UNITED STATES
SECURITIES AND EXCHANGE COMMISSION
Washington, D.C. 20549
FORMN-CSR
CERTIFIED SHAREHOLDER REPORT OF REGISTERED
MANAGEMENT INVESTMENT COMPANIES
Investment Company Act file number811-05349
Goldman Sachs Trust
(Exact name of registrant as specified in charter)
71 South Wacker Drive, Chicago, Illinois 60606
(Address of principal executive offices) (Zip code)
| | |
| Caroline Kraus, Esq. | | Copies to: |
| Goldman Sachs & Co. LLC | | Geoffrey R.T. Kenyon, Esq. |
| 200 West Street | | Dechert LLP |
| New York, New York 10282 | | 100 Oliver Street |
| | 40th Floor |
| | Boston, MA 02110-2605 |
(Name and address of agents for service)
Registrant’s telephone number, including area code:(312) 655-4400
Date of fiscal year end: August 31
Date of reporting period: February 28, 2019
| ITEM 1. | REPORTS TO STOCKHOLDERS. |
| | The Semi-Annual Report to Shareholders is filed herewith. |
Goldman Sachs Funds

| | | | |
| | |
| Semi-Annual Report | | | | February 28, 2019 |
| | |
| | | | Financial Square FundsSM |
| | | | Federal Instruments |
| | | | Government |
| | | | Money Market |
| | | | Prime Obligations |
| | | | Treasury Instruments |
| | | | Treasury Obligations |
| | | | Treasury Solutions |
It is our intention that beginning on January 1, 2021, paper copies of the Funds’ annual and semi-annual shareholder reports will no longer be sent by mail, unless you specifically request paper copies of the reports from a Fund or from your financial intermediary. Instead, the reports will be made available on a website, and you will be notified by mail each time a report is posted and provided with a website link to access the report.
If you already elected to receive shareholder reports electronically, you will not be affected by this change and you need not take any action. At any time, you may elect to receive reports and certain communications from a Fund electronically by calling the applicable toll-free number below or by contacting your financial intermediary.
You may elect to receive all future shareholder reports in paper free of charge. If you hold shares of a Fund directly with the Fund’s transfer agent, you can inform the transfer agent that you wish to receive paper copies of reports by calling toll-free800-621-2550 for Institutional/Class I, Administration, Capital, Cash Management, Preferred, Premier, Resource, Service, Class R6 and Select shareholders or800-526-7384 for Class A and Class C shareholders. If you hold shares of a Fund through a financial intermediary, please contact your financial intermediary to make this election. Your election to receive reports in paper will apply to all Goldman Sachs Funds held in your account if you invest through your financial intermediary or all Goldman Sachs Funds held with the Funds’ transfer agent if you invest directly with the transfer agent.

Goldman Sachs Financial Square Funds
| ∎ | | FEDERAL INSTRUMENTS FUND |
| ∎ | | TREASURY INSTRUMENTS FUND |
| ∎ | | TREASURY OBLIGATIONS FUND |
| ∎ | | TREASURY SOLUTIONS FUND |
| | | | |
| | | |
| NOT FDIC-INSURED | | May Lose Value | | No Bank Guarantee |
PORTFOLIO RESULTS
Goldman Sachs Financial Square Funds
Portfolio Management Discussion and Analysis
Below, the Goldman Sachs Money Market Portfolio Management Team discusses the Goldman Sachs Financial Square Funds’ (the “Funds”) performance and positioning for the six-month period ended February 28, 2019 (the “Reporting Period”).
| Q | | What economic and market factors most influenced the money markets as a whole during the Reporting Period? |
| A | | During the Reporting Period, money market yields remained low but continued to move higher as the Federal Reserve (“Fed”) tightened monetary policy. Fed officials raised the targeted federal funds rate twice — in September and December 2018 — such that at the end of the Reporting Period, it was in a range of between 2.25% and 2.50%. Other influences on the money markets during the Reporting Period were the continuation of the Fed’s balance sheet normalization and the dovish stance of most developed markets central banks. (Balance sheet normalization refers to the steps the Fed is taking to reverse quantitative easing and remove the substantial monetary accommodation it has provided to the economy since the financial crisis began in 2007. Dovish tends to imply lower interest rates; opposite of hawkish.) |
| | | When the Reporting Period started in September 2018, U.S. economic growth was robust, though some major economies, including those of the Eurozone, the U.K. and China, exhibited a gradual weakening trend. The Fed raised the targeted federal funds rate by 25 basis points, citing ongoing strength in the labor market and a pickup in household spending and business fixed investment. (A basis point is 1/100th of a percentage point.) The Fed’s dot plot pointed to another increase by the end of 2018 and three more during 2019. (The “dot plot” shows rate projections of the members of the Fed’s Open Market Committee.) Fed Chair Jerome Powell delivered an upbeat assessment of the U.S. economy, which supported market expectations for these additional Fed rate hikes in 2019. During the fourth quarter of 2018, investor concerns about slowing global economic growth momentum as well as tighter financial conditions weighed on financial markets. Global interest rates, which had risen for most of the calendar year, fell, as investors grew fearful about the possible end of the global economic cycle and as their expectations for Fed rate hikes diminished. In December 2018, Fed policymakers raised short-term interest rates by an additional 25 basis points, much as the market had expected, but lowered their projection for 2019 monetary policy tightening from three rate hikes to two. In January 2019, the Fed left monetary policy unchanged and also eliminated language about “further gradual increases in rates,” cementing investor expectations for a near-term pause in rate hikes. Fed Chair Powell emphasized that the U.S. central bank would be largely guided by inflation indicators as well as by the global economic growth backdrop and the potential for financial market volatility. During February 2019, the release of minutes from the Fed’s January meeting confirmed policymakers’ dovish tilt. |
| Q | | What key factors were responsible for the performance of the Funds during the Reporting Period? |
| A | | The Funds’ yields rose during the Reporting Period, driven by the increase in money market yields, which occurred primarily because of the economic and market factors discussed above. The money market yield curve flattened, meaning yields on shorter-term maturities rose more than those on longer-term maturities. (Yield curve is a spectrum of interest rates based on maturities of varying lengths.) |
| Q | | How did you manage the Funds during the Reporting Period? |
| A | | Collectively, the Funds had investments in commercial paper, asset-backed commercial paper, U.S. Treasury securities, government agency securities, time deposits, certificates of deposit, floating rate securities, repurchase agreements (“repo”), government guaranteed paper, municipal securities and variable rate demand notes during the Reporting Period. |
| | | In our commercial paper strategies (i.e., the Goldman Sachs Financial Square Money Market Fund and the Goldman Sachs Financial Square Prime Obligations Fund), we maintained somewhat short weighted average maturities of between 34 and 40 days during the first four months of the Reporting Period in response to rather consistent clarity from the Fed around potential interest rate hikes in September and December 2018. For the same reason, during the first half of the Reporting Period, we maintained relatively short |
1
PORTFOLIO RESULTS
| | weighted average maturities of between 16 and 37 days in our government repo strategies (i.e., the Goldman Sachs Financial Square Government Fund, the Goldman Sachs Financial Square Treasury Obligations Fund and the Goldman Sachs Financial Square Treasury Solutions Fund) and between 27 days and 50 days in our government non-repo strategies (i.e., the Goldman Sachs Financial Square Federal Instruments Fund and the Goldman Sachs Financial Square Treasury Instruments Fund). The Funds’ purchases were focused on floating rate securities, asset-backed commercial paper and government agency securities, all of which helped us to manage duration. (Duration is a measure of the Funds’ sensitivity to changes in interest rates). |
| | | After the December 2018 rate hike, the Fed’s path became less clear to us. As a result, we lengthened the weighted average maturities of the commercial paper, government repo and government non-repo strategies. Within our commercial paper strategies, we extended weighted average maturities to between 49 and 52 days during the last two months of the Reporting Period. In our government and government non-repo strategies, we extended weighted average maturities to between 42 and 50 days during December 2018. Then, in January 2019, we shortened the weighted average maturities of our government repo strategies to between 32 and 40 days and the weighted average maturities of our government non-repo strategies to between 39 and 49 days. We continued to shorten the weighted average maturities of the government repo and government non-repo strategies during February, ending the Reporting Period with weighted average maturities of between 21 and 39 days and between 37 and 47 days, respectively. Purchases were focused overall on fixed-rate securities as we sought to manage the Funds’ duration. |
| | | The weighted average maturity of a money market fund is a measure of its price sensitivity to changes in interest rates. Also known as effective maturity, weighted average maturity measures the weighted average of the maturity date of bonds held by the Funds, taking into consideration any available maturity shortening features. |
| Q | | How did you manage the Funds’ weighted average life during the Reporting Period? |
| A | | During the Reporting Period, we managed the weighted average life of the Funds below 120 days. In our commercial paper strategies, we managed the Funds’ weighted average life in a range between approximately 75 days and approximately 101 days. In our government repo and government non-repo strategies, we managed the Funds’ weighted average life in a range between approximately 84 days and approximately 118 days. The weighted average life of a money market fund is a measure of a money market fund’s price sensitivity to changes in liquidity and/or credit risk. |
| | | Under amendments to SEC Rule 2a-7 that became effective in May 2010, the maximum allowable weighted average life of a money market fund is 120 days. While one of the goals of the SEC’s money market fund rule is to reinforce conservative investment practices across the money market fund industry, our security selection process has long emphasized conservative investment choices. |
| Q | | Did you make any changes to the Funds’ portfolios during the Reporting Period? |
| A | | During the Reporting Period, we made adjustments to the Funds’ weighted average maturities and their allocations to specific investments based on then-current market conditions, our near-term view and anticipated and actual Fed monetary policy statements. |
| Q | | What is the Funds’ tactical view and strategy for the months ahead? |
| A | | At the end of the Reporting Period, we expected the elongated U.S. economic expansion to continue and considered market concerns around a near-term recession premature. However, we believed global economic growth was likely to moderate in 2019. More than 60% of the 32 economies for which we track manufacturing data closed 2018 with a lower reading than where they commenced the year. This contrasts with 2017 when almost 80% of these economies ended the year with higher readings. However, manufacturing activity remained in expansionary territory for 70% of these countries, in our view. |
| | | Regarding inflation, the moderation in crude oil prices in October 2018 is likely, we believe, to feed through to lower headline inflation in key economies in the short term. Meanwhile, we think cyclical improvements — namely, a decline in unemployment rates and improving wage growth — could result in firmer core inflation in key developed economies. Potential downside inflation risks include slower than consensus anticipated economic growth and, therefore, stalling or declining labor market improvements, while potential upside risks include continued labor market improvements that lead to inflation or an increase in tariffs. |
| | | As for monetary policy, at the end of the Reporting Period, we had scaled back our expectations for 2019 Fed action |
2
PORTFOLIO RESULTS
| | from three interest rate hikes to one. We also anticipated a near-term pause in the Fed’s rate increases. Regarding other central banks, we expected the European Central Bank to start lifting its policy rates out of negative territory toward the end of 2019, though we thought low interest rates would continue for a prolonged period due to the subdued inflation outlook for the region. We also saw scope for monetary policy normalization in several other developed markets countries, including the U.K. once uncertainty about the country’s exit from the European Union subsides. |
| | | Overall, the Funds continue to be flexibly guided by shifting market conditions, and we have positioned them to seek to take advantage of anticipated interest rate movements. As always, we intend to continue to use our actively managed approach to seek the best possible return within the framework of our Funds’ investment guidelines and objectives. In addition, we will continue to manage interest, liquidity and credit risk daily. We will also continue to closely monitor economic data, Fed policy and any shifts in the money market yield curve, as we strive to navigate the interest rate environment. |
3
PORTFOLIO RESULTS
GOVERNMENT MONEY MARKET FUNDS
| | ∎ | | Federal Instruments Fund |
| | ∎ | | Treasury Instruments Fund |
| | ∎ | | Treasury Obligations Fund |
| | ∎ | | Treasury Solutions Fund |
You could lose money by investing in the Fund. Although the Fund seeks to preserve the value of your investment at $1.00 per share, it cannot guarantee it will do so. An investment in the Fund is not a deposit of a bank and is not insured or guaranteed by the Federal Deposit Insurance Corporation or any other government agency. The Fund’s sponsor has no legal obligation to provide financial support to the Fund, and you should not expect that the sponsor will provide financial support to the Fund at any time.
INSTITUTIONAL MONEY MARKET FUNDS
You could lose money by investing in the Fund. Because the share price of the Fund will fluctuate, when you sell your shares they may be worth more or less than what you originally paid for them. The Fund may impose a fee upon sale of your shares or may temporarily suspend your ability to sell shares if the Fund’s liquidity falls below required minimums because of market conditions or other factors. An investment in the Fund is not a deposit of a bank and is not insured or guaranteed by the Federal Deposit Insurance Corporation or any other government agency. The Fund’s sponsor has no legal obligation to provide financial support to the Fund, and you should not expect that the sponsor will provide financial support to the Fund at any time.
4
FUND BASICS
Financial Square Funds
as of February 28, 2019
| | | | | | | | | | |
| | PERFORMANCE REVIEW1,2 | |
| | | |
| | | September 1, 2018–
February 28, 2019 | | Fund Total Return (based on NAV)4 Institutional Shares | | | iMoneyNet Institutional
Average5 | |
| | | |
| | Federal Instruments3 | | | 1.05 | % | | | 1.95 | %6 |
| | Government | | | 1.07 | | | | 1.95 | 6 |
| | Money Market3 | | | 1.23 | | | | 2.19 | 7 |
| | Prime Obligations3 | | | 1.23 | | | | 2.19 | 7 |
| | Treasury Instruments | | | 1.04 | | | | 1.92 | 8 |
| | Treasury Obligations | | | 1.06 | | | | 1.95 | 9 |
| | | Treasury Solutions | | | 1.05 | | | | 1.95 | 9 |
The returns represent past performance. Past performance does not guarantee future results. The Funds’ investment returns will fluctuate. Current performance may be lower or higher than the performance quoted above. Please visit our Web site at www.GSAMFUNDS.com to obtain the most recentmonth-end returns.Performance reflects applicable fee waivers and/or expense limitations in effect during the periods shown. In their absence, performance would be reduced. Returns do not reflect the deduction of taxes that a shareholder would pay on Fund distributions or the redemption of Fund shares.
| | 1 | | Each of the Prime Obligations, Treasury Obligations, Money Market, Treasury Instruments and Treasury Solutions Funds offers nine separate classes of shares (Institutional, Select, Preferred, Capital, Administration, Service, Cash Management, Premier and Resource), the Federal Instruments Fund offers eight separate classes of shares (Institutional, Select, Preferred, Capital, Administration, Service, Cash Management and Premier), and the Government Fund offers twelve separate classes of shares (Institutional, Select, Preferred, Capital, Administration, Service, Cash Management, Premier, Resource, Class R6, Class A and Class C), each of which is subject to different fees and expenses that affect performance and entitles shareholders to different services. The Institutional and Class R6 Shares do not have distribution and/or service(12b-1) or administration and/or service(non-12b-1) fees. The Select, Preferred, Capital, Administration, Service, Cash Management, Premier, Resource, Class A and Class C Shares offer financial institutions the opportunity to receive fees for providing certain distribution, administrative support and/or shareholder services (as applicable). As an annualized percentage of average daily net assets, these share classes pay combined distribution and/or service(12b-1), administration and/ or service(non-12b-1) fees (as applicable) at the following contractual rates: the Select Shares pay 0.03%, Preferred Shares pay 0.10%, Capital Shares pay 0.15%, Administration Shares pay 0.25%, Service Shares pay 0.50%, Cash Management Shares pay 0.80%, Premier Shares pay 0.35%, Resource Shares pay 0.65%, Class A Shares pay 0.25% and Class C Shares pay 1.00%. If these fees were reflected in the above performance, performance would have been reduced. In addition, the Fund’s performance does not reflect the deduction of any applicable sales charges. |
| | 2 | | The investment adviser may contractually agree to waive or reimburse certain fees and expenses until a specified date. The investment adviser may also voluntarily waive certain fees and expenses, and such voluntary waivers may be discontinued or modified at any time without notice. The performance shown above reflects any waivers or reimbursements that were in effect for all or a portion of the periods shown. When waivers or reimbursements are in place, the Fund’s operating expenses are reduced and the Fund’s yield and total returns to the shareholder are increased. |
| | 3 | | From the beginning of the reporting period through September 30, 2018, the investment adviser implemented a voluntary temporary fee waiver equal annually to 0.08% of the average daily net assets of the Financial Square Prime Obligations Fund and Financial Square Money Market Fund. On October 1, 2018, the investment adviser reduced the voluntary temporary fee waiver to a percentage rate equal annually to 0.06% of the average daily net assets for both funds. On February 28, 2019, the investment adviser has reduced the voluntary temporary fee waiver to a percentage rate equal annually to 0.05% of the average daily net assets for both funds. In addition, on December 28, 2018, GSAM implemented a management fee waiver equal to 0.02% of the average daily net assets for the Financial Square Federal Instruments Fund. |
| | 4 | | The net asset value (NAV) represents the net assets of the class of the Fund(ex-dividend) divided by the total number of shares of the class outstanding. A Fund’s total return reflects the reinvestment of dividends and other distributions. |
| | 5 | | Source: iMoneyNet, Inc. February 2019. |
| | 6 | | Government & Agencies Institutional–Category includes the most broadly based of the government institutional funds. These funds may generally invest in U.S. treasuries, U.S. agencies, repurchase agreements, or government-backed floating rate notes. |
| | 7 | | First Tier Institutional–Category includes onlynon-government institutional funds that also are not holding any second tier securities. Portfolio holdings of First Tier funds include U.S. Treasury, U.S. other, repurchase agreements, time deposits, domestic bank obligations, foreign bank obligations, first tier commercial paper, floating rate notes, and asset-backed commercial paper. |
| | 8 | | Treasury Institutional–Category includes only institutional government funds that hold 100 percent in U.S. Treasuries. |
| | 9 | | Treasury & Repo Institutional–Category includes only institutional government funds that hold U.S. Treasuries and repurchase agreements backed by the U.S. Treasury. |
5
FUND BASICS
| | | | | | | | | | | | | | | | | | | | | | | | |
| | STANDARDIZED TOTAL RETURNS1,2,10 |
| | | | | | | |
| | | For the period ended
December 31, 2018 | | SEC
7-Day
Current Yield11 | | | One Year | | | Five Years | | | Ten Years | | | Since
Inception | | | Inception Date |
| | | | | | | |
| | Federal Instruments | | | 2.23 | % | | | 1.71 | % | | | N/A | | | | N/A | | | | 0.85 | % | | 10/30/15 |
| | Government | | | 2.34 | | | | 1.74 | | | | 0.56 | % | | | 0.33 | % | | | 2.59 | | | 4/6/93 |
| | Money Market | | | 2.57 | | | | 2.07 | | | | 0.75 | | | | 0.47 | | | | 2.67 | | | 5/18/94 |
| | Prime Obligations | | | 2.56 | | | | 2.06 | | | | 0.73 | | | | 0.44 | | | | 3.00 | | | 3/8/90 |
| | Treasury Instruments | | | 2.22 | | | | 1.71 | | | | 0.53 | | | | 0.27 | | | | 1.97 | | | 3/3/97 |
| | Treasury Obligations | | | 2.33 | | | | 1.73 | | | | 0.54 | | | | 0.29 | | | | 2.79 | | | 4/25/90 |
| | | Treasury Solutions | | | 2.23 | | | | 1.72 | | | | 0.53 | | | | 0.30 | | | | 2.16 | | | 2/28/97 |
| 10 | | The Standardized Total Returns are average annual or cumulative total returns (only if the performance period is one year or less) of Institutional Shares as of the most recent calendarquarter-end. They assume reinvestment of all distributions at NAV. The SEC7-Day Current Yield is not a Standardized Total Return. |
| | | Because Institutional Shares do not involve a sales charge, such a charge is not applied to their Standardized Total Returns. |
| | | The yields and returns represent past performance. Past performance does not guarantee future results. The Funds’ investment yields and returns will fluctuate as market conditions change. Current performance may be lower or higher than the performance quoted above.Please visit our Web site at www.GSAMFUNDS.com to obtain the most recentmonth-end yields and returns.Performance reflects applicable fee waivers and/or expense limitations in effect during the periods shown. In their absence, performance would be reduced. Returns do not reflect the deduction of taxes that a shareholder would pay on Fund distributions or the redemption of Fund shares. |
| 11 | | The SEC7-Day Current Yield figures are as of December 31, 2018 and are calculated in accordance with securities industry regulations and do not include net capital gains. SEC7-Day Current Yield may differ slightly from the actual distribution rate of a given Fund because of the exclusion of distributed capital gains, which arenon-recurring.The SEC7-Day Current Yield more closely reflects a Fund’s current earnings than do the Standardized Total Return figures. |
6
YIELD SUMMARY
| | | | | | | | | | | | | | | | | | | | | | |
| | SUMMARY OF THE INSTITUTIONAL SHARES1,2 AS OF 2/28/19 | |
| | | | | | |
| | | Funds | | 7-Day Dist. Yield12 | | | SEC 7-Day Effective Yield13 | | | 30-Day Average Yield14 | | | Weighted Avg. Maturity (days)15 | | | Weighted Avg. Life (days)16 | |
| | | | | | |
| | Federal Instruments | | | 2.28 | % | | | 2.30 | % | | | 2.27 | % | | | 47 | | | | 88 | |
| | Government | | | 2.32 | | | | 2.34 | | | | 2.31 | | | | 22 | | | | 84 | |
| | Money Market | | | 2.62 | | | | 2.63 | | | | 2.61 | | | | 52 | | | | 85 | |
| | Prime Obligations | | | 2.60 | | | | 2.63 | | | | 2.60 | | | | 49 | | | | 75 | |
| | Treasury Instruments | | | 2.26 | | | | 2.27 | | | | 2.24 | | | | 37 | | | | 95 | |
| | Treasury Obligations | | | 2.29 | | | | 2.30 | | | | 2.28 | | | | 21 | | | | 87 | |
| | | Treasury Solutions | | | 2.26 | | | | 2.27 | | | | 2.25 | | | | 39 | | | | 89 | |
| | | The Yields represent past performance. Past performance does not guarantee future results. Current performance may be lower or higher than the performance quoted above. |
| | | Yields reflect fee waivers and expense limitations in effect and will fluctuate as market conditions change. The yield quotations more closely reflect the current earnings of the Fund. Please visit our Web site at www.GSAMFUNDS.com to obtain the most recentmonth-end performance. |
| 12 | | The7-Day Distribution Yield is an annualized measure of a Fund’s dividends per share, divided by the price per share. This yield can include capital gain/loss distribution, if any. This is not an SEC Yield. |
| 13 | | The SEC7-Day Effective Yield of a Fund is calculated in accordance with securities industry regulations and does not include net capital gains. The SEC7-Day Effective Yield assumes reinvestment of dividends for one year. |
| 14 | | The30-Day Average Yield is a net annualized yield of 30 days back from the current date listed. This yield includes capital gain/loss distribution. |
| 15 | | A Fund’s weighted average maturity (WAM) is an average of the effective maturities of all securities held in the portfolio, weighted by each security’s percentage of net assets. This must not exceed 60 days as calculated under SEC Rule2a-7. |
| 16 | | A Fund’s weighted average life (WAL) is an average of the final maturities of all securities held in the portfolio, weighted by each security’s percentage of net assets. This must not exceed 120 days as calculated under SEC Rule2a-7. |
7
SECTOR ALLOCATIONS
| | | | | | | | | | | | | | | | | | | | | | | | | | | | | | |
| | SECTOR ALLOCATIONS17 | |
| | | | | | | |
| | | As of February 28, 2019 | | | | | | | | | | | | | | | | | | | |
| | | | | | | | |
| | | Security Type
(Percentage of Net Assets) | | Federal Instruments | | | Government | | | Money
Market | | | Prime
Obligations | | | Treasury
Instruments | | | Treasury
Obligations | | | Treasury
Solutions | |
| | | | | | | | |
| | Certificates of Deposit | | | — | | | | — | | | | 0.5 | % | | | 0.5 | % | | | — | | | | — | | | | — | |
| | | | | | | | |
| | Certificates of Deposit - Eurodollar | | | | | | | | | | | 7.8 | | | | — | | | | | | | | | | | | | |
| | | | | | | | |
| | Certificates of Deposit - Yankeedollar | | | — | | | | — | | | | 2.9 | | | | 3.4 | | | | — | | | | — | | | | — | |
| | | | | | | | |
| | Commercial Paper & Corporate Obligations | | | — | | | | — | | | | 28.7 | | | | 30.8 | | | | — | | | | — | | | | — | |
| | | | | | | | |
| | Fixed Rate Municipal Debt Obligations | | | — | | | | — | | | | 2.4 | | | | 3.4 | | | | — | | | | — | | | | — | |
| | | | | | | | |
| | Repurchase Agreements | | | — | | | | 60.1 | % | | | 31.9 | | | | 30.2 | | | | — | | | | 61.6 | % | | | — | |
| | | | | | | | |
| | Time Deposits | | | — | | | | — | | | | 3.3 | | | | 6.0 | | | | — | | | | — | | | | — | |
| | | | | | | | |
| | U.S. Government Agency Obligations | | | 75.2 | % | | | 18.1 | | | | — | | | | 0.2 | | | | — | | | | — | | | | — | |
| | | | | | | | |
| | U.S. Treasury Obligations | | | 45.9 | | | | 23.3 | | | | — | | | | — | | | | 111.4 | % | | | 38.5 | | | | 115.1 | % |
| | | | | | | | |
| | Variable Rate Municipal Debt Obligations | | | — | | | | — | | | | 2.0 | | | | 2.7 | | | | — | | | | — | | | | — | |
| | | | | | | | |
| | | Variable Rate Obligations | | | — | | | | — | | | | 23.0 | | | | 24.5 | | | | — | | | | — | | | | — | |
| 17 | | Each Fund is actively managed and, as such, its portfolio composition may differ over time. The percentage shown for each investment category reflects the value of investments in that category as a percentage of net assets. Figures in the above table may not sum to 100% due to the exclusion of other assets and liabilities. |
8
SECTOR ALLOCATIONS
| | | | | | | | | | | | | | | | | | | | | | | | | | | | | | |
| | SECTOR ALLOCATIONS18 | |
| | | | | | | |
| | | As of August 31, 2018 | | | | | | | | | | | | | | | | | | | |
| | | | | | | | |
| | | Security Type (Percentage of Net Assets) | | Federal
Instruments | | | Government | | | Money
Market | | | Prime
Obligations | | | Treasury
Instruments | | | Treasury
Obligations | | | Treasury
Solutions | |
| | | | | | | | |
| | Certificates of Deposit - Eurodollar | | | — | | | | — | | | | 3.2 | % | | | — | | | | — | | | | — | | | | — | |
| | | | | | | | |
| | Certificates of Deposit - Yankeedollar | | | — | | | | — | | | | 4.1 | | | | 4.9 | % | | | — | | | | — | | | | — | |
| | | | | | | | |
| | Commercial Paper & Corporate Obligations | | | — | | | | — | | | | 30.4 | | | | 31.9 | | | | — | | | | — | | | | — | |
| | | | | | | | |
| | Master Demand Notes | | | — | | | | — | | | | | | | | — | | | | — | | | | — | | | | — | |
| | | | | | | | |
| | Fixed Rate Municipal Debt Obligations | | | — | | | | — | | | | 1.4 | | | | 1.1 | | | | — | | | | — | | | | — | |
| | | | | | | | |
| | Repurchase Agreements | | | — | | | | 48.9 | % | | | 30.1 | | | | 25.3 | | | | — | | | | 59.0 | % | | | — | |
| | | | | | | | |
| | Time Deposits | | | — | | | | — | | | | 1.3 | | | | 1.3 | | | | — | | | | — | | | | — | |
| | | | | | | | |
| | U.S. Government Agency Obligations | | | 32.6 | % | | | 25.7 | | | | — | | | | 0.2 | | | | — | | | | — | | | | — | |
| | | | | | | | |
| | U.S. Government Guarantee Notes | | | — | | | | — | | | | | | | | | | | | — | | | | — | | | | — | |
| | | | | | | | |
| | U.S. Government Guarantee Variable Rate Obligations | | | — | | | | — | | | | | | | | | | | | — | | | | — | | | | — | |
| | | | | | | | |
| | U.S. Treasury Obligations | | | 67.9 | | | | 25.6 | | | | 8.3 | | | | 9.5 | | | | 100.5 | % | | | 41.3 | | | | 100.6 | % |
| | | | | | | | |
| | Variable Rate Municipal Debt Obligations | | | — | | | | — | | | | 1.7 | | | | 2.8 | | | | — | | | | — | | | | — | |
| | | | | | | | |
| | | Variable Rate Obligations | | | — | | | | — | | | | 20.4 | | | | 24.5 | | | | — | | | | — | | | | — | |
| 18 | | Each Fund is actively managed and, as such, its portfolio composition may differ over time. The percentage shown for each investment category reflects the value of investments in that category as a percentage of net assets. Figures in the above table may not sum to 100% due to the exclusion of other assets and liabilities. |
9
FINANCIAL SQUARE FEDERAL INSTRUMENTS FUND
Schedule of Investments
February 28, 2019 (Unaudited)
| | | | | | | | | | | | | | |
Principal
Amount | | | Interest
Rate | | | Maturity
Date | | | Amortized
Cost | |
|
| U.S. Government Agency Obligations – 75.2% | |
| | Federal Farm Credit Bank (1 Mo. LIBOR – 0.09%) | |
| $ | 1,000,000 | | | | 2.402 | %(a) | | | 03/28/19 | | | $ | 1,000,000 | |
| | Federal Farm Credit Bank (3 Mo. LIBOR – 0.14%) | |
| | 1,800,000 | | | | 2.663 | (a) | | | 09/30/19 | | | | 1,799,947 | |
| | Federal Farm Credit Bank (3 Mo. LIBOR – 0.26%) | |
| | 250,000 | | | | 2.523 | (a) | | | 07/10/19 | | | | 250,000 | |
| | Federal Farm Credit Bank (3 Mo. U.S. T-Bill MMY + 0.07%)(a) | |
| | 850,000 | | | | 2.485 | | | | 11/29/19 | | | | 850,000 | |
| | 650,000 | | | | 2.490 | | | | 02/18/20 | | | | 650,000 | |
| | Federal Farm Credit Bank (3 Mo. U.S. T-Bill MMY + 0.08%)(a) | |
| | 700,000 | | | | 2.495 | | | | 10/18/19 | | | | 699,987 | |
| | 750,000 | | | | 2.495 | | | | 12/26/19 | | | | 749,976 | |
| | Federal Farm Credit Bank (3 Mo. U.S. T-Bill MMY + 0.09%) | |
| | 900,000 | | | | 2.505 | (a) | | | 07/05/19 | | | | 899,994 | |
| | Federal Farm Credit Bank (FEDL01 + 0.11%) | |
| | 800,000 | | | | 2.510 | (a) | | | 08/13/20 | | | | 799,884 | |
| | Federal Farm Credit Bank (Prime Rate – 2.88%) | |
| | 1,000,000 | | | | 2.620 | (a) | | | 05/07/20 | | | | 999,906 | |
| | Federal Farm Credit Bank (Prime Rate – 2.90%) | |
| | 600,000 | | | | 2.600 | (a) | | | 01/30/20 | | | | 600,000 | |
| | Federal Farm Credit Bank (Prime Rate – 2.93%) | |
| | 1,200,000 | | | | 2.570 | (a) | | | 11/06/20 | | | | 1,200,000 | |
| | Federal Farm Credit Bank (Prime Rate – 2.96%) | |
| | 200,000 | | | | 2.540 | (a) | | | 03/13/20 | | | | 199,845 | |
| | Federal Farm Credit Bank (Prime Rate – 2.98%) | |
| | 300,000 | | | | 2.520 | (a) | | | 11/12/20 | | | | 299,747 | |
| | Federal Farm Credit Bank (Prime Rate – 3.08%)(a) | |
| | 250,000 | | | | 2.420 | | | | 06/27/19 | | | | 249,996 | |
| | 1,600,000 | | | | 2.420 | | | | 07/17/19 | | | | 1,599,939 | |
| | Federal Home Loan Bank (1 Mo. LIBOR – 0.05%) | |
| | 6,000,000 | | | | 2.462 | (a) | | | 10/07/19 | | | | 6,000,000 | |
| | Federal Home Loan Bank (1 Mo. LIBOR – 0.08%) | |
| | 14,000,000 | | | | 2.401 | (a) | | | 03/19/19 | | | | 14,000,000 | |
| | Federal Home Loan Bank (1 Mo. LIBOR – 0.10%) | |
| | 5,900,000 | | | | 2.386 | (a) | | | 04/18/19 | | | | 5,900,000 | |
| | Federal Home Loan Bank (3 Mo. LIBOR – 0.16%) | |
| | 5,000,000 | | | | 2.591 | (a) | | | 08/04/20 | | | | 5,000,000 | |
| | Federal Home Loan Bank (3 Mo. LIBOR – 0.26%)(a) | |
| | 25,000,000 | | | | 2.542 | | | | 07/09/19 | | | | 25,000,000 | |
| | 10,000,000 | | | | 2.544 | | | | 07/11/19 | | | | 10,000,000 | |
| | Federal Home Loan Bank (3 Mo. LIBOR – 0.31%)(a) | |
| | 7,200,000 | | | | 2.466 | | | | 03/12/19 | | | | 7,200,000 | |
| | 4,200,000 | | | | 2.469 | | | | 03/13/19 | | | | 4,200,000 | |
| | 7,200,000 | | | | 2.478 | | | | 03/15/19 | | | | 7,200,000 | |
| | 1,800,000 | | | | 2.514 | | | | 03/22/19 | | | | 1,800,000 | |
| | 750,000 | | | | 2.512 | | | | 03/25/19 | | | | 750,000 | |
| | Federal Home Loan Bank (3 Mo. LIBOR – 0.32%)(a) | |
| | 3,600,000 | | | | 2.470 | | | | 03/21/19 | | | | 3,600,000 | |
| | 7,300,000 | | | | 2.502 | | | | 03/25/19 | | | | 7,300,000 | |
| | 7,000,000 | | | | 2.502 | | | | 03/27/19 | | | | 7,000,000 | |
| | Federal Home Loan Bank (3 Mo. U.S. T-Bill + 0.07%) | |
| | 10,100,000 | | | | 2.530 | (a) | | | 01/30/20 | | | | 10,101,392 | |
| | Federal Home Loan Bank (Prime Rate – 2.94%) | |
| | 900,000 | | | | 2.560 | (a) | | | 02/26/21 | | | | 900,000 | |
| | Federal Home Loan Bank Discount Notes | |
| | 166,300,000 | | | | 2.428 | | | | 03/01/19 | | | | 166,300,000 | |
| | 2,000,000 | | | | 2.394 | | | | 03/06/19 | | | | 1,999,344 | |
| | |
|
| U.S. Government Agency Obligations – (continued) | |
| | Federal Home Loan Bank Discount Notes – (continued) | |
| 10,000,000 | | | | 2.402 | % | | | 03/06/19 | | | | 9,996,715 | |
| | 35,000,000 | | | | 2.364 | | | | 03/08/19 | | | | 34,983,939 | |
| | 1,800,000 | | | | 2.417 | | | | 03/15/19 | | | | 1,798,334 | |
| | 60,000,000 | | | | 2.423 | | | | 03/22/19 | | | | 59,916,525 | |
| | 10,000,000 | | | | 2.458 | | | | 03/22/19 | | | | 9,985,942 | |
| | 175,000,000 | | | | 2.418 | | | | 03/27/19 | | | | 174,699,195 | |
| | 1,200,000 | | | | 2.500 | | | | 05/17/19 | | | | 1,199,888 | |
| | 30,000,000 | | | | 2.498 | | | | 07/12/19 | | | | 29,729,567 | |
| | 50,000,000 | | | | 2.508 | | | | 08/02/19 | | | | 49,477,470 | |
| | |
| TOTAL U.S. GOVERNMENT
AGENCY OBLIGATIONS |
| | $ | 668,887,532 | |
| | |
| | |
|
| U.S. Treasury Obligations – 45.9% | |
| | United States Treasury Bills | |
| $ | 3,000,000 | | | | 2.383 | % | | | 03/05/19 | | | $ | 2,999,217 | |
| | 600,000 | | | | 2.406 | | | | 03/05/19 | | | | 599,842 | |
| | 500,000 | | | | 2.430 | | | | 03/05/19 | | | | 499,867 | |
| | 900,000 | | | | 2.412 | | | | 03/12/19 | | | | 899,347 | |
| | 7,200,000 | | | | 2.418 | | | | 03/12/19 | | | | 7,194,764 | |
| | 100,000 | | | | 2.422 | | | | 03/12/19 | | | | 99,927 | |
| | 200,000 | | | | 2.423 | | | | 03/12/19 | | | | 199,854 | |
| | 300,000 | | | | 2.428 | | | | 03/12/19 | | | | 299,781 | |
| | 200,000 | | | | 2.342 | (b) | | | 03/14/19 | | | | 199,831 | |
| | 5,300,000 | | | | 2.413 | | | | 03/19/19 | | | | 5,293,706 | |
| | 1,200,000 | | | | 2.418 | | | | 03/19/19 | | | | 1,198,572 | |
| | 5,500,000 | | | | 2.417 | | | | 03/26/19 | | | | 5,490,910 | |
| | 700,000 | | | | 2.422 | | | | 03/26/19 | | | | 698,841 | |
| | 200,000 | | | | 2.423 | | | | 03/26/19 | | | | 199,669 | |
| | 400,000 | | | | 2.402 | | | | 04/02/19 | | | | 399,161 | |
| | 400,000 | | | | 2.406 | | | | 04/02/19 | | | | 399,159 | |
| | 1,700,000 | | | | 2.410 | | | | 04/02/19 | | | | 1,696,419 | |
| | 3,600,000 | | | | 2.411 | | | | 04/02/19 | | | | 3,592,416 | |
| | 100,000 | | | | 2.415 | | | | 04/02/19 | | | | 99,789 | |
| | 3,200,000 | | | | 2.417 | | | | 04/02/19 | | | | 3,193,244 | |
| | 23,100,000 | | | | 2.448 | (b) | | | 04/02/19 | | | | 23,056,700 | |
| | 166,300,000 | | | | 2.440 | (b) | | | 04/11/19 | | | | 165,845,447 | |
| | 1,900,000 | | | | 2.546 | | | | 06/13/19 | | | | 1,886,388 | |
| | 3,170,000 | | | | 2.552 | | | | 06/20/19 | | | | 3,145,711 | |
| | 31,630,000 | | | | 2.546 | | | | 06/27/19 | | | | 31,372,883 | |
| | 4,500,000 | | | | 2.573 | | | | 07/05/19 | | | | 4,460,546 | |
| | 500,000 | | | | 2.469 | | | | 07/25/19 | | | | 495,113 | |
| | 500,000 | | | | 2.472 | | | | 07/25/19 | | | | 495,113 | |
| | 11,100,000 | | | | 2.515 | | | | 08/01/19 | | | | 10,984,421 | |
| | 500,000 | | | | 2.487 | | | | 08/08/19 | | | | 494,611 | |
| | 300,000 | | | | 2.492 | | | | 08/08/19 | | | | 296,760 | |
| | 1,700,000 | | | | 2.494 | | | | 08/08/19 | | | | 1,681,640 | |
| | 3,900,000 | | | | 2.500 | | | | 08/08/19 | | | | 3,857,793 | |
| | 700,000 | | | | 2.501 | | | | 08/08/19 | | | | 692,421 | |
| | 700,000 | | | | 2.502 | | | | 08/08/19 | | | | 692,417 | |
| | 9,800,000 | | | | 2.505 | | | | 08/08/19 | | | | 9,693,724 | |
| | 1,000,000 | | | | 2.510 | | | | 08/22/19 | | | | 988,182 | |
| | 900,000 | | | | 2.515 | | | | 08/22/19 | | | | 889,343 | |
| | 3,000,000 | | | | 2.520 | | | | 08/22/19 | | | | 2,964,403 | |
| | |
| | |
| 10 | | The accompanying notes are an integral part of these financial statements. |
FINANCIAL SQUARE FEDERAL INSTRUMENTS FUND
| | | | | | | | | | | | | | |
Principal
Amount | | | Interest
Rate | | | Maturity
Date | | | Amortized
Cost | |
|
| U.S. Treasury Obligations – (continued) | |
| United States Treasury Floating Rate Note (3 Mo. U.S. T-Bill
MMY – 0.00%) |
|
| $ | 15,900,000 | | | | 2.420 | %(a) | | | 01/31/20 | | | $ | 15,903,295 | |
| United States Treasury Floating Rate Note (3 Mo. U.S. T-Bill
MMY + 0.03%) |
|
| | 1,200,000 | | | | 2.453 | (a) | | | 04/30/20 | | | | 1,200,382 | |
| United States Treasury Floating Rate Notes (3 Mo. U.S. T-Bill
MMY + 0.05%)(a) |
|
| | 16,300,000 | | | | 2.468 | | | | 10/31/19 | | | | 16,308,555 | |
| | 10,450,000 | | | | 2.465 | | | | 10/31/20 | | | | 10,450,000 | |
| United States Treasury Floating Rate Note (3 Mo. U.S. T-Bill
MMY + 0.06%) |
|
| | 31,200,000 | | | | 2.480 | (a) | | | 07/31/19 | | | | 31,214,549 | |
| United States Treasury Floating Rate Note (3 Mo. U.S. T-Bill
MMY + 0.07%) |
|
| | 21,200,000 | | | | 2.490 | (a) | | | 04/30/19 | | | | 21,204,273 | |
| | United States Treasury Notes | |
| | 300,000 | | | | 1.000 | | | | 03/15/19 | | | | 299,836 | |
| | 1,800,000 | | | | 1.625 | | | | 03/31/19 | | | | 1,798,710 | |
| | 2,400,000 | | | | 1.250 | | | | 06/30/19 | | | | 2,389,375 | |
| | 3,100,000 | | | | 1.625 | | | | 06/30/19 | | | | 3,090,094 | |
| | 200,000 | | | | 0.750 | | | | 07/15/19 | | | | 198,630 | |
| | 600,000 | | | | 0.875 | | | | 07/31/19 | | | | 596,015 | |
| | 500,000 | | | | 0.750 | | | | 08/15/19 | | | | 495,753 | |
| | 2,400,000 | | | | 3.625 | | | | 08/15/19 | | | | 2,411,243 | |
| | 800,000 | | | | 8.125 | | | | 08/15/19 | | | | 820,282 | |
| | 600,000 | | | | 1.750 | | | | 09/30/19 | | | | 596,768 | |
| | |
| TOTAL U.S. TREASURY
OBLIGATIONS |
| | $ | 408,225,692 | |
| �� | |
| | TOTAL INVESTMENTS – 121.1% | | | $ | 1,077,113,224 | |
| | |
| LIABILITIES IN EXCESS OF
OTHER ASSETS – (21.1)% |
| | | (187,769,625 | ) |
| | |
| | NET ASSETS – 100.0% | | | $ | 889,343,599 | |
| | |
| | |
|
| The percentage shown for each investment category reflects the value of investments in that category as a percentage of net assets. |
| |
(a) | | Variable or floating rate security. Except for floating rate notes (for which final maturity is disclosed), maturity date disclosed is the next interest reset date. Interest rate disclosed is that which is in effect on February 28, 2019. |
| |
(b) | | All or a portion represents a forward commitment. |
Interest rates represent either the stated coupon rate, annualized yield on date of purchase for discounted securities, or, for floating rate securities, the current reset rate, which is based upon current interest rate indices.
Maturity dates represent either the final legal maturity date on the security, the demand date for puttable securities, the date of the next interest rate reset for variable rate securities, or the prerefunded date for those types of securities.
| | |
|
Investment Abbreviations: |
FEDL01 | | —US Federal Funds Effective Rate |
LIBOR | | —London Interbank Offered Rates |
MMY | | —Money Market Yield |
Prime | | —Federal Reserve Bank Prime Loan Rate US |
T-Bill | | —Treasury Bill |
|
| | |
| The accompanying notes are an integral part of these financial statements. | | 11 |
FINANCIAL SQUARE GOVERNMENT FUND
Schedule of Investments
February 28, 2019 (Unaudited)
| | | | | | | | | | | | | | |
Principal
Amount | | | Interest
Rate | | | Maturity
Date | | | Amortized
Cost | |
|
| U.S. Government Agency Obligations – 18.1% | |
| | Federal Farm Credit Bank (1 Mo. LIBOR – 0.09%) | |
| $ | 148,000,000 | | | | 2.402 | %(a) | | | 03/28/19 | | | $ | 148,000,000 | |
| | Federal Farm Credit Bank (3 Mo. LIBOR – 0.14%) | |
| | 246,500,000 | | | | 2.663 | (a) | | | 09/30/19 | | | | 246,492,804 | |
| | Federal Farm Credit Bank (3 Mo. LIBOR – 0.26%) | |
| | 24,500,000 | | | | 2.523 | (a) | | | 07/10/19 | | | | 24,500,000 | |
| | Federal Farm Credit Bank (3 Mo. U.S. T-Bill MMY + 0.07%)(a) | |
| | 198,700,000 | | | | 2.485 | | | | 11/20/19 | | | | 198,695,707 | |
| | 98,500,000 | | | | 2.485 | | | | 11/29/19 | | | | 98,500,000 | |
| | 98,700,000 | | | | 2.490 | | | | 02/18/20 | | | | 98,700,000 | |
| | Federal Farm Credit Bank (3 Mo. U.S. T-Bill MMY + 0.08%)(a) | |
| | 120,500,000 | | | | 2.495 | | | | 10/18/19 | | | | 120,497,712 | |
| | 98,600,000 | | | | 2.495 | | | | 12/26/19 | | | | 98,596,781 | |
| | Federal Farm Credit Bank (3 Mo. U.S. T-Bill MMY + 0.09%) | |
| | 118,700,000 | | | | 2.505 | (a) | | | 07/05/19 | | | | 118,699,179 | |
| | Federal Farm Credit Bank (FEDL01 + 0.11%) | |
| | 123,400,000 | | | | 2.510 | (a) | | | 08/13/20 | | | | 123,382,156 | |
| | Federal Farm Credit Bank (Prime Rate – 2.88%) | |
| | 148,000,000 | | | | 2.620 | (a) | | | 05/07/20 | | | | 147,986,061 | |
| | Federal Farm Credit Bank (Prime Rate – 2.90%) | |
| | 88,800,000 | | | | 2.600 | (a) | | | 01/30/20 | | | | 88,800,000 | |
| | Federal Farm Credit Bank (Prime Rate – 2.93%) | |
| | 197,600,000 | | | | 2.570 | (a) | | | 11/06/20 | | | | 197,600,000 | |
| | Federal Farm Credit Bank (Prime Rate – 2.94%) | |
| | 244,900,000 | | | | 2.565 | (a) | | | 10/30/20 | | | | 244,900,000 | |
| | Federal Farm Credit Bank (Prime Rate – 2.95%) | |
| | 24,300,000 | | | | 2.550 | (a) | | | 04/30/20 | | | | 24,300,000 | |
| | Federal Farm Credit Bank (Prime Rate – 2.96%) | |
| | 24,600,000 | | | | 2.540 | (a) | | | 03/13/20 | | | | 24,580,932 | |
| | Federal Farm Credit Bank (Prime Rate – 2.98%) | |
| | 54,000,000 | | | | 2.520 | (a) | | | 11/12/20 | | | | 53,954,514 | |
| | Federal Farm Credit Bank (Prime Rate – 3.08%)(a) | |
| | 36,500,000 | | | | 2.420 | | | | 06/27/19 | | | | 36,499,399 | |
| | 216,800,000 | | | | 2.420 | | | | 07/17/19 | | | | 216,791,787 | |
| | Federal Home Loan Bank (1 Mo. LIBOR – 0.05%) | |
| | 988,000,000 | | | | 2.462 | (a) | | | 10/07/19 | | | | 988,000,000 | |
| | Federal Home Loan Bank (1 Mo. LIBOR – 0.08%) | |
| | 1,900,000,000 | | | | 2.401 | (a) | | | 03/19/19 | | | | 1,900,000,000 | |
| | Federal Home Loan Bank (1 Mo. LIBOR – 0.10%) | |
| | 903,750,000 | | | | 2.386 | (a) | | | 04/18/19 | | | | 903,750,000 | |
| | Federal Home Loan Bank (3 Mo. LIBOR – 0.16%) | |
| | 477,700,000 | | | | 2.591 | (a) | | | 08/04/20 | | | | 477,700,000 | |
| | Federal Home Loan Bank (3 Mo. LIBOR – 0.26%)(a) | |
| | 745,000,000 | | | | 2.549 | | | | 06/27/19 | | | | 745,000,000 | |
| | 495,000,000 | | | | 2.542 | | | | 07/09/19 | | | | 495,000,000 | |
| | 496,000,000 | | | | 2.544 | | | | 07/11/19 | | | | 496,000,000 | |
| | Federal Home Loan Bank (3 Mo. LIBOR – 0.31%)(a) | |
| | 566,900,000 | | | | 2.469 | | | | 03/13/19 | | | | 566,900,000 | |
| | 949,300,000 | | | | 2.478 | | | | 03/15/19 | | | | 949,300,000 | |
| | 224,000,000 | | | | 2.514 | | | | 03/22/19 | | | | 224,000,000 | |
| | 98,500,000 | | | | 2.512 | | | | 03/25/19 | | | | 98,500,000 | |
| | Federal Home Loan Bank (3 Mo. LIBOR – 0.32%)(a) | |
| | 493,500,000 | | | | 2.470 | | | | 03/21/19 | | | | 493,500,000 | |
| | 986,800,000 | | | | 2.502 | | | | 03/25/19 | | | | 986,800,000 | |
| | 987,000,000 | | | | 2.502 | | | | 03/27/19 | | | | 987,000,000 | |
| | Federal Home Loan Bank (3 Mo. U.S. T-Bill + 0.07%) | |
| | 1,755,000,000 | | | | 2.530 | (a) | | | 01/30/20 | | | | 1,755,241,963 | |
| | |
|
| U.S. Government Agency Obligations – (continued) | |
| | Federal Home Loan Bank (Prime Rate – 2.94%) | |
| 98,300,000 | | | | 2.560 | %(a) | | | 02/26/21 | | | | 98,300,000 | |
| | Federal Home Loan Bank Discount Notes | |
| | 200,000,000 | | | | 2.281 | | | | 03/01/19 | | | | 200,000,000 | |
| | 229,500,000 | | | | 2.526 | | | | 05/08/19 | | | | 228,429,255 | |
| | 217,500,000 | | | | 2.532 | | | | 05/14/19 | | | | 216,393,469 | |
| | 182,600,000 | | | | 2.500 | | | | 05/17/19 | | | | 182,582,920 | |
| | 496,700,000 | | | | 2.539 | | | | 05/21/19 | | | | 493,928,414 | |
| | 496,000,000 | | | | 2.498 | | | | 07/12/19 | | | | 491,528,836 | |
| | Federal National Mortgage Association (SOFR + 0.12%) | |
| | 994,000,000 | | | | 2.490 | (a) | | | 07/30/19 | | | | 994,000,000 | |
| | Federal National Mortgage Association (SOFR + 0.16%) | |
| | 124,250,000 | | | | 2.530 | (a) | | | 01/30/20 | | | | 124,250,000 | |
| | Overseas Private Investment Corp. (3 Mo. U.S. T-Bill + 0.00%)(a) | |
| | 102,234,956 | | | | 2.420 | | | | 03/07/19 | | | | 102,234,957 | |
| | 646,873,699 | | | | 2.440 | | | | 03/07/19 | | | | 646,873,699 | |
| | |
| TOTAL U.S. GOVERNMENT
AGENCY OBLIGATIONS |
| | $ | 18,156,690,545 | |
| | |
| | | | | | | | | | | | | | |
|
| U.S. Treasury Obligations – 23.3% | |
| | United States Treasury Bills | |
| $ | 100,000 | | | | 2.422 | % | | | 03/26/19 | | | $ | 99,834 | |
| | 428,300,000 | | | | 2.443 | (b) | | | 04/02/19 | | | | 427,498,841 | |
| | 2,710,000,000 | | | | 2.440 | (b) | | | 04/11/19 | | | | 2,702,592,676 | |
| | 443,400,000 | | | | 2.546 | | | | 06/13/19 | | | | 440,223,285 | |
| | 697,470,000 | | | | 2.552 | | | | 06/20/19 | | | | 692,125,925 | |
| | 518,730,000 | | | | 2.546 | | | | 06/27/19 | | | | 514,513,301 | |
| | 2,854,800,000 | | | | 2.573 | | | | 07/05/19 | | | | 2,829,770,541 | |
| | 159,700,000 | | | | 2.536 | | | | 07/11/19 | | | | 158,253,650 | |
| | 1,276,300,000 | | | | 2.515 | | | | 08/01/19 | | | | 1,263,010,527 | |
| | 56,100,000 | | | | 2.487 | | | | 08/08/19 | | | | 55,495,367 | |
| | 33,200,000 | | | | 2.492 | | | | 08/08/19 | | | | 32,841,440 | |
| | 238,600,000 | | | | 2.494 | | | | 08/08/19 | | | | 236,023,120 | |
| | 531,700,000 | | | | 2.500 | | | | 08/08/19 | | | | 525,945,824 | |
| | 101,300,000 | | | | 2.501 | | | | 08/08/19 | | | | 100,203,259 | |
| | 101,300,000 | | | | 2.502 | | | | 08/08/19 | | | | 100,202,583 | |
| | 1,096,750,000 | | | | 2.505 | | | | 08/08/19 | | | | 1,084,856,353 | |
| | 116,900,000 | | | | 2.510 | | | | 08/22/19 | | | | 115,518,534 | |
| | 121,250,000 | | | | 2.515 | | | | 08/22/19 | | | | 119,814,198 | |
| | 350,100,000 | | | | 2.520 | | | | 08/22/19 | | | | 345,945,772 | |
| United States Treasury Floating Rate Note (3 Mo. U.S. T-Bill
MMY + 0.04%) |
|
| | 3,000,000,500 | | | | 2.46 | (a) | | | 07/31/20 | | | | 2,999,688,879 | |
| United States Treasury Floating Rate Notes (3 Mo. U.S. T-Bill
MMY + 0.05%)(a) |
|
| | 4,854,100,000 | | | | 2.468 | | | | 10/31/19 | | | | 4,854,429,673 | |
| | 2,003,000,000 | | | | 2.465 | | | | 10/31/20 | | | | 2,003,000,000 | |
| | United States Treasury Notes | |
| | 51,300,000 | | | | 1.125 | | | | 05/31/19 | | | | 51,118,717 | |
| | 384,600,000 | | | | 1.250 | | | | 06/30/19 | | | | 382,897,461 | |
| | 506,300,000 | | | | 1.625 | | | | 06/30/19 | | | | 504,682,032 | |
| | 34,400,000 | | | | 0.750 | | | | 07/15/19 | | | | 34,164,401 | |
| | 69,900,000 | | | | 0.875 | | | | 07/31/19 | | | | 69,435,728 | |
| | 80,600,000 | | | | 0.750 | | | | 08/15/19 | | | | 79,915,404 | |
| | 370,000,000 | | | | 3.625 | | | | 08/15/19 | | | | 371,738,061 | |
| | |
| | |
| 12 | | The accompanying notes are an integral part of these financial statements. |
FINANCIAL SQUARE GOVERNMENT FUND
| | | | | | | | | | | | | | |
Principal
Amount | | | Interest
Rate | | | Maturity
Date | | | Amortized
Cost | |
|
| U.S. Treasury Obligations – (continued) | |
| | United States Treasury Notes – (continued) | |
| $ | 117,000,000 | | | | 8.125 | % | | | 08/15/19 | | | $ | 119,966,270 | |
| | 91,800,000 | | | | 1.750 | | | | 09/30/19 | | | | 91,305,457 | |
| | |
| TOTAL U.S. TREASURY
OBLIGATIONS |
| | $ | 23,307,277,113 | |
| | |
| TOTAL INVESTMENTS BEFORE
REPURCHASE AGREEMENTS |
| | $ | 41,463,967,658 | |
| | |
| | | | | | | | | | | | | | |
|
| Repurchase Agreements-Unaffiliated Issuers(c) – 59.5% | |
| | Bank of Montreal | |
| $ | 20,000,000 | | | | 2.600 | % | | | 03/01/19 | | | $ | 20,000,000 | |
| | Maturity Value: $20,001,444 | |
| Collateralized by Federal National Mortgage Association, 4.000%
to 4.500%, due 01/01/49 to 03/01/49, Government National
Mortgage Association, 4.500%, due 01/20/49, U.S. Treasury
Bonds, 2.500% to 3.000%, due 02/15/46 to 02/15/47 and a U.S.
Treasury Note, 2.250%, due 11/15/27. The aggregate market
value of the collateral, including accrued interest, was
$20,599,869. |
|
| | 500,000,000 | | | | 2.480 | (d) | | | 03/07/19 | | | | 500,000,000 | |
| | Maturity Value: $501,928,889 | |
| | Settlement Date: 02/13/19 | |
| Collateralized by Federal Home Loan Bank, 3.500%, due
06/09/28, Federal Home Loan Mortgage Corp., 3.000% to
4.000%, due 10/01/29 to 11/01/48, Federal National Mortgage
Association, 3.000% to 5.000%, due 03/01/28 to 03/01/49 and
Government National Mortgage Association, 3.000% to
4.500%, due 01/20/46 to 01/20/49. The aggregate market value
of the collateral, including accrued interest, was $514,979,563. |
|
| | |
| | Bank of Nova Scotia (The) | |
| | 200,000,000 | | | | 2.620 | | | | 03/01/19 | | | | 200,000,000 | |
| | Maturity Value: $200,014,556 | |
| Collateralized by Federal Home Loan Mortgage Corp., 3.500% to
6.000%, due 11/01/20 to 12/01/48, Federal National Mortgage
Association, 1.750% to 7.125%, due 09/12/19 to 02/01/49 and
Government National Mortgage Association, 4.000% to
5.000%, due 01/20/46 to 02/20/49. The aggregate market value
of the collateral, including accrued interest, was $205,880,107. |
|
| | |
| | BNP Paribas | |
| | 500,000,000 | | | | 2.600 | | | | 03/01/19 | | | | 500,000,000 | |
| | Maturity Value: $500,036,111 | |
| Collateralized by a U.S. Treasury Note, 3.625%, due 08/15/19.
The market value of the collateral, including accrued interest,
was $510,000,000. |
|
| | 1,000,000,000 | | | | 2.600 | | | | 03/01/19 | | | | 1,000,000,000 | |
| | Maturity Value: $1,000,072,222 | |
| Collateralized by a U.S. Treasury Note, 2.875%, due 07/31/25.
The market value of the collateral, including accrued interest,
was $1,020,000,000. |
|
| | 1,000,000,000 | | | | 2.600 | | | | 03/01/19 | | | | 1,000,000,000 | |
| | Maturity Value: $1,000,072,222 | |
| Collateralized by a U.S. Treasury Note, 2.500%, due 06/30/20.
The market value of the collateral, including accrued interest,
was $1,020,000,000. |
|
| | |
|
| Repurchase Agreements-Unaffiliated Issuers(c) – (continued) | |
| | BNP Paribas – (continued) | |
| 475,000,000 | | | | 2.480 | %(d) | | | 03/07/19 | | | | 475,000,000 | |
| | Maturity Value: $480,890,001 | |
| | Settlement Date: 02/27/19 | |
| Collateralized by U.S. Treasury Bonds, 2.500% to 2.750%, due
08/15/42 to 02/15/45, U.S. Treasury Inflation-Indexed Bonds,
2.125% to 3.875%, due 04/15/29 to 02/15/41, U.S. Treasury
Interest-Only Stripped Securities, 0.000%, due 05/15/21 to
11/15/45, U.S. Treasury Notes, 1.750% to 3.500%, due
05/15/20 to 01/31/23 and U.S. Treasury Principal-Only
Stripped Securities, 0.000%, due 08/15/28 to 05/15/46. The
aggregate market value of the collateral, including accrued
interest, was $484,499,997. |
|
| | 1,490,000,000 | | | | 2.480 | (d) | | | 03/07/19 | | | | 1,490,000,000 | |
| | Maturity Value: $1,499,443,290 | |
| | Settlement Date: 12/20/18 | |
| Collateralized by Federal Farm Credit Bank, 1.375% to 4.080%,
due 06/12/19 to 09/20/38, Federal Home Loan Mortgage Corp.,
3.000% to 7.500%, due 03/01/19 to 03/01/49, Federal National
Mortgage Association, 2.500% to 7.500%, due 04/01/19 to
06/01/51, Federal National Mortgage Association Stripped
Security, 0.000%, due 11/15/30, Government National
Mortgage Association, 2.000% to 6.000%, due 02/15/33 to
02/20/49, U.S. Treasury Bills, 0.000%, due 07/05/19 to
08/08/19, U.S. Treasury Bonds, 2.750% to 8.125%, due
08/15/19 to 08/15/45, U.S. Treasury Inflation-Indexed Bonds,
0.750% to 3.875%, due 01/15/29 to 02/15/45, U.S. Treasury
Interest-Only Stripped Securities, 0.000%, due 05/15/37 to
08/15/37 and U.S. Treasury Notes, 1.000% to 2.750%, due
09/30/19 to 12/31/23. The aggregate market value of the
collateral, including accrued interest, was $1,529,098,824. |
|
| | 250,000,000 | | | | 2.500 | (d) | | | 03/07/19 | | | | 250,000,000 | |
| | Maturity Value: $253,142,359 | |
| | Settlement Date: 01/08/19 | |
| Collateralized by Federal Home Loan Mortgage Corp., 3.000% to
4.500%, due 04/01/46 to 09/01/48, Federal National Mortgage
Association, 3.000% to 5.000%, due 10/01/30 to 07/01/48,
Government National Mortgage Association, 2.500% to
4.500%, due 12/15/26 to 12/20/48, a U.S. Treasury Bill,
0.000%, due 03/28/19, a U.S. Treasury Bond, 4.375%, due
11/15/39, a U.S. Treasury Inflation-Indexed Bond, 3.375%, due
04/15/32, U.S. Treasury Interest-Only Stripped Securities,
0.000%, due 05/15/19 to 02/15/33, U.S. Treasury Notes,
1.375% to 2.625%, due 03/31/20 to 02/28/26 and a U.S.
Treasury Principal-Only Stripped Security, 0.000%, due
05/15/39. The aggregate market value of the collateral,
including accrued interest, was $256,992,319. |
|
| | |
| | |
| The accompanying notes are an integral part of these financial statements. | | 13 |
FINANCIAL SQUARE GOVERNMENT FUND
Schedule of Investments(continued)
February 28, 2019 (Unaudited)
| | | | | | | | | | | | | | |
Principal
Amount | | | Interest
Rate | | | Maturity
Date | | | Amortized
Cost | |
|
| Repurchase Agreements-Unaffiliated Issuers(c) – (continued) | |
| | BNP Paribas – (continued) | |
| $ | 870,000,000 | | | | 2.500 | %(d) | | | 03/07/19 | | | $ | 870,000,000 | |
| | Maturity Value: $880,874,993 | |
| | Settlement Date: 02/27/19 | |
| Collateralized by Federal Farm Credit Bank, 3.420%, due
09/11/37, Federal Home Loan Mortgage Corp., 2.000% to
7.000%, due 03/01/19 to 12/01/48, Federal National Mortgage
Association, 2.500% to 6.500%, due 04/01/19 to 01/01/57,
Government National Mortgage Association, 3.000% to
7.000%, due 12/15/25 to 02/20/49, a U.S. Treasury Bill,
0.000%, due 04/23/19, a U.S. Treasury Bond, 2.500%, due
02/15/45, U.S. Treasury Inflation-Indexed Notes, 0.500% to
1.125%, due 01/15/21 to 01/15/28, U.S. Treasury Interest-Only
Stripped Securities, 0.000%, due 02/15/33 to 08/15/47 and U.S.
Treasury Notes, 1.500% to 2.625%, due 08/15/20 to 02/28/23.
The aggregate market value of the collateral, including accrued
interest, was $895,836,763. |
|
| | 2,000,000,000 | | | | 2.500 | (d) | | | 03/07/19 | | | | 2,000,000,000 | |
| | Maturity Value: $2,024,999,984 | |
| | Settlement Date: 01/04/19 | |
| Collateralized by Federal Farm Credit Bank, 1.375% to 3.540%,
due 06/12/19 to 01/25/38, Federal Home Loan Bank, 0.875%,
due 08/05/19, Federal Home Loan Mortgage Corp., 3.000%,
due 01/01/47, Federal National Mortgage Association, 1.200%
to 5.500%, due 08/16/19 to 11/01/48, Federal National
Mortgage Association Stripped Security, 0.000%, due
11/15/30, Government National Mortgage Association,
3.645%, due 01/20/43, U.S. Treasury Bills, 0.000%, due
03/26/19 to 07/11/19, U.S. Treasury Bonds, 2.500% to 7.250%,
due 08/15/22 to 08/15/48, a U.S. Treasury Inflation-Indexed
Bond, 0.875%, due 02/15/47, U.S. Treasury Inflation-Indexed
Notes, 0.375% to 1.875%, due 07/15/19 to 07/15/27, U.S.
Treasury Interest-Only Stripped Securities, 0.000%, due
05/15/19 to 05/15/48, U.S. Treasury Notes, 1.125% to 2.875%,
due 01/31/20 to 02/15/29 and U.S. Treasury Principal-Only
Stripped Securities, 0.000%, due 11/15/22 to 02/15/23. The
aggregate market value of the collateral, including accrued
interest, was $2,040,181,870. |
|
| | |
|
| Repurchase Agreements-Unaffiliated Issuers(c) – (continued) | |
| | BNP Paribas (Overnight MBS + 0.02%) | |
| 500,000,000 | | | | 2.630 | %(a)(d) | | | 03/01/19 | | | | 500,000,000 | |
| | Maturity Value: $540,765,025 | |
| | Settlement Date: 02/23/16 | |
| Collateralized by Federal Farm Credit Bank, 3.130% to 4.150%,
due 06/27/33 to 06/02/36, Federal Home Loan Bank, 4.200%,
due 06/01/33, Federal Home Loan Mortgage Corp., 0.000% to
8.000%, due 04/01/19 to 10/01/48, Federal National Mortgage
Association, 1.200% to 7.000%, due 08/16/19 to 11/01/48,
Federal National Mortgage Association Stripped Securities,
0.000%, due 05/15/22 to 05/15/29, Government National
Mortgage Association, 2.500% to 6.450%, due 12/15/26 to
12/20/48, U.S. Treasury Bills, 0.000%, due 03/28/19 to
06/20/19, U.S. Treasury Bonds, 2.750% to 6.625%, due
02/15/27 to 08/15/44, a U.S. Treasury Inflation-Indexed Note,
1.125%, due 01/15/21, U.S. Treasury Interest-Only Stripped
Securities, 0.000%, due 05/15/21 to 02/15/33 and U.S.
Treasury Notes, 1.375% to 2.750%, due 06/30/20 to 08/15/21.
The aggregate market value of the collateral, including accrued
interest, was $514,149,208. |
|
| | 550,000,000 | | | | 2.630 | (a)(d) | | | 03/01/19 | | | | 550,000,000 | |
| | Maturity Value: $594,560,263 | |
| | Settlement Date: 02/23/16 | |
| Collateralized by Federal Home Loan Mortgage Corp., 3.000% to
7.500%, due 03/01/19 to 11/01/48, Federal National Mortgage
Association, 3.000% to 9.000%, due 04/01/19 to 11/01/48,
Government National Mortgage Association, 2.500% to
9.500%, due 06/15/21 to 11/20/48, a U.S. Treasury Bill,
0.000%, due 06/20/19, a U.S. Treasury Bond, 2.875%, due
05/15/43 and U.S. Treasury Notes, 1.250% to 2.375%, due
04/30/20 to 02/29/24. The aggregate market value of the
collateral, including accrued interest, was $566,310,755. |
|
| | |
| | CIBC Wood Gundy Securities | |
| | 100,000,000 | | | | 2.460 | (d) | | | 03/07/19 | | | | 100,000,000 | |
| | Maturity Value: $100,410,000 | |
| | Settlement Date: 02/11/19 | |
| Collateralized by Federal Home Loan Mortgage Corp., 3.000%,
due 10/01/33, Federal National Mortgage Association, 3.500%
to 4.000%, due 11/01/48 to 03/01/49, Government National
Mortgage Association, 4.500%, due 10/20/48 to 01/20/49 and a
U.S. Treasury Note, 2.750%, due 09/15/21. The aggregate
market value of the collateral, including accrued interest, was
$102,999,091. |
|
| | 300,000,000 | | | | 2.460 | (d) | | | 03/07/19 | | | | 300,000,000 | |
| | Maturity Value: $301,926,999 | |
| | Settlement Date: 01/18/19 | |
| Collateralized by U.S. Treasury Bonds, 3.125%, due 02/15/43 to
05/15/48, U.S. Treasury Inflation-Indexed Notes, 0.625% to
0.750%, due 01/15/26 to 07/15/28 and U.S. Treasury Notes,
1.875% to 3.125%, due 09/30/20 to 11/15/28. The aggregate
market value of the collateral, including accrued interest, was
$306,000,020. |
|
| | |
| | |
| 14 | | The accompanying notes are an integral part of these financial statements. |
FINANCIAL SQUARE GOVERNMENT FUND
| | | | | | | | | | | | | | |
Principal
Amount | | | Interest
Rate | | | Maturity
Date | | | Amortized
Cost | |
|
| Repurchase Agreements-Unaffiliated Issuers(c) – (continued) | |
| | CIBC Wood Gundy Securities – (continued) | |
| $ | 500,000,000 | | | | 2.460 | %(d) | | | 03/07/19 | | | $ | 500,000,000 | |
| | Maturity Value: $502,049,999 | |
| | Settlement Date: 02/11/19 | |
| Collateralized by Federal Home Loan Mortgage Corp., 3.000% to
4.000%, due 04/01/44 to 02/01/48, Federal National Mortgage
Association, 3.500% to 4.500%, due 05/01/42 to 10/01/48,
Government National Mortgage Association, 4.500%, due
10/20/48 to 01/20/49 and a U.S. Treasury Note, 2.750%, due
09/15/21. The aggregate market value of the collateral,
including accrued interest, was $514,992,421. |
|
| | 300,000,000 | | | | 2.480 | (d) | | | 03/07/19 | | | | 300,000,000 | |
| | Maturity Value: $301,798,000 | |
| | Settlement Date: 01/14/19 | |
| Collateralized by Federal Home Loan Mortgage Corp., 3.000% to
3.500%, due 12/01/47 to 02/01/48, Federal National Mortgage
Association, 3.500% to 5.000%, due 04/01/46 to 02/01/49,
Government National Mortgage Association, 4.000% to
5.000%, due 10/20/44 to 01/20/49 and a U.S. Treasury Note,
2.750%, due 09/15/21. The aggregate market value of the
collateral, including accrued interest, was $308,995,449. |
|
| | 550,000,000 | | | | 2.480 | (d) | | | 03/07/19 | | | | 550,000,000 | |
| | Maturity Value: $553,410,001 | |
| | Settlement Date: 01/18/19 | |
| Collateralized by Federal Home Loan Mortgage Corp., 3.000% to
4.500%, due 01/01/48 to 03/01/49, Federal National Mortgage
Association, 3.500% to 4.500%, due 11/01/30 to 03/01/49,
Government National Mortgage Association, 4.500%, due
10/20/48 to 01/20/49, a U.S. Treasury Bond, 3.125%, due
05/15/48 and a U.S. Treasury Note, 2.000%, due 11/15/26. The
aggregate market value of the collateral, including accrued
interest, was $566,494,286. |
|
| | |
| | Citibank N.A. (Overnight MBS + 0.01%) | |
| | 1,000,000,000 | | | | 2.630 | (a) | | | 03/07/19 | | | | 1,000,000,000 | |
| | Maturity Value: $1,009,570,284 | |
| | Settlement Date: 11/01/18 | |
| Collateralized by Federal Farm Credit Bank, 2.430% to 2.779%,
due 03/23/20 to 07/19/27, Federal Home Loan Bank, 2.484% to
5.500%, due 02/25/20 to 07/15/36, Federal Home Loan
Mortgage Corp., 0.875% to 11.000%, due 03/01/19 to
07/01/48, Federal National Mortgage Association, 0.000% to
8.500%, due 03/01/19 to 03/01/49, Government National
Mortgage Association, 2.500% to 8.500%, due 05/15/24 to
01/20/49, Tennessee Valley Authority, 2.875% to 3.500%, due
09/15/24 to 12/15/42, U.S. Treasury Bills, 0.000%, due
03/19/19 to 01/30/20, U.S. Treasury Bonds, 2.250% to 8.125%,
due 08/15/19 to 05/15/47, a U.S. Treasury Floating Rate Note,
2.535%, due 01/31/21, U.S. Treasury Inflation-Indexed Bonds,
0.625% to 3.875%, due 04/15/28 to 02/15/47, U.S. Treasury
Inflation-Indexed Notes, 0.125% to 1.875%, due 04/15/19 to
01/15/29 and U.S. Treasury Notes, 0.875% to 3.625%, due
04/30/19 to 02/15/27. The aggregate market value of the
collateral, including accrued interest, was $1,020,000,175. |
|
| | |
|
| Repurchase Agreements-Unaffiliated Issuers(c) – (continued) | |
| | Credit Agricole Corporate and Investment Bank | |
| 3,200,000 | | | | 2.350 | % | | | 03/01/19 | | | | 3,200,000 | |
| | Maturity Value: $3,200,209 | |
| Collateralized by U.S. Treasury Bills, 0.000%, due 06/06/19 to
02/27/20, U.S. Treasury Bonds, 4.625% to 7.250%, due
08/15/22 to 02/15/40, a U.S. Treasury Inflation-Indexed Note,
0.125%, due 04/15/19 and U.S. Treasury Notes, 2.000% to
2.125%, due 01/31/21 to 02/28/21. The aggregate market value
of the collateral, including accrued interest, was $3,264,073. |
|
| | 300,000,000 | | | | 2.350 | | | | 03/01/19 | | | | 300,000,000 | |
| | Maturity Value: $300,019,583 | |
| Collateralized by U.S. Treasury Inflation-Indexed Notes, 0.125%
to 0.250%, due 04/15/20 to 07/15/26 and U.S. Treasury Notes,
2.250% to 2.750%, due 02/28/23 to 11/15/24. The aggregate
market value of the collateral, including accrued interest, was
$306,000,059. |
|
| | 150,000,000 | | | | 2.530 | | | | 03/01/19 | | | | 150,000,000 | |
| | Maturity Value: $150,010,542 | |
| Collateralized by U.S. Treasury Bills, 0.000%, due 03/26/19 to
02/27/20, a U.S. Treasury Floating Rate Note, 2.480%, due
07/31/19, U.S. Treasury Inflation-Indexed Notes, 0.125% to
0.375%, due 04/15/19 to 07/15/27 and U.S. Treasury Notes,
1.125% to 2.625%, due 01/31/20 to 03/31/22. The aggregate
market value of the collateral, including accrued interest, was
$153,000,024. |
|
| | |
| | Daiwa Capital Markets America, Inc. | |
| | 95,220,588 | | | | 2.580 | | | | 03/01/19 | | | | 95,220,588 | |
| | Maturity Value: $95,227,412 | |
| Collateralized by a U.S. Treasury Note, 2.250%, due 08/15/27.
The market value of the collateral, including accrued interest,
was $97,125,000. |
|
| | 95,656,715 | | | | 2.580 | | | | 03/01/19 | | | | 95,656,715 | |
| | Maturity Value: $95,663,570 | |
| Collateralized by a U.S. Treasury Note, 2.125%, due 09/30/24.
The market value of the collateral, including accrued interest,
was $97,569,849. |
|
| | 97,274,582 | | | | 2.580 | | | | 03/01/19 | | | | 97,274,582 | |
| | Maturity Value: $97,281,553 | |
| Collateralized by a U.S. Treasury Note, 2.125%, due 05/15/25.
The market value of the collateral, including accrued interest,
was $99,220,074. |
|
| | 109,460,782 | | | | 2.580 | | | | 03/01/19 | | | | 109,460,782 | |
| | Maturity Value: $109,468,627 | |
| Collateralized by a U.S. Treasury Note, 2.750%, due 06/30/25.
The market value of the collateral, including accrued interest,
was $111,649,998. |
|
| | 135,816,175 | | | | 2.580 | | | | 03/01/19 | | | | 135,816,175 | |
| | Maturity Value: $135,825,908 | |
| Collateralized by a U.S. Treasury Note, 2.000%, due 04/30/24.
The market value of the collateral, including accrued interest,
was $138,532,498. |
|
| | |
| | |
| The accompanying notes are an integral part of these financial statements. | | 15 |
FINANCIAL SQUARE GOVERNMENT FUND
Schedule of Investments(continued)
February 28, 2019 (Unaudited)
| | | | | | | | | | | | | | |
Principal
Amount | | | Interest
Rate | | | Maturity
Date | | | Amortized
Cost | |
|
| Repurchase Agreements-Unaffiliated Issuers(c) – (continued) | |
| | Daiwa Capital Markets America, Inc. – (continued) | |
| $ | 144,176,285 | | | | 2.580 | % | | | 03/01/19 | | | $ | 144,176,285 | |
| | Maturity Value: $144,186,618 | |
| Collateralized by a U.S. Treasury Note, 2.875%, due 09/30/23.
The market value of the collateral, including accrued interest,
was $147,059,811. |
|
| | 144,485,292 | | | | 2.580 | | | | 03/01/19 | | | | 144,485,292 | |
| | Maturity Value: $144,495,647 | |
| Collateralized by a U.S. Treasury Note, 2.000%, due 02/15/23.
The market value of the collateral, including accrued interest,
was $147,374,998. |
|
| | 147,564,828 | | | | 2.580 | | | | 03/01/19 | | | | 147,564,828 | |
| | Maturity Value: $147,575,403 | |
| Collateralized by a U.S. Treasury Bond, 2.875%, due 05/15/28.
The market value of the collateral, including accrued interest,
was $150,516,125. |
|
| | 160,858,889 | | | | 2.580 | | | | 03/01/19 | | | | 160,858,889 | |
| | Maturity Value: $160,870,417 | |
| Collateralized by a U.S. Treasury Note, 2.875%, due 10/15/21.
The market value of the collateral, including accrued interest,
was $164,076,067. |
|
| | 175,794,117 | | | | 2.580 | | | | 03/01/19 | | | | 175,794,117 | |
| | Maturity Value: $175,806,716 | |
| Collateralized by a U.S. Treasury Bond, 6.500%, due 11/15/26.
The market value of the collateral, including accrued interest,
was $179,309,999. |
|
| | 250,839,091 | | | | 2.580 | | | | 03/01/19 | | | | 250,839,091 | |
| | Maturity Value: $250,857,068 | |
| Collateralized by a U.S. Treasury Note, 2.500%, due 01/15/22.
The market value of the collateral, including accrued interest,
was $255,855,873. |
|
| | 252,064,965 | | | | 2.580 | | | | 03/01/19 | | | | 252,064,965 | |
| | Maturity Value: $252,083,030 | |
| Collateralized by a U.S. Treasury Note, 2.750%, due 08/31/23.
The market value of the collateral, including accrued interest,
was $257,106,264. |
|
| | 282,103,042 | | | | 2.580 | | | | 03/01/19 | | | | 282,103,042 | |
| | Maturity Value: $282,123,259 | |
| Collateralized by a U.S. Treasury Note, 2.875%, due 10/31/23.
The market value of the collateral, including accrued interest,
was $287,745,103. |
|
| | 342,766,763 | | | | 2.580 | | | | 03/01/19 | | | | 342,766,763 | |
| | Maturity Value: $342,791,328 | |
| Collateralized by a U.S. Treasury Note, 2.375%, due 02/29/24.
The market value of the collateral, including accrued interest,
was $349,622,098. |
|
| | 370,172,000 | | | | 2.580 | | | | 03/01/19 | | | | 370,172,000 | |
| | Maturity Value: $370,198,529 | |
| Collateralized by a U.S. Treasury Bond, 2.750%, due 04/30/23.
The market value of the collateral, including accrued interest,
was $377,575,440. |
|
| | 385,467,518 | | | | 2.580 | | | | 03/01/19 | | | | 385,467,518 | |
| | Maturity Value: $385,495,143 | |
| Collateralized by a U.S. Treasury Note, 2.625%, due 12/31/25.
The market value of the collateral, including accrued interest,
was $393,176,868. |
|
| | |
|
| Repurchase Agreements-Unaffiliated Issuers(c) – (continued) | |
| | Daiwa Capital Markets America, Inc. – (continued) | |
| 389,044,112 | | | | 2.580 | | | | 03/01/19 | | | | 389,044,112 | |
| | Maturity Value: $389,071,993 | |
| Collateralized by a U.S. Treasury Note, 2.250%, due 11/15/27.
The market value of the collateral, including accrued interest,
was $396,824,994. |
|
| | 439,647,051 | | | | 2.580 | | | | 03/01/19 | | | | 439,647,051 | |
| | Maturity Value: $439,678,559 | |
| Collateralized by a U.S. Treasury Note, 2.625%, due 12/15/21.
The market value of the collateral, including accrued interest,
was $448,439,992. |
|
| | 481,587,205 | | | | 2.580 | | | | 03/01/19 | | | | 481,587,205 | |
| | Maturity Value: $481,621,719 | |
| Collateralized by a U.S. Treasury Note, 2.875%, due 11/30/23.
The market value of the collateral, including accrued interest,
was $491,218,949. |
|
| | |
| | Deutsche Bank Securities, Inc. | |
| | 400,000,000 | | | | 2.620 | | | | 03/01/19 | | | | 400,000,000 | |
| | Maturity Value: $400,029,111 | |
| Collateralized by Federal Home Loan Mortgage Corp., 2.500% to
5.000%, due 01/01/27 to 02/01/49 and U.S. Treasury Notes,
2.250% to 2.625%, due 03/31/21 to 02/15/29. The aggregate
market value of the collateral, including accrued interest, was
$409,132,378. |
|
| | |
| | Federal Reserve Bank of New York | |
| | 350,000,000 | | | | 2.250 | | | | 03/01/19 | | | | 350,000,000 | |
| | Maturity Value: $350,021,875 | |
| Collateralized by U.S. Treasury Notes, 2.000% to 2.750%, due
11/30/22 to 08/31/25. The aggregate market value of the
collateral, including accrued interest, was $350,021,884. |
|
| | |
| | Fixed Income Clearing Corp. | |
| | 115,000,000 | | | | 2.360 | | | | 03/01/19 | | | | 115,000,000 | |
| | Maturity Value: $115,007,539 | |
| Collateralized by a U.S. Treasury Bill, 0.000%, due 02/27/20 and
a U.S. Treasury Note, 1.375%, due 01/31/21. The aggregate
market value of the collateral, including accrued interest, was
$117,300,072. |
|
| | 500,000,000 | | | | 2.400 | | | | 03/01/19 | | | | 500,000,000 | |
| | Maturity Value: $500,033,333 | |
| Collateralized by a U.S. Treasury Bill, 0.000%, due 02/27/20. The
market value of the collateral, including accrued interest, was
$510,000,009. |
|
| | 9,500,000,000 | | | | 2.550 | | | | 03/01/19 | | | | 9,500,000,000 | |
| | Maturity Value: $9,500,672,917 | |
| Collateralized by U.S. Treasury Bonds, 3.125% to 3.750%, due
11/15/43 to 08/15/44 and U.S. Treasury Notes, 2.750% to
3.375%, due 11/15/19 to 07/31/25. The aggregate market value
of the collateral, including accrued interest, was
$9,690,000,058. |
|
| | |
| | |
| 16 | | The accompanying notes are an integral part of these financial statements. |
FINANCIAL SQUARE GOVERNMENT FUND
| | | | | | | | | | | | | | |
Principal
Amount | | | Interest
Rate | | | Maturity
Date | | | Amortized
Cost | |
|
| Repurchase Agreements-Unaffiliated Issuers(c) – (continued) | |
| | HSBC Bank PLC | |
| $ | 2,100,000,000 | | | | 2.570 | % | | | 03/01/19 | | | $ | 2,100,000,000 | |
| | Maturity Value: $2,100,149,917 | |
| Collateralized by U.S. Treasury Bonds, 0.750% to 8.000%, due
11/15/21 to 05/15/47 and U.S. Treasury Notes, 1.125% to
3.625%, due 04/30/19 to 08/15/27. The aggregate market value
of the collateral, including accrued interest, was
$2,142,000,006. |
|
| | |
| | HSBC Securities (USA), Inc. | |
| | 1,000,000,000 | | | | 2.580 | | | | 03/01/19 | | | | 1,000,000,000 | |
| | Maturity Value: $1,000,071,667 | |
| Collateralized by Federal Home Loan Mortgage Corp., 3.000% to
5.000%, due 07/01/28 to 01/01/49, Federal National Mortgage
Association, 2.125%, due 04/24/26, Federal National Mortgage
Association Stripped Securities, 0.000%, due 07/15/20 to
11/15/28, Government National Mortgage Association, 3.000%
to 5.000%, due 10/20/39 to 02/20/49, a U.S. Treasury Inflation-
Indexed Bond, 2.375%, due 01/15/25, a U.S. Treasury
Inflation-Indexed Note, 0.375%, due 07/15/27, U.S. Treasury
Interest-Only Stripped Securities, 0.000%, due 02/15/21 to
02/15/45, U.S. Treasury Notes, 2.125% to 2.750%, due
05/31/23 to 07/31/24 and U.S. Treasury Principal-Only
Stripped Securities, 0.000%, due 11/15/22 to 11/15/39. The
aggregate market value of the collateral, including accrued
interest, was $1,026,875,282. |
|
| | |
| | HSBC Securities (USA), Inc. (Overnight MBS + 0.01%) | |
| | 500,000,000 | | | | 2.590 | (a) | | | 03/07/19 | | | | 500,000,000 | |
| | Maturity Value: $504,244,720 | |
| | Settlement Date: 11/14/18 | |
| Collateralized by Federal Home Loan Mortgage Corp. Stripped
Securities, 0.000%, due 03/15/21 to 09/15/26, Government
National Mortgage Association, 3.500%, due 10/20/43 and U.S.
Treasury Interest-Only Stripped Securities, 0.000%, due
11/15/20 to 08/15/40. The aggregate market value of the
collateral, including accrued interest, was $511,187,505. |
|
| | 1,000,000,000 | | | | 2.590 | (a) | | | 03/07/19 | | | | 1,000,000,000 | |
| | Maturity Value: $1,009,496,661 | |
| | Settlement Date: 10/31/18 | |
| Collateralized by Federal Farm Credit Bank, 1.440% to 2.700%,
due 10/21/19 to 02/23/21, Federal Farm Credit Bank discount
note, 0.000%, due 09/16/19, Federal Home Loan Bank, 0.000%
to 2.750%, due 06/14/19 to 03/10/23, Federal Home Loan
Mortgage Corp., 0.000% to 5.000%, due 05/30/19 to 01/01/49,
Federal Home Loan Mortgage Corp. Stripped Securities,
0.000%, due 03/15/19 to 07/15/31, Federal National Mortgage
Association, 1.000% to 7.125%, due 06/13/19 to 11/15/30,
Federal National Mortgage Association Stripped Securities,
0.000%, due 05/15/19 to 11/15/30, Tennessee Valley
Authority, 0.000% to 3.500%, due 01/15/37 to 12/15/42, a U.S.
Treasury Bill, 0.000%, due 08/29/19 and U.S. Treasury
Interest-Only Stripped Securities, 0.000%, due 02/15/38 to
11/15/42. The aggregate market value of the collateral,
including accrued interest, was $1,022,694,217. |
|
| | |
|
| Repurchase Agreements-Unaffiliated Issuers(c) – (continued) | |
| | ING Financial Markets LLC | |
| 37,000,000 | | | | 2.410 | | | | 03/01/19 | | | | 37,000,000 | |
| | Maturity Value: $37,002,477 | |
| Collateralized by U.S. Treasury Bills, 0.000%, due 07/05/19 to
01/02/20, U.S. Treasury Bonds, 2.750% to 6.625%, due
02/15/27 to 02/15/49 and U.S. Treasury Notes, 1.000% to
3.125%, due 06/30/19 to 02/15/29. The aggregate market value
of the collateral, including accrued interest, was $37,740,021. |
|
| | 200,000,000 | | | | 2.580 | | | | 03/01/19 | | | | 200,000,000 | |
| | Maturity Value: $200,014,333 | |
| Collateralized by Federal Home Loan Mortgage Corp., 2.437% to
4.777%, due 08/01/37 to 10/01/46, Federal National Mortgage
Association, 2.389% to 6.000%, due 05/01/23 to 02/01/49, U.S.
Treasury Bills, 0.000%, due 08/15/19 to 01/02/20 and a U.S.
Treasury Note, 2.500%, due 02/28/26. The aggregate market
value of the collateral, including accrued interest, was
$204,000,041. |
|
| | 300,000,000 | | | | 2.490 | | | | 03/11/19 | | | | 300,000,000 | |
| | Maturity Value: $301,888,250 | |
| | Settlement Date: 12/10/18 | |
| Collateralized by Federal Home Loan Mortgage Corp., 2.245% to
7.000%, due 07/01/25 to 08/01/48, Federal National Mortgage
Association, 2.500% to 7.000%, due 01/01/24 to 02/01/49, U.S.
Treasury Bills, 0.000%, due 08/15/19 to 01/02/20 and a U.S.
Treasury Bond, 3.125%, due 08/15/44. The aggregate market
value of the collateral, including accrued interest, was
$306,000,014. |
|
| | 300,000,000 | | | | 2.490 | | | | 03/12/19 | | | | 300,000,000 | |
| | Maturity Value: $301,888,250 | |
| | Settlement Date: 12/11/18 | |
| Collateralized by Federal Home Loan Mortgage Corp., 2.500% to
6.000%, due 12/01/26 to 08/01/48, Federal National Mortgage
Association, 2.500% to 6.000%, due 07/01/24 to 01/01/57, U.S.
Treasury Bills, 0.000%, due 08/15/19 to 01/02/20 and a U.S.
Treasury Bond, 3.125%, due 08/15/44. The aggregate market
value of the collateral, including accrued interest, was
$306,000,007. |
|
| | 300,000,000 | | | | 2.510 | | | | 03/22/19 | | | | 300,000,000 | |
| | Maturity Value: $301,924,333 | |
| | Settlement Date: 12/20/18 | |
| Collateralized by Federal Home Loan Mortgage Corp., 2.245% to
4.910%, due 10/01/29 to 11/01/48, Federal National Mortgage
Association, 2.500% to 7.000%, due 09/01/23 to 02/01/49 and
U.S. Treasury Bills, 0.000%, due 08/15/19 to 01/02/20. The
aggregate market value of the collateral, including accrued
interest, was $306,000,014. |
|
| | |
| | |
| The accompanying notes are an integral part of these financial statements. | | 17 |
FINANCIAL SQUARE GOVERNMENT FUND
Schedule of Investments(continued)
February 28, 2019 (Unaudited)
| | | | | | | | | | | | | | |
Principal
Amount | | | Interest
Rate | | | Maturity
Date | | | Amortized
Cost | |
|
| Repurchase Agreements-Unaffiliated Issuers(c) – (continued) | |
| | ING Financial Markets LLC – (continued) | |
| $ | 400,000,000 | | | | 2.510 | % | | | 03/22/19 | | | $ | 400,000,000 | |
| | Maturity Value: $402,565,778 | |
| | Settlement Date: 12/20/18 | |
| Collateralized by Federal Home Loan Mortgage Corp., 2.118% to
5.000%, due 11/01/26 to 01/01/49, Federal National Mortgage
Association, 2.310% to 6.500%, due 05/01/21 to 01/01/57, U.S.
Treasury Bills, 0.000%, due 08/15/19 to 01/02/20, a U.S.
Treasury Bond, 3.125%, due 08/15/44 and U.S. Treasury
Notes, 1.500% to 2.000%, due 08/15/25 to 08/15/26. The
aggregate market value of the collateral, including accrued
interest, was $816,000,033. |
|
| | 400,000,000 | | | | 2.510 | | | | 03/22/19 | | | | 400,000,000 | |
| | Maturity Value: $402,565,778 | |
| | Settlement Date: 12/20/18 | |
| Collateralized by Federal Home Loan Mortgage Corp., 2.118% to
5.000%, due 11/01/26 to 01/01/49, Federal National Mortgage
Association, 2.310% to 6.500%, due 05/01/21 to 01/01/57, U.S.
Treasury Bills, 0.000%, due 08/15/19 to 01/02/20, a U.S.
Treasury Bond, 3.125%, due 08/15/44 and U.S. Treasury
Notes, 1.500% to 2.000%, due 08/15/25 to 08/15/26. The
aggregate market value of the collateral, including accrued
interest, was $816,000,033. |
|
| | |
| | J.P. Morgan Securities LLC | |
| | 1,000,000,000 | | | | 2.600 | | | | 03/01/19 | | | | 1,000,000,000 | |
| | Maturity Value: $1,000,072,222 | |
| Collateralized by Federal Home Loan Mortgage Corp., 2.500% to
7.500%, due 07/16/21 to 02/01/49, Federal National Mortgage
Association, 2.500% to 5.000%, due 06/01/27 to 01/01/58 and
Government National Mortgage Association, 3.000% to
7.500%, due 12/20/30 to 02/20/49. The aggregate market value
of the collateral, including accrued interest, was
$1,029,159,119. |
|
| | |
| | Joint Repurchase Agreement Account I | |
| | 1,200,000,000 | | | | 2.589 | | | | 03/01/19 | | | | 1,200,000,000 | |
| | Maturity Value: $1,200,086,303 | |
| | |
| | Joint Repurchase Agreement Account III | |
| | 3,939,800,000 | | | | 2.595 | | | | 03/01/19 | | | | 3,939,800,000 | |
| | Maturity Value: $3,940,083,987 | |
| | |
| | Merrill Lynch, Pierce, Fenner & Smith, Inc. | |
| | 400,000,000 | | | | 2.500 | | | | 03/01/19 | | | | 400,000,000 | |
| | Maturity Value: $400,027,778 | |
| Collateralized by a U.S. Treasury Interest-Only Stripped Security,
0.000%, due 11/15/24 and U.S. Treasury Notes, 1.750%, due
10/31/20 to 04/30/22. The aggregate market value of the
collateral, including accrued interest, was $408,000,001. |
|
| | 155,100,000 | | | | 2.570 | | | | 03/01/19 | | | | 155,100,000 | |
| | Maturity Value: $155,111,072 | |
| Collateralized by Government National Mortgage Association,
3.500% to 4.000%, due 04/20/47 to 06/20/47. The aggregate
market value of the collateral, including accrued interest, was
$159,753,000. |
|
| | |
|
| Repurchase Agreements-Unaffiliated Issuers(c) – (continued) | |
| | Merrill Lynch, Pierce, Fenner& Smith, Inc. – (continued) | |
| 231,700,000 | | | | 2.570 | % | | | 03/01/19 | | | | 231,700,000 | |
| | Maturity Value: $231,716,541 | |
| Collateralized by Government National Mortgage Association,
4.000%, due 06/20/47. The market value of the collateral,
including accrued interest, was $238,651,000. |
|
| | |
| | Mizuho Securities USA LLC | |
| | 350,000,000 | | | | 2.570 | | | | 03/01/19 | | | | 350,000,000 | |
| | Maturity Value: $350,024,986 | |
| Collateralized by Federal Home Loan Mortgage Corp., 4.000%,
due 11/01/48 to 01/01/49, Federal National Mortgage
Association, 4.000% to 5.000%, due 05/01/48 to 02/01/49 and
Government National Mortgage Association, 4.500%, due
05/15/46 to 08/20/48. The aggregate market value of the
collateral, including accrued interest, was $360,499,999. |
|
| | |
| | MUFG Securities Americas Inc. | |
| | 300,000,000 | | | | 2.570 | | | | 03/01/19 | | | | 300,000,000 | |
| | Maturity Value: $300,021,417 | |
| Collateralized by Federal Home Loan Mortgage Corp., 2.500% to
5.500%, due 09/01/27 to 02/01/49, Federal Home Loan
Mortgage Corp. Stripped Security, 0.000%, due 03/15/29 and
Federal National Mortgage Association Stripped Security,
0.000%, due 07/15/29. The aggregate market value of the
collateral, including accrued interest, was $308,948,448. |
|
| | |
| | MUFG Securities Americas Inc. (Overnight MBS + 0.09%) | |
| | 250,000,000 | | | | 2.660 | (a) | | | 04/04/19 | | | | 250,000,000 | |
| | Maturity Value: $252,438,334 | |
| | Settlement Date: 11/28/18 | |
| Collateralized by Federal Home Loan Mortgage Corp., 3.000% to
6.000%, due 06/01/25 to 02/01/49. The aggregate market value
of the collateral, including accrued interest, was $257,499,998. |
|
| | 500,000,000 | | | | 2.660 | (a) | | | 04/04/19 | | | | 500,000,000 | |
| | Maturity Value: $506,613,057 | |
| | Settlement Date: 10/12/18 | |
| Collateralized by Federal Home Loan Mortgage Corp., 2.500% to
5.000%, due 11/01/26 to 12/01/48, Federal National Mortgage
Association Stripped Security, 0.000%, due 05/15/30 and
Tennessee Valley Authority, 4.625% to 5.375%, due 04/01/56
to 09/15/60. The aggregate market value of the collateral,
including accrued interest, was $514,450,042. |
|
| | |
| | MUFG Securities Americas Inc. (Overnight Treasury + 0.02%) | |
| | 525,000,000 | | | | 2.570 | (a) | | | 03/07/19 | | | | 525,000,000 | |
| | Maturity Value: $527,286,229 | |
| | Settlement Date: 01/10/19 | |
| Collateralized by a U.S. Treasury Bond, 8.750%, due 05/15/20,
U.S. Treasury Inflation-Indexed Notes, 0.125% to 1.375%, due
04/15/19 to 01/15/20 and U.S. Treasury Notes, 0.875% to
2.625%, due 03/31/19 to 06/30/22. The aggregate market value
of the collateral, including accrued interest, was $535,500,054. |
|
| | |
| | |
| 18 | | The accompanying notes are an integral part of these financial statements. |
FINANCIAL SQUARE GOVERNMENT FUND
| | | | | | | | | | | | | | |
Principal
Amount | | | Interest
Rate | | | Maturity
Date | | | Amortized
Cost | |
|
| Repurchase Agreements-Unaffiliated Issuers(c) – (continued) | |
| | Natixis-New York Branch | |
| $ | 1,500,000,000 | | | | 2.570 | % | | | 03/01/19 | | | $ | 1,500,000,000 | |
| | Maturity Value: $1,500,107,083 | |
| Collateralized by Federal Farm Credit Bank, 2.900%, due
06/28/32, Federal Home Loan Bank, 3.930%, due 07/11/33,
Federal Home Loan Mortgage Corp. Stripped Security,
0.000%, due 03/15/31, Federal National Mortgage Association,
4.000%, due 02/01/49, U.S. Treasury Bills, 0.000%, due
05/09/19 to 02/27/20, U.S. Treasury Bonds, 2.500% to 8.750%,
due 05/15/20 to 08/15/47, U.S. Treasury Inflation-Indexed
Bonds, 0.750% to 3.375%, due 01/15/27 to 02/15/45, U.S.
Treasury Inflation-Indexed Notes, 0.125% to 1.375%, due
04/15/19 to 07/15/28 and U.S. Treasury Notes, 1.250% to
3.000%, due 04/30/19 to 02/15/29. The aggregate market value
of the collateral, including accrued interest, was
$1,530,000,037. |
|
| | |
| | Nomura Securities International, Inc. | |
| | 1,200,000,000 | | | | 2.590 | | | | 03/01/19 | | | | 1,200,000,000 | |
| | Maturity Value: $1,200,086,333 | |
| Collateralized by Federal Farm Credit Bank, 2.540%, due
10/24/30, Federal Home Loan Mortgage Corp., 2.500% to
7.500%, due 03/01/21 to 03/01/49, Federal National Mortgage
Association, 2.000% to 7.000%, due 08/01/19 to 02/01/52,
Government National Mortgage Association, 2.500% to
9.000%, due 12/15/22 to 02/20/49, Tennessee Valley
Authority, 0.000% to 6.150%, due 01/15/38 to 12/15/42 and a
U.S. Treasury Principal-Only Stripped Security, 0.000%, due
11/15/43. The aggregate market value of the collateral,
including accrued interest, was $1,235,861,561. |
|
| | |
| | Norinchukin Bank | |
| | 215,000,000 | | | | 2.490 | | | | 03/07/19 | | | | 215,000,000 | |
| | Maturity Value: $216,695,275 | |
| | Settlement Date: 11/13/18 | |
| Collateralized by U.S. Treasury Inflation-Indexed Notes, 0.375%
to 1.125%, due 01/15/21 to 01/15/27 and U.S. Treasury Notes,
2.000% to 3.375%, due 11/15/19 to 11/15/26. The aggregate
market value of the collateral, including accrued interest, was
$219,300,024. |
|
| | 640,000,000 | | | | 2.520 | | | | 03/15/19 | | | | 640,000,000 | |
| | Maturity Value: $644,121,600 | |
| | Settlement Date: 12/13/18 | |
| Collateralized by a U.S. Treasury Bond, 6.125%, due 08/15/29,
U.S. Treasury Inflation-Indexed Notes, 0.375% to 1.125%, due
01/15/21 to 01/15/27 and a U.S. Treasury Note, 2.000%, due
11/15/26. The aggregate market value of the collateral,
including accrued interest, was $652,800,087. |
|
| | |
| | Northwestern Mutual Life Insurance Company | |
| | 148,275,000 | | | | 2.590 | | | | 03/01/19 | | | | 148,275,000 | |
| | Maturity Value: $148,285,668 | |
| Collateralized by a U.S. Treasury Note, 2.375%, due 03/15/21.
The market value of the collateral, including accrued interest,
was $151,240,500. |
|
| | 778,000,000 | | | | 2.590 | | | | 03/01/19 | | | | 778,000,000 | |
| | Maturity Value: $778,055,973 | |
| Collateralized by a U.S. Treasury Note, 1.750%, due 11/15/20.
The market value of the collateral, including accrued interest,
was $793,560,000. |
|
| | |
|
| Repurchase Agreements-Unaffiliated Issuers(c) – (continued) | |
| | Prudential Insurance Company of America (The) | |
| 15,793,750 | | | | 2.580 | | | | 03/01/19 | | | | 15,793,750 | |
| | Maturity Value: $15,794,882 | |
| Collateralized by a U.S. Treasury Interest-Only Stripped Security,
0.000%, due 11/15/43. The market value of the collateral,
including accrued interest, was $16,109,625. |
|
| | 16,468,750 | | | | 2.580 | | | | 03/01/19 | | | | 16,468,750 | |
| | Maturity Value: $16,469,930 | |
| Collateralized by a U.S. Treasury Interest-Only Stripped Security,
0.000%, due 11/15/32. The market value of the collateral,
including accrued interest, was $16,798,125. |
|
| | 18,067,500 | | | | 2.580 | | | | 03/01/19 | | | | 18,067,500 | |
| | Maturity Value: $18,068,795 | |
| Collateralized by a U.S. Treasury Interest-Only Stripped Security,
0.000%, due 08/15/38. The market value of the collateral,
including accrued interest, was $18,428,850. |
|
| | 18,812,500 | | | | 2.580 | | | | 03/01/19 | | | | 18,812,500 | |
| | Maturity Value: $18,813,848 | |
| Collateralized by a U.S. Treasury Bond, 0.000%, due 08/15/39.
The market value of the collateral, including accrued interest,
was $19,188,750. |
|
| | 23,275,000 | | | | 2.580 | | | | 03/01/19 | | | | 23,275,000 | |
| | Maturity Value: $23,276,668 | |
| Collateralized by a U.S. Treasury Interest-Only Stripped Security,
0.000%, due 02/15/35. The market value of the collateral,
including accrued interest, was $23,740,500. |
|
| | 26,268,750 | | | | 2.580 | | | | 03/01/19 | | | | 26,268,750 | |
| | Maturity Value: $26,270,633 | |
| Collateralized by a U.S. Treasury Interest-Only Stripped Security,
0.000%, due 08/15/36. The market value of the collateral,
including accrued interest, was $26,794,125. |
|
| | 66,187,500 | | | | 2.580 | | | | 03/01/19 | | | | 66,187,500 | |
| | Maturity Value: $66,192,243 | |
| Collateralized by a U.S. Treasury Bond, 2.500%, due 02/15/45.
The market value of the collateral, including accrued interest,
was $67,511,250. |
|
| | 72,562,500 | | | | 2.580 | | | | 03/01/19 | | | | 72,562,500 | |
| | Maturity Value: $72,567,700 | |
| Collateralized by a U.S. Treasury Interest-Only Stripped Security,
0.000%, due 11/15/41. The market value of the collateral,
including accrued interest, was $74,013,750. |
|
| | 156,750,000 | | | | 2.580 | | | | 03/01/19 | | | | 156,750,000 | |
| | Maturity Value: $156,761,234 | |
| Collateralized by a U.S. Treasury Principal-Only Stripped
Security, 0.000%, due 08/15/27. The market value of the
collateral, including accrued interest, was $159,885,000. |
|
| | 189,750,000 | | | | 2.580 | | | | 03/01/19 | | | | 189,750,000 | |
| | Maturity Value: $189,763,599 | |
| Collateralized by a U.S. Treasury Bond, 2.875%, due 08/15/45.
The market value of the collateral, including accrued interest,
was $193,545,000. |
|
| | |
| | |
| The accompanying notes are an integral part of these financial statements. | | 19 |
FINANCIAL SQUARE GOVERNMENT FUND
Schedule of Investments(continued)
February 28, 2019 (Unaudited)
| | | | | | | | | | | | | | |
Principal
Amount | | | Interest
Rate | | | Maturity
Date | | | Amortized
Cost | |
|
| Repurchase Agreements-Unaffiliated Issuers(c) – (continued) | |
| | RBC Capital Markets LLC | |
| $ | 250,000,000 | | | | 2.480 | %(d) | | | 03/07/19 | | | $ | 250,000,000 | |
| | Maturity Value: $251,550,000 | |
| | Settlement Date: 01/22/19 | |
| Collateralized by a U.S. Treasury Bond, 2.875%, due 11/15/46
and U.S. Treasury Notes, 1.625% to 2.000%, due 07/31/20 to
11/30/20. The aggregate market value of the collateral,
including accrued interest, was $255,000,001. |
|
| | |
| | Royal Bank of Canada-New York Branch | |
| | 2,000,000,000 | | | | 2.550 | | | | 03/01/19 | | | | 2,000,000,000 | |
| | Maturity Value: $2,000,141,667 | |
| Collateralized by Federal Home Loan Mortgage Corp., 3.000% to
5.000%, due 11/01/31 to 01/01/49, Federal National Mortgage
Association, 2.000% to 7.000%, due 08/01/27 to 06/01/56 and
Government National Mortgage Association, 4.500% to
5.000%, due 07/15/48 to 02/20/49. The aggregate market value
of the collateral, including accrued interest, was
$2,039,999,998. |
|
| | 858,000,000 | | | | 2.460 | (d) | | | 03/07/19 | | | | 858,000,000 | |
| | Maturity Value: $863,276,697 | |
| | Settlement Date: 01/04/19 | |
| Collateralized by Federal Home Loan Mortgage Corp., 3.000% to
4.500%, due 02/01/29 to 01/01/49, Federal National Mortgage
Association, 3.000% to 5.000%, due 11/01/32 to 02/01/49 and
Government National Mortgage Association, 5.000% to
5.500%, due 07/15/48 to 01/20/49. The aggregate market value
of the collateral, including accrued interest, was $875,160,000. |
|
| | 1,500,000,000 | | | | 2.460 | (d) | | | 03/07/19 | | | | 1,500,000,000 | |
| | Maturity Value: $1,509,224,995 | |
| | Settlement Date: 12/13/18 | |
| Collateralized by Federal Home Loan Mortgage Corp., 2.500% to
6.000%, due 02/01/26 to 02/01/49, Federal National Mortgage
Association, 2.500% to 6.500%, due 12/01/25 to 01/01/49 and
Government National Mortgage Association, 4.000% to
6.000%, due 01/20/43 to 02/20/49. The aggregate market value
of the collateral, including accrued interest, was
$1,529,999,994. |
|
| | 500,000,000 | | | | 2.470 | (d) | | | 03/07/19 | | | | 500,000,000 | |
| | Maturity Value: $503,087,500 | |
| | Settlement Date: 01/10/19 | |
| Collateralized by Federal Home Loan Mortgage Corp., 3.000% to
4.500%, due 11/01/26 to 01/01/49, Federal National Mortgage
Association, 3.000% to 6.000%, due 01/01/30 to 02/01/57 and
Government National Mortgage Association, 5.000%, due
02/15/49. The aggregate market value of the collateral,
including accrued interest, was $510,000,001. |
|
| | 850,000,000 | | | | 2.470 | (d) | | | 03/07/19 | | | | 850,000,000 | |
| | Maturity Value: $855,307,069 | |
| | Settlement Date: 01/28/19 | |
| Collateralized by Federal Home Loan Mortgage Corp., 3.000% to
4.500%, due 12/01/28 to 10/01/48, Federal National Mortgage
Association, 3.000% to 5.000%, due 06/01/30 to 07/01/55 and
Government National Mortgage Association, 3.500% to
6.000%, due 07/20/43 to 02/20/49. The aggregate market value
of the collateral, including accrued interest, was $866,999,993. |
|
| | |
|
| Repurchase Agreements-Unaffiliated Issuers(c) – (continued) | |
| | Royal Bank of Canada-New York Branch – (continued) | |
| 850,000,000 | | | | 2.480 | %(d) | | | 03/07/19 | | | | 850,000,000 | |
| | Maturity Value: $855,270,001 | |
| | Settlement Date: 01/22/19 | |
| Collateralized by Federal Home Loan Mortgage Corp., 2.500% to
5.000%, due 11/01/27 to 02/01/49, Federal National Mortgage
Association, 3.000% to 7.000%, due 08/01/25 to 06/01/51 and
Government National Mortgage Association, 3.500% to
6.000%, due 02/20/40 to 02/20/49. The aggregate market value
of the collateral, including accrued interest, was $867,000,004. |
|
| | 1,000,000,000 | | | | 2.470 | | | | 04/16/19 | | | | 1,000,000,000 | |
| | Maturity Value: $1,003,224,722 | |
| Collateralized by Federal Home Loan Mortgage Corp., 3.000% to
4.500%, due 03/01/33 to 12/01/48, Federal National Mortgage
Association, 3.000% to 4.500%, due 02/01/27 to 02/01/56 and
Government National Mortgage Association, 4.500% to
5.000%, due 10/20/48 to 02/20/49. The aggregate market value
of the collateral, including accrued interest, was
$1,020,000,001. |
|
| | |
| | Sumitomo Mitsui Banking Corp. | |
| | 3,000,000,000 | | | | 2.600 | | | | 03/01/19 | | | | 3,000,000,000 | |
| | Maturity Value: $3,000,216,667 | |
| Collateralized by Federal Home Loan Mortgage Corp., 3.500%,
due 05/01/47, Federal National Mortgage Association, 3.500%
to 4.000%, due 12/01/48 to 03/01/49 and Government National
Mortgage Association, 3.500% to 4.000%, due 03/20/46 to
02/20/48. The aggregate market value of the collateral,
including accrued interest, was $3,090,223,166. |
|
| | |
| | Wells Fargo Securities LLC | |
| | 300,000,000 | | | | 2.520 | | | | 03/01/19 | | | | 300,000,000 | |
| | Maturity Value: $300,021,000 | |
| Collateralized by U.S. Treasury Bonds, 2.250% to 2.875%, due
02/15/46 to 11/15/46, a U.S. Treasury Inflation-Indexed Note,
1.125%, due 01/15/21 and U.S. Treasury Notes, 1.125% to
3.500%, due 07/31/19 to 08/15/27. The aggregate market value
of the collateral, including accrued interest, was $306,000,075. |
|
| | 250,000,000 | | | | 2.570 | | | | 03/01/19 | | | | 250,000,000 | |
| | Maturity Value: $250,017,847 | |
| Collateralized by a U.S. Treasury Bill, 0.000%, due 01/30/20,
U.S. Treasury Bonds, 2.750% to 2.875%, due 11/15/42 to
11/15/46, U.S. Treasury Inflation-Indexed Bonds, 0.750% to
1.000%, due 02/15/45 to 02/15/49 and U.S. Treasury Notes,
1.250% to 2.250%, due 10/31/21 to 11/15/27. The aggregate
market value of the collateral, including accrued interest, was
$255,000,010. |
|
| | |
| TOTAL REPURCHASE AGREEMENTS-
UNAFFILIATED ISSUERS |
| | $ | 59,755,011,250 | |
| | |
| | | | | | | | | | | | | | |
| | |
| 20 | | The accompanying notes are an integral part of these financial statements. |
FINANCIAL SQUARE GOVERNMENT FUND
| | | | | | | | | | | | | | |
Principal
Amount | | | Interest
Rate | | | Maturity
Date | | | Amortized
Cost | |
|
| Repurchase Agreements-Affiliated Issuers(c) – 0.6% | |
| | Goldman Sachs & Co. | |
| $ | 650,000,000 | | | | 2.200 | % | | | 03/01/19 | | | $ | 650,000,000 | |
| | Maturity Value: $650,039,722 | |
| Collateralized by U.S. Treasury Interest-Only Stripped Securities,
0.000%, due 11/15/33 to 08/15/36, U.S. Treasury Notes,
1.750% to 3.000%, due 05/15/22 to 08/15/28 and a U.S.
Treasury Principal-Only Stripped Security, 0.000%, due
02/15/27. The aggregate market value of the collateral,
including accrued interest, was $663,000,036. |
|
| | |
| | TOTAL INVESTMENTS – 101.5% | | | $ | 101,868,978,908 | |
| | |
| LIABILITIES IN EXCESS OF
OTHER ASSETS – (1.5)% |
| | | (1,462,929,115 | ) |
| | |
| | NET ASSETS – 100.0% | | | $ | 100,406,049,793 | |
| | |
| | |
|
| The percentage shown for each investment category reflects the value of investments in that category as a percentage of net assets. |
| |
(a) | | Variable or floating rate security. Except for floating rate notes (for which final maturity is disclosed), maturity date disclosed is the next interest reset date. Interest rate disclosed is that which is in effect on February 28, 2019. |
| |
(b) | | All or a portion represents a forward commitment. |
| |
(c) | | Unless noted, all repurchase agreements were entered into on February 28, 2019. Additional information on Joint Repurchase Agreement Accounts I and III appear on pages 38 and 39. |
| |
(d) | | The instrument is subject to a demand feature. |
Interest rates represent either the stated coupon rate, annualized yield on date of purchase for discounted securities, or, for floating rate securities, the current reset rate, which is based upon current interest rate indices.
Maturity dates represent either the final legal maturity date on the security, the demand date for puttable securities, the date of the next interest rate reset for variable rate securities, or the prerefunded date for those types of securities.
| | |
|
Investment Abbreviations: |
FEDL01 | | —US Federal Funds Effective Rate |
LIBOR | | —London Interbank Offered Rates |
MMY | | —Money Market Yield |
Prime | | —Federal Reserve Bank Prime Loan Rate US |
SOFR | | —Secured Overnight Financing Rate |
T-Bill | | —Treasury Bill |
|
| | |
| The accompanying notes are an integral part of these financial statements. | | 21 |
FINANCIAL SQUARE MONEY MARKET FUND
Schedule of Investments
February 28, 2019 (Unaudited)
| | | | | | | | | | | | | | |
Principal
Amount | | | Interest
Rate | | | Maturity
Date | | | Value | |
|
| Commercial Paper and Corporate Obligations – 28.7% | |
| | Albion Capital LLC | |
| $ | 150,000,000 | | | | 2.516 | % | | | 03/01/19 | | | $ | 149,990,053 | |
| | 24,255,000 | | | | 2.570 | | | | 03/28/19 | | | | 24,208,649 | |
| | 89,386,000 | | | | 2.653 | | | | 05/15/19 | | | | 88,906,504 | |
| | Alpine Securitization LLC | |
| | 42,150,000 | | | | 2.860 | (a) | | | 05/09/19 | | | | 42,171,752 | |
| | Antalis S.A. | |
| | 15,552,000 | | | | 2.806 | | | | 04/10/19 | | | | 15,507,614 | |
| | Atlantic Asset Securitization LLC | |
| | 39,000,000 | | | | 2.871 | | | | 03/11/19 | | | | 38,970,804 | |
| | 46,000,000 | | | | 2.911 | | | | 03/21/19 | | | | 45,933,775 | |
| | Banque et Caisse d’Epargne de l’Etat | |
| | 34,000,000 | | | | 2.696 | | | | 05/07/19 | | | | 33,835,527 | |
| | 50,000,000 | | | | 2.662 | | | | 07/01/19 | | | | 49,546,609 | |
| | Barclays US CCP Funding LLC | |
| | 25,000,000 | | | | 2.900 | | | | 03/05/19 | | | | 24,991,656 | |
| | 20,000,000 | | | | 2.910 | | | | 03/07/19 | | | | 19,990,628 | |
| | 35,000,000 | | | | 2.709 | | | | 03/26/19 | | | | 34,937,943 | |
| | Barton Capital S.A. | |
| | 30,300,000 | | | | 2.674 | | | | 05/08/19 | | | | 30,148,366 | |
| | Bedford Row Funding Corp. | |
| | 8,000,000 | | | | 3.103 | | | | 10/16/19 | | | | 7,862,000 | |
| | CAFCO, LLC | |
| | 21,000,000 | | | | 3.015 | | | | 07/01/19 | | | | 20,816,894 | |
| | 72,000,000 | | | | 2.818 | | | | 08/01/19 | | | | 71,208,132 | |
| | Cancara Asset Securitisation LLC | |
| | 20,000,000 | | | | 2.903 | | | | 03/22/19 | | | | 19,969,823 | |
| | 25,000,000 | | | | 2.994 | | | | 05/14/19 | | | | 24,865,886 | |
| | 16,980,000 | | | | 3.005 | | | | 05/28/19 | | | | 16,870,940 | |
| | Chariot Funding LLC | |
| | 55,000,000 | | | | 2.900 | | | | 05/02/19 | | | | 54,754,755 | |
| | 15,000,000 | | | | 3.057 | | | | 06/17/19 | | | | 14,884,823 | |
| | 50,000,000 | | | | 3.037 | | | | 07/08/19 | | | | 49,540,847 | |
| | China Construction Bank Corp. | |
| | 18,150,000 | | | | 3.044 | | | | 04/08/19 | | | | 18,099,743 | |
| | 18,000,000 | | | | 2.962 | | | | 04/15/19 | | | | 17,940,568 | |
| | 23,000,000 | | | | 2.962 | | | | 04/16/19 | | | | 22,922,288 | |
| | CNPC Finance (HK) Ltd. | |
| | 22,000,000 | | | | 2.968 | | | | 03/14/19 | | | | 21,977,875 | |
| | Coca-Cola Company (The) | |
| | 50,000,000 | | | | 2.794 | | | | 01/13/20 | | | | 48,778,939 | |
| | 30,000,000 | | | | 2.822 | | | | 02/11/20 | | | | 29,192,640 | |
| | Collateralized Commercial Paper Flex Co., LLC | |
| | 43,100,000 | | | | 3.059 | | | | 10/15/19 | | | | 42,358,661 | |
| | Collateralized Commercial Paper II Co., LLC | |
| | 66,000,000 | | | | 2.984 | | | | 07/08/19 | | | | 65,388,198 | |
| | 40,000,000 | | | | 3.191 | | | | 10/22/19 | | | | 39,286,493 | |
| | 16,455,000 | | | | 3.309 | | | | 11/25/19 | | | | 16,114,382 | |
| | CRC Funding, LLC | |
| | 25,000,000 | | | | 3.015 | | | | 07/01/19 | | | | 24,779,539 | |
| | Dexia Credit Local-New York Branch | |
| | 70,000,000 | | | | 2.644 | | | | 05/07/19 | | | | 69,673,014 | |
| | 60,000,000 | | | | 2.866 | | | | 10/10/19 | | | | 59,035,307 | |
| District of Columbia Water & Sewer Authority Public
Utility Systems |
|
| | 29,200,000 | | | | 2.530 | | | | 03/19/19 | | | | 29,198,213 | |
| | |
|
| Commercial Paper and Corporate Obligations – (continued) | |
| | DNB Bank ASA | |
| 150,000,000 | | | | 2.434 | | | | 03/06/19 | | | | 149,940,700 | |
| | DZ Bank AG Deutsche Zentral-Genossenschaftsbank | |
| | 33,200,000 | | | | 2.756 | | | | 04/10/19 | | | | 33,106,909 | |
| | 25,000,000 | | | | 2.756 | | | | 04/11/19 | | | | 24,928,133 | |
| | Fairway Finance Company LLC | |
| | 3,000,000 | | | | 2.846 | | | | 03/14/19 | | | | 2,997,132 | |
| | 42,200,000 | | | | 2.760 | | | | 04/18/19 | | | | 42,053,991 | |
| | Federation des caisses Desjardins du Quebec | |
| | 45,400,000 | | | | 2.803 | | | | 02/25/20 | | | | 44,159,173 | |
| | First Abu Dhabi Bank P.J.S.C. | |
| | 30,000,000 | | | | 2.736 | | | | 05/06/19 | | | | 29,849,306 | |
| | 50,000,000 | | | | 2.736 | | | | 05/08/19 | | | | 49,741,059 | |
| | 70,000,000 | | | | 2.762 | | | | 06/05/19 | | | | 69,483,394 | |
| | Gotham Funding Corp. | |
| | 25,000,000 | | | | 2.859 | | | | 04/08/19 | | | | 24,932,264 | |
| | Industrial & Commercial Bank of China Ltd.-New York Branch | |
| | 62,550,000 | | | | 3.066 | | | | 04/15/19 | | | | 62,344,353 | |
| | J.P. Morgan Securities LLC | |
| | 32,000,000 | | | | 2.992 | | | | 06/03/19 | | | | 31,775,631 | |
| | 45,000,000 | | | | 3.012 | | | | 08/01/19 | | | | 44,483,522 | |
| | 25,000,000 | | | | 3.058 | | | | 09/27/19 | | | | 24,599,393 | |
| | Liberty Street Funding LLC | |
| | 30,000,000 | | | | 2.859 | | | | 04/04/19 | | | | 29,927,317 | |
| | 25,000,000 | | | | 2.659 | | | | 06/11/19 | | | | 24,816,173 | |
| | LMA-Americas LLC | |
| | 22,000,000 | | | | 2.899 | | | | 03/07/19 | | | | 21,989,648 | |
| | 19,000,000 | | | | 2.807 | | | | 04/18/19 | | | | 18,935,244 | |
| | Longship Funding LLC | |
| | 37,000,000 | | | | 2.592 | | | | 04/02/19 | | | | 36,912,631 | |
| | 23,850,000 | | | | 2.617 | | | | 04/24/19 | | | | 23,751,874 | |
| | Macquarie Bank Ltd. | |
| | 18,800,000 | | | | 2.808 | | | | 04/15/19 | | | | 18,739,296 | |
| | Manhattan Asset Funding Company LLC | |
| | 14,200,000 | | | | 2.498 | | | | 03/21/19 | | | | 14,179,556 | |
| | 10,000,000 | | | | 2.669 | | | | 03/22/19 | | | | 9,984,912 | |
| | Matchpoint Finance PLC | |
| | 9,250,000 | | | | 2.516 | | | | 03/07/19 | | | | 9,245,468 | |
| | 20,000,000 | | | | 2.807 | | | | 04/18/19 | | | | 19,929,114 | |
| | 40,000,000 | | | | 3.029 | | | | 05/20/19 | | | | 39,760,150 | |
| | 32,750,000 | | | | 2.622 | | | | 05/21/19 | | | | 32,551,049 | |
| | 20,000,000 | | | | 3.057 | | | | 06/03/19 | | | | 19,858,186 | |
| | 40,000,000 | | | | 2.669 | | | | 06/11/19 | | | | 39,691,343 | |
| | Mercy Health | |
| | 28,000,000 | | | | 2.662 | | | | 03/18/19 | | | | 27,965,938 | |
| | Metlife Short Term Funding LLC | |
| | 7,000,000 | | | | 2.728 | | | | 07/08/19 | | | | 6,934,708 | |
| | 30,000,000 | | | | 2.817 | | | | 07/23/19 | | | | 29,685,471 | |
| | 45,950,000 | | | | 2.816 | | | | 07/24/19 | | | | 45,464,551 | |
| | Mitsubishi UFJ Trust and Banking Corp. | |
| | 20,000,000 | | | | 2.777 | | | | 04/16/19 | | | | 19,934,539 | |
| | National Securities Clearing Corp. | |
| | 60,000,000 | | | | 3.017 | | | | 10/01/19 | | | | 59,043,608 | |
| | 58,000,000 | | | | 3.245 | | | | 12/13/19 | | | | 56,723,536 | |
| | 21,000,000 | | | | 3.137 | | | | 01/02/20 | | | | 20,501,605 | |
| | Natixis-New York Branch | |
| | 20,000,000 | | | | 2.835 | | | | 09/03/19 | | | | 19,729,266 | |
| | |
| | |
| 22 | | The accompanying notes are an integral part of these financial statements. |
FINANCIAL SQUARE MONEY MARKET FUND
| | | | | | | | | | | | | | |
Principal
Amount | | | Interest
Rate | | | Maturity
Date | | | Value | |
|
| Commercial Paper and Corporate Obligations – (continued) | |
| | Nederlandse Waterschapsbank N.V. | |
| $ | 50,000,000 | | | | 2.445 | %(b) | | | 03/08/19 | | | $ | 49,972,934 | |
| | Nieuw Amsterdam Receivables Corp. | |
| | 38,000,000 | | | | 2.617 | | | | 04/03/19 | | | | 37,912,180 | |
| | 30,000,000 | | | | 2.562 | | | | 04/08/19 | | | | 29,919,757 | |
| | 20,715,000 | | | | 2.562 | (b) | | | 04/09/19 | | | | 20,658,080 | |
| | Nordea Bank AB | |
| | 60,000,000 | | | | 2.617 | | | | 05/13/19 | | | | 59,690,063 | |
| | Old Line Funding Corp. | |
| | 12,250,000 | | | | 2.889 | | | | 05/02/19 | | | | 12,195,742 | |
| | 51,500,000 | | | | 3.057 | | | | 06/17/19 | | | | 51,103,001 | |
| | Ridgefield Funding Company LLC | |
| | 25,000,000 | | | | 2.828 | | | | 04/16/19 | | | | 24,917,750 | |
| | 25,000,000 | | | | 3.089 | | | | 06/10/19 | | | | 24,817,392 | |
| | 28,000,000 | | | | 3.015 | | | | 07/08/19 | | | | 27,736,808 | |
| | 20,000,000 | | | | 3.090 | | | | 07/08/19 | | | | 19,812,005 | |
| | Skandinaviska Enskilda Banken AB | |
| | 65,000,000 | | | | 2.742 | | | | 11/13/19 | | | | 63,767,871 | |
| | State of the Netherlands (The) | |
| | 200,000,000 | | | | 2.455 | (b) | | | 03/07/19 | | | | 199,905,112 | |
| | Sumitomo Mitsui Banking Corp. | |
| | 50,000,000 | | | | 2.866 | | | | 05/13/19 | | | | 49,739,664 | |
| | 15,000,000 | | | | 2.618 | | | | 06/24/19 | | | | 14,875,445 | |
| | Sumitomo Mitsui Trust Bank, Ltd.-Singapore Branch | |
| | 50,000,000 | | | | 2.907 | | | | 05/03/19 | | | | 49,773,600 | |
| | Swedbank AB | |
| | 40,000,000 | | | | 2.814 | | | | 05/08/19 | | | | 39,812,933 | |
| | 45,000,000 | | | | 2.763 | | | | 05/16/19 | | | | 44,762,551 | |
| | Thunder Bay Funding, LLC | |
| | 33,300,000 | | | | 3.057 | | | | 06/17/19 | | | | 33,042,090 | |
| | 80,200,000 | | | | 3.046 | | | | 06/26/19 | | | | 79,522,826 | |
| | Toronto-Dominion Bank (The) | |
| | 36,650,000 | | | | 3.136 | | | | 10/18/19 | | | | 36,036,618 | |
| | Versailles Commercial Paper LLC | |
| | 50,000,000 | | | | 2.619 | | | | 05/09/19 | | | | 49,750,820 | |
| | Victory Receivables Corp. | |
| | 25,000,000 | | | | 2.541 | | | | 04/01/19 | | | | 24,944,778 | |
| | |
| TOTAL COMMERCIAL PAPER AND
CORPORATE OBLIGATIONS |
|
| | (Cost $3,708,514,896) | | | $ | 3,709,980,003 | |
| | |
| | |
|
| Certificate of Deposit – 0.5% | |
| | Branch Banking and Trust Company | |
| $ | 70,000,000 | | | | 2.410 | % | | | 03/05/19 | | | $ | 69,999,997 | |
| | (Cost $70,000,000) | |
| | |
| | |
|
| Certificates of Deposit-Eurodollar – 7.8% | |
| | ABN AMRO Bank NV | |
| $ | 60,000,000 | | | | 2.840 | % | | | 03/01/19 | | | $ | 59,995,895 | |
| | Credit Industriel et Commercial | |
| | 80,000,000 | | | | 2.900 | | | | 08/01/19 | | | | 79,121,014 | |
| | DZ Bank AG Deutsche Zentral-Genossenschaftsbank | |
| | 45,000,000 | | | | 2.595 | | | | 06/28/19 | | | | 44,611,140 | |
| | |
|
| Certificates of Deposit-Eurodollar – (continued) | |
| | Euroclear Bank | |
| 28,000,000 | | | | 2.630 | | | | 05/07/19 | | | | 27,860,827 | |
| | 2,000,000 | | | | 2.720 | | | | 07/08/19 | | | | 1,981,007 | |
| | 100,000,000 | | | | 2.750 | | | | 10/15/19 | | | | 98,285,070 | |
| | 7,000,000 | | | | 2.790 | | | | 11/05/19 | | | | 6,868,591 | |
| | 50,000,000 | | | | 2.900 | | | | 11/05/19 | | | | 49,061,361 | |
| | KBC Bank NV | |
| | 55,000,000 | | | | 2.750 | | | | 04/25/19 | | | | 55,014,172 | |
| | 85,000,000 | | | | 2.680 | | | | 05/13/19 | | | | 85,015,768 | |
| | 45,500,000 | | | | 2.620 | | | | 07/01/19 | | | | 45,500,764 | |
| | 80,000,000 | | | | 2.770 | | | | 07/01/19 | | | | 80,040,520 | |
| | Mitsubishi UFJ Trust and Banking Corp. | |
| | 25,000,000 | | | | 2.705 | | | | 05/07/19 | | | | 24,878,384 | |
| | Mizuho Bank, Ltd.-London Branch | |
| | 30,000,000 | | | | 2.720 | | | | 04/30/19 | | | | 29,871,739 | |
| | Norinchukin Bank (The)-London Branch | |
| | 85,000,000 | | | | 2.660 | | | | 05/13/19 | | | | 84,549,520 | |
| | Sumitomo Mitsui Trust Bank Ltd. | |
| | 30,000,000 | | | | 2.895 | | | | 05/10/19 | | | | 29,850,583 | |
| | 30,000,000 | | | | 2.795 | | | | 05/24/19 | | | | 29,819,616 | |
| | 40,000,000 | | | | 2.835 | | | | 07/31/19 | | | | 39,560,835 | |
| | 40,000,000 | | | | 2.835 | | | | 08/07/19 | | | | 39,540,105 | |
| | Toronto-Dominion Bank (The)-London Branch | |
| | 100,000,000 | | | | 2.430 | | | | 03/06/19 | | | | 99,948,891 | |
| | |
| | TOTAL CERTIFICATES OF DEPOSIT-EURODOLLAR | |
| | (Cost $1,011,091,261) | | | $ | 1,011,375,802 | |
| | |
| | |
|
| Certificates of Deposit-Yankeedollar – 2.9% | |
| | Banco Del Estado De Chile | |
| $ | 25,000,000 | | | | 2.970 | % | | | 08/09/19 | | | $ | 25,032,673 | |
| | Mizuho Bank, Ltd.-New York Branch | |
| | 50,000,000 | | | | 2.710 | | | | 09/20/19 | | | | 50,009,711 | |
| | MUFG Bank, Ltd. | |
| | 50,000,000 | | | | 2.840 | | | | 02/24/20 | | | | 50,030,090 | |
| | National Bank of Kuwait S.A.K.P | |
| | 20,000,000 | | | | 2.800 | | | | 03/01/19 | | | | 20,000,190 | |
| | 23,000,000 | | | | 3.000 | | | | 03/15/19 | | | | 23,004,670 | |
| | 10,000,000 | | | | 3.050 | | | | 04/23/19 | | | | 10,005,905 | |
| | 28,800,000 | | | | 2.850 | | | | 04/29/19 | | | | 28,808,778 | |
| | 40,000,000 | | | | 2.900 | | | | 05/20/19 | | | | 40,014,361 | |
| | Natixis-New York Branch | |
| | 48,350,000 | | | | 2.900 | | | | 08/12/19 | | | | 48,413,497 | |
| | Standard Chartered Bank-New York Branch | |
| | 50,000,000 | | | | 2.840 | | | | 04/12/19 | | | | 50,020,528 | |
| | Sumitomo Mitsui Banking Corp. | |
| | 30,000,000 | | | | 2.050 | | | | 05/03/19 | | | | 29,976,187 | |
| | |
| | TOTAL CERTIFICATES OF DEPOSIT-YANKEEDOLLAR | |
| | (Cost $375,109,668) | | | $ | 375,316,590 | |
| | |
| | | | | | | | | | | | | | |
|
| Fixed Rate Municipal Debt Obligations – 2.4% | |
| | Australia & New Zealand Banking Group Ltd. | |
| $ | 18,000,000 | | | | 2.250 | % | | | 06/13/19 | | | $ | 17,976,546 | |
| | Banque Federative du Credit Mutuel | |
| | 16,668,000 | | | | 2.000 | (a) | | | 04/12/19 | | | | 16,656,558 | |
| | |
| | |
| The accompanying notes are an integral part of these financial statements. | | 23 |
FINANCIAL SQUARE MONEY MARKET FUND
Schedule of Investments(continued)
February 28, 2019 (Unaudited)
| | | | | | | | | | | | | | |
Principal
Amount | | | Interest
Rate | | | Maturity
Date | | | Value | |
|
| Fixed Rate Municipal Debt Obligations – (continued) | |
| | Cooperatieve Rabobank UA | |
| $ | 10,000,000 | | | | 2.250 | % | | | 01/14/20 | | | $ | 9,954,600 | |
| | Credit Agricole S.A. | |
| | 7,850,000 | | | | 2.500 | (a) | | | 04/15/19 | | | | 7,847,516 | |
| | Credit Suisse AG-New York Branch | |
| | 70,563,000 | | | | 2.300 | | | | 05/28/19 | | | | 70,503,021 | |
| | ING Bank NV | |
| | 4,500,000 | | | | 2.500 | (a) | | | 10/01/19 | | | | 4,489,527 | |
| | MUFG Bank, Ltd. | |
| | 35,000,000 | | | | 2.350 | (a) | | | 09/08/19 | | | | 34,910,852 | |
| | Nordea Bank AB | |
| | 15,190,000 | | | | 1.625 | (a) | | | 09/30/19 | | | | 15,082,475 | |
| | PACCAR Financial Corp. | |
| | 12,000,000 | | | | 1.950 | | | | 02/27/20 | | | | 11,904,151 | |
| | Sumitomo Mitsui Banking Corp. | |
| | 6,595,000 | | | | 2.450 | (b) | | | 01/16/20 | | | | 6,569,793 | |
| | 32,491,000 | | | | 2.514 | | | | 01/17/20 | | | | 32,382,318 | |
| | Wells Fargo Bank N.A. | |
| | 47,530,000 | | | | 2.400 | | | | 01/15/20 | | | | 47,347,986 | |
| | Westpac Banking Corp. | |
| | 30,000,000 | | | | 1.600 | | | | 08/19/19 | | | | 29,850,830 | |
| | |
| | TOTAL FIXED RATE MUNICIPAL DEBT OBLIGATIONS | |
| | (Cost $305,324,815) | | | $ | 305,476,173 | |
| | |
| | | | | | | | | | | | | | |
|
| Time Deposit – 3.3% | |
| | Credit Industriel et Commercial | |
| $ | 200,000,000 | | | | 2.450 | % | | | 03/01/19 | | | $ | 199,996,732 | |
| | Skandinaviska Enskilda Banken AB | |
| | 28,900,000 | | | | 2.380 | | | | 03/01/19 | | | | 28,900,000 | |
| | Standard Chartered Bank-London Branch | |
| | 200,000,000 | | | | 2.430 | | | | 03/01/19 | | | | 199,996,622 | |
| | |
| | TOTAL TIME DEPOSIT | |
| | (Cost $428,900,000) | | | $ | 428,893,354 | |
| | |
| | | | | | | | | | | | | | |
|
| Variable Rate Municipal Debt Obligations(c) – 2.0% | |
| Alaska Housing Finance Corp. VRDN RB Refunding for State
Capital Project Bonds II Series 2017 B |
|
| $ | 15,000,000 | | | | 2.420 | % | | | 03/07/19 | | | $ | 15,000,000 | |
| BlackRock Municipal Bond Trust VRDN RB Putters
Series 2012-T0014 (JPMorgan Chase N.A., LIQ)(a) |
|
| | 66,500,000 | | | | 2.500 | | | | 03/01/19 | | | | 66,500,000 | |
| BlackRock MuniVest Fund II, Inc. VRDN RB Putters
Series 2012-T0005 (JPMorgan Chase Bank N.A., LIQ)(a) |
|
| | 4,950,000 | | | | 2.500 | | | | 03/01/19 | | | | 4,950,000 | |
| BlackRock MuniVest Fund, Inc. VRDN RB Putters
Series 2012-T0007 (JPMorgan Chase Bank N.A., LIQ)(a) |
|
| | 29,110,000 | | | | 2.500 | | | | 03/01/19 | | | | 29,110,000 | |
| City of Portland, Maine GO VRDN for Taxable Pension Bonds
Series 2001 RMKT (Sumitomo Mitsui Banking Corp., SPA) |
|
| | 62,500,000 | | | | 2.440 | | | | 03/07/19 | | | | 62,500,000 | |
| Regents of the University of California VRDN RB Taxable
Series 2011 Z-1 |
|
| | 54,925,000 | | | | 2.380 | | | | 03/07/19 | | | | 54,925,000 | |
| | |
|
| Variable Rate Municipal Debt Obligations(c) – (continued) | |
| Triborough Bridge & Tunnel Authority VRDN RB Refunding for
Metropolitan Transportation Authority Bridges & Tunnels
Series 2018E (Bank of America N.A., LOC) |
|
| 24,000,000 | | | | 2.420 | | | | 03/07/19 | | | | 24,000,000 | |
| | |
| TOTAL VARIABLE RATE MUNICIPAL DEBT
OBLIGATIONS |
|
| | (Cost $256,985,000) | | | $ | 256,985,000 | |
| | |
| | | | | | | | | | | | | | |
|
| Variable Rate Obligations(d) – 23.0% | |
| | ASB Finance Limited-London Branch (1 Mo. LIBOR + 0.31%) | |
| $ | 50,000,000 | | | | 2.803 | %(a) | | | 06/28/19 | | | $ | 50,033,318 | |
| | Banco Del Estado De Chile (3 Mo. LIBOR + 0.20%) | |
| | 35,000,000 | | | | 2.868 | | | | 06/07/19 | | | | 35,011,065 | |
| | Banco Del Estado De Chile (3 Mo. LIBOR + 0.07%) | |
| | 24,000,000 | | | | 2.860 | | | | 03/21/19 | | | | 23,999,768 | |
| | Banco Del Estado De Chile (3 Mo. LIBOR + 0.08%) | |
| | 19,000,000 | | | | 2.851 | | | | 07/25/19 | | | | 18,999,895 | |
| | Bank of Montreal (3 Mo. LIBOR + 0.33%) | |
| | 27,000,000 | | | | 3.106 | | | | 06/12/19 | | | | 27,024,038 | |
| | Bank of Montreal (3 Mo. LIBOR + 0.21%) | |
| | 57,000,000 | | | | 2.946 | | | | 11/01/19 | | | | 57,070,463 | |
| | Bank of Montreal (1 Mo. LIBOR + 0.40%) | |
| | 70,150,000 | | | | 2.917 | | | | 12/10/19 | | | | 70,285,151 | |
| | Bank of Nova Scotia (The) (3 Mo. LIBOR + 0.28%) | |
| | 34,000,000 | | | | 3.072 | | | | 03/20/19 | | | | 34,004,295 | |
| | Bank of Nova Scotia (The) (3 Mo. LIBOR + 0.08%) | |
| | 60,000,000 | | | | 2.904 | (a) | | | 06/24/19 | | | | 60,014,567 | |
| | Bank of Nova Scotia (The) (3 Mo. LIBOR + 0.10%) | |
| | 75,000,000 | | | | 2.922 | (a) | | | 03/25/19 | | | | 75,005,182 | |
| | Bedford Row Funding Corp. (1 Mo. LIBOR + 0.20%) | |
| | 30,000,000 | | | | 2.680 | (a) | | | 06/18/19 | | | | 30,009,539 | |
| | Bedford Row Funding Corp. (3 Mo. LIBOR + 0.10%) | |
| | 11,000,000 | | | | 2.887 | (a) | | | 07/15/19 | | | | 11,004,341 | |
| | BNP Paribas-New York Branch (3 Mo. LIBOR + 0.10%) | |
| | 60,000,000 | | | | 2.883 | | | | 07/10/19 | | | | 60,016,476 | |
| | BNP Paribas-New York Branch (3 Mo. LIBOR + 0.15%) | |
| | 19,500,000 | | | | 2.915 | | | | 04/26/19 | | | | 19,504,089 | |
| | BNP Paribas-New York Branch (3 Mo. LIBOR + 0.22%) | |
| | 60,000,000 | | | | 3.015 | | | | 01/06/20 | | | | 60,069,380 | |
| | BNZ International Funding Ltd. (3 Mo. LIBOR + 0.25%) | |
| | 22,171,000 | | | | 3.045 | (a) | | | 04/05/19 | | | | 22,174,501 | |
| | BNZ International Funding Ltd. (1 Mo. LIBOR + 0.31%) | |
| | 25,000,000 | | | | 2.823 | (a) | | | 08/08/19 | | | | 25,019,384 | |
| | BNZ International Funding Ltd. (1 Mo. LIBOR + 0.34%) | |
| | 50,000,000 | | | | 2.853 | (a) | | | 09/06/19 | | | | 50,049,098 | |
| | Canadian Imperial Bank of Commerce (3 Mo. LIBOR + 0.22%) | |
| | 62,500,000 | | | | 2.958 | | | | 11/08/19 | | | | 62,579,563 | |
| | Canadian Imperial Bank of Commerce (1 Mo. LIBOR + 0.40%) | |
| | 70,000,000 | | | | 2.917 | | | | 12/10/19 | | | | 70,133,216 | |
| | Canadian Imperial Bank of Commerce (3 Mo. LIBOR + 0.20%) | |
| | 35,000,000 | | | | 2.936 | | | | 05/01/19 | | | | 35,012,561 | |
| | Canadian Imperial Bank of Commerce (1 Mo. LIBOR + 0.35%) | |
| | 40,000,000 | | | | 2.864 | | | | 11/05/19 | | | | 40,045,065 | |
| | Chariot Funding LLC (3 Mo. LIBOR + 0.05%) | |
| | 37,000,000 | | | | 2.815 | (a) | | | 10/25/19 | | | | 36,999,831 | |
| | |
| | |
| 24 | | The accompanying notes are an integral part of these financial statements. |
FINANCIAL SQUARE MONEY MARKET FUND
| | | | | | | | | | | | | | |
Principal
Amount | | | Interest
Rate | | | Maturity
Date | | | Value | |
|
| Variable Rate Obligations(d) – (continued) | |
| | Commonwealth Bank of Australia (3 Mo. LIBOR + 0.10%) | |
| $ | 80,000,000 | | | | 2.892 | %(a) | | | 09/20/19 | | | $ | 80,038,535 | |
| | Credit Industriel et Commercial (3 Mo. LIBOR + 0.04%) | |
| | 22,000,000 | | | | 2.832 | | | | 03/20/19 | | | | 22,000,368 | |
| | Credit Suisse AG (3 Mo. LIBOR + 0.25%) | |
| | 42,000,000 | | | | 3.054 | | | | 01/08/20 | | | | 42,048,838 | |
| | Credit Suisse AG (3 Mo. LIBOR + 0.17%) | |
| | 40,000,000 | | | | 2.967 | | | | 10/01/19 | | | | 40,024,951 | |
| | Credit Suisse AG-New York Branch (1 Mo. LIBOR + 0.22%) | |
| | 70,000,000 | | | | 2.737 | | | | 12/09/19 | | | | 70,029,422 | |
| | DNB Bank ASA (3 Mo. LIBOR + 0.10%) | |
| | 98,800,000 | | | | 2.924 | (a) | | | 09/23/19 | | | | 98,854,183 | |
| | ING (U.S.) Funding LLC (3 Mo. LIBOR + 0.11%) | |
| | 45,900,000 | | | | 2.807 | | | | 05/10/19 | | | | 45,908,180 | |
| | Mizuho Bank, Ltd.-New York Branch (1 Mo. LIBOR + 0.19%) | |
| | 53,000,000 | | | | 2.680 | | | | 03/25/19 | | | | 53,008,463 | |
| | Mizuho Bank, Ltd.-New York Branch (3 Mo. LIBOR + 0.08%) | |
| | 36,000,000 | | | | 2.867 | | | | 07/15/19 | | | | 36,010,279 | |
| | Mizuho Bank, Ltd.-New York Branch (3 Mo. LIBOR + 0.05%) | |
| | 75,000,000 | | | | 2.830 | | | | 07/18/19 | | | | 75,013,500 | |
| | MUFG Bank, Ltd. (3 Mo. LIBOR + 0.18%) | |
| | 15,000,000 | | | | 2.819 | | | | 02/27/20 | | | | 14,999,977 | |
| | Natixis-New York Branch (3 Mo. LIBOR + 0.18%) | |
| | 50,000,000 | | | | 2.847 | | | | 06/06/19 | | | | 50,024,077 | |
| | 50,000,000 | | | | 2.850 | | | | 06/10/19 | | | | 50,025,739 | |
| | Natixis-New York Branch (3 Mo. LIBOR + 0.23%) | |
| | 10,000,000 | | | | 3.029 | | | | 01/10/20 | | | | 10,010,931 | |
| | Nordea Bank AB (3 Mo. LIBOR + 0.27%) | |
| | 28,750,000 | | | | 3.050 | | | | 10/18/19 | | | | 28,796,018 | |
| | Nordea Bank AB (1 Mo. LIBOR + 0.14%) | |
| | 26,500,000 | | | | 2.654 | | | | 04/05/19 | | | | 26,504,410 | |
| | Oversea-Chinese Banking Corp., Ltd. (1 Mo. LIBOR + 0.20%) | |
| | 10,000,000 | | | | 2.681 | (a) | | | 04/18/19 | | | | 10,002,571 | |
| | Oversea-Chinese Banking Corp., Ltd. (3 Mo. LIBOR + 0.17%) | |
| | 50,000,000 | | | | 2.950 | (a) | | | 04/18/19 | | | | 50,011,324 | |
| | Royal Bank of Canada (3 Mo. LIBOR + 0.17%) | |
| | 43,000,000 | | | | 2.936 | | | | 06/07/19 | | | | 43,020,936 | |
| | Societe Generale (3 Mo. LIBOR + 0.16%) | |
| | 60,500,000 | | | | 2.939 | | | | 04/24/19 | | | | 60,516,751 | |
| | Societe Generale (3 Mo. LIBOR + 0.21%) | |
| | 75,600,000 | | | | 2.849 | | | | 03/03/20 | | | | 75,599,978 | |
| | Societe Generale (3 Mo. LIBOR + 0.41%) | |
| | 58,200,000 | | | | 3.211 | (a) | | | 12/18/19 | | | | 58,331,082 | |
| | Standard Chartered Bank (3 Mo. LIBOR + 0.21%) | |
| | 49,750,000 | | | | 2.884 | | | | 06/10/19 | | | | 49,775,609 | |
| | Sumitomo Mitsui Banking Corp. (3 Mo. LIBOR + 0.10%) | |
| | 40,000,000 | | | | 2.897 | | | | 04/12/19 | | | | 40,003,904 | |
| | Sumitomo Mitsui Banking Corp. (3 Mo. LIBOR + 0.31%) | |
| | 25,000,000 | | | | 3.090 | | | | 10/18/19 | | | | 25,032,750 | |
| | Sumitomo Mitsui Trust Bank Ltd. (3 Mo. LIBOR + 0.10%) | |
| | 60,000,000 | | | | 2.887 | | | | 04/15/19 | | | | 60,006,318 | |
| | Svenska Handelsbanken AB (3 Mo. LIBOR + 0.27%) | |
| | 13,688,000 | | | | 3.031 | | | | 10/21/19 | | | | 13,712,409 | |
| | Svenska Handelsbanken AB (1 Mo. LIBOR + 0.31%) | |
| | 8,250,000 | | | | 2.800 | | | | 08/23/19 | | | | 8,257,253 | |
| | Svenska Handelsbanken AB (1 Mo. LIBOR + 0.34%) | |
| | 8,500,000 | | | | 2.821 | | | | 11/22/19 | | | | 8,511,240 | |
| | |
|
| Variable Rate Obligations(d) – (continued) | |
| | Svenska Handelsbanken AB (3 Mo. LIBOR + 0.20%) | |
| 40,000,000 | | | | 2.997 | % | | | 04/09/19 | | | | 40,009,142 | |
| Svenska Handelsbanken AB-New York Branch (3 Mo. LIBOR +
0.21%) |
|
| | 37,000,000 | | | | 3.014 | | | | 12/19/19 | | | | 37,051,887 | |
| Svenska Handelsbanken AB-New York Branch (1 Mo. LIBOR +
0.15%) |
|
| | 40,150,000 | | | | 2.664 | | | | 04/05/19 | | | | 40,154,839 | |
| | Swedbank AB (1 Mo. LIBOR + 0.29%) | |
| | 60,000,000 | | | | 2.780 | | | | 07/25/19 | | | | 60,032,677 | |
| | Toronto-Dominion Bank (The) (1 Mo. LIBOR + 0.37%) | |
| | 99,000,000 | | | | 2.882 | (a) | | | 11/07/19 | | | | 99,151,492 | |
| | Toronto-Dominion Bank (The) (3 Mo. LIBOR + 0.11%) | |
| | 35,000,000 | | | | 2.934 | | | | 09/23/19 | | | | 35,013,678 | |
| | Toronto-Dominion Bank (The) (3 Mo. LIBOR + 0.17%) | |
| | 35,000,000 | | | | 2.943 | | | | 04/17/19 | | | | 35,006,852 | |
| | Toyota Finance Australia Limited (3 Mo. LIBOR + 0.08%) | |
| | 16,000,000 | | | | 2.863 | | | | 07/02/19 | | | | 16,005,835 | |
| Toyota Motor Finance (Netherlands) B.V. (3 Mo. LIBOR +
0.09%) |
|
| | 34,255,000 | | | | 2.880 | | | | 03/18/19 | | | | 34,256,408 | |
| | UBS AG-London Branch (3 Mo. LIBOR + 0.32%) | |
| | 80,000,000 | | | | 3.144 | (a) | | | 12/19/19 | | | | 80,124,642 | |
| | UBS AG-London Branch (1 Mo. LIBOR + 0.25%) | |
| | 10,000,000 | | | | 2.759 | (a) | | | 10/01/19 | | | | 10,005,698 | |
| | UBS AG-London Branch (3 Mo. LIBOR + 0.00%) | |
| | 40,000,000 | | | | 2.824 | (a) | | | 09/24/19 | | | | 40,013,141 | |
| | Wells Fargo Bank N.A. (3 Mo. LIBOR + 0.16%) | |
| | 45,000,000 | | | | 2.957 | | | | 08/13/19 | | | | 45,045,443 | |
| | Wells Fargo Bank N.A. (1 Mo. LIBOR + 0.30%) | |
| | 20,000,000 | | | | 2.790 | | | | 07/23/19 | | | | 20,014,580 | |
| | Wells Fargo Bank N.A. (1 Mo. LIBOR + 0.39%) | |
| | 38,750,000 | | | | 2.903 | | | | 12/09/19 | | | | 38,820,247 | |
| | Wells Fargo Bank N.A. (3 Mo. LIBOR + 0.25%) | |
| | 15,000,000 | | | | 3.047 | | | | 04/05/19 | | | | 15,004,245 | |
| | Westpac Banking Corp. (3 Mo. LIBOR + 0.10%) | |
| | 60,000,000 | | | | 2.892 | (a) | | | 09/20/19 | | | | 60,022,432 | |
| | Westpac Banking Corp. (3 Mo. LIBOR + 0.18%) | |
| | 50,000,000 | | | | 2.924 | (a) | | | 10/31/19 | | | | 50,048,537 | |
| | |
| | TOTAL VARIABLE RATE OBLIGATIONS | |
| | (Cost $2,973,988,101) | | | $ | 2,975,926,557 | |
| | |
| TOTAL INVESTMENTS BEFORE REPURCHASE
AGREEMENTS |
|
| | (Cost $9,129,913,741) | | | $ | 9,133,953,476 | |
| | |
| | | | | | | | | | | | | | |
|
| Repurchase Agreements(e) – 31.9% | |
| | BNP Paribas | |
| $ | 60,000,000 | | | | 2.520 | % | | | 03/01/19 | | | $ | 59,999,897 | |
| | Maturity Value: $60,004,200 | |
| | Settlement Date: 02/28/19 | |
| Collateralized by various sovereign debt security issuers, 2.250%
to 7.375%, due 03/18/19 to 04/24/28. The aggregate market
value of the collateral, including accrued interest, was
$63,000,241. |
|
| | |
| | |
| The accompanying notes are an integral part of these financial statements. | | 25 |
FINANCIAL SQUARE MONEY MARKET FUND
Schedule of Investments(continued)
February 28, 2019 (Unaudited)
| | | | | | | | | | | | | | |
Principal
Amount | | | Interest
Rate | | | Maturity
Date | | | Value | |
|
| Repurchase Agreements(e) – (continued) | |
| | BNP Paribas (OBFR + 0.20%) | |
| $ | 50,000,000 | | | | 2.600 | %(d) | | | 03/07/19 | | | $ | 50,000,000 | |
| | Maturity Value: $52,592,777 | |
| | Settlement Date: 03/24/17 | |
| Collateralized by various asset-backed obligations, 0.000% to
6.202%, due 01/22/30 to 04/30/47 and various sovereign debt
security issuers, 4.875% to 8.875%, due 01/22/21 to 04/15/24.
The aggregate market value of the collateral, including accrued
interest, was $55,006,541. |
|
| | |
| | Citigroup Global Markets, Inc. (3 Mo. LIBOR + 0.43%) | |
| | 108,000,000 | | | | 3.209 | (d) | | | 06/03/19 | | | | 108,000,000 | |
| | Maturity Value: $110,628,121 | |
| | Settlement Date: 09/10/18 | |
| Collateralized by mortgage-backed obligations, 4.259% to
6.185%, due 10/15/21 to 05/15/46 and various asset-backed
obligations, 0.000% to 8.360%, due 01/17/20 to 11/23/52. The
aggregate market value of the collateral, including accrued
interest, was $118,800,002. |
|
| | |
| | Credit Suisse Securities (USA) LLC (1 Mo. LIBOR + 0.50%) | |
| | 30,000,000 | | | | 2.993 | (d) | | | 04/04/19 | | | | 30,000,000 | |
| | Maturity Value: $31,775,847 | |
| | Settlement Date: 04/27/17 | |
| Collateralized by various corporate security issuers, 4.625% to
12.500%, due 04/25/19 to perpetual maturity. The aggregate
market value of the collateral, including accrued interest, was
$33,002,745. |
|
| | |
| | HSBC Bank PLC | |
| | 140,000,000 | | | | 2.600 | | | | 03/01/19 | | | | 140,000,066 | |
| | Maturity Value: $140,010,111 | |
| Collateralized by an Exchange-Traded Fund, 0.000%, due
01/01/49 and various equity securities. The aggregate market
value of the collateral, including accrued interest, was
$151,200,013. |
|
| | |
| | HSBC Securities (USA), Inc. | |
| | 50,000,000 | | | | 2.500 | | | | 03/01/19 | | | | 49,999,887 | |
| | Maturity Value: $50,003,472 | |
| Collateralized by various corporate security issuers, 1.800% to
6.375%, due 02/14/20 to 03/30/67 and various sovereign debt
security issuer, 3.125%, due 09/06/23. The aggregate market
value of the collateral, including accrued interest, was
$52,503,648. |
|
| | 115,000,000 | | | | 2.600 | | | | 03/01/19 | | | | 115,000,054 | |
| | Maturity Value: $115,008,306 | |
| Collateralized by various corporate security issuers, 2.000% to
12.500%, due 02/15/20 to perpetual maturity. The aggregate
market value of the collateral, including accrued interest, was
$126,509,139. |
|
| | |
| | Joint Repurchase Agreement Account III | |
| | 2,760,000,000 | | | | 2.595 | | | | 03/01/19 | | | | 2,760,000,911 | |
| | Maturity Value: $2,760,198,945 | |
| | |
|
| Repurchase Agreements(e) – (continued) | |
| | Merrill Lynch, Pierce, Fenner & Smith, Inc. | |
| 75,000,000 | | | | 2.600 | % | | | 03/01/19 | | | | 75,000,035 | |
| | Maturity Value: $75,005,417 | |
| Collateralized by mortgage-backed obligations, 2.856% to
5.064%, due 08/10/30 to 11/25/58 and various asset-backed
obligations, 2.200% to 3.990%, due 07/15/22 to 05/28/69. The
aggregate market value of the collateral, including accrued
interest, was $86,250,001. |
|
| | 132,000,000 | | | | 2.700 | | | | 04/04/19 | | | | 132,000,000 | |
| | Maturity Value: $132,534,600 | |
| | Settlement Date: 02/14/19 | |
| Collateralized by mortgage-backed obligations, 1.909% to
7.490%, due 06/10/28 to 06/15/60 and various asset-backed
obligations, 0.000% to 4.540%, due 12/18/19 to 02/25/70. The
aggregate market value of the collateral, including accrued
interest, was $151,800,001. |
|
| | |
| | MUFG Securities Americas Inc. | |
| | 110,000,000 | | | | 2.570 | | | | 03/01/19 | | | | 109,999,961 | |
| | Maturity Value: $110,007,853 | |
| Collateralized by an Exchange-Traded Fund, 0.000%, due
01/01/49, various corporate security issuers, 1.000% to 2.875%,
due 07/01/20 to 02/01/33 and various equity securities. The
aggregate market value of the collateral, including accrued
interest, was $119,160,537. |
|
| | |
| | RBC Capital Markets LLC | |
| | 250,000,000 | | | | 2.500 | | | | 03/01/19 | | | | 249,999,433 | |
| | Maturity Value: $250,017,361 | |
| Collateralized by Federal Home Loan Mortgage Corp., 2.000% to
3.500%, due 07/15/25 to 02/01/48, Federal Home Loan
Mortgage Corp. Stripped Security, 0.000%, due 05/15/40,
Federal National Mortgage Association, 2.000% to 4.500%,
due 12/01/20 to 02/01/49, Government National Mortgage
Association, 2.000% to 3.500%, due 04/20/38 to 10/20/48 and
various corporate security issuers, 0.000% to 9.400%, due
07/01/19 to 09/14/48. The aggregate market value of the
collateral, including accrued interest, was $257,681,579. |
|
| | |
| | Wells Fargo Securities LLC | |
| | 150,000,000 | | | | 2.500 | | | | 03/01/19 | | | | 150,000,000 | |
| | Maturity Value: $150,010,417 | |
| Collateralized by various corporate security issuers, 0.000%, due
03/13/19 to 04/03/19. The aggregate market value of the
collateral, including accrued interest, was $157,500,001. |
|
| | 92,000,000 | | | | 2.890 | | | | 05/10/19 | | | | 92,000,000 | |
| | Maturity Value: $92,886,267 | |
| | Settlement Date: 01/10/19 | |
| Collateralized by various asset-backed obligations, 1.750% to
8.151%, due 10/13/20 to 01/17/38. The aggregate market value
of the collateral, including accrued interest, was $101,199,999. |
|
| | |
| | TOTAL REPURCHASE AGREEMENTS | |
| | (Cost $4,122,000,000) | | | $ | 4,122,000,244 | |
| | |
| | TOTAL INVESTMENTS – 102.5% | |
| | (Cost $13,251,913,741) | | | $ | 13,255,953,720 | |
| | |
| LIABILITIES IN EXCESS OF
OTHER ASSETS – (2.5)% |
| | | (320,301,068 | ) |
| | |
| | NET ASSETS – 100.0% | | | $ | 12,935,652,652 | |
| | |
| | |
| 26 | | The accompanying notes are an integral part of these financial statements. |
FINANCIAL SQUARE MONEY MARKET FUND
| | |
|
| The percentage shown for each investment category reflects the value of investments in that category as a percentage of net assets. |
| |
(a) | | Exempt from registration under Rule 144A of the Securities Act of 1933. |
| |
(b) | | All or a portion represents a forward commitment. |
| |
(c) | | Rate shown is that which is in effect on February 28, 2019. Certain variable rate securities are not based on a published reference rate and spread but are determined by the issuer or agent and are based on current market conditions. |
| |
(d) | | Variable or floating rate security. Except for floating rate notes (for which final maturity is disclosed), maturity date disclosed is the next interest reset date. Interest rate disclosed is that which is in effect on February 28, 2019. |
| |
(e) | | Unless noted, all repurchase agreements were entered into on February 28, 2019. Additional information on Joint Repurchase Agreement Account III appears on page 39. |
Interest rates represent either the stated coupon rate, annualized yield on date of purchase for discounted securities, or, for floating rate securities, the current reset rate, which is based upon current interest rate indices.
Maturity dates represent either the final legal maturity date on the security, the demand date for puttable securities, the date of the next interest rate reset for variable rate securities, or the prerefunded date for those types of securities.
| | |
|
Investment Abbreviations: |
GO | | —General Obligation |
LIBOR | | —London Interbank Offered Rates |
LIQ | | —Liquidity Agreement |
LOC | | —Letter of Credit |
OBFR | | —Overnight Bank Funding Rate |
RB | | —Revenue Bond |
RMKT | | —Remarketed |
SPA | | —Stand-by Purchase Agreement |
VRDN | | —Variable Rate Demand Notes |
|
| | |
| The accompanying notes are an integral part of these financial statements. | | 27 |
FINANCIAL SQUARE PRIME OBLIGATIONS FUND
Schedule of Investments
February 28, 2019 (Unaudited)
| | | | | | | | | | | | | | |
| Principal Amount | | | Interest
Rate | | | Maturity
Date | | | Value | |
|
| Commercial Paper and Corporate Obligations – 30.8% | |
| | Albion Capital LLC | |
| $ | 8,300,000 | | | | 2.570 | % | | | 03/28/19 | | | $ | 8,284,139 | |
| | 50,000,000 | | | | 2.617 | | | | 04/29/19 | | | | 49,790,000 | |
| | Antalis S.A. | |
| | 32,504,000 | | | | 2.806 | | | | 04/10/19 | | | | 32,411,232 | |
| | Atlantic Asset Securitization LLC | |
| | 14,000,000 | | | | 2.839 | | | | 03/04/19 | | | | 13,996,216 | |
| | 13,000,000 | | | | 2.871 | | | | 03/11/19 | | | | 12,990,268 | |
| | 10,000,000 | | | | 2.911 | | | | 03/19/19 | | | | 9,986,990 | |
| | Banque et Caisse d’Epargne de l’Etat | |
| | 10,000,000 | | | | 2.696 | | | | 05/07/19 | | | | 9,951,626 | |
| | 15,000,000 | | | | 2.662 | | | | 07/01/19 | | | | 14,863,982 | |
| | Barclays US CCP Funding LLC | |
| | 15,000,000 | | | | 2.900 | | | | 03/05/19 | | | | 14,994,994 | |
| | 6,000,000 | | | | 2.910 | | | | 03/07/19 | | | | 5,997,188 | |
| | 13,000,000 | | | | 2.709 | | | | 03/26/19 | | | | 12,976,950 | |
| | Barton Capital S.A. | |
| | 10,000,000 | | | | 2.674 | | | | 05/08/19 | | | | 9,949,956 | |
| | Bedford Row Funding Corp. | |
| | 4,300,000 | | | | 3.103 | | | | 10/16/19 | | | | 4,225,825 | |
| | 6,000,000 | | | | 3.136 | | | | 10/18/19 | | | | 5,895,523 | |
| | CAFCO, LLC | |
| | 24,000,000 | | | | 2.818 | | | | 08/01/19 | | | | 23,736,044 | |
| | Cancara Asset Securitisation LLC | |
| | 6,000,000 | | | | 2.903 | | | | 03/22/19 | | | | 5,990,947 | |
| | 15,000,000 | | | | 2.901 | | | | 04/30/19 | | | | 14,935,137 | |
| | 5,342,000 | | | | 3.005 | | | | 05/28/19 | | | | 5,307,689 | |
| | Chariot Funding LLC | |
| | 10,000,000 | | | | 2.900 | | | | 05/02/19 | | | | 9,955,410 | |
| | 10,000,000 | | | | 3.057 | | | | 06/17/19 | | | | 9,923,216 | |
| | 15,000,000 | | | | 3.037 | | | | 07/08/19 | | | | 14,862,254 | |
| | China Construction Bank Corp. | |
| | 5,350,000 | | | | 3.044 | | | | 04/08/19 | | | | 5,335,186 | |
| | 7,000,000 | | | | 2.962 | | | | 04/15/19 | | | | 6,976,887 | |
| | 7,000,000 | | | | 2.962 | | | | 04/16/19 | | | | 6,976,349 | |
| | CNPC Finance (HK) Ltd. | |
| | 10,000,000 | | | | 2.968 | | | | 03/14/19 | | | | 9,989,943 | |
| | Coca-Cola Company (The) | |
| | 10,000,000 | | | | 2.822 | | | | 02/11/20 | | | | 9,730,880 | |
| | Collateralized Commercial Paper Flex Co., LLC | |
| | 15,000,000 | | | | 3.059 | | | | 10/15/19 | | | | 14,741,993 | |
| | Collateralized Commercial Paper II Co., LLC | |
| | 24,000,000 | | | | 2.984 | | | | 07/08/19 | | | | 23,777,527 | |
| | 20,000,000 | | | | 3.191 | | | | 10/22/19 | | | | 19,643,247 | |
| | 5,167,000 | | | | 3.309 | | | | 11/25/19 | | | | 5,060,043 | |
| | Dexia Credit Local-New York Branch | |
| | 25,000,000 | | | | 2.644 | | | | 05/07/19 | | | | 24,883,220 | |
| | 35,000,000 | | | | 2.866 | | | | 10/10/19 | | | | 34,437,262 | |
| | DNB Bank ASA | |
| | 50,000,000 | | | | 2.434 | | | | 03/06/19 | | | | 49,980,234 | |
| | Erste Abwicklungsanstalt | |
| | 45,000,000 | | | | 2.584 | | | | 05/08/19 | | | | 44,782,736 | |
| | Federation des caisses Desjardins du Quebec | |
| | 20,250,000 | | | | 2.803 | | | | 02/25/20 | | | | 19,696,547 | |
| | First Abu Dhabi Bank P.J.S.C. | |
| | 15,000,000 | | | | 2.736 | | | | 05/06/19 | | | | 14,924,653 | |
| | 20,000,000 | | | | 2.736 | | | | 05/08/19 | | | | 19,896,423 | |
| | 15,000,000 | | | | 2.762 | | | | 06/05/19 | | | | 14,889,299 | |
| | |
|
| Commercial Paper and Corporate Obligations – (continued) | |
| | Industrial & Commercial Bank of China Ltd.-New York Branch | |
| 19,300,000 | | | | 3.066 | | | | 04/15/19 | | | | 19,236,547 | |
| | J.P. Morgan Securities LLC | |
| | 11,000,000 | | | | 2.992 | | | | 06/03/19 | | | | 10,922,873 | |
| | 20,000,000 | | | | 3.012 | | | | 08/01/19 | | | | 19,770,455 | |
| | Kells Funding LLC | |
| | 2,850,000 | | | | 2.605 | | | | 06/10/19 | | | | 2,829,296 | |
| | Liberty Street Funding LLC | |
| | 11,800,000 | | | | 2.869 | | | | 03/19/19 | | | | 11,784,649 | |
| | 15,000,000 | | | | 2.859 | | | | 04/04/19 | | | | 14,963,658 | |
| | 15,000,000 | | | | 2.690 | | | | 06/05/19 | | | | 14,896,695 | |
| | 10,000,000 | | | | 2.659 | | | | 06/11/19 | | | | 9,926,469 | |
| | LMA-Americas LLC | |
| | 9,500,000 | | | | 2.807 | | | | 04/18/19 | | | | 9,467,622 | |
| | 10,250,000 | | | | 3.088 | | | | 06/10/19 | | | | 10,174,608 | |
| | Longship Funding LLC | |
| | 10,000,000 | | | | 2.592 | | | | 04/02/19 | | | | 9,976,387 | |
| | 42,000,000 | | | | 2.617 | | | | 04/23/19 | | | | 41,830,656 | |
| | Macquarie Bank Ltd. | |
| | 5,075,000 | | | | 2.808 | | | | 04/15/19 | | | | 5,058,613 | |
| | Manhattan Asset Funding Company LLC | |
| | 5,400,000 | | | | 2.498 | | | | 03/21/19 | | | | 5,392,226 | |
| | Matchpoint Finance PLC | |
| | 10,000,000 | | | | 2.807 | | | | 04/18/19 | | | | 9,964,557 | |
| | 15,000,000 | | | | 3.029 | | | | 05/20/19 | | | | 14,910,056 | |
| | 15,000,000 | | | | 3.030 | | | | 06/03/19 | | | | 14,893,639 | |
| | 10,000,000 | | | | 3.057 | | | | 06/03/19 | | | | 9,929,093 | |
| | 15,000,000 | | | | 2.669 | | | | 06/11/19 | | | | 14,884,254 | |
| | 15,000,000 | | | | 3.089 | | | | 06/11/19 | | | | 14,884,254 | |
| | Mercy Health | |
| | 20,000,000 | | | | 2.662 | | | | 03/18/19 | | | | 19,975,670 | |
| | Metlife Short Term Funding LLC | |
| | 40,000,000 | | | | 2.728 | | | | 07/08/19 | | | | 39,626,900 | |
| | 16,000,000 | | | | 2.816 | | | | 07/24/19 | | | | 15,830,965 | |
| | 22,500,000 | | | | 2.734 | | | | 08/19/19 | | | | 22,219,425 | |
| | Mitsubishi UFJ Trust and Banking Corp. | |
| | 15,000,000 | | | | 2.813 | | | | 05/09/19 | | | | 14,925,129 | |
| | National Securities Clearing Corp. | |
| | 18,000,000 | | | | 3.245 | | | | 12/13/19 | | | | 17,603,856 | |
| | Natixis-New York Branch | |
| | 20,000,000 | | | | 2.835 | | | | 09/03/19 | | | | 19,729,266 | |
| | Nederlandse Waterschapsbank N.V. | |
| | 15,000,000 | | | | 2.445 | (a) | | | 03/08/19 | | | | 14,991,880 | |
| | Nieuw Amsterdam Receivables Corp. | |
| | 10,000,000 | | | | 2.562 | | | | 04/08/19 | | | | 9,973,253 | |
| | 7,673,000 | | | | 2.562 | (a) | | | 04/09/19 | | | | 7,651,916 | |
| | 15,000,000 | | | | 2.653 | | | | 05/07/19 | | | | 14,929,082 | |
| | Nordea Bank AB | |
| | 20,000,000 | | | | 2.617 | | | | 05/13/19 | | | | 19,896,688 | |
| | NRW.Bank | |
| | 40,000,000 | | | | 2.617 | | | | 05/10/19 | | | | 39,805,854 | |
| | Ridgefield Funding Company LLC | |
| | 15,000,000 | | | | 2.828 | | | | 04/16/19 | | | | 14,950,650 | |
| | 15,000,000 | | | | 3.088 | | | | 06/10/19 | | | | 14,890,435 | |
| | 25,000,000 | | | | 3.015 | | | | 07/08/19 | | | | 24,765,007 | |
| | Sheffield Receivables Company LLC | |
| | 10,000,000 | | | | 2.584 | | | | 03/26/19 | | | | 9,982,204 | |
| | |
| | |
| 28 | | The accompanying notes are an integral part of these financial statements. |
FINANCIAL SQUARE PRIME OBLIGATIONS FUND
| | | | | | | | | | | | | | |
| Principal Amount | | | Interest
Rate | | | Maturity
Date | | | Value | |
|
| Commercial Paper and Corporate Obligations – (continued) | |
| | Skandinaviska Enskilda Banken AB | |
| $ | 20,000,000 | | | | 2.742 | % | | | 11/13/19 | | | $ | 19,620,883 | |
| | Starbird Funding Corp. | |
| | 20,000,000 | | | | 2.566 | | | | 04/15/19 | | | | 19,935,677 | |
| | State of the Netherlands (The) | |
| | 65,000,000 | | | | 2.455 | (a) | | | 03/07/19 | | | | 64,969,161 | |
| | Sumitomo Mitsui Trust Bank, Ltd.-Singapore Branch | |
| | 20,000,000 | | | | 2.907 | | | | 05/03/19 | | | | 19,909,440 | |
| | Swedbank AB | |
| | 20,000,000 | | | | 2.763 | | | | 05/16/19 | | | | 19,894,467 | |
| | Thunder Bay Funding, LLC | |
| | 25,000,000 | | | | 3.057 | | | | 06/17/19 | | | | 24,806,373 | |
| | 27,000,000 | | | | 3.046 | | | | 06/26/19 | | | | 26,772,024 | |
| | Toronto-Dominion Bank (The) | |
| | 12,300,000 | | | | 3.136 | | | | 10/18/19 | | | | 12,094,145 | |
| | Versailles Commercial Paper LLC | |
| | 14,500,000 | | | | 2.859 | | | | 03/01/19 | | | | 14,499,023 | |
| | 12,000,000 | | | | 2.821 | | | | 03/04/19 | | | | 11,996,756 | |
| | 25,000,000 | | | | 2.726 | | | | 05/07/19 | | | | 24,879,064 | |
| | |
| TOTAL COMMERCIAL PAPER AND CORPORATE
OBLIGATIONS |
|
| | (Cost $1,463,038,308) | | | $ | 1,463,569,815 | |
| | |
| | | | | | | | | | | | | | |
|
| Certificate of Deposit – 0.5% | |
| | Branch Banking and Trust Company | |
| $ | 23,000,000 | | | | 2.410 | % | | | 03/05/19 | | | $ | 22,999,999 | |
| | (Cost $23,000,000) | |
| | |
| | |
|
| Certificates of Deposit-Yankeedollar – 3.4% | |
| | Banco Del Estado De Chile | |
| $ | 15,000,000 | | | | 2.970 | % | | | 08/09/19 | | | $ | 15,019,604 | |
| | Mizuho Bank, Ltd.-New York Branch | |
| | 30,000,000 | | | | 2.710 | | | | 09/20/19 | | | | 30,005,826 | |
| | MUFG Bank, Ltd. | |
| | 30,000,000 | | | | 2.840 | | | | 02/24/20 | | | | 30,018,054 | |
| | National Bank of Kuwait S.A.K.P | |
| | 6,500,000 | | | | 3.000 | | | | 03/15/19 | | | | 6,501,320 | |
| | 10,000,000 | | | | 3.050 | | | | 04/23/19 | | | | 10,005,905 | |
| | 11,050,000 | | | | 2.850 | | | | 04/29/19 | | | | 11,053,368 | |
| | 15,000,000 | | | | 2.900 | | | | 05/20/19 | | | | 15,005,385 | |
| | Natixis-New York Branch | |
| | 15,200,000 | | | | 2.900 | | | | 08/12/19 | | | | 15,219,962 | |
| | Sumitomo Mitsui Banking Corp. | |
| | 10,000,000 | | | | 2.050 | | | | 05/03/19 | | | | 9,992,062 | |
| | Sumitomo Mitsui Trust Bank Ltd. | |
| | 21,000,000 | | | | 2.820 | | | | 03/19/19 | | | | 21,004,125 | |
| | |
| | TOTAL CERTIFICATES OF DEPOSIT-YANKEEDOLLAR | |
| | (Cost $163,736,556) | | | $ | 163,825,611 | |
| | |
|
| Fixed Rate Municipal Debt Obligations – 3.4% | |
| | Banque Federative du Credit Mutuel | |
| $ | 25,000,000 | | | | 1.900 | %(b) | | | 03/28/19 | | | $ | 24,991,476 | |
| | 18,800,000 | | | | 2.000 | (b) | | | 04/12/19 | | | | 18,787,095 | |
| | Citibank N.A. | |
| | 8,000,000 | | | | 1.850 | | | | 09/18/19 | | | | 7,960,391 | |
| | Cooperatieve Rabobank UA | |
| | 10,250,000 | | | | 2.250 | | | | 01/14/20 | | | | 10,203,465 | |
| | Credit Suisse AG-New York Branch | |
| | 15,000,000 | | | | 2.300 | | | | 05/28/19 | | | | 14,987,250 | |
| | 5,000,000 | | | | 5.300 | | | | 08/13/19 | | | | 5,054,522 | |
| | MUFG Bank, Ltd. | |
| | 15,000,000 | | | | 2.350 | (b) | | | 09/08/19 | | | | 14,961,794 | |
| | Nordea Bank AB | |
| | 4,140,000 | | | | 4.875 | (b) | | | 01/27/20 | | | | 4,214,221 | |
| | Santander UK PLC | |
| | 11,000,000 | | | | 2.500 | | | | 03/14/19 | | | | 10,999,687 | |
| | Sumitomo Mitsui Banking Corp. | |
| | 10,000,000 | | | | 2.514 | | | | 01/17/20 | | | | 9,966,550 | |
| | Svenska Handelsbanken AB | |
| | 15,000,000 | | | | 1.500 | | | | 09/06/19 | | | | 14,897,718 | |
| | Wells Fargo Bank N.A. | |
| | 30,000,000 | | | | 2.400 | | | | 01/15/20 | | | | 29,885,116 | |
| | |
| | TOTAL FIXED RATE MUNICIPAL DEBT OBLIGATIONS | |
| | (Cost $166,853,226) | | | $ | 166,909,285 | |
| | |
| | | | | | | | | | | | | | |
|
| Time Deposit – 6.0% | |
| | Credit Agricole Corporate and Investment Bank | |
| $ | 135,600,000 | | | | 2.380 | % | | | 03/01/19 | | | $ | 135,600,000 | |
| | Skandinaviska Enskilda Banken AB | |
| | 150,000,000 | | | | 2.380 | | | | 03/01/19 | | | | 150,000,000 | |
| | |
| | TOTAL TIME DEPOSIT | |
| | (Cost $285,600,000) | | | $ | 285,600,000 | |
| | |
| | | | | | | | | | | | | | |
|
| U.S. Government Agency Obligations – 0.2% | |
| Overseas Private Investment Corp. (USA) (3 Mo. U.S. T-Bill +
0.00%) |
|
| $ | 8,248,121 | | | | 2.420 | %(c) | | | 03/07/19 | | | $ | 8,248,121 | |
| | (Cost $8,248,121) | | | | | |
| | |
| | | | | | | | | | | | | | |
|
| Variable Rate Municipal Debt Obligations(d) – 2.7% | |
| Alaska Housing Finance Corp. VRDN RB Refunding for State
Capital Project Bonds II Series 2017 B |
|
| $ | 8,000,000 | | | | 2.420 | % | | | 03/07/19 | | | $ | 8,000,000 | |
| BlackRock Municipal Bond Trust VRDN RB Putters
Series 2012-T0014 (JPMorgan Chase N.A., LIQ)(b) |
|
| | 7,000,000 | | | | 2.500 | | | | 03/01/19 | | | | 7,000,000 | |
| BlackRock MuniVest Fund II, Inc. VRDN RB Putters
Series 2012-T0005 (JPMorgan Chase Bank N.A., LIQ)(b) |
|
| | 5,000,000 | | | | 2.500 | | | | 03/01/19 | | | | 5,000,000 | |
| | |
| | |
| The accompanying notes are an integral part of these financial statements. | | 29 |
FINANCIAL SQUARE PRIME OBLIGATIONS FUND
Schedule of Investments(continued)
February 28, 2019 (Unaudited)
| | | | | | | | | | | | | | |
| Principal Amount | | | Interest
Rate | | | Maturity
Date | | | Value | |
|
| Variable Rate Municipal Debt Obligations(d) – (continued) | |
| BlackRock MuniVest Fund, Inc. VRDN RB Putters
Series 2012-T0007 (JPMorgan Chase Bank N.A., LIQ)(b) |
|
| $ | 30,000,000 | | | | 2.500 | % | | | 03/01/19 | | | $ | 30,000,000 | |
| City of Portland, Maine GO VRDN for Taxable Pension Bonds
Series 2001 RMKT (Sumitomo Mitsui Banking Corp., SPA) |
|
| | 18,500,000 | | | | 2.440 | | | | 03/07/19 | | | | 18,500,000 | |
| Providence Health & Services Obligated Group VRDN RB
Series 2012-E (U.S. Bank N.A., SBPA) |
|
| | 30,300,000 | | | | 2.499 | | | | 03/07/19 | | | | 30,300,000 | |
| Regents of the University of California VRDN RB Taxable
Series 2011-Z-1 |
|
| | 22,000,000 | | | | 2.380 | | | | 03/07/19 | | | | 22,000,000 | |
| Triborough Bridge & Tunnel Authority VRDN RB Refunding for
Metropolitan Transportation Authority Bridges & Tunnels
Series 2018E (Bank of America N.A., LOC) |
|
| | 7,000,000 | | | | 2.420 | | | | 03/07/19 | | | | 7,000,000 | |
| | |
| TOTAL VARIABLE RATE MUNICIPAL DEBT
OBLIGATIONS |
|
| | (Cost $127,800,000) | | | $ | 127,800,000 | |
| | |
| | | | | | | | | | | | | | |
|
| Variable Rate Obligations(c) – 24.5% | |
| | Banco Del Estado De Chile (3 Mo. LIBOR + 0.08%) | |
| $ | 6,000,000 | | | | 2.851 | % | | | 07/25/19 | | | $ | 5,999,967 | |
| | Bank of Montreal (1 Mo. LIBOR + 0.40%) | |
| | 15,000,000 | | | | 2.917 | | | | 12/10/19 | | | | 15,028,899 | |
| | Bank of Montreal (1 Mo. LIBOR + 0.15%) | |
| | 26,000,000 | | | | 2.654 | | | | 03/12/19 | | | | 26,001,933 | |
| | Bank of Montreal (3 Mo. LIBOR + 0.21%) | |
| | 20,000,000 | | | | 2.946 | | | | 11/01/19 | | | | 20,024,724 | |
| | Bank of Montreal (3 Mo. LIBOR + 0.33%) | |
| | 18,000,000 | | | | 3.106 | | | | 06/12/19 | | | | 18,016,025 | |
| | Bank of Nova Scotia (The) (3 Mo. LIBOR + 0.28%) | |
| | 9,300,000 | | | | 3.072 | | | | 03/20/19 | | | | 9,301,175 | |
| | Bank of Nova Scotia (The) (3 Mo. LIBOR + 0.10%) | |
| | 32,000,000 | | | | 2.922 | (b) | | | 03/25/19 | | | | 32,002,211 | |
| | Bedford Row Funding Corp. (3 Mo. LIBOR + 0.10%) | |
| | 15,000,000 | | | | 2.887 | (b) | | | 07/15/19 | | | | 15,005,919 | |
| | Bedford Row Funding Corp. (3 Mo. LIBOR + 0.16%) | |
| | 20,000,000 | | | | 2.939 | (b) | | | 01/10/20 | | | | 20,009,994 | |
| | BNP Paribas-New York Branch (3 Mo. LIBOR + 0.10%) | |
| | 20,000,000 | | | | 2.883 | | | | 07/10/19 | | | | 20,005,492 | |
| | BNZ International Funding Ltd. (1 Mo. LIBOR + 0.31%) | |
| | 12,000,000 | | | | 2.823 | (b) | | | 08/08/19 | | | | 12,009,304 | |
| | BNZ International Funding Ltd. (3 Mo. LIBOR + 0.25%) | |
| | 13,817,000 | | | | 3.045 | (b) | | | 04/05/19 | | | | 13,819,182 | |
| | Canadian Imperial Bank of Commerce (1 Mo. LIBOR + 0.35%) | |
| | 15,000,000 | | | | 2.864 | | | | 11/05/19 | | | | 15,016,899 | |
| | Canadian Imperial Bank of Commerce (3 Mo. LIBOR + 0.20%) | |
| | 32,500,000 | | | | 2.936 | | | | 05/01/19 | | | | 32,511,664 | |
| | Chariot Funding LLC (3 Mo. LIBOR + 0.05%) | |
| | 13,000,000 | | | | 2.815 | (b) | | | 10/25/19 | | | | 12,999,941 | |
| | Commonwealth Bank of Australia (3 Mo. LIBOR + 0.10%) | |
| | 30,000,000 | | | | 2.892 | (b) | | | 09/20/19 | | | | 30,014,451 | |
| | Cooperatieve Rabobank U.A. (1 Mo. LIBOR + 0.19%) | |
| | 20,000,000 | | | | 2.670 | | | | 04/18/19 | | | | 20,002,187 | |
| | |
|
| Variable Rate Obligations(c) – (continued) | |
| | Credit Industriel et Commercial (3 Mo. LIBOR + 0.04%) | |
| 5,000,000 | | | | 2.832 | | | | 03/20/19 | | | | 5,000,084 | |
| | Credit Suisse AG (3 Mo. LIBOR + 0.25%) | |
| | 27,000,000 | | | | 3.054 | | | | 01/08/20 | | | | 27,031,396 | |
| | Credit Suisse AG (3 Mo. LIBOR + 0.17%) | |
| | 13,450,000 | | | | 2.967 | | | | 10/01/19 | | | | 13,458,390 | |
| | Credit Suisse AG-New York Branch (1 Mo. LIBOR + 0.22%) | |
| | 20,000,000 | | | | 2.737 | | | | 12/09/19 | | | | 20,008,406 | |
| | DNB Bank ASA (3 Mo. LIBOR + 0.10%) | |
| | 35,000,000 | | | | 2.924 | (b) | | | 09/23/19 | | | | 35,019,194 | |
| | ING (U.S.) Funding LLC (3 Mo. LIBOR + 0.11%) | |
| | 20,450,000 | | | | 2.807 | | | | 05/10/19 | | | | 20,453,644 | |
| | J.P. Morgan Securities LLC (1 Mo. LIBOR + 0.32%) | |
| | 9,800,000 | | | | 2.800 | (b) | | | 07/17/19 | | | | 9,807,365 | |
| | Mizuho Bank, Ltd.-New York Branch (3 Mo. LIBOR + 0.05%) | |
| | 30,000,000 | | | | 2.830 | | | | 07/18/19 | | | | 30,005,400 | |
| | Mizuho Bank, Ltd.-New York Branch (3 Mo. LIBOR + 0.08%) | |
| | 10,000,000 | | | | 2.867 | | | | 07/15/19 | | | | 10,002,855 | |
| | MUFG Bank, Ltd. (3 Mo. LIBOR + 0.18%) | |
| | 10,000,000 | | | | 2.819 | | | | 02/27/20 | | | | 9,999,985 | |
| | Natixis-New York Branch (3 Mo. LIBOR + 0.18%) | |
| | 20,000,000 | | | | 2.847 | | | | 06/06/19 | | | | 20,009,631 | |
| | 10,000,000 | | | | 2.850 | | | | 06/10/19 | | | | 10,005,148 | |
| | Nordea Bank AB (3 Mo. LIBOR + 0.20%) | |
| | 7,000,000 | | | | 2.995 | | | | 04/05/19 | | | | 7,001,233 | |
| | Old Line Funding Corp. (1 Mo. LIBOR + 0.20%) | |
| | 20,000,000 | | | | 2.681 | (b) | | | 04/22/19 | | | | 20,005,640 | |
| | Old Line Funding Corp. (1 Mo. LIBOR + 0.37%) | |
| | 30,000,000 | | | | 2.884 | (b) | | | 03/04/19 | | | | 30,001,546 | |
| | Oversea-Chinese Banking Corp., Ltd. (3 Mo. LIBOR + 0.17%) | |
| | 20,000,000 | | | | 2.950 | (b) | | | 04/18/19 | | | | 20,004,530 | |
| | Oversea-Chinese Banking Corp., Ltd. (3 Mo. LIBOR + 0.21%) | |
| | 5,000,000 | | | | 2.989 | | | | 10/24/19 | | | | 5,006,631 | |
| | Royal Bank of Canada (3 Mo. LIBOR + 0.17%) | |
| | 17,000,000 | | | | 2.936 | | | | 06/07/19 | | | | 17,008,277 | |
| | Societe Generale (3 Mo. LIBOR + 0.16%) | |
| | 15,000,000 | | | | 2.939 | | | | 04/24/19 | | | | 15,004,153 | |
| | Societe Generale (3 Mo. LIBOR + 0.21%) | |
| | 25,000,000 | | | | 2.849 | | | | 03/03/20 | | | | 24,999,993 | |
| | Societe Generale (3 Mo. LIBOR + 0.20%) | |
| | 500,000 | | | | 2.933 | | | | 08/05/19 | | | | 500,464 | |
| | 20,000,000 | | | | 2.883 | (b) | | | 02/24/20 | | | | 19,999,926 | |
| | Standard Chartered Bank (3 Mo. LIBOR + 0.21%) | |
| | 15,175,000 | | | | 2.884 | | | | 06/10/19 | | | | 15,182,811 | |
| | Standard Chartered Bank (1 Mo. LIBOR + 0.20%) | |
| | 12,000,000 | | | | 2.680 | | | | 03/19/19 | | | | 12,001,524 | |
| | Standard Chartered Bank (3 Mo. LIBOR + 0.06%) | |
| | 35,000,000 | | | | 2.850 | | | | 03/21/19 | | | | 35,000,790 | |
| | Sumitomo Mitsui Banking Corp. (3 Mo. LIBOR + 0.10%) | |
| | 30,000,000 | | | | 2.897 | | | | 04/12/19 | | | | 30,002,928 | |
| | Sumitomo Mitsui Banking Corp. (3 Mo. LIBOR + 0.15%) | |
| | 10,000,000 | | | | 2.930 | | | | 04/18/19 | | | | 10,001,756 | |
| | Sumitomo Mitsui Banking Corp. (1 Mo. LIBOR + 0.19%) | |
| | 40,000,000 | | | | 2.674 | | | | 03/26/19 | | | | 40,006,431 | |
| | Sumitomo Mitsui Banking Corp. (3 Mo. LIBOR + 0.31%) | |
| | 15,000,000 | | | | 3.090 | | | | 10/18/19 | | | | 15,019,650 | |
| | |
| | |
| 30 | | The accompanying notes are an integral part of these financial statements. |
FINANCIAL SQUARE PRIME OBLIGATIONS FUND
| | | | | | | | | | | | | | |
| Principal Amount | | | Interest
Rate | | | Maturity
Date | | | Value | |
|
| Variable Rate Obligations(c) – (continued) | |
| | Sumitomo Mitsui Trust Bank Ltd. (3 Mo. LIBOR + 0.10%) | |
| $ | 20,000,000 | | | | 2.887 | % | | | 04/15/19 | | | $ | 20,002,106 | |
| | Svenska Handelsbanken AB (1 Mo. LIBOR + 0.31%) | |
| | 2,250,000 | | | | 2.800 | | | | 08/23/19 | | | | 2,251,978 | |
| | Svenska Handelsbanken AB (1 Mo. LIBOR + 0.34%) | |
| | 3,000,000 | | | | 2.821 | | | | 11/22/19 | | | | 3,003,967 | |
| | Svenska Handelsbanken AB (3 Mo. LIBOR + 0.20%) | |
| | 15,000,000 | | | | 2.997 | | | | 04/09/19 | | | | 15,003,428 | |
| Svenska Handelsbanken AB-New York Branch (3 Mo. LIBOR +
0.21%) |
|
| | 18,000,000 | | | | 3.014 | | | | 12/19/19 | | | | 18,025,242 | |
| | Swedbank AB (1 Mo. LIBOR + 0.29%) | |
| | 25,000,000 | | | | 2.780 | | | | 07/25/19 | | | | 25,013,615 | |
| | Toronto-Dominion Bank (The) (3 Mo. LIBOR + 0.11%) | |
| | 15,000,000 | | | | 2.934 | | | | 09/23/19 | | | | 15,005,862 | |
| | Toronto-Dominion Bank (The) (3 Mo. LIBOR + 0.17%) | |
| | 15,000,000 | | | | 2.943 | | | | 04/17/19 | | | | 15,002,937 | |
| | Toyota Finance Australia Limited (3 Mo. LIBOR + 0.08%) | |
| | 5,000,000 | | | | 2.863 | | | | 07/02/19 | | | | 5,001,823 | |
| | Toyota Motor Credit Corp. (3 Mo. LIBOR + 0.10%) | |
| | 9,650,000 | | | | 2.883 | | �� | | 01/10/20 | | | | 9,653,838 | |
| Toyota Motor Finance (Netherlands) B.V. (3 Mo. LIBOR +
0.09%) |
|
| | 13,580,000 | | | | 2.880 | | | | 03/18/19 | | | | 13,580,558 | |
| | U.S. Bank N.A. (3 Mo. LIBOR + 0.15%) | |
| | 20,000,000 | | | | 2.801 | | | | 05/24/19 | | | | 20,002,650 | |
| | UBS AG-London Branch (3 Mo. LIBOR + 0.12%) | |
| | 16,000,000 | | | | 2.871 | (b) | | | 06/05/19 | | | | 16,002,407 | |
| | UBS AG-London Branch (1 Mo. LIBOR + 0.25%) | |
| | 15,000,000 | | | | 2.759 | (b) | | | 10/01/19 | | | | 15,008,547 | |
| | Wells Fargo Bank N.A. (3 Mo. LIBOR + 0.21%) | |
| | 25,000,000 | | | | 2.990 | | | | 04/18/19 | | | | 25,008,442 | |
| | Wells Fargo Bank N.A. (1 Mo. LIBOR + 0.30%) | |
| | 20,000,000 | | | | 2.790 | | | | 07/23/19 | | | | 20,014,581 | |
| | Wells Fargo Bank N.A. (1 Mo. LIBOR + 0.39%) | |
| | 10,000,000 | | | | 2.903 | | | | 12/09/19 | | | | 10,018,128 | |
| | Wells Fargo Bank N.A. (3 Mo. LIBOR + 0.25%) | |
| | 7,000,000 | | | | 3.047 | | | | 04/05/19 | | | | 7,001,981 | |
| | Westpac Banking Corp. (3 Mo. LIBOR + 0.10%) | |
| | 20,000,000 | | | | 2.892 | (b) | | | 09/20/19 | | | | 20,007,477 | |
| | Westpac Banking Corp. (1 Mo. LIBOR + 0.28%) | |
| | 14,000,000 | | | | 2.773 | (b) | | | 05/30/19 | | | | 14,007,655 | |
| | Westpac Banking Corp. (3 Mo. LIBOR + 0.18%) | |
| | 25,000,000 | | | | 2.924 | (b) | | | 10/31/19 | | | | 25,024,268 | |
| | |
| | TOTAL VARIABLE RATE OBLIGATIONS | |
| | (Cost $1,158,494,332) | | | $ | 1,158,961,238 | |
| | |
| TOTAL INVESTMENTS BEFORE REPURCHASE
AGREEMENTS |
|
| | (Cost $3,396,770,543) | | | $ | 3,397,914,069 | |
| | |
| | |
|
| Repurchase Agreements(e) – 30.2% | |
| | BNP Paribas (OBFR + 0.20%) | |
| $ | 20,000,000 | | | | 2.600 | %(c) | | | 03/07/19 | | | $ | 20,000,000 | |
| | Maturity Value: $21,037,111 | |
| | Settlement Date: 03/24/17 | |
| Collateralized by mortgage-backed obligations, 4.640% to
7.740%, due 10/25/23 to 10/25/48, various asset-backed
obligation, 0.000%, due 01/22/30, various corporate security
issuers, 3.100% to 11.500%, due 05/13/19 to perpetual maturity
and various sovereign debt security issuer, 4.875%, due
01/22/21. The aggregate market value of the collateral,
including accrued interest, was $22,062,269. |
|
| | |
| | Citigroup Global Markets, Inc. (3 Mo. LIBOR + 0.43%) | |
| | 37,000,000 | | | | 3.209 | (c) | | | 06/03/19 | | | | 37,000,000 | |
| | Maturity Value: $37,900,375 | |
| | Settlement Date: 09/10/18 | |
| Collateralized by mortgage-backed obligations, 4.259% to
5.946%, due 10/15/21 to 05/15/46 and various asset-backed
obligations, 0.000% to 8.360%, due 08/15/21 to 11/23/52. The
aggregate market value of the collateral, including accrued
interest, was $40,700,002. |
|
| | |
| | HSBC Bank PLC | |
| | 60,000,000 | | | | 2.600 | | | | 03/01/19 | | | | 60,000,028 | |
| | Maturity Value: $60,004,333 | |
| Collateralized by an Exchange-Traded Fund, 0.000%, due
01/01/49 and various equity securities. The aggregate market
value of the collateral, including accrued interest, was
$64,800,001. |
|
| | |
| | HSBC Securities (USA), Inc. | |
| | 25,000,000 | | | | 2.500 | | | | 03/01/19 | | | | 24,999,943 | |
| | Maturity Value: $25,001,736 | |
| Collateralized by various corporate security issuers, 3.250% to
5.875%, due 08/11/20 to 05/02/47 and various sovereign debt
security issuers, 3.750% to 7.125%, due 01/29/26 to 01/23/45.
The aggregate market value of the collateral, including accrued
interest, was $26,251,824. |
|
| | 60,000,000 | | | | 2.600 | | | | 03/01/19 | | | | 60,000,028 | |
| | Maturity Value: $60,004,333 | |
| Collateralized by various corporate security issuers, 2.000% to
11.000%, due 08/01/20 to perpetual maturity. The aggregate
market value of the collateral, including accrued interest, was
$66,004,768. |
|
| | |
| | Joint Repurchase Agreement Account III | |
| | 1,100,000,000 | | | | 2.595 | | | | 03/01/19 | | | | 1,100,000,363 | |
| | Maturity Value: $1,100,079,289 | |
| | |
| | Merrill Lynch, Pierce, Fenner & Smith, Inc. | |
| | 25,000,000 | | | | 2.600 | | | | 03/01/19 | | | | 25,000,012 | |
| | Maturity Value: $25,001,806 | |
| Collateralized by mortgage-backed obligations, 3.184% to
9.240%, due 01/25/24 to 05/25/57 and various asset-backed
obligations, 2.350% to 3.869%, due 04/15/22 to 08/25/55. The
aggregate market value of the collateral, including accrued
interest, was $28,750,001. |
|
| | |
| | |
| The accompanying notes are an integral part of these financial statements. | | 31 |
FINANCIAL SQUARE PRIME OBLIGATIONS FUND
Schedule of Investments(continued)
February 28, 2019 (Unaudited)
| | | | | | | | | | | | | | |
Principal
Amount | | | Interest
Rate | | | Maturity
Date | | | Value | |
|
| Repurchase Agreements(e) – (continued) | |
| | Merrill Lynch, Pierce, Fenner & Smith, Inc. (OBFR + 0.30%) | |
| $ | 42,000,000 | | | | 2.700 | %(c) | | | 04/04/19 | | | $ | 42,000,000 | |
| | Maturity Value: $42,170,100 | |
| | Settlement Date: 02/14/19 | |
| Collateralized by mortgage-backed obligations, 3.184% to
9.240%, due 01/25/24 to 05/25/57 and various asset-backed
obligations, 2.060% to 3.869%, due 04/15/22 to 08/25/55. The
aggregate market value of the collateral, including accrued
interest, was $48,300,002. |
|
| | |
| | MUFG Securities Americas Inc. | |
| | 40,000,000 | | | | 2.570 | | | | 03/01/19 | | | | 39,999,986 | |
| | Maturity Value: $40,002,856 | |
| Collateralized by an Exchange-Traded Fund, 0.000%, due
01/01/49, various corporate security issuers, 0.125% to 5.500%,
due 08/15/19 to 02/01/33 and various equity securities. The
aggregate market value of the collateral, including accrued
interest, was $43,474,065. |
|
| | |
| | Wells Fargo Securities LLC (3 Mo. LIBOR + 0.20%) | |
| | 27,000,000 | | | | 2.890 | (c) | | | 05/10/19 | | | | 27,000,000 | |
| | Maturity Value: $27,260,100 | |
| | Settlement Date: 01/10/19 | |
| Collateralized by various asset-backed obligations, 1.750% to
8.151%, due 10/15/19 to 01/17/38. The aggregate market value
of the collateral, including accrued interest, was $29,699,998. |
|
| | |
| | TOTAL REPURCHASE AGREEMENTS | |
| | (Cost $1,436,000,000) | | | $ | 1,436,000,360 | |
| | |
| | TOTAL INVESTMENTS – 101.7% | |
| | (Cost $4,832,770,543) | | | $ | 4,833,914,429 | |
| | |
| LIABILITIES IN EXCESS OF
OTHER ASSETS – (1.7)% |
| | | (78,912,322 | ) |
| | |
| | NET ASSETS – 100.0% | | | $ | 4,755,002,107 | |
| | |
| | |
|
| The percentage shown for each investment category reflects the value of investments in that category as a percentage of net assets. |
| |
(a) | | All or a portion represents a forward commitment. |
| |
(b) | | Exempt from registration under Rule 144A of the Securities Act of 1933. |
| |
(c) | | Variable or floating rate security. Except for floating rate notes (for which final maturity is disclosed), maturity date disclosed is the next interest reset date. Interest rate disclosed is that which is in effect on February 28, 2019. |
| |
(d) | | Rate shown is that which is in effect on February 28, 2019. Certain variable rate securities are not based on a published reference rate and spread but are determined by the issuer or agent and are based on current market conditions. |
| |
(e) | | Unless noted, all repurchase agreements were entered into on February 28, 2019. Additional information on Joint Repurchase Agreement Account III appears on page 39. |
Interest rates represent either the stated coupon rate, annualized yield on date of purchase for discounted securities, or, for floating rate securities, the current reset rate, which is based upon current interest rate indices.
Maturity dates represent either the final legal maturity date on the security, the demand date for puttable securities, the date of the next interest rate reset for variable rate securities, or the prerefunded date for those types of securities.
| | |
|
Investment Abbreviations: |
GO | | —General Obligation |
LIBOR | | —London Interbank Offered Rates |
LIQ | | —Liquidity Agreement |
LOC | | —Letter of Credit |
OBFR | | —Overnight Bank Funding Rate |
RB | | —Revenue Bond |
RMKT | | —Remarketed |
SBPA | | —Standby Bond Purchase Agreement |
SPA | | —Stand-by Purchase Agreement |
T-Bill | | —Treasury Bill |
VRDN | | —Variable Rate Demand Notes |
|
| | |
| 32 | | The accompanying notes are an integral part of these financial statements. |
FINANCIAL SQUARE TREASURY INSTRUMENTS FUND
Schedule of Investments
February 28, 2019 (Unaudited)
| | | | | | | | | | | | | | |
Principal
Amount | | | Interest
Rate | | | Maturity
Date | | | Amortized
Cost | |
|
| U.S. Treasury Obligations – 111.4% | |
| | United States Treasury Bills | |
| $ | 1,500,000 | | | | 2.281 | % | | | 03/01/19 | | | $ | 1,500,000 | |
| | 194,000,000 | | | | 2.383 | | | | 03/05/19 | | | | 193,949,344 | |
| | 55,000,000 | | | | 2.391 | | | | 03/05/19 | | | | 54,985,608 | |
| | 250,800,000 | | | | 2.397 | | | | 03/05/19 | | | | 250,734,235 | |
| | 117,000,000 | | | | 2.401 | | | | 03/05/19 | | | | 116,969,255 | |
| | 171,800,000 | | | | 2.402 | | | | 03/05/19 | | | | 171,754,855 | |
| | 298,700,000 | | | | 2.406 | | | | 03/05/19 | | | | 298,621,342 | |
| | 1,789,900,000 | | | | 2.417 | | | | 03/05/19 | | | | 1,789,427,499 | |
| | 510,500,000 | | | | 2.418 | | | | 03/05/19 | | | | 510,365,001 | |
| | 443,600,000 | | | | 2.430 | | | | 03/05/19 | | | | 443,482,076 | |
| | 7,800,000 | | | | 2.394 | | | | 03/07/19 | | | | 7,796,932 | |
| | 1,000,000 | | | | 2.395 | | | | 03/07/19 | | | | 999,607 | |
| | 5,910,000 | | | | 2.412 | | | | 03/07/19 | | | | 5,907,670 | |
| | 7,200,000 | | | | 2.417 | | | | 03/07/19 | | | | 7,197,156 | |
| | 1,043,900,000 | | | | 2.423 | | | | 03/12/19 | | | | 1,043,139,258 | |
| | 6,620,400,000 | | | | 2.428 | | | | 03/12/19 | | | | 6,615,565,269 | |
| | 141,200,000 | | | | 2.342 | (a) | | | 03/14/19 | | | | 141,080,686 | |
| | 60,700,000 | | | | 2.397 | | | | 03/19/19 | | | | 60,628,374 | |
| | 122,600,000 | | | | 2.413 | | | | 03/19/19 | | | | 122,454,413 | |
| | 283,000,000 | | | | 2.418 | | | | 03/19/19 | | | | 282,663,230 | |
| | 5,015,000,000 | | | | 2.433 | | | | 03/19/19 | | | | 5,008,994,530 | |
| | 136,000,000 | | | | 2.386 | | | | 03/21/19 | | | | 135,822,444 | |
| | 285,000,000 | | | | 2.412 | | | | 03/26/19 | | | | 284,529,948 | |
| | 94,500,000 | | | | 2.417 | | | | 03/26/19 | | | | 94,343,813 | |
| | 565,800,000 | | | | 2.422 | | | | 03/26/19 | | | | 564,862,894 | |
| | 159,800,000 | | | | 2.423 | | | | 03/26/19 | | | | 159,535,331 | |
| | 4,688,000,000 | | | | 2.428 | | | | 03/26/19 | | | | 4,680,219,218 | |
| | 94,300,000 | | | | 2.410 | | | | 04/02/19 | | | | 94,101,341 | |
| | 302,500,000 | | | | 2.411 | | | | 04/02/19 | | | | 301,862,733 | |
| | 101,400,000 | | | | 2.415 | | | | 04/02/19 | | | | 101,185,933 | |
| | 303,600,000 | | | | 2.417 | | | | 04/02/19 | | | | 302,959,067 | |
| | 6,027,200,000 | | | | 2.448 | (a) | | | 04/02/19 | | | | 6,015,902,348 | |
| | 556,600,000 | | | | 2.440 | (a) | | | 04/11/19 | | | | 555,078,627 | |
| | 1,634,400,000 | | | | 2.546 | | | | 06/13/19 | | | | 1,622,690,430 | |
| | 705,610,000 | | | | 2.552 | | | | 06/20/19 | | | | 700,203,555 | |
| | 2,191,790,000 | | | | 2.546 | | | | 06/27/19 | | | | 2,173,973,179 | |
| | 1,356,000,000 | | | | 2.573 | | | | 07/05/19 | | | | 1,344,111,270 | |
| | 190,000,000 | | | | 2.491 | | | | 07/11/19 | | | | 188,307,100 | |
| | 72,500,000 | | | | 2.526 | | | | 07/11/19 | | | | 71,846,050 | |
| | 381,600,000 | | | | 2.536 | | | | 07/11/19 | | | | 378,143,976 | |
| | 45,300,000 | | | | 2.469 | | | | 07/25/19 | | | | 44,857,243 | |
| | 40,500,000 | | | | 2.472 | | | | 07/25/19 | | | | 40,104,158 | |
| | 956,200,000 | | | | 2.515 | | | | 08/01/19 | | | | 946,243,568 | |
| | 27,200,000 | | | | 2.487 | | | | 08/08/19 | | | | 26,906,844 | |
| | 16,100,000 | | | | 2.492 | | | | 08/08/19 | | | | 15,926,120 | |
| | 151,500,000 | | | | 2.494 | | | | 08/08/19 | | | | 149,863,800 | |
| | 341,300,000 | | | | 2.500 | | | | 08/08/19 | | | | 337,606,376 | |
| | 65,000,000 | | | | 2.501 | | | | 08/08/19 | | | | 64,296,267 | |
| | 65,000,000 | | | | 2.502 | | | | 08/08/19 | | | | 64,295,833 | |
| | 578,500,000 | | | | 2.505 | | | | 08/08/19 | | | | 572,226,488 | |
| | 56,500,000 | | | | 2.510 | | | | 08/22/19 | | | | 55,832,311 | |
| | 58,400,000 | | | | 2.515 | | | | 08/22/19 | | | | 57,708,447 | |
| | 169,500,000 | | | | 2.520 | | | | 08/22/19 | | | | 167,488,741 | |
| United States Treasury Floating Rate Note (3 Mo. U.S. T-Bill
MMY + 0.00%) |
|
| | 2,661,300,000 | | | | 2.420 | (b) | | | 01/31/20 | | | | 2,662,022,493 | |
| | |
| United States Treasury Floating Rate Note (3 Mo. U.S. T-Bill
MMY + 0.03%) |
|
| 106,200,000 | | | | 2.453 | %(b) | | | 04/30/20 | | | | 106,233,795 | |
| United States Treasury Floating Rate Note (3 Mo. U.S. T-Bill
MMY + 0.05%) |
|
| | 3,663,100,000 | | | | 2.468 | (b) | | | 10/31/19 | | | | 3,664,768,918 | |
| United States Treasury Floating Rate Note (3 Mo. U.S. T-Bill
MMY + 0.06%) |
|
| | 6,059,300,000 | | | | 2.480 | (b) | | | 07/31/19 | | | | 6,061,743,960 | |
| United States Treasury Floating Rate Note (3 Mo. U.S. T-Bill
MMY + 0.07%) |
|
| | 5,345,000,000 | | | | 2.490 | (b) | | | 04/30/19 | | | | 5,346,034,522 | |
| | United States Treasury Notes | |
| | 426,200,000 | | | | 1.000 | | | | 03/15/19 | | | | 425,966,922 | |
| | 95,900,000 | | | | 1.625 | | | | 03/31/19 | | | | 95,831,240 | |
| | 148,300,000 | | | | 1.250 | | | | 06/30/19 | | | | 147,643,689 | |
| | 285,300,000 | | | | 1.625 | | | | 06/30/19 | | | | 284,388,274 | |
| | 19,700,000 | | | | 0.750 | | | | 07/15/19 | | | | 19,565,079 | |
| | 37,300,000 | | | | 0.875 | | | | 07/31/19 | | | | 37,052,255 | |
| | 45,500,000 | | | | 0.750 | | | | 08/15/19 | | | | 45,113,534 | |
| | 210,000,000 | | | | 3.625 | | | | 08/15/19 | | | | 210,986,349 | |
| | 62,600,000 | | | | 8.125 | | | | 08/15/19 | | | | 64,187,081 | |
| | 52,200,000 | | | | 1.750 | | | | 09/30/19 | | | | 51,918,790 | |
| | |
| | TOTAL INVESTMENTS – 111.4% | | | $ | 58,664,708,694 | |
| | |
| LIABILITIES IN EXCESS OF
OTHER ASSETS – (11.4)% |
| | | (6,019,459,147 | ) |
| | |
| | NET ASSETS – 100.0% | | | $ | 52,645,249,547 | |
| | |
| | |
|
| The percentage shown for each investment category reflects the value of investments in that category as a percentage of net assets. |
| |
(a) | | All or a portion represents a forward commitment. |
| |
(b) | | Variable or floating rate security. Except for floating rate notes (for which final maturity is disclosed), maturity date disclosed is the next interest reset date. Interest rate disclosed is that which is in effect on February 28, 2019. |
Interest rates represent either the stated coupon rate, annualized yield on date of purchase for discounted securities, or, for floating rate securities, the current reset rate, which is based upon interest rate indices.
Maturity dates represent either the final legal maturity date on the security, the demand date for puttable securities, the date of the next interest rate reset for variable rate securities, or the prerefunded date for those types of securities.
| | |
|
Investment Abbreviations: |
MMY | | —Money Market Yield |
T-Bill | | —Treasury Bill |
|
| | |
| The accompanying notes are an integral part of these financial statements. | | 33 |
FINANCIAL SQUARE TREASURY OBLIGATIONS FUND
Schedule of Investments
February 28, 2019 (Unaudited)
| | | | | | | | | | | | | | |
Principal
Amount | | | Interest
Rate | | | Maturity
Date | | | Amortized
Cost | |
|
| U.S. Treasury Obligations – 38.5% | |
| | United States Treasury Bills | |
| $ | 68,600,000 | | | | 2.443 | %(a) | | | 04/02/19 | | | $ | 68,471,680 | |
| | 400,000,000 | | | | 2.440 | (a) | | | 04/11/19 | | | | 398,906,668 | |
| | 68,400,000 | | | | 2.546 | | | | 06/13/19 | | | | 67,909,952 | |
| | 227,690,000 | | | | 2.552 | | | | 06/20/19 | | | | 225,945,420 | |
| | 85,110,000 | | | | 2.546 | | | | 06/27/19 | | | | 84,418,150 | |
| | 609,900,000 | | | | 2.573 | | | | 07/05/19 | | | | 604,552,702 | |
| | 61,500,000 | | | | 2.536 | | | | 07/11/19 | | | | 60,943,015 | |
| | 188,800,000 | | | | 2.515 | | | | 08/01/19 | | | | 186,834,120 | |
| | 8,500,000 | | | | 2.487 | | | | 08/08/19 | | | | 8,408,389 | |
| | 5,000,000 | | | | 2.492 | | | | 08/08/19 | | | | 4,946,000 | |
| | 35,200,000 | | | | 2.494 | | | | 08/08/19 | | | | 34,819,840 | |
| | 78,700,000 | | | | 2.500 | | | | 08/08/19 | | | | 77,848,291 | |
| | 15,000,000 | | | | 2.501 | | | | 08/08/19 | | | | 14,837,600 | |
| | 15,000,000 | | | | 2.502 | | | | 08/08/19 | | | | 14,837,500 | |
| | 191,000,000 | | | | 2.505 | | | | 08/08/19 | | | | 188,928,711 | |
| | 17,600,000 | | | | 2.510 | | | | 08/22/19 | | | | 17,392,012 | |
| | 18,200,000 | | | | 2.515 | | | | 08/22/19 | | | | 17,984,482 | |
| | 52,800,000 | | | | 2.520 | | | | 08/22/19 | | | | 52,173,484 | |
| United States Treasury Floating Rate Note (3 Mo. U.S. T-Bill
MMY + 0.04%) |
|
| | 673,000,000 | | | | 2.463 | (b) | | | 07/31/20 | | | | 672,933,244 | |
| United States Treasury Floating Rate Note (3 Mo. U.S. T-Bill
MMY + 0.05%) |
|
| | 619,600,000 | | | | 2.468 | (b) | | | 10/31/19 | | | | 619,626,279 | |
| | 630,565,000 | | | | 2.465 | (b) | | | 10/31/20 | | | | 630,433,783 | |
| United States Treasury Floating Rate Note (3 Mo. U.S. T-Bill
MMY + 0.06%) |
|
| | 332,000,000 | | | | 2.480 | (b) | | | 07/31/19 | | | | 332,035,265 | |
| United States Treasury Floating Rate Note (3 Mo. U.S. T-Bill
MMY + 0.07%) |
|
| | 1,181,100,000 | | | | 2.490 | (b) | | | 04/30/19 | | | | 1,181,153,323 | |
| | United States Treasury Notes | |
| | 8,500,000 | | | | 1.125 | | | | 05/31/19 | | | | 8,469,963 | |
| | 66,400,000 | | | | 1.250 | | | | 06/30/19 | | | | 66,106,063 | |
| | 87,300,000 | | | | 1.625 | | | | 06/30/19 | | | | 87,021,019 | |
| | 5,600,000 | | | | 0.750 | | | | 07/15/19 | | | | 5,561,647 | |
| | 10,800,000 | | | | 0.875 | | | | 07/31/19 | | | | 10,728,267 | |
| | 14,000,000 | | | | 0.750 | | | | 08/15/19 | | | | 13,881,087 | |
| | 64,200,000 | | | | 3.625 | | | | 08/15/19 | | | | 64,501,605 | |
| | 18,300,000 | | | | 8.125 | | | | 08/15/19 | | | | 18,763,955 | |
| | 15,900,000 | | | | 1.750 | | | | 09/30/19 | | | | 15,814,344 | |
| | |
| TOTAL INVESTMENTS BEFORE
REPURCHASE AGREEMENTS |
| | $ | 5,857,187,860 | |
| | |
| | |
|
| Repurchase Agreements-Unaffiliated Issuers(c) – 60.6% | |
| | Bank of Montreal | |
| $ | 300,000,000 | | | | 2.450 | %(d) | | | 03/07/19 | | | $ | 300,000,000 | |
| | Maturity Value: $301,735,418 | |
| | Settlement Date: 02/05/19 | |
| Collateralized by U.S. Treasury Bills, 0.000%, due 04/25/19 to
11/07/19, a U.S. Treasury Bond, 3.000%, due 05/15/45, a U.S.
Treasury Floating Rate Note, 2.420%, due 01/31/20, U.S.
Treasury Notes, 1.125% to 3.500%, due 05/15/20 to 02/15/29
and a U.S. Treasury Principal-Only Stripped Security, 0.000%,
due 02/15/46. The aggregate market value of the collateral,
including accrued interest, was $306,000,074. |
|
| | |
|
| Repurchase Agreements-Unaffiliated Issuers(c) – (continued) | |
| | BNP Paribas | |
| 100,000,000 | | | | 2.590 | % | | | 03/01/19 | | | | 100,000,000 | |
| | Maturity Value: $100,007,194 | |
| Collateralized by a U.S. Treasury Bond, 2.500%, due 05/15/46, a
U.S. Treasury Inflation-Indexed Bond, 2.125%, due 02/15/41
and U.S. Treasury Notes, 1.625% to 2.000%, due 03/15/20 to
02/15/23. The aggregate market value of the collateral,
including accrued interest, was $102,000,072. |
|
| | 320,000,000 | | | | 2.480 | (d) | | | 03/07/19 | | | | 320,000,000 | |
| | Maturity Value: $323,968,001 | |
| | Settlement Date: 02/27/19 | |
| Collateralized by U.S. Treasury Bills, 0.000%, due 03/28/19 to
06/20/19, U.S. Treasury Bonds, 3.125% to 7.875%, due
02/15/21 to 05/15/44, U.S. Treasury Inflation-Indexed Bonds,
1.375% to 2.500%, due 01/15/29 to 02/15/44, a U.S. Treasury
Inflation-Indexed Note, 0.625%, due 07/15/21, U.S. Treasury
Interest-Only Stripped Securities, 0.000%, due 05/15/19 to
02/15/40 and U.S. Treasury Notes, 1.875% to 3.625%, due
05/15/20 to 11/30/25. The aggregate market value of the
collateral, including accrued interest, was $326,400,073. |
|
| | 350,000,000 | | | | 2.480 | (d) | | | 03/07/19 | | | | 350,000,000 | |
| | Maturity Value: $354,340,001 | |
| | Settlement Date: 01/04/19 | |
| Collateralized by U.S. Treasury Bills, 0.000%, due 07/11/19 to
01/02/20, U.S. Treasury Bonds, 2.250% to 7.500%, due
11/15/24 to 02/15/48, U.S. Treasury Inflation-Indexed Bonds,
0.750% to 2.375%, due 01/15/26 to 02/15/47, U.S. Treasury
Inflation-Indexed Notes, 0.500% to 0.625%, due 01/15/26 to
01/15/28, a U.S. Treasury Interest-Only Stripped Security,
0.000%, due 08/15/21 and U.S. Treasury Notes, 1.125% to
2.875%, due 03/31/20 to 09/30/24. The aggregate market value
of the collateral, including accrued interest, was $357,000,053. |
|
| | |
| | BNP Paribas (Overnight Treasury + 0.02%) | |
| | 700,000,000 | | | | 2.610 | (b)(d) | | | 03/01/19 | | | | 700,000,000 | |
| | Maturity Value: $756,637,000 | |
| | Settlement Date: 02/23/16 | |
| Collateralized by U.S. Treasury Bonds, 2.250% to 8.125%, due
08/15/19 to 08/15/46, a U.S. Treasury Inflation-Indexed Note,
0.750%, due 07/15/28, U.S. Treasury Interest-Only Stripped
Securities, 0.000%, due 05/15/19 to 05/15/48, U.S. Treasury
Notes, 1.375% to 2.750%, due 03/31/20 to 11/30/23 and U.S.
Treasury Principal-Only Stripped Securities, 0.000%, due
11/15/22 to 02/15/45. The aggregate market value of the
collateral, including accrued interest, was $714,000,051. |
|
| | |
| | CIBC Wood Gundy Securities | |
| | 300,000,000 | | | | 2.460 | %(d) | | | 03/07/19 | | | | 300,000,000 | |
| | Maturity Value: $301,926,999 | |
| | Settlement Date: 01/18/19 | |
| Collateralized by U.S. Treasury Bonds, 3.000% to 3.125%, due
05/15/45 to 05/15/48, a U.S. Treasury Inflation-Indexed Bond,
2.375%, due 01/15/25, U.S. Treasury Inflation-Indexed Notes,
0.125% to 0.750%, due 04/15/21 to 07/15/28 and U.S. Treasury
Notes, 1.625% to 3.125%, due 09/30/20 to 11/15/28. The
aggregate market value of the collateral, including accrued
interest, was $306,000,017. |
|
| | |
| | |
| 34 | | The accompanying notes are an integral part of these financial statements. |
FINANCIAL SQUARE TREASURY OBLIGATIONS FUND
| | | | | | | | | | | | | | |
Principal
Amount | | | Interest
Rate | | | Maturity
Date | | | Amortized
Cost | |
|
| Repurchase Agreements-Unaffiliated Issuers(c) – (continued) | |
| | Credit Agricole Corporate and Investment Bank | |
| $ | 100,000,000 | | | | 2.530 | % | | | 03/01/19 | | | $ | 100,000,000 | |
| | Maturity Value: $100,007,028 | |
| Collateralized by U.S. Treasury Bills, 0.000%, due 06/06/19 to
02/27/20, U.S. Treasury Bonds, 4.625% to 7.250%, due
08/15/22 to 02/15/40, U.S. Treasury Inflation-Indexed Notes,
0.125% to 0.375%, due 04/15/19 to 07/15/27 and U.S. Treasury
Notes, 0.875% to 2.125%, due 09/15/19 to 10/31/22. The
aggregate market value of the collateral, including accrued
interest, was $102,000,049. |
|
| | |
| | Daiwa Capital Markets America, Inc. | |
| | 500,000,000 | | | | 2.580 | | | | 03/01/19 | | | | 500,000,000 | |
| | Maturity Value: $500,035,833 | |
| Collateralized by a U.S. Treasury Note, 2.875%, due 11/30/23.
The market value of the collateral, including accrued interest,
was $510,000,000. |
|
| | |
| | Fixed Income Clearing Corp. | |
| | 100,000,000 | | | | 2.400 | | | | 03/01/19 | | | | 100,000,000 | |
| | Maturity Value: $100,006,667 | |
| Collateralized by a U.S. Treasury Bill, 0.000%, due 02/27/20. The
market value of the collateral, including accrued interest,
was $102,000,002. |
|
| | 1,500,000,000 | | | | 2.550 | | | | 03/01/19 | | | | 1,500,000,000 | |
| | Maturity Value: $1,500,106,250 | |
| Collateralized by U.S. Treasury Inflation-Indexed Bonds, 0.750%
to 2.000%, due 01/15/26 to 02/15/45 and U.S. Treasury Notes,
1.000% to 2.875%, due 09/30/19 to 11/30/25. The aggregate
market value of the collateral, including accrued interest,
was $1,530,000,051. |
|
| | |
| | HSBC Bank PLC | |
| | 1,700,000,000 | | | | 2.570 | | | | 03/01/19 | | | | 1,700,000,000 | |
| | Maturity Value: $1,700,121,361 | |
| Collateralized by U.S. Treasury Bonds, 3.125% to 7.125%, due
02/15/23 to 11/15/48 and U.S. Treasury Notes, 0.125% to
3.500%, due 05/15/19 to 02/15/27. The aggregate market value
of the collateral, including accrued interest, was
$1,734,000,035. |
|
| | |
| | ING Financial Markets LLC | |
| | 350,000,000 | | | | 2.560 | | | | 03/01/19 | | | | 350,000,000 | |
| | Maturity Value: $350,024,889 | |
| Collateralized by U.S. Treasury Bills, 0.000%, due 04/25/19 to
01/02/20, U.S. Treasury Bonds, 2.750% to 3.125%, due
11/15/42 to 08/15/44, U.S. Treasury Inflation-Indexed Notes,
0.125% to 1.250%, due 04/15/19 to 07/15/20 and U.S. Treasury
Notes, 1.000% to 2.750%, due 04/30/19 to 02/28/26. The
aggregate market value of the collateral, including accrued
interest, was $357,000,084. |
|
| | |
| | J.P. Morgan Securities LLC | |
| | 153,000,000 | | | | 2.580 | | | | 03/01/19 | | | | 153,000,000 | |
| | Maturity Value: $153,010,965 | |
| Collateralized by U.S. Treasury Notes, 1.625% to 2.500%, due
06/30/19 to 07/31/24. The aggregate market value of the
collateral, including accrued interest, was $156,071,273. |
|
| | |
|
| Repurchase Agreements-Unaffiliated Issuers(c) – (continued) | |
| | Joint Repurchase Agreement Account I | |
| 1,000,000,000 | | | | 2.589 | | | | 03/01/19 | | | | 1,000,000,000 | |
| | Maturity Value: $1,000,071,919 | |
| | |
| | Merrill Lynch, Pierce, Fenner & Smith, Inc. | |
| | 100,000,000 | | | | 2.500 | | | | 03/01/19 | | | | 100,000,000 | |
| | Maturity Value: $100,006,944 | |
| Collateralized by a U.S. Treasury Inflation-Indexed Bond,
2.000%, due 01/15/26 and U.S. Treasury Notes, 1.125% to
2.250%, due 02/28/21 to 12/31/23. The aggregate market value
of the collateral, including accrued interest, was $102,000,073. |
|
| | 100,000,000 | | | | 2.550 | | | | 03/01/19 | | | | 100,000,000 | |
| | Maturity Value: $100,007,083 | |
| Collateralized by a U.S. Treasury Inflation-Indexed Bond,
2.375%, due 01/15/25 and a U.S. Treasury Note, 2.375%, due
04/30/20. The aggregate market value of the collateral,
including accrued interest, was $102,000,050. |
|
| | |
| | MUFG Securities Americas Inc. | |
| | 250,000,000 | | | | 2.550 | | | | 03/01/19 | | | | 250,000,000 | |
| | Maturity Value: $250,017,708 | |
| Collateralized by a U.S. Treasury Inflation-Indexed Note, 0.125%,
due 04/15/20 and U.S. Treasury Notes, 1.375% to 3.500%, due
05/15/20 to 02/15/22. The aggregate market value of the
collateral, including accrued interest, was $255,000,036. |
|
| | |
| | MUFG Securities Americas Inc. (Overnight Treasury + 0.02%) | |
| | 225,000,000 | | | | 2.570 | (b) | | | 03/07/19 | | | | 225,000,000 | |
| | Maturity Value: $225,979,813 | |
| | Settlement Date: 01/10/19 | |
| Collateralized by a U.S. Treasury Inflation-Indexed Note, 0.125%,
due 04/15/20 and U.S. Treasury Notes, 1.125% to 2.875%, due
06/30/20 to 08/15/28. The aggregate market value of the
collateral, including accrued interest, was $229,500,048. |
|
| | |
| | Natixis-New York Branch | |
| | 500,000,000 | | | | 2.470 | (d) | | | 03/07/19 | | | | 500,000,000 | |
| | Maturity Value: $503,156,111 | |
| Collateralized by U.S. Treasury Bills, 0.000%, due 08/29/19 to
02/27/20, U.S. Treasury Bonds, 2.500% to 3.875%, due
08/15/40 to 11/15/48, U.S. Treasury Inflation-Indexed Bonds,
0.750% to 2.375%, due 01/15/25 to 02/15/42, a U.S. Treasury
Inflation-Indexed Note, 0.125%, due 01/15/23 and U.S.
Treasury Notes, 1.125% to 2.875%, due 04/30/19 to 05/15/27.
The aggregate market value of the collateral, including accrued
interest, was $510,000,084. |
|
| | |
| | Norinchukin Bank | |
| | 35,000,000 | | | | 2.490 | | | | 03/07/19 | | | | 35,000,000 | |
| | Maturity Value: $35,275,975 | |
| | Settlement Date: 11/13/18 | |
| Collateralized by U.S. Treasury Inflation-Indexed Notes, 0.375%
to 1.125%, due 01/15/21 to 01/15/27 and a U.S. Treasury Note,
2.000%, due 11/15/26. The aggregate market value of the
collateral, including accrued interest, was $35,700,006. |
|
| | 110,000,000 | | | | 2.520 | | | | 03/15/19 | | | | 110,000,000 | |
| | Maturity Value: $110,708,400 | |
| | Settlement Date: 12/13/18 | |
| Collateralized by a U.S. Treasury Bond, 6.125%, due 08/15/29,
U.S. Treasury Inflation-Indexed Notes, 0.375% to 1.125%, due
01/15/21 to 01/15/27 and U.S. Treasury Notes, 2.000% to
3.375%, due 11/15/19 to 11/15/26. The aggregate market value
of the collateral, including accrued interest, was $112,200,056. |
|
| | |
| | |
| The accompanying notes are an integral part of these financial statements. | | 35 |
FINANCIAL SQUARE TREASURY OBLIGATIONS FUND
Schedule of Investments(continued)
February 28, 2019 (Unaudited)
| | | | | | | | | | | | | | |
Principal
Amount | | | Interest
Rate | | | Maturity
Date | | | Amortized
Cost | |
|
| Repurchase Agreements-Unaffiliated Issuers(c) – (continued) | |
| | Prudential Insurance Company of America (The) | |
| $ | 7,290,000 | | | | 2.580 | % | | | 03/01/19 | | | $ | 7,290,000 | |
| | Maturity Value: $7,290,522 | |
| Collateralized by a U.S. Treasury Interest-Only Stripped Security,
0.000%, due 05/15/26. The market value of the collateral,
including accrued interest, was $7,435,800. |
|
| | 9,432,500 | | | | 2.580 | | | | 03/01/19 | | | | 9,432,500 | |
| | Maturity Value: $9,433,176 | |
| Collateralized by a U.S. Treasury Principal-Only Stripped
Security, 0.000%, due 11/15/45. The market value of the
collateral, including accrued interest, was $9,621,150. |
|
| | 9,973,750 | | | | 2.580 | | | | 03/01/19 | | | | 9,973,750 | |
| | Maturity Value: $9,974,465 | |
| Collateralized by a U.S. Treasury Bond, 6.625%, due 02/15/27.
The market value of the collateral, including accrued interest,
was $10,173,225. |
|
| | 11,362,500 | | | | 2.580 | | | | 03/01/19 | | | | 11,362,500 | |
| | Maturity Value: $11,363,314 | |
| Collateralized by a U.S. Treasury Bond, 7.250%, due 08/15/22.
The market value of the collateral, including accrued interest,
was $11,589,750. |
|
| | 14,981,250 | | | | 2.580 | | | | 03/01/19 | | | | 14,981,250 | |
| | Maturity Value: $14,982,324 | |
| Collateralized by a U.S. Treasury Note, 2.750%, due 09/15/21.
The market value of the collateral, including accrued interest,
was $15,280,875. |
|
| | 21,092,500 | | | | 2.580 | | | | 03/01/19 | | | | 21,092,500 | |
| | Maturity Value: $21,094,012 | |
| Collateralized by a U.S. Treasury Bond, 2.875%, due 05/15/43.
The market value of the collateral, including accrued interest,
was $21,514,350. |
|
| | 44,156,250 | | | | 2.580 | | | | 03/01/19 | | | | 44,156,250 | |
| | Maturity Value: $44,159,414 | |
| Collateralized by a U.S. Treasury Interest-Only Stripped Security,
0.000%, due 05/15/36. The market value of the collateral,
including accrued interest, was $45,039,375. |
|
| | 88,425,000 | | | | 2.580 | | | | 03/01/19 | | | | 88,425,000 | |
| | Maturity Value: $88,431,337 | |
| Collateralized by a U.S. Treasury Floating Rate Note, 2.463%,
due 07/31/20. The market value of the collateral, including
accrued interest, was $90,193,500. |
|
| | |
| | Wells Fargo Securities LLC | |
| | 200,000,000 | | | | 2.520 | | | | 03/01/19 | | | | 200,000,000 | |
| | Maturity Value: $200,014,000 | |
| Collateralized by U.S. Treasury Bills, 0.000%, due 05/09/19 to
01/02/20, U.S. Treasury Bonds, 4.375% to 6.250%, due
05/15/30 to 05/15/41, a U.S. Treasury Inflation-Indexed Note,
0.625%, due 07/15/21 and U.S. Treasury Notes, 0.875% to
2.625%, due 04/30/19 to 06/30/23. The aggregate market value
of the collateral, including accrued interest, was $204,000,004. |
|
| | |
| TOTAL REPURCHASE AGREEMENTS-
UNAFFILIATED ISSUERS |
| | $ | 9,199,713,750 | |
| | |
| | |
|
| Repurchase Agreements-Affiliated Issuers(c) – 1.0% | |
| | Goldman Sachs & Co. | |
| 150,000,000 | | | | 2.200 | | | | 03/01/19 | | | | 150,000,000 | |
| | Maturity Value: $150,009,167 | |
| Collateralized by a U.S. Treasury Inflation-Indexed Note, 0.125%,
due 04/15/19, U.S. Treasury Interest-Only Stripped Securities,
0.000%, due 02/15/44 to 08/15/47, U.S. Treasury Notes,
1.250% to 3.125%, due 05/15/19 to 02/29/20 and U.S. Treasury
Principal-Only Stripped Securities, 0.000%, due 02/15/26 to
11/15/44. The aggregate market value of the collateral,
including accrued interest, was $153,000,001. |
|
| | |
| | TOTAL INVESTMENTS – 100.1% | | | $ | 15,206,901,610 | |
| | |
| LIABILITIES IN EXCESS OF
OTHER ASSETS – (0.1)% |
| | | (17,353,918 | ) |
| | |
| | NET ASSETS – 100.0% | | | $ | 15,189,547,692 | |
| | |
| | |
|
| The percentage shown for each investment category reflects the value of investments in that category as a percentage of net assets. |
| |
(a) | | All or a portion represents a forward commitment. |
| |
(b) | | Variable or floating rate security. Except for floating rate notes (for which final maturity is disclosed), maturity date disclosed is the next interest reset date. Interest rate disclosed is that which is in effect on February 28, 2019. |
| |
(c) | | Unless noted, all repurchase agreements were entered into on February 28, 2019. Additional information on Joint Repurchase Agreement Account I appears on page 38. |
| |
(d) | | The instrument is subject to a demand feature. |
|
| Interest rates represent either the stated coupon rate, annualized yield on date of purchase for discounted securities, or, for floating rate securities, the current reset rate, which is based upon current interest rate indices. |
|
| Maturity dates represent either the final legal maturity date on the security, the demand date for puttable securities, the date of the next interest rate reset for variable rate securities, or the prerefunded date for those types of securities. |
| | |
|
Investment Abbreviations: |
MMY | | —Money Market Yield |
T-Bill | | —Treasury Bill |
|
| | |
| 36 | | The accompanying notes are an integral part of these financial statements. |
FINANCIAL SQUARE TREASURY SOLUTIONS FUND
Schedule of Investments
February 28, 2019 (Unaudited)
| | | | | | | | | | | | | | |
Principal
Amount | | | Interest
Rate | | | Maturity
Date | | | Amortized
Cost | |
|
| U.S. Treasury Obligations – 115.1% | |
| | United States Treasury Bills | |
| $ | 22,500,000 | | | | 2.281 | % | | | 03/01/19 | | | $ | 22,500,000 | |
| | 99,400,000 | | | | 2.403 | | | | 03/01/19 | | | | 99,400,000 | |
| | 22,000,000 | | | | 2.383 | | | | 03/05/19 | | | | 21,994,256 | |
| | 4,000,000 | | | | 2.397 | | | | 03/05/19 | | | | 3,998,951 | |
| | 12,000,000 | | | | 2.401 | | | | 03/05/19 | | | | 11,996,847 | |
| | 52,900,000 | | | | 2.402 | | | | 03/05/19 | | | | 52,886,099 | |
| | 31,700,000 | | | | 2.406 | | | | 03/05/19 | | | | 31,691,652 | |
| | 348,400,000 | | | | 2.417 | | | | 03/05/19 | | | | 348,308,033 | |
| | 39,500,000 | | | | 2.418 | | | | 03/05/19 | | | | 39,489,554 | |
| | 350,000,000 | | | | 2.428 | | | | 03/05/19 | | | | 349,907,056 | |
| | 64,100,000 | | | | 2.430 | | | | 03/05/19 | | | | 64,082,960 | |
| | 1,000,000 | | | | 2.394 | | | | 03/07/19 | | | | 999,607 | |
| | 11,200,000 | | | | 2.412 | | | | 03/12/19 | | | | 11,191,872 | |
| | 88,400,000 | | | | 2.418 | | | | 03/12/19 | | | | 88,335,714 | |
| | 177,800,000 | | | | 2.423 | | | | 03/12/19 | | | | 177,670,428 | |
| | 191,800,000 | | | | 2.428 | | | | 03/12/19 | | | | 191,659,933 | |
| | 8,600,000 | | | | 2.342 | (a) | | | 03/14/19 | | | | 8,592,733 | |
| | 48,900,000 | | | | 2.375 | | | | 03/19/19 | | | | 48,842,787 | |
| | 2,900,000 | | | | 2.413 | | | | 03/19/19 | | | | 2,896,556 | |
| | 47,500,000 | | | | 2.418 | | | | 03/19/19 | | | | 47,443,475 | |
| | 985,000,000 | | | | 2.433 | | | | 03/19/19 | | | | 983,820,461 | |
| | 30,000,000 | | | | 2.386 | | | | 03/21/19 | | | | 29,960,833 | |
| | 45,000,000 | | | | 2.412 | | | | 03/26/19 | | | | 44,925,781 | |
| | 75,400,000 | | | | 2.422 | | | | 03/26/19 | | | | 75,275,119 | |
| | 10,000,000 | | | | 2.423 | | | | 03/26/19 | | | | 9,983,438 | |
| | 1,250,000,000 | | | | 2.428 | | | | 03/26/19 | | | | 1,247,925,346 | |
| | 1,500,000 | | | | 2.406 | | | | 04/02/19 | | | | 1,496,847 | |
| | 24,000,000 | | | | 2.410 | | | | 04/02/19 | | | | 23,949,440 | |
| | 58,600,000 | | | | 2.411 | | | | 04/02/19 | | | | 58,476,549 | |
| | 16,500,000 | | | | 2.415 | | | | 04/02/19 | | | | 16,465,167 | |
| | 45,300,000 | | | | 2.417 | | | | 04/02/19 | | | | 45,204,367 | |
| | 1,248,200,000 | | | | 2.448 | (a) | | | 04/02/19 | | | | 1,245,860,318 | |
| | 86,300,000 | | | | 2.440 | (a) | | | 04/11/19 | | | | 86,064,113 | |
| | 100,000,000 | | | | 2.441 | (a) | | | 04/11/19 | | | | 99,726,610 | |
| | 281,300,000 | | | | 2.546 | | | | 06/13/19 | | | | 279,284,641 | |
| | 117,900,000 | | | | 2.552 | | | | 06/20/19 | | | | 116,996,640 | |
| | 486,900,000 | | | | 2.546 | | | | 06/27/19 | | | | 482,942,043 | |
| | 139,100,000 | | | | 2.573 | | | | 07/05/19 | | | | 137,880,441 | |
| | 32,900,000 | | | | 2.491 | | | | 07/11/19 | | | | 32,606,861 | |
| | 7,400,000 | | | | 2.526 | | | | 07/11/19 | | | | 7,333,252 | |
| | 60,600,000 | | | | 2.536 | | | | 07/11/19 | | | | 60,051,166 | |
| | 7,800,000 | | | | 2.469 | | | | 07/25/19 | | | | 7,723,764 | |
| | 7,000,000 | | | | 2.472 | | | | 07/25/19 | | | | 6,931,583 | |
| | 165,800,000 | | | | 2.515 | | | | 08/01/19 | | | | 164,073,608 | |
| | 4,500,000 | | | | 2.487 | | | | 08/08/19 | | | | 4,451,500 | |
| | 2,700,000 | | | | 2.492 | | | | 08/08/19 | | | | 2,670,840 | |
| | 24,300,000 | | | | 2.494 | | | | 08/08/19 | | | | 24,037,560 | |
| | 58,400,000 | | | | 2.500 | | | | 08/08/19 | | | | 57,767,982 | |
| | 11,100,000 | | | | 2.501 | | | | 08/08/19 | | | | 10,979,824 | |
| | 11,100,000 | | | | 2.502 | | | | 08/08/19 | | | | 10,979,750 | |
| | 91,100,000 | | | | 2.505 | | | | 08/08/19 | | | | 90,112,071 | |
| | 9,400,000 | | | | 2.510 | | | | 08/22/19 | | | | 9,288,915 | |
| | 9,600,000 | | | | 2.515 | | | | 08/22/19 | | | | 9,486,320 | |
| | 28,100,000 | | | | 2.520 | | | | 08/22/19 | | | | 27,766,570 | |
| | |
|
| U.S. Treasury Obligations – (continued) | |
| United States Treasury Floating Rate Note (3 Mo. U.S. T-Bill
MMY + 0.00%) |
|
| 327,800,000 | | | | 2.420 | %(b) | | | 01/31/20 | | | | 327,885,310 | |
| United States Treasury Floating Rate Note (3 Mo. U.S. T-Bill
MMY + 0.03%) |
|
| | 17,600,000 | | | | 2.453 | (b) | | | 04/30/20 | | | | 17,605,601 | |
| United States Treasury Floating Rate Note (3 Mo. U.S. T-Bill
MMY + 0.05%) |
|
| | 496,500,000 | | | | 2.468 | (b) | | | 10/31/19 | | | | 496,752,018 | |
| United States Treasury Floating Rate Note (3 Mo. U.S. T-Bill
MMY + 0.06%) |
|
| | 935,737,000 | | | | 2.480 | (b) | | | 07/31/19 | | | | 936,105,360 | |
| United States Treasury Floating Rate Note (3 Mo. U.S. T-Bill
MMY + 0.07%) |
|
| | 1,110,600,000 | | | | 2.490 | (b) | | | 04/30/19 | | | | 1,110,756,484 | |
| | United States Treasury Notes | |
| | 26,500,000 | | | | 1.000 | | | | 03/15/19 | | | | 26,485,524 | |
| | 24,300,000 | | | | 1.625 | | | | 03/31/19 | | | | 24,282,577 | |
| | 37,700,000 | | | | 1.250 | | | | 06/30/19 | | | | 37,533,109 | |
| | 49,400,000 | | | | 1.625 | | | | 06/30/19 | | | | 49,242,133 | |
| | 3,400,000 | | | | 0.750 | | | | 07/15/19 | | | | 3,376,714 | |
| | 6,300,000 | | | | 0.875 | | | | 07/31/19 | | | | 6,258,156 | |
| | 7,900,000 | | | | 0.750 | | | | 08/15/19 | | | | 7,832,899 | |
| | 36,300,000 | | | | 3.625 | | | | 08/15/19 | | | | 36,470,596 | |
| | 10,700,000 | | | | 8.125 | | | | 08/15/19 | | | | 10,971,274 | |
| | 8,900,000 | | | | 1.750 | | | | 09/30/19 | | | | 8,852,054 | |
| | |
| | TOTAL INVESTMENTS – 115.1% | | | $ | 10,236,798,042 | |
| | |
| LIABILITIES IN EXCESS OF
OTHER ASSETS – (15.1)% |
| | | (1,343,908,490 | ) |
| | |
| | NET ASSETS – 100.0% | | | $ | 8,892,889,552 | |
| | |
| | |
|
| The percentage shown for each investment category reflects the value of investments in that category as a percentage of net assets. |
| |
(a) | | All or a portion represents a forward commitment. |
| |
(b) | | Variable or floating rate security. Except for floating rate notes (for which final maturity is disclosed), maturity date disclosed is the next interest reset date. Interest rate disclosed is that which is in effect on February 28, 2019. |
|
| Interest rates represent either the stated coupon rate, annualized yield on date of purchase for discounted securities, or, for floating rate securities, the current reset rate, which is based upon current interest rate indices. |
|
| Maturity dates represent either the final legal maturity date on the security, the demand date for puttable securities, the date of the next interest rate reset for variable rate securities, or the prerefunded date for those types of securities. |
| | |
|
Investment Abbreviations: |
MMY | | —Money Market Yield |
T-Bill | | —Treasury Bill |
|
| | |
| The accompanying notes are an integral part of these financial statements. | | 37 |
GOLDMAN SACHS FUNDS — FINANCIAL SQUARE FUNDS
Schedule of Investments
February 28, 2019 (Unaudited)
|
| ADDITIONAL INVESTMENT INFORMATION |
JOINT REPURCHASE AGREEMENT ACCOUNT I — At February 28, 2019, certain Funds had undivided interests in the Joint Repurchase Agreement Account I with a maturity date of March 1, 2019, as follows:
| | | | | | | | | | | | |
| Fund | | Principal
Amount | | | Maturity
Value | | | Collateral Value
Allocation | |
Government | | $ | 1,200,000,000 | | | | $1,200,086,303 | | | $ | 1,224,201,872 | |
Treasury Obligations | | | 1,000,000,000 | | | | 1,000,071,919 | | | | 1,020,168,227 | |
REPURCHASE AGREEMENTS — At February 28, 2019, the Principal Amounts of certain Funds’ interests in the Joint Repurchase Agreement Account I were as follows:
| | | | | | | | | | | | |
| Counterparty | | Interest
Rate | | | Government | | | Treasury
Obligations | |
Bank of Nova Scotia (The) | | | 2.600% | | | $ | 109,090,909 | | | $ | 90,909,091 | |
BNP Paribus | | | 2.590 | | | | 654,545,455 | | | | 545,454,545 | |
Citigroup Global Markets, Inc. | | | 2.600 | | | | 109,090,909 | | | | 90,909,091 | |
Credit Agricole Corporate and Investment Bank | | | 2.580 | | | | 327,272,727 | | | | 272,727,273 | |
| | | |
| TOTAL | | | | | | $ | 1,200,000,000 | | | $ | 1,000,000,000 | |
At February 28, 2019, the Joint Repurchase Agreement Account I was fully collateralized by:
| | | | | | | | |
| Issuer | | Interest Rates | | | Maturity Dates | |
U.S. Treasury Bills | | | 0.000 | % | | | 03/05/19 to 02/27/20 | |
U.S. Treasury Bonds | | | 2.250 to 7.875 | | | | 02/15/21 to 08/15/49 | |
U.S. Treasury Floating Rate Notes | | | 2.463 | | | | 07/31/20 | |
U.S. Treasury Inflation-Indexed Bonds | | | 0.875 to 3.625 | | | | 04/15/28 to 02/15/47 | |
U.S. Treasury Inflation-Indexed Notes | | | 0.125 to 0.625 | | | | 04/15/21 to 07/15/27 | |
U.S. Treasury Interest-Only Stripped Securities | | | 0.000 | | | | 05/15/21 to 05/15/48 | |
U.S. Treasury Notes | | | 0.875 to 2.875 | | | | 09/15/19 to 08/15/28 | |
U.S. Treasury Principal-Only Stripped Securities | | | 0.000 | | | | 11/15/22 to 05/15/47 | |
| | |
| 38 | | The accompanying notes are an integral part of these financial statements. |
GOLDMAN SACHS FUNDS — FINANCIAL SQUARE FUNDS
|
| ADDITIONAL INVESTMENT INFORMATION (continued) |
JOINT REPURCHASE AGREEMENT ACCOUNT III— At February 28, 2019, certain Funds had undivided interests in the Joint Repurchase Agreement Account I with a maturity date of March 1, 2019, as follows:
| | | | | | | | | | | | |
| Fund | | Principal
Amount | | | Maturity
Value | | | Collateral Value
Allocation | |
Government | | $ | 3,939,800,000 | | | | $3,940,083,987 | | | $ | 4,053,332,481 | |
Money Market | | | 2,760,000,000 | | | | 2,760,198,945 | | | | 2,839,534,405 | |
Prime Obligations | | | 1,100,000,000 | | | | 1,100,079,290 | | | | 1,131,698,495 | |
REPURCHASE AGREEMENTS — At February 28, 2019, the Principal Amounts of certain Funds’ interests in the Joint Repurchase Agreement Account III were as follows:
| | | | | | | | | | | | | | | | |
| Counterparty | | Interest
Rate | | | Government | | | Money Market | | | Prime Obligations | |
ABN Amro Bank N.V. | | | 2.600 | % | | $ | 324,454,118 | | | $ | 227,294,118 | | | $ | 90,588,235 | |
Bank of America, N.A. | | | 2.580 | | | | 231,752,941 | | | | 162,352,941 | | | | 64,705,882 | |
Bank of Nova Scotia (The) | | | 2.620 | | | | 1,019,712,941 | | | | 714,352,941 | | | | 284,705,883 | |
BNP Paribas | | | 2.610 | | | | 231,752,941 | | | | 162,352,941 | | | | 64,705,882 | |
Merrill Lynch, Pierce, Fenner & Smith, Inc. | | | 2.570 | | | | 834,310,588 | | | | 584,470,588 | | | | 232,941,177 | |
Wells Fargo Securities, LLC | | | 2.590 | | | | 1,297,816,471 | | | | 909,176,471 | | | | 362,352,941 | |
| | | | |
| TOTAL | | | | | | $ | 3,939,800,000 | | | $ | 2,760,000,000 | | | $ | 1,100,000,000 | |
At February 28, 2019, the Joint Repurchase Agreement Account III was fully collateralized by:
| | | | | | | | |
| Issuer | | Interest Rates | | | Maturity Dates | |
Federal Farm Credit Bank | | | 2.450 to 4.150 | % | | | 03/01/21 to 06/27/33 | |
Federal Home Loan Bank | | | 3.930 | | | | 07/11/33 | |
Federal Home Loan Mortgage Corp. | | | 2.000 to 9.500 | | | | 11/01/19 to 03/01/49 | |
Federal Home Loan Mortgage Corp. Stripped Securities | | | 0.000 | | | | 07/15/32 | |
Federal National Mortgage Association | | | 1.750 to 7.500 | | | | 03/01/19 to 03/01/49 | |
Federal National Mortgage Association Stripped Securities | | | 0.000 | | | | 03/23/28 to 11/15/30 | |
Government National Mortgage Association | | | 2.500 to 7.500 | | | | 09/15/24 to 02/20/49 | |
U.S. Treasury Bonds | | | 2.750 to 3.375 | | | | 11/15/47 to 11/15/48 | |
U.S. Treasury Inflation-Indexed Bonds | | | 2.375 to 3.875 | | | | 01/15/25 to 04/15/29 | |
U.S. Treasury Inflation-Indexed Notes | | | 0.125 | | | | 01/15/22 | |
U.S. Treasury Interest-Only Stripped Securities | | | 0.000 | | | | 08/15/37 | |
U.S. Treasury Notes | | | 1.250 to 2.875 | | | | 11/30/19 to 11/15/24 | |
| | |
| The accompanying notes are an integral part of these financial statements. | | 39 |
GOLDMAN SACHS FUNDS — FINANCIAL SQUARE FUNDS
Statements of Assets and Liabilities
February 28, 2019 (Unaudited)
| | | | | | | | | | | | | | | | | | |
| | | | | Federal
Instruments
Fund | | | Government Fund | | | Money Market Fund | | | Prime
Obligations
Fund | |
| | Assets: | | | | | | | | | | | | | | | | |
| | Investments, at value (cost $1,077,113,224, $41,463,967,658, $9,129,913,741 and $3,396,770,543) | | $ | 1,077,113,224 | | | $ | 41,463,967,658 | | | $ | 9,133,953,476 | | | $ | 3,397,914,069 | |
| | Repurchase agreements, at value — unaffiliated issuers (cost $0, $59,755,011,250, $4,122,000,000 and $1,436,000,000) | | | — | | | | 59,755,011,250 | | | | 4,122,000,244 | | | | 1,436,000,360 | |
| | Repurchase agreements, at value — affiliated issuers (cost $0, $650,000,000, $0 and $0) | | | — | | | | 650,000,000 | | | | — | | | | — | |
| | Cash | | | 7,625 | | | | 486,406,280 | | | | 32,417,796 | | | | 42,650 | |
| | Receivables: | | | | | | | | | | | | | | | | |
| | Investments sold | | | 1,495,276 | | | | 1,188,667,803 | | | | — | | | | — | |
| | Reimbursement from investment advisor | | | 12,760 | | | | — | | | | — | | | | — | |
| | Interest | | | 642,451 | | | | 117,253,681 | | | | 16,544,334 | | | | 6,111,647 | |
| | Fund shares sold | | | 29,373 | | | | 22,812,846 | | | | — | | | | 10,774,646 | |
| | Other assets | | | 2,985 | | | | 518,836 | | | | 57,325 | | | | 18,459 | |
| | Total assets | | | 1,079,303,694 | | | | 103,684,638,354 | | | | 13,304,973,175 | | | | 4,850,861,831 | |
| | | | | | | | | | | | | | | | | | |
| | Liabilities: | | | | | | | | | | | | | | | | |
| | Payables: | | | | | | | | | | | | | | | | |
| | Investments purchased | | | 189,101,978 | | | | 3,130,091,517 | | | | 355,314,092 | | | | 87,618,807 | |
| | Fund shares redeemed | | | — | | | | 39,312,760 | | | | — | | | | 4,165,804 | |
| | Dividend distribution | | | 529,201 | | | | 92,832,268 | | | | 12,648,556 | | | | 3,502,766 | |
| | Management fees | | | 109,768 | | | | 12,435,559 | | | | 991,898 | | | | 340,221 | |
| | Distribution and Service fees and Transfer Agency fees | | | 6,873 | | | | 802,703 | | | | 98,847 | | | | 33,896 | |
| | Accrued expenses | | | 212,275 | | | | 3,113,754 | | | | 267,130 | | | | 198,230 | |
| | Total liabilities | | | 189,960,095 | | | | 3,278,588,561 | | | | 369,320,523 | | | | 95,859,724 | |
| | | | | | | | | | | | | | | | | | |
| | Net Assets: | | | | | | | | | | | | | | | | |
| | Paid-in capital | | | 889,321,763 | | | | 100,401,165,797 | | | | 12,931,454,349 | | | | 4,753,791,640 | |
| | Total distributable earnings | | | 21,836 | | | | 4,883,996 | | | | 4,198,303 | | | | 1,210,467 | |
| | | NET ASSETS | | $ | 889,343,599 | | | $ | 100,406,049,793 | | | $ | 12,935,652,652 | | | $ | 4,755,002,107 | |
| | | Net Assets: | | | | | | | | | | | | | | | | |
| | | Institutional Shares | | | $811,781,938 | | | | $91,021,628,790 | | | | $12,901,986,354 | | | | $4,615,641,285 | |
| | | Select Shares | | | 48,414 | | | | 656,196,087 | | | | 26,174,275 | | | | 92,570,051 | |
| | | Preferred Shares | | | 7,738,565 | | | | 737,386,658 | | | | 1,840,532 | | | | 2,606,914 | |
| | | Capital Shares | | | 880,722 | | | | 1,778,565,601 | | | | 4,805,957 | | | | 5,062,083 | |
| | | Administration Shares | | | 58,276,761 | | | | 5,202,651,346 | | | | 838,463 | | | | 34,009,557 | |
| | | Premier Shares | | | 51,034 | | | | 227,339,223 | | | | 1,029 | | | | 1,029 | |
| | | Service Shares | | | 10,515,563 | | | | 598,646,788 | | | | 4,000 | | | | 5,109,147 | |
| | | Class A Shares | | | — | | | | 70,105,609 | | | | — | | | | — | |
| | | Class C Shares | | | — | | | | 4,588,536 | | | | — | | | | — | |
| | | Resource Shares | | | — | | | | 56,085,518 | | | | 1,023 | | | | 1,022 | |
| | | Cash Management Shares | | | 50,602 | | | | 7,046,525 | | | | 1,019 | | | | 1,019 | |
| | | Class R6 Shares | | | — | | | | 45,809,112 | | | | — | | | | — | |
| | | Total Net Assets | | $ | 889,343,599 | | | $ | 100,406,049,793 | | | $ | 12,935,652,652 | | | $ | 4,755,002,107 | |
| | | Shares outstanding $0.001 par value (unlimited number of shares authorized): | | | | | | | | | | | | | | | | |
| | | Institutional Shares | | | 811,766,501 | | | | 91,017,196,313 | | | | 12,895,614,416 | | | | 4,613,388,333 | |
| | | Select Shares | | | 48,413 | | | | 656,164,160 | | | | 26,162,144 | | | | 92,541,432 | |
| | | Preferred Shares | | | 7,738,418 | | | | 737,350,737 | | | | 1,839,671 | | | | 2,606,127 | |
| | | Capital Shares | | | 880,705 | | | | 1,778,479,004 | | | | 4,803,657 | | | | 5,059,989 | |
| | | Administration Shares | | | 58,275,652 | | | | 5,202,397,955 | | | | 838,107 | | | | 33,995,175 | |
| | | Premier Shares | | | 51,033 | | | | 227,328,150 | | | | 1,029 | | | | 1,028 | |
| | | Service Shares | | | 10,515,363 | | | | 598,617,626 | | | | 3,999 | | | | 5,107,599 | |
| | | Class A Shares | | | — | | | | 70,102,212 | | | | — | | | | — | |
| | | Class C Shares | | | — | | | | 4,588,312 | | | | — | | | | — | |
| | | Resource Shares | | | — | | | | 56,082,798 | | | | 1,023 | | | | 1,021 | |
| | | Cash Management Shares | | | 50,601 | | | | 7,046,182 | | | | 1,018 | | | | 1,019 | |
| | | Class R6 Shares | | | — | | | | 45,806,884 | | | | — | | | | — | |
| | | Net asset value, offering and redemption price per share: | | | | | | | | | | | | | | | | |
| | | Institutional Shares | | | $1.00 | | | | $1.00 | | | | $1.0005 | | | | $1.0005 | |
| | | Select Shares | | | 1.00 | | | | 1.00 | | | | 1.0005 | | | | 1.0003 | |
| | | Preferred Shares | | | 1.00 | | | | 1.00 | | | | 1.0005 | | | | 1.0003 | |
| | | Capital Shares | | | 1.00 | | | | 1.00 | | | | 1.0005 | | | | 1.0004 | |
| | | Administration Shares | | | 1.00 | | | | 1.00 | | | | 1.0004 | | | | 1.0004 | |
| | | Premier Shares | | | 1.00 | | | | 1.00 | | | | 1.0005 | | | | 1.0004 | |
| | | Service Shares | | | 1.00 | | | | 1.00 | | | | 1.0002 | | | | 1.0003 | |
| | | Class A Shares | | | — | | | | 1.00 | | | | — | | | | — | |
| | | Class C Shares | | | — | | | | 1.00 | | | | — | | | | — | |
| | | Resource Shares | | | — | | | | 1.00 | | | | 1.0005 | | | | 1.0004 | |
| | | Cash Management Shares | | | 1.00 | | | | 1.00 | | | | 1.0005 | | | | 1.0004 | |
| | | Class R6 Shares | | | — | | | | 1.00 | | | | — | | | | — | |
| | |
| 40 | | The accompanying notes are an integral part of these financial statements. |
GOLDMAN SACHS FUNDS — FINANCIAL SQUARE FUNDS
| | | | | | | | | | | | | | |
| | | | | Treasury
Instruments Fund | | | Treasury
Obligations Fund | | | Treasury Solutions Fund | |
| | Assets: | | | | | | | | | | | | |
| | Investments based on amortized cost | | $ | 58,664,708,694 | | | $ | 5,857,187,860 | | | $ | 10,236,798,042 | |
| | Repurchase agreements based on amortized cost — unaffiliated issuers | | | — | | | | 9,199,713,750 | | | | — | |
| | Repurchase agreements based on amortized cost — affiliated issuers | | | — | | | | 150,000,000 | | | | — | |
| | Cash | | | 83,493 | | | | 148,753,266 | | | | 155,435 | |
| | Receivables: | | | | | | | | | | | | |
| | Investments sold | | | 697,049,289 | | | | 309,622,482 | | | | 94,784,814 | |
| | Interest | | | 39,940,761 | | | | 11,692,760 | | | | 6,385,083 | |
| | Fund shares sold | | | 4,878,576 | | | | 1,510,791 | | | | 478,764 | |
| | Other assets | | | 298,989 | | | | 86,410 | | | | 49,347 | |
| | Total assets | | | 59,406,959,802 | | | | 15,678,567,319 | | | | 10,338,651,485 | |
| | | | | | | | | | | | | | |
| | Liabilities: | | | | | | | | | | | | |
| | Payables: | | | | | | | | | | | | |
| | Investments purchased | | | 6,712,061,661 | | | | 467,378,348 | | | | 1,440,243,774 | |
| | Dividend distribution | | | 36,856,631 | | | | 16,602,264 | | | | 3,752,969 | |
| | Management fees | | | 7,228,774 | | | | 2,152,164 | | | | 1,204,193 | |
| | Distribution and Service fees and Transfer Agency fees | | | 404,041 | | | | 119,587 | | | | 94,689 | |
| | Fund shares redeemed | | | 3,608,344 | | | | 1,524,120 | | | | 11,344 | |
| | Accrued expenses | | | 1,550,804 | | | | 1,243,144 | | | | 454,964 | |
| | Total liabilities | | | 6,761,710,255 | | | | 489,019,627 | | | | 1,445,761,933 | |
| | | | | | | | | | | | | | |
| | Net Assets: | | | | | | | | | | | | |
| | Paid-in capital | | | 52,644,588,312 | | | | 15,188,533,799 | | | | 8,892,830,499 | |
| | Total distributable earnings | | | 661,235 | | | | 1,013,893 | | | | 59,053 | |
| | | NET ASSETS | | $ | 52,645,249,547 | | | $ | 15,189,547,692 | | | $ | 8,892,889,552 | |
| | | Net Assets: | | | | | | | | | | | | |
| | | Institutional Shares | | $ | 49,173,003,519 | | | $ | 11,277,421,295 | | | $ | 7,920,939,117 | |
| | | Select Shares | | | 329,535,195 | | | | 49,017,373 | | | | 5,865,274 | |
| | | Preferred Shares | | | 58,961,327 | | | | 400,152,513 | | | | 65,945,555 | |
| | | Capital Shares | | | 581,695,730 | | | | 563,055,267 | | | | 170,570,750 | |
| | | Administration Shares | | | 2,292,341,060 | | | | 1,758,556,129 | | | | 379,729,538 | |
| | | Premier Shares | | | 131,124,996 | | | | 16,846,790 | | | | 138,038,823 | |
| | | Service Shares | | | 68,938,832 | | | | 1,124,452,573 | | | | 109,113,829 | |
| | | Resource Shares | | | 1,015 | | | | 1,016 | | | | 1,015 | |
| | | Cash Management Shares | | | 9,647,873 | | | | 44,736 | | | | 102,685,651 | |
| | | Total Net Assets | | $ | 52,645,249,547 | | | $ | 15,189,547,692 | | | $ | 8,892,889,552 | |
| | | Shares outstanding $0.001 par value (unlimited number of shares authorized): | | | | | | | | | | | | |
| | | Institutional Shares | | | 49,172,388,250 | | | | 11,276,668,596 | | | | 7,920,886,521 | |
| | | Select Shares | | | 329,531,075 | | | | 49,014,104 | | | | 5,865,235 | |
| | | Preferred Shares | | | 58,960,589 | | | | 400,125,802 | | | | 65,945,117 | |
| | | Capital Shares | | | 581,688,456 | | | | 563,017,696 | | | | 170,569,618 | |
| | | Administration Shares | | | 2,292,312,378 | | | | 1,758,438,714 | | | | 379,727,015 | |
| | | Premier Shares | | | 131,123,354 | | | | 16,845,666 | | | | 138,037,906 | |
| | | Service Shares | | | 68,937,970 | | | | 1,124,377,474 | | | | 109,113,104 | |
| | | Resource Shares | | | 1,015 | | | | 1,016 | | | | 1,015 | |
| | | Cash Management Shares | | | 9,647,752 | | | | 44,733 | | | | 102,684,968 | |
| | | Net asset value, offering and redemption price per share: | | | | | | | | | | | | |
| | | Institutional Shares | | | $1.00 | | | | $1.00 | | | | $1.00 | |
| | | Select Shares | | | 1.00 | | | | 1.00 | | | | 1.00 | |
| | | Preferred Shares | | | 1.00 | | | | 1.00 | | | | 1.00 | |
| | | Capital Shares | | | 1.00 | | | | 1.00 | | | | 1.00 | |
| | | Administration Shares | | | 1.00 | | | | 1.00 | | | | 1.00 | |
| | | Premier Shares | | | 1.00 | | | | 1.00 | | | | 1.00 | |
| | | Service Shares | | | 1.00 | | | | 1.00 | | | | 1.00 | |
| | | Resource Shares | | | 1.00 | | | | 1.00 | | | | 1.00 | |
| | | Cash Management Shares | | | 1.00 | | | | 1.00 | | | | 1.00 | |
| | |
| The accompanying notes are an integral part of these financial statements. | | 41 |
GOLDMAN SACHS FUNDS — FINANCIAL SQUARE FUNDS
Statements of Operations
For the Six Months Ended February 28, 2019 (Unaudited)
| | | | | | | | | | | | | | | | | | |
| | | | | Federal
Instruments
Fund | | | Government Fund | | | Money Market Fund | | | Prime
Obligations
Fund | |
| | Investment income: | | | | | | | | | | | | | |
| | | | | |
| | Interest income — from unaffiliated issuers | | $ | 7,709,951 | | | $ | 1,176,433,096 | | | $ | 149,799,604 | | | $ | 49,502,015 | |
| | | | | |
| | Interest income — from affiliated issuers | | | — | | | | 1,672,690 | | | | — | | | | — | |
| | | | | |
| | Total investment income | | | 7,709,951 | | | | 1,178,105,786 | | | | 149,799,604 | | | | 49,502,015 | |
| | | | | | | | | | | | | | | | | | |
| | Expenses: | | | | | | | | | | | | | |
| | Fund-Level Expenses: | | | | | | | | | | | | | | | | |
| | | | | |
| | Management fees | | | 601,204 | | | | 81,126,104 | | | | 9,460,555 | | | | 3,128,429 | |
| | | | | |
| | Professional fees | | | 54,138 | | | | 60,455 | | | | 49,134 | | | | 51,984 | |
| | | | | |
| | Transfer Agency fees | | | 33,400 | | | | 5,070,381 | | | | 591,285 | | | | 195,527 | |
| | | | | |
| | Registration fees | | | 27,951 | | | | 625,513 | | | | 290,447 | | | | 127,742 | |
| | | | | |
| | Custody, accounting and administrative services | | | 26,415 | | | | 1,687,191 | | | | 250,426 | | | | 97,033 | |
| | | | | |
| | Trustee fees | | | 8,609 | | | | 99,451 | | | | 16,204 | | | | 12,000 | |
| | | | | |
| | Printing and mailing fees | | | — | | | | 238,028 | | | | 25,389 | | | | 13,163 | |
| | | | | |
| | Other | | | 22,806 | | | | 316,644 | | | | 32,641 | | | | 29,584 | |
| | Subtotal | | | 774,523 | | | | 89,223,767 | | | | 10,716,081 | | | | 3,655,462 | |
| | Class Specific Expenses: | | | | | | | | | | | | | | | | |
| | | | | |
| | Administration Share fees | | | 70,511 | | | | 6,512,330 | | | | 2,329 | | | | 31,765 | |
| | | | | |
| | Service Share fees | | | 23,996 | | | | 1,511,209 | | | | 187 | | | | 12,994 | |
| | | | | |
| | Preferred Share fees | | | 4,127 | | | | 457,508 | | | | 950 | | | | 1,304 | |
| | | | | |
| | Select Share fees | | | 7 | | | | 96,814 | | | | 4,880 | | | | 10,336 | |
| | | | | |
| | Capital Share fees | | | 1,149 | | | | 1,088,697 | | | | 276 | | | | 3,385 | |
| | | | | |
| | Resource Share fees | | | — | | | | 156,859 | | | | 2 | | | | 2 | |
| | | | | |
| | Premier Share fees | | | 89 | | | | 335,180 | | | | 2 | | | | 2 | |
| | | | | |
| | Cash Management Share fees | | | 125 | | | | 19,501 | | | | 2 | | | | 2 | |
| | | | | |
| | Class C Share fees | | | — | | | | 5,812 | | | | — | | | | — | |
| | | | | |
| | Distribution fees — Cash Management Shares | | | 75 | | | | 11,700 | | | | 2 | | | | 1 | |
| | | | | |
| | Distribution fees — Resource Shares | | | — | | | | 47,058 | | | | 1 | | | | 1 | |
| | | | | |
| | Distribution and Service fees — Class A Shares | | | — | | | | 79,298 | | | | — | | | | — | |
| | | | | |
| | Distribution fees — Class C Shares | | | — | | | | 17,436 | | | | — | | | | — | |
| | | | | |
| | Total expenses | | | 874,602 | | | | 99,563,169 | | | | 10,724,712 | | | | 3,715,254 | |
| | | | | |
| | Less — expense reductions | | | (118,700 | ) | | | (296 | ) | | | (3,742,560 | ) | | | (1,294,729 | ) |
| | | | | |
| | Net expenses | | | 755,902 | | | | 99,562,873 | | | | 6,982,152 | | | | 2,420,525 | |
| | | | | |
| | NET INVESTMENT INCOME | | $ | 6,954,049 | | | $ | 1,078,542,913 | | | $ | 142,817,452 | | | $ | 47,081,490 | |
| | | | | |
| | Net realized gain (loss) from investment transactions | | | 3,268 | | | | 1,062,354 | | | | (118,060 | ) | | | 19,057 | |
| | | | | |
| | Net change in unrealized gain from investment transactions | | | — | | | | — | | | | 2,748,122 | | | | 708,385 | |
| | | | | |
| | Net realized and unrealized gain | | | 3,268 | | | | 1,062,354 | | | | 2,630,062 | | | | 727,442 | |
| | | | | |
| | NET INCREASE IN NET ASSETS RESULTING FROM OPERATIONS | | $ | 6,957,317 | | | $ | 1,079,605,267 | | | $ | 145,447,514 | | | $ | 47,808,932 | |
| | |
| 42 | | The accompanying notes are an integral part of these financial statements. |
GOLDMAN SACHS FUNDS — FINANCIAL SQUARE FUNDS
| | | | | | | | | | | | | | |
| | | | | Treasury
Instruments
Fund | | | Treasury
Obligations
Fund | | | Treasury
Solutions Fund | |
| | Investment income: | | | | | | | | | |
| | | | |
| | Interest income — from unaffiliated issuers | | $ | 637,687,111 | | | $ | 183,495,280 | | | $ | 103,687,619 | |
| | | | |
| | Interest income — from affiliated issuers | | | — | | | | 284,180 | | | | — | |
| | | | |
| | Total investment income | | | 637,687,111 | | | | 183,779,460 | | | | 103,687,619 | |
| | | | | | | | | | | | | | |
| | Expenses: | | | | | | | | | |
| | Fund-Level Expenses: | | | | | | | | | | | | |
| | | | |
| | Management fees | | | 50,026,427 | | | | 14,153,090 | | | | 8,096,084 | |
| | | | |
| | Transfer Agency fees | | | 2,779,246 | | | | 786,283 | | | | 449,782 | |
| | | | |
| | Custody, accounting and administrative services | | | 937,068 | | | | 295,519 | | | | 163,565 | |
| | | | |
| | Printing and mailing fees | | | 273,864 | | | | 25,536 | | | | 26,976 | |
| | | | |
| | Registration fees | | | 227,335 | | | | 111,380 | | | | 53,147 | |
| | | | |
| | Trustee fees | | | 58,761 | | | | 20,540 | | | | 23,283 | |
| | | | |
| | Professional fees | | | 54,882 | | | | 58,613 | | | | 55,027 | |
| | | | |
| | Other | | | 192,167 | | | | 119,902 | | | | 54,199 | |
| | Subtotal | | | 54,549,750 | | | | 15,570,863 | | | | 8,922,063 | |
| | Class Specific Expenses: | | | | | | | | | | | | |
| | | | |
| | Administration Share fees | | | 3,011,567 | | | | 2,259,062 | | | | 392,944 | |
| | | | |
| | Service Share fees | | | 452,703 | | | | 2,996,648 | | | | 322,401 | |
| | | | |
| | Preferred Share fees | | | 22,680 | | | | 128,509 | | | | 14,753 | |
| | | | |
| | Select Share fees | | | 52,237 | | | | 11,517 | | | | 962 | |
| | | | |
| | Capital Share fees | | | 384,435 | | | | 240,576 | | | | 124,347 | |
| | | | |
| | Resource Share fees | | | 2 | | | | 3 | | | | 3 | |
| | | | |
| | Premier Share fees | | | 235,758 | | | | 26,946 | | | | 215,651 | |
| | | | |
| | Cash Management Share fees | | | 15,206 | | | | 101 | | | | 204,481 | |
| | | | |
| | Distribution fees — Cash Management Shares | | | 9,123 | | | | 60 | | | | 122,688 | |
| | | | |
| | Distribution fees — Resource Shares | | | 1 | | | | 1 | | | | 1 | |
| | | | |
| | Total expenses | | | 58,733,462 | | | | 21,234,286 | | | | 10,320,294 | |
| | | | |
| | Less — expense reductions | | | (71 | ) | | | (21 | ) | | | (11 | ) |
| | | | |
| | Net expenses | | | 58,733,391 | | | | 21,234,265 | | | | 10,320,283 | |
| | | | |
| | NET INVESTMENT INCOME | | $ | 578,953,720 | | | $ | 162,545,195 | | | $ | 93,367,336 | |
| | | | |
| | Net realized gain (loss) from investment transactions | | | (696,983 | ) | | | 740,476 | | | | (88,682 | ) |
| | | | |
| | NET INCREASE IN NET ASSETS RESULTING FROM OPERATIONS | | $ | 578,256,737 | | | $ | 163,285,671 | | | $ | 93,278,654 | |
| | |
| The accompanying notes are an integral part of these financial statements. | | 43 |
GOLDMAN SACHS FUNDS — FINANCIAL SQUARE FUNDS
Statements of Changes in Net Assets
| | | | | | | | | | | | | | | | | | | | | | |
| | | | | Federal Instruments Fund | | | | | | Government Fund | |
| | | | | For the Six Months Ended February 28, 2019
(Unaudited) | | | For the Fiscal Year Ended August 31, 2018 | | | | | | For the Six Months Ended February 28, 2019
(Unaudited) | | | For the Fiscal Year Ended August 31, 2018 | |
| | From operations: | | | | | | | | | | | | | |
| | Net investment income | | $ | 6,954,049 | | | $ | 7,770,882 | | | | | | | $ | 1,078,542,913 | | | $ | 1,262,100,931 | |
| | Net realized gain (loss) from investment transactions | | | 3,268 | | | | (3,809 | ) | | | | | | | 1,062,354 | | | | 20,449 | |
| | Net increase in net assets resulting from operations | | | 6,957,317 | | | | 7,767,073 | | | | | | | | 1,079,605,267 | | | | 1,262,121,380 | |
| | | | | | | | | | | | | | | | | | | | | | |
| | Distributions to shareholders: | | | | | | | | | | | | | | | | | | | | |
| | | | | | |
| | From distributable earnings: | | | | | | | | | | | | | | | | | | | | |
| | Institutional Shares | | | (6,246,692 | ) | | | (6,922,945 | )(a) | | | | | | | (987,481,758 | ) | | | (1,157,085,399 | )(a) |
| | Select Shares | | | (494 | ) | | | (620 | )(a) | | | | | | | (6,822,680 | ) | | | (26,372,855 | )(a) |
| | Preferred Shares | | | (84,511 | ) | | | (11,468 | )(a) | | | | | | | (9,261,231 | ) | | | (10,128,118 | )(a) |
| | Capital Shares | | | (13,826 | ) | | | (140,311 | )(a) | | | | | | | (14,659,932 | ) | | | (12,902,791 | )(a) |
| | Administration Shares | | | (521,470 | ) | | | (575,410 | )(a) | | | | | | | (49,839,307 | ) | | | (46,579,598 | )(a) |
| | Premier Shares | | | (440 | ) | | | (495 | )(a) | | | | | | | (1,729,594 | ) | | | (1,870,618 | )(a) |
| | Service Shares | | | (76,956 | ) | | | (117,449 | )(a) | | | | | | | (4,963,193 | ) | | | (3,854,546 | )(a) |
| | Class A Shares | | | — | | | | — | | | | | | | | (601,179 | ) | | | (670,689 | )(a) |
| | Class C Shares | | | — | | | | — | | | | | | | | (26,558 | ) | | | (20,492 | )(a) |
| | Resource Shares | | | — | | | | — | | | | | | | | (466,581 | ) | | | (492,465 | )(a) |
| | Cash Management Shares | | | (326 | ) | | | (266 | )(a) | | | | | | | (53,403 | ) | | | (33,066 | )(a) |
| | Class R6 Shares | | | — | | | | — | | | | | | | | (596,310 | ) | | | (381,000 | )(a) |
| | Total distributions to shareholders | | | (6,944,715 | ) | | | (7,768,964 | ) | | | | | | | (1,076,501,726 | ) | | | (1,260,391,637 | ) |
| | | | | | | | | | | | | | | | | | | | | | |
| | From share transactions: | | | | | | | | | | | | | |
| | Proceeds from sales of shares | | | 822,109,494 | | | | 1,597,928,128 | | | | | | | | 461,766,097,866 | | | | 814,016,972,049 | |
| | Reinvestment of distributions | | | 5,885,662 | | | | 7,165,769 | | | | | | | | 507,981,875 | | | | 623,990,529 | |
| | Cost of shares redeemed | | | (525,431,890 | ) | | | (1,657,023,195 | ) | | | | | | | (466,729,628,922 | ) | | | (798,295,133,217 | ) |
| | Net increase (decrease) in net assets resulting from share transactions | | | 302,563,266 | | | | (51,929,298 | ) | | | | | | | (4,455,549,181 | ) | | | 16,345,829,361 | |
| | NET INCREASE (DECREASE) | | | 302,575,868 | | | | (51,931,189 | ) | | | | | | | (4,452,445,640 | ) | | | 16,347,559,104 | |
| | | | | | | | | | | | | | | | | | | | | | |
| | Net assets:(b) | | | | | | | | | | | | | |
| | Beginning of period | | | 586,767,731 | | | | 638,698,920 | | | | | | | | 104,858,495,433 | | | | 88,510,936,329 | |
| | End of period | | $ | 889,343,599 | | | $ | 586,767,731 | | | | | | | $ | 100,406,049,793 | | | $ | 104,858,495,433 | |
| | (a) | | Prior year information has been revised to conform to current year presentation, see prior year presentation below: |
| | | | | | | | | | | | | | | | | | | | | | | | | | | | | | | | | | | | | | | | | | | | | | | | |
Distributions from net
investment income: | | Institutional
Shares | | | Select
Shares | | | Preferred
Shares | | | Capital
Shares | | | Administration
Shares | | | Premier
Shares | | | Service
Shares | | | Class A
Shares | | | Class C
Shares | | | Resource
Shares | | | Cash
Management
Shares | | | Class R6
Shares | |
Federal Instruments Fund | | | (6,922,945 | ) | | | (620 | ) | | | (11,468 | ) | | | (140,141 | ) | | | (575,410 | ) | | | (495 | ) | | | (117,449 | ) | | | — | | | | — | | | | — | | | | (266 | ) | | | — | |
Government Fund | | | (1,156,282,021 | ) | | | (26,367,861 | ) | | | (10,117,010 | ) | | | (12,892,038 | ) | | | (46,542,413 | ) | | | (1,869,215 | ) | | | (3,849,639 | ) | | | (670,107 | ) | | | (20,451 | ) | | | (491,874 | ) | | | (33,011 | ) | | | (380,587 | ) |
| | | | | | | | | | | | |
Distributions from net realized
gains: | | Institutional
Shares | | | Select
Shares | | | Preferred
Shares | | | Capital
Shares | | | Administration
Shares | | | Premier
Shares | | | Service
Shares | | | Class A
Shares | | | Class C
Shares | | | Resource
Shares | | | Cash
Management
Shares | | | Class R6
Shares | |
Federal Instruments Fund | | | — | | | | — | | | | — | | | | (170 | ) | | | — | | | | — | | | | — | | | | — | | | | — | | | | — | | | | — | | | | — | |
Government Fund | | | (803,378 | ) | | | (4,994 | ) | | | (11,108 | ) | | | (10,753 | ) | | | (37,185 | ) | | | (1,403 | ) | | | (4,907 | ) | | | (582 | ) | | | (41 | ) | | | (591 | ) | | | (55 | ) | | | (413 | ) |
| | (b) | | Prior fiscal year information has been revised to conform with current year presentation. Undistributed net investment income was $14,706 and $6,714,936 for the Federal Instruments Fund and Government Fund, respectively as of August 31, 2018. |
| | |
| 44 | | The accompanying notes are an integral part of these financial statements. |
GOLDMAN SACHS FUNDS — FINANCIAL SQUARE FUNDS
Statements of Changes in Net Assets(continued)
| | | | | | | | | | | | | | | | | | | | | | |
| | | | | Money Market Fund | | | | | | Prime Obligations Fund | |
| | | | | For the Six Months Ended
February 28, 2019
(Unaudited) | | | For the Fiscal Year Ended August 31, 2018 | | | | | | For the Six Months Ended
February 28, 2019
(Unaudited) | | | For the Fiscal Year Ended August 31, 2018 | |
| | From operations: | | | | | | | | | | | | | |
| | | | | | |
| | Net investment income | | $ | 142,817,452 | | | $ | 94,866,940 | | | | | | | $ | 47,081,490 | | | $ | 40,110,969 | |
| | | | | | |
| | Net realized gain (loss) from investment transactions | | | (118,060 | ) | | | 266,263 | | | | | | | | 19,057 | | | | 128,347 | |
| | | | | | |
| | Net change in unrealized gain from investment transactions | | | 2,748,122 | | | | 858,850 | | | | | | | | 708,385 | | | | 208,988 | |
| | | | | | |
| | Net increase in net assets resulting from operations | | | 145,447,514 | | | | 95,992,053 | | | | | | | | 47,808,932 | | | | 40,448,304 | |
| | | | | | | | | | | | | | | | | | | | | | |
| | Distributions to shareholders: | | | | | | | | | | | | | | | | | | | | |
| | | | | | |
| | From distributable earnings: | | | | | | | | | | | | | | | | | | | | |
| | | | | | |
| | Institutional Shares | | | (142,131,837 | ) | | | (94,703,705 | )(a) | | | | | | | (45,808,408 | ) | | | (39,411,524 | )(a) |
| | | | | | |
| | Select Shares | | | (384,038 | ) | | | (336,271 | )(a) | | | | | | | (822,812 | ) | | | (614,919 | )(a) |
| | | | | | |
| | Preferred Shares | | | (21,778 | ) | | | (16,262 | )(a) | | | | | | | (30,076 | ) | | | (23,515 | )(a) |
| | | | | | |
| | Capital Shares | | | (4,557 | ) | | | (18 | )(a) | | | | | | | (50,319 | ) | | | (22,792 | )(a) |
| | | | | | |
| | Administration Shares | | | (19,544 | ) | | | (48,591 | )(a) | | | | | | | (279,485 | ) | | | (151,862 | )(a) |
| | | | | | |
| | Premier Shares | | | (11 | ) | | | (14 | )(a) | | | | | | | (11 | ) | | | (15 | )(a) |
| | | | | | |
| | Service Shares | | | (720 | ) | | | (4,434 | )(a) | | | | | | | (51,330 | ) | | | (6,003 | )(a) |
| | | | | | |
| | Resource Shares | | | (11 | ) | | | (14 | )(a) | | | | | | | (11 | ) | | | (15 | )(a) |
| | | | | | |
| | Cash Management Shares | | | (9 | ) | | | (11 | )(a) | | | | | | | (9 | ) | | | (11 | )(a) |
| | | | | | |
| | Total distributions to shareholders | | | (142,562,505 | ) | | | (95,109,320 | ) | | | | | | | (47,042,461 | ) | | | (40,230,656 | ) |
| | | | | | | | | | | | | | | | | | | | | | |
| | From share transactions: | | | | | | | | | | | | | |
| | | | | | |
| | Proceeds from sales of shares | | | 40,821,448,774 | | | | 46,362,347,251 | | | | | | | | 6,694,234,668 | | | | 13,545,751,948 | |
| | | | | | |
| | Reinvestment of distributions | | | 65,155,993 | | | | 45,984,373 | | | | | | | | 29,472,051 | | | | 24,278,845 | |
| | | | | | |
| | Cost of shares redeemed | | | (39,564,732,505 | ) | | | (37,357,864,040 | ) | | | | | | | (5,812,996,978 | ) | | | (11,218,581,295 | ) |
| | | | | | |
| | Net increase in net assets resulting from share transactions | | | 1,321,872,262 | | | | 9,050,467,584 | | | | | | | | 910,709,741 | | | | 2,351,449,498 | |
| | | | | | |
| | NET INCREASE | | | 1,324,757,271 | | | | 9,051,350,317 | | | | | | | | 911,476,212 | | | | 2,351,667,146 | |
| | | | | | | | | | | | | | | | | | | | | | |
| | Net assets:(b) | | | | | | | | | | | | | |
| | | | | | |
| | Beginning of period | | | 11,610,895,381 | | | | 2,559,545,064 | | | | | | | | 3,843,525,895 | | | | 1,491,858,749 | |
| | | | | | |
| | End of period | | $ | 12,935,652,652 | | | $ | 11,610,895,381 | | | | | | | $ | 4,755,002,107 | | | $ | 3,843,525,895 | |
| | (a) | | Prior year information has been revised to conform to current year presentation, see prior year presentation below: |
| | | | | | | | | | | | | | | | | | | | | | | | | | | | | | | | | | | | |
Distributions from net investment income: | | Institutional
Shares | | | Select
Shares | | | Preferred
Shares | | | Capital
Shares | | | Administration
Shares | | | Premier
Shares | | | Service
Shares | | | Resource
Shares | | | Cash
Management
Shares | |
Money Market Fund | | | (94,462,241 | ) | | | (335,508 | ) | | | (16,206 | ) | | | (18 | ) | | | (48,499 | ) | | | (14 | ) | | | (4,429 | ) | | | (14 | ) | | | (11 | ) |
Prime Obligations Fund | | | (39,294,800 | ) | | | (612,433 | ) | | | (23,379 | ) | | | (22,720 | ) | | | (151,617 | ) | | | (15 | ) | | | (5,979 | ) | | | (15 | ) | | | (11 | ) |
| | | | | | | | | |
Distributions from net realized gains: | | Institutional
Shares | | | Select
Shares | | | Preferred
Shares | | | Capital
Shares | | | Administration
Shares | | | Premier
Shares | | | Service
Shares | | | Resource
Shares | | | Cash
Management
Shares | |
Money Market Fund | | | (241,464 | ) | | | (763 | ) | | | (56 | ) | | | — | | | | (92 | ) | | | — | | | | (5 | ) | | | — | | | | — | |
Prime Obligations Fund | | | (116,724 | ) | | | (2,486 | ) | | | (136 | ) | | | (72 | ) | | | (245 | ) | | | — | | | | (24 | ) | | | — | | | | — | |
| | (b) | | Prior fiscal year information has been revised to conform with current year presentation. Distributions in excess of net investment income was $(3,582) and $(380) for the Money Market Fund and Prime Obligations Fund, respectively as of August 31, 2018. |
| | |
| The accompanying notes are an integral part of these financial statements. | | 45 |
GOLDMAN SACHS FUNDS — FINANCIAL SQUARE FUNDS
Statements of Changes in Net Assets(continued)
| | | | | | | | | | | | | | | | | | | | | | |
| | | | | Treasury Instruments Fund | | | | | | Treasury Obligations Fund | |
| | | | | For the Six Months Ended
February 28, 2019
(Unaudited) | | | For the Fiscal Year Ended August 31, 2018 | | | | | | For the Six Months Ended
February 28, 2019
(Unaudited) | | | For the Fiscal Year Ended August 31, 2018 | |
| | From operations: | | | | | | | | | | | | | |
| | | | | | |
| | Net investment income | | $ | 578,953,720 | | | $ | 669,188,022 | | | | | | | $ | 162,545,195 | | | $ | 216,240,443 | |
| | | | | | |
| | Net realized gain (loss) from investment transactions | | | (696,983 | ) | | | (1,062,940 | ) | | | | | | | 740,476 | | | | 303,622 | |
| | | | | | |
| | Net increase in net assets resulting from operations | | | 578,256,737 | | | | 668,125,082 | | | | | | | | 163,285,671 | | | | 216,544,065 | |
| | | | | | | | | | | | | | | | | | | | | | |
| | Distributions to shareholders: | | | | | | | | | | | | | |
| | | | | | |
| | From distributable earnings: | | | | | | | | | | | | | | | | | | | | |
| | | | | | |
| | Institutional Shares | | | (544,241,250 | ) | | | (631,771,179 | )(a) | | | | | | | (129,041,743 | ) | | | (183,017,133 | )(a) |
| | | | | | |
| | Select Shares | | | (3,596,445 | ) | | | (1,088,083 | )(a) | | | | | | | (786,587 | ) | | | (1,479,694 | )(a) |
| | | | | | |
| | Preferred Shares | | | (455,204 | ) | | | (555,409 | )(a) | | | | | | | (2,636,837 | ) | | | (2,135,434 | )(a) |
| | | | | | |
| | Capital Shares | | | (5,044,444 | ) | | | (7,223,408 | )(a) | | | | | | | (3,188,880 | ) | | | (3,837,660 | )(a) |
| | | | | | |
| | Administration Shares | | | (22,188,002 | ) | | | (25,621,041 | )(a) | | | | | | | (17,033,648 | ) | | | (16,261,506 | )(a) |
| | | | | | |
| | Premier Shares | | | (1,171,984 | ) | | | (1,059,275 | )(a) | | | | | | | (138,325 | ) | | | (68,491 | )(a) |
| | | | | | |
| | Service Shares | | | (1,439,361 | ) | | | (233,786 | )(a) | | | | | | | (9,820,786 | ) | | | (9,784,439 | )(a) |
| | | | | | |
| | Resource Shares | | | (8 | ) | | | (9 | )(a) | | | | | | | (8 | ) | | | (8 | )(a) |
| | | | | | |
| | Cash Management Shares | | | (42,330 | ) | | | (297 | )(a) | | | | | | | (268 | ) | | | (362 | )(a) |
| | | | | | |
| | Total distributions to shareholders | | | (578,179,028 | ) | | | (667,552,487 | ) | | | | | | | (162,647,082 | ) | | | (216,584,727 | ) |
| | | | | | | | | | | | | | | | | | | | | | |
| | From share transactions: | | | | | | | | | | | | | |
| | | | | | |
| | Proceeds from sales of shares | | | 120,778,091,365 | | | | 215,655,170,491 | | | | | | | | 93,206,581,535 | | | | 142,342,952,985 | |
| | | | | | |
| | Reinvestment of distributions | | | 332,063,163 | | | | 392,776,668 | | | | | | | | 57,970,549 | | | | 89,393,406 | |
| | | | | | |
| | Cost of shares redeemed | | | (122,996,670,864 | ) | | | (209,935,305,042 | ) | | | | | | | (92,501,464,011 | ) | | | (145,821,281,209 | ) |
| | | | | | |
| | Net increase (decrease) in net assets resulting from share transactions | | | (1,886,516,336 | ) | | | 6,112,642,117 | | | | | | | | 763,088,073 | | | | (3,388,934,818 | ) |
| | | | | | |
| | NET INCREASE (DECREASE) | | | (1,886,438,627 | ) | | | 6,113,214,712 | | | | | | | | 763,726,662 | | | | (3,388,975,480 | ) |
| | | | | | | | | | | | | | | | | | | | | | |
| | Net assets:(b) | | | | | | | | | | | | | |
| | | | | | |
| | Beginning of period | | | 54,531,688,174 | | | | 48,418,473,462 | | | | | | | | 14,425,821,030 | | | | 17,814,796,510 | |
| | | | | | |
| | End of period | | $ | 52,645,249,547 | | | $ | 54,531,688,174 | | | | | | | $ | 15,189,547,692 | | | $ | 14,425,821,030 | |
| | (a) | | Prior year information has been revised to conform to current year presentation, see prior year presentation below: |
| | | | | | | | | | | | | | | | | | | | | | | | | | | | | | | | | | | | |
Distributions from net investment
income: | | Institutional
Shares | | | Select
Shares | | | Preferred
Shares | | | Capital
Shares | | | Administration
Shares | | | Premier
Shares | | | Service
Shares | | | Resource
Shares | | | Cash
Management
Shares | |
Treasury Instruments Fund | | | (631,727,882 | ) | | | (1,088,061 | ) | | | (555,366 | ) | | | (7,222,661 | ) | | | (25,618,691 | ) | | | (1,059,219 | ) | | | (233,755 | ) | | | (9 | ) | | | (297 | ) |
Treasury Obligations Fund | | | (182,742,081 | ) | | | (1,477,682 | ) | | | (2,130,572 | ) | | | (3,831,207 | ) | | | (16,228,708 | ) | | | (68,491 | ) | | | (9,761,043 | ) | | | (8 | ) | | | (359 | ) |
| | | | | | | | | |
Distributions from net realized
gains: | | Institutional
Shares | | | Select
Shares | | | Preferred
Shares | | | Capital
Shares | | | Administration
Shares | | | Premier
Shares | | | Service
Shares | | | Resource
Shares | | | Cash
Management
Shares | |
Treasury Instruments Fund | | | (43,297 | ) | | | (22 | ) | | | (43 | ) | | | (747 | ) | | | (2,350 | ) | | | (56 | ) | | | (31 | ) | | | — | | | | — | |
Treasury Obligations Fund | | | (275,052 | ) | | | (2,012 | ) | | | (4,862 | ) | | | (6,453 | ) | | | (32,798 | ) | | | — | | | | (23,396 | ) | | | — | | | | (3 | ) |
| | (b) | | Prior fiscal year information has been revised to conform with current year presentation. Undistributed net investment income was $4,097,675 and $992,202 for the Treasury Instruments Fund and Treasury Obligations Fund, respectively as of August 31, 2018. |
| | |
| 46 | | The accompanying notes are an integral part of these financial statements. |
GOLDMAN SACHS FUNDS — FINANCIAL SQUARE FUNDS
Statements of Changes in Net Assets(continued)
| | | | | | | | | | |
| | | | | Treasury Solutions Fund | |
| | | | | For the Six Months Ended
February 28, 2019 (Unaudited) | | | For the Fiscal Year Ended August 31, 2018 | |
| | From operations: | |
| | | |
| | Net investment income | | $ | 93,367,336 | | | $ | 116,416,989 | |
| | | |
| | Net realized gain (loss) from investment transactions | | | (88,682 | ) | | | 705,244 | |
| | | |
| | Net increase in net assets resulting from operations | | | 93,278,654 | | | | 117,122,233 | |
| | | | | | | | | | |
| | Distributions to shareholders: | |
| | | |
| | From distributable earnings: | | | | | | | | |
| | | |
| | Institutional Shares | | | (85,752,040 | ) | | | (109,839,322 | )(a) |
| | | |
| | Select Shares | | | (66,031 | ) | | | (106,224 | )(a) |
| | | |
| | Preferred Shares | | | (303,110 | ) | | | (515,373 | )(a) |
| | | |
| | Capital Shares | | | (1,620,694 | ) | | | (2,131,692 | )(a) |
| | | |
| | Administration Shares | | | (2,905,319 | ) | | | (3,082,405 | )(a) |
| | | |
| | Premier Shares | | | (1,093,377 | ) | | | (474,955 | )(a) |
| | | |
| | Service Shares | | | (1,029,021 | ) | | | (1,182,598 | )(a) |
| | | |
| | Resource Shares | | | (8 | ) | | | (8 | )(a) |
| | Cash Management Shares | | | (556,830 | ) | | | (136,411 | )(a) |
| | | |
| | Total distributions to shareholders | | | (93,326,430 | ) | | | (117,468,988 | ) |
| | | | | | | | | | |
| | From share transactions: | |
| | | |
| | Proceeds from sales of shares | | | 20,334,477,438 | | | | 37,150,719,127 | |
| | | |
| | Reinvestment of distributions | | | 67,695,177 | | | | 81,317,670 | |
| | | |
| | Cost of shares redeemed | | | (19,954,988,986 | ) | | | (38,074,196,148 | ) |
| | | |
| | Net increase (decrease) in net assets resulting from share transactions | | | 447,183,629 | | | | (842,159,351 | ) |
| | | |
| | NET INCREASE (DECREASE) | | | 447,135,853 | | | | (842,506,106 | ) |
| | | | | | | | | | |
| | Net assets:(b) | |
| | | |
| | Beginning of period | | | 8,445,753,699 | | | | 9,288,259,805 | |
| | | |
| | End of period | | $ | 8,892,889,552 | | | $ | 8,445,753,699 | |
| | (a) | | Prior year information has been revised to conform to current year presentation, see prior year presentation below: |
| | | | | | | | | | | | | | | | | | | | | | | | | | | | | | | | | | | | | | | | | | | | |
Distributions from net investment income: | | Institutional
Shares | | | Select
Shares | | | Preferred
Shares | | | Capital
Shares | | | Administration
Shares | | | Premier
Shares | | | Service
Shares | | | Class A
Shares | | | Class C
Shares | | | Resource
Shares | | | Cash
Management
Shares | |
Treasury Solutions Fund | | | (108,867,455 | ) | | | (105,211 | ) | | | (511,284 | ) | | | (2,109,950 | ) | | | (3,051,952 | ) | | | (471,286 | ) | | | (1,166,476 | ) | | | — | | | | — | | | | (8 | ) | | | (133,367 | ) |
| | | | | | | | | | | |
Distributions from net realized gains: | | Institutional
Shares | | | Select
Shares | | | Preferred
Shares | | | Capital
Shares | | | Administration
Shares | | | Premier
Shares | | | Service
Shares | | | Class A
Shares | | | Class C
Shares | | | Resource
Shares | | | Cash
Management
Shares | |
Treasury Solutions Fund | | | (971,867 | ) | | | (1,013 | ) | | | (4,089 | ) | | | (21,742 | ) | | | (30,453 | ) | | | (3,669 | ) | | | (16,122 | ) | | | — | | | | — | | | | — | | | | (3,044 | ) |
| | (b) | | Prior fiscal year information has been revised to conform with current year presentation. Undistributed net investment income was $83,593 as of August 31, 2018. |
| | |
| The accompanying notes are an integral part of these financial statements. | | 47 |
FINANCIAL SQUARE FEDERAL INSTRUMENTS FUND
Financial Highlights
Selected Data for a Share Outstanding Throughout Each Period
| | | | | | | | | | | | | | | | | | |
| | | | | Financial Square Federal Instruments Fund | |
| | | | | Institutional Shares | |
| | | | | Six Months Ended
February 28, 2019
(Unaudited) | | | Year Ended August 31, | | | Period Ended
August 31, 2016* | |
| | 2018 | | | 2017 | |
| | Per Share Data: | | | | | | | | | | | | | | | | |
| | | | | |
| | Net asset value, beginning of period | | $ | 1.00 | | | $ | 1.00 | | | $ | 1.00 | | | $ | 1.00 | |
| | | | | |
| | Net investment income(a) | | | 0.010 | | | | 0.013 | | | | 0.005 | | | | 0.002 | |
| | | | | |
| | Net realized loss | | | — | (b) | | | — | (b) | | | — | (b) | | | — | (b) |
| | | | | | |
| | Total from investment operations | | | 0.010 | | | | 0.013 | | | | 0.005 | | | | 0.002 | |
| | | | | |
| | Distributions to shareholders from net investment income | | | (0.010 | ) | | | (0.013 | ) | | | (0.005 | ) | | | (0.002 | ) |
| | | | | |
| | Distributions to shareholders from net realized gains | | | — | (b) | | | — | (b) | | | — | (b) | | | — | (b) |
| | | | | | |
| | Total distributions(c) | | | (0.010 | ) | | | (0.013 | ) | | | (0.005 | ) | | | (0.002 | ) |
| | | | | |
| | Net asset value, end of period | | $ | 1.00 | | | $ | 1.00 | | | $ | 1.00 | | | $ | 1.00 | |
| | | | | |
| | Total return(d) | | | 1.05 | % | | | 1.34 | % | | | 0.52 | % | | | 0.16 | % |
| | | | | |
| | Net assets, end of period (in 000’s) | | $ | 811,782 | | | $ | 508,647 | | | $ | 556,458 | | | $ | 577,395 | |
| | | | | |
| | Ratio of net expenses to average net assets | | | 0.19 | %(e) | | | 0.20 | % | | | 0.20 | % | | | 0.20 | %(e) |
| | | | | |
| | Ratio of total expenses to average net assets | | | 0.23 | %(e) | | | 0.25 | % | | | 0.28 | % | | | 0.39 | %(e) |
| | | | | |
| | Ratio of net investment income to average net assets | | | 2.11 | %(e) | | | 1.33 | % | | | 0.51 | % | | | 0.19 | %(e) |
| | * | | Commenced operations on October 30, 2015. |
| | (a) | | Calculated based on the average shares outstanding methodology. |
| | (b) | | Amount is less than $0.0005 per share. |
| | (c) | | Distributions may not coincide with the current year net investment income or net realized gains as distributions may be paid from current or prior year earnings. |
| | (d) | | Assumes reinvestment of all distributions. Returns do not reflect the deduction of taxes that a shareholder would pay on Fund distributions. Total returns for periods less than one full year are not annualized. |
| | |
| 48 | | The accompanying notes are an integral part of these financial statements. |
FINANCIAL SQUARE FEDERAL INSTRUMENTS FUND
Financial Highlights(continued)
Selected Data for a Share Outstanding Throughout Each Period
| | | | | | | | | | | | | | | | | | |
| | | | | Financial Square Federal Instruments Fund | |
| | | | | Select Shares | |
| | | | | Six Months Ended
February 28, 2019
(Unaudited) | | | Year Ended August 31, | | | Period Ended
August 31, 2016* | |
| | 2018 | | | 2017 | |
| | Per Share Data: | | | | | | | | | | | | | | | | |
| | | | | |
| | Net asset value, beginning of period | | $ | 1.00 | | | $ | 1.00 | | | $ | 1.00 | | | $ | 1.00 | |
| | | | | |
| | Net investment income(a) | | | 0.010 | | | | 0.013 | | | | 0.005 | | | | 0.001 | |
| | | | | |
| | Net realized gain | | | — | (b) | | | — | (b) | | | — | (b) | | | — | (b) |
| | | | | | |
| | Total from investment operations | | | 0.010 | | | | 0.013 | | | | 0.005 | | | | 0.001 | |
| | | | | |
| | Distributions to shareholders from net investment income | | | (0.010 | ) | | | (0.013 | ) | | | (0.005 | ) | | | (0.001 | ) |
| | | | | |
| | Distributions to shareholders from net realized gains | | | — | (b) | | | — | (b) | | | — | (b) | | | — | (b) |
| | | | | | |
| | Total distributions(c) | | | (0.010 | ) | | | (0.013 | ) | | | (0.005 | ) | | | (0.001 | ) |
| | | | | |
| | Net asset value, end of period | | $ | 1.00 | | | $ | 1.00 | | | $ | 1.00 | | | $ | 1.00 | |
| | | | | |
| | Total return(d) | | | 1.03 | % | | | 1.31 | % | | | 0.49 | % | | | 0.13 | % |
| | | | | |
| | Net assets, end of period (in 000’s) | | $ | 48 | | | $ | 48 | | | $ | 47 | | | $ | 50 | |
| | | | | |
| | Ratio of net expenses to average net assets | | | 0.22 | % | | | 0.23 | % | | | 0.23 | % | | | 0.23 | %(e) |
| | | | | |
| | Ratio of total expenses to average net assets | | | 0.26 | %(e) | | | 0.28 | % | | | 0.31 | % | | | 0.42 | %(e) |
| | | | | |
| | Ratio of net investment income to average net assets | | | 2.07 | %(e) | | | 1.30 | % | | | 0.48 | % | | | 0.14 | %(e) |
| | * | | Commenced operations on October 30, 2015. |
| | (a) | | Calculated based on the average shares outstanding methodology. |
| | (b) | | Amount is less than $0.0005 per share. |
| | (c) | | Distributions may not coincide with the current year net investment income or net realized gains as distributions may be paid from current or prior year earnings. |
| | (d) | | Assumes reinvestment of all distributions. Returns do not reflect the deduction of taxes that a shareholder would pay on Fund distributions. Total returns for periods less than one full year are not annualized. |
| | |
| The accompanying notes are an integral part of these financial statements. | | 49 |
FINANCIAL SQUARE FEDERAL INSTRUMENTS FUND
Financial Highlights(continued)
Selected Data for a Share Outstanding Throughout Each Period
| | | | | | | | | | | | | | | | | | |
| | | | | Financial Square Federal Instruments Fund | |
| | | | | Preferred Shares | |
| | | | | Six Months Ended
February 28, 2019
(Unaudited) | | | Year Ended August 31, | | | Period Ended
August 31, 2016* | |
| | 2018 | | | 2017 | |
| | Per Share Data: | | | | | | | | | | | | | | | | |
| | | | | |
| | Net asset value, beginning of period | | $ | 1.00 | | | $ | 1.00 | | | $ | 1.00 | | | $ | 1.00 | |
| | | | | |
| | Net investment income(a) | | | 0.018 | | | | 0.012 | | | | 0.004 | | | | 0.001 | |
| | | | | |
| | Net realized loss | | | (0.008 | ) | | | — | (b) | | | — | (b) | | | — | (b) |
| | | | | | |
| | Total from investment operations | | | 0.010 | | | | 0.012 | | | | 0.004 | | | | 0.001 | |
| | | | | |
| | Distributions to shareholders from net investment income | | | (0.010 | ) | | | (0.012 | ) | | | (0.004 | ) | | | (0.001 | ) |
| | | | | |
| | Distributions to shareholders from net realized gains | | | — | (b) | | | — | (b) | | | — | (b) | | | — | (b) |
| | | | | | |
| | Total distributions(c) | | | (0.010 | ) | | | (0.012 | ) | | | (0.004 | ) | | | (0.001 | ) |
| | | | | |
| | Net asset value, end of period | | $ | 1.00 | | | $ | 1.00 | | | $ | 1.00 | | | $ | 1.00 | |
| | | | | |
| | Total return(d) | | | 1.00 | % | | | 1.24 | % | | | 0.42 | % | | | 0.08 | % |
| | | | | |
| | Net assets, end of period (in 000’s) | | $ | 7,739 | | | $ | 2,386 | | | $ | 50 | | | $ | 50 | |
| | | | | |
| | Ratio of net expenses to average net assets | | | 0.29 | %(e) | | | 0.30 | % | | | 0.30 | % | | | 0.29 | %(e) |
| | | | | |
| | Ratio of total expenses to average net assets | | | 0.33 | %(e) | | | 0.35 | % | | | 0.38 | % | | | 0.49 | %(e) |
| | | | | |
| | Ratio of net investment income to average net assets | | | 2.05 | %(e) | | | 1.43 | % | | | 0.41 | % | | | 0.08 | %(e) |
| | * | | Commenced operations on October 30, 2015. |
| | (a) | | Calculated based on the average shares outstanding methodology. |
| | (b) | | Amount is less than $0.0005 per share. |
| | (c) | | Distributions may not coincide with the current year net investment income or net realized gains as distributions may be paid from current or prior year earnings. |
| | (d) | | Assumes reinvestment of all distributions. Returns do not reflect the deduction of taxes that a shareholder would pay on Fund distributions. Total returns for periods less than one full year are not annualized. |
| | |
| 50 | | The accompanying notes are an integral part of these financial statements. |
FINANCIAL SQUARE FEDERAL INSTRUMENTS FUND
Financial Highlights(continued)
Selected Data for a Share Outstanding Throughout Each Period
| | | | | | | | | | | | | | | | | | |
| | | | | Financial Square Federal Instruments Fund | |
| | | | | Capital Shares | |
| | | | | Six Months Ended
February 28, 2019
(Unaudited) | | | Year Ended August 31, | | | Period Ended
August 31, 2016* | |
| | 2018 | | | 2017 | |
| | Per Share Data: | | | | | | | | | | | | | | | | |
| | | | | |
| | Net asset value, beginning of period | | $ | 1.00 | | | $ | 1.00 | | | $ | 1.00 | | | $ | 1.00 | |
| | | | | |
| | Net investment income(a) | | | 0.003 | | | | 0.012 | | | | 0.003 | | | | — | (b) |
| | | | | | |
| | Net realized gain | | | 0.007 | | | | — | (b) | | | 0.001 | | | | — | (b) |
| | | | | | |
| | Total from investment operations | | | 0.010 | | | | 0.012 | | | | 0.004 | | | | — | (b) |
| | | | | | |
| | Distributions to shareholders from net investment income | | | (0.010 | ) | | | (0.012 | ) | | | (0.004 | ) | | | — | (b) |
| | | | | | |
| | Distributions to shareholders from net realized gains | | | — | (b) | | | — | (b) | | | — | (b) | | | — | (b) |
| | | | | | |
| | Total distributions(c) | | | (0.010 | ) | | | (0.012 | ) | | | (0.004 | ) | | | — | (b) |
| | | | | | |
| | Net asset value, end of period | | $ | 1.00 | | | $ | 1.00 | | | $ | 1.00 | | | $ | 1.00 | |
| | | | | |
| | Total return(d) | | | 0.97 | % | | | 1.19 | % | | | 0.37 | % | | | 0.05 | % |
| | | | | |
| | Net assets, end of period (in 000’s) | | $ | 881 | | | $ | 5,136 | | | $ | 16,147 | | | $ | 50 | |
| | | | | |
| | Ratio of net expenses to average net assets | | | 0.34 | %(e) | | | 0.35 | % | | | 0.35 | % | | | 0.33 | %(e) |
| | | | | |
| | Ratio of total expenses to average net assets | | | 0.38 | %(e) | | | 0.40 | % | | | 0.43 | % | | | 0.54 | %(e) |
| | | | | |
| | Ratio of net investment income to average net assets | | | 1.80 | %(e) | | | 1.04 | % | | | 0.31 | % | | | 0.04 | %(e) |
| | * | | Commenced operations on October 30, 2015. |
| | (a) | | Calculated based on the average shares outstanding methodology. |
| | (b) | | Amount is less than $0.0005 per share. |
| | (c) | | Distributions may not coincide with the current year net investment income or net realized gains as distributions may be paid from current or prior year earnings. |
| | (d) | | Assumes reinvestment of all distributions. Returns do not reflect the deduction of taxes that a shareholder would pay on Fund distributions. Total returns for periods less than one full year are not annualized. |
| | |
| The accompanying notes are an integral part of these financial statements. | | 51 |
FINANCIAL SQUARE FEDERAL INSTRUMENTS FUND
Financial Highlights(continued)
Selected Data for a Share Outstanding Throughout Each Period
| | | | | | | | | | | | | | | | | | |
| | | | | Financial Square Federal Instruments Fund | |
| | | | | Administration Shares | |
| | | | | Six Months Ended
February 28, 2019
(Unaudited) | | | Year Ended August 31, | | | Period Ended
August 31, 2016* | |
| | 2018 | | | 2017 | |
| | Per Share Data: | | | | | | | | | | | | | | | | |
| | | | | |
| | Net asset value, beginning of period | | $ | 1.00 | | | $ | 1.00 | | | $ | 1.00 | | | $ | 1.00 | |
| | | | | |
| | Net investment income(a) | | | 0.009 | | | | 0.011 | | | | 0.003 | | | | — | (b) |
| | | | | | |
| | Net realized gain | | | — | (b) | | | — | (b) | | | — | (b) | | | — | (b) |
| | | | | | |
| | Total from investment operations | | | 0.009 | | | | 0.011 | | | | 0.003 | | | | — | (b) |
| | | | | | |
| | Distributions to shareholders from net investment income | | | (0.009 | ) | | | (0.011 | ) | | | (0.003 | ) | | | — | (b) |
| | | | | | |
| | Distributions to shareholders from net realized gains | | | — | (b) | | | — | (b) | | | — | (b) | | | — | (b) |
| | | | | | |
| | Total distributions(c) | | | (0.009 | ) | | | (0.011 | ) | | | (0.003 | ) | | | — | (b) |
| | | | | | |
| | Net asset value, end of period | | $ | 1.00 | | | $ | 1.00 | | | $ | 1.00 | | | $ | 1.00 | |
| | | | | |
| | Total return(d) | | | 0.92 | % | | | 1.09 | % | | | 0.27 | % | | | 0.01 | % |
| | | | | |
| | Net assets, end of period (in 000’s) | | $ | 58,277 | | | $ | 59,447 | | | $ | 50,768 | | | $ | 43,835 | |
| | | | | |
| | Ratio of net expenses to average net assets | | | 0.44 | %(e) | | | 0.45 | % | | | 0.45 | % | | | 0.39 | %(e) |
| | | | | |
| | Ratio of total expenses to average net assets | | | 0.48 | %(e) | | | 0.50 | % | | | 0.53 | % | | | 0.64 | %(e) |
| | | | | |
| | Ratio of net investment income (loss) to average net assets | | | 1.85 | %(e) | | | 1.08 | % | | | 0.26 | % | | | (0.01 | )%(e) |
| | * | | Commenced operations on October 30, 2015. |
| | (a) | | Calculated based on the average shares outstanding methodology. |
| | (b) | | Amount is less than $0.0005 per share. |
| | (c) | | Distributions may not coincide with the current year net investment income or net realized gains as distributions may be paid from current or prior year earnings. |
| | (d) | | Assumes reinvestment of all distributions. Returns do not reflect the deduction of taxes that a shareholder would pay on Fund distributions. Total returns for periods less than one full year are not annualized. |
| | |
| 52 | | The accompanying notes are an integral part of these financial statements. |
FINANCIAL SQUARE FEDERAL INSTRUMENTS FUND
Financial Highlights(continued)
Selected Data for a Share Outstanding Throughout Each Period
| | | | | | | | | | | | | | | | | | |
| | | | | Financial Square Federal Instruments Fund | |
| | | | | Premier Shares | |
| | | | | Six Months Ended
February 28, 2019
(Unaudited) | | | Year Ended August 31, | | | Period Ended
August 31, 2016* | |
| | 2018 | | | 2017 | |
| | Per Share Data: | | | | | | | | | | | | | | | | |
| | | | | |
| | Net asset value, beginning of period | | $ | 1.00 | | | $ | 1.00 | | | $ | 1.00 | | | $ | 1.00 | |
| | | | | |
| | Net investment income(a) | | | 0.009 | | | | 0.010 | | | | 0.002 | | | | — | (b) |
| | | | | | |
| | Net realized gain | | | — | (b) | | | — | (b) | | | — | (b) | | | — | (b) |
| | | | | | |
| | Total from investment operations | | | 0.009 | | | | 0.010 | | | | 0.002 | | | | — | (b) |
| | | | | | |
| | Distributions to shareholders from net investment income | | | (0.009 | ) | | | (0.010 | ) | | | (0.002 | ) | | | — | (b) |
| | | | | | |
| | Distributions to shareholders from net realized gains | | | — | (b) | | | — | (b) | | | — | (b) | | | — | (b) |
| | | | | | |
| | Total distributions(c) | | | (0.009 | ) | | | (0.010 | ) | | | (0.002 | ) | | | — | (b) |
| | | | | | |
| | Net asset value, end of period | | $ | 1.00 | | | $ | 1.00 | | | $ | 1.00 | | | $ | 1.00 | |
| | | | | |
| | Total return(d) | | | 0.87 | % | | | 0.99 | % | | | 0.19 | % | | | 0.01 | % |
| | | | | |
| | Net assets, end of period (in 000’s) | | $ | 51 | | | $ | 51 | | | $ | 50 | | | $ | 50 | |
| | | | | |
| | Ratio of net expenses to average net assets | | | 0.54 | %(e) | | | 0.55 | % | | | 0.53 | % | | | 0.38 | %(e) |
| | | | | |
| | Ratio of total expenses to average net assets | | | 0.58 | %(e) | | | 0.60 | % | | | 0.63 | % | | | 0.74 | %(e) |
| | | | | |
| | Ratio of net investment income to average net assets | | | 1.75 | %(e) | | | 0.99 | % | | | 0.19 | % | | | — | %(e)(f) |
| | * | | Commenced operations on October 30, 2015. |
| | (a) | | Calculated based on the average shares outstanding methodology. |
| | (b) | | Amount is less than $0.0005 per share. |
| | (c) | | Distributions may not coincide with the current year net investment income or net realized gains as distributions may be paid from current or prior year earnings. |
| | (d) | | Assumes reinvestment of all distributions. Returns do not reflect the deduction of taxes that a shareholder would pay on Fund distributions. Total returns for periods less than one full year are not annualized. |
| | (f) | | Amount is less than 0.005% of average net assets. |
| | |
| The accompanying notes are an integral part of these financial statements. | | 53 |
FINANCIAL SQUARE FEDERAL INSTRUMENTS FUND
Financial Highlights(continued)
Selected Data for a Share Outstanding Throughout Each Period
| | | | | | | | | | | | | | | | | | |
| | | | | Financial Square Federal Instruments Fund | |
| | | | | Service Shares | |
| | | | | Six Months Ended
February 28, 2019
(Unaudited) | | | Year Ended August 31, | | | Period Ended
August 31, 2016* | |
| | 2018 | | | 2017 | |
| | Per Share Data: | | | | | | | | | | | | | | | | |
| | | | | |
| | Net asset value, beginning of period | | $ | 1.00 | | | $ | 1.00 | | | $ | 1.00 | | | $ | 1.00 | |
| | | | | |
| | Net investment income(a) | | | 0.006 | | | | 0.008 | | | | 0.001 | | | | — | (b) |
| | | | | | |
| | Net realized gain | | | 0.002 | | | | — | (b) | | | — | (b) | | | — | (b) |
| | | | | | |
| | Total from investment operations | | | 0.008 | | | | 0.008 | | | | 0.001 | | | | — | (b) |
| | | | | | |
| | Distributions to shareholders from net investment income | | | (0.008 | ) | | | (0.008 | ) | | | (0.001 | ) | | | — | (b) |
| | | | | | |
| | Distributions to shareholders from net realized gains | | | — | (b) | | | — | (b) | | | — | (b) | | | — | (b) |
| | | | | | |
| | Total distributions(c) | | | (0.008 | ) | | | (0.008 | ) | | | (0.001 | ) | | | — | (b) |
| | | | | | |
| | Net asset value, end of period | | $ | 1.00 | | | $ | 1.00 | | | $ | 1.00 | | | $ | 1.00 | |
| | | | | |
| | Total return(d) | | | 0.80 | % | | | 0.84 | % | | | 0.10 | % | | | 0.01 | % |
| | | | | |
| | Net assets, end of period (in 000’s) | | $ | 10,516 | | | $ | 11,003 | | | $ | 15,129 | | | $ | 14,949 | |
| | | | | |
| | Ratio of net expenses to average net assets | | | 0.69 | %(e) | | | 0.70 | % | | | 0.62 | % | | | 0.39 | %(e) |
| | | | | |
| | Ratio of total expenses to average net assets | | | 0.73 | %(e) | | | 0.75 | % | | | 0.78 | % | | | 0.89 | %(e) |
| | | | | |
| | Ratio of net investment income (loss) to average net assets | | | 1.61 | %(e) | | | 0.83 | % | | | 0.09 | % | | | (0.01 | )%(e) |
| | * | | Commenced operations on October 30, 2015. |
| | (a) | | Calculated based on the average shares outstanding methodology. |
| | (b) | | Amount is less than $0.0005 per share. |
| | (c) | | Distributions may not coincide with the current year net investment income or net realized gains as distributions may be paid from current or prior year earnings. |
| | (d) | | Assumes reinvestment of all distributions. Returns do not reflect the deduction of taxes that a shareholder would pay on Fund distributions. Total returns for periods less than one full year are not annualized. |
| | |
| 54 | | The accompanying notes are an integral part of these financial statements. |
FINANCIAL SQUARE FEDERAL INSTRUMENTS FUND
Financial Highlights(continued)
Selected Data for a Share Outstanding Throughout Each Period
| | | | | | | | | | | | | | | | | | |
| | | | | Financial Square Federal Instruments Fund | |
| | | | | Cash Management Shares | |
| | | | | Six Months Ended
February 28, 2019
(Unaudited) | | | Year Ended August 31, | | | Period Ended
August 31, 2016* | |
| | 2018 | | | 2017 | |
| | Per Share Data: | | | | | | | | | | | | | | | | |
| | | | | |
| | Net asset value, beginning of period | | $ | 1.00 | | | $ | 1.00 | | | $ | 1.00 | | | $ | 1.00 | |
| | | | | |
| | Net investment income(a) | | | 0.006 | | | | 0.005 | | | | — | (b) | | | — | (b) |
| | | | | | |
| | Net realized gain | | | — | (b) | | | — | (b) | | | — | (b) | | | — | (b) |
| | | | | | |
| | Total from investment operations | | | 0.006 | | | | 0.005 | | | | — | (b) | | | — | (b) |
| | | | | | |
| | Distributions to shareholders from net investment income | | | (0.006 | ) | | | (0.005 | ) | | | — | (b) | | | — | (b) |
| | | | | | |
| | Distributions to shareholders from net realized gains | | | — | (b) | | | — | (b) | | | — | (b) | | | — | (b) |
| | | | | | |
| | Total distributions(c) | | | (0.006 | ) | | | (0.005 | ) | | | — | (b) | | | — | (b) |
| | | | | | |
| | Net asset value, end of period | | $ | 1.00 | | | $ | 1.00 | | | $ | 1.00 | | | $ | 1.00 | |
| | | | | |
| | Total return(d) | | | 0.65 | % | | | 0.53 | % | | | 0.01 | % | | | 0.01 | % |
| | | | | |
| | Net assets, end of period (in 000’s) | | $ | 51 | | | $ | 50 | | | $ | 50 | | | $ | 50 | |
| | | | | |
| | Ratio of net expenses to average net assets | | | 0.99 | %(e) | | | 1.00 | % | | | 0.71 | % | | | 0.38 | %(e) |
| | | | | |
| | Ratio of total expenses to average net assets | | | 1.03 | %(e) | | | 1.05 | % | | | 1.08 | % | | | 1.19 | %(e) |
| | | | | |
| | Ratio of net investment income to average net assets | | | 1.31 | %(e) | | | 0.53 | % | | | 0.01 | % | | | — | %(e)(f) |
| | * | | Commenced operations on October 30, 2015. |
| | (a) | | Calculated based on the average shares outstanding methodology. |
| | (b) | | Amount is less than $0.0005 per share. |
| | (c) | | Distributions may not coincide with the current year net investment income or net realized gains as distributions may be paid from current or prior year earnings. |
| | (d) | | Assumes reinvestment of all distributions. Returns do not reflect the deduction of taxes that a shareholder would pay on Fund distributions. Total returns for periods less than one full year are not annualized. |
| | (f) | | Amount is less than 0.005% of average net assets. |
| | |
| The accompanying notes are an integral part of these financial statements. | | 55 |
FINANCIAL SQUARE GOVERNMENT FUND
Financial Highlights(continued)
Selected Data for a Share Outstanding Throughout Each Period
| | | | | | | | | | | | | | | | | | | | | | | | | | |
| | | | | Financial Square Government Fund | |
| | | | | Institutional Shares | |
| | | | | Six Months Ended
February 28, 2019
(Unaudited) | | | Year Ended August 31, | |
| | | | | 2018 | | | 2017 | | | 2016 | | | 2015 | | | 2014 | |
| | Per Share Data: | | | | | | | | | | | | | | | | | | | | | | | | |
| | | | | | | |
| | Net asset value, beginning of period | | $ | 1.00 | | | $ | 1.00 | | | $ | 1.00 | | | $ | 1.00 | | | $ | 1.00 | | | $ | 1.00 | |
| | | | | | | |
| | Net investment income(a) | | | 0.011 | | | | 0.014 | | | | 0.006 | | | | 0.002 | | | | — | (b) | | | — | (b) |
| | | | | | | |
| | Net realized gain | | | — | (b) | | | — | (b) | | | — | (b) | | | — | (b) | | | — | (b) | | | — | (b) |
| | | | | | | |
| | Total from investment operations | | | 0.011 | | | | 0.014 | | | | 0.006 | | | | 0.002 | | | | — | (b) | | | — | (b) |
| | | | | | | |
| | Distributions to shareholders from net investment income | | | (0.011 | ) | | | (0.014 | ) | | | (0.006 | ) | | | (0.002 | ) | | | — | (b) | | | — | (b) |
| | | | | | | |
| | Distributions to shareholders from net realized gains | | | — | (b) | | | — | (b) | | | — | (b) | | | — | (b) | | | — | (b) | | | — | (b) |
| | | | | | | |
| | Total distributions(c) | | | (0.011 | ) | | | (0.014 | ) | | | (0.006 | ) | | | (0.002 | ) | | | — | (b) | | | — | (b) |
| | | | | | | |
| | Net asset value, end of period | | $ | 1.00 | | | $ | 1.00 | | | $ | 1.00 | | | $ | 1.00 | | | $ | 1.00 | | | $ | 1.00 | |
| | | | | | | |
| | Total return(d) | | | 1.07 | % | | | 1.38 | % | | | 0.55 | % | | | 0.20 | % | | | 0.01 | % | | | 0.01 | % |
| | | | | | | |
| | Net assets, end of period (in 000’s) | | $ | 91,021,629 | | | $ | 96,230,361 | | | $ | 79,411,937 | | | $ | 63,804,041 | | | $ | 29,753,210 | | | $ | 22,069,515 | |
| | | | | | | |
| | Ratio of net expenses to average net assets | | | 0.18 | %(e) | | | 0.17 | % | | | 0.18 | % | | | 0.18 | % | | | 0.14 | % | | | 0.12 | % |
| | | | | | | |
| | Ratio of total expenses to average net assets | | | 0.18 | %(e) | | | 0.19 | % | | | 0.23 | % | | | 0.23 | % | | | 0.23 | % | | | 0.23 | % |
| | | | | | | |
| | Ratio of net investment income to average net assets | | | 2.15 | %(e) | | | 1.39 | % | | | 0.55 | % | | | 0.21 | % | | | 0.01 | % | | | — | %(f) |
| | (a) | | Calculated based on the average shares outstanding methodology. |
| | (b) | | Amount is less than $0.0005 per share. |
| | (c) | | Distributions may not coincide with the current year net investment income or net realized gains as distributions may be paid from current or prior year earnings. |
| | (d) | | Assumes reinvestment of all distributions. Returns do not reflect the deduction of taxes that a shareholder would pay on Fund distributions. Total returns for periods less than one full year are not annualized. |
| | (f) | | Amount is less than 0.005% of average net assets. |
| | |
| 56 | | The accompanying notes are an integral part of these financial statements. |
FINANCIAL SQUARE GOVERNMENT FUND
Financial Highlights(continued)
Selected Data for a Share Outstanding Throughout Each Period
| | | | | | | | | | | | | | | | | | | | | | | | | | |
| | | | | Financial Square Government Fund | |
| | | | | Select Shares | |
| | | | | Six Months Ended
February 28, 2019
(Unaudited) | | | Year Ended August 31, | |
| | | | | 2018 | | | 2017 | | | 2016 | | | 2015 | | | 2014 | |
| | Per Share Data: | | | | | | | | | | | | | | | | | | | | | | | | |
| | | | | | | |
| | Net asset value, beginning of period | | $ | 1.00 | | | $ | 1.00 | | | $ | 1.00 | | | $ | 1.00 | | | $ | 1.00 | | | $ | 1.00 | |
| | | | | | | |
| | Net investment income(a) | | | 0.007 | | | | 0.013 | | | | 0.005 | | | | 0.002 | | | | — | (b) | | | — | (b) |
| | | | | | | | |
| | Net realized gain | | | 0.004 | | | | — | (b) | | | — | (b) | | | — | (b) | | | — | (b) | | | — | (b) |
| | | | | | | | |
| | Total from investment operations | | | 0.011 | | | | 0.013 | | | | 0.005 | | | | 0.002 | | | | — | (b) | | | — | (b) |
| | | | | | | | |
| | Distributions to shareholders from net investment income | | | (0.011 | ) | | | (0.013 | ) | | | (0.005 | ) | | | (0.002 | ) | | | — | (b) | | | — | (b) |
| | | | | | | | |
| | Distributions to shareholders from net realized gains | | | — | (b) | | | — | (b) | | | — | (b) | | | — | (b) | | | — | (b) | | | — | (b) |
| | | | | | | | |
| | Total distributions(c) | | | (0.011 | ) | | | (0.013 | ) | | | (0.005 | ) | | | (0.002 | ) | | | — | (b) | | | — | (b) |
| | | | | | | | |
| | Net asset value, end of period | | $ | 1.00 | | | $ | 1.00 | | | $ | 1.00 | | | $ | 1.00 | | | $ | 1.00 | | | $ | 1.00 | |
| | | | | | | |
| | Total return(d) | | | 1.05 | % | | | 1.35 | % | | | 0.52 | % | | | 0.17 | % | | | 0.01 | % | | | 0.01 | % |
| | | | | | | |
| | Net assets, end of period (in 000’s) | | $ | 656,196 | | | $ | 598,258 | | | $ | 2,921,971 | | | $ | 2,471,275 | | | $ | 203,098 | | | $ | 101,446 | |
| | | | | | | |
| | Ratio of net expenses to average net assets | | | 0.21 | %(e) | | | 0.20 | % | | | 0.21 | % | | | 0.21 | % | | | 0.14 | % | | | 0.12 | % |
| | | | | | | |
| | Ratio of total expenses to average net assets | | | 0.21 | %(e) | | | 0.22 | % | | | 0.26 | % | | | 0.26 | % | | | 0.26 | % | | | 0.26 | % |
| | | | | | | |
| | Ratio of net investment income to average net assets | | | 2.12 | %(e) | | | 1.19 | % | | | 0.52 | % | | | 0.21 | % | | | 0.01 | % | | | — | %(f) |
| | (a) | | Calculated based on the average shares outstanding methodology. |
| | (b) | | Amount is less than $0.0005 per share. |
| | (c) | | Distributions may not coincide with the current year net investment income or net realized gains as distributions may be paid from current or prior year earnings. |
| | (d) | | Assumes reinvestment of all distributions. Returns do not reflect the deduction of taxes that a shareholder would pay on Fund distributions. Total returns for periods less than one full year are not annualized. |
| | (f) | | Amount is less than 0.005% of average net assets. |
| | |
| The accompanying notes are an integral part of these financial statements. | | 57 |
FINANCIAL SQUARE GOVERNMENT FUND
Financial Highlights(continued)
Selected Data for a Share Outstanding Throughout Each Period
| | | | | | | | | | | | | | | | | | | | | | | | | | |
| | | | | Financial Square Government Fund | |
| | | | | Preferred Shares | |
| | | | | Six Months Ended
February 28, 2019
(Unaudited) | | | Year Ended August 31, | |
| | | | | 2018 | | | 2017 | | | 2016 | | | 2015 | | | 2014 | |
| | Per Share Data: | | | | | | | | | | | | | | | | | | | | | | | | |
| | | | | | | |
| | Net asset value, beginning of period | | $ | 1.00 | | | $ | 1.00 | | | $ | 1.00 | | | $ | 1.00 | | | $ | 1.00 | | | $ | 1.00 | |
| | | | | | | |
| | Net investment income(a) | | | 0.010 | | | | 0.013 | | | | 0.004 | | | | 0.001 | | | | — | (b) | | | — | (b) |
| | | | | | | | |
| | Net realized gain | | | — | (b) | | | — | (b) | | | 0.001 | | | | — | (b) | | | — | (b) | | | — | (b) |
| | | | | | | | |
| | Total from investment operations | | | 0.010 | | | | 0.013 | | | | 0.005 | | | | 0.001 | | | | — | (b) | | | — | (b) |
| | | | | | | | |
| | Distributions to shareholders from net investment income | | | (0.010 | ) | | | (0.013 | ) | | | (0.005 | ) | | | (0.001 | ) | | | — | (b) | | | — | (b) |
| | | | | | | | |
| | Distributions to shareholders from net realized gains | | | — | (b) | | | — | (b) | | | — | (b) | | | — | (b) | | | — | (b) | | | — | (b) |
| | | | | | | | |
| | Total distributions(c) | | | (0.010 | ) | | | (0.013 | ) | | | (0.005 | ) | | | (0.001 | ) | | | — | (b) | | | — | (b) |
| | | | | | | | |
| | Net asset value, end of period | | $ | 1.00 | | | $ | 1.00 | | | $ | 1.00 | | | $ | 1.00 | | | $ | 1.00 | | | $ | 1.00 | |
| | | | | | | |
| | Total return(d) | | | 1.02 | % | | | 1.28 | % | | | 0.45 | % | | | 0.12 | % | | | 0.01 | % | | | 0.01 | % |
| | | | | | | |
| | Net assets, end of period (in 000’s) | | $ | 737,387 | | | $ | 1,330,598 | | | $ | 553,781 | | | $ | 536,818 | | | $ | 249,542 | | | $ | 266,881 | |
| | | | | | | |
| | Ratio of net expenses to average net assets | | | 0.28 | %(e) | | | 0.27 | % | | | 0.28 | % | | | 0.27 | % | | | 0.14 | % | | | 0.12 | % |
| | | | | | | |
| | Ratio of total expenses to average net assets | | | 0.28 | %(e) | | | 0.29 | % | | | 0.33 | % | | | 0.33 | % | | | 0.33 | % | | | 0.33 | % |
| | | | | | | |
| | Ratio of net investment income to average net assets | | | 2.03 | %(e) | | | 1.32 | % | | | 0.43 | % | | | 0.13 | % | | | 0.01 | % | | | — | %(f) |
| | (a) | | Calculated based on the average shares outstanding methodology. |
| | (b) | | Amount is less than $0.0005 per share. |
| | (c) | | Distributions may not coincide with the current year net investment income or net realized gains as distributions may be paid from current or prior year earnings. |
| | (d) | | Assumes reinvestment of all distributions. Returns do not reflect the deduction of taxes that a shareholder would pay on Fund distributions. Total returns for periods less than one full year are not annualized. |
| | (f) | | Amount is less than 0.005% of average net assets. |
| | |
| 58 | | The accompanying notes are an integral part of these financial statements. |
FINANCIAL SQUARE GOVERNMENT FUND
Financial Highlights(continued)
Selected Data for a Share Outstanding Throughout Each Period
| | | | | | | | | | | | | | | | | | | | | | | | | | |
| | | | | Financial Square Government Fund | |
| | | | | Capital Shares | |
| | | | | Six Months Ended
February 28, 2019
(Unaudited) | | | Year Ended August 31, | |
| | | | | 2018 | | | 2017 | | | 2016 | | | 2015 | | | 2014 | |
| | Per Share Data: | | | | | | | | | | | | | | | | | | | | | | | | |
| | | | | | | |
| | Net asset value, beginning of period | | $ | 1.00 | | | $ | 1.00 | | | $ | 1.00 | | | $ | 1.00 | | | $ | 1.00 | | | $ | 1.00 | |
| | | | | | | |
| | Net investment income(a) | | | 0.011 | | | | 0.012 | | | | 0.004 | | | | 0.001 | | | | — | (b) | | | — | (b) |
| | | | | | | | |
| | Net realized loss | | | (0.001 | ) | | | — | (b) | | | — | (b) | | | — | (b) | | | — | (b) | | | — | (b) |
| | | | | | | | |
| | Total from investment operations | | | 0.010 | | | | 0.012 | | | | 0.004 | | | | 0.001 | | | | — | (b) | | | — | (b) |
| | | | | | | | |
| | Distributions to shareholders from net investment income | | | (0.010 | ) | | | (0.012 | ) | | | (0.004 | ) | | | (0.001 | ) | | | — | (b) | | | — | (b) |
| | | | | | | | |
| | Distributions to shareholders from net realized gains | | | — | (b) | | | — | (b) | | | — | (b) | | | — | (b) | | | — | (b) | | | — | (b) |
| | | | | | | | |
| | Total distributions(c) | | | (0.010 | ) | | | (0.012 | ) | | | (0.004 | ) | | | (0.001 | ) | | | — | (b) | | | — | (b) |
| | | | | | | | |
| | Net asset value, end of period | | $ | 1.00 | | | $ | 1.00 | | | $ | 1.00 | | | $ | 1.00 | | | $ | 1.00 | | | $ | 1.00 | |
| | | | | | | |
| | Total return(d) | | | 0.99 | % | | | 1.22 | % | | | 0.40 | % | | | 0.08 | % | | | 0.01 | % | | | 0.01 | % |
| | | | | | | |
| | Net assets, end of period (in 000’s) | | $ | 1,778,566 | | | $ | 1,287,999 | | | $ | 893,496 | | | $ | 1,390,271 | | | $ | 1,174,099 | | | $ | 1,113,078 | |
| | | | | | | |
| | Ratio of net expenses to average net assets | | | 0.33 | %(e) | | | 0.32 | % | | | 0.33 | % | | | 0.30 | % | | | 0.14 | % | | | 0.12 | % |
| | | | | | | |
| | Ratio of total expenses to average net assets | | | 0.33 | %(e) | | | 0.34 | % | | | 0.38 | % | | | 0.38 | % | | | 0.38 | % | | | 0.38 | % |
| | | | | | | |
| | Ratio of net investment income to average net assets | | | 2.02 | %(e) | | | 1.24 | % | | | 0.37 | % | | | 0.07 | % | | | 0.01 | % | | | — | %(f) |
| | (a) | | Calculated based on the average shares outstanding methodology. |
| | (b) | | Amount is less than $0.0005 per share. |
| | (c) | | Distributions may not coincide with the current year net investment income or net realized gains as distributions may be paid from current or prior year earnings. |
| | (d) | | Assumes reinvestment of all distributions. Returns do not reflect the deduction of taxes that a shareholder would pay on Fund distributions. Total returns for periods less than one full year are not annualized. |
| | (f) | | Amount is less than 0.005% of average net assets. |
| | |
| The accompanying notes are an integral part of these financial statements. | | 59 |
FINANCIAL SQUARE GOVERNMENT FUND
Financial Highlights(continued)
Selected Data for a Share Outstanding Throughout Each Period
| | | | | | | | | | | | | | | | | | | | | | | | | | |
| | | | | Financial Square Government Fund | |
| | | | | Administration Shares | |
| | | | | Six Months Ended
February 28, 2019
(Unaudited) | | | Year Ended August 31, | |
| | | | | 2018 | | | 2017 | | | 2016 | | | 2015 | | | 2014 | |
| | Per Share Data: | | | | | | | | | | | | | | | | | | | | | | | | |
| | | | | | | |
| | Net asset value, beginning of period | | $ | 1.00 | | | $ | 1.00 | | | $ | 1.00 | | | $ | 1.00 | | | $ | 1.00 | | | $ | 1.00 | |
| | | | | | | |
| | Net investment income(a) | | | 0.011 | | | | 0.011 | | | | 0.003 | | | | — | (b) | | | — | (b) | | | — | (b) |
| | | | | | | | |
| | Net realized loss | | | (0.002 | ) | | | — | (b) | | | — | (b) | | | — | (b) | | | — | (b) | | | — | (b) |
| | | | | | | | |
| | Total from investment operations | | | 0.009 | | | | 0.011 | | | | 0.003 | | | | — | (b) | | | — | (b) | | | — | (b) |
| | | | | | | | |
| | Distributions to shareholders from net investment income | | | (0.009 | ) | | | (0.011 | ) | | | (0.003 | ) | | | — | (b) | | | — | (b) | | | — | (b) |
| | | | | | | | |
| | Distributions to shareholders from net realized gains | | | — | (b) | | | — | (b) | | | — | (b) | | | — | (b) | | | — | (b) | | | — | (b) |
| | | | | | | | |
| | Total distributions(c) | | | (0.009 | ) | | | (0.011 | ) | | | (0.003 | ) | | | — | (b) | | | — | (b) | | | — | (b) |
| | | | | | | | |
| | Net asset value, end of period | | $ | 1.00 | | | $ | 1.00 | | | $ | 1.00 | | | $ | 1.00 | | | $ | 1.00 | | | $ | 1.00 | |
| | | | | | | |
| | Total return(d) | | | 0.94 | % | | | 1.12 | % | | | 0.30 | % | | | 0.02 | % | | | 0.01 | % | | | 0.01 | % |
| | | | | | | |
| | Net assets, end of period (in 000’s) | | $ | 5,202,651 | | | $ | 4,454,065 | | | $ | 4,138,362 | | | $ | 2,673,689 | | | $ | 1,920,203 | | | $ | 1,939,309 | |
| | | | | | | |
| | Ratio of net expenses to average net assets | | | 0.43 | %(e) | | | 0.42 | % | | | 0.43 | % | | | 0.36 | % | | | 0.14 | % | | | 0.12 | % |
| | | | | | | |
| | Ratio of total expenses to average net assets | | | 0.43 | %(e) | | | 0.44 | % | | | 0.48 | % | | | 0.48 | % | | | 0.48 | % | | | 0.48 | % |
| | | | | | | |
| | Ratio of net investment income to average net assets | | | 1.92 | %(e) | | | 1.13 | % | | | 0.32 | % | | | 0.01 | % | | | 0.01 | % | | | — | %(f) |
| | (a) | | Calculated based on the average shares outstanding methodology. |
| | (b) | | Amount is less than $0.0005 per share. |
| | (c) | | Distributions may not coincide with the current year net investment income or net realized gains as distributions may be paid from current or prior year earnings. |
| | (d) | | Assumes reinvestment of all distributions. Returns do not reflect the deduction of taxes that a shareholder would pay on Fund distributions. Total returns for periods less than one full year are not annualized. |
| | (f) | | Amount is less than 0.005% of average net assets. |
| | |
| 60 | | The accompanying notes are an integral part of these financial statements. |
FINANCIAL SQUARE GOVERNMENT FUND
Financial Highlights(continued)
Selected Data for a Share Outstanding Throughout Each Period
| | | | | | | | | | | | | | | | | | | | | | | | | | |
| | | | | Financial Square Government Fund | |
| | | | | Premier Shares | |
| | | | | Six Months Ended
February 28, 2019
(Unaudited) | | | Year Ended August 31, | |
| | | | | 2018 | | | 2017 | | | 2016 | | | 2015 | | | 2014 | |
| | Per Share Data: | | | | | | | | | | | | | | | | | | | | | | | | |
| | | | | | | |
| | Net asset value, beginning of period | | $ | 1.00 | | | $ | 1.00 | | | $ | 1.00 | | | $ | 1.00 | | | $ | 1.00 | | | $ | 1.00 | |
| | | | | | | |
| | Net investment income(a) | | | 0.009 | | | | 0.010 | | | | 0.003 | | | | — | (b) | | | — | (b) | | | — | (b) |
| | | | | | | | |
| | Net realized loss | | | — | (b) | | | — | (b) | | | (0.001 | ) | | | — | (b) | | | — | (b) | | | — | (b) |
| | | | | | | | |
| | Total from investment operations | | | 0.009 | | | | 0.010 | | | | 0.002 | | | | — | (b) | | | — | (b) | | | — | (b) |
| | | | | | | | |
| | Distributions to shareholders from net investment income | | | (0.009 | ) | | | (0.010 | ) | | | (0.002 | ) | | | — | (b) | | | — | (b) | | | — | (b) |
| | | | | | | | |
| | Distributions to shareholders from net realized gains | | | — | (b) | | | — | (b) | | | — | (b) | | | — | (b) | | | — | (b) | | | — | (b) |
| | | | | | | | |
| | Total distributions(c) | | | (0.009 | ) | | | (0.010 | ) | | | (0.002 | ) | | | — | (b) | | | — | (b) | | | — | (b) |
| | | | | | | | |
| | Net asset value, end of period | | $ | 1.00 | | | $ | 1.00 | | | $ | 1.00 | | | $ | 1.00 | | | $ | 1.00 | | | $ | 1.00 | |
| | | | | | | |
| | Total return(d) | | | 0.89 | % | | | 1.02 | % | | | 0.22 | % | | | 0.02 | % | | | 0.01 | % | | | 0.01 | % |
| | | | | | | |
| | Net assets, end of period (in 000’s) | | $ | 227,339 | | | $ | 168,032 | | | $ | 101,311 | | | $ | 1 | | | $ | 1 | | | $ | 1 | |
| | | | | | | |
| | Ratio of net expenses to average net assets | | | 0.53 | %(e) | | | 0.52 | % | | | 0.52 | % | | | 0.20 | % | | | 0.14 | % | | | 0.12 | % |
| | | | | | | |
| | Ratio of total expenses to average net assets | | | 0.53 | %(e) | | | 0.54 | % | | | 0.58 | % | | | 0.58 | % | | | 0.58 | % | | | 0.58 | % |
| | | | | | | |
| | Ratio of net investment income to average net assets | | | 1.81 | %(e) | | | 0.99 | % | | | 0.28 | % | | | 0.40 | % | | | 0.40 | % | | | — | %(f) |
| | (a) | | Calculated based on the average shares outstanding methodology. |
| | (b) | | Amount is less than $0.0005 per share. |
| | (c) | | Distributions may not coincide with the current year net investment income or net realized gains as distributions may be paid from current or prior year earnings. |
| | (d) | | Assumes reinvestment of all distributions. Returns do not reflect the deduction of taxes that a shareholder would pay on Fund distributions. Total returns for periods less than one full year are not annualized. |
| | (f) | | Amount is less than 0.005% of average net assets. |
| | |
| The accompanying notes are an integral part of these financial statements. | | 61 |
FINANCIAL SQUARE GOVERNMENT FUND
Financial Highlights(continued)
Selected Data for a Share Outstanding Throughout Each Period
| | | | | | | | | | | | | | | | | | | | | | | | | | |
| | | | | Financial Square Government Fund | |
| | | | | Service Shares | |
| | | | | Six Months Ended
February 28, 2019
(Unaudited) | | | Year Ended August 31, | |
| | | | | 2018 | | | 2017 | | | 2016 | | | 2015 | | | 2014 | |
| | Per Share Data: | | | | | | | | | | | | | | | | | | | | | | | | |
| | | | | | | |
| | Net asset value, beginning of period | | $ | 1.00 | | | $ | 1.00 | | | $ | 1.00 | | | $ | 1.00 | | | $ | 1.00 | | | $ | 1.00 | |
| | | | | | | |
| | Net investment income(a) | | | 0.009 | | | | 0.009 | | | | 0.001 | | | | — | (b) | | | — | (b) | | | — | (b) |
| | | | | | | | |
| | Net realized loss | | | (0.001 | ) | | | — | (b) | | | — | (b) | | | — | (b) | | | — | (b) | | | — | (b) |
| | | | | | | | |
| | Total from investment operations | | | 0.008 | | | | 0.009 | | | | 0.001 | | | | — | (b) | | | — | (b) | | | — | (b) |
| | | | | | | | |
| | Distributions to shareholders from net investment income | | | (0.008 | ) | | | (0.009 | ) | | | (0.001 | ) | | | — | (b) | | | — | (b) | | | — | (b) |
| | | | | | | | |
| | Distributions to shareholders from net realized gains | | | — | (b) | | | — | (b) | | | — | (b) | | | — | (b) | | | — | (b) | | | — | (b) |
| | | | | | | | |
| | Total distributions(c) | | | (0.008 | ) | | | (0.009 | ) | | | (0.001 | ) | | | — | (b) | | | — | (b) | | | — | (b) |
| | | | | | | | |
| | Net asset value, end of period | | $ | 1.00 | | | $ | 1.00 | | | $ | 1.00 | | | $ | 1.00 | | | $ | 1.00 | | | $ | 1.00 | |
| | | | | | | |
| | Total return(d) | | | 0.82 | % | | | 0.87 | % | | | 0.12 | % | | | 0.01 | % | | | 0.01 | % | | | 0.01 | % |
| | | | | | | |
| | Net assets, end of period (in 000’s) | | $ | 598,647 | | | $ | 587,810 | | | $ | 337,219 | | | $ | 368,299 | | | $ | 468,041 | | | $ | 376,094 | |
| | | | | | | |
| | Ratio of net expenses to average net assets | | | 0.68 | %(e) | | | 0.67 | % | | | 0.60 | % | | | 0.36 | % | | | 0.14 | % | | | 0.12 | % |
| | | | | | | |
| | Ratio of total expenses to average net assets | | | 0.68 | %(e) | | | 0.69 | % | | | 0.73 | % | | | 0.73 | % | | | 0.73 | % | | | 0.73 | % |
| | | | | | | |
| | Ratio of net investment income (loss) to average net assets | | | 1.65 | %(e) | | | 0.93 | % | | | 0.11 | % | | | (0.01 | )% | | | 0.01 | % | | | — | %(f) |
| | (a) | | Calculated based on the average shares outstanding methodology. |
| | (b) | | Amount is less than $0.0005 per share. |
| | (c) | | Distributions may not coincide with the current year net investment income or net realized gains as distributions may be paid from current or prior year earnings. |
| | (d) | | Assumes reinvestment of all distributions. Returns do not reflect the deduction of taxes that a shareholder would pay on Fund distributions. Total returns for periods less than one full year are not annualized. |
| | (f) | | Amount is less than 0.005% of average net assets. |
| | |
| 62 | | The accompanying notes are an integral part of these financial statements. |
FINANCIAL SQUARE GOVERNMENT FUND
Financial Highlights(continued)
Selected Data for a Share Outstanding Throughout Each Period
| | | | | | | | | | | | | | | | | | |
| | | | | Financial Square Government Fund | |
| | | | | Class A Shares | |
| | | | | Six Months Ended
February 28, 2019
(Unaudited) | | | Year Ended August 31, | | | Period Ended
August 31, 2016* | |
| | 2018 | | | 2017 | |
| | Per Share Data: | | | | | | | | | | | | | | | | |
| | | | | |
| | Net asset value, beginning of period | | $ | 1.00 | | | $ | 1.00 | | | $ | 1.00 | | | $ | 1.00 | |
| | | | | |
| | Net investment income(a) | | | 0.009 | | | | 0.011 | | | | 0.003 | | | | — | (b) |
| | | | | | |
| | Net realized gain | | | — | (b) | | | — | (b) | | | — | (b) | | | — | (b) |
| | | | | | |
| | Total from investment operations | | | 0.009 | | | | 0.011 | | | | 0.003 | | | | — | (b) |
| | | | | | |
| | Distributions to shareholders from net investment income | | | (0.009 | ) | | | (0.011 | ) | | | (0.003 | ) | | | — | (b) |
| | | | | | |
| | Distributions to shareholders from net realized gains | | | — | (b) | | | — | (b) | | | — | (b) | | | — | (b) |
| | | | | | |
| | Total distributions(c) | | | (0.009 | ) | | | (0.011 | ) | | | (0.003 | ) | | | — | (b) |
| | | | | | |
| | Net asset value, end of period | | $ | 1.00 | | | $ | 1.00 | | | $ | 1.00 | | | $ | 1.00 | |
| | | | | |
| | Total return(d) | | | 0.94 | % | | | 1.12 | % | | | 0.30 | % | | | 0.01 | % |
| | | | | |
| | Net assets, end of period (in 000’s) | | $ | 70,106 | | | $ | 69,681 | | | $ | 55,506 | | | $ | 1,563 | |
| | | | | |
| | Ratio of net expenses to average net assets | | | 0.43 | %(e) | | | 0.42 | % | | | 0.43 | % | | | 0.43 | %(e) |
| | | | | |
| | Ratio of total expenses to average net assets | | | 0.43 | %(e) | | | 0.44 | % | | | 0.48 | % | | | 0.48 | %(e) |
| | | | | |
| | Ratio of net investment income to average net assets | | | 1.90 | %(e) | | | 1.12 | % | | | 0.34 | % | | | 0.02 | %(e) |
| | * | | Commenced operations on February 29, 2016. |
| | (a) | | Calculated based on the average shares outstanding methodology. |
| | (b) | | Amount is less than $0.0005 per share. |
| | (c) | | Distributions may not coincide with the current year net investment income or net realized gains as distributions may be paid from current or prior year earnings. |
| | (d) | | Assumes reinvestment of all distributions. Returns do not reflect the deduction of taxes that a shareholder would pay on Fund distributions. Total returns for periods less than one full year are not annualized. |
| | |
| The accompanying notes are an integral part of these financial statements. | | 63 |
FINANCIAL SQUARE GOVERNMENT FUND
Financial Highlights(continued)
Selected Data for a Share Outstanding Throughout Each Period
| | | | | | | | | | | | | | | | | | |
| | | | | Financial Square Government Fund | |
| | | | | Class C Shares | |
| | | | | Six Months Ended
February 28, 2019
(Unaudited) | | | Year Ended August 31, | | | Period Ended
August 31, 2016* | |
| | 2018 | | | 2017 | |
| | Per Share Data: | | | | | | | | | | | | | | | | |
| | | | | |
| | Net asset value, beginning of period | | $ | 1.00 | | | $ | 1.00 | | | $ | 1.00 | | | $ | 1.00 | |
| | | | | |
| | Net investment income(a) | | | 0.005 | | | | 0.004 | | | | — | (b) | | | — | (b) |
| | | | | | |
| | Net realized gain | | | 0.001 | | | | — | (b) | | | — | (b) | | | — | (b) |
| | | | | | |
| | Total from investment operations | | | 0.006 | | | | 0.004 | | | | — | (b) | | | — | (b) |
| | | | | | |
| | Distributions to shareholders from net investment income | | | (0.006 | ) | | | (0.004 | ) | | | — | (b) | | | — | (b) |
| | | | | | |
| | Distributions to shareholders from net realized gains | | | — | (b) | | | — | (b) | | | — | (b) | | | — | (b) |
| | | | | | |
| | Total distributions(c) | | | (0.006 | ) | | | (0.004 | ) | | | — | (b) | | | — | (b) |
| | | | | | |
| | Net asset value, end of period | | $ | 1.00 | | | $ | 1.00 | | | $ | 1.00 | | | $ | 1.00 | |
| | | | | |
| | Total return(d) | | | 0.57 | % | | | 0.39 | % | | | 0.01 | % | | | 0.01 | % |
| | | | | |
| | Net assets, end of period (in 000’s) | | $ | 4,589 | | | $ | 4,928 | | | $ | 5,937 | | | $ | 413 | |
| | | | | |
| | Ratio of net expenses to average net assets | | | 1.18 | %(e) | | | 1.15 | % | | | 0.70 | % | | | 0.44 | %(e) |
| | | | | |
| | Ratio of total expenses to average net assets | | | 1.18 | %(e) | | | 1.19 | % | | | 1.23 | % | | | 1.23 | %(e) |
| | | | | |
| | Ratio of net investment income to average net assets | | | 1.15 | %(e) | | | 0.37 | % | | | 0.01 | % | | | 0.01 | %(e) |
| | * | | Commenced operations on February 29, 2016. |
| | (a) | | Calculated based on the average shares outstanding methodology. |
| | (b) | | Amount is less than $0.0005 per share. |
| | (c) | | Distributions may not coincide with the current year net investment income or net realized gains as distributions may be paid from current or prior year earnings. |
| | (d) | | Assumes reinvestment of all distributions. Returns do not reflect the deduction of taxes that a shareholder would pay on Fund distributions. Total returns for periods less than one full year are not annualized. |
| | |
| 64 | | The accompanying notes are an integral part of these financial statements. |
FINANCIAL SQUARE GOVERNMENT FUND
Financial Highlights(continued)
Selected Data for a Share Outstanding Throughout Each Period
| | | | | | | | | | | | | | | | | | | | | | | | | | |
| | | | | Financial Square Government Fund | |
| | | | | Resource Shares | |
| | | | | Six Months Ended
February 28, 2019
(Unaudited) | | | Year Ended August 31, | |
| | | | | 2018 | | | 2017 | | | 2016 | | | 2015 | | | 2014 | |
| | Per Share Data: | | | | | | | | | | | | | | | | | | | | | | | | |
| | | | | | | |
| | Net asset value, beginning of period | | $ | 1.00 | | | $ | 1.00 | | | $ | 1.00 | | | $ | 1.00 | | | $ | 1.00 | | | $ | 1.00 | |
| | | | | | | |
| | Net investment income(a) | | | 0.007 | | | | 0.007 | | | | 0.001 | | | | — | (b) | | | — | (b) | | | — | (b) |
| | | | | | | | |
| | Net realized gain | �� | | — | (b) | | | — | (b) | | | — | (b) | | | — | (b) | | | — | (b) | | | — | (b) |
| | | | | | | | |
| | Total from investment operations | | | 0.007 | | | | 0.007 | | | | 0.001 | | | | — | (b) | | | — | (b) | | | — | (b) |
| | | | | | | | |
| | Distributions to shareholders from net investment income | | | (0.007 | ) | | | (0.007 | ) | | | (0.001 | ) | | | — | (b) | | | — | (b) | | | — | (b) |
| | | | | | | | |
| | Distributions to shareholders from net realized gains | | | — | (b) | | | — | (b) | | | — | (b) | | | — | (b) | | | — | (b) | | | — | (b) |
| | | | | | | | |
| | Total distributions(c) | | | (0.007 | ) | | | (0.007 | ) | | | (0.001 | ) | | | — | (b) | | | — | (b) | | | — | (b) |
| | | | | | | | |
| | Net asset value, end of period | | $ | 1.00 | | | $ | 1.00 | | | $ | 1.00 | | | $ | 1.00 | | | $ | 1.00 | | | $ | 1.00 | |
| | | | | | | |
| | Total return(d) | | | 0.74 | % | | | 0.72 | % | | | 0.05 | % | | | 0.01 | % | | | 0.01 | % | | | 0.01 | % |
| | | | | | | |
| | Net assets, end of period (in 000’s) | | $ | 56,086 | | | $ | 70,747 | | | $ | 74,864 | | | $ | 17,634 | | | $ | 1 | | | $ | 1 | |
| | | | | | | |
| | Ratio of net expenses to average net assets | | | 0.83 | %(e) | | | 0.82 | % | | | 0.69 | % | | | 0.43 | % | | | 0.14 | % | | | 0.12 | % |
| | | | | | | |
| | Ratio of total expenses to average net assets | | | 0.83 | %(e) | | | 0.84 | % | | | 0.88 | % | | | 0.88 | % | | | 0.88 | % | | | 0.88 | % |
| | | | | | | |
| | Ratio of net investment income (loss) to average net assets | | | 1.49 | %(e) | | | 0.70 | % | | | 0.06 | % | | | (0.01 | )% | | | 0.40 | % | | | 0.40 | % |
| | (a) | | Calculated based on the average shares outstanding methodology. |
| | (b) | | Amount is less than $0.0005 per share. |
| | (c) | | Distributions may not coincide with the current year net investment income or net realized gains as distributions may be paid from current or prior year earnings. |
| | (d) | | Assumes reinvestment of all distributions. Returns do not reflect the deduction of taxes that a shareholder would pay on Fund distributions. Total returns for periods less than one full year are not annualized. |
| | |
| The accompanying notes are an integral part of these financial statements. | | 65 |
FINANCIAL SQUARE GOVERNMENT FUND
Financial Highlights(continued)
Selected Data for a Share Outstanding Throughout Each Period
| | | | | | | | | | | | | | | | | | | | | | | | | | |
| | | | | Financial Square Government Fund | |
| | | | | Cash Management Shares | |
| | | | | Six Months Ended
February 28, 2019
(Unaudited) | | | Year Ended August 31, | |
| | | | | 2018 | | | 2017 | | | 2016 | | | 2015 | | | 2014 | |
| | Per Share Data: | | | | | | | | | | | | | | | | | | | | | | | | |
| | | | | | | |
| | Net asset value, beginning of period | | $ | 1.00 | | | $ | 1.00 | | | $ | 1.00 | | | $ | 1.00 | | | $ | 1.00 | | | $ | 1.00 | |
| | | | | | | |
| | Net investment income(a) | | | 0.008 | | | | 0.006 | | | | — | (b) | | | — | (b) | | | — | (b) | | | — | (b) |
| | | | | | | | |
| | Net realized loss | | | (0.001 | ) | | | — | (b) | | | — | (b) | | | — | (b) | | | — | (b) | | | — | (b) |
| | | | | | | | |
| | Total from investment operations | | | 0.007 | | | | 0.006 | | | | — | (b) | | | — | (b) | | | — | (b) | | | — | (b) |
| | | | | | | | |
| | Distributions to shareholders from net investment income | | | (0.007 | ) | | | (0.006 | ) | | | — | (b) | | | — | (b) | | | — | (b) | | | — | (b) |
| | | | | | | | |
| | Distributions to shareholders from net realized gains | | | — | (b) | | | — | (b) | | | — | (b) | | | — | (b) | | | — | (b) | | | — | (b) |
| | | | | | | | |
| | Total distributions(c) | | | (0.007 | ) | | | (0.006 | ) | | | — | (b) | | | — | (b) | | | — | (b) | | | — | (b) |
| | | | | | | | |
| | Net asset value, end of period | | $ | 1.00 | | | $ | 1.00 | | | $ | 1.00 | | | $ | 1.00 | | | $ | 1.00 | | | $ | 1.00 | |
| | | | | | | |
| | Total return(d) | | | 0.67 | % | | | 0.57 | % | | | 0.02 | % | | | 0.02 | % | | | 0.01 | % | | | 0.01 | % |
| | | | | | | |
| | Net assets, end of period (in 000’s) | | $ | 7,047 | | | $ | 6,573 | | | $ | 3,779 | | | $ | 14 | | | $ | 4 | | | $ | 1 | |
| | | | | | | |
| | Ratio of net expenses to average net assets | | | 0.98 | %(e) | | | 0.97 | % | | | 0.62 | % | | | 0.35 | % | | | 0.14 | % | | | 0.12 | % |
| | | | | | | |
| | Ratio of total expenses to average net assets | | | 0.98 | %(e) | | | 0.99 | % | | | 1.03 | % | | | 1.03 | % | | | 1.03 | % | | | 1.03 | % |
| | | | | | | |
| | Ratio of net investment income to average net assets | | | 1.37 | %(e) | | | 0.64 | % | | | 0.01 | % | | | 0.06 | % | | | 0.22 | % | | | 0.40 | % |
| | (a) | | Calculated based on the average shares outstanding methodology. |
| | (b) | | Amount is less than $0.0005 per share. |
| | (c) | | Distributions may not coincide with the current year net investment income or net realized gains as distributions may be paid from current or prior year earnings. |
| | (d) | | Assumes reinvestment of all distributions. Returns do not reflect the deduction of taxes that a shareholder would pay on Fund distributions. Total returns for periods less than one full year are not annualized. |
| | |
| 66 | | The accompanying notes are an integral part of these financial statements. |
FINANCIAL SQUARE GOVERNMENT FUND
Financial Highlights(continued)
Selected Data for a Share Outstanding Throughout Each Period
| | | | | | | | | | | | | | | | | | |
| �� | | | | Financial Square Government Fund | |
| | | | | Class R6 Shares | |
| | | | | Six Months Ended
February 28, 2019
(Unaudited) | | | Year Ended August 31, | | | Period Ended
August 31, 2016* | |
| | 2018 | | | 2017 | |
| | Per Share Data: | | | | | | | | | | | | | | | | |
| | | | | |
| | Net asset value, beginning of period | | $ | 1.00 | | | $ | 1.00 | | | $ | 1.00 | | | $ | 1.00 | |
| | | | | |
| | Net investment income(a) | | | 0.013 | | | | 0.014 | | | | 0.006 | | | | 0.002 | |
| | | | | |
| | Net realized loss | | | (0.002 | ) | | | — | (b) | | | — | (b) | | | — | (b) |
| | | | | | |
| | Total from investment operations | | | 0.011 | | | | 0.014 | | | | 0.006 | | | | 0.002 | |
| | | | | |
| | Distributions to shareholders from net investment income | | | (0.011 | ) | | | (0.014 | ) | | | (0.006 | ) | | | (0.002 | ) |
| | | | | |
| | Distributions to shareholders from net realized gains | | | — | (b) | | | — | (b) | | | — | (b) | | | — | (b) |
| | | | | | |
| | Total distributions(c) | | | (0.011 | ) | | | (0.014 | ) | | | (0.006 | ) | | | (0.002 | ) |
| | | | | |
| | Net asset value, end of period | | $ | 1.00 | | | $ | 1.00 | | | $ | 1.00 | | | $ | 1.00 | |
| | | | | |
| | Total return(d) | | | 1.07 | % | | | 1.38 | % | | | 0.55 | % | | | 0.18 | % |
| | | | | |
| | Net assets, end of period (in 000’s) | | $ | 45,809 | | | $ | 49,441 | | | $ | 12,773 | | | $ | 4,705 | |
| | | | | |
| | Ratio of net expenses to average net assets | | | 0.18 | %(e) | | | 0.17 | % | | | 0.18 | % | | | 0.18 | %(e) |
| | | | | |
| | Ratio of total expenses to average net assets | | | 0.18 | %(e) | | | 0.19 | % | | | 0.23 | % | | | 0.23 | %(e) |
| | | | | |
| | Ratio of net investment income to average net assets | | | 2.18 | %(e) | | | 1.54 | % | | | 0.56 | % | | | 0.26 | %(e) |
| | * | | Commenced operations on December 29, 2015. |
| | (a) | | Calculated based on the average shares outstanding methodology. |
| | (b) | | Amount is less than $0.0005 per share. |
| | (c) | | Distributions may not coincide with the current year net investment income or net realized gains as distributions may be paid from current or prior year earnings. |
| | (d) | | Assumes reinvestment of all distributions. Returns do not reflect the deduction of taxes that a shareholder would pay on Fund distributions. Total returns for periods less than one full year are not annualized. |
| | |
| The accompanying notes are an integral part of these financial statements. | | 67 |
FINANCIAL SQUARE MONEY MARKET FUND
Financial Highlights(continued)
Selected Data for a Share Outstanding Throughout Each Period
| | | | | | | | | | | | | | | | | | | | | | | | | | |
| | | | | Financial Square Money Market Fund | |
| | | | | Institutional Shares | |
| | | | | Six Months Ended
February 28, 2019
(Unaudited) | | | Year Ended August 31, | |
| | | | | 2018 | | | 2017 | | | 2016 | | | 2015 | | | 2014 | |
| | Per Share Data: | | | | | | | | | | | | | | | | | | | | | | | | |
| | | | | | | |
| | Net asset value, beginning of period | | $ | 1.0003 | | | $ | 1.0003 | | | $ | 1.0000 | | | $ | 1.00 | | | $ | 1.00 | | | $ | 1.00 | |
| | | | | | | |
| | Net investment income(a) | | | 0.0148 | | | | 0.0187 | | | | 0.0071 | | | | — | (b) | | | — | (b) | | | — | (b) |
| | | | | | | | |
| | Net realized and unrealized gain (loss) | | | (0.0026 | ) | | | (0.0019 | ) | | | 0.0015 | | | | — | (b) | | | — | (b) | | | — | (b) |
| | | | | | | | |
| | Total from investment operations | | | 0.0122 | | | | 0.0168 | | | | 0.0086 | | | | — | (b) | | | — | (b) | | | — | (b) |
| | | | | | | | |
| | Distributions to shareholders from net investment income | | | (0.0120 | ) | | | (0.0168 | ) | | | (0.0082 | ) | | | — | (b) | | | — | (b) | | | — | (b) |
| | | | | | | | |
| | Distributions to shareholders from net realized gains | | | — | (c) | | | — | (c) | | | (0.0001 | ) | | | — | (b) | | | — | (b) | | | — | (b) |
| | | | | | | | |
| | Total distributions(d) | | | (0.0120 | ) | | | (0.0168 | ) | | | (0.0083 | ) | | | — | (b) | | | — | (b) | | | — | (b) |
| | | | | | | | |
| | Net asset value, end of period | | $ | 1.0005 | | | $ | 1.0003 | | | $ | 1.0003 | | | $ | 1.00 | | | $ | 1.00 | | | $ | 1.00 | |
| | | | | | | |
| | Total return(e) | | | 1.23 | % | | | 1.68 | % | | | 0.87 | % | | | 0.32 | % | | | 0.09 | % | | | 0.06 | % |
| | | | | | | |
| | Net assets, end of period (in 000’s) | | $ | 12,901,986 | | | $ | 11,570,439 | | | $ | 2,542,693 | | | $ | 15,336,774 | | | $ | 32,746,797 | | | $ | 26,529,130 | |
| | | | | | | |
| | Ratio of net expenses to average net assets | | | 0.12 | %(f) | | | 0.11 | % | | | 0.18 | % | | | 0.18 | % | | | 0.18 | % | | | 0.18 | % |
| | | | | | | |
| | Ratio of total expenses to average net assets | | | 0.18 | %(f) | | | 0.20 | % | | | 0.25 | % | | | 0.23 | % | | | 0.23 | % | | | 0.23 | % |
| | | | | | | |
| | Ratio of net investment income to average net assets | | | 2.42 | %(f) | | | 1.87 | % | | | 0.71 | % | | | 0.32 | % | | | 0.08 | % | | | 0.06 | % |
| | (a) | | Calculated based on the average shares outstanding methodology. |
| | (b) | | Amount is less than $0.0005 per share. |
| | (c) | | Amount is less than $0.00005 per share. |
| | (d) | | Distributions may not coincide with the current year net investment income or net realized gains as distributions may be paid from current or prior year earnings. |
| | (e) | | Assumes investment at the net asset value at the beginning of the year, reinvestment of all dividends and distributions and a complete redemption of the investment at the net asset value at the end of the year. Returns do not reflect the deduction of taxes that a shareholder would pay on Fund distributions or the redemption of Fund shares. Total returns for periods less than one full year are not annualized. |
| | |
| 68 | | The accompanying notes are an integral part of these financial statements. |
FINANCIAL SQUARE MONEY MARKET FUND
Financial Highlights(continued)
Selected Data for a Share Outstanding Throughout Each Period
| | | | | | | | | | | | | | | | | | | | | | | | | | |
| | | | | Financial Square Money Market Fund | |
| | | | | Select Shares | |
| | | | | Six Months Ended
February 28, 2019
(Unaudited) | | | Year Ended August 31, | |
| | | | | 2018 | | | 2017 | | | 2016 | | | 2015 | | | 2014 | |
| | Per Share Data: | | | | | | | | | | | | | | | | | | | | | | | | |
| | | | | | | |
| | Net asset value, beginning of period | | $ | 1.0003 | | | $ | 1.0003 | | | $ | 1.0000 | | | $ | 1.00 | | | $ | 1.00 | | | $ | 1.00 | |
| | | | | | | |
| | Net investment income(a) | | | 0.0131 | | | | 0.0182 | | | | 0.0040 | | | | 0.003 | | | | 0.001 | | | | — | (b) |
| | | | | | | | |
| | Net realized and unrealized gain (loss) | | | (0.0011 | ) | | | (0.0017 | ) | | | 0.0043 | | | | — | (b) | | | — | (b) | | | — | (b) |
| | | | | | | | |
| | Total from investment operations | | | 0.0120 | | | | 0.0165 | | | | 0.0083 | | | | 0.003 | | | | 0.001 | | | | — | (b) |
| | | | | | | | |
| | Distributions to shareholders from net investment income | | | (0.0118 | ) | | | (0.0165 | ) | | | (0.0079 | ) | | | (0.003 | ) | | | (0.001 | ) | | | — | (b) |
| | | | | | | | |
| | Distributions to shareholders from net realized gains | | | — | (c) | | | — | (c) | | | (0.0001 | ) | | | — | (b) | | | — | (b) | | | — | (b) |
| | | | | | | | |
| | Total distributions(d) | | | (0.0118 | ) | | | (0.0165 | ) | | | (0.0080 | ) | | | (0.003 | ) | | | (0.001 | ) | | | — | (b) |
| | | | | | | | |
| | Net asset value, end of period | | $ | 1.0005 | | | $ | 1.0003 | | | $ | 1.0003 | | | $ | 1.00 | | | $ | 1.00 | | | $ | 1.00 | |
| | | | | | | |
| | Total return(e) | | | 1.22 | % | | | 1.65 | % | | | 0.84 | % | | | 0.29 | % | | | 0.06 | % | | | 0.03 | % |
| | | | | | | |
| | Net assets, end of period (in 000’s) | | $ | 26,174 | | | $ | 34,354 | | | $ | 9,847 | | | $ | 1,080,075 | | | $ | 1,917,216 | | | $ | 527,470 | |
| | | | | | | |
| | Ratio of net expenses to average net assets | | | 0.15 | %(f) | | | 0.14 | % | | | 0.21 | % | | | 0.21 | % | | | 0.21 | % | | | 0.21 | % |
| | | | | | | |
| | Ratio of total expenses to average net assets | | | 0.21 | %(f) | | | 0.23 | % | | | 0.28 | % | | | 0.26 | % | | | 0.26 | % | | | 0.26 | % |
| | | | | | | |
| | Ratio of net investment income to average net assets | | | 2.37 | %(f) | | | 1.82 | % | | | 0.40 | % | | | 0.29 | % | | | 0.06 | % | | | 0.03 | % |
| | (a) | | Calculated based on the average shares outstanding methodology. |
| | (b) | | Amount is less than $0.0005 per share. |
| | (c) | | Amount is less than $0.00005 per share. |
| | (d) | | Distributions may not coincide with the current year net investment income or net realized gains as distributions may be paid from current or prior year earnings. |
| | (e) | | Assumes investment at the net asset value at the beginning of the year, reinvestment of all dividends and distributions and a complete redemption of the investment at the net asset value at the end of the year. Returns do not reflect the deduction of taxes that a shareholder would pay on Fund distributions or the redemption of Fund shares. Total returns for periods less than one full year are not annualized. |
| | |
| The accompanying notes are an integral part of these financial statements. | | 69 |
FINANCIAL SQUARE MONEY MARKET FUND
Financial Highlights(continued)
Selected Data for a Share Outstanding Throughout Each Period
| | | | | | | | | | | | | | | | | | | | | | | | | | |
| | | | | Financial Square Money Market Fund | |
| | | | | Preferred Shares | |
| | | | | Six Months Ended
February 28, 2019
(Unaudited) | | | Year Ended August 31, | |
| | | | | 2018 | | | 2017 | | | 2016 | | | 2015 | | | 2014 | |
| | Per Share Data: | | | | | | | | | | | | | | | | | | | | | | | | |
| | | | | | | |
| | Net asset value, beginning of period | | $ | 1.0002 | | | $ | 1.0003 | | | $ | 1.0000 | | | $ | 1.00 | | | $ | 1.00 | | | $ | 1.00 | |
| | | | | | | |
| | Net investment income(a) | | | 0.0139 | | | | 0.0172 | | | | 0.0032 | | | | 0.002 | | | | — | (b) | | | — | (b) |
| | | | | | | | |
| | Net realized and unrealized gain (loss) | | | (0.0021 | ) | | | (0.0015 | ) | | | 0.0044 | | | | — | (b) | | | — | (b) | | | — | (b) |
| | | | | | | | |
| | Total from investment operations | | | 0.0118 | | | | 0.0157 | | | | 0.0076 | | | | 0.002 | | | | — | (b) | | | — | (b) |
| | | | | | | | |
| | Distributions to shareholders from net investment income | | | (0.0115 | ) | | | (0.0158 | ) | | | (0.0072 | ) | | | (0.002 | ) | | | — | (b) | | | — | (b) |
| | | | | | | | |
| | Distributions to shareholders from net realized gains | | | — | (c) | | | — | (c) | | | (0.0001 | ) | | | — | (b) | | | — | (b) | | | — | (b) |
| | | | | | | | |
| | Total distributions(d) | | | (0.0115 | ) | | | (0.0158 | ) | | | (0.0073 | ) | | | (0.002 | ) | | | — | (b) | | | — | (b) |
| | | | | | | | |
| | Net asset value, end of period | | $ | 1.0005 | | | $ | 1.0002 | | | $ | 1.0003 | | | $ | 1.00 | | | $ | 1.00 | | | $ | 1.00 | |
| | | | | | | |
| | Total return(e) | | | 1.18 | % | | | 1.58 | % | | | 0.77 | % | | | 0.22 | % | | | 0.01 | % | | | 0.01 | % |
| | | | | | | |
| | Net assets, end of period (in 000’s) | | $ | 1,841 | | | $ | 2,752 | | | $ | 1,418 | | | $ | 59,053 | | | $ | 116,846 | | | $ | 66,193 | |
| | | | | | | |
| | Ratio of net expenses to average net assets | | | 0.22 | %(f) | | | 0.21 | % | | | 0.28 | % | | | 0.28 | % | | | 0.26 | % | | | 0.24 | % |
| | | | | | | |
| | Ratio of total expenses to average net assets | | | 0.28 | %(f) | | | 0.30 | % | | | 0.35 | % | | | 0.33 | % | | | 0.33 | % | | | 0.33 | % |
| | | | | | | |
| | Ratio of net investment income to average net assets | | | 2.30 | %(f) | | | 1.72 | % | | | 0.32 | % | | | 0.20 | % | | | 0.01 | % | | | 0.01 | % |
| | (a) | | Calculated based on the average shares outstanding methodology. |
| | (b) | | Amount is less than $0.0005 per share. |
| | (c) | | Amount is less than $0.00005 per share. |
| | (d) | | Distributions may not coincide with the current year net investment income or net realized gains as distributions may be paid from current or prior year earnings. |
| | (e) | | Assumes investment at the net asset value at the beginning of the year, reinvestment of all dividends and distributions and a complete redemption of the investment at the net asset value at the end of the year. Returns do not reflect the deduction of taxes that a shareholder would pay on Fund distributions or the redemption of Fund shares. Total returns for periods less than one full year are not annualized. |
| | |
| 70 | | The accompanying notes are an integral part of these financial statements. |
FINANCIAL SQUARE MONEY MARKET FUND
Financial Highlights(continued)
Selected Data for a Share Outstanding Throughout Each Period
| | | | | | | | | | | | | | | | | | | | | | | | | | |
| | | | | Financial Square Money Market Fund | |
| | | | | Capital Shares | |
| | | | | Six Months Ended
February 28, 2019
(Unaudited) | | | Year Ended August 31, | |
| | | | | 2018 | | | 2017 | | | 2016 | | | 2015 | | | 2014 | |
| | Per Share Data: | | | | | | | | | | | | | | | | | | | | | | | | |
| | | | | | | |
| | Net asset value, beginning of period | | $ | 1.0004 | | | $ | 1.0003 | | | $ | 1.0000 | | | $ | 1.00 | | | $ | 1.00 | | | $ | 1.00 | |
| | | | | | | |
| | Net investment income(a) | | | 0.0245 | | | | 0.0177 | | | | 0.0020 | | | | 0.002 | | | | — | (b) | | | — | (b) |
| | | | | | | | |
| | Net realized and unrealized gain (loss) | | | (0.0121 | ) | | | 0.0001 | | | | 0.0051 | | | | — | (b) | | | — | (b) | | | — | (b) |
| | | | | | | | |
| | Total from investment operations | | | 0.0124 | | | | 0.0178 | | | | 0.0071 | | | | 0.002 | | | | — | (b) | | | — | (b) |
| | | | | | | | |
| | Distributions to shareholders from net investment income | | | (0.0123 | ) | | | (0.0177 | ) | | | (0.0068 | ) | | | (0.002 | ) | | | — | (b) | | | — | (b) |
| | | | | | | | |
| | Distributions to shareholders from net realized gains | | | — | (c) | | | — | (c) | | | — | (c) | | | — | (b) | | | — | (b) | | | — | (b) |
| | | | | | | | |
| | Total distributions(d) | | | (0.0123 | ) | | | (0.0177 | ) | | | (0.0068 | ) | | | (0.002 | ) | | | — | (b) | | | — | (b) |
| | | | | | | | |
| | Net asset value, end of period | | $ | 1.0005 | | | $ | 1.0004 | | | $ | 1.0003 | | | $ | 1.00 | | | $ | 1.00 | | | $ | 1.00 | |
| | | | | | | |
| | Total return(e) | | | 1.15 | % | | | 1.54 | % | | | 0.72 | % | | | 0.18 | % | | | 0.01 | % | | | 0.01 | % |
| | | | | | | |
| | Net assets, end of period (in 000’s) | | $ | 4,806 | | | $ | 1 | | | $ | 1 | | | $ | 108,671 | | | $ | 201,440 | | | $ | 36,709 | |
| | | | | | | |
| | Ratio of net expenses to average net assets | | | 0.27 | %(f) | | | 0.11 | % | | | 0.33 | % | | | 0.33 | % | | | 0.27 | % | | | 0.24 | % |
| | | | | | | |
| | Ratio of total expenses to average net assets | | | 0.33 | %(f) | | | 0.35 | % | | | 0.40 | % | | | 0.38 | % | | | 0.38 | % | | | 0.38 | % |
| | | | | | | |
| | Ratio of net investment income to average net assets | | | 2.46 | %(f) | | | 1.77 | % | | | 0.20 | % | | | 0.18 | % | | | — | %(g) | | | 0.01 | % |
| | (a) | | Calculated based on the average shares outstanding methodology. |
| | (b) | | Amount is less than $0.0005 per share. |
| | (c) | | Amount is less than $0.00005 per share. |
| | (d) | | Distributions may not coincide with the current year net investment income or net realized gains as distributions may be paid from current or prior year earnings. |
| | (e) | | Assumes investment at the net asset value at the beginning of the year, reinvestment of all dividends and distributions and a complete redemption of the investment at the net asset value at the end of the year. Returns do not reflect the deduction of taxes that a shareholder would pay on Fund distributions or the redemption of Fund shares. Total returns for periods less than one full year are not annualized. |
| | (g) | | Amount is less than 0.005% of average net assets. |
| | |
| The accompanying notes are an integral part of these financial statements. | | 71 |
FINANCIAL SQUARE MONEY MARKET FUND
Financial Highlights(continued)
Selected Data for a Share Outstanding Throughout Each Period
| | | | | | | | | | | | | | | | | | | | | | | | | | |
| | | | | Financial Square Money Market Fund | |
| | | | | Administration Shares | |
| | | | | Six Months Ended
February 28, 2019
(Unaudited) | | | Year Ended August 31, | |
| | | | | 2018 | | | 2017 | | | 2016 | | | 2015 | | | 2014 | |
| | Per Share Data: | | | | | | | | | | | | | | | | | | | | | | | | |
| | | | | | | |
| | Net asset value, beginning of period | | $ | 1.0003 | | | $ | 1.0003 | | | $ | 1.0000 | | | $ | 1.00 | | | $ | 1.00 | | | $ | 1.00 | |
| | | | | | | |
| | Net investment income(a) | | | 0.0077 | | | | 0.0140 | | | | 0.0024 | | | | 0.001 | | | | — | (b) | | | — | (b) |
| | | | | | | | |
| | Net realized and unrealized gain | | | 0.0031 | | | | 0.0003 | | | | 0.0037 | | | | — | (b) | | | — | (b) | | | — | (b) |
| | | | | | | | |
| | Total from investment operations | | | 0.0108 | | | | 0.0143 | | | | 0.0061 | | | | 0.001 | | | | — | (b) | | | — | (b) |
| | | | | | | | |
| | Distributions to shareholders from net investment income | | | (0.0107 | ) | | | (0.0143 | ) | | | (0.0057 | ) | | | (0.001 | ) | | | — | (b) | | | — | (b) |
| | | | | | | | |
| | Distributions to shareholders from net realized gains | | | — | (c) | | | — | (c) | | | (0.0001 | ) | | | — | (b) | | | — | (b) | | | — | (b) |
| | | | | | | | |
| | Total distributions(d) | | | (0.0107 | ) | | | (0.0143 | ) | | | (0.0058 | ) | | | (0.001 | ) | | | — | (b) | | | — | (b) |
| | | | | | | | |
| | Net asset value, end of period | | $ | 1.0004 | | | $ | 1.0003 | | | $ | 1.0003 | | | $ | 1.00 | | | $ | 1.00 | | | $ | 1.00 | |
| | | | | | | |
| | Total return(e) | | | 1.10 | % | | | 1.43 | % | | | 0.61 | % | | | 0.10 | % | | | 0.01 | % | | | 0.01 | % |
| | | | | | | |
| | Net assets, end of period (in 000’s) | | $ | 838 | | | $ | 3,218 | | | $ | 5,516 | | | $ | 316,162 | | | $ | 430,947 | | | $ | 277,404 | |
| | | | | | | |
| | Ratio of net expenses to average net assets | | | 0.37 | %(f) | | | 0.36 | % | | | 0.43 | % | | | 0.40 | % | | | 0.26 | % | | | 0.24 | % |
| | | | | | | |
| | Ratio of total expenses to average net assets | | | 0.43 | %(f) | | | 0.45 | % | | | 0.50 | % | | | 0.48 | % | | | 0.48 | % | | | 0.48 | % |
| | | | | | | |
| | Ratio of net investment income to average net assets | | | 2.10 | %(f) | | | 1.40 | % | | | 0.24 | % | | | 0.09 | % | | | — | %(g) | | | 0.01 | % |
| | (a) | | Calculated based on the average shares outstanding methodology. |
| | (b) | | Amount is less than $0.0005 per share. |
| | (c) | | Amount is less than $0.00005 per share. |
| | (d) | | Distributions may not coincide with the current year net investment income or net realized gains as distributions may be paid from current or prior year earnings. |
| | (e) | | Assumes investment at the net asset value at the beginning of the year, reinvestment of all dividends and distributions and a complete redemption of the investment at the net asset value at the end of the year. Returns do not reflect the deduction of taxes that a shareholder would pay on Fund distributions or the redemption of Fund shares. Total returns for periods less than one full year are not annualized. |
| | (g) | | Amount is less than 0.005% of average net assets. |
| | |
| 72 | | The accompanying notes are an integral part of these financial statements. |
FINANCIAL SQUARE MONEY MARKET FUND
Financial Highlights(continued)
Selected Data for a Share Outstanding Throughout Each Period
| | | | | | | | | | | | | | | | | | | | | | | | | | |
| | | | | Financial Square Money Market Fund | |
| | | | | Premier Shares | |
| | | | | Six Months Ended
February 28, 2019
(Unaudited) | | | Year Ended August 31, | |
| | | | | 2018 | | | 2017 | | | 2016 | | | 2015 | | | 2014 | |
| | Per Share Data: | | | | | | | | | | | | | | | | | | | | | | | | |
| | | | | | | |
| | Net asset value, beginning of period | | $ | 1.0004 | | | $ | 1.0003 | | | $ | 1.0000 | | | $ | 1.00 | | | $ | 1.00 | | | $ | 1.00 | |
| | | | | | | |
| | Net investment income(a) | | | 0.0107 | | | | 0.0142 | | | | 0.0068 | | | | 0.001 | | | | — | (b) | | | — | (b) |
| | | | | | | | |
| | Net realized and unrealized gain (loss) | | | — | (b) | | | 0.0001 | | | | (0.0016 | ) | | | — | (b) | | | — | (b) | | | — | (b) |
| | | | | | | | |
| | Total from investment operations | | | 0.0107 | | | | 0.0143 | | | | 0.0052 | | | | 0.001 | | | | — | (b) | | | — | (b) |
| | | | | | | | |
| | Distributions to shareholders from net investment income | | | (0.0106 | ) | | | (0.0142 | ) | | | (0.0049 | ) | | | (0.001 | ) | | | — | (b) | | | — | (b) |
| | | | | | | | |
| | Distributions to shareholders from net realized gains | | | — | (c) | | | — | (c) | | | — | (c) | | | — | (b) | | | — | (b) | | | — | (b) |
| | | | | | | | |
| | Total distributions(d) | | | (0.0106 | ) | | | (0.0142 | ) | | | (0.0049 | ) | | | (0.001 | ) | | | — | (b) | | | — | (b) |
| | | | | | | | |
| | Net asset value, end of period | | $ | 1.0005 | | | $ | 1.0004 | | | $ | 1.0003 | | | $ | 1.00 | | | $ | 1.00 | | | $ | 1.00 | |
| | | | | | | |
| | Total return(e) | | | 1.04 | % | | | 1.35 | % | | | 0.52 | % | | | 0.10 | % | | | 0.01 | % | | | 0.01 | % |
| | | | | | | |
| | Net assets, end of period (in 000’s) | | $ | 1 | | | $ | 1 | | | $ | 1 | | | $ | 1 | | | $ | 1 | | | $ | 1 | |
| | | | | | | |
| | Ratio of net expenses to average net assets | | | 0.48 | %(f) | | | 0.47 | % | | | 0.53 | % | | | 0.19 | % | | | 0.18 | % | | | 0.24 | % |
| | | | | | | |
| | Ratio of total expenses to average net assets | | | 0.53 | %(f) | | | 0.55 | % | | | 0.60 | % | | | 0.58 | % | | | 0.58 | % | | | 0.58 | % |
| | | | | | | |
| | Ratio of net investment income to average net assets | | | 2.14 | %(f) | | | 1.42 | % | | | 0.69 | % | | | 0.37 | % | | | 0.40 | % | | | 0.01 | % |
| | (a) | | Calculated based on the average shares outstanding methodology. |
| | (b) | | Amount is less than $0.0005 per share. |
| | (c) | | Amount is less than $0.00005 per share. |
| | (d) | | Distributions may not coincide with the current year net investment income or net realized gains as distributions may be paid from current or prior year earnings. |
| | (e) | | Assumes investment at the net asset value at the beginning of the year, reinvestment of all dividends and distributions and a complete redemption of the investment at the net asset value at the end of the year. Returns do not reflect the deduction of taxes that a shareholder would pay on Fund distributions or the redemption of Fund shares. Total returns for periods less than one full year are not annualized. |
| | |
| The accompanying notes are an integral part of these financial statements. | | 73 |
FINANCIAL SQUARE MONEY MARKET FUND
Financial Highlights(continued)
Selected Data for a Share Outstanding Throughout Each Period
| | | | | | | | | | | | | | | | | | | | | | | | | | |
| | | | | Financial Square Money Market Fund | |
| | | | | Service Shares | |
| | | | | Six Months Ended
February 28, 2019
(Unaudited) | | | Year Ended August 31, | |
| | | | | 2018 | | | 2017 | | | 2016 | | | 2015 | | | 2014 | |
| | Per Share Data: | | | | | | | | | | | | | | | | | | | | | | | | |
| | | | | | | |
| | Net asset value, beginning of period | | $ | 1.0001 | | | $ | 1.0003 | | | $ | 1.0000 | | | $ | 1.00 | | | $ | 1.00 | | | $ | 1.00 | |
| | | | | | | |
| | Net investment income(a) | | | 0.0034 | | | | 0.0115 | | | | 0.0011 | | | | — | (b) | | | — | (b) | | | — | (b) |
| | | | | | | | |
| | Net realized and unrealized gain | | | 0.0062 | | | | 0.0001 | | | | 0.0027 | | | | — | (b) | | | — | (b) | | | — | (b) |
| | | | | | | | |
| | Total from investment operations | | | 0.0096 | | | | 0.0116 | | | | 0.0038 | | | | — | (b) | | | — | (b) | | | — | (b) |
| | | | | | | | |
| | Distributions to shareholders from net investment income | | | (0.0095 | ) | | | (0.0118 | ) | | | (0.0034 | ) | | | — | (b) | | | — | (b) | | | — | (b) |
| | | | | | | | |
| | Distributions to shareholders from net realized gains | | | — | (c) | | | — | (c) | | | (0.0001 | ) | | | — | (b) | | | — | (b) | | | — | (b) |
| | | | | | | | |
| | Total distributions(d) | | | (0.0095 | ) | | | (0.0118 | ) | | | (0.0035 | ) | | | — | (b) | | | — | (b) | | | — | (b) |
| | | | | | | | |
| | Net asset value, end of period | | $ | 1.0002 | | | $ | 1.0001 | | | $ | 1.0003 | | | $ | 1.00 | | | $ | 1.00 | | | $ | 1.00 | |
| | | | | | | |
| | Total return(e) | | | 0.97 | % | | | 1.16 | % | | | 0.38 | % | | | 0.01 | % | | | 0.01 | % | | | 0.01 | % |
| | | | | | | |
| | Net assets, end of period (in 000’s) | | $ | 4 | | | $ | 128 | | | $ | 67 | | | $ | 17,000 | | | $ | 21,066 | | | $ | 20,963 | |
| | | | | | | |
| | Ratio of net expenses to average net assets | | | 0.62 | %(f) | | | 0.61 | % | | | 0.60 | % | | | 0.49 | % | | | 0.26 | % | | | 0.24 | % |
| | | | | | | |
| | Ratio of total expenses to average net assets | | | 0.68 | %(f) | | | 0.70 | % | | | 0.75 | % | | | 0.73 | % | | | 0.73 | % | | | 0.73 | % |
| | | | | | | |
| | Ratio of net investment income to average net assets | | | 1.94 | %(f) | | | 1.15 | % | | | 0.11 | % | | | — | %(g) | | | — | %(g) | | | 0.01 | % |
| | (a) | | Calculated based on the average shares outstanding methodology. |
| | (b) | | Amount is less than $0.0005 per share. |
| | (c) | | Amount is less than $0.00005 per share. |
| | (d) | | Distributions may not coincide with the current year net investment income or net realized gains as distributions may be paid from current or prior year earnings. |
| | (e) | | Assumes investment at the net asset value at the beginning of the year, reinvestment of all dividends and distributions and a complete redemption of the investment at the net asset value at the end of the year. Returns do not reflect the deduction of taxes that a shareholder would pay on Fund distributions or the redemption of Fund shares. Total returns for periods less than one full year are not annualized. |
| | (g) | | Amount is less than 0.005% of average net assets. |
| | |
| 74 | | The accompanying notes are an integral part of these financial statements. |
FINANCIAL SQUARE MONEY MARKET FUND
Financial Highlights(continued)
Selected Data for a Share Outstanding Throughout Each Period
| | | | | | | | | | | | | | | | | | | | | | | | | | |
| | | | | Financial Square Money Market Fund | |
| | | | | Resource Shares | |
| | | | | Six Months Ended
February 28, 2019
(Unaudited) | | | Year Ended August 31, | |
| | | | | 2018 | | | 2017 | | | 2016 | | | 2015 | | | 2014 | |
| | Per Share Data: | | | | | | | | | | | | | | | | | | | | | | | | |
| | | | | | | |
| | Net asset value, beginning of period | | $ | 1.0004 | | | $ | 1.0003 | | | $ | 1.0000 | | | $ | 1.00 | | | $ | 1.00 | | | $ | 1.00 | |
| | | | | | | |
| | Net investment income(a) | | | 0.0107 | | | | 0.0142 | | | | 0.0068 | | | | 0.001 | | | | — | (b) | | | — | (b) |
| | | | | | | | |
| | Net realized and unrealized gain (loss) | | | — | (b) | | | 0.0001 | | | | (0.0040 | ) | | | — | (b) | | | — | (b) | | | — | (b) |
| | | | | | | | |
| | Total from investment operations | | | 0.0107 | | | | 0.0143 | | | | 0.0028 | | | | 0.001 | | | | — | (b) | | | — | (b) |
| | | | | | | | |
| | Distributions to shareholders from net investment income | | | (0.0106 | ) | | | (0.0142 | ) | | | (0.0025 | ) | | | (0.001 | ) | | | — | (b) | | | — | (b) |
| | | | | | | | |
| | Distributions to shareholders from net realized gains | | | — | (c) | | | — | (c) | | | — | (c) | | | — | (b) | | | — | (b) | | | — | (b) |
| | | | | | | | |
| | Total distributions(d) | | | (0.0106 | ) | | | (0.0142 | ) | | | (0.0025 | ) | | | (0.001 | ) | | | — | (b) | | | — | (b) |
| | | | | | | | |
| | Net asset value, end of period | | $ | 1.0005 | | | $ | 1.0004 | | | $ | 1.0003 | | | $ | 1.00 | | | $ | 1.00 | | | $ | 1.00 | |
| | | | | | | |
| | Total return(e) | | | 0.90 | % | | | 1.04 | % | | | 0.28 | % | | | 0.10 | % | | | 0.01 | % | | | 0.01 | % |
| | | | | | | |
| | Net assets, end of period (in 000’s) | | $ | 1 | | | $ | 1 | | | $ | 1 | | | $ | 1 | | | $ | 1 | | | $ | 1 | |
| | | | | | | |
| | Ratio of net expenses to average net assets | | | 0.48 | %(f) | | | 0.47 | % | | | 0.53 | % | | | 0.19 | % | | | 0.18 | % | | | 0.18 | % |
| | | | | | | |
| | Ratio of total expenses to average net assets | | | 0.83 | %(f) | | | 0.85 | % | | | 0.90 | % | | | 0.88 | % | | | 0.88 | % | | | 0.88 | % |
| | | | | | | |
| | Ratio of net investment income to average net assets | | | 2.14 | %(f) | | | 1.42 | % | | | 0.68 | % | | | 0.37 | % | | | 0.40 | % | | | 0.40 | % |
| | (a) | | Calculated based on the average shares outstanding methodology. |
| | (b) | | Amount is less than $0.0005 per share. |
| | (c) | | Amount is less than $0.00005 per share. |
| | (d) | | Distributions may not coincide with the current year net investment income or net realized gains as distributions may be paid from current or prior year earnings. |
| | (e) | | Assumes investment at the net asset value at the beginning of the year, reinvestment of all dividends and distributions and a complete redemption of the investment at the net asset value at the end of the year. Returns do not reflect the deduction of taxes that a shareholder would pay on Fund distributions or the redemption of Fund shares. Total returns for periods less than one full year are not annualized. |
| | |
| The accompanying notes are an integral part of these financial statements. | | 75 |
FINANCIAL SQUARE MONEY MARKET FUND
Financial Highlights(continued)
Selected Data for a Share Outstanding Throughout Each Period
| | | | | | | | | | | | | | | | | | | | | | | | | | |
| | | | | Financial Square Money Market Fund | |
| | | | | Cash Management Shares | |
| | | | | Six Months Ended
February 28, 2019
(Unaudited) | | | Year Ended August 31, | |
| | | | | 2018 | | | 2017 | | | 2016 | | | 2015 | | | 2014 | |
| | Per Share Data: | | | | | | | | | | | | | | | | | | | | | | | | |
| | | | | | | |
| | Net asset value, beginning of period | | $ | 1.0004 | | | $ | 1.0003 | | | $ | 1.0000 | | | $ | 1.00 | | | $ | 1.00 | | | $ | 1.00 | |
| | | | | | | |
| | Net investment income(a) | | | 0.0089 | | | | 0.0106 | | | | 0.0001 | | | | — | (b) | | | — | (b) | | | — | (b) |
| | | | | | | | |
| | Net realized and unrealized gain (loss) | | | 0.0001 | | | | 0.0001 | | | | 0.0017 | | | | — | (b) | | | — | (b) | | | — | (b) |
| | | | | | | | |
| | Total from investment operations | | | 0.0090 | | | | 0.0107 | | | | 0.0018 | | | | — | (b) | | | — | (b) | | | — | (b) |
| | | | | | | | |
| | Distributions to shareholders from net investment income | | | (0.0089 | ) | | | (0.0106 | ) | | | (0.0015 | ) | | | — | (b) | | | — | (b) | | | — | (b) |
| | | | | | | | |
| | Distributions to shareholders from net realized gains | | | — | (c) | | | — | (c) | | | — | (c) | | | — | (b) | | | — | (b) | | | — | (b) |
| | | | | | | | |
| | Total distributions(d) | | | (0.0089 | ) | | | (0.0106 | ) | | | (0.0015 | ) | | | — | (b) | | | — | (b) | | | — | (b) |
| | | | | | | | |
| | Net asset value, end of period | | $ | 1.0005 | | | $ | 1.0004 | | | $ | 1.0003 | | | $ | 1.00 | | | $ | 1.00 | | | $ | 1.00 | |
| | | | | | | |
| | Total return(e) | | | 0.81 | % | | | 0.89 | % | | | 0.18 | % | | | 0.01 | % | | | 0.01 | % | | | 0.01 | % |
| | | | | | | |
| | Net assets, end of period (in 000’s) | | $ | 1 | | | $ | 1 | | | $ | 1 | | | $ | 10,742 | | | $ | 8,041 | | | $ | 1 | |
| | | | | | | |
| | Ratio of net expenses to average net assets | | | 0.84 | %(f) | | | 0.83 | % | | | 0.50 | % | | | 0.51 | % | | | 0.28 | % | | | 0.18 | % |
| | | | | | | |
| | Ratio of total expenses to average net assets | | | 0.98 | %(f) | | | 1.00 | % | | | 1.05 | % | | | 1.03 | % | | | 1.03 | % | | | 1.03 | % |
| | | | | | | |
| | Ratio of net investment income to average net assets | | | 1.79 | %(f) | | | 1.06 | % | | | 0.01 | % | | | — | %(g) | | | — | %(g) | | | 0.40 | % |
| | (a) | | Calculated based on the average shares outstanding methodology. |
| | (b) | | Amount is less than $0.0005 per share. |
| | (c) | | Amount is less than $0.00005 per share. |
| | (d) | | Distributions may not coincide with the current year net investment income or net realized gains as distributions may be paid from current or prior year earnings. |
| | (e) | | Assumes investment at the net asset value at the beginning of the year, reinvestment of all dividends and distributions and a complete redemption of the investment at the net asset value at the end of the year. Returns do not reflect the deduction of taxes that a shareholder would pay on Fund distributions or the redemption of Fund shares. Total returns for periods less than one full year are not annualized. |
| | (g) | | Amount is less than 0.005% of average net assets. |
| | |
| 76 | | The accompanying notes are an integral part of these financial statements. |
FINANCIAL SQUARE PRIME OBLIGATIONS FUND
Financial Highlights(continued)
Selected Data for a Share Outstanding Throughout Each Period
| | | | | | | | | | | | | | | | | | | | | | | | | | |
| | | | | Financial Square Prime Obligations Fund | |
| | | | | Institutional Shares | |
| | | | | Six Months Ended
February 28, 2019
(Unaudited) | | | Year Ended August 31, | |
| | | | | 2018 | | | 2017 | | | 2016 | | | 2015 | | | 2014 | |
| | Per Share Data: | | | | | | | | | | | | | | | | | | | | | | | | |
| | | | | | | |
| | Net asset value, beginning of period | | $ | 1.0003 | | | $ | 1.0003 | | | $ | 1.0000 | | | $ | 1.00 | | | $ | 1.00 | | | $ | 1.00 | |
| | | | | | | |
| | Net investment income(a) | | | 0.0136 | | | | 0.0182 | | | | 0.0073 | | | | 0.003 | | | | — | (b) | | | — | (b) |
| | | | | | | | |
| | Net realized and unrealized gain (loss) | | | (0.0015 | ) | | | (0.0014 | ) | | | 0.0014 | | | | — | (b) | | | — | (b) | | | — | (b) |
| | | | | | | | |
| | Total from investment operations | | | 0.0121 | | | | 0.0168 | | | | 0.0087 | | | | 0.003 | | | | — | (b) | | | — | (b) |
| | | | | | | | |
| | Distributions to shareholders from net investment income | | | (0.0119 | ) | | | (0.0168 | ) | | | (0.0083 | ) | | | (0.003 | ) | | | — | (b) | | | — | (b) |
| | | | | | | | |
| | Distributions to shareholders from net realized gains | | | — | (c) | | | — | (c) | | | (0.0001 | ) | | | — | (b) | | | — | (b) | | | — | (b) |
| | | | | | | | |
| | Total distributions(d) | | | (0.0119 | ) | | | (0.0168 | ) | | | (0.0084 | ) | | | (0.003 | ) | | | — | (b) | | | — | (b) |
| | | | | | | | |
| | Net asset value, end of period | | $ | 1.0005 | | | $ | 1.0003 | | | $ | 1.0003 | | | $ | 1.00 | | | $ | 1.00 | | | $ | 1.00 | |
| | | | | | | |
| | Total return(e) | | | 1.23 | % | | | 1.68 | % | | | 0.87 | % | | | 0.29 | % | | | 0.03 | % | | | 0.02 | % |
| | | | | | | |
| | Net assets, end of period (in 000’s) | | $ | 4,615,641 | | | $ | 3,766,257 | | | $ | 1,467,979 | | | $ | 7,299,656 | | | $ | 9,211,383 | | | $ | 10,934,044 | |
| | | | | | | |
| | Ratio of net expenses to average net assets | | | 0.12 | %(f) | | | 0.11 | % | | | 0.18 | % | | | 0.18 | % | | | 0.18 | % | | | 0.18 | % |
| | | | | | | |
| | Ratio of total expenses to average net assets | | | 0.18 | %(f) | | | 0.21 | % | | | 0.27 | % | | | 0.23 | % | | | 0.23 | % | | | 0.23 | % |
| | | | | | | |
| | Ratio of net investment income to average net assets | | | 2.41 | %(f) | | | 1.82 | % | | | 0.73 | % | | | 0.31 | % | | | 0.03 | % | | | 0.02 | % |
| | (a) | | Calculated based on the average shares outstanding methodology. |
| | (b) | | Amount is less than $0.0005 per share. |
| | (c) | | Amount is less than $0.00005 per share. |
| | (d) | | Distributions may not coincide with the current year net investment income or net realized gains as distributions may be paid from current or prior year earnings. |
| | (e) | | Assumes investment at the net asset value at the beginning of the year, reinvestment of all dividends and distributions and a complete redemption of the investment at the net asset value at the end of the year. Returns do not reflect the deduction of taxes that a shareholder would pay on Fund distributions or the redemption of Fund shares. Total returns for periods less than one full year are not annualized. |
| | |
| The accompanying notes are an integral part of these financial statements. | | 77 |
FINANCIAL SQUARE PRIME OBLIGATIONS FUND
Financial Highlights(continued)
Selected Data for a Share Outstanding Throughout Each Period
| | | | | | | | | | | | | | | | | | | | | | | | | | |
| | | | | Financial Square Prime Obligations Fund | |
| | | | | Select Shares | |
| | | | | Six Months Ended
February 28, 2019
(Unaudited) | | | Year Ended August 31, | |
| | | | | 2018 | | | 2017 | | | 2016 | | | 2015 | | | 2014 | |
| | Per Share Data: | | | | | | | | | | | | | | | | | | | | | | | | |
| | | | | | | |
| | Net asset value, beginning of period | | $ | 1.0002 | | | $ | 1.0003 | | | $ | 1.0000 | | | $ | 1.00 | | | $ | 1.00 | | | $ | 1.00 | |
| | | | | | | |
| | Net investment income(a) | | | 0.0143 | | | | 0.0181 | | | | 0.0097 | | | | 0.003 | | | | — | (b) | | | — | (b) |
| | | | | | | | |
| | Net realized and unrealized loss | | | (0.0024 | ) | | | (0.0017 | ) | | | (0.0013 | ) | | | — | (b) | | | — | (b) | | | — | (b) |
| | | | | | | | |
| | Total from investment operations | | | 0.0119 | | | | 0.0164 | | | | 0.0084 | | | | 0.003 | | | | — | (b) | | | — | (b) |
| | | | | | | | |
| | Distributions to shareholders from net investment income | | | (0.0118 | ) | | | (0.0165 | ) | | | (0.0080 | ) | | | (0.003 | ) | | | — | (b) | | | — | (b) |
| | | | | | | | |
| | Distributions to shareholders from net realized gains | | | — | (c) | | | — | (c) | | | (0.0001 | ) | | | — | (b) | | | — | (b) | | | — | (b) |
| | | | | | | | |
| | Total distributions(d) | | | (0.0118 | ) | | | (0.0165 | ) | | | (0.0081 | ) | | | (0.003 | ) | | | — | (b) | | | — | (b) |
| | | | | | | | |
| | Net asset value, end of period | | $ | 1.0003 | | | $ | 1.0002 | | | $ | 1.0003 | | | $ | 1.00 | | | $ | 1.00 | | | $ | 1.00 | |
| | | | | | | |
| | Total return(e) | | | 1.20 | % | | | 1.64 | % | | | 0.84 | % | | | 0.26 | % | | | 0.01 | % | | | 0.01 | % |
| | | | | | | |
| | Net assets, end of period (in 000’s) | | $ | 92,570 | | | $ | 60,236 | | | $ | 18,082 | | | $ | 9,454 | | | $ | 88,996 | | | $ | 118,994 | |
| | | | | | | |
| | Ratio of net expenses to average net assets | | | 0.15 | %(f) | | | 0.14 | % | | | 0.21 | % | | | 0.21 | % | | | 0.20 | % | | | 0.19 | % |
| | | | | | | |
| | Ratio of total expenses to average net assets | | | 0.21 | %(f) | | | 0.24 | % | | | 0.30 | % | | | 0.26 | % | | | 0.26 | % | | | 0.26 | % |
| | | | | | | |
| | Ratio of net investment income to average net assets | | | 2.39 | %(f) | | | 1.81 | % | | | 0.97 | % | | | 0.29 | % | | | 0.01 | % | | | 0.01 | % |
| | (a) | | Calculated based on the average shares outstanding methodology. |
| | (b) | | Amount is less than $0.0005 per share. |
| | (c) | | Amount is less than $0.00005 per share. |
| | (d) | | Distributions may not coincide with the current year net investment income or net realized gains as distributions may be paid from current or prior year earnings. |
| | (e) | | Assumes investment at the net asset value at the beginning of the year, reinvestment of all dividends and distributions and a complete redemption of the investment at the net asset value at the end of the year. Returns do not reflect the deduction of taxes that a shareholder would pay on Fund distributions or the redemption of Fund shares. Total returns for periods less than one full year are not annualized. |
| | |
| 78 | | The accompanying notes are an integral part of these financial statements. |
FINANCIAL SQUARE PRIME OBLIGATIONS FUND
Financial Highlights(continued)
Selected Data for a Share Outstanding Throughout Each Period
| | | | | | | | | | | | | | | | | | | | | | | | | | |
| | | | | Financial Square Prime Obligations Fund
| |
| | | | | Preferred Shares | |
| | | | | Six Months Ended
February 28, 2019
(Unaudited) | | | Year Ended August 31, | |
| | | | | 2018 | | | 2017 | | | 2016 | | | 2015 | | | 2014 | |
| | Per Share Data: | | | | | | | | | | | | | | | | | | | | | | | | |
| | | | | | | |
| | Net asset value, beginning of period | | $ | 1.0001 | | | $ | 1.0003 | | | $ | 1.0000 | | | $ | 1.00 | | | $ | 1.00 | | | $ | 1.00 | |
| | | | | | | |
| | Net investment income(a) | | | 0.0161 | | | | 0.0142 | | | | 0.0030 | | | | 0.002 | | | | — | (b) | | | — | (b) |
| | | | | | | | |
| | Net realized and unrealized gain (loss) | | | (0.0044 | ) | | | 0.0014 | | | | 0.0047 | | | | — | (b) | | | — | (b) | | | — | (b) |
| | | | | | | | |
| | Total from investment operations | | | 0.0117 | | | | 0.0156 | | | | 0.0077 | | | | 0.002 | | | | — | (b) | | | — | (b) |
| | | | | | | | |
| | Distributions to shareholders from net investment income | | | (0.0115 | ) | | | (0.0158 | ) | | | (0.0073 | ) | | | (0.002 | ) | | | — | (b) | | | — | (b) |
| | | | | | | | |
| | Distributions to shareholders from net realized gains | | | — | (c) | | | — | (c) | | | (0.0001 | ) | | | — | (b) | | | — | (b) | | | — | (b) |
| | | | | | | | |
| | Total distributions(d) | | | (0.0115 | ) | | | (0.0158 | ) | | | (0.0074 | ) | | | (0.002 | ) | | | — | (b) | | | — | (b) |
| | | | | | | | |
| | Net asset value, end of period | | $ | 1.0003 | | | $ | 1.0001 | | | $ | 1.0003 | | | $ | 1.00 | | | $ | 1.00 | | | $ | 1.00 | |
| | | | | | | |
| | Total return(e) | | | 1.17 | % | | | 1.57 | % | | | 0.77 | % | | | 0.20 | % | | | 0.01 | % | | | 0.01 | % |
| | | | | | | |
| | Net assets, end of period (in 000’s) | | $ | 2,607 | | | $ | 2,624 | | | $ | 1,003 | | | $ | 279,445 | | | $ | 332,798 | | | $ | 108,264 | |
| | | | | | | |
| | Ratio of net expenses to average net assets | | | 0.22 | %(f) | | | 0.21 | % | | | 0.28 | % | | | 0.28 | % | | | 0.21 | % | | | 0.19 | % |
| | | | | | | |
| | Ratio of total expenses to average net assets | | | 0.28 | %(f) | | | 0.31 | % | | | 0.37 | % | | | 0.33 | % | | | 0.33 | % | | | 0.33 | % |
| | | | | | | |
| | Ratio of net investment income to average net assets | | | 2.31 | %(f) | | | 1.42 | % | | | 0.30 | % | | | 0.19 | % | | | 0.01 | % | | | 0.01 | % |
| | (a) | | Calculated based on the average shares outstanding methodology. |
| | (b) | | Amount is less than $0.0005 per share. |
| | (c) | | Amount is less than $0.00005 per share. |
| | (d) | | Distributions may not coincide with the current year net investment income or net realized gains as distributions may be paid from current or prior year earnings. |
| | (e) | | Assumes investment at the net asset value at the beginning of the year, reinvestment of all dividends and distributions and a complete redemption of the investment at the net asset value at the end of the year. Returns do not reflect the deduction of taxes that a shareholder would pay on Fund distributions or the redemption of Fund shares. Total returns for periods less than one full year are not annualized. |
| | |
| The accompanying notes are an integral part of these financial statements. | | 79 |
FINANCIAL SQUARE PRIME OBLIGATIONS FUND
Financial Highlights(continued)
Selected Data for a Share Outstanding Throughout Each Period
| | | | | | | | | | | | | | | | | | | | | | | | | | |
| | | | | Financial Square Prime Obligations Fund | |
| | | | | Capital Shares | |
| | | | | Six Months Ended
February 28, 2019
(Unaudited) | | | Year Ended August 31, | |
| | | | | 2018 | | | 2017 | | | 2016 | | | 2015 | | | 2014 | |
| | Per Share Data: | | | | | | | | | | | | | | | | | | | | | | | | |
| | | | | | | |
| | Net asset value, beginning of period | | $ | 1.0002 | | | $ | 1.0003 | | | $ | 1.0000 | | | $ | 1.00 | | | $ | 1.00 | | | $ | 1.00 | |
| | | | | | | |
| | Net investment income(a) | | | 0.0155 | | | | 0.0178 | | | | 0.0024 | | | | 0.002 | | | | — | (b) | | | — | (b) |
| | | | | | | | |
| | Net realized and unrealized gain (loss) | | | (0.0041 | ) | | | (0.0026 | ) | | | 0.0048 | | | | — | (b) | | | — | (b) | | | — | (b) |
| | | | | | | | |
| | Total from investment operations | | | 0.0114 | | | | 0.0152 | | | | 0.0072 | | | | 0.002 | | | | — | (b) | | | — | (b) |
| | | | | | | | |
| | Distributions to shareholders from net investment income | | | (0.0112 | ) | | | (0.0153 | ) | | | (0.0068 | ) | | | (0.002 | ) | | | — | (b) | | | — | (b) |
| | | | | | | | |
| | Distributions to shareholders from net realized gains | | | — | (c) | | | — | (c) | | | (0.0001 | ) | | | — | (b) | | | — | (b) | | | — | (b) |
| | | | | | | | |
| | Total distributions(d) | | | (0.0112 | ) | | | (0.0153 | ) | | | (0.0069 | ) | | | (0.002 | ) | | | — | (b) | | | — | (b) |
| | | | | | | | |
| | Net asset value, end of period | | $ | 1.0004 | | | $ | 1.0002 | | | $ | 1.0003 | | | $ | 1.00 | | | $ | 1.00 | | | $ | 1.00 | |
| | | | | | | |
| | Total return(e) | | | 1.14 | % | | | 1.53 | % | | | 0.72 | % | | | 0.16 | % | | | 0.01 | % | | | 0.01 | % |
| | | | | | | |
| | Net assets, end of period (in 000’s) | | $ | 5,062 | | | $ | 6,829 | | | $ | 407 | | | $ | 140,138 | | | $ | 103,978 | | | $ | 72,327 | |
| | | | | | | |
| | Ratio of net expenses to average net assets | | | 0.27 | %(f) | | | 0.26 | % | | | 0.33 | % | | | 0.31 | % | | | 0.21 | % | | | 0.19 | % |
| | | | | | | |
| | Ratio of total expenses to average net assets | | | 0.33 | %(f) | | | 0.36 | % | | | 0.42 | % | | | 0.38 | % | | | 0.38 | % | | | 0.38 | % |
| | | | | | | |
| | Ratio of net investment income to average net assets | | | 2.23 | %(f) | | | 1.78 | % | | | 0.24 | % | | | 0.16 | % | | | 0.01 | % | | | 0.01 | % |
| | (a) | | Calculated based on the average shares outstanding methodology. |
| | (b) | | Amount is less than $0.0005 per share. |
| | (c) | | Amount is less than $0.00005 per share. |
| | (d) | | Distributions may not coincide with the current year net investment income or net realized gains as distributions may be paid from current or prior year earnings. |
| | (e) | | Assumes investment at the net asset value at the beginning of the year, reinvestment of all dividends and distributions and a complete redemption of the investment at the net asset value at the end of the year. Returns do not reflect the deduction of taxes that a shareholder would pay on Fund distributions or the redemption of Fund shares. Total returns for periods less than one full year are not annualized. |
| | |
| 80 | | The accompanying notes are an integral part of these financial statements. |
FINANCIAL SQUARE PRIME OBLIGATIONS FUND
Financial Highlights(continued)
Selected Data for a Share Outstanding Throughout Each Period
| | | | | | | | | | | | | | | | | | | | | | | | | | |
| | | | | Financial Square Prime Obligations Fund | |
| | | | | Administration Shares | |
| | | | | Six Months Ended
February 28, 2019
(Unaudited) | | | Year Ended August 31, | |
| | | | | 2018 | | | 2017 | | | 2016 | | | 2015 | | | 2014 | |
| | Per Share Data: | | | | | | | | | | | | | | | | | | | | | | | | |
| | | | | | | |
| | Net asset value, beginning of period | | $ | 1.0002 | | | $ | 1.0003 | | | $ | 1.0000 | | | $ | 1.00 | | | $ | 1.00 | | | $ | 1.00 | |
| | | | | | | |
| | Net investment income(a) | | | 0.0159 | | | | 0.0139 | | | | 0.0015 | | | | 0.001 | | | | — | (b) | | | — | (b) |
| | | | | | | | |
| | Net realized and unrealized gain (loss) | | | (0.0050 | ) | | | 0.0003 | | | | 0.0047 | | | | — | (b) | | | — | (b) | | | — | (b) |
| | | | | | | | |
| | Total from investment operations | | | 0.0109 | | | | 0.0142 | | | | 0.0062 | | | | 0.001 | | | | — | (b) | | | — | (b) |
| | | | | | | | |
| | Distributions to shareholders from net investment income | | | (0.0107 | ) | | | (0.0143 | ) | | | (0.0058 | ) | | | (0.001 | ) | | | — | (b) | | | — | (b) |
| | | | | | | | |
| | Distributions to shareholders from net realized gains | | | — | (c) | | | — | (c) | | | (0.0001 | ) | | | — | (b) | | | — | (b) | | | — | (b) |
| | | | | | | | |
| | Total distributions(d) | | | (0.0107 | ) | | | (0.0143 | ) | | | (0.0059 | ) | | | (0.001 | ) | | | — | (b) | | | — | (b) |
| | | | | | | | |
| | Net asset value, end of period | | $ | 1.0004 | | | $ | 1.0002 | | | $ | 1.0003 | | | $ | 1.00 | | | $ | 1.00 | | | $ | 1.00 | |
| | | | | | | |
| | Total return(e) | | | 1.09 | % | | | 1.43 | % | | | 0.62 | % | | | 0.09 | % | | | 0.01 | % | | | 0.01 | % |
| | | | | | | |
| | Net assets, end of period (in 000’s) | | $ | 34,010 | | | $ | 7,474 | | | $ | 4,282 | | | $ | 1,250,848 | | | $ | 1,893,461 | | | $ | 1,644,425 | |
| | | | | | | |
| | Ratio of net expenses to average net assets | | | 0.37 | %(f) | | | 0.36 | % | | | 0.43 | % | | | 0.38 | % | | | 0.20 | % | | | 0.19 | % |
| | | | | | | |
| | Ratio of total expenses to average net assets | | | 0.43 | %(f) | | | 0.46 | % | | | 0.52 | % | | | 0.48 | % | | | 0.48 | % | | | 0.48 | % |
| | | | | | | |
| | Ratio of net investment income to average net assets | | | 2.20 | %(f) | | | 1.39 | % | | | 0.15 | % | | | 0.09 | % | | | 0.01 | % | | | 0.01 | % |
| | (a) | | Calculated based on the average shares outstanding methodology. |
| | (b) | | Amount is less than $0.0005 per share. |
| | (c) | | Amount is less than $0.00005 per share. |
| | (d) | | Distributions may not coincide with the current year net investment income or net realized gains as distributions may be paid from current or prior year earnings. |
| | (e) | | Assumes investment at the net asset value at the beginning of the year, reinvestment of all dividends and distributions and a complete redemption of the investment at the net asset value at the end of the year. Returns do not reflect the deduction of taxes that a shareholder would pay on Fund distributions or the redemption of Fund shares. Total returns for periods less than one full year are not annualized. |
| | |
| The accompanying notes are an integral part of these financial statements. | | 81 |
FINANCIAL SQUARE PRIME OBLIGATIONS FUND
Financial Highlights(continued)
Selected Data for a Share Outstanding Throughout Each Period
| | | | | | | | | | | | | | | | | | | | | | | | | | |
| | | | | Financial Square Prime Obligations Fund
| |
| | | | | Premier Shares | |
| | | | | Six Months Ended
February 28, 2019
(Unaudited) | | | Year Ended August 31, | |
| | | | | 2018 | | | 2017 | | | 2016 | | | 2015 | | | 2014 | |
| | Per Share Data: | | | | | | | | | | | | | | | | | | | | | | | | |
| | | | | | | |
| | Net asset value, beginning of period | | $ | 1.0002 | | | $ | 1.0003 | | | $ | 1.0000 | | | $ | 1.00 | | | $ | 1.00 | | | $ | 1.00 | |
| | | | | | | |
| | Net investment income(a) | | | 0.0106 | | | | 0.0144 | | | | 0.0071 | | | | 0.001 | | | | — | (b) | | | — | (b) |
| | | | | | | | |
| | Net realized and unrealized gain (loss) | | | 0.0002 | | | | (0.0001 | ) | | | (0.0018 | ) | | | — | (b) | | | — | (b) | | | — | (b) |
| | | | | | | | |
| | Total from investment operations | | | 0.0108 | | | | 0.0143 | | | | 0.0053 | | | | 0.001 | | | | — | (b) | | | — | (b) |
| | | | | | | | |
| | Distributions to shareholders from net investment income | | | (0.0106 | ) | | | (0.0144 | ) | | | (0.0050 | ) | | | (0.001 | ) | | | — | (b) | | | — | (b) |
| | | | | | | | |
| | Distributions to shareholders from net realized gains | | | — | (c) | | | — | (c) | | | — | (c) | | | — | (b) | | | — | (b) | | | — | (b) |
| | | | | | | | |
| | Total distributions(d) | | | (0.0106 | ) | | | (0.0144 | ) | | | (0.0050 | ) | | | (0.001 | ) | | | — | (b) | | | — | (b) |
| | | | | | | | |
| | Net asset value, end of period | | $ | 1.0004 | | | $ | 1.0002 | | | $ | 1.0003 | | | $ | 1.00 | | | $ | 1.00 | | | $ | 1.00 | |
| | | | | | | |
| | Total return(e) | | | 1.05 | % | | | 1.32 | % | | | 0.53 | % | | | 0.09 | % | | | 0.01 | % | | | 0.01 | % |
| | | | | | | |
| | Net assets, end of period (in 000’s) | | $ | 1 | | | $ | 1 | | | $ | 1 | | | $ | 1 | | | $ | 1 | | | $ | 1 | |
| | | | | | | |
| | Ratio of net expenses to average net assets | | | 0.48 | %(f) | | | 0.47 | % | | | 0.53 | % | | | 0.18 | % | | | 0.18 | % | | | 0.18 | % |
| | | | | | | |
| | Ratio of total expenses to average net assets | | | 0.53 | %(f) | | | 0.56 | % | | | 0.62 | % | | | 0.58 | % | | | 0.58 | % | | | 0.58 | % |
| | | | | | | |
| | Ratio of net investment income to average net assets | | | 2.13 | %(f) | | | 1.44 | % | | | 0.71 | % | | | 0.36 | % | | | 0.40 | % | | | 0.40 | % |
| | (a) | | Calculated based on the average shares outstanding methodology. |
| | (b) | | Amount is less than $0.0005 per share. |
| | (c) | | Amount is less than $0.00005 per share. |
| | (d) | | Distributions may not coincide with the current year net investment income or net realized gains as distributions may be paid from current or prior year earnings. |
| | (e) | | Assumes investment at the net asset value at the beginning of the year, reinvestment of all dividends and distributions and a complete redemption of the investment at the net asset value at the end of the year. Returns do not reflect the deduction of taxes that a shareholder would pay on Fund distributions or the redemption of Fund shares. Total returns for periods less than one full year are not annualized. |
| | |
| 82 | | The accompanying notes are an integral part of these financial statements. |
FINANCIAL SQUARE PRIME OBLIGATIONS FUND
Financial Highlights(continued)
Selected Data for a Share Outstanding Throughout Each Period
| | | | | | | | | | | | | | | | | | | | | | | | | | |
| | | | | Financial Square Prime Obligations Fund
| |
| | | | | Service Shares | |
| | | | | Six Months Ended
February 28, 2019
(Unaudited) | | | Year Ended August 31, | |
| | | | | 2018 | | | 2017 | | | 2016 | | | 2015 | | | 2014 | |
| | Per Share Data: | | | | | | | | | | | | | | | | | | | | | | | | |
| | | | | | | |
| | Net asset value, beginning of period | | $ | 1.0002 | | | $ | 1.0003 | | | $ | 1.0000 | | | $ | 1.00 | | | $ | 1.00 | | | $ | 1.00 | |
| | | | | | | |
| | Net investment income(a) | | | 0.0176 | | | | 0.0145 | | | | 0.0003 | | | | — | (b) | | | — | (b) | | | — | (b) |
| | | | | | | | |
| | Net realized and unrealized gain (loss) | | | (0.0080 | ) | | | (0.0028 | ) | | | 0.0035 | | | | — | (b) | | | — | (b) | | | — | (b) |
| | | | | | | | |
| | Total from investment operations | | | 0.0096 | | | | 0.0117 | | | | 0.0038 | | | | — | (b) | | | — | (b) | | | — | (b) |
| | | | | | | | |
| | Distributions to shareholders from net investment income | | | (0.0095 | ) | | | (0.0118 | ) | | | (0.0034 | ) | | | — | (b) | | | — | (b) | | | — | (b) |
| | | | | | | | |
| | Distributions to shareholders from net realized gains | | | — | (c) | | | — | (c) | | | (0.0001 | ) | | | — | (b) | | | — | (b) | | | — | (b) |
| | | | | | | | |
| | Total distributions(d) | | | (0.0095 | ) | | | (0.0118 | ) | | | (0.0035 | ) | | | — | (b) | | | — | (b) | | | — | (b) |
| | | | | | | | |
| | Net asset value, end of period | | $ | 1.0003 | | | $ | 1.0002 | | | $ | 1.0003 | | | $ | 1.00 | | | $ | 1.00 | | | $ | 1.00 | |
| | | | | | | |
| | Total return(e) | | | 0.97 | % | | | 1.16 | % | | | 0.38 | % | | | 0.01 | % | | | 0.01 | % | | | 0.01 | % |
| | | | | | | |
| | Net assets, end of period (in 000’s) | | $ | 5,109 | | | $ | 102 | | | $ | 103 | | | $ | 253,231 | | | $ | 777,357 | | | $ | 938,791 | |
| | | | | | | |
| | Ratio of net expenses to average net assets | | | 0.62 | %(f) | | | 0.61 | % | | | 0.59 | % | | | 0.42 | % | | | 0.20 | % | | | 0.19 | % |
| | | | | | | |
| | Ratio of total expenses to average net assets | | | 0.68 | %(f) | | | 0.71 | % | | | 0.77 | % | | | 0.73 | % | | | 0.73 | % | | | 0.73 | % |
| | | | | | | |
| | Ratio of net investment income to average net assets | | | 1.98 | %(f) | | | 1.45 | % | | | 0.03 | % | | | — | %(g) | | | 0.01 | % | | | 0.01 | % |
| | (a) | | Calculated based on the average shares outstanding methodology. |
| | (b) | | Amount is less than $0.0005 per share. |
| | (c) | | Amount is less than $0.00005 per share. |
| | (d) | | Distributions may not coincide with the current year net investment income or net realized gains as distributions may be paid from current or prior year earnings. |
| | (e) | | Assumes investment at the net asset value at the beginning of the year, reinvestment of all dividends and distributions and a complete redemption of the investment at the net asset value at the end of the year. Returns do not reflect the deduction of taxes that a shareholder would pay on Fund distributions or the redemption of Fund shares. Total returns for periods less than one full year are not annualized. |
| | (g) | | Amount is less than 0.005% of average net assets. |
| | |
| The accompanying notes are an integral part of these financial statements. | | 83 |
FINANCIAL SQUARE PRIME OBLIGATIONS FUND
Financial Highlights(continued)
Selected Data for a Share Outstanding Throughout Each Period
| | | | | | | | | | | | | | | | | | | | | | | | | | |
| | | | | Financial Square Prime Obligations Fund
| |
| | | | | Resource Shares | |
| | | | | Six Months Ended
February 28, 2019
(Unaudited) | | | Year Ended August 31, | |
| | | | | 2018 | | | 2017 | | | 2016 | | | 2015 | | | 2014 | |
| | Per Share Data: | | | | | | | | | | | | | | | | | | | | | | | | |
| | | | | | | |
| | Net asset value, beginning of period | | $ | 1.0002 | | | $ | 1.0003 | | | $ | 1.0000 | | | $ | 1.00 | | | $ | 1.00 | | | $ | 1.00 | |
| | | | | | | |
| | Net investment income(a) | | | 0.0106 | | | | 0.0144 | | | | 0.0002 | | | | — | (b) | | | — | (b) | | | — | (b) |
| | | | | | | | |
| | Net realized and unrealized gain (loss) | | | 0.0001 | | | | (0.0001 | ) | | | 0.0025 | | | | — | (b) | | | — | (b) | | | — | (b) |
| | | | | | | | |
| | Total from investment operations | | | 0.0107 | | | | 0.0143 | | | | 0.0027 | | | | — | (b) | | | — | (b) | | | — | (b) |
| | | | | | | | |
| | Distributions to shareholders from net investment income | | | (0.0105 | ) | | | (0.0144 | ) | | | (0.0024 | ) | | | — | (b) | | | — | (b) | | | — | (b) |
| | | | | | | | |
| | Distributions to shareholders from net realized gains | | | — | (c) | | | — | (c) | | | — | (c) | | | — | (b) | | | — | (b) | | | — | (b) |
| | | | | | | | |
| | Total distributions(d) | | | (0.0105 | ) | | | (0.0144 | ) | | | (0.0024 | ) | | | — | (b) | | | — | (b) | | | — | (b) |
| | | | | | | | |
| | Net asset value, end of period | | $ | 1.0004 | | | $ | 1.0002 | | | $ | 1.0003 | | | $ | 1.00 | | | $ | 1.00 | | | $ | 1.00 | |
| | | | | | | |
| | Total return(e) | | | 0.90 | % | | | 1.01 | % | | | 0.27 | % | | | 0.01 | % | | | 0.01 | % | | | 0.01 | % |
| | | | | | | |
| | Net assets, end of period (in 000’s) | | $ | 1 | | | $ | 1 | | | $ | 1 | | | $ | 71,804 | | | $ | 72,031 | | | $ | 78,532 | |
| | | | | | | |
| | Ratio of net expenses to average net assets | | | 0.48 | %(f) | | | 0.47 | % | | | 0.52 | % | | | 0.46 | % | | | 0.20 | % | | | 0.19 | % |
| | | | | | | |
| | Ratio of total expenses to average net assets | | | 0.83 | %(f) | | | 0.86 | % | | | 0.92 | % | | | 0.88 | % | | | 0.88 | % | | | 0.88 | % |
| | | | | | | |
| | Ratio of net investment income to average net assets | | | 2.12 | %(f) | | | 1.44 | % | | | 0.02 | % | | | 0.01 | % | | | 0.01 | % | | | 0.01 | % |
| | (a) | | Calculated based on the average shares outstanding methodology. |
| | (b) | | Amount is less than $0.0005 per share. |
| | (c) | | Amount is less than $0.00005 per share. |
| | (d) | | Distributions may not coincide with the current year net investment income or net realized gains as distributions may be paid from current or prior year earnings. |
| | (e) | | Assumes investment at the net asset value at the beginning of the year, reinvestment of all dividends and distributions and a complete redemption of the investment at the net asset value at the end of the year. Returns do not reflect the deduction of taxes that a shareholder would pay on Fund distributions or the redemption of Fund shares. Total returns for periods less than one full year are not annualized. |
| | |
| 84 | | The accompanying notes are an integral part of these financial statements. |
FINANCIAL SQUARE PRIME OBLIGATIONS FUND
Financial Highlights(continued)
Selected Data for a Share Outstanding Throughout Each Period
| | | | | | | | | | | | | | | | | | | | | | | | | | |
| | | | | Financial Square Prime Obligations Fund
| |
| | | | | Cash Management Shares | |
| | | | | Six Months Ended
February 28, 2019
(Unaudited) | | | Year Ended August 31, | |
| | | | | 2018 | | | 2017 | | | 2016 | | | 2015 | | | 2014 | |
| | Per Share Data: | | | | | | | | | | | | | | | | | | | | | | | | |
| | | | | | | |
| | Net asset value, beginning of period | | $ | 1.0002 | | | $ | 1.0003 | | | $ | 1.0000 | | | $ | 1.00 | | | $ | 1.00 | | | $ | 1.00 | |
| | | | | | | |
| | Net investment income(a) | | | 0.0088 | | | | 0.0108 | | | | 0.0051 | | | | 0.001 | | | | — | (b) | | | — | (b) |
| | | | | | | | |
| | Net realized and unrealized loss | | | 0.0002 | | | | (0.0001 | ) | | | (0.0033 | ) | | | — | (b) | | | — | (b) | | | — | (b) |
| | | | | | | | |
| | Total from investment operations | | �� | 0.0090 | | | | 0.0107 | | | | 0.0018 | | | | 0.001 | | | | — | (b) | | | — | (b) |
| | | | | | | | |
| | Distributions to shareholders from net investment income | | | (0.0088 | ) | | | (0.0108 | ) | | | (0.0015 | ) | | | (0.001 | ) | | | — | (b) | | | — | (b) |
| | | | | | | | |
| | Distributions to shareholders from net realized gains | | | — | (c) | | | — | (c) | | | — | (c) | | | — | (b) | | | — | (b) | | | — | (b) |
| | | | | | | | |
| | Total distributions(d) | | | (0.0088 | ) | | | (0.0108 | ) | | | (0.0015 | ) | | | (0.001 | ) | | | — | (b) | | | — | (b) |
| | | | | | | | |
| | Net asset value, end of period | | $ | 1.0004 | | | $ | 1.0002 | | | $ | 1.0003 | | | $ | 1.00 | | | $ | 1.00 | | | $ | 1.00 | |
| | | | | | | |
| | Total return(e) | | | 0.83 | % | | | 0.86 | % | | | 0.18 | % | | | 0.09 | % | | | 0.01 | % | | | 0.01 | % |
| | | | | | | |
| | Net assets, end of period (in 000’s) | | $ | 1 | | | $ | 1 | | | $ | 1 | | | $ | 1 | | | $ | 1 | | | $ | 1 | |
| | | | | | | |
| | Ratio of net expenses to average net assets | | | 0.84 | %(f) | | | 0.83 | % | | | 0.73 | % | | | 0.18 | % | | | 0.18 | % | | | 0.18 | % |
| | | | | | | |
| | Ratio of total expenses to average net assets | | | 0.98 | %(f) | | | 1.01 | % | | | 1.07 | % | | | 1.03 | % | | | 1.03 | % | | | 1.03 | % |
| | | | | | | |
| | Ratio of net investment income to average net assets | | | 1.77 | %(f) | | | 1.08 | % | | | 0.51 | % | | | 0.37 | % | | | 0.40 | % | | | 0.40 | % |
| | (a) | | Calculated based on the average shares outstanding methodology. |
| | (b) | | Amount is less than $0.0005 per share. |
| | (c) | | Amount is less than $0.00005 per share. |
| | (d) | | Distributions may not coincide with the current year net investment income or net realized gains as distributions may be paid from current or prior year earnings. |
| | (e) | | Assumes investment at the net asset value at the beginning of the year, reinvestment of all dividends and distributions and a complete redemption of the investment at the net asset value at the end of the year. Returns do not reflect the deduction of taxes that a shareholder would pay on Fund distributions or the redemption of Fund shares. Total returns for periods less than one full year are not annualized. |
| | |
| The accompanying notes are an integral part of these financial statements. | | 85 |
FINANCIAL SQUARE TREASURY INSTRUMENTS FUND
Financial Highlights(continued)
Selected Data for a Share Outstanding Throughout Each Period
| | | | | | | | | | | | | | | | | | | | | | | | | | |
| | | | | Financial Square Treasury Instruments Fund
| |
| | | | | Institutional Shares | |
| | | | | Six Months Ended
February 28, 2019
(Unaudited) | | | Year Ended August 31, | |
| | | | | 2018 | | | 2017 | | | 2016 | | | 2015 | | | 2014 | |
| | Per Share Data: | | | | | | | | | | | | | | | | | | | | | | | | |
| | | | | | | |
| | Net asset value, beginning of period | | $ | 1.00 | | | $ | 1.00 | | | $ | 1.00 | | | $ | 1.00 | | | $ | 1.00 | | | $ | 1.00 | |
| | | | | | | |
| | Net investment income(a) | | | 0.011 | | | | 0.014 | | | | 0.005 | | | | 0.001 | | | | — | (b) | | | — | (b) |
| | | | | | | | |
| | Net realized gain | | | (0.001 | ) | | | (0.001 | ) | | | — | (b) | | | — | (b) | | | — | (b) | | | — | (b) |
| | | | | | | | |
| | Total from investment operations | | | 0.010 | | | | 0.013 | | | | 0.005 | | | | 0.001 | | | | — | (b) | | | — | (b) |
| | | | | | | | |
| | Distributions to shareholders from net investment income | | | (0.010 | ) | | | (0.013 | ) | | | (0.005 | ) | | | (0.001 | ) | | | — | (b) | | | — | (b) |
| | | | | | | | |
| | Distributions to shareholders from net realized gains | | | — | (b) | | | — | (b) | | | — | (b) | | | — | (b) | | | — | (b) | | | — | (b) |
| | | | | | | | |
| | Total distributions(c) | | | (0.010 | ) | | | (0.013 | ) | | | (0.005 | ) | | | (0.001 | ) | | | — | (b) | | | — | (b) |
| | | | | | | | |
| | Net asset value, end of period | | $ | 1.00 | | | $ | 1.00 | | | $ | 1.00 | | | $ | 1.00 | | | $ | 1.00 | | | $ | 1.00 | |
| | | | | | | |
| | Total return(d) | | | 1.04 | % | | | 1.34 | % | | | 0.48 | % | | | 0.13 | % | | | — | %(e) | | | — | %(e) |
| | | | | | | |
| | Net assets, end of period (in 000’s) | | $ | 49,173,004 | | | $ | 51,205,454 | | | $ | 44,355,448 | | | $ | 50,595,412 | | | $ | 34,094,054 | | | $ | 31,170,061 | |
| | | | | | | |
| | Ratio of net expenses to average net assets | | | 0.20 | %(f) | | | 0.20 | % | | | 0.20 | % | | | 0.19 | % | | | 0.06 | % | | | 0.07 | % |
| | | | | | | |
| | Ratio of total expenses to average net assets | | | 0.20 | %(f) | | | 0.21 | % | | | 0.23 | % | | | 0.23 | % | | | 0.23 | % | | | 0.23 | % |
| | | | | | | |
| | Ratio of net investment income to average net assets | | | 2.10 | %(f) | | | 1.35 | % | | | 0.47 | % | | | 0.14 | % | | | — | %(g) | | | — | %(g) |
| | (a) | | Calculated based on the average shares outstanding methodology. |
| | (b) | | Amount is less than $0.0005 per share. |
| | (c) | | Distributions may not coincide with the current year net investment income or net realized gains as distributions may be paid from current or prior year earnings. |
| | (d) | | Assumes reinvestment of all distributions. Returns do not reflect the deduction of taxes that a shareholder would pay on Fund distributions. Total returns for periods less than one full year are not annualized. |
| | (e) | | Amount is less than 0.005%. |
| | (g) | | Amount is less than 0.005% of average net assets. |
| | |
| 86 | | The accompanying notes are an integral part of these financial statements. |
FINANCIAL SQUARE TREASURY INSTRUMENTS FUND
Financial Highlights(continued)
Selected Data for a Share Outstanding Throughout Each Period
| | | | | | | | | | | | | | | | | | | | | | | | | | |
| | | | | Financial Square Treasury Instruments Fund
| |
| | | | | Select Shares | |
| | | | | Six Months Ended
February 28, 2019
(Unaudited) | | | Year Ended August 31, | |
| | | | | 2018 | | | 2017 | | | 2016 | | | 2015 | | | 2014 | |
| | Per Share Data: | | | | | | | | | | | | | | | | | | | | | | | | |
| | | | | | | |
| | Net asset value, beginning of period | | $ | 1.00 | | | $ | 1.00 | | | $ | 1.00 | | | $ | 1.00 | | | $ | 1.00 | | | $ | 1.00 | |
| | | | | | | |
| | Net investment income(a) | | | 0.016 | | | | 0.015 | | | | 0.004 | | | | 0.001 | | | | — | (b) | | | — | (b) |
| | | | | | | | |
| | Net realized gain (loss) | | | (0.006 | ) | | | (0.002 | ) | | | 0.001 | | | | — | (b) | | | — | (b) | | | — | (b) |
| | | | | | | | |
| | Total from investment operations | | | 0.010 | | | | 0.013 | | | | 0.005 | | | | 0.001 | | | | — | (b) | | | — | (b) |
| | | | | | | | |
| | Distributions to shareholders from net investment income | | | (0.010 | ) | | | (0.013 | ) | | | (0.005 | ) | | | (0.001 | ) | | | — | (b) | | | — | (b) |
| | | | | | | | |
| | Distributions to shareholders from net realized gains | | | — | (b) | | | — | (b) | | | — | (b) | | | — | (b) | | | — | (b) | | | — | (b) |
| | | | | | | | |
| | Total distributions(c) | | | (0.010 | ) | | | (0.013 | ) | | | (0.005 | ) | | | (0.001 | ) | | | — | (b) | | | — | (b) |
| | | | | | | | |
| | Net asset value, end of period | | $ | 1.00 | | | $ | 1.00 | | | $ | 1.00 | | | $ | 1.00 | | | $ | 1.00 | | | $ | 1.00 | |
| | | | | | | |
| | Total return(d) | | | 1.03 | % | | | 1.31 | % | | | 0.45 | % | | | 0.11 | % | | | — | %(e) | | | — | %(e) |
| | | | | | | |
| | Net assets, end of period (in 000’s) | | $ | 329,535 | | | $ | 370,898 | | | $ | 47,839 | | | $ | 21,009 | | | $ | 80,008 | | | $ | 192,930 | |
| | | | | | | |
| | Ratio of net expenses to average net assets | | | 0.23 | %(f) | | | 0.23 | % | | | 0.23 | % | | | 0.21 | % | | | 0.06 | % | | | 0.07 | % |
| | | | | | | |
| | Ratio of total expenses to average net assets | | | 0.23 | %(f) | | | 0.24 | % | | | 0.26 | % | | | 0.26 | % | | | 0.26 | % | | | 0.26 | % |
| | | | | | | |
| | Ratio of net investment income to average net assets | | | 2.07 | %(f) | | | 1.49 | % | | | 0.43 | % | | | 0.07 | % | | | — | %(g) | | | — | %(g) |
| | (a) | | Calculated based on the average shares outstanding methodology. |
| | (b) | | Amount is less than $0.0005 per share. |
| | (c) | | Distributions may not coincide with the current year net investment income or net realized gains as distributions may be paid from current or prior year earnings. |
| | (d) | | Assumes reinvestment of all distributions. Returns do not reflect the deduction of taxes that a shareholder would pay on Fund distributions. Total returns for periods less than one full year are not annualized. |
| | (e) | | Amount is less than 0.005%. |
| | (g) | | Amount is less than 0.005% of average net assets. |
| | |
| The accompanying notes are an integral part of these financial statements. | | 87 |
FINANCIAL SQUARE TREASURY INSTRUMENTS FUND
Financial Highlights(continued)
Selected Data for a Share Outstanding Throughout Each Period
| | | | | | | | | | | | | | | | | | | | | | | | | | |
| | | | | Financial Square Treasury Instruments Fund
| |
| | | | | Preferred Shares | |
| | | | | Six Months Ended
February 28, 2019
(Unaudited) | | | Year Ended August 31, | |
| | | | | 2018 | | | 2017 | | | 2016 | | | 2015 | | | 2014 | |
| | Per Share Data: | | | | | | | | | | | | | | | | | | | | | | | | |
| | | | | | | |
| | Net asset value, beginning of period | | $ | 1.00 | | | $ | 1.00 | | | $ | 1.00 | | | $ | 1.00 | | | $ | 1.00 | | | $ | 1.00 | |
| | | | | | | |
| | Net investment income(a) | | | 0.010 | | | | 0.012 | | | | 0.003 | | | | 0.001 | | | | — | (b) | | | — | (b) |
| | | | | | | | |
| | Net realized gain | | | — | (b) | | | — | (b) | | | 0.001 | | | | — | (b) | | | — | (b) | | | — | (b) |
| | | | | | | | |
| | Total from investment operations | | | 0.010 | | | | 0.012 | | | | 0.004 | | | | 0.001 | | | | — | (b) | | | — | (b) |
| | | | | | | | |
| | Distributions to shareholders from net investment income | | | (0.010 | ) | | | (0.012 | ) | | | (0.004 | ) | | | (0.001 | ) | | | — | (b) | | | — | (b) |
| | | | | | | | |
| | Distributions to shareholders from net realized gains | | | — | (b) | | | — | (b) | | | — | (b) | | | — | (b) | | | — | (b) | | | — | (b) |
| | | | | | | | |
| | Total distributions(c) | | | (0.010 | ) | | | (0.012 | ) | | | (0.004 | ) | | | (0.001 | ) | | | — | (b) | | | — | (b) |
| | | | | | | | |
| | Net asset value, end of period | | $ | 1.00 | | | $ | 1.00 | | | $ | 1.00 | | | $ | 1.00 | | | $ | 1.00 | | | $ | 1.00 | |
| | | | | | | |
| | Total return(d) | | | 0.99 | % | | | 1.24 | % | | | 0.38 | % | | | 0.06 | % | | | — | %(e) | | | — | %(e) |
| | | | | | | |
| | Net assets, end of period (in 000’s) | | $ | 58,961 | | | $ | 45,007 | | | $ | 39,754 | | | $ | 12,735 | | | $ | 33,032 | | | $ | 43,335 | |
| | | | | | | |
| | Ratio of net expenses to average net assets | | | 0.30 | %(f) | | | 0.30 | % | | | 0.30 | % | | | 0.26 | % | | | 0.06 | % | | | 0.07 | % |
| | | | | | | |
| | Ratio of total expenses to average net assets | | | 0.30 | %(f) | | | 0.31 | % | | | 0.33 | % | | | 0.33 | % | | | 0.33 | % | | | 0.33 | % |
| | | | | | | |
| | Ratio of net investment income to average net assets | | | 2.01 | %(f) | | | 1.24 | % | | | 0.34 | % | | | 0.05 | % | | | — | %(g) | | | — | %(g) |
| | (a) | | Calculated based on the average shares outstanding methodology. |
| | (b) | | Amount is less than $0.0005 per share. |
| | (c) | | Distributions may not coincide with the current year net investment income or net realized gains as distributions may be paid from current or prior year earnings. |
| | (d) | | Assumes reinvestment of all distributions. Returns do not reflect the deduction of taxes that a shareholder would pay on Fund distributions. Total returns for periods less than one full year are not annualized. |
| | (e) | | Amount is less than 0.005%. |
| | (g) | | Amount is less than 0.005% of average net assets. |
| | |
| 88 | | The accompanying notes are an integral part of these financial statements. |
FINANCIAL SQUARE TREASURY INSTRUMENTS FUND
Financial Highlights(continued)
Selected Data for a Share Outstanding Throughout Each Period
| | | | | | | | | | | | | | | | | | | | | | | | | | |
| | | | | Financial Square Treasury Instruments Fund
| |
| | | | | Capital Shares | |
| | | | | Six Months Ended
February 28, 2019
(Unaudited) | | | Year Ended August 31, | |
| | | | | 2018 | | | 2017 | | | 2016 | | | 2015 | | | 2014 | |
| | Per Share Data: | | | | | | | | | | | | | | | | | | | | | | | | |
| | | | | | | |
| | Net asset value, beginning of period | | $ | 1.00 | | | $ | 1.00 | | | $ | 1.00 | | | $ | 1.00 | | | $ | 1.00 | | | $ | 1.00 | |
| | | | | | | |
| | Net investment income(a) | | | 0.010 | | | | 0.011 | | | | 0.004 | | | | — | (b) | | | — | (b) | | | — | (b) |
| | | | | | | | |
| | Net realized gain (loss) | | | — | (b) | | | 0.001 | | | | (0.001 | ) | | | — | (b) | | | — | (b) | | | — | (b) |
| | | | | | | | |
| | Total from investment operations | | | 0.010 | | | | 0.012 | | | | 0.003 | | | | — | (b) | | | — | (b) | | | — | (b) |
| | | | | | | | |
| | Distributions to shareholders from net investment income | | | (0.010 | ) | | | (0.012 | ) | | | (0.003 | ) | | | — | (b) | | | — | (b) | | | — | (b) |
| | | | | | | | |
| | Distributions to shareholders from net realized gains | | | — | (b) | | | — | (b) | | | — | (b) | | | — | (b) | | | — | (b) | | | — | (b) |
| | | | | | | | |
| | Total distributions(c) | | | (0.010 | ) | | | (0.012 | ) | | | (0.003 | ) | | | — | (b) | | | — | (b) | | | — | (b) |
| | | | | | | | |
| | Net asset value, end of period | | $ | 1.00 | | | $ | 1.00 | | | $ | 1.00 | | | $ | 1.00 | | | $ | 1.00 | | | $ | 1.00 | |
| | | | | | | |
| | Total return(d) | | | 0.97 | % | | | 1.19 | % | | | 0.33 | % | | | 0.03 | % | | | — | %(e) | | | — | %(e) |
| | | | | | | |
| | Net assets, end of period (in 000’s) | | $ | 581,696 | | | $ | 374,831 | | | $ | 1,054,817 | | | $ | 495,853 | | | $ | 353,326 | | | $ | 163,450 | |
| | | | | | | |
| | Ratio of net expenses to average net assets | | | 0.35 | %(f) | | | 0.35 | % | | | 0.35 | % | | | 0.30 | % | | | 0.06 | % | | | 0.07 | % |
| | | | | | | |
| | Ratio of total expenses to average net assets | | | 0.35 | %(f) | | | 0.36 | % | | | 0.38 | % | | | 0.38 | % | | | 0.38 | % | | | 0.38 | % |
| | | | | | | |
| | Ratio of net investment income to average net assets | | | 1.97 | %(f) | | | 1.08 | % | | | 0.38 | % | | | 0.02 | % | | | — | %(g) | | | — | %(g) |
| | (a) | | Calculated based on the average shares outstanding methodology. |
| | (b) | | Amount is less than $0.0005 per share. |
| | (c) | | Distributions may not coincide with the current year net investment income or net realized gains as distributions may be paid from current or prior year earnings. |
| | (d) | | Assumes reinvestment of all distributions. Returns do not reflect the deduction of taxes that a shareholder would pay on Fund distributions. Total returns for periods less than one full year are not annualized. |
| | (e) | | Amount is less than 0.005%. |
| | (g) | | Amount is less than 0.005% of average net assets. |
| | |
| The accompanying notes are an integral part of these financial statements. | | 89 |
FINANCIAL SQUARE TREASURY INSTRUMENTS FUND
Financial Highlights(continued)
Selected Data for a Share Outstanding Throughout Each Period
| | | | | | | | | | | | | | | | | | | | | | | | | | |
| | | | | Financial Square Treasury Instruments Fund
| |
| | | | | Administration Shares | |
| | | | | Six Months Ended
February 28, 2019
(Unaudited) | | | Year Ended August 31, | |
| | | | | 2018 | | | 2017 | | | 2016 | | | 2015 | | | 2014 | |
| | Per Share Data: | | | | | | | | | | | | | | | | | | | | | | | | |
| | | | | | | |
| | Net asset value, beginning of period | | $ | 1.00 | | | $ | 1.00 | | | $ | 1.00 | | | $ | 1.00 | | | $ | 1.00 | | | $ | 1.00 | |
| | | | | | | |
| | Net investment income(a) | | | 0.009 | | | | 0.011 | | | | 0.003 | | | | — | (b) | | | — | (b) | | | — | (b) |
| | | | | | | | |
| | Net realized loss | | | — | (b) | | | — | (b) | | | (0.001 | ) | | | — | (b) | | | — | (b) | | | — | (b) |
| | | | | | | | |
| | Total from investment operations | | | 0.009 | | | | 0.011 | | | | 0.002 | | | | — | (b) | | | — | (b) | | | — | (b) |
| | | | | | | | |
| | Distributions to shareholders from net investment income | | | (0.009 | ) | | | (0.011 | ) | | | (0.002 | ) | | | — | (b) | | | — | (b) | | | — | (b) |
| | | | | | | | |
| | Distributions to shareholders from net realized gains | | | — | (b) | | | — | (b) | | | — | (b) | | | — | (b) | | | — | (b) | | | — | (b) |
| | | | | | | | |
| | Total distributions(c) | | | (0.009 | ) | | | (0.011 | ) | | | (0.002 | ) | | | — | (b) | | | — | (b) | | | — | (b) |
| | | | | | | | |
| | Net asset value, end of period | | $ | 1.00 | | | $ | 1.00 | | | $ | 1.00 | | | $ | 1.00 | | | $ | 1.00 | | | $ | 1.00 | |
| | | | | | | |
| | Total return(d) | | | 0.92 | % | | | 1.09 | % | | | 0.24 | % | | | — | %(e) | | | — | %(e) | | | — | %(e) |
| | | | | | | |
| | Net assets, end of period (in 000’s) | | $ | 2,292,341 | | | $ | 2,361,026 | | | $ | 2,817,291 | | | $ | 2,186,426 | | | $ | 2,101,757 | | | $ | 1,231,641 | |
| | | | | | | |
| | Ratio of net expenses to average net assets | | | 0.45 | %(f) | | | 0.45 | % | | | 0.44 | % | | | 0.32 | % | | | 0.06 | % | | | 0.07 | % |
| | | | | | | |
| | Ratio of total expenses to average net assets | | | 0.45 | %(f) | | | 0.46 | % | | | 0.48 | % | | | 0.48 | % | | | 0.48 | % | | | 0.48 | % |
| | | | | | | |
| | Ratio of net investment income (loss) to average net assets | | | 1.84 | %(f) | | | 1.07 | % | | | 0.26 | % | | | (0.01 | )% | | | — | %(g) | | | — | %(g) |
| | (a) | | Calculated based on the average shares outstanding methodology. |
| | (b) | | Amount is less than $0.0005 per share. |
| | (c) | | Distributions may not coincide with the current year net investment income or net realized gains as distributions may be paid from current or prior year earnings. |
| | (d) | | Assumes reinvestment of all distributions. Returns do not reflect the deduction of taxes that a shareholder would pay on Fund distributions. Total returns for periods less than one full year are not annualized. |
| | (e) | | Amount is less than 0.005%. |
| | (g) | | Amount is less than 0.005% of average net assets. |
| | |
| 90 | | The accompanying notes are an integral part of these financial statements. |
FINANCIAL SQUARE TREASURY INSTRUMENTS FUND
Financial Highlights(continued)
Selected Data for a Share Outstanding Throughout Each Period
| | | | | | | | | | | | | | | | | | | | | | | | | | |
| | | | | Financial Square Treasury Instruments Fund
| |
| | | | | Premier Shares | |
| | | | | Six Months Ended
February 28, 2019
(Unaudited) | | | Year Ended August 31, | |
| | | | | 2018 | | | 2017 | | | 2016 | | | 2015 | | | 2014 | |
| | Per Share Data: | | | | | | | | | | | | | | | | | | | | | | | | |
| | | | | | | |
| | Net asset value, beginning of period | | $ | 1.00 | | | $ | 1.00 | | | $ | 1.00 | | | $ | 1.00 | | | $ | 1.00 | | | $ | 1.00 | |
| | | | | | | |
| | Net investment income(a) | | | 0.009 | | | | 0.011 | | | | 0.002 | | | | — | (b) | | | — | (b) | | | — | (b) |
| | | | | | | | |
| | Net realized loss | | | — | (b) | | | (0.001 | ) | | | — | (b) | | | — | (b) | | | — | (b) | | | — | (b) |
| | | | | | | | |
| | Total from investment operations | | | 0.009 | | | | 0.010 | | | | 0.002 | | | | — | (b) | | | — | (b) | | | — | (b) |
| | | | | | | | |
| | Distributions to shareholders from net investment income | | | (0.009 | ) | | | (0.010 | ) | | | (0.002 | ) | | | — | (b) | | | — | (b) | | | — | (b) |
| | | | | | | | |
| | Distributions to shareholders from net realized gains | | | — | (b) | | | — | (b) | | | — | (b) | | | — | (b) | | | — | (b) | | | — | (b) |
| | | | | | | | |
| | Total distributions(c) | | | (0.009 | ) | | | (0.010 | ) | | | (0.002 | ) | | | — | (b) | | | — | (b) | | | — | (b) |
| | | | | | | | |
| | Net asset value, end of period | | $ | 1.00 | | | $ | 1.00 | | | $ | 1.00 | | | $ | 1.00 | | | $ | 1.00 | | | $ | 1.00 | |
| | | | | | | |
| | Total return(d) | | | 0.87 | % | | | 0.99 | % | | | 0.17 | % | | | — | %(e) | | | — | %(e) | | | — | %(e) |
| | | | | | | |
| | Net assets, end of period (in 000’s) | | $ | 131,125 | | | $ | 152,344 | | | $ | 56,059 | | | $ | 19,142 | | | $ | 54 | | | $ | 2,720 | |
| | | | | | | |
| | Ratio of net expenses to average net assets | | | 0.55 | %(f) | | | 0.55 | % | | | 0.50 | % | | | 0.38 | % | | | 0.06 | % | | | 0.07 | % |
| | | | | | | |
| | Ratio of total expenses to average net assets | | | 0.55 | %(f) | | | 0.56 | % | | | 0.58 | % | | | 0.58 | % | | | 0.58 | % | | | 0.58 | % |
| | | | | | | |
| | Ratio of net investment income (loss) to average net assets | | | 1.74 | %(f) | | | 1.12 | % | | | 0.20 | % | | | (0.02 | )% | | | — | %(g) | | | — | %(g) |
| | (a) | | Calculated based on the average shares outstanding methodology. |
| | (b) | | Amount is less than $0.0005 per share. |
| | (c) | | Distributions may not coincide with the current year net investment income or net realized gains as distributions may be paid from current or prior year earnings. |
| | (d) | | Assumes reinvestment of all distributions. Returns do not reflect the deduction of taxes that a shareholder would pay on Fund distributions. Total returns for periods less than one full year are not annualized. |
| | (e) | | Amount is less than 0.005%. |
| | (g) | | Amount is less than 0.005% of average net assets. |
| | |
| The accompanying notes are an integral part of these financial statements. | | 91 |
FINANCIAL SQUARE TREASURY INSTRUMENTS FUND
Financial Highlights(continued)
Selected Data for a Share Outstanding Throughout Each Period
| | | | | | | | | | | | | | | | | | | | | | | | | | |
| | | | | Financial Square Treasury Instruments Fund
| |
| | | | | Service Shares | |
| | | | | Six Months Ended
February 28, 2019
(Unaudited) | | | Year Ended August 31, | |
| | | | | 2018 | | | 2017 | | | 2016 | | | 2015 | | | 2014 | |
| | Per Share Data: | | | | | | | | | | | | | | | | | | | | | | | | |
| | | | | | | |
| | Net asset value, beginning of period | | $ | 1.00 | | | $ | 1.00 | | | $ | 1.00 | | | $ | 1.00 | | | $ | 1.00 | | | $ | 1.00 | |
| | | | | | | |
| | Net investment income(a) | | | 0.014 | | | | 0.008 | | | | 0.001 | | | | — | (b) | | | — | (b) | | | — | (b) |
| | | | | | | | |
| | Net realized loss | | | (0.006 | ) | | | — | (b) | | | — | (b) | | | — | (b) | | | — | (b) | | | — | (b) |
| | | | | | | | |
| | Total from investment operations | | | 0.008 | | | | 0.008 | | | | 0.001 | | | | — | (b) | | | — | (b) | | | — | (b) |
| | | | | | | | |
| | Distributions to shareholders from net investment income | | | (0.008 | ) | | | (0.008 | ) | | | (0.001 | ) | | | — | (b) | | | — | (b) | | | — | (b) |
| | | | | | | | |
| | Distributions to shareholders from net realized gains | | | — | (b) | | | — | (b) | | | — | (b) | | | — | (b) | | | — | (b) | | | — | (b) |
| | | | | | | | |
| | Total distributions(c) | | | (0.008 | ) | | | (0.008 | ) | | | (0.001 | ) | | | — | (b) | | | — | (b) | | | — | (b) |
| | | | | | | | |
| | Net asset value, end of period | | $ | 1.00 | | | $ | 1.00 | | | $ | 1.00 | | | $ | 1.00 | | | $ | 1.00 | | | $ | 1.00 | |
| | | | | | | |
| | Total return(d) | | | 0.79 | % | | | 0.84 | % | | | 0.10 | % | | | — | %(e) | | | — | %(e) | | | — | %(e) |
| | | | | | | |
| | Net assets, end of period (in 000’s) | | $ | 68,939 | | | $ | 22,063 | | | $ | 47,234 | | | $ | 91,598 | | | $ | 197,083 | | | $ | 140,016 | |
| | | | | | | |
| | Ratio of net expenses to average net assets | | | 0.70 | %(f) | | | 0.70 | % | | | 0.55 | % | | | 0.29 | % | | | 0.06 | % | | | 0.07 | % |
| | | | | | | |
| | Ratio of total expenses to average net assets | | | 0.70 | %(f) | | | 0.71 | % | | | 0.73 | % | | | 0.73 | % | | | 0.73 | % | | | 0.73 | % |
| | | | | | | |
| | Ratio of net investment income (loss) to average net assets | | | 1.60 | %(f) | | | 0.79 | % | | | 0.05 | % | | | (0.01 | )% | | | — | %(g) | | | — | %(g) |
| | (a) | | Calculated based on the average shares outstanding methodology. |
| | (b) | | Amount is less than $0.0005 per share. |
| | (c) | | Distributions may not coincide with the current year net investment income or net realized gains as distributions may be paid from current or prior year earnings. |
| | (d) | | Assumes reinvestment of all distributions. Returns do not reflect the deduction of taxes that a shareholder would pay on Fund distributions. Total returns for periods less than one full year are not annualized. |
| | (e) | | Amount is less than 0.005%. |
| | (g) | | Amount is less than 0.005% of average net assets. |
| | |
| 92 | | The accompanying notes are an integral part of these financial statements. |
FINANCIAL SQUARE TREASURY INSTRUMENTS FUND
Financial Highlights(continued)
Selected Data for a Share Outstanding Throughout Each Period
| | | | | | | | | | | | | | | | | | | | | | | | | | |
| | | | | Financial Square Treasury Instruments Fund | |
| | | | | Resource Shares | |
| | | | | Six Months Ended
February 28, 2019
(Unaudited) | | | Year Ended August 31, | |
| | | | | 2018 | | | 2017 | | | 2016 | | | 2015 | | | 2014 | |
| | Per Share Data: | | | | | | | | | | | | | | | | | | | | | | | | |
| | | | | | | |
| | Net asset value, beginning of period | | $ | 1.00 | | | $ | 1.00 | | | $ | 1.00 | | | $ | 1.00 | | | $ | 1.00 | | | $ | 1.00 | |
| | | | | | | |
| | Net investment income(a) | | | 0.008 | | | | 0.009 | | | | 0.004 | | | | — | (b) | | | — | (b) | | | — | (b) |
| | | | | | | | |
| | Net realized loss | | | — | (b) | | | — | (b) | | | (0.004 | ) | | | — | (b) | | | — | (b) | | | — | (b) |
| | | | | | | | |
| | Total from investment operations | | | 0.008 | | | | 0.009 | | | | — | (b) | | | — | (b) | | | — | (b) | | | — | (b) |
| | | | | | | | |
| | Distributions to shareholders from net investment income | | | (0.008 | ) | | | (0.009 | ) | | | — | (b) | | | — | (b) | | | — | (b) | | | — | (b) |
| | | | | | | | |
| | Distributions to shareholders from net realized gains | | | — | (b) | | | — | (b) | | | — | (b) | | | — | (b) | | | — | (b) | | | — | (b) |
| | | | | | | | |
| | Total distributions(c) | | | (0.008 | ) | | | (0.009 | ) | | | — | (b) | | | — | (b) | | | — | (b) | | | — | (b) |
| | | | | | | | |
| | Net asset value, end of period | | $ | 1.00 | | | $ | 1.00 | | | $ | 1.00 | | | $ | 1.00 | | | $ | 1.00 | | | $ | 1.00 | |
| | | | | | | |
| | Total return(d) | | | 0.72 | % | | | 0.69 | % | | | 0.04 | % | | | — | %(e) | | | — | %(e) | | | — | %(e) |
| | | | | | | |
| | Net assets, end of period (in 000’s) | | $ | 1 | | | $ | 1 | | | $ | 1 | | | $ | 1 | | | $ | 1 | | | $ | 1 | |
| | | | | | | |
| | Ratio of net expenses to average net assets | | | 0.56 | %(f) | | | 0.55 | % | | | 0.26 | % | | | 0.19 | % | | | 0.06 | % | | | 0.07 | % |
| | | | | | | |
| | Ratio of total expenses to average net assets | | | 0.85 | %(f) | | | 0.86 | % | | | 0.88 | % | | | 0.88 | % | | | 0.88 | % | | | 0.88 | % |
| | | | | | | |
| | Ratio of net investment income to average net assets | | | 1.60 | %(f) | | | 0.87 | % | | | 0.37 | % | | | 0.37 | % | | | 0.40 | % | | | 0.40 | % |
| | (a) | | Calculated based on the average shares outstanding methodology. |
| | (b) | | Amount is less than $0.0005 per share. |
| | (c) | | Distributions may not coincide with the current year net investment income or net realized gains as distributions may be paid from current or prior year earnings. |
| | (d) | | Assumes reinvestment of all distributions. Returns do not reflect the deduction of taxes that a shareholder would pay on Fund distributions. Total returns for periods less than one full year are not annualized. |
| | (e) | | Amount is less than 0.005%. |
| | |
| The accompanying notes are an integral part of these financial statements. | | 93 |
FINANCIAL SQUARE TREASURY INSTRUMENTS FUND
Financial Highlights(continued)
Selected Data for a Share Outstanding Throughout Each Period
| | | | | | | | | | | | | | | | | | | | | | | | | | |
| | | | | Financial Square Treasury Instruments Fund | |
| | | | | Cash Management Shares | |
| | | | | Six Months Ended
February 28, 2019
(Unaudited) | | | Year Ended August 31, | |
| | | | | 2018 | | | 2017 | | | 2016 | | | 2015 | | | 2014 | |
| | Per Share Data: | | | | | | | | | | | | | | | | | | | | | | | | |
| | | | | | | |
| | Net asset value, beginning of period | | $ | 1.00 | | | $ | 1.00 | | | $ | 1.00 | | | $ | 1.00 | | | $ | 1.00 | | | $ | 1.00 | |
| | | | | | | |
| | Net investment income(a) | | | 0.014 | | | | 0.006 | | | | — | (b) | | | — | (b) | | | — | (b) | | | — | (b) |
| | | | | | | | |
| | Net realized loss | | | (0.008 | ) | | | (0.001 | ) | | | — | (b) | | | — | (b) | | | — | (b) | | | — | (b) |
| | | | | | | | |
| | Total from investment operations | | | 0.006 | | | | 0.005 | | | | — | (b) | | | — | (b) | | | — | (b) | | | — | (b) |
| | | | | | | | |
| | Distributions to shareholders from net investment income | | | (0.006 | ) | | | (0.005 | ) | | | — | (b) | | | — | (b) | | | — | (b) | | | — | (b) |
| | | | | | | | |
| | Distributions to shareholders from net realized gains | | | — | (b) | | | — | (b) | | | — | (b) | | | — | (b) | | | — | (b) | | | — | (b) |
| | | | | | | | |
| | Total distributions(c) | | | (0.006 | ) | | | (0.005 | ) | | | — | (b) | | | — | (b) | | | — | (b) | | | — | (b) |
| | | | | | | | |
| | Net asset value, end of period | | $ | 1.00 | | | $ | 1.00 | | | $ | 1.00 | | | $ | 1.00 | | | $ | 1.00 | | | $ | 1.00 | |
| | | | | | | |
| | Total return(d) | | | 0.64 | % | | | 0.54 | % | | | 0.01 | % | | | — | %(e) | | | — | %(e) | | | — | %(e) |
| | | | | | | |
| | Net assets, end of period (in 000’s) | | $ | 9,648 | | | $ | 64 | | | $ | 30 | | | $ | 279 | | | $ | 1 | | | $ | 1 | |
| | | | | | | |
| | Ratio of net expenses to average net assets | | | 1.00 | %(f) | | | 1.00 | % | | | 0.61 | % | | | 0.35 | % | | | 0.06 | % | | | 0.07 | % |
| | | | | | | |
| | Ratio of total expenses to average net assets | | | 1.00 | %(f) | | | 1.01 | % | | | 1.03 | % | | | 1.03 | % | | | 1.03 | % | | | 1.03 | % |
| | | | | | | |
| | Ratio of net investment income to average net assets | | | 1.39 | %(f) | | | 0.60 | % | | | — | %(g) | | | 0.05 | % | | | 0.40 | % | | | 0.40 | % |
| | (a) | | Calculated based on the average shares outstanding methodology. |
| | (b) | | Amount is less than $0.0005 per share. |
| | (c) | | Distributions may not coincide with the current year net investment income or net realized gains as distributions may be paid from current or prior year earnings. |
| | (d) | | Assumes reinvestment of all distributions. Returns do not reflect the deduction of taxes that a shareholder would pay on Fund distributions. Total returns for periods less than one full year are not annualized. |
| | (e) | | Amount is less than 0.005%. |
| | (g) | | Amount is less than 0.005% of average net assets. |
| | |
| 94 | | The accompanying notes are an integral part of these financial statements. |
FINANCIAL SQUARE TREASURY OBLIGATIONS FUND
Financial Highlights(continued)
Selected Data for a Share Outstanding Throughout Each Period
| | | | | | | | | | | | | | | | | | | | | | | | | | |
| | | | | Financial Square Treasury Obligations Fund | |
| | | | | Institutional Shares | |
| | | | | Six Months Ended
February 28, 2019
(Unaudited) | | | Year Ended August 31, | |
| | | | | 2018 | | | 2017 | | | 2016 | | | 2015 | | | 2014 | |
| | Per Share Data: | | | | | | | | | | | | | | | | | | | | | | | | |
| | | | | | | |
| | Net asset value, beginning of period | | $ | 1.00 | | | $ | 1.00 | | | $ | 1.00 | | | $ | 1.00 | | | $ | 1.00 | | | $ | 1.00 | |
| | | | | | | |
| | Net investment income(a) | | | 0.011 | | | | 0.013 | | | | 0.005 | | | | 0.002 | | | | — | (b) | | | — | (b) |
| | | | | | | | |
| | Net realized gain | | | — | (b) | | | 0.001 | | | | — | (b) | | | — | (b) | | | — | (b) | | | — | (b) |
| | | | | | | | |
| | Total from investment operations | | | 0.011 | | | | 0.014 | | | | 0.005 | | | | 0.002 | | | | — | (b) | | | — | (b) |
| | | | | | | | |
| | Distributions to shareholders from net investment income | | | (0.011 | ) | | | (0.014 | ) | | | (0.005 | ) | | | (0.002 | ) | | | — | (b) | | | — | (b) |
| | | | | | | | |
| | Distributions to shareholders from net realized gains | | | — | (b) | | | — | (b) | | | — | (b) | | | — | (b) | | | — | (b) | | | — | (b) |
| | | | | | | | |
| | Total distributions(c) | | | (0.011 | ) | | | (0.014 | ) | | | (0.005 | ) | | | (0.002 | ) | | | — | (b) | | | — | (b) |
| | | | | | | | |
| | Net asset value, end of period | | $ | 1.00 | | | $ | 1.00 | | | $ | 1.00 | | | $ | 1.00 | | | $ | 1.00 | | | $ | 1.00 | |
| | | | | | | |
| | Total return(d) | | | 1.06 | % | | | 1.37 | % | | | 0.50 | % | | | 0.15 | % | | | 0.01 | % | | | 0.01 | % |
| | | | | | | |
| | Net assets, end of period (in 000’s) | | $ | 11,277,421 | | | $ | 10,649,826 | | | $ | 15,091,527 | | | $ | 19,950,969 | | | $ | 12,758,713 | | | $ | 12,822,354 | |
| | | | | | | |
| | Ratio of net expenses to average net assets | | | 0.20 | %(e) | | | 0.20 | % | | | 0.20 | % | | | 0.19 | % | | | 0.10 | % | | | 0.08 | % |
| | | | | | | |
| | Ratio of total expenses to average net assets | | | 0.20 | %(e) | | | 0.21 | % | | | 0.23 | % | | | 0.23 | % | | | 0.23 | % | | | 0.23 | % |
| | | | | | | |
| | Ratio of net investment income to average net assets | | | 2.14 | %(e) | | | 1.31 | % | | | 0.47 | % | | | 0.14 | % | | | — | %(f) | | | 0.01 | % |
| | (a) | | Calculated based on the average shares outstanding methodology. |
| | (b) | | Amount is less than $0.0005 per share. |
| | (c) | | Distributions may not coincide with the current year net investment income or net realized gains as distributions may be paid from current or prior year earnings. |
| | (d) | | Assumes reinvestment of all distributions. Returns do not reflect the deduction of taxes that a shareholder would pay on Fund distributions. Total returns for periods less than one full year are not annualized. |
| | (f) | | Amount is less than 0.005% of average net assets. |
| | |
| The accompanying notes are an integral part of these financial statements. | | 95 |
FINANCIAL SQUARE TREASURY OBLIGATIONS FUND
Financial Highlights(continued)
Selected Data for a Share Outstanding Throughout Each Period
| | | | | | | | | | | | | | | | | | | | | | | | | | |
| | | | | Financial Square Treasury Obligations Fund
| |
| | | | | Select Shares | |
| | | | | Six Months Ended
February 28, 2019
(Unaudited) | | | Year Ended August 31, | |
| | | | | 2018 | | | 2017 | | | 2016 | | | 2015 | | | 2014 | |
| | Per Share Data: | | | | | | | | | | | | | | | | | | | | | | | | |
| | | | | | | |
| | Net asset value, beginning of period | | $ | 1.00 | | | $ | 1.00 | | | $ | 1.00 | | | $ | 1.00 | | | $ | 1.00 | | | $ | 1.00 | |
| | | | | | | |
| | Net investment income(a) | | | 0.007 | | | | 0.015 | | | | 0.005 | | | | 0.001 | | | | — | (b) | | | — | (b) |
| | | | | | | | |
| | Net realized gain (loss) | | | 0.003 | | | | (0.002 | ) | | | — | (b) | | | — | (b) | | | — | (b) | | | — | (b) |
| | | | | | | | |
| | Total from investment operations | | | 0.010 | | | | 0.013 | | | | 0.005 | | | | 0.001 | | | | — | (b) | | | — | (b) |
| | | | | | | | |
| | Distributions to shareholders from net investment income | | | (0.010 | ) | | | (0.013 | ) | | | (0.005 | ) | | | (0.001 | ) | | | — | (b) | | | — | (b) |
| | | | | | | | |
| | Distributions to shareholders from net realized gains | | | — | (b) | | | — | (b) | | | — | (b) | | | — | (b) | | | — | (b) | | | — | (b) |
| | | | | | | | |
| | Total distributions(c) | | | (0.010 | ) | | | (0.013 | ) | | | (0.005 | ) | | | (0.001 | ) | | | — | (b) | | | — | (b) |
| | | | | | | | |
| | Net asset value, end of period | | $ | 1.00 | | | $ | 1.00 | | | $ | 1.00 | | | $ | 1.00 | | | $ | 1.00 | | | $ | 1.00 | |
| | | | | | | |
| | Total return(d) | | | 1.05 | % | | | 1.34 | % | | | 0.47 | % | | | 0.13 | % | | | 0.01 | % | | | 0.01 | % |
| | | | | | | |
| | Net assets, end of period (in 000’s) | | $ | 49,017 | | | $ | 134,034 | | | $ | 67,865 | | | $ | 505,162 | | | $ | 169,026 | | | $ | 279,848 | |
| | | | | | | |
| | Ratio of net expenses to average net assets | | | 0.23 | %(e) | | | 0.23 | % | | | 0.23 | % | | | 0.21 | % | | | 0.10 | % | | | 0.08 | % |
| | | | | | | |
| | Ratio of total expenses to average net assets | | | 0.23 | %(e) | | | 0.24 | % | | | 0.26 | % | | | 0.26 | % | | | 0.26 | % | | | 0.26 | % |
| | | | | | | |
| | Ratio of net investment income to average net assets | | | 2.03 | %(e) | | | 1.46 | % | | | 0.46 | % | | | 0.12 | % | | | — | %(f) | | | — | %(f) |
| | (a) | | Calculated based on the average shares outstanding methodology. |
| | (b) | | Amount is less than $0.0005 per share. |
| | (c) | | Distributions may not coincide with the current year net investment income or net realized gains as distributions may be paid from current or prior year earnings. |
| | (d) | | Assumes reinvestment of all distributions. Returns do not reflect the deduction of taxes that a shareholder would pay on Fund distributions. Total returns for periods less than one full year are not annualized. |
| | (f) | | Amount is less than 0.005% of average net assets. |
| | |
| 96 | | The accompanying notes are an integral part of these financial statements. |
FINANCIAL SQUARE TREASURY OBLIGATIONS FUND
Financial Highlights(continued)
Selected Data for a Share Outstanding Throughout Each Period
| | | | | | | | | | | | | | | | | | | | | | | | | | |
| | | | | Financial Square Treasury Obligations Fund | |
| | | | | Preferred Shares | |
| | | | | Six Months Ended
February 28, 2019
(Unaudited) | | | Year Ended August 31, | |
| | | | | 2018 | | | 2017 | | | 2016 | | | 2015 | | | 2014 | |
| | Per Share Data: | | | | | | | | | | | | | | | | | | | | | | | | |
| | | | | | | |
| | Net asset value, beginning of period | | $ | 1.00 | | | $ | 1.00 | | | $ | 1.00 | | | $ | 1.00 | | | $ | 1.00 | | | $ | 1.00 | |
| | | | | | | |
| | Net investment income(a) | | | 0.012 | | | | 0.013 | | | | 0.004 | | | | 0.001 | | | | — | (b) | | | — | (b) |
| | | | | | | | |
| | Net realized loss | | | (0.002 | ) | | | — | (b) | | | — | (b) | | | — | (b) | | | — | (b) | | | — | (b) |
| | | | | | | | |
| | Total from investment operations | | | 0.010 | | | | 0.013 | | | | 0.004 | | | | 0.001 | | | | — | (b) | | | — | (b) |
| | | | | | | | |
| | Distributions to shareholders from net investment income | | | (0.010 | ) | | | (0.013 | ) | | | (0.004 | ) | | | (0.001 | ) | | | — | (b) | | | — | (b) |
| | | | | | | | |
| | Distributions to shareholders from net realized gains | | | — | (b) | | | — | (b) | | | — | (b) | | | — | (b) | | | — | (b) | | | — | (b) |
| | | | | | | | |
| | Total distributions(c) | | | (0.010 | ) | | | (0.013 | ) | | | (0.004 | ) | | | (0.001 | ) | | | — | (b) | | | — | (b) |
| | | | | | | | |
| | Net asset value, end of period | | $ | 1.00 | | | $ | 1.00 | | | $ | 1.00 | | | $ | 1.00 | | | $ | 1.00 | | | $ | 1.00 | |
| | | | | | | |
| | Total return(d) | | | 1.01 | % | | | 1.26 | % | | | 0.40 | % | | | 0.08 | % | | | 0.01 | % | | | 0.01 | % |
| | | | | | | |
| | Net assets, end of period (in 000’s) | | $ | 400,153 | | | $ | 173,807 | | | $ | 123,436 | | | $ | 81,542 | | | $ | 220,426 | | | $ | 205,386 | |
| | | | | | | |
| | Ratio of net expenses to average net assets | | | 0.30 | %(e) | | | 0.30 | % | | | 0.30 | % | | | 0.25 | % | | | 0.10 | % | | | 0.08 | % |
| | | | | | | |
| | Ratio of total expenses to average net assets | | | 0.30 | %(e) | | | 0.31 | % | | | 0.33 | % | | | 0.33 | % | | | 0.33 | % | | | 0.33 | % |
| | | | | | | |
| | Ratio of net investment income to average net assets | | | 2.06 | %(e) | | | 1.28 | % | | | 0.40 | % | | | 0.05 | % | | | — | %(f) | | | — | %(f) |
| | (a) | | Calculated based on the average shares outstanding methodology. |
| | (b) | | Amount is less than $0.0005 per share. |
| | (c) | | Distributions may not coincide with the current year net investment income or net realized gains as distributions may be paid from current or prior year earnings. |
| | (d) | | Assumes reinvestment of all distributions. Returns do not reflect the deduction of taxes that a shareholder would pay on Fund distributions. Total returns for periods less than one full year are not annualized. |
| | (f) | | Amount is less than 0.005% of average net assets. |
| | |
| The accompanying notes are an integral part of these financial statements. | | 97 |
FINANCIAL SQUARE TREASURY OBLIGATIONS FUND
Financial Highlights(continued)
Selected Data for a Share Outstanding Throughout Each Period
| | | | | | | | | | | | | | | | | | | | | | | | | | |
| | | | | Financial Square Treasury Obligations Fund | |
| | | | | Capital Shares | |
| | | | | Six Months Ended
February 28, 2019
(Unaudited) | | | Year Ended August 31, | |
| | | | | 2018 | | | 2017 | | | 2016 | | | 2015 | | | 2014 | |
| | Per Share Data: | | | | | | | | | | | | | | | | | | | | | | | | |
| | | | | | | |
| | Net asset value, beginning of period | | $ | 1.00 | | | $ | 1.00 | | | $ | 1.00 | | | $ | 1.00 | | | $ | 1.00 | | | $ | 1.00 | |
| | | | | | | |
| | Net investment income(a) | | | 0.010 | | | | 0.012 | | | | 0.003 | | | | — | (b) | | | — | (b) | | | — | (b) |
| | | | | | | | |
| | Net realized gain | | | — | (b) | | | — | (b) | | | — | (b) | | | — | (b) | | | — | (b) | | | — | (b) |
| | | | | | | | |
| | Total from investment operations | | | 0.010 | | | | 0.012 | | | | 0.003 | | | | — | (b) | | | — | (b) | | | — | (b) |
| | | | | | | | |
| | Distributions to shareholders from net investment income | | | (0.010 | ) | | | (0.012 | ) | | | (0.003 | ) | | | — | (b) | | | — | (b) | | | — | (b) |
| | | | | | | | |
| | Distributions to shareholders from net realized gains | | | — | (b) | | | — | (b) | | | — | (b) | | | — | (b) | | | — | (b) | | | — | (b) |
| | | | | | | | |
| | Total distributions(c) | | | (0.010 | ) | | | (0.012 | ) | | | (0.003 | ) | | | — | (b) | | | — | (b) | | | — | (b) |
| | | | | | | | |
| | Net asset value, end of period | | $ | 1.00 | | | $ | 1.00 | | | $ | 1.00 | | | $ | 1.00 | | | $ | 1.00 | | | $ | 1.00 | |
| | | | | | | |
| | Total return(d) | | | 0.99 | % | | | 1.21 | % | | | 0.35 | % | | | 0.05 | % | | | 0.01 | % | | | 0.01 | % |
| | | | | | | |
| | Net assets, end of period (in 000’s) | | $ | 563,055 | | | $ | 299,105 | | | $ | 269,417 | | | $ | 404,533 | | | $ | 442,625 | | | $ | 356,753 | |
| | | | | | | |
| | Ratio of net expenses to average net assets | | | 0.35 | %(e) | | | 0.35 | % | | | 0.35 | % | | | 0.30 | % | | | 0.10 | % | | | 0.08 | % |
| | | | | | | |
| | Ratio of total expenses to average net assets | | | 0.35 | %(e) | | | 0.36 | % | | | 0.38 | % | | | 0.38 | % | | | 0.38 | % | | | 0.38 | % |
| | | | | | | |
| | Ratio of net investment income to average net assets | | | 2.00 | %(e) | | | 1.19 | % | | | 0.34 | % | | | 0.03 | % | | | 0.01 | % | | | — | %(f) |
| | (a) | | Calculated based on the average shares outstanding methodology. |
| | (b) | | Amount is less than $0.0005 per share. |
| | (c) | | Distributions may not coincide with the current year net investment income or net realized gains as distributions may be paid from current or prior year earnings. |
| | (d) | | Assumes reinvestment of all distributions. Returns do not reflect the deduction of taxes that a shareholder would pay on Fund distributions. Total returns for periods less than one full year are not annualized. |
| | (f) | | Amount is less than 0.005% of average net assets. |
| | |
| 98 | | The accompanying notes are an integral part of these financial statements. |
FINANCIAL SQUARE TREASURY OBLIGATIONS FUND
Financial Highlights(continued)
Selected Data for a Share Outstanding Throughout Each Period
| | | | | | | | | | | | | | | | | | | | | | | | | | |
| | | | | Financial Square Treasury Obligations Fund | |
| | | | | Administration Shares | |
| | | | | Six Months Ended
February 28, 2019
(Unaudited) | | | Year Ended August 31, | |
| | | | | 2018 | | | 2017 | | | 2016 | | | 2015 | | | 2014 | |
| | Per Share Data: | | | | | | | | | | | | | | | | | | | | | | | | |
| | | | | | | |
| | Net asset value, beginning of period | | $ | 1.00 | | | $ | 1.00 | | | $ | 1.00 | | | $ | 1.00 | | | $ | 1.00 | | | $ | 1.00 | |
| | | | | | | |
| | Net investment income(a) | | | 0.010 | | | | 0.011 | | | | 0.002 | | | | — | (b) | | | — | (b) | | | — | (b) |
| | | | | | | | |
| | Net realized gain (loss) | | | (0.001 | ) | | | — | (b) | | | 0.001 | | | | — | (b) | | | — | (b) | | | — | (b) |
| | | | | | | | |
| | Total from investment operations | | | 0.009 | | | | 0.011 | | | | 0.003 | | | | — | (b) | | | — | (b) | | | — | (b) |
| | | | | | | | |
| | Distributions to shareholders from net investment income | | | (0.009 | ) | | | (0.011 | ) | | | (0.003 | ) | | | — | (b) | | | — | (b) | | | — | (b) |
| | | | | | | | |
| | Distributions to shareholders from net realized gains | | | — | (b) | | | — | (b) | | | — | (b) | | | — | (b) | | | — | (b) | | | — | (b) |
| | | | | | | | |
| | Total distributions(c) | | | (0.009 | ) | | | (0.011 | ) | | | (0.003 | ) | | | — | (b) | | | — | (b) | | | — | (b) |
| | | | | | | | |
| | Net asset value, end of period | | $ | 1.00 | | | $ | 1.00 | | | $ | 1.00 | | | $ | 1.00 | | | $ | 1.00 | | | $ | 1.00 | |
| | | | | | | |
| | Total return(d) | | | 0.94 | % | | | 1.11 | % | | | 0.26 | % | | | 0.01 | % | | | 0.01 | % | | | 0.01 | % |
| | | | | | | |
| | Net assets, end of period (in 000’s) | | $ | 1,758,556 | | | $ | 1,810,200 | | | $ | 1,307,550 | | | $ | 1,543,863 | | | $ | 1,620,517 | | | $ | 2,144,601 | |
| | | | | | | |
| | Ratio of net expenses to average net assets | | | 0.45 | %(e) | | | 0.45 | % | | | 0.44 | % | | | 0.33 | % | | | 0.10 | % | | | 0.08 | % |
| | | | | | | |
| | Ratio of total expenses to average net assets | | | 0.45 | %(e) | | | 0.46 | % | | | 0.48 | % | | | 0.48 | % | | | 0.48 | % | | | 0.48 | % |
| | | | | | | |
| | Ratio of net investment income (loss) to average net assets | | | 1.88 | %(e) | | | 1.14 | % | | | 0.25 | % | | | (0.01 | )% | | | — | %(f) | | | — | %(f) |
| | (a) | | Calculated based on the average shares outstanding methodology. |
| | (b) | | Amount is less than $0.0005 per share. |
| | (c) | | Distributions may not coincide with the current year net investment income or net realized gains as distributions may be paid from current or prior year earnings. |
| | (d) | | Assumes reinvestment of all distributions. Returns do not reflect the deduction of taxes that a shareholder would pay on Fund distributions. Total returns for periods less than one full year are not annualized. |
| | (f) | | Amount is less than 0.005% of average net assets. |
| | |
| The accompanying notes are an integral part of these financial statements. | | 99 |
FINANCIAL SQUARE TREASURY OBLIGATIONS FUND
Financial Highlights(continued)
Selected Data for a Share Outstanding Throughout Each Period
| | | | | | | | | | | | | | | | | | | | | | | | | | |
| | | | | Financial Square Treasury Obligations Fund | |
| | | | | Premier Shares | |
| | | | | Six Months Ended
February 28, 2019
(Unaudited) | | | Year Ended August 31, | |
| | | | | 2018 | | | 2017 | | | 2016 | | | 2015 | | | 2014 | |
| | Per Share Data: | | | | | | | | | | | | | | | | | | | | | | | | |
| | | | | | | |
| | Net asset value, beginning of period | | $ | 1.00 | | | $ | 1.00 | | | $ | 1.00 | | | $ | 1.00 | | | $ | 1.00 | | | $ | 1.00 | |
| | | | | | | |
| | Net investment income(a) | | | 0.011 | | | | 0.013 | | | | 0.004 | | | | — | (b) | | | — | (b) | | | — | (b) |
| | | | | | | | |
| | Net realized loss | | | (0.002 | ) | | | (0.004 | ) | | | (0.002 | ) | | | — | (b) | | | — | (b) | | | — | (b) |
| | | | | | | | |
| | Total from investment operations | | | 0.009 | | | | 0.009 | | | | 0.002 | | | | — | (b) | | | — | (b) | | | — | (b) |
| | | | | | | | |
| | Distributions to shareholders from net investment income | | | (0.009 | ) | | | (0.009 | ) | | | (0.002 | ) | | | — | (b) | | | — | (b) | | | — | (b) |
| | | | | | | | |
| | Distributions to shareholders from net realized gains | | | — | (b) | | | — | (b) | | | — | (b) | | | — | (b) | | | — | (b) | | | — | (b) |
| | | | | | | | |
| | Total distributions(c) | | | (0.009 | ) | | | (0.009 | ) | | | (0.002 | ) | | | — | (b) | | | — | (b) | | | — | (b) |
| | | | | | | | |
| | Net asset value, end of period | | $ | 1.00 | | | $ | 1.00 | | | $ | 1.00 | | | $ | 1.00 | | | $ | 1.00 | | | $ | 1.00 | |
| | | | | | | |
| | Total return(d) | | | 0.89 | % | | | 1.01 | % | | | 0.19 | % | | | 0.01 | % | | | 0.01 | % | | | 0.01 | % |
| | | | | | | |
| | Net assets, end of period (in 000’s) | | $ | 16,847 | | | $ | 16,492 | | | $ | 1 | | | $ | 1 | | | $ | 1 | | | $ | 948 | |
| | | | | | | |
| | Ratio of net expenses to average net assets | | | 0.55 | %(e) | | | 0.55 | % | | | 0.27 | % | | | 0.19 | % | | | 0.10 | % | | | 0.08 | % |
| | | | | | | |
| | Ratio of total expenses to average net assets | | | 0.55 | %(e) | | | 0.56 | % | | | 0.58 | % | | | 0.58 | % | | | 0.58 | % | | | 0.58 | % |
| | | | | | | |
| | Ratio of net investment income (loss) to average net assets | | | 1.79 | %(e) | | | 1.32 | % | | | 0.37 | % | | | 0.36 | % | | | (0.02 | )% | | | (0.01 | )% |
| | (a) | | Calculated based on the average shares outstanding methodology. |
| | (b) | | Amount is less than $0.0005 per share. |
| | (c) | | Distributions may not coincide with the current year net investment income or net realized gains as distributions may be paid from current or prior year earnings. |
| | (d) | | Assumes reinvestment of all distributions. Returns do not reflect the deduction of taxes that a shareholder would pay on Fund distributions. Total returns for periods less than one full year are not annualized. |
| | |
| 100 | | The accompanying notes are an integral part of these financial statements. |
FINANCIAL SQUARE TREASURY OBLIGATIONS FUND
Financial Highlights(continued)
Selected Data for a Share Outstanding Throughout Each Period
| | | | | | | | | | | | | | | | | | | | | | | | | | |
| | | | | Financial Square Treasury Obligations Fund | |
| | | | | Service Shares | |
| | | | | Six Months Ended
February 28, 2019
(Unaudited) | | | Year Ended August 31, | |
| | | | | 2018 | | | 2017 | | | 2016 | | | 2015 | | | 2014 | |
| | Per Share Data: | | | | | | | | | | | | | | | | | | | | | | | | |
| | | | | | | |
| | Net asset value, beginning of period | | $ | 1.00 | | | $ | 1.00 | | | $ | 1.00 | | | $ | 1.00 | | | $ | 1.00 | | | $ | 1.00 | |
| | | | | | | |
| | Net investment income(a) | | | 0.008 | | | | 0.009 | | | | 0.001 | | | | — | (b) | | | — | (b) | | | — | (b) |
| | | | | | | | |
| | Net realized gain | | | — | (b) | | | — | (b) | | | — | (b) | | | — | (b) | | | — | (b) | | | — | (b) |
| | | | | | | | |
| | Total from investment operations | | | 0.008 | | | | 0.009 | | | | 0.001 | | | | — | (b) | | | — | (b) | | | — | (b) |
| | | | | | | | |
| | Distributions to shareholders from net investment income | | | (0.008 | ) | | | (0.009 | ) | | | (0.001 | ) | | | — | (b) | | | — | (b) | | | — | (b) |
| | | | | | | | |
| | Distributions to shareholders from net realized gains | | | — | (b) | | | — | (b) | | | — | (b) | | | — | (b) | | | — | (b) | | | — | (b) |
| | | | | | | | |
| | Total distributions(c) | | | (0.008 | ) | | | (0.009 | ) | | | (0.001 | ) | | | — | (b) | | | — | (b) | | | — | (b) |
| | | | | | | | |
| | Net asset value, end of period | | $ | 1.00 | | | $ | 1.00 | | | $ | 1.00 | | | $ | 1.00 | | | $ | 1.00 | | | $ | 1.00 | |
| | | | | | | |
| | Total return(d) | | | 0.81 | % | | | 0.86 | % | | | 0.11 | % | | | 0.01 | % | | | 0.01 | % | | | 0.01 | % |
| | | | | | | |
| | Net assets, end of period (in 000’s) | | $ | 1,124,453 | | | $ | 1,342,308 | | | $ | 954,846 | | | $ | 787,768 | | | $ | 940,671 | | | $ | 915,527 | |
| | | | | | | |
| | Ratio of net expenses to average net assets | | | 0.70 | %(e) | | | 0.70 | % | | | 0.59 | % | | | 0.33 | % | | | 0.10 | % | | | 0.08 | % |
| | | | | | | |
| | Ratio of total expenses to average net assets | | | 0.70 | %(e) | | | 0.71 | % | | | 0.73 | % | | | 0.73 | % | | | 0.73 | % | | | 0.73 | % |
| | | | | | | |
| | Ratio of net investment income (loss) to average net assets | | | 1.63 | %(e) | | | 0.88 | % | | | 0.11 | % | | | (0.01 | )% | | | — | %(f) | | | — | %(f) |
| | (a) | | Calculated based on the average shares outstanding methodology. |
| | (b) | | Amount is less than $0.0005 per share. |
| | (c) | | Distributions may not coincide with the current year net investment income or net realized gains as distributions may be paid from current or prior year earnings. |
| | (d) | | Assumes reinvestment of all distributions. Returns do not reflect the deduction of taxes that a shareholder would pay on Fund distributions. Total returns for periods less than one full year are not annualized. |
| | (f) | | Amount is less than 0.005% of average net assets. |
| | |
| The accompanying notes are an integral part of these financial statements. | | 101 |
FINANCIAL SQUARE TREASURY OBLIGATIONS FUND
Financial Highlights(continued)
Selected Data for a Share Outstanding Throughout Each Period
| | | | | | | | | | | | | | | | | | | | | | | | | | |
| | | | | Financial Square Treasury Obligations Fund | |
| | | | | Resource Shares | |
| | | | | Six Months Ended
February 28, 2019
(Unaudited) | | | Year Ended August 31, | |
| | | | | 2018 | | | 2017 | | | 2016 | | | 2015 | | | 2014 | |
| | Per Share Data: | | | | | | | | | | | | | | | | | | | | | | | | |
| | | | | | | |
| | Net asset value, beginning of period | | $ | 1.00 | | | $ | 1.00 | | | $ | 1.00 | | | $ | 1.00 | | | $ | 1.00 | | | $ | 1.00 | |
| | | | | | | |
| | Net investment income(a) | | | 0.007 | | | | 0.008 | | | | 0.004 | | | | — | (b) | | | — | (b) | | | — | (b) |
| | | | | | | | |
| | Net realized gain (loss) | | | — | (b) | | | — | (b) | | | (0.004 | ) | | | — | (b) | | | — | (b) | | | — | (b) |
| | | | | | | | |
| | Total from investment operations | | | 0.007 | | | | 0.008 | | | | — | (b) | | | — | (b) | | | — | (b) | | | — | (b) |
| | | | | | | | |
| | Distributions to shareholders from net investment income | | | (0.007 | ) | | | (0.008 | ) | | | — | (b) | | | — | (b) | | | — | (b) | | | — | (b) |
| | | | | | | | |
| | Distributions to shareholders from net realized gains | | | — | (b) | | | — | (b) | | | — | (b) | | | — | (b) | | | — | (b) | | | — | (b) |
| | | | | | | | |
| | Total distributions(c) | | | (0.007 | ) | | | (0.008 | ) | | | — | (b) | | | — | (b) | | | — | (b) | | | — | (b) |
| | | | | | | | |
| | Net asset value, end of period | | $ | 1.00 | | | $ | 1.00 | | | $ | 1.00 | | | $ | 1.00 | | | $ | 1.00 | | | $ | 1.00 | |
| | | | | | | |
| | Total return(d) | | | 0.74 | % | | | 0.71 | % | | | 0.05 | % | | | 0.01 | % | | | 0.01 | % | | | 0.01 | % |
| | | | | | | |
| | Net assets, end of period (in 000’s) | | $ | 1 | | | $ | 1 | | | $ | 1 | | | $ | 1 | | | $ | 1 | | | $ | 1 | |
| | | | | | | |
| | Ratio of net expenses to average net assets | | | 0.56 | %(e) | | | 0.56 | % | | | 0.27 | % | | | 0.19 | % | | | 0.10 | % | | | 0.08 | % |
| | | | | | | |
| | Ratio of total expenses to average net assets | | | 0.85 | %(e) | | | 0.86 | % | | | 0.88 | % | | | 0.88 | % | | | 0.88 | % | | | 0.88 | % |
| | | | | | | |
| | Ratio of net investment income to average net assets | | | 1.51 | %(e) | | | 0.78 | % | | | 0.37 | % | | | 0.36 | % | | | 0.40 | % | | | 0.40 | % |
| | (a) | | Calculated based on the average shares outstanding methodology. |
| | (b) | | Amount is less than $0.0005 per share. |
| | (c) | | Distributions may not coincide with the current year net investment income or net realized gains as distributions may be paid from current or prior year earnings. |
| | (d) | | Assumes reinvestment of all distributions. Returns do not reflect the deduction of taxes that a shareholder would pay on Fund distributions. Total returns for periods less than one full year are not annualized. |
| | |
| 102 | | The accompanying notes are an integral part of these financial statements. |
FINANCIAL SQUARE TREASURY OBLIGATIONS FUND
Financial Highlights(continued)
Selected Data for a Share Outstanding Throughout Each Period
| | | | | | | | | | | | | | | | | | | | | | | | | | |
| | | | | Financial Square Treasury Obligations Fund
| |
| | | | | Cash Management Shares | |
| | | | | Six Months Ended
February 28, 2019
(Unaudited) | | | Year Ended August 31, | |
| | | | | 2018 | | | 2017 | | | 2016 | | | 2015 | | | 2014 | |
| | Per Share Data: | | | | | | | | | | | | | | | | | | | | | | | | |
| | | | | | | |
| | Net asset value, beginning of period | | $ | 1.00 | | | $ | 1.00 | | | $ | 1.00 | | | $ | 1.00 | | | $ | 1.00 | | | $ | 1.00 | |
| | | | | | | |
| | Net investment income(a) | | | 0.006 | | | | 0.004 | | | | 0.001 | | | | — | (b) | | | — | (b) | | | — | (b) |
| | | | | | | | |
| | Net realized gain (loss) | | | 0.001 | | | | 0.002 | | | | (0.001 | ) | | | — | (b) | | | — | (b) | | | — | (b) |
| | | | | | | | |
| | Total from investment operations | | | 0.007 | | | | 0.006 | | | | — | (b) | | | — | (b) | | | — | (b) | | | — | (b) |
| | | | | | | | |
| | Distributions to shareholders from net investment income | | | (0.007 | ) | | | (0.006 | ) | | | — | (b) | | | — | (b) | | | — | (b) | | | — | (b) |
| | | | | | | | |
| | Distributions to shareholders from net realized gains | | | — | (b) | | | — | (b) | | | — | (b) | | | — | (b) | | | — | (b) | | | — | (b) |
| | | | | | | | |
| | Total distributions(c) | | | (0.007 | ) | | | (0.006 | ) | | | — | (b) | | | — | (b) | | | — | (b) | | | — | (b) |
| | | | | | | | |
| | Net asset value, end of period | | $ | 1.00 | | | $ | 1.00 | | | $ | 1.00 | | | $ | 1.00 | | | $ | 1.00 | | | $ | 1.00 | |
| | | | | | | |
| | Total return(d) | | | 0.66 | % | | | 0.56 | % | | | 0.02 | % | | | 0.01 | % | | | 0.01 | % | | | 0.01 | % |
| | | | | | | |
| | Net assets, end of period (in 000’s) | | $ | 45 | | | $ | 48 | | | $ | 154 | | | $ | 1 | | | $ | 1 | | | $ | 1 | |
| | | | | | | |
| | Ratio of net expenses to average net assets | | | 1.00 | %(e) | | | 1.00 | % | | | 0.97 | % | | | 0.19 | % | | | 0.10 | % | | | 0.08 | % |
| | | | | | | |
| | Ratio of total expenses to average net assets | | | 1.00 | %(e) | | | 1.01 | % | | | 1.03 | % | | | 1.03 | % | | | 1.03 | % | | | 1.03 | % |
| | | | | | | |
| | Ratio of net investment income to average net assets | | | 1.33 | %(e) | | | 0.43 | % | | | 0.14 | % | | | 0.36 | % | | | 0.40 | % | | | 0.40 | % |
| | (a) | | Calculated based on the average shares outstanding methodology. |
| | (b) | | Amount is less than $0.0005 per share. |
| | (c) | | Distributions may not coincide with the current year net investment income or net realized gains as distributions may be paid from current or prior year earnings. |
| | (d) | | Assumes reinvestment of all distributions. Returns do not reflect the deduction of taxes that a shareholder would pay on Fund distributions. Total returns for periods less than one full year are not annualized. |
| | |
| The accompanying notes are an integral part of these financial statements. | | 103 |
FINANCIAL SQUARE TREASURY SOLUTIONS FUND
Financial Highlights(continued)
Selected Data for a Share Outstanding Throughout Each Period
| | | | | | | | | | | | | | | | | | | | | | | | | | |
| | | | | Financial Square Treasury Solutions Fund | |
| | | | | Institutional Shares | |
| | | | | Six Months Ended
February 28, 2019
(Unaudited) | | | Year Ended August 31, | |
| | | | | 2018 | | | 2017 | | | 2016 | | | 2015 | | | 2014 | |
| | Per Share Data: | | | | | | | | | | | | | | | | | | | | | | | | |
| | | | | | | |
| | Net asset value, beginning of period | | $ | 1.00 | | | $ | 1.00 | | | $ | 1.00 | | | $ | 1.00 | | | $ | 1.00 | | | $ | 1.00 | |
| | | | | | | |
| | Net investment income(a) | | | 0.011 | | | | 0.013 | | | | 0.005 | | | | 0.001 | | | | — | (b) | | | — | (b) |
| | | | | | | | |
| | Net realized gain | | | (0.001 | ) | | | — | (b) | | | — | (b) | | | — | (b) | | | — | (b) | | | — | (b) |
| | | | | | | | |
| | Total from investment operations | | | 0.010 | | | | 0.013 | | | | 0.005 | | | | 0.001 | | | | — | (b) | | | — | (b) |
| | | | | | | | |
| | Distributions to shareholders from net investment income | | | (0.010 | ) | | | (0.013 | ) | | | (0.005 | ) | | | (0.001 | ) | | | — | (b) | | | — | (b) |
| | | | | | | | |
| | Distributions to shareholders from net realized gains | | | — | (b) | | | — | (b) | | | — | (b) | | | — | (b) | | | — | (b) | | | — | (b) |
| | | | | | | | |
| | Total distributions(c) | | | (0.010 | ) | | | (0.013 | ) | | | (0.005 | ) | | | (0.001 | ) | | | — | (b) | | | — | (b) |
| | | | | | | | |
| | Net asset value, end of period | | $ | 1.00 | | | $ | 1.00 | | | $ | 1.00 | | | $ | 1.00 | | | $ | 1.00 | | | $ | 1.00 | |
| | | | | | | |
| | Total return(d) | | | 1.05 | % | | | 1.34 | % | | | 0.49 | % | | | 0.14 | % | | | 0.01 | % | | | 0.01 | % |
| | | | | | | |
| | Net assets, end of period (in 000’s) | | $ | 7,920,939 | | | $ | 7,667,540 | | | $ | 8,619,492 | | | $ | 9,876,558 | | | $ | 10,053,367 | | | $ | 9,153,246 | |
| | | | | | | |
| | Ratio of net expenses to average net assets | | | 0.20 | %(e) | | | 0.20 | % | | | 0.20 | % | | | 0.19 | % | | | 0.10 | % | | | 0.09 | % |
| | | | | | | |
| | Ratio of total expenses to average net assets | | | 0.20 | %(e) | | | 0.21 | % | | | 0.23 | % | | | 0.23 | % | | | 0.23 | % | | | 0.23 | % |
| | | | | | | |
| | Ratio of net investment income to average net assets | | | 2.11 | %(e) | | | 1.31 | % | | | 0.48 | % | | | 0.11 | % | | | — | %(f) | | | 0.01 | % |
| | (a) | | Calculated based on the average shares outstanding methodology. |
| | (b) | | Amount is less than $0.0005 per share. |
| | (c) | | Distributions may not coincide with the current year net investment income or net realized gains as distributions may be paid from current or prior year earnings. |
| | (d) | | Assumes reinvestment of all distributions. Returns do not reflect the deduction of taxes that a shareholder would pay on Fund distributions. Total returns for periods less than one full year are not annualized. |
| | (f) | | Amount is less than 0.005% of average net assets. |
| | |
| 104 | | The accompanying notes are an integral part of these financial statements. |
FINANCIAL SQUARE TREASURY SOLUTIONS FUND
Financial Highlights(continued)
Selected Data for a Share Outstanding Throughout Each Period
| | | | | | | | | | | | | | | | | | | | | | | | | | |
| | | | | Financial Square Treasury Solutions Fund | |
| | | | | Select Shares | |
| | | | | Six Months Ended
February 28, 2019
(Unaudited) | | | Year Ended August 31, | |
| | | | | 2018 | | | 2017 | | | 2016 | | | 2015 | | | 2014 | |
| | Per Share Data: | | | | | | | | | | | | | | | | | | | | | | | | |
| | | | | | | |
| | Net asset value, beginning of period | | $ | 1.00 | | | $ | 1.00 | | | $ | 1.00 | | | $ | 1.00 | | | $ | 1.00 | | | $ | 1.00 | |
| | | | | | | |
| | Net investment income(a) | | | 0.009 | | | | 0.013 | | | | 0.004 | | | | 0.001 | | | | — | (b) | | | — | (b) |
| | | | | | | | |
| | Net realized gain | | | 0.001 | | | | — | (b) | | | 0.001 | | | | — | (b) | | | — | (b) | | | — | (b) |
| | | | | | | | |
| | Total from investment operations | | | 0.010 | | | | 0.013 | | | | 0.005 | | | | 0.001 | | | | — | (b) | | | — | (b) |
| | | | | | | | |
| | Distributions to shareholders from net investment income | | | (0.010 | ) | | | (0.013 | ) | | | (0.005 | ) | | | (0.001 | ) | | | — | (b) | | | — | (b) |
| | | | | | | | |
| | Distributions to shareholders from net realized gains | | | — | (b) | | | — | (b) | | | — | (b) | | | — | (b) | | | — | (b) | | | — | (b) |
| | | | | | | | |
| | Total distributions(c) | | | (0.010 | ) | | | (0.013 | ) | | | (0.005 | ) | | | (0.001 | ) | | | — | (b) | | | — | (b) |
| | | | | | | | |
| | Net asset value, end of period | | $ | 1.00 | | | $ | 1.00 | | | $ | 1.00 | | | $ | 1.00 | | | $ | 1.00 | | | $ | 1.00 | |
| | | | | | | |
| | Total return(d) | | | 1.03 | % | | | 1.31 | % | | | 0.46 | % | | | 0.12 | % | | | 0.01 | % | | | 0.01 | % |
| | | | | | | |
| | Net assets, end of period (in 000’s) | | $ | 5,865 | | | $ | 7,439 | | | $ | 7,333 | | | $ | 10,969 | | | $ | 12,266 | | | $ | 38,054 | |
| | | | | | | |
| | Ratio of net expenses to average net assets | | | 0.23 | %(e) | | | 0.23 | % | | | 0.23 | % | | | 0.21 | % | | | 0.10 | % | | | 0.09 | % |
| | | | | | | |
| | Ratio of total expenses to average net assets | | | 0.23 | %(e) | | | 0.24 | % | | | 0.26 | % | | | 0.26 | % | | | 0.26 | % | | | 0.26 | % |
| | | | | | | |
| | Ratio of net investment income to average net assets | | | 2.06 | %(e) | | | 1.27 | % | | | 0.42 | % | | | 0.09 | % | | | — | %(f) | | | 0.01 | % |
| | (a) | | Calculated based on the average shares outstanding methodology. |
| | (b) | | Amount is less than $0.0005 per share. |
| | (c) | | Distributions may not coincide with the current year net investment income or net realized gains as distributions may be paid from current or prior year earnings. |
| | (d) | | Assumes reinvestment of all distributions. Returns do not reflect the deduction of taxes that a shareholder would pay on Fund distributions. Total returns for periods less than one full year are not annualized. |
| | (f) | | Amount is less than 0.005% of average net assets. |
| | |
| The accompanying notes are an integral part of these financial statements. | | 105 |
FINANCIAL SQUARE TREASURY SOLUTIONS FUND
Financial Highlights(continued)
Selected Data for a Share Outstanding Throughout Each Period
| | | | | | | | | | | | | | | | | | | | | | | | | | |
| | | | | Financial Square Treasury Solutions Fund | |
| | | | | Preferred Shares | |
| | | | | Six Months Ended
February 28, 2019
(Unaudited) | | | Year Ended August 31, | |
| | | | | 2018 | | | 2017 | | | 2016 | | | 2015 | | | 2014 | |
| | Per Share Data: | | | | | | | | | | | | | | | | | | | | | | | | |
| | | | | | | |
| | Net asset value, beginning of period | | $ | 1.00 | | | $ | 1.00 | | | $ | 1.00 | | | $ | 1.00 | | | $ | 1.00 | | | $ | 1.00 | |
| | | | | | | |
| | Net investment income(a) | | | 0.008 | | | | 0.013 | | | | 0.003 | | | | 0.001 | | | | — | (b) | | | — | (b) |
| | | | | | | | |
| | Net realized gain | | | 0.002 | | | | (0.001 | ) | | | 0.001 | | | | — | (b) | | | — | (b) | | | — | (b) |
| | | | | | | | |
| | Total from investment operations | | | 0.010 | | | | 0.012 | | | | 0.004 | | | | 0.001 | | | | — | (b) | | | — | (b) |
| | | | | | | | |
| | Distributions to shareholders from net investment income | | | (0.010 | ) | | | (0.012 | ) | | | (0.004 | ) | | | (0.001 | ) | | | — | (b) | | | — | (b) |
| | | | | | | | |
| | Distributions to shareholders from net realized gains | | | — | (b) | | | — | (b) | | | — | (b) | | | — | (b) | | | — | (b) | | | — | (b) |
| | | | | | | | |
| | Total distributions(c) | | | (0.010 | ) | | | (0.012 | ) | | | (0.004 | ) | | | (0.001 | ) | | | — | (b) | | | — | (b) |
| | | | | | | | |
| | Net asset value, end of period | | $ | 1.00 | | | $ | 1.00 | | | $ | 1.00 | | | $ | 1.00 | | | $ | 1.00 | | | $ | 1.00 | |
| | | | | | | |
| | Total return(d) | | | 1.00 | % | | | 1.24 | % | | | 0.39 | % | | | 0.07 | % | | | 0.01 | % | | | 0.01 | % |
| | | | | | | |
| | Net assets, end of period (in 000’s) | | $ | 65,946 | | | $ | 19,545 | | | $ | 14,565 | | | $ | 75,756 | | | $ | 40,923 | | | $ | 52,417 | |
| | | | | | | |
| | Ratio of net expenses to average net assets | | | 0.30 | %(e) | | | 0.30 | % | | | 0.30 | % | | | 0.26 | % | | | 0.10 | % | | | 0.09 | % |
| | | | | | | |
| | Ratio of total expenses to average net assets | | | 0.30 | %(e) | | | 0.31 | % | | | 0.33 | % | | | 0.33 | % | | | 0.33 | % | | | 0.33 | % |
| | | | | | | |
| | Ratio of net investment income to average net assets | | | 2.05 | %(e) | | | 1.26 | % | | | 0.25 | % | | | 0.03 | % | | | — | %(f) | | | 0.01 | % |
| | (a) | | Calculated based on the average shares outstanding methodology. |
| | (b) | | Amount is less than $0.0005 per share. |
| | (c) | | Distributions may not coincide with the current year net investment income or net realized gains as distributions may be paid from current or prior year earnings. |
| | (d) | | Assumes reinvestment of all distributions. Returns do not reflect the deduction of taxes that a shareholder would pay on Fund distributions. Total returns for periods less than one full year are not annualized. |
| | (f) | | Amount is less than 0.005% of average net assets. |
| | |
| 106 | | The accompanying notes are an integral part of these financial statements. |
FINANCIAL SQUARE TREASURY SOLUTIONS FUND
Financial Highlights(continued)
Selected Data for a Share Outstanding Throughout Each Period
| | | | | | | | | | | | | | | | | | | | | | | | | | |
| | | | | Financial Square Treasury Solutions Fund | |
| | | | | Capital Shares | |
| | | | | Six Months Ended
February 28, 2019
(Unaudited) | | | Year Ended August 31, | |
| | | | | 2018 | | | 2017 | | | 2016 | | | 2015 | | | 2014 | |
| | Per Share Data: | | | | | | | | | | | | | | | | | | | | | | | | |
| | | | | | | |
| | Net asset value, beginning of period | | $ | 1.00 | | | $ | 1.00 | | | $ | 1.00 | | | $ | 1.00 | | | $ | 1.00 | | | $ | 1.00 | |
| | | | | | | |
| | Net investment income(a) | | | 0.010 | | | | 0.012 | | | | 0.003 | | | | — | (b) | | | — | (b) | | | — | (b) |
| | | | | | | | |
| | Net realized gain | | | — | (b) | | | — | (b) | | | — | (b) | | | — | (b) | | | — | (b) | | | — | (b) |
| | | | | | | | |
| | Total from investment operations | | | 0.010 | | | | 0.012 | | | | 0.003 | | | | — | (b) | | | — | (b) | | | — | (b) |
| | | | | | | | |
| | Distributions to shareholders from net investment income | | | (0.010 | ) | | | (0.012 | ) | | | (0.003 | ) | | | — | (b) | | | — | (b) | | | — | (b) |
| | | | | | | | |
| | Distributions to shareholders from net realized gains | | | — | (b) | | | — | (b) | | | — | (b) | | | — | (b) | | | — | (b) | | | — | (b) |
| | | | | | | | |
| | Total distributions(c) | | | (0.010 | ) | | | (0.012 | ) | | | (0.003 | ) | | | — | (b) | | | — | (b) | | | — | (b) |
| | | | | | | | |
| | Net asset value, end of period | | $ | 1.00 | | | $ | 1.00 | | | $ | 1.00 | | | $ | 1.00 | | | $ | 1.00 | | | $ | 1.00 | |
| | | | | | | |
| | Total return(d) | | | 0.97 | % | | | 1.19 | % | | | 0.34 | % | | | 0.03 | % | | | 0.01 | % | | | 0.01 | % |
| | | | | | | |
| | Net assets, end of period (in 000’s) | | $ | 170,571 | | | $ | 165,645 | | | $ | 215,820 | | | $ | 264,092 | | | $ | 103,108 | | | $ | 55,729 | |
| | | | | | | |
| | Ratio of net expenses to average net assets | | | 0.35 | %(e) | | | 0.35 | % | | | 0.35 | % | | | 0.32 | % | | | 0.10 | % | | | 0.09 | % |
| | | | | | | |
| | Ratio of total expenses to average net assets | | | 0.35 | %(e) | | | 0.36 | % | | | 0.38 | % | | | 0.38 | % | | | 0.38 | % | | | 0.38 | % |
| | | | | | | |
| | Ratio of net investment income to average net assets | | | 1.96 | %(e) | | | 1.15 | % | | | 0.30 | % | | | 0.01 | % | | | — | %(f) | | | 0.01 | % |
| | (a) | | Calculated based on the average shares outstanding methodology. |
| | (b) | | Amount is less than $0.0005 per share. |
| | (c) | | Distributions may not coincide with the current year net investment income or net realized gains as distributions may be paid from current or prior year earnings. |
| | (d) | | Assumes reinvestment of all distributions. Returns do not reflect the deduction of taxes that a shareholder would pay on Fund distributions. Total returns for periods less than one full year are not annualized. |
| | (f) | | Amount is less than 0.005% of average net assets. |
| | |
| The accompanying notes are an integral part of these financial statements. | | 107 |
FINANCIAL SQUARE TREASURY SOLUTIONS FUND
Financial Highlights(continued)
Selected Data for a Share Outstanding Throughout Each Period
| | | | | | | | | | | | | | | | | | | | | | | | | | |
| | | | | Financial Square Treasury Solutions Fund | |
| | | | | Administration Shares | |
| | | | | Six Months Ended
February 28, 2019
(Unaudited) | | | Year Ended August 31, | |
| | | | | 2018 | | | 2017 | | | 2016 | | | 2015 | | | 2014 | |
| | Per Share Data: | | | | | | | | | | | | | | | | | | | | | | | | |
| | | | | | | |
| | Net asset value, beginning of period | | $ | 1.00 | | | $ | 1.00 | | | $ | 1.00 | | | $ | 1.00 | | | $ | 1.00 | | | $ | 1.00 | |
| | | | | | | |
| | Net investment income(a) | | | 0.010 | | | | 0.011 | | | | 0.003 | | | | — | (b) | | | — | (b) | | | — | (b) |
| | | | | | | | |
| | Net realized gain | | | (0.001 | ) | | | — | (b) | | | — | (b) | | | — | (b) | | | — | (b) | | | — | (b) |
| | | | | | | | |
| | Total from investment operations | | | 0.009 | | | | 0.011 | | | | 0.003 | | | | — | (b) | | | — | (b) | | | — | (b) |
| | | | | | | | |
| | Distributions to shareholders from net investment income | | | (0.009 | ) | | | (0.011 | ) | | | (0.003 | ) | | | — | (b) | | | — | (b) | | | — | (b) |
| | | | | | | | |
| | Distributions to shareholders from net realized gains | | | — | (b) | | | — | (b) | | | — | (b) | | | — | (b) | | | — | (b) | | | — | (b) |
| | | | | | | | |
| | Total distributions(c) | | | (0.009 | ) | | | (0.011 | ) | | | (0.003 | ) | | | — | (b) | | | — | (b) | | | — | (b) |
| | | | | | | | |
| | Net asset value, end of period | | $ | 1.00 | | | $ | 1.00 | | | $ | 1.00 | | | $ | 1.00 | | | $ | 1.00 | | | $ | 1.00 | |
| | | | | | | |
| | Total return(d) | | | 0.92 | % | | | 1.09 | % | | | 0.25 | % | | | 0.01 | % | | | 0.01 | % | | | 0.01 | % |
| | | | | | | |
| | Net assets, end of period (in 000’s) | | $ | 379,730 | | | $ | 360,817 | | | $ | 237,557 | | | $ | 189,870 | | | $ | 390,266 | | | $ | 403,438 | |
| | | | | | | |
| | Ratio of net expenses to average net assets | | | 0.45 | %(e) | | | 0.45 | % | | | 0.44 | % | | | 0.30 | % | | | 0.10 | % | | | 0.09 | % |
| | | | | | | |
| | Ratio of total expenses to average net assets | | | 0.45 | %(e) | | | 0.46 | % | | | 0.48 | % | | | 0.48 | % | | | 0.48 | % | | | 0.48 | % |
| | | | | | | |
| | Ratio of net investment income (loss) to average net assets | | | 1.85 | %(e) | | | 1.09 | % | | | 0.28 | % | | | (0.02 | )% | | | — | %(f) | | | 0.01 | % |
| | (a) | | Calculated based on the average shares outstanding methodology. |
| | (b) | | Amount is less than $0.0005 per share. |
| | (c) | | Distributions may not coincide with the current year net investment income or net realized gains as distributions may be paid from current or prior year earnings. |
| | (d) | | Assumes reinvestment of all distributions. Returns do not reflect the deduction of taxes that a shareholder would pay on Fund distributions. Total returns for periods less than one full year are not annualized. |
| | (f) | | Amount is less than 0.005% of average net assets. |
| | |
| 108 | | The accompanying notes are an integral part of these financial statements. |
FINANCIAL SQUARE TREASURY SOLUTIONS FUND
Financial Highlights(continued)
Selected Data for a Share Outstanding Throughout Each Period
| | | | | | | | | | | | | | | | | | | | | | | | | | |
| | | | | Financial Square Treasury Solutions Fund | |
| | | | | Premier Shares | |
| | | | | Six Months Ended
February 28, 2019
(Unaudited) | | | Year Ended August 31, | |
| | | | | 2018 | | | 2017 | | | 2016 | | | 2015 | | | 2014 | |
| | Per Share Data: | | | | | | | | | | | | | | | | | | | | | | | | |
| | | | | | | |
| | Net asset value, beginning of period | | $ | 1.00 | | | $ | 1.00 | | | $ | 1.00 | | | $ | 1.00 | | | $ | 1.00 | | | $ | 1.00 | |
| | | | | | | |
| | Net investment income(a) | | | 0.012 | | | | 0.011 | | | | 0.001 | | | | — | (b) | | | — | (b) | | | — | (b) |
| | | | | | | | |
| | Net realized gain (loss) | | | (0.003 | ) | | | (0.001 | ) | | | 0.001 | | | | — | (b) | | | — | (b) | | | — | (b) |
| | | | | | | | |
| | Total from investment operations | | | 0.009 | | | | 0.010 | | | | 0.002 | | | | — | (b) | | | — | (b) | | | — | (b) |
| | | | | | | | |
| | Distributions to shareholders from net investment income | | | (0.009 | ) | | | (0.010 | ) | | | (0.002 | ) | | | — | (b) | | | — | (b) | | | — | (b) |
| | | | | | | | |
| | Distributions to shareholders from net realized gains | | | — | (b) | | | — | (b) | | | — | (b) | | | — | (b) | | | — | (b) | | | — | (b) |
| | | | | | | | |
| | Total distributions(c) | | | (0.009 | ) | | | (0.010 | ) | | | (0.002 | ) | | | — | (b) | | | — | (b) | | | — | (b) |
| | | | | | | | |
| | Net asset value, end of period | | $ | 1.00 | | | $ | 1.00 | | | $ | 1.00 | | | $ | 1.00 | | | $ | 1.00 | | | $ | 1.00 | |
| | | | | | | |
| | Total return(d) | | | 0.87 | % | | | 0.99 | % | | | 0.18 | % | | | 0.01 | % | | | 0.01 | % | | | 0.01 | % |
| | | | | | | |
| | Net assets, end of period (in 000’s) | | $ | 138,039 | | | $ | 45,627 | | | $ | 15,512 | | | $ | 1 | | | $ | 1 | | | $ | 17,834 | |
| | | | | | | |
| | Ratio of net expenses to average net assets | | | 0.55 | %(e) | | | 0.55 | % | | | 0.50 | % | | | 0.19 | % | | | 0.10 | % | | | 0.09 | % |
| | | | | | | |
| | Ratio of total expenses to average net assets | | | 0.55 | %(e) | | | 0.56 | % | | | 0.58 | % | | | 0.58 | % | | | 0.58 | % | | | 0.58 | % |
| | | | | | | |
| | Ratio of net investment income to average net assets | | | 1.78 | %(e) | | | 1.10 | % | | | 0.13 | % | | | 0.36 | % | | | 0.01 | % | | | 0.01 | % |
| | (a) | | Calculated based on the average shares outstanding methodology. |
| | (b) | | Amount is less than $0.0005 per share. |
| | (c) | | Distributions may not coincide with the current year net investment income or net realized gains as distributions may be paid from current or prior year earnings. |
| | (d) | | Assumes reinvestment of all distributions. Returns do not reflect the deduction of taxes that a shareholder would pay on Fund distributions. Total returns for periods less than one full year are not annualized. |
| | |
| The accompanying notes are an integral part of these financial statements. | | 109 |
FINANCIAL SQUARE TREASURY SOLUTIONS FUND
Financial Highlights(continued)
Selected Data for a Share Outstanding Throughout Each Period
| | | | | | | | | | | | | | | | | | | | | | | | | | |
| | | | | Financial Square Treasury Solutions Fund | |
| | | | | Service Shares | |
| | | | | Six Months Ended
February 28, 2019
(Unaudited) | | | Year Ended August 31, | |
| | | | | 2018 | | | 2017 | | | 2016 | | | 2015 | | | 2014 | |
| | Per Share Data: | | | | | | | | | | | | | | | | | | | | | | | | |
| | | | | | | |
| | Net asset value, beginning of period | | $ | 1.00 | | | $ | 1.00 | | | $ | 1.00 | | | $ | 1.00 | | | $ | 1.00 | | | $ | 1.00 | |
| | | | | | | |
| | Net investment income(a) | | | 0.008 | | | | 0.008 | | | | 0.001 | | | | — | (b) | | | — | (b) | | | — | (b) |
| | | | | | | | |
| | Net realized gain | | | — | (b) | | | — | (b) | | | — | (b) | | | — | (b) | | | — | (b) | | | — | (b) |
| | | | | | | | |
| | Total from investment operations | | | 0.008 | | | | 0.008 | | | | 0.001 | | | | — | (b) | | | — | (b) | | | — | (b) |
| | | | | | | | |
| | Distributions to shareholders from net investment income | | | (0.008 | ) | | | (0.008 | ) | | | (0.001 | ) | | | — | (b) | | | — | (b) | | | — | (b) |
| | | | | | | | |
| | Distributions to shareholders from net realized gains | | | — | (b) | | | — | (b) | | | — | (b) | | | — | (b) | | | — | (b) | | | — | (b) |
| | | | | | | | |
| | Total distributions(c) | | | (0.008 | ) | | | (0.008 | ) | | | (0.001 | ) | | | — | (b) | | | — | (b) | | | — | (b) |
| | | | | | | | |
| | Net asset value, end of period | | $ | 1.00 | | | $ | 1.00 | | | $ | 1.00 | | | $ | 1.00 | | | $ | 1.00 | | | $ | 1.00 | |
| | | | | | | |
| | Total return(d) | | | 0.80 | % | | | 0.84 | % | | | 0.10 | % | | | 0.01 | % | | | 0.01 | % | | | 0.01 | % |
| | | | | | | |
| | Net assets, end of period (in 000’s) | | $ | 109,114 | | | $ | 155,808 | | | $ | 144,728 | | | $ | 142,607 | | | $ | 355,272 | | | $ | 435,856 | |
| | | | | | | |
| | Ratio of net expenses to average net assets | | | 0.70 | %(e) | | | 0.70 | % | | | 0.58 | % | | | 0.29 | % | | | 0.10 | % | | | 0.09 | % |
| | | | | | | |
| | Ratio of total expenses to average net assets | | | 0.70 | %(e) | | | 0.71 | % | | | 0.73 | % | | | 0.73 | % | | | 0.73 | % | | | 0.73 | % |
| | | | | | | |
| | Ratio of net investment income (loss) to average net assets | | | 1.60 | %(e) | | | 0.83 | % | | | 0.08 | % | | | (0.02 | )% | | | — | %(f) | | | 0.01 | % |
| | (a) | | Calculated based on the average shares outstanding methodology. |
| | (b) | | Amount is less than $0.0005 per share. |
| | (c) | | Distributions may not coincide with the current year net investment income or net realized gains as distributions may be paid from current or prior year earnings. |
| | (d) | | Assumes reinvestment of all distributions. Returns do not reflect the deduction of taxes that a shareholder would pay on Fund distributions. Total returns for periods less than one full year are not annualized. |
| | (f) | | Amount is less than 0.005% of average net assets. |
| | |
| 110 | | The accompanying notes are an integral part of these financial statements. |
FINANCIAL SQUARE TREASURY SOLUTIONS FUND
Financial Highlights(continued)
Selected Data for a Share Outstanding Throughout Each Period
| | | | | | | | | | | | | | | | | | | | | | | | | | |
| | | | | Financial Square Treasury Solutions Fund | |
| | | | | Resource Shares | |
| | | | | Six Months Ended
February 28, 2019
(Unaudited) | | | Year Ended August 31, | |
| | | | | 2018 | | | 2017 | | | 2016 | | | 2015 | | | 2014 | |
| | Per Share Data: | | | | | | | | | | | | | | | | | | | | | | | | |
| | | | | | | |
| | Net asset value, beginning of period | | $ | 1.00 | | | $ | 1.00 | | | $ | 1.00 | | | $ | 1.00 | | | $ | 1.00 | | | $ | 1.00 | |
| | | | | | | |
| | Net investment income(a) | | | 0.008 | | | | 0.008 | | | | 0.004 | | | | — | (b) | | | — | (b) | | | — | (b) |
| | | | | | | | |
| | Net realized loss | | | — | (b) | | | — | (b) | | | (0.004 | ) | | | — | (b) | | | — | (b) | | | — | (b) |
| | | | | | | | |
| | Total from investment operations | | | 0.008 | | | | 0.008 | | | | — | (b) | | | — | (b) | | | — | (b) | | | — | (b) |
| | | | | | | | |
| | Distributions to shareholders from net investment income | | | (0.008 | ) | | | (0.008 | ) | | | — | (b) | | | — | (b) | | | — | (b) | | | — | (b) |
| | | | | | | | |
| | Distributions to shareholders from net realized gains | | | — | (b) | | | — | (b) | | | — | (b) | | | — | (b) | | | — | (b) | | | — | (b) |
| | | | | | | | |
| | Total distributions(c) | | | (0.008 | ) | | | (0.008 | ) | | | — | (b) | | | — | (b) | | | — | (b) | | | — | (b) |
| | | | | | | | |
| | Net asset value, end of period | | $ | 1.00 | | | $ | 1.00 | | | $ | 1.00 | | | $ | 1.00 | | | $ | 1.00 | | | $ | 1.00 | |
| | | | | | | |
| | Total return(d) | | | 0.72 | % | | | 0.69 | % | | | 0.05 | % | | | 0.01 | % | | | 0.01 | % | | | 0.01 | % |
| | | | | | | |
| | Net assets, end of period (in 000’s) | | $ | 1 | | | $ | 1 | | | $ | 1 | | | $ | 1 | | | $ | 1 | | | $ | 1 | |
| | | | | | | |
| | Ratio of net expenses to average net assets | | | 0.56 | %(e) | | | 0.55 | % | | | 0.26 | % | | | 0.19 | % | | | 0.10 | % | | | 0.09 | % |
| | | | | | | |
| | Ratio of total expenses to average net assets | | | 0.85 | %(e) | | | 0.86 | % | | | 0.88 | % | | | 0.88 | % | | | 0.88 | % | | | 0.88 | % |
| | | | | | | |
| | Ratio of net investment income to average net assets | | | 1.61 | %(e) | | | 0.84 | % | | | 0.37 | % | | | 0.37 | % | | | 0.40 | % | | | 0.40 | % |
| | (a) | | Calculated based on the average shares outstanding methodology. |
| | (b) | | Amount is less than $0.0005 per share. |
| | (c) | | Distributions may not coincide with the current year net investment income or net realized gains as distributions may be paid from current or prior year earnings. |
| | (d) | | Assumes reinvestment of all distributions. Returns do not reflect the deduction of taxes that a shareholder would pay on Fund distributions. Total returns for periods less than one full year are not annualized. |
| | |
| The accompanying notes are an integral part of these financial statements. | | 111 |
FINANCIAL SQUARE TREASURY SOLUTIONS FUND
Financial Highlights(continued)
Selected Data for a Share Outstanding Throughout Each Period
| | | | | | | | | | | | | | | | | | | | | | | | | | |
| | | | | Financial Square Treasury Solutions Fund | |
| | | | | Cash Management Shares | |
| | | | | Six Months Ended
February 28, 2019
(Unaudited) | | | Year Ended August 31, | |
| | | | | 2018 | | | 2017 | | | 2016 | | | 2015 | | | 2014 | |
| | Per Share Data: | | | | | | | | | | | | | | | | | | | | | | | | |
| | | | | | | |
| | Net asset value, beginning of period | | $ | 1.00 | | | $ | 1.00 | | | $ | 1.00 | | | $ | 1.00 | | | $ | 1.00 | | | $ | 1.00 | |
| | | | | | | |
| | Net investment income(a) | | | 0.010 | | | | 0.005 | | | | — | (b) | | | — | (b) | | | — | (b) | | | — | (b) |
| | | | | | | | |
| | Net realized loss | | | (0.004 | ) | | | — | (b) | | | — | (b) | | | — | (b) | | | — | (b) | | | — | (b) |
| | | | | | | | |
| | Total from investment operations | | | 0.006 | | | | 0.005 | | | | — | (b) | | | — | (b) | | | — | (b) | | | — | (b) |
| | | | | | | | |
| | Distributions to shareholders from net investment income | | | (0.006 | ) | | | (0.005 | ) | | | — | (b) | | | — | (b) | | | — | (b) | | | — | (b) |
| | | | | | | | |
| | Distributions to shareholders from net realized gains | | | — | (b) | | | — | (b) | | | — | (b) | | | — | (b) | | | — | (b) | | | — | (b) |
| | | | | | | | |
| | Total distributions(c) | | | (0.006 | ) | | | (0.005 | ) | | | — | (b) | | | — | (b) | | | — | (b) | | | — | (b) |
| | | | | | | | |
| | Net asset value, end of period | | $ | 1.00 | | | $ | 1.00 | | | $ | 1.00 | | | $ | 1.00 | | | $ | 1.00 | | | $ | 1.00 | |
| | | | | | | |
| | Total return(d) | | | 0.65 | % | | | 0.54 | % | | | 0.01 | % | | | 0.01 | % | | | 0.01 | % | | | 0.01 | % |
| | | | | | | |
| | Net assets, end of period (in 000’s) | | $ | 102,686 | | | $ | 23,332 | | | $ | 33,252 | | | $ | 73,211 | | | $ | 147,486 | | | $ | 90,568 | |
| | | | | | | |
| | Ratio of net expenses to average net assets | | | 1.00 | %(e) | | | 1.00 | % | | | 0.62 | % | | | 0.31 | % | | | 0.10 | % | | | 0.09 | % |
| | | | | | | |
| | Ratio of total expenses to average net assets | | | 1.00 | %(e) | | | 1.01 | % | | | 1.03 | % | | | 1.03 | % | | | 1.03 | % | | | 1.03 | % |
| | | | | | | |
| | Ratio of net investment income (loss) to average net assets | | | 1.36 | %(e) | | | 0.51 | % | | | — | %(f) | | | (0.02 | )% | | | — | %(f) | | | 0.01 | % |
| | (a) | | Calculated based on the average shares outstanding methodology. |
| | (b) | | Amount is less than $0.0005 per share. |
| | (c) | | Distributions may not coincide with the current year net investment income or net realized gains as distributions may be paid from current or prior year earnings. |
| | (d) | | Assumes reinvestment of all distributions. Returns do not reflect the deduction of taxes that a shareholder would pay on Fund distributions. Total returns for periods less than one full year are not annualized. |
| | (f) | | Amount is less than 0.005% of average net assets. |
| | |
| 112 | | The accompanying notes are an integral part of these financial statements. |
GOLDMAN SACHS FUNDS — FINANCIAL SQUARE FUNDS
Notes to Financial Statements
February 28, 2019 (Unaudited)
Goldman Sachs Trust (the “Trust”) is a Delaware statutory trust registered under the Investment Company Act of 1940, as amended (the ��Act”), as an open-end management investment company. The following table lists those series of the Trust that are included in this report (collectively, the “Funds” or individually a “Fund”), along with their corresponding share classes and respective diversification status under the Act:
| | | | |
| Fund | | Share Classes Offered | | Diversified/
Non-Diversified |
Federal Instruments | | Institutional, Select, Preferred, Capital, Administration, Premier, Service, and Cash Management | | Diversified |
Government | | Institutional, Select, Preferred, Capital, Administration, Premier, Service, Class A, Class C, Resource, Cash Management and Class R6 | | Diversified |
Money Market, Prime Obligations, Treasury Instruments, Treasury Obligations and Treasury Solutions | | Institutional, Select, Preferred, Capital, Administration, Premier, Service, Resource, and Cash Management | | Diversified |
Class C Shares may typically be acquired only in an exchange for Class C Shares of another Goldman Sachs Fund. Class C Shares may be subject to a contingent deferred sales charge (“CDSC”) of 1.00% during the first 12 months, measured from the time the original shares subject to the CDSC were acquired.
Goldman Sachs Asset Management, L.P. (“GSAM”), an affiliate of Goldman Sachs & Co. LLC (“Goldman Sachs”), serves as investment adviser to the Funds pursuant to management agreements (the “Agreements”) with the Trust.
The following Funds were designated by the Board of Trustees (“Trustees”) as “institutional money market funds” under Rule 2a-7 under the Act: Financial Square Money Market Fund and Financial Square Prime Obligations Fund (the “Institutional Money Market Funds”). Each of the Institutional Money Market Funds must price its shares at a net asset value (“NAV”) reflecting market-based values of its portfolio securities (i.e., at a “floating” NAV) rounded to the fourth decimal place (e.g., $1.0000).
|
| 2. SIGNIFICANT ACCOUNTING POLICIES |
The financial statements have been prepared in accordance with accounting principles generally accepted in the United States of America (“GAAP”) and require management to make estimates and assumptions that may affect the reported amounts and disclosures. Actual results may differ from those estimates and assumptions.
A. Investment Valuation — The investment valuation policy of the Funds, except for the Institutional Money Market Funds, is to use the amortized-cost method permitted by Rule 2a-7 under the Act for valuing portfolio securities. The amortized-cost method of valuation involves valuing a security at its cost and thereafter applying a constant accretion or amortization to maturity of any discount or premium. Normally, a security’s amortized cost will approximate its market value. Under procedures and tolerances approved by the Trustees, GSAM evaluates daily the difference between each Fund’s NAV per share using the amortized costs of its portfolio securities and the Fund’s NAV per share using market-based values of its portfolio securities. The Institutional Money Market Funds’ investment valuation policy is to value its portfolio securities only at market-based values. The market-based value of a portfolio security is determined, where readily available, on the basis of market quotations provided by pricing services or securities dealers, or, where accurate market quotations are not readily available, on the basis of the security’s fair value as determined in accordance with Valuation Procedures approved by the Trustees. The pricing services may use valuation models or matrix pricing, which may consider (among other things): (i) yield or price with respect to debt securities that are considered comparable in characteristics such as rating, interest rate and maturity date or (ii) quotations from securities dealers to determine current value.
113
GOLDMAN SACHS FUNDS — FINANCIAL SQUARE FUNDS
Notes to Financial Statements(continued)
February 28, 2019 (Unaudited)
|
| 2. SIGNIFICANT ACCOUNTING POLICIES (continued) |
B. Investment Income and Investments — Interest income is accrued daily and adjusted for amortization of premiums and accretion of discounts. Investment transactions are reflected on trade date. Realized gains and losses are calculated using identified cost.
C. Class Allocations and Expenses — Investment income, realized and unrealized gain (loss), if any, and non-class specific expenses of each Fund are allocated daily based upon the proportion of net assets of each class. Class specific expenses, where applicable, are borne by the respective share classes and include Distribution, Service, Distribution and Service, Administration, Service and Administration, and Shareholder Administration fees and Transfer Agency fees. Non-class specific expenses directly incurred by a Fund are charged to that Fund, while such expenses incurred by the Trust are allocated across the respective Funds on a straight-line and/or pro-rata basis depending upon the nature of the expenses.
D. Federal Taxes and Distributions to Shareholders — It is each Fund’s policy to comply with the requirements of the Internal Revenue Code of 1986, as amended (the “Code”), applicable to regulated investment companies (mutual funds) and to distribute each year substantially all of its investment company taxable and tax exempt income and capital gains to its shareholders. Accordingly, the Funds are not required to make any provisions for the payment of federal income tax. Distributions to shareholders are declared and recorded daily and paid monthly by the Funds and may include short-term capital gains. Long-term capital gain distributions, if any, are declared and paid annually. A Fund may defer or accelerate the timing of the distribution of short-term capital gains (or any portion thereof).
Net capital losses, if any, are carried forward to future fiscal years and may be used to the extent allowed by the Code to offset any future capital gains. Utilization of capital loss carryforwards will reduce the requirement of future capital gains distributions.
The characterization of distributions to shareholders for financial reporting purposes is determined in accordance with federal income tax rules, which may differ from GAAP. The source of each Fund’s distributions may be shown in the accompanying financial statements as either from distributable earnings or capital. Certain components of the Funds’ net assets on the Statements of Assets and Liabilities reflect permanent GAAP/tax differences based on the appropriate tax character.
E. Forward Commitments — A forward commitment involves entering into a contract to purchase or sell securities, typically on an extended settlement basis, for a fixed price at a future date. The purchase of securities on a forward commitment basis involves a risk of loss if the value of the security to be purchased declines before the settlement date. Conversely, the sale of securities on a forward commitment basis involves the risk that the value of the securities sold may increase before the settlement date. Although a Fund will generally purchase securities on a forward commitment basis with the intention of acquiring the securities for its portfolio, the Fund may dispose of forward commitments prior to settlement which may result in a realized gain or loss.
F. Repurchase Agreements — Repurchase agreements involve the purchase of securities subject to the seller’s agreement to repurchase the securities at a mutually agreed upon date and price, under the terms of a Master Repurchase Agreement (“MRA”). During the term of a repurchase agreement, the value of the underlying securities held as collateral on behalf of a Fund, including accrued interest, is required to exceed the value of the repurchase agreement, including accrued interest. The gross value of repurchase agreements is included in the Statements of Assets and Liabilities for financial reporting purposes. The underlying securities for all repurchase agreements are held at the Funds’ custodian or designated sub-custodians under tri-party repurchase agreements.
An MRA governs transactions between a Fund and select counterparties. An MRA contains provisions for, among other things, initiation of the transaction, income payments, events of default, and maintenance of securities for repurchase agreements. An MRA also permits offsetting with collateral to create one single net payment in the event of default or similar events, including the bankruptcy or insolvency of a counterparty.
If the seller defaults, a Fund could suffer a loss to the extent that the proceeds from the sale of the underlying securities and other collateral held by the Fund are less than the repurchase price and the Fund’s costs associated with delay and enforcement of the repurchase agreement. In addition, in the event of default or insolvency of the seller, a court could determine that a Fund’s interest in the collateral is not enforceable, resulting in additional losses to the Fund.
114
GOLDMAN SACHS FUNDS — FINANCIAL SQUARE FUNDS
|
| 2. SIGNIFICANT ACCOUNTING POLICIES (continued) |
Pursuant to exemptive relief granted by the Securities and Exchange Commission (“SEC”) and terms and conditions contained therein, the Funds, together with other funds of the Trust and registered investment companies having management agreements with GSAM or its affiliates, may transfer uninvested cash into joint accounts, the daily aggregate balance of which is invested in one or more repurchase agreements. Under these joint accounts, the Funds maintain pro-rata credit exposure to the underlying repurchase agreements’ counterparties. With the exception of certain transaction fees, the Funds are not subject to any expenses in relation to these investments.
| | |
| 3. INVESTMENTS AND FAIR VALUE MEASUREMENTS | | |
U.S. GAAP defines the fair value of a financial instrument as the amount that would be received to sell an asset or paid to transfer a liability in an orderly transaction between market participants at the measurement date (i.e., the exit price); the Funds’ policy is to use the market approach. GAAP establishes a fair value hierarchy that prioritizes the inputs to valuation techniques used to measure fair value. The hierarchy gives the highest priority to unadjusted quoted prices in active markets for identical assets or liabilities (Level 1 measurements) and the lowest priority to unobservable inputs (Level 3 measurements). The levels used for classifying investments are not necessarily an indication of the risk associated with investing in these investments. The three levels of the fair value hierarchy are described below:
Level 1 — Unadjusted quoted prices in active markets that are accessible at the measurement date for identical, unrestricted assets or liabilities;
Level 2 — Quoted prices in markets that are not active or financial instruments for which significant inputs are observable (including, but not limited to, quoted prices for similar investments, interest rates, foreign exchange rates, volatility and credit spreads), either directly or indirectly;
Level 3 — Prices or valuations that require significant unobservable inputs (including GSAM’s assumptions in determining fair value measurement).
The Trustees have approved Valuation Procedures that govern the valuation of the portfolio investments held by the Funds, including investments for which market quotations are not readily available. The Trustees have delegated to GSAM day-to-day responsibility for implementing and maintaining internal controls and procedures related to the valuation (including both the amortized cost and market-based methods of valuation) of the Funds’ investments. To assess the continuing appropriateness of pricing sources and methodologies related to the market-based method of valuation, GSAM regularly performs price verification procedures and issues challenges as necessary to third party pricing vendors or brokers, and any differences are reviewed in accordance with the Valuation Procedures.
As of February 28, 2019, all investments and repurchase agreements, other than those held by the Institutional Money Market Funds, are classified as Level 2 of the fair value hierarchy. All investments for the Institutional Money Market Funds are classified as Level 2, with the exception of treasury securities of G8 countries which are generally classified as Level 1. Please refer to the Schedules of Investments for further detail.
| | |
| 4. AGREEMENTS AND AFFILIATED TRANSACTIONS | | |
A. Management Agreements — Under the Agreements, GSAM manages the Funds, subject to the general supervision of the Trustees.
As compensation for the services rendered pursuant to the Agreements, the assumption of the expenses related thereto and administration of the Funds’ business affairs, including providing facilities, GSAM is entitled to a management fee, accrued daily and paid monthly, equal to an annual percentage rate of each Fund’s average daily net assets.
B. Administration, Service and/or Shareholder Administration Plans — The Trust, on behalf of each applicable Fund, has adopted Administration, Service and/or Shareholder Administration Plans (the “Plans”) to allow Class C, Select, Preferred, Capital, Administration, Premier, Service, Resource and Cash Management Shares to compensate service organizations (including
115
GOLDMAN SACHS FUNDS — FINANCIAL SQUARE FUNDS
Notes to Financial Statements(continued)
February 28, 2019 (Unaudited)
|
| 4. AGREEMENTS AND AFFILIATED TRANSACTIONS (continued) |
Goldman Sachs) for providing varying levels of account administration and/or personal and account maintenance services to their customers who are beneficial owners of such shares. The Plans provide for compensation to the service organizations equal to an annual percentage rate of the average daily net assets of such shares.
C. Distribution and/or Service (12b-1) Plans — The Trust, on behalf of Class A Shares of each applicable Fund, has adopted a Distribution and Service Plan subject to Rule 12b-1 under the Act. Under the Distribution and Service Plan, Goldman Sachs, which serves as distributor (the “Distributor”), is entitled to a fee accrued daily and paid monthly for distribution services and personal and account maintenance services, which may then be paid by Goldman Sachs to authorized dealers. These fees are equal to an annual percentage rate of the average daily net assets attributable to Class A Shares of the Funds, as set forth below.
The Trust, on behalf of Class C, Resource and Cash Management Shares of each applicable Fund, has adopted Distribution Plans subject to Rule 12b-1 under the Act. Under the Distribution Plans, Goldman Sachs as Distributor is entitled to a fee accrued daily and paid monthly for distribution services, which may then be paid by Goldman Sachs to authorized dealers. These fees are equal to an annual percentage rate of the average daily net assets attributable to Class C, Resource and Cash Management Shares of the Funds, as set forth below.
The Trust, on behalf of the Service Shares of each applicable Fund, has adopted a Service Plan subject to Rule 12b-1 under the Act to allow Service Shares to compensate service organizations (including Goldman Sachs) for providing personal and account maintenance services to their customers who are beneficial owners of such shares. The Service Plan provides for compensation to the service organizations equal to an annual percentage rate of the average daily net assets attributable to Services Shares of the Funds, as set forth below.
D. Distribution Agreement — Goldman Sachs, as Distributor of the shares of the Funds pursuant to a Distribution Agreement, may retain a portion of the Class C Shares’ CDSC. During the six months ended February 28, 2019, Goldman Sachs has advised that it retained $1,209 in CDSCs with respect to Class C Shares of the Financial Square Government Fund.
E. Transfer Agency Agreement — Goldman Sachs also serves as the transfer agent of the Funds for a fee pursuant to a Transfer Agency Agreement. The fee charged for such transfer agency services is accrued daily and paid monthly and is equal to an annual percentage rate of each Fund’s average daily net assets.
F. Other Agreements — GSAM has agreed to limit certain “Other Expenses” of the Funds (excluding transfer agency fees and expenses, administration fees (as applicable), service fees (as applicable), shareholder administration fees (as applicable), taxes, interest, brokerage fees, expenses of shareholder meetings, litigation and indemnification, and extraordinary expenses) to the extent such expenses exceed, on an annual basis, 0.014% of the average daily net assets of each Fund. Such Other Expense reimbursements, if any, are accrued daily and paid monthly. These Other Expense limitations will remain in place through at least December 28, 2019, and prior to such date GSAM may not terminate the arrangements without the approval of the Trustees.
In addition, the Funds have entered into certain offset arrangements with the custodian which may result in a reduction of the Funds’ expenses and are received irrespective of the application of the “Other Expense” limitations described above.
G. Total Fund Expenses
Fund Contractual Fees
The contractual management fee rate is 0.18% for the Financial Square Federal Instruments, Financial Square Treasury Instruments, Financial Square Treasury Obligations and Financial Square Treasury Solutions Funds and 0.16% for the Financial Square Government, Financial Square Money Market and Financial Square Prime Obligations Funds.
116
GOLDMAN SACHS FUNDS — FINANCIAL SQUARE FUNDS
|
| 4. AGREEMENTS AND AFFILIATED TRANSACTIONS (continued) |
Other contractual annualized rates for each of the Funds are as follows:
| | | | | | | | | | | | | | | | | | | | | | | | | | | | | | | | | | | | | | | | | | | | | | | | |
| | | Institutional
Shares | | | Select
Shares | | | Preferred
Shares | | | Capital
Shares | | | Administration
Shares | | | Premier
Shares | | | Service
Shares | | | Resource
Shares | | | Cash
Management
Shares | | | Class R6
Shares(a) | | | Class A
Shares(a) | | | Class C
Shares(a) | |
Administration, Service and/or Shareholder Administration Fees | | | N/A | | | | 0.03 | % | | | 0.10 | % | | | 0.15 | % | | | 0.25 | % | | | 0.35 | % | | | 0.25 | % | | | 0.50 | % | | | 0.50 | % | | | N/A | | | | N/A | | | | 0.25 | % |
Distribution and/or Service (12b-1) Fees | | | N/A | | | | N/A | | | | N/A | | | | N/A | | | | N/A | | | | N/A | | | | 0.25 | (b) | | | 0.15 | (c) | | | 0.30 | (c) | | | N/A | | | | 0.25 | % | | | 0.75 | (c) |
Transfer Agency Fee | | | 0.01 | % | | | 0.01 | | | | 0.01 | | | | 0.01 | | | | 0.01 | | | | 0.01 | | | | 0.01 | | | | 0.01 | | | | 0.01 | | | | 0.01 | % | | | 0.01 | | | | 0.01 | |
| N/A | | — Fees not applicable to respective share class |
| (a) | | Government Fund only. |
| (b) | | Service (12b-1) fee only. |
| (c) | | Distribution (12b-1) fee only. |
Fund Effective Net Expenses (After Waivers and Reimbursements)
The investment adviser may contractually agree to waive or reimburse certain fees and expenses until a specified date. As of December 28, 2018, the investment adviser has agreed to not impose a portion of the management fee equal annually to 0.02% of the Financial Square Federal Instrument Fund’s average daily net assets. This arrangement will remain in effect through at least December 28, 2019, and prior to such date, the investment adviser may not terminate the arrangement without the approval of the Board of Trustees. The investment adviser may also voluntarily waive certain fees and expenses, and such voluntary waivers may be discontinued or modified at any time without notice. From the beginning of the reporting period through September 30, 2018, the investment adviser implemented a voluntary temporary fee waiver equal annually to 0.08% of the average daily net assets of the Financial Square Prime Obligations Fund and Financial Square Money Market Fund. From October 1, 2018 through February 27, 2019, the investment adviser reduced the voluntary temporary fee waiver to a percentage rate equal annually to 0.06% of the average daily net assets for both funds. On February 28, 2019, the investment adviser reduced the voluntary temporary fee waiver to a percentage rate equal annually to 0.05% of the average daily net assets for both funds.
During the six months ended February 28, 2019, GSAM and Goldman Sachs (as applicable) agreed to waive all or a portion of the management fees and respective class-specific fees described above attributable to the Funds. The Funds are not obligated to reimburse GSAM or Goldman Sachs for prior fiscal year fee waivers and/or expense reimbursements, if any.
For the six months ended February 28, 2019, expense reductions including any fee waivers and Other Expense reimbursements were as follows (in thousands):
| | | | | | | | | | | | | | | | | | | | |
| Fund | | Management
Fee Waivers | | | Distribution,
Administration,
Service and/or
Shareholder
Administration
Plans Fee Waivers | | | Custody Fee
Reduction | | | Other
Expense
Reimbursements | | | Total
Expense
Reductions | |
Federal Instruments | | $ | 26 | | | $ | — | | | $ | — | | | $ | 93 | | | $ | 119 | |
Government | | | — | | | | — | | | | — | * | | | — | | | | — | * |
Money Market | | | 3,743 | | | | — | | | | — | | | | — | | | | 3,743 | |
Prime Obligations | | | 1,237 | | | | — | | | | — | | | | 58 | | | | 1,295 | |
Treasury Instruments | | | — | * | | | — | | | | — | | | | — | | | | — | |
Treasury Obligations | | | — | * | | | — | | | | — | | | | — | | | | — | |
Treasury Solutions | | | — | * | | | — | | | | — | | | | — | | | | — | |
| * | | Amount less than one thousand. |
117
GOLDMAN SACHS FUNDS — FINANCIAL SQUARE FUNDS
Notes to Financial Statements(continued)
February 28, 2019 (Unaudited)
|
| 4. AGREEMENTS AND AFFILIATED TRANSACTIONS (continued) |
For the six months ended February 28, 2019, the net effective management fee rate was 0.18% for the Financial Square Treasury Instruments, Financial Square Treasury Obligations and Financial Square Treasury Solutions Funds, 0.17% for the Financial Square Federal Instruments Fund, 0.16% for the Financial Square Government Fund and 0.10% for the Financial Square Money Market and Financial Square Prime Obligations Funds.
H. Other Transactions with Affiliates — A Fund may purchase securities from, or sell securities to, an affiliated fund provided the affiliation is solely due to having a common investment adviser, common officers, or common Trustees.
For the six months ended February 28, 2019, the purchase and sale transactions and related net realized gain (loss) for the Funds with affiliated funds in compliance with Rule 17a-7 under the Act were as follows:
| | | | | | | | | | | | | | |
| Fund | | | | Purchases | | | Sales | | | Net Realized
Gain (Loss) | |
Federal Instruments | | | | $ | — | | | $ | — | | | $ | — | |
Government | | | | | 3,490,217,660 | | | | — | | | | — | |
Money Market | | | | | — | | | | — | | | | — | |
Prime Obligations | | | | | — | | | | — | | | | — | |
Treasury Instruments | | | | | — | | | | 3,540,509,762 | | | | — | |
Treasury Obligations | | | | | 507,942,427 | | | | — | | | | — | |
Treasury Solutions | | | | | — | | | | 457,650,325 | | | | — | |
As of February 28, 2019, The Goldman Sachs Group, Inc. was the beneficial owner of 5% or more of the outstanding share classes of the following Funds:
| | | | | | | | | | | | | | | | | | | | | | | | |
| Fund | | Select
Shares | | | Capital
Shares | | | Premier
Shares | | | Service
Shares | | | Resource
Shares | | | Cash
Management
Shares | |
Federal Instruments | | | 100 | % | | | 6 | % | | | 100 | % | | | — | % | | | — | % | | | 100 | % |
Money Market | | | — | | | | — | | | | 100 | | | | 26 | | | | 100 | | | | 100 | |
Prime Obligations | | | — | | | | — | | | | 100 | | | | — | | | | 100 | | | | 100 | |
Treasury Instruments | | | — | | | | — | | | | — | | | | — | | | | 100 | | | | — | |
Treasury Obligations | | | — | | | | — | | | | — | | | | — | | | | 100 | | | | — | |
Treasury Solutions | | | — | | | | — | | | | — | | | | — | | | | 100 | | | | — | |
The following table provides information about the investment in issuers deemed to be affiliates of the Funds.
| | | | | | | | | | | | | | | | | | | | | | | | | | | | |
| | | | | | |
| Government Fund | | | | | | | | | | | | | | | | | | | | | | | | | |
| Name of Affiliated Issuer | | Value at
8/31/18 | | | Purchases
at Cost | | | Proceeds from
Sales/maturities | | | Net
Realized
Gain (Loss) | | | Unrealized
Gain (Loss) | | | Value at
2/28/19 | | | Interest
Income | |
Goldman Sachs &Co. -Repurchase Agreement | | $ | 1,600,800,000 | | | $ | 21,475,500,000 | | | $ | (22,426,300,000 | ) | | $ | — | | | $ | — | | | $ | 650,000,000 | | | $ | 1,672,690 | |
118
GOLDMAN SACHS FUNDS — FINANCIAL SQUARE FUNDS
|
| 4. AGREEMENTS AND AFFILIATED TRANSACTIONS (continued) |
| | | | | | | | | | | | | | | | | | | | | | | | | | | | |
| Treasury Obligations Fund | | | | | | | | | | | | | | | | | | | | | | | | | |
| Name of Affiliated Issuer | | Value at
8/31/18 | | | Purchases
at Cost | | | Proceeds from
Sales/maturities | | | Net
Realized
Gain (Loss) | | | Unrealized
Gain (Loss) | | | Value at
2/28/19 | | | Interest
Income | |
Goldman Sachs &Co. -Repurchase Agreement | | $ | 31,200,000 | | | $ | 3,730,200,000 | | | $ | (3,611,400,000 | ) | | $ | — | | | $ | — | | | $ | 150,000,000 | | | $ | 284,180 | |
I. Line of Credit Facility — As of February 28, 2019, the Funds participated in a $770,000,000 committed, unsecured revolving line of credit facility (the “facility”) together with other funds of the Trust and registered investment companies having management agreements with GSAM or its affiliates. This facility is to be used for temporary emergency purposes, or to allow for an orderly liquidation of securities to meet redemption requests. The interest rate on borrowings is based on the federal funds rate. The facility also requires a fee to be paid by the Funds based on the amount of the commitment that has not been utilized. For the six months ended February 28, 2019, the Funds did not have any borrowings under the facility.
As of the Funds’ most recent fiscal year end, August 31, 2018, the Funds’ certain timing differences on a tax basis were as follows:
| | | | | | | | | | | | | | | | | | | | | | | | | | | | |
| | | Federal
Instruments | | | Government | | | Money
Market | | | Prime
Obligations | | | Treasury
Instruments | | | Treasury
Obligations | | | Treasury
Solutions | |
Timing differences (Dividend Payable and Post-October Capital Loss Deferral) | | $ | (114,323 | ) | | $ | (76,227,006 | ) | | $ | (10,710,503 | ) | | $ | (2,372,825 | ) | | $ | (36,153,689 | ) | | $ | (13,297,307 | ) | | $ | (3,547,072 | ) |
At February 28, 2019, the aggregate cost for each Fund stated in the accompanying Statements of Assets and Liabilities also represents aggregate cost for U.S. federal income tax purposes.
GSAM has reviewed the Funds’ tax positions for all open tax years (the current and prior three tax years, as applicable) and has concluded that no provision for income tax is required in the Funds’ financial statements. Such open tax years remain subject to examination and adjustment by tax authorities.
The Funds’ risks include, but are not limited to, the following:
Large Shareholder Transactions Risk — A Fund may experience adverse effects when certain large shareholders, such as other funds, institutional investors (including those trading by use of non-discretionary mathematical formulas), financial intermediaries (who may make investment decisions on behalf of underlying clients and/or include a Fund in their investment model), individuals, accounts and Goldman Sachs affiliates, purchase or redeem large amounts of shares of a Fund. Such large shareholder redemptions, which may occur rapidly or unexpectedly, may cause a Fund to sell portfolio securities at times when it would not otherwise do so, which may negatively impact the Fund’s NAV and liquidity. Similarly, large Fund share purchases may adversely affect a Fund’s performance to the extent that the Fund is delayed in investing new cash or otherwise maintains a larger cash position than it ordinarily would. These transactions may also accelerate the realization of taxable income to shareholders if such sales of investments resulted in gains, and may also increase transaction costs. In addition, a large redemption could result in a Fund’s current expenses being allocated over a smaller asset base, leading to an increase in the Fund’s expense ratio.
Interest Rate Risk — When interest rates increase, a Fund’s yield will tend to be lower than prevailing market rates, and the market value of its securities or instruments may also be adversely affected. A low interest rate environment poses additional risks to a Fund, because low yields on the Fund’s portfolio holdings may have an adverse impact on the Fund’s ability to provide a
119
GOLDMAN SACHS FUNDS — FINANCIAL SQUARE FUNDS
Notes to Financial Statements(continued)
February 28, 2019 (Unaudited)
|
| 6. OTHER RISKS (continued) |
positive yield to its shareholders, pay expenses out of Fund assets, or, at times, maintain a stable $1.00 share price (or, for the Institutional Money Market Funds, minimize the volatility of the Fund’s NAV per share). The risks associated with changing interest rates may have unpredictable effects on the markets and a Fund’s investments. Fluctuations in interest rates may also affect the liquidity of fixed income securities and instruments held by the Funds.
Market and Credit Risks — In the normal course of business, the Funds trade financial instruments and enter into financial transactions where risk of potential loss exists due to changes in the market (market risk). Additionally, a Fund may also be exposed to credit risk in the event that an issuer or guarantor fails to perform or that an institution or entity with which a Fund has unsettled or open transactions defaults.
Credit/Default Risk — An issuer or guarantor of a security held by the Fund, or a bank or other financial institution that has entered into a repurchase agreement with the Fund, may default on its obligation to pay interest and repay principal or default on any other obligation. Additionally, the credit quality of securities may deteriorate rapidly, which may impair the Fund’s liquidity and cause significant deterioration in NAV.
Under the Trust’s organizational documents, its Trustees, officers, employees and agents are indemnified, to the extent permitted by the Act and state law, against certain liabilities that may arise out of performance of their duties to the Funds. Additionally, in the course of business, the Funds enter into contracts that contain a variety of indemnification clauses. The Funds’ maximum exposure under these arrangements is unknown, as this would involve future claims that may be made against the Funds that have not yet occurred. However, GSAM believes the risk of loss under these arrangements to be remote.
Exemptive Orders — Pursuant to SEC exemptive orders, the Funds may enter into certain principal transactions, including repurchase agreements, with Goldman Sachs.
Subsequent events after the Statements of Assets and Liabilities date have been evaluated and GSAM has concluded that there is no impact requiring adjustment or disclosure in the financial statements.
120
GOLDMAN SACHS FUNDS — FINANCIAL SQUARE FUNDS
|
| 10. SUMMARY OF SHARE TRANSACTIONS |
Share activity is as follows:
| | | | | | | | |
| | | Federal Instruments Fund | |
| | | | |
| | | For the Six Months Ended
February 28, 2019
(Unaudited) | | | For the Fiscal Year Ended
August 31, 2018 | |
| | | | |
| | | Shares* | | | Shares* | |
| | | | |
| Institutional Shares | | | | | | | | |
Shares sold | | | 714,869,383 | | | | 1,400,470,046 | |
Reinvestment of distributions | | | 5,726,329 | | | | 6,922,069 | |
Shares redeemed | | | (417,472,364 | ) | | | (1,455,200,988 | ) |
| | | | 303,123,348 | | | | (47,808,873 | ) |
| Select Shares | | | | | | | | |
Shares sold | | | — | | | | — | |
Reinvestment of distributions | | | 494 | | | | 620 | |
Shares redeemed | | | — | | | | — | |
| | | | 494 | | | | 620 | |
| Preferred Shares | | | | | | | | |
Shares sold | | | 21,896,334 | | | | 17,006,614 | |
Reinvestment of distributions | | | 83,500 | | | | 9,963 | |
Shares redeemed | | | (16,627,227 | ) | | | (14,681,017 | ) |
| | | | 5,352,607 | | | | 2,335,560 | |
| Capital Shares | | | | | | | | |
Shares sold | | | 1,230,570 | | | | 33,748,217 | |
Reinvestment of distributions | | | 13,827 | | | | 140,311 | |
Shares redeemed | | | (5,500,008 | ) | | | (44,899,331 | ) |
| | | | (4,255,611 | ) | | | (11,010,803 | ) |
| Administration Shares | | | | | | | | |
Shares sold | | | 82,104,058 | | | | 140,166,680 | |
Reinvestment of distributions | | | 60,739 | | | | 92,037 | |
Shares redeemed | | | (83,335,965 | ) | | | (131,578,827 | ) |
| | | | (1,171,168 | ) | | | 8,679,890 | |
| Premier Shares | | | | | | | | |
Shares sold | | | — | | | | — | |
Reinvestment of distributions | | | 441 | | | | 494 | |
Shares redeemed | | | — | | | | — | |
| | | | 441 | | | | 494 | |
| Service Shares | | | | | | | | |
Shares sold | | | 2,009,148 | | | | 6,536,571 | |
Reinvestment of distributions | | | 8 | | | | 8 | |
Shares redeemed | | | (2,496,326 | ) | | | (10,663,032 | ) |
| | | | (487,170 | ) | | | (4,126,453 | ) |
| Cash Management Shares | | | | | | | | |
Shares sold | | | — | | | | — | |
Reinvestment of distributions | | | 325 | | | | 267 | |
Shares redeemed | | | — | | | | — | |
| | | | 325 | | | | 267 | |
| | |
NET INCREASE (DECREASE) IN SHARES | | | 302,563,266 | | | | (51,929,298 | ) |
| * | | Valued at $1.00 per share. |
121
GOLDMAN SACHS FUNDS — FINANCIAL SQUARE FUNDS
Notes to Financial Statements(continued)
February 28, 2019 (Unaudited)
|
| 10. SUMMARY OF SHARE TRANSACTIONS (continued) |
Share activity is as follows:
| | | | | | | | |
| | | Government Fund | |
| | | | |
| | | For the Six Months Ended
February 28, 2019
(Unaudited) | | | For the Fiscal Year Ended
August 31, 2018 | |
| | | | |
| | | Shares* | | | Shares* | |
| | | | |
| Institutional Shares | | | | | | | | |
Shares sold | | | 435,978,659,529 | | | | 767,294,667,985 | |
Reinvestment of distributions | | | 475,415,102 | | | | 573,354,489 | |
Shares redeemed | | | (441,665,600,868 | ) | | | (751,051,186,053 | ) |
| | | | (5,211,526,237 | ) | | | 16,816,836,421 | |
| Select Shares | | | | | | | | |
Shares sold | | | 896,337,832 | | | | 7,696,626,754 | |
Reinvestment of distributions | | | 6,023,859 | | | | 22,869,904 | |
Shares redeemed | | | (844,445,155 | ) | | | (10,043,218,389 | ) |
| | | | 57,916,536 | | | | (2,323,721,731 | ) |
| Preferred Shares | | | | | | | | |
Shares sold | | | 1,983,503,094 | | | | 3,366,876,972 | |
Reinvestment of distributions | | | 1,118,028 | | | | 2,263,169 | |
Shares redeemed | | | (2,577,845,487 | ) | | | (2,592,345,659 | ) |
| | | | (593,224,365 | ) | | | 776,794,482 | |
| Capital Shares | | | | | | | | |
Shares sold | | | 5,804,436,666 | | | | 10,611,941,302 | |
Reinvestment of distributions | | | 8,304,195 | | | | 8,910,716 | |
Shares redeemed | | | (5,322,239,301 | ) | | | (10,226,370,008 | ) |
| | | | 490,501,560 | | | | 394,482,010 | |
| Administration Shares | | | | | | | | |
Shares sold | | | 15,056,993,759 | | | | 22,082,581,830 | |
Reinvestment of distributions | | | 13,995,893 | | | | 14,229,495 | |
Shares redeemed | | | (14,322,581,097 | ) | | | (21,781,180,895 | ) |
| | | | 748,408,555 | | | | 315,630,430 | |
| Premier Shares | | | | | | | | |
Shares sold | | | 291,174,966 | | | | 528,483,711 | |
Reinvestment of distributions | | | 422,661 | | | | 61,356 | |
Shares redeemed | | | (232,298,810 | ) | | | (461,826,788 | ) |
| | | | 59,298,817 | | | | 66,718,279 | |
| Service Shares | | | | | | | | |
Shares sold | | | 947,478,982 | | | | 1,702,546,572 | |
Reinvestment of distributions | | | 1,026,400 | | | | 725,362 | |
Shares redeemed | | | (937,687,788 | ) | | | (1,452,690,284 | ) |
| | | | 10,817,594 | | | | 250,581,650 | |
| Class A Shares | | | | | | | | |
Shares sold | | | 38,880,678 | | | | 38,536,927 | |
Reinvestment of distributions | | | 593,754 | | | | 667,472 | |
Shares redeemed | | | (39,052,500 | ) | | | (25,029,702 | ) |
| | | | 421,932 | | | | 14,174,697 | |
| Class C Shares | | | | | | | | |
Shares sold | | | 1,657,277 | | | | 1,641,220 | |
Reinvestment of distributions | | | 26,359 | | | | 20,356 | |
Shares redeemed | | | (2,023,597 | ) | | | (2,670,451 | ) |
| | | | (339,961 | ) | | | (1,008,875 | ) |
| Resource Shares | | | | | | | | |
Shares sold | | | 50,685,357 | | | | 157,695,967 | |
Reinvestment of distributions | | | 457,731 | | | | 477,107 | |
Shares redeemed | | | (65,806,391 | ) | | | (162,291,445 | ) |
| | | | (14,663,303 | ) | | | (4,118,371 | ) |
| Cash Management Shares | | | | | | | | |
Shares sold | | | 10,775,400 | | | | 18,102,135 | |
Reinvestment of distributions | | | 49,957 | | | | 32,820 | |
Shares redeemed | | | (10,352,269 | ) | | | (15,341,360 | ) |
| | | | 473,088 | | | | 2,793,595 | |
| Class R6 Shares | | | | | | | | |
Shares sold | | | 705,514,328 | | | | 517,270,674 | |
Reinvestment of distributions | | | 547,934 | | | | 378,283 | |
Shares redeemed | | | (709,695,659 | ) | | | (480,982,183 | ) |
| | | | (3,633,397 | ) | | | 36,666,774 | |
| | |
NET INCREASE IN SHARES | | | (4,455,549,181 | ) | | | 16,345,829,361 | |
| * | | Valued at $1.00 per share. |
122
GOLDMAN SACHS FUNDS — FINANCIAL SQUARE FUNDS
|
| 10. SUMMARY OF SHARE TRANSACTIONS (continued) |
Share activity is as follows:
| | | | | | | | | | | | | | | | |
| | | Money Market Fund | |
| | | | |
| | | For the Six Months Ended
February 28, 2019
(Unaudited) | | | For the Fiscal Year Ended
August 31, 2018 | |
| | | | |
| | | Shares | | | Dollars | | | Shares | | | Dollars | |
| | | | |
| Institutional Shares | | | | | | | | | | | | | | | | |
Shares sold | | | 40,792,153,750 | | | $ | 40,800,408,538 | | | | 46,299,886,154 | | | $ | 46,307,987,978 | |
Reinvestment of distributions | | | 64,727,138 | | | | 64,742,029 | | | | 45,575,447 | | | | 45,582,507 | |
Shares redeemed | | | (39,528,651,992 | ) | | | (39,536,483,868 | ) | | | (37,319,991,499 | ) | | | (37,326,705,607 | ) |
| | | | 1,328,228,896 | | | | 1,328,666,699 | | | | 9,025,470,102 | | | | 9,026,864,878 | |
| Select Shares | | | | | | | | | | | | | | | | |
Shares sold | | | 9,458,319 | | | | 9,460,861 | | | | 43,394,073 | | | | 43,400,844 | |
Reinvestment of distributions | | | 371,564 | | | | 371,639 | | | | 334,349 | | | | 334,409 | |
Shares redeemed | | | (18,012,831 | ) | | | (18,016,299 | ) | | | (19,227,361 | ) | | | (19,230,355 | ) |
| | | | (8,182,948 | ) | | | (8,183,799 | ) | | | 24,501,061 | | | | 24,504,898 | |
| Preferred Shares | | | | | | | | | | | | | | | | |
Shares sold | | | 69,972 | | | | 70,000 | | | | 5,423,111 | | | | 5,424,179 | |
Reinvestment of distributions | | | 20,240 | | | | 20,244 | | | | 14,447 | | | | 14,449 | |
Shares redeemed | | | (1,002,099 | ) | | | (1,002,199 | ) | | | (4,103,804 | ) | | | (4,104,735 | ) |
| | | | (911,887 | ) | | | (911,955 | ) | | | 1,333,754 | | | | 1,333,893 | |
| Capital Shares | | | | | | | | | | | | | | | | |
Shares sold | | | 4,798,081 | | | | 4,800,000 | | | | — | | | | — | |
Reinvestment of distributions | | | 4,553 | | | | 4,556 | | | | 16 | | | | 16 | |
Shares redeemed | | | — | | | | — | | | | — | | | | — | |
| | | | 4,802,634 | | | | 4,804,556 | | | | 16 | | | | 16 | |
| Administration Shares | | | | | | | | | | | | | | | | |
Shares sold | | | 5,950,930 | | | | 5,951,275 | | | | — | | | | — | |
Reinvestment of distributions | | | 16,777 | | | | 16,779 | | | | 48,519 | | | | 48,526 | |
Shares redeemed | | | (8,346,359 | ) | | | (8,346,940 | ) | | | (2,345,631 | ) | | | (2,346,243 | ) |
| | | | (2,378,652 | ) | | | (2,378,886 | ) | | | (2,297,112 | ) | | | (2,297,717 | ) |
| Premier Shares | | | | | | | | | | | | | | | | |
Shares sold | | | — | | | | — | | | | — | | | | — | |
Reinvestment of distributions | | | 10 | | | | 10 | | | | 13 | | | | 13 | |
Shares redeemed | | | — | | | | — | | | | — | | | | — | |
| | | | 10 | | | | 10 | | | | 13 | | | | 13 | |
| Service Shares | | | | | | | | | | | | | | | | |
Shares sold | | | 758,150 | | | | 758,100 | | | | 5,533,949 | | | | 5,534,250 | |
Reinvestment of distributions | | | 719 | | | | 720 | | | | 4,433 | | | | 4,433 | |
Shares redeemed | | | (883,219 | ) | | | (883,200 | ) | | | (5,476,814 | ) | | | (5,477,100 | ) |
| | | | (124,350 | ) | | | (124,380 | ) | | | 61,568 | | | | 61,583 | |
| Resource Shares | | | | | | | | | | | | | | | | |
Shares sold | | | — | | | | — | | | | — | | | | — | |
Reinvestment of distributions | | | 9 | | | | 9 | | | | 11 | | | | 11 | |
Shares redeemed | | | — | | | | — | | | | — | | | | — | |
| | | | 9 | | | | 9 | | | | 11 | | | | 11 | |
| Cash Management Shares | | | | | | | | | | | | | | | | |
Shares sold | | | — | | | | — | | | | — | | | | — | |
Reinvestment of distributions | | | 8 | | | | 8 | | | | 9 | | | | 9 | |
Shares redeemed | | | — | | | | — | | | | — | | | | — | |
| | | | 8 | | | | 8 | | | | 9 | | | | 9 | |
| | | | |
NET INCREASE (DECREASE) | | | 1,321,433,720 | | | $ | 1,321,872,262 | | | | 9,049,069,422 | | | $ | 9,050,467,584 | |
123
GOLDMAN SACHS FUNDS — FINANCIAL SQUARE FUNDS
Notes to Financial Statements(continued)
February 28, 2019 (Unaudited)
|
| 10. SUMMARY OF SHARE TRANSACTIONS (continued) |
Share activity is as follows:
| | | | | | | | | | | | | | | | |
| | | Prime Obligations Fund | |
| | | | |
| | | For the Six Months Ended
February 28, 2019
(Unaudited) | | | For the Fiscal Year Ended
August 31, 2018 | |
| | | | |
| | | Shares | | | Dollars | | | Shares | | | Dollars | |
| | | | |
| Institutional Shares | | | | | | | | | | | | | | | | |
Shares sold | | | 6,414,081,316 | | | $ | 6,415,781,689 | | | | 13,026,118,996 | | | $ | 13,029,108,551 | |
Reinvestment of distributions | | | 28,505,854 | | | | 28,513,165 | | | | 23,617,053 | | | | 23,622,474 | |
Shares redeemed | | | (5,594,266,498 | ) | | | (5,595,649,849 | ) | | | (10,752,156,347 | ) | | | (10,754,667,412 | ) |
| | | | 848,320,672 | | | | 848,645,005 | | | | 2,297,579,702 | | | | 2,298,063,613 | |
| Select Shares | | | | | | | | | | | | | | | | |
Shares sold | | | 99,677,262 | | | | 99,687,738 | | | | 206,804,211 | | | | 206,836,533 | |
Reinvestment of distributions | | | 822,767 | | | | 822,857 | | | | 614,305 | | | | 614,374 | |
Shares redeemed | | | (68,185,100 | ) | | | (68,191,347 | ) | | | (165,268,899 | ) | | | (165,300,538 | ) |
| | | | 32,314,929 | | | | 32,319,248 | | | | 42,149,617 | | | | 42,150,369 | |
| Preferred Shares | | | | | | | | | �� | | | | | | | |
Shares sold | | | 162,323 | | | | 162,334 | | | | 67,707,785 | | | | 67,727,575 | |
Reinvestment of distributions | | | 30,075 | | | | 30,077 | | | | 15,732 | | | | 15,734 | |
Shares redeemed | | | (210,056 | ) | | | (210,077 | ) | | | (66,102,138 | ) | | | (66,121,783 | ) |
| | | | (17,658 | ) | | | (17,666 | ) | | | 1,621,379 | | | | 1,621,526 | |
| Capital Shares | | | | | | | | | | | | | | | | |
Shares sold | | | 3,450,088 | | | | 3,450,873 | | | | 6,399,800 | | | | 6,401,080 | |
Reinvestment of distributions | | | 48,860 | | | | 48,869 | | | | 20,801 | | | | 20,805 | |
Shares redeemed | | | (5,266,605 | ) | | | (5,267,179 | ) | | | (269 | ) | | | (269 | ) |
| | | | (1,767,657 | ) | | | (1,767,437 | ) | | | 6,420,332 | | | | 6,421,616 | |
| Administration Shares | | | | | | | | | | | | | | | | |
Shares sold | | | 165,634,924 | | | | 165,663,364 | | | | 178,009,602 | | | | 178,050,176 | |
Reinvestment of distributions | | | 5,862 | | | | 5,863 | | | | 5,002 | | | | 5,003 | |
Shares redeemed | | | (139,118,083 | ) | | | (139,143,063 | ) | | | (174,822,956 | ) | | | (174,862,263 | ) |
| | | | 26,522,703 | | | | 26,526,164 | | | | 3,191,648 | | | | 3,192,916 | |
| Premier Shares | | | | | | | | | | | | | | | | |
Shares sold | | | — | | | | — | | | | — | | | | — | |
Reinvestment of distributions | | | 10 | | | | 10 | | | | 13 | | | | 13 | |
Shares redeemed | | | — | | | | — | | | | — | | | | — | |
| | | | 10 | | | | 10 | | | | 13 | | | | 13 | |
| Service Shares | | | | | | | | | | | | | | | | |
Shares sold | | | 9,488,649 | | | | 9,488,670 | | | | 57,622,958 | | | | 57,628,033 | |
Reinvestment of distributions | | | 51,188 | | | | 51,193 | | | | 422 | | | | 422 | |
Shares redeemed | | | (4,534,313 | ) | | | (4,535,463 | ) | | | (57,623,933 | ) | | | (57,629,030 | ) |
| | | | 5,005,524 | | | | 5,004,400 | | | | (553 | ) | | | (575 | ) |
| Resource Shares | | | | | | | | | | | | | | | | |
Shares sold | | | — | | | | — | | | | — | | | | — | |
Reinvestment of distributions | | | 9 | | | | 9 | | | | 11 | | | | 11 | |
Shares redeemed | | | — | | | | — | | | | — | | | | — | |
| | | | 9 | | | | 9 | | | | 11 | | | | 11 | |
| Cash Management Shares | | | | | | | | | | | | | | | | |
Shares sold | | | — | | | | — | | | | — | | | | — | |
Reinvestment of distributions | | | 8 | | | | 8 | | | | 9 | | | | 9 | |
Shares redeemed | | | — | | | | — | | | | — | | | | — | |
| | | | 8 | | | | 8 | | | | 9 | | | | 9 | |
| | | | |
NET INCREASE (DECREASE) | | | 910,378,540 | | | $ | 910,709,741 | | | | 2,350,962,158 | | | $ | 2,351,449,498 | |
124
GOLDMAN SACHS FUNDS — FINANCIAL SQUARE FUNDS
|
| 10. SUMMARY OF SHARE TRANSACTIONS (continued) |
Share activity is as follows:
| | | | | | | | |
| | | Treasury InstrumentsFund | |
| | | | |
| | | For the Six Months Ended
February 28, 2019
(Unaudited) | | | For the Fiscal Year Ended
August 31, 2018 | |
| | | | |
| | | Shares* | | | Shares* | |
| | | | |
| Institutional Shares | | | | | | | | |
Shares sold | | | 111,489,409,325 | | | | 200,968,164,954 | |
Reinvestment of distributions | | | 306,564,681 | | | | 368,644,488 | |
Shares redeemed | | | (113,828,494,522 | ) | | | (194,487,340,904 | ) |
| | | | (2,032,520,516 | ) | | | 6,849,468,538 | |
| Select Shares | | | | | | | | |
Shares sold | | | 373,997,895 | | | | 964,098,549 | |
Reinvestment of distributions | | | 3,545,000 | | | | 1,006,438 | |
Shares redeemed | | | (418,905,690 | ) | | | (642,050,518 | ) |
| | | | (41,362,795 | ) | | | 323,054,469 | |
| Preferred Shares | | | | | | | | |
Shares sold | | | 109,251,300 | | | | 203,124,249 | |
Reinvestment of distributions | | | 364,892 | | | | 413,889 | |
Shares redeemed | | | (95,661,929 | ) | | | (198,285,848 | ) |
| | | | 13,954,263 | | | | 5,252,290 | |
| Capital Shares | | | | | | | | |
Shares sold | | | 2,528,514,439 | | | | 4,337,569,703 | |
Reinvestment of distributions | | | 5,030,971 | | | | 7,208,601 | |
Shares redeemed | | | (2,326,683,758 | ) | | | (5,024,768,164 | ) |
| | | | 206,861,652 | | | | (679,989,860 | ) |
| Administration Shares | | | | | | | | |
Shares sold | | | 5,652,096,596 | | | | 8,941,512,202 | |
Reinvestment of distributions | | | 15,199,612 | | | | 15,407,859 | |
Shares redeemed | | | (5,735,985,000 | ) | | | (9,413,209,502 | ) |
| | | | (68,688,792 | ) | | | (456,289,441 | ) |
| Premier Shares | | | | | | | | |
Shares sold | | | 36,366,252 | | | | 166,068,240 | |
Reinvestment of distributions | | | 109 | | | | 175 | |
Shares redeemed | | | (57,585,341 | ) | | | (69,785,344 | ) |
| | | | (21,218,980 | ) | | | 96,283,071 | |
| Service Shares | | | | | | | | |
Shares sold | | | 545,594,616 | | | | 74,599,248 | |
Reinvestment of distributions | | | 1,315,559 | | | | 94,914 | |
Shares redeemed | | | (500,035,076 | ) | | | (99,864,762 | ) |
| | | | 46,875,099 | | | | (25,170,600 | ) |
| Resource Shares | | | | | | | | |
Shares sold | | | — | | | | — | |
Reinvestment of distributions | | | 7 | | | | 7 | |
Shares redeemed | | | — | | | | — | |
| | | | 7 | | | | 7 | |
| Cash Management Shares | | | | | | | | |
Shares sold | | | 42,860,943 | | | | 33,346 | |
Reinvestment of distributions | | | 42,331 | | | | 297 | |
Shares redeemed | | | (33,319,548 | ) | | | — | |
| | | | 9,583,726 | | | | 33,643 | |
| | |
NET INCREASE (DECREASE) IN SHARES | | | (1,886,516,336 | ) | | | 6,112,642,117 | |
| * | | Valued at $1.00 per share. |
125
GOLDMAN SACHS FUNDS — FINANCIAL SQUARE FUNDS
Notes to Financial Statements(continued)
February 28, 2019 (Unaudited)
|
| 10. SUMMARY OF SHARE TRANSACTIONS (continued) |
Share activity is as follows:
| | | | | | | | |
| | | Treasury Obligations Fund | |
| | | | |
| | | For the Six Months Ended
February 28, 2019
(Unaudited) | | | For the Fiscal Year Ended
August 31, 2018 | |
| | | | |
| | | Shares* | | | Shares* | |
| | | | |
| Institutional Shares | | | | | | | | |
Shares sold | | | 82,758,716,858 | | | | 127,843,066,508 | |
Reinvestment of distributions | | | 48,065,617 | | | | 78,076,429 | |
Shares redeemed | | | (82,179,662,859 | ) | | | (132,362,768,631 | ) |
| | | | 627,119,616 | | | | (4,441,625,694 | ) |
| Select Shares | | | | | | | | |
Shares sold | | | 381,321,867 | | | | 628,512,654 | |
Reinvestment of distributions | | | 759,576 | | | | 1,433,355 | |
Shares redeemed | | | (467,098,314 | ) | | | (563,778,095 | ) |
| | | | (85,016,871 | ) | | | 66,167,914 | |
| Preferred Shares | | | | | | | | |
Shares sold | | | 706,254,818 | | | | 888,926,342 | |
Reinvestment of distributions | | | 1,476,100 | | | | 1,307,822 | |
Shares redeemed | | | (481,407,126 | ) | | | (839,865,749 | ) |
| | | | 226,323,792 | | | | 50,368,415 | |
| Capital Shares | | | | | | | | |
Shares sold | | | 1,177,820,605 | | | | 2,033,717,384 | |
Reinvestment of distributions | | | 3,176,548 | | | | 3,814,950 | |
Shares redeemed | | | (917,076,646 | ) | | | (2,007,845,745 | ) |
| | | | 263,920,507 | | | | 29,686,589 | |
| Administration Shares | | | | | | | | |
Shares sold | | | 5,344,630,794 | | | | 6,999,654,929 | |
Reinvestment of distributions | | | 3,864,089 | | | | 4,252,605 | |
Shares redeemed | | | (5,400,209,343 | ) | | | (6,501,274,216 | ) |
| | | | (51,714,460 | ) | | | 502,633,318 | |
| Premier Shares | | | | | | | | |
Shares sold | | | 40,427,361 | | | | 67,578,986 | |
Reinvestment of distributions | | | 138,329 | | | | 52,384 | |
Shares redeemed | | | (40,212,009 | ) | | | (51,140,386 | ) |
| | | | 353,681 | | | | 16,490,984 | |
| Service Shares | | | | | | | | |
Shares sold | | | 2,797,371,035 | | | | 3,881,413,566 | |
Reinvestment of distributions | | | 490,013 | | | | 455,493 | |
Shares redeemed | | | (3,015,756,258 | ) | | | (3,494,419,632 | ) |
| | | | (217,895,210 | ) | | | 387,449,427 | |
| Resource Shares | | | | | | | | |
Shares sold | | | — | | | | — | |
Reinvestment of distributions | | | 7 | | | | 8 | |
Shares redeemed | | | — | | | | — | |
| | | | 7 | | | | 8 | |
| Cash Management Shares | | | | | | | | |
Shares sold | | | 38,198 | | | | 82,616 | |
Reinvestment of distributions | | | 269 | | | | 360 | |
Shares redeemed | | | (41,456 | ) | | | (188,755 | ) |
| | | | (2,989 | ) | | | (105,779 | ) |
| | |
NET DECREASE IN SHARES | | | 763,088,073 | | | | (3,388,934,818 | ) |
| * | | Valued at $1.00 per share. |
126
GOLDMAN SACHS FUNDS — FINANCIAL SQUARE FUNDS
|
| 10. SUMMARY OF SHARE TRANSACTIONS (continued) |
Share activity is as follows:
| | | | | | | | |
| | | Treasury Solutions Fund | |
| | | | |
| | | For the Six Months Ended
February 28, 2019
(Unaudited) | | | For the Fiscal Year Ended
August 31, 2018 | |
| | | | |
| | | Shares* | | | Shares* | |
| | | | |
| Institutional Shares | | | | | | | | |
Shares sold | | | 17,881,759,069 | | | | 33,048,691,763 | |
Reinvestment of distributions | | | 63,656,390 | | | | 76,819,487 | |
Shares redeemed | | | (17,691,972,119 | ) | | | (34,077,138,356 | ) |
| | | | 253,443,340 | | | | (951,627,106 | ) |
| Select Shares | | | | | | | | |
Shares sold | | | — | | | | 4,000,000 | |
Reinvestment of distributions | | | 66,034 | | | | 106,209 | |
Shares redeemed | | | (1,640,000 | ) | | | (4,000,000 | ) |
| | | | (1,573,966 | ) | | | 106,209 | |
| Preferred Shares | | | | | | | | |
Shares sold | | | 104,674,751 | | | | 243,266,133 | |
Reinvestment of distributions | | | 156,503 | | | | 395,088 | |
Shares redeemed | | | (58,431,198 | ) | | | (238,680,643 | ) |
| | | | 46,400,056 | | | | 4,980,578 | |
| Capital Shares | | | | | | | | |
Shares sold | | | 735,177,874 | | | | 1,717,466,555 | |
Reinvestment of distributions | | | 1,543,502 | | | | 1,998,911 | |
Shares redeemed | | | (731,794,009 | ) | | | (1,769,632,289 | ) |
| | | | 4,927,367 | | | | (50,166,823 | ) |
| Administration Shares | | | | | | | | |
Shares sold | | | 868,049,699 | | | | 1,316,637,199 | |
Reinvestment of distributions | | | 2,061,704 | | | | 1,948,987 | |
Shares redeemed | | | (851,196,940 | ) | | | (1,195,319,497 | ) |
| | | | 18,914,463 | | | | 123,266,689 | |
| Premier Shares | | | | | | | | |
Shares sold | | | 189,339,991 | | | | 171,371,374 | |
Reinvestment of distributions | | | 157,629 | | | | 10,395 | |
Shares redeemed | | | (97,085,852 | ) | | | (141,266,720 | ) |
| | | | 92,411,768 | | | | 30,115,049 | |
| Service Shares | | | | | | | | |
Shares sold | | | 198,434,936 | | | | 500,278,676 | |
Reinvestment of distributions | | | 53,388 | | | | 38,581 | |
Shares redeemed | | | (245,181,515 | ) | | | (489,231,701 | ) |
| | | | (46,693,191 | ) | | | 11,085,556 | |
| Resource Shares | | | | | | | | |
Shares sold | | | — | | | | — | |
Reinvestment of distributions | | | 7 | | | | 7 | |
Shares redeemed | | | — | | | | — | |
| | | | 7 | | | | 7 | |
| Cash Management Shares | | | | | | | | |
Shares sold | | | 357,041,116 | | | | 149,007,427 | |
Reinvestment of distributions | | | 20 | | | | 5 | |
Shares redeemed | | | (277,687,351 | ) | | | (158,926,942 | ) |
| | | | 79,353,785 | | | | (9,919,510 | ) |
| | |
NET DECREASE IN SHARES | | | 447,183,629 | | | | (842,159,351 | ) |
| * | | Valued at $1.00 per share. |
127
GOLDMAN SACHS FUNDS — FINANCIAL SQUARE FUNDS
Fund Expenses — Six Month Period Ended February 28, 2019 (Unaudited)
As a shareholder of Institutional Shares, Select Shares, Preferred Shares, Capital Shares, Administration Shares, Premier Shares, Service Shares, Class A Shares, Class C Shares, Resource Shares, Cash Management Shares or Class R6 Shares of a Fund, you incur two types of costs: (1) transaction costs, including contingent deferred sales charges (with respect to Class C Shares); and (2) ongoing costs, including management fees and distribution, service, administration and/or shareholder administration fees (with respect to all share classes except Institutional Shares and Class R6 Shares) and other Fund expenses. This example is intended to help you understand your ongoing costs (in dollars) of investing in Institutional Shares, Select Shares, Preferred Shares. Capital Shares, Administration Shares, Premier Shares, Service Shares, Class A Shares, Class C Shares, Resource Shares, Cash Management Shares or Class R6 Shares of the Funds and to compare these costs with the ongoing costs of investing in other mutual funds.
The example is based on an investment of $1,000 invested at the beginning of the period and held for the entire period from September 1, 2018 through February 28, 2019, which represents a period of 181 days in a 365-day year.
Actual Expenses — The first line under each share class in the table below provides information about actual account values and actual expenses. You may use the information in this line, together with the amount you invested, to estimate the expenses that you paid over the period. Simply divide your account value by $1,000 (for example, an $8,600 account value divided by $1,000=8.6), then multiply the result by the number in the first line under the column heading entitled “Expenses Paid” to estimate the expenses you paid on your account during this period.
Hypothetical Example for Comparison Purposes —The second line under each share class in the table below provides information about hypothetical account values and hypothetical expenses based on the Funds’ actual net expense ratios and an assumed rate of return of 5% per year before expenses, which is not the Funds’ actual return. The hypothetical account values and expenses may not be used to estimate the actual ending account balance or expenses you paid for the period. You may use this information to compare the ongoing costs of investing in the Funds and other funds. To do so, compare this 5% hypothetical example with the 5% hypothetical examples that appear in the shareholder reports of the other funds.
Please note that the expenses shown in the table are meant to highlight your ongoing costs only and do not reflect any transactional costs, such as sales charges, redemption fees, or exchange fees. Therefore, the second line of the table is useful in comparing ongoing costs only, and will not help you determine the relative total costs of owning different funds. In addition, if these transactional costs were included, your costs would have been higher.
128
GOLDMAN SACHS FUNDS — FINANCIAL SQUARE FUNDS
Fund Expenses — Six Month Period Ended February 28, 2019 (Unaudited) (continued)
| | | | | | | | | | | | | | | | | | | | | | | | | | | | | | | | | | | | |
| | | Federal Instruments Fund | | | Government Fund | | | Money Market Fund | |
| Share Class | | Beginning
Account
Value 9/1/18 | | | Ending
Account
Value
2/28/19 | | | Expenses
Paid for the
6 months ended
2/28/19* | | | Beginning
Account
Value 9/1/18 | | | Ending
Account
Value
2/28/19 | | | Expenses
Paid for the
6 months ended
2/28/19* | | | Beginning
Account
Value 9/1/18 | | | Ending
Account
Value
2/28/19 | | | Expenses
Paid for the
6 months ended
2/28/19* | |
| Institutional Shares | | | | | | | | | | | | | | | | | | | | | | | | | | | | | | | | | | | | |
Actual | | $ | 1,000.00 | | | $ | 1,010.46 | | | $ | 0.95 | | | $ | 1,000.00 | | | $ | 1,010.68 | | | $ | 0.90 | | | $ | 1,000.00 | | | $ | 1,012.31 | | | $ | 0.60 | |
Hypothetical (5% return before expenses) | | | 1,000.00 | | | | 1,023.85 | + | | | 0.95 | | | | 1,000.00 | | | | 1,023.90 | + | | | 0.90 | | | | 1,000.00 | | | | 1,024.20 | + | | | 0.60 | |
| Select Shares | | | | | | | | | | | | | | | | | | | | | | | | | | | | | | | | | | | | |
Actual | | | 1,000.00 | | | | 1,010.31 | | | | 1.10 | | | | 1,000.00 | | | | 1,010.53 | | | | 1.05 | | | | 1,000.00 | | | | 1,012.16 | | | | 0.75 | |
Hypothetical (5% return before expenses) | | | 1,000.00 | | | | 1,023.70 | + | | | 1.10 | | | | 1,000.00 | | | | 1,023.75 | + | | | 1.05 | | | | 1,000.00 | | | | 1,024.05 | + | | | 0.75 | |
| Preferred Shares | | | | | | | | | | | | | | | | | | | | | | | | | | | | | | | | | | | | |
Actual | | | 1,000.00 | | | | 1,009.96 | | | | 1.45 | | | | 1,000.00 | | | | 1,010.18 | | | | 1.40 | | | | 1,000.00 | | | | 1,011.81 | | | | 1.10 | |
Hypothetical (5% return before expenses) | | | 1,000.00 | | | | 1,023.36 | + | | | 1.45 | | | | 1,000.00 | | | | 1,023.41 | + | | | 1.40 | | | | 1,000.00 | | | | 1,023.70 | + | | | 1.10 | |
| Capital Shares | | | | | | | | | | | | | | | | | | | | | | | | | | | | | | | | | | | | |
Actual | | | 1,000.00 | | | | 1,009.71 | | | | 1.69 | | | | 1,000.00 | | | | 1,009.93 | | | | 1.64 | | | | 1,000.00 | | | | 1,011.46 | | | | 1.35 | |
Hypothetical (5% return before expenses) | | | 1,000.00 | | | | 1,023.11 | + | | | 1.71 | | | | 1,000.00 | | | | 1,023.16 | + | | | 1.66 | | | | 1,000.00 | | | | 1,023.46 | + | | | 1.35 | |
| Administration Shares | | | | | | | | | | | | | | | | | | | | | | | | | | | | | | | | | | | | |
Actual | | | 1,000.00 | | | | 1,009.21 | | | | 2.19 | | | | 1,000.00 | | | | 1,009.43 | | | | 2.14 | | | | 1,000.00 | | | | 1,010.96 | | | | 1.84 | |
Hypothetical (5% return before expenses) | | | 1,000.00 | | | | 1,022.61 | + | | | 2.21 | | | | 1,000.00 | | | | 1,022.66 | + | | | 2.16 | | | | 1,000.00 | | | | 1,022.96 | + | | | 1.86 | |
| Premier Shares | | | | | | | | | | | | | | | | | | | | | | | | | | | | | | | | | | | | |
Actual | | | 1,000.00 | | | | 1,008.71 | | | | 2.69 | | | | 1,000.00 | | | | 1,008.93 | | | | 2.64 | | | | 1,000.00 | | | | 1,010.36 | | | | 2.39 | |
Hypothetical (5% return before expenses) | | | 1,000.00 | | | | 1,022.12 | + | | | 2.71 | | | | 1,000.00 | | | | 1,022.17 | + | | | 2.66 | | | | 1,000.00 | | | | 1,022.41 | + | | | 2.41 | |
| Service Shares | | | | | | | | | | | | | | | | | | | | | | | | | | | | | | | | | | | | |
Actual | | | 1,000.00 | | | | 1,007.96 | | | | 3.44 | | | | 1,000.00 | | | | 1,008.18 | | | | 3.39 | | | | 1,000.00 | | | | 1,009.71 | | | | 3.09 | |
Hypothetical (5% return before expenses) | | | 1,000.00 | | | | 1,021.37 | + | | | 3.46 | | | | 1,000.00 | | | | 1,021.42 | + | | | 3.41 | | | | 1,000.00 | | | | 1,021.72 | + | | | 3.11 | |
| Class A Shares | | | | | | | | | | | | | | | | | | | | | | | | | | | | | | | | | | | | |
Actual | | | N/A | | | | N/A | | | | N/A | | | | 1,000.00 | | | | 1,009.43 | | | | 2.14 | | | | N/A | | | | N/A | | | | N/A | |
Hypothetical (5% return before expenses) | | | N/A | | | | N/A | | | | N/A | | | | 1,000.00 | | | | 1,022.66 | + | | | 2.16 | | | | N/A | | | | N/A | | | | N/A | |
| Class C Shares | | | | | | | | | | | | | | | | | | | | | | | | | | | | | | | | | | | | |
Actual | | | N/A | | | | N/A | | | | N/A | | | | 1,000.00 | | | | 1,005.69 | | | | 5.87 | | | | N/A | | | | N/A | | | | N/A | |
Hypothetical (5% return before expenses) | | | N/A | | | | N/A | | | | N/A | | | | 1,000.00 | | | | 1,018.94 | + | | | 5.91 | | | | N/A | | | | N/A | | | | N/A | |
| Resource Shares | | | | | | | | | | | | | | | | | | | | | | | | | | | | | | | | | | | | |
Actual | | | N/A | | | | N/A | | | | N/A | | | | 1,000.00 | | | | 1,007.44 | | | | 4.13 | | | | 1,000.00 | | | | 1,008.96 | | | | 2.39 | |
Hypothetical (5% return before expenses) | | | N/A | | | | N/A | | | | N/A | | | | 1,000.00 | | | | 1,020.68 | + | | | 4.16 | | | | 1,000.00 | | | | 1,022.41 | + | | | 2.41 | |
| Cash Management Shares | | | | | | | | | | | | | | | | | | | | | | | | | | | | | | | | | | | | |
Actual | | | 1,000.00 | | | | 1,006.46 | | | | 4.93 | | | | 1,000.00 | | | | 1,006.69 | | | | 4.88 | | | | 1,000.00 | | | | 1,008.11 | | | | 4.18 | |
Hypothetical (5% return before expenses) | | | 1,000.00 | | | | 1,019.89 | + | | | 4.96 | | | | 1,000.00 | | | | 1,019.93 | + | | | 4.91 | | | | 1,000.00 | | | | 1,020.63 | + | | | 4.21 | |
| Class R6 Shares | | | | | | | | | | | | | | | | | | | | | | | | | | | | | | | | | | | | |
Actual | | | N/A | | | | N/A | | | | N/A | | | | 1,000.00 | | | | 1,010.68 | | | | 0.90 | | | | N/A | | | | N/A | | | | N/A | |
Hypothetical (5% return before expenses) | | | N/A | | | | N/A | | | | N/A | | | | 1,000.00 | | | | 1,023.90 | + | | | 0.90 | | | | N/A | | | | N/A | | | | N/A | |
| * | | Expenses for each share class are calculated using each Fund’s annualized net expense ratio for each class, which represents the ongoing expenses as a percentage of net assets for the six months ended February 28, 2019. Expenses are calculated by multiplying the annualized net expense ratio by the average account value for the period; then multiplying the result by the number of days in the most recent fiscal half year; and then dividing that result by the number of days in the fiscal year. The annualized net expense ratios for the period were as follows: |
| | | | | | | | | | | | | | | | | | | | | | | | | | | | | | | | | | | | | | | | | | | | | | | | |
| Fund | | Institutional
Shares | | | Select
Shares | | | Preferred
Shares | | | Capital
Shares | | | Administration
Shares | | | Premier
Shares | | | Service
Shares | | | Class A
Shares | | | Class C
Shares | | | Resource
Shares | | | Cash
Management
Shares | | | Class R6
Shares | |
Federal Instruments | | | 0.19 | % | | | 0.22 | % | | | 0.29 | % | | | 0.34 | % | | | 0.44 | % | | | 0.54 | % | | | 0.69 | % | | | N/A | | | | N/A | | | | N/A | | | | 0.99 | % | | | N/A | |
Government | | | 0.18 | | | | 0.21 | | | | 0.28 | | | | 0.33 | | | | 0.43 | | | | 0.53 | | | | 0.68 | | | | 0.43 | % | | | 1.18 | % | | | 0.83 | % | | | 0.98 | | | | 0.18 | % |
Money Market | | | 0.12 | | | | 0.15 | | | | 0.22 | | | | 0.27 | | | | 0.37 | | | | 0.48 | | | | 0.62 | | | | N/A | | | | N/A | | | | 0.48 | | | | 0.84 | | | | N/A | |
| + | | Hypothetical expenses are based on each Fund’s actual annualized net expense ratios and an assumed rate of return of 5% per year before expenses. |
129
GOLDMAN SACHS FUNDS — FINANCIAL SQUARE FUNDS
Fund Expenses — Six Month Period Ended February 28, 2019 (Unaudited) (continued)
| | | | | | | | | | | | | | | | | | | | | | | | | | | | | | | | | | | | |
| | | Prime Obligations Fund | | | Treasury Instruments Fund | | | Treasury Obligations Fund | |
| Share Class | | Beginning
Account
Value 9/1/18 | | | Ending
Account
Value
2/28/19 | | | Expenses
Paid for the
6 months ended
2/28/19* | | | Beginning
Account
Value 9/1/18 | | | Ending
Account
Value
2/28/19 | | | Expenses
Paid for the
6 months ended
2/28/19* | | | Beginning
Account
Value 9/1/18 | | | Ending
Account
Value
2/28/19 | | | Expenses
Paid for the
6 months ended
2/28/19* | |
| Institutional Shares | | | | | | | | | | | | | | | | | | | | | | | | | | | | | | | | | | | | |
Actual | | $ | 1,000.00 | | | $ | 1,012.30 | | | $ | 0.60 | | | $ | 1,000.00 | | | $ | 1,010.44 | | | $ | 1.00 | | | $ | 1,000.00 | | | $ | 1,010.62 | | | $ | 1.00 | |
Hypothetical (5% return before expenses) | | | 1,000.00 | | | | 1,024.20 | + | | | 0.60 | | | | 1,000.00 | | | | 1,023.80 | + | | | 1.00 | | | | 1,000.00 | | | | 1,023.80 | + | | | 1.00 | |
| Select Shares | | | | | | | | | | | | | | | | | | | | | | | | | | | | | | | | | | | | |
Actual | | | 1,000.00 | | | | 1,012.05 | | | | 0.75 | | | | 1,000.00 | | | | 1,010.29 | | | | 1.15 | | | | 1,000.00 | | | | 1,010.47 | | | | 1.15 | |
Hypothetical (5% return before expenses) | | | 1,000.00 | | | | 1,024.05 | + | | | 0.75 | | | | 1,000.00 | | | | 1,023.65 | + | | | 1.15 | | | | 1,000.00 | | | | 1,023.65 | + | | | 1.15 | |
| Preferred Shares | | | | | | | | | | | | | | | | | | | | | | | | | | | | | | | | | | | | |
Actual | | | 1,000.00 | | | | 1,011.70 | | | | 1.10 | | | | 1,000.00 | | | | 1,009.94 | | | | 1.50 | | | | 1,000.00 | | | | 1,010.12 | | | | 1.50 | |
Hypothetical (5% return before expenses) | | | 1,000.00 | | | | 1,023.70 | + | | | 1.10 | | | | 1,000.00 | | | | 1,023.31 | + | | | 1.51 | | | | 1,000.00 | | | | 1,023.31 | + | | | 1.51 | |
| Capital Shares | | | | | | | | | | | | | | | | | | | | | | | | | | | | | | | | | | | | |
Actual | | | 1,000.00 | | | | 1,011.45 | | | | 1.35 | | | | 1,000.00 | | | | 1,009.69 | | | | 1.74 | | | | 1,000.00 | | | | 1,009.87 | | | | 1.74 | |
Hypothetical (5% return before expenses) | | | 1,000.00 | | | | 1,023.46 | + | | | 1.35 | | | | 1,000.00 | | | | 1,023.06 | + | | | 1.76 | | | | 1,000.00 | | | | 1,023.06 | + | | | 1.76 | |
| Administration Shares | | | | | | | | | | | | | | | | | | | | | | | | | | | | | | | | | | | | |
Actual | | | 1,000.00 | | | | 1,010.95 | | | | 1.84 | | | | 1,000.00 | | | | 1,009.19 | | | | 2.24 | | | | 1,000.00 | | | | 1,009.37 | | | | 2.24 | |
Hypothetical (5% return before expenses) | | | 1,000.00 | | | | 1,022.96 | + | | | 1.86 | | | | 1,000.00 | | | | 1,022.56 | + | | | 2.26 | | | | 1,000.00 | | | | 1,022.56 | + | | | 2.26 | |
| Premier Shares | | | | | | | | | | | | | | | | | | | | | | | | | | | | | | | | | | | | |
Actual | | | 1,000.00 | | | | 1,010.55 | | | | 2.39 | | | | 1,000.00 | | | | 1,008.69 | | | | 2.74 | | | | 1,000.00 | | | | 1,008.87 | | | | 2.74 | |
Hypothetical (5% return before expenses) | | | 1,000.00 | | | | 1,022.41 | + | | | 2.41 | | | | 1,000.00 | | | | 1,022.07 | + | | | 2.76 | | | | 1,000.00 | | | | 1,022.07 | + | | | 2.76 | |
| Service Shares | | | | | | | | | | | | | | | | | | | | | | | | | | | | | | | | | | | | |
Actual | | | 1,000.00 | | | | 1,009.70 | | | | 3.09 | | | | 1,000.00 | | | | 1,007.94 | | | | 3.49 | | | | 1,000.00 | | | | 1,008.12 | | | | 3.49 | |
Hypothetical (5% return before expenses) | | | 1,000.00 | | | | 1,021.72 | + | | | 3.11 | | | | 1,000.00 | | | | 1,021.32 | + | | | 3.51 | | | | 1,000.00 | | | | 1,021.32 | + | | | 3.51 | |
| Resource Shares | | | | | | | | | | | | | | | | | | | | | | | | | | | | | | | | | | | | |
Actual | | | 1,000.00 | | | | 1,009.05 | | | | 2.39 | | | | 1,000.00 | | | | 1,007.20 | | | | 2.79 | | | | 1,000.00 | | | | 1,007.37 | | | | 2.79 | |
Hypothetical (5% return before expenses) | | | 1,000.00 | | | | 1,022.41 | + | | | 2.41 | | | | 1,000.00 | | | | 1,022.02 | + | | | 2.81 | | | | 1,000.00 | | | | 1,022.02 | + | | | 2.81 | |
| Cash Management Shares | | | | | | | | | | | | | | | | | | | | | | | | | | | | | | | | | | | | |
Actual | | | 1,000.00 | | | | 1,008.30 | | | | 4.18 | | | | 1,000.00 | | | | 1,006.45 | | | | 4.97 | | | | 1,000.00 | | | | 1,006.63 | | | | 4.98 | |
Hypothetical (5% return before expenses) | | | 1,000.00 | | | | 1,020.63 | + | | | 4.21 | | | | 1,000.00 | | | | 1,019.84 | + | | | 5.01 | | | | 1,000.00 | | | | 1,019.84 | + | | | 5.01 | |
| * | | Expenses for each share class are calculated using each Fund’s annualized net expense ratio for each class, which represents the ongoing expenses as a percentage of net assets for the six months ended February 28, 2019. Expenses are calculated by multiplying the annualized net expense ratio by the average account value for the period; then multiplying the result by the number of days in the most recent fiscal half year; and then dividing that result by the number of days in the fiscal year. The annualized net expense ratios for the period were as follows: |
| | | | | | | | | | | | | | | | | | | | | | | | | | | | | | | | | | | | | | | | | | | | | | | | |
| Fund | | Institutional
Shares | | | Select
Shares | | | Preferred
Shares | | | Capital
Shares | | | Administration
Shares | | | Premier
Shares | | | Service
Shares | | | Class A
Shares | | | Class C
Shares | | | Resource
Shares | | | Cash
Management
Shares | | | Class R6
Shares | |
Prime Obligations | | | 0.12 | % | | | 0.15 | % | | | 0.22 | % | | | 0.27 | % | | | 0.37 | % | | | 0.48 | % | | | 0.62 | % | | | N/A | | | | N/A | | | | 0.48 | % | | | 0.84 | % | | | N/A | |
Treasury Instruments | | | 0.20 | | | | 0.23 | | | | 0.30 | | | | 0.35 | | | | 0.45 | | | | 0.55 | | | | 0.70 | | | | N/A | | | | N/A | | | | 0.56 | | | | 1.00 | | | | N/A | |
Treasury Obligations | | | 0.20 | | | | 0.23 | | | | 0.30 | | | | 0.35 | | | | 0.45 | | | | 0.55 | | | | 0.70 | | | | N/A | | | | N/A | | | | 0.56 | | | | 1.00 | | | | N/A | |
| + | | Hypothetical expenses are based on each Fund’s actual annualized net expense ratios and an assumed rate of return of 5% per year before expenses. |
130
GOLDMAN SACHS FUNDS — FINANCIAL SQUARE FUNDS
Fund Expenses — Six Month Period Ended February 28, 2019 (Unaudited) (continued)
| | | | | | | | | | | | |
| | | Treasury Solutions Fund | |
| Share Class | | Beginning
Account
Value 9/1/18 | | | Ending
Account
Value
2/28/19 | | | Expenses
Paid for the
6 months ended
2/28/19* | |
| Institutional Shares | | | | | | | | | | | | |
Actual | | $ | 1,000.00 | | | $ | 1,010.48 | | | $ | 1.00 | |
Hypothetical (5% return before expenses) | | | 1,000.00 | | | | 1,023.80 | + | | | 1.00 | |
| Select Shares | | | | | | | | | | | | |
Actual | | | 1,000.00 | | | | 1,010.33 | | | | 1.15 | |
Hypothetical (5% return before expenses) | | | 1,000.00 | | | | 1,023.65 | + | | | 1.15 | |
| Preferred Shares | | | | | | | | | | | | |
Actual | | | 1,000.00 | | | | 1,009.98 | | | | 1.50 | |
Hypothetical (5% return before expenses) | | | 1,000.00 | | | | 1,023.31 | + | | | 1.51 | |
| Capital Shares | | | | | | | | | | | | |
Actual | | | 1,000.00 | | | | 1,009.73 | | | | 1.74 | |
Hypothetical (5% return before expenses) | | | 1,000.00 | | | | 1,023.06 | + | | | 1.76 | |
| Administration Shares | | | | | | | | | | | | |
Actual | | | 1,000.00 | | | | 1,009.23 | | | | 2.24 | |
Hypothetical (5% return before expenses) | | | 1,000.00 | | | | 1,022.56 | + | | | 2.26 | |
| Premier Shares | | | | | | | | | | | | |
Actual | | | 1,000.00 | | | | 1,008.73 | | | | 2.74 | |
Hypothetical (5% return before expenses) | | | 1,000.00 | | | | 1,022.07 | + | | | 2.76 | |
| Service Shares | | | | | | | | | | | | |
Actual | | | 1,000.00 | | | | 1,007.98 | | | | 3.49 | |
Hypothetical (5% return before expenses) | | | 1,000.00 | | | | 1,021.32 | + | | | 3.51 | |
| Resource Shares | | | | | | | | | | | | |
Actual | | | 1,000.00 | | | | 1,007.23 | | | | 2.79 | |
Hypothetical (5% return before expenses) | | | 1,000.00 | | | | 1,022.02 | + | | | 2.81 | |
| Cash Management Shares | | | | | | | | | | | | |
Actual | | | 1,000.00 | | | | 1,006.48 | | | | 4.97 | |
Hypothetical (5% return before expenses) | | | 1,000.00 | | | | 1,019.84 | + | | | 5.01 | |
| * | | Expenses for each share class are calculated using each Fund’s annualized net expense ratio for each class, which represents the ongoing expenses as a percentage of net assets for the six months ended February 28, 2019. Expenses are calculated by multiplying the annualized net expense ratio by the average account value for the period; then multiplying the result by the number of days in the most recent fiscal half year; and then dividing that result by the number of days in the fiscal year. The annualized net expense ratios for the period were as follows: |
| | | | | | | | | | | | | | | | | | | | | | | | | | | | | | | | | | | | | | | | | | | | | | | | |
| Fund | | Institutional
Shares | | | Select
Shares | | | Preferred
Shares | | | Capital
Shares | | | Administration
Shares | | | Premier
Shares | | | Service
Shares | | | Class A
Shares | | | Class C
Shares | | | Resource
Shares | | | Cash
Management
Shares | | | Class R6
Shares | |
Treasury Solutions | | | 0.20 | % | | | 0.23 | % | | | 0.30 | % | | | 0.35 | % | | | 0.45 | % | | | 0.55 | % | | | 0.70 | % | | | N/A | | | | N/A | | | | 0.56 | % | | | 1.00 | % | | | N/A | |
| + | | Hypothetical expenses are based on each Fund’s actual annualized net expense ratios and an assumed rate of return of 5% per year before expenses. |
131
FUNDS PROFILE
Goldman Sachs Funds
Goldman Sachs is a premier financial services firm, known since 1869 for creating thoughtful and customized investment solutions in complex global markets.
Today, theInvestment Management Division of Goldman Sachs serves a diverse set of clients worldwide, including private institutions, public entities and individuals. With approximately $1.34 trillion in assets under supervision as of December 31, 2018, Goldman Sachs Asset Management (“GSAM”) has portfolio management teams located around the world and our investment professionals bring firsthand knowledge of local markets to every investment decision. Assets under supervision includes assets under management and other client assets for which Goldman Sachs does not have full discretion. GSAM leverages the resources of Goldman Sachs & Co. LLC subject to legal, internal and regulatory restrictions.
Money Market
Financial Square FundsSM
| ∎ | | Financial Square Treasury Solutions Fund1 |
| ∎ | | Financial Square Government Fund1 |
| ∎ | | Financial Square Money Market Fund2 |
| ∎ | | Financial Square Prime Obligations Fund2 |
| ∎ | | Financial Square Treasury Instruments Fund1 |
| ∎ | | Financial Square Treasury Obligations Fund1 |
| ∎ | | Financial Square Federal Instruments Fund1 |
Investor FundsSM
| ∎ | | Investor Money Market Fund3 |
| ∎ | | InvestorTax-Exempt Money Market Fund3 |
Fixed Income
Short Duration and Government
| ∎ | | High Quality Floating Rate Fund |
| ∎ | | Short-Term Conservative Income Fund |
| ∎ | | Short Duration Government Fund |
| ∎ | | Short Duration Income Fund |
| ∎ | | Inflation Protected Securities Fund |
Multi-Sector
Municipal andTax-Free
| ∎ | | High Yield Municipal Fund |
| ∎ | | Dynamic Municipal Income Fund |
| ∎ | | Short DurationTax-Free Fund |
Single Sector
| ∎ | | Investment Grade Credit Fund |
| ∎ | | High Yield Floating Rate Fund |
| ∎ | | Emerging Markets Debt Fund |
| ∎ | | Local Emerging Markets Debt Fund |
Fixed Income Alternatives
| ∎ | | Long Short Credit Strategies Fund |
Fundamental Equity
| ∎ | | Small/Mid Cap Value Fund |
| ∎ | | Small/Mid Cap Growth Fund |
| ∎ | | Concentrated Growth Fund |
| ∎ | | Technology Opportunities Fund |
| ∎ | | Growth Opportunities Fund |
| ∎ | | Rising Dividend Growth Fund |
Tax-Advantaged Equity
| ∎ | | U.S.Tax-Managed Equity Fund |
| ∎ | | InternationalTax-Managed Equity Fund |
| ∎ | | U.S. Equity Dividend and Premium Fund |
| ∎ | | International Equity Dividend and Premium Fund |
Equity Insights
| ∎ | | Small Cap Equity Insights Fund |
| ∎ | | U.S. Equity Insights Fund |
| ∎ | | Small Cap Growth Insights Fund |
| ∎ | | Large Cap Growth Insights Fund |
| ∎ | | Large Cap Value Insights Fund |
| ∎ | | Small Cap Value Insights Fund |
| ∎ | | International Small Cap Insights Fund |
| ∎ | | International Equity Insights Fund |
| ∎ | | Emerging Markets Equity Insights Fund |
Fundamental Equity International
| ∎ | | International Equity Income Fund |
| ∎ | | International Equity ESG Fund |
| ∎ | | Emerging Markets Equity Fund |
| ∎ | | ESG Emerging Markets Equity Fund |
Select Satellite
| ∎ | | Real Estate Securities Fund |
| ∎ | | International Real Estate Securities Fund |
| ∎ | | Commodity Strategy Fund |
| ∎ | | Global Real Estate Securities Fund |
| ∎ | | Alternative Premia Fund |
| ∎ | | Absolute Return Tracker Fund |
| ∎ | | Managed Futures Strategy Fund |
| ∎ | | MLP Energy Infrastructure Fund |
| ∎ | | Multi-Manager Alternatives Fund |
| ∎ | | Absolute Return Multi-Asset Fund |
| ∎ | | Global Infrastructure Fund |
Total Portfolio Solutions
| ∎ | | Global Managed Beta Fund |
| ∎ | | Multi-ManagerNon-Core Fixed Income Fund |
| ∎ | | Multi-Manager U.S. Dynamic Equity Fund |
| ∎ | | Multi-Manager Global Equity Fund |
| ∎ | | Multi-Manager International Equity Fund |
| ∎ | | Tactical Tilt Overlay Fund |
| ∎ | | Balanced Strategy Portfolio |
| ∎ | | Multi-Manager U.S. Small Cap Equity Fund |
| ∎ | | Multi-Manager Real Assets Strategy Fund |
| ∎ | | Growth and Income Strategy Portfolio |
| ∎ | | Growth Strategy Portfolio |
| ∎ | | Dynamic Global Equity Fund4 |
| ∎ | | Satellite Strategies Portfolio |
| ∎ | | Enhanced Dividend Global Equity Portfolio |
| ∎ | | Tax-Advantaged Global Equity Portfolio |
| ∎ | | Strategic Factor Allocation Fund |
| ∎ | | Target Date 2020 Portfolio |
| ∎ | | Target Date 2025 Portfolio |
| ∎ | | Target Date 2030 Portfolio |
| ∎ | | Target Date 2035 Portfolio |
| ∎ | | Target Date 2040 Portfolio |
| ∎ | | Target Date 2045 Portfolio |
| ∎ | | Target Date 2050 Portfolio |
| ∎ | | Target Date 2055 Portfolio |
| ∎ | | Target Date 2060 Portfolio |
| ∎ | | GQG Partners International Opportunities Fund |
| 1 | | You could lose money by investing in the Fund. Although the Fund seeks to preserve the value of your investment at $1.00 per share, it cannot guarantee it will do so. An investment in the Fund is not a deposit of a bank and is not insured or guaranteed by the Federal Deposit Insurance Corporation or any other government agency. The Fund’s sponsor has no legal obligation to provide financial support to the Fund, and you should not expect that the sponsor will provide financial support to the Fund at any time. |
| 2 | | You could lose money by investing in the Fund. Because the share price of the Fund will fluctuate, when you sell your shares they may be worth more or less than what you originally paid for them. The Fund may impose a fee upon sale of your shares or may temporarily suspend your ability to sell shares if the Fund’s liquidity falls below required minimums because of market conditions or other factors. An investment in the Fund is not a deposit of a bank and is not insured or guaranteed by the Federal Deposit Insurance Corporation or any other government agency. The Fund’s sponsor has no legal obligation to provide financial support to the Fund, and you should not expect that the sponsor will provide financial support to the Fund at any time. |
| 3 | | You could lose money by investing in the Fund. Although the Fund seeks to preserve the value of your investment at $1.00 per share, it cannot guarantee it will do so. The Fund may impose a fee upon sale of your shares or may temporarily suspend your ability to sell shares if the Fund’s liquidity falls below required minimums because of market conditions or other factors. An investment in the Fund is not a deposit of a bank and is not insured or guaranteed by the Federal Deposit Insurance Corporation or any other government agency. The Fund’s sponsor has no legal obligation to provide financial support to theFund, and you should not expect that the sponsor will provide financial support to the Fund at any time. |
| 4 | | Effective after the close of business on February 28, 2019, the Goldman Sachs Equity Growth Strategy Portfolio was renamed the Goldman Sachs Dynamic Global Equity Fund. |
Financial Square FundsSM and Investor FundsSM are registered service marks of Goldman Sachs & Co. LLC.
| * | | This list coversopen-end funds only. Please visit our website at www.GSAMFUNDS.com to learn about ourclosed-end funds andexchange-traded funds. |
| | |
TRUSTEES Jessica Palmer,Chair Kathryn A. Cassidy Diana M. Daniels James A. McNamara Roy W. Templin Gregory G. Weaver | | OFFICERS James A. McNamara,President Scott M. McHugh,Treasurer, Senior Vice President and Principal Financial Officer Joseph F. DiMaria,Assistant Treasurerand Principal Accounting Officer Caroline L. Kraus,Secretary |
| |
GOLDMAN SACHS & CO. LLC Distributor and Transfer Agent | | GOLDMAN SACHS ASSET MANAGEMENT, L.P. Investment Adviser |
Visit our web site atwww.GSAMFUNDS.com to obtain the most recentmonth-end returns.
Goldman Sachs Asset Management, L.P., 200 West Street, New York, New York 10282
Economic and market forecasts presented herein reflect our judgment as of the date of this presentation and are subject to change without notice. These forecasts do not take into account the specific investment objectives, restrictions, tax and financial situation or other needs of any specific client. Actual data will vary and may not be reflected here. These forecasts are subject to high levels of uncertainty that may affect actual performance. Accordingly, these forecasts should be viewed as merely representative of a broad range of possible outcomes. These forecasts are estimated, based on assumptions, and are subject to significant revision and may change materially as economic and market conditions change. Goldman Sachs has no obligation to provide updates or changes to these forecasts. Case studies and examples are for illustrative purposes only.
The portfolio risk management process includes an effort to monitor and manage risk, but does not imply low risk The reports concerning the Funds included in this shareholder report may contain certain forward-looking statements about the factors that may affect the performance of the Funds in the future. These statements are based on Fund management’s predictions and expectations concerning certain future events and their expected impact on the Funds, such as performance of the economy as a whole and of specific industry sectors, changes in the levels of interest rates, the impact of developing world events, and other factors that may influence the future performance of the Funds. Management believes these forward-looking statements to be reasonable, although they are inherently uncertain and difficult to predict. Actual events may cause adjustments in portfolio management strategies from those currently expected to be employed.
A description of the policies and procedures that the Funds use to determine how to vote proxies relating to portfolio securities and information regarding how a Fund voted proxies relating to portfolio securities during the most recent12-month period ended June 30 is available (i) without charge, upon request by calling1-800-526-7384 (for shareholders of Class A Shares or Class C Shares) or1-800-621-2550 (for shareholders of all other share classes of a Fund); and (ii) on the Securities and Exchange Commission (“SEC”) web site at http://www.sec.gov.
The Funds file their complete schedule of portfolio holdings with the SEC for the first and third quarters of each fiscal year on FormN-Qs. The Funds’ FormN-Qs are available on the SEC’s web site at http://www.sec.gov within 60 days after the Funds’ first and third fiscal quarters. FormN-Qs may be obtained upon request and without charge by calling1-800-526-7384 (for shareholders of Class A Shares or Class C Shares) or1-800-621-2550 (for shareholders of all other share classes of a Fund).
Goldman Sachs & Co. LLC (“Goldman Sachs’’) does not provide legal, tax or accounting advice. Any statement contained in this communication (including any attachments) concerning U.S. tax matters was not intended or written to be used, and cannot be used, for the purpose of avoiding penalties under the Internal Revenue Code, and was written to support the promotion or marketing of the transaction(s) or matter(s) addressed. Clients of Goldman Sachs should obtain their own independent tax advice based on their particular circumstances. Fund holdings and allocations shown are as of February 28, 2019 and may not be representative of future investments. Fund holdings should not be relied on in making investment decisions and should not be construed as research or investment advice regarding particular securities. Current and future holdings are subject to risk.
Financial Square FundsSM is a registered service mark of Goldman Sachs & Co LLC.
This material is not authorized for distribution to prospective investors unless preceded or accompanied by a current Prospectus or summary prospectus, if applicable. Investors should consider a Fund’s objective, risks, and charges and expenses, and read the summary prospectus, if available, and/or the Prospectus carefully before investing or sending money. The summary prospectus, if available, and the Prospectus contain this and other information about a Fund and may be obtained from your Intermediary or from Goldman Sachs & Co LLC by calling (Class A Shares or Class C Shares –1-800-526-7384) (all other share classes –1-800-621-2550).
© 2019 Goldman Sachs. All rights reserved. 162571-OTU-960927 FSQSAR-19/97K
Goldman Sachs Funds

| | | | |
| | |
| Semi-Annual Report | | | | February 28, 2019 |
| | |
| | | | Fundamental Equity Growth Funds |
| | | | Blue Chip |
| | | | Capital Growth |
| | | | Concentrated Growth |
| | | | Flexible Cap |
| | | | Growth Opportunities |
| | | | Small/Mid Cap Growth |
| | | | Strategic Growth |
| | | | Technology Opportunities |
It is our intention that beginning on January 1, 2021, paper copies of the Funds’ annual and semi-annual shareholder reports will no longer be sent by mail, unless you specifically request paper copies of the reports from a Fund or from your financial intermediary. Instead, the reports will be made available on a website, and you will be notified by mail each time a report is posted and provided with a website link to access the report.
If you already elected to receive shareholder reports electronically, you will not be affected by this change and you need not take any action. At any time, you may elect to receive reports and certain communications from a Fund electronically by calling the applicable toll-free number below or by contacting your financial intermediary.
You may elect to receive all future shareholder reports in paper free of charge. If you hold shares of a Fund directly with the Fund’s transfer agent, you can inform the transfer agent that you wish to receive paper copies of reports by calling toll-free 800-621-2550 for Institutional, Service, Class R6 and Class P shareholders or 800-526-7384 for all other shareholders. If you hold shares of a Fund through a financial intermediary, please contact your financial intermediary to make this election. Your election to receive reports in paper will apply to all Goldman Sachs Funds held in your account if you invest through your financial intermediary or all Goldman Sachs Funds held with the Funds’ transfer agent if you invest directly with the transfer agent.

Goldman Sachs Fundamental Equity Growth Funds
| ∎ | | TECHNOLOGY OPPORTUNITIES |
| | | | |
| | | |
| NOT FDIC-INSURED | | May Lose Value | | No Bank Guarantee |
GOLDMAN SACHS FUNDAMENTAL EQUITY GROWTH FUNDS
What Differentiates the Goldman Sachs Growth Strategies’ Investment Process?
For over 30 years, the Goldman Sachs Growth Strategies has consistently applied a three-step investment process based on our belief that wealth is created through the long-term ownership of growing businesses.


| ∎ | | Make decisions as long-term business owners rather than as stock traders |
| ∎ | | Perform in-depth, fundamental research |
| ∎ | | Focus on long-term structural and competitive advantages |
Result
Performance driven by the compounding growth of businesses over time — not short-term market movements
Long-term participation in growing businesses — less reliance on macroeconomic predictions, market timing, sector rotation or momentum

Identify what we believe to be high quality growth businesses. Some investment criteria may include:
| ∎ | | Recurring revenue streams |
| ∎ | | Length of product life cycle |
| ∎ | | Long-term growth prospects |
Result
Investments in businesses that we believe are strategically positioned for consistent, sustainable long-term growth

| ∎ | | Perform rigorous valuation analysis of every potential investment |
| ∎ | | Use valuation tools and analytics to determine whether the business franchises we consider high-quality also represent sound investments |
Result
Reasoned investment decisions based on our understanding of what each business is worth
Relatively attractive buying opportunities as the stock prices of quality growth businesses fluctuate over time
1
MARKET REVIEW
Goldman Sachs Fundamental Equity Growth Funds
Market Review
Overall, U.S. equities lost ground during the six months ended February 28, 2019 (the “Reporting Period”). The last few months of 2018 were challenging for equities, with markets declining due to investor fears of a Federal Reserve (“Fed”) policy mistake and a global growth slowdown in both corporate earnings and economic data. The tumultuous fourth quarter of 2018 was unable to be overcome by a strong rally in the first two months of the new year, which was driven by oversold equity market conditions, better than consensus anticipated corporate earnings growth and steady macroeconomic data. The Standard & Poor’s 500 Index (the “S&P 500 Index”) ended the Reporting Period with a return of -3.04%. The Russell 3000® Index generated a return of -3.51%.
U.S. equities inched higher as the Reporting Period began in September 2018, driven by robust U.S. macroeconomic data relative to other developed markets and to emerging markets. Against a backdrop of solid economic growth, near-target inflation and healthy monthly job gains, the Fed raised interest rates by 25 basis points, in line with market expectations. (A basis point is 1/100th of a percentage point.) The successful outcome of North American Free Trade Agreement negotiations to its new incarnation as the United States-Mexico-Canada Agreement near month end was also supportive of market sentiment. U.S. equities then fell in October 2018, as investor sentiment rapidly deteriorated on escalating trade and political uncertainty and in a delayed response to an earlier sell-off in global rates. The correction resulted in tighter U.S. financial conditions, which had been resilient to Fed interest rate hikes earlier in the calendar year. U.S. equities saw a reprieve in November 2018 on more accommodative comments from Fed Chair Jerome Powell and encouraging progress in U.S.-China trade talks. However, the recovery was short-lived. U.S. equities subsequently plunged in December 2018 on renewed investor fears sparked by the arrest of a Chinese technology executive, a partial U.S. Federal government shutdown, the U.S. President’s criticism of Fed Chair Powell and reignited corporate earnings growth concerns. The Fed raised interest rates by another 25 basis points.
In January 2019, dovish Fed commentary indicating a pause in its hiking cycle, headlines of easing trade tensions and strong corporate earnings propelled U.S. equities higher despite the ongoing U.S. government shutdown and decelerating emerging market demand. (Dovish commentary tends to suggest lower interest rates; opposite of hawkish.) Investor sentiment improved as the release of generally healthy U.S. economic data and corporate earnings suggested that U.S. equity markets had likely oversold at the end of 2018. Toward month end, U.S. equities were supported by a resolution to the long-lasting U.S. government shutdown. The Fed kept its monetary policy unchanged at its January meeting and delivered dovish tilts, including the statement it would be “patient” and a description of inflationary pressures as “muted.”
The U.S. equity market rally continued in February 2019, as corporate earnings growth remained solid, surpassing consensus expectations, which had been reduced at the end of 2018. Investors also rallied around news the deadline for further U.S. tariffs on Chinese goods would be extended given promising developments in deal negotiations. The Fed reaffirmed its dovish tone, announcing its intention to conclude its balance sheet unwind in the near future. (The Fed unwinds, or shrinks, its balance sheet by selling securities on its balance sheet and/or not reinvesting maturing securities.) Additionally, U.S. equity markets were positively surprised by the 2.6% Gross Domestic Product (“GDP”) growth rate for the fourth quarter of 2018 reported at the end of the month. In further evidence of economic strength, U.S. unemployment remained low at 4.0%, and private payrolls grew by 296,000, beating the consensus estimate by 90,000.
2
MARKET REVIEW
For the Reporting Period overall, utilities, real estate and consumer staples, traditionally considered more defensive sectors, were the best performing sectors in the S&P 500 Index. The weakest performing sectors in the S&P 500 Index were energy, materials and information technology, each considered a more economically-sensitive cyclical sector.
Within the U.S. equity market, all capitalization segments posted single-digit negative absolute returns, but on a relative basis, mid-cap stocks, as measured by the Russell Midcap® Index, performed best, followed closely by large-cap stocks, as measured by the Russell 1000® Index, and then, at some distance, by small-cap stocks, as measured by the Russell 2000® Index. From a style perspective, value-oriented stocks outpaced growth-oriented stocks within the large-cap segment of the U.S. equity market, but growth outperformed value within the mid-cap segment, and performance within the small-cap segment was rather similar between the two styles. (All as measured by the FTSE Russell indices.)
Looking Ahead
Amidst an environment of positive but moderating corporate earnings growth and economic data, we continued to view U.S. equities at the end of the Reporting Period with measured optimism for the remainder of 2019. We think the risk/reward profile of the broad U.S. equity market had become more positive following the late-2018 sell-off, but that selectivity will likely be increasingly important in the months to come given higher volatility and downside risks involving trade, politics, slowing revenue growth and margin pressures.
A possible driver for U.S. equity returns in the coming months, in our view, revolves around strong growth momentum and generally positive economic data. GDP growth in the U.S. remained above-trend at the end of the Reporting Period, with the gap in GDP per capita growing steadily compared to the rest of both developed and emerging markets. The ISM Manufacturing Index remained firmly in expansionary territory, providing a durable backdrop, in our opinion, for continued GDP growth and U.S. equity returns. A well-rounded U.S. consumer has been another strong point for the U.S. economy, with above-trend consumer spending growth and suppressed levels of delinquency on consumer loans. At the end of the Reporting Period, we viewed smaller-cap equities as possibly the biggest beneficiary of the positive economic backdrop, as they have relatively high revenue exposure to the U.S.
In our view, Fed policy will likely remain a focal point for capital markets, with investors looking for more insights into the dovish pivot the Fed took in the last months of the Reporting Period. If markets continue rapidly appreciating, supported by an uptick in inflation and a tightening of the labor market, the Fed could again shift to a more hawkish stance. Conversely, if markets view the recently dovish Fed policy as a sign of deeper macroeconomic issues, returns could potentially soften.
While many investors are concerned about the late-economic cycle pressures on corporate revenue growth and margin expansion, we continued to see opportunities at the end of the Reporting Period, especially on a stock-specific basis. These pressures could create a greater dispersion of U.S. equity returns that we believe can benefit higher quality companies. We also believe pricing power may be an increasingly important factor in this environment, enabling companies to continue growing margins despite a subdued economic environment.
3
MARKET REVIEW
Regardless of market direction, our fundamental, bottom-up stock selection continues to drive our process, rather than headlines or sentiment. We maintain high conviction in the companies the Funds own and believe they have the potential to outperform relative to the broader market regardless of economic growth conditions. As always, we maintain our focus on seeking companies that we believe will generate long-term growth in today’s ever-changing market conditions.
4
PORTFOLIO RESULTS
Goldman Sachs Blue Chip Fund
Portfolio Composition
The Fund invests, under normal circumstances, at least 80% of its net assets plus any borrowings for investment purposes (measured at the time of purchase) (“Net Assets”) in a diversified portfolio of equity investments of “blue chip” companies. Blue chip companies are companies that, in the view of Goldman Sachs Asset Management, L.P. (the “Investment Adviser”), enjoy strong market positions, seasoned management teams, solid financial fundamentals and high-quality reputations. Although blue chip companies generally have large or medium market capitalizations, the Investment Adviser may invest in companies that it believes have good, long-term prospects to become well-known, established or blue chip companies. The Fund may continue to invest up to 20% of its Net Assets in foreign securities.
Portfolio Management Discussion and Analysis
Below, the Goldman Sachs Fundamental Equity U.S. Equity Team discusses the Goldman Sachs Blue Chip Fund’s (the “Fund”) performance and positioning for the six-month period ended February 28, 2019 (the “Reporting Period”).
| Q | | How did the Fund perform during the Reporting Period? |
| A | | During the Reporting Period, the Fund’s Class A, Class C, Institutional, Investor, Class P, Class R and Class R6 Shares generated cumulative total returns, without sales charges, of-0.51%,-0.86%,-0.31%,-0.36%,-0.35%,-0.59% and-0.30%, respectively. These returns compare to the-3.04% cumulative total return of the Fund’s benchmark, the Standard & Poor’s 500® Index (the “S&P 500 Index”), during the same period. |
| Q | | What key factors were responsible for the Fund’s performance during the Reporting Period? |
| A | | While the Fund posted negative absolute returns, it outperformed the S&P 500 Index on a relative basis during the Reporting Period due primarily to effective stock selection. Sector allocation as a whole detracted from relative performance, albeit modestly. |
| Q | | Which equity market sectors most significantly affected Fund performance? |
| A | | The sectors that contributed most positively to the Fund’s relative performance during the Reporting Period were health care, industrials and consumer discretionary, wherein effective stock selection helped most in each. The only two sectors to detract from the Fund’s relative results during the Reporting Period were utilities and materials. The Fund had no exposure to the strongly performing utilities sector, and both challenging stock selection and having an overweight to the weakly performing materials sector hurt. |
| Q | | What were some of the Fund’s best-performing individual stocks? |
| A | | The Fund benefited most relative to the S&P 500 Index from positions in pharmaceutical company Eli Lilly, medical equipment company Danaher and aerospace and defense company Boeing. |
| | | Eli Lilly’s stock climbed through most of November 2018 after the company reported solid quarterly results in which it beat consensus earnings per share and revenue expectations and also raised guidance for the full year 2018. Then, in December 2018, Eli Lilly shares benefited from the announcement of better than market expected 2019 guidance, featuring significant improvements in revenue growth and long-term sales growth. The company had a volatile month of trading in January 2019, finishing the month in positive territory but lagging the health care sector as well as the broad U.S. equity market. Early on, a negative headline on drug pricing pressured the stock along with that of other pharmaceutical companies. Then news of Eli Lilly’s acquisition of Loxo Oncology, a cancer drug company, helped give a boost to its shares. These gains were quickly erased after a phase 3 soft tissue study did not meet its primary objective, leading the Food and Drug Administration to recommend new patients not start using the drug. All in all, we viewed January 2019 as a month of primarily short-term trading noise that did not alter the underlying fundamentals of the company or why we favor it. At the end of the Reporting Period, we believed the company maintained strong risk/reward prospects versus its peers, and we saw an upside to its diabetes franchise. We were also |
5
PORTFOLIO RESULTS
| | optimistic about its management’s commitment to creating shareholder value through increased dividends and share repurchases. Additionally, we viewed the company’s split with Elanco, its former animal health business segment, as value accretive. Overall, we viewed Eli Lilly as a high quality pharmaceuticals business with leading franchises, a robust drug pipeline and an improving financial profile. |
| | | In November 2018, Danaher’s stock was driven less by company-specific events but rather rose along with the health care equipment industry as a whole. Then, in February 2019, Danaher announced an agreement with General Electric (“GE”) to acquire the biopharmaceutical business of GE Life Sciences. The market’s reception of the deal was overwhelmingly positive, and Danaher’s shares climbed through the end of the month. We were also highly optimistic about the transaction, which makes Danaher the largest player within bioprocessing and gives the company a multi-year value creation opportunity through potential top-line acceleration and cost savings. GE Life Sciences is a high quality asset, and in our opinion, significantly improves Danaher’s positioning within the biopharmaceutical industry. With this in mind, at the end of the Reporting Period, we had renewed confidence that Danaher is a high quality company, led by what we see as an outstanding management team, that generates solid free cash flow and has high barriers to entry in its key business segments. |
| | | Early in January 2019, Boeing announced fourth quarter 2018 and full year 2018 aircraft deliveries that were both slightly higher than market estimates, causing its stock to rise. Then, at the end of the month, Boeing announced strong quarterly earnings results, exceeding market expectations on revenue, earnings per share and, most importantly, cash from operations. Boeing’s stock also reacted to the optimism surrounding trade talks with China throughout February 2019, as a resolution could create a potential order boost. At the end of the Reporting Period, we remained positive on the company’s strong productivity track record, multi-year commercial aircraft backlog and improving prospects in its defense business. We viewed Boeing favorably due to what we considered to be its strong competitive position, robust free cash flow and focus on shareholders through buybacks and distributions. |
| Q | | Which stocks detracted significantly from the Fund’s performance during the Reporting Period? |
| A | | Among those stocks detracting most from the Fund’s results relative to the S&P 500 Index were positions in DowDuPont, which develops materials, chemicals and agricultural products; Pioneer Natural Resources, an oil and gas exploration and production company; and Humana, a health insurance company. |
| | | Most of DowDuPont’s share price decline occurred during the first two months of the Reporting Period. Its share price fell at the end of September 2018 driven both by weakness in the materials and chemicals industries and by negative reports by several analysts. In October 2018, DowDuPont disclosed a $4.6 billion write-down of goodwill*, which was viewed negatively by investors. Despite the decline in the stock, we remained optimistic at the end of the Reporting Period on the company’s ability to unlock operating synergies, decrease costs and deploy cash on high return projects to further improve profitability. Overall, we believed DowDuPont was well positioned to benefit from inflecting cyclical tailwinds across multiple business segments as it works to improve its operations and unlock efficiencies. |
| | | Shares of Pioneer Natural Resources declined in the fourth quarter of 2018 along with the oil market as a whole, which was down sharply during that time. Following the volatility, we felt Pioneer Natural Resources’ valuation had become less attractive, and we decided to exit the position. From our perspective, other large cap energy operators in the Permian Basin have more favorable asset bases as well as management teams better situated to execute moving forward. Thus, we sold the position and reallocated the capital to other names in the energy industry we felt had more favorable risk/return profiles. |
| | | Humana’s stock traded up and down in a volatile fashion throughout the Reporting Period. The first catalyst occurred in November 2018 when Humana reported its third quarter 2018 earnings, in which revenues and earnings came in above consensus expectations, sending the company’s shares higher. These gains were reversed later in the month when news spread regarding a Medicare proposal that would potentially reduce or remove the rebates that managed care |
| | * | | Goodwill impairment is an earnings charge that companies record on their income statements after they identify that there is persuasive evidence that the asset associated with the goodwill can no longer demonstrate financial results that were expected from it at the time of its purchase. Because many companies acquire other firms and pay a price that exceeds the fair value of identifiable assets and liabilities that the acquired firm possesses, the difference between the purchase price and the fair value of acquired assets is recorded as goodwill. However, if unforeseen circumstances arise that decrease expected cash flows from acquired assets, their fair value can be lower than what was originally paid for them, and a company must book a goodwill impairment. |
6
PORTFOLIO RESULTS
| | firms receive from drug makers in an effort to curb excessive drug pricing. Its shares fell again late in February 2019, along with other managed care stocks, as pharmaceutical company executives testified before the U.S. Congress to address criticism over drug pricing. During the hearings, the executives deflected the blame to insurance companies, such as Humana, arguing that the rebates should be eliminated. Given that Humana derives a portion of its revenue from these rebates, we remained somewhat cautious at the end of the Reporting Period, and we intend to continue to monitor developments on this front going forward. That said, at the |
| | end of the Reporting Period, we believed Humana has opportunities for future growth, as we expect it to benefit from Medicare patient growth and aging of our population. |
| Q | | How did the Fund use derivatives and similar instruments during the Reporting Period? |
| A | | During the Reporting Period, we did not use derivatives as part of an active management strategy. |
| Q | | Did the Fund make any significant purchases or sales during the Reporting Period? |
| A | | During the Reporting Period, we initiated a Fund position in health care products company Johnson & Johnson. Its shares had plunged in December 2018 after it was reported its executives knew for decades that its baby powder sometimes tested positive for asbestos. In response, its management dismissed the allegations and said the product is safe and asbestos-free. Given that the stock had its worst day in 16 years, we felt investors had overreacted to the accusations and viewed the sell-off as a buying opportunity. In our view, Johnson & Johnson has a healthy financial profile and diversified suite of growing businesses. It has approximately $20 billion in cash and securities and generated approximately $16 billion in operating cash flow in the first three quarters of 2018 — more than twice dividends paid. Furthermore, the company beat the market’s quarterly earnings estimates during the Reporting Period, with psoriasis treatments and cancer drug sales driving the success, while signature baby products and consumer goods showed signs of improvement. Overall, we view Johnson & Johnson as a high quality health care name and decided to take advantage of what we saw as its attractive valuation on weakness. |
| | | We established a Fund position in oil and gas production company EOG Resources during the Reporting Period. We are highly confident in its management’s ability to execute its long-term strategy. Specifically, we believe its management is focused on creating a business model that can compete against attractive investments in other sectors by demonstrating sustainable growth, free cash flow generation and returns. In other words, it appears that EOG Resources wants to compete not just with energy companies but also with the S&P 500 Index companies broadly. EOG Resources has stated it plans to grow its production and generate returns on capital by double digits, characteristics held by only a select group of S&P 500 companies. |
| | | Conversely, in addition to the sale of Pioneer Natural Resources, mentioned earlier, we exited the Fund’s position in pharmaceutical company Shire during the Reporting Period. In December 2018, it was announced that Takeda Pharmaceutical shareholders voted to approve the company’s acquisition of Shire. Following the approval of the acquisition and the stock’s strong performance, we decided to sell the position and reallocate the capital elsewhere. |
| Q | | Were there any changes to the Fund’s portfolio management team during the Reporting Period? |
| A | | Sean Gallagher, a portfolio manager of the Fund, retired effective September 30, 2018. The Fund continues to be managed by Steven M. Barry and Stephen E. Becker. |
| Q | | Were there any notable changes in the Fund’s weightings during the Reporting Period? |
| A | | In constructing the Fund’s portfolio, we focus on picking stocks rather than on making industry or sector bets. We seek to outpace the benchmark index by overweighting stocks that we expect to outperform and underweighting those that we think may lag. Consequently, changes in its sector weights are generally the direct result of individual stock selection or of stock appreciation or depreciation. That said, during the Reporting Period, the Fund’s exposure to industrials and health care increased and its allocations to information technology and financials decreased compared to the S&P 500 Index. The Fund’s position in cash increased during the Reporting Period. |
| Q | | How was the Fund positioned relative to its benchmark index at the end of February 2019? |
| A | | At the end of February 2019, the Fund had overweighted positions relative to the S&P 500 Index in industrials, health care, communication services and consumer staples. On the same date, the Fund had underweighted positions compared to the S&P 500 Index in financials and information technology and was rather neutrally weighted to the S&P 500 Index in materials, energy, consumer discretionary and real estate. The Fund had no position at all in utilities at the end of the Reporting Period. |
7
FUND BASICS
Blue Chip Fund
as of February 28, 2019
| | | | | | | | | | |
| | PERFORMANCE REVIEW | |
| | | |
| | | September 1, 2018–February 28, 2019 | | Fund Total Return
(based on NAV)1 | | | S&P 500® Index2 | |
| | | |
| | Class A | | | -0.51 | % | | | -3.04 | % |
| | Class C | | | -0.86 | | | | -3.04 | |
| | Institutional | | | -0.31 | | | | -3.04 | |
| | Investor | | | -0.36 | | | | -3.04 | |
| | Class P | | | -0.35 | | | | -3.04 | |
| | Class R | | | -0.59 | | | | -3.04 | |
| | | Class R6 | | | -0.30 | | | | -3.04 | |
| | 1 | | The net asset value (“NAV”) represents the net assets of the class of the Fund (ex-dividend) divided by the total number of shares of the class outstanding. The Fund’s performance reflects the reinvestment of dividends and other distributions. The Fund’s performance does not reflect the deduction of any applicable sales charges. |
| | 2 | | The S&P 500® Index is the Standard & Poor’s 500 Composite Index of 500 stocks, an unmanaged index of common stock prices. The S&P 500® Index figures do not reflect any deduction for fees, expenses or taxes. It is not possible to invest directly in an index. |
| | | | | | | | | | | | | | | | |
| | STANDARDIZED TOTAL RETURNS3 |
| | | | | |
| | | For the period ended 12/31/18 | | One Year | | | Five Years | | | Since Inception | | | Inception Date |
| | | | | |
| | Class A | | | -7.40 | % | | | 4.76 | % | | | 8.96 | % | | 11/30/09 |
| | Class C | | | -3.67 | | | | 5.15 | | | | 8.81 | | | 11/30/09 |
| | Institutional | | | -1.66 | | | | 6.34 | | | | 10.06 | | | 11/30/09 |
| | Investor | | | -1.71 | | | | 6.20 | | | | 9.90 | | | 11/30/09 |
| | Class P | | | N/A | | | | N/A | | | | -3.81 | | | 4/17/18 |
| | Class R | | | -2.22 | | | | 5.69 | | | | 9.36 | | | 11/30/09 |
| | | Class R6 | | | -1.57 | | | | N/A | | | | 4.83 | | | 7/31/15 |
| | 3 | | The Standardized Total Returns are average annual total returns or cumulative total returns (only if the performance period is one year or less) as of the most recent calendar quarter-end. They assume reinvestment of all distributions at NAV. These returns reflect a maximum initial sales charge of 5.5% for Class A Shares and the assumed contingent deferred sales charge for Class C Shares (1% if redeemed within 12 months of purchase). Because Institutional, Investor, Class P, Class R and Class R6 Shares do not involve a sales charge, such a charge is not applied to their Standardized Total Returns. |
The returns set forth in the tables above represent past performance. Past performance does not guarantee future results. The Fund’s investment return and principal value will fluctuate so that an investor’s shares, when redeemed, may be worth more or less than their original cost. Current performance may be lower or higher than the performance quoted above. Please visit our web site at www.GSAMFUNDS.com to obtain the most recent month-end returns.Performance reflects applicable fee waivers and/or expense limitations in effect during the periods shown. In their absence, performance would be reduced. Returns do not reflect the deduction of taxes that a shareholder would pay on Fund distributions or the redemption of Fund shares.
8
FUND BASICS
| | | | | | | | | | | | | | |
| | EXPENSE RATIOS4 | |
| | | | |
| | | | | | | | Net Expense Ratio (Current) | | | Gross Expense Ratio (Before Waivers) | |
| | | | |
| | Class A | | | | | | | 1.03 | % | | | 5.10 | % |
| | Class C | | | | | | | 1.78 | | | | 5.85 | |
| | Institutional | | | | | | | 0.67 | | | | 4.71 | |
| | Investor | | | | | | | 0.78 | | | | 4.85 | |
| | Class P | | | | | | | 0.66 | | | | 4.70 | |
| | Class R | | | | | | | 1.28 | | | | 5.35 | |
| | | Class R6 | | | | | | | 0.66 | | | | 4.70 | |
| | 4 | | The expense ratios of the Fund, both current (net of applicable fee waivers and/or expense limitations) and before waivers (gross of applicable fee waivers and/or expense limitations) are as set forth above according to the most recent publicly available Prospectus for the Fund and may differ from the expense ratios disclosed in the Financial Highlights in this report. Pursuant to a contractual arrangement, the Fund’s waivers and/or expense limitations will remain in place through at least December 28, 2019, and prior to such date the investment adviser may not terminate the arrangements without the approval of the Fund’s Board of Trustees. If these arrangements are discontinued in the future, the expense ratios may change without shareholder approval. |
| | | | | | | | |
| | TOP TEN HOLDINGS AS OF 2/28/195 |
| | | |
| | | Holding | | % of Net Assets | | | Line of Business |
| | | |
| | Microsoft Corp. | | | 4.0 | % | | Software |
| | Visa, Inc. Class A | | | 3.9 | | | IT Services |
| | | |
| | Facebook, Inc. Class A | | | 3.5 | | | Interactive Media & Services |
| | Eli Lilly & Co. | | | 3.4 | | | Pharmaceuticals |
| | Texas Instruments, Inc. | | | 3.4 | | | Semiconductors & Semiconductor
Equipment |
| | Union Pacific Corp. | | | 3.3 | | | Road & Rail |
| | Danaher Corp. | | | 3.2 | | | Health Care Equipment &
Supplies |
| | The Boeing Co. | | | 3.1 | | | Aerospace & Defense |
| | Honeywell International, Inc. | | | 3.1 | | | Industrial Conglomerates |
| | | Walmart, Inc. | | | 3.0 | | | Food & Staples Retailing |
| | 5 | | The top 10 holdings may not be representative of the Fund’s future investments. |
9
FUND BASICS
|
| FUND VS. BENCHMARK SECTOR ALLOCATION6 |
|
| As of February 28, 2019 |
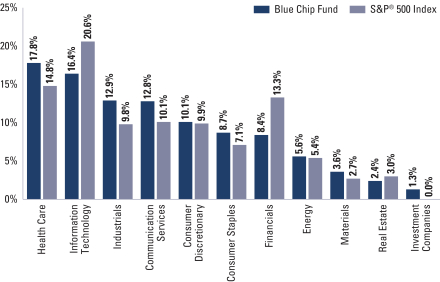
| | 6 | | The Fund is actively managed and, as such, its composition may differ over time. Consequently, the Fund’s overall sector allocations may differ from the percentages contained in the graph above. The graph categorizes investments using the Global Industry Classification Standard (“GICS”), however, the sector classifications used by the portfolio management team may differ from GICS. The percentage shown for each investment category reflects the value of investments in that category as a percentage of market value. The graph depicts the Fund’s investments but may not represent the Fund’s market exposure due to the exclusion of certain derivatives, if any, as listed in the Additional Investment Information section of the Schedule of Investments. |
10
PORTFOLIO RESULTS
Goldman Sachs Capital Growth Fund
Portfolio Composition
The Fund seeks to achieve its investment objective by investing, under normal circumstances, in companies that are considered by the Investment Adviser to be positioned for long-term growth. The Fund invests in both value and growth companies. The Fund’s fundamental equity investment process involves evaluating potential investments based on specific characteristics believed to indicate a high-quality business with sustainable growth, including strong business franchises, favorable long-term prospects, and excellent management.
Portfolio Management Discussion and Analysis
Below, the Goldman Sachs Fundamental Equity U.S. Equity Team discusses the Goldman Sachs Capital Growth Fund’s (the “Fund”) performance and positioning for the six-month period ended February 28, 2019 (the “Reporting Period”).
| Q | | How did the Fund perform during the Reporting Period? |
| A | | During the Reporting Period, the Fund’s Class A, Class C, Institutional, Service, Investor, Class P, Class R and Class R6 Shares generated cumulative total returns, without sales charges, of-3.34%,-3.67%,-3.16%,-3.39%,-3.22%,-3.14%, -3.46% and -3.15%, respectively. These returns compare to the-3.07% cumulative total return of the Fund’s benchmark, the Russell 1000® Index (with dividends reinvested) (the “Russell Index”), during the same period. The Fund’s former benchmark, the Russell 1000® Growth Index, returned-4.52% for the same time period. |
| Q | | What key factors were responsible for the Fund’s performance during the Reporting Period? |
| A | | The Fund underperformed the Russell Index on a relative basis during the Reporting Period due to a combination of stock selection and sector allocation. |
| Q | | Which equity market sectors most significantly affected Fund performance? |
| A | | The sectors that detracted most from the Fund’s relative performance during the Reporting Period were industrials, consumer staples and information technology, wherein stock selection in each dampened results. The sectors that contributed most positively to the Fund’s relative performance during the Reporting Period were health care, communication services and utilities, wherein stock selection in each proved effective. |
| Q | | Which stocks detracted significantly from the Fund’s performance during the Reporting Period? |
| A | | Among those stocks detracting most from the Fund’s results relative to the Russell Index were positions in semiconductor company NVIDIA, transportation and logistics company XPO Logistics and asset management company Affiliated Managers Group. |
| | | NVIDIA’s stock price declined in October 2018 along with the broader semiconductor industry, as international trade tensions and end-market demand concerns weighed on investor sentiment. (End-market is used to indicate where the final transaction takes place in a value chain. Typically it is where the end-user is located, meaning the individual, organization, industry or region for whom the product or service has been created and who is not expected to resell that product or service.) Also, in November 2018, the company reported a miss in earnings primarily due to weak crypto-currency demand, which at one point had accounted for more than 10% of company revenues. However, the remainder of the business, which is driven by cloud, gaming and artificial intelligence, continued to show strong growth. In addition to the earnings-related sell-off, NVIDIA’s stock was under pressure for the majority of the fourth quarter of 2018, along with its semiconductor peers, as concerns around the health of the global economy grew to end the year. Despite the difficult fourth calendar quarter for the company, we believed at the end of the Reporting Period that the underlying long-term fundamentals of the company were still healthy, though we continued to evaluate the macro backdrop. |
| | | While there were no stock-specific reasons for the decline in XPO Logistics’ share price during a volatile October 2018, |
11
PORTFOLIO RESULTS
| | the company, along with others in the industrials and freight industries, underperformed for the month. In mid-December 2018, a hedge fund issued a report that sent XPO Logistics’ shares tumbling more than 26% in one day. We were not particularly troubled by our initial read-through of the analysis but recognized several aspects that warranted follow up. After assessing various factors, we confirmed our previously held view that XPO Logistics’ business was well aligned with the structural changes in the freight industry, such as outsourcing and labor-saving technology,e-commerce exposure and the implementation of electronic logging devices. The market eventually recognized this as well, and its shares recovered all of the losses prompted by the hedge fund report. However, unrelated to the report, XPO Logistics’ stock tumbled in February 2019 after the company released its fourth quarter 2018 earnings report that revealed results below market estimates on earnings per share, revenue and 2019 guidance. Its management cited a reduction in business from its largest client, expressing it would negatively impact its growth for 2019. These developments led us to exit the Fund’s position in XPO Logistics. |
| | | Shares of Affiliated Managers Group came under pressure in the fourth quarter of 2018, as AQR, one of its key affiliates, was experiencing substantial outflows. Investors also had concerns about Affiliated Managers Group’s private equity capital raise coming to an end as well as outflows potentially accelerating in the medium term. While we see positive aspects of the firm, we chose to exit the Fund’s position and reallocate capital to what we see as other high quality investments. |
| Q | | What were some of the Fund’s best-performing individual stocks? |
| A | | Among those stocks the Fund benefited most from relative to the Russell Index were positions in pharmaceutical company Eli Lilly, enterprise software solutions company Red Hat and regional bank Signature Bank. |
| | | Eli Lilly’s stock climbed through most of November 2018 after the company reported solid quarterly results in which it beat consensus earnings per share and revenue expectations and also raised guidance for the full year 2018. Then, in December 2018, Eli Lilly shares benefited from the announcement of better than market expected 2019 guidance, featuring significant improvements in revenue growth and long-term sales growth. The company had a volatile month of trading in January 2019, finishing the month in positive territory but lagging the health care sector as well as the broad U.S. equity market. Early on, a negative headline on drug pricing pressured the stock along with that of other pharmaceutical companies. Then news of Eli Lilly’s acquisition of Loxo Oncology, a cancer drug company, helped give a boost to its shares. These gains were quickly erased after a phase 3 soft tissue study did not meet its primary objective, leading the Food and Drug Administration to recommend new patients not start using the drug. All in all, we viewed January 2019 as a month of primarily short-term trading noise that did not alter the underlying fundamentals of the company or why we favor it. At the end of the Reporting Period, we believed the company maintained strong risk/reward prospects versus its peers, and we saw an upside to its diabetes franchise. We were also optimistic about its management’s commitment to creating shareholder value through increased dividends and share repurchases. Additionally, we viewed the company’s split with Elanco, its former animal health business segment, as value accretive. Overall, we viewed Eli Lilly as a high quality pharmaceuticals business with leading franchises, a robust drug pipeline and an improving financial profile. |
| | | Shares of Red Hat soared in late October 2018 after IBM announced an offer to acquire Red Hat for a significant premium to its market price. This acquisition was in line with our thesis that the software industry is ripe for consolidation. We also believe Red Hat has impressive growth prospects, led mostly by new business, and has solid sales capacity through its partnerships with cloud providers. We were encouraged by this news and continued to monitor developments as both companies work toward finalizing the acquisition. |
| | | The strong performance of Signature Bank’s stock was primarily driven by an earnings report in January 2019 that showed improved earnings per share and revenues in addition to the announcement of a cash dividend. Quarter-over-quarter loan growth was particularly strong as well. At the end of the Reporting Period, we continued to like the stock given what we see as the company’s notable growth opportunities, potential for net interest income expansion and its management’s efforts to grow the regional bank’s deposit base. |
| Q | | How did the Fund use derivatives and similar instruments during the Reporting Period? |
| A | | During the Reporting Period, we did not use derivatives as part of an active management strategy. |
12
PORTFOLIO RESULTS
| Q | | Did the Fund make any significant purchases or sales during the Reporting Period? |
| A | | During the Reporting Period, we initiated a Fund position in multinational consumer goods company Procter & Gamble. We believe the company could start to see an inflection from its recent consolidation, and we remain positive that its price cuts could help improve sales in emerging markets. Additionally, we are confident in its management’s ability to adapt to the changing landscape and various business challenges. We think its innovative pipeline and brand awareness may well lead to continued sales momentum going forward. |
| | | We established a Fund position in Deere & Co. We are positive on the outlook for the company’s largest and most profitable end-market, North American agricultural equipment. We believe the segment is beginning to recover from recent trough levels and that Deere & Co. is well positioned to capitalize on a potential recovery. In our view, the company has a strong balance sheet and robust return on equity. It also saw increased share repurchases in 2018. Overall, we believe Deere & Co. is a high quality company with an attractive outlook. |
| | | Conversely, in addition to the sales already mentioned, we exited the Fund’s position in pharmaceutical company Shire during the Reporting Period. In December 2018, it was announced that Takeda Pharmaceutical shareholders voted to approve the company’s acquisition of Shire. Following the approval of the acquisition and the stock’s strong performance, we decided to sell the position and reallocate the capital elsewhere. |
| Q | | Were there any changes to the Fund’s portfolio management team during the Reporting Period? |
| A | | Sean Gallagher, a portfolio manager of the Fund, retired effective September 30, 2018. The Fund continues to be managed by Steven M. Barry and Stephen E. Becker. |
| Q | | Were there any notable changes in the Fund’s weightings during the Reporting Period? |
| A | | In constructing the Fund’s portfolio, we focus on picking stocks rather than on making industry or sector bets. We seek to outpace the benchmark index by overweighting stocks that we expect to outperform and underweighting those that we think may lag. Consequently, changes in its sector weights are generally the direct result of individual stock selection or of stock appreciation or depreciation. That said, during the Reporting Period, relative to the Russell Index, the Fund’s allocations in information technology and consumer discretionary decreased. The Fund’s position in cash increased during the Reporting Period. |
| Q | | How was the Fund positioned relative to its benchmark index at the end of February 2019? |
| A | | At the end of February 2019, the Fund had overweighted positions relative to the Russell Index in the materials and health care sectors and underweighted positions relative to the Russell Index in the financials, industrials and consumer discretionary sectors. On the same date, the Fund was rather neutrally weighted to the Russell Index in information technology, real estate, consumer staples, energy, utilities and communication services. |
13
FUND BASICS
Capital Growth Fund
as of February 28, 2019
| | | | | | | | | | | | | | |
| | PERFORMANCE REVIEW | |
| | | | |
| | | September 1, 2018–February 28, 2019 | | Fund Total Return
(based on NAV)1 | | | Russell 1000®
Index2 | | | Russell 1000® Growth Index3 | |
| | | | |
| | Class A | | | -3.34 | % | | | -3.07 | % | | | -4.52 | % |
| | Class C | | | -3.67 | | | | -3.07 | | | | -4.52 | |
| | Institutional | | | -3.16 | | | | -3.07 | | | | -4.52 | |
| | Service | | | -3.39 | | | | -3.07 | | | | -4.52 | |
| | Investor | | | -3.22 | | | | -3.07 | | | | -4.52 | |
| | Class P | | | -3.14 | | | | -3.07 | | | | -4.52 | |
| | Class R | | | -3.46 | | | | -3.07 | | | | -4.52 | |
| | | Class R6 | | | -3.15 | | | | -3.07 | | | | -4.52 | |
| | 1 | | The net asset value (“NAV”) represents the net assets of the class of the Fund (ex-dividend) divided by the total number of shares of the class outstanding. The Fund’s performance reflects the reinvestment of dividends and other distributions. The Fund’s performance does not reflect the deduction of any applicable sales charges. |
| | 2 | | The Russell 1000 Index measures the performance of the large-cap segment of the U.S. equity universe. It includes those Russell 1000 Index companies with lower price-to-book ratios and lower expected growth values. The Russell 1000 Index is constructed to provide a comprehensive and unbiased barometer for the large-cap value segment. The Russell 1000 Index is completely reconstituted annually to ensure new and growing equities are included and that the represented companies continue to reflect value characteristics. It is not possible to invest directly in an index. |
| | 3 | | The Russell 1000® Growth Index is an unmanaged index that measures the performance of those Russell 1000® companies with higher price-to-book ratios and higher forecasted growth values. The Russell 1000® Growth Index figures do not reflect any deduction for fees, expenses or taxes. It is not possible to invest directly in an index. |
| | | | | | | | | | | | | | | | | | | | |
| | STANDARDIZED TOTAL RETURNS4 |
| | | | | | |
| | | For the period ended 12/31/18 | | One Year | | | Five Years | | | Ten Years | | | Since Inception | | | Inception Date |
| | | | | | |
| | Class A | | | -8.15 | % | | | 7.41 | % | | | 13.70 | % | | | 9.07 | % | | 4/20/90 |
| | Class C | | | -4.41 | | | | 7.83 | | | | 13.50 | | | | 5.67 | | | 8/15/97 |
| | Institutional | | | -2.39 | | | | 9.06 | | | | 14.80 | | | | 6.87 | | | 8/15/97 |
| | Service | | | -2.92 | | | | 8.52 | | | | 14.23 | | | | 6.35 | | | 8/15/97 |
| | Investor | | | -2.56 | | | | 8.90 | | | | 14.63 | | | | 7.63 | | | 11/30/07 |
| | Class P | | | N/A | | | | N/A | | | | N/A | | | | -7.88 | | | 4/17/18 |
| | Class R | | | -3.03 | | | | 8.36 | | | | 14.06 | | | | 7.10 | | | 11/30/07 |
| | | Class R6 | | | -2.38 | | | | N/A | | | | N/A | | | | 7.22 | | | 7/31/15 |
| | 4The | | Standardized Total Returns are average annual total returns or cumulative total returns (only if the performance period is one year or less) as of the most recent calendar quarter-end. They assume reinvestment of all distributions at NAV. These returns reflect a maximum initial sales charge of 5.5% for Class A Shares and the assumed contingent deferred sales charge for Class C Shares (1% if redeemed within 12 months of purchase). Effective July 30, 2018, Class C Shares convert automatically to Class A Shares on or about the fifteenth day of the last month of the calendar quarter that is ten years after the purchase date. Because Institutional, Service, Investor, Class P, Class R and Class R6 Shares do not involve a sales charge, such a charge is not applied to their Standardized Total Returns. |
The returns set forth in the tables above represent past performance. Past performance does not guarantee future results. The Fund’s investment return and principal value will fluctuate so that an investor’s shares, when redeemed, may be worth more or less than their original cost. Current performance may be lower or higher than the performance quoted above. Please visit our web site at www.GSAMFUNDS.com to obtain the most recent month-end returns.Performance reflects applicable fee waivers and/or expense limitations in effect during the periods shown. In their absence, performance would be reduced. Returns do not reflect the deduction of taxes that a shareholder would pay on Fund distributions or the redemption of Fund shares.
14
FUND BASICS
| | | | | | | | | | |
| | EXPENSE RATIOS5 | |
| | | |
| | | | | Net Expense Ratio (Current) | | | Gross Expense Ratio (Before Waivers) | |
| | Class A | | | 1.14 | % | | | 1.22 | % |
| | Class C | | | 1.89 | | | | 1.97 | |
| | Institutional | | | 0.75 | | | | 0.83 | |
| | Service | | | 1.25 | | | | 1.33 | |
| | Investor | | | 0.89 | | | | 0.97 | |
| | Class P | | | 0.74 | | | | 0.82 | |
| | Class R | | | 1.39 | | | | 1.47 | |
| | | Class R6 | | | 0.74 | | | | 0.82 | |
| | 5 | | The expense ratios of the Fund, both current (net of applicable fee waivers and/or expense limitations) and before waivers (gross of applicable fee waivers and/or expense limitations) are as set forth above according to the most recent publicly available Prospectus for the Fund and may differ from the expense ratios disclosed in the Financial Highlights in this report. Pursuant to a contractual arrangement, the Fund’s waivers and/or expense limitations will remain in place through at least December 28, 2019, and prior to such date the investment adviser may not terminate the arrangements without the approval of the Fund’s Board of Trustees. If these arrangements are discontinued in the future, the expense ratios may change without shareholder approval. |
| | | | | | | | |
| | TOP TEN HOLDINGS AS OF 2/28/196 |
| | | |
| | | Holding | | % of Net Assets | | | Line of Business |
| | | |
| | Apple, Inc. | | | 3.5 | % | | Technology Hardware, Storage &
Peripherals |
| | Microsoft Corp. | | | 3.4 | | | Software |
| | Amazon.com, Inc. | | | 2.8 | | | Internet & Direct Marketing
Retail |
| | JPMorgan Chase & Co. | | | 1.6 | | | Banks |
| | Facebook, Inc. Class A | | | 1.5 | | | Interactive Media & Services |
| | Alphabet, Inc. Class A | | | 1.5 | | | Interactive Media & Services |
| | Visa, Inc. Class A | | | 1.5 | | | IT Services |
| | Alphabet, Inc. Class C | | | 1.5 | | | Interactive Media & Services |
| | Bank of America Corp. | | | 1.4 | | | Banks |
| | | The Boeing Co. | | | 1.3 | | | Aerospace & Defense |
| | 6 | | The top 10 holdings may not be representative of the Fund’s future investments. |
15
FUND BASICS
|
| FUND VS. BENCHMARK SECTOR ALLOCATION7 |
|
| As of February 28, 2019 |
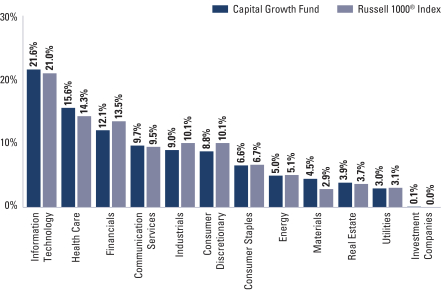
| | 7 | | The Fund is actively managed and, as such, its composition may differ over time. Consequently, the Fund’s overall sector allocations may differ from the percentages contained in the graph above. The graph categorizes investments using the Global Industry Classification Standard (“GICS”), however, the sector classifications used by the portfolio management team may differ from GICS. The percentage shown for each investment category reflects the value of investments in that category as a percentage of market value (excluding investments in the securities lending reinvestment vehicle, if any). Investments in the securities lending reinvestment vehicle represented 0.1% of the Fund’s net assets as of February 28, 2019. The graph depicts the Fund’s investments but may not represent the Fund’s market exposure due to the exclusion of certain derivatives, if any, as listed in the Additional Investment Information section of the Schedule of Investments. |
16
PORTFOLIO RESULTS
Goldman Sachs Concentrated Growth Fund
Portfolio Composition
The Fund invests primarily in U.S. equity investments selected for their potential to achieve capital appreciation over the long term. The Fund typically holds 30-40 companies that are considered by the Investment Adviser to be positioned for long-term growth. The Fund may invest in securities of companies of any capitalization. Although the Fund invests primarily in publicly traded U.S. securities, it may invest up to 25% of its total assets in foreign securities, including securities of issuers in countries with emerging markets or economies (“emerging countries”) and securities quoted in foreign currencies. The Fund may also invest up to 10% of its total assets in fixed income securities, such as government, corporate and bank debt obligations.
Portfolio Management Discussion and Analysis
Below, the Goldman Sachs Fundamental Equity U.S. Equity Team discusses the Goldman Sachs Concentrated Growth Fund’s (the “Fund”) performance and positioning for the six-month period ended February 28, 2019 (the “Reporting Period”).
| Q | | How did the Fund perform during the Reporting Period? |
| A | | During the Reporting Period, the Fund’s Class A, Class C, Institutional, Investor, Class P, Class R and Class R6 Shares generated cumulative total returns, without sales charges, of-4.10%,-4.38%,-3.87%,-3.95%,-3.87%,-4.19% and-3.88%, respectively. These returns compare to the-4.52% cumulative total return of the Fund’s benchmark, the Russell 1000® Growth Index (with dividends reinvested) (the “Russell Index”), during the same period. |
| Q | | What key factors were responsible for the Fund’s performance during the Reporting Period? |
| A | | While the Fund generated negative absolute returns, it outperformed the Russell Index on a relative basis during the Reporting Period due primarily to effective stock selection. Sector allocation as a whole detracted from relative performance, albeit modestly. |
| Q | | Which equity market sectors most significantly affected Fund performance? |
| A | | The sectors that contributed most positively to the Fund’s relative performance during the Reporting Period were health care and communication services, wherein effective stock selection in each helped most. Having an overweighted allocation to real estate, which outperformed the Russell Index during the Reporting Period, also boosted relative results. Challenging stock selection in the information technology, industrials and financials sectors detracted from the Fund’s relative results most during the Reporting Period. Having an underweight to industrials, which outpaced the Russell Index during the Reporting Period, also hurt. |
| Q | | What were some of the Fund’s best-performing individual stocks? |
| A | | The Fund benefited most relative to the Russell Index from positions in medical equipment company Danaher, pharmaceutical company Eli Lilly and medical device manufacturer Boston Scientific. |
| | In November 2018, Danaher’s stock was driven less by company-specific events but rather rose along with the health care equipment industry as a whole. Then, in February 2019, Danaher announced an agreement with General Electric (“GE”) to acquire the biopharmaceutical business of GE Life Sciences. The market’s reception of the deal was overwhelmingly positive, and Danaher’s shares climbed through the end of the month. We were also highly optimistic about the transaction, which makes Danaher the largest player within bioprocessing and gives the company a multi-year value creation opportunity through potential top-line acceleration and cost savings. GE Life Sciences is a high quality asset, and in our opinion, significantly improves Danaher’s positioning within the biopharmaceutical industry. With this in mind, at the end of the Reporting Period, we had renewed confidence that Danaher is a high quality company, led by what we see as an outstanding management team, that generates solid free cash flow and has high barriers to entry in its key business segments. |
| | Eli Lilly’s stock climbed through most of November 2018 after the company reported solid quarterly results in which it beat consensus earnings per share and revenue expectations and also raised guidance for the full year 2018. Then, in December 2018, Eli Lilly shares benefited from the |
17
PORTFOLIO RESULTS
| | announcement of better than market expected 2019 guidance, featuring significant improvements in revenue growth and long-term sales growth. The company had a volatile month of trading in January 2019, finishing the month in positive territory but lagging the health care sector as well as the broad U.S. equity market. Early on, a negative headline on drug pricing pressured the stock along with that of other pharmaceutical companies. Then news of Eli Lilly’s acquisition of Loxo Oncology, a cancer drug company, helped give a boost to its shares. These gains were quickly erased after a phase 3 soft tissue study did not meet its primary objective, leading the Food and Drug Administration to recommend new patients not start using the drug. All in all, we viewed January 2019 as a month of primarily short-term trading noise that did not alter the underlying fundamentals of the company or why we favor it. At the end of the Reporting Period, we believed the company maintained strong risk/reward prospects versus its peers, and we saw an upside to its diabetes franchise. We were also optimistic about its management’s commitment to creating shareholder value through increased dividends and share repurchases. Additionally, we viewed the company’s split with Elanco, its former animal health business segment, as value accretive. Overall, we viewed Eli Lilly as a high quality pharmaceuticals business with leading franchises, a robust drug pipeline and an improving financial profile. |
| | During the third quarter of 2018, Boston Scientific’s shares climbed rather steadily, primarily driven by the announcement of several acquisitions of smaller companies in the health care equipment space, which were seen by the market as positive. For example, investors were positive on the company’s September 2018 acquisition of Augmenix, a privately held developer of systems used to reduce the side effects of radiotherapy in cancer patients. The market also viewed the company’s 2019 launch plans for Lotus Edge, a transcatheter aortic valve replacement system, as increasingly favorable. During the fourth quarter of 2018, the company experienced some volatility alongside the broader market but then rose in the first two months of 2019. In February 2019, the company’s fourth quarter 2018 results came in better than the market expected, with its earnings per share beating consensus estimates and its revenue in line with consensus estimates, giving an extra push to its shares. At the end of the Reporting Period, we believed Boston Scientific presented an attractive path for growth and had one of the best product pipelines in its market. We viewed its new product launches, accompanied by geographic market and platform expansion, positively and believed those launches make Boston Scientific’s growth profile among the best in the medical device industry. |
| Q | | Which stocks detracted significantly from the Fund’s performance during the Reporting Period? |
| A | | Among those stocks detracting most from the Fund’s results relative to the Russell Index were positions in semiconductor company NVIDIA, consumer staples giant Kraft Heinz and materials, chemicals and agricultural products developer DowDuPont. |
| | NVIDIA’s stock price declined in October 2018 along with the broader semiconductor industry, as international trade tensions and end-market demand concerns weighed on investor sentiment. (End-market is used to indicate where the final transaction takes place in a value chain. Typically it is where the end-user is located, meaning the individual, organization, industry or region for whom the product or service has been created and who is not expected to resell that product or service.) In November 2018, the company reported a miss in earnings primarily due to weak crypto-currency demand, which at one point had accounted for more than 10% of company revenues. However, the remainder of the business, which is driven by cloud, gaming and artificial intelligence, continued to show strong growth. In addition to the earnings-related sell-off, NVIDIA’s stock was under pressure for the majority of the fourth quarter of 2018, along with its semiconductor peers, as concerns around the health of the global economy grew to end the year. Despite the difficult fourth calendar quarter for the company, we believed at the end of the Reporting Period that the underlying long-term fundamentals of the company were still healthy, though we continued to evaluate the macro backdrop. |
| | Nearly all of Kraft Heinz’ stock price decline occurred at the end of February 2019. The stock plummeted after the company reported quarterly earnings that missed market estimates across all metrics. Furthermore, Kraft Heinz cut its dividend by approximately one-third, announced a $15 billion goodwill impairment* and reported it had received a subpoena from the Securities and Exchange Commission. Following the report, we decided to exit the Fund’s position, as we viewed this as a thesis-changing event and believed there were better opportunities elsewhere. |
| | * | | Goodwill impairment is an earnings charge that companies record on their income statements after they identify that there is persuasive evidence that the asset associated with the goodwill can no longer demonstrate financial results that were expected from it at the time of its purchase. Because many companies acquire other firms and pay a price that exceeds the fair value of identifiable assets and liabilities that the acquired firm possesses, the difference between the purchase price and the fair value of acquired assets is recorded as goodwill. However, if unforeseen circumstances arise that decrease expected cash flows from acquired assets, their fair value can be lower than what was originally paid for them, and a company must book a goodwill impairment. |
18
PORTFOLIO RESULTS
| | Most of DowDuPont’s share price decline occurred during the first two months of the Reporting Period. Its share price fell at the end of September 2018 driven both by weakness in the materials and chemicals industries and by negative reports by several analysts. In October 2018, DowDuPont disclosed a $4.6 billion write-down of goodwill, which was viewed negatively by investors. Despite the decline in the stock, we remained optimistic at the end of the Reporting Period on the company’s ability to unlock operating synergies, decrease costs and deploy cash on high return projects to further improve profitability. Overall, we believed DowDuPont was well positioned to benefit from inflecting cyclical tailwinds across multiple business segments as it works to improve its operations and unlock efficiencies. |
| Q | | How did the Fund use derivatives and similar instruments during the Reporting Period? |
| A | | During the Reporting Period, we did not use derivatives as part of an active management strategy. |
| Q | | Did the Fund make any significant purchases or sales during the Reporting Period? |
| A | | We initiated a Fund position in discount retailer Walmart. We are positive on the company and confident in its management team and its potential to create shareholder value in the long run through strategic initiatives and acquisitions. In our view, Walmart has a strong balance sheet with robust, consistent free cash flow, and we believe the company was attractively valued at the time of purchase relative to its peers. |
| | We added Intuitive Surgical to the Fund’s portfolio during the Reporting Period. The company develops, manufactures and markets robotic surgical systems and related instruments and accessories for invasive surgery. We are optimistic that the company is on the brink of entering into a strong product cycle, specifically its lung biopsy pipeline, which targets the cancer biopsy market. Given the sparse competition in the space, we feel its sales momentum is poised to move forward and think the company has a strong competitive advantage. |
| | Conversely, in addition to the sale already mentioned, we exited the Fund’s position in integrated circuit manufacturer Analog Devices. The stock had experienced heightened volatility during the fourth quarter of 2018 due to increased investor concerns around the outlook for semiconductor spending. While we still believe the company has an attractive revenue growth and margin profile, we felt the risk/reward balance was less attractive for this Fund and decided to sell the position and reallocate the capital elsewhere. |
| | We eliminated the Fund’s position in pharmaceutical company Shire during the Reporting Period. In December 2018, it was announced that Takeda Pharmaceutical shareholders voted to approve the company’s acquisition of Shire. Following the approval of the acquisition and the stock’s strong performance, we decided to sell the position and reallocate the capital elsewhere. |
| Q | | Were there any changes to the Fund’s portfolio management team during the Reporting Period? |
| A | | There were no changes to the Fund’s portfolio management team during the Reporting Period. |
| Q | | Were there any notable changes in the Fund’s weightings during the Reporting Period? |
| A | | In constructing the Fund’s portfolio, we focus on picking stocks rather than on making industry or sector bets. We seek to outpace the benchmark index by overweighting stocks that we expect to outperform and underweighting those that we think may lag. Consequently, changes in its sector weights are generally the direct result of individual stock selection or of stock appreciation or depreciation. That said, during the Reporting Period, the Fund’s exposure to materials, industrials and financials increased and its allocation to information technology decreased relative to the Russell Index. |
| Q | | How was the Fund positioned relative to its benchmark index at the end of February 2019? |
| A | | At the end of February 2019, the Fund had overweighted positions relative to the Russell Index in the health care, real estate, materials, communication services and energy sectors. On the same date, the Fund had underweighted positions compared to the Russell Index in information technology, industrials and consumer discretionary. The Fund was rather neutrally weighted relative to the Russell Index in consumer staples and financials and had no position at all in the utilities sector at the end of the Reporting Period. |
19
FUND BASICS
Concentrated Growth Fund
as of February 28, 2019
| | | | | | | | | | |
| | PERFORMANCE REVIEW | |
| | | |
| | | September 1, 2018–February 28, 2019 | | Fund Total Return
(based on NAV)1 | | | Russell 1000®
Growth Index2 | |
| | | |
| | Class A | | | -4.10 | % | | | -4.52 | % |
| | Class C | | | -4.38 | | | | -4.52 | |
| | Institutional | | | -3.87 | | | | -4.52 | |
| | Investor | | | -3.95 | | | | -4.52 | |
| | Class P | | | -3.87 | | | | -4.52 | |
| | Class R | | | -4.19 | | | | -4.52 | |
| | | Class R6 | | | -3.88 | | | | -4.52 | |
| | 1 | | The net asset value (“NAV”) represents the net assets of the class of the Fund (ex-dividend) divided by the total number of shares of the class outstanding. The Fund’s performance reflects the reinvestment of dividends and other distributions. The Fund’s performance does not reflect the deduction of any applicable sales charges. |
| | 2 | | The Russell 1000® Growth Index is an unmanaged index that measures the performance of those Russell 1000® companies with higher price-to-book ratios and higher forecasted growth values. The Russell 1000® Growth Index figures do not reflect any deduction for fees, expenses or taxes. It is not possible to invest directly in an index. |
| | | | | | | | | | | | | | | | | | | | |
| | STANDARDIZED TOTAL RETURNS3 | | | |
| | | | | | |
| | | For the period ended 12/31/18 | | One Year | | | Five Years | | | Ten Years | | | Since Inception | | | Inception Date |
| | | | | | |
| | Class A | | | -7.90 | % | | | 5.78 | % | | | 12.50 | % | | | 7.01 | % | | 9/3/02 |
| | Class C | | | -4.24 | | | | 6.19 | | | | 12.31 | | | | 6.57 | | | 9/3/02 |
| | Institutional | | | -2.19 | | | | 7.40 | | | | 13.61 | | | | 7.80 | | | 9/3/02 |
| | Investor | | | -2.35 | | | | 7.25 | | | | 13.43 | | | | 6.35 | | | 11/30/07 |
| | Class P | | | N/A | | | | N/A | | | | N/A | | | | -6.96 | | | 4/17/18 |
| | Class R | | | -2.78 | | | | 6.72 | | | | 12.88 | | | | 5.84 | | | 11/30/07 |
| | | Class R6 | | | -2.17 | | | | N/A | | | | N/A | | | | 5.79 | | | 7/31/15 |
| | 3 | | The Standardized Total Returns are average annual total returns or cumulative total returns (only if the performance period is one year or less) as of the most recent calendar quarter-end. They assume reinvestment of all distributions at NAV. These returns reflect a maximum initial sales charge of 5.5% for Class A Shares and the assumed contingent deferred sales charge for Class C Shares (1% if redeemed within 12 months of purchase). Effective July 30, 2018, Class C Shares convert automatically to Class A Shares on or about the fifteenth day of the last month of the calendar quarter that is ten years after the purchase date. Because Institutional, Investor, Class P, Class R and Class R6 Shares do not involve a sales charge, such a charge is not applied to their Standardized Total Returns. |
The returns set forth in the tables above represent past performance. Past performance does not guarantee future results. The Fund’s investment return and principal value will fluctuate so that an investor’s shares, when redeemed, may be worth more or less than their original cost. Current performance may be lower or higher than the performance quoted above. Please visit our web site at www.GSAMFUNDS.com to obtain the most recent month-end returns. Performance reflects applicable fee waivers and/or expense limitations in effect during the periods shown. In their absence, performance would be reduced. Returns do not reflect the deduction of taxes that a shareholder would pay on Fund distributions or the redemption of Fund shares.
20
FUND BASICS
| | | | | | | | | | |
| | EXPENSE RATIOS4 | |
| | | |
| | | | | Net Expense Ratio (Current) | | | Gross Expense Ratio (Before Waivers) | |
| | Class A | | | 1.16 | % | | | 1.43 | % |
| | Class C | | | 1.91 | | | | 2.18 | |
| | Institutional | | | 0.80 | | | | 1.04 | |
| | Investor | | | 0.91 | | | | 1.18 | |
| | Class P | | | 0.79 | | | | 1.03 | |
| | Class R | | | 1.41 | | | | 1.68 | |
| | | Class R6 | | | 0.79 | | | | 1.03 | |
| | 4 | | The expense ratios of the Fund, both current (net of applicable fee waivers and/or expense limitations) and before waivers (gross of applicable fee waivers and/or expense limitations) are as set forth above according to the most recent publicly available Prospectus for the Fund and may differ from the expense ratios disclosed in the Financial Highlights in this report. Pursuant to a contractual arrangement, the Fund’s waivers and/or expense limitations will remain in place through at least December 28, 2019, and prior to such date the investment adviser may not terminate the arrangements without the approval of the Fund’s Board of Trustees. If these arrangements are discontinued in the future, the expense ratios may change without shareholder approval. |
| | | | | | | | |
| | TOP TEN HOLDINGS AS OF 2/28/195 |
| | | |
| | | Holding | | % of Net Assets | | | Line of Business |
| | | |
| | Microsoft Corp. | | | 5.8 | % | | Software |
| | Apple, Inc. | | | 4.8 | | | Technology Hardware, Storage & Peripherals |
| | Amazon.com, Inc. | | | 4.6 | | | Internet & Direct Marketing Retail |
| | Visa, Inc. Class A | | | 4.5 | | | IT Services |
| | Facebook, Inc. Class A | | | 4.5 | | | Interactive Media & Services |
| | Alphabet, Inc. Class A | | | 3.9 | | | Interactive Media & Services |
| | Honeywell International, Inc. | | | 3.1 | | | Industrial Conglomerates |
| | Danaher Corp. | | | 3.1 | | | Health Care Equipment & Supplies |
| | Northrop Grumman Corp. | | | 3.0 | | | Aerospace & Defense |
| | | NIKE, Inc. Class B | | | 2.9 | | | Textiles, Apparel & Luxury Goods |
| | 5 | | The top 10 holdings may not be representative of the Fund’s future investments. |
21
FUND BASICS
|
| FUND VS. BENCHMARK SECTOR ALLOCATION6 |
|
| As of February 28, 2019 |
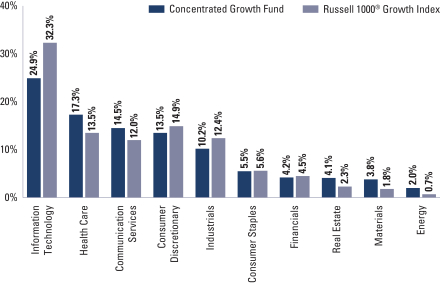
| | 6 | | The Fund is actively managed and, as such, its composition may differ over time. Consequently, the Fund’s overall sector allocations may differ from the percentages contained in the graph above. The graph categorizes investments using the Global Industry Classification Standard (“GICS”); however, the sector classifications used by the portfolio management team may differ from GICS. The percentage shown for each investment category reflects the value of investments in that category as a percentage of market value. The graph depicts the Fund’s investments but may not represent the Fund’s market exposure due to the exclusion of certain derivatives, if any, as listed in the Additional Investment Information section of the Schedule of Investments. |
22
PORTFOLIO RESULTS
Goldman Sachs Flexible Cap Fund
Portfolio Composition
The Fund invests, under normal circumstances, at least 80% of its net assets plus any borrowings for investment purposes (measured at time of purchase) (“Net Assets”) in equity investments in small-, mid- and large-cap issuers. The Fund seeks to achieve its investment objective by investing, under normal circumstances, in companies that are considered by the Investment Adviser to be positioned for long-term growth of capital. This strategy is combined with a quantitative risk allocation process that is used to assist portfolio construction and trading decisions.
Portfolio Management Discussion and Analysis
Below, the Goldman Sachs Fundamental Equity U.S. Equity Team discusses the Goldman Sachs Flexible Cap Fund’s (the “Fund”) performance and positioning for the six-month period ended February 28, 2019 (the “Reporting Period”).
| Q | | How did the Fund perform during the Reporting Period? |
| A | | During the Reporting Period, the Fund’s Class A, Class C, Institutional, Investor, Class P, Class R and Class R6 Shares generated cumulative total returns, without sales charges, of-3.41%,-3.80%,-3.24%,-3.22%,-3.17%,-3.52% and-3.19%, respectively. These returns compare to the-3.04% cumulative total return of the Fund’s benchmark, the S&P 500 Index (with dividends reinvested), during the same period. |
| Q | | What key factors were responsible for the Fund’s performance during the Reporting Period? |
| A | | The Fund underperformed the S&P 500 Index during the Reporting Period. Stock selection overall contributed positively, albeit modestly, while sector allocation as a whole detracted from the Fund’s relative results during the Reporting Period. |
| Q | | Which equity market sectors most significantly affected Fund performance? |
| A | | The sectors that detracted most from the Fund’s relative results during the Reporting Period were consumer discretionary, industrials and financials, wherein stock selection proved challenging. The sectors that contributed most positively to the Fund’s relative performance during the Reporting Period were health care, communication services and materials. Effective stock selection drove results in each of these sectors. |
| Q | | Which stocks detracted significantly from the Fund’s performance during the Reporting Period? |
| A | | Detracting most from the Fund’s results relative to the S&P 500 Index were positions in transportation and logistics company XPO Logistics, processed and packaged foods manufacturer Conagra Brands and integrated powertrain technologies designer and manufacturer Delphi Technologies. |
| | While there were no stock-specific reasons for the decline in XPO Logistics’ share price during a volatile October 2018, the company, along with others in the industrials and freight industries, underperformed for the month. In mid-December 2018, a hedge fund issued a report that sent XPO Logistics’ shares tumbling more than 26% in one day. We were not particularly troubled by our initial read-through of the analysis but recognized several aspects that warranted follow up. After assessing various factors, we confirmed our previously held view that XPO Logistics’ business was well aligned with the structural changes in the freight industry, such as outsourcing and labor-saving technology,e-commerce exposure and the implementation of electronic logging devices. The market eventually recognized this as well, and its shares recovered all of the losses prompted by the hedge fund report. However, unrelated to the report, XPO Logistics’ stock tumbled in February 2019 after the company released its fourth quarter 2018 earnings report that revealed results below market estimates on earnings per share, revenue and 2019 guidance. Its management cited a reduction in business from its largest client, expressing it would negatively impact its growth for 2019. These developments led us to exit the Fund’s position in XPO Logistics. |
| | Conagra Brands’ stock initially fell in late September 2018 when the company reported weaker than consensus expected earnings. However, we believe this was largely attributed to higher taxes, as the underlying business continued showing solid growth. Its share price again declined mid-December |
23
PORTFOLIO RESULTS
| | 2018 in response to a challenging earnings report that demonstrated issues with the acquisition of one of its peers. Following these reports, our confidence lessened in the stock, and we decided to exit the position in favor of other companies that we believed had more attractive prospects. |
| | In October 2018, the stock of Delphi Technologies declined after the company announced the departure of its Chief Executive Officer and revised its outlook downward for the full year 2018. In its outlook, Delphi Technologies forecasted revenue for the full year to be consistent with the prior year level, compared to the previous guidance, which had projected low single-digit revenue growth. Upon the news, multiple research analysts downgraded the stock, sending its shares lower. In November 2018, Delphi Technologies reported weak quarterly results. Its quarterly results and guidance were in line with preannouncements, but its 2019 preliminary guidance was significantly below consensus expectations, as industry volumes continued to face headwinds, specifically in China, where there was negative product mix. We decided to sell the position in January 2019 given what we viewed as the company’s substantial operational and structural challenges, exacerbated by uncertainty related to its management change and potential macro headwinds. |
| Q | | What were some of the Fund’s best-performing individual stocks? |
| A | | Among those stocks the Fund benefited most from relative to the S&P 500 Index were positions in biopharmaceutical company Celgene, medical equipment company Danaher and aerospace and defense company Boeing. |
| | We added a Fund position in Celgene during the fourth quarter of 2018 and shortly thereafter it was announced that Bristol-Myers Squibb would be acquiring Celgene for a sizable premium, causing its shares to spike. We were positive on Celgene given what we saw as its strong pipeline of upcoming drugs and believed the deal could be value accretive. At the end of the Reporting Period, we remained encouraged by the news of the potential acquisition and were continuing to monitor the situation. |
| | In November 2018, Danaher’s stock was driven less by company-specific events but rather rose along with the health care equipment industry as a whole. Then, in February 2019, Danaher announced an agreement with General Electric (“GE”) to acquire the biopharmaceutical business of GE Life Sciences. The market’s reception of the deal was overwhelmingly positive, and Danaher’s shares climbed through the end of the month. We were also highly optimistic about the transaction, which makes Danaher the largest player within bioprocessing and gives the company a multi-year value creation opportunity through potential top-line acceleration and cost savings. GE Life Sciences is a high quality asset, and in our opinion, significantly improves Danaher’s positioning within the biopharmaceutical industry. With this in mind, at the end of the Reporting Period, we had renewed confidence that Danaher is a high quality company, led by what we see as an outstanding management team, that generates solid free cash flow and has high barriers to entry in its key business segments. |
| | Early in January 2019, Boeing announced fourth quarter 2018 and full year 2018 aircraft deliveries that were both slightly higher than market estimates, causing its stock to rise. Then, at the end of the month, Boeing announced strong quarterly earnings results, exceeding market expectations on revenue, earnings per share and, most importantly, cash from operations. Boeing’s stock reacted to the optimism surrounding trade talks with China throughout February 2019, as a resolution could create a potential order boost. At the end of the Reporting Period, we remained positive on the company’s strong productivity track record, multi-year commercial aircraft backlog and improving prospects in its defense business. We viewed Boeing favorably due to what we considered to be its strong competitive position, robust free cash flow and focus on shareholders through buybacks and distributions. |
| Q | | How did the Fund use derivatives and similar instruments during the Reporting Period? |
| A | | During the Reporting Period, we did not use derivatives as part of an active management strategy. |
| Q | | Did the Fund make any significant purchases or sales during the Reporting Period? |
| A | | In addition to the purchase mentioned earlier, we re-initiated a Fund position in fast-food restaurant company McDonald’s. Its stock had lagged the overall market during the third quarter of 2018, which we believe presented an attractive opportunity to add back what we view as a best-in-class franchise to the Fund’s portfolio after selling it in the Fund’s prior fiscal year. We are positive on many of the strategic initiatives McDonald’s has been rolling out, including a revamped value menu and fresh beef hamburgers, which we believe can help boost its stock. In our view, McDonald’s has a strong balance sheet with robust free cash flow and good return on equity. We also believe it |
24
PORTFOLIO RESULTS
| | was attractively valued at the time of purchase and poised for growth and market share gains. |
| | We established a Fund position in Accenture. We feel the company is positioned as a leading information technology implementation company in digital and new age technologies, including cloud software as a service, analytics and security. We also feel the company’s relationships, combined with its consulting practice, give it a competitive advantage when compared to traditional outsourcing peers, as Accenture is involved early in deals. Lastly, we feel the company’s balanced capital allocation towards merger and acquisition and capital returns allows it to invest in new practices. |
| | Conversely, in addition to those sales already mentioned, we exited the Fund’s position in health insurance company Aetna. In November 2018, Aetna was acquired by CVS Health, forming a business comprising a retail pharmacy, pharmacy benefit manager and insurance segment. After the transaction closed, we decided to exchange the Fund’s shares of Aetna for those of CVS Health, given that we viewed the combined entity as an attractive investment opportunity. We are optimistic that CVS Health may be able to successfully integrate Aetna to help lower costs by making health care local and accessible and simplifying how consumers access care. |
| | We sold the Fund’s position in consumer products company Colgate-Palmolive. Commodity prices and foreign exchange headwinds continued to pressure its margins, and despite the company’s increased advertising efforts, organic sales growth has shown little signs of improving. Colgate-Palmolive also trailed its competitors in growing sales in emerging markets. We therefore decided to exit the position and reallocate the capital to names with what we considered more attractive risk/reward prospects. |
| Q | | Were there any changes to the Fund’s portfolio management team during the Reporting Period? |
| A | | There were no changes to the Fund’s portfolio management team during the Reporting Period. |
| Q | | Were there any notable changes in the Fund’s weightings during the Reporting Period? |
| A | | In constructing the Fund’s portfolio, we focus on picking stocks rather than on making industry or sector bets. We seek to outpace the benchmark index by overweighting stocks that we expect to outperform and underweighting those that we think may lag. Consequently, changes in its sector weights are generally the direct result of individual stock selection or of stock appreciation or depreciation. During the Reporting Period, there were no notable changes in the Fund’s sector weightings relative to the S&P 500 Index. |
| Q | | How was the Fund positioned relative to its benchmark index at the end of February 2019? |
| A | | At the end of February 2019, the Fund was rather neutrally weighted to all 11 sectors in the S&P 500 Index. |
25
FUND BASICS
Flexible Cap Fund
as of February 28, 2019
| | | | | | | | | | |
| | PERFORMANCE REVIEW | |
| | | |
| | | September 1, 2018–February 28, 2019 | | Fund Total Return
(based on NAV)1 | | | S&P 500®
Index2 | |
| | | |
| | Class A | | | -3.41 | % | | | -3.04 | % |
| | Class C | | | -3.80 | | | | -3.04 | |
| | Institutional | | | -3.24 | | | | -3.04 | |
| | Investor | | | -3.22 | | | | -3.04 | |
| | Class P | | | -3.17 | | | | -3.04 | |
| | Class R | | | -3.52 | | | | -3.04 | |
| | | Class R6 | | | -3.19 | | | | -3.04 | |
| | 1 | | The net asset value (“NAV”) represents the net assets of the class of the Fund (ex-dividend) divided by the total number of shares of the class outstanding. The Fund’s performance reflects the reinvestment of dividends and other distributions. The Fund’s performance does not reflect the deduction of any applicable sales charges. |
| | 2 | | The S&P 500® Index is the Standard & Poor’s 500 Composite Index of 500 stocks, an unmanaged index of common stock prices. The S&P 500® Index figures do not reflect any deduction for fees, expenses or taxes. It is not possible to invest directly in an index. |
| | | | | | | | | | | | | | | | | | | | |
| | STANDARDIZED TOTAL RETURNS3 | | | |
| | | | | | |
| | | For the period ended 12/31/18 | | One Year | | | Five Years | | | Ten Years | | | Since Inception | | | Inception Date |
| | | | | | |
| | Class A | | | -11.00 | % | | | 6.76 | % | | | 13.56 | % | | | 8.46 | % | | 1/31/08 |
| | Class C | | | -7.47 | | | | 7.17 | | | | 13.35 | | | | 8.23 | | | 1/31/08 |
| | Institutional | | | -5.55 | | | | 8.38 | | | | 14.64 | | | | 9.46 | | | 1/31/08 |
| | Investor | | | -5.57 | | | | 8.25 | | | | 14.48 | | | | 9.31 | | | 1/31/08 |
| | Class P | | | N/A | | | | N/A | | | | N/A | | | | -8.02 | | | 4/17/18 |
| | Class R | | | -6.01 | | | | 7.72 | | | | 13.92 | | | | 8.78 | | | 1/31/08 |
| | | Class R6 | | | -5.51 | | | | N/A | | | | N/A | | | | 5.81 | | | 7/31/15 |
| | 3 | | The Standardized Total Returns are average annual total returns or cumulative total returns (only if the performance period is one year or less) as of the most recent calendar quarter-end. They assume reinvestment of all distributions at NAV. These returns reflect a maximum initial sales charge of 5.5% for Class A Shares and the assumed contingent deferred sales charge for Class C Shares (1% if redeemed within 12 months of purchase). Effective July 30, 2018, Class C Shares convert automatically to Class A Shares on or about the fifteenth day of the last month of the calendar quarter that is ten years after the purchase date. The Since Inception returns for Class C Shares do not reflect the conversion to Class A Shares after the first ten years of performance. Because Institutional, Investor, Class P, Class R and Class R6 Shares do not involve a sales charge, such a charge is not applied to their Standardized Total Returns. |
The returns set forth in the tables above represent past performance. Past performance does not guarantee future results. The Fund’s investment return and principal value will fluctuate so that an investor’s shares, when redeemed, may be worth more or less than their original cost. Current performance may be lower or higher than the performance quoted above. Please visit our web site at www.GSAMFUNDS.com to obtain the most recent month-end returns.Performance reflects applicable fee waivers and/or expense limitations in effect during the periods shown. In their absence, performance would be reduced. Returns do not reflect the deduction of taxes that a shareholder would pay on Fund distributions or the redemption of Fund shares.
26
FUND BASICS
| | | | | | | | | | |
| | EXPENSE RATIOS4 | |
| | | |
| | | | | Net Expense Ratio (Current) | | | Gross Expense Ratio (Before Waivers) | |
| | | |
| | Class A | | | 0.98 | % | | | 2.48 | % |
| | Class C | | | 1.73 | | | | 3.23 | |
| | Institutional | | | 0.59 | | | | 2.09 | |
| | Investor | | | 0.73 | | | | 2.23 | |
| | Class P | | | 0.58 | | | | 2.08 | |
| | Class R | | | 1.23 | | | | 2.73 | |
| | | Class R6 | | | 0.58 | | | | 2.08 | |
| | 4 | | The expense ratios of the Fund, both current (net of applicable fee waivers and/or expense limitations) and before waivers (gross of applicable fee waivers and/or expense limitations) are as set forth above according to the most recent publicly available Prospectus for the Fund and may differ from the expense ratios disclosed in the Financial Highlights in this report. Pursuant to a contractual arrangement, the Fund’s waivers and/or expense limitations will remain in place through at least December 28, 2019, and prior to such date the investment adviser may not terminate the arrangements without the approval of the Fund’s Board of Trustees. If these arrangements are discontinued in the future, the expense ratios may change without shareholder approval. |
| | | | | | | | |
| | TOP TEN HOLDINGS AS OF 2/28/195 |
| | | |
| | | Holding | | % of Net Assets | | | Line of Business |
| | | |
| | Microsoft Corp. | | | 4.1 | % | | Software |
| | Apple, Inc. | | | 3.7 | | | Technology Hardware, Storage & Peripherals |
| | Amazon.com, Inc. | | | 2.9 | | | Internet & Direct Marketing Retail |
| | Johnson & Johnson | | | 2.0 | | | Pharmaceuticals |
| | JPMorgan Chase & Co. | | | 1.9 | | | Banks |
| | Alphabet, Inc. Class A | | | 1.7 | | | Interactive Media & Services |
| | Facebook, Inc. Class A | | | 1.6 | | | Interactive Media & Services |
| | The Procter & Gamble Co. | | | 1.6 | | | Household Products |
| | Bank of America Corp. | | | 1.5 | | | Banks |
| | | Alphabet, Inc. Class C | | | 1.5 | | | Interactive Media & Services |
| | 5 | | The top 10 holdings may not be representative of the Fund’s future investments. |
27
FUND BASICS
|
| FUND VS. BENCHMARK SECTOR ALLOCATION6 |
|
| As of February 28, 2019 |
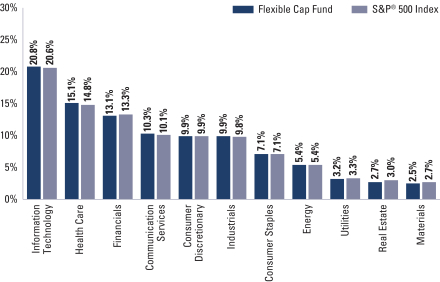
| | 6 | | The Fund is actively managed and, as such, its composition may differ over time. Consequently, the Fund’s overall sector allocations may differ from the percentages contained in the graph above. The graph categorizes investments using the Global Industry Classification Standard (“GICS”), however, the sector classifications used by the portfolio management team may differ from GICS. The percentage shown for each investment category reflects the value of investments in that category as a percentage of market value. The graph depicts the Fund’s investments but may not represent the Fund’s market exposure due to the exclusion of certain derivatives, if any, as listed in the Additional Investment Information section of the Schedule of Investments. |
28
PORTFOLIO RESULTS
Goldman Sachs Growth Opportunities Fund
Portfolio Composition
The Fund invests primarily in medium-sized growth companies. The Fund seeks to achieve its investment objective of seeking long-term growth of capital by investing, under normal circumstances, in companies that are considered by the Investment Adviser to be positioned for long-term growth. Although the Fund invests primarily in publicly traded U.S. securities, it may invest up to 25% of its total assets in foreign securities, including securities of issuers in emerging countries and securities quoted in foreign currencies. The Fund may also invest in privately held companies and companies that only recently began to trade publicly.
Portfolio Management Discussion and Analysis
Below, the Goldman Sachs Fundamental Equity U.S. Equity Team discusses the Goldman Sachs Growth Opportunities Fund’s (the “Fund”) performance and positioning for the six-month period ended February 28, 2019 (the “Reporting Period”).
| Q | | How did the Fund perform during the Reporting Period? |
| A | | During the Reporting Period, the Fund’s Class A, Class C, Institutional, Service, Investor, Class P, Class R and Class R6 Shares generated cumulative total returns, without sales charges, of-1.17%,-1.52%,-0.96%,-1.24%,-1.02%,-0.97%, -1.23% and-1.00%, respectively. These returns compare to the-1.27% cumulative total return of the Fund’s benchmark, the Russell Midcap® Growth Index (with dividends reinvested) (the “Russell Index”), during the same period. |
| Q | | What key factors were responsible for the Fund’s performance during the Reporting Period? |
| A | | While the Fund generated negative absolute returns, most of its share classes outperformed the Russell Index on a relative basis during the Reporting Period due primarily to effective stock selection. Sector allocation as a whole detracted from relative performance, albeit modestly. |
| Q | | Which equity market sectors most significantly affected Fund performance? |
| A | | The sectors that contributed most positively to the Fund’s relative performance during the Reporting Period were health care, communication services and consumer staples, wherein effective stock selection drove results. Having an underweighted allocation to communication services, which lagged the Russell Index during the Reporting Period, and having an overweighted allocation to consumer staples, which outperformed the Russell Index during the Reporting Period, also buoyed relative results. Detracting most from the Fund’s relative results was challenging stock selection in the information technology, energy and financials sectors. Having an underweighted allocation to information technology, which outperformed the Russell Index during the Reporting Period, and having an overweighted allocation to energy, which was the second-weakest sector in the Russell Index during the Reporting Period, also hurt. |
| Q | | What were some of the Fund’s best-performing individual stocks? |
| A | | The Fund benefited most relative to the Russell Index from positions in commercial gene therapy firm Spark Therapeutics, health care equipment and services company Agilent Technologies and enterprise software solutions company Red Hat. |
| | A new purchase for the Fund during the Reporting Period, Spark Therapeutics’ shares spiked in late February 2019 after news broke that Swiss drug maker Roche Holding had agreed to acquire Spark Therapeutics for approximately $115 per share, representing a total equity value of about $5 billion. Given that Spark Therapeutics had a market value of just under $2 billion at the prior session’s close, its stock price more than doubled upon the announcement. With this in mind, we felt the valuation for Spark Therapeutics became less attractive and opted to sell the Fund’s position and allocate the gains to what we saw as more appealing risk/reward opportunities. |
| | Shares of Agilent Technologies rallied in November 2018 following an earnings release in which the company reported both earnings per share and revenues that exceeded consensus estimates. The results were primarily driven by |
29
PORTFOLIO RESULTS
| | broad-based strength across products and an acceleration of its business in China, which investors viewed positively. The company’s stock also performed well in January 2019, buoyed by solid performance by the health care sector more broadly. At the end of the Reporting Period, we were encouraged by the company’s recent earnings reports and continued to believe Agilent Technologies presented an attractive growth story. We felt the combination of an innovative product pipeline and productivity enhancement initiatives provided a potential runway for revenue growth and margin expansion. |
| | Shares of Red Hat soared in late October 2018 after IBM announced an offer to acquire Red Hat for a significant premium to its market price. This acquisition was in line with our thesis that the software industry is ripe for consolidation. We also believe Red Hat has impressive growth prospects, led mostly by new business, and has solid sales capacity through its partnerships with cloud providers. While we were encouraged by this news and continued to monitor developments as both companies work toward finalizing the acquisition, we opted to sell the Fund’s position in Red Hat, taking profits. |
| Q | | Which stocks detracted significantly from the Fund’s performance during the Reporting Period? |
| A | | Detracting most from the Fund’s results relative to the Russell Index were positions in Xilinx, PVH and John Bean Technologies. |
| | Xilinx engages in the designing and developing of programmable devices and associated technologies. While its stock significantly outperformed the Russell Index during the Reporting Period due to consecutive impressive earnings releases, the Fund’s underweight position led the stock to be a top detractor from relative results. At the end of the Reporting Period, we continued to like the company and the end-markets it is exposed to, including fifth-generation (“5G”) and public cloud. |
| | PVH designs and manufactures apparel and footwear through a variety of brand names. Amidst a more challenging environment for retail during the fourth quarter of 2018, PVH reported mixed results in November 2018. While its earnings per share and revenue were higher, its Calvin Klein sales were disappointing for the second consecutive quarter. PVH’s stock slid throughout December 2018 alongside the broader market, which experienced heightened volatility. Despite the weakness in the stock, we remained positive on PVH at the end of the Reporting Period given its geographic diversity and global growth potential. We also believed the company was well positioned given its recognizable brand names and what we viewed as its strong balance sheet and good free cash flow generation. |
| | John Bean Technologies is a technology solutions provider in the food, beverage and air transportation industries. In November 2018, investors digested weak results reported for the third quarter of 2018, causing its stock price to drop. In the release, John Bean Technologies missed market expectations on earnings per share and revenue and cut guidance for the full year 2018. Part of the weakness stemmed from margins that faced input cost and freight pressures. We note that this issue impacted many industrials companies and is also likely transitory in nature, in our view. Fourth quarter 2018 results were better than consensus expectations both in earnings per share and revenue, causing the company’s shares to trend up. At the end of the Reporting Period, we did recognize some uncertainty related to tariffs and continued to monitor that situation carefully. However, we were still positive on the company as it works to execute on the secular growth theme of automation in food services. Furthermore, we believed John Bean Technologies would likely continue to benefit from potential acquisitions and its internal restructuring program, making it one of the most attractive long-term growth companies in the industrials sector, in our view. |
| Q | | How did the Fund use derivatives and similar instruments during the Reporting Period? |
| A | | During the Reporting Period, we did not use derivatives as part of an active management strategy. |
| Q | | Did the Fund make any significant purchases or sales during the Reporting Period? |
| A | | We initiated a Fund position in global diversified industrial manufacturing company Ingersoll-Rand during the Reporting Period. Ingersoll-Rand’s products range from complete air compressor systems, tools, plugs, material handling systems and more. We are positive on the company’s core heating, ventilation and air conditioning (“HVAC”) business on both the commercial and residential side. In our view, its management is working to sustain strong double-digit order book growth by focusing on investments in energy efficiency, building controls and taking advantage of favorable pricing power. We also view the company’s acquisition of Precision Flow Systems as a prudent capital allocation decision, as the asset finally became available after a decade of monitoring it, and its existing fluid control |
30
PORTFOLIO RESULTS
| | business and attractive end-market should further synergize with Ingersoll-Rand’s offerings and generate incremental cash flow, in our opinion. (End-market is used to indicate where the final transaction takes place in a value chain. Typically it is where the end-user is located, meaning the individual, organization, industry or region for whom the product or service has been created and who is not expected to resell that product or service.) |
| | We established a Fund position in construction company Martin Marietta Materials. The company engages in the provision of aggregates, including crushed stone, sand and gravel, through its network of quarries and distribution yards. We are positive on what we see as the company’s long path of pricing outperformance made available from its consolidation of its Texas and Colorado markets, given that aggregates is a local business with strong pricing power. As the top 74 aggregates players in the U.S. are only 14% of the market, this leaves decades of consolidation opportunities for this industry, in our view. We believe Martin Marietta Materials has proven to be a thoughtful management team for creating shareholder value through capital deployment, a strategy we see continuing. Finally, we recognize cyclical upside potential given the relatively depressed levels for aggregates production and the high probability of reaching 90% of the last cycle. |
| | Conversely, in addition to the sales already mentioned, we exited the Fund’s position in Dunkin’ Brands Group. After the company reported its fourth quarter 2018 earnings, in which it beat consensus earnings per share estimates but missed on revenues, we noticed a significant disconnect between the results and its management’s optimism around the business. Our outlook was more negative, as the company exhausted numerous strategies during 2018, but store traffic and same-store sales both remained soft. Given that the stock was a solid performer during the Reporting Period, we elected to sell the stock and reallocate gains to other businesses with what we viewed as more promising long-term growth prospects. |
| | We eliminated the Fund’s position in Global Payments, a provider of payment technology and software solutions. The company has a history of completing smaller debt-financed acquisitions, which we believe could potentially negatively impact its risk/reward profile as the cycle extends. As a result, we decided to exit the position and reallocate the capital to other high quality names in the payments space. |
| Q | | Were there any changes to the Fund’s portfolio management team during the Reporting Period? |
| A | | There were no changes to the Fund’s portfolio management team during the Reporting Period. |
| Q | | Were there any notable changes in the Fund’s weightings during the Reporting Period? |
| A | | In constructing the Fund’s portfolio, we focus on picking stocks rather than on making industry or sector bets. We seek to outpace the benchmark index by overweighting stocks that we expect to outperform and underweighting those that we think may lag. Consequently, changes in its sector weights are generally the direct result of individual stock selection or of stock appreciation or depreciation. That said, during the Reporting Period, the Fund’s exposure to health care, real estate, materials and industrials increased and its allocations to financials, consumer discretionary and information technology decreased relative to the Russell Index. The Fund’s position in cash decreased during the Reporting Period. |
| Q | | How was the Fund positioned relative to its benchmark index at the end of February 2019? |
| A | | At the end of February 2019, the Fund had overweighted positions relative to the Russell Index in the health care, consumer staples and energy sectors. On the same date, the Fund had underweighted positions compared to the Russell Index in information technology, communication services and consumer discretionary. The Fund was rather neutrally weighted to the Index in financials, real estate, materials and industrials and had no position at all in utilities at the end of the Reporting Period. |
31
FUND BASICS
Growth Opportunities Fund
as of February 28, 2019
| | | | | | | | | | |
| | PERFORMANCE REVIEW | |
| | | |
| | | September 1, 2018–February 28, 2019 | | Fund Total Return
(based on NAV)1 | | | Russell Midcap®
Growth Index2 | |
| | | |
| | Class A | | | -1.17 | % | | | -1.27 | % |
| | Class C | | | -1.52 | | | | -1.27 | |
| | Institutional | | | -0.96 | | | | -1.27 | |
| | Service | | | -1.24 | | | | -1.27 | |
| | Investor | | | -1.02 | | | | -1.27 | |
| | Class P | | | -0.97 | | | | -1.27 | |
| | Class R | | | -1.23 | | | | -1.27 | |
| | | Class R6 | | | -1.00 | | | | -1.27 | |
| | 1 | | The net asset value (“NAV”) represents the net assets of the class of the Fund (ex-dividend) divided by the total number of shares of the class outstanding. The Fund’s performance reflects the reinvestment of dividends and other distributions. The Fund’s performance does not reflect the deduction of any applicable sales charges. |
| | 2 | | The Russell Midcap® Growth Index is an unmanaged market capitalization weighted index that measures the performance of those Russell Midcap companies with higher price-to-book ratios and higher forecasted growth values. The Russell Midcap® Growth Index figures do not reflect any deduction for fees, expenses or taxes. It is not possible to invest directly in an index. |
| | | | | | | | | | | | | | | | | | | | |
| | STANDARDIZED TOTAL RETURNS3 |
| | | | | | |
| | | For the period ended 12/31/18 | | One Year | | | Five Years | | | Ten Years | | | Since Inception | | | Inception Date |
| | | | | | |
| | Class A | | | -10.54 | % | | | 3.74 | % | | | 12.96 | % | | | 9.65 | % | | 5/24/99 |
| | Class C | | | -6.94 | | | | 4.15 | | | | 12.75 | | | | 9.15 | | | 5/24/99 |
| | Institutional | | | -4.97 | | | | 5.31 | | | | 14.03 | | | | 10.39 | | | 5/24/99 |
| | Service | | | -5.44 | | | | 4.79 | | | | 13.47 | | | | 9.84 | | | 5/24/99 |
| | Investor | | | -5.08 | | | | 5.19 | | | | 13.88 | | | | 7.56 | | | 11/30/07 |
| | Class P | | | N/A | | | | N/A | | | | N/A | | | | -9.91 | | | 4/17/18 |
| | Class R | | | -5.53 | | | | 4.66 | | | | 13.32 | | | | 7.03 | | | 11/30/07 |
| | | Class R6 | | | -4.97 | | | | N/A | | | | N/A | | | | 3.70 | | | 7/31/15 |
| | 3 | | The Standardized Total Returns are average annual total returns or cumulative total returns (only if the performance period is one year or less) as of the most recent calendar quarter-end. They assume reinvestment of all distributions at NAV. These returns reflect a maximum initial sales charge of 5.5% for Class A Shares and the assumed contingent deferred sales charge for Class C Shares (1% if redeemed within 12 months of purchase). Effective July 30, 2018, Class C Shares convert automatically to Class A Shares on or about the fifteenth day of the last month of the calendar quarter that is ten years after the purchase date. Because Institutional, Service, Investor, Class P, Class R and Class R6 Shares do not involve a sales charge, such a charge is not applied to their Standardized Total Returns. |
The returns set forth in the tables above represent past performance. Past performance does not guarantee future results. The Fund’s investment return and principal value will fluctuate so that an investor’s shares, when redeemed, may be worth more or less than their original cost. Current performance may be lower or higher than the performance quoted above. Please visit our web site at www.GSAMFUNDS.com to obtain the most recent month-end returns.Performance reflects applicable fee waivers and/or expense limitations in effect during the periods shown. In their absence, performance would be reduced. Returns do not reflect the deduction of taxes that a shareholder would pay on Fund distributions or the redemption of Fund shares.
32
FUND BASICS
| | | | | | | | | | |
| | EXPENSE RATIOS4 | |
| | | |
| | | | | Net Expense Ratio (Current) | | | Gross Expense Ratio (Before Waivers) | |
| | | |
| | Class A | | | 1.24 | % | | | 1.37 | % |
| | Class C | | | 1.99 | | | | 2.12 | |
| | Institutional | | | 0.90 | | | | 0.98 | |
| | Service | | | 1.40 | | | | 1.48 | |
| | Investor | | | 0.99 | | | | 1.12 | |
| | Class P | | | 0.89 | | | | 0.97 | |
| | Class R | | | 1.49 | | | | 1.62 | |
| | | Class R6 | | | 0.89 | | | | 0.97 | |
| | 4 | | The expense ratios of the Fund, both current (net of applicable fee waivers and/or expense limitations) and before waivers (gross of applicable fee waivers and/or expense limitations) are as set forth above according to the most recent publicly available Prospectus for the Fund and may differ from the expense ratios disclosed in the Financial Highlights in this report. Pursuant to a contractual arrangement, the Fund’s waivers and/or expense limitations will remain in place through at least December 28, 2019, and prior to such date the investment adviser may not terminate the arrangements without the approval of the Fund’s Board of Trustees. If these arrangements are discontinued in the future, the expense ratios may change without shareholder approval. |
| | | | | | | | |
| | TOP TEN HOLDINGS AS OF 2/28/195 |
| | | |
| | | Holding | | % of Net Assets | | | Line of Business |
| | | |
| | ServiceNow, Inc. | | | 2.4 | % | | Software |
| | Dollar General Corp. | | | 2.3 | | | Multiline Retail |
| | Fiserv, Inc. | | | 2.3 | | | IT Services |
| | Amphenol Corp. Class A | | | 2.2 | | | Electronic Equipment, Instruments &
Components |
| | Align Technology, Inc. | | | 2.2 | | | Health Care Equipment & Supplies |
| | Ross Stores, Inc. | | | 2.0 | | | Specialty Retail |
| | GoDaddy, Inc. Class A | | | 1.7 | | | IT Services |
| | Harris Corp. | | | 1.7 | | | Aerospace & Defense |
| | Bright Horizons Family Solutions, Inc. | | | 1.7 | | | Diversified Consumer Services |
| | | Total System Services, Inc. | | | 1.7 | | | IT Services |
| | 5 | | The top 10 holdings may not be representative of the Fund’s future investments. |
33
FUND BASICS
|
| FUND VS. BENCHMARK SECTOR ALLOCATION6 |
|
| As of February 28, 2019 |
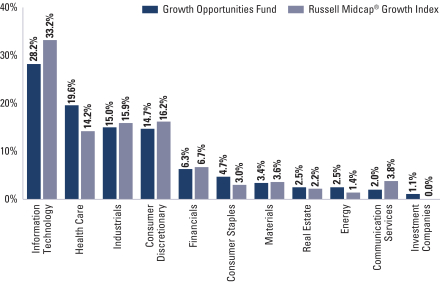
| | 6 | | The Fund is actively managed and, as such, its composition may differ over time. Consequently, the Fund’s overall sector allocations may differ from the percentages contained in the graph above. The graph categorizes investments using the Global Industry Classification Standard (“GICS”); however, the sector classifications used by the portfolio management team may differ from GICS. The percentage shown for each investment category reflects the value of investments in that category as a percentage of market value (excluding investments in the securities lending reinvestment vehicle, if any). Investments in the securities lending reinvestment vehicle represented 1.0% of the Fund’s net assets as of February 28, 2019. The graph depicts the Fund’s investments but may not represent the Fund’s market exposure due to the exclusion of certain derivatives, if any, as listed in the Additional Investment Information section of the Schedule of Investments. |
34
PORTFOLIO RESULTS
Goldman Sachs Small/Mid Cap Growth Fund
Portfolio Composition
The Fund invests, under normal circumstances, at least 80% of its net assets plus any borrowings for investment purposes (“Net Assets”) in a diversified portfolio of equity investments in small- and mid-cap issuers. Small- or mid-cap issuers are issuers with public stock capitalizations within the outside range of the market capitalizations of companies constituting the Russell 2000 Growth Index and the Russell Midcap Growth Index. As of September 30, 2018, the outside capitalization range of the companies in these indexes was between $12 million and $75 billion. Although the Fund invests primarily in publicly traded U.S. securities, it may invest up to 25% of its Net Assets in foreign securities, including securities of issuers in countries with emerging markets or economies and securities quoted in foreign currencies.
Portfolio Management Discussion and Analysis
Below, the Goldman Sachs Fundamental Equity U.S. Equity Team discusses the Goldman Sachs Small/Mid Cap Growth Fund’s (the “Fund”) performance and positioning for the six-month period ended February 28, 2019 (the “Reporting Period”).
| Q | | How did the Fund perform during the Reporting Period? |
| A | | During the Reporting Period, the Fund’s Class A, Class C, Institutional, Service, Investor, Class P, Class R and Class R6 Shares generated cumulative total returns, without sales charges, of-1.97%,-2.32%,-1.83%,-2.07%,-1.89%,-1.79%,-2.10% and-1.79%, respectively. These returns compare to the-6.06% cumulative total return of the Fund’s benchmark, the Russell 2500® Growth Index (with dividends reinvested) (the “Russell Index”), during the same period. |
| Q | | What key factors were responsible for the Fund’s performance during the Reporting Period? |
| A | | While the Fund generated negative absolute returns, it outperformed the Russell Index on a relative basis during the Reporting Period due primarily to effective stock selection. Sector allocation as a whole also contributed positively to relative performance, albeit more modestly. |
| Q | | Which equity market sectors most significantly affected Fund performance? |
| A | | Effective stock selection in the health care, information technology and consumer staples sectors helped the Fund’s performance most relative to the Russell Index. Having an overweighted allocation to information technology, which outperformed the Russell Index during the Reporting Period, also buoyed the Fund’s relative results. Detracting from relative results most during the Reporting Period were industrials, financials and materials, wherein stock selection was challenging. |
| Q | | What were some of the Fund’s best-performing individual stocks? |
| A | | Among those stocks the Fund benefited most from relative to the Russell Index were positions in commercial gene therapy firm Spark Therapeutics, oncology-focused biopharmaceutical company TESARO and medical technology company Teleflex. |
| | Spark Therapeutics’ shares spiked in late February 2019 after news broke that Swiss drug maker Roche Holding had agreed to acquire Spark Therapeutics for approximately $115 per share, representing a total equity value of about $5 billion. Given that Spark Therapeutics had a market value of just under $2 billion at the prior session’s close, its stock price more than doubled upon the announcement. With this in mind, we felt the valuation for Spark Therapeutics became less attractive and opted to sell the Fund’s position and allocate the gains to what we saw as more appealing risk/reward opportunities. |
| | Shares of TESARO jumped in early December 2018 after the company announced it had agreed to a $5.1 billion takeover bid from British pharmaceuticals giant GlaxoSmithKline. We believe this acquisition was driven by TESARO’s Food and Drug Administration-approved ovarian cancer drug Zejula. Zejula belongs to a fairly new class of medicines, and it is in clinical trials for other high-value indications, such as breast and prostate cancers. Following this positive development, we sold the Fund’s shares in TESARO to realize the gains and reallocate them to other opportunities. |
35
PORTFOLIO RESULTS
| | Teleflex’s stock experienced a volatile window of trading during the fourth quarter of 2018, much like the broader market. Its shares spiked on the first day of November 2018 after the company reported earnings per share, revenues and organic growth for the third quarter of 2018 that exceeded consensus expectations. In addition to the strong results, its management also provided solid guidance for both its core business and recent acquisitions. The strong earnings were received well by investors following the company’s second quarter 2018 miss. While the stock ended the fourth quarter of 2018 slightly down, we viewed the earnings release as a thesis-confirming report, as Teleflex appears to be working to transform into a higher growth business led by a strong product pipeline and recent acquisitions. In February 2019, Teleflex reported its fourth quarter 2018 results in which it beat consensus expectations for earnings per share with revenue in line. On the back of the strong earnings results, its shares rallied to end the month. At the end of the Reporting Period, we felt Teleflex was well positioned to capitalize on the evolving trends in medical purchasing, as improved patient outcomes and reduced hospital stays become more of a priority. Furthermore, we felt its deep product pipeline lays a healthy groundwork for future growth as its management continues to allocate capital into key disease markets. Overall, we thought Teleflex was a high quality growth company with strong cash flows, and we felt good about its opportunity to expand margins as it works to benefit from secular growth themes. |
| Q | | Which stocks detracted significantly from the Fund’s performance during the Reporting Period? |
| A | | Among those stocks detracting most from the Fund’s results relative to the Russell Index were positions in John Bean Technologies, Take-Two Interactive Software and Vail Resorts. |
| | John Bean Technologies is a technology solutions provider in the food, beverage and air transportation industries. In November 2018, investors digested weak results reported for the third quarter of 2018, causing its stock price to drop. In the release, John Bean Technologies missed market expectations on earnings per share and revenue and cut guidance for the full year 2018. Part of the weakness stemmed from margins that faced input cost and freight pressure. We note that this issue impacted many industrials companies and is also likely transitory in nature, in our view. Fourth quarter 2018 results were better than consensus expectations both in earnings per share and revenue, causing the company’s shares to trend up. At the end of the Reporting Period, we did recognize some uncertainty related to tariffs and continued to monitor that situation carefully. However, we were still positive on the company as it works to execute on the secular growth theme of automation in food services. Furthermore, we believed John Bean Technologies would likely continue to benefit from potential acquisitions and its internal restructuring program, making it one of the most attractive long-term growth companies in the industrials sector, in our view. |
| | Shares of gaming company Take-Two Interactive Software were down alongside the gaming industry during the Reporting Period, as Epic Games’ Fortnite Battle Royale, a free-to-play last player standing game, took the gaming world by storm. As a result of Fortnite’s popularity, earnings and revenue expectations came down for the gaming industry broadly, weighing on Take-Two Interactive Software’s shares. Despite the competitive challenges, we continued to like Take-Two Interactive Software at the end of the Reporting Period, as we believe the company has a favorable long-term secular outlook given its user growth and deep pipeline of successful franchises, headlined by Red Dead Redemption, Grand Theft Auto and NBA 2K. Additionally, as the purchase method mix has shifted from hard copies to digital downloads, such a trend has acted as a tailwind to the company’s margins and, we believe, ultimately, its earnings growth. Finally, following a difficult Reporting Period, we believed the company and the gaming industry were trading at attractive valuations at the end of the Reporting Period. |
| | Vail Resorts is a mountain resort operator. In late September 2018, the company reported results for its fiscal fourth quarter of 2018, in which its earnings per share beat market expectations but its revenue fell short, prompting a sell-off. Its shares regained some value during the next couple of months until Vail Resorts reported an even weaker quarter of performance in December 2018, missing both revenue and earnings per share consensus estimates. Its stock took a meaningful dip upon the release. Then, in January 2019, the company reported it had missed expectations for destination guest visitation in the pre-holiday period and thus its full-year earnings before interest, taxes, depreciation and amortization guidance would be slightly below the range it had previously provided. After that miss, a couple of research analysts downgraded the stock, further weighing on its shares. We did not necessarily share the same view that the company was fundamentally troubled. Instead, we viewed the soft performance as largely transitory. One possible explanation is that the visitation weakness actually stemmed from stock market volatility in the fourth calendar |
36
PORTFOLIO RESULTS
| | quarter, which led investors to rein in impulse spending when their assets were not performing well. Furthermore, in the same January 2019 announcement, the company reported certain ski season metrics, including total lift ticket revenue, ski school revenue and total skier visits for the company’s North American mountain resorts that all grew healthily season-to-date. Improved conditions across western U.S. resorts helped drive this strong rebound and also helped reinforce to us that Vail Resorts continues to deliver excellent guest services as the premier mountain resort company in the world. |
| Q | | How did the Fund use derivatives and similar instruments during the Reporting Period? |
| A | | During the Reporting Period, we did not use derivatives as part of an active management strategy. |
| Q | | Did the Fund make any significant purchases or sales during the Reporting Period? |
| A | | We initiated a Fund position in health care saving solutions company HealthEquity. We believe the company is one of the top players in the industry given its broad market share and efforts to enhance its competitive position through an array of partnerships. We feel HealthEquity’s business model provides downside protection and augments the company’s defensive growth characteristics during times of more volatile markets. Overall, we view HealthEquity as a high quality company with favorable risk/reward characteristics and are positive on its prospects moving forward. |
| | We established a Fund position in exchange operator Cboe Global Markets, which engages in the provision of trading and investment solutions. We see a solid path for the company to grow revenue beyond potential macro tailwinds. Furthermore, we are encouraged by its management’s commentary around the launch of new products where incremental costs are limited given the scale and depth that Cboe Global Markets already has in its transaction business. Overall, we are positive on the state of the business and its opportunity path to growth moving forward. |
| | Conversely, in addition to those sales mentioned earlier, we exited the Fund’s position in L3 Technologies. The company provides communication and electronic systems used on military, homeland security and commercial platforms. In October 2018, L3 Technologies announced a merger of equals with Harris Corp. While we are positive on the merger and the synergies it could create, the resulting company will end with a higher market capitalization than the Fund’s mandate allows. Therefore, we sold the position. |
| | We eliminated the Fund’s position in construction materials company Summit Materials. In early August 2018, just before the start of the Reporting Period, its stock had fallen sharply following the company’s quarterly earnings release. Despite beating market expectations on revenue, the company missed market expectations on earnings per share by a significant margin. These operational struggles persisted throughout the latter part of 2018 and into early 2019. In February 2019, Summit Materials announced it had missed earnings per share and revenue market estimates for the fourth quarter of 2018. Given these fundamental struggles, we decided to sell the Fund’s position and reallocate capital to other industrials companies with what we considered to be more attractive risk/reward profiles. |
| Q | | Were there any changes to the Fund’s portfolio management team during the Reporting Period? |
| A | | In February 2019, Michael DeSantis, vice president and portfolio manager of the Fund, left the firm to pursue another opportunity. Also, Daniel Zimmerman, managing director and portfolio manager of the Fund, left the firm in February 2019. Effective February 4, 2019, Jessica Katz became a portfolio manager of the Fund. Also, effective February 25, 2019, Steven Barry assumed portfolio management responsibilities on an interim basis while we initiate a talent search for additional senior resources. Previously, Steven Barry had been a portfolio manager for the Small/Mid Cap Growth strategy for more than a decade. Steven Barry also remains the chief investment officer of the Fundamental Equity US Equity team and of Fundamental Equity globally, overseeing more than $50 billion in assets under supervision as of December 31, 2018. |
| Q | | Were there any notable changes in the Fund’s weightings during the Reporting Period? |
| A | | In constructing the Fund’s portfolio, we focus on picking stocks rather than on making industry or sector bets. We seek to outpace the benchmark index by overweighting stocks that we expect to outperform and underweighting those that we think may lag. Consequently, changes in its sector weights are generally the direct result of individual stock selection or of stock appreciation or depreciation. That said, during the Reporting Period, the Fund’s exposure to health care increased and its allocations to information technology, energy and consumer discretionary decreased relative to the Russell Index. The Fund’s position in cash increased during the Reporting Period. |
37
PORTFOLIO RESULTS
| Q | | How was the Fund positioned relative to its benchmark index at the end of February 2019? |
| A | | At the end of February 2019, the Fund had overweighted positions relative to the Russell Index in the information technology, health care and financials sectors. On the same date, the Fund had underweighted positions compared to the Russell Index in consumer discretionary, industrials, materials, real estate and communication services. The Fund was rather neutrally weighted to the Russell Index in consumer staples and energy and had no position at all in utilities at the end of the Reporting Period. |
38
FUND BASICS
Small/Mid Cap Growth Fund
as of February 28, 2019
| | | | | | | | | | |
| | PERFORMANCE REVIEW | |
| | | |
| | | September 1, 2018–February 28, 2019 | | Fund Total Return
(based on NAV)1 | | | Russell 2500®
Growth Index2 | |
| | | |
| | Class A | | | -1.97 | % | | | -6.06 | % |
| | Class C | | | -2.32 | | | | -6.06 | |
| | Institutional | | | -1.83 | | | | -6.06 | |
| | Service | | | -2.07 | | | | -6.06 | |
| | Investor | | | -1.89 | | | | -6.06 | |
| | Class P | | | -1.79 | | | | -6.06 | |
| | Class R | | | -2.10 | | | | -6.06 | |
| | | Class R6 | | | -1.79 | | | | -6.06 | |
| | 1 | | The net asset value (“NAV”) represents the net assets of the class of the Fund(ex-dividend) divided by the total number of shares of the class outstanding. The Fund’s performance reflects the reinvestment of dividends and other distributions. The Fund’s performance does not reflect the deduction of any applicable sales charges. |
| | 2 | | The Russell 2500®Growth Index is an unmanaged index that measures the performance of the small tomid-cap growth segment of the US equity universe. The Russell 2500®Growth Index is constructed to provide a comprehensive and unbiased barometer of the small- tomid-cap growth market. Based on ongoing empirical research of investment manager behavior, the methodology used to determine growth probability approximates the aggregate small- tomid-cap growth manager’s opportunity set. The Russell 2500®Growth Index figures do not reflect any deduction for fees, expenses or taxes. It is not possible to invest directly in an index. |
| | | | | | | | | | | | | | | | | | | | |
| | STANDARDIZED TOTAL RETURNS3 |
| | | | | | |
| | | For the period ended 12/31/18 | | One Year | | | Five Years | | | Ten Years | | | Since Inception | | | Inception Date |
| | | | | | |
| | Class A | | | -10.97 | % | | | 4.40 | % | | | 14.07 | % | | | 8.89 | % | | 6/30/05 |
| | Class C | | | -7.51 | | | | 4.78 | | | | 13.85 | | | | 8.49 | | | 6/30/05 |
| | Institutional | | | -5.54 | | | | 5.98 | | | | 15.16 | | | | 9.74 | | | 6/30/05 |
| | Service | | | -6.01 | | | | 5.44 | | | | 14.59 | | | | 9.19 | | | 6/30/05 |
| | Investor | | | -5.61 | | | | 5.84 | | | | 15.00 | | | | 8.48 | | | 11/30/07 |
| | Class P | | | N/A | | | | N/A | | | | N/A | | | | -10.76 | | | 4/17/18 |
| | Class R | | | -6.07 | | | | 5.31 | | | | 14.43 | | | | 7.94 | | | 11/30/07 |
| | | Class R6 | | | -5.53 | | | | N/A | | | | N/A | | | | 2.48 | | | 7/31/15 |
| | 3 | | The Standardized Total Returns are average annual total returns or cumulative total returns (only if the performance period is one year or less) as of the most recent calendarquarter-end. They assume reinvestment of all distributions at NAV. These returns reflect a maximum initial sales charge of 5.5% for Class A Shares and the assumed contingent deferred sales charge for Class C Shares (1% if redeemed within 12 months of purchase). Effective July 30, 2018, Class C Shares convert automatically to Class A Shares on or about the fifteenth day of the last month of the calendar quarter that is ten years after the purchase date. Because Institutional, Service, Investor, Class P, Class R and Class R6 Shares do not involve a sales charge, such a charge is not applied to their Standardized Total Returns. |
The returns set forth in the tables above represent past performance. Past performance does not guarantee future results. The Fund’s investment return and principal value will fluctuate so that an investor’s shares, when redeemed, may be worth more or less than their original cost. Current performance may be lower or higher than the performance quoted above. Please visit our web site at www.GSAMFUNDS.com to obtain the most recentmonth-end returns.Performance reflects applicable fee waivers and/or expense limitations in effect during the periods shown. In their absence, performance would be reduced. Returns do not reflect the deduction of taxes that a shareholder would pay on Fund distributions or the redemption of Fund shares.
39
FUND BASICS
| | | | | | | | | | |
| | EXPENSE RATIOS4 | |
| | | |
| | | | | Net Expense Ratio (Current) | | | Gross Expense Ratio (Before Waivers) | |
| | | |
| | Class A | | | 1.24 | % | | | 1.31 | % |
| | Class C | | | 1.99 | | | | 2.06 | |
| | Institutional | | | 0.92 | | | | 0.92 | |
| | Service | | | 1.42 | | | | 1.42 | |
| | Investor | | | 0.99 | | | | 1.06 | |
| | Class P | | | 0.91 | | | | 0.91 | |
| | Class R | | | 1.49 | | | | 1.56 | |
| | | Class R6 | | | 0.91 | | | | 0.91 | |
| | 4 | | The expense ratios of the Fund, both current (net of applicable fee waivers and/or expense limitations) and before waivers (gross of applicable fee waivers and/or expense limitations) are as set forth above according to the most recent publicly available Prospectus for the Fund and may differ from the expense ratios disclosed in the Financial Highlights in this report. Pursuant to a contractual arrangement, the Fund’s waivers and/or expense limitations for the applicable share classes will remain in place through at least December 28, 2019, and prior to such date the investment adviser may not terminate the arrangements without the approval of the Fund’s Board of Trustees. If these arrangements are discontinued in the future, the expense ratios may change without shareholder approval. |
| | | | | | | | |
| | TOP TEN HOLDINGS AS OF 2/28/195 |
| | | |
| | | Holding | | % of Net Assets | | | Line of Business |
| | | |
| | GoDaddy, Inc. Class A | | | 2.1 | % | | IT Services |
| | Cadence Design Systems, Inc. | | | 1.9 | | | Software |
| | Black Knight, Inc. | | | 1.8 | | | IT Services |
| | HealthEquity, Inc. | | | 1.8 | | | Health Care Providers & Services |
| | Bright Horizons Family Solutions, Inc. | | | 1.8 | | | Diversified Consumer Services |
| | The Ultimate Software Group, Inc. | | | 1.7 | | | Software |
| | PTC, Inc. | | | 1.6 | | | Software |
| | Global Payments, Inc. | | | 1.6 | | | IT Services |
| | Eagle Bancorp, Inc. | | | 1.6 | | | Banks |
| | | MGP Ingredients, Inc. | | | 1.6 | | | Beverages |
| | 5 | | The top 10 holdings may not be representative of the Fund’s future investments. |
40
FUND BASICS
|
| FUND VS. BENCHMARK SECTOR ALLOCATION6 |
|
| As of February 28, 2019 |
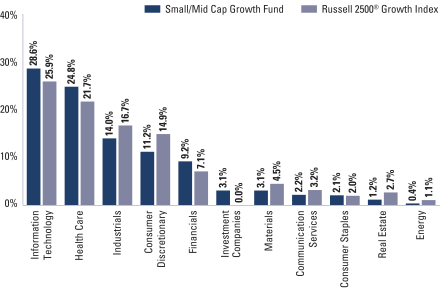
| | 6 | | The Fund is actively managed and, as such, its composition may differ over time. Consequently, the Fund’s overall sector allocations may differ from the percentages contained in the graph above. The graph categorizes investments using the Global Industry Classification Standard (“GICS”), however, the sector classifications used by the portfolio management team may differ from GICS. The percentage shown for each investment category reflects the value of investments in that category as a percentage of market value (excluding investments in the securities lending reinvestment vehicle, if any). Investments in the securities lending reinvestment vehicle represented 1.9% of the Fund’s net assets as of February 28, 2019. The graph depicts the Fund’s investments but may not represent the Fund’s market exposure due to the exclusion of certain derivatives, if any, as listed in the Additional Investment Information section of the Schedule of Investments. |
41
PORTFOLIO RESULTS
Goldman Sachs Strategic Growth Fund
Portfolio Composition
The Fund invests primarily in U.S. equity investments. The Fund seeks to achieve its investment objective of seeking long-term growth of capital by investing, under normal circumstances, in companies that are considered by the Investment Adviser to be positioned for long-term growth. The Fund’s fundamental equity growth investment process involves evaluating potential investments based on specific characteristics believed to indicate a high-quality business with sustainable growth, including strong business franchises, favorable long-term prospects, and excellent management.
Portfolio Management Discussion and Analysis
Below, the Goldman Sachs Fundamental Equity U.S. Equity Team discusses the Goldman Sachs Strategic Growth Fund’s (the “Fund”) performance and positioning for the six-month period ended February 28, 2019 (the “Reporting Period”).
| Q | | How did the Fund perform during the Reporting Period? |
| A | | During the Reporting Period, the Fund’s Class A, Class C, Institutional, Service, Investor, Class P, Class R and Class R6 Shares generated cumulative total returns, without sales charges, of-4.04%,-4.29%,-3.85%,-4.12%, -3.94%,-3.82%,-4.15% and-3.84%, respectively. These returns compare to the-4.52% cumulative total return of the Fund’s benchmark, the Russell 1000® Growth Index (with dividends reinvested) (the “Russell Index”), during the same period. |
| Q | | What key factors were responsible for the Fund’s performance during the Reporting Period? |
| A | | While the Fund generated negative absolute returns, it outperformed the Russell Index on a relative basis during the Reporting Period due primarily to effective stock selection. Sector allocation as a whole detracted from relative performance, albeit modestly. |
| Q | | Which equity market sectors most significantly affected Fund performance? |
| A | | The sectors that contributed most positively to the Fund’s relative performance during the Reporting Period were health care, communication services and consumer staples, wherein effective stock selection drove results. Challenging stock selection in financials and industrials detracted from the Fund’s relative results most during the Reporting Period. Having an overweighted allocation to energy, which was the weakest sector in the Russell Index by a wide margin during the Reporting Period, also dampened the Fund’s relative performance. |
| Q | | What were some of the Fund’s best-performing individual stocks? |
| A | | Among those stocks the Fund benefited most from relative to the Russell Index were positions in medical equipment company Danaher, health care equipment and services company Agilent Technologies and pharmaceutical company Eli Lilly. |
| | In November 2018, Danaher’s stock was driven less by company-specific events but rather rose along with the health care equipment industry as a whole. Then, in February 2019, Danaher announced an agreement with General Electric (“GE”) to acquire the biopharmaceutical business of GE Life Sciences. The market’s reception of the deal was overwhelmingly positive, and Danaher’s shares climbed through the end of the month. We were also highly optimistic about the transaction, which makes Danaher the largest player within bioprocessing and gives the company a multi-year value creation opportunity through potential top-line acceleration and cost savings. GE Life Sciences is a high quality asset, and in our opinion, significantly improves Danaher’s positioning within the biopharmaceutical industry. With this in mind, at the end of the Reporting Period, we had renewed confidence that Danaher is a high quality company, led by what we see as an outstanding management team, that generates solid free cash flow and has high barriers to entry in its key business segments. |
| | Shares of Agilent Technologies rallied in November 2018 following an earnings release in which the company reported both earnings per share and revenues that exceeded consensus estimates. The results were primarily driven by broad-based strength across products and an acceleration of its business in China, which investors viewed positively. The |
42
PORTFOLIO RESULTS
| | company’s stock also performed well in January 2019, buoyed by solid performance by the health care sector more broadly. At the end of the Reporting Period, we were encouraged by the company’s recent earnings reports and continued to believe Agilent Technologies presented an attractive growth story. We felt the combination of an innovative product pipeline and productivity enhancement initiatives provided a potential runway for revenue growth and margin expansion. |
| | Eli Lilly’s stock climbed through most of November 2018 after the company reported solid quarterly results in which it beat consensus earnings per share and revenue expectations and also raised guidance for the full year 2018. Then, in December 2018, Eli Lilly shares benefited from the announcement of better than market expected 2019 guidance, featuring significant improvements in revenue growth and long-term sales growth. The company had a volatile month of trading in January 2019, finishing the month in positive territory but lagging the health care sector as well as the broad U.S. equity market. Early on, a negative headline on drug pricing pressured the stock along with that of other pharmaceutical companies. Then news of Eli Lilly’s acquisition of Loxo Oncology, a cancer drug company, helped give a boost to its shares. These gains were quickly erased after a phase 3 soft tissue study did not meet its primary objective, leading the Food and Drug Administration to recommend new patients not start using the drug. All in all, we viewed January 2019 as a month of primarily short-term trading noise that did not alter the underlying fundamentals of the company or why we favor it. At the end of the Reporting Period, we believed the company maintained strong risk/reward prospects versus its peers, and we saw an upside to its diabetes franchise. We were also optimistic about its management’s commitment to creating shareholder value through increased dividends and share repurchases. Additionally, we viewed the company’s split with Elanco, its former animal health business segment, as value accretive. Overall, we viewed Eli Lilly as a high quality pharmaceuticals business with leading franchises, a robust drug pipeline and an improving financial profile. |
| Q | | Which stocks detracted significantly from the Fund’s performance during the Reporting Period? |
| A | | Among the stocks detracting most from the Fund’s results relative to the Russell Index were transportation and logistics company XPO Logistics, consumer staples giant Kraft Heinz and apparel and footwear company PVH. |
| | While there were no stock-specific reasons for the decline in XPO Logistics’ share price during a volatile October 2018, the company, along with others in the industrials and freight industries, underperformed for the month. In mid-December 2018, a hedge fund issued a report that sent XPO Logistics’ shares tumbling more than 26% in one day. We were not particularly troubled by our initial read-through of the analysis but recognized several aspects that warranted follow up. After assessing various factors, we confirmed our previously held view that XPO Logistics’ business was well aligned with the structural changes in the freight industry, such as outsourcing and labor-saving technology, e-commerce exposure and the implementation of electronic logging devices. The market eventually recognized this as well, and its shares recovered all of the losses prompted by the hedge fund report. However, unrelated to the report, XPO Logistics’ stock tumbled in February 2019 after the company released its fourth quarter 2018 earnings report that revealed results below market estimates on earnings per share, revenue and 2019 guidance. Its management cited a reduction in business from its largest client, expressing it would negatively impact its growth for 2019. These developments led us to exit the Fund’s position in XPO Logistics. |
| | Nearly all of Kraft Heinz’ stock price decline occurred at the end of February 2019. The stock plummeted after the company reported quarterly earnings that missed market estimates across all metrics. Furthermore, Kraft Heinz cut its dividend by approximately one-third, announced a $15 billion goodwill impairment* and reported it had received a subpoena from the Securities and Exchange Commission. Following the report, we decided to exit the Fund’s position, as we viewed this as a thesis-changing event and believed there were better opportunities elsewhere. |
| | PVH designs and manufactures apparel and footwear through a variety of brand names. Amidst a more challenging environment for retail during the fourth quarter of 2018, PVH reported mixed results in November 2018. While its earnings per share and revenue were higher, its Calvin Klein |
| | * | | Goodwill impairment is an earnings charge that companies record on their income statements after they identify that there is persuasive evidence that the asset associated with the goodwill can no longer demonstrate financial results that were expected from it at the time of its purchase. Because many companies acquire other firms and pay a price that exceeds the fair value of identifiable assets and liabilities that the acquired firm possesses, the difference between the purchase price and the fair value of acquired assets is recorded as goodwill. However, if unforeseen circumstances arise that decrease expected cash flows from acquired assets, their fair value can be lower than what was originally paid for them, and a company must book a goodwill impairment. |
43
PORTFOLIO RESULTS
| | sales were disappointing for the second consecutive quarter. PVH’s stock slid throughout December 2018 alongside the broader market, which experienced heightened volatility. Despite the weakness in the stock, we remained positive on PVH at the end of the Reporting Period given its geographic diversity and global growth potential. We also believed the company was well positioned given its recognizable brand names and what we viewed as its strong balance sheet and good free cash flow generation. |
| Q | | How did the Fund use derivatives and similar instruments during the Reporting Period? |
| A | | During the Reporting Period, we did not use derivatives as part of an active management strategy. |
| Q | | Did the Fund make any significant purchases or sales during the Reporting Period? |
| A | | During the Reporting Period, we initiated a Fund position in Accenture. We feel the company is positioned as a leading information technology implementation company in digital and new age technologies, including cloud software as a service, analytics and security. We also feel the company’s relationships, combined with its consulting practice, give it a competitive advantage when compared to traditional outsourcing peers, as Accenture is involved early in deals. Lastly, we feel the company’s balanced capital allocation towards merger and acquisition and capital returns allows it to invest in new practices. |
| | We established a Fund position in Deere & Co. We are positive on the outlook for the company’s largest and most profitable end-market, North American agricultural equipment. (End-market is used to indicate where the final transaction takes place in a value chain. Typically it is where the end-user is located, meaning the individual, organization, industry or region for whom the product or service has been created and who is not expected to resell that product or service.) We believe the segment is beginning to recover from recent trough levels and that Deere & Co. is well positioned to capitalize on a potential recovery. In our view, the company has a strong balance sheet and robust return on equity. It also saw increased share repurchases in 2018. Overall, we believe Deere & Co. is a high quality company with an attractive outlook. |
| | Conversely, in addition to those sales already mentioned, we exited the Fund’s position in pharmaceutical company Shire during the Reporting Period. In December 2018, it was announced that Takeda Pharmaceutical shareholders voted to approve the company’s acquisition of Shire. Following the approval of the acquisition and the stock’s strong performance, we decided to sell the position and reallocate the capital elsewhere. |
| | We eliminated the Fund’s position in Global Payments, a provider of payment technology and software solutions. The company has a history of completing smaller debt-financed acquisitions, which we believe could potentially negatively impact its risk/reward profile as the cycle extends. As a result, we decided to exit the position and reallocate the capital to other high quality names in the payments space. |
| Q | | Were there any changes to the Fund’s portfolio management team during the Reporting Period? |
| A | | There were no changes to the Fund’s portfolio management team during the Reporting Period. |
| Q | | Were there any notable changes in the Fund’s weightings during the Reporting Period? |
| A | | In constructing the Fund’s portfolio, we focus on picking stocks rather than on making industry or sector bets. We seek to outpace the benchmark index by overweighting stocks that we expect to outperform and underweighting those that we think may lag. Consequently, changes in its sector weights are generally the direct result of individual stock selection or of stock appreciation or depreciation. That said, during the Reporting Period, the Fund’s exposure to health care and financials increased and its allocations to information technology and consumer discretionary decreased relative to the Russell Index. |
| Q | | How was the Fund positioned relative to its benchmark index at the end of February 2019? |
| A | | At the end of February 2019, the Fund had overweighted allocations relative to the Russell Index in health care and energy and underweighted positions compared to the Russell Index in information technology, consumer discretionary, industrials and financials. The Fund was rather neutrally weighted in the materials, consumer staples, real estate and communication services sectors of the Russell Index and had no position at all in utilities at the end of the Reporting Period. |
44
FUND BASICS
Strategic Growth Fund
as of February 28, 2019

| | | | | | | | | | |
| | PERFORMANCE REVIEW | |
| | | |
| | | September 1, 2018–February 28, 2019 | | Fund Total Return
(based on NAV)1 | | | Russell 1000®
Growth Index2 | |
| | | |
| | Class A | | | -4.04 | % | | | -4.52 | % |
| | Class C | | | -4.29 | | | | -4.52 | |
| | Institutional | | | -3.85 | | | | -4.52 | |
| | Service | | | -4.12 | | | | -4.52 | |
| | Investor | | | -3.94 | | | | -4.52 | |
| | Class P | | | -3.82 | | | | -4.52 | |
| | Class R | | | -4.15 | | | | -4.52 | |
| | | Class R6 | | | -3.84 | | | | -4.52 | |
| | 1 | | The net asset value (“NAV”) represents the net assets of the class of the Fund(ex-dividend) divided by the total number of shares of the class outstanding. The Fund’s performance reflects the reinvestment of dividends and other distributions. The Fund’s performance does not reflect the deduction of any applicable sales charges. |
| | 2 | | The Russell 1000® Growth Index is an unmanaged index that measures the performance of those Russell 1000® companies with higherprice-to-book ratios and higher forecasted growth values. The Russell 1000® Growth Index figures do not reflect any deduction for fees, expenses or taxes. It is not possible to invest directly in an index. |
| | | | | | | | | | | | | | | | | | | | |
| | STANDARDIZED TOTAL RETURNS3 |
| | | | | | |
| | | For the period ended 12/31/18 | | One Year | | | Five Years | | | Ten Years | | | Since Inception | | | Inception Date |
| | | | | | |
| | Class A | | | -7.07 | % | | | 7.42 | % | | | 13.25 | % | | | 4.18 | % | | 5/24/99 |
| | Class C | | | -3.27 | | | | 7.88 | | | | 13.06 | | | | 3.72 | | | 5/24/99 |
| | Institutional | | | -1.22 | | | | 9.10 | | | | 14.35 | | | | 4.90 | | | 5/24/99 |
| | Service | | | -1.64 | | | | 8.57 | | | | 13.80 | | | | 4.46 | | | 5/24/99 |
| | Investor | | | -1.29 | | | | 8.94 | | | | N/A | | | | 13.50 | | | 1/6/09 |
| | Class P | | | N/A | | | | N/A | | | | N/A | | | | -7.27 | | | 4/17/18 |
| | Class R | | | -1.82 | | | | 8.42 | | | | N/A | | | | 12.99 | | | 1/6/09 |
| | | Class R6 | | | -1.15 | | | | N/A | | | | N/A | | | | 7.50 | | | 7/31/15 |
| | 3 | | The Standardized Total Returns are average annual total returns or cumulative total returns (only if the performance period is one year or less) as of the most recent calendarquarter-end. They assume reinvestment of all distributions at NAV. These returns reflect a maximum initial sales charge of 5.5% for Class A Shares and the assumed contingent deferred sales charge for Class C Shares (1% if redeemed within 12 months of purchase). Effective July 30, 2018, Class C Shares convert automatically to Class A Shares on or about the fifteenth day of the last month of the calendar quarter that is ten years after the purchase date. Because Institutional, Service, Investor, Class P, Class R and Class R6 Shares do not involve a sales charge, such a charge is not applied to their Standardized Total Returns. |
The returns set forth in the tables above represent past performance. Past performance does not guarantee future results. The Fund’s investment return and principal value will fluctuate so that an investor’s shares, when redeemed, may be worth more or less than their original cost. Current performance may be lower or higher than the performance quoted above. Please visit our web site at www.GSAMFUNDS.com to obtain the most recentmonth-end returns.Performance reflects applicable fee waivers and/or expense limitations in effect during the periods shown. In their absence, performance would be reduced. Returns do not reflect the deduction of taxes that a shareholder would pay on Fund distributions or the redemption of Fund shares.
45
FUND BASICS
| | | | | | | | | | |
| | EXPENSE RATIOS4 | |
| | | |
| | | | | Net Expense Ratio (Current) | | | Gross Expense Ratio (Before Waivers) | |
| | | |
| | Class A | | | 1.14 | % | | | 1.28 | % |
| | Class C | | | 1.89 | | | | 2.03 | |
| | Institutional | | | 0.75 | | | | 0.89 | |
| | Service | | | 1.25 | | | | 1.39 | |
| | Investor | | | 0.89 | | | | 1.03 | |
| | Class P | | | 0.74 | | | | 0.88 | |
| | Class R | | | 1.39 | | | | 1.53 | |
| | | Class R6 | | | 0.74 | | | | 0.88 | |
| | 4 | | The expense ratios of the Fund, both current (net of applicable fee waivers and/or expense limitations) and before waivers (gross of applicable fee waivers and/or expense limitations) are as set forth above according to the most recent publicly available Prospectus for the Fund and may differ from the expense ratios disclosed in the Financial Highlights in this report. Pursuant to a contractual arrangement, the Fund’s waivers and/or expense limitations will remain in place through at least December 28, 2019, and prior to such date the investment adviser may not terminate the arrangements without the approval of the Fund’s Board of Trustees. If these arrangements are discontinued in the future, the expense ratios may change without shareholder approval. |
| | | | | | | | |
| | TOP TEN HOLDINGS AS OF 2/28/195 |
| | | |
| | | Holding | | % of Net Assets | | | Line of Business |
| | | |
| | Microsoft Corp. | | | 5.8 | % | | Software |
| | Apple, Inc. | | | 5.6 | | | Technology Hardware, Storage & Peripherals |
| | Amazon.com, Inc. | | | 4.6 | | | Internet & Direct Marketing Retail |
| | Facebook, Inc. Class A | | | 3.8 | | | Interactive Media & Services |
| | Alphabet, Inc. Class A | | | 3.1 | | | Interactive Media & Services |
| | Visa, Inc. Class A | | | 2.9 | | | IT Services |
| | The Boeing Co. | | | 2.4 | | | Aerospace & Defense |
| | Alphabet, Inc. Class C | | | 2.3 | | | Interactive Media & Services |
| | Mastercard, Inc. Class A | | | 2.1 | | | IT Services |
| | | salesforce.com, Inc. | | | 2.0 | | | Software |
| | 5 | | The top 10 holdings may not be representative of the Fund’s future investments. |
46
FUND BASICS
|
| FUND VS. BENCHMARK SECTOR ALLOCATION6 |
|
| As of February 28, 2019 |
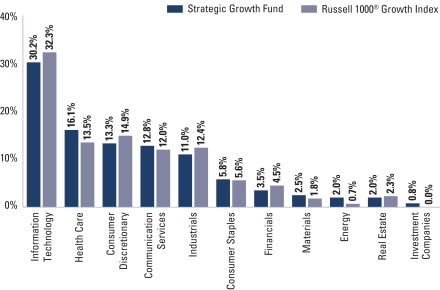
| | 6 | | The Fund is actively managed and, as such, its composition may differ over time. Consequently, the Fund’s overall sector allocations may differ from the percentages contained in the graph above. The graph categorizes investments using the Global Industry Classification Standard (“GICS”), however, the sector classifications used by the portfolio management team may differ from GICS. The percentage shown for each investment category reflects the value of investments in that category as a percentage of market value (excluding investments in the securities lending reinvestment vehicle, if any). Investments in the securities lending reinvestment vehicle represented 0.3% of the Fund’s net assets as of February 28, 2019. The graph depicts the Fund’s investments but may not represent the Fund’s market exposure due to the exclusion of certain derivatives, if any, as listed in the Additional Investment Information section of the Schedule of Investments. |
47
PORTFOLIO RESULTS
Goldman Sachs Technology Opportunities Fund
Portfolio Composition
The Fund invests, under normal circumstances, at least 80% of its net assets plus any borrowing for investment purposes (measured at time of purchase) in equity investments in technology companies. The Fund seeks to achieve its investment objective by investing, under normal circumstances, in companies that are considered by the Investment Adviser to benefit from the proliferation of technology. Although the Fund invests primarily in publicly traded U.S. securities, it may invest up to 25% of its total assets measured at the time of purchase in foreign securities, including securities of issuers in countries with emerging markets or economies and securities quoted in foreign currencies. The Fund may also invest in privately held companies and companies that only recently began to trade publicly.
Portfolio Management Discussion and Analysis
Below, the Goldman Sachs Fundamental Equity U.S. Equity Team discusses the Goldman Sachs Technology Opportunities Fund’s (the “Fund”) performance and positioning for the six-month period ended February 28, 2019 (the “Reporting Period”).
| Q | | How did the Fund perform during the Reporting Period? |
| A | | During the Reporting Period, the Fund’s Class A, Class C, Institutional, Service, Investor, Class P and Class R6 Shares generated cumulative total returns, without sales charges, of-4.40%,-4.73%,-4.20%,-4.42%,-4.27%,-4.20% and-4.21%, respectively. These returns compare to the-6.60% cumulative total return of the Fund’s benchmark, the NASDAQ Composite Total Return Index (the “NASDAQ Composite”), during the same period. The Fund’s former benchmark, the S&P North American Technology Sector Index, returned -5.65% during the same period. |
| Q | | What key factors were responsible for the Fund’s performance during the Reporting Period? |
| A | | While the Fund generated negative absolute returns, it outperformed the NASDAQ Composite on a relative basis during the Reporting Period due primarily to effective stock selection. Sector allocation as a whole detracted from relative performance, albeit modestly. |
| Q | | Which equity market sectors most significantly affected Fund performance? |
| A | | As both the Fund and the NASDAQ Composite have the majority of their respective assets allocated to the information technology sector, broad equity market sector performance generally does not have a meaningful impact on relative performance. That said, effective stock selection in information technology and real estate contributed positively to the Fund’s relative results. Having no exposure to energy, which significantly underperformed the NASDAQ Composite during the Reporting Period, also helped. The sectors that detracted most from the Fund’s relative results during the Reporting Period were communication services and consumer discretionary, wherein stock selection proved particularly challenging. Having no exposure to industrials, which posted a negative absolute return but outperformed the NASDAQ Composite on a relative basis during the Reporting Period, also hurt. |
| Q | | What were some of the Fund’s best-performing individual stocks? |
| A | | Among those stocks the Fund benefited most from relative to the NASDAQ Composite were positions in enterprise software solutions company Red Hat, cloud-based services provider ServiceNow and wireless communications and broadcast tower real estate investment trust American Tower. |
| | Shares of Red Hat soared in late October 2018 after IBM announced an offer to acquire Red Hat for a significant premium to its market price. This acquisition was in line with our thesis that the software industry is ripe for consolidation. We also believe Red Hat has impressive growth prospects, led mostly by new business, and has solid sales capacity through its partnerships with cloud providers. We were encouraged by this news and continued to monitor developments as both companies work toward finalizing the acquisition. |
| | ServiceNow provides cloud-based services to automate enterprise information technology operations. Shares of the company rallied upon reporting strong quarterly results after |
48
PORTFOLIO RESULTS
| | the market closed on the last day of January 2019. Despite reporting against a challenging year-over-year comparison, ServiceNow posted strong billings growth and revenue guidance ahead of market expectations. The positive results were driven by continued sales momentum in its high dollar customer category and successful new product rollouts. We were encouraged by the underlying drivers of the results, as we believe the company’s deep client base and product pipeline can potentially lead to opportunities to introduce these products to existing clients. Overall, at the end of the Reporting Period, we continued to view ServiceNow as a high quality software name with what we believe to be superior growth and solid margins. Additionally, we remained confident in its management’s ability to thoughtfully invest as it works to meet its levels of growth. |
| | Shares of American Tower performed well relative to the market in the fourth quarter of 2018 amidst a more challenging time, as investors rotated toward more defensive sectors in the U.S. equity market. Additionally, in late October 2018, its shares climbed in response to the company’s third quarter 2018 earnings release, in which funds from operations (“FFO”) and revenue both beat consensus estimates. Its management also raised guidance for a number of metrics for the full year, including total property revenue and net income. The company subsequently participated in the broader market rebound in January and February 2019. At the end of the Reporting Period, we believed American Tower may benefit from secular trends toward growing data usage, taking advantage of its dominant market share, global expansion and additional investment opportunities to fuel long-term growth. We felt American Tower was trading at an attractive valuation relative to its peers at the end of the Reporting Period. Further, given what we see as its recurring revenue streams, strong organic leasing growth and healthy FFO, we considered it to be a high quality, durable growth company. |
| Q | | Which stocks detracted significantly from the Fund’s performance during the Reporting Period? |
| A | | Detracting most from the Fund’s results relative to the NASDAQ Composite were positions in semiconductor company NVIDIA, gaming company Activision Blizzard and e-commerce retailing giant Amazon.com. |
| | NVIDIA’s stock price declined in October 2018 along with the broader semiconductor industry, as international trade tensions and end-market demand concerns weighed on investor sentiment. In November 2018, the company reported a miss in earnings primarily due to weak crypto-currency demand, which at one point had accounted for more than 10% of company revenues. However, the remainder of the business, which is driven by cloud, gaming and artificial intelligence, continued to show strong growth. In addition to the earnings-related sell-off, NVIDIA’s stock was under pressure for the majority of the fourth quarter of 2018, along with its semiconductor peers, as concerns around the health of the global economy grew to end the year. Despite the difficult fourth calendar quarter for the company, we believed at the end of the Reporting Period that the underlying long-term fundamentals of the company were still healthy, though we continued to evaluate the macro backdrop. |
| | Activision Blizzard’s stock was down alongside the gaming industry during the Reporting Period, as Epic Games’ Fortnite Battle Royale, a free-to-play last player standing game, took the gaming world by storm. As a result of Fortnite’s popularity, earnings and revenue expectations came down for the gaming industry broadly, weighing on Activision Blizzard’s shares. Additionally, its stock sold off sharply early in February 2019 after a close competitor significantly decreased its guidance, which investors viewed as a negative sign for the gaming industry. Its shares then saw some relief later in the month after the company reported mixed earnings and plans to shrink its global workforce by 8% in an effort to strategically reallocate resources to its biggest franchises. Despite the competitive challenges, we continued to like Activision Blizzard at the end of the Reporting Period, as we believe the company has a favorable long-term secular outlook given its user growth and deep pipeline of successful franchises, headlined by Call of Duty. Additionally, as the purchase method mix has shifted from hard copies to digital downloads, such a trend has acted as a tailwind to the company’s margins and, we believe, ultimately, its earnings growth. Finally, following a difficult Reporting Period, we believed the company and the gaming industry were trading at attractive valuations at the end of the Reporting Period. |
| | Following especially strong 2018 performance through August, Amazon.com’s stock declined, along with other technology stocks, throughout October 2018. That month, the company reported disappointing third quarter 2018 results, in which earnings per share meaningfully beat consensus expectations but top-line revenue and guidance were both below market estimates. Following the earnings release, Amazon.com’s stock traded down due to continued general market volatility and investor concerns. In December 2018, while no negative headlines significantly weighed on the company, its stock sank along with the broader market |
49
PORTFOLIO RESULTS
| | sell-off. Despite this, we remained positive on the company at the end of the Reporting Period, as it continued to impressively grow its most profitable businesses, positioning it well, in our opinion, to invest in further innovation. We were also confident at the end of the Reporting Period that it may have the ability to outpace competitors and disrupt multiple industries as a leading, innovative growth company. |
| Q | | How did the Fund use derivatives and similar instruments during the Reporting Period? |
| A | | During the Reporting Period, we did not use derivatives as part of an active management strategy. |
| Q | | Did the Fund make any significant purchases or sales during the Reporting Period? |
| A | | We established a Fund position in Accenture. We feel the company is positioned as a leading information technology implementation company in digital and new age technologies, including cloud software as a service, analytics and security. We also feel the company’s relationships, combined with its consulting practice, give it a competitive advantage when compared to traditional outsourcing peers, as Accenture is involved early in deals. Lastly, we feel the company’s balanced capital allocation towards merger and acquisition and capital returns allows it to invest in new practices. |
| | We initiated a Fund position in Taiwan Semiconductor Manufacturing during the Reporting Period. The company engages in the manufacturing of integrated circuits and wafer semiconductor devices. We view the company as a high quality semiconductor producer that is exposed to a diverse set of favorable end-markets. (End-market is used to indicate where the final transaction takes place in a value chain. Typically it is where the end-user is located, meaning the individual, organization, industry or region for whom the product or service has been created and who is not expected to resell that product or service.) We decided to establish the position following a sharp sell-off in the fourth quarter of 2018 for the semiconductor group broadly, which was driven by iPhone and cloud demand concerns. Despite the short-term weakness, we believe the company should benefit from its exposure to several secular growth markets, including the upcoming rollout of fifth generation (“5G”). |
| | Conversely, we exited the Fund’s position in Global Payments, a provider of payment technology and software solutions. The company has a history of completing smaller debt-financed acquisitions, which we believe could potentially negatively impact its risk/reward profile as the cycle extends. As a result, we decided to exit the position and reallocate the capital to other high quality names in the payments space. |
| | We sold the Fund’s position in MasterCard during the Reporting Period. After a strong run of performance, we felt the risk/reward profile for Visa was more compelling than that of MasterCard given their similar growth prospects. At the end of the Reporting Period, MasterCard was trading at an 11% premium to Visa. We also see the strong performance of MasterCard during the Reporting Period as being potentially driven by a favorable geographic mix instead of market share gains. We thus believe its strength could be temporary and does not negatively affect Visa’s growth prospects. |
| Q | | Were there any changes to the Fund’s portfolio management team during the Reporting Period? |
| A | | Effective February 4, 2019, Michael DeSantis, vice president and portfolio manager of the Fund, left the firm to pursue another opportunity. Steven Barry, Sung Cho and Charles “Brook” Dane continue to serve as portfolio managers of the Fund and assumed Michael’s portfolio management responsibilities effective February 4, 2019. Steven Barry also remains the chief investment officer of the Fundamental Equity US Equity team and of Fundamental Equity globally, overseeing more than $50 billion in assets under supervision as of December 31, 2018. |
| Q | | Were there any notable changes in the Fund’s weightings during the Reporting Period? |
| A | | In constructing the Fund’s portfolio, we focus on picking stocks rather than on making industry or sector bets. We seek to outpace the benchmark index by overweighting stocks that we expect to outperform and underweighting those that we think may lag. Consequently, changes in its sector weights are generally the direct result of individual stock selection or of stock appreciation or depreciation. That said, during the Reporting Period, the Fund’s exposure to consumer discretionary increased relative to the NASDAQ Composite and its relative exposure to information technology decreased. The Fund’s position in cash decreased during the Reporting Period. |
| Q | | How was the Fund positioned relative to its benchmark index at the end of February 2019? |
| A | | At the end of February 2019, the Fund was overweighted relative to the NASDAQ Composite in the information technology and real estate sectors. On the same date, the Fund had underweighted exposure compared to the NASDAQ Composite in health care, communication services and consumer discretionary. The Fund had no exposure to the utilities, materials, energy, industrials, consumer staples or financials sectors at the end of the Reporting Period. |
50
FUND BASICS
Technology Opportunities Fund
as of February 28, 2019
| | | | | | | | | | | | | | |
| | PERFORMANCE REVIEW | | | | | |
| | | | |
| | | September 1, 2018–February 28, 2019 | | Fund Total Return
(based on NAV)1 | | | NASDAQ Composite
Total Return Index2 | | | S&P North
American Technology
Sector Index3 | |
| | | | |
| | Class A | | | -4.40 | % | | | -6.60 | % | | | -5.65 | % |
| | Class C | | | -4.73 | | | | -6.60 | | | | -5.65 | |
| | Institutional | | | -4.20 | | | | -6.60 | | | | -5.65 | |
| | Service | | | -4.42 | | | | -6.60 | | | | -5.65 | |
| | Investor | | | -4.27 | | | | -6.60 | | | | -5.65 | |
| | Class P | | | -4.20 | | | | -6.60 | | | | -5.65 | |
| | | | |
| | | Class R6 | | | -4.21 | | | | -6.60 | | | | -5.65 | |
| | 1 | | The net asset value (“NAV”) represents the net assets of the class of the Fund(ex-dividend) divided by the total number of shares of the class outstanding. The Fund’s performance reflects the reinvestment of dividends and other distributions. The Fund’s performance does not reflect the deduction of any applicable sales charges. |
| | 2 | | The NASDAQ Composite Index includes all domestic and international based common type stocks listed on The NASDAQ Stock Market. The NASDAQ Composite Index is a broad based Index. It is not possible to invest directly in an index. |
| | 3 | | The S&P North American Technology Sector Index provides investors with a benchmark that represents U.S. securities classified under the Global Industry Classification Standard (“GICS”)® technology sector and Internet retail sub-industry. It is not possible to invest directly in an index. |
| | | | | | | | | | | | | | | | | | | | |
| | STANDARDIZED TOTAL RETURNS4 |
| | | | | | |
| | | For the period ended 12/31/18 | | One Year | | | Five Years | | | Ten Years | | | Since Inception | | | Inception Date |
| | | | | | |
| | Class A | | | -3.44 | % | | | 10.88 | % | | | 16.82 | % | | | 5.91 | % | | 10/1/99 |
| | Class C | | | 0.46 | | | | 11.31 | | | | 16.61 | | | | 5.42 | | | 10/1/99 |
| | Institutional | | | 2.60 | | | | 12.58 | | | | 17.95 | | | | 6.64 | | | 10/1/99 |
| | Service | | | 2.10 | | | | 12.02 | | | | 17.38 | | | | 6.13 | | | 10/1/99 |
| | Investor | | | 2.47 | | | | 12.41 | | | | N/A | | | | 12.94 | | | 9/30/10 |
| | Class P | | | N/A | | | | N/A | | | | N/A | | | | -7.50 | | | 4/17/18 |
| | | Class R6 | | | 2.64 | | | | N/A | | | | N/A | | | | 2.64 | | | 12/29/17 |
| | 4 | | The Standardized Total Returns are average annual total returns or cumulative total returns (only if the performance period is one year or less) as of the most recent calendarquarter-end. They assume reinvestment of all distributions at NAV. These returns reflect a maximum initial sales charge of 5.5% for Class A Shares and the assumed contingent deferred sales charge for Class C Shares (1% if redeemed within 12 months of purchase). Effective July 30, 2018, Class C Shares convert automatically to Class A Shares on or about the fifteenth day of the last month of the calendar quarter that is ten years after the purchase date. Because Institutional, Service, Investor, Class P and Class R6 Shares do not involve a sales charge, such a charge is not applied to their Standardized Total Returns. |
The returns set forth in the tables above represent past performance. Past performance does not guarantee future results. The Fund’s investment return and principal value will fluctuate so that an investor’s shares, when redeemed, may be worth more or less than their original cost. Current performance may be lower or higher than the performance quoted above. Please visit our web site at www.GSAMFUNDS.com to obtain the most recentmonth-end returns.Performance reflects applicable fee waivers and/or expense limitations in effect during the periods shown. In their absence, performance would be reduced. Returns do not reflect the deduction of taxes that a shareholder would pay on Fund distributions or the redemption of Fund shares.
51
FUND BASICS
| | | | | | | | | | |
| | EXPENSE RATIOS5 | |
| | | |
| | | | | Net Expense Ratio (Current) | | | Gross Expense Ratio (Before Waivers) | |
| | | |
| | Class A | | | 1.33 | % | | | 1.46 | % |
| | Class C | | | 2.08 | | | | 2.21 | |
| | Institutional | | | 0.98 | | | | 1.07 | |
| | Service | | | 1.48 | | | | 1.57 | |
| | Investor | | | 1.08 | | | | 1.21 | |
| | Class P | | | 0.97 | | | | 1.06 | |
| | | Class R6 | | | 0.97 | | | | 1.06 | |
| | 5 | | The expense ratios of the Fund, both current (net of applicable fee waivers and/or expense limitations) and before waivers (gross of applicable fee waivers and/or expense limitations) are as set forth above according to the most recent publicly available Prospectus for the Fund and may differ from the expense ratios disclosed in the Financial Highlights in this report. Pursuant to a contractual arrangement, the Fund’s waivers and/or expense limitations will remain in place through at least December 28, 2019, and prior to such date the investment adviser may not terminate the arrangements without the approval of the Fund’s Board of Trustees. If these arrangements are discontinued in the future, the expense ratios may change without shareholder approval. |
| | | | | | | | |
| | TOP TEN HOLDINGS AS OF 2/28/196 |
| | | |
| | | Holding | | % of Net Assets | | | Line of Business |
| | | |
| | Amazon.com, Inc. | | | 8.5 | % | | Internet & Direct Marketing Retail |
| | Microsoft Corp. | | | 7.3 | | | Software |
| | Apple, Inc. | | | 4.9 | | | Technology Hardware, Storage & Peripherals |
| | Alphabet, Inc. Class C | | | 4.4 | | | Interactive Media & Services |
| | Alphabet, Inc. Class A | | | 4.1 | | | Interactive Media & Services |
| | Facebook, Inc. Class A | | | 3.9 | | | Interactive Media & Services |
| | Visa, Inc. Class A | | | 3.6 | | | IT Services |
| | Marvell Technology Group Ltd. | | | 3.6 | | | Semiconductors & Semiconductor
Equipment |
| | ServiceNow, Inc. | | | 3.5 | | | Software |
| | | Adobe, Inc. | | | 3.5 | | | Software |
| | 6 | | The top 10 holdings may not be representative of the Fund’s future investments. |
52
FUND BASICS
|
| FUND VS. BENCHMARK SECTOR ALLOCATION7 |
|
| As of February 28, 2019 |
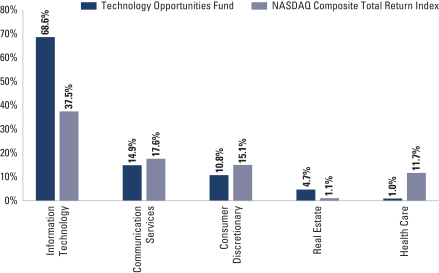
| | 7 | | The Fund is actively managed and, as such, its composition may differ over time. Consequently, the Fund’s overall sector allocations may differ from the percentages contained in the graph above. The graph categorizes investments using the Global Industry Classification Standard (“GICS”), however, the sector classifications used by the portfolio management team may differ from GICS. The percentage shown for each investment category reflects the value of investments in that category as a percentage of market value. The graph depicts the Fund’s investments but may not represent the Fund’s market exposure due to the exclusion of certain derivatives, if any, as listed in the Additional Investment Information section of the Schedule of Investments. |
53
FUND BASICS
Index Definitions
The Russell 3000® Indexis a market capitalization weighted equity index maintained by the FTSE Russell that provides exposure to the entire U.S. stock market. The index tracks the performance of the 3,000 largest U.S.-traded stocks which represent about 98% of all U.S incorporated equity securities.
The ISM Manufacturing Index is a widely-watched indicator of recent U.S. economic activity. It is often referred to as the Purchasing Manager’s Index (PMI). Based on a survey of purchasing managers at more than 300 manufacturing firms by the Institute for Supply Management (“ISM”), the Index monitors changes in production levels from month to month.
54
GOLDMAN SACHS BLUE CHIP FUND
Schedule of Investments
February 28, 2019 (Unaudited)
| | | | | | | | |
| Shares | | | Description | | Value | |
|
| Common Stocks – 95.6% | |
| Aerospace & Defense – 6.1% | |
| | 550 | | | Northrop Grumman Corp. | | $ | 159,478 | |
| | 754 | | | The Boeing Co. | | | 331,730 | |
| | 1,220 | | | United Technologies Corp. | | | 153,317 | |
| | | | | | | | |
| | | | | | | 644,525 | |
| | |
| Banks – 6.4% | |
| | 7,238 | | | Bank of America Corp. | | | 210,481 | |
| | 2,092 | | | First Republic Bank | | | 219,618 | |
| | 1,356 | | | JPMorgan Chase & Co. | | | 141,512 | |
| | 1,976 | | | Wells Fargo & Co. | | | 98,583 | |
| | | | | | | | |
| | | | | | | 670,194 | |
| | |
| Beverages – 1.2% | |
| | 2,829 | | | TheCoca-Cola Co. | | | 128,267 | |
| | |
| Capital Markets – 1.7% | |
| | 1,968 | | | Northern Trust Corp. | | | 183,418 | |
| | |
| Chemicals – 3.4% | |
| | 2,615 | | | DowDuPont, Inc. | | | 139,196 | |
| | 540 | | | Ecolab, Inc. | | | 91,211 | |
| | 303 | | | The Sherwin-Williams Co. | | | 131,260 | |
| | | | | | | | |
| | | | | | | 361,667 | |
| | |
| Communications Equipment – 1.9% | |
| | 3,855 | | | Cisco Systems, Inc. | | | 199,573 | |
| | |
| Diversified Telecommunication Services – 2.9% | |
| | 3,383 | | | AT&T, Inc. | | | 105,279 | |
| | 3,576 | | | Verizon Communications, Inc. | | | 203,546 | |
| | | | | | | | |
| | | | | | | 308,825 | |
| | |
| Entertainment – 1.1% | |
| | 1,057 | | | The Walt Disney Co. | | | 119,272 | |
| | |
| Equity Real Estate Investment Trusts (REITs) – 2.3% | |
| | 1,393 | | | American Tower Corp. | | | 245,377 | |
| | |
| Food & Staples Retailing – 3.0% | |
| | 3,141 | | | Walmart, Inc. | | | 310,928 | |
| | |
| Food Products – 0.6% | |
| | 1,280 | | | Mondelez International, Inc. Class A | | | 60,365 | |
| | |
| Health Care Equipment & Supplies – 7.1% | |
| | 6,504 | | | Boston Scientific Corp.* | | | 260,940 | |
| | 2,621 | | | Danaher Corp. | | | 332,919 | |
| | 1,737 | | | Medtronic PLC | | | 157,199 | |
| | | | | | | | |
| | | | | | | 751,058 | |
| | |
| Health Care Providers & Services – 1.5% | |
| | 566 | | | Humana, Inc. | | | 161,333 | |
| | |
| Hotels, Restaurants & Leisure – 2.1% | |
| | 1,193 | | | McDonald’s Corp. | | | 219,321 | |
| | |
| Household Products – 1.8% | |
| | 835 | | | Colgate-Palmolive Co. | | | 55,001 | |
| | 1,312 | | | The Procter & Gamble Co. | | | 129,298 | |
| | | | | | | | |
| | | | | | | 184,299 | |
| | |
|
| Common Stocks – (continued) | |
| Industrial Conglomerates – 3.1% | |
| | 2,110 | | | Honeywell International, Inc. | | | 325,088 | |
| | |
| Interactive Media & Services* – 7.1% | |
| | 179 | | | Alphabet, Inc. Class A | | | 201,652 | |
| | 152 | | | Alphabet, Inc. Class C | | | 170,228 | |
| | 2,293 | | | Facebook, Inc. Class A | | | 370,205 | |
| | | | | | | | |
| | | | | | | 742,085 | |
| | |
| Internet & Direct Marketing Retail* – 2.4% | |
| | 157 | | | Amazon.com, Inc. | | | 257,453 | |
| | |
| IT Services – 3.9% | |
| | 2,765 | | | Visa, Inc. Class A | | | 409,552 | |
| | |
| Media – 1.3% | |
| | 3,580 | | | Comcast Corp. Class A | | | 138,439 | |
| | |
| Oil, Gas & Consumable Fuels – 5.5% | |
| | 1,744 | | | Chevron Corp. | | | 208,548 | |
| | 2,299 | | | EOG Resources, Inc. | | | 216,106 | |
| | 1,909 | | | Exxon Mobil Corp. | | | 150,868 | |
| | | | | | | | |
| | | | | | | 575,522 | |
| | |
| Pharmaceuticals – 8.5% | |
| | 2,848 | | | Eli Lilly & Co. | | | 359,674 | |
| | 1,912 | | | Johnson & Johnson | | | 261,256 | |
| | 6,409 | | | Pfizer, Inc. | | | 277,830 | |
| | | | | | | | |
| | | | | | | 898,760 | |
| | |
| Road & Rail – 3.3% | |
| | 2,063 | | | Union Pacific Corp. | | | 345,965 | |
| | |
| Semiconductors & Semiconductor Equipment – 3.4% | |
| | 3,347 | | | Texas Instruments, Inc. | | | 354,046 | |
| | |
| Software – 4.0% | |
| | 3,803 | | | Microsoft Corp. | | | 426,050 | |
| | |
| Specialty Retail – 2.6% | |
| | 2,870 | | | Ross Stores, Inc. | | | 272,162 | |
| | |
| Technology Hardware, Storage & Peripherals – 2.7% | |
| | 1,646 | | | Apple, Inc. | | | 285,005 | |
| | |
| Textiles, Apparel & Luxury Goods – 2.7% | |
| | 3,306 | | | NIKE, Inc. Class B | | | 283,423 | |
| | |
| Tobacco – 2.0% | |
| | 1,718 | | | Altria Group, Inc. | | | 90,040 | |
| | 1,353 | | | Philip Morris International, Inc. | | | 117,630 | |
| | | | | | | | |
| | | | | | | 207,670 | |
| | |
| | TOTAL COMMON STOCKS | |
| | (Cost $8,872,573) | | $ | 10,069,642 | |
| | |
| | |
| The accompanying notes are an integral part of these financial statements. | | 55 |
GOLDMAN SACHS BLUE CHIP FUND
Schedule of Investments(continued)
February 28, 2019 (Unaudited)
| | | | | | | | |
| Shares | | | Dividend
Rate | | Value | |
| |
| Investment Company(a) – 1.3% | | | |
| Goldman Sachs Financial Square Government Fund –
Institutional Shares |
|
| | 136,636 | | | 2.395% | | $ | 136,636 | |
| | (Cost $136,636) | | | | |
| | |
| | TOTAL INVESTMENTS – 96.9% | | | | |
| | (Cost $9,009,209) | | $ | 10,206,278 | |
| | |
| OTHER ASSETS IN EXCESS OF
LIABILITIES – 3.1% | | | 326,287 | |
| | |
| | NET ASSETS – 100.0% | | $ | 10,532,565 | |
| | |
| | |
|
| The percentage shown for each investment category reflects the value of investments in that category as a percentage of net assets. |
| |
* | | Non-income producing security. |
| |
(a) | | Represents an affiliated fund. |
| | |
|
Investment Abbreviations: |
PLC | | —Public Limited Company |
|
| | |
| 56 | | The accompanying notes are an integral part of these financial statements. |
GOLDMAN SACHS CAPITAL GROWTH FUND
Schedule of Investments
February 28, 2019 (Unaudited)
| | | | | | | | |
| Shares | | | Description | | Value | |
|
| Common Stocks – 98.4% | |
| Aerospace & Defense – 2.6% | |
| | 19,845 | | | Harris Corp. | | $ | 3,273,036 | |
| | 22,086 | | | HEICO Corp. | | | 2,070,121 | |
| | 18,895 | | | Northrop Grumman Corp. | | | 5,478,794 | |
| | 26,774 | | | The Boeing Co. | | | 11,779,489 | |
| | | | | | | | |
| | | | | | | 22,601,440 | |
| | |
| Auto Components – 0.4% | |
| | 41,689 | | | Aptiv PLC | | | 3,464,773 | |
| | |
| Banks – 5.5% | |
| | 414,895 | | | Bank of America Corp. | | | 12,065,147 | |
| | 53,178 | | | First Republic Bank | | | 5,582,627 | |
| | 135,103 | | | JPMorgan Chase & Co. | | | 14,099,349 | |
| | 21,337 | | | M&T Bank Corp. | | | 3,692,581 | |
| | 27,037 | | | Signature Bank | | | 3,670,543 | |
| | 22,313 | | | SunTrust Banks, Inc. | | | 1,447,444 | |
| | 151,091 | | | Wells Fargo & Co. | | | 7,537,930 | |
| | | | | | | | |
| | | | | | | 48,095,621 | |
| | |
| Beverages – 1.8% | |
| | 31,433 | | | Brown-Forman Corp. Class B | | | 1,555,619 | |
| | 45,807 | | | Coca-Cola European Partners PLC* | | | 2,159,342 | |
| | 108,745 | | | Monster Beverage Corp.* | | | 6,941,193 | |
| | 105,307 | | | TheCoca-Cola Co. | | | 4,774,620 | |
| | | | | | | | |
| | | | | | | 15,430,774 | |
| | |
| Biotechnology – 2.3% | |
| | 47,208 | | | AbbVie, Inc. | | | 3,740,762 | |
| | 6,052 | | | Agios Pharmaceuticals, Inc.* | | | 392,593 | |
| | 27,155 | | | Alexion Pharmaceuticals, Inc.* | | | 3,674,886 | |
| | 38,162 | | | Alkermes PLC* | | | 1,269,650 | |
| | 3,780 | | | Amgen, Inc. | | | 718,502 | |
| | 2,240 | | | Biogen, Inc.* | | | 734,742 | |
| | 38,043 | | | BioMarin Pharmaceutical, Inc.* | | | 3,547,890 | |
| | 29,890 | | | Celgene Corp.* | | | 2,484,457 | |
| | 24,009 | | | Exelixis, Inc.* | | | 537,562 | |
| | 5,260 | | | Incyte Corp.* | | | 453,570 | |
| | 14,421 | | | Vertex Pharmaceuticals, Inc.* | | | 2,721,964 | |
| | | | | | | | |
| | | | | | | 20,276,578 | |
| | |
| Capital Markets – 1.7% | |
| | 25,267 | | | Cboe Global Markets, Inc. | | | 2,423,358 | |
| | 55,962 | | | E*TRADE Financial Corp. | | | 2,741,578 | |
| | 48,564 | | | Northern Trust Corp. | | | 4,526,165 | |
| | 27,575 | | | S&P Global, Inc. | | | 5,525,203 | |
| | | | | | | | |
| | | | | | | 15,216,304 | |
| | |
| Chemicals – 2.9% | |
| | 20,968 | | | Ashland Global Holdings, Inc. | | | 1,622,504 | |
| | 42,427 | | | Celanese Corp. | | | 4,339,858 | |
| | 182,753 | | | DowDuPont, Inc. | | | 9,727,942 | |
| | 26,277 | | | Ecolab, Inc. | | | 4,438,448 | |
| | 3,400 | | | The Sherwin-Williams Co. | | | 1,472,880 | |
| | 47,743 | | | W.R. Grace & Co. | | | 3,708,199 | |
| | | | | | | | |
| | | | | | | 25,309,831 | |
| | |
|
| Common Stocks – (continued) | |
| Commercial Services & Supplies – 0.6% | |
| | 14,073 | | | Cintas Corp. | | | 2,907,482 | |
| | 24,139 | | | Waste Connections, Inc. | | | 2,013,192 | |
| | | | | | | | |
| | | | | | | 4,920,674 | |
| | |
| Communications Equipment – 1.3% | |
| | 181,331 | | | Cisco Systems, Inc. | | | 9,387,506 | |
| | 15,934 | | | Motorola Solutions, Inc. | | | 2,280,474 | |
| | | | | | | | |
| | | | | | | 11,667,980 | |
| | |
| Construction Materials – 0.8% | |
| | 39,377 | | | Martin Marietta Materials, Inc. | | | 7,395,001 | |
| | |
| Consumer Finance – 0.7% | |
| | 54,683 | | | American Express Co. | | | 5,891,546 | |
| | |
| Containers & Packaging – 0.3% | |
| | 56,030 | | | Ball Corp. | | | 3,069,323 | |
| | |
| Diversified Consumer Services* – 0.2% | |
| | 16,044 | | | Bright Horizons Family Solutions, Inc. | | | 1,989,456 | |
| | |
| Diversified Financial Services* – 1.2% | |
| | 52,997 | | | Berkshire Hathaway, Inc. Class B | | | 10,668,296 | |
| | |
| Diversified Telecommunication Services – 1.4% | |
| | 194,479 | | | Verizon Communications, Inc. | | | 11,069,744 | |
| | 53,316 | | | Zayo Group Holdings, Inc.* | | | 1,322,237 | |
| | | | | | | | |
| | | | | | | 12,391,981 | |
| | |
| Electric Utilities – 1.3% | |
| | 37,339 | | | NextEra Energy, Inc. | | | 7,009,277 | |
| | 77,675 | | | Xcel Energy, Inc. | | | 4,261,251 | |
| | | | | | | | |
| | | | | | | 11,270,528 | |
| | |
| Electrical Equipment* – 0.1% | |
| | 24,362 | | | Sensata Technologies Holding PLC | | | 1,235,884 | |
| | |
| Electronic Equipment, Instruments & Components – 0.4% | |
| | 39,385 | | | Amphenol Corp. Class A | | | 3,701,008 | |
| | |
| Entertainment – 1.9% | |
| | 37,555 | | | Activision Blizzard, Inc. | | | 1,582,568 | |
| | 16,585 | | | Netflix, Inc.* | | | 5,939,088 | |
| | 25,592 | | | The Walt Disney Co. | | | 2,887,801 | |
| | 117,731 | | | Twenty-First Century Fox, Inc. Class B | | | 5,905,387 | |
| | | | | | | | |
| | | | | | | 16,314,844 | |
| | |
| Equity Real Estate Investment Trusts (REITs) – 3.8% | |
| | 36,848 | | | Alexandria Real Estate Equities, Inc. | | | 5,007,275 | |
| | 23,441 | | | American Tower Corp. | | | 4,129,132 | |
| | 36,530 | | | CyrusOne, Inc. | | | 1,820,655 | |
| | 6,379 | | | Equinix, Inc. | | | 2,701,507 | |
| | 20,077 | | | Equity LifeStyle Properties, Inc. | | | 2,181,165 | |
| | 7,536 | | | Essex Property Trust, Inc. | | | 2,108,874 | |
| | 120,733 | | | Hudson Pacific Properties, Inc. | | | 4,010,750 | |
| | 72,094 | | | Prologis, Inc. | | | 5,050,906 | |
| | 24,156 | | | Simon Property Group, Inc. | | | 4,376,101 | |
| | 159,394 | | | SITE Centers Corp. | | | 2,127,910 | |
| | | | | | | | |
| | | | | | | 33,514,275 | |
| | |
| | |
| The accompanying notes are an integral part of these financial statements. | | 57 |
GOLDMAN SACHS CAPITAL GROWTH FUND
Schedule of Investments(continued)
February 28, 2019 (Unaudited)
| | | | | | | | |
| Shares | | | Description | | Value | |
|
| Common Stocks – (continued) | |
| Food & Staples Retailing – 1.2% | |
| | 52,200 | | | US Foods Holding Corp.* | | $ | 1,839,528 | |
| | 92,330 | | | Walmart, Inc. | | | 9,139,747 | |
| | | | | | | | |
| | | | | | | 10,979,275 | |
| | |
| Food Products – 0.6% | |
| | 61,095 | | | Conagra Brands, Inc. | | | 1,427,790 | |
| | 89,554 | | | Mondelez International, Inc. Class A | | | 4,223,367 | |
| | | | | | | | |
| | | | | | | 5,651,157 | |
| | |
| Health Care Equipment & Supplies – 5.7% | |
| | 26,084 | | | Align Technology, Inc.* | | | 6,754,974 | |
| | 201,585 | | | Boston Scientific Corp.* | | | 8,087,590 | |
| | 56,571 | | | Danaher Corp. | | | 7,185,648 | |
| | 23,534 | | | Edwards Lifesciences Corp.* | | | 3,984,071 | |
| | 9,400 | | | IDEXX Laboratories, Inc.* | | | 1,983,682 | |
| | 11,770 | | | Intuitive Surgical, Inc.* | | | 6,445,370 | |
| | 13,641 | | | Teleflex, Inc. | | | 3,953,707 | |
| | 10,358 | | | The Cooper Cos., Inc. | | | 2,962,284 | |
| | 25,023 | | | West Pharmaceutical Services, Inc. | | | 2,621,159 | |
| | 51,646 | | | Zimmer Biomet Holdings, Inc. | | | 6,410,302 | |
| | | | | | | | |
| | | | | | | 50,388,787 | |
| | |
| Health Care Providers & Services – 2.7% | |
| | 16,865 | | | Anthem, Inc. | | | 5,071,811 | |
| | 97,720 | | | CVS Health Corp. | | | 5,651,148 | |
| | 17,797 | | | Humana, Inc. | | | 5,072,857 | |
| | 19,366 | | | Laboratory Corp. of America Holdings* | | | 2,870,816 | |
| | 22,622 | | | UnitedHealth Group, Inc. | | | 5,479,501 | |
| | | | | | | | |
| | | | | | | 24,146,133 | |
| | |
| Hotels, Restaurants & Leisure – 1.8% | |
| | 25,355 | | | Choice Hotels International, Inc. | | | 2,024,343 | |
| | 6,240 | | | Domino’s Pizza, Inc. | | | 1,565,866 | |
| | 10,344 | | | Dunkin’ Brands Group, Inc. | | | 739,079 | |
| | 10,452 | | | Hilton Worldwide Holdings, Inc. | | | 868,561 | |
| | 30,035 | | | Las Vegas Sands Corp. | | | 1,845,050 | |
| | 42,435 | | | McDonald’s Corp. | | | 7,801,250 | |
| | 9,169 | | | Royal Caribbean Cruises Ltd. | | | 1,086,343 | |
| | | | | | | | |
| | | | | | | 15,930,492 | |
| | |
| Household Durables – 0.2% | |
| | 37,655 | | | D.R. Horton, Inc. | | | 1,464,403 | |
| | |
| Household Products – 1.4% | |
| | 15,220 | | | The Clorox Co. | | | 2,405,217 | |
| | 101,737 | | | The Procter & Gamble Co. | | | 10,026,181 | |
| | | | | | | | |
| | | | | | | 12,431,398 | |
| | |
| Industrial Conglomerates – 1.6% | |
| | 289,034 | | | General Electric Co. | | | 3,003,063 | |
| | 69,208 | | | Honeywell International, Inc. | | | 10,662,877 | |
| | | | | | | | |
| | | | | | | 13,665,940 | |
| | |
| Insurance – 2.8% | |
| | 58,572 | | | Chubb Ltd. | | | 7,842,791 | |
| | 2,376 | | | Markel Corp.* | | | 2,387,595 | |
| | |
|
| Common Stocks – (continued) | |
| Insurance – (continued) | |
| | 27,281 | | | Reinsurance Group of America, Inc. | | | 3,941,831 | |
| | 31,010 | | | The Progressive Corp. | | | 2,260,629 | |
| | 55,812 | | | Torchmark Corp. | | | 4,607,839 | |
| | 21,437 | | | Willis Towers Watson PLC | | | 3,687,593 | |
| | | | | | | | |
| | | | | | | 24,728,278 | |
| | |
| Interactive Media & Services* – 4.6% | |
| | 12,023 | | | Alphabet, Inc. Class A | | | 13,544,511 | |
| | 11,436 | | | Alphabet, Inc. Class C | | | 12,807,405 | |
| | 84,264 | | | Facebook, Inc. Class A | | | 13,604,423 | |
| | | | | | | | |
| | | | | | | 39,956,339 | |
| | |
| Internet & Direct Marketing Retail – 3.2% | |
| | 14,913 | | | Amazon.com, Inc.* | | | 24,454,785 | |
| | 1,324 | | | Booking Holdings, Inc.* | | | 2,246,881 | |
| | 8,552 | | | Expedia Group, Inc. | | | 1,054,547 | |
| | | | | | | | |
| | | | | | | 27,756,213 | |
| | |
| IT Services – 5.1% | |
| | 44,159 | | | Accenture PLC Class A | | | 7,126,379 | |
| | 17,481 | | | Automatic Data Processing, Inc. | | | 2,675,117 | |
| | 47,012 | | | Fidelity National Information Services, Inc. | | | 5,084,348 | |
| | 23,690 | | | Fiserv, Inc.* | | | 2,006,306 | |
| | 12,901 | | | Gartner, Inc.* | | | 1,835,812 | |
| | 17,461 | | | International Business Machines Corp. | | | 2,411,888 | |
| | 21,889 | | | Mastercard, Inc. Class A | | | 4,919,991 | |
| | 38,250 | | | PayPal Holdings, Inc.* | | | 3,751,178 | |
| | 23,435 | | | Total System Services, Inc. | | | 2,212,264 | |
| | 86,624 | | | Visa, Inc. Class A | | | 12,830,747 | |
| | | | | | | | |
| | | | | | | 44,854,030 | |
| | |
| Life Sciences Tools & Services – 1.3% | |
| | 68,249 | | | Agilent Technologies, Inc. | | | 5,421,701 | |
| | 18,300 | | | Illumina, Inc.* | | | 5,723,691 | |
| | | | | | | | |
| | | | | | | 11,145,392 | |
| | |
| Machinery – 2.5% | |
| | 45,395 | | | Deere & Co. | | | 7,446,596 | |
| | 48,346 | | | Fortive Corp. | | | 3,943,583 | |
| | 71,909 | | | ITT, Inc. | | | 4,153,464 | |
| | 46,349 | | | Stanley Black & Decker, Inc. | | | 6,137,998 | |
| | 1,552 | | | Wabtec Corp. | | | 113,729 | |
| | | | | | | | |
| | | | | | | 21,795,370 | |
| | |
| Media – 1.4% | |
| | 6,541 | | | Charter Communications, Inc. Class A* | | | 2,256,056 | |
| | 245,108 | | | Comcast Corp. Class A | | | 9,478,327 | |
| | 33,200 | | | Liberty Global PLC Class C* | | | 842,948 | |
| | | | | | | | |
| | | | | | | 12,577,331 | |
| | |
| Metals & Mining – 0.4% | |
| | 123,103 | | | Freeport-McMoRan, Inc. | | | 1,588,029 | |
| | 45,434 | | | Newmont Mining Corp. | | | 1,550,208 | |
| | | | | | | | |
| | | | | | | 3,138,237 | |
| | |
| | |
| 58 | | The accompanying notes are an integral part of these financial statements. |
GOLDMAN SACHS CAPITAL GROWTH FUND
| | | | | | | | |
| Shares | | | Description | | Value | |
|
| Common Stocks – (continued) | |
| Multi-Utilities – 1.2% | |
| | 76,595 | | | Ameren Corp. | | $ | 5,456,628 | |
| | 95,536 | | | CMS Energy Corp. | | | 5,197,158 | |
| | | | | | | | |
| | | | | | | 10,653,786 | |
| | |
| Multiline Retail – 0.4% | |
| | 29,976 | | | Dollar General Corp. | | | 3,550,957 | |
| | |
| Oil, Gas & Consumable Fuels – 4.9% | |
| | 97,251 | | | Cheniere Energy, Inc.* | | | 6,267,827 | |
| | 91,644 | | | Chevron Corp. | | | 10,958,790 | |
| | 52,374 | | | Concho Resources, Inc. | | | 5,761,140 | |
| | 53,994 | | | Diamondback Energy, Inc. | | | 5,557,602 | |
| | 36,861 | | | EOG Resources, Inc. | | | 3,464,934 | |
| | 43,002 | | | Exxon Mobil Corp. | | | 3,398,448 | |
| | 94,585 | | | Marathon Petroleum Corp. | | | 5,865,216 | |
| | 33,343 | | | Royal Dutch Shell PLC Class B ADR | | | 2,120,948 | |
| | | | | | | | |
| | | | | | | 43,394,905 | |
| | |
| Personal Products – 0.5% | |
| | 17,194 | | | The Estee Lauder Cos., Inc. Class A | | | 2,698,426 | |
| | 25,165 | | | Unilever NV | | | 1,358,407 | |
| | | | | | | | |
| | | | | | | 4,056,833 | |
| | |
| Pharmaceuticals – 3.3% | |
| | 147,449 | | | AstraZeneca PLC ADR | | | 6,130,929 | |
| | 41,182 | | | Elanco Animal Health, Inc.*(a) | | | 1,245,344 | |
| | 85,471 | | | Eli Lilly & Co. | | | 10,794,133 | |
| | 42,892 | | | Johnson & Johnson | | | 5,860,763 | |
| | 55,146 | | | Zoetis, Inc. | | | 5,196,407 | |
| | | | | | | | |
| | | | | | | 29,227,576 | |
| | |
| Road & Rail – 1.6% | |
| | 23,662 | | | Old Dominion Freight Line, Inc. | | | 3,567,520 | |
| | 60,202 | | | Union Pacific Corp. | | | 10,095,875 | |
| | | | | | | | |
| | | | | | | 13,663,395 | |
| | |
| Semiconductors & Semiconductor Equipment – 4.0% | |
| | 117,164 | | | Advanced Micro Devices, Inc.* | | | 2,756,869 | |
| | 26,440 | | | Analog Devices, Inc. | | | 2,828,022 | |
| | 47,560 | | | Intel Corp. | | | 2,518,777 | |
| | 8,321 | | | Lam Research Corp. | | | 1,465,245 | |
| | 285,907 | | | Marvell Technology Group Ltd. | | | 5,703,845 | |
| | 51,300 | | | Micron Technology, Inc.* | | | 2,097,144 | |
| | 37,180 | | | NVIDIA Corp. | | | 5,735,387 | |
| | 44,060 | | | NXP Semiconductors NV | | | 4,023,559 | |
| | 73,596 | | | Texas Instruments, Inc. | | | 7,784,985 | |
| | | | | | | | |
| | | | | | | 34,913,833 | |
| | |
| Software – 6.9% | |
| | 28,084 | | | Adobe, Inc.* | | | 7,372,050 | |
| | 10,812 | | | Autodesk, Inc.* | | | 1,762,464 | |
| | 10,908 | | | Check Point Software Technologies Ltd.* | | | 1,334,048 | |
| | 16,127 | | | Citrix Systems, Inc. | | | 1,701,399 | |
| | 20,571 | | | Intuit, Inc. | | | 5,083,711 | |
| | 266,861 | | | Microsoft Corp. | | | 29,896,438 | |
| | 3,484 | | | Red Hat, Inc.* | | | 636,178 | |
| | 43,032 | | | salesforce.com, Inc.* | | | 7,042,187 | |
| | |
|
| Common Stocks – (continued) | |
| Software – (continued) | |
| | 24,665 | | | ServiceNow, Inc.* | | | 5,905,788 | |
| | | | | | | | |
| | | | | | | 60,734,263 | |
| | |
| Specialty Retail – 1.8% | |
| | 12,529 | | | Burlington Stores, Inc.* | | | 2,126,672 | |
| | 9,476 | | | O’Reilly Automotive, Inc.* | | | 3,524,693 | |
| | 53,393 | | | The Home Depot, Inc. | | | 9,885,180 | |
| | | | | | | | |
| | | | | | | 15,536,545 | |
| | |
| Technology Hardware, Storage & Peripherals – 3.5% | |
| | 176,242 | | | Apple, Inc. | | | 30,516,302 | |
| | |
| Textiles, Apparel & Luxury Goods – 0.8% | |
| | 57,490 | | | NIKE, Inc. Class B | | | 4,928,618 | |
| | 15,471 | | | PVH Corp. | | | 1,776,689 | |
| | | | | | | | |
| | | | | | | 6,705,307 | |
| | |
| Tobacco – 1.0% | |
| | 67,628 | | | Altria Group, Inc. | | | 3,544,384 | |
| | 56,214 | | | Philip Morris International, Inc. | | | 4,887,245 | |
| | | | | | | | |
| | | | | | | 8,431,629 | |
| | |
| Water Utilities – 0.5% | |
| | 42,591 | | | American Water Works Co., Inc. | | | 4,328,097 | |
| | |
| Wireless Telecommunication Services* – 0.3% | |
| | 37,677 | | | T-Mobile US, Inc. | | | 2,720,656 | |
| | |
| | TOTAL COMMON STOCKS | |
| | (Cost $676,718,647) | | $ | 863,468,976 | |
| | |
| | | | | | | | |
| Shares | | | Dividend
Rate | | Value | |
| |
| Investment Company(b) – 0.1% | | | |
| Goldman Sachs Financial Square Government Fund –
Institutional Shares |
|
| | 1,113,767 | | | 2.395% | | $ | 1,113,767 | |
| | (Cost $1,113,767) | | | | |
| | |
| TOTAL INVESTMENTS BEFORE SECURITIES
LENDING REINVESTMENT VEHICLE | | | | |
| | (Cost $677,832,414) | | $ | 864,582,743 | |
| | |
| | |
|
| Securities Lending Reinvestment Vehicle(b) – 0.1% | |
| Goldman Sachs Financial Square Government Fund –
Institutional Shares |
|
| | 1,239,743 | | | 2.395% | | $ | 1,239,743 | |
| | (Cost $1,239,743) | | | | |
| | |
| | TOTAL INVESTMENTS – 98.6% | | | | |
| | (Cost $679,072,157) | | $ | 865,822,486 | |
| | |
| OTHER ASSETS IN EXCESS OF
LIABILITIES – 1.4% | | | 12,156,621 | |
| | |
| | NET ASSETS – 100.0% | | $ | 877,979,107 | |
| | |
| | |
| The accompanying notes are an integral part of these financial statements. | | 59 |
GOLDMAN SACHS CAPITAL GROWTH FUND
Schedule of Investments(continued)
February 28, 2019 (Unaudited)
| | |
|
| The percentage shown for each investment category reflects the value of investments in that category as a percentage of net assets. |
| |
* | | Non-income producing security. |
| |
(a) | | All or a portion of security is on loan. |
| |
(b) | | Represents an affiliated fund. |
| | |
|
Investment Abbreviations: |
ADR | | —American Depositary Receipt |
PLC | | —Public Limited Company |
|
| | |
| 60 | | The accompanying notes are an integral part of these financial statements. |
GOLDMAN SACHS CONCENTRATED GROWTH FUND
Schedule of Investments
February 28, 2019 (Unaudited)
| | | | | | | | |
Shares | | | Description | | Value | |
|
| Common Stocks – 98.6% | |
| Aerospace & Defense – 3.0% | |
| | 14,815 | | | Northrop Grumman Corp. | | $ | 4,295,757 | |
| | |
| Auto Components – 2.4% | |
| | 40,196 | | | Aptiv PLC | | | 3,340,690 | |
| | |
| Beverages* – 2.0% | |
| | 43,754 | | | Monster Beverage Corp. | | | 2,792,818 | |
| | |
| Biotechnology* – 5.1% | |
| | 23,883 | | | BioMarin Pharmaceutical, Inc. | | | 2,227,329 | |
| | 31,117 | | | Incyte Corp. | | | 2,683,219 | |
| | 12,499 | | | Vertex Pharmaceuticals, Inc. | | | 2,359,186 | |
| | | | | | | | |
| | | | | | | 7,269,734 | |
| | |
| Capital Markets – 4.2% | |
| | 29,723 | | | Intercontinental Exchange, Inc. | | | 2,293,130 | |
| | 38,412 | | | Northern Trust Corp. | | | 3,579,998 | |
| | | | | | | | |
| | | | | | | 5,873,128 | |
| | |
| Chemicals – 3.7% | |
| | 34,970 | | | DowDuPont, Inc. | | | 1,861,453 | |
| | 20,180 | | | Ecolab, Inc. | | | 3,408,604 | |
| | | | | | | | |
| | | | | | | 5,270,057 | |
| | |
| Communications Equipment – 2.1% | |
| | 57,269 | | | Cisco Systems, Inc. | | | 2,964,816 | |
| | |
| Entertainment* – 4.0% | |
| | 29,561 | | | Electronic Arts, Inc. | | | 2,831,353 | |
| | 7,994 | | | Netflix, Inc. | | | 2,862,651 | |
| | | | | | | | |
| | | | | | | 5,694,004 | |
| | |
| Equity Real Estate Investment Trusts (REITs) – 4.1% | |
| | 18,368 | | | American Tower Corp. | | | 3,235,523 | |
| | 5,956 | | | Equinix, Inc. | | | 2,522,366 | |
| | | | | | | | |
| | | | | | | 5,757,889 | |
| | |
| Food & Staples Retailing – 2.2% | |
| | 31,487 | | | Walmart, Inc. | | | 3,116,898 | |
| | |
| Food Products – 1.2% | |
| | 13,028 | | | McCormick & Co., Inc. | | | 1,771,547 | |
| | |
| Health Care Equipment & Supplies – 7.4% | |
| | 88,396 | | | Boston Scientific Corp.* | | | 3,546,448 | |
| | 34,611 | | | Danaher Corp. | | | 4,396,289 | |
| | 4,674 | | | Intuitive Surgical, Inc.* | | | 2,559,529 | |
| | | | | | | | |
| | | | | | | 10,502,266 | |
| | |
| Hotels, Restaurants & Leisure – 1.7% | |
| | 34,536 | | | Dunkin’ Brands Group, Inc. | | | 2,467,597 | |
| | |
| Industrial Conglomerates – 3.1% | |
| | 28,760 | | | Honeywell International, Inc. | | | 4,431,053 | |
| | |
| Interactive Media & Services* – 10.3% | |
| | 4,882 | | | Alphabet, Inc. Class A | | | 5,499,817 | |
| | 2,386 | | | Alphabet, Inc. Class C | | | 2,672,129 | |
| | 39,174 | | | Facebook, Inc. Class A | | | 6,324,642 | |
| | | | | | | | |
| | | | | | | 14,496,588 | |
| | |
| Internet & Direct Marketing Retail* – 6.3% | |
| | 13,219 | | | Alibaba Group Holding Ltd. ADR | | | 2,419,473 | |
| | 3,925 | | | Amazon.com, Inc. | | | 6,436,333 | |
| | | | | | | | |
| | | | | | | 8,855,806 | |
| | |
| IT Services – 4.5% | |
| | 42,998 | | | Visa, Inc. Class A | | | 6,368,864 | |
| | |
| Life Sciences Tools & Services* – 1.7% | |
| | 7,692 | | | Illumina, Inc. | | | 2,405,827 | |
| | |
| Machinery – 1.5% | |
| | 12,973 | | | Deere & Co. | | | 2,128,091 | |
| | |
| Oil, Gas & Consumable Fuels – 2.0% | |
| | 27,152 | | | Diamondback Energy, Inc. | | | 2,794,755 | |
| | |
| Pharmaceuticals – 2.8% | |
| | 31,307 | | | Eli Lilly & Co. | | | 3,953,761 | |
| | |
| Road & Rail – 2.4% | |
| | 46,968 | | | CSX Corp. | | | 3,413,165 | |
| | |
| Semiconductors & Semiconductor Equipment – 3.3% | |
| | 11,082 | | | NVIDIA Corp. | | | 1,709,509 | |
| | 31,674 | | | NXP Semiconductors NV | | | 2,892,470 | |
| | | | | | | | |
| | | | | | | 4,601,979 | |
| | |
| Software – 9.9% | |
| | 9,532 | | | Intuit, Inc. | | | 2,355,643 | |
| | 73,344 | | | Microsoft Corp. | | | 8,216,729 | |
| | 20,974 | | | salesforce.com, Inc.* | | | 3,432,395 | |
| | | | | | | | |
| | | | | | | 14,004,767 | |
| | |
| Technology Hardware, Storage & Peripherals – 4.8% | |
| | 39,145 | | | Apple, Inc. | | | 6,777,957 | |
| | |
| Textiles, Apparel & Luxury Goods – 2.9% | |
| | 47,604 | | | NIKE, Inc. Class B | | | 4,081,091 | |
| | |
| | TOTAL COMMON STOCKS | |
| | (Cost $93,787,114) | | $ | 139,430,905 | |
| | |
| | TOTAL INVESTMENTS – 98.6% | |
| | (Cost $93,787,114) | | $ | 139,430,905 | |
| | |
| OTHER ASSETS IN EXCESS OF
LIABILITIES – 1.4% | | | 1,930,329 | |
| | |
| | NET ASSETS – 100.0% | | $ | 141,361,234 | |
| | |
| | |
|
| The percentage shown for each investment category reflects the value of investments in that category as a percentage of net assets. |
| |
* | | Non-income producing security. |
| | |
|
Investment Abbreviations: |
ADR | | —American Depositary Receipt |
PLC | | —Public Limited Company |
|
| | |
| The accompanying notes are an integral part of these financial statements. | | 61 |
GOLDMAN SACHS FLEXIBLE CAP FUND
Schedule of Investments
February 28, 2019 (Unaudited)
| | | | | | | | |
Shares | | | Description | | Value | |
|
| Common Stocks – 99.5% | |
| Aerospace & Defense – 3.5% | |
| | 355 | | | Huntington Ingalls Industries, Inc. | | $ | 74,340 | |
| | 384 | | | L3 Technologies, Inc. | | | 81,312 | |
| | 378 | | | Northrop Grumman Corp. | | | 109,605 | |
| | 602 | | | Raytheon Co. | | | 112,273 | |
| | 573 | | | The Boeing Co. | | | 252,097 | |
| | | | | | | | |
| | | | | | | 629,627 | |
| | |
| Airlines* – 0.4% | |
| | 3,923 | | | JetBlue Airways Corp. | | | 65,514 | |
| | |
| Auto Components – 0.5% | |
| | 997 | | | Aptiv PLC | | | 82,861 | |
| | |
| Banks – 6.2% | |
| | 9,572 | | | Bank of America Corp. | | | 278,354 | |
| | 1,040 | | | Commerce Bancshares, Inc. | | | 65,447 | |
| | 1,067 | | | East West Bancorp, Inc. | | | 58,269 | |
| | 837 | | | First Republic Bank | | | 87,868 | |
| | 3,270 | | | JPMorgan Chase & Co. | | | 341,257 | |
| | 537 | | | M&T Bank Corp. | | | 92,933 | |
| | 1,407 | | | PacWest Bancorp | | | 57,715 | |
| | 1,326 | | | Synovus Financial Corp. | | | 52,616 | |
| | 1,708 | | | Wells Fargo & Co. | | | 85,212 | |
| | | | | | | | |
| | | | | | | 1,119,671 | |
| | |
| Beverages – 1.4% | |
| | 1,646 | | | Coca-Cola European Partners PLC | | | 77,592 | |
| | 1,503 | | | Monster Beverage Corp.* | | | 95,936 | |
| | 276 | | | PepsiCo, Inc. | | | 31,917 | |
| | 891 | | | TheCoca-Cola Co. | | | 40,398 | |
| | | | | | | | |
| | | | | | | 245,843 | |
| | |
| Biotechnology* – 2.4% | |
| | 837 | | | Alexion Pharmaceuticals, Inc. | | | 113,271 | |
| | 844 | | | BioMarin Pharmaceutical, Inc. | | | 78,711 | |
| | 1,439 | | | Celgene Corp. | | | 119,610 | |
| | 615 | | | Vertex Pharmaceuticals, Inc. | | | 116,081 | |
| | | | | | | | |
| | | | | | | 427,673 | |
| | |
| Capital Markets – 2.5% | |
| | 764 | | | Cboe Global Markets, Inc. | | | 73,275 | |
| | 1,687 | | | E*TRADE Financial Corp. | | | 82,646 | |
| | 1,265 | | | Intercontinental Exchange, Inc. | | | 97,595 | |
| | 971 | | | Northern Trust Corp. | | | 90,497 | |
| | 564 | | | S&P Global, Inc. | | | 113,009 | |
| | | | | | | | |
| | | | | | | 457,022 | |
| | |
| Chemicals – 1.4% | |
| | 496 | | | Celanese Corp. | | | 50,736 | |
| | 1,758 | | | DowDuPont, Inc. | | | 93,578 | |
| | 592 | | | Ecolab, Inc. | | | 99,995 | |
| | | | | | | | |
| | | | | | | 244,309 | |
| | |
| Communications Equipment – 1.4% | |
| | 4,780 | | | Cisco Systems, Inc. | | | 247,461 | |
| | |
| Consumer Finance – 0.7% | |
| | 1,228 | | | American Express Co. | | | 132,305 | |
| | |
| Containers & Packaging – 0.9% | |
| | 595 | | | Avery Dennison Corp. | | | 64,284 | |
| | 1,799 | | | Ball Corp. | | | 98,549 | |
| | | | | | | | |
| | | | | | | 162,833 | |
| | |
| Diversified Financial Services* – 1.2% | |
| | 1,044 | | | Berkshire Hathaway, Inc. Class B | | | 210,157 | |
| | |
| Diversified Telecommunication Services – 2.4% | |
| | 7,009 | | | AT&T, Inc. | | | 218,120 | |
| | 3,880 | | | Verizon Communications, Inc. | | | 220,850 | |
| | | | | | | | |
| | | | | | | 438,970 | |
| | |
| Electric Utilities – 2.2% | |
| | 1,422 | | | Evergy, Inc. | | | 79,504 | |
| | 753 | | | NextEra Energy, Inc. | | | 141,353 | |
| | 867 | | | Pinnacle West Capital Corp. | | | 81,273 | |
| | 1,719 | | | Xcel Energy, Inc. | | | 94,304 | |
| | | | | | | | |
| | | | | | | 396,434 | |
| | |
| Electrical Equipment – 1.4% | |
| | 975 | | | AMETEK, Inc. | | | 77,591 | |
| | 1,489 | | | Emerson Electric Co. | | | 101,475 | |
| | 1,401 | | | Sensata Technologies Holding PLC* | | | 71,073 | |
| | | | | | | | |
| | | | | | | 250,139 | |
| | |
| Electronic Equipment, Instruments & Components – 0.5% | |
| | 940 | | | Amphenol Corp. Class A | | | 88,332 | |
| | |
| Entertainment – 1.5% | |
| | 749 | | | Electronic Arts, Inc.* | | | 71,739 | |
| | 832 | | | Live Nation Entertainment, Inc.* | | | 47,058 | |
| | 330 | | | Netflix, Inc.* | | | 118,173 | |
| | 287 | | | The Walt Disney Co. | | | 32,385 | |
| | | | | | | | |
| | | | | | | 269,355 | |
| | |
| Equity Real Estate Investment Trusts (REITs) – 2.7% | |
| | 1,684 | | | Chesapeake Lodging Trust | | | 50,722 | |
| | 187 | | | Equinix, Inc. | | | 79,195 | |
| | 559 | | | Equity LifeStyle Properties, Inc. | | | 60,730 | |
| | 2,111 | | | HCP, Inc. | | | 64,955 | |
| | 608 | | | Mid-America Apartment Communities, Inc. | | | 62,977 | |
| | 420 | | | SBA Communications Corp.* | | | 75,835 | |
| | 544 | | | Simon Property Group, Inc. | | | 98,551 | |
| | | | | | | | |
| | | | | | | 492,965 | |
| | |
| Food & Staples Retailing – 1.7% | |
| | 2,745 | | | US Foods Holding Corp.* | | | 96,734 | |
| | 2,090 | | | Walmart, Inc. | | | 206,889 | |
| | | | | | | | |
| | | | | | | 303,623 | |
| | |
| Food Products – 0.8% | |
| | 3,162 | | | Mondelez International, Inc. Class A | | | 149,120 | |
| | |
| Health Care Equipment & Supplies – 3.7% | |
| | 2,486 | | | Abbott Laboratories | | | 192,963 | |
| | 3,187 | | | Boston Scientific Corp.* | | | 127,863 | |
| | 1,220 | | | Danaher Corp. | | | 154,964 | |
| | |
| | |
| 62 | | The accompanying notes are an integral part of these financial statements. |
GOLDMAN SACHS FLEXIBLE CAP FUND
| | | | | | | | |
Shares | | | Description | | Value | |
|
| Common Stocks – (continued) | |
| Health Care Equipment & Supplies – (continued) | |
| | 752 | | | West Pharmaceutical Services, Inc. | | $ | 78,772 | |
| | 864 | | | Zimmer Biomet Holdings, Inc. | | | 107,240 | |
| | | | | | | | |
| | | | | | | 661,802 | |
| | |
| Health Care Providers & Services – 2.4% | |
| | 2,137 | | | CVS Health Corp. | | | 123,583 | |
| | 378 | | | Humana, Inc. | | | 107,745 | |
| | 672 | | | Laboratory Corp. of America Holdings* | | | 99,617 | |
| | 388 | | | UnitedHealth Group, Inc. | | | 93,981 | |
| | | | | | | | |
| | | | | | | 424,926 | |
| | |
| Hotels, Restaurants & Leisure – 1.8% | |
| | 1,086 | | | Las Vegas Sands Corp. | | | 66,713 | |
| | 966 | | | McDonald’s Corp. | | | 177,589 | |
| | 699 | | | Royal Caribbean Cruises Ltd. | | | 82,818 | |
| | | | | | | | |
| | | | | | | 327,120 | |
| | |
| Household Products – 2.2% | |
| | 721 | | | The Clorox Co. | | | 113,940 | |
| | 2,891 | | | The Procter & Gamble Co. | | | 284,908 | |
| | | | | | | | |
| | | | | | | 398,848 | |
| | |
| Industrial Conglomerates – 1.3% | |
| | 6,921 | | | General Electric Co. | | | 71,909 | |
| | 1,023 | | | Honeywell International, Inc. | | | 157,614 | |
| | | | | | | | |
| | | | | | | 229,523 | |
| | |
| Insurance – 2.3% | |
| | 742 | | | American Financial Group, Inc. | | | 73,948 | |
| | 363 | | | Everest Re Group Ltd. | | | 82,078 | |
| | 2,401 | | | MetLife, Inc. | | | 108,501 | |
| | 980 | | | Torchmark Corp. | | | 80,909 | |
| | 901 | | | W.R. Berkley Corp. | | | 75,377 | |
| | | | | | | | |
| | | | | | | 420,813 | |
| | |
| Interactive Media & Services* – 5.1% | |
| | 271 | | | Alphabet, Inc. Class A | | | 305,295 | |
| | 238 | | | Alphabet, Inc. Class C | | | 266,541 | |
| | 1,831 | | | Facebook, Inc. Class A | | | 295,615 | |
| | 233 | | | IAC/InterActiveCorp. | | | 49,641 | |
| | | | | | | | |
| | | | | | | 917,092 | |
| | |
| Internet & Direct Marketing Retail – 3.3% | |
| | 318 | | | Amazon.com, Inc.* | | | 521,466 | |
| | 616 | | | Expedia Group, Inc. | | | 75,959 | |
| | | | | | | | |
| | | | | | | 597,425 | |
| | |
| IT Services – 4.8% | |
| | 894 | | | Accenture PLC Class A | | | 144,274 | |
| | 1,186 | | | Black Knight, Inc.* | | | 61,969 | |
| | 849 | | | Fidelity National Information Services, Inc. | | | 91,819 | |
| | 854 | | | GoDaddy, Inc. Class A* | | | 63,751 | |
| | 708 | | | Mastercard, Inc. Class A | | | 159,137 | |
| | 838 | | | Total System Services, Inc. | | | 79,107 | |
| | 1,793 | | | Visa, Inc. Class A | | | 265,579 | |
| | | | | | | | |
| | | | | | | 865,636 | |
| | |
| Life Sciences Tools & Services – 0.6% | |
| | 1,326 | | | Agilent Technologies, Inc. | | | 105,337 | |
| | |
| Machinery – 1.8% | |
| | 457 | | | IDEX Corp. | | | 65,854 | |
| | 864 | | | Ingersoll-Rand PLC | | | 91,204 | |
| | 599 | | | Stanley Black & Decker, Inc. | | | 79,326 | |
| | 37 | | | Wabtec Corp. | | | 2,723 | |
| | 1,077 | | | Xylem, Inc. | | | 81,367 | |
| | | | | | | | |
| | | | | | | 320,474 | |
| | |
| Media – 1.3% | |
| | 4,662 | | | Comcast Corp. Class A | | | 180,280 | |
| | 1,831 | | | Liberty Global PLC Class C* | | | 46,489 | |
| | | | | | | | |
| | | | | | | 226,769 | |
| | |
| Metals & Mining – 0.2% | |
| | 1,190 | | | Steel Dynamics, Inc. | | | 44,411 | |
| | |
| Multi-Utilities – 1.0% | |
| | 1,203 | | | Ameren Corp. | | | 85,701 | |
| | 1,577 | | | CMS Energy Corp. | | | 85,789 | |
| | | | | | | | |
| | | | | | | 171,490 | |
| | |
| Multiline Retail – 0.4% | |
| | 656 | | | Dollar General Corp. | | | 77,710 | |
| | |
| Oil, Gas & Consumable Fuels – 5.3% | |
| | 2,112 | | | Chevron Corp. | | | 252,553 | |
| | 799 | | | Concho Resources, Inc. | | | 87,890 | |
| | 2,022 | | | ConocoPhillips | | | 137,193 | |
| | 837 | | | Diamondback Energy, Inc. | | | 86,152 | |
| | 1,243 | | | EOG Resources, Inc. | | | 116,842 | |
| | 2,171 | | | Exxon Mobil Corp. | | | 171,574 | |
| | 1,763 | | | Marathon Petroleum Corp. | | | 109,324 | |
| | | | | | | | |
| | | | | | | 961,528 | |
| | |
| Pharmaceuticals – 6.0% | |
| | 2,064 | | | AstraZeneca PLC ADR | | | 85,821 | |
| | 2,665 | | | Elanco Animal Health, Inc.* | | | 80,590 | |
| | 1,404 | | | Eli Lilly & Co. | | | 177,311 | |
| | 2,665 | | | Johnson & Johnson | | | 364,146 | |
| | 776 | | | Merck & Co., Inc. | | | 63,081 | |
| | 4,431 | | | Pfizer, Inc. | | | 192,084 | |
| | 1,301 | | | Zoetis, Inc. | | | 122,593 | |
| | | | | | | | |
| | | | | | | 1,085,626 | |
| | |
| Road & Rail – 1.5% | |
| | 1,566 | | | CSX Corp. | | | 113,801 | |
| | 970 | | | Union Pacific Corp. | | | 162,669 | |
| | | | | | | | |
| | | | | | | 276,470 | |
| | |
| Semiconductors & Semiconductor Equipment – 3.9% | |
| | 893 | | | Analog Devices, Inc. | | | 95,515 | |
| | 1,753 | | | Intel Corp. | | | 92,839 | |
| | 478 | | | Lam Research Corp. | | | 84,171 | |
| | 3,368 | | | Marvell Technology Group Ltd. | | | 67,192 | |
| | 1,395 | | | Maxim Integrated Products, Inc. | | | 75,930 | |
| | |
| | |
| The accompanying notes are an integral part of these financial statements. | | 63 |
GOLDMAN SACHS FLEXIBLE CAP FUND
Schedule of Investments(continued)
February 28, 2019 (Unaudited)
| | | | | | | | |
Shares | | | Description | | Value | |
|
| Common Stocks – (continued) | |
| Semiconductors & Semiconductor Equipment – (continued) | |
| | 470 | | | NVIDIA Corp. | | $ | 72,502 | |
| | 720 | | | NXP Semiconductors NV | | | 65,750 | |
| | 1,345 | | | Texas Instruments, Inc. | | | 142,274 | |
| | | | | | | | |
| | | | | | | 696,173 | |
| | |
| Software – 6.4% | |
| | 537 | | | Check Point Software Technologies Ltd.* | | | 65,675 | |
| | 713 | | | Citrix Systems, Inc. | | | 75,222 | |
| | 479 | | | Intuit, Inc. | | | 118,375 | |
| | 6,567 | | | Microsoft Corp. | | | 735,701 | |
| | 982 | | | salesforce.com, Inc.* | | | 160,704 | |
| | | | | | | | |
| | | | | | | 1,155,677 | |
| | |
| Specialty Retail – 2.6% | |
| | 392 | | | Burlington Stores, Inc.* | | | 66,538 | |
| | 237 | | | O’Reilly Automotive, Inc.* | | | 88,154 | |
| | 969 | | | Ross Stores, Inc. | | | 91,890 | |
| | 1,219 | | | The Home Depot, Inc. | | | 225,686 | |
| | | | | | | | |
| | | | | | | 472,268 | |
| | |
| Technology Hardware, Storage & Peripherals – 3.7% | |
| | 3,861 | | | Apple, Inc. | | | 668,532 | |
| | |
| Textiles, Apparel & Luxury Goods – 1.2% | |
| | 1,759 | | | NIKE, Inc. Class B | | | 150,799 | |
| | 646 | | | PVH Corp. | | | 74,187 | |
| | | | | | | | |
| | | | | | | 224,986 | |
| | |
| Tobacco – 1.0% | |
| | 1,424 | | | Altria Group, Inc. | | | 74,632 | |
| | 1,183 | | | Philip Morris International, Inc. | | | 102,850 | |
| | | | | | | | |
| | | | | | | 177,482 | |
| | |
| | TOTAL COMMON STOCKS | |
| | (Cost $14,382,524) | | $ | 17,922,332 | |
| | |
| | TOTAL INVESTMENTS – 99.5% | |
| | (Cost $14,382,524) | | $ | 17,922,332 | |
| | |
| OTHER ASSETS IN EXCESS OF
LIABILITIES – 0.5% | | | 96,757 | |
| | |
| | NET ASSETS – 100.0% | | $ | 18,019,089 | |
| | |
| | |
|
| The percentage shown for each investment category reflects the value of investments in that category as a percentage of net assets. |
| |
* | | Non-income producing security. |
| | |
|
Investment Abbreviations: |
ADR | | —American Depositary Receipt |
PLC | | —Public Limited Company |
|
| | |
| 64 | | The accompanying notes are an integral part of these financial statements. |
GOLDMAN SACHS GROWTH OPPORTUNITIES FUND
Schedule of Investments
February 28, 2019 (Unaudited)
| | | | | | | | |
Shares | | | Description | | Value | |
|
| Common Stocks – 98.5% | |
| Aerospace & Defense – 3.0% | |
| | 160,893 | | | Harris Corp. | | $ | 26,536,083 | |
| | 146,359 | | | HEICO Corp. | | | 13,718,229 | |
| | 74,998 | | | HEICO Corp. Class A | | | 5,999,090 | |
| | | | | | | | |
| | | | | | | 46,253,402 | |
| | |
| Auto Components – 1.1% | |
| | 203,157 | | | Aptiv PLC | | | 16,884,378 | |
| | |
| Banks – 1.4% | |
| | 211,167 | | | First Republic Bank | | | 22,168,312 | |
| | |
| Beverages – 2.3% | |
| | 441,263 | | | Brown-Forman Corp. Class B | | | 21,838,106 | |
| | 216,274 | | | Monster Beverage Corp.* | | | 13,804,769 | |
| | | | | | | | |
| | | | | | | 35,642,875 | |
| | |
| Biotechnology* – 4.6% | |
| | 148,329 | | | Agios Pharmaceuticals, Inc. | | | 9,622,102 | |
| | 311,092 | | | Alder Biopharmaceuticals, Inc. | | | 3,988,199 | |
| | 108,494 | | | BioMarin Pharmaceutical, Inc. | | | 10,118,151 | |
| | 18,930 | | | Bluebird Bio, Inc. | | | 2,938,315 | |
| | 156,298 | | | Exact Sciences Corp. | | | 14,223,118 | |
| | 340,778 | | | Exelixis, Inc. | | | 7,630,019 | |
| | 118,909 | | | Incyte Corp. | | | 10,253,523 | |
| | 321,347 | | | Moderna, Inc.(a) | | | 7,262,442 | |
| | 29,127 | | | Sarepta Therapeutics, Inc. | | | 4,201,279 | |
| | | | | | | | |
| | | | | | | 70,237,148 | |
| | |
| Capital Markets – 4.8% | |
| | 112,877 | | | Cboe Global Markets, Inc. | | | 10,826,033 | |
| | 284,710 | | | Lazard Ltd. Class A | | | 10,656,695 | |
| | 53,881 | | | Moody’s Corp. | | | 9,327,879 | |
| | 91,018 | | | MSCI, Inc. | | | 16,812,845 | |
| | 201,956 | | | Northern Trust Corp. | | | 18,822,299 | |
| | 77,237 | | | T. Rowe Price Group, Inc. | | | 7,756,912 | |
| | | | | | | | |
| | | | | | | 74,202,663 | |
| | |
| Chemicals – 1.5% | |
| | 187,653 | | | Ashland Global Holdings, Inc. | | | 14,520,589 | |
| | 76,984 | | | Celanese Corp. | | | 7,874,694 | |
| | | | | | | | |
| | | | | | | 22,395,283 | |
| | |
| Commercial Services & Supplies – 1.2% | |
| | 87,379 | | | Cintas Corp. | | | 18,052,501 | |
| | |
| Construction Materials – 1.4% | |
| | 115,094 | | | Martin Marietta Materials, Inc. | | | 21,614,653 | |
| | |
| Containers & Packaging – 0.5% | |
| | 75,584 | | | Avery Dennison Corp. | | | 8,166,095 | |
| | |
| Diversified Consumer Services* – 1.7% | |
| | 210,703 | | | Bright Horizons Family Solutions, Inc. | | | 26,127,172 | |
| | |
| Electrical Equipment* – 0.9% | |
| | 266,131 | | | Sensata Technologies Holding PLC | | | 13,500,826 | |
| | |
| Electronic Equipment, Instruments & Components – 2.2% | |
| | 355,889 | | | Amphenol Corp. Class A | | | 33,442,889 | |
| | |
| Entertainment* – 0.5% | |
| | 57,521 | | | Spotify Technology SA | | | 8,060,993 | |
| | |
| Equity Real Estate Investment Trusts (REITs) – 2.5% | |
| | 127,427 | | | Equity LifeStyle Properties, Inc. | | | 13,843,669 | |
| | 133,866 | | | SBA Communications Corp.* | | | 24,170,845 | |
| | | | | | | | |
| | | | | | | 38,014,514 | |
| | |
| Food Products – 1.6% | |
| | 174,651 | | | McCormick & Co., Inc. | | | 23,749,043 | |
| | |
| Health Care Equipment & Supplies – 8.6% | |
| | 19,658 | | | ABIOMED, Inc.* | | | 6,575,601 | |
| | 128,323 | | | Align Technology, Inc.* | | | 33,231,807 | |
| | 112,744 | | | Edwards Lifesciences Corp.* | | | 19,086,432 | |
| | 109,839 | | | IDEXX Laboratories, Inc.* | | | 23,179,324 | |
| | 71,892 | | | Teleflex, Inc. | | | 20,837,177 | |
| | 34,219 | | | The Cooper Cos., Inc. | | | 9,786,292 | |
| | 104,970 | | | West Pharmaceutical Services, Inc. | | | 10,995,608 | |
| | 64,039 | | | Zimmer Biomet Holdings, Inc. | | | 7,948,521 | |
| | | | | | | | |
| | | | | | | 131,640,762 | |
| | |
| Hotels, Restaurants & Leisure – 2.2% | |
| | 294,256 | | | Choice Hotels International, Inc. | | | 23,493,399 | |
| | 37,562 | | | Domino’s Pizza, Inc. | | | 9,425,808 | |
| | | | | | | | |
| | | | | | | 32,919,207 | |
| | |
| Household Durables – 0.5% | |
| | 199,405 | | | D.R. Horton, Inc. | | | 7,754,860 | |
| | |
| Household Products – 0.8% | |
| | 80,825 | | | The Clorox Co. | | | 12,772,775 | |
| | |
| Industrial Conglomerates – 1.6% | |
| | 73,853 | | | Roper Technologies, Inc. | | | 23,902,524 | |
| | |
| Interactive Media & Services* – 1.5% | |
| | 63,348 | | | IAC/InterActiveCorp. | | | 13,496,292 | |
| | 306,554 | | | Twitter, Inc. | | | 9,435,732 | |
| | | | | | | | |
| | | | | | | 22,932,024 | |
| | |
| Internet & Direct Marketing Retail* – 0.2% | |
| | 43,254 | | | GrubHub, Inc. | | | 3,528,661 | |
| | |
| IT Services – 8.4% | |
| | 376,635 | | | Black Knight, Inc.* | | | 19,679,179 | |
| | 162,488 | | | Fidelity National Information Services, Inc. | | | 17,573,077 | |
| | 408,799 | | | Fiserv, Inc.* | | | 34,621,187 | |
| | 358,425 | | | GoDaddy, Inc. Class A* | | | 26,756,426 | |
| | 63,237 | | | Square, Inc. Class A* | | | 5,137,374 | |
| | 272,870 | | | Total System Services, Inc. | | | 25,758,928 | |
| | | | | | | | |
| | | | | | | 129,526,171 | |
| | |
| Life Sciences Tools & Services – 4.9% | |
| | 303,803 | | | Agilent Technologies, Inc. | | | 24,134,110 | |
| | 78,752 | | | Illumina, Inc.* | | | 24,631,263 | |
| | |
| | |
| The accompanying notes are an integral part of these financial statements. | | 65 |
GOLDMAN SACHS GROWTH OPPORTUNITIES FUND
Schedule of Investments(continued)
February 28, 2019 (Unaudited)
| | | | | | | | |
Shares | | | Description | | Value | |
|
| Common Stocks – (continued) | |
| Life Sciences Tools & Services – (continued) | |
| | 18,201 | | | Mettler-Toledo International, Inc.* | | $ | 12,393,243 | |
| | 126,553 | | | PRA Health Sciences, Inc.* | | | 13,538,640 | |
| | | | | | | | |
| | | | | | | 74,697,256 | |
| | |
| Machinery – 6.1% | |
| | 268,691 | | | Fortive Corp. | | | 21,917,125 | |
| | 136,164 | | | IDEX Corp. | | | 19,621,232 | |
| | 215,765 | | | Ingersoll-Rand PLC | | | 22,776,154 | |
| | 157,723 | | | John Bean Technologies Corp. | | | 14,778,645 | |
| | 186,586 | | | Xylem, Inc. | | | 14,096,572 | |
| | | | | | | | |
| | | | | | | 93,189,728 | |
| | |
| Multiline Retail – 2.3% | |
| | 302,029 | | | Dollar General Corp. | | | 35,778,355 | |
| | |
| Oil, Gas & Consumable Fuels – 2.4% | |
| | 247,118 | | | Cheniere Energy, Inc.* | | | 15,926,755 | |
| | 99,028 | | | Concho Resources, Inc. | | | 10,893,080 | |
| | 102,079 | | | Diamondback Energy, Inc. | | | 10,506,992 | |
| | | | | | | | |
| | | | | | | 37,326,827 | |
| | |
| Pharmaceuticals – 1.5% | |
| | 314,384 | | | Elanco Animal Health, Inc.*(a) | | | 9,506,972 | |
| | 140,291 | | | Zoetis, Inc. | | | 13,219,621 | |
| | | | | | | | |
| | | | | | | 22,726,593 | |
| | |
| Professional Services* – 1.4% | |
| | 171,828 | | | Verisk Analytics, Inc. | | | 21,724,214 | |
| | |
| Road & Rail – 0.8% | |
| | 85,193 | | | Old Dominion Freight Line, Inc. | | | 12,844,549 | |
| | |
| Semiconductors & Semiconductor Equipment – 6.0% | |
| | 514,078 | | | Advanced Micro Devices, Inc.* | | | 12,096,255 | |
| | 107,115 | | | Analog Devices, Inc. | | | 11,457,020 | |
| | 1,188,825 | | | Marvell Technology Group Ltd. | | | 23,717,059 | |
| | 163,028 | | | Maxim Integrated Products, Inc. | | | 8,873,614 | |
| | 185,004 | | | Microchip Technology, Inc. | | | 16,071,297 | |
| | 133,465 | | | MKS Instruments, Inc. | | | 11,060,245 | |
| | 66,836 | | | Xilinx, Inc. | | | 8,374,551 | |
| | | | | | | | |
| | | | | | | 91,650,041 | |
| | |
| Software – 11.5% | |
| | 125,726 | | | Atlassian Corp. PLC Class A* | | | 13,513,030 | |
| | 143,446 | | | Autodesk, Inc.* | | | 23,383,132 | |
| | 211,112 | | | Citrix Systems, Inc. | | | 22,272,316 | |
| | 66,301 | | | Coupa Software, Inc.* | | | 6,244,891 | |
| | 102,438 | | | Intuit, Inc. | | | 25,315,503 | |
| | 242,252 | | | PTC, Inc.* | | | 22,485,831 | |
| | 151,456 | | | ServiceNow, Inc.* | | | 36,264,625 | |
| | 129,974 | | | Splunk, Inc.* | | | 17,660,867 | |
| | 45,389 | | | Workday, Inc. Class A* | | | 8,983,845 | |
| | | | | | | | |
| | | | | | | 176,124,040 | |
| | |
| Specialty Retail – 4.3% | |
| | 60,470 | | | Five Below, Inc.* | | | 7,277,564 | |
| | 41,006 | | | O’Reilly Automotive, Inc.* | | | 15,252,592 | |
| | |
| | 317,625 | | | Ross Stores, Inc. | | | 30,120,379 | |
| | 137,740 | | | Tiffany & Co. | | | 13,090,810 | |
| | | | | | | | |
| | | | | | | 65,741,345 | |
| | |
| Textiles, Apparel & Luxury Goods – 2.3% | |
| | 129,927 | | | Lululemon Athletica, Inc.* | | | 19,543,619 | |
| | 132,396 | | | PVH Corp. | | | 15,204,357 | |
| | | | | | | | |
| | | | | | | 34,747,976 | |
| | |
| | TOTAL COMMON STOCKS | |
| | (Cost $1,190,724,093) | | $ | 1,510,040,655 | |
| | |
| | | | | | | | |
| Shares | | | Dividend
Rate | | Value | |
|
| Investment Company(b) – 1.1% | |
| Goldman Sachs Financial Square Government Fund –
Institutional Shares |
|
| | 16,991,395 | | | 2.395% | | $ | 16,991,395 | |
| | (Cost $16,991,395) | |
| | |
| TOTAL INVESTMENTS BEFORE SECURITIES
LENDING REINVESTMENT VEHICLE |
|
| | (Cost $1,207,715,488) | | $ | 1,527,032,050 | |
| | |
| | | | | | | | |
|
| Securities Lending Reinvestment Vehicle(b) – 1.0% | |
| Goldman Sachs Financial Square Government Fund –
Institutional Shares |
|
| | 15,382,880 | | | 2.395% | | $ | 15,382,880 | |
| | (Cost $15,382,880) | | | | |
| | |
| | TOTAL INVESTMENTS – 100.6% | |
| | (Cost $1,223,098,368) | | $ | 1,542,414,930 | |
| | |
| LIABILITIES IN EXCESS OF
OTHER ASSETS – (0.6)% | | | (8,613,307 | ) |
| | |
| | NET ASSETS – 100.0% | | $ | 1,533,801,623 | |
| | |
| | |
|
| The percentage shown for each investment category reflects the value of investments in that category as a percentage of net assets. |
| |
* | | Non-income producing security. |
| |
(a) | | All or a portion of security is on loan. |
| |
(b) | | Represents an affiliated fund. |
| | |
|
Investment Abbreviations: |
PLC | | —Public Limited Company |
|
| | |
| 66 | | The accompanying notes are an integral part of these financial statements. |
GOLDMAN SACHS SMALL/MID CAP GROWTH FUND
Schedule of Investments
February 28, 2019 (Unaudited)
| | | | | | | | |
Shares | | | Description | | Value | |
|
| Common Stocks – 95.8% | |
| Aerospace & Defense – 2.4% | |
| | 322,396 | | | Aerojet Rocketdyne Holdings, Inc.* | | $ | 12,009,251 | |
| | 258,841 | | | HEICO Corp. Class A | | | 20,704,692 | |
| | 81,313 | | | Huntington Ingalls Industries, Inc. | | | 17,027,755 | |
| | | | | | | | |
| | | | | | | 49,741,698 | |
| | |
| Banks – 3.9% | |
| | 773,844 | | | Amalgamated Bank Class A | | | 13,704,777 | |
| | 559,006 | | | Eagle Bancorp, Inc.* | | | 33,087,565 | |
| | 59,689 | | | First Republic Bank | | | 6,266,151 | |
| | 256,288 | | | Glacier Bancorp, Inc. | | | 11,230,540 | |
| | 124,186 | | | Signature Bank | | | 16,859,492 | |
| | | | | | | | |
| | | | | | | 81,148,525 | |
| | |
| Beverages – 1.6% | |
| | 396,276 | | | MGP Ingredients, Inc. | | | 32,435,191 | |
| | |
| Biotechnology* – 10.4% | |
| | 464,281 | | | ACADIA Pharmaceuticals, Inc. | | | 12,303,447 | |
| | 306,558 | | | Agios Pharmaceuticals, Inc. | | | 19,886,417 | |
| | 1,145,760 | | | Alder Biopharmaceuticals, Inc. | | | 14,688,643 | |
| | 366,533 | | | Alector, Inc. | | | 7,180,381 | |
| | 528,478 | | | Alkermes PLC | | | 17,582,463 | |
| | 475,781 | | | Amarin Corp. PLC ADR | | | 9,739,237 | |
| | 85,991 | | | BioSpecifics Technologies Corp. | | | 5,972,075 | |
| | 133,549 | | | Bluebird Bio, Inc. | | | 20,729,476 | |
| | 246,893 | | | Evelo Biosciences, Inc.(a) | | | 2,170,189 | |
| | 758,879 | | | Exelixis, Inc. | | | 16,991,301 | |
| | 200,250 | | | Incyte Corp. | | | 17,267,557 | |
| | 498,538 | | | Moderna, Inc.(a) | | | 11,266,959 | |
| | 1,003,875 | | | Proteostasis Therapeutics, Inc. | | | 4,135,965 | |
| | 1,733,699 | | | Rigel Pharmaceuticals, Inc. | | | 3,796,801 | |
| | 156,420 | | | Sarepta Therapeutics, Inc. | | | 22,562,021 | |
| | 1,171,040 | | | Stemline Therapeutics, Inc. | | | 12,846,309 | |
| | 434,858 | | | Synthorx, Inc. | | | 8,658,023 | |
| | 255,080 | | | UNITY Biotechnology, Inc.(a) | | | 2,550,800 | |
| | 205,611 | | | Y-mAbs Therapeutics, Inc. | | | 4,451,478 | |
| | | | | | | | |
| | | | | | | 214,779,542 | |
| | |
| Building Products – 1.5% | |
| | 208,553 | | | Allegion PLC | | | 18,761,428 | |
| | 262,273 | | | Fortune Brands Home & Security, Inc. | | | 12,358,304 | |
| | | | | | | | |
| | | | | | | 31,119,732 | |
| | |
| Capital Markets – 4.1% | |
| | 78,970 | | | Affiliated Managers Group, Inc. | | | 8,655,902 | |
| | 235,996 | | | Cboe Global Markets, Inc. | | | 22,634,376 | |
| | 173,379 | | | Evercore, Inc. Class A | | | 15,968,206 | |
| | 725,719 | | | Lazard Ltd. Class A | | | 27,163,662 | |
| | 59,754 | | | MSCI, Inc. | | | 11,037,759 | |
| | | | | | | | |
| | | | | | | 85,459,905 | |
| | |
| Chemicals – 1.6% | |
| | 304,937 | | | Ashland Global Holdings, Inc. | | | 23,596,025 | |
| | 175,347 | | | RPM International, Inc. | | | 10,147,331 | |
| | | | | | | | |
| | | | | | | 33,743,356 | |
| | |
| Commercial Services & Supplies – 1.1% | |
| | 330,856 | | | Healthcare Services Group, Inc. | | | 12,632,082 | |
| | 134,197 | | | Rollins, Inc. | | | 5,322,253 | |
| | 88,685 | | | US Ecology, Inc. | | | 5,088,745 | |
| | | | | | | | |
| | | | | | | 23,043,080 | |
| | |
| Communications Equipment* – 1.1% | |
| | 1,760,620 | | | Viavi Solutions, Inc. | | | 23,116,941 | |
| | |
| Consumer Finance* – 1.0% | |
| | 178,241 | | | Green Dot Corp. Class A | | | 11,505,456 | |
| | 884,917 | | | SLM Corp. | | | 9,778,333 | |
| | | | | | | | |
| | | | | | | 21,283,789 | |
| | |
| Containers & Packaging – 1.5% | |
| | 284,584 | | | Avery Dennison Corp. | | | 30,746,455 | |
| | |
| Diversified Consumer Services* – 1.8% | |
| | 292,582 | | | Bright Horizons Family Solutions, Inc. | | | 36,280,168 | |
| | |
| Diversified Telecommunication Services* – 0.2% | |
| | 192,746 | | | Zayo Group Holdings, Inc. | | | 4,780,101 | |
| | |
| Electrical Equipment – 1.4% | |
| | 309,633 | | | nVent Electric PLC | | | 8,508,715 | |
| | 390,995 | | | Sensata Technologies Holding PLC* | | | 19,835,176 | |
| | | | | | | | |
| | | | | | | 28,343,891 | |
| | |
| Electronic Equipment, Instruments & Components – 3.0% | |
| | 371,487 | | | Badger Meter, Inc. | | | 21,858,295 | |
| | 537,012 | | | Cognex Corp. | | | 28,676,441 | |
| | 128,149 | | | Keysight Technologies, Inc.* | | | 10,817,057 | |
| | | | | | | | |
| | | | | | | 61,351,793 | |
| | |
| Entertainment* – 0.7% | |
| | 157,775 | | | Take-Two Interactive Software, Inc. | | | 13,767,447 | |
| | |
| Equity Real Estate Investment Trusts (REITs)* – 0.8% | |
| | 93,721 | | | SBA Communications Corp. | | | 16,922,264 | |
| | |
| Food Products – 0.5% | |
| | 76,985 | | | McCormick & Co., Inc. | | | 10,468,420 | |
| | |
| Health Care Equipment & Supplies – 8.2% | |
| | 23,346 | | | ABIOMED, Inc.* | | | 7,809,237 | |
| | 328,059 | | | Axonics Modulation Technologies, Inc.*(a) | | | 6,974,534 | |
| | 126,027 | | | DexCom, Inc.* | | | 17,559,342 | |
| | 484,540 | | | ElectroCore, Inc.* | | | 4,234,880 | |
| | 137,302 | | | Glaukos Corp.* | | | 10,183,689 | |
| | 52,193 | | | Heska Corp.* | | | 4,268,866 | |
| | 93,798 | | | IDEXX Laboratories, Inc.* | | | 19,794,192 | |
| | 201,314 | | | Neogen Corp.* | | | 12,473,415 | |
| | 202,385 | | | SI-BONE, Inc.* | | | 4,193,417 | |
| | 216,407 | | | Tandem Diabetes Care, Inc.* | | | 14,189,807 | |
| | 109,272 | | | Teleflex, Inc. | | | 31,671,397 | |
| | 42,570 | | | The Cooper Cos., Inc. | | | 12,174,594 | |
| | 232,956 | | | West Pharmaceutical Services, Inc. | | | 24,402,141 | |
| | | | | | | | |
| | | | | | | 169,929,511 | |
| | |
| | |
| The accompanying notes are an integral part of these financial statements. | | 67 |
GOLDMAN SACHS SMALL/MID CAP GROWTH FUND
Schedule of Investments(continued)
February 28, 2019 (Unaudited)
| | | | | | | | |
Shares | | | Description | | Value | |
|
| Common Stocks – (continued) | |
| Health Care Providers & Services* – 2.4% | |
| | 195,529 | | | Guardant Health, Inc.(a) | | $ | 13,030,052 | |
| | 466,304 | | | HealthEquity, Inc. | | | 37,528,146 | |
| | | | | | | | |
| | | | | | | 50,558,198 | |
| | |
| Health Care Technology* – 1.1% | |
| | 161,110 | | | Teladoc Health, Inc. | | | 10,369,040 | |
| | 107,986 | | | Veeva Systems, Inc. Class A | | | 12,732,629 | |
| | | | | | | | |
| | | | | | | 23,101,669 | |
| | |
| Hotels, Restaurants & Leisure – 5.8% | |
| | 361,317 | | | Choice Hotels International, Inc. | | | 28,847,549 | |
| | 75,168 | | | Domino’s Pizza, Inc. | | | 18,862,658 | |
| | 246,171 | | | Dunkin’ Brands Group, Inc. | | | 17,588,918 | |
| | 252,108 | | | Papa John’s International, Inc.(a) | | | 11,019,641 | |
| | 141,536 | | | Texas Roadhouse, Inc. | | | 8,960,644 | |
| | 104,223 | | | Vail Resorts, Inc. | | | 21,719,031 | |
| | 206,083 | | | Wingstop, Inc. | | | 13,727,189 | |
| | | | | | | | |
| | | | | | | 120,725,630 | |
| | |
| Household Durables* – 0.3% | |
| | 269,292 | | | M/I Homes, Inc. | | | 7,012,364 | |
| | |
| Interactive Media & Services* – 1.3% | |
| | 124,613 | | | IAC/InterActiveCorp. | | | 26,548,800 | |
| | |
| Internet & Direct Marketing Retail* – 0.3% | |
| | 82,505 | | | GrubHub, Inc. | | | 6,730,758 | |
| | |
| IT Services – 10.8% | |
| | 722,492 | | | Black Knight, Inc.* | | | 37,750,207 | |
| | 124,586 | | | Euronet Worldwide, Inc.* | | | 16,734,392 | |
| | 72,317 | | | Gartner, Inc.* | | | 10,290,709 | |
| | 258,195 | | | Global Payments, Inc. | | | 33,663,464 | |
| | 580,149 | | | GoDaddy, Inc. Class A* | | | 43,308,123 | |
| | 436,536 | | | InterXion Holding NV* | | | 28,593,108 | |
| | 321,990 | | | Total System Services, Inc. | | | 30,395,856 | |
| | 205,084 | | | Wix.com Ltd.* | | | 22,405,427 | |
| | | | | | | | |
| | | | | | | 223,141,286 | |
| | |
| Life Sciences Tools & Services – 1.0% | |
| | 193,214 | | | Medpace Holdings, Inc.* | | | 10,617,109 | |
| | 104,936 | | | PerkinElmer, Inc. | | | 9,880,774 | |
| | | | | | | | |
| | | | | | | 20,497,883 | |
| | |
| Machinery – 5.7% | |
| | 435,257 | | | Evoqua Water Technologies Corp.* | | | 5,910,790 | |
| | 277,998 | | | Hillenbrand, Inc. | | | 12,312,531 | |
| | 119,521 | | | IDEX Corp. | | | 17,222,976 | |
| | 218,475 | | | John Bean Technologies Corp. | | | 20,471,107 | |
| | 97,160 | | | RBC Bearings, Inc.* | | | 13,616,974 | |
| | 79,498 | | | Standex International Corp. | | | 6,519,631 | |
| | 1,092,979 | | | Welbilt, Inc.* | | | 17,454,875 | |
| | 331,352 | | | Xylem, Inc. | | | 25,033,644 | |
| | | | | | | | |
| | | | | | | 118,542,528 | |
| | |
| Oil, Gas & Consumable Fuels – 0.4% | |
| | 259,643 | | | Centennial Resource Development, Inc. Class A* | | | 2,354,962 | |
| | 58,749 | | | Diamondback Energy, Inc. | | | 6,047,035 | |
| | | | | | | | |
| | | | | | | 8,401,997 | |
| | |
| Pharmaceuticals* – 1.4% | |
| | 206,293 | | | Aratana Therapeutics, Inc. | | | 829,298 | |
| | 368,079 | | | Elanco Animal Health, Inc.(a) | | | 11,130,709 | |
| | 64,358 | | | GW Pharmaceuticals PLC ADR | | | 11,070,219 | |
| | 1,638,739 | | | Marinus Pharmaceuticals, Inc. | | | 5,620,875 | |
| | | | | | | | |
| | | | | | | 28,651,101 | |
| | |
| Professional Services* – 0.3% | |
| | 246,047 | | | Upwork, Inc. | | | 5,828,853 | |
| | |
| Real Estate Management & Development – 0.4% | |
| | 186,622 | | | HFF, Inc. Class A | | | 8,435,314 | |
| | |
| Road & Rail – 1.0% | |
| | 141,513 | | | Old Dominion Freight Line, Inc. | | | 21,335,915 | |
| | |
| Semiconductors & Semiconductor Equipment – 3.7% | |
| | 709,693 | | | Advanced Micro Devices, Inc.* | | | 16,699,076 | |
| | 546,801 | | | Entegris, Inc. | | | 19,318,479 | |
| | 1,318,774 | | | Marvell Technology Group Ltd. | | | 26,309,541 | |
| | 181,188 | | | MKS Instruments, Inc. | | | 15,015,050 | |
| | | | | | | | |
| | | | | | | 77,342,146 | |
| | |
| Software* – 9.7% | |
| | 670,302 | | | Cadence Design Systems, Inc. | | | 38,374,790 | |
| | 176,574 | | | Coupa Software, Inc. | | | 16,631,505 | |
| | 499,519 | | | ForeScout Technologies, Inc. | | | 20,750,019 | |
| | 52,774 | | | Proofpoint, Inc. | | | 6,232,082 | |
| | 365,438 | | | PTC, Inc. | | | 33,919,955 | |
| | 129,407 | | | Splunk, Inc. | | | 17,583,823 | |
| | 105,177 | | | Tableau Software, Inc. Class A | | | 13,872,846 | |
| | 103,184 | | | The Ultimate Software Group, Inc. | | | 34,205,496 | |
| | 247,923 | | | Zendesk, Inc. | | | 19,590,876 | |
| | | | | | | | |
| | | | | | | 201,161,392 | |
| | |
| Specialty Retail* – 2.0% | |
| | 115,135 | | | Burlington Stores, Inc. | | | 19,543,015 | |
| | 177,329 | | | Five Below, Inc. | | | 21,341,545 | |
| | | | | | | | |
| | | | | | | 40,884,560 | |
| | |
| Textiles, Apparel & Luxury Goods – 0.9% | |
| | 80,459 | | | Canada Goose Holdings, Inc.* | | | 4,578,922 | |
| | 132,310 | | | Carter’s, Inc. | | | 12,892,286 | |
| | | | | | | | |
| | | | | | | 17,471,208 | |
| | |
| Trading Companies & Distributors* – 0.5% | |
| | 185,015 | | | SiteOne Landscape Supply, Inc. | | | 9,937,156 | |
| | |
| | TOTAL COMMON STOCKS | |
| | (Cost $1,629,237,066) | | $ | 1,984,770,567 | |
| | |
| | |
| 68 | | The accompanying notes are an integral part of these financial statements. |
GOLDMAN SACHS SMALL/MID CAP GROWTH FUND
| | | | | | | | |
| Shares | | | Dividend
Rate | | Value | |
|
| Investment Company(b) – 3.1% | |
| Goldman Sachs Financial Square Government Fund –
Institutional Shares |
|
| | 64,720,804 | | | 2.395% | | $ | 64,720,804 | |
| | (Cost $64,720,804) | | | | |
| | |
| TOTAL INVESTMENTS BEFORE SECURITIES LENDING
REINVESTMENT VEHICLE |
|
| | (Cost $1,693,957,870) | | $ | 2,049,491,371 | |
| | |
| | | | | | | | |
|
| Securities Lending Reinvestment Vehicle(b) – 1.9% | |
| Goldman Sachs Financial Square Government Fund –
Institutional Shares |
|
| | 38,657,890 | | | 2.395% | | $ | 38,657,890 | |
| | (Cost $38,657,890) | | | | |
| | |
| | TOTAL INVESTMENTS – 100.8% | |
| | (Cost $1,732,615,760) | | $ | 2,088,149,261 | |
| | |
| LIABILITIES IN EXCESS OF
OTHER ASSETS – (0.8)% | | | (16,050,362 | ) |
| | |
| | NET ASSETS – 100.0% | | $ | 2,072,098,899 | |
| | |
| | |
|
| The percentage shown for each investment category reflects the value of investments in that category as a percentage of net assets. |
| |
* | | Non-income producing security. |
| |
(a) | | All or a portion of security is on loan. |
| |
(b) | | Represents an affiliated fund. |
| | |
|
Investment Abbreviations: |
ADR | | —American Depositary Receipt |
PLC | | —Public Limited Company |
|
| | |
| The accompanying notes are an integral part of these financial statements. | | 69 |
GOLDMAN SACHS STRATEGIC GROWTH FUND
Schedule of Investments
February 28, 2019 (Unaudited)
| | | | | | | | |
Shares | | | Description | | Value | |
|
| Common Stocks – 98.2% | |
| Aerospace & Defense – 3.8% | |
| | 7,984 | | | Northrop Grumman Corp. | | $ | 2,315,041 | |
| | 9,202 | | | The Boeing Co. | | | 4,048,512 | |
| | | | | | | | |
| | | | | | | 6,363,553 | |
| | |
| Auto Components – 1.0% | |
| | 19,160 | | | Aptiv PLC | | | 1,592,388 | |
| | |
| Banks – 1.1% | |
| | 17,709 | | | First Republic Bank | | | 1,859,091 | |
| | |
| Beverages – 2.4% | |
| | 17,233 | | | Brown-Forman Corp. Class B | | | 852,861 | |
| | 33,220 | | | Monster Beverage Corp.* | | | 2,120,433 | |
| | 23,333 | | | TheCoca-Cola Co. | | | 1,057,918 | |
| | | | | | | | |
| | | | | | | 4,031,212 | |
| | |
| Biotechnology – 3.5% | |
| | 5,057 | | | AbbVie, Inc. | | | 400,717 | |
| | 11,859 | | | Alexion Pharmaceuticals, Inc.* | | | 1,604,878 | |
| | 12,252 | | | BioMarin Pharmaceutical, Inc.* | | | 1,142,622 | |
| | 13,056 | | | Incyte Corp.* | | | 1,125,819 | |
| | 8,248 | | | Vertex Pharmaceuticals, Inc.* | | | 1,556,810 | |
| | | | | | | | |
| | | | | | | 5,830,846 | |
| | |
| Capital Markets – 2.1% | |
| | 8,949 | | | Cboe Global Markets, Inc. | | | 858,299 | |
| | 14,570 | | | Intercontinental Exchange, Inc. | | | 1,124,075 | |
| | 15,428 | | | Northern Trust Corp. | | | 1,437,890 | |
| | | | | | | | |
| | | | | | | 3,420,264 | |
| | |
| Chemicals – 2.1% | |
| | 12,602 | | | DowDuPont, Inc. | | | 670,804 | |
| | 10,959 | | | Ecolab, Inc. | | | 1,851,085 | |
| | 2,070 | | | The Sherwin-Williams Co. | | | 896,724 | |
| | | | | | | | |
| | | | | | | 3,418,613 | |
| | |
| Communications Equipment – 0.9% | |
| | 29,975 | | | Cisco Systems, Inc. | | | 1,551,806 | |
| | |
| Construction Materials – 0.4% | |
| | 3,213 | | | Martin Marietta Materials, Inc. | | | 603,401 | |
| | |
| Electrical Equipment* – 0.6% | |
| | 19,964 | | | Sensata Technologies Holding PLC | | | 1,012,774 | |
| | |
| Electronic Equipment, Instruments & Components – 1.1% | |
| | 18,574 | | | Amphenol Corp. Class A | | | 1,745,399 | |
| | |
| Entertainment* – 2.5% | |
| | 16,382 | | | Electronic Arts, Inc. | | | 1,569,068 | |
| | 7,155 | | | Netflix, Inc. | | | 2,562,205 | |
| | | | | | | | |
| | | | | | | 4,131,273 | |
| | |
| Equity Real Estate Investment Trusts (REITs) – 1.9% | |
| | 11,165 | | | American Tower Corp. | | | 1,966,715 | |
| | 2,913 | | | Equinix, Inc. | | | 1,233,655 | |
| | | | | | | | |
| | | | | | | 3,200,370 | |
| | |
| Food & Staples Retailing – 0.9% | |
| | 15,064 | | | Walmart, Inc. | | | 1,491,185 | |
| | |
| Food Products – 1.2% | |
| | 6,155 | | | McCormick & Co., Inc. | | | 836,957 | |
| | 25,312 | | | Mondelez International, Inc. Class A | | | 1,193,714 | |
| | | | | | | | |
| | | | | | | 2,030,671 | |
| | |
| Health Care Equipment & Supplies – 4.8% | |
| | 5,224 | | | Align Technology, Inc.* | | | 1,352,859 | |
| | 54,570 | | | Boston Scientific Corp.* | | | 2,189,348 | |
| | 16,038 | | | Danaher Corp. | | | 2,037,147 | |
| | 3,119 | | | Intuitive Surgical, Inc.* | | | 1,707,996 | |
| | 7,179 | | | West Pharmaceutical Services, Inc. | | | 752,000 | |
| | | | | | | | |
| | | | | | | 8,039,350 | |
| | |
| Health Care Providers & Services – 2.1% | |
| | 6,679 | | | Humana, Inc. | | | 1,903,782 | |
| | 6,430 | | | UnitedHealth Group, Inc. | | | 1,557,475 | |
| | | | | | | | |
| | | | | | | 3,461,257 | |
| | |
| Hotels, Restaurants & Leisure – 2.4% | |
| | 1,379 | | | Chipotle Mexican Grill, Inc.* | | | 837,784 | |
| | 17,408 | | | Dunkin’ Brands Group, Inc. | | | 1,243,801 | |
| | 10,063 | | | McDonald’s Corp. | | | 1,849,982 | |
| | | | | | | | |
| | | | | | | 3,931,567 | |
| | |
| Household Products – 0.6% | |
| | 15,730 | | | Colgate-Palmolive Co. | | | 1,036,135 | |
| | |
| Industrial Conglomerates – 1.6% | |
| | 16,709 | | | Honeywell International, Inc. | | | 2,574,356 | |
| | |
| Insurance* – 0.3% | |
| | 433 | | | Markel Corp. | | | 435,113 | |
| | |
| Interactive Media & Services* – 9.2% | |
| | 4,559 | | | Alphabet, Inc. Class A | | | 5,135,942 | |
| | 3,449 | | | Alphabet, Inc. Class C | | | 3,862,604 | |
| | 38,565 | | | Facebook, Inc. Class A | | | 6,226,319 | |
| | | | | | | | |
| | | | | | | 15,224,865 | |
| | |
| Internet & Direct Marketing Retail* – 5.2% | |
| | 5,057 | | | Alibaba Group Holding Ltd. ADR | | | 925,583 | |
| | 4,650 | | | Amazon.com, Inc. | | | 7,625,209 | |
| | | | | | | | |
| | | | | | | 8,550,792 | |
| | |
| IT Services – 6.6% | |
| | 15,723 | | | Accenture PLC Class A | | | 2,537,378 | |
| | 15,551 | | | Mastercard, Inc. Class A | | | 3,495,398 | |
| | 32,846 | | | Visa, Inc. Class A | | | 4,865,149 | |
| | | | | | | | |
| | | | | | | 10,897,925 | |
| | |
| Life Sciences Tools & Services – 2.3% | |
| | 21,623 | | | Agilent Technologies, Inc. | | | 1,717,731 | |
| | 6,532 | | | Illumina, Inc.* | | | 2,043,014 | |
| | | | | | | | |
| | | | | | | 3,760,745 | |
| | |
| | |
| 70 | | The accompanying notes are an integral part of these financial statements. |
GOLDMAN SACHS STRATEGIC GROWTH FUND
| | | | | | | | |
Shares | | | Description | | Value | |
|
| Common Stocks – (continued) | |
| Machinery – 2.2% | |
| | 9,952 | | | Deere & Co. | | $ | 1,632,526 | |
| | 15,174 | | | Fortive Corp. | | | 1,237,743 | |
| | 6,069 | | | Stanley Black & Decker, Inc. | | | 803,718 | |
| | | | | | | | |
| | | | | | | 3,673,987 | |
| | |
| Media – 1.0% | |
| | 44,206 | | | Comcast Corp. Class A | | | 1,709,446 | |
| | |
| Oil, Gas & Consumable Fuels – 2.0% | |
| | 8,866 | | | Cheniere Energy, Inc.* | | | 571,414 | |
| | 7,739 | | | Diamondback Energy, Inc. | | | 796,575 | |
| | 7,432 | | | EOG Resources, Inc. | | | 698,608 | |
| | 19,204 | | | Marathon Petroleum Corp. | | | 1,190,840 | |
| | | | | | | | |
| | | | | | | 3,257,437 | |
| | |
| Pharmaceuticals – 3.3% | |
| | 21,865 | | | AstraZeneca PLC ADR | | | 909,147 | |
| | 16,265 | | | Elanco Animal Health, Inc.*(a) | | | 491,853 | |
| | 20,865 | | | Eli Lilly & Co. | | | 2,635,041 | |
| | 14,787 | | | Zoetis, Inc. | | | 1,393,379 | |
| | | | | | | | |
| | | | | | | 5,429,420 | |
| | |
| Road & Rail – 2.7% | |
| | 29,019 | | | CSX Corp. | | | 2,108,811 | |
| | 13,893 | | | Union Pacific Corp. | | | 2,329,856 | |
| | | | | | | | |
| | | | | | | 4,438,667 | |
| | |
| Semiconductors & Semiconductor Equipment – 4.2% | |
| | 7,720 | | | Analog Devices, Inc. | | | 825,731 | |
| | 58,674 | | | Marvell Technology Group Ltd. | | | 1,170,546 | |
| | 9,092 | | | NVIDIA Corp. | | | 1,402,532 | |
| | 15,412 | | | NXP Semiconductors NV | | | 1,407,424 | |
| | 20,629 | | | Texas Instruments, Inc. | | | 2,182,136 | |
| | | | | | | | |
| | | | | | | 6,988,369 | |
| | |
| Software – 11.5% | |
| | 9,898 | | | Adobe, Inc.* | | | 2,598,225 | |
| | 6,983 | | | Autodesk, Inc.* | | | 1,138,299 | |
| | 9,945 | | | Intuit, Inc. | | | 2,457,708 | |
| | 86,242 | | | Microsoft Corp. | | | 9,661,691 | |
| | 19,964 | | | salesforce.com, Inc.* | | | 3,267,108 | |
| | | | | | | | |
| | | | | | | 19,123,031 | |
| | |
| Specialty Retail – 2.1% | |
| | 24,216 | | | Ross Stores, Inc. | | | 2,296,403 | |
| | 6,485 | | | The Home Depot, Inc. | | | 1,200,633 | |
| | | | | | | | |
| | | | | | | 3,497,036 | |
| | |
| Technology Hardware, Storage & Peripherals – 5.6% | |
| | 53,844 | | | Apple, Inc. | | | 9,323,089 | |
| | |
| Textiles, Apparel & Luxury Goods – 2.5% | |
| | 34,650 | | | NIKE, Inc. Class B | | | 2,970,545 | |
| | 10,372 | | | PVH Corp. | | | 1,191,120 | |
| | | | | | | | |
| | | | | | | 4,161,665 | |
| | |
| Tobacco – 0.5% | |
| | 10,225 | | | Philip Morris International, Inc. | | | 888,961 | |
| | |
| | TOTAL COMMON STOCKS | |
| | (Cost $94,210,268) | | $ | 162,686,059 | |
| | |
| | | | | | | | |
| Shares | | | Dividend
Rate | | Value | |
|
| Investment Company(b) – 0.8% | |
| Goldman Sachs Financial Square Government Fund –
Institutional Shares |
|
| | 1,262,216 | | | 2.395% | | $ | 1,262,216 | |
| | (Cost $1,262,216) | | | | |
| | |
| TOTAL INVESTMENTS BEFORE SECURITIES LENDING
REINVESTMENT VEHICLE |
|
| | (Cost $95,472,484) | | $ | 163,948,275 | |
| | |
| | | | | | | | |
|
| Securities Lending Reinvestment Vehicle(b) – 0.3% | |
| Goldman Sachs Financial Square Government Fund –
Institutional Shares |
|
| | 491,111 | | | 2.395% | | $ | 491,111 | |
| | (Cost $491,111) | | | | |
| | |
| | TOTAL INVESTMENTS – 99.3% | |
| | (Cost $95,963,595) | | $ | 164,439,386 | |
| | |
| OTHER ASSETS IN EXCESS OF
LIABILITIES – 0.7% | | | 1,231,493 | |
| | |
| | NET ASSETS – 100.0% | | $ | 165,670,879 | |
| | |
| | |
|
| The percentage shown for each investment category reflects the value of investments in that category as a percentage of net assets. |
| |
* | | Non-income producing security. |
| |
(a) | | All or a portion of security is on loan. |
| |
(b) | | Represents an affiliated fund. |
| | |
|
Investment Abbreviations: |
ADR | | —American Depositary Receipt |
PLC | | —Public Limited Company |
|
| | |
| The accompanying notes are an integral part of these financial statements. | | 71 |
GOLDMAN SACHS TECHNOLOGY OPPORTUNITIES FUND
Schedule of Investments
February 28, 2019 (Unaudited)
| | | | | | | | |
Shares | | | Description | | Value | |
|
| Common Stocks – 99.7% | |
| Communications Equipment – 3.2% | |
| | 285,752 | | | Cisco Systems, Inc. | | $ | 14,793,381 | |
| | |
| Electronic Equipment, Instruments & Components – 3.3% | |
| | 160,162 | | | Amphenol Corp. Class A | | | 15,050,423 | |
| | |
| Entertainment – 2.5% | |
| | 107,728 | | | Activision Blizzard, Inc. | | | 4,539,658 | |
| | 19,451 | | | Netflix, Inc.* | | | 6,965,403 | |
| | | | | | | | |
| | | | | | | 11,505,061 | |
| | |
| Equity Real Estate Investment Trusts (REITs) – 4.6% | |
| | 76,056 | | | American Tower Corp. | | | 13,397,264 | |
| | 18,703 | | | Equinix, Inc. | | | 7,920,721 | |
| | | | | | | | |
| | | | | | | 21,317,985 | |
| | |
| Interactive Media & Services* – 12.4% | |
| | 16,679 | | | Alphabet, Inc. Class A | | | 18,789,727 | |
| | 18,014 | | | Alphabet, Inc. Class C | | | 20,174,239 | |
| | 111,811 | | | Facebook, Inc. Class A | | | 18,051,886 | |
| | | | | | | | |
| | | | | | | 57,015,852 | |
| | |
| Internet & Direct Marketing Retail – 10.8% | |
| | 33,975 | | | Alibaba Group Holding Ltd. ADR* | | | 6,218,444 | |
| | 23,775 | | | Amazon.com, Inc.* | | | 38,986,958 | |
| | 34,612 | | | Expedia Group, Inc. | | | 4,268,006 | |
| | | | | | | | |
| | | | | | | 49,473,408 | |
| | |
| IT Services – 13.2% | |
| | 58,687 | | | Accenture PLC Class A | | | 9,470,908 | |
| | 136,344 | | | Black Knight, Inc.* | | | 7,123,974 | |
| | 70,700 | | | Fidelity National Information Services, Inc. | | | 7,646,205 | |
| | 129,527 | | | GoDaddy, Inc. Class A* | | | 9,669,191 | |
| | 107,672 | | | Total System Services, Inc. | | | 10,164,237 | |
| | 113,427 | | | Visa, Inc. Class A | | | 16,800,807 | |
| | | | | | | | |
| | | | | | | 60,875,322 | |
| | |
| Life Sciences Tools & Services* – 1.0% | |
| | 15,082 | | | Illumina, Inc. | | | 4,717,197 | |
| | |
| Semiconductors & Semiconductor Equipment – 14.7% | |
| | 162,864 | | | Advanced Micro Devices, Inc.* | | | 3,832,190 | |
| | 64,429 | | | Analog Devices, Inc. | | | 6,891,326 | |
| | 97,751 | | | Applied Materials, Inc. | | | 3,747,773 | |
| | 820,207 | | | Marvell Technology Group Ltd. | | | 16,363,130 | |
| | 49,984 | | | NVIDIA Corp. | | | 7,710,532 | |
| | 70,903 | | | NXP Semiconductors NV | | | 6,474,862 | |
| | 212,081 | | | Taiwan Semiconductor Manufacturing Co. Ltd. ADR | | | 8,281,763 | |
| | 137,238 | | | Texas Instruments, Inc. | | | 14,517,035 | |
| | | | | | | | |
| | | | | | | 67,818,611 | |
| | |
| Software – 29.1% | |
| | 61,600 | | | Adobe, Inc.* | | | 16,170,000 | |
| | 67,192 | | | Atlassian Corp. PLC Class A* | | | 7,221,796 | |
| | 44,927 | | | Autodesk, Inc.* | | | 7,323,550 | |
| | 80,706 | | | Citrix Systems, Inc. | | | 8,514,483 | |
| | |
| | 42,502 | | | Intuit, Inc. | | | 10,503,519 | |
| | 299,214 | | | Microsoft Corp. | | | 33,520,945 | |
| | 78,890 | | | PTC, Inc.* | | | 7,322,570 | |
| | 26,328 | | | Red Hat, Inc.* | | | 4,807,493 | |
| | 88,032 | | | Salesforce.com, Inc.* | | | 14,406,437 | |
| | 67,907 | | | ServiceNow, Inc.* | | | 16,259,652 | |
| | 59,176 | | | Splunk, Inc.* | | | 8,040,835 | |
| | | | | | | | |
| | | | | | | 134,091,280 | |
| | |
| Technology Hardware, Storage & Peripherals – 4.9% | |
| | 130,113 | | | Apple, Inc. | | | 22,529,066 | |
| | |
| | TOTAL COMMON STOCKS | |
| | (Cost $249,477,101) | | $ | 459,187,586 | |
| | |
| | TOTAL INVESTMENTS – 99.7% | |
| | (Cost $249,477,101) | | $ | 459,187,586 | |
| | |
| OTHER ASSETS IN EXCESS OF
LIABILITIES – 0.3% | | | 1,371,531 | |
| | |
| | NET ASSETS – 100.0% | | $ | 460,559,117 | |
| | |
| | |
|
| The percentage shown for each investment category reflects the value of investments in that category as a percentage of net assets. |
| |
* | | Non-income producing security. |
| | |
|
Investment Abbreviations: |
ADR | | —American Depositary Receipt |
PLC | | —Public Limited Company |
|
| | |
| 72 | | The accompanying notes are an integral part of these financial statements. |
GOLDMAN SACHS FUNDAMENTAL EQUITY GROWTH FUNDS
Statements of Assets and Liabilities
February 28, 2019 (Unaudited)
| | | | | | | | | | | | | | |
| | | | | Blue Chip
Fund | | | Capital Growth
Fund | | | Concentrated
Growth Fund | |
| | Assets: | | | | | | | | | | | | |
| | Investments of unaffiliated issuers, at value (cost $8,872,573, $676,718,647 and $93,787,114)(a) | | $ | 10,069,642 | | | $ | 863,468,976 | | | $ | 139,430,905 | |
| | Investments of affiliated issuers, at value (cost $136,636, $1,113,767 and $0) | | | 136,636 | | | | 1,113,767 | | | | — | |
| | Investments in securities lending reinvestment vehicle — affiliated issuer, at value which equals cost | | | — | | | | 1,239,743 | | | | — | |
| | Cash | | | 160,944 | | | | 8,854,269 | | | | 1,953,396 | |
| | Receivables: | | | | | | | | | | | | |
| | Fund shares sold | | | 163,639 | | | | 201,402 | | | | 2,981 | |
| | Reimbursement from investment adviser | | | 25,590 | | | | 39,212 | | | | 31,776 | |
| | Dividends | | | 24,598 | | | | 1,346,224 | | | | 148,907 | |
| | Investments sold | | | — | | | | 10,247,768 | | | | — | |
| | Securities lending income | | | — | | | | 6,468 | | | | — | |
| | Other assets | | | 55,111 | | | | 89,868 | | | | 81,772 | |
| | Total assets | | | 10,636,160 | | | | 886,607,697 | | | | 141,649,737 | |
| | | | | | | | | | | | | | |
| | Liabilities: | | | | | | | | | | | | |
| | Payables: | | | | | | | | | | | | |
| | Management fees | | | 4,282 | | | | 471,627 | | | | 80,530 | |
| | Distribution and Service fees and Transfer Agency fees | | | 2,219 | | | | 253,335 | | | | 5,811 | |
| | Investments purchased | | | 357 | | | | 5,816,015 | | | | — | |
| | Payable upon return of securities loaned | | | — | | | | 1,239,743 | | | | — | |
| | Fund shares redeemed | | | — | | | | 641,359 | | | | 15,369 | |
| | Accrued expenses | | | 96,737 | | | | 206,511 | | | | 186,793 | |
| | Total liabilities | | | 103,595 | | | | 8,628,590 | | | | 288,503 | |
| | | | | | | | | | | | | | |
| | Net Assets: | | | | | | | | | | | | |
| | Paid-in capital | | | 9,122,857 | | | | 695,643,252 | | | | 91,769,383 | |
| | Total distributable earnings | | | 1,409,708 | | | | 182,335,855 | | | | 49,591,851 | |
| | | NET ASSETS | | $ | 10,532,565 | | | $ | 877,979,107 | | | $ | 141,361,234 | |
| | | Net Assets: | | | | | | | | | | | | |
| | | Class A | | $ | 2,969,450 | | | $ | 697,640,763 | | | $ | 5,963,761 | |
| | | Class C | | | 1,346,143 | | | | 19,574,845 | | | | 1,023,143 | |
| | | Institutional | | | 828,671 | | | | 58,488,774 | | | | 12,167,710 | |
| | | Service | | | — | | | | 1,694,435 | | | | — | |
| | | Investor | | | 245,663 | | | | 7,965,755 | | | | 224,018 | |
| | | Class P | | | 1,984,894 | | | | 80,498,016 | | | | 121,452,001 | |
| | | Class R | | | 18,604 | | | | 8,171,355 | | | | 33,107 | |
| | | Class R6 | | | 3,139,140 | | | | 3,945,164 | | | | 497,494 | |
| | | Total Net Assets | | $ | 10,532,565 | | | $ | 877,979,107 | | | $ | 141,361,234 | |
| | | Shares Outstanding $0.001 par value (unlimited number of shares authorized): | | | | | | | | | | | | |
| | | Class A | | | 234,516 | | | | 32,644,397 | | | | 366,935 | |
| | | Class C | | | 111,544 | | | | 1,489,387 | | | | 79,341 | |
| | | Institutional | | | 64,932 | | | | 2,383,030 | | | | 695,479 | |
| | | Service | | | — | | | | 83,610 | | | | — | |
| | | Investor | | | 19,242 | | | | 365,259 | | | | 13,530 | |
| | | Class P | | | 155,518 | | | | 3,285,323 | | | | 6,960,243 | |
| | | Class R | | | 1,460 | | | | 404,918 | | | | 2,121 | |
| | | Class R6 | | | 245,896 | | | | 160,958 | | | | 28,502 | |
| | | Net asset value, offering and redemption price per share:(b) | | | | | | | | | | | | |
| | | Class A | | | $12.66 | | | | $21.37 | | | | $16.25 | |
| | | Class C | | | 12.07 | | | | 13.14 | | | | 12.90 | |
| | | Institutional | | | 12.76 | | | | 24.54 | | | | 17.50 | |
| | | Service | | | — | | | | 20.27 | | | | — | |
| | | Investor | | | 12.77 | | | | 21.81 | | | | 16.56 | |
| | | Class P | | | 12.76 | | | | 24.50 | | | | 17.45 | |
| | | Class R | | | 12.75 | | | | 20.18 | | | | 15.61 | |
| | | Class R6 | | | 12.77 | | | | 24.51 | | | | 17.45 | |
| | (a) | | Includes loaned securities having a market value of $1,211,684 for the Capital Growth Fund. |
| | (b) | | Maximum public offering price per share for Class A Shares of the Blue Chip, Capital Growth and Concentrated Growth Funds is $13.40, $22.61 and $17.20, respectively. At redemption, Class C Shares may be subject to a contingent deferred sales charge, assessed on the amount equal to the lesser of the current net asset value (“NAV”) or the original purchase price of the shares. |
| | |
| The accompanying notes are an integral part of these financial statements. | | 73 |
GOLDMAN SACHS FUNDAMENTAL EQUITY GROWTH FUNDS
Statements of Assets and Liabilities(continued)
February 28, 2019 (Unaudited)
| | | | | | | | | | | | | | |
| | | | | Flexible Cap
Fund | | | Growth
Opportunities
Fund | | | Small/Mid Cap
Growth Fund | |
| | Assets: | | | | | | | | | | | | |
| | Investments, at value (cost $14,382,524, $1,190,724,093 and $1,629,237,066)(a) | | $ | 17,922,332 | | | $ | 1,510,040,655 | | | $ | 1,984,770,567 | |
| | Investments of affiliated issuers, at value (cost $0, $16,991,395 and $64,720,804) | | | — | | | | 16,991,395 | | | | 64,720,804 | |
| | Investments in securities lending reinvestment vehicle — affiliated issuer, at value which equals cost | | | — | | | | 15,382,880 | | | | 38,657,890 | |
| | Cash | | | 79,552 | | | | 23,091,330 | | | | 31,219,232 | |
| | Receivables: | | | | | | | | | | | | |
| | Investments sold | | | — | | | | — | | | | 2,366,312 | |
| | Dividends | | | 31,233 | | | | 828,345 | | | | 1,489,944 | |
| | Fund shares sold | | | — | | | | 444,051 | | | | 2,953,397 | |
| | Reimbursement from investment adviser | | | 23,661 | | | | 43,385 | | | | — | |
| | Securities lending income | | | — | | | | 75,651 | | | | 109,112 | |
| | Other assets | | | 77,226 | | | | 95,992 | | | | 120,282 | |
| | Total assets | | | 18,134,004 | | | | 1,566,993,684 | | | | 2,126,407,540 | |
| | | | | | | | | | | | | | |
| | Liabilities: | | | | | | | | | | | | |
| | Payables: | | | | | | | | | | | | |
| | Payable upon return of securities loaned | | | — | | | | 15,382,880 | | | | 38,657,890 | |
| | Investments purchased | | | — | | | | 13,375,452 | | | | 6,921,941 | |
| | Fund shares redeemed | | | 6,286 | | | | 3,044,515 | | | | 6,970,896 | |
| | Management fees | | | 7,515 | | | | 997,491 | | | | 1,303,867 | |
| | Distribution and Service fees and Transfer Agency fees | | | 3,107 | | | | 198,983 | | | | 308,272 | |
| | Accrued expenses | | | 98,007 | | | | 192,740 | | | | 145,775 | |
| | Total liabilities | | | 114,915 | | | | 33,192,061 | | | | 54,308,641 | |
| | | | | | | | | | | | | | |
| | Net Assets: | | | | | | | | | | | | |
| | Paid-in capital | | | 14,217,191 | | | | 1,084,566,997 | | | | 1,620,478,967 | |
| | Total distributable earnings | | | 3,801,898 | | | | 449,234,626 | | | | 451,619,932 | |
| | | NET ASSETS | | $ | 18,019,089 | | | $ | 1,533,801,623 | | | $ | 2,072,098,899 | |
| | | Net Assets: | | | | | | | | | | | | |
| | | Class A | | $ | 5,418,746 | | | $ | 337,662,476 | | | $ | 293,646,324 | |
| | | Class C | | | 1,201,983 | | | | 49,893,598 | | | | 184,670,043 | |
| | | Institutional | | | 648,118 | | | | 730,236,411 | | | | 858,280,832 | |
| | | Service | | | — | | | | 27,956,821 | | | | 17,622,540 | |
| | | Investor | | | 65,432 | | | | 85,954,441 | | | | 444,754,871 | |
| | | Class P | | | 10,436,175 | | | | 66,429,824 | | | | 202,061,421 | |
| | | Class R | | | 48,787 | | | | 49,243,124 | | | | 18,496,400 | |
| | | Class R6 | | | 199,848 | | | | 186,424,928 | | | | 52,566,468 | |
| | | Total Net Assets | | $ | 18,019,089 | | | $ | 1,533,801,623 | | | $ | 2,072,098,899 | |
| | | Shares Outstanding $0.001 par value (unlimited number of shares authorized): | | | | | | | | | | | | |
| | | Class A | | | 484,519 | | | | 20,330,717 | | | | 15,222,497 | |
| | | Class C | | | 124,898 | | | | 5,345,061 | | | | 11,581,244 | |
| | | Institutional | | | 53,564 | | | | 34,833,293 | | | | 40,905,223 | |
| | | Service | | | — | | | | 1,806,464 | | | | 944,474 | |
| | | Investor | | | 5,527 | | | | 4,829,102 | | | | 22,013,637 | |
| | | Class P | | | 863,833 | | | | 3,165,168 | | | | 9,622,618 | |
| | | Class R | | | 4,562 | | | | 3,174,630 | | | | 1,003,997 | |
| | | Class R6 | | | 16,549 | | | | 8,885,935 | | | | 2,503,647 | |
| | | Net asset value, offering and redemption price per share:(b) | | | | | | | | | | | | |
| | | Class A | | | $11.18 | | | | $16.61 | | | | $19.29 | |
| | | Class C | | | 9.62 | | | | 9.33 | | | | 15.95 | |
| | | Institutional | | | 12.10 | | | | 20.96 | | | | 20.98 | |
| | | Service | | | — | | | | 15.48 | | | | 18.66 | |
| | | Investor | | | 11.84 | | | | 17.80 | | | | 20.20 | |
| | | Class P | | | 12.08 | | | | 20.99 | | | | 21.00 | |
| | | Class R | | | 10.69 | | | | 15.51 | | | | 18.42 | |
| | | Class R6 | | | 12.08 | | | | 20.98 | | | | 21.00 | |
| | (a) | | Includes loaned securities having a market value of $14,977,577 and $37,679,284 for the Growth Opportunities, and Small/Mid Cap Growth Funds, respectively. |
| | (b) | | Maximum public offering price per share for Class A Shares of the Flexible Cap, Growth Opportunities and Small/Mid Cap Growth Funds is $11.83, $17.58 and $20.41, respectively. At redemption, Class C Shares may be subject to a contingent deferred sales charge, assessed on the amount equal to the lesser of the current net asset value (“NAV”) or the original purchase price of the shares. |
| | |
| 74 | | The accompanying notes are an integral part of these financial statements. |
GOLDMAN SACHS FUNDAMENTAL EQUITY GROWTH FUNDS
Statements of Assets and Liabilities(continued)
February 28, 2019 (Unaudited)
| | | | | | | | | | |
| | | | | Strategic Growth
Fund | | | Technology
Opportunities Fund | |
| | Assets: | | | | | | | | |
| | Investments of unaffiliated issuers, at value (cost $94,210,268 and $249,477,101)(a) | | $ | 162,686,059 | | | $ | 459,187,586 | |
| | Investments of affiliated issuers, at value (cost $1,262,216 and $0) | | | 1,262,216 | | | | — | |
| | Investments in securities lending reinvestment vehicle — affiliated issuer, at value which equals cost | | | 491,111 | | | | — | |
| | Cash | | | 2,499,628 | | | | 2,150,305 | |
| | Receivables: | | | | | | | | |
| | Dividends | | | 194,605 | | | | 275,574 | |
| | Fund shares sold | | | 70,073 | | | | 60,219 | |
| | Reimbursement from investment adviser | | | 30,438 | | | | 37,310 | |
| | Securities lending income | | | 2,569 | | | | — | |
| | Other assets | | | 85,089 | | | | 73,668 | |
| | Total assets | | | 167,321,788 | | | | 461,784,662 | |
| | | | | | | | | | |
| | Liabilities: | | | | | | | | |
| | Payables: | | | | | | | | |
| | Payable upon return of securities loaned | | | 491,111 | | | | — | |
| | Investments purchased | | | 1,893 | | | | — | |
| | Fund shares redeemed | | | 949,216 | | | | 669,390 | |
| | Management fees | | | 88,702 | | | | 328,675 | |
| | Distribution and Service fees and Transfer Agency fees | | | 16,847 | | | | 115,419 | |
| | Accrued expenses | | | 103,140 | | | | 112,061 | |
| | Total liabilities | | | 1,650,909 | | | | 1,225,545 | |
| | | | | | | | | | |
| | Net Assets: | | | | | | | | |
| | Paid-in capital | | | 85,042,238 | | | | 236,422,928 | |
| | Total distributable earnings | | | 80,628,641 | | | | 224,136,189 | |
| | | NET ASSETS | | $ | 165,670,879 | | | $ | 460,559,117 | |
| | | Net Assets: | | | | | | | | |
| | | Class A | | $ | 27,067,239 | | | $ | 290,937,945 | |
| | | Class C | | | 4,615,865 | | | | 27,574,744 | |
| | | Institutional | | | 55,502,250 | | | | 73,022,524 | |
| | | Service | | | 583,900 | | | | 29,456,584 | |
| | | Investor | | | 2,846,779 | | | | 18,836,895 | |
| | | Class P | | | 74,348,588 | | | | 20,718,668 | |
| | | Class R | | | 300,039 | | | | — | |
| | | Class R6 | | | 406,219 | | | | 11,757 | |
| | | Total Net Assets | | $ | 165,670,879 | | | $ | 460,559,117 | |
| | | Shares Outstanding $0.001 par value (unlimited number of shares authorized): | | | | | | | | |
| | | Class A | | | 3,136,387 | | | | 13,756,227 | |
| | | Class C | | | 808,915 | | | | 1,676,988 | |
| | | Institutional | | | 5,740,191 | | | | 3,049,189 | |
| | | Service | | | 68,899 | | | | 1,429,558 | |
| | | Investor | | | 295,536 | | | | 801,470 | |
| | | Class P | | | 7,714,439 | | | | 864,866 | |
| | | Class R | | | 36,190 | | | | — | |
| | | Class R6 | | | 42,094 | | | | 491 | |
| | | Net asset value, offering and redemption price per share:(b) | | | | | | | | |
| | | Class A | | | $8.63 | | | | $21.15 | |
| | | Class C | | | 5.71 | | | | 16.44 | |
| | | Institutional | | | 9.67 | | | | 23.95 | |
| | | Service | | | 8.47 | | | | 20.61 | |
| | | Investor | | | 9.63 | | | | 23.50 | |
| | | Class P | | | 9.64 | | | | 23.96 | |
| | | Class R | | | 8.29 | | | | — | |
| | | Class R6 | | | 9.65 | | | | 23.95 | |
| | (a) | | Includes loaned securities having a market value of $478,551 for the Strategic Growth Fund. |
| | (b) | | Maximum public offering price per share for Class A Shares of the Strategic Growth and Technology Opportunities Funds is $9.13 and $22.38. At redemption, Class C Shares may be subject to a contingent deferred sales charge, assessed on the amount equal to the lesser of the current net asset value (“NAV”) or the original purchase price of the shares. |
| | |
| The accompanying notes are an integral part of these financial statements. | | 75 |
GOLDMAN SACHS FUNDAMENTAL EQUITY GROWTH FUNDS
Statements of Operations
For the Six Months Ended February 28, 2019 (Unaudited)
| | | | | | | | | | | | | | |
| | | | | Blue Chip
Fund | | | Capital Growth
Fund | | | Concentrated
Growth Fund | |
| | Investment income: | |
| | | | |
| | Dividends — unaffiliated issuers (net of foreign withholding taxes of $233, $14,151 and $2,284) | | $ | 95,645 | | | $ | 6,866,383 | | | $ | 679,020 | |
| | | | |
| | Dividends — affiliated issuers | | | 1,984 | | | | 40,295 | | | | 1,637 | |
| | | | |
| | Securities lending income — affiliated issuer | | | — | | | | 28,012 | | | | 437 | |
| | | | |
| | Total investment income | | | 97,629 | | | | 6,934,690 | | | | 681,094 | |
| | | | | | | | | | | | | | |
| | Expenses: | |
| | | | |
| | Management fees | | | 26,634 | | | | 3,182,057 | | | | 550,634 | |
| | | | |
| | Distribution and Service fees(a) | | | 6,263 | | | | 1,016,063 | | | | 12,907 | |
| | | | |
| | Transfer Agency fees(a) | | | 4,219 | | | | 692,604 | | | | 27,832 | |
| | | | |
| | Printing and mailing costs | | | 10,995 | | | | 79,369 | | | | 27,004 | |
| | | | |
| | Registration fees | | | 53,536 | | | | 70,163 | | | | 59,933 | |
| | | | |
| | Custody, accounting and administrative services | | | 25,348 | | | | 65,373 | | | | 23,385 | |
| | | | |
| | Professional fees | | | 65,928 | | | | 59,882 | | | | 96,121 | |
| | | | |
| | Trustee fees | | | 7,930 | | | | 8,803 | | | | 8,065 | |
| | | | |
| | Service Share fees — Service Plan | | | — | | | | 2,045 | | | | — | |
| | | | |
| | Service Share fees — Shareholder Administration Plan | | | — | | | | 2,045 | | | | — | |
| | | | |
| | Other | | | 4,015 | | | | 13,623 | | | | 7,507 | |
| | | | |
| | Total expenses | | | 204,868 | | | | 5,192,027 | | | | 813,388 | |
| | | | |
| | Less — expense reductions | | | (164,342 | ) | | | (283,751 | ) | | | (220,338 | ) |
| | | | |
| | Net expenses | | | 40,526 | | | | 4,908,276 | | | | 593,050 | |
| | | | |
| | NET INVESTMENT INCOME | | | 57,103 | | | | 2,026,414 | | | | 88,044 | |
| | | | | | | | | | | | | | |
| | Realized and unrealized gain (loss): | |
| | | | |
| | Net realized gain from: | | | | | | | | | | | | |
| | | | |
| | Investments — unaffiliated issuers (including commission recapture of $0, $315 and $0) | | | 242,054 | | | | 9,915,116 | | | | 5,757,635 | |
| | | | |
| | Net change in unrealized loss on: | | | | | | | | | | | | |
| | | | |
| | Investments — unaffiliated issuers | | | (191,309 | ) | | | (51,939,150 | ) | | | (13,950,481 | ) |
| | | | |
| | Net realized and unrealized gain (loss) | | | 50,745 | | | | (42,024,034 | ) | | | (8,192,846 | ) |
| | | | |
| | NET INCREASE (DECREASE) IN NET ASSETS RESULTING FROM OPERATIONS | | $ | 107,848 | | | $ | (39,997,620 | ) | | $ | (8,104,802 | ) |
| | (a) | | Class specific Distribution and/or Service and Transfer Agency fees were as follows: |
| | | | | | | | | | | | | | | | | | | | | | | | | | | | | | | | | | | | | | | | | | | | |
| | | Distribution and Service Fees | | | Transfer Agency Fees | |
Fund | | Class A | | | Class C | | | Class R | | | Class A | | | Class C | | | Institutional | | | Service | | | Investor | | | Class P | | | Class R | | | Class R6 | |
Blue Chip Fund | | $ | 3,194 | | | $ | 3,022 | | | $ | 47 | | | $ | 2,300 | | | $ | 544 | | | $ | 732 | | | $ | — | | | $ | 239 | | | $ | 286 | | | $ | 17 | | | $ | 101 | |
Capital Growth Fund | | | 873,623 | | | | 122,282 | | | | 20,158 | | | | 629,009 | | | | 22,011 | | | | 12,975 | | | | 327 | | | | 7,483 | | | | 13,381 | | | | 7,257 | | | | 161 | |
Concentrated Growth Fund | | | 7,196 | | | | 5,633 | | | | 78 | | | | 5,181 | | | | 1,014 | | | | 2,621 | | | | — | | | | 307 | | | | 18,653 | | | | 28 | | | | 28 | |
| | |
| 76 | | The accompanying notes are an integral part of these financial statements. |
GOLDMAN SACHS FUNDAMENTAL EQUITY GROWTH FUNDS
Statements of Operations(continued)
For the Six Months Ended February 28, 2019 (Unaudited)
| | | | | | | | | | | | | | |
| | | | | Flexible Cap
Fund | | | Growth
Opportunities
Fund | | | Small/Mid Cap
Growth Fund | |
| | Investment income: | |
| | | | |
| | Dividends — unaffiliated issuers (net of foreign withholding taxes of $68, $0 and $0) | | $ | 164,536 | | | $ | 5,998,138 | | | $ | 6,570,221 | |
| | | | |
| | Dividends — affiliated issuers | | | 9 | | | | 57,201 | | | | 123,185 | |
| | | | |
| | Securities lending income — affiliated issuer | | | 49 | | | | 254,322 | | | | 533,085 | |
| | | | |
| | Total investment income | | | 164,594 | | | | 6,309,661 | | | | 7,226,491 | |
| | | | | | | | | | | | | | |
| | Expenses: | |
| | | | |
| | Management fees | | | 51,797 | | | | 7,898,967 | | | | 8,900,354 | |
| | | | |
| | Distribution and Service fees(a) | | | 12,343 | | | | 837,560 | | | | 1,364,428 | |
| | | | |
| | Transfer Agency fees(a) | | | 7,678 | | | | 704,396 | | | | 1,075,164 | |
| | | | |
| | Printing and mailing costs | | | 11,471 | | | | 95,963 | | | | 137,498 | |
| | | | |
| | Registration fees | | | 59,296 | | | | 84,036 | | | | 96,846 | |
| | | | |
| | Custody, accounting and administrative services | | | 25,473 | | | | 73,997 | | | | 77,522 | |
| | | | |
| | Professional fees | | | 51,484 | | | | 50,456 | | | | 50,457 | |
| | | | |
| | Service Share fees — Service Plan | | | — | | | | 36,040 | | | | 20,588 | |
| | | | |
| | Service Share fees — Shareholder Administration Plan | | | — | | | | 36,040 | | | | 20,588 | |
| | | | |
| | Trustee fees | | | 7,940 | | | | 9,824 | | | | 10,096 | |
| | | | |
| | Other | | | 4,148 | | | | 29,260 | | | | 34,657 | |
| | | | |
| | Total expenses | | | 231,630 | | | | 9,856,539 | | | | 11,788,198 | |
| | | | |
| | Less — expense reductions | | | (160,073 | ) | | | (539,398 | ) | | | (212,859 | ) |
| | | | |
| | Net expenses | | | 71,557 | | | | 9,317,141 | | | | 11,575,339 | |
| | | | |
| | NET INVESTMENT INCOME (LOSS) | | | 93,037 | | | | (3,007,480 | ) | | | (4,348,848 | ) |
| | | | | | | | | | | | | | |
| | Realized and unrealized gain (loss): | |
| | | | |
| | Net realized gain from: | | | | | | | | | | | | |
| | | | |
| | Investments — unaffiliated issuers (including commission recapture of $0, $0 and $7,142) | | | 452,145 | | | | 206,411,864 | | | | 206,486,596 | |
| | | | |
| | Net change in unrealized loss on: | | | | | | | | | | | | |
| | | | |
| | Investments — unaffiliated issuers | | | (1,382,659 | ) | | | (270,464,484 | ) | | | (298,639,305 | ) |
| | | | |
| | Net realized and unrealized loss | | | (930,514 | ) | | | (64,052,620 | ) | | | (92,152,709 | ) |
| | | | |
| | NET DECREASE IN NET ASSETS RESULTING FROM OPERATIONS | | $ | (837,477 | ) | | $ | (67,060,100 | ) | | $ | (96,501,557 | ) |
| | (a) | | Class specific Distribution and/or Service and Transfer Agency fees were as follows: |
| | | | | | | | | | | | | | | | | | | | | | | | | | | | | | | | | | | | | | | | | | | | |
| | | Distribution and Service Fees | | | Transfer Agency Fees | |
Fund | | Class A | | | Class C | | | Class R | | | Class A | | | Class C | | | Institutional | | | Service | | | Investor | | | Class P | | | Class R | | | Class R6 | |
Flexible Cap Fund | | $ | 6,383 | | | $ | 5,844 | | | $ | 116 | | | $ | 4,596 | | | $ | 1,052 | | | $ | 257 | | | $ | — | | | $ | 57 | | | $ | 1,666 | | | $ | 42 | | | $ | 8 | |
Growth Opportunities Fund | | | 455,737 | | | | 262,153 | | | | 119,670 | | | | 328,130 | | | | 47,188 | | | | 173,934 | | | | 5,766 | | | | 63,434 | | | | 11,402 | | | | 43,081 | | | | 31,461 | |
Small/Mid Cap Growth Fund | | | 368,729 | | | | 947,161 | | | | 48,538 | | | | 265,485 | | | | 170,489 | | | | 178,720 | | | | 3,294 | | | | 402,248 | | | | 31,257 | | | | 17,474 | | | | 6,197 | |
| | |
| The accompanying notes are an integral part of these financial statements. | | 77 |
GOLDMAN SACHS FUNDAMENTAL EQUITY GROWTH FUNDS
Statements of Operations(continued)
For the Six Months Ended February 28, 2019 (Unaudited)
| | | | | | | | | | |
| | | | | Strategic Growth
Fund | | | Technology
Opportunities
Fund | |
| | Investment income: | |
| | | |
| | Dividends — unaffiliated issuers (net of foreign withholding taxes of $1,234 and $6,645) | | $ | 936,840 | | | $ | 1,745,414 | |
| | | |
| | Dividends — affiliated issuers | | | 2,216 | | | | 19,100 | |
| | | |
| | Securities lending income — affiliated issuer | | | 11,647 | | | | 2 | |
| | | |
| | Total investment income | | | 950,703 | | | | 1,764,516 | |
| | | | | | | | | | |
| | Expenses: | |
| | | |
| | Management fees | | | 651,542 | | | | 2,197,124 | |
| | | |
| | Registration fees | | | 70,455 | | | | 51,659 | |
| | | |
| | Distribution and Service fees(a) | | | 62,055 | | | | 514,956 | |
| | | |
| | Professional fees | | | 58,703 | | | | 59,927 | |
| | | |
| | Transfer Agency fees(a) | | | 58,294 | | | | 331,212 | |
| | | |
| | Custody, accounting and administrative services | | | 29,312 | | | | 38,081 | |
| | | |
| | Printing and mailing costs | | | 22,345 | | | | 59,120 | |
| | | |
| | Trustee fees | | | 8,112 | | | | 8,385 | |
| | | |
| | Service Share fees — Service Plan | | | 671 | | | | 36,978 | |
| | | |
| | Service Share fees — Shareholder Administration Plan | | | 671 | | | | 36,978 | |
| | | |
| | Other | | | 6,060 | | | | 9,055 | |
| | | |
| | Total expenses | | | 968,220 | | | | 3,343,475 | |
| | | |
| | Less — expense reductions | | | (191,501 | ) | | | (241,067 | ) |
| | | |
| | Net expenses | | | 776,719 | | | | 3,102,408 | |
| | | |
| | NET INVESTMENT INCOME (LOSS) | | | 173,984 | | | | (1,337,892 | ) |
| | | | | | | | | | |
| | Realized and unrealized gain (loss): | |
| | | |
| | Net realized gain from: | | | | | | | | |
| | | |
| | Investments — unaffiliated issuers (including commission recapture of $411 and $1,971) | | | 15,884,292 | | | | 21,152,782 | |
| | | |
| | Net change in unrealized loss on: | | | | | | | | |
| | | |
| | Investments — unaffiliated issuers | | | (29,145,120 | ) | | | (47,424,258 | ) |
| | | |
| | Net realized and unrealized loss | | | (13,260,828 | ) | | | (26,271,476 | ) |
| | | |
| | NET DECREASE IN NET ASSETS RESULTING FROM OPERATIONS | | $ | (13,086,844 | ) | | $ | (27,609,368 | ) |
| | (a) | | Class specific Distribution and/or Service and Transfer Agency fees were as follows: |
| | | | | | | | | | | | | | | | | | | | | | | | | | | | | | | | | | | | | | | | | | | | |
| | | Distribution and Service Fees | | | Transfer Agency Fees | |
Fund | | Class A | | | Class C | | | Class R | | | Class A | | | Class C | | | Institutional | | | Service | | | Investor | | | Class P | | | Class R | | | Class R6 | |
Strategic Growth Fund | | $ | 35,433 | | | $ | 25,954 | | | $ | 668 | | | $ | 25,512 | | | $ | 4,672 | | | $ | 12,233 | | | $ | 108 | | | $ | 2,791 | | | $ | 12,722 | | | $ | 240 | | | $ | 16 | |
Technology Opportunities Fund | | | 364,332 | | | | 150,624 | | | | — | | | | 262,319 | | | | 27,113 | | | | 14,798 | | | | 5,916 | | | | 17,663 | | | | 3,401 | | | | — | | | | 2 | |
| | |
| 78 | | The accompanying notes are an integral part of these financial statements. |
GOLDMAN SACHS FUNDAMENTAL EQUITY GROWTH FUNDS
Statements of Changes in Net Assets
| | | | | | | | | | | | | | | | | | | | | | |
| | | | | Blue Chip Fund | | | | | | Capital Growth Fund | |
| | | | | For the
Six Months Ended
February 28, 2019
(Unaudited) | | | For the Fiscal
Year Ended
August 31, 2018 | | | | | | For the
Six Months Ended
February 28, 2019
(Unaudited) | | | For the Fiscal
Year Ended
August 31, 2018 | |
| From operations: | | | | | | | | | | | | | | | | | |
| | | | | | |
| | Net investment income | | $ | 57,103 | | | $ | 78,007 | | | | | | | $ | 2,026,414 | | | $ | 727,493 | |
| | | | | | |
| | Net realized gain | | | 242,054 | | | | 745,297 | | | | | | | | 9,915,116 | | | | 283,002,758 | |
| | | | | | |
| | Net change in unrealized gain (loss) | | | (191,309 | ) | | | 324,442 | | | | | | | | (51,939,150 | ) | | | (91,364,384 | ) |
| | | | | | |
| | Net increase (decrease) in net assets resulting from operations | | | 107,848 | | | | 1,147,746 | | | | | | | | (39,997,620 | ) | | | 192,365,867 | |
| | | | | | | | | | | | | | | | | | | | | | |
| | Distributions to shareholders: | | | | | | | | | | | | | |
| | | | | | |
| | From distributable earnings: | | | | | | | | | | | | | | | | | | | | |
| | | | | | |
| | Class A Shares | | | (213,475 | ) | | | (399,773 | )(a) | | | | | | | (220,760,416 | ) | | | (56,468,884 | )(a) |
| | | | | | |
| | Class C Shares | | | (26,622 | ) | | | (55,004 | )(a) | | | | | | | (8,782,823 | ) | | | (6,772,737 | )(a) |
| | | | | | |
| | Institutional Shares | | | (279,538 | ) | | | (733,918 | )(a) | | | | | | | (18,835,285 | ) | | | (13,142,477 | )(a) |
| | | | | | |
| | Service Shares | | | — | | | | — | | | | | | | | (533,521 | ) | | | (125,587 | )(a) |
| | | | | | |
| | Investor Shares | | | (20,921 | ) | | | (40,464 | )(a) | | | | | | | (2,665,392 | ) | | | (787,742 | )(a) |
| | | | | | |
| | Class P Shares(b) | | | (174,322 | ) | | | — | | | | | | | | (26,269,986 | ) | | | — | |
| | | | | | |
| | Class R Shares | | | (1,678 | ) | | | (4,440 | )(a) | | | | | | | (2,616,026 | ) | | | (734,333 | )(a) |
| | | | | | |
| | Class R6 Shares | | | (903 | ) | | | (2,356 | )(a) | | | | | | | (16,308 | ) | | | (1,470 | )(a) |
| | | | | | |
| | Total distributions to shareholders | | | (717,459 | ) | | | (1,235,955 | ) | | | | | | | (280,479,757 | ) | | | (78,033,230 | ) |
| | | | | | | | | | | | | | | | | | | | | | |
| | From share transactions: | | | | | | | | | | | | | |
| | | | | | |
| | Proceeds from sales of shares | | | 6,635,113 | | | | 7,069,385 | | | | | | | | 71,321,750 | | | | 133,283,768 | |
| | | | | | |
| | Reinvestment of distributions | | | 669,296 | | | | 1,036,474 | | | | | | | | 266,002,222 | | | | 74,027,178 | |
| | | | | | |
| | Cost of shares redeemed | | | (6,127,610 | ) | | | (3,829,883 | ) | | | | | | | (151,645,656 | ) | | | (226,927,471 | ) |
| | | | | | |
| | Net increase (decrease) in net assets resulting from share transactions | | | 1,176,799 | | | | 4,275,976 | | | | | | | | 185,678,316 | | | | (19,616,525 | ) |
| | | | | | |
| | TOTAL INCREASE (DECREASE) | | | 567,188 | | | | 4,187,767 | | | | | | | | (134,799,061 | ) | | | 94,716,112 | |
| | | | | | | | | | | | | | | | | | | | | | |
| | Net assets:(c) | | | | | | | | | | | | | |
| | | | | | |
| | Beginning of period | | | 9,965,377 | | | | 5,777,610 | | | | | | | | 1,012,778,168 | | | | 918,062,056 | |
| | | | | | |
| | End of period | | $ | 10,532,565 | | | $ | 9,965,377 | | | | | | | $ | 877,979,107 | | | $ | 1,012,778,168 | |
| | (a) | | Prior year information has been revised to conform to current year presentation, see prior year presentation below: |
| | | | | | | | | | | | | | | | | | | | | | | | |
Distributions from net investment income: | | Class A | | | Class C | | | Institutional | | | Investor | | | Class R | | | Class R6 | |
Blue Chip | | $ | (13,883) | | | $ | (674) | | | $ | (35,590) | | | $ | (1,830) | | | $ | (66) | | | $ | (103) | |
Capital Growth | | | (463,240) | | | | — | | | | (645,455) | | | | (31,502) | | | | (10,246) | | | | (80) | |
| | | | | | | | | | | | | | | | | | | | | | | | |
| | | | | | | | | | | | | | | | | | | | | | | | | | | | |
Distributions from net realized gains: | | Class A | | | Class C | | | Institutional | | | Service | | | Investor | | | Class R | | | Class R6 | |
Blue Chip | | $ | (385,890) | | | $ | (54,330) | | | $ | (698,328) | | | $ | — | | | $ | (38,634) | | | $ | (4,374) | | | $ | (2,253) | |
Capital Growth | | | (56,005,644) | | | | (6,772,737) | | | | (12,497,022) | | | | (125,587) | | | | (756,240) | | | | (724,087) | | | | (1,390) | |
| | (b) | | Class P Shares commenced operations on April 17, 2018. |
| | (c) | | Prior year information has been revised to conform with current year presentation. Undistributed net investment income was $65,008 and $714,653 for the Blue Chip and Capital Growth Funds, respectively as of August 31, 2018. |
| | |
| The accompanying notes are an integral part of these financial statements. | | 79 |
GOLDMAN SACHS FUNDAMENTAL EQUITY GROWTH FUNDS
Statements of Changes in Net Assets (continued)
| | | | | | | | | | | | | | | | | | | | | | |
| | | | | Concentrated Growth Fund | | | | | | Flexible Cap Fund | |
| | | | | For the
Six Months Ended
February 28, 2019
(Unaudited) | | | For the Fiscal
Year Ended
August 31, 2018 | | | | | | For the
Six Months Ended
February 28, 2019
(Unaudited) | | | For the Fiscal
Year Ended
August 31, 2018 | |
| | From operations: | | | | | | | | | | | | | | | | | | | | |
| | | | | | |
| | Net investment income | | $ | 88,044 | | | $ | 444,839 | | | | | | | $ | 93,037 | | | $ | 183,360 | |
| | | | | | |
| | Net realized gain | | | 5,757,635 | | | | 22,191,534 | | | | | | | | 452,145 | | | | 4,574,331 | |
| | | | | | |
| | Net change in unrealized gain (loss) | | | (13,950,481 | ) | | | 11,135,644 | | | | | | | | (1,382,659 | ) | | | (1,262,467 | ) |
| | | | | | |
| | Net increase (decrease) in net assets resulting from operations | | | (8,104,802 | ) | | | 33,772,017 | | | | | | | | (837,477 | ) | | | 3,495,224 | |
| | | | | | | | | | | | | | | | | | | | | | |
| | Distributions to shareholders: | | | | | | | | | | | | | |
| | | | | | |
| | From distributable earnings: | | | | | | | | | | | | | | | | | | | | |
| | | | | | |
| | Class A Shares | | | (710,810 | ) | | | (654,075 | )(a) | | | | | | | (420,196 | ) | | | (1,426,826 | )(a) |
| | | | | | |
| | Class C Shares | | | (148,426 | ) | | | (290,281 | )(a) | | | | | | | (104,102 | ) | | | (384,365 | )(a) |
| | | | | | |
| | Institutional Shares | | | (1,532,532 | ) | | | (16,290,367 | )(a) | | | | | | | (114,070 | ) | | | (3,015,595 | )(a) |
| | | | | | |
| | Investor Shares | | | (44,432 | ) | | | (48,581 | )(a) | | | | | | | (5,174 | ) | | | (47,179 | )(a) |
| | | | | | |
| | Class P Shares(b) | | | (14,440,076 | ) | | | — | | | | | | | | (930,190 | ) | | | — | |
| | | | | | |
| | Class R Shares | | | (3,862 | ) | | | (3,177 | )(a) | | | | | | | (3,964 | ) | | | (10,791 | )(a) |
| | | | | | |
| | Class R6 Shares | | | (11,481 | ) | | | (6,572 | )(a) | | | | | | | (1,067 | ) | | | (2,983 | )(a) |
| | | | | | |
| | Total distributions to shareholders | | | (16,891,619 | ) | | | (17,293,053 | ) | | | | | | | (1,578,763 | ) | | | (4,887,739 | ) |
| | | | | | | | | | | | | | | | | | | | | | |
| | From share transactions: | | | | | | | | | | | | | |
| | | | | | |
| | Proceeds from sales of shares | | | 3,292,144 | | | | 142,848,495 | | | | | | | | 1,024,529 | | | | 15,023,654 | |
| | | | | | |
| | Reinvestment of distributions | | | 16,689,324 | | | | 16,915,941 | | | | | | | | 1,575,048 | | | | 4,887,739 | |
| | | | | | |
| | Cost of shares redeemed | | | (20,353,400 | ) | | | (160,682,995 | ) | | | | | | | (3,339,229 | ) | | | (16,024,957 | ) |
| | | | | | |
| | Net increase (decrease) in net assets resulting from share transactions | | | (371,932 | ) | | | (918,559 | ) | | | | | | | (739,652 | ) | | | 3,886,436 | |
| | | | | | |
| | TOTAL INCREASE (DECREASE) | | | (25,368,353 | ) | | | 15,560,405 | | | | | | | | (3,155,892 | ) | | | 2,493,921 | |
| | | | | | | | | | | | | | | | | | | | | | |
| | Net assets:(c) | | | | | | | | | | | | | |
| | | | | | |
| | Beginning of period | | | 166,729,587 | | | | 151,169,182 | | | | | | | | 21,174,981 | | | | 18,681,060 | |
| | | | | | |
| | End of period | | $ | 141,361,234 | | | $ | 166,729,587 | | | | | | | $ | 18,019,089 | | | $ | 21,174,981 | |
| | (a) | | Prior year information has been revised to conform to current year presentation, see prior year presentation below: |
| | | | | | | | | | | | | | | | |
Distributions from net investment income: | | Class A | | | Institutional | | | Investor | | | Class R6 | |
Concentrated Growth | | $ | (1,554) | | | $ | (532,295) | | | $ | (853) | | | $ | (242) | |
Flexible Cap | | | (6,194) | | | | (57,444) | | | | — | | | | (59) | |
| | | | | | | | | | | | | | | | | | | | | | | | |
| | | | | | |
Distributions from net realized gains: | | Class A | | | Class C | | | Institutional | | | Investor | | | Class R | | | Class R6 | |
Concentrated Growth | | $ | (652,521) | | | $ | (290,281) | | | $ | (15,758,072) | | | $ | (47,728) | | | $ | (3,177) | | | $ | (6,330) | |
Flexible Cap | | | (1,420,632) | | | | (384,365) | | | | (2,958,151) | | | | (47,179) | | | | (10,791) | | | | (2,924) | |
| | (b) | | Class P Shares commenced operations on April 17, 2018. |
| | (c) | | Prior year information has been revised to conform with current year presentation. Undistributed net investment income was $372,138 and $134,009 for the Concentrated Growth and Flexible Cap Funds, respectively as of August 31, 2018. |
| | |
| 80 | | The accompanying notes are an integral part of these financial statements. |
GOLDMAN SACHS FUNDAMENTAL EQUITY GROWTH FUNDS
Statements of Changes in Net Assets (continued)
| | | | | | | | | | | | | | | | | | | | | | |
| | | | | Growth Opportunities Fund | | | | | | Small/Mid Cap Growth Fund | |
| | | | | For the
Six Months Ended
February 28, 2019
(Unaudited) | | | For the Fiscal
Year Ended
August 31, 2018 | | | | | | For the
Six Months Ended
February 28, 2019
(Unaudited) | | | For the Fiscal
Year Ended
August 31, 2018 | |
| | From operations: | | | | | | | | | | | | | | | | | | | | |
| | | | | | |
| | Net investment loss | | $ | (3,007,480 | ) | | $ | (9,381,477 | ) | | | | | | $ | (4,348,848 | ) | | $ | (10,951,565 | ) |
| | | | | | |
| | Net realized gain | | | 206,411,864 | | | | 489,114,569 | | | | | | | | 206,486,596 | | | | 335,369,681 | |
| | | | | | |
| | Net change in unrealized gain (loss) | | | (270,464,484 | ) | | | (46,209,290 | ) | | | | | | | (298,639,305 | ) | | | 207,824,664 | |
| | | | | | |
| | Net increase (decrease) in net assets resulting from operations | | | (67,060,100 | ) | | | 433,523,802 | | | | | | | | (96,501,557 | ) | | | 532,242,780 | |
| | | | | | | | | | | | | | | | | | | | | | |
| | Distributions to shareholders: | | | | | | | | | | | | | |
| | | | | | |
| | From distributable earnings: | | | | | | | | | | | | | | | | | | | | |
| | | | | | |
| | Class A Shares | | | (97,130,292 | ) | | | (83,073,494 | )(a) | | | | | | | (49,982,088 | ) | | | (42,706,708 | )(a) |
| | | | | | |
| | Class C Shares | | | (19,969,153 | ) | | | (21,738,994 | )(a) | | | | | | | (37,660,467 | ) | | | (31,198,094 | )(a) |
| | | | | | |
| | Institutional Shares | | | (187,967,343 | ) | | | (254,482,256 | )(a) | | | | | | | (146,388,336 | ) | | | (141,294,637 | )(a) |
| | | | | | |
| | Service Shares | | | (8,365,708 | ) | | | (6,431,452 | )(a) | | | | | | | (2,862,516 | ) | | | (2,192,847 | )(a) |
| | | | | | |
| | Investor Shares | | | (17,580,366 | ) | | | (21,849,524 | )(a) | | | | | | | (73,001,992 | ) | | | (55,620,264 | )(a) |
| | | | | | |
| | Class P Shares(b) | | | (17,766,747 | ) | | | — | | | | | | | | (34,099,828 | ) | | | — | |
| | | | | | |
| | Class R Shares | | | (13,633,189 | ) | | | (11,017,200 | )(a) | | | | | | | (3,278,948 | ) | | | (3,313,405 | )(a) |
| | | | | | |
| | Class R6 Shares | | | (51,920,508 | ) | | | (26,019,891 | )(a) | | | | | | | (6,417,937 | ) | | | (3,036,144 | )(a) |
| | | | | | |
| | Total distributions to shareholders | | | (414,333,306 | ) | | | (424,612,811 | ) | | | | | | | (353,692,112 | ) | | | (279,362,099 | ) |
| | | | | | | | | | | | | | | | | | | | | | |
| | From share transactions: | | | | | | | | | | | | | |
| | | | | | |
| | Proceeds from sales of shares | | | 220,070,833 | | | | 663,942,711 | | | | | | | | 236,253,596 | | | | 667,329,618 | |
| | | | | | |
| | Reinvestment of distributions | | | 380,325,913 | | | | 390,075,550 | | | | | | | | 317,808,677 | | | | 251,642,738 | |
| | | | | | |
| | Cost of shares redeemed | | | (771,546,098 | ) | | | (1,467,615,153 | ) | | | | | | | (535,451,152 | ) | | | (889,675,339 | ) |
| | | | | | |
| | Net increase (decrease) in net assets resulting from share transactions | | | (171,149,352 | ) | | | (413,596,892 | ) | | | | | | | 18,611,121 | | | | 29,297,017 | |
| | | | | | |
| | TOTAL INCREASE (DECREASE) | | | (652,542,758 | ) | | | (404,685,901 | ) | | | | | | | (431,582,548 | ) | | | 282,177,698 | |
| | | | | | | | | | | | | | | | | | | | | | |
| | Net assets:(c) | | | | | | | | | | | | | |
| | | | | | |
| | Beginning of period | | | 2,186,344,381 | | | | 2,591,030,282 | | | | | | | | 2,503,681,447 | | | | 2,221,503,749 | |
| | | | | | |
| | End of period | | $ | 1,533,801,623 | | | $ | 2,186,344,381 | | | | | | | $ | 2,072,098,899 | | | $ | 2,503,681,447 | |
| | (a) | | Prior year information has been revised to conform to current year presentation. Distributions to shareholders consisted solely of net realized gains for the fiscal year ended August 31, 2018. |
| | (b) | | Class P Shares commenced operations on April 17, 2018. |
| | (c) | | Prior year information has been revised to conform with current year presentation. Undistributed (distributions in excess of) net investment income was $1,128,660 and $(6,565,686) for the Growth Opportunities and Small/Mid Cap Growth Funds, respectively as of August 31, 2018. |
| | |
| The accompanying notes are an integral part of these financial statements. | | 81 |
GOLDMAN SACHS FUNDAMENTAL EQUITY GROWTH FUNDS
Statements of Changes in Net Assets (continued)
| | | | | | | | | | | | | | | | | | | | | | |
| | | | | Strategic Growth Fund | | | | | | Technology Opportunities Fund | |
| | | | | For the
Six Months Ended
February 28, 2019
(Unaudited) | | | For the Fiscal
Year Ended
August 31, 2018 | | | | | | For the
Six Months Ended
February 28, 2019
(Unaudited) | | | For the Fiscal
Year Ended
August 31, 2018 | |
| | From operations: | | | | | | | | | | | | | | | | | | | | |
| | | | | | |
| | Net investment income (loss) | | $ | 173,984 | | | $ | 498,210 | | | | | | | $ | (1,337,892 | ) | | $ | (3,146,930 | ) |
| | | | | | |
| | Net realized gain | | | 15,884,292 | | | | 61,825,326 | | | | | | | | 21,152,782 | | | | 103,117,671 | |
| | | | | | |
| | Net change in unrealized gain (loss) | | | (29,145,120 | ) | | | (5,938,473 | ) | | | | | | | (47,424,258 | ) | | | 30,134,338 | |
| | | | | | |
| | Net increase (decrease) in net assets resulting from operations | | | (13,086,844 | ) | | | 56,385,063 | | | | | | | | (27,609,368 | ) | | | 130,105,079 | |
| | | | | | | | | | | | | | | | | | | | | | |
| | Distributions to shareholders: | | | | | | | | | | | | | |
| | | | | | |
| | From distributable earnings: | | | | | | | | | | | | | | | | | | | | |
| | | | | | |
| | Class A Shares | | | (9,959,880 | ) | | | (5,870,001 | )(a) | | | | | | | (59,848,450 | ) | | | (20,110,843 | )(b) |
| | | | | | |
| | Class C Shares | | | (2,011,947 | ) | | | (2,284,131 | )(a) | | | | | | | (6,783,789 | ) | | | (4,428,142 | )(b) |
| | | | | | |
| | Institutional Shares | | | (19,817,247 | ) | | | (46,482,660 | )(a) | | | | | | | (12,889,684 | ) | | | (5,936,457 | )(b) |
| | | | | | |
| | Service Shares | | | (180,451 | ) | | | (109,589 | )(a) | | | | | | | (6,202,770 | ) | | | (1,573,961 | )(b) |
| | | | | | |
| | Investor Shares | | | (1,098,042 | ) | | | (459,379 | )(a) | | | | | | | (3,690,377 | ) | | | (1,638,714 | )(b) |
| | | | | | |
| | Class P Shares(c) | | | (27,631,178 | ) | | | — | | | | | | | | (4,533,680 | ) | | | — | |
| | | | | | |
| | Class R Shares | | | (97,377 | ) | | | (39,278 | )(a) | | | | | | | — | | | | — | |
| | | | | | |
| | Class R6 Shares | | | (4,416 | ) | | | (2,515 | )(a) | | | | | | | (2,018 | ) | | | — | (d) |
| | | | | | | |
| | Total distributions to shareholders | | | (60,800,538 | ) | | | (55,247,553 | ) | | | | | | | (93,950,768 | ) | | | (33,688,117 | ) |
| | | | | | | | | | | | | | | | | | | | | | |
| | From share transactions: | | | | | | | | | | | | | |
| | | | | | |
| | Proceeds from sales of shares | | | 21,046,781 | | | | 142,949,552 | | | | | | | | 66,558,383 | | | | 123,020,803 | |
| | | | | | |
| | Reinvestment of distributions | | | 59,192,504 | | | | 53,450,381 | | | | | | | | 87,902,456 | | | | 31,099,776 | |
| | | | | | |
| | Cost of shares redeemed | | | (63,440,269 | ) | | | (244,453,101 | ) | | | | | | | (109,952,134 | ) | | | (159,782,824 | ) |
| | | | | | |
| | Net increase (decrease) in net assets resulting from share transactions | | | 16,799,016 | | | | (48,053,168 | ) | | | | | | | 44,508,705 | | | | (5,662,245 | ) |
| | | | | | |
| | TOTAL INCREASE (DECREASE) | | | (57,088,366 | ) | | | (46,915,658 | ) | | | | | | | (77,051,431 | ) | | | 90,754,717 | |
| | | | | | | | | | | | | | | | | | | | | | |
| | Net assets:(e) | | | | | | | | | | | | | |
| | | | | | |
| | Beginning of period | | | 222,759,245 | | | | 269,674,903 | | | | | | | | 537,610,548 | | | | 446,855,831 | |
| | | | | | |
| | End of period | | $ | 165,670,879 | | | $ | 222,759,245 | | | | | | | $ | 460,559,117 | | | $ | 537,610,548 | |
| | (a) | | Prior year information has been revised to conform to current year presentation, see prior year presentation below: |
| | | | | | | | | | | | | | | | | | | | | | | | | | | | |
Distributions from net investment income: | | | | | | | | Institutional | | | Service | | | Investor | | | Class R | | | Class R6 | |
Strategic Growth | | | | | | | | | | $ | (1,263,130) | | | $ | (1,269) | | | $ | (11,296) | | | $ | (258) | | | $ | (73) | |
| | | | | | | | | | | | | | | | | | | | | | | | | | | | |
| | | | | | | |
Distributions from net realized gains: | | Class A | | | Class C | | | Institutional | | | Service | | | Investor | | | Class R | | | Class R6 | |
Strategic Growth | | $ | (5,870,001) | | | $ | (2,284,131) | | | $ | (45,219,530) | | | $ | (108,320) | | | $ | (448,083) | | | $ | (39,020) | | | $ | (2,442) | |
| | (b) | | Prior year information has been revised to conform to current year presentation. Distributions to shareholders consisted solely of net realized gains for the fiscal year ended August 31, 2018. |
| | (c) | | Class P Shares commenced operations on April 17, 2018. |
| | (d) | | Commenced operations on December 29, 2017. |
| | (e) | | Prior year information has been revised to conform with current year presentation. Undistributed (distributions in excess of ) net investment income was $501,594 and $(1,969,779) for the Strategic Growth and Technology Opportunities Funds, respectively as of August 31, 2018. |
| | |
| 82 | | The accompanying notes are an integral part of these financial statements. |
GOLDMAN SACHS BLUE CHIP FUND
Financial Highlights
Selected Share Data for a Share Outstanding Throughout Each Period
| | | | | | | | | | | | | | | | | | | | | | | | | | |
| | | | | Goldman Sachs Blue Chip Fund | |
| | | | | Class A Shares | |
| | | | | Six Months Ended
February 28, 2019
(Unaudited) | | | Year Ended August 31, | |
| | | | | 2018 | | | 2017 | | | 2016 | | | 2015 | | | 2014 | |
| | Per Share Data | | | | | | | | | | | | | | | | | | | | | | | | |
| | | | | | | |
| | Net asset value, beginning of period | | $ | 14.00 | | | $ | 14.84 | | | $ | 13.08 | | | $ | 13.92 | | | $ | 16.66 | | | $ | 14.79 | |
| | | | | | | |
| | Net investment income(a) | | | 0.06 | | | | 0.11 | | | | 0.07 | | | | 0.09 | | | | 0.09 | | | | 0.06 | |
| | | | | | | |
| | Net realized and unrealized gain (loss) | | | (0.23 | ) | | | 2.15 | | | | 1.76 | | | | 0.50 | | | | (0.17 | ) | | | 3.23 | |
| | | | | | | |
| | Total from investment operations | | | (0.17 | ) | | | 2.26 | | | | 1.83 | | | | 0.59 | | | | (0.08 | ) | | | 3.29 | |
| | | | | | | |
| | Distributions to shareholders from net investment income | | | (0.08 | ) | | | (0.09 | ) | | | (0.07 | ) | | | (0.07 | ) | | | (0.07 | ) | | | (0.05 | ) |
| | | | | | | |
| | Distributions to shareholders from net realized gains | | | (1.09 | ) | | | (3.01 | ) | | | — | (b) | | | (1.36 | ) | | | (2.59 | ) | | | (1.37 | ) |
| | | | | | | |
| | Total distributions | | | (1.17 | ) | | | (3.10 | ) | | | (0.07 | ) | | | (1.43 | ) | | | (2.66 | ) | | | (1.42 | ) |
| | | | | | | |
| | Net asset value, end of period | | $ | 12.66 | | | $ | 14.00 | | | $ | 14.84 | | | $ | 13.08 | | | $ | 13.92 | | | $ | 16.66 | |
| | | | | | | |
| | Total return(c) | | | (0.51 | )% | | | 17.50 | % | | | 14.06 | % | | | 4.39 | % | | | (1.22 | )% | | | 23.41 | % |
| | | | | | | |
| | Net assets, end of period (in 000s) | | $ | 2,969 | | | $ | 2,533 | | | $ | 1,880 | | | $ | 2,124 | | | $ | 3,086 | | | $ | 4,542 | |
| | | | | | | |
| | Ratio of net expenses to average net assets | | | 1.03 | %(d) | | | 1.04 | % | | | 1.17 | % | | | 1.22 | % | | | 1.21 | % | | | 1.20 | % |
| | | | | | | |
| | Ratio of total expenses to average net assets | | | 4.46 | %(d) | | | 5.12 | % | | | 4.64 | % | | | 3.60 | % | | | 2.81 | % | | | 3.04 | % |
| | | | | | | |
| | Ratio of net investment income to average net assets | | | 0.98 | %(d) | | | 0.81 | % | | | 0.53 | % | | | 0.67 | % | | | 0.57 | % | | | 0.37 | % |
| | | | | | | |
| | Portfolio turnover rate(e) | | | 37 | % | | | 71 | % | | | 77 | % | | | 49 | % | | | 67 | % | | | 67 | % |
| | (a) | | Calculated based on the average shares outstanding methodology. |
| | (b) | | Amount is less than $0.005 per share. |
| | (c) | | Assumes investment at the NAV at the beginning of the period, reinvestment of all dividends and distributions, a complete redemption of the investment at the NAV at the end of the period and no sales or redemption charges. Total returns would be reduced if a sales or redemption charge was taken into account. Returns do not reflect the impact of taxes to shareholders relating to Fund distributions or the redemption of Fund shares. Total returns for periods less than one full year are not annualized. |
| | (e) | | The Fund’s portfolio turnover rate is calculated in accordance with regulatory requirements, without regard to transactions involving short term investments. If such transactions were included, the Fund’s portfolio turnover rate may be higher. |
| | |
| The accompanying notes are an integral part of these financial statements. | | 83 |
GOLDMAN SACHS BLUE CHIP FUND
Financial Highlights(continued)
Selected Share Data for a Share Outstanding Throughout Each Period
| | | | | | | | | | | | | | | | | | | | | | | | | | |
| | | | | Goldman Sachs Blue Chip Fund | |
| | | | | Class C Shares | |
| | | | | Six Months Ended
February 28, 2019
(Unaudited) | | | Year Ended August 31, | |
| | | | | 2018 | | | 2017 | | | 2016 | | | 2015 | | | 2014 | |
| | Per Share Data | | | | | | | | | | | | | | | | | | | | | | | | |
| | | | | | | |
| | Net asset value, beginning of period | | $ | 13.40 | | | $ | 14.36 | | | $ | 12.69 | | | $ | 13.56 | | | $ | 16.33 | | | $ | 14.58 | |
| | | | | | | |
| | Net investment income (loss)(a) | | | 0.02 | | | | 0.01 | | | | (0.02 | ) | | | (0.01 | ) | | | (0.03 | ) | | | (0.06 | ) |
| | | | | | | |
| | Net realized and unrealized gain (loss) | | | (0.22 | ) | | | 2.07 | | | | 1.69 | | | | 0.50 | | | | (0.15 | ) | | | 3.18 | |
| | | | | | | |
| | Total from investment operations | | | (0.20 | ) | | | 2.08 | | | | 1.67 | | | | 0.49 | | | | (0.18 | ) | | | 3.12 | |
| | | | | | | |
| | Distributions to shareholders from net investment income | | | (0.04 | ) | | | (0.03 | ) | | | — | | | | — | | | | — | | | | — | |
| | | | | | | |
| | Distributions to shareholders from net realized gains | | | (1.09 | ) | | | (3.01 | ) | | | — | (b) | | | (1.36 | ) | | | (2.59 | ) | | | (1.37 | ) |
| | | | | | | |
| | Total distributions | | | (1.13 | ) | | | (3.04 | ) | | | — | (b) | | | (1.36 | ) | | | (2.59 | ) | | | (1.37 | ) |
| | | | | | | |
| | Net asset value, end of period | | $ | 12.07 | | | $ | 13.40 | | | $ | 14.36 | | | $ | 12.69 | | | $ | 13.56 | | | $ | 16.33 | |
| | | | | | | |
| | Total return(c) | | | (0.86 | )% | | | 16.66 | % | | | 13.18 | % | | | 3.66 | % | | | (1.96 | )% | | | 22.44 | % |
| | | | | | | |
| | Net assets, end of period (in 000s) | | $ | 1,346 | | | $ | 172 | | | $ | 178 | | | $ | 195 | | | $ | 355 | | | $ | 247 | |
| | | | | | | |
| | Ratio of net expenses to average net assets | | | 1.78 | %(d) | | | 1.80 | % | | | 1.92 | % | | | 1.97 | % | | | 1.97 | % | | | 1.95 | % |
| | | | | | | |
| | Ratio of total expenses to average net assets | | | 5.25 | %(d) | | | 5.86 | % | | | 5.38 | % | | | 4.33 | % | | | 3.56 | % | | | 3.78 | % |
| | | | | | | |
| | Ratio of net investment income (loss) to average net assets | | | 0.41 | %(d) | | | 0.05 | % | | | (0.18 | )% | | | (0.10 | )% | | | (0.21 | )% | | | (0.37 | )% |
| | | | | | | |
| | Portfolio turnover rate(e) | | | 37 | % | | | 71 | % | | | 77 | % | | | 49 | % | | | 67 | % | | | 67 | % |
| | (a) | | Calculated based on the average shares outstanding methodology. |
| | (b) | | Amount is less than $0.005 per share. |
| | (c) | | Assumes investment at the NAV at the beginning of the period, reinvestment of all dividends and distributions, a complete redemption of the investment at the NAV at the end of the period and no sales or redemption charges. Total returns would be reduced if a sales or redemption charge was taken into account. Returns do not reflect the impact of taxes to shareholders relating to Fund distributions or the redemption of Fund shares. Total returns for periods less than one full year are not annualized. |
| | (e) | | The Fund’s portfolio turnover rate is calculated in accordance with regulatory requirements, without regard to transactions involving short term investments. If such transactions were included, the Fund’s portfolio turnover rate may be higher. |
| | |
| 84 | | The accompanying notes are an integral part of these financial statements. |
GOLDMAN SACHS BLUE CHIP FUND
Financial Highlights(continued)
Selected Share Data for a Share Outstanding Throughout Each Period
| | | | | | | | | | | | | | | | | | | | | | | | | | |
| | | | |
Goldman Sachs Blue Chip Fund | |
| | | | | Institutional Shares | |
| | | | | Six Months Ended
February 28, 2019
(Unaudited) | | | Year Ended August 31, | |
| | | | | 2018 | | | 2017 | | | 2016 | | | 2015 | | | 2014 | |
| | Per Share Data | | | | | | | | | | | | | | | | | | | | | | | | |
| | | | | | | |
| | Net asset value, beginning of period | | $ | 14.10 | | | $ | 14.92 | | | $ | 13.17 | | | $ | 14.01 | | | $ | 16.75 | | | $ | 14.85 | |
| | | | | | | |
| | Net investment income(a) | | | 0.08 | | | | 0.16 | | | | 0.12 | | | | 0.14 | | | | 0.14 | | | | 0.12 | |
| | | | | | | |
| | Net realized and unrealized gain (loss) | | | (0.22 | ) | | | 2.17 | | | | 1.77 | | | | 0.51 | | | | (0.16 | ) | | | 3.25 | |
| | | | | | | |
| | Total from investment operations | | | (0.14 | ) | | | 2.33 | | | | 1.89 | | | | 0.65 | | | | (0.02 | ) | | | 3.37 | |
| | | | | | | |
| | Distributions to shareholders from net investment income | | | (0.11 | ) | | | (0.14 | ) | | | (0.14 | ) | | | (0.13 | ) | | | (0.13 | ) | | | (0.10 | ) |
| | | | | | | |
| | Distributions to shareholders from net realized gains | | | (1.09 | ) | | | (3.01 | ) | | | — | (b) | | | (1.36 | ) | | | (2.59 | ) | | | (1.37 | ) |
| | | | | | | |
| | Total distributions | | | (1.20 | ) | | | (3.15 | ) | | | (0.14 | ) | | | (1.49 | ) | | | (2.72 | ) | | | (1.47 | ) |
| | | | | | | |
| | Net asset value, end of period | | $ | 12.76 | | | $ | 14.10 | | | $ | 14.92 | | | $ | 13.17 | | | $ | 14.01 | | | $ | 16.75 | |
| | | | | | | |
| | Total return(c) | | | (0.31 | )% | | | 17.92 | % | | | 14.43 | % | | | 4.84 | % | | | (0.82 | )% | | | 23.92 | % |
| | | | | | | |
| | Net assets, end of period (in 000s) | | $ | 829 | | | $ | 4,969 | | | $ | 3,499 | | | $ | 4,754 | | | $ | 10,855 | | | $ | 8,995 | |
| | | | | | | |
| | Ratio of net expenses to average net assets | | | 0.67 | %(d) | | | 0.68 | % | | | 0.79 | % | | | 0.82 | % | | | 0.81 | % | | | 0.80 | % |
| | | | | | | |
| | Ratio of total expenses to average net assets | | | 4.03 | %(d) | | | 4.65 | % | | | 4.28 | % | | | 3.16 | % | | | 2.42 | % | | | 2.65 | % |
| | | | | | | |
| | Ratio of net investment income to average net assets | | | 1.24 | %(d) | | | 1.20 | % | | | 0.88 | % | | | 1.10 | % | | | 0.93 | % | | | 0.76 | % |
| | | | | | | |
| | Portfolio turnover rate(e) | | | 37 | % | | | 71 | % | | | 77 | % | | | 49 | % | | | 67 | % | | | 67 | % |
| | (a) | | Calculated based on the average shares outstanding methodology. |
| | (b) | | Amount is less than $0.005 per share. |
| | (c) | | Assumes investment at the NAV at the beginning of the period, reinvestment of all dividends and distributions, a complete redemption of the investment at the NAV at the end of the period and no sales or redemption charges. Total returns would be reduced if a sales or redemption charge was taken into account. Returns do not reflect the impact of taxes to shareholder relating to Fund distributions or the redemption of Fund shares. Total returns for periods less than one full year are not annualized. |
| | (e) | | The Fund’s portfolio turnover rate is calculated in accordance with regulatory requirements, without regard to transactions involving short term investments. If such transactions were included, the Fund’s portfolio turnover rate may be higher. |
| | |
| The accompanying notes are an integral part of these financial statements. | | 85 |
GOLDMAN SACHS BLUE CHIP FUND
Financial Highlights(continued)
Selected Share Data for a Share Outstanding Throughout Each Period
| | | | | | | | | | | | | | | | | | | | | | | | | | |
| | | | | Goldman Sachs Blue Chip Fund | |
| | | | | Investor Shares | |
| | | | | Six Months Ended
February 28, 2019
(Unaudited) | | | Year Ended August 31, | |
| | | | | 2018 | | | 2017 | | | 2016 | | | 2015 | | | 2014 | |
| | Per Share Data | | | | | | | | | | | | | | | | | | | | | | | | |
| | | | | | | |
| | Net asset value, beginning of period | | $ | 14.11 | | | $ | 14.92 | | | $ | 13.16 | | | $ | 13.98 | | | $ | 16.72 | | | $ | 14.83 | |
| | | | | | | |
| | Net investment income(a) | | | 0.08 | | | | 0.14 | | | | 0.11 | | | | 0.13 | | | | 0.11 | | | | 0.10 | |
| | | | | | | |
| | Net realized and unrealized gain (loss) | | | (0.23 | ) | | | 2.18 | | | | 1.76 | | | | 0.50 | | | | (0.15 | ) | | | 3.24 | |
| | | | | | | |
| | Total from investment operations | | | (0.15 | ) | | | 2.32 | | | | 1.87 | | | | 0.63 | | | | (0.04 | ) | | | 3.34 | |
| | | | | | | |
| | Distributions to shareholders from net investment income | | | (0.10 | ) | | | (0.12 | ) | | | (0.11 | ) | | | (0.09 | ) | | | (0.11 | ) | | | (0.08 | ) |
| | | | | | | |
| | Distributions to shareholders from net realized gains | | | (1.09 | ) | | | (3.01 | ) | | | — | (b) | | | (1.36 | ) | | | (2.59 | ) | | | (1.37 | ) |
| | | | | | | |
| | Total distributions | | | (1.19 | ) | | | (3.13 | ) | | | (0.11 | ) | | | (1.45 | ) | | | (2.70 | ) | | | (1.45 | ) |
| | | | | | | |
| | Net asset value, end of period | | $ | 12.77 | | | $ | 14.11 | | | $ | 14.92 | | | $ | 13.16 | | | $ | 13.98 | | | $ | 16.72 | |
| | | | | | | |
| | Total return(c) | | | (0.36 | )% | | | 17.86 | % | | | 14.27 | % | | | 4.67 | % | | | (0.98 | )% | | | 23.71 | % |
| | | | | | | |
| | Net assets, end of period (in 000s) | | $ | 246 | | | $ | 235 | | | $ | 188 | | | $ | 156 | | | $ | 800 | | | $ | 205 | |
| | | | | | | |
| | Ratio of net expenses to average net assets | | | 0.78 | %(d) | | | 0.79 | % | | | 0.92 | % | | | 0.97 | % | | | 0.96 | % | | | 0.95 | % |
| | | | | | | |
| | Ratio of total expenses to average net assets | | | 4.23 | %(d) | | | 4.87 | % | | | 4.47 | % | | | 3.54 | % | | | 1.06 | % | | | 2.80 | % |
| | | | | | | |
| | Ratio of net investment loss to average net assets | | | 1.21 | %(d) | | | 1.06 | % | | | 0.78 | % | | | 0.97 | % | | | 0.73 | % | | | 0.61 | % |
| | | | | | | |
| | Portfolio turnover rate(e) | | | 37 | % | | | 71 | % | | | 77 | % | | | 49 | % | | | 67 | % | | | 67 | % |
| | (a) | | Calculated based on the average shares outstanding methodology. |
| | (b) | | Amount is less than $0.005 per share. |
| | (c) | | Assumes investment at the NAV at the beginning of the period, reinvestment of all dividends and distributions, a complete redemption of the investment at the NAV at the end of the period and no sales or redemption charges. Total returns would be reduced if a sales or redemption charge was taken into account. Returns do not reflect the impact of taxes to shareholder relating to Fund distributions or the redemption of Fund shares. Total returns for periods less than one full year are not annualized. |
| | (e) | | The Fund’s portfolio turnover rate is calculated in accordance with regulatory requirements, without regard to transactions involving short term investments. If such transactions were included, the Fund’s portfolio turnover rate may be higher. |
| | |
| 86 | | The accompanying notes are an integral part of these financial statements. |
GOLDMAN SACHS BLUE CHIP FUND
Financial Highlights(continued)
Selected Share Data for a Share Outstanding Throughout Each Period
| | | | | | | | | | |
| | | | | Goldman Sachs Blue Chip Fund | |
| | | | | Class P Shares | |
| | | | | Six Months Ended
February 28, 2019
(Unaudited) | | | Period Ended August 31, 2018(a) | |
| | | |
| | Per Share Data | | | | | | | | |
| | | |
| | Net asset value, beginning of period | | $ | 14.11 | | | $ | 13.06 | |
| | | |
| | Net investment income(b) | | | 0.09 | | | | 0.06 | |
| | | |
| | Net realized and unrealized gain (loss) | | | (0.24 | ) | | | 0.99 | |
| | | |
| | Total from investment operations | | | (0.15 | ) | | | 1.05 | |
| | | |
| | Distributions to shareholders from net investment income | | | (0.11 | ) | | | — | |
| | | |
| | Distributions to shareholders from net realized gains | | | (1.09 | ) | | | — | |
| | | |
| | Total distributions | | | (1.20 | ) | | | — | |
| | | |
| | Net asset value, end of period | | $ | 12.76 | | | $ | 14.11 | |
| | | |
| | Total return(c) | | | (0.35 | )% | | | 8.04 | % |
| | | |
| | Net assets, end of period (in 000s) | | $ | 1,985 | | | $ | 2,026 | |
| | | |
| | Ratio of net expenses to average net assets(d) | | | 0.66 | % | | | 0.66 | % |
| | | |
| | Ratio of total expenses to average net assets(d) | | | 4.06 | % | | | 5.72 | % |
| | | |
| | Ratio of net investment income to average net assets(d) | | | 1.33 | % | | | 1.23 | % |
| | | |
| | Portfolio turnover rate(e) | | | 37 | % | | | 71 | % |
| | (a) | | Commenced operations on April 17, 2018. |
| | (b) | | Calculated based on the average shares outstanding methodology. |
| | (c) | | Assumes investment at the NAV at the beginning of the period, reinvestment of all dividends and distributions, a complete redemption of the investment at the NAV at the end of the period and no sales or redemption charges. Total returns would be reduced if a sales or redemption charge was taken into account. Returns do not reflect the impact of taxes to shareholder relating to Fund distributions or the redemption of Fund shares. Total returns for periods less than one full year are not annualized. |
| | (e) | | The Fund’s portfolio turnover rate is calculated in accordance with regulatory requirements, without regard to transactions involving short term investments. If such transactions were included, the Fund’s portfolio turnover rate may be higher. |
| | |
| The accompanying notes are an integral part of these financial statements. | | 87 |
GOLDMAN SACHS BLUE CHIP FUND
Financial Highlights(continued)
Selected Share Data for a Share Outstanding Throughout Each Period
| | | | | | | | | | | | | | | | | | | | | | | | | | |
| | | | | Goldman Sachs Blue Chip Fund | |
| | | | | Class R Shares | |
| | | | | Six Months Ended
February 28, 2019
(Unaudited) | | | Year Ended August 31, | |
| | | | | 2018 | | | 2017 | | | 2016 | | | 2015 | | | 2014 | |
| | Per Share Data | | | | | | | | | | | | | | | | | | | | | | | | |
| | | | | | | |
| | Net asset value, beginning of period | | $ | 14.07 | | | $ | 14.89 | | | $ | 13.09 | | | $ | 13.88 | | | $ | 16.62 | | | $ | 14.78 | |
| | | | | | | |
| | Net investment income(a) | | | 0.05 | | | | 0.08 | | | | 0.04 | | | | 0.07 | | | | 0.04 | | | | 0.02 | |
| | | | | | | |
| | Net realized and unrealized gain (loss) | | | (0.22 | ) | | | 2.16 | | | | 1.76 | | | | 0.50 | | | | (0.16 | ) | | | 3.23 | |
| | | | | | | |
| | Total from investment operations | | | (0.17 | ) | | | 2.24 | | | | 1.80 | | | | 0.57 | | | | (0.12 | ) | | | 3.25 | |
| | | | | | | |
| | Distributions to shareholders from net investment income | | | (0.06 | ) | | | (0.05 | ) | | | — | | | | — | | | | (0.03 | ) | | | (0.04 | ) |
| | | | | | | |
| | Distributions to shareholders from net realized gains | | | (1.09 | ) | | | (3.01 | ) | | | — | (b) | | | (1.36 | ) | | | (2.59 | ) | | | (1.37 | ) |
| | | | | | | |
| | Total distributions | | | (1.15 | ) | | | (3.06 | ) | | | — | (b) | | | (1.36 | ) | | | (2.62 | ) | | | (1.41 | ) |
| | | | | | | |
| | Net asset value, end of period | | $ | 12.75 | | | $ | 14.07 | | | $ | 14.89 | | | $ | 13.09 | | | $ | 13.88 | | | $ | 16.62 | |
| | | | | | | |
| | Total return(c) | | | (0.59 | )% | | | 17.21 | % | | | 13.77 | % | | | 4.18 | % | | | (1.48 | )% | | | 23.06 | % |
| | | | | | | |
| | Net assets, end of period (in 000s) | | $ | 19 | | | $ | 20 | | | $ | 22 | | | $ | 19 | | | $ | 118 | | | $ | 110 | |
| | | | | | | |
| | Ratio of net expenses to average net assets | | | 1.28 | %(d) | | | 1.29 | % | | | 1.41 | % | | | 1.47 | % | | | 1.46 | % | | | 1.45 | % |
| | | | | | | |
| | Ratio of total expenses to average net assets | | | 4.71 | %(d) | | | 5.36 | % | | | 4.88 | % | | | 3.70 | % | | | 3.10 | % | | | 3.30 | % |
| | | | | | | |
| | Ratio of net investment income to average net assets | | | 0.70 | %(d) | | | 0.55 | % | | | 0.30 | % | | | 0.49 | % | | | 0.28 | % | | | 0.11 | % |
| | | | | | | |
| | Portfolio turnover rate(e) | | | 37 | % | | | 71 | % | | | 77 | % | | | 49 | % | | | 67 | % | | | 67 | % |
| | (a) | | Calculated based on the average shares outstanding methodology. |
| | (b) | | Amount is less than $0.005 per share. |
| | (c) | | Assumes investment at the NAV at the beginning of the period, reinvestment of all dividends and distributions, a complete redemption of the investment at the NAV at the end of the period and no sales or redemption charges. Total returns would be reduced if a sales or redemption charge was taken into account. Returns do not reflect the impact of taxes to shareholder relating to Fund distributions or the redemption of Fund shares. Total returns for periods less than one full year are not annualized. |
| | (e) | | The Fund’s portfolio turnover rate is calculated in accordance with regulatory requirements, without regard to transactions involving short term investments. If such transactions were included, the Fund’s portfolio turnover rate may be higher. |
| | |
| 88 | | The accompanying notes are an integral part of these financial statements. |
GOLDMAN SACHS BLUE CHIP FUND
Financial Highlights(continued)
Selected Share Data for a Share Outstanding Throughout Each Period
| | | | | | | | | | | | | | | | | | | | | | |
| | | | | Goldman Sachs Blue Chip Fund | |
| | | | | Class R6 Shares | |
| | | | | Six Months Ended
February 28, 2019
(Unaudited) | | | Year Ended August 31, | | | Period Ended August 31, 2015(a) | |
| | | | | 2018 | | | 2017 | | | 2016 | |
| | Per Share Data | | | | | | | | | | | | | | | | | | | | |
| | | | | | |
| | Net asset value, beginning of period | | $ | 14.11 | | | $ | 14.93 | | | $ | 13.17 | | | $ | 14.01 | | | $ | 15.04 | |
| | | | | | |
| | Net investment income(b) | | | 0.11 | | | | 0.16 | | | | 0.13 | | | | 0.14 | | | | 0.01 | |
| | | | | | |
| | Net realized and unrealized gain (loss) | | | (0.25 | ) | | | 2.17 | | | | 1.77 | | | | 0.51 | | | | (1.04 | ) |
| | | | | | |
| | Total from investment operations | | | (0.14 | ) | | | 2.33 | | | | 1.90 | | | | 0.65 | | | | (1.03 | ) |
| | | | | | |
| | Distributions to shareholders from net investment income | | | (0.11 | ) | | | (0.14 | ) | | | (0.14 | ) | | | (0.13 | ) | | | — | |
| | | | | | |
| | Distributions to shareholders from net realized gains | | | (1.09 | ) | | | (3.01 | ) | | | — | (c) | | | (1.36 | ) | | | — | |
| | | | | | |
| | Total distributions | | | (1.20 | ) | | | (3.15 | ) | | | (0.14 | ) | | | (1.49 | ) | | | — | |
| | | | | | |
| | Net asset value, end of period | | $ | 12.77 | | | $ | 14.11 | | | $ | 14.93 | | | $ | 13.17 | | | $ | 14.01 | |
| | | | | | |
| | Total return(d) | | | (0.30 | )% | | | 17.94 | % | | | 14.52 | % | | | 4.86 | % | | | (6.85 | )% |
| | | | | | |
| | Net assets, end of period (in 000s) | | $ | 3,139 | | | $ | 11 | | | $ | 11 | | | $ | 10 | | | $ | 9 | |
| | | | | | |
| | Ratio of net expenses to average net assets | | | 0.66 | %(e) | | | 0.68 | % | | | 0.77 | % | | | 0.81 | % | | | 0.76 | %(e) |
| | | | | | |
| | Ratio of total expenses to average net assets | | | 3.98 | %(e) | | | 4.73 | % | | | 4.20 | % | | | 3.14 | % | | | 1.65 | %(e) |
| | | | | | |
| | Ratio of net investment income to average net assets | | | 1.86 | %(e) | | | 1.16 | % | | | 0.95 | % | | | 1.09 | % | | | 1.08 | %(e) |
| | | | | | |
| | Portfolio turnover rate(f) | | | 37 | % | | | 71 | % | | | 77 | % | | | 49 | % | | | 67 | % |
| | (a) | | Commenced operations on July 31, 2015. |
| | (b) | | Calculated based on the average shares outstanding methodology. |
| | (c) | | Amount is less than $0.005 per share. |
| | (d) | | Assumes investment at the NAV at the beginning of the period, reinvestment of all dividends and distributions, a complete redemption of the investment at the NAV at the end of the period and no sales or redemption charges. Total returns would be reduced if a sales or redemption charge was taken into account. Returns do not reflect the impact of taxes to shareholder relating to Fund distributions or the redemption of Fund shares. Total returns for periods less than one full year are not annualized. |
| | (f) | | The Fund’s portfolio turnover rate is calculated in accordance with regulatory requirements, without regard to transactions involving short term investments. If such transactions were included, the Fund’s portfolio turnover rate may be higher. |
| | |
| The accompanying notes are an integral part of these financial statements. | | 89 |
GOLDMAN SACHS CAPITAL GROWTH FUND
Financial Highlights(continued)
Selected Share Data for a Share Outstanding Throughout Each Period
| | | | | | | | | | | | | | | | | | | | | | | | | | |
| | | | | Goldman Sachs Capital Growth Fund | |
| | | | | Class A Shares | |
| | | | | Six Months Ended
February 28, 2019
(Unaudited) | | | Year Ended August 31, | |
| | | | | 2018 | | | 2017 | | | 2016 | | | 2015 | | | 2014 | |
| | Per Share Data | | | | | | | | | | | | | | | | | | | | | | | | |
| | | | | | | |
| | Net asset value, beginning of period | | $ | 32.46 | | | $ | 28.92 | | | $ | 24.15 | | | $ | 24.80 | | | $ | 28.16 | | | $ | 28.13 | |
| | | | | | | |
| | Net investment income (loss)(a) | | | 0.05 | | | | 0.02 | | | | 0.04 | | | | 0.03 | | | | 0.01 | | | | (0.01 | ) |
| | | | | | | |
| | Net realized and unrealized gain (loss) | | | (1.81 | ) | | | 6.01 | | | | 5.07 | | | | 1.37 | | | | 1.00 | | | | 6.41 | |
| | | | | | | |
| | Total from investment operations | | | (1.76 | ) | | | 6.03 | | | | 5.11 | | | | 1.40 | | | | 1.01 | | | | 6.40 | |
| | | | | | | |
| | Distributions to shareholders from net investment income | | | — | | | | (0.02 | ) | | | (0.01 | ) | | | — | | | | — | | | | (0.08 | ) |
| | | | | | | |
| | Distributions to shareholders from net realized gains | | | (9.33 | ) | | | (2.47 | ) | | | (0.33 | ) | | | (2.05 | ) | | | (4.37 | ) | | | (6.29 | ) |
| | | | | | | |
| | Total distributions | | | (9.33 | ) | | | (2.49 | ) | | | (0.34 | ) | | | (2.05 | ) | | | (4.37 | ) | | | (6.37 | ) |
| | | | | | | |
| | Net asset value, end of period | | $ | 21.37 | | | $ | 32.46 | | | $ | 28.92 | | | $ | 24.15 | | | $ | 24.80 | | | $ | 28.16 | |
| | | | | | | |
| | Total return(b) | | | (3.34 | )% | | | 22.01 | % | | | 21.47 | % | | | 5.79 | % | | | 3.34 | % | | | 25.50 | % |
| | | | | | | |
| | Net assets, end of period (in 000s) | | $ | 697,641 | | | $ | 745,362 | | | $ | 671,371 | | | $ | 630,091 | | | $ | 669,345 | | | $ | 702,534 | |
| | | | | | | |
| | Ratio of net expenses to average net assets | | | 1.14 | %(c) | | | 1.14 | % | | | 1.15 | % | | | 1.15 | % | | | 1.15 | % | | | 1.16 | % |
| | | | | | | |
| | Ratio of total expenses to average net assets | | | 1.21 | %(c) | | | 1.31 | % | | | 1.51 | % | | | 1.51 | % | | | 1.49 | % | | | 1.51 | % |
| | | | | | | |
| | Ratio of net investment income (loss) to average net assets | | | 0.41 | %(c) | | | 0.06 | % | | | 0.14 | % | | | 0.11 | % | | | 0.04 | % | | | (0.05 | )% |
| | | | | | | |
| | Portfolio turnover rate(d) | | | 29 | % | | | 93 | % | | | 48 | % | | | 45 | % | | | 55 | % | | | 75 | % |
| | (a) | | Calculated based on the average shares outstanding methodology. |
| | (b) | | Assumes investment at the NAV at the beginning of the period, reinvestment of all dividends and distributions, a complete redemption of the investment at the NAV at the end of the period and no sales or redemption charges. Total returns would be reduced if a sales or redemption charge was taken into account. Returns do not reflect the impact of taxes to shareholder relating to Fund distributions or the redemption of Fund shares. Total returns for periods less than one full year are not annualized. |
| | (d) | | The Fund’s portfolio turnover rate is calculated in accordance with regulatory requirements, without regard to transactions involving short term investments. If such transactions were included, the Fund’s portfolio turnover rate may be higher. |
| | |
| 90 | | The accompanying notes are an integral part of these financial statements. |
GOLDMAN SACHS CAPITAL GROWTH FUND
Financial Highlights(continued)
Selected Share Data for a Share Outstanding Throughout Each Period
| | | | | | | | | | | | | | | | | | | | | | | | | | |
| | | | | Goldman Sachs Capital Growth Fund | |
| | | | | Class C Shares | |
| | | | | Six Months Ended
February 28, 2019
(Unaudited) | | | Year Ended August 31, | |
| | | | | 2018 | | | 2017 | | | 2016 | | | 2015 | | | 2014 | |
| | Per Share Data | | | | | | | | | | | | | | | | | | | | | | | | |
| | | | | | | |
| | Net asset value, beginning of period | | $ | 24.01 | | | $ | 22.13 | | | $ | 18.68 | | | $ | 19.77 | | | $ | 23.45 | | | $ | 24.46 | |
| | | | | | | |
| | Net investment loss(a) | | | (0.04 | ) | | | (0.16 | ) | | | (0.12 | ) | | | (0.12 | ) | | | (0.15 | ) | | | (0.18 | ) |
| | | | | | | |
| | Net realized and unrealized gain (loss) | | | (1.50 | ) | | | 4.51 | | | | 3.90 | | | | 1.08 | | | | 0.84 | | | | 5.46 | |
| | | | | | | |
| | Total from investment operations | | | (1.54 | ) | | | 4.35 | | | | 3.78 | | | | 0.96 | | | | 0.69 | | | | 5.28 | |
| | | | | | | |
| | Distributions to shareholder from net realized gains | | | (9.33 | ) | | | (2.47 | ) | | | (0.33 | ) | | | (2.05 | ) | | | (4.37 | ) | | | (6.29 | ) |
| | | | | | | |
| | Total distributions | | | (9.33 | ) | | | (2.47 | ) | | | (0.33 | ) | | | (2.05 | ) | | | (4.37 | ) | | | (6.29 | ) |
| | | | | | | |
| | Net asset value, end of period | | $ | 13.14 | | | $ | 24.01 | | | $ | 22.13 | | | $ | 18.68 | | | $ | 19.77 | | | $ | 23.45 | |
| | | | | | | |
| | Total return(b) | | | (3.67 | )% | | | 21.11 | % | | | 20.59 | % | | | 4.98 | % | | | 2.55 | % | | | 24.57 | % |
| | | | | | | |
| | Net assets, end of period (000s) | | $ | 19,575 | | | $ | 65,983 | | | $ | 62,701 | | | $ | 68,960 | | | $ | 75,941 | | | $ | 81,954 | |
| | | | | | | |
| | Ratio of net expenses to average net assets | | | 1.89 | %(c) | | | 1.89 | % | | | 1.90 | % | | | 1.90 | % | | | 1.90 | % | | | 1.91 | % |
| | | | | | | |
| | Ratio of total expenses to average net assets | | | 1.96 | %(c) | | | 2.06 | % | | | 2.26 | % | | | 2.26 | % | | | 2.25 | % | | | 2.26 | % |
| | | | | | | |
| | Ratio of net investment loss to average net assets | | | (0.39 | )%(c) | | | (0.70 | )% | | | (0.61 | )% | | | (0.64 | )% | | | (0.71 | )% | | | (0.80 | )% |
| | | | | | | |
| | Portfolio turnover rate(d) | | | 29 | % | | | 93 | % | | | 48 | % | | | 45 | % | | | 55 | % | | | 75 | % |
| | (a) | | Calculated based on the average shares outstanding methodology. |
| | (b) | | Assumes investment at the NAV at the beginning of the period, reinvestment of all dividends and distributions, a complete redemption of the investment at the NAV at the end of the period and no sales or redemption charges. Total returns would be reduced if a sales or redemption charge was taken into account. Returns do not reflect the impact of taxes to shareholder relating to Fund distributions or the redemption of Fund shares. Total returns for periods less than one full year are not annualized. |
| | (d) | | The Fund’s portfolio turnover rate is calculated in accordance with regulatory requirements, without regard to transactions involving short term investments. If such transactions were included, the Fund’s portfolio turnover rate may be higher. |
| | |
| The accompanying notes are an integral part of these financial statements. | | 91 |
GOLDMAN SACHS CAPITAL GROWTH FUND
Financial Highlights(continued)
Selected Share Data for a Share Outstanding Throughout Each Period
| | | | | | | | | | | | | | | | | | | | | | | | | | |
| | | | | Goldman Sachs Capital Growth Fund | |
| | | | | Institutional Shares | |
| | | | | Six Months Ended
February 28, 2019
(Unaudited) | | | Year Ended August 31, | |
| | | | | 2018 | | | 2017 | | | 2016 | | | 2015 | | | 2014 | |
| | Per Share Data | | | | | | | | | | | | | | | | | | | | | | | | |
| | | | | | | |
| | Net asset value, beginning of period | | $ | 35.76 | | | $ | 31.60 | | | $ | 26.35 | | | $ | 26.82 | | | $ | 30.01 | | | $ | 29.57 | |
| | | | | | | |
| | Net investment income(a) | | | 0.11 | | | | 0.13 | | | | 0.15 | | | | 0.13 | | | | 0.12 | | | | 0.10 | |
| | | | | | | |
| | Net realized and unrealized gain (loss) | | | (1.93 | ) | | | 6.62 | | | | 5.54 | | | | 1.49 | | | | 1.06 | | | | 6.79 | |
| | | | | | | |
| | Total from investment operations | | | (1.82 | ) | | | 6.75 | | | | 5.69 | | | | 1.62 | | | | 1.18 | | | | 6.89 | |
| | | | | | | |
| | Distributions to shareholders from net investment income | | | (0.07 | ) | | | (0.12 | ) | | | (0.11 | ) | | | (0.04 | ) | | | — | | | | (0.16 | ) |
| | | | | | | |
| | Distributions to shareholder from net realized gains | | | (9.33 | ) | | | (2.47 | ) | | | (0.33 | ) | | | (2.05 | ) | | | (4.37 | ) | | | (6.29 | ) |
| | | | | | | |
| | Total distributions | | | (9.40 | ) | | | (2.59 | ) | | | (0.44 | ) | | | (2.09 | ) | | | (4.37 | ) | | | (6.45 | ) |
| | | | | | | |
| | Net asset value, end of period | | $ | 24.54 | | | $ | 35.76 | | | $ | 31.60 | | | $ | 26.35 | | | $ | 26.82 | | | $ | 30.01 | |
| | | | | | | |
| | Total return(b) | | | (3.16 | )% | | | 22.50 | % | | | 21.96 | % | | | 6.19 | % | | | 3.75 | % | | | 26.03 | % |
| | | | | | | |
| | Net assets, end of period (000s) | | $ | 58,489 | | | $ | 77,293 | | | $ | 165,948 | | | $ | 141,442 | | | $ | 173,539 | | | $ | 147,642 | |
| | | | | | | |
| | Ratio of net expenses to average net assets | | | 0.75 | %(c) | | | 0.75 | % | | | 0.75 | % | | | 0.75 | % | | | 0.75 | % | | | 0.76 | % |
| | | | | | | |
| | Ratio of total expenses to average net assets | | | 0.82 | %(c) | | | 0.93 | % | | | 1.11 | % | | | 1.11 | % | | | 1.09 | % | | | 1.11 | % |
| | | | | | | |
| | Ratio of net investment income to average net assets | | | 0.78 | %(c) | | | 0.40 | % | | | 0.54 | % | | | 0.50 | % | | | 0.44 | % | | | 0.35 | % |
| | | | | | | |
| | Portfolio turnover rate(d) | | | 29 | % | | | 93 | % | | | 48 | % | | | 45 | % | | | 55 | % | | | 75 | % |
| | (a) | | Calculated based on the average shares outstanding methodology. |
| | (b) | | Assumes investment at the NAV at the beginning of the period, reinvestment of all dividends and distributions, a complete redemption of the investment at the NAV at the end of the period and no sales or redemption charges. Total returns would be reduced if a sales or redemption charge was taken into account. Returns do not reflect the impact of taxes to shareholder relating to Fund distributions or the redemption of Fund shares. Total returns for periods less than one full year are not annualized. |
| | (d) | | The Fund’s portfolio turnover rate is calculated in accordance with regulatory requirements, without regard to transactions involving short term investments. If such transactions were included, the Fund’s portfolio turnover rate may be higher. |
| | |
| 92 | | The accompanying notes are an integral part of these financial statements. |
GOLDMAN SACHS CAPITAL GROWTH FUND
Financial Highlights(continued)
Selected Share Data for a Share Outstanding Throughout Each Period
| | | | | | | | | | | | | | | | | | | | | | | | | | |
| | | | | Goldman Sachs Capital Growth Fund
| |
| | | | | Service Shares | |
| | | | | Six Months Ended
February 28, 2019
(Unaudited) | | | Year Ended August 31, | |
| | | | | 2018 | | | 2017 | | | 2016 | | | 2015 | | | 2014 | |
| | Per Share Data | | | | | | | | | | | | | | | | | | | | | | | | |
| | | | | | | |
| | Net asset value, beginning of period | | $ | 31.33 | | | $ | 28.00 | | | $ | 23.40 | | | $ | 24.12 | | | $ | 27.53 | | | $ | 27.62 | |
| | | | | | | |
| | Net investment income (loss)(a) | | | 0.04 | | | | (0.01 | ) | | | — | | | | — | (b) | | | (0.02 | ) | | | (0.04 | ) |
| | | | | | | |
| | Net realized and unrealized gain (loss) | | | (1.77 | ) | | | 5.81 | | | | 4.93 | | | | 1.33 | | | | 0.98 | | | | 6.29 | |
| | | | | | | |
| | Total from investment operations | | | (1.73 | ) | | | 5.80 | | | | 4.93 | | | | 1.33 | | | | 0.96 | | | | 6.25 | |
| | | | | | | |
| | Distributions to shareholders from net investment income | | | — | | | | — | | | | — | | | | — | | | | — | | | | (0.05 | ) |
| | | | | | | |
| | Distributions to shareholder from net realized gains | | | (9.33 | ) | | | (2.47 | ) | | | (0.33 | ) | | | (2.05 | ) | | | (4.37 | ) | | | (6.29 | ) |
| | | | | | | |
| | Total distributions | | | (9.33 | ) | | | (2.47 | ) | | | (0.33 | ) | | | (2.05 | ) | | | (4.37 | ) | | | (6.34 | ) |
| | | | | | | |
| | Net asset value, end of period | | $ | 20.27 | | | $ | 31.33 | | | $ | 28.00 | | | $ | 23.40 | | | $ | 24.12 | | | $ | 27.53 | |
| | | | | | | |
| | Total return(c) | | | (3.39 | )% | | | 21.91 | % | | | 21.36 | % | | | 5.66 | % | | | 3.23 | % | | | 25.39 | % |
| | | | | | | |
| | Net assets, end of period (000s) | | $ | 1,694 | | | $ | 1,802 | | | $ | 1,437 | | | $ | 1,561 | | | $ | 1,917 | | | $ | 1,135 | |
| | | | | | | |
| | Ratio of net expenses to average net assets | | | 1.25 | %(d) | | | 1.25 | % | | | 1.25 | % | | | 1.25 | % | | | 1.25 | % | | | 1.26 | % |
| | | | | | | |
| | Ratio of total expenses to average net assets | | | 1.32 | %(d) | | | 1.41 | % | | | 1.61 | % | | | 1.61 | % | | | 1.60 | % | | | 1.61 | % |
| | | | | | | |
| | Ratio of net investment income (loss) to average net assets | | | 0.30 | %(d) | | | (0.04 | )% | | | 0.02 | % | | | 0.01 | % | | | (0.08 | )% | | | (0.15 | )% |
| | | | | | | |
| | Portfolio turnover rate(e) | | | 29 | % | | | 93 | % | | | 48 | % | | | 45 | % | | | 55 | % | | | 75 | % |
| | (a) | | Calculated based on the average shares outstanding methodology. |
| | (b) | | Amount is less than $0.005 per share. |
| | (c) | | Assumes investment at the NAV at the beginning of the period, reinvestment of all dividends and distributions, a complete redemption of the investment at the NAV at the end of the period and no sales or redemption charges. Total returns would be reduced if a sales or redemption charge was taken into account. Returns do not reflect the impact of taxes to shareholder relating to Fund distributions or the redemption of Fund shares. Total returns for periods less than one full year are not annualized. |
| | (e) | | The Fund’s portfolio turnover rate is calculated in accordance with regulatory requirements, without regard to transactions involving short term investments. If such transactions were included, the Fund’s portfolio turnover rate may be higher. |
| | |
| The accompanying notes are an integral part of these financial statements. | | 93 |
GOLDMAN SACHS CAPITAL GROWTH FUND
Financial Highlights(continued)
Selected Share Data for a Share Outstanding Throughout Each Period
| | | | | | | | | | | | | | | | | | | | | | | | | | |
| | | | | Goldman Sachs Capital Growth Fund
| |
| | | | | Investor Shares | |
| | | | | Six Months Ended
February 28, 2019
(Unaudited) | | | Year Ended August 31, | |
| | | | | 2018 | | | 2017 | | | 2016 | | | 2015 | | | 2014 | |
| | Per Share Data | | | | | | | | | | | | | | | | | | | | | | | | |
| | | | | | | |
| | Net asset value, beginning of period | | $ | 32.94 | | | $ | 29.31 | | | $ | 24.48 | | | $ | 25.07 | | | $ | 28.36 | | | $ | 28.28 | |
| | | | | | | |
| | Net investment income(a) | | | 0.08 | | | | 0.09 | | | | 0.11 | | | | 0.08 | | | | 0.07 | | | | 0.06 | |
| | | | | | | |
| | Net realized and unrealized gain (loss) | | | (1.83 | ) | | | 6.11 | | | | 5.13 | | | | 1.40 | | | | 1.01 | | | | 6.44 | |
| | | | | | | |
| | Total from investment operations | | | (1.75 | ) | | | 6.20 | | | | 5.24 | | | | 1.48 | | | | 1.08 | | | | 6.50 | |
| | | | | | | |
| | Distributions to shareholders from net investment income | | | (0.05 | ) | | | (0.10 | ) | | | (0.08 | ) | | | (0.02 | ) | | | — | | | | (0.13 | ) |
| | | | | | | |
| | Distributions to shareholders from net realized gains | | | (9.33 | ) | | | (2.47 | ) | | | (0.33 | ) | | | (2.05 | ) | | | (4.37 | ) | | | (6.29 | ) |
| | | | | | | |
| | Total distributions | | | (9.38 | ) | | | (2.57 | ) | | | (0.41 | ) | | | (2.07 | ) | | | (4.37 | ) | | | (6.42 | ) |
| | | | | | | |
| | Net asset value, end of period | | $ | 21.81 | | | $ | 32.94 | | | $ | 29.31 | | | $ | 24.48 | | | $ | 25.07 | | | $ | 28.36 | |
| | | | | | | |
| | Total return(b) | | | (3.22 | )% | | | 22.35 | % | | | 21.77 | % | | | 6.05 | % | | | 3.59 | % | | | 25.80 | % |
| | | | | | | |
| | Net assets, end of period (000s) | | $ | 7,966 | | | $ | 9,259 | | | $ | 8,496 | | | $ | 4,297 | | | $ | 3,823 | | | $ | 2,951 | |
| | | | | | | |
| | Ratio of net expenses to average net assets | | | 0.89 | %(c) | | | 0.89 | % | | | 0.90 | % | | | 0.90 | % | | | 0.90 | % | | | 0.91 | % |
| | | | | | | |
| | Ratio of total expenses to average net assets | | | 0.96 | %(c) | | | 1.06 | % | | | 1.26 | % | | | 1.26 | % | | | 1.24 | % | | | 1.26 | % |
| | | | | | | |
| | Ratio of net investment loss to average net assets | | | 0.65 | %(c) | | | 0.31 | % | | | 0.43 | % | | | 0.35 | % | | | 0.28 | % | | | 0.20 | % |
| | | | | | | |
| | Portfolio turnover rate(d) | | | 29 | % | | | 93 | % | | | 48 | % | | | 45 | % | | | 55 | % | | | 75 | % |
| | (a) | | Calculated based on the average shares outstanding methodology. |
| | (b) | | Assumes investment at the NAV at the beginning of the period, reinvestment of all dividends and distributions, a complete redemption of the investment at the NAV at the end of the period and no sales or redemption charges. Total returns would be reduced if a sales or redemption charge was taken into account. Returns do not reflect the impact of taxes to shareholder relating to Fund distributions or the redemption of Fund shares. Total returns for periods less than one full year are not annualized. |
| | (d) | | The Fund’s portfolio turnover rate is calculated in accordance with regulatory requirements, without regard to transactions involving short term investments. If such transactions were included, the Fund’s portfolio turnover rate may be higher. |
| | |
| 94 | | The accompanying notes are an integral part of these financial statements. |
GOLDMAN SACHS CAPITAL GROWTH FUND
Financial Highlights(continued)
Selected Share Data for a Share Outstanding Throughout Each Period
| | | | | | | | | | |
| | | | | Goldman Sachs Capital Growth Fund
| |
| | | | | Class P | |
| | | | | Six Months Ended
February 28, 2019
(Unaudited) | | | Period Ended
August 31, 2018(a) | |
| | Per Share Data | | | | | | | | |
| | | |
| | Net asset value, beginning of period | | $ | 35.74 | | | $ | 33.39 | |
| | | |
| | Net investment income(b) | | | 0.11 | | | | 0.09 | |
| | | |
| | Net realized and unrealized gain/ (loss) | | | (1.93 | ) | | | 2.26 | |
| | | |
| | Total from investment operations | | | (1.82 | ) | | | 2.35 | |
| | | |
| | Distributions to shareholders from net investment income | | | (0.09 | ) | | | — | |
| | | |
| | Distributions to shareholders from net realized gains | | | (9.33 | ) | | | — | |
| | | |
| | Total Distributions | | | (9.42 | ) | | | — | |
| | | |
| | Net asset value, end of period | | $ | 24.50 | | | $ | 35.74 | |
| | | |
| | Total return(c) | | | (3.14 | )% | | | 7.04 | % |
| | | |
| | Net assets, end of period (in 000s) | | $ | 80,498 | | | $ | 104,131 | |
| | | |
| | Ratio of net expenses to average net assets(d) | | | 0.74 | % | | | 0.74 | % |
| | | |
| | Ratio of total expenses to average net assets(d) | | | 0.81 | % | | | 0.85 | % |
| | | |
| | Ratio of net investment income to average net assets(d) | | | 0.79 | % | | | 0.72 | % |
| | | |
| | Portfolio turnover rate(e) | | | 29 | % | | | 93 | % |
| | (a) | | Commenced operations April 7, 2018. |
| | (b) | | Calculated based on the average shares outstanding methodology. |
| | (c) | | Assumes investment at the NAV at the beginning of the period, reinvestment of all dividends and distributions, a complete redemption of the investment at the NAV at the end of the period and no sales or redemption charges. Total returns would be reduced if a sales or redemption charge was taken into account. Returns do not reflect the impact of taxes to shareholder relating to Fund distributions or the redemption of Fund shares. Total returns for periods less than one full year are not annualized. |
| | (e) | | The Fund’s portfolio turnover rate is calculated in accordance with regulatory requirements, without regard to transactions involving short term investments. If such transactions were included, the Fund’s portfolio turnover rate may be higher. |
| | |
| The accompanying notes are an integral part of these financial statements. | | 95 |
GOLDMAN SACHS CAPITAL GROWTH FUND
Financial Highlights(continued)
Selected Share Data for a Share Outstanding Throughout Each Period
| | | | | | | | | | | | | | | | | | | | | | | | | | |
| | | | | Goldman Sachs Capital Growth Fund
| |
| | | | | Class R Shares | |
| | | | | Six Months Ended
February 28, 2019
(Unaudited) | | | Year Ended August 31, | |
| | | | | 2018 | | | 2017 | | | 2016 | | | 2015 | | | 2014 | |
| | Per Share Data | | | | | | | | | | | | | | | | | | | | | | | | |
| | | | | | | |
| | Net asset value, beginning of period | | $ | 31.26 | | | $ | 28.01 | | | $ | 23.44 | | | $ | 24.19 | | | $ | 27.64 | | | $ | 27.75 | |
| | | | | | | |
| | Net investment income (loss)(a) | | | 0.02 | | | | (0.06 | ) | | | (0.03 | ) | | | (0.03 | ) | | | (0.06 | ) | | | (0.08 | ) |
| | | | | | | |
| | Net realized and unrealized gain (loss) | | | (1.77 | ) | | | 5.81 | | | | 4.93 | | | | 1.33 | | | | 0.98 | | | | 6.31 | |
| | | | | | | |
| | Total from investment operations | | | (1.75 | ) | | | 5.75 | | | | 4.90 | | | | 1.30 | | | | 0.92 | | | | 6.23 | |
| | | | | | | |
| | Distributions to shareholders from net investment income | | | — | | | | (0.03 | ) | | | — | | | | — | | | | — | | | | (0.05 | ) |
| | | | | | | |
| | Distributions to shareholders from net realized gains | | | (9.33 | ) | | | (2.47 | ) | | | (0.33 | ) | | | (2.05 | ) | | | (4.37 | ) | | | (6.29 | ) |
| | | | | | | |
| | Total distributions | | | (9.33 | ) | | | (2.50 | ) | | | (0.33 | ) | | | (2.05 | ) | | | (4.37 | ) | | | (6.34 | ) |
| | | | | | | |
| | Net asset value, end of period | | $ | 20.18 | | | $ | 31.26 | | | $ | 28.01 | | | $ | 23.44 | | | $ | 24.19 | | | $ | 27.64 | |
| | | | | | | |
| | Total return(b) | | | (3.46 | )% | | | 21.73 | % | | | 21.19 | % | | | 5.51 | % | | | 3.05 | % | | | 25.18 | % |
| | | | | | | |
| | Net assets, end of period (000s) | | $ | 8,171 | | | $ | 8,887 | | | $ | 8,093 | | | $ | 3,450 | | | $ | 3,500 | | | $ | 3,571 | |
| | | | | | | |
| | Ratio of net expenses to average net assets | | | 1.39 | %(c) | | | 1.39 | % | | | 1.40 | % | | | 1.40 | % | | | 1.40 | % | | | 1.41 | % |
| | | | | | | |
| | Ratio of total expenses to average net assets | | | 1.46 | %(c) | | | 1.56 | % | | | 1.77 | % | | | 1.76 | % | | | 1.74 | % | | | 1.76 | % |
| | | | | | | |
| | Ratio of net investment income (loss) to average net assets | | | 0.16 | %(c) | | | (0.20 | )% | | | (0.10 | )% | | | (0.15 | )% | | | (0.21 | )% | | | (0.30 | )% |
| | | | | | | |
| | Portfolio turnover rate(d) | | | 29 | % | | | 93 | % | | | 48 | % | | | 45 | % | | | 55 | % | | | 75 | % |
| | (a) | | Calculated based on the average shares outstanding methodology. |
| | (b) | | Assumes investment at the NAV at the beginning of the period, reinvestment of all dividends and distributions, a complete redemption of the investment at the NAV at the end of the period and no sales or redemption charges. Total returns would be reduced if a sales or redemption charge was taken into account. Returns do not reflect the impact of taxes to shareholder relating to Fund distributions or the redemption of Fund shares. Total returns for periods less than one full year are not annualized. |
| | (d) | | The Fund’s portfolio turnover rate is calculated in accordance with regulatory requirements, without regard to transactions involving short term investments. If such transactions were included, the Fund’s portfolio turnover rate may be higher. |
| | |
| 96 | | The accompanying notes are an integral part of these financial statements. |
GOLDMAN SACHS CAPITAL GROWTH FUND
Financial Highlights(continued)
Selected Share Data for a Share Outstanding Throughout Each Period
| | | | | | | | | | | | | | | | | | | | | | |
| | | | | Goldman Sachs Capital Growth Fund
| |
| | | | | Class R6 Shares | |
| | | | | Six Months Ended
February 28, 2019
(Unaudited) | | | Year Ended August 31, | |
| | | | | 2018 | | | 2017 | | | 2016 | | | 2015(a) | |
| | Per Share Data | | | | | | | | | | | | | | | | | | | | |
| | | | | | |
| | Net asset value, beginning of period | | $ | 35.75 | | | $ | 31.60 | | | $ | 26.34 | | | $ | 26.82 | | | $ | 28.86 | |
| | | | | | |
| | Net investment income(b) | | | 0.13 | | | | 0.20 | | | | 0.16 | | | | 0.13 | | | | 0.01 | |
| | | | | | |
| | Net realized and unrealized gain (loss) | | | (1.95 | ) | | | 6.55 | | | | 5.55 | | | | 1.49 | | | | (2.05 | ) |
| | | | | | |
| | Total from investment operations | | | (1.82 | ) | | | 6.75 | | | | 5.71 | | | | 1.62 | | | | (2.04 | ) |
| | | | | | |
| | Distributions to shareholders from net investment income | | | (0.09 | ) | | | (0.13 | ) | | | (0.12 | ) | | | (0.05 | ) | | | — | |
| | | | | | |
| | Distributions to shareholders from net realized gains | | | (9.33 | ) | | | (2.47 | ) | | | (0.33 | ) | | | (2.05 | ) | | | — | |
| | | | | | |
| | Total distributions | | | (9.42 | ) | | | (2.60 | ) | | | (0.45 | ) | | | (2.10 | ) | | | — | |
| | | | | | |
| | Net asset value, end of period | | $ | 24.51 | | | $ | 35.75 | | | $ | 31.60 | | | $ | 26.34 | | | $ | 26.82 | |
| | | | | | |
| | Total return(c) | | | (3.15 | )% | | | 22.53 | % | | | 21.99 | % | | | 6.19 | % | | | (7.07 | )% |
| | | | | | |
| | Net assets, end of period (000s) | | $ | 3,945 | | | $ | 60 | | | $ | 16 | | | $ | 10 | | | $ | 9 | |
| | | | | | |
| | Ratio of net expenses to average net assets | | | 0.74 | %(d) | | | 0.74 | % | | | 0.75 | % | | | 0.74 | % | | | 0.76 | %(d) |
| | | | | | |
| | Ratio of total expenses to average net assets | | | 0.80 | %(d) | | | 0.90 | % | | | 1.10 | % | | | 1.09 | % | | | 1.11 | %(d) |
| | | | | | |
| | Ratio of net investment income to average net assets | | | 1.10 | %(d) | | | 0.60 | % | | | 0.56 | % | | | 0.52 | % | | | 0.54 | %(d) |
| | | | | | |
| | Portfolio turnover rate(e) | | | 29 | % | | | 93 | % | | | 48 | % | | | 45 | % | | | 55 | % |
| | (a) | | Commenced operations on July 31, 2015. |
| | (b) | | Calculated based on the average shares outstanding methodology. |
| | (c) | | Assumes investment at the NAV at the beginning of the period, reinvestment of all dividends and distributions, a complete redemption of the investment at the NAV at the end of the period and no sales or redemption charges. Total returns would be reduced if a sales or redemption charge was taken into account. Returns do not reflect the impact of taxes to shareholder relating to Fund distributions or the redemption of Fund shares. Total returns for periods less than one full year are not annualized. |
| | (e) | | The Fund’s portfolio turnover rate is calculated in accordance with regulatory requirements, without regard to transactions involving short term investments. If such transactions were included, the Fund’s portfolio turnover rate may be higher. |
| | |
| The accompanying notes are an integral part of these financial statements. | | 97 |
GOLDMAN SACHS CONCENTRATED GROWTH FUND
Financial Highlights(continued)
Selected Share Data for a Share Outstanding Throughout Each Period
| | | | | | | | | | | | | | | | | | | | | | | | | | |
| | | | | Goldman Sachs Concentrated Growth Fund
| |
| | | | | Class A Shares | |
| | | | | Six Months Ended
February 28, 2019
(Unaudited) | | | Year Ended August 31, | |
| | | | | 2018 | | | 2017 | | | 2016 | | | 2015 | | | 2014 | |
| | Per Share Data | | | | | | | | | | | | | | | | | | | | | | | | |
| | | | | | | |
| | Net asset value, beginning of period | | $ | 19.33 | | | $ | 17.62 | | | $ | 15.06 | | | $ | 16.06 | | | $ | 18.94 | | | $ | 17.05 | |
| | | | | | | |
| | Net investment income (loss)(a) | | | (0.02 | ) | | | (0.01 | ) | | | 0.02 | | | | — | (b) | | | — | (c)(d) | | | (0.06 | ) |
| | | | | | | |
| | Net realized and unrealized gain (loss) | | | (0.96 | ) | | | 3.82 | | | | 2.64 | | | | 0.81 | | | | 0.55 | | | | 3.78 | |
| | | | | | | |
| | Total from investment operations | | | (0.98 | ) | | | 3.81 | | | | 2.66 | | | | 0.81 | | | | 0.55 | | | | 3.72 | |
| | | | | | | |
| | Distributions to shareholders from net investment income | | | — | | | | — | (d) | | | (0.03 | ) | | | — | | | | — | | | | — | |
| | | | | | | |
| | Distributions to shareholders from net realized gains | | | (2.10 | ) | | | (2.10 | ) | | | (0.07 | ) | | | (1.81 | ) | | | (3.43 | ) | | | (1.83 | ) |
| | | | | | | |
| | Total distributions | | | (2.10 | ) | | | (2.10 | ) | | | (0.10 | ) | | | (1.81 | ) | | | (3.43 | ) | | | (1.83 | ) |
| | | | | | | |
| | Net asset value, end of period | | $ | 16.25 | | | $ | 19.33 | | | $ | 17.62 | | | $ | 15.06 | | | $ | 16.06 | | | $ | 18.94 | |
| | | | | | | |
| | Total return(e) | | | (4.10 | )% | | | 23.68 | % | | | 17.75 | % | | | 5.10 | % | | | 2.54 | % | | | 22.88 | % |
| | | | | | | |
| | Net assets, end of period (in 000s) | | $ | 5,964 | | | $ | 5,633 | | | $ | 5,462 | | | $ | 6,573 | | | $ | 7,350 | | | $ | 7,564 | |
| | | | | | | |
| | Ratio of net expenses to average net assets | | | 1.16 | %(f) | | | 1.17 | % | | | 1.20 | % | | | 1.22 | % | | | 1.24 | % | | | 1.27 | % |
| | | | | | | |
| | Ratio of total expenses to average net assets | | | 1.50 | %(f) | | | 1.51 | % | | | 1.65 | % | | | 1.63 | % | | | 1.60 | % | | | 1.60 | % |
| | | | | | | |
| | Ratio of net investment income (loss) to average net assets | | | (0.21 | )%(f) | | | (0.05 | )% | | | 0.11 | % | | | 0.03 | %(b) | | | 0.02 | %(c) | | | (0.32 | )% |
| | | | | | | |
| | Portfolio turnover rate(g) | | | 19 | % | | | 44 | % | | | 54 | %(h) | | | 55 | % | | | 47 | % | | | 60 | % |
| | (a) | | Calculated based on the average shares outstanding methodology. |
| | (b) | | Reflects income recognized from a special dividend which amounted to $0.03 per share and 0.19% of average net assets. |
| | (c) | | Reflects income recognized from a special dividend which amounted to $0.05 per share and 0.30% of average net assets. |
| | (d) | | Amount is less than $0.005 per share. |
| | (e) | | Assumes investment at the NAV at the beginning of the period, reinvestment of all dividends and distributions, a complete redemption of the investment at the NAV at the end of the period and no sales or redemption charges. Total returns would be reduced if a sales or redemption charge was taken into account. Returns do not reflect the impact of taxes to shareholder relating to Fund distributions or the redemption of Fund shares. Total returns for periods less than one full year are not annualized. |
| | (g) | | The Fund’s portfolio turnover rate is calculated in accordance with regulatory requirements, without regard to transactions involving short term investments. If such transactions were included, the Fund’s portfolio turnover rate may be higher. |
| | (h) | | On July 28, 2017, Goldman Sachs Concentrated Growth Fund acquired all of the net assets of Goldman Sachs Focused Growth Fund pursuant to an Agreement and Plan of Reorganization. Portfolio turnover excludes purchases and sales of securities by Goldman Sachs Focused Growth Fund (acquired fund) prior to the merger date. |
| | |
| 98 | | The accompanying notes are an integral part of these financial statements. |
GOLDMAN SACHS CONCENTRATED GROWTH FUND
Financial Highlights(continued)
Selected Share Data for a Share Outstanding Throughout Each Period
| | | | | | | | | | | | | | | | | | | | | | | | | | |
| | | | | Goldman Sachs Concentrated Growth Fund
| |
| | | | | Class C Shares | |
| | | | | Six Months Ended
February 28, 2019
(Unaudited) | | | Year Ended August 31, | |
| | | | | 2018 | | | 2017 | | | 2016 | | | 2015 | | | 2014 | |
| | Per Share Data | | | | | | | | | | | | | | | | | | | | | | | | |
| | | | | | | |
| | Net asset value, beginning of period | | $ | 15.88 | | | $ | 14.93 | | | $ | 12.84 | | | $ | 14.05 | | | $ | 17.09 | | | $ | 15.65 | |
| | | | | | | |
| | Net investment loss(a) | | | (0.07 | ) | | | (0.12 | ) | | | (0.08 | ) | | | (0.09 | )(b) | | | (0.11 | )(c) | | | (0.17 | ) |
| | | | | | | |
| | Net realized and unrealized gain (loss) | | | (0.81 | ) | | | 3.17 | | | | 2.24 | | | | 0.69 | | | | 0.50 | | | | 3.44 | |
| | | | | | | |
| | Total from investment operations | | | (0.88 | ) | | | 3.05 | | | | 2.16 | | | | 0.60 | | | | 0.39 | | | | 3.27 | |
| | | | | | | |
| | Distributions to shareholder from net realized gains | | | (2.10 | ) | | | (2.10 | ) | | | (0.07 | ) | | | (1.81 | ) | | | (3.43 | ) | | | (1.83 | ) |
| | | | | | | |
| | Net asset value, end of period | | $ | 12.90 | | | $ | 15.88 | | | $ | 14.93 | | | $ | 12.84 | | | $ | 14.05 | | | $ | 17.09 | |
| | | | | | | |
| | Total return(d) | | | (4.38 | )% | | | 22.74 | % | | | 16.88 | % | | | 4.27 | % | | | 1.78 | % | | | 21.98 | % |
| | | | | | | |
| | Net assets, end of period (000s) | | $ | 1,023 | | | $ | 2,137 | | | $ | 2,210 | | | $ | 2,192 | | | $ | 3,604 | | | $ | 3,460 | |
| | | | | | | |
| | Ratio of net expenses to average net assets | | | 1.91 | %(e) | | | 1.92 | % | | | 1.95 | % | | | 1.98 | % | | | 1.99 | % | | | 2.02 | % |
| | | | | | | |
| | Ratio of total expenses to average net assets | | | 2.25 | %(e) | | | 2.26 | % | | | 2.40 | % | | | 2.38 | % | | | 2.35 | % | | | 2.35 | % |
| | | | | | | |
| | Ratio of net investment loss to average net assets | | | (1.03 | )%(e) | | | (0.80 | )% | | | (0.61 | )% | | | (0.71 | )%(b) | | | (0.74 | )%(c) | | | (1.06 | )% |
| | | | | | | |
| | Portfolio turnover rate(f) | | | 19 | % | | | 44 | % | | | 54 | %(g) | | | 55 | % | | | 47 | % | | | 60 | % |
| | (a) | | Calculated based on the average shares outstanding methodology. |
| | (b) | | Reflects income recognized from a special dividend which amounted to $0.03 per share and 0.19% of average net assets. |
| | (c) | | Reflects income recognized from a special dividend which amounted to $0.05 per share and 0.30% of average net assets. |
| | (d) | | Assumes investment at the NAV at the beginning of the period, reinvestment of all dividends and distributions, a complete redemption of the investment at the NAV at the end of the period and no sales or redemption charges. Total returns would be reduced if a sales or redemption charge was taken into account. Returns do not reflect the impact of taxes to shareholder relating to Fund distributions or the redemption of Fund shares. Total returns for periods less than one full year are not annualized. |
| | (f) | | The Fund’s portfolio turnover rate is calculated in accordance with regulatory requirements, without regard to transactions involving short term investments. If such transactions were included, the Fund’s portfolio turnover rate may be higher. |
| | (g) | | On July 28, 2017, Goldman Sachs Concentrated Growth Fund acquired all of the net assets of Goldman Sachs Focused Growth Fund pursuant to an Agreement and Plan of Reorganization. Portfolio turnover excludes purchases and sales of securities by Goldman Sachs Focused Growth Fund (acquired fund) prior to the merger date. |
| | |
| The accompanying notes are an integral part of these financial statements. | | 99 |
GOLDMAN SACHS CONCENTRATED GROWTH FUND
Financial Highlights(continued)
Selected Share Data for a Share Outstanding Throughout Each Period
| | | | | | | | | | | | | | | | | | | | | | | | | | |
| | | | | Goldman Sachs Concentrated Growth Fund
| |
| | | | | Institutional Shares | |
| | | | | Six Months Ended
February 28, 2019
(Unaudited) | | | Year Ended August 31, | |
| | | | | 2018 | | | 2017 | | | 2016 | | | 2015 | | | 2014 | |
| | Per Share Data | | | | | | | | | | | | | | | | | | | | | | | | |
| | | | | | | |
| | Net asset value, beginning of period | | $ | 20.61 | | | $ | 18.65 | | | $ | 15.94 | | | $ | 16.88 | | | $ | 19.71 | | | $ | 17.63 | |
| | | | | | | |
| | Net investment income(a) | | | 0.01 | | | | 0.06 | | | | 0.09 | | | | 0.07 | (b) | | | 0.08 | (c) | | | 0.02 | |
| | | | | | | |
| | Net realized and unrealized gain (loss) | | | (1.00 | ) | | | 4.07 | | | | 2.78 | | | | 0.84 | | | | 0.57 | | | | 3.92 | |
| | | | | | | |
| | Total from investment operations | | | (0.99 | ) | | | 4.13 | | | | 2.87 | | | | 0.91 | | | | 0.65 | | | | 3.94 | |
| | | | | | | |
| | Distributions to shareholders from net investment income | | | (0.02 | ) | | | (0.07 | ) | | | (0.09 | ) | | | (0.04 | ) | | | (0.05 | ) | | | (0.03 | ) |
| | | | | | | |
| | Distributions to shareholders from net realized gains | | | (2.10 | ) | | | (2.10 | ) | | | (0.07 | ) | | | (1.81 | ) | | | (3.43 | ) | | | (1.83 | ) |
| | | | | | | |
| | Total distributions | | | (2.12 | ) | | | (2.17 | ) | | | (0.16 | ) | | | (1.85 | ) | | | (3.48 | ) | | | (1.86 | ) |
| | | | | | | |
| | Net asset value, end of period | | $ | 17.50 | | | $ | 20.61 | | | $ | 18.65 | | | $ | 15.94 | | | $ | 16.88 | | | $ | 19.71 | |
| | | | | | | |
| | Total return(d) | | | (3.87 | )% | | | 24.13 | % | | | 18.22 | % | | | 5.47 | % | | | 2.97 | % | | | 23.44 | % |
| | | | | | | |
| | Net assets, end of period (000s) | | $ | 12,168 | | | $ | 15,286 | | | $ | 142,623 | | | $ | 134,818 | | | $ | 155,652 | | | $ | 169,387 | |
| | | | | | | |
| | Ratio of net expenses to average net assets | | | 0.80 | %(e) | | | 0.81 | % | | | 0.82 | % | | | 0.82 | % | | | 0.84 | % | | | 0.87 | % |
| | | | | | | |
| | Ratio of total expenses to average net assets | | | 1.11 | %(e) | | | 1.20 | % | | | 1.26 | % | | | 1.23 | % | | | 1.20 | % | | | 1.20 | % |
| | | | | | | |
| | Ratio of net investment income to average net assets | | | 0.13 | %(e) | | | 0.31 | % | | | 0.51 | % | | | 0.43 | %(b) | | | 0.42 | %(c) | | | 0.09 | % |
| | | | | | | |
| | Portfolio turnover rate(f) | | | 19 | % | | | 44 | % | | | 54 | %(g) | | | 55 | % | | | 47 | % | | | 60 | % |
| | (a) | | Calculated based on the average shares outstanding methodology. |
| | (b) | | Reflects income recognized from a special dividend which amounted to $0.03 per share and 0.19% of average net assets. |
| | (c) | | Reflects income recognized from a special dividend which amounted to $0.05 per share and 0.30% of average net assets. |
| | (d) | | Assumes investment at the NAV at the beginning of the period, reinvestment of all dividends and distributions, a complete redemption of the investment at the NAV at the end of the period and no sales or redemption charges. Total returns would be reduced if a sales or redemption charge was taken into account. Returns do not reflect the impact of taxes to shareholder relating to Fund distributions or the redemption of Fund shares. Total returns for periods less than one full year are not annualized. |
| | (f) | | The Fund’s portfolio turnover rate is calculated in accordance with regulatory requirements, without regard to transactions involving short term investments. If such transactions were included, the Fund’s portfolio turnover rate may be higher. |
| | (g) | | On July 28, 2017, Goldman Sachs Concentrated Growth Fund acquired all of the net assets of Goldman Sachs Focused Growth Fund pursuant to an Agreement and Plan of Reorganization. Portfolio turnover excludes purchases and sales of securities by Goldman Sachs Focused Growth Fund (acquired fund) prior to the merger date. |
| | |
| 100 | | The accompanying notes are an integral part of these financial statements. |
GOLDMAN SACHS CONCENTRATED GROWTH FUND
Financial Highlights(continued)
Selected Share Data for a Share Outstanding Throughout Each Period
| | | | | | | | | | | | | | | | | | | | | | | | | | |
| | | | | Goldman Sachs Concentrated Growth Fund
| |
| | | | | Investor Shares | |
| | | | | Six Months Ended
February 28, 2019
(Unaudited) | | | Year Ended August 31, | |
| | | | | 2018 | | | 2017 | | | 2016 | | | 2015 | | | 2014 | |
| | Per Share Data | | | | | | | | | | | | | | | | | | | | | | | | |
| | | | | | | |
| | Net asset value, beginning of period | | $ | 19.66 | | | $ | 17.88 | | | $ | 15.28 | | | $ | 16.26 | | | $ | 19.10 | | | $ | 17.15 | |
| | | | | | | |
| | Net investment income (loss)(a) | | | — | (b) | | | 0.03 | | | | 0.07 | | | | 0.04 | (c) | | | 0.05 | (d) | | | (0.01 | ) |
| | | | | | | |
| | Net realized and unrealized gain (loss) | | | (0.97 | ) | | | 3.88 | | | | 2.67 | | | | 0.81 | | | | 0.56 | | | | 3.81 | |
| | | | | | | |
| | Total from investment operations | | | (0.97 | ) | | | 3.91 | | | | 2.74 | | | | 0.85 | | | | 0.61 | | | | 3.80 | |
| | | | | | | |
| | Distributions to shareholders from net investment income | | | (0.03 | ) | | | (0.03 | ) | | | (0.07 | ) | | | (0.02 | ) | | | (0.02 | ) | | | (0.02 | ) |
| | | | | | | |
| | Distributions to shareholders from net realized gains | | | (2.10 | ) | | | (2.10 | ) | | | (0.07 | ) | | | (1.81 | ) | | | (3.43 | ) | | | (1.83 | ) |
| | | | | | | |
| | Total distributions | | | (2.13 | ) | | | (2.13 | ) | | | (0.14 | ) | | | (1.83 | ) | | | (3.45 | ) | | | (1.85 | ) |
| | | | | | | |
| | Net asset value, end of period | | $ | 16.56 | | | $ | 19.66 | | | $ | 17.88 | | | $ | 15.28 | | | $ | 16.26 | | | $ | 19.10 | |
| | | | | | | |
| | Total return(e) | | | (3.95 | )% | | | 23.94 | % | | | 18.14 | % | | | 5.31 | % | | | 2.84 | % | | | 23.20 | % |
| | | | | | | |
| | Net assets, end of period (000s) | | $ | 224 | | | $ | 463 | | | $ | 780 | | | $ | 452 | | | $ | 342 | | | $ | 385 | |
| | | | | | | |
| | Ratio of net expenses to average net assets | | | 0.91 | %(f) | | | 0.92 | % | | | 0.95 | % | | | 0.97 | % | | | 0.99 | % | | | 1.02 | % |
| | | | | | | |
| | Ratio of total expenses to average net assets | | | 1.25 | %(f) | | | 1.26 | % | | | 1.41 | % | | | 1.38 | % | | | 1.35 | % | | | 1.35 | % |
| | | | | | | |
| | Ratio of net investment loss to average net assets | | | 0.02 | %(f) | | | 0.17 | % | | | 0.45 | % | | | 0.27 | %(c) | | | 0.29 | %(d) | | | (0.06 | )% |
| | | | | | | |
| | Portfolio turnover rate(g) | | | 19 | % | | | 44 | % | | | 54 | %(h) | | | 55 | % | | | 47 | % | | | 60 | % |
| | (a) | | Calculated based on the average shares outstanding methodology. |
| | (b) | | Rounds to less than $0.01 per share. |
| | (c) | | Reflects income recognized from a special dividend which amounted to $0.03 per share and 0.19% of average net assets. |
| | (d) | | Reflects income recognized from a special dividend which amounted to $0.05 per share and 0.30% of average net assets. |
| | (e) | | Assumes investment at the NAV at the beginning of the period, reinvestment of all dividends and distributions, a complete redemption of the investment at the NAV at the end of the period and no sales or redemption charges. Total returns would be reduced if a sales or redemption charge was taken into account. Returns do not reflect the impact of taxes to shareholder relating to Fund distributions or the redemption of Fund shares. Total returns for periods less than one full year are not annualized. |
| | (g) | | The Fund’s portfolio turnover rate is calculated in accordance with regulatory requirements, without regard to transactions involving short term investments. If such transactions were included, the Fund’s portfolio turnover rate may be higher. |
| | (h) | | On July 28, 2017, Goldman Sachs Concentrated Growth Fund acquired all of the net assets of Goldman Sachs Focused Growth Fund pursuant to an Agreement and Plan of Reorganization. Portfolio turnover excludes purchases and sales of securities by Goldman Sachs Focused Growth Fund (acquired fund) prior to the merger date. |
| | |
| The accompanying notes are an integral part of these financial statements. | | 101 |
GOLDMAN SACHS CONCENTRATED GROWTH FUND
Financial Highlights(continued)
Selected Share Data for a Share Outstanding Throughout Each Period
| | | | | | | | | | |
| | | | | Goldman Sachs Concentrated Growth Fund
| |
| | | | | Class P Shares | |
| | | | | Six Months Ended
February 28, 2019
(Unaudited) | | | Period Ended
August 31, 2018(a) | |
| | Per Share Data | | | | | | | | |
| | | |
| | Net asset value, beginning of period | | $ | 20.60 | | | $ | 18.54 | |
| | | |
| | Net investment income(b) | | | 0.01 | | | | 0.02 | |
| | | |
| | Net realized and unrealized gain (loss) | | | (1.01 | ) | | | 2.04 | |
| | | |
| | Total from investment operations | | | (1.00 | ) | | | 2.06 | |
| | | |
| | Distributions to shareholders from net investment income | | | (0.05 | ) | | | — | |
| | | |
| | Distributions to shareholders from net realized gains | | | (2.10 | ) | | | — | |
| | | |
| | Total distributions | | | (2.15 | ) | | | — | |
| | | |
| | Net asset value, end of period | | $ | 17.45 | | | $ | 20.60 | |
| | | |
| | Total return(c) | | | (3.87 | )% | | | 11.11 | % |
| | | |
| | Net assets, end of period (in 000s) | | $ | 121,452 | | | $ | 143,078 | |
| | | |
| | Ratio of net expenses to average net assets(d) | | | 0.79 | % | | | 0.79 | % |
| | | |
| | Ratio of total expenses to average net assets(d) | | | 1.10 | % | | | 0.72 | % |
| | | |
| | Ratio of net investment income to average net assets(d) | | | 0.15 | % | | | 0.32 | % |
| | | |
| | Portfolio turnover rate(e) | | | 19 | % | | | 44 | % |
| | (a) | | Commenced operations April 17, 2018. |
| | (b) | | Calculated based on the average shares outstanding methodology. |
| | (c) | | Assumes investment at the NAV at the beginning of the period, reinvestment of all dividends and distributions, a complete redemption of the investment at the NAV at the end of the period and no sales or redemption charges. Total returns would be reduced if a sales or redemption charge was taken into account. Returns do not reflect the impact of taxes to shareholder relating to Fund distributions or the redemption of Fund shares. Total returns for periods less than one full year are not annualized. |
| | (e) | | The Fund’s portfolio turnover rate is calculated in accordance with regulatory requirements, without regard to transactions involving short term investments. If such transactions were included, the Fund’s portfolio turnover rate may be higher. |
| | |
| 102 | | The accompanying notes are an integral part of these financial statements. |
GOLDMAN SACHS CONCENTRATED GROWTH FUND
Financial Highlights(continued)
Selected Share Data for a Share Outstanding Throughout Each Period
| | | | | | | | | | | | | | | | | | | | | | | | | | |
| | | | | Goldman Sachs Concentrated Growth Fund
| |
| | | | | Class R Shares | |
| | | | | Six Months Ended
February 28, 2019
(Unaudited) | | | Year Ended August 31, | |
| | | | | 2018 | | | 2017 | | | 2016 | | | 2015 | | | 2014 | |
| | Per Share Data | | | | | | | | | | | | | | | | | | | | | | | | |
| | | | | | | |
| | Net asset value, beginning of period | | $ | 18.68 | | | $ | 17.13 | | | $ | 14.65 | | | $ | 15.71 | | | $ | 18.64 | | | $ | 16.84 | |
| | | | | | | |
| | Net investment loss(a) | | | (0.04 | ) | | | (0.05 | ) | | | (0.02 | ) | | | (0.04 | )(b) | | | (0.05 | )(c) | | | (0.10 | ) |
| | | | | | | |
| | Net realized and unrealized gain (loss) | | | (0.93 | ) | | | 3.70 | | | | 2.57 | | | | 0.79 | | | | 0.55 | | | | 3.73 | |
| | | | | | | |
| | Total from investment operations | | | (0.97 | ) | | | 3.65 | | | | 2.55 | | | | 0.75 | | | | 0.50 | | | | 3.63 | |
| | | | | | | |
| | Distributions to shareholder from net realized gains | | | (2.10 | ) | | | (2.10 | ) | | | (0.07 | ) | | | (1.81 | ) | | | (3.43 | ) | | | (1.83 | ) |
| | | | | | | |
| | Net asset value, end of period | | $ | 15.61 | | | $ | 18.68 | | | $ | 17.13 | | | $ | 14.65 | | | $ | 15.71 | | | $ | 18.64 | |
| | | | | | | |
| | Total return(d) | | | (4.19 | )% | | | 23.37 | % | | | 17.46 | % | | | 4.81 | % | | | 2.28 | % | | | 22.61 | % |
| | | | | | | |
| | Net assets, end of period (000s) | | $ | 33 | | | $ | 34 | | | $ | 25 | | | $ | 22 | | | $ | 27 | | | $ | 14 | |
| | | | | | | |
| | Ratio of net expenses to average net assets | | | 1.41 | %(e) | | | 1.42 | % | | | 1.45 | % | | | 1.48 | % | | | 1.49 | % | | | 1.50 | % |
| | | | | | | |
| | Ratio of total expenses to average net assets | | | 1.75 | %(e) | | | 1.75 | % | | | 1.91 | % | | | 1.89 | % | | | 1.87 | % | | | 1.84 | % |
| | | | | | | |
| | Ratio of net investment loss to average net assets | | | (0.47 | )%(e) | | | (0.29 | )% | | | (0.14 | )% | | | (0.25 | )%(b) | | | (0.31 | )%(c) | | | (0.55 | )% |
| | | | | | | |
| | Portfolio turnover rate(f) | | | 19 | % | | | 44 | % | | | 54 | %(g) | | | 55 | % | | | 47 | % | | | 60 | % |
| | (a) | | Calculated based on the average shares outstanding methodology. |
| | (b) | | Reflects income recognized from a special dividend which amounted to $0.03 per share and 0.19% of average net assets. |
| | (c) | | Reflects income recognized from a special dividend which amounted to $0.05 per share and 0.30% of average net assets. |
| | (d) | | Assumes investment at the NAV at the beginning of the period, reinvestment of all dividends and distributions, a complete redemption of the investment at the NAV at the end of the period and no sales or redemption charges. Total returns would be reduced if a sales or redemption charge was taken into account. Returns do not reflect the impact of taxes to shareholder relating to Fund distributions or the redemption of Fund shares. Total returns for periods less than one full year are not annualized. |
| | (f) | | The Fund’s portfolio turnover rate is calculated in accordance with regulatory requirements, without regard to transactions involving short term investments. If such transactions were included, the Fund’s portfolio turnover rate may be higher. |
| | (g) | | On July 28, 2017, Goldman Sachs Concentrated Growth Fund acquired all of the net assets of Goldman Sachs Focused Growth Fund pursuant to an Agreement and Plan of Reorganization. Portfolio turnover excludes purchases and sales of securities by Goldman Sachs Focused Growth Fund (acquired fund) prior to the merger date. |
| | |
| The accompanying notes are an integral part of these financial statements. | | 103 |
GOLDMAN SACHS CONCENTRATED GROWTH FUND
Financial Highlights(continued)
Selected Share Data for a Share Outstanding Throughout Each Period
| | | | | | | | | | | | | | | | | | | | | | |
| | | | | Goldman Sachs Concentrated Growth Fund
| |
| | | | | Class R6 Shares | |
| | | | | Six Months Ended
February 28, 2019
(Unaudited) | | | Year Ended August 31, | | | Period Ended
August 31, 2015(a) | |
| | | | | 2018 | | | 2017 | | | 2016 | |
| | Per Share Data | | | | | | | | | | | | | | | | | | | | |
| | | | | | |
| | Net asset value, beginning of period | | $ | 20.60 | | | $ | 18.65 | | | $ | 15.95 | | | $ | 16.88 | | | $ | 18.04 | |
| | | | | | |
| | Net investment income(b) | | | 0.02 | | | | 0.06 | | | | 0.13 | | | | 0.07 | (c) | | | 0.01 | (d) |
| | | | | | |
| | Net realized and unrealized gain (loss) | | | (1.02 | ) | | | 4.06 | | | | 2.74 | | | | 0.85 | | | | (1.17 | ) |
| | | | | | |
| | Total from investment operations | | | (1.00 | ) | | | 4.12 | | | | 2.87 | | | | 0.92 | | | | (1.16 | ) |
| | | | | | |
| | Distributions to shareholders from net investment income | | | (0.05 | ) | | | (0.07 | ) | | | (0.10 | ) | | | (0.04 | ) | | | — | |
| | | | | | |
| | Distributions to shareholders from net realized gains | | | (2.10 | ) | | | (2.10 | ) | | | (0.07 | ) | | | (1.81 | ) | | | — | |
| | | | | | |
| | Total distributions | | | (2.15 | ) | | | (2.17 | ) | | | (0.17 | ) | | | (1.85 | ) | | | — | |
| | | | | | |
| | Net asset value, end of period | | $ | 17.45 | | | $ | 20.60 | | | $ | 18.65 | | | $ | 15.95 | | | $ | 16.88 | |
| | | | | | |
| | Total return(e) | | | (3.88 | )% | | | 24.09 | % | | | 18.17 | % | | | 5.56 | % | | | (6.43 | )% |
| | | | | | |
| | Net assets, end of period (000s) | | $ | 497 | | | $ | 99 | | | $ | 68 | | | $ | 10 | | | $ | 9 | |
| | | | | | |
| | Ratio of net expenses to average net assets | | | 0.79 | %(f) | | | 0.80 | % | | | 0.82 | % | | | 0.81 | % | | | 0.77 | %(f) |
| | | | | | |
| | Ratio of total expenses to average net assets | | | 1.10 | %(f) | | | 1.09 | % | | | 1.32 | % | | | 1.21 | % | | | 1.48 | %(f) |
| | | | | | |
| | Ratio of net investment income to average net assets | | | 0.24 | %(f) | | | 0.34 | % | | | 0.74 | % | | | 0.44 | %(c) | | | 0.46 | %(d)(f) |
| | | | | | |
| | Portfolio turnover rate(g) | | | 19 | % | | | 44 | % | | | 54 | %(h) | | | 55 | % | | | 47 | % |
| | (a) | | Commenced operations on July 31, 2015. |
| | (b) | | Calculated based on the average shares outstanding methodology. |
| | (c) | | Reflects income recognized from a special dividend which amounted to $0.03 per share and 0.19% of average net assets. |
| | (d) | | Reflects income recognized from a special dividend which amounted to $0.05 per share and 0.30% of average net assets. |
| | (e) | | Assumes investment at the NAV at the beginning of the period, reinvestment of all dividends and distributions, a complete redemption of the investment at the NAV at the end of the period and no sales or redemption charges. Total returns would be reduced if a sales or redemption charge was taken into account. Returns do not reflect the impact of taxes to shareholder relating to Fund distributions or the redemption of Fund shares. Total returns for periods less than one full year are not annualized. |
| | (g) | | The Fund’s portfolio turnover rate is calculated in accordance with regulatory requirements, without regard to transactions involving short term investments. If such transactions were included, the Fund’s portfolio turnover rate may be higher. |
| | (h) | | On July 28, 2017, Goldman Sachs Concentrated Growth Fund acquired all of the net assets of Goldman Sachs Focused Growth Fund pursuant to an Agreement and Plan of Reorganization. Portfolio turnover excludes purchases and sales of securities by Goldman Sachs Focused Growth Fund (acquired fund) prior to the merger date. |
| | |
| 104 | | The accompanying notes are an integral part of these financial statements. |
GOLDMAN SACHS FLEXIBLE CAP FUND
Financial Highlights(continued)
Selected Share Data for a Share Outstanding Throughout Each Period
| | | | | | | | | | | | | | | | | | | | | | | | | | |
| | | | | Goldman Sachs Flexible Cap Fund | |
| | | | | Class A Shares | |
| | | | | Six Months Ended
February 28, 2019
(Unaudited) | | | Year Ended August 31, | |
| | | | | 2018 | | | 2017 | | | 2016 | | | 2015 | | | 2014 | |
| | Per Share Data | | | | | | | | | | | | | | | | | | | | | | | | |
| | | | | | | |
| | Net asset value, beginning of period | | $ | 12.66 | | | $ | 14.09 | | | $ | 11.74 | | | $ | 11.90 | | | $ | 13.21 | | | $ | 11.83 | |
| | | | | | | |
| | Net investment income (loss)(a) | | | 0.05 | | | | 0.09 | | | | — | (b) | | | (0.02 | ) | | | (0.04 | )(c) | | | (0.05 | ) |
| | | | | | | |
| | Net realized and unrealized gain (loss) | | | (0.56 | ) | | | 2.17 | | | | 2.36 | | | | 0.59 | | | | 0.63 | | | | 3.01 | |
| | | | | | | |
| | Total from investment operations | | | (0.51 | ) | | | 2.26 | | | | 2.36 | | | | 0.57 | | | | 0.59 | | | | 2.96 | |
| | | | | | | |
| | Distributions to shareholders from net investment income | | | (0.10 | ) | | | (0.01 | ) | | | — | | | | — | | | | — | | | | — | |
| | | | | | | |
| | Distributions to shareholders from net realized gains | | | (0.87 | ) | | | (3.68 | ) | | | (0.01 | ) | | | (0.73 | ) | | | (1.90 | ) | | | (1.58 | ) |
| | | | | | | |
| | Total distributions | | | (0.97 | ) | | | (3.69 | ) | | | (0.01 | ) | | | (0.73 | ) | | | (1.90 | ) | | | (1.58 | ) |
| | | | | | | |
| | Net asset value, end of period | | $ | 11.18 | | | $ | 12.66 | | | $ | 14.09 | | | $ | 11.74 | | | $ | 11.90 | | | $ | 13.21 | |
| | | | | | | |
| | Total return(d) | | | (3.41 | )% | | | 18.82 | % | | | 20.14 | % | | | 4.93 | % | | | 4.59 | % | | | 26.62 | % |
| | | | | | | |
| | Net assets, end of period (in 000s) | | $ | 5,419 | | | $ | 5,490 | | | $ | 5,627 | | | $ | 5,927 | | | $ | 7,048 | | | $ | 5,665 | |
| | | | | | | |
| | Ratio of net expenses to average net assets | | | 0.96 | %(e) | | | 0.95 | % | | | 1.20 | % | | | 1.22 | % | | | 1.24 | % | | | 1.28 | % |
| | | | | | | |
| | Ratio of total expenses to average net assets | | | 2.68 | %(e) | | | 2.47 | % | | | 3.01 | % | | | 3.07 | % | | | 2.97 | % | | | 3.32 | % |
| | | | | | | |
| | Ratio of net investment income (loss) to average net assets | | | 0.80 | %(e) | | | 0.73 | % | | | (0.01 | )% | | | (0.21 | )% | | | (0.30 | )%(c) | | | (0.40 | )% |
| | | | | | | |
| | Portfolio turnover rate(f) | | | 23 | % | | | 157 | % | | | 47 | % | | | 46 | % | | | 41 | % | | | 56 | % |
| | (a) | | Calculated based on the average shares outstanding methodology. |
| | (b) | | Amount is less than $0.005 per share. |
| | (c) | | Reflects income recognized from special dividends which amounted to $0.02 per share and 0.13% of average net assets. |
| | (d) | | Assumes investment at the NAV at the beginning of the period, reinvestment of all dividends and distributions, a complete redemption of the investment at the NAV at the end of the period and no sales or redemption charges. Total returns would be reduced if a sales or redemption charge was taken into account. Returns do not reflect the impact of taxes to shareholder relating to Fund distributions or the redemption of Fund shares. Total returns for periods less than one full year are not annualized. |
| | (f) | | The Fund’s portfolio turnover rate is calculated in accordance with regulatory requirements, without regard to transactions involving short term investments. If such transactions were included, the Fund’s portfolio turnover rate may be higher. |
| | |
| The accompanying notes are an integral part of these financial statements. | | 105 |
GOLDMAN SACHS FLEXIBLE CAP FUND
Financial Highlights(continued)
Selected Share Data for a Share Outstanding Throughout Each Period
| | | | | | | | | | | | | | | | | | | | | | | | | | |
| | | | | Goldman Sachs Flexible Cap Fund | |
| | | | | Class C Shares | |
| | | | | Six Months Ended
February 28, 2019
(Unaudited) | | | Year Ended August 31, | |
| | | | | 2018 | | | 2017 | | | 2016 | | | 2015 | | | 2014 | |
| | Per Share Data | | | | | | | | | | | | | | | | | | | | | | | | |
| | | | | | | |
| | Net asset value, beginning of period | | $ | 11.00 | | | $ | 12.75 | | | $ | 10.71 | | | $ | 11.00 | | | $ | 12.43 | | | $ | 11.29 | |
| | | | | | | |
| | Net investment income (loss)(a) | | | — | (b) | | | — | (b) | | | (0.09 | ) | | | (0.10 | ) | | | (0.12 | )(c) | | | (0.14 | ) |
| | | | | | | |
| | Net realized and unrealized gain (loss) | | | (0.48 | ) | | | 1.93 | | | | 2.14 | | | | 0.54 | | | | 0.59 | | | | 2.86 | |
| | | | | | | |
| | Total from investment operations | | | (0.48 | ) | | | 1.93 | | | | 2.05 | | | | 0.44 | | | | 0.47 | | | | 2.72 | |
| | | | | | | |
| | Distributions to shareholders from net investment income | | | (0.03 | ) | | | — | | | | — | | | | — | | | | — | | | | — | |
| | | | | | | |
| | Distributions to shareholders from net realized gains | | | (0.87 | ) | | | (3.68 | ) | | | (0.01 | ) | | | (0.73 | ) | | | (1.90 | ) | | | (1.58 | ) |
| | | | | | | |
| | Total distributions | | | (0.90 | ) | | | (3.68 | ) | | | (0.01 | ) | | | (0.73 | ) | | | (1.90 | ) | | | (1.58 | ) |
| | | | | | | |
| | Net asset value, end of period | | $ | 9.62 | | | $ | 11.00 | | | $ | 12.75 | | | $ | 10.71 | | | $ | 11.00 | | | $ | 12.43 | |
| | | | | | | |
| | Total return(d) | | | (3.80 | )% | | | 18.00 | % | | | 19.18 | % | | | 4.12 | % | | | 3.83 | % | | | 25.68 | % |
| | | | | | | |
| | Net assets, end of period (in 000s) | | $ | 1,202 | | | $ | 1,304 | | | $ | 1,512 | | | $ | 1,474 | | | $ | 1,802 | | | $ | 1,119 | |
| | | | | | | |
| | Ratio of net expenses to average net assets | | | 1.71 | %(e) | | | 1.70 | % | | | 1.95 | % | | | 1.97 | % | | | 1.98 | % | | | 2.03 | % |
| | | | | | | |
| | Ratio of total expenses to average net assets | | | 3.43 | %(e) | | | 3.20 | % | | | 3.76 | % | | | 3.82 | % | | | 3.71 | % | | | 4.09 | % |
| | | | | | | |
| | Ratio of net investment income (loss) to average net assets | | | 0.05 | %(e) | | | (0.02 | )% | | | (0.75 | )% | | | (0.96 | )% | | | (1.04 | )%(c) | | | (1.15 | )% |
| | | | | | | |
| | Portfolio turnover rate(f) | | | 23 | % | | | 157 | % | | | 47 | % | | | 46 | % | | | 41 | % | | | 56 | % |
| | (a) | | Calculated based on the average shares outstanding methodology. |
| | (b) | | Amount is less than $0.005 per share. |
| | (c) | | Reflects income recognized from special dividends which amounted to $0.02 per share and 0.13% of average net assets. |
| | (d) | | Assumes investment at the NAV at the beginning of the period, reinvestment of all dividends and distributions, a complete redemption of the investment at the NAV at the end of the period and no sales or redemption charges. Total returns would be reduced if a sales or redemption charge was taken into account. Returns do not reflect the impact of taxes to shareholders relating to Fund distributions or the redemption of Fund shares. Total returns for periods less than one full year are not annualized. |
| | (f) | | The Fund’s portfolio turnover rate is calculated in accordance with regulatory requirements, without regard to transactions involving short term investments. If such transactions were included, the Fund’s portfolio turnover rate may be higher. |
| | |
| 106 | | The accompanying notes are an integral part of these financial statements. |
GOLDMAN SACHS FLEXIBLE CAP FUND
Financial Highlights(continued)
Selected Share Data for a Share Outstanding Throughout Each Period
| | | | | | | | | | | | | | | | | | | | | | | | | | |
| | | | | Goldman Sachs Flexible Cap Fund | |
| | | | | Institutional Shares | |
| | | | | Six Months Ended
February 28, 2019
(Unaudited) | | | Year Ended August 31, | |
| | | | | 2018 | | | 2017 | | | 2016 | | | 2015 | | | 2014 | |
| | Per Share Data | | | | | | | | | | | | | | | | | | | | | | | | |
| | | | | | | |
| | Net asset value, beginning of period | | $ | 13.61 | | | $ | 14.88 | | | $ | 12.35 | | | $ | 12.44 | | | $ | 13.68 | | | $ | 12.17 | |
| | | | | | | |
| | Net investment income(a) | | | 0.07 | | | | 0.14 | | | | 0.05 | | | | 0.02 | | | | 0.01 | (b) | | | — | (c) |
| | | | | | | |
| | Net realized and unrealized gain (loss) | | | (0.59 | ) | | | 2.33 | | | | 2.49 | | | | 0.62 | | | | 0.65 | | | | 3.11 | |
| | | | | | | |
| | Total from investment operations | | | (0.52 | ) | | | 2.47 | | | | 2.54 | | | | 0.64 | | | | 0.66 | | | | 3.11 | |
| | | | | | | |
| | Distributions to shareholders from net investment income | | | (0.12 | ) | | | (0.06 | ) | | | — | | | | — | | | | — | | | | (0.02 | ) |
| | | | | | | |
| | Distributions to shareholders from net realized gains | | | (0.87 | ) | | | (3.68 | ) | | | (0.01 | ) | | | (0.73 | ) | | | (1.90 | ) | | | (1.58 | ) |
| | | | | | | |
| | Total distributions | | | (0.99 | ) | | | (3.74 | ) | | | (0.01 | ) | | | (0.73 | ) | | | (1.90 | ) | | | (1.60 | ) |
| | | | | | | |
| | Net asset value, end of period | | $ | 12.10 | | | $ | 13.61 | | | $ | 14.88 | | | $ | 12.35 | | | $ | 12.44 | | | $ | 13.68 | |
| | | | | | | |
| | Total return(d) | | | (3.24 | )% | | | 19.29 | % | | | 20.61 | % | | | 5.29 | % | | | 4.99 | % | | | 27.21 | % |
| | | | | | | |
| | Net assets, end of period (in 000s) | | $ | 648 | | | $ | 1,633 | | | $ | 11,111 | | | $ | 9,330 | | | $ | 8,586 | | | $ | 8,262 | |
| | | | | | | |
| | Ratio of net expenses to average net assets | | | 0.59 | %(e) | | | 0.59 | % | | | 0.82 | % | | | 0.82 | % | | | 0.84 | % | | | 0.88 | % |
| | | | | | | |
| | Ratio of total expenses to average net assets | | | 2.28 | %(e) | | | 2.01 | % | | | 2.62 | % | | | 2.68 | % | | | 2.57 | % | | | 2.92 | % |
| | | | | | | |
| | Ratio of net investment income to average net assets | | | 1.07 | %(e) | | | 1.04 | % | | | 0.38 | % | | | 0.20 | % | | | 0.09 | %(b) | | | — | %(f) |
| | | | | | | |
| | Portfolio turnover rate(g) | | | 23 | % | | | 157 | % | | | 47 | % | | | 46 | % | | | 41 | % | | | 56 | % |
| | (a) | | Calculated based on the average shares outstanding methodology. |
| | (b) | | Reflects income recognized from special dividends which amounted to $0.02 per share and 0.13% of average net assets. |
| | (c) | | Amount is less than $0.005 per share. |
| | (d) | | Assumes investment at the NAV at the beginning of the period, reinvestment of all dividends and distributions, a complete redemption of the investment at the NAV at the end of the period and no sales or redemption charges. Total returns would be reduced if a sales or redemption charge was taken into account. Returns do not reflect the impact of taxes to shareholder relating to Fund distributions or the redemption of Fund shares. Total returns for periods less than one full year are not annualized. |
| | (f) | | Amount is less than 0.005% per share. |
| | (g) | | The Fund’s portfolio turnover rate is calculated in accordance with regulatory requirements, without regard to transactions involving short term investments. If such transactions were included, the Fund’s portfolio turnover rate may be higher. |
| | |
| The accompanying notes are an integral part of these financial statements. | | 107 |
GOLDMAN SACHS FLEXIBLE CAP FUND
Financial Highlights(continued)
Selected Share Data for a Share Outstanding Throughout Each Period
| | | | | | | | | | | | | | | | | | | | | | | | | | |
| | | | | Goldman Sachs Flexible Cap Fund | |
| | | | | Investor Shares | |
| | | | | Six Months Ended
February 28, 2019
(Unaudited) | | | Year Ended August 31, | |
| | | | | 2018 | | | 2017 | | | 2016 | | | 2015 | | | 2014 | |
| | Per Share Data | | | | | | | | | | | | | | | | | | | | | | | | |
| | | | | | | |
| | Net asset value, beginning of period | | $ | 13.35 | | | $ | 14.63 | | | $ | 12.16 | | | $ | 12.27 | | | $ | 13.53 | | | $ | 12.05 | |
| | | | | | | |
| | Net investment income (loss)(a) | | | 0.06 | | | | 0.12 | | | | 0.05 | | | | — | (b) | | | — | (b)(c) | | | (0.02 | ) |
| | | | | | | |
| | Net realized and unrealized gain (loss) | | | (0.57 | ) | | | 2.28 | | | | 2.43 | | | | 0.62 | | | | 0.64 | | | | 3.08 | |
| | | | | | | |
| | Total from investment operations | | | (0.51 | ) | | | 2.40 | | | | 2.48 | | | | 0.62 | | | | 0.64 | | | | 3.06 | |
| | | | | | | |
| | Distributions to shareholders from net investment income | | | (0.13 | ) | | | — | | | | — | | | | — | | | | — | | | | — | |
| | | | | | | |
| | Distributions to shareholders from net realized gains | | | (0.87 | ) | | | (3.68 | ) | | | (0.01 | ) | | | (0.73 | ) | | | (1.90 | ) | | | (1.58 | ) |
| | | | | | | |
| | Total distributions | | | (1.00 | ) | | | (3.68 | ) | | | (0.01 | ) | | | (0.73 | ) | | | (1.90 | ) | | | (1.58 | ) |
| | | | | | | |
| | Net asset value, end of period | | $ | 11.84 | | | $ | 13.35 | | | $ | 14.63 | | | $ | 12.16 | | | $ | 12.27 | | | $ | 13.53 | |
| | | | | | | |
| | Total return(d) | | | (3.22 | )% | | | 19.08 | % | | | 20.43 | % | | | 5.20 | % | | | 4.88 | % | | | 26.98 | % |
| | | | | | | |
| | Net assets, end of period (in 000s) | | $ | 65 | | | $ | 68 | | | $ | 379 | | | $ | 197 | | | $ | 253 | | | $ | 126 | |
| | | | | | | |
| | Ratio of net expenses to average net assets | | | 0.71 | %(e) | | | 0.70 | % | | | 0.95 | % | | | 0.97 | % | | | 0.98 | % | | | 1.03 | % |
| | | | | | | |
| | Ratio of total expenses to average net assets | | | 2.43 | %(e) | | | 2.08 | % | | | 2.83 | % | | | 2.76 | % | | | 2.66 | % | | | 3.04 | % |
| | | | | | | |
| | Ratio of net investment loss to average net assets | | | 1.05 | %(e) | | | 0.88 | % | | | 0.35 | % | | | 0.03 | % | | | (0.03 | )%(c) | | | (0.17 | )% |
| | | | | | | |
| | Portfolio turnover rate(f) | | | 23 | % | | | 157 | % | | | 47 | % | | | 46 | % | | | 41 | % | | | 56 | % |
| | (a) | | Calculated based on the average shares outstanding methodology. |
| | (b) | | Amount is less than $0.005 per share. |
| | (c) | | Reflects income recognized from special dividends which amounted to $0.02 per share and 0.13% of average net assets. |
| | (d) | | Assumes investment at the NAV at the beginning of the period, reinvestment of all dividends and distributions, a complete redemption of the investment at the NAV at the end of the period and no sales or redemption charges. Total returns would be reduced if a sales or redemption charge was taken into account. Returns do not reflect the impact of taxes to shareholder relating to Fund distributions or the redemption of Fund shares. Total returns for periods less than one full year are not annualized. |
| | (f) | | The Fund’s portfolio turnover rate is calculated in accordance with regulatory requirements, without regard to transactions involving short term investments. If such transactions were included, the Fund’s portfolio turnover rate may be higher. |
| | |
| 108 | | The accompanying notes are an integral part of these financial statements. |
GOLDMAN SACHS FLEXIBLE CAP FUND
Financial Highlights(continued)
Selected Share Data for a Share Outstanding Throughout Each Period
| | | | | | | | | | |
| | | | | Goldman Sachs Flexible Cap Fund | |
| | | | | Class P | |
| | | | | Six Months Ended
February 28, 2019
(Unaudited) | | | Period Ended
August 31, 2018(a) | |
| | Per Share Data | | | | | | | | |
| | | |
| | Net asset value, beginning of period | | $ | 13.61 | | | $ | 12.75 | |
| | | |
| | Net investment income(b) | | | 0.07 | | | | 0.09 | |
| | | |
| | Net realized and unrealized gain (loss) | | | (0.58 | ) | | | 0.77 | |
| | | |
| | Total from investment operations | | | (0.51 | ) | | | 0.86 | |
| | | |
| | Distributions to shareholders from net investment income | | | (0.15 | ) | | | — | |
| | | |
| | Distributions to shareholder from net realized gains | | | (0.87 | ) | | | — | |
| | | |
| | Total distributions | | | (1.02 | ) | | | — | |
| | | |
| | Net asset value, end of period | | $ | 12.08 | | | $ | 13.61 | |
| | | |
| | Total return(c) | | | (3.17 | )% | | | 6.75 | % |
| | | |
| | Net assets, end of period (in 000s) | | $ | 10,436 | | | $ | 12,616 | |
| | | |
| | Ratio of net expenses to average net assets(d) | | | 0.58 | % | | | 0.58 | % |
| | | |
| | Ratio of total expenses to average net assets(d) | | | 2.28 | % | | | 3.14 | % |
| | | |
| | Ratio of net investment income to average net assets(d) | | | 1.16 | % | | | 1.79 | % |
| | | |
| | Portfolio turnover rate(e) | | | 23 | % | | | 157 | % |
| | (a) | | Commenced operations on April 17, 2018. |
| | (b) | | Calculated based on the average shares outstanding methodology. |
| | (c) | | Assumes investment at the NAV at the beginning of the period, reinvestment of all dividends and distributions, a complete redemption of the investment at the NAV at the end of the period and no sales or redemption charges. Total returns would be reduced if a sales or redemption charge was taken into account. Returns do not reflect the impact of taxes to shareholder relating to Fund distributions or the redemption of Fund shares. Total returns for periods less than one full year are not annualized. |
| | (e) | | The Fund’s portfolio turnover rate is calculated in accordance with regulatory requirements, without regard to transactions involving short term investments. If such transactions were included, the Fund’s portfolio turnover rate may be higher. |
| | |
| The accompanying notes are an integral part of these financial statements. | | 109 |
GOLDMAN SACHS FLEXIBLE CAP FUND
Financial Highlights(continued)
Selected Share Data for a Share Outstanding Throughout Each Period
| | | | | | | | | | | | | | | | | | | | | | | | | | |
| | | | | Goldman Sachs Flexible Cap Fund | |
| | | | | Class R Shares | |
| | | | | Six Months Ended
February 28, 2019 (Unaudited) | | | Year Ended August 31, | |
| | | | | 2018 | | | 2017 | | | 2016 | | | 2015 | | | 2014 | |
| | Per Share Data | | | | | | | | | | | | | | | | | | | | | | | | |
| | | | | | | |
| | Net asset value, beginning of period | | $ | 12.14 | | | $ | 13.67 | | | $ | 11.42 | | | $ | 11.63 | | | $ | 12.97 | | | $ | 11.66 | |
| | | | | | | |
| | Net investment income (loss)(a) | | | 0.03 | | | | 0.06 | | | | (0.03 | ) | | | (0.05 | ) | | | (0.07 | )(b) | | | (0.08 | ) |
| | | | | | | |
| | Net realized and unrealized gain (loss) | | | (0.53 | ) | | | 2.09 | | | | 2.29 | | | | 0.57 | | | | 0.63 | | | | 2.97 | |
| | | | | | | |
| | Total from investment operations | | | (0.50 | ) | | | 2.15 | | | | 2.26 | | | | 0.52 | | | | 0.56 | | | | 2.89 | |
| | | | | | | |
| | Distributions to shareholders from net investment income | | | (0.08 | ) | | | — | | | | — | | | | — | | | | — | | | | — | |
| | | | | | | |
| | Distributions to shareholders from net realized gains | | | (0.87 | ) | | | (3.68 | ) | | | (0.01 | ) | | | (0.73 | ) | | | (1.90 | ) | | | (1.58 | ) |
| | | | | | | |
| | Total distributions | | | (0.95 | ) | | | (3.68 | ) | | | (0.01 | ) | | | (0.73 | ) | | | (1.90 | ) | | | (1.58 | ) |
| | | | | | | |
| | Net asset value, end of period | | $ | 10.69 | | | $ | 12.14 | | | $ | 13.67 | | | $ | 11.42 | | | $ | 11.63 | | | $ | 12.97 | |
| | | | | | | |
| | Total return(c) | | | (3.52 | )% | | | 18.50 | % | | | 19.83 | % | | | 4.61 | % | | | 4.43 | % | | | 26.38 | % |
| | | | | | | |
| | Net assets, end of period (in 000s) | | $ | 49 | | | $ | 49 | | | $ | 39 | | | $ | 37 | | | $ | 33 | | | $ | 55 | |
| | | | | | | |
| | Ratio of net expenses to average net assets | | | 1.21 | %(d) | | | 1.20 | % | | | 1.45 | % | | | 1.47 | % | | | 1.49 | % | | | 1.53 | % |
| | | | | | | |
| | Ratio of total expenses to average net assets | | | 2.93 | %(d) | | | 2.74 | % | | | 3.28 | % | | | 3.33 | % | | | 3.24 | % | | | 3.56 | % |
| | | | | | | |
| | Ratio of net investment income (loss) to average net assets | | | 0.55 | %(d) | | | 0.48 | % | | | (0.23 | )% | | | (0.45 | )% | | | (0.55 | )%(b) | | | (0.65 | )% |
| | | | | | | |
| | Portfolio turnover rate(e) | | | 23 | % | | | 157 | % | | | 47 | % | | | 46 | % | | | 41 | % | | | 56 | % |
| | (a) | | Calculated based on the average shares outstanding methodology. |
| | (b) | | Reflects income recognized from special dividends which amounted to $0.02 per share and 0.13% of average net assets. |
| | (c) | | Assumes investment at the NAV at the beginning of the period, reinvestment of all dividends and distributions, a complete redemption of the investment at the NAV at the end of the period and no sales or redemption charges. Total returns would be reduced if a sales or redemption charge was taken into account. Returns do not reflect the impact of taxes to shareholder relating to Fund distributions or the redemption of Fund shares. Total returns for periods less than one full year are not annualized. |
| | (e) | | The Fund’s portfolio turnover rate is calculated in accordance with regulatory requirements, without regard to transactions involving short term investments. If such transactions were included, the Fund’s portfolio turnover rate may be higher. |
| | |
| 110 | | The accompanying notes are an integral part of these financial statements. |
GOLDMAN SACHS FLEXIBLE CAP FUND
Financial Highlights(continued)
Selected Share Data for a Share Outstanding Throughout Each Period
| | | | | | | | | | | | | | | | | | | | | | |
| | | | | Goldman Sachs Flexible Cap Fund | |
| | | | | Class R6 Shares | |
| | | | | Six Months Ended
February 28, 2019 (Unaudited) | | | Year Ended August 31, | | | Period Ended
August 31, 2015(a) | |
| | | | | 2018 | | | 2017 | | | 2016 | |
| | Per Share Data | | | | | | | | | | | | | | | | | | | | |
| | | | | | |
| | Net asset value, beginning of period | | $ | 13.61 | | | $ | 14.88 | | | $ | 12.35 | | | $ | 12.44 | | | $ | 13.38 | |
| | | | | | |
| | Net investment income(b) | | | 0.09 | | | | 0.15 | | | | 0.05 | | | | 0.03 | | | | — | (c)(d) |
| | | | | | |
| | Net realized and unrealized gain (loss) | | | (0.60 | ) | | | 2.32 | | | | 2.49 | | | | 0.61 | | | | (0.94 | ) |
| | | | | | |
| | Total from investment operations | | | (0.51 | ) | | | 2.47 | | | | 2.54 | | | | 0.64 | | | | (0.94 | ) |
| | | | | | |
| | Distributions to shareholders from net investment income | | | (0.15 | ) | | | (0.06 | ) | | | — | | | | — | | | | — | |
| | | | | | |
| | Distributions to shareholders from net realized gains | | | (0.87 | ) | | | (3.68 | ) | | | (0.01 | ) | | | (0.73 | ) | | | — | |
| | | | | | |
| | Total distributions | | | (1.02 | ) | | | (3.74 | ) | | | (0.01 | ) | | | (0.73 | ) | | | — | |
| | | | | | |
| | Net asset value, end of period | | $ | 12.08 | | | $ | 13.61 | | | $ | 14.88 | | | $ | 12.35 | | | $ | 12.44 | |
| | | | | | |
| | Total return(e) | | | (3.19 | )% | | | 19.27 | % | | | 20.61 | % | | | 5.29 | % | | | (7.03 | )% |
| | | | | | |
| | Net assets, end of period (in 000s) | | $ | 200 | | | $ | 14 | | | $ | 12 | | | $ | 10 | | | $ | 9 | |
| | | | | | |
| | Ratio of net expenses to average net assets | | | 0.58 | %(f) | | | 0.58 | % | | | 0.82 | % | | | 0.81 | % | | | 0.84 | %(f) |
| | | | | | |
| | Ratio of total expenses to average net assets | | | 2.31 | %(f) | | | 2.09 | % | | | 2.61 | % | | | 2.66 | % | | | 4.34 | %(f) |
| | | | | | |
| | Ratio of net investment income to average net assets | | | 1.46 | %(f) | | | 1.11 | % | | | 0.39 | % | | | 0.22 | % | | | 0.24 | %(f)(d) |
| | | | | | |
| | Portfolio turnover rate(g) | | | 23 | % | | | 157 | % | | | 47 | % | | | 46 | % | | | 41 | % |
| | (a) | | Commenced operations on July 31, 2015. |
| | (b) | | Calculated based on the average shares outstanding methodology. |
| | (c) | | Amount is less than $0.005 per share. |
| | (d) | | Reflects income recognized from special dividends which amounted to $0.02 per share and 0.13% of average net assets. |
| | (e) | | Assumes investment at the NAV at the beginning of the period, reinvestment of all dividends and distributions, a complete redemption of the investment at the NAV at the end of the period and no sales or redemption charges. Total returns would be reduced if a sales or redemption charge was taken into account. Returns do not reflect the impact of taxes to shareholder relating to Fund distributions or the redemption of Fund shares. Total returns for periods less than one full year are not annualized. |
| | (g) | | The Fund’s portfolio turnover rate is calculated in accordance with regulatory requirements, without regard to transactions involving short term investments. If such transactions were included, the Fund’s portfolio turnover rate may be higher. |
| | |
| The accompanying notes are an integral part of these financial statements. | | 111 |
GOLDMAN SACHS GROWTH OPPORTUNITIES FUND
Financial Highlights(continued)
Selected Share Data for a Share Outstanding Throughout Each Period
| | | | | | | | | | | | | | | | | | | | | | | | | | |
| | | | | Goldman Sachs Growth Opportunities Fund | |
| | | | | Class A Shares | |
| | | | | Six Months Ended
February 28, 2019
(Unaudited) | | | Year Ended August 31, | |
| | | | | 2018 | | | 2017 | | | 2016 | | | 2015 | | | 2014 | |
| | Per Share Data | | | | | | | | | | | | | | | | | | | | | | | | |
| | | | | | | |
| | Net asset value, beginning of period | | $ | 23.42 | | | $ | 23.97 | | | $ | 21.70 | | | $ | 23.84 | | | $ | 30.22 | | | $ | 26.65 | |
| | | | | | | |
| | Net investment loss(a) | | | (0.05 | ) | | | (0.14 | ) | | | (0.12 | ) | | | (0.10 | )(b) | | | (0.17 | )(c) | | | (0.19 | ) |
| | | | | | | |
| | Net realized and unrealized gain (loss) | | | (0.88 | ) | | | 4.20 | | | | 2.94 | | | | 0.77 | | | | (0.05 | ) | | | 5.95 | |
| | | | | | | |
| | Total from investment operations | | | (0.93 | ) | | | 4.06 | | | | 2.82 | | | | 0.67 | | | | (0.22 | ) | | | 5.76 | |
| | | | | | | |
| | Distributions to shareholders from net realized gains | | | (5.88 | ) | | | (4.61 | ) | | | (0.55 | ) | | | (2.81 | ) | | | (6.16 | ) | | | (2.19 | ) |
| | | | | | | |
| | Net asset value, end of period | | $ | 16.61 | | | $ | 23.42 | | | $ | 23.97 | | | $ | 21.70 | | | $ | 23.84 | | | $ | 30.22 | |
| | | | | | | |
| | Total return(d) | | | (1.17 | )% | | | 19.37 | % | | | 13.40 | % | | | 3.39 | % | | | (1.47 | )% | | | 22.57 | % |
| | | | | | | |
| | Net assets, end of period (in 000s) | | $ | 337,662 | | | $ | 421,605 | | | $ | 486,115 | | | $ | 631,053 | | | $ | 946,463 | | | $ | 1,110,320 | |
| | | | | | | |
| | Ratio of net expenses to average net assets | | | 1.29 | %(e) | | | 1.30 | % | | | 1.30 | % | | | 1.32 | % | | | 1.35 | % | | | 1.36 | % |
| | | | | | | |
| | Ratio of total expenses to average net assets | | | 1.39 | %(e) | | | 1.40 | % | | | 1.43 | % | | | 1.42 | % | | | 1.40 | % | | | 1.40 | % |
| | | | | | | |
| | Ratio of net investment loss to average net assets | | | (0.56 | )%(e) | | | (0.60 | )% | | | (0.56 | )% | | | (0.47 | )%(b) | | | (0.65 | )%(c) | | | (0.66 | )% |
| | | | | | | |
| | Portfolio turnover rate(f) | | | 29 | % | | | 60 | % | | | 61 | % | | | 55 | % | | | 51 | % | | | 59 | % |
| | (a) | | Calculated based on the average shares outstanding methodology. |
| | (b) | | Reflects income recognized from special dividends which amounted to $0.04 per share and 0.16% of average net assets. |
| | (c) | | Reflects income recognized from special dividends which amounted to $0.03 per share and 0.10% of average net assets. |
| | (d) | | Assumes investment at the NAV at the beginning of the period, reinvestment of all dividends and distributions, a complete redemption of the investment at the NAV at the end of the period and no sales or redemption charges. Total returns would be reduced if a sales or redemption charge was taken into account. Returns do not reflect the impact of taxes to shareholders relating to Fund distributions or the redemption of Fund shares. Total returns for periods less than one full year are not annualized. |
| | (f) | | The Fund’s portfolio turnover rate is calculated in accordance with regulatory requirements, without regard to transactions involving short term investments. If such transactions were included, the Fund’s portfolio turnover rate may be higher. |
| | |
| 112 | | The accompanying notes are an integral part of these financial statements. |
GOLDMAN SACHS GROWTH OPPORTUNITIES FUND
Financial Highlights(continued)
Selected Share Data for a Share Outstanding Throughout Each Period
| | | | | | | | | | | | | | | | | | | | | | | | | | |
| | | | | Goldman Sachs Growth Opportunities Fund | |
| | | | | Class C Shares | |
| | | | | Six Months Ended
February 28, 2019
(Unaudited) | | | Year Ended August 31, | |
| | | | | 2018 | | | 2017 | | | 2016 | | | 2015 | | | 2014 | |
| | Per Share Data | | | | | | | | | | | | | | | | | | | | | | | | |
| | | | | | | |
| | Net asset value, beginning of period | | $ | 16.11 | | | $ | 17.95 | | | $ | 16.52 | | | $ | 18.95 | | | $ | 25.42 | | | $ | 22.89 | |
| | | | | | | |
| | Net investment loss(a) | | | (0.08 | ) | | | (0.22 | ) | | | (0.22 | ) | | | (0.20 | )(b) | | | (0.30 | )(c) | | | (0.34 | ) |
| | | | | | | |
| | Net realized and unrealized gain (loss) | | | (0.82 | ) | | | 2.99 | | | | 2.20 | | | | 0.58 | | | | (0.01 | ) | | | 5.06 | |
| | | | | | | |
| | Total from investment operations | | | (0.90 | ) | | | 2.77 | | | | 1.98 | | | | 0.38 | | | | (0.31 | ) | | | 4.72 | |
| | | | | | | |
| | Distributions to shareholders from net realized gains | | | (5.88 | ) | | | (4.61 | ) | | | (0.55 | ) | | | (2.81 | ) | | | (6.16 | ) | | | (2.19 | ) |
| | | | | | | |
| | Net asset value, end of period | | $ | 9.33 | | | $ | 16.11 | | | $ | 17.95 | | | $ | 16.52 | | | $ | 18.95 | | | $ | 25.42 | |
| | | | | | | |
| | Total return(d) | | | (1.52 | )% | | | 18.52 | % | | | 12.49 | % | | | 2.66 | % | | | (2.23 | )% | | | 21.67 | % |
| | | | | | | |
| | Net assets, end of period (in 000s) | | $ | 49,894 | | | $ | 77,990 | | | $ | 91,086 | | | $ | 128,788 | | | $ | 168,461 | | | $ | 191,125 | |
| | | | | | | |
| | Ratio of net expenses to average net assets | | | 2.04 | %(e) | | | 2.05 | % | | | 2.05 | % | | | 2.07 | % | | | 2.10 | % | | | 2.11 | % |
| | | | | | | |
| | Ratio of total expenses to average net assets | | | 2.14 | %(e) | | | 2.15 | % | | | 2.18 | % | | | 2.17 | % | | | 2.15 | % | | | 2.15 | % |
| | | | | | | |
| | Ratio of net investment loss to average net assets | | | (1.30 | )%(e) | | | (1.35 | )% | | | (1.32 | )% | | | (1.23 | )%(b) | | | (1.40 | )%(c) | | | (1.41 | )% |
| | | | | | | |
| | Portfolio turnover rate(f) | | | 29 | % | | | 60 | % | | | 61 | % | | | 55 | % | | | 51 | % | | | 59 | % |
| | (a) | | Calculated based on the average shares outstanding methodology. |
| | (b) | | Reflects income recognized from special dividends which amounted to $0.04 per share and 0.16% of average net assets. |
| | (c) | | Reflects income recognized from special dividends which amounted to $0.03 per share and 0.10% of average net assets. |
| | (d) | | Assumes investment at the NAV at the beginning of the period, reinvestment of all dividends and distributions, a complete redemption of the investment at the NAV at the end of the period and no sales or redemption charges. Total returns would be reduced if a sales or redemption charge was taken into account. Returns do not reflect the impact of taxes to shareholders relating to Fund distributions or the redemption of Fund shares. Total returns for periods less than one full year are not annualized. |
| | (f) | | The Fund’s portfolio turnover rate is calculated in accordance with regulatory requirements, without regard to transactions involving short term investments. If such transactions were included, the Fund’s portfolio turnover rate may be higher. |
| | |
| The accompanying notes are an integral part of these financial statements. | | 113 |
GOLDMAN SACHS GROWTH OPPORTUNITIES FUND
Financial Highlights(continued)
Selected Share Data for a Share Outstanding Throughout Each Period
| | | | | | | | | | | | | | | | | | | | | | | | | | |
| | | | | Goldman Sachs Growth Opportunities Fund
| |
| | | | | Institutional Shares | |
| | | | | Six Months Ended
February 28, 2019
(Unaudited) | | | Year Ended August 31, | |
| | | | | 2018 | | | 2017 | | | 2016 | | | 2015 | | | 2014 | |
| | Per Share Data | | | | | | | | | | | | | | | | | | | | | | | | |
| | | | | | | |
| | Net asset value, beginning of period | | $ | 27.78 | | | $ | 27.54 | | | $ | 24.76 | | | $ | 26.71 | | | $ | 33.02 | | | $ | 28.83 | |
| | | | | | | |
| | Net investment loss(a) | | | (0.03 | ) | | | (0.07 | ) | | | (0.05 | ) | | | (0.03 | )(b) | | | (0.07 | )(c) | | | (0.08 | ) |
| | | | | | | |
| | Net realized and unrealized gain (loss) | | | (0.91 | ) | | | 4.92 | | | | 3.38 | | | | 0.89 | | | | (0.08 | ) | | | 6.46 | |
| | | | | | | |
| | Total from investment operations | | | (0.94 | ) | | | 4.85 | | | | 3.33 | | | | 0.86 | | | | (0.15 | ) | | | 6.38 | |
| | | | | | | |
| | Distributions to shareholders from net realized gains | | | (5.88 | ) | | | (4.61 | ) | | | (0.55 | ) | | | (2.81 | ) | | | (6.16 | ) | | | (2.19 | ) |
| | | | | | | |
| | Net asset value, end of period | | $ | 20.96 | | | $ | 27.78 | | | $ | 27.54 | | | $ | 24.76 | | | $ | 26.71 | | | $ | 33.02 | |
| | | | | | | |
| | Total return(d) | | | (0.96 | )% | | | 19.78 | % | | | 13.81 | % | | | 3.76 | % | | | (1.08 | )% | | | 23.04 | % |
| | | | | | | |
| | Net assets, end of period (in 000s) | | $ | 730,236 | | | $ | 1,178,239 | | | $ | 1,670,808 | | | $ | 2,160,714 | | | $ | 3,171,058 | | | $ | 3,750,790 | |
| | | | | | | |
| | Ratio of net expenses to average net assets | | | 0.95 | %(e) | | | 0.96 | % | | | 0.95 | % | | | 0.95 | % | | | 0.95 | % | | | 0.96 | % |
| | | | | | | |
| | Ratio of total expenses to average net assets | | | 1.00 | %(e) | | | 1.01 | % | | | 1.03 | % | | | 1.02 | % | | | 1.00 | % | | | 1.00 | % |
| | | | | | | |
| | Ratio of net investment loss to average net assets | | | (0.22 | )%(e) | | | (0.26 | )% | | | (0.21 | )% | | | (0.11 | )%(b) | | | (0.24 | )%(c) | | | (0.26 | )% |
| | | | | | | |
| | Portfolio turnover rate(f) | | | 29 | % | | | 60 | % | | | 61 | % | | | 55 | % | | | 51 | % | | | 59 | % |
| | (a) | | Calculated based on the average shares outstanding methodology. |
| | (b) | | Reflects income recognized from special dividends which amounted to $0.04 per share and 0.16% of average net assets. |
| | (c) | | Reflects income recognized from special dividends which amounted to $0.03 per share and 0.10% of average net assets. |
| | (d) | | Assumes investment at the NAV at the beginning of the period, reinvestment of all dividends and distributions, a complete redemption of the investment at the NAV at the end of the period and no sales or redemption charges. Total returns would be reduced if a sales or redemption charge was taken into account. Returns do not reflect the impact of taxes to shareholder relating to Fund distributions or the redemption of Fund shares. Total returns for periods less than one full year are not annualized. |
| | (f) | | The Fund’s portfolio turnover rate is calculated in accordance with regulatory requirements, without regard to transactions involving short term investments. If such transactions were included, the Fund’s portfolio turnover rate may be higher. |
| | |
| 114 | | The accompanying notes are an integral part of these financial statements. |
GOLDMAN SACHS GROWTH OPPORTUNITIES FUND
Financial Highlights(continued)
Selected Share Data for a Share Outstanding Throughout Each Period
| | | | | | | | | | | | | | | | | | | | | | | | | | |
| | | | | Goldman Sachs Growth Opportunities Fund | |
| | | | | Service Shares | |
| | | | | Six Months Ended
February 28, 2019
(Unaudited) | | | Year Ended August 31, | |
| | | | | 2018 | | | 2017 | | | 2016 | | | 2015 | | | 2014 | |
| | Per Share Data | | | | | | | | | | | | | | | | | | | | | | | | |
| | | | | | | |
| | Net asset value, beginning of period | | $ | 22.29 | | | $ | 23.05 | | | $ | 20.92 | | | $ | 23.11 | | | $ | 29.51 | | | $ | 26.10 | |
| | | | | | | |
| | Net investment loss(a) | | | (0.06 | ) | | | (0.17 | ) | | | (0.15 | ) | | | (0.13 | )(b) | | | (0.19 | )(c) | | | (0.21 | ) |
| | | | | | | |
| | Net realized and unrealized gain (loss) | | | (0.87 | ) | | | 4.02 | | | | 2.83 | | | | 0.75 | | | | (0.05 | ) | | | 5.81 | |
| | | | | | | |
| | Total from investment operations | | | (0.93 | ) | | | 3.85 | | | | 2.68 | | | | 0.62 | | | | (0.24 | ) | | | 5.60 | |
| | | | | | | |
| | Distributions to shareholders from net realized gains | | | (5.88 | ) | | | (4.61 | ) | | | (0.55 | ) | | | (2.81 | ) | | | (6.16 | ) | | | (2.19 | ) |
| | | | | | | |
| | Net asset value, end of period | | $ | 15.48 | | | $ | 22.29 | | | $ | 23.05 | | | $ | 20.92 | | | $ | 23.11 | | | $ | 29.51 | |
| | | | | | | |
| | Total return(d) | | | (1.24 | )% | | | 19.21 | % | | | 13.22 | % | | | 3.27 | % | | | (1.59 | )% | | | 22.42 | % |
| | | | | | | |
| | Net assets, end of period (in 000s) | | $ | 27,957 | | | $ | 34,211 | | | $ | 33,159 | | | $ | 37,432 | | | $ | 49,105 | | | $ | 57,643 | |
| | | | | | | |
| | Ratio of net expenses to average net assets | | | 1.45 | %(e) | | | 1.46 | % | | | 1.45 | % | | | 1.45 | % | | | 1.45 | % | | | 1.46 | % |
| | | | | | | |
| | Ratio of total expenses to average net assets | | | 1.50 | %(e) | | | 1.51 | % | | | 1.53 | % | | | 1.52 | % | | | 1.50 | % | | | 1.50 | % |
| | | | | | | |
| | Ratio of net investment loss to average net assets | | | (0.72 | )%(e) | | | (0.76 | )% | | | (0.71 | )% | | | (0.61 | )%(b) | | | (0.75 | )%(c) | | | (0.76 | )% |
| | | | | | | |
| | Portfolio turnover rate(f) | | | 29 | % | | | 60 | % | | | 61 | % | | | 55 | % | | | 51 | % | | | 59 | % |
| | (a) | | Calculated based on the average shares outstanding methodology. |
| | (b) | | Reflects income recognized from special dividends which amounted to $0.04 per share and 0.16% of average net assets. |
| | (c) | | Reflects income recognized from special dividends which amounted to $0.03 per share and 0.10% of average net assets. |
| | (d) | | Assumes investment at the NAV at the beginning of the period, reinvestment of all dividends and distributions, a complete redemption of the investment at the NAV at the end of the period and no sales or redemption charges. Total returns would be reduced if a sales or redemption charge was taken into account. Returns do not reflect the impact of taxes to shareholder relating to Fund distributions or the redemption of Fund shares. Total returns for periods less than one full year are not annualized. |
| | (f) | | The Fund’s portfolio turnover rate is calculated in accordance with regulatory requirements, without regard to transactions involving short term investments. If such transactions were included, the Fund’s portfolio turnover rate may be higher. |
| | |
| The accompanying notes are an integral part of these financial statements. | | 115 |
GOLDMAN SACHS GROWTH OPPORTUNITIES FUND
Financial Highlights(continued)
Selected Share Data for a Share Outstanding Throughout Each Period
| | | | | | | | | | | | | | | | | | | | | | | | | | |
| | | | | Goldman Sachs Growth Opportunities Fund | |
| | | | | Investor Shares | |
| | | | | Six Months Ended
February 28, 2019
(Unaudited) | | | Year Ended August 31, | |
| | | | | 2018 | | | 2017 | | | 2016 | | | 2015 | | | 2014 | |
| | Per Share Data | | | | | | | | | | | | | | | | | | | | | | | | |
| | | | | | | |
| | Net asset value, beginning of period | | $ | 24.59 | | | $ | 24.90 | | | $ | 22.46 | | | $ | 24.52 | | | $ | 30.85 | | | $ | 27.10 | |
| | | | | | | |
| | Net investment loss(a) | | | (0.03 | ) | | | (0.08 | ) | | | (0.07 | ) | | | (0.05 | )(b) | | | (0.11 | )(c) | | | (0.12 | ) |
| | | | | | | |
| | Net realized and unrealized gain (loss) | | | (0.88 | ) | | | 4.38 | | | | 3.06 | | | | 0.80 | | | | (0.06 | ) | | | 6.06 | |
| | | | | | | |
| | Total from investment operations | | | (0.91 | ) | | | 4.30 | | | | 2.99 | | | | 0.75 | | | | (0.17 | ) | | | 5.94 | |
| | | | | | | |
| | Distributions to shareholders from net realized gains | | | (5.88 | ) | | | (4.61 | ) | | | (0.55 | ) | | | (2.81 | ) | | | (6.16 | ) | | | (2.19 | ) |
| | | | | | | |
| | Net asset value, end of period | | $ | 17.80 | | | $ | 24.59 | | | $ | 24.90 | | | $ | 22.46 | | | $ | 24.52 | | | $ | 30.85 | |
| | | | | | | |
| | Total return(d) | | | (1.02 | )% | | | 19.64 | % | | | 13.71 | % | | | 3.64 | % | | | (1.25 | )% | | | 22.87 | % |
| | | | | | | |
| | Net assets, end of period (in 000s) | | $ | 85,954 | | | $ | 93,889 | | | $ | 132,003 | | | $ | 135,930 | | | $ | 171,980 | | | $ | 143,249 | |
| | | | | | | |
| | Ratio of net expenses to average net assets | | | 1.04 | %(e) | | | 1.05 | % | | | 1.05 | % | | | 1.07 | % | | | 1.10 | % | | | 1.11 | % |
| | | | | | | |
| | Ratio of total expenses to average net assets | | | 1.14 | %(e) | | | 1.15 | % | | | 1.18 | % | | | 1.17 | % | | | 1.15 | % | | | 1.15 | % |
| | | | | | | |
| | Ratio of net investment loss to average net assets | | | (0.29 | )%(e) | | | (0.35 | )% | | | (0.31 | )% | | | (0.23 | )%(b) | | | (0.41 | )%(c) | | | (0.41 | )% |
| | | | | | | |
| | Portfolio turnover rate(f) | | | 29 | % | | | 60 | % | | | 61 | % | | | 55 | % | | | 51 | % | | | 59 | % |
| | (a) | | Calculated based on the average shares outstanding methodology. |
| | (b) | | Reflects income recognized from special dividends which amounted to $0.04 per share and 0.16% of average net assets. |
| | (c) | | Reflects income recognized from special dividends which amounted to $0.03 per share and 0.10% of average net assets. |
| | (d) | | Assumes investment at the NAV at the beginning of the period, reinvestment of all dividends and distributions, a complete redemption of the investment at the NAV at the end of the period and no sales or redemption charges. Total returns would be reduced if a sales or redemption charge was taken into account. Returns do not reflect the impact of taxes to shareholder relating to Fund distributions or the redemption of Fund shares. Total returns for periods less than one full year are not annualized. |
| | (f) | | The Fund’s portfolio turnover rate is calculated in accordance with regulatory requirements, without regard to transactions involving short term investments. If such transactions were included, the Fund’s portfolio turnover rate may be higher. |
| | |
| 116 | | The accompanying notes are an integral part of these financial statements. |
GOLDMAN SACHS GROWTH OPPORTUNITIES FUND
Financial Highlights(continued)
Selected Share Data for a Share Outstanding Throughout Each Period
| | | | | | | | | | |
| | | | | Goldman Sachs Growth
Opportunities Fund | |
| | | | | Class P | |
| | | | | Six Months Ended
February 28, 2019
(Unaudited) | | | Period Ended
August 31, 2018(a) | |
| | Per Share Data | | | | | | | | |
| | | |
| | Net asset value, beginning of period | | $ | 27.80 | | | $ | 26.35 | |
| | | |
| | Net investment income (loss)(b) | | | (0.02 | ) | | | (0.04 | ) |
| | | |
| | Net realized and unrealized gain (loss) | | | (0.91 | ) | | | 1.49 | |
| | | |
| | Total from investment operations | | | (0.93 | ) | | | 1.45 | |
| | | |
| | Distributions to shareholders from net realized gains | | | (5.88 | ) | | | — | |
| | | |
| | Net asset value, end of period | | $ | 20.99 | | | $ | 27.80 | |
| | | |
| | Total return(c) | | | (0.97 | )% | | | 5.50 | % |
| | | |
| | Net assets, end of period (in 000s) | | $ | 66,430 | | | $ | 94,974 | |
| | | |
| | Ratio of net expenses to average net assets | | | 0.94 | %(d) | | | 0.95 | %(d) |
| | | |
| | Ratio of total expenses to average net assets | | | 0.99 | %(d) | | | 1.00 | %(d) |
| | | |
| | Ratio of net investment income (loss) to average net assets | | | (0.21 | )%(d) | | | (0.36 | )%(d) |
| | | |
| | Portfolio turnover rate(e) | | | 29 | % | | | 60 | % |
| | (a) | | Class P Shares commenced operations on April 17, 2018. |
| | (b) | | Calculated based on the average shares outstanding methodology. |
| | (c) | | Assumes investment at the NAV at the beginning of the period, reinvestment of all dividends and distributions, a complete redemption of the investment at the NAV at the end of the period and no sales or redemption charges. Total returns would be reduced if a sales or redemption charge was taken into account. Returns do not reflect the impact of taxes to shareholder relating to Fund distributions or the redemption of Fund shares. Total returns for periods less than one full year are not annualized. |
| | (e) | | The Fund’s portfolio turnover rate is calculated in accordance with regulatory requirements, without regard to transactions involving short term investments. If such transactions were included, the Fund’s portfolio turnover rate may be higher. |
| | |
| The accompanying notes are an integral part of these financial statements. | | 117 |
GOLDMAN SACHS GROWTH OPPORTUNITIES FUND
Financial Highlights(continued)
Selected Share Data for a Share Outstanding Throughout Each Period
| | | | | | | | | | | | | | | | | | | | | | | | | | |
| | | | | Goldman Sachs Growth Opportunities Fund | |
| | | | | Class R Shares | |
| | | | | Six Months Ended
February 28, 2019
(Unaudited) | | | Year Ended August 31, | |
| | | | | 2018 | | | 2017 | | | 2016 | | | 2015 | | | 2014 | |
| | Per Share Data | | | | | | | | | | | | | | | | | | | | | | | | |
| | | | | | | |
| | Net asset value, beginning of period | | $ | 22.33 | | | $ | 23.11 | | | $ | 20.99 | | | $ | 23.21 | | | $ | 29.65 | | | $ | 26.25 | |
| | | | | | | |
| | Net investment loss(a) | | | (0.07 | ) | | | (0.19 | ) | | | (0.17 | ) | | | (0.15 | )(b) | | | (0.23 | )(c) | | | (0.25 | ) |
| | | | | | | |
| | Net realized and unrealized gain (loss) | | | (0.87 | ) | | | 4.02 | | | | 2.84 | | | | 0.74 | | | | (0.05 | ) | | | 5.84 | |
| | | | | | | |
| | Total from investment operations | | | (0.94 | ) | | | 3.83 | | | | 2.67 | | | | 0.59 | | | | (0.28 | ) | | | 5.59 | |
| | | | | | | |
| | Distributions to shareholders from net realized gains | | | (5.88 | ) | | | (4.61 | ) | | | (0.55 | ) | | | (2.81 | ) | | | (6.16 | ) | | | (2.19 | ) |
| | | | | | | |
| | Net asset value, end of period | | $ | 15.51 | | | $ | 22.33 | | | $ | 23.11 | | | $ | 20.99 | | | $ | 23.21 | | | $ | 29.65 | |
| | | | | | | |
| | Total return(d) | | | (1.23 | )% | | | 19.06 | % | | | 13.13 | % | | | 3.12 | % | | | (1.74 | )% | | | 22.25 | % |
| | | | | | | |
| | Net assets, end of period (in 000s) | | $ | 49,243 | | | $ | 54,359 | | | $ | 59,225 | | | $ | 63,105 | | | $ | 77,673 | | | $ | 80,542 | |
| | | | | | | |
| | Ratio of net expenses to average net assets | | | 1.54 | %(e) | | | 1.55 | % | | | 1.55 | % | | | 1.57 | % | | | 1.60 | % | | | 1.61 | % |
| | | | | | | |
| | Ratio of total expenses to average net assets | | | 1.64 | %(e) | | | 1.65 | % | | | 1.68 | % | | | 1.67 | % | | | 1.65 | % | | | 1.65 | % |
| | | | | | | |
| | Ratio of net investment loss to average net assets | | | (0.81 | )%(e) | | | (0.85 | )% | | | (0.81 | )% | | | (0.73 | )%(b) | | | (0.90 | )%(c) | | | (0.91 | )% |
| | | | | | | |
| | Portfolio turnover rate(f) | | | 29 | % | | | 60 | % | | | 61 | % | | | 55 | % | | | 51 | % | | | 59 | % |
| | (a) | | Calculated based on the average shares outstanding methodology. |
| | (b) | | Reflects income recognized from special dividends which amounted to $0.04 per share and 0.16% of average net assets. |
| | (c) | | Reflects income recognized from special dividends which amounted to $0.03 per share and 0.10% of average net assets. |
| | (d) | | Assumes investment at the NAV at the beginning of the period, reinvestment of all dividends and distributions, a complete redemption of the investment at the NAV at the end of the period and no sales or redemption charges. Total returns would be reduced if a sales or redemption charge was taken into account. Returns do not reflect the impact of taxes to shareholder relating to Fund distributions or the redemption of Fund shares. Total returns for periods less than one full year are not annualized. |
| | (f) | | The Fund’s portfolio turnover rate is calculated in accordance with regulatory requirements, without regard to transactions involving short term investments. If such transactions were included, the Fund’s portfolio turnover rate may be higher. |
| | |
| 118 | | The accompanying notes are an integral part of these financial statements. |
GOLDMAN SACHS GROWTH OPPORTUNITIES FUND
Financial Highlights(continued)
Selected Share Data for a Share Outstanding Throughout Each Period
| | | | | | | | | | | | | | | | | | | | | | |
| | | | | Goldman Sachs Growth Opportunities Fund | |
| | | | | Class R6 Shares | |
| | | | | Six Months Ended
February 28, 2019
(Unaudited) | | | Year Ended August 31, | | | Period End
August 31, 2015(a) | |
| | | | | 2018 | | | 2017 | | | 2016 | |
| | Per Share Data | | | | | | | | | | | | | | | | | | | | |
| | | | | | |
| | Net asset value, beginning of period | | $ | 27.80 | | | $ | 27.55 | | | $ | 24.77 | | | $ | 26.71 | | | $ | 28.49 | |
| | | | | | |
| | Net investment loss(b) | | | (0.02 | ) | | | (0.07 | ) | | | (0.04 | ) | | | (0.04 | )(c) | | | (0.01 | )(d) |
| | | | | | |
| | Net realized and unrealized gain (loss) | | | (0.92 | ) | | | 4.93 | | | | 3.37 | | | | 0.91 | | | | (1.77 | ) |
| | | | | | |
| | Total from investment operations | | | (0.94 | ) | | | 4.86 | | | | 3.33 | | | | 0.87 | | | | (1.78 | ) |
| | | | | | |
| | Distributions to shareholders from net realized gains | | | (5.88 | ) | | | (4.61 | ) | | | (0.55 | ) | | | (2.81 | ) | | | — | |
| | | | | | |
| | Net asset value, end of period | | $ | 20.98 | | | $ | 27.80 | | | $ | 27.55 | | | $ | 24.77 | | | $ | 26.71 | |
| | | | | | |
| | Total return(e) | | | (1.00 | )% | | | 19.80 | % | | | 13.80 | % | | | 3.81 | % | | | (6.25 | )% |
| | | | | | |
| | Net assets, end of period (in 000s) | | $ | 186,425 | | | $ | 231,077 | | | $ | 118,634 | | | $ | 44,865 | | | $ | 9 | |
| | | | | | |
| | Ratio of net expenses to average net assets | | | 0.94 | %(f) | | | 0.95 | % | | | 0.93 | % | | | 0.93 | % | | | 0.97 | %(f) |
| | | | | | |
| | Ratio of total expenses to average net assets | | | 0.99 | %(f) | | | 0.99 | % | | | 1.01 | % | | | 1.01 | % | | | 1.02 | %(f) |
| | | | | | |
| | Ratio of Net investment loss | | | (0.20 | )%(f) | | | (0.25 | )% | | | (0.18 | )% | | | (0.19 | )%(c) | | | (0.32 | )%(f)(d) |
| | | | | | |
| | Portfolio turnover rate(g) | | | 29 | % | | | 60 | % | | | 61 | % | | | 55 | % | | | 51 | % |
| | (a) | | Commenced operations on July 31, 2015. |
| | (b) | | Calculated based on the average shares outstanding methodology. |
| | (c) | | Reflects income recognized from special dividends which amounted to $0.04 per share and 0.16% of average net assets. |
| | (d) | | Reflects income recognized from special dividends which amounted to $0.03 per share and 0.10% of average net assets. |
| | (e) | | Assumes investment at the NAV at the beginning of the period, reinvestment of all dividends and distributions, a complete redemption of the investment at the NAV at the end of the period and no sales or redemption charges. Total returns would be reduced if a sales or redemption charge was taken into account. Returns do not reflect the impact of taxes to shareholder relating to Fund distributions or the redemption of Fund shares. Total returns for periods less than one full year are not annualized. |
| | (g) | | The Fund’s portfolio turnover rate is calculated in accordance with regulatory requirements, without regard to transactions involving short term investments. If such transactions were included, the Fund’s portfolio turnover rate may be higher. |
| | |
| The accompanying notes are an integral part of these financial statements. | | 119 |
GOLDMAN SACHS SMALL/MID CAP GROWTH FUND
Financial Highlights(continued)
Selected Share Data for a Share Outstanding Throughout Each Period
| | | | | | | | | | | | | | | | | | | | | | | | | | |
| | | | | Goldman Sachs Small/Mid Cap Growth Fund | |
| | | | | Class A Shares | |
| | | | | Six Months Ended
February 28, 2019 (Unaudited) | | | Year Ended August 31, | |
| | | | | 2018 | | | 2017 | | | 2016 | | | 2015 | | | 2014 | |
| | Per Share Data | | | | | | | | | | | | | | | | | | | | | | | | |
| | | | | | | |
| | Net asset value, beginning of period | | $ | 23.94 | | | $ | 21.81 | | | $ | 19.85 | | | $ | 20.72 | | | $ | 20.90 | | | $ | 18.63 | |
| | | | | | | |
| | Net investment loss(a) | | | (0.06 | )(b) | | | (0.14 | )(c) | | | (0.12 | )(d) | | | (0.14 | )(e) | | | (0.18 | )(f) | | | (0.16 | )(g) |
| | | | | | | |
| | Net realized and unrealized gain (loss) | | | (0.94 | ) | | | 5.15 | | | | 2.77 | | | | — | | | | 1.71 | | | | 3.43 | |
| | | | | | | |
| | Total from investment operations | | | (1.00 | ) | | | 5.01 | | | | 2.65 | | | | (0.14 | ) | | | 1.53 | | | | 3.27 | |
| | | | | | | |
| | Distributions to shareholders from net realized gains | | | (3.65 | ) | | | (2.88 | ) | | | (0.69 | ) | | | (0.73 | ) | | | (1.71 | ) | | | (1.00 | ) |
| | | | | | | |
| | Net asset value, end of period | | $ | 19.29 | | | $ | 23.94 | | | $ | 21.81 | | | $ | 19.85 | | | $ | 20.72 | | | $ | 20.90 | |
| | | | | | | |
| | Total return(h) | | | (1.97 | )% | | | 25.22 | % | | | 13.78 | % | | | (0.56 | )% | | | 7.67 | % | | | 17.97 | % |
| | | | | | | |
| | Net assets, end of period (in 000s) | | $ | 293,646 | | | $ | 346,289 | | | $ | 351,253 | | | $ | 736,221 | | | $ | 906,362 | | | $ | 741,254 | |
| | | | | | | |
| | Ratio of net expenses to average net assets | | | 1.27 | %(i) | | | 1.28 | % | | | 1.29 | % | | | 1.31 | % | | | 1.33 | % | | | 1.33 | % |
| | | | | | | |
| | Ratio of total expenses to average net assets | | | 1.31 | %(i) | | | 1.35 | % | | | 1.46 | % | | | 1.45 | % | | | 1.45 | % | | | 1.48 | % |
| | | | | | | |
| | Ratio of net investment loss to average net assets | | | (0.59 | )%(b)(i) | | | (0.64 | )%(c) | | | (0.62 | )%(d) | | | (0.73 | )%(e) | | | (0.85 | )%(f) | | | (0.82 | )%(g) |
| | | | | | | |
| | Portfolio turnover rate(j) | | | 45 | % | | | 59 | % | | | 60 | % | | | 67 | % | | | 47 | % | | | 43 | % |
| | (a) | | Calculated based on the average shares outstanding methodology. |
| | (b) | | Reflects income recognized from special dividends which amounted to $0.02 per share and 0.16% of average net assets. |
| | (c) | | Reflects income recognized from special dividends which amounted to $0.03 per share and 0.11% of average net assets. |
| | (d) | | Reflects income recognized from special dividends which amounted to $0.03 per share and 0.14% of average net assets. |
| | (e) | | Reflects income recognized from special dividends which amounted to $0.03 per share and 0.15% of average net assets. |
| | (f) | | Reflects income recognized from special dividends which amounted to $0.01 per share and 0.05% of average net assets. |
| | (g) | | Reflects income recognized from special dividends which amounted to $0.01 per share and 0.12% of average net assets. |
| | (h) | | Assumes investment at the NAV at the beginning of the period, reinvestment of all dividends and distributions, a complete redemption of the investment at the NAV at the end of the period and no sales or redemption charges. Total returns would be reduced if a sales or redemption charge was taken into account. Returns do not reflect the impact of taxes to shareholders relating to Fund distributions or the redemption of Fund shares. Total returns for periods less than one full year are not annualized. |
| | (j) | | The Fund’s portfolio turnover rate is calculated in accordance with regulatory requirements, without regard to transactions involving short term investments. If such transactions were included, the Fund’s portfolio turnover rate may be higher. |
| | |
| 120 | | The accompanying notes are an integral part of these financial statements. |
GOLDMAN SACHS SMALL/MID CAP GROWTH FUND
Financial Highlights(continued)
Selected Share Data for a Share Outstanding Throughout Each Period
| | | | | | | | | | | | | | | | | | | | | | | | | | |
| | | | | Goldman Sachs Small/Mid Cap Growth Fund | |
| | | | | Class C Shares | |
| | | | | Six Months Ended
February 28, 2019 (Unaudited) | | | Year Ended August 31, | |
| | | | | 2018 | | | 2017 | | | 2016 | | | 2015 | | | 2014 | |
| | Per Share Data | | | | | | | | | | | | | | | | | | | | | | | | |
| | | | | | | |
| | Net asset value, beginning of period | | $ | 20.60 | | | $ | 19.27 | | | $ | 17.75 | | | $ | 18.74 | | | $ | 19.20 | | | $ | 17.31 | |
| | | | | | | |
| | Net investment loss(a) | | | (0.11 | )(b) | | | (0.27 | )(c) | | | (0.24 | )(d) | | | (0.25 | )(e) | | | (0.31 | )(f) | | | (0.29 | )(g) |
| | | | | | | |
| | Net realized and unrealized gain (loss) | | | (0.89 | ) | | | 4.48 | | | | 2.45 | | | | (0.01 | ) | | | 1.56 | | | | 3.18 | |
| | | | | | | |
| | Total from investment operations | | | (1.00 | ) | | | 4.21 | | | | 2.21 | | | | (0.26 | ) | | | 1.25 | | | | 2.89 | |
| | | | | | | |
| | Distributions to shareholder from net realized gains | | | (3.65 | ) | | | (2.88 | ) | | | (0.69 | ) | | | (0.73 | ) | | | (1.71 | ) | | | (1.00 | ) |
| | | | | | | |
| | Net asset value, end of period | | $ | 15.95 | | | $ | 20.60 | | | $ | 19.27 | | | $ | 17.75 | | | $ | 18.74 | | | $ | 19.20 | |
| | | | | | | |
| | Total return(h) | | | (2.32 | )% | | | 24.30 | % | | | 12.98 | % | | | (1.34 | )% | | | 6.84 | % | | | 17.11 | % |
| | | | | | | |
| | Net assets, end of period (000s) | | $ | 184,670 | | | $ | 232,881 | | | $ | 217,385 | | | $ | 265,282 | | | $ | 268,384 | | | $ | 221,451 | |
| | | | | | | |
| | Ratio of net expenses to average net assets | | | 2.02 | %(i) | | | 2.03 | % | | | 2.04 | % | | | 2.06 | % | | | 2.08 | % | | | 2.08 | % |
| | | | | | | |
| | Ratio of total expenses to average net assets | | | 2.06 | %(i) | | | 2.10 | % | | | 2.21 | % | | | 2.20 | % | | | 2.20 | % | | | 2.23 | % |
| | | | | | | |
| | Ratio of net investment loss to average net assets | | | (1.34 | )%(b)(i) | | | (1.38 | )%(c) | | | (1.36 | )%(d) | | | (1.48 | )%(e) | | | (1.60 | )%(f) | | | (1.57 | )%(g) |
| | | | | | | |
| | Portfolio turnover rate(j) | | | 45 | % | | | 59 | % | | | 60 | % | | | 67 | % | | | 47 | % | | | 43 | % |
| | (a) | | Calculated based on the average shares outstanding methodology. |
| | (b) | | Reflects income recognized from special dividends which amounted to $0.02 per share and 0.16% of average net assets. |
| | (c) | | Reflects income recognized from special dividends which amounted to $0.03 per share and 0.11% of average net assets. |
| | (d) | | Reflects income recognized from special dividends which amounted to $0.03 per share and 0.14% of average net assets. |
| | (e) | | Reflects income recognized from special dividends which amounted to $0.03 per share and 0.15% of average net assets. |
| | (f) | | Reflects income recognized from special dividends which amounted to $0.01 per share and 0.05% of average net assets. |
| | (g) | | Reflects income recognized from special dividends which amounted to $0.01 per share and 0.12% of average net assets. |
| | (h) | | Assumes investment at the NAV at the beginning of the period, reinvestment of all dividends and distributions, a complete redemption of the investment at the NAV at the end of the period and no sales or redemption charges. Total returns would be reduced if a sales or redemption charge was taken into account. Returns do not reflect the impact of taxes to shareholders relating to Fund distributions or the redemption of Fund shares. Total returns for periods less than one full year are not annualized. |
| | (j) | | The Fund’s portfolio turnover rate is calculated in accordance with regulatory requirements, without regard to transactions involving short term investments. If such transactions were included, the Fund’s portfolio turnover rate may be higher. |
| | |
| The accompanying notes are an integral part of these financial statements. | | 121 |
GOLDMAN SACHS SMALL/MID CAP GROWTH FUND
Financial Highlights(continued)
Selected Share Data for a Share Outstanding Throughout Each Period
| | | | | | | | | | | | | | | | | | | | | | | | | | |
| | | | | Goldman Sachs Small/Mid Cap Growth Fund | |
| | | | | Institutional Shares | |
| | | | | Six Months Ended
February 28, 2019 (Unaudited) | | | Year Ended August 31, | |
| | | | | 2018 | | | 2017 | | | 2016 | | | 2015 | | | 2014 | |
| | Per Share Data | | | | | | | | | | | | | | | | | | | | | | | | |
| | | | | | | |
| | Net asset value, beginning of period | | $ | 25.63 | | | $ | 23.08 | | | $ | 20.89 | | | $ | 21.69 | | | $ | 21.71 | | | $ | 19.25 | |
| | | | | | | |
| | Net investment loss(a) | | | (0.03 | )(b) | | | (0.07 | )(c) | | | (0.05 | )(d) | | | (0.07 | )(e) | | | (0.10 | )(f) | | | (0.09 | )(g) |
| | | | | | | |
| | Net realized and unrealized gain (loss) | | | (0.97 | ) | | | 5.50 | | | | 2.93 | | | | — | | | | 1.79 | | | | 3.55 | |
| | | | | | | |
| | Total from investment operations | | | (1.00 | ) | | | 5.43 | | | | 2.88 | | | | (0.07 | ) | | | 1.69 | | | | 3.46 | |
| | | | | | | |
| | Distributions to shareholder from net realized gains | | | (3.65 | ) | | | (2.88 | ) | | | (0.69 | ) | | | (0.73 | ) | | | (1.71 | ) | | | (1.00 | ) |
| | | | | | | |
| | Net asset value, end of period | | $ | 20.98 | | | $ | 25.63 | | | $ | 23.08 | | | $ | 20.89 | | | $ | 21.69 | | | $ | 21.71 | |
| | | | | | | |
| | Total return(h) | | | (1.83 | )% | | | 25.69 | % | | | 14.21 | % | | | (0.21 | )% | | | 8.15 | % | | | 18.39 | % |
| | | | | | | |
| | Net assets, end of period (000s) | | $ | 858,281 | | | $ | 1,067,540 | | | $ | 1,149,459 | | | $ | 1,235,282 | | | $ | 1,355,322 | | | $ | 1,077,769 | |
| | | | | | | |
| | Ratio of net expenses to average net assets | | | 0.92 | %(i) | | | 0.92 | % | | | 0.92 | % | | | 0.93 | % | | | 0.93 | % | | | 0.93 | % |
| | | | | | | |
| | Ratio of total expenses to average net assets | | | 0.92 | %(i) | | | 0.96 | % | | | 1.06 | % | | | 1.05 | % | | | 1.05 | % | | | 1.08 | % |
| | | | | | | |
| | Ratio of net investment loss to average net assets | | | (0.24 | )%(i)(b) | | | (0.27 | )%(c) | | | (0.24 | )%(d) | | | (0.35 | )%(e) | | | (0.45 | )%(f) | | | (0.42 | )%(g) |
| | | | | | | |
| | Portfolio turnover rate(j) | | | 45 | % | | | 59 | % | | | 60 | % | | | 67 | % | | | 47 | % | | | 43 | % |
| | (a) | | Calculated based on the average shares outstanding methodology. |
| | (b) | | Reflects income recognized from special dividends which amounted to $0.02 per share and 0.16% of average net assets. |
| | (c) | | Reflects income recognized from special dividends which amounted to $0.03 per share and 0.11% of average net assets. |
| | (d) | | Reflects income recognized from special dividends which amounted to $0.03 per share and 0.14% of average net assets. |
| | (e) | | Reflects income recognized from special dividends which amounted to $0.03 per share and 0.15% of average net assets. |
| | (f) | | Reflects income recognized from special dividends which amounted to $0.01 per share and 0.05% of average net assets. |
| | (g) | | Reflects income recognized from special dividends which amounted to $0.01 per share and 0.12% of average net assets. |
| | (h) | | Assumes investment at the NAV at the beginning of the period, reinvestment of all dividends and distributions, a complete redemption of the investment at the NAV at the end of the period and no sales or redemption charges. Total returns would be reduced if a sales or redemption charge was taken into account. Returns do not reflect the impact of taxes to shareholder relating to Fund distributions or the redemption of Fund shares. Total returns for periods less than one full year are not annualized. |
| | (j) | | The Fund’s portfolio turnover rate is calculated in accordance with regulatory requirements, without regard to transactions involving short term investments. If such transactions were included, the Fund’s portfolio turnover rate may be higher. |
| | |
| 122 | | The accompanying notes are an integral part of these financial statements. |
GOLDMAN SACHS SMALL/MID CAP GROWTH FUND
Financial Highlights(continued)
Selected Share Data for a Share Outstanding Throughout Each Period
| | | | | | | | | | | | | | | | | | | | | | | | | | |
| | | | | Goldman Sachs Small/Mid Cap Growth Fund | |
| | | | | Service Shares | |
| | | | | Six Months Ended
February 28, 2019 (Unaudited) | | | Year Ended August 31, | |
| | | | | 2018 | | | 2017 | | | 2016 | | | 2015 | | | 2014 | |
| | Per Share Data | | | | | | | | | | | | | | | | | | | | | | | | |
| | | | | | | |
| | Net asset value, beginning of period | | $ | 23.32 | | | $ | 21.33 | | | $ | 19.46 | | | $ | 20.35 | | | $ | 20.58 | | | $ | 18.38 | |
| | | | | | | |
| | Net investment loss(a) | | | (0.07 | )(b) | | | (0.17 | )(c) | | | (0.14 | )(d) | | | (0.16 | )(e) | | | (0.20 | )(f) | | | (0.18 | )(g) |
| | | | | | | |
| | Net realized and unrealized gain (loss) | | | (0.94 | ) | | | 5.04 | | | | 2.70 | | | | — | | | | 1.68 | | | | 3.38 | |
| | | | | | | |
| | Total from investment operations | | | (1.01 | ) | | | 4.87 | | | | 2.56 | | | | (0.16 | ) | | | 1.48 | | | | 3.20 | |
| | | | | | | |
| | Distributions to shareholder from net realized gains | | | (3.65 | ) | | | (2.88 | ) | | | (0.69 | ) | | | (0.73 | ) | | | (1.71 | ) | | | (1.00 | ) |
| | | | | | | |
| | Net asset value, end of period | | $ | 18.66 | | | $ | 23.32 | | | $ | 21.33 | | | $ | 19.46 | | | $ | 20.35 | | | $ | 20.58 | |
| | | | | | | |
| | Total return(h) | | | (2.07 | )% | | | 25.12 | % | | | 13.59 | % | | | (0.67 | )% | | | 7.54 | % | | | 17.83 | % |
| | | | | | | |
| | Net assets, end of period (000s) | | $ | 17,623 | | | $ | 18,210 | | | $ | 16,520 | | | $ | 13,956 | | | $ | 12,695 | | | $ | 8,692 | |
| | | | | | | |
| | Ratio of net expenses to average net assets | | | 1.42 | %(i) | | | 1.42 | % | | | 1.42 | % | | | 1.43 | % | | | 1.42 | % | | | 1.43 | % |
| | | | | | | |
| | Ratio of total expenses to average net assets | | | 1.42 | %(i) | | | 1.46 | % | | | 1.56 | % | | | 1.55 | % | | | 1.55 | % | | | 1.58 | % |
| | | | | | | |
| | Ratio of net investment loss to average net assets | | | (0.73 | )%(b)(i) | | | (0.77 | )%(c) | | | (0.73 | )%(d) | | | (0.85 | )%(e) | | | (0.95 | )%(f) | | | (0.92 | )%(g) |
| | | | | | | |
| | Portfolio turnover rate(j) | | | 45 | % | | | 59 | % | | | 60 | % | | | 67 | % | | | 47 | % | | | 43 | % |
| | (a) | | Calculated based on the average shares outstanding methodology. |
| | (b) | | Reflects income recognized from special dividends which amounted to $0.02 per share and 0.16% of average net assets. |
| | (c) | | Reflects income recognized from special dividends which amounted to $0.03 per share and 0.11% of average net assets. |
| | (d) | | Reflects income recognized from special dividends which amounted to $0.03 per share and 0.14% of average net assets. |
| | (e) | | Reflects income recognized from special dividends which amounted to $0.03 per share and 0.15% of average net assets. |
| | (f) | | Reflects income recognized from special dividends which amounted to $0.01 per share and 0.05% of average net assets. |
| | (g) | | Reflects income recognized from special dividends which amounted to $0.01 per share and 0.12% of average net assets. |
| | (h) | | Assumes investment at the NAV at the beginning of the period, reinvestment of all dividends and distributions, a complete redemption of the investment at the NAV at the end of the period and no sales or redemption charges. Total returns would be reduced if a sales or redemption charge was taken into account. Returns do not reflect the impact of taxes to shareholder relating to Fund distributions or the redemption of Fund shares. Total returns for periods less than one full year are not annualized. |
| | (j) | | The Fund’s portfolio turnover rate is calculated in accordance with regulatory requirements, without regard to transactions involving short term investments. If such transactions were included, the Fund’s portfolio turnover rate may be higher. |
| | |
| The accompanying notes are an integral part of these financial statements. | | 123 |
GOLDMAN SACHS SMALL/MID CAP GROWTH FUND
Financial Highlights(continued)
Selected Share Data for a Share Outstanding Throughout Each Period
| | | | | | | | | | | | | | | | | | | | | | | | | | |
| | | | | Goldman Sachs Small/Mid Cap Growth Fund | |
| | | | | Investor Shares | |
| | | | | Six Months Ended
February 28, 2019 (Unaudited) | | | Year Ended August 31, | |
| | | | | 2018 | | | 2017 | | | 2016 | | | 2015 | | | 2014 | |
| | Per Share Data | | | | | | | | | | | | | | | | | | | | | | | | |
| | | | | | | |
| | Net asset value, beginning of period | | $ | 24.85 | | | $ | 22.48 | | | $ | 20.39 | | | $ | 21.21 | | | $ | 21.30 | | | $ | 18.93 | |
| | | | | | | |
| | Net investment loss(a) | | | (0.03 | )(b) | | | (0.09 | )(c) | | | (0.08 | )(d) | | | (0.09 | )(e) | | | (0.13 | )(f) | | | (0.12 | )(g) |
| | | | | | | |
| | Net realized and unrealized gain (loss) | | | (0.97 | ) | | | 5.34 | | | | 2.86 | | | | — | | | | 1.75 | | | | 3.49 | |
| | | | | | | |
| | Total from investment operations | | | (1.00 | ) | | | 5.25 | | | | 2.78 | | | | (0.09 | ) | | | 1.62 | | | | 3.37 | |
| | | | | | | |
| | Distributions to shareholder from net realized gains | | | (3.65 | ) | | | (2.88 | ) | | | (0.69 | ) | | | (0.73 | ) | | | (1.71 | ) | | | (1.00 | ) |
| | | | | | | |
| | Net asset value, end of period | | $ | 20.20 | | | $ | 24.85 | | | $ | 22.48 | | | $ | 20.39 | | | $ | 21.21 | | | $ | 21.30 | |
| | | | | | | |
| | Total return(h) | | | (1.89 | )% | | | 25.57 | % | | | 14.06 | % | | | (0.31 | )% | | | 7.97 | % | | | 18.22 | % |
| | | | | | | |
| | Net assets, end of period (000s) | | $ | 444,755 | | | $ | 529,670 | | | $ | 437,309 | | | $ | 313,812 | | | $ | 221,058 | | | $ | 171,779 | |
| | | | | | | |
| | Ratio of net expenses to average net assets | | | 1.02 | %(i) | | | 1.03 | % | | | 1.04 | % | | | 1.06 | % | | | 1.08 | % | | | 1.08 | % |
| | | | | | | |
| | Ratio of total expenses to average net assets | | | 1.06 | %(i) | | | 1.10 | % | | | 1.21 | % | | | 1.20 | % | | | 1.20 | % | | | 1.23 | % |
| | | | | | | |
| | Ratio of net investment loss to average net assets | | | (0.33 | )%(b)(i) | | | (0.38 | )%(c) | | | (0.36 | )%(d) | | | (0.48 | )%(e) | | | (0.60 | )%(f) | | | (0.57 | )%(g) |
| | | | | | | |
| | Portfolio turnover rate(j) | | | 45 | % | | | 59 | % | | | 60 | % | | | 67 | % | | | 47 | % | | | 43 | % |
| | (a) | | Calculated based on the average shares outstanding methodology. |
| | (b) | | Reflects income recognized from special dividends which amounted to $0.02 per share and 0.16% of average net assets. |
| | (c) | | Reflects income recognized from special dividends which amounted to $0.03 per share and 0.11% of average net assets. |
| | (d) | | Reflects income recognized from special dividends which amounted to $0.03 per share and 0.14% of average net assets. |
| | (e) | | Reflects income recognized from special dividends which amounted to $0.03 per share and 0.15% of average net assets. |
| | (f) | | Reflects income recognized from special dividends which amounted to $0.01 per share and 0.05% of average net assets. |
| | (g) | | Reflects income recognized from special dividends which amounted to $0.01 per share and 0.12% of average net assets. |
| | (h) | | Assumes investment at the NAV at the beginning of the period, reinvestment of all dividends and distributions, a complete redemption of the investment at the NAV at the end of the period and no sales or redemption charges. Total returns would be reduced if a sales or redemption charge was taken into account. Returns do not reflect the impact of taxes to shareholder relating to Fund distributions or the redemption of Fund shares. Total returns for periods less than one full year are not annualized. |
| | (j) | | The Fund’s portfolio turnover rate is calculated in accordance with regulatory requirements, without regard to transactions involving short term investments. If such transactions were included, the Fund’s portfolio turnover rate may be higher. |
| | |
| 124 | | The accompanying notes are an integral part of these financial statements. |
GOLDMAN SACHS SMALL/MID CAP GROWTH FUND
Financial Highlights(continued)
Selected Share Data for a Share Outstanding Throughout Each Period
| | | | | | | | | | |
| | | | | Goldman Sachs Small/Mid Cap Growth
Fund | |
| | | | | Class P | |
| | | | | Six Months Ended
February 28, 2019 (Unaudited) | | | Period Ended
August 31, 2018(a) | |
| | Per Share Data | | | | | | | | |
| | | |
| | Net Asset Value, Beginning of Period | | $ | 25.64 | | | $ | 23.61 | |
| | | |
| | Net investment loss(b) | | | (0.02 | )(c) | | | (0.03 | )(d) |
| | | |
| | Net realized and unrealized gain (loss) | | | (0.97 | ) | | | 2.06 | |
| | | |
| | Total from investment operations | | | (0.99 | ) | | | 2.03 | |
| | | |
| | Distributions to shareholder from net realized gains | | | (3.65 | ) | | | — | |
| | | |
| | Net asset value, end of Period | | $ | 21.00 | | | $ | 25.64 | |
| | | |
| | Total return(e) | | | (1.79 | )% | | | 8.60 | % |
| | | |
| | Net assets, end of period (in 000s) | | $ | 202,061 | | | $ | 245,612 | |
| | | |
| | Ratio of net expenses to average net assets(f) | | | 0.91 | % | | | 0.90 | % |
| | | |
| | Ratio of total expenses to average net assets(f) | | | 0.91 | % | | | 0.91 | % |
| | | |
| | Ratio of net investment income (loss) to average net assets(f) | | | (0.23 | )%(c) | | | (0.36 | )%(d) |
| | | |
| | Portfolio turnover rate(g) | | | 45 | % | | | 59 | % |
| | (a) | | Class P Shares commenced operations on April 17, 2018. |
| | (b) | | Calculated based on the average shares outstanding methodology. |
| | (c) | | Reflects income recognized from special dividends which amounted to $0.02 per share and 0.16% of average net assets. |
| | (d) | | Reflects income recognized from special dividends which amounted to $0.03 per share and 0.11% of average net assets. |
| | (e) | | Assumes investment at the NAV at the beginning of the period, reinvestment of all dividends and distributions, a complete redemption of the investment at the NAV at the end of the period and no sales or redemption charges. Total returns would be reduced if a sales or redemption charge was taken into account. Returns do not reflect the impact of taxes to shareholder relating to Fund distributions or the redemption of Fund shares. Total returns for periods less than one full year are not annualized. |
| | (g) | | The Fund’s portfolio turnover rate is calculated in accordance with regulatory requirements, without regard to transactions involving short term investments. If such transactions were included, the Fund’s portfolio turnover rate may be higher. |
| | |
| The accompanying notes are an integral part of these financial statements. | | 125 |
GOLDMAN SACHS SMALL/MID CAP GROWTH FUND
Financial Highlights(continued)
Selected Share Data for a Share Outstanding Throughout Each Period
| | | | | | | | | | | | | | | | | | | | | | | | | | |
| | | | | Goldman Sachs Small/Mid Cap Growth Fund | |
| | | | | Class R Shares | |
| | | | | Six Months Ended
February 28, 2019 (Unaudited) | | | Year Ended August 31, | |
| | | | | 2018 | | | 2017 | | | 2016 | | | 2015 | | | 2014 | |
| | Per Share Data | | | | | | | | | | | | | | | | | | | | | | | | |
| | | | | | | |
| | Net asset value, beginning of period | | $ | 23.08 | | | $ | 21.17 | | | $ | 19.34 | | | $ | 20.26 | | | $ | 20.51 | | | $ | 18.35 | |
| | | | | | | |
| | Net investment loss(a) | | | (0.08 | )(b) | | | (0.19 | )(c) | | | (0.17 | )(d) | | | (0.18 | )(e) | | | (0.23 | )(f) | | | (0.21 | )(g) |
| | | | | | | |
| | Net realized and unrealized gain (loss) | | | (0.93 | ) | | | 4.98 | | | | 2.69 | | | | (0.01 | ) | | | 1.69 | | | | 3.37 | |
| | | | | | | |
| | Total from investment operations | | | (1.01 | ) | | | 4.79 | | | | 2.52 | | | | (0.19 | ) | | | 1.46 | | | | 3.16 | |
| | | | | | | |
| | Distributions to shareholder from net realized gains | | | (3.65 | ) | | | (2.88 | ) | | | (0.69 | ) | | | (0.73 | ) | | | (1.71 | ) | | | (1.00 | ) |
| | | | | | | |
| | Net asset value, end of period | | $ | 18.42 | | | $ | 23.08 | | | $ | 21.17 | | | $ | 19.34 | | | $ | 20.26 | | | $ | 20.51 | |
| | | | | | | |
| | Total return(h) | | | (2.10 | )% | | | 24.92 | % | | | 13.47 | % | | | (0.83 | )% | | | 7.46 | % | | | 17.63 | % |
| | | | | | | |
| | Net assets, end of period (000s) | | $ | 18,496 | | | $ | 24,215 | | | $ | 26,918 | | | $ | 34,493 | | | $ | 34,697 | | | $ | 34,118 | |
| | | | | | | |
| | Ratio of net expenses to average net assets | | | 1.52 | %(i) | | | 1.53 | % | | | 1.54 | % | | | 1.56 | % | | | 1.58 | % | | | 1.58 | % |
| | | | | | | |
| | Ratio of total expenses to average net assets | | | 1.56 | %(i) | | | 1.61 | % | | | 1.71 | % | | | 1.70 | % | | | 1.70 | % | | | 1.73 | % |
| | | | | | | |
| | Ratio of net investment loss to average net assets | | | (0.84 | )%(b)(i) | | | (0.90 | )%(c) | | | (0.86 | )%(d) | | | (0.98 | )%(e) | | | (1.10 | )%(f) | | | (1.07 | )%(g) |
| | | | | | | |
| | Portfolio turnover rate(j) | | | 45 | % | | | 59 | % | | | 60 | % | | | 67 | % | | | 47 | % | | | 43 | % |
| | (a) | | Calculated based on the average shares outstanding methodology. |
| | (b) | | Reflects income recognized from special dividends which amounted to $0.02 per share and 0.16% of average net assets. |
| | (c) | | Reflects income recognized from special dividends which amounted to $0.03 per share and 0.11% of average net assets. |
| | (d) | | Reflects income recognized from special dividends which amounted to $0.03 per share and 0.14% of average net assets. |
| | (e) | | Reflects income recognized from special dividends which amounted to $0.03 per share and 0.15% of average net assets. |
| | (f) | | Reflects income recognized from special dividends which amounted to $0.01 per share and 0.05% of average net assets. |
| | (g) | | Reflects income recognized from special dividends which amounted to $0.01 per share and 0.12% of average net assets. |
| | (h) | | Assumes investment at the NAV at the beginning of the period, reinvestment of all dividends and distributions, a complete redemption of the investment at the NAV at the end of the period and no sales or redemption charges. Total returns would be reduced if a sales or redemption charge was taken into account. Returns do not reflect the impact of taxes to shareholder relating to Fund distributions or the redemption of Fund shares. Total returns for periods less than one full year are not annualized. |
| | (j) | | The Fund’s portfolio turnover rate is calculated in accordance with regulatory requirements, without regard to transactions involving short term investments. If such transactions were included, the Fund’s portfolio turnover rate may be higher. |
| | |
| 126 | | The accompanying notes are an integral part of these financial statements. |
GOLDMAN SACHS SMALL/MID CAP GROWTH FUND
Financial Highlights(continued)
Selected Share Data for a Share Outstanding Throughout Each Period
| | | | | | | | | | | | | | | | | | | | | | |
| | | | | Goldman Sachs Small/Mid Cap Growth Fund | |
| | | | | Class R6 Shares | |
| | | | | Six Months Ended
February 28, 2019 (Unaudited) | | | Year Ended August 31, | | | Period Ended
August 31, 2015(a) | |
| | | | | 2018 | | | 2017 | | | 2016 | |
| | Per Share Data | | | | | | | | | | | | | | | | | | | | |
| | | | | | |
| | Net asset value, beginning of period | | $ | 25.64 | | | $ | 23.09 | | | $ | 20.89 | | | $ | 21.69 | | | $ | 23.47 | |
| | | | | | |
| | Net investment loss(b) | | | (0.02 | )(c) | | | (0.06 | )(d) | | | (0.04 | )(e) | | | (0.06 | )(f) | | | (0.01 | )(g) |
| | | | | | |
| | Net realized and unrealized gain (loss) | | | (0.97 | ) | | | 5.49 | | | | 2.93 | | | | 0.01 | | | | (1.77 | ) |
| | | | | | |
| | Total from investment operations | | | (0.99 | ) | | | 5.43 | | | | 2.89 | | | | (0.07 | ) | | | (1.78 | ) |
| | | | | | |
| | Distributions to shareholder from net realized gains | | | (3.65 | ) | | | (2.88 | ) | | | (0.69 | ) | | | (0.73 | ) | | | — | |
| | | | | | |
| | Net asset value, end of period | | $ | 21.00 | | | $ | 25.64 | | | $ | 23.09 | | | $ | 20.89 | | | $ | 21.69 | |
| | | | | | |
| | Total return(h) | | | (1.79 | )% | | | 25.68 | % | | | 14.26 | % | | | (0.21 | )% | | | (7.58 | )% |
| | | | | | |
| | Net assets, end of period (000s) | | $ | 52,566 | | | $ | 39,263 | | | $ | 22,660 | | | $ | 9,785 | | | $ | 9 | |
| | | | | | |
| | Ratio of net expenses to average net assets | | | 0.91 | %(i) | | | 0.91 | % | | | 0.90 | % | | | 0.92 | % | | | 0.92 | %(i) |
| | | | | | |
| | Ratio of total expenses to average net assets | | | 0.91 | %(i) | | | 0.95 | % | | | 1.04 | % | | | 1.04 | % | | | 1.05 | %(i) |
| | | | | | |
| | Ratio of Net investment loss | | | (0.20 | )%(c)(i) | | | (0.25 | )%(d) | | | (0.18 | )%(e) | | | (0.28 | )%(f) | | | (0.34 | )%(g)(i) |
| | | | | | |
| | Portfolio turnover rate(j) | | | 45 | % | | | 59 | % | | | 60 | % | | | 67 | % | | | 47 | % |
| | (a) | | Commenced operations on July 31, 2015. |
| | (b) | | Calculated based on the average shares outstanding methodology. |
| | (c) | | Reflects income recognized from special dividends which amounted to $0.02 per share and 0.16% of average net assets. |
| | (d) | | Reflects income recognized from special dividends which amounted to $0.03 per share and 0.11% of average net assets. |
| | (e) | | Reflects income recognized from special dividends which amounted to $0.03 per share and 0.14% of average net assets. |
| | (f) | | Reflects income recognized from special dividends which amounted to $0.03 per share and 0.15% of average net assets. |
| | (g) | | Reflects income recognized from special dividends which amounted to $0.01 per share and 0.05% of average net assets. |
| | (h) | | Assumes investment at the NAV at the beginning of the period, reinvestment of all dividends and distributions, a complete redemption of the investment at the NAV at the end of the period and no sales or redemption charges. Total returns would be reduced if a sales or redemption charge was taken into account. Returns do not reflect the impact of taxes to shareholder relating to Fund distributions or the redemption of Fund shares. Total returns for periods less than one full year are not annualized. |
| | (j) | | The Fund’s portfolio turnover rate is calculated in accordance with regulatory requirements, without regard to transactions involving short term investments. If such transactions were included, the Fund’s portfolio turnover rate may be higher. |
| | |
| The accompanying notes are an integral part of these financial statements. | | 127 |
GOLDMAN SACHS STRATEGIC GROWTH FUND
Financial Highlights(continued)
Selected Share Data for a Share Outstanding Throughout Each Period
| | | | | | | | | | | | | | | | | | | | | | | | | | |
| | | | | Goldman Sachs Strategic Growth Fund | |
| | | | | Class A Shares | |
| | | | | Six Months Ended
February 28, 2019 (Unaudited) | | | Year Ended August 31, | |
| | | | | 2018 | | | 2017 | | | 2016 | | | 2015 | | | 2014 | |
| | Per Share Data | | | | | | | | | | | | | | | | | | | | | | | | |
| | | | | | | |
| | Net asset value, beginning of period | | $ | 13.83 | | | $ | 13.79 | | | $ | 11.91 | | | $ | 11.86 | | | $ | 13.50 | | | $ | 12.29 | |
| | | | | | | |
| | Net investment income (loss)(a) | | | (0.01 | ) | | | (0.02 | ) | | | 0.02 | | | | 0.02 | | | | 0.02 | (b) | | | (0.01 | ) |
| | | | | | | |
| | Net realized and unrealized gain (loss) | | | (0.92 | ) | | | 3.03 | | | | 2.26 | | | | 0.74 | | | | 0.42 | | | | 3.06 | |
| | | | | | | |
| | Total from investment operations | | | (0.93 | ) | | | 3.01 | | | | 2.28 | | | | 0.76 | | | | 0.44 | | | | 3.05 | |
| | | | | | | |
| | Distributions to shareholders from net investment income | | | — | | | | — | | | | (0.04 | ) | | | (0.02 | ) | | | — | | | | (0.01 | ) |
| | | | | | | |
| | Distributions to shareholders from net realized gains | | | (4.27 | ) | | | (2.97 | ) | | | (0.36 | ) | | | (0.69 | ) | | | (2.08 | ) | | | (1.83 | ) |
| | | | | | | |
| | Total distributions | | | (4.27 | ) | | | (2.97 | ) | | | (0.40 | ) | | | (0.71 | ) | | | (2.08 | ) | | | (1.84 | ) |
| | | | | | | |
| | Net asset value, end of period | | $ | 8.63 | | | $ | 13.83 | | | $ | 13.79 | | | $ | 11.91 | | | $ | 11.86 | | | $ | 13.50 | |
| | | | | | | |
| | Total return(c) | | | (4.04 | )% | | | 25.59 | % | | | 19.79 | % | | | 6.48 | % | | | 3.09 | % | | | 26.74 | % |
| | | | | | | |
| | Net assets, end of period (in 000s) | | $ | 27,067 | | | $ | 30,174 | | | $ | 46,114 | | | $ | 46,093 | | | $ | 45,046 | | | $ | 51,626 | |
| | | | | | | |
| | Ratio of net expenses to average net assets | | | 1.14 | %(d) | | | 1.14 | % | | | 1.15 | % | | | 1.15 | % | | | 1.15 | % | | | 1.16 | % |
| | | | | | | |
| | Ratio of total expenses to average net assets | | | 1.35 | %(d) | | | 1.39 | % | | | 1.55 | % | | | 1.54 | % | | | 1.52 | % | | | 1.53 | % |
| | | | | | | |
| | Ratio of net investment income (loss) to average net assets | | | (0.10 | )%(d) | | | (0.15 | )% | | | 0.15 | % | | | 0.19 | % | | | 0.13 | %(b) | | | (0.10 | )% |
| | | | | | | |
| | Portfolio turnover rate(e) | | | 16 | % | | | 40 | % | | | 54 | % | | | 56 | % | | | 52 | % | | | 64 | % |
| | (a) | | Calculated based on the average shares outstanding methodology. |
| | (b) | | Reflects income recognized from special dividends which amounted to $0.02 per share and 0.18% of average net assets. |
| | (c) | | Assumes investment at the NAV at the beginning of the period, reinvestment of all dividends and distributions, a complete redemption of the investment at the NAV at the end of the period and no sales or redemption charges. Total returns would be reduced if a sales or redemption charge was taken into account. Returns do not reflect the impact of taxes to shareholders relating to Fund distributions or the redemption of Fund shares. Total returns for periods less than one full year are not annualized. |
| | (e) | | The Fund’s portfolio turnover rate is calculated in accordance with regulatory requirements, without regard to transactions involving short term investments. If such transactions were included, the Fund’s portfolio turnover rate may be higher. |
| | |
| 128 | | The accompanying notes are an integral part of these financial statements. |
GOLDMAN SACHS STRATEGIC GROWTH FUND
Financial Highlights(continued)
Selected Share Data for a Share Outstanding Throughout Each Period
| | | | | | | | | | | | | | | | | | | | | | | | | | |
| | | | | Goldman Sachs Strategic Growth Fund | |
| | | | | Class C Shares | |
| | | | | Six Months Ended
February 28, 2019 (Unaudited) | | | Year Ended August 31, | |
| | | | | 2018 | | | 2017 | | | 2016 | | | 2015 | | | 2014 | |
| | Per Share Data | | | | | | | | | | | | | | | | | | | | | | | | |
| | | | | | | |
| | Net asset value, beginning of period | | $ | 10.81 | | | $ | 11.46 | | | $ | 10.00 | | | $ | 10.12 | | | $ | 11.90 | | | $ | 11.09 | |
| | | | | | | |
| | Net investment loss(a) | | | (0.03 | ) | | | (0.09 | ) | | | (0.06 | ) | | | (0.05 | ) | | | (0.07 | )(b) | | | (0.10 | ) |
| | | | | | | |
| | Net realized and unrealized gain (loss) | | | (0.80 | ) | | | 2.41 | | | | 1.88 | | | | 0.62 | | | | 0.37 | | | | 2.74 | |
| | | | | | | |
| | Total from investment operations | | | (0.83 | ) | | | 2.32 | | | | 1.82 | | | | 0.57 | | | | 0.30 | | | | 2.64 | |
| | | | | | | |
| | Distributions to shareholder from net realized gains | | | (4.27 | ) | | | (2.97 | ) | | | (0.36 | ) | | | (0.69 | ) | | | (2.08 | ) | | | (1.83 | ) |
| | | | | | | |
| | Total distributions | | | (4.27 | ) | | | (2.97 | ) | | | (0.36 | ) | | | (0.69 | ) | | | (2.08 | ) | | | (1.83 | ) |
| | | | | | | |
| | Net asset value, end of period | | $ | 5.71 | | | $ | 10.81 | | | $ | 11.46 | | | $ | 10.00 | | | $ | 10.12 | | | $ | 11.90 | |
| | | | | | | |
| | Total return(c) | | | (4.29 | )% | | | 24.61 | % | | | 18.89 | % | | | 5.70 | % | | | 2.23 | % | | | 25.83 | % |
| | | | | | | |
| | Net assets, end of period (000s) | | $ | 4,616 | | | $ | 9,081 | | | $ | 9,326 | | | $ | 11,103 | | | $ | 11,175 | | | $ | 11,717 | |
| | | | | | | |
| | Ratio of net expenses to average net assets | | | 1.89 | %(d) | | | 1.89 | % | | | 1.90 | % | | | 1.90 | % | | | 1.90 | % | | | 1.91 | % |
| | | | | | | |
| | Ratio of total expenses to average net assets | | | 2.10 | %(d) | | | 2.13 | % | | | 2.30 | % | | | 2.29 | % | | | 2.27 | % | | | 2.28 | % |
| | | | | | | |
| | Ratio of net investment loss to average net assets | | | (0.88 | )%(d) | | | (0.85 | )% | | | (0.60 | )% | | | (0.56 | )% | | | (0.63 | )%(b) | | | (0.85 | )% |
| | | | | | | |
| | Portfolio turnover rate(e) | | | 16 | % | | | 40 | % | | | 54 | % | | | 56 | % | | | 52 | % | | | 64 | % |
| | (a) | | Calculated based on the average shares outstanding methodology. |
| | (b) | | Reflects income recognized from special dividends which amounted to $0.02 per share and 0.18% of average net assets. |
| | (c) | | Assumes investment at the NAV at the beginning of the period, reinvestment of all dividends and distributions, a complete redemption of the investment at the NAV at the end of the period and no sales or redemption charges. Total returns would be reduced if a sales or redemption charge was taken into account. Returns do not reflect the impact of taxes to shareholders relating to Fund distributions or the redemption of Fund shares. Total returns for periods less than one full year are not annualized. |
| | (e) | | The Fund’s portfolio turnover rate is calculated in accordance with regulatory requirements, without regard to transactions involving short term investments. If such transactions were included, the Fund’s portfolio turnover rate may be higher. |
| | |
| The accompanying notes are an integral part of these financial statements. | | 129 |
GOLDMAN SACHS STRATEGIC GROWTH FUND
Financial Highlights(continued)
Selected Share Data for a Share Outstanding Throughout Each Period
| | | | | | | | | | | | | | | | | | | | | | | | | | |
| | | | | Goldman Sachs Strategic Growth Fund
| |
| | | | | Institutional Shares | |
| | | | | Six Months Ended
February 28, 2019 (Unaudited) | | | Year Ended August 31, | |
| | | | | 2018 | | | 2017 | | | 2016 | | | 2015 | | | 2014 | |
| | Per Share Data | | | | | | | | | | | | | | | | | | | | | | | | |
| | | | | | | |
| | Net asset value, beginning of period | | $ | 14.92 | | | $ | 14.67 | | | $ | 12.64 | | | $ | 12.53 | | | $ | 14.15 | | | $ | 12.79 | |
| | | | | | | |
| | Net investment income(a) | | | 0.02 | | | | 0.04 | | | | 0.07 | | | | 0.07 | | | | 0.07 | (b) | | | 0.04 | |
| | | | | | | |
| | Net realized and unrealized gain (loss) | | | (0.97 | ) | | | 3.25 | | | | 2.40 | | | | 0.78 | | | | 0.43 | | | | 3.21 | |
| | | | | | | |
| | Total from investment operations | | | (0.95 | ) | | | 3.29 | | | | 2.47 | | | | 0.85 | | | | 0.50 | | | | 3.25 | |
| | | | | | | |
| | Distributions to shareholders from net investment income | | | (0.03 | ) | | | (0.07 | ) | | | (0.08 | ) | | | (0.05 | ) | | | (0.04 | ) | | | (0.06 | ) |
| | | | | | | |
| | Distributions to shareholders from net realized gains | | | (4.27 | ) | | | (2.97 | ) | | | (0.36 | ) | | | (0.69 | ) | | | (2.08 | ) | | | (1.83 | ) |
| | | | | | | |
| | Total distributions | | | (4.30 | ) | | | (3.04 | ) | | | (0.44 | ) | | | (0.74 | ) | | | (2.12 | ) | | | (1.89 | ) |
| | | | | | | |
| | Net asset value, end of period | | $ | 9.67 | | | $ | 14.92 | | | $ | 14.67 | | | $ | 12.64 | | | $ | 12.53 | | | $ | 14.15 | |
| | | | | | | |
| | Total return(c) | | | (3.85 | )% | | | 26.11 | % | | | 20.29 | % | | | 6.89 | % | | | 3.43 | % | | | 27.32 | % |
| | | | | | | |
| | Net assets, end of period (000s) | | $ | 55,502 | | | $ | 75,470 | | | $ | 211,311 | | | $ | 294,952 | | | $ | 326,619 | | | $ | 332,401 | |
| | | | | | | |
| | Ratio of net expenses to average net assets | | | 0.75 | %(d) | | | 0.75 | % | | | 0.75 | % | | | 0.75 | % | | | 0.75 | % | | | 0.76 | % |
| | | | | | | |
| | Ratio of total expenses to average net assets | | | 0.96 | %(d) | | | 0.99 | % | | | 1.14 | % | | | 1.14 | % | | | 1.12 | % | | | 1.13 | % |
| | | | | | | |
| | Ratio of net investment income to average net assets | | | 0.28 | %(d) | | | 0.31 | % | | | 0.51 | % | | | 0.59 | % | | | 0.52 | %(b) | | | 0.30 | % |
| | | | | | | |
| | Portfolio turnover rate(e) | | | 16 | % | | | 40 | % | | | 54 | % | | | 56 | % | | | 52 | % | | | 64 | % |
| | (a) | | Calculated based on the average shares outstanding methodology. |
| | (b) | | Reflects income recognized from special dividends which amounted to $0.02 per share and 0.18% of average net assets. |
| | (c) | | Assumes investment at the NAV at the beginning of the period, reinvestment of all dividends and distributions, a complete redemption of the investment at the NAV at the end of the period and no sales or redemption charges. Total returns would be reduced if a sales or redemption charge was taken into account. Returns do not reflect the impact of taxes to shareholder relating to Fund distributions or the redemption of Fund shares. Total returns for periods less than one full year are not annualized. |
| | (e) | | The Fund’s portfolio turnover rate is calculated in accordance with regulatory requirements, without regard to transactions involving short term investments. If such transactions were included, the Fund’s portfolio turnover rate may be higher. |
| | |
| 130 | | The accompanying notes are an integral part of these financial statements. |
GOLDMAN SACHS STRATEGIC GROWTH FUND
Financial Highlights(continued)
Selected Share Data for a Share Outstanding Throughout Each Period
| | | | | | | | | | | | | | | | | | | | | | | | | | |
| | | | | Goldman Sachs Strategic Growth Fund
| |
| | | | | Service Shares | |
| | | | | Six Months Ended
February 28, 2019 (Unaudited) | | | Year Ended August 31, | |
| | | | | 2018 | | | 2017 | | | 2016 | | | 2015 | | | 2014 | |
| | Per Share Data | | | | | | | | | | | | | | | | | | | | | | | | |
| | | | | | | |
| | Net asset value, beginning of period | | $ | 13.67 | | | $ | 13.70 | | | $ | 11.85 | | | $ | 11.81 | | | $ | 13.47 | | | $ | 12.28 | |
| | | | | | | |
| | Net investment income (loss)(a) | | | (0.01 | ) | | | (0.03 | ) | | | 0.01 | | | | 0.01 | | | | — | (b)(c) | | | (0.02 | ) |
| | | | | | | |
| | Net realized and unrealized gain (loss) | | | (0.92 | ) | | | 3.00 | | | | 2.24 | | | | 0.73 | | | | 0.42 | | | | 3.05 | |
| | | | | | | |
| | Total from investment operations | | | (0.93 | ) | | | 2.97 | | | | 2.25 | | | | 0.74 | | | | 0.42 | | | | 3.03 | |
| | | | | | | |
| | Distributions to shareholders from net investment income | | | — | | | | (0.03 | ) | | | (0.04 | ) | | | (0.01 | ) | | | — | | | | (0.01 | ) |
| | | | | | | |
| | Distributions to shareholders from net realized gains | | | (4.27 | ) | | | (2.97 | ) | | | (0.36 | ) | | | (0.69 | ) | | | (2.08 | ) | | | (1.83 | ) |
| | | | | | | |
| | Total distributions | | | (4.27 | ) | | | (3.00 | ) | | | (0.40 | ) | | | (0.70 | ) | | | (2.08 | ) | | | (1.84 | ) |
| | | | | | | |
| | Net asset value, end of period | | $ | 8.47 | | | $ | 13.67 | | | $ | 13.70 | | | $ | 11.85 | | | $ | 11.81 | | | $ | 13.47 | |
| | | | | | | |
| | Total return(d) | | | (4.12 | )% | | | 25.48 | % | | | 19.66 | % | | | 6.40 | % | | | 2.93 | % | | | 26.55 | % |
| | | | | | | |
| | Net assets, end of period (000s) | | $ | 584 | | | $ | 597 | | | $ | 478 | | | $ | 272 | | | $ | 254 | | | $ | 156 | |
| | | | | | | |
| | Ratio of net expenses to average net assets | | | 1.25 | %(e) | | | 1.25 | % | | | 1.25 | % | | | 1.25 | % | | | 1.25 | % | | | 1.26 | % |
| | | | | | | |
| | Ratio of total expenses to average net assets | | | 1.47 | %(e) | | | 1.48 | % | | | 1.65 | % | | | 1.64 | % | | | 1.62 | % | | | 1.63 | % |
| | | | | | | |
| | Ratio of net investment income (loss) to average net assets | | | (0.21 | )%(e) | | | (0.21 | )% | | | 0.09 | % | | | 0.11 | % | | | (0.01 | )%(b) | | | (0.20 | )% |
| | | | | | | |
| | Portfolio turnover rate(f) | | | 16 | % | | | 40 | % | | | 54 | % | | | 56 | % | | | 52 | % | | | 64 | % |
| | (a) | | Calculated based on the average shares outstanding methodology. |
| | (b) | | Reflects income recognized from special dividends which amounted to $0.02 per share and 0.18% of average net assets. |
| | (c) | | Amount is less than $0.005 per share. |
| | (d) | | Assumes investment at the NAV at the beginning of the period, reinvestment of all dividends and distributions, a complete redemption of the investment at the NAV at the end of the period and no sales or redemption charges. Total returns would be reduced if a sales or redemption charge was taken into account. Returns do not reflect the impact of taxes to shareholder relating to Fund distributions or the redemption of Fund shares. Total returns for periods less than one full year are not annualized. |
| | (f) | | The Fund’s portfolio turnover rate is calculated in accordance with regulatory requirements, without regard to transactions involving short term investments. If such transactions were included, the Fund’s portfolio turnover rate may be higher. |
| | |
| The accompanying notes are an integral part of these financial statements. | | 131 |
GOLDMAN SACHS STRATEGIC GROWTH FUND
Financial Highlights(continued)
Selected Share Data for a Share Outstanding Throughout Each Period
| | | | | | | | | | | | | | | | | | | | | | | | | | |
| | | | | Goldman Sachs Strategic Growth Fund | |
| | | | | Investor Shares | |
| | | | | Six Months Ended
February 28, 2019 (Unaudited) | | | Year Ended August 31, | |
| | | | | 2018 | | | 2017 | | | 2016 | | | 2015 | | | 2014 | |
| | Per Share Data | | | | | | | | | | | | | | | | | | | | | | | | |
| | | | | | | |
| | Net asset value, beginning of period | | $ | 14.89 | | | $ | 14.66 | | | $ | 12.63 | | | $ | 12.53 | | | $ | 14.14 | | | $ | 12.80 | |
| | | | | | | |
| | Net investment income(a) | | | 0.01 | | | | 0.02 | | | | 0.06 | | | | 0.05 | | | | 0.05 | (b) | | | 0.02 | |
| | | | | | | |
| | Net realized and unrealized gain (loss) | | | (0.97 | ) | | | 3.24 | | | | 2.40 | | | | 0.78 | | | | 0.44 | | | | 3.20 | |
| | | | | | | |
| | Total from investment operations | | | (0.96 | ) | | | 3.26 | | | | 2.46 | | | | 0.83 | | | | 0.49 | | | | 3.22 | |
| | | | | | | |
| | Distributions to shareholders from net investment income | | | (0.03 | ) | | | (0.06 | ) | | | (0.07 | ) | | | (0.04 | ) | | | (0.02 | ) | | | (0.05 | ) |
| | | | | | | |
| | Distributions to shareholders from net realized gains | | | (4.27 | ) | | | (2.97 | ) | | | (0.36 | ) | | | (0.69 | ) | | | (2.08 | ) | | | (1.83 | ) |
| | | | | | | |
| | Total distributions | | | (4.30 | ) | | | (3.03 | ) | | | (0.43 | ) | | | (0.73 | ) | | | (2.10 | ) | | | (1.88 | ) |
| | | | | | | |
| | Net asset value, end of period | | $ | 9.63 | | | $ | 14.89 | | | $ | 14.66 | | | $ | 12.63 | | | $ | 12.53 | | | $ | 14.14 | |
| | | | | | | |
| | Total return(c) | | | (3.94 | )% | | | 25.90 | % | | | 20.15 | % | | | 6.69 | % | | | 3.34 | % | | | 27.03 | % |
| | | | | | | |
| | Net assets, end of period (000s) | | $ | 2,847 | | | $ | 2,578 | | | $ | 2,264 | | | $ | 829 | | | $ | 817 | | | $ | 994 | |
| | | | | | | |
| | Ratio of net expenses to average net assets | | | 0.89 | %(d) | | | 0.89 | % | | | 0.90 | % | | | 0.90 | % | | | 0.90 | % | | | 0.91 | % |
| | | | | | | |
| | Ratio of total expenses to average net assets | | | 1.11 | %(d) | | | 1.12 | % | | | 1.30 | % | | | 1.29 | % | | | 1.27 | % | | | 1.28 | % |
| | | | | | | |
| | Ratio of net investment loss to average net assets | | | 0.15 | %(d) | | | 0.15 | % | | | 0.48 | % | | | 0.44 | % | | | 0.37 | %(b) | | | 0.15 | % |
| | | | | | | |
| | Portfolio turnover rate(e) | | | 16 | % | | | 40 | % | | | 54 | % | | | 56 | % | | | 52 | % | | | 64 | % |
| | (a) | | Calculated based on the average shares outstanding methodology. |
| | (b) | | Reflects income recognized from special dividends which amounted to $0.02 per share and 0.18% of average net assets. |
| | (c) | | Assumes investment at the NAV at the beginning of the period, reinvestment of all dividends and distributions, a complete redemption of the investment at the NAV at the end of the period and no sales or redemption charges. Total returns would be reduced if a sales or redemption charge was taken into account. Returns do not reflect the impact of taxes to shareholder relating to Fund distributions or the redemption of Fund shares. Total returns for periods less than one full year are not annualized. |
| | (e) | | The Fund’s portfolio turnover rate is calculated in accordance with regulatory requirements, without regard to transactions involving short term investments. If such transactions were included, the Fund’s portfolio turnover rate may be higher. |
| | |
| 132 | | The accompanying notes are an integral part of these financial statements. |
GOLDMAN SACHS STRATEGIC GROWTH FUND
Financial Highlights(continued)
Selected Share Data for a Share Outstanding Throughout Each Period
| | | | | | | | | | |
| | | | | Goldman Sachs
Strategic Growth Fund | |
| | | | | Class P | |
| | | | | Six Months Ended
February 28, 2019 (Unaudited) | | | Year Ended
August 31, 2018(a) | |
| | Per Share Data | | | | | | | | |
| | | |
| | Net Asset Value, Beginning of period | | $ | 14.90 | | | $ | 13.53 | |
| | | |
| | Net investment income(b) | | | 0.02 | | | | 0.01 | |
| | | |
| | Net realized and unrealized gain (loss) | | | (0.97 | ) | | | 1.36 | |
| | | |
| | Total from investment operations | | | (0.95 | ) | | | 1.37 | |
| | | |
| | Distributions to shareholders from net investment income | | | (0.04 | ) | | | — | |
| | | |
| | Distributions to shareholders from net realized gains | | | (4.27 | ) | | | — | |
| | | |
| | Total Distributions | | | (4.31 | ) | | | — | |
| | | |
| | Net asset value, end of period | | $ | 9.64 | | | $ | 14.90 | |
| | | |
| | Total return(c) | | | (3.82 | )% | | | 10.13 | % |
| | | |
| | Net assets, end of period (in 000s) | | $ | 74,349 | | | $ | 104,590 | |
| | | |
| | Ratio of net expenses to average net assets(d) | | | 0.74 | % | | | 0.74 | % |
| | | |
| | Ratio of total expenses to average net assets(d) | | | 0.95 | % | | | 0.96 | % |
| | | |
| | Ratio of net investment income to average net assets(d) | | | 0.29 | % | | | 0.22 | % |
| | | |
| | Portfolio turnover rate(e) | | | 16 | % | | | 40 | % |
| | (a) | | Class P Shares commenced operations on April 17, 2018. |
| | (b) | | Calculated based on the average shares outstanding methodology. |
| | (c) | | Assumes investment at the NAV at the beginning of the period, reinvestment of all dividends and distributions, a complete redemption of the investment at the NAV at the end of the period and no sales or redemption charges. Total returns would be reduced if a sales or redemption charge was taken into account. Returns do not reflect the impact of taxes to shareholder relating to Fund distributions or the redemption of Fund shares. Total returns for periods less than one full year are not annualized. |
| | (e) | | The Fund’s portfolio turnover rate is calculated in accordance with regulatory requirements, without regard to transactions involving short term investments. If such transactions were included, the Fund’s portfolio turnover rate may be higher. |
| | |
| The accompanying notes are an integral part of these financial statements. | | 133 |
GOLDMAN SACHS STRATEGIC GROWTH FUND
Financial Highlights(continued)
Selected Share Data for a Share Outstanding Throughout Each Period
| | | | | | | | | | | | | | | | | | | | | | | | | | |
| | | | | Goldman Sachs Strategic Growth Fund | |
| | | | | Class R Shares | |
| | | | | Six Months Ended
February 28, 2019
(Unaudited) | | | Year Ended August 31, | |
| | | | | 2018 | | | 2017 | | | 2016 | | | 2015 | | | 2014 | |
| | Per Share Data | | | | | | | | | | | | | | | | | | | | | | | | |
| | | | | | | |
| | Net asset value, beginning of period | | $ | 13.49 | | | $ | 13.56 | | | $ | 11.75 | | | $ | 11.74 | | | $ | 13.42 | | | $ | 12.26 | |
| | | | | | | |
| | Net investment loss(a) | | | (0.02 | ) | | | (0.04 | ) | | | (0.01 | ) | | | (0.01 | ) | | | (0.01 | )(b) | | | (0.04 | ) |
| | | | | | | |
| | Net realized and unrealized gain (loss) | | | (0.91 | ) | | | 2.96 | | | | 2.23 | | | | 0.73 | | | | 0.41 | | | | 3.05 | |
| | | | | | | |
| | Total from investment operations | | | (0.93 | ) | | | 2.92 | | | | 2.22 | | | | 0.72 | | | | 0.40 | | | | 3.01 | |
| | | | | | | |
| | Distributions to shareholders from net investment income | | | — | (c) | | | (0.02 | ) | | | (0.05 | ) | | | (0.02 | ) | | | — | | | | (0.02 | ) |
| | | | | | | |
| | Distributions to shareholders from net realized gains | | | (4.27 | ) | | | (2.97 | ) | | | (0.36 | ) | | | (0.69 | ) | | | (2.08 | ) | | | (1.83 | ) |
| | | | | | | |
| | Total distributions | | | (4.27 | ) | | | (2.99 | ) | | | (0.41 | ) | | | (0.71 | ) | | | (2.08 | ) | | | (1.85 | ) |
| | | | | | | |
| | Net asset value, end of period | | $ | 8.29 | | | $ | 13.49 | | | $ | 13.56 | | | $ | 11.75 | | | $ | 11.74 | | | $ | 13.42 | |
| | | | | | | |
| | Total return(d) | | | (4.15 | )% | | | 25.29 | % | | | 19.56 | % | | | 6.18 | % | | | 2.78 | % | | | 26.49 | % |
| | | | | | | |
| | Net assets, end of period (000s) | | $ | 300 | | | $ | 255 | | | $ | 169 | | | $ | 81 | | | $ | 77 | | | $ | 15 | |
| | | | | | | |
| | Ratio of net expenses to average net assets | | | 1.39 | %(e) | | | 1.39 | % | | | 1.40 | % | | | 1.40 | % | | | 1.40 | % | | | 1.38 | % |
| | | | | | | |
| | Ratio of total expenses to average net assets | | | 1.61 | %(e) | | | 1.62 | % | | | 1.80 | % | | | 1.79 | % | | | 1.76 | % | | | 1.75 | % |
| | | | | | | |
| | Ratio of net investment loss to average net assets | | | (0.33 | )%(e) | | | (0.34 | )% | | | (0.07 | )% | | | (0.05 | )% | | | (0.07 | )%(b) | | | (0.30 | )% |
| | | | | | | |
| | Portfolio turnover rate(f) | | | 16 | % | | | 40 | % | | | 54 | % | | | 56 | %�� | | | 52 | % | | | 64 | % |
| | (a) | | Calculated based on the average shares outstanding methodology. |
| | (b) | | Reflects income recognized from special dividends which amounted to $0.02 per share and 0.18% of average net assets. |
| | (d) | | Assumes investment at the NAV at the beginning of the period, reinvestment of all dividends and distributions, a complete redemption of the investment at the NAV at the end of the period and no sales or redemption charges. Total returns would be reduced if a sales or redemption charge was taken into account. Returns do not reflect the impact of taxes to shareholder relating to Fund distributions or the redemption of Fund shares. Total returns for periods less than one full year are not annualized. |
| | (f) | | The Fund’s portfolio turnover rate is calculated in accordance with regulatory requirements, without regard to transactions involving short term investments. If such transactions were included, the Fund’s portfolio turnover rate may be higher. |
| | |
| 134 | | The accompanying notes are an integral part of these financial statements. |
GOLDMAN SACHS STRATEGIC GROWTH FUND
Financial Highlights(continued)
Selected Share Data for a Share Outstanding Throughout Each Period
| | | | | | | | | | | | | | | | | | | | | | | | | | |
| | | | | Goldman Sachs Strategic Growth Fund | |
| | | | | Class R6 Shares | |
| | | | | Six Months Ended
February 28, 2019
(Unaudited) | | | Year Ended August 31, | |
| | | | | 2018 | | | 2017 | | | 2016 | | | 2015(a) | | | 2014 | |
| | Per Share Data | | | | | | | | | | | | | | | | | | | | | | | | |
| | | | | | | |
| | Net asset value, beginning of period | | $ | 14.91 | | | $ | 14.66 | | | $ | 12.63 | | | $ | 12.53 | | | $ | 13.36 | | | $ | — | |
| | | | | | | |
| | Net investment income(b) | | | 0.03 | | | | 0.04 | | | | 0.08 | | | | 0.07 | | | | 0.01 | (c) | | | — | |
| | | | | | | |
| | Net realized and unrealized gain (loss) | | | (0.98 | ) | | | 3.25 | | | | 2.40 | | | | 0.77 | | | | (0.84 | ) | | | — | |
| | | | | | | |
| | Total from investment operations | | | (0.95 | ) | | | 3.29 | | | | 2.48 | | | | 0.84 | | | | (0.83 | ) | | | — | |
| | | | | | | |
| | Distributions to shareholders from net investment income | | | (0.04 | ) | | | (0.07 | ) | | | (0.09 | ) | | | (0.05 | ) | | | — | | | | — | |
| | | | | | | |
| | Distributions to shareholders from net realized gains | | | (4.27 | ) | | | (2.97 | ) | | | (0.36 | ) | | | (0.69 | ) | | | — | | | | — | |
| | | | | | | |
| | Total distributions | | | (4.31 | ) | | | (3.04 | ) | | | (0.45 | ) | | | (0.74 | ) | | | — | | | | — | |
| | | | | | | |
| | Net asset value, end of period | | $ | 9.65 | | | $ | 14.91 | | | $ | 14.66 | | | $ | 12.63 | | | $ | 12.53 | | | $ | — | |
| | | | | | | |
| | Total return(d) | | | (3.84 | )% | | | 26.15 | % | | | 20.33 | % | | | 6.83 | % | | | (6.21 | )% | | | — | % |
| | | | | | | |
| | Net assets, end of period (000s) | | $ | 406 | | | $ | 15 | | | $ | 12 | | | $ | 10 | | | $ | 9 | | | $ | — | |
| | | | | | | |
| | Ratio of net expenses to average net assets | | | 0.74 | %(e) | | | 0.74 | % | | | 0.75 | % | | | 0.76 | % | | | 0.73 | %(e) | | | — | % |
| | | | | | | |
| | Ratio of total expenses to average net assets | | | 0.99 | %(e) | | | 0.97 | % | | | 1.14 | % | | | 1.15 | % | | | 1.06 | %(e) | | | — | % |
| | | | | | | |
| | Ratio of net investment income to average net assets | | | 0.57 | %(e) | | | 0.30 | % | | | 0.57 | % | | | 0.59 | % | | | 0.68 | %(c)(e) | | | — | % |
| | | | | | | |
| | Portfolio turnover rate(f) | | | 16 | % | | | 40 | % | | | 54 | % | | | 56 | % | | | 52 | % | | | — | % |
| | (a) | | Commenced operations on July 31, 2015. |
| | (b) | | Calculated based on the average shares outstanding methodology. |
| | (c) | | Reflects income recognized from special dividends which amounted to $0.02 per share and 0.18% of average net assets. |
| | (d) | | Assumes investment at the NAV at the beginning of the period, reinvestment of all dividends and distributions, a complete redemption of the investment at the NAV at the end of the period and no sales or redemption charges. Total returns would be reduced if a sales or redemption charge was taken into account. Returns do not reflect the impact of taxes to shareholder relating to Fund distributions or the redemption of Fund shares. Total returns for periods less than one full year are not annualized. |
| | (f) | | The Fund’s portfolio turnover rate is calculated in accordance with regulatory requirements, without regard to transactions involving short term investments. If such transactions were included, the Fund’s portfolio turnover rate may be higher. |
| | |
| The accompanying notes are an integral part of these financial statements. | | 135 |
GOLDMAN SACHS TECHNOLOGY OPPORTUNITIES FUND
Financial Highlights(continued)
Selected Share Data for a Share Outstanding Throughout Each Period
| | | | | | | | | | | | | | | | | | | | | | | | | | |
| | | | | Goldman Sachs Technology Opportunities Fund | |
| | | | | Class A Shares | |
| | | | | Six Months Ended
February 28, 2019
(Unaudited) | | | Year Ended August 31, | |
| | | | | 2018 | | | 2017 | | | 2016 | | | 2015 | | | 2014 | |
| | Per Share Data | | | | | | | | | | | | | | | | | | | | | | | | |
| | | | | | | |
| | Net asset value, beginning of period | | $ | 27.91 | | | $ | 23.04 | | | $ | 18.73 | | | $ | 17.93 | | | $ | 18.97 | | | $ | 15.20 | |
| | | | | | | |
| | Net investment loss(a) | | | (0.07 | ) | | | (0.16 | ) | | | (0.15 | ) | | | (0.12 | )(b) | | | (0.14 | )(c) | | | (0.15 | ) |
| | | | | | | |
| | Net realized and unrealized gain (loss) | | | (1.63 | ) | | | 6.79 | | | | 5.37 | | | | 2.50 | | | | 0.57 | | | | 4.16 | |
| | | | | | | |
| | Total from investment operations | | | (1.70 | ) | | | 6.63 | | | | 5.22 | | | | 2.38 | | | | 0.43 | | | | 4.01 | |
| | | | | | | |
| | Distributions to shareholders from net realized gains | | | (5.06 | ) | | | (1.76 | ) | | | (0.91 | ) | | | (1.58 | ) | | | (1.47 | ) | | | (0.24 | ) |
| | | | | | | |
| | Net asset value, end of period | | $ | 21.15 | | | $ | 27.91 | | | $ | 23.04 | | | $ | 18.73 | | | $ | 17.93 | | | $ | 18.97 | |
| | | | | | | |
| | Total return(d) | | | (4.40 | )% | | | 30.46 | % | | | 29.17 | % | | | 13.71 | % | | | 2.31 | % | | | 26.55 | % |
| | | | | | | |
| | Net assets, end of period (in 000s) | | $ | 290,938 | | | $ | 312,289 | | | $ | 268,746 | | | $ | 233,097 | | | $ | 250,087 | | | $ | 260,982 | |
| | | | | | | |
| | Ratio of net expenses to average net assets | | | 1.36 | %(e) | | | 1.38 | % | | | 1.42 | % | | | 1.47 | % | | | 1.48 | % | | | 1.51 | % |
| | | | | | | |
| | Ratio of total expenses to average net assets | | | 1.47 | %(e) | | | 1.48 | % | | | 1.53 | % | | | 1.55 | % | | | 1.54 | % | | | 1.55 | % |
| | | | | | | |
| | Ratio of net investment loss to average net assets | | | (0.60 | )%(e) | | | (0.65 | )% | | | (0.74 | )% | | | (0.68 | )%(b) | | | (0.74 | )%(c) | | | (0.85 | )% |
| | | | | | | |
| | Portfolio turnover rate(f) | | | 12 | % | | | 46 | % | | | 19 | % | | | 22 | % | | | 41 | % | | | 39 | % |
| | (a) | | Calculated based on the average shares outstanding methodology. |
| | (b) | | Reflects income recognized from special dividends which amounted to $0.02 per share and 0.13% of average net assets. |
| | (c) | | Reflects income recognized from special dividends which amounted to $0.02 per share and 0.10% of average net assets. |
| | (d) | | Assumes investment at the NAV at the beginning of the period, reinvestment of all dividends and distributions, a complete redemption of the investment at the NAV at the end of the period and no sales or redemption charges. Total returns would be reduced if a sales or redemption charge was taken into account. Returns do not reflect the impact of taxes to shareholders relating to Fund distributions or the redemption of Fund shares. Total returns for periods less than one full year are not annualized. |
| | (f) | | The Fund’s portfolio turnover rate is calculated in accordance with regulatory requirements, without regard to transactions involving short term investments. If such transactions were included, the Fund’s portfolio turnover rate may be higher. |
| | |
| 136 | | The accompanying notes are an integral part of these financial statements. |
GOLDMAN SACHS TECHNOLOGY OPPORTUNITIES FUND
Financial Highlights(continued)
Selected Share Data for a Share Outstanding Throughout Each Period
| | | | | | | | | | | | | | | | | | | | | | | | | | |
| | | | | Goldman Sachs Technology Opportunities Fund | |
| | | | | Class C Shares | |
| | | | | Six Months Ended
February 28, 2019
(Unaudited) | | | Year Ended August 31, | |
| | | | | 2018 | | | 2017 | | | 2016 | | | 2015 | | | 2014 | |
| | Per Share Data | | | | | | | | | | | | | | | | | | | | | | | | |
| | | | | | | |
| | Net asset value, beginning of period | | $ | 23.05 | | | $ | 19.45 | | | $ | 16.07 | | | $ | 15.70 | | | $ | 16.91 | | | $ | 13.68 | |
| | | | | | | |
| | Net investment loss(a) | | | (0.13 | ) | | | (0.29 | ) | | | (0.25 | ) | | | (0.22 | )(b) | | | (0.24 | )(c) | | | (0.25 | ) |
| | | | | | | |
| | Net realized and unrealized gain (loss) | | | (1.42 | ) | | | 5.65 | | | | 4.54 | | | | 2.17 | | | | 0.50 | | | | 3.72 | |
| | | | | | | |
| | Total from investment operations | | | (1.55 | ) | | | 5.36 | | | | 4.29 | | | | 1.95 | | | | 0.26 | | | | 3.47 | |
| | | | | | | |
| | Distributions to shareholders from net realized gains | | | (5.06 | ) | | | (1.76 | ) | | | (0.91 | ) | | | (1.58 | ) | | | (1.47 | ) | | | (0.24 | ) |
| | | | | | | |
| | Net asset value, end of period | | $ | 16.44 | | | $ | 23.05 | | | $ | 19.45 | | | $ | 16.07 | | | $ | 15.70 | | | $ | 16.91 | |
| | | | | | | |
| | Total return(d) | | | (4.73 | )% | | | 29.49 | % | | | 28.18 | % | | | 12.87 | % | | | 1.53 | % | | | 25.54 | % |
| | | | | | | |
| | Net assets, end of period (in 000s) | | $ | 27,575 | | | $ | 57,207 | | | $ | 50,779 | | | $ | 52,843 | | | $ | 53,556 | | | $ | 58,602 | |
| | | | | | | |
| | Ratio of net expenses to average net assets | | | 2.11 | %(e) | | | 2.13 | % | | | 2.17 | % | | | 2.22 | % | | | 2.23 | % | | | 2.26 | % |
| | | | | | | |
| | Ratio of total expenses to average net assets | | | 2.22 | %(e) | | | 2.23 | % | | | 2.28 | % | | | 2.30 | % | | | 2.29 | % | | | 2.30 | % |
| | | | | | | |
| | Ratio of net investment loss to average net assets | | | (1.40 | )%(e) | | | (1.40 | )% | | | (1.49 | )% | | | (1.43 | )%(b) | | | (1.49 | )%(c) | | | (1.60 | )% |
| | | | | | | |
| | Portfolio turnover rate(f) | | | 12 | % | | | 46 | % | | | 19 | % | | | 22 | % | | | 41 | % | | | 39 | % |
| | (a) | | Calculated based on the average shares outstanding methodology. |
| | (b) | | Reflects income recognized from special dividends which amounted to $0.02 per share and 0.13% of average net assets. |
| | (c) | | Reflects income recognized from special dividends which amounted to $0.02 per share and 0.10% of average net assets. |
| | (d) | | Assumes investment at the NAV at the beginning of the period, reinvestment of all dividends and distributions, a complete redemption of the investment at the NAV at the end of the period and no sales or redemption charges. Total returns would be reduced if a sales or redemption charge was taken into account. Returns do not reflect the impact of taxes to shareholders relating to Fund distributions or the redemption of Fund shares. Total returns for periods less than one full year are not annualized. |
| | (f) | | The Fund’s portfolio turnover rate is calculated in accordance with regulatory requirements, without regard to transactions involving short term investments. If such transactions were included, the Fund’s portfolio turnover rate may be higher. |
| | |
| The accompanying notes are an integral part of these financial statements. | | 137 |
GOLDMAN SACHS TECHNOLOGY OPPORTUNITIES FUND
Financial Highlights(continued)
Selected Share Data for a Share Outstanding Throughout Each Period
| | | | | | | | | | | | | | | | | | | | | | | | | | |
| | | | | Goldman Sachs Technology Opportunities Fund | |
| | | | | Institutional Shares | |
| | | | | Six Months Ended
February 28, 2019
(Unaudited) | | | Year Ended August 31, | |
| | | | | 2018 | | | 2017 | | | 2016 | | | 2015 | | | 2014 | |
| | Per Share Data | | | | | | | | | | | | | | | | | | | | | | | | |
| | | | | | | |
| | Net asset value, beginning of period | | $ | 30.78 | | | $ | 25.15 | | | $ | 20.29 | | | $ | 19.22 | | | $ | 20.16 | | | $ | 16.08 | |
| | | | | | | |
| | Net investment loss(a) | | | (0.03 | ) | | | (0.07 | ) | | | (0.07 | ) | | | (0.05 | )(b) | | | (0.07 | )(c) | | | (0.08 | ) |
| | | | | | | |
| | Net realized and unrealized gain (loss) | | | (1.74 | ) | | | 7.46 | | | | 5.84 | | | | 2.70 | | | | 0.60 | | | | 4.40 | |
| | | | | | | |
| | Total from investment operations | | | (1.77 | ) | | | 7.39 | | | | 5.77 | | | | 2.65 | | | | 0.53 | | | | 4.32 | |
| | | | | | | |
| | Distributions to shareholders from net realized gains | | | (5.06 | ) | | | (1.76 | ) | | | (0.91 | ) | | | (1.58 | ) | | | (1.47 | ) | | | (0.24 | ) |
| | | | | | | |
| | Net asset value, end of period | | $ | 23.95 | | | $ | 30.78 | | | $ | 25.15 | | | $ | 20.29 | | | $ | 19.22 | | | $ | 20.16 | |
| | | | | | | |
| | Total return(d) | | | (4.20 | )% | | | 30.95 | % | | | 29.66 | % | | | 14.22 | % | | | 2.68 | % | | | 27.03 | % |
| | | | | | | |
| | Net assets, end of period (in 000s) | | $ | 73,023 | | | $ | 87,522 | | | $ | 85,095 | | | $ | 83,746 | | | $ | 92,483 | | | $ | 99,039 | |
| | | | | | | |
| | Ratio of net expenses to average net assets | | | 0.98 | %(e) | | | 0.99 | % | | | 1.02 | % | | | 1.07 | % | | | 1.08 | % | | | 1.11 | % |
| | | | | | | |
| | Ratio of total expenses to average net assets | | | 1.08 | %(e) | | | 1.09 | % | | | 1.13 | % | | | 1.15 | % | | | 1.14 | % | | | 1.15 | % |
| | | | | | | |
| | Ratio of net investment loss to average net assets | | | (0.24 | )%(e) | | | (0.26 | )% | | | (0.34 | )% | | | (0.27 | )%(b) | | | (0.33 | )%(c) | | | (0.45 | )% |
| | | | | | | |
| | Portfolio turnover rate(f) | | | 12 | % | | | 46 | % | | | 19 | % | | | 22 | % | | | 41 | % | | | 39 | % |
| | (a) | | Calculated based on the average shares outstanding methodology. |
| | (b) | | Reflects income recognized from special dividends which amounted to $0.02 per share and 0.13% of average net assets. |
| | (c) | | Reflects income recognized from special dividends which amounted to $0.02 per share and 0.10% of average net assets. |
| | (d) | | Assumes investment at the NAV at the beginning of the period, reinvestment of all dividends and distributions, a complete redemption of the investment at the NAV at the end of the period and no sales or redemption charges. Total returns would be reduced if a sales or redemption charge was taken into account. Returns do not reflect the impact of taxes to shareholder relating to Fund distributions or the redemption of Fund shares. Total returns for periods less than one full year are not annualized. |
| | (f) | | The Fund’s portfolio turnover rate is calculated in accordance with regulatory requirements, without regard to transactions involving short term investments. If such transactions were included, the Fund’s portfolio turnover rate may be higher. |
| | |
| 138 | | The accompanying notes are an integral part of these financial statements. |
GOLDMAN SACHS TECHNOLOGY OPPORTUNITIES FUND
Financial Highlights(continued)
Selected Share Data for a Share Outstanding Throughout Each Period
| | | | | | | | | | | | | | | | | | | | | | | | | | |
| | | | | Goldman Sachs Technology Opportunities Fund | |
| | | | | Service Shares | |
| | | | | Six Months Ended
February 28, 2019
(Unaudited) | | | Year Ended August 31, | |
| | | | | 2018 | | | 2017 | | | 2016 | | | 2015 | | | 2014 | |
| | Per Share Data | | | | | | | | | | | | | | | | | | | | | | | | |
| | | | | | | |
| | Net asset value, beginning of period | | $ | 27.35 | | | $ | 22.64 | | | $ | 18.44 | | | $ | 17.69 | | | $ | 18.76 | | | $ | 15.04 | |
| | | | | | | |
| | Net investment loss(a) | | | (0.08 | ) | | | (0.18 | ) | | | (0.16 | ) | | | (0.14 | )(b) | | | (0.15 | )(c) | | | (0.16 | ) |
| | | | | | | |
| | Net realized and unrealized gain (loss) | | | (1.60 | ) | | | 6.65 | | | | 5.27 | | | | 2.47 | | | | 0.55 | | | | 4.12 | |
| | | | | | | |
| | Total from investment operations | | | (1.68 | ) | | | 6.47 | | | | 5.11 | | | | 2.33 | | | | 0.40 | | | | 3.96 | |
| | | | | | | |
| | Distributions to shareholders from net realized gains | | | (5.06 | ) | | | (1.76 | ) | | | (0.91 | ) | | | (1.58 | ) | | | (1.47 | ) | | | (0.24 | ) |
| | | | | | | |
| | Net asset value, end of period | | $ | 20.61 | | | $ | 27.35 | | | $ | 22.64 | | | $ | 18.44 | | | $ | 17.69 | | | $ | 18.76 | |
| | | | | | | |
| | Total return(d) | | | (4.42 | )% | | | 30.28 | % | | | 29.03 | % | | | 13.61 | % | | | 2.17 | % | | | 26.49 | % |
| | | | | | | |
| | Net assets, end of period (in 000s) | | $ | 29,457 | | | $ | 33,109 | | | $ | 18,919 | | | $ | 11,186 | | | $ | 10,329 | | | $ | 10,712 | |
| | | | | | | |
| | Ratio of net expenses to average net assets | | | 1.48 | %(e) | | | 1.49 | % | | | 1.51 | % | | | 1.57 | % | | | 1.58 | % | | | 1.61 | % |
| | | | | | | |
| | Ratio of total expenses to average net assets | | | 1.58 | %(e) | | | 1.59 | % | | | 1.63 | % | | | 1.65 | % | | | 1.64 | % | | | 1.65 | % |
| | | | | | | |
| | Ratio of net investment loss to average net assets | | | (0.73 | )%(e) | | | (0.75 | )% | | | (0.83 | )% | | | (0.79 | )%(b) | | | (0.84 | )%(c) | | | (0.96 | )% |
| | | | | | | |
| | Portfolio turnover rate(f) | | | 12 | % | | | 46 | % | | | 19 | % | | | 22 | % | | | 41 | % | | | 39 | % |
| | (a) | | Calculated based on the average shares outstanding methodology. |
| | (b) | | Reflects income recognized from special dividends which amounted to $0.02 per share and 0.13% of average net assets. |
| | (c) | | Reflects income recognized from special dividends which amounted to $0.02 per share and 0.10% of average net assets. |
| | (d) | | Assumes investment at the NAV at the beginning of the period, reinvestment of all dividends and distributions, a complete redemption of the investment at the NAV at the end of the period and no sales or redemption charges. Total returns would be reduced if a sales or redemption charge was taken into account. Returns do not reflect the impact of taxes to shareholder relating to Fund distributions or the redemption of Fund shares. Total returns for periods less than one full year are not annualized. |
| | (f) | | The Fund’s portfolio turnover rate is calculated in accordance with regulatory requirements, without regard to transactions involving short term investments. If such transactions were included, the Fund’s portfolio turnover rate may be higher. |
| | |
| The accompanying notes are an integral part of these financial statements. | | 139 |
GOLDMAN SACHS TECHNOLOGY OPPORTUNITIES FUND
Financial Highlights(continued)
Selected Share Data for a Share Outstanding Throughout Each Period
| | | | | | | | | | | | | | | | | | | | | | | | | | |
| | | | | Goldman Sachs Technology Opportunities Fund | |
| | | | | Investor Shares | |
| | | | | Six Months Ended
February 28, 2019
(Unaudited) | | | Year Ended August 31, | |
| | | | | 2018 | | | 2017 | | | 2016 | | | 2015 | | | 2014 | |
| | Per Share Data | | | | | | | | | | | | | | | | | | | | | | | | |
| | | | | | | |
| | Net asset value, beginning of period | | $ | 30.33 | | | $ | 24.84 | | | $ | 20.08 | | | $ | 19.07 | | | $ | 20.04 | | | $ | 16.01 | |
| | | | | | | |
| | Net investment loss(a) | | | (0.05 | ) | | | (0.11 | ) | | | (0.10 | ) | | | (0.08 | )(b) | | | (0.10 | )(c) | | | (0.11 | ) |
| | | | | | | |
| | Net realized and unrealized gain (loss) | | | (1.72 | ) | | | 7.36 | | | | 5.77 | | | | 2.67 | | | | 0.60 | | | | 4.38 | |
| | | | | | | |
| | Total from investment operations | | | (1.77 | ) | | | 7.25 | | | | 5.67 | | | | 2.59 | | | | 0.50 | | | | 4.27 | |
| | | | | | | |
| | Distributions to shareholders from net realized gains | | | (5.06 | ) | | | (1.76 | ) | | | (0.91 | ) | | | (1.58 | ) | | | (1.47 | ) | | | (0.24 | ) |
| | | | | | | |
| | Net asset value, end of period | | $ | 23.50 | | | $ | 30.33 | | | $ | 24.84 | | | $ | 20.08 | | | $ | 19.07 | | | $ | 20.04 | |
| | | | | | | |
| | Total return(d) | | | (4.27 | )% | | | 30.76 | % | | | 29.46 | % | | | 14.00 | % | | | 2.54 | % | | | 26.83 | % |
| | | | | | | |
| | Net assets, end of period (in 000s) | | $ | 18,837 | | | $ | 22,520 | | | $ | 23,317 | | | $ | 6,741 | | | $ | 6,103 | | | $ | 3,228 | |
| | | | | | | |
| | Ratio of net expenses to average net assets | | | 1.11 | %(e) | | | 1.13 | % | | | 1.16 | % | | | 1.22 | % | | | 1.23 | % | | | 1.26 | % |
| | | | | | | |
| | Ratio of total expenses to average net assets | | | 1.22 | %(e) | | | 1.23 | % | | | 1.28 | % | | | 1.30 | % | | | 1.29 | % | | | 1.30 | % |
| | | | | | | |
| | Ratio of net investment loss to average net assets | | | (0.36 | )%(e) | | | (0.40 | )% | | | (0.46 | )% | | | (0.43 | )%(b) | | | (0.52 | )%(c) | | | (0.59 | )% |
| | | | | | | |
| | Portfolio turnover rate(f) | | | 12 | % | | | 46 | % | | | 19 | % | | | 22 | % | | | 41 | % | | | 39 | % |
| | (a) | | Calculated based on the average shares outstanding methodology. |
| | (b) | | Reflects income recognized from special dividends which amounted to $0.02 per share and 0.13% of average net assets. |
| | (c) | | Reflects income recognized from special dividends which amounted to $0.02 per share and 0.10% of average net assets. |
| | (d) | | Assumes investment at the NAV at the beginning of the period, reinvestment of all dividends and distributions, a complete redemption of the investment at the NAV at the end of the period and no sales or redemption charges. Total returns would be reduced if a sales or redemption charge was taken into account. Returns do not reflect the impact of taxes to shareholder relating to Fund distributions or the redemption of Fund shares. Total returns for periods less than one full year are not annualized. |
| | (f) | | The Fund’s portfolio turnover rate is calculated in accordance with regulatory requirements, without regard to transactions involving short term investments. If such transactions were included, the Fund’s portfolio turnover rate may be higher. |
| | |
| 140 | | The accompanying notes are an integral part of these financial statements. |
GOLDMAN SACHS TECHNOLOGY OPPORTUNITIES FUND
Financial Highlights(continued)
Selected Share Data for a Share Outstanding Throughout Each Period
| | | | | | | | | | |
| | | | | Goldman Sachs
Technology Opportunities Fund | |
| | | | | Class P | |
| | | | | Six Months Ended
February 28, 2019
(Unaudited) | | | Period Ended
August 31, 2018(a) | |
| | Per Share Data | | | | | | | | |
| | | |
| | Net asset value, beginning of period | | $ | 30.79 | | | $ | 27.83 | |
| | | |
| | Net investment income (loss)(b) | | | (0.03 | ) | | | 0.01 | |
| | | |
| | Net realized and unrealized gain (loss) | | | (1.74 | ) | | | 2.95 | |
| | | |
| | Total from investment operations | | | (1.77 | ) | | | 2.96 | |
| | | |
| | Distributions to shareholders from net realized gains | | | (5.06 | ) | | | — | |
| | | |
| | Net asset value, end of Period | | $ | 23.96 | | | $ | 30.79 | |
| | | |
| | Total return(c) | | | (4.20 | )% | | | 10.64 | % |
| | | |
| | Net assets, end of period (in 000s) | | $ | 20,719 | | | $ | 24,951 | |
| | | |
| | Ratio of net expenses to average net assets(d) | | | 0.97 | % | | | 0.97 | % |
| | | |
| | Ratio of total expenses to average net assets(d) | | | 1.07 | % | | | 1.14 | % |
| | | |
| | Ratio of net investment income (loss) to average net assets(d) | | | (0.22 | )% | | | 0.08 | % |
| | | |
| | Portfolio turnover rate(e) | | | 12 | % | | | 46 | % |
| | (a) | | Commenced operations on April 17, 2018. |
| | (b) | | Calculated based on the average shares outstanding methodology. |
| | (c) | | Assumes investment at the NAV at the beginning of the period, reinvestment of all dividends and distributions, a complete redemption of the investment at the NAV at the end of the period and no sales or redemption charges. Total returns would be reduced if a sales or redemption charge was taken into account. Returns do not reflect the impact of taxes to shareholder relating to Fund distributions or the redemption of Fund shares. Total returns for periods less than one full year are not annualized. |
| | (e) | | The Fund’s portfolio turnover rate is calculated in accordance with regulatory requirements, without regard to transactions involving short term investments. If such transactions were included, the Fund’s portfolio turnover rate may be higher. |
| | |
| The accompanying notes are an integral part of these financial statements. | | 141 |
GOLDMAN SACHS TECHNOLOGY OPPORTUNITIES FUND
Financial Highlights(continued)
Selected Share Data for a Share Outstanding Throughout Each Period
| | | | | | | | | | |
| | | | | Goldman Sachs
Technology Opportunities Fund | |
| | | | | Class R6 Shares | |
| | | | | Six Months Ended
February 28, 2019
(Unaudited) | | | Period Ended
August 31, 2018(a) | |
| | Per Share Data | | | | | | | | |
| | | |
| | Net asset value, beginning of period | | $ | 30.78 | | | $ | 25.08 | |
| | | |
| | Net investment income (loss)(b) | | | (0.03 | ) | | | (0.04 | ) |
| | | |
| | Net realized and unrealized gain (loss) | | | (1.74 | ) | | | 5.74 | |
| | | |
| | Total from investment operations | | | (1.77 | ) | | | 5.70 | |
| | | |
| | Distributions to shareholders from net realized gains | | | (5.06 | ) | | | — | |
| | | |
| | Net asset value, end of period | | $ | 23.95 | | | $ | 30.78 | |
| | | |
| | Total return(c) | | | (4.21 | )% | | | 22.73 | % |
| | | |
| | Net assets, end of period (in 000s) | | $ | 12 | | | $ | 12 | |
| | | |
| | Ratio of net expenses to average net assets(d) | | | 0.98 | % | | | 0.98 | % |
| | | |
| | Ratio of total expenses to average net assets(d) | | | 1.04 | % | | | 1.08 | % |
| | | |
| | Ratio of Net investment income (loss)(d) | | | (0.23 | )% | | | (0.20 | )% |
| | | |
| | Portfolio turnover rate(e) | | | 12 | % | | | 46 | % |
| | (a) | | Commenced operations on December 29, 2017. |
| | (b) | | Calculated based on the average shares outstanding methodology. |
| | (c) | | Assumes investment at the NAV at the beginning of the period, reinvestment of all dividends and distributions, a complete redemption of the investment at the NAV at the end of the period and no sales or redemption charges. Total returns would be reduced if a sales or redemption charge was taken into account. Returns do not reflect the impact of taxes to shareholder relating to Fund distributions or the redemption of Fund shares. Total returns for periods less than one full year are not annualized. |
| | (e) | | The Fund’s portfolio turnover rate is calculated in accordance with regulatory requirements, without regard to transactions involving short term investments. If such transactions were included, the Fund’s portfolio turnover rate may be higher. |
| | |
| 142 | | The accompanying notes are an integral part of these financial statements. |
GOLDMAN SACHS FUNDAMENTAL EQUITY GROWTH FUNDS
Notes to Financial Statements
February 28, 2019 (Unaudited)
Goldman Sachs Trust (the “Trust”) is a Delaware statutory trust registered under the Investment Company Act of 1940, as amended (the “Act”), as an open-end management investment company. The following table lists those series of the Trust that are included in this report (collectively, the “Funds” or individually a “Fund”), along with their corresponding share classes and respective diversification status under the Act:
| | | | |
| Fund | | Share Classes Offered | | Diversified/ Non-diversified |
Capital Growth, Growth Opportunities, Small/Mid Cap Growth and Strategic Growth | | A, C, Institutional, Service, Investor, P*, R and R6 | | Diversified |
Blue Chip Concentrated Growth and Flexible Cap | | A, C, Institutional, Investor, P*, R and R6 | | Diversified |
Technology Opportunities | | A, C, Institutional, Service, Investor, P* and R6** | | Diversified |
| * | | Commenced operations on April 17, 2018. |
| ** | | Commenced operations on December 29, 2017. |
Class A Shares are sold with a front-end sales charge of up to 5.50%. Class C Shares are sold with a contingent deferred sales charge (“CDSC”) of 1.00%, which is imposed on redemptions made within 12 months of purchase. Institutional, Service, Investor, Class P, Class R and Class R6 Shares are not subject to a sales charge.
Goldman Sachs Asset Management, L.P. (“GSAM”), an affiliate of Goldman Sachs & Co. LLC (“Goldman Sachs”), serves as investment adviser to the Funds pursuant to a management agreement (the “Agreement”) with the Trust.
|
| 2. SIGNIFICANT ACCOUNTING POLICIES |
The financial statements have been prepared in accordance with accounting principles generally accepted in the United States of America (“GAAP”) and require management to make estimates and assumptions that may affect the reported amounts and disclosures. Actual results may differ from those estimates and assumptions.
A. Investment Valuation — The Funds’ valuation policy is to value investments at fair value.
B. Investment Income and Investments — Investment income includes interest income, dividend income and securities lending income, if any. Interest income is accrued daily and adjusted for amortization of premiums and accretion of discounts. Dividend income is recognized on ex-dividend date or, for certain foreign securities, as soon as such information is obtained subsequent to the ex-dividend date. Investment transactions are reflected on trade date. Realized gains and losses are calculated using identified cost. Investment transactions are recorded on the following business day for daily net asset value (“NAV”) calculations. Investment income is recorded net of any foreign withholding taxes, less any amounts reclaimable. The Funds may file withholding tax reclaims in certain jurisdictions to recover a portion of amounts previously withheld. Any foreign capital gains tax is accrued daily based upon net unrealized gains, and is payable upon sale of such investments. Distributions received from the Funds’ investments in U.S. real estate investment trusts (“REITs”) may be characterized as ordinary income, net capital gain or a return of capital. A return of capital is recorded by the Funds as a reduction to the cost basis of the REIT.
C. Class Allocations and Expenses — Investment income, realized and unrealized gain (loss), if any, and non-class specific expenses of each Fund are allocated daily based upon the proportion of net assets of each class. Non-class specific expenses directly incurred by a Fund are charged to that Fund, while such expenses incurred by the Trust are allocated across the applicable Funds on a straight-line and/or pro-rata basis depending upon the nature of the expenses. Class specific expenses, where
143
GOLDMAN SACHS FUNDAMENTAL EQUITY GROWTH FUNDS
Notes to Financial Statements(continued)
February 28, 2019 (Unaudited)
|
| 2. SIGNIFICANT ACCOUNTING POLICIES (continued) |
applicable, are borne by the respective share classes and include Distribution and Service, Transfer Agency and Service and Shareholder Administration fees.
D. Federal Taxes and Distributions to Shareholders — It is each Fund’s policy to comply with the requirements of the Internal Revenue Code of 1986, as amended (the “Code”), applicable to regulated investment companies and to distribute each year substantially all of its investment company taxable income and capital gains to its shareholders. Accordingly, each Fund is not required to make any provisions for the payment of federal income tax. Distributions to shareholders are recorded on the ex-dividend date. Income and capital gains distributions, if any, are declared and paid annually.
Net capital losses, if any, are carried forward to future fiscal years and may be used to the extent allowed by the Code to offset any future capital gains. Losses that are carried forward will retain their character as either short-term or long-term capital losses. Utilization of capital loss carryforwards will reduce the requirement of future capital gains distributions.
The characterization of distributions to shareholders for financial reporting purposes is determined in accordance with federal income tax rules, which may differ from GAAP. The source of each Fund’s distributions may be shown in the accompanying financial statements as either from distributable earnings or capital. Certain components of the Funds’ net assets on the Statements of Assets and Liabilities reflect permanent GAAP/tax differences based on the appropriate tax character.
E. Foreign Currency Translation — The accounting records and reporting currency of the Funds are maintained in U.S. dollars. Assets and liabilities denominated in foreign currencies are translated into U.S. dollars using the current exchange rates at the close of each business day. The effect of changes in foreign currency exchange rates on investments is included within net realized and unrealized gain (loss) on investments. Changes in the value of other assets and liabilities as a result of fluctuations in foreign exchange rates are included in the Statements of Operations within net change in unrealized gain (loss) on foreign currency translation. Transactions denominated in foreign currencies are translated into U.S. dollars on the date the transaction occurred, the effects of which are included within net realized gain (loss) on foreign currency transactions.
F. Commission Recapture — GSAM, on behalf of certain Funds, may direct portfolio trades, subject to seeking best execution, to various brokers who have agreed to rebate a portion of the commissions generated. Such rebates are made directly to a Fund as cash payments and are included in net realized gain (loss) from investments on the Statements of Operations.
| | |
| 3. INVESTMENTS AND FAIR VALUE MEASUREMENTS | | |
U.S. GAAP defines the fair value of a financial instrument as the amount that would be received to sell an asset or paid to transfer a liability in an orderly transaction between market participants at the measurement date (i.e., the exit price); the Funds’ policy is to use the market approach. GAAP establishes a fair value hierarchy that prioritizes the inputs to valuation techniques used to measure fair value. The hierarchy gives the highest priority to unadjusted quoted prices in active markets for identical assets or liabilities (Level 1 measurements) and the lowest priority to unobservable inputs (Level 3 measurements). The levels used for classifying investments are not necessarily an indication of the risk associated with investing in these investments. The three levels of the fair value hierarchy are described below:
Level 1 — Unadjusted quoted prices in active markets that are accessible at the measurement date for identical, unrestricted assets or liabilities;
Level 2 — Quoted prices in markets that are not active or financial instruments for which significant inputs are observable (including, but not limited to, quoted prices for similar investments, interest rates, foreign exchange rates, volatility and credit spreads), either directly or indirectly;
Level 3 — Prices or valuations that require significant unobservable inputs (including GSAM’s assumptions in determining fair value measurement).
The Board of Trustees (“Trustees”) has approved Valuation Procedures that govern the valuation of the portfolio investments held by the Funds, including investments for which market quotations are not readily available. The Trustees have delegated to GSAM day-to-day responsibility for implementing and maintaining internal controls and procedures related to the valuation of the Funds’ investments. To assess the continuing appropriateness of pricing sources and methodologies, GSAM regularly performs price
144
GOLDMAN SACHS FUNDAMENTAL EQUITY GROWTH FUNDS
|
| 3. INVESTMENTS AND FAIR VALUE MEASUREMENTS (continued) |
verification procedures and issues challenges as necessary to third party pricing vendors or brokers, and any differences are reviewed in accordance with the Valuation Procedures.
A. Level 1 and Level 2 Fair Value Investments — The valuation techniques and significant inputs used in determining the fair values for investments classified as Level 1 and Level 2 are as follows:
Equity Securities — Equity securities traded on a United States (“U.S.”) securities exchange or the NASDAQ system, or those located on certain foreign exchanges, including but not limited to the Americas, are valued daily at their last sale price or official closing price on the principal exchange or system on which they are traded. If there is no sale or official closing price or such price is believed by GSAM to not represent fair value, equity securities are valued at the last bid price for long positions and at the last ask price for short positions. To the extent these investments are actively traded, they are classified as Level 1 of the fair value hierarchy, otherwise they are generally classified as Level 2.
Unlisted equity securities for which market quotations are available are valued at the last sale price on the valuation date, or if no sale occurs, at the last bid price, and are generally classified as Level 2. Securities traded on certain foreign securities exchanges are valued daily at fair value determined by an independent fair value service (if available) under Valuation Procedures approved by the Trustees and consistent with applicable regulatory guidance. The independent fair value service takes into account multiple factors including, but not limited to, movements in the securities markets, certain depositary receipts, futures contracts and foreign currency exchange rates that have occurred subsequent to the close of the foreign securities exchange. These investments are generally classified as Level 2 of the fair value hierarchy.
Money Market Funds — Investments in the Goldman Sachs Financial Square Government Fund (“Underlying Fund”) are valued at the NAV of the Institutional Share class on the day of valuation. These investments are generally classified as Level 1 of the fair value hierarchy. For information regarding the Underlying Fund’s accounting policies and investment holdings, please see the Underlying Fund’s shareholder report.
B. Level 3 Fair Value Investments — To the extent that significant inputs to valuation models and other alternative pricing sources are unobservable, or if quotations are not readily available, or if GSAM believes that such quotations do not accurately reflect fair value, the fair value of a Fund’s investments may be determined under Valuation Procedures approved by the Trustees. GSAM, consistent with its procedures and applicable regulatory guidance, may make an adjustment to the most recent valuation prices of either domestic or foreign securities in light of significant events to reflect what it believes to be the fair value of the securities at the time of determining a Fund’s NAV.
C. Fair Value Hierarchy — The following is a summary of the Funds’ investments and derivatives classified in the fair value hierarchy as of February 28, 2019:
| | | | | | | | | | | | |
|
| BLUE CHIP | |
| | | |
| Investment Type | | Level 1 | | | Level 2 | | | Level 3 | |
| | | |
| Assets | | | | | | | | | | | | |
| | | |
Common Stock and/or Other Equity Investments(a) | | | | | | | | | | | | |
| | | |
Europe | | $ | 157,199 | | | $ | — | | | $ | — | |
| | | |
North America | | | 9,912,443 | | | | — | | | | — | |
| | | |
Investment Company | | | 136,636 | | | | — | | | | — | |
| | | |
| Total | | $ | 10,206,278 | | | $ | — | | | $ | — | |
| (a) | | Amounts are disclosed by continent to highlight the impact of time zone differences between local market close and the calculation of net asset value. Security valuations are based on the principal exchange or system on which they are traded, which may differ from country of domicile. |
145
GOLDMAN SACHS FUNDAMENTAL EQUITY GROWTH FUNDS
Notes to Financial Statements(continued)
February 28, 2019 (Unaudited)
|
| 3. INVESTMENTS AND FAIR VALUE MEASUREMENTS (continued) |
| | | | | | | | | | | | |
|
| CAPITAL GROWTH | |
| | | |
| Investment Type | | Level 1 | | | Level 2 | | | Level 3 | |
| | | |
| Assets | | | | | | | | | | | | |
| | | |
Common Stock and/or Other Equity Investments(a) | | | | | | | | | | | | |
| | | |
Asia | | $ | 1,334,048 | | | $ | — | | | $ | — | |
| | | |
Europe | | | 40,027,319 | | | | — | | | | — | |
| | | |
North America | | | 822,107,609 | | | | — | | | | — | |
| | | |
Investment Company | | | 1,113,767 | | | | — | | | | — | |
| | | |
Securities Lending Reinvestment Vehicle | | | 1,239,743 | | | | — | | | | — | |
| | | |
| Total | | $ | 865,822,486 | | | $ | — | | | $ | — | |
| | | |
| CONCENTRATED GROWTH | | | | | | | | | | | | |
| | | |
| Investment Type | | Level 1 | | | Level 2 | | | Level 3 | |
| | | |
| Assets | | | | | | | | | | | | |
| | | |
Common Stock and/or Other Equity Investments(a) | | | | | | | | | | | | |
| | | |
Asia | | $ | 2,419,473 | | | $ | — | | | $ | — | |
| | | |
Europe | | | 6,233,160 | | | | — | | | | — | |
| | | |
North America | | | 130,778,272 | | | | — | | | | — | |
| | | |
| Total | | $ | 139,430,905 | | | $ | — | | | $ | — | |
| | | |
| FLEXIBLE CAP | | | | | | | | | | | | |
| | | |
| Investment Type | | Level 1 | | | Level 2 | | | Level 3 | |
| | | |
| Assets | | | | | | | | | | | | |
| | | |
Common Stock and/or Other Equity Investments(a) | | | | | | | | | | | | |
| | | |
Asia | | $ | 65,675 | | | $ | — | | | $ | — | |
| | | |
Europe | | | 502,787 | | | | — | | | | — | |
| | | |
North America | | | 17,353,870 | | | | — | | | | — | |
| | | |
| Total | | $ | 17,922,332 | | | $ | — | | | $ | — | |
| | | |
| GROWTH OPPORTUNITIES | | | | | | | | | | | | |
| | | |
| Investment Type | | Level 1 | | | Level 2 | | | Level 3 | |
| | | |
| Assets | | | | | | | | | | | | |
| | | |
Common Stock and/or Other Equity Investments(a) | | | | | | | | | | | | |
| | | |
Australia and Oceania | | $ | 13,513,030 | | | $ | — | | | $ | — | |
| | | |
Europe | | | 24,945,371 | | | | — | | | | — | |
| | | |
North America | | | 1,471,582,254 | | | | — | | | | — | |
| | | |
Investment Company | | | 16,991,395 | | | | — | | | | — | |
| | | |
Securities Lending Reinvestment Vehicle | | | 15,382,880 | | | | — | | | | — | |
| | | |
| Total | | $ | 1,542,414,930 | | | $ | — | | | $ | — | |
| (a) | | Amounts are disclosed by continent to highlight the impact of time zone differences between local market close and the calculation of net asset value. Security valuations are based on the principal exchange or system on which they are traded, which may differ from country of domicile. |
146
GOLDMAN SACHS FUNDAMENTAL EQUITY GROWTH FUNDS
|
| 3. INVESTMENTS AND FAIR VALUE MEASUREMENTS (continued) |
| | | | | | | | | | | | |
|
| SMALL/MID CAP GROWTH | |
| | | |
| Investment Type | | Level 1 | | | Level 2 | | | Level 3 | |
| | | |
| Assets | | | | | | | | | | | | |
| | | |
Common Stock and/or Other Equity Investments(a) | | | | | | | | | | | | |
| | | |
Asia | | $ | 22,405,427 | | | $ | — | | | $ | — | |
| | | |
Europe | | | 94,255,170 | | | | — | | | | — | |
| | | |
North America | | | 1,868,109,970 | | | | — | | | | — | |
| | | |
Investment Company | | | 64,720,804 | | | | — | | | | — | |
| | | |
Securities Lending Reinvestment Vehicle | | | 38,657,890 | | | | — | | | | — | |
| | | |
| Total | | $ | 2,088,149,261 | | | $ | — | | | $ | — | |
| | | |
| STRATEGIC GROWTH | | | | | | | | | | | | |
| | | |
| Investment Type | | Level 1 | | | Level 2 | | | Level 3 | |
| | | |
| Assets | | | | | | | | | | | | |
| | | |
Common Stock and/or Other Equity Investments(a) | | | | | | | | | | | | |
| | | |
Asia | | $ | 925,583 | | | $ | — | | | $ | — | |
| | | |
Europe | | | 6,446,337 | | | | — | | | | — | |
| | | |
North America | | | 155,314,139 | | | | — | | | | — | |
| | | |
Investment Company | | | 1,262,216 | | | | — | | | | — | |
| | | |
Securities Lending Reinvestment Vehicle | | | 491,111 | | | | — | | | | — | |
| | | |
| Total | | $ | 164,439,386 | | | $ | — | | | $ | — | |
| | | |
| TECHNOLOGY OPPORTUNITIES | | | | | | | | | | | | |
| | | |
| Investment Type | | Level 1 | | | Level 2 | | | Level 3 | |
| | | |
| Assets | | | | | | | | | | | | |
| | | |
Common Stock and/or Other Equity Investments(a) | | | | | | | | | | | | |
| | | |
Asia | | $ | 14,500,207 | | | $ | — | | | $ | — | |
| | | |
Australia and Oceania | | | 7,221,796 | | | | — | | | | — | |
| | | |
Europe | | | 15,945,770 | | | | — | | | | — | |
| | | |
North America | | | 421,519,813 | | | | — | | | | — | |
| | | |
| Total | | $ | 459,187,586 | | | $ | — | | | $ | — | |
| (a) | | Amounts are disclosed by continent to highlight the impact of time zone differences between local market close and the calculation of net asset value. Security valuations are based on the principal exchange or system on which they are traded, which may differ from country of domicile. |
For further information regarding security characteristics, see the Schedules of Investments.
|
| 4. AGREEMENTS AND AFFILIATED TRANSACTIONS |
A. Management Agreement — Under the Agreement, GSAM manages the Funds, subject to the general supervision of the Trustees.
As compensation for the services rendered pursuant to the Agreement, the assumption of the expenses related thereto and administration of the Funds’ business affairs, including providing facilities, GSAM is entitled to a management fee, accrued daily and paid monthly, equal to an annual percentage rate of each Fund’s average daily net assets.
147
GOLDMAN SACHS FUNDAMENTAL EQUITY GROWTH FUNDS
Notes to Financial Statements(continued)
February 28, 2019 (Unaudited)
|
| 4. AGREEMENTS AND AFFILIATED TRANSACTIONS (continued) |
As of February 28, 2019, contractual management fees with GSAM were as stated below. The effective contractual management rates and effective net management rates represent the rates for the six month period ended February 28, 2019.
| | | | | | | | | | | | | | | | | | | | | | | | | | | | | | |
| | | | | Contractual Management Rate | | | Effective
Contractual
Management
Rate | | | Effective Net
Management
Rate# | |
| Fund | | | | First
$1 billion | | | Next
$1 billion | | | Next
$3 billion | | | Next
$3 billion | | | Over
$8 billion | |
Blue Chip | | | | | 0.55 | % | | | 0.50 | % | | | 0.47 | % | | | 0.46 | % | | | 0.45 | % | | | 0.55 | % | | | 0.55 | % |
Capital Growth | | | | | 0.71 | | | | 0.64 | | | | 0.61 | | | | 0.61 | | | | 0.61 | | | | 0.71 | | | | 0.71 | |
Concentrated Growth | | | | | 0.76 | | | | 0.68 | | | | 0.65 | | | | 0.64 | | | | 0.62 | | | | 0.76 | | | | 0.76 | |
Flexible Cap | | | | | 0.55 | | | | 0.50 | | | | 0.47 | | | | 0.46 | | | | 0.45 | | | | 0.55 | | | | 0.55 | |
Growth Opportunities | | | | | 0.92 | | | | 0.92 | | | | 0.83 | | | | 0.79 | | | | 0.77 | | | | 0.92 | | | | 0.90 | ^ |
Small/Mid Cap Growth | | | | | 0.85 | | | | 0.85 | | | | 0.77 | | | | 0.73 | | | | 0.71 | | | | 0.84 | | | | 0.84 | |
Strategic Growth | | | | | 0.71 | | | | 0.64 | | | | 0.61 | | | | 0.59 | | | | 0.58 | | | | 0.71 | | | | 0.71 | |
Technology Opportunities | | | | | 0.94 | | | | 0.85 | | | | 0.80 | | | | 0.79 | | | | 0.77 | | | | 0.94 | | | | 0.94 | |
| # | | The Effective Net Management Rate includes the impact of management fee waivers of affiliated underlying funds, if any. The Effective Net Management Rate may not correlate to the Contractual Management Rate as a result of management fee waivers that may be in effect from time to time. |
| ^ | | Effective December 28, 2018, the Investment Adviser agreed to waive a portion of its management fee in order to achieve an effective net management fee rate of 0.86% as an annual percentage rate of the Growth Opportunities Fund’s average daily net assets. This arrangement will remain in effect through at least December 28, 2019. Prior to December 28, 2018, the Investment Adviser did not contractually waive a portion of its management fee as an annual percentage rate of the Fund’s average daily net assets. |
The Funds invest in Institutional Shares of the Goldman Sachs Financial Square Government Fund (“Government Money Market Fund”), which is an affiliated Underlying Fund. GSAM has agreed to waive a portion of its management fee payable by the Funds in an amount equal to the management fee it earns as an investment adviser to the affiliated Underlying Fund in which the Funds invest, except those management fees it earns from the Funds’ investments of cash collateral received in connection with securities lending transactions in the Goldman Sachs Financial Square Government Fund. For the six months ended February 28, 2019, the management fee waived by GSAM for each Fund was as follows:
| | | | | | |
| Fund | | | | Management Fee Waived | |
Blue Chip | | | | $ | 137 | |
Capital Growth | | | | | 3,117 | |
Concentrated Growth | | | | | 123 | |
Flexible Cap | | | | | 1 | |
Growth Opportunities | | | | | 5,119 | |
Small/Mid-Cap Growth | | | | | 9,264 | |
Strategic Growth | | | | | 153 | |
Technology Opportunities | | | | | 1,494 | |
148
GOLDMAN SACHS FUNDAMENTAL EQUITY GROWTH FUNDS
|
| 4. AGREEMENTS AND AFFILIATED TRANSACTIONS (continued) |
B. Distribution and/or Service (12b-1) Plans — The Trust, on behalf of Class A and Class R Shares of each applicable Fund, has adopted Distribution and Service Plans subject to Rule 12b-1 under the Act. Under the Distribution and Service Plans, Goldman Sachs, which serves as distributor (the “Distributor”), is entitled to a fee accrued daily and paid monthly for distribution services and personal and account maintenance services, which may then be paid by Goldman Sachs to authorized dealers. These fees are equal to an annual percentage rate of the average daily net assets attributable to Class A or Class R Shares of the Funds, as applicable, as set forth below.
The Trust, on behalf of Class C Shares of each applicable Fund, has adopted a Distribution Plan subject to Rule 12b-1 under the Act. Under the Distribution Plan, Goldman Sachs as Distributor is entitled to a fee accrued daily and paid monthly for distribution services, which may then be paid by Goldman Sachs to authorized dealers. These fees are equal to an annual percentage rate of the average daily net assets attributable to Class C Shares of the Funds, as set forth below.
The Trust, on behalf of Service Shares of each applicable Fund, has adopted a Service Plan subject to Rule 12b-1 under the Act to allow Service Shares to compensate service organizations (including Goldman Sachs) for providing personal and account maintenance services to their customers who are beneficial owners of such shares. The Service Plan provides for compensation to the service organizations equal to an annual percentage rate of the average daily net assets attributable to Service Shares of the Funds, as set forth below.
| | | | | | | | | | | | | | | | |
| | | Distribution and/or Service Plan Rates | |
| | | Class A* | | | Class C | | | Class R* | | | Service | |
Distribution and/or Service Plan | | | 0.25 | % | | | 0.75 | % | | | 0.50 | % | | | 0.25 | % |
| * | | With respect to Class A and Class R Shares, the Distributor at its discretion may use compensation for distribution services paid under the Distribution and Service Plans to compensate service organizations for personal and account maintenance services and expenses as long as such total compensation does not exceed the maximum cap on “service fees” imposed by the Financial Industry Regulatory Authority. |
C. Distribution Agreement — Goldman Sachs, as Distributor of the shares of the Funds pursuant to a Distribution Agreement, may retain a portion of the Class A Shares’ front end sales charge and Class C Shares’ CDSC. During the six months ended February 28, 2019, Goldman Sachs advised that it retained the following amounts:
| | | | | | | | | | |
| | | | | Front End
Sales Charge
| | | Contingent Deferred
Sales Charge
| |
| Fund | | | | Class A | | | Class C | |
Blue Chip | | | | $ | 414 | | | $ | — | |
Capital Growth | | | | | 11,610 | | | | 9,203 | |
Concentrated Growth | | | | | 306 | | | | — | |
Flexible Cap | | | | | 454 | | | | — | |
Growth Opportunities | | | | | 3,461 | | | | 604 | |
Small/Mid Cap Growth | | | | | 13,652 | | | | — | |
Strategic Growth | | | | | 688 | | | | 15 | |
Technology Opportunities | | | | | 6,207 | | | | 414 | |
149
GOLDMAN SACHS FUNDAMENTAL EQUITY GROWTH FUNDS
Notes to Financial Statements(continued)
February 28, 2019 (Unaudited)
|
| 4. AGREEMENTS AND AFFILIATED TRANSACTIONS (continued) |
D. Service and/or Shareholder Administration Plans — The Trust, on behalf of each applicable Fund, has adopted Service and/or Shareholder Administration Plans to allow Class C and Service Shares, respectively, to compensate service organizations (including Goldman Sachs) for providing varying levels of personal and account maintenance and/or shareholder administration services to their customers who are beneficial owners of such shares. The Service and/or Shareholder Administration Plans each provide for compensation to the service organizations equal to an annual percentage rate of 0.25% the average daily net assets attributable to Class C or Service Shares of the Funds, respectively.
E. Transfer Agency Agreement — Goldman Sachs also serves as the transfer agent of the Funds for a fee pursuant to the Transfer Agency Agreement. The fees charged for such transfer agency services are accrued daily and paid monthly at annual rates as follows: 0.18% of the average daily net assets of Class A, Class C, Investor and Class R Shares; 0.03% of the average daily net assets of Class P and Class R6 Shares; and 0.04% of the average daily net assets of Institutional and Service Shares.
Goldman Sachs has agreed to waive a portion of its transfer agency fee equal to 0.05% as an annual percentage rate of the average daily net assets attributable to Class A, Class C, Investor, and Class R Shares of the Growth Opportunities Fund. This arrangement will remain in effect through at least December 28, 2019, and prior to such date, the Investment Adviser may not terminate the arrangement without the approval of the Board of Trustees.
Goldman Sachs has agreed to waive a portion of its transfer agency fee equal to 0.07% as an annual percentage rate of the average daily net assets attributable to Class A, Class C, Investor, and Class R Shares of the Small/Mid Cap Growth Fund. This arrangement will remain in effect through at least December 28, 2019, and prior to such date, the Investment Adviser may not terminate the arrangement without the approval of the Board of Trustees. Prior to December 28, 2018 such waiver was 0.03%.
Effective December 28, 2018, Goldman Sachs has agreed to waive a portion of its transfer agency fee equal to 0.04% as an annual percentage rate of the average daily net assets attributable to Class A, Class C and Investor Shares of the Technology Opportunities Fund. This arrangement will remain in effect through at least December 28, 2019, and prior to such date, the Investment Adviser may not terminate the arrangement without the approval of the Board of Trustees. Prior to December 28, 2018, there was no transfer agency waiver in place for this fund.
Goldman Sachs has agreed to waive a portion of its transfer agency fee equal to 0.03% as an annual percentage rate of the average daily net assets attributable to Class A, Class C, Investor and Class R Shares of the Blue Chip and Concentrated Growth Funds. This arrangement will remain in effect through at least December 28, 2019, and prior to such date, the Investment Adviser may not terminate the arrangement without the approval of the Board of Trustees.
Effective December 28, 2018, the transfer agency fee waiver was eliminated for the Flexible Cap Fund. Prior to December 28, 2018, Goldman Sachs had agreed to waive a portion of its transfer agency fee equal to 0.03% as an annual percentage rate of the average daily net assets attributable to Class A, Class C, Investor and Class R Shares of the Fund.
F. Other Expense Agreements and Affiliated Transactions— GSAM has agreed to limit certain “Other Expenses” of the Funds (excluding acquired fund fees and expenses, transfer agency fees and expenses, service fees and shareholder administration fees (as applicable), taxes, interest, brokerage fees, expenses of shareholder meetings, litigation and indemnification, and extraordinary expenses) to the extent such expenses exceed, on an annual basis, a percentage rate of the average daily net assets of each Fund. Such Other Expense reimbursements, if any, are accrued daily and paid monthly. In addition, the Funds are not obligated to reimburse GSAM for prior fiscal year expense reimbursements, if any. The Other Expense limitations as an annual percentage rate of average daily net assets for Blue Chip, Capital Growth, Concentrated Growth, Flexible Cap, Growth Opportunities, Small/Mid Cap Growth, Strategic Growth, and Technology Opportunities Funds are 0.084%, 0.004%, 0.004%, 0.004%, 0.004%, 0.064%, 0.004%, and 0.004%, respectively. These Other Expense limitations will remain in place through at least December 28, 2019, and prior to such date GSAM may not terminate the arrangements without the approval of the Trustees. Prior to December 28, 2018, the Other Expense limitation for the Growth Opportunities Fund was 0.014%. In addition, the Funds have entered into certain offset arrangements with the transfer agent, which may result in a reduction of the Funds’ expenses and are received irrespective of the application of the “Other Expense” limitations described above.
150
GOLDMAN SACHS FUNDAMENTAL EQUITY GROWTH FUNDS
|
| 4. AGREEMENTS AND AFFILIATED TRANSACTIONS (continued) |
For the six months ended February 28, 2019, these expense reductions, including any fee waivers and Other Expense reimbursements, were as follows:
| | | | | | | | | | | | | | | | | | |
| Fund | | | | Management
Fee Waiver | | | Transfer Agency
Fee Waivers/Credits | | | Other
Expense
Reimbursements | | | Total
Expense
Reductions | |
Blue Chip | | | | $ | 137 | | | $ | 520 | | | $ | 163,685 | | | $ | 164,342 | |
Capital Growth | | | | | 3,117 | | | | 1,350 | | | | 279,284 | | | | 283,751 | |
Concentrated Growth | | | | | 123 | | | | 1,099 | | | | 219,116 | | | | 220,338 | |
Flexible Cap | | | | | 1 | | | | 638 | | | | 159,434 | | | | 160,073 | |
Growth Opportunities | | | | | 156,798 | | | | 134,158 | | | | 248,442 | | | | 539,398 | |
Small/Mid Cap Growth | | | | | 9,264 | | | | 203,595 | | | | — | | | | 212,859 | |
Strategic Growth | | | | | 153 | | | | 32 | | | | 191,316 | | | | 191,501 | |
Technology Opportunities | | | | | 1,494 | | | | 22,694 | | | | 216,879 | | | | 241,067 | |
G. Line of Credit Facility — As of February 28, 2019, the Funds participated in a $770,000,000 committed, unsecured revolving line of credit facility (the “facility”) together with other funds of the Trust and certain registered investment companies having management agreements with GSAM or its affiliates. This facility is to be used for temporary emergency purposes, or to allow for an orderly liquidation of securities to meet redemption requests. The interest rate on borrowings is based on the federal funds rate. The facility also requires a fee to be paid by the Funds based on the amount of the commitment that has not been utilized. For the six months ended February 28, 2019, the Funds did not have any borrowings under the facility.
H. Other Transactions with Affiliates — For the six months ended February 28, 2019, Goldman Sachs earned $94, $9,955, $54,264, $6, and $2,186, in brokerage commissions from portfolio transactions, including futures transactions executed with Goldman Sachs as the Futures Commission Merchant, on behalf of the Flexible Cap, Growth Opportunities, Small/Mid Cap Growth, Strategic Growth, and Technology Opportunities Funds respectively.
The table below shows the transactions in and earnings from investments in the Government Money Market Fund — Institutional Shares for the six months ended February 28, 2019:
| | | | | | | | | | | | | | | | | | | | | | | | |
| Fund | | Market
Value as of
August 31, 2018 | | | Purchases
at Cost | | | Proceeds
from Sales | | | Market
Value as of
February 28, 2018 | | | Shares as of
February 28, 2018 | | | Dividend
Income | |
Blue Chip | | $ | 99,977 | | | $ | 2,843,244 | | | $ | (2,806,585 | ) | | $ | 136,636 | | | | 136,636 | | | $ | 1,984 | |
Capital Growth | | | 5,675 | | | | 25,988,516 | | | | (24,880,424 | ) | | | 1,113,767 | | | | 1,113,767 | | | | 40,295 | |
Concentrated Growth | | | — | | | | 5,784,707 | | | | (5,784,707 | ) | | | — | | | | — | | | | 1,637 | |
Flexible Cap | | | — | | | | 90,209 | | | | (90,209 | ) | | | — | | | | — | | | | 9 | |
Growth Opportunities | | | 35,064,516 | | | | 203,043,736 | | | | (221,116,857 | ) | | | 16,991,395 | | | | 16,991,395 | | | | 57,201 | |
Small/Mid Cap Growth | | | 25,981,945 | | | | 284,812,088 | | | | (246,073,229 | ) | | | 64,720,804 | | | | 64,720,804 | | | | 123,185 | |
Strategic Growth | | | 570 | | | | 4,996,176 | | | | (3,734,530 | ) | | | 1,262,216 | | | | 1,262,216 | | | | 2,216 | |
Technology Opportunities | | | 1,263 | | | | 20,501,425 | | | | (20,502,688 | ) | | | — | | | | — | | | | 19,100 | |
151
GOLDMAN SACHS FUNDAMENTAL EQUITY GROWTH FUNDS
Notes to Financial Statements(continued)
February 28, 2019 (Unaudited)
|
| 4. AGREEMENTS AND AFFILIATED TRANSACTIONS (continued) |
As of February 28, 2019, The Goldman Sachs Group, Inc. was the beneficial owner of 5% or more of total outstanding shares of the following Funds:
| | | | | | | | | | | | | | | | | | | | | | | | |
| Fund | | | | | Institutional | | | Investor | | | Class R | | | Class R6 | | | Class P | |
Blue Chip | | | | | | | 52 | % | | | 8 | % | | | 100 | % | | | — | % | | | — | % |
Concentrated Growth | | | | | | | — | | | | 10 | | | | 65 | | | | — | | | | — | |
Flexible Cap | | | | | | | — | | | | 44 | | | | 56 | | | | 7 | | | | — | |
Technology Opportunities | | | | | | | — | | | | — | | | | — | | | | 100 | | | | — | |
|
| 5. PORTFOLIO SECURITIES TRANSACTIONS |
The cost of purchases and proceeds from sales and maturities of long-term securities for the six months ended February 28, 2019, were:
| | | | | | | | | | |
| Fund | | | | Purchases | | | Sales and Maturities | |
Blue Chip | | | | $ | 3,831,821 | | | $ | 3,613,481 | |
Capital Growth | | | | | 258,992,106 | | | | 362,825,497 | |
Concentrated Growth | | | | | 27,279,420 | | | | 44,758,880 | |
Flexible Cap | | | | | 4,388,446 | | | | 6,405,805 | |
Growth Opportunities | | | | | 505,531,748 | | | | 1,057,201,212 | |
Small/Mid Cap Growth | | | | | 967,579,421 | | | | 1,334,029,396 | |
Strategic Growth | | | | | 29,323,754 | | | | 72,616,660 | |
Technology Opportunities | | | | | 55,298,374 | | | | 100,279,506 | |
The Funds may lend their securities through a securities lending agent, the Bank of New York Mellon (“BNYM”), to certain qualified borrowers. In accordance with the Funds’ securities lending procedures, the Funds receive cash collateral at least equal to the market value of the securities on loan. The market value of the loaned securities is determined at the close of business of the Funds at their last sale price or official closing price on the principal exchange or system on which they are traded, and any additional required collateral is delivered to the Funds on the next business day. As with other extensions of credit, the Funds may experience delay in the recovery of their securities or incur a loss should the borrower of the securities breach its agreement with the Funds or become insolvent at a time when the collateral is insufficient to cover the cost of repurchasing securities on loan. Dividend income received from securities on loan may not be subject to withholding taxes and therefore withholding taxes paid may differ from the amounts listed in the Statements of Operations. Loans of securities are terminable at any time and as such 1) the remaining contractual maturities of the outstanding securities lending transactions are considered to be overnight and continuous and 2) the borrower, after notice, is required to return borrowed securities within the standard time period for settlement of securities transactions.
152
GOLDMAN SACHS FUNDAMENTAL EQUITY GROWTH FUNDS
|
| 6. SECURITIES LENDING (continued) |
The Capital Growth, Growth Opportunities, Small/Mid Cap Growth and Strategic Growth Funds invest the cash collateral received in connection with securities lending transactions in the Government Money Market Fund, an affiliated series of the Goldman Sachs Trust. The Government Money Market Fund is registered under the Act as an open end investment company, is subject to Rule 2a-7 under the Act, and is managed by GSAM, for which GSAM may receive a management fee of up to 0.16% on an annualized basis of the average daily net assets of the Government Money Market Fund.
In the event of a default by a borrower with respect to any loan, BNYM may exercise any and all remedies provided under the applicable borrower agreement to make the Funds whole. These remedies include purchasing replacement securities by applying the collateral held from the defaulting broker against the purchase cost of the replacement securities. If BNYM is unable to purchase replacement securities, BNYM will indemnify the Funds by paying the Funds an amount equal to the market value of the securities loaned minus the value of cash collateral received from the borrower for the loan, subject to an exclusion for any shortfalls resulting from a loss of value in such cash collateral due to reinvestment risk. The Funds may enter into master netting agreements with borrowers, which provide the right, in the event of a default (including bankruptcy or insolvency), for the non-defaulting party to liquidate the collateral and calculate net exposure to the defaulting party or request additional collateral. However, in the event of a default by a borrower, a resolution authority could determine that such rights are not enforceable due to the restrictions or prohibitions against the right of set-off that may be imposed in accordance with a particular jurisdiction’s bankruptcy or insolvency laws. The Funds’ loaned securities were all subject to enforceable Securities Lending Agreements and the value of the collateral was at least equal to the value of the cash received. The amounts of the Funds’ overnight and continuous agreements, which represent the gross amounts of recognized liabilities for securities lending transactions outstanding as of February 28, 2019, are disclosed as “Payable upon return of securities loaned” on the Statements of Assets and Liabilities.
Each of the Funds and BNYM received compensation relating to the lending of the Funds’ securities. The amounts earned, if any, by the Funds for the six months ended February 28, 2019, are reported under Investment Income on the Statements of Operations.
The following table provides information about the Funds’ investments in the Government Money Market Fund for the six months ended February 28, 2019:
| | | | | | | | | | | | | | | | | | |
| Fund | | | | Beginning
Value as of
August 31, 2018 | | | Purchases
at Cost | | | Proceeds
from Sales | | | Ending
Value as of
February 28, 2019 | |
Blue Chip | | | | $ | — | | | $ | — | | | $ | — | | | $ | — | |
Capital Growth | | | | | 2,135,000 | | | | 11,297,577 | | | | (12,192,834 | ) | | | 1,239,743 | |
Concentrated Growth | | | | | — | | | | 3,267,775 | | | | (3,267,775 | ) | | | — | |
Flexible Cap | | | | | 70,000 | | | | 193,982 | | | | (263,982 | ) | | | — | |
Growth Opportunities | | | | | 26,971,503 | | | | 69,155,650 | | | | (80,744,273 | ) | | | 15,382,880 | |
Small/Mid Cap Growth | | | | | 12,039,425 | | | | 165,141,160 | | | | (138,522,695 | ) | | | 38,657,890 | |
Strategic Growth | | | | | — | | | | 2,973,470 | | | | (2,482,359 | ) | | | 491,111 | |
Technology Opportunities | | | | | — | | | | — | | | | — | | | | — | |
153
GOLDMAN SACHS FUNDAMENTAL EQUITY GROWTH FUNDS
Notes to Financial Statements(continued)
February 28, 2019 (Unaudited)
As of the Funds’ most recent fiscal year end, August 31, 2018, the Funds’ certain timing differences on a tax basis were as follows:
| | | | | | | | | | | | | | | | | | | | | | | | | | | | | | | | |
| | | Blue Chip | | | Capital
Growth | | | Concentrated
Growth | | | Flexible
Cap
Growth | | | Growth
Opportunities | | | Small/Mid
Cap Growth | | | Strategic
Growth | | | Technology
Opportunities | |
Timing differences (Qualified Late Year Loss Deferral and Post October Losses) | | $ | (64,352 | ) | | $ | (4 | ) | | $ | — | | | $ | — | | | $ | (894,899 | ) | | $ | (7,693,180 | ) | | $ | — | | | $ | (1,990,540 | ) |
As of February 28, 2019, the Funds’ aggregate security unrealized gains and losses based on cost for U.S. federal income tax purposes were as follows:
| | | | | | | | | | | | | | | | | | | | | | | | | | | | | | | | |
| | | Blue Chip | | | Capital Growth | | | Concentrated
Growth | | | Flexible Cap
Growth | | | Growth
Opportunities | | | Small/Mid Cap
Growth | | | Strategic
Growth | | | Technology
Opportunities | |
Tax Cost | | $ | 9,031,365 | | | $ | 681,623,506 | | | $ | 94,153,675 | | | $ | 14,432,303 | | | $ | 1,224,892,259 | | | $ | 1,737,159,600 | | | $ | 96,523,586 | | | $ | 249,613,169 | |
Gross unrealized gain | | | 1,259,092 | | | | 206,258,444 | | | | 47,852,523 | | | | 4,037,957 | | | | 345,977,662 | | | | 425,908,448 | | | | 70,077,146 | | | | 214,529,909 | |
Gross unrealized loss | | | (84,179 | ) | | | (22,059,464 | ) | | | (2,575,293 | ) | | | (547,928 | ) | | | (28,454,991 | ) | | | (74,918,787 | ) | | | (2,161,346 | ) | | | (4,955,492 | ) |
Net unrealized gains (losses) | | $ | 1,174,913 | | | $ | 184,198,980 | | | $ | 45,277,230 | | | $ | 3,490,029 | | | $ | 317,522,671 | | | $ | 350,989,661 | | | $ | 67,915,800 | | | $ | 209,574,417 | |
The difference between GAAP-basis and tax basis unrealized gains (losses) is attributable primarily to wash sales, differences to the tax treatment of underlying fund investments, and partnership investments.
GSAM has reviewed the Funds’ tax positions for all open tax years (the current and prior three years, as applicable) and have concluded that no provision for income tax is required in the Funds’ financial statements. Such open tax years remain subject to examination and adjustment by tax authorities.
The Funds’ risks include, but are not limited to, the following:
Foreign and Emerging Countries Risk — Investing in foreign markets may involve special risks and considerations not typically associated with investing in the United States. Foreign securities may be subject to risk of loss because of more or less foreign government regulation, less public information and less economic, political and social stability in the countries in which a Fund invest. The imposition of exchange controls (including repatriation restrictions), confiscations, trade restrictions (including tariffs) and other government restrictions by the United States or other governments, or from problems in share registration, settlement or custody, may also result in losses. Foreign risk also involves the risk of negative foreign currency rate fluctuations, which may cause the value of securities denominated in such foreign currency (or other instruments through which a Fund have exposure to foreign currencies) to decline in value. Currency exchange rates may fluctuate significantly over short periods of time.
Foreign Custody Risk — If a Fund invests in foreign securities, the Fund may hold such securities and cash with foreign banks, agents, and securities depositories appointed by the Fund’s custodian (each a “Foreign Custodian”). Some foreign custodians may be recently organized or new to the foreign custody business. In some countries, Foreign Custodians may be subject to little or regulatory oversight over, or independent evaluation of, their operations. Further, the laws of certain countries may place limitations on a Fund’s ability to recover its assets if a Foreign Custodian enters bankruptcy. Investments in emerging markets may be subject to even greater custody risks than investments in more developed markets. Custody services in emerging market countries are very often undeveloped and may be considerably less well regulated than in more developed countries, and thus may not afford the same level of investor protection as would apply in developed countries.
Industry Concentration Risk — The Technology Opportunities Fund invests primarily in equity investments in high-quality technology, media, or service companies that adopt or use technology to improve their cost structure, revenue opportunities or competitive advantage. Because of its focus on technology, media and service companies, the Technology Opportunities Fund is
154
GOLDMAN SACHS FUNDAMENTAL EQUITY GROWTH FUNDS
|
| 8. OTHER RISKS (continued) |
subject to greater risk of loss as a result of adverse economic, business or other developments than if its investments were diversified across different industry sectors. The Technology Opportunities Fund may also invest in a relatively few number of issuers. Thus, the Technology Opportunities Fund may be more susceptible to adverse developments affecting any single issuer held in its portfolio and may be more susceptible to greater losses because of these developments.
Investments in Other Investment Companies Risk — As a shareholder of another investment company, including an ETF, a Fund will indirectly bear its proportionate share of any net management fees and other expenses paid by such other investment companies, in addition to the fees and expenses regularly borne by the Fund. ETFs are subject to risks that do not apply to conventional mutual funds, including but not limited to the following: (i) the market price of the ETF’s shares may trade at a premium or a discount to their NAV; and (ii) an active trading market for an ETF’s shares may not develop or be maintained.
Large Shareholder Transactions Risk — A Fund may experience adverse effects when certain large shareholders, such as other funds, institutional investors (including those trading by use of non-discretionary mathematical formulas), financial intermediaries (who may make investment decisions on behalf of underlying clients and/or include a Fund in their investment model), individuals, accounts and Goldman Sachs affiliates, purchase or redeem large amounts of shares of a Fund. Such large shareholder redemptions, which may occur rapidly or unexpectedly, may cause a Fund to sell portfolio securities at times when it would not otherwise do so, which may negatively impact a Fund’s NAV and liquidity. These transactions may also accelerate the realization of taxable income to shareholders if such sales of investments resulted in gains, and may also increase transaction costs. In addition, a large redemption could result in a Fund’s current expenses being allocated over a smaller asset base, leading to an increase in the Fund’s expense ratio. Similarly, large Fund share purchases may adversely affect a Fund’s performance to the extent that the Fund is delayed in investing new cash or otherwise maintains a larger cash position than it ordinarily would.
Liquidity Risk— A Fund may make investments that are illiquid or that may become less liquid in response to market developments or adverse investor perceptions. Illiquid investments may be more difficult to value. Liquidity risk may also refer to the risk that a Fund will not be able to pay redemption proceeds within the allowable time period or without significant dilution to remaining investors’ interests because of unusual market conditions, an unusually high volume of redemption requests, or other reasons. To meet redemption requests, a Fund may be forced to sell investments at an unfavorable time and/or under unfavorable conditions. If a Fund is forced to sell securities at an unfavorable time and/or under unfavorable conditions, such sales may adversely affect the Fund’s NAV and dilute remaining investors’ interests. These risks may be more pronounced in connection with a Fund’s investments in securities of issuers located in emerging market countries.
Market and Credit Risks — In the normal course of business, a Fund trades financial instruments and enters into financial transactions where risk of potential loss exists due to changes in the market (market risk). Additionally, a Fund may also be exposed to credit risk in the event that an issuer or guarantor fails to perform or that an institution or entity with which a Fund has unsettled or open transactions defaults.
Under the Trust’s organizational documents, its Trustees, officers, employees and agents are indemnified, to the extent permitted by the Act and state law, against certain liabilities that may arise out of performance of their duties to the Funds. Additionally, in the course of business, the Funds enter into contracts that contain a variety of indemnification clauses. The Funds’ maximum exposure under these arrangements is unknown, as this would involve future claims that may be made against the Funds that have not yet occurred. However, GSAM believes the risk of loss under these arrangements to be remote.
Subsequent events after the Statements of Assets and Liabilities date have been evaluated, and GSAM has concluded that there is no impact requiring adjustment or disclosure in the financial statements.
155
GOLDMAN SACHS FUNDAMENTAL EQUITY GROWTH FUNDS
Notes to Financial Statements(continued)
February 28, 2019 (Unaudited)
|
| 11. SUMMARY OF SHARE TRANSACTIONS |
Share activity is as follows:
| | | | | | | | | | | | | | | | |
| | | Blue Chip Fund | |
| | | | |
| | | For the Six Months Ended
February 28, 2019
(Unaudited) | | | For the Fiscal Year Ended
August 31, 2018
| |
| | | | |
| | | Shares | | | Dollars | | | Shares | | | Dollars | |
| | | | |
| Class A Shares | | | | | | | | | | | | | | | | |
Shares sold | | | 68,313 | | | $ | 802,837 | | | | 48,018 | | | $ | 657,169 | |
Reinvestment of distributions | | | 17,899 | | | | 211,711 | | | | 31,111 | | | | 395,165 | |
Shares redeemed | | | (32,582 | ) | | | (393,671 | ) | | | (24,957 | ) | | | (333,348 | ) |
| | | | 53,630 | | | | 620,877 | | | | 54,172 | | | | 718,986 | |
| Class C Shares | | | | | | | | | | | | | | | | |
Shares sold | | | 105,670 | | | | 1,151,277 | | | | 9,439 | | | | 132,560 | |
Reinvestment of distributions | | | 2,215 | | | | 24,978 | | | | 4,157 | | | | 50,601 | |
Shares redeemed | | | (9,158 | ) | | | (98,684 | ) | | | (13,146 | ) | | | (177,027 | ) |
| | | | 98,727 | | | | 1,077,571 | | | | 450 | | | | 6,134 | |
| Institutional Shares | | | | | | | | | | | | | | | | |
Shares sold | | | 118,577 | | | | 1,525,510 | | | | 321,245 | | | | 4,299,878 | |
Reinvestment of distributions | | | 20,066 | | | | 239,180 | | | | 43,322 | | | | 554,953 | |
Shares redeemed | | | (426,062 | ) | | | (5,397,379 | ) | | | (246,651 | ) | | | (3,257,586 | ) |
| | | | (287,419 | ) | | | (3,632,689 | ) | | | 117,916 | | | | 1,597,245 | |
| Investor Shares | | | | | | | | | | | | | | | | |
Shares sold | | | 11,401 | | | | 129,372 | | | | 5,260 | | | | 78,320 | |
Reinvestment of distributions | | | 1,602 | | | | 19,105 | | | | 2,793 | | | | 35,755 | |
Shares redeemed | | | (10,393 | ) | | | (129,963 | ) | | | (4,015 | ) | | | (61,922 | ) |
| | | | 2,610 | | | | 18,514 | | | | 4,038 | | | | 52,153 | |
| Class P Shares(a) | | | | | | | | | | | | | | | | |
Shares sold | | | — | | | | — | | | | 143,625 | | | | 1,901,458 | |
Reinvestment of distributions | | | 14,612 | | | | 174,322 | | | | — | | | | — | |
Shares redeemed | | | (2,719 | ) | | | (32,450 | ) | | | — | | | | — | |
| | | | 11,893 | | | | 141,872 | | | | 143,625 | | | | 1,901,458 | |
| Class R Shares | | | | | | | | | | | | | | | | |
Shares sold | | | 5 | | | | 66 | | | | — | | | | — | |
| | | | 5 | | | | 66 | | | | — | | | | — | |
| Class R6 Shares | | | | | | | | | | | | | | | | |
Shares sold | | | 251,136 | | | | 3,026,051 | | | | — | | | | — | |
Shares redeemed | | | (5,989 | ) | | | (75,463 | ) | | | — | | | | — | |
| | | | 245,147 | | | | 2,950,588 | | | | — | | | | — | |
| | | | |
NET INCREASE | | | 124,593 | | | $ | 1,176,799 | | | | 320,201 | | | $ | 4,275,976 | |
| (a) | | Class P Shares commenced operations on April 17, 2018. |
156
GOLDMAN SACHS FUNDAMENTAL EQUITY GROWTH FUNDS
|
| 11. SUMMARY OF SHARE TRANSACTIONS (continued) |
| | | | | | | | | | | | | | | | |
| | | Capital Growth Fund | |
| | | | |
| | | For the Six Months Ended
February 28, 2019
(Unaudited) | | | For the Fiscal Year Ended
August 31, 2018
| |
| | | | |
| | | Shares | | | Dollars | | | Shares | | | Dollars | |
| | | | |
| Class A Shares | | | | | | | | | | | | | | | | |
Shares sold | | | 2,061,909 | | | $ | 57,635,143 | | | | 470,845 | | | $ | 14,194,828 | |
Reinvestment of distributions | | | 10,589,777 | | | | 211,151,830 | | | | 1,880,254 | | | | 53,779,240 | |
Shares redeemed | | | (2,968,011 | ) | | | (65,729,718 | ) | | | (2,606,109 | ) | | | (78,544,576 | ) |
| | | | 9,683,675 | | | | 203,057,255 | | | | (255,010 | ) | | | (10,570,508 | ) |
| Class C Shares | | | | | | | | | | | | | | | | |
Shares sold | | | 215,019 | | | | 3,106,637 | | | | 151,842 | | | | 3,396,793 | |
Reinvestment of distributions | | | 658,461 | | | | 8,079,315 | | | | 308,446 | | | | 6,554,474 | |
Shares redeemed | | | (2,132,358 | ) | | | (47,372,858 | ) | | | (545,691 | ) | | | (12,374,122 | ) |
| | | | (1,258,878 | ) | | | (36,186,906 | ) | | | (85,403 | ) | | | (2,422,855 | ) |
| Institutional Shares | | | | | | | | | | | | | | | | |
Shares sold | | | 179,295 | | | | 4,653,608 | | | | 353,887 | | | | 11,714,134 | |
Reinvestment of distributions | | | 645,191 | | | | 14,798,485 | | | | 383,700 | | | | 12,097,584 | |
Shares redeemed | | | (602,762 | ) | | | (15,968,125 | ) | | | (3,828,254 | ) | | | (129,206,221 | ) |
| | | | 221,724 | | | | 3,483,968 | | | | (3,090,667 | ) | | | (105,394,503 | ) |
| Service Shares | | | | | | | | | | | | | | | | |
Shares sold | | | 3,441 | | | | 73,018 | | | | 7,449 | | | | 214,423 | |
Reinvestment of distributions | | | 26,626 | | | | 503,495 | | | | 4,219 | | | | 116,439 | |
Shares redeemed | | | (3,987 | ) | | | (82,371 | ) | | | (5,452 | ) | | | (161,928 | ) |
| | | | 26,080 | | | | 494,142 | | | | 6,216 | | | | 168,934 | |
| Investor Shares | | | | | | | | | | | | | | | | |
Shares sold | | | 33,997 | | | | 1,017,960 | | | | 77,368 | | | | 2,371,012 | |
Reinvestment of distributions | | | 130,778 | | | | 2,665,391 | | | | 27,119 | | | | 787,742 | |
Shares redeemed | | | (80,635 | ) | | | (1,935,249 | ) | | | (113,254 | ) | | | (3,457,931 | ) |
| | | | 84,140 | | | | 1,748,102 | | | | (8,767 | ) | | | (299,177 | ) |
| Class P Shares(a) | | | | | | | | | | | | | | | | |
Shares sold | | | 24,006 | | | | 536,888 | | | | 2,945,245 | | | | 100,138,566 | |
Reinvestment of distributions | | | 1,146,496 | | | | 26,269,986 | | | | — | | | | — | |
Shares redeemed | | | (798,430 | ) | | | (19,531,160 | ) | | | (31,994 | ) | | | (1,103,766 | ) |
| | | | 372,072 | | | | 7,275,714 | | | | 2,913,251 | | | | 99,034,800 | |
| Class R Shares | | | | | | | | | | | | | | | | |
Shares sold | | | 29,781 | | | | 695,527 | | | | 41,533 | | | | 1,206,372 | |
Reinvestment of distributions | | | 133,698 | | | | 2,517,533 | | | | 25,005 | | | | 690,229 | |
Shares redeemed | | | (42,858 | ) | | | (981,172 | ) | | | (71,179 | ) | | | (2,071,048 | ) |
| | | | 120,621 | | | | 2,231,888 | | | | (4,641 | ) | | | (174,447 | ) |
| Class R6 Shares | | | | | | | | | | | | | | | | |
Shares sold | | | 160,479 | | | | 3,602,969 | | | | 1,366 | | | | 47,640 | |
Reinvestment of distributions | | | 706 | | | | 16,187 | | | | 47 | | | | 1,470 | |
Shares redeemed | | | (1,915 | ) | | | (45,003 | ) | | | (236 | ) | | | (7,879 | ) |
| | | | 159,270 | | | | 3,574,153 | | | | 1,177 | | | | 41,231 | |
| | | | |
NET INCREASE (DECREASE) | | | 9,408,704 | | | $ | 185,678,316 | | | | (523,844 | ) | | $ | (19,616,525 | ) |
| (a) | | Class P Shares commenced operations on April 17, 2018. |
157
GOLDMAN SACHS FUNDAMENTAL EQUITY GROWTH FUNDS
Notes to Financial Statements(continued)
February 28, 2019 (Unaudited)
|
| 11. SUMMARY OF SHARE TRANSACTIONS (continued) |
| | | | | | | | | | | | | | | | |
| | | Concentrated Growth Fund | |
| | | | |
| | | For the Six Months Ended
February 28, 2019
(Unaudited) | | | For the Fiscal Year Ended
August 31, 2018
| |
| | | | |
| | | Shares | | | Dollars | | | Shares | | | Dollars | |
| | | | |
| Class A Shares | | | | | | | | | | | | | | | | |
Shares sold | | | 85,514 | | | $ | 1,488,069 | | | | 47,183 | | | $ | 854,216 | |
Reinvestment of distributions | | | 37,996 | | | | 567,276 | | | | 27,951 | | | | 462,041 | |
Shares redeemed | | | (48,071 | ) | | | (724,788 | ) | | | (93,617 | ) | | | (1,648,051 | ) |
| | | | 75,439 | | | | 1,330,557 | | | | (18,483 | ) | | | (331,794 | ) |
| Class C Shares | | | | | | | | | | | | | | | | |
Shares sold | | | 9,396 | | | | 130,972 | | | | 14,977 | | | | 216,086 | |
Reinvestment of distributions | | | 10,648 | | | | 126,388 | | | | 16,964 | | | | 231,562 | |
Shares redeemed | | | (75,221 | ) | | | (1,140,262 | ) | | | (45,413 | ) | | | (655,381 | ) |
| | | | (55,177 | ) | | | (882,902 | ) | | | (13,472 | ) | | | (207,733 | ) |
| Institutional Shares | | | | | | | | | | | | | | | | |
Shares sold | | | 19,037 | | | | 339,503 | | | | 238,715 | | | | 4,461,612 | |
Reinvestment of distributions | | | 93,159 | | | | 1,497,144 | | | | 916,262 | | | | 16,164,951 | |
Shares redeemed | | | (158,426 | ) | | | (2,572,316 | ) | | | (8,058,774 | ) | | | (155,237,739 | ) |
| | | | (46,230 | ) | | | (735,669 | ) | | | (6,903,797 | ) | | | (134,611,176 | ) |
| Investor Shares | | | | | | | | | | | | | | | | |
Shares sold | | | 605 | | | | 10,000 | | | | 2,312 | | | | 41,258 | |
Reinvestment of distributions | | | 2,918 | | | | 44,432 | | | | 2,890 | | | | 48,582 | |
Shares redeemed | | | (13,521 | ) | | | (204,518 | ) | | | (25,306 | ) | | | (459,385 | ) |
| | | | (9,998 | ) | | | (150,086 | ) | | | (20,104 | ) | | | (369,545 | ) |
| Class P Shares(a) | | | | | | | | | | | | | | | | |
Shares sold | | | 56,395 | | | | 947,206 | | | | 7,079,978 | | | | 137,241,255 | |
Reinvestment of distributions | | | 899,567 | | | | 14,440,076 | | | | — | | | | — | |
Shares redeemed | | | (940,355 | ) | | | (15,705,777 | ) | | | (135,342 | ) | | | (2,665,210 | ) |
| | | | 15,607 | | | | (318,495 | ) | | | 6,944,636 | | | | 134,576,045 | |
| Class R Shares | | | | | | | | | | | | | | | | |
Shares sold | | | 136 | | | | 2,053 | | | | 190 | | | | 3,196 | |
Reinvestment of distributions | | | 176 | | | | 2,528 | | | | 140 | | | | 2,233 | |
| | | | 312 | | | | 4,581 | | | | 330 | | | | 5,429 | |
| Class R6 Shares | | | | | | | | | | | | | | | | |
Shares sold | | | 23,324 | | | | 374,341 | | | | 1,703 | | | | 30,872 | |
Reinvestment of distributions | | | 715 | | | | 11,480 | | | | 373 | | | | 6,572 | |
Shares redeemed | | | (347 | ) | | | (5,739 | ) | | | (918 | ) | | | (17,229 | ) |
| | | | 23,692 | | | | 380,082 | | | | 1,158 | | | | 20,215 | |
| | | | |
NET INCREASE (DECREASE) | | | 3,645 | | | $ | (371,932 | ) | | | (9,732 | ) | | $ | (918,559 | ) |
| (a) | | Class P Shares commenced operations on April 17, 2018. |
158
GOLDMAN SACHS FUNDAMENTAL EQUITY GROWTH FUNDS
|
| 11. SUMMARY OF SHARE TRANSACTIONS (continued) |
| | | | | | | | | | | | | | | | |
| | | Flexible Cap Fund | |
| | | | |
| | | For the Six Months Ended
February 28, 2019
(Unaudited) | | | For the Fiscal Year Ended
August 31, 2018
| |
| | | | |
| | | Shares | | | Dollars | | | Shares | | | Dollars | |
| | | | |
| Class A Shares | | | | | | | | | | | | | | | | |
Shares sold | | | 59,964 | | | $ | 610,740 | | | | 44,120 | | | $ | 543,131 | |
Reinvestment of distributions | | | 39,617 | | | | 416,480 | | | | 124,283 | | | | 1,426,826 | |
Shares redeemed | | | (48,681 | ) | | | (522,821 | ) | | | (134,271 | ) | | | (1,637,383 | ) |
| | | | 50,900 | | | | 504,399 | | | | 34,132 | | | | 332,574 | |
| Class C Shares | | | | | | | | | | | | | | | | |
Shares sold | | | 14,149 | | | | 132,702 | | | | 12,370 | | | | 134,674 | |
Reinvestment of distributions | | | 11,501 | | | | 104,102 | | | | 38,360 | | | | 384,365 | |
Shares redeemed | | | (19,335 | ) | | | (177,117 | ) | | | (50,716 | ) | | | (575,778 | ) |
| | | | 6,315 | | | | 59,687 | | | | 14 | | | | (56,739 | ) |
| Institutional Shares | | | | | | | | | | | | | | | | |
Shares sold | | | 5,190 | | | | 68,080 | | | | 145,836 | | | | 2,009,232 | |
Reinvestment of distributions | | | 10,036 | | | | 114,070 | | | | 244,148 | | | | 3,015,595 | |
Shares redeemed | | | (81,698 | ) | | | (947,812 | ) | | | (1,016,698 | ) | | | (13,457,112 | ) |
| | | | (66,472 | ) | | | (765,662 | ) | | | (626,714 | ) | | | (8,432,285 | ) |
| Investor Shares | | | | | | | | | | | | | | | | |
Shares sold | | | — | | | | — | | | | 762 | | | | 11,324 | |
Reinvestment of distributions | | | 465 | | | | 5,174 | | | | 3,905 | | | | 47,179 | |
Shares redeemed | | | (38 | ) | | | (405 | ) | | | (25,510 | ) | | | (349,741 | ) |
| | | | 427 | | | | 4,769 | | | | (20,843 | ) | | | (291,238 | ) |
| Class P Shares(a) | | | | | | | | | | | | | | | | |
Shares sold | | | — | | | | — | | | | 927,023 | | | | 12,322,824 | |
Reinvestment of distributions | | | 81,854 | | | | 930,190 | | | | — | | | | — | |
Shares redeemed | | | (144,679 | ) | | | (1,653,541 | ) | | | (365 | ) | | | (4,905 | ) |
| | | | (62,825 | ) | | | (723,351 | ) | | | 926,658 | | | | 12,317,919 | |
| Class R Shares | | | | | | | | | | | | | | | | |
Shares sold | | | 97 | | | | 1,056 | | | | 206 | | | | 2,469 | |
Reinvestment of distributions | | | 394 | | | | 3,964 | | | | 979 | | | | 10,791 | |
Shares redeemed | | | (1 | ) | | | (15 | ) | | | (3 | ) | | | (38 | ) |
| | | | 490 | | | | 5,005 | | | | 1,182 | | | | 13,222 | |
| Class R6 Shares | | | | | | | | | | | | | | | | |
Shares sold | | | 18,652 | | | | 211,951 | | | | — | | | | — | |
Reinvestment of distributions | | | 94 | | | | 1,068 | | | | 241 | | | | 2,983 | |
Shares redeemed | | | (3,232 | ) | | | (37,518 | ) | | | — | | | | — | |
| | | | 15,514 | | | | 175,501 | | | | 241 | | | | 2,983 | |
| | | | |
NET INCREASE (DECREASE) | | | (55,651 | ) | | $ | (739,652 | ) | | | 314,670 | | | $ | 3,886,436 | |
| (a) | | Class P Shares commenced operations on April 17, 2018. |
159
GOLDMAN SACHS FUNDAMENTAL EQUITY GROWTH FUNDS
Notes to Financial Statements(continued)
February 28, 2019 (Unaudited)
|
| 11. SUMMARY OF SHARE TRANSACTIONS (continued) |
| | | | | | | | | | | | | | | | |
| | | Growth Opportunities Fund | |
| | | | |
| | | For the Six Months Ended
February 28, 2019
(Unaudited) | | | For the Fiscal Year Ended
August 31, 2018 | |
| | | | |
| | | Shares | | | Dollars | | | Shares | | | Dollars | |
| | | | |
| Class A Shares | | | | | | | | | | | | | | | | |
Shares sold | | | 2,866,891 | | | $ | 53,784,079 | | | | 3,005,035 | | | $ | 67,000,700 | |
Reinvestment of distributions | | | 5,713,557 | | | | 85,246,276 | | | | 3,455,971 | | | | 71,849,631 | |
Shares redeemed | | | (6,253,568 | ) | | | (112,997,235 | ) | | | (8,739,880 | ) | | | (199,979,605 | ) |
| | | | 2,326,880 | | | | 26,033,120 | | | | (2,278,874 | ) | | | (61,129,274 | ) |
| Class C Shares | | | | | | | | | | | | | | | | |
Shares sold | | | 632,472 | | | | 5,541,578 | | | | 400,896 | | | | 6,148,111 | |
Reinvestment of distributions | | | 2,034,557 | | | | 17,090,278 | | | | 1,349,765 | | | | 19,409,623 | |
Shares redeemed | | | (2,164,071 | ) | | | (29,185,909 | ) | | | (1,982,323 | ) | | | (31,376,379 | ) |
| | | | 502,958 | | | | (6,554,053 | ) | | | (231,662 | ) | | | (5,818,645 | ) |
| Institutional Shares | | | | | | | | | | | | | | | | |
Shares sold | | | 3,746,899 | | | | 78,932,414 | | | | 12,411,664 | | | | 329,983,353 | |
Reinvestment of distributions | | | 9,354,603 | | | | 176,053,628 | | | | 9,590,336 | | | | 235,922,256 | |
Shares redeemed | | | (20,683,611 | ) | | | (479,092,834 | ) | | | (40,260,760 | ) | | | (1,070,896,971 | ) |
| | | | (7,582,109 | ) | | | (224,106,792 | ) | | | (18,258,760 | ) | | | (504,991,362 | ) |
| Service Shares | | | | | | | | | | | | | | | | |
Shares sold | | | 153,827 | | | | 2,316,012 | | | | 237,767 | | | | 4,982,361 | |
Reinvestment of distributions | | | 504,280 | | | | 7,014,537 | | | | 249,919 | | | | 4,950,893 | |
Shares redeemed | | | (386,759 | ) | | | (6,258,007 | ) | | | (391,144 | ) | | | (8,400,778 | ) |
| | | | 271,348 | | | | 3,072,542 | | | | 96,542 | | | | 1,532,476 | |
| Investor Shares | | | | | | | | | | | | | | | | |
Shares sold | | | 1,676,490 | | | | 29,885,379 | | | | 820,227 | | | | 19,406,624 | |
Reinvestment of distributions | | | 1,100,078 | | | | 17,579,243 | | | | 1,002,231 | | | | 21,848,644 | |
Shares redeemed | | | (1,765,216 | ) | | | (36,065,824 | ) | | | (3,306,711 | ) | | | (78,457,853 | ) |
| | | | 1,011,352 | | | | 11,398,798 | | | | (1,484,253 | ) | | | (37,202,585 | ) |
| Class P Shares(a) | | | | | | | | | | | | | | | | |
Shares sold | | | 47,795 | | | | 964,504 | | | | 3,451,924 | | | | 91,853,054 | |
Reinvestment of distributions | | | 943,033 | | | | 17,766,747 | | | | — | | | | — | |
Shares redeemed | | | (1,241,788 | ) | | | (25,817,659 | ) | | | (35,796 | ) | | | (968,937 | ) |
| | | | (250,960 | ) | | | (7,086,408 | ) | | | 3,416,128 | | | | 90,884,117 | |
| Class R Shares | | | | | | | | | | | | | | | | |
Shares sold | | | 306,428 | | | | 5,012,210 | | | | 449,764 | | | | 9,622,684 | |
Reinvestment of distributions | | | 896,518 | | | | 12,497,449 | | | | 508,819 | | | | 10,105,151 | |
Shares redeemed | | | (462,412 | ) | | | (8,140,884 | ) | | | (1,087,386 | ) | | | (23,499,280 | ) |
| | | | 740,534 | | | | 9,368,775 | | | | (128,803 | ) | | | (3,771,445 | ) |
| Class R6 Shares | | | | | | | | | | | | | | | | |
Shares sold | | | 1,759,285 | | | | 43,634,657 | | | | 4,998,110 | | | | 134,945,824 | |
Reinvestment of distributions | | | 2,500,146 | | | | 47,077,755 | | | | 1,055,619 | | | | 25,989,352 | |
Shares redeemed | | | (3,687,066 | ) | | | (73,987,746 | ) | | | (2,046,665 | ) | | | (54,035,350 | ) |
| | | | 572,365 | | | | 16,724,666 | | | | 4,007,064 | | | | 106,899,826 | |
| | | | |
NET DECREASE | | | (2,407,632 | ) | | $ | (171,149,352 | ) | | | (14,862,618 | ) | | $ | (413,596,892 | ) |
| (a) | | Class P Shares commenced operations on April 17, 2018. |
160
GOLDMAN SACHS FUNDAMENTAL EQUITY GROWTH FUNDS
|
| 11. SUMMARY OF SHARE TRANSACTIONS (continued) |
| | | | | | | | | | | | | | | | |
| | | Small/Mid Cap Growth Fund | |
| | | | |
| | | For the Six Months Ended
February 28, 2019
(Unaudited) | | | For the Fiscal Year Ended
August 31, 2018
| |
| | | | |
| | | Shares | | | Dollars | | | Shares | | | Dollars | |
| | | | |
| Class A Shares | | | | | | | | | | | | | | | | |
Shares sold | | | 1,509,935 | | | $ | 30,308,122 | | | | 2,856,873 | | | $ | 62,878,815 | |
Reinvestment of distributions | | | 2,664,057 | | | | 44,942,631 | | | | 1,843,608 | | | | 37,701,786 | |
Shares redeemed | | | (3,414,644 | ) | | | (65,156,113 | ) | | | (6,344,603 | ) | | | (140,532,187 | ) |
| | | | 759,348 | | | | 10,094,640 | | | | (1,644,122 | ) | | | (39,951,586 | ) |
| Class C Shares | | | | | | | | | | | | | | | | |
Shares sold | | | 587,909 | | | | 9,052,114 | | | | 992,863 | | | | 18,937,194 | |
Reinvestment of distributions | | | 2,471,157 | | | | 34,522,065 | | | | 1,607,766 | | | | 28,441,383 | |
Shares redeemed | | | (2,782,806 | ) | | | (44,750,840 | ) | | | (2,578,133 | ) | | | (49,560,402 | ) |
| | | | 276,260 | | | | (1,176,661 | ) | | | 22,496 | | | | (2,181,825 | ) |
| Institutional Shares | | | | | | | | | | | | | | | | |
Shares sold | | | 5,774,341 | | | | 118,050,452 | | | | 8,798,646 | | | | 207,228,586 | |
Reinvestment of distributions | | | 6,539,687 | | | | 119,937,857 | | | | 5,605,047 | | | | 122,358,178 | |
Shares redeemed | | | (13,064,591 | ) | | | (254,293,235 | ) | | | (22,560,284 | ) | | | (539,432,759 | ) |
| | | | (750,563 | ) | | | (16,304,926 | ) | | | (8,156,591 | ) | | | (209,845,995 | ) |
| Service Shares | | | | | | | | | | | | | | | | |
Shares sold | | | 140,303 | | | | 2,722,270 | | | | 283,721 | | | | 6,132,180 | |
Reinvestment of distributions | | | 148,708 | | | | 2,426,917 | | | | 90,894 | | | | 1,811,511 | |
Shares redeemed | | | (125,559 | ) | | | (2,419,868 | ) | | | (367,940 | ) | | | (8,095,318 | ) |
| | | | 163,452 | | | | 2,729,319 | | | | 6,675 | | | | (151,627 | ) |
| Investor Shares | | | | | | | | | | | | | | | | |
Shares sold | | | 2,004,960 | | | | 40,994,996 | | | | 4,551,274 | | | | 104,643,966 | |
Reinvestment of distributions | | | 4,131,670 | | | | 72,965,292 | | | | 2,624,748 | | | | 55,592,168 | |
Shares redeemed | | | (5,440,717 | ) | | | (109,091,825 | ) | | | (5,313,604 | ) | | | (121,151,439 | ) |
| | | | 695,913 | | | | 4,868,463 | | | | 1,862,418 | | | | 39,084,695 | |
| Class P Shares(a) | | | | | | | | | | | | | | | | |
Shares sold | | | 720,992 | | | | 14,134,726 | | | | 9,876,622 | | | | 241,955,492 | |
Reinvestment of distributions | | | 1,858,301 | | | | 34,099,828 | | | | — | | | | — | |
Shares redeemed | | | (2,534,294 | ) | | | (47,892,010 | ) | | | (299,003 | ) | | | (7,511,628 | ) |
| | | | 44,999 | | | | 342,544 | | | | 9,577,619 | | | | 234,443,864 | |
| Class R Shares | | | | | | | | | | | | | | | | |
Shares sold | | | 135,845 | | | | 2,450,671 | | | | 317,878 | | | | 6,760,064 | |
Reinvestment of distributions | | | 162,654 | | | | 2,621,986 | | | | 136,788 | | | | 2,701,568 | |
Shares redeemed | | | (343,472 | ) | | | (6,545,742 | ) | | | (677,172 | ) | | | (14,382,347 | ) |
| | | | (44,973 | ) | | | (1,473,085 | ) | | | (222,506 | ) | | | (4,920,715 | ) |
| Class R6 Shares | | | | | | | | | | | | | | | | |
Shares sold | | | 879,518 | | | | 18,540,245 | | | | 789,053 | | | | 18,793,321 | |
Reinvestment of distributions | | | 342,894 | | | | 6,292,101 | | | | 139,018 | | | | 3,036,144 | |
Shares redeemed | | | (250,029 | ) | | | (5,301,519 | ) | | | (378,405 | ) | | | (9,009,259 | ) |
| | | | 972,383 | | | | 19,530,827 | | | | 549,666 | | | | 12,820,206 | |
| | | | |
NET INCREASE | | | 2,116,819 | | | $ | 18,611,121 | | | | 1,995,655 | | | $ | 29,297,017 | |
| (a) | | Class P Shares commenced operations on April 17, 2018. |
161
GOLDMAN SACHS FUNDAMENTAL EQUITY GROWTH FUNDS
Notes to Financial Statements(continued)
February 28, 2019 (Unaudited)
|
| 11. SUMMARY OF SHARE TRANSACTIONS (continued) |
| | | | | | | | | | | | | | | | |
| | | Strategic Growth Fund | |
| | | | |
| | | For the Six Months Ended
February 28, 2019
(Unaudited) | | | For the Fiscal Year Ended
August 31, 2018
| |
| | | | |
| | | Shares | | | Dollars | | | Shares | | | Dollars | |
| | | | |
| Class A Shares | | | | | | | | | | | | | | | | |
Shares sold | | | 429,058 | | | $ | 4,880,461 | | | | 227,341 | | | $ | 3,001,385 | |
Reinvestment of distributions | | | 1,136,370 | | | | 9,022,776 | | | | 441,271 | | | | 5,193,762 | |
Shares redeemed | | | (611,134 | ) | | | (5,249,326 | ) | | | (1,831,457 | ) | | | (25,715,496 | ) |
| | | | 954,294 | | | | 8,653,911 | | | | (1,162,845 | ) | | | (17,520,349 | ) |
| Class C Shares | | | | | | | | | | | | | | | | |
Shares sold | | | 196,533 | | | | 1,065,946 | | | | 102,964 | | | | 1,013,891 | |
Reinvestment of distributions | | | 359,395 | | | | 1,890,416 | | | | 229,878 | | | | 2,126,375 | |
Shares redeemed | | | (586,676 | ) | | | (5,053,449 | ) | | | (307,183 | ) | | | (3,101,217 | ) |
| | | | (30,748 | ) | | | (2,097,087 | ) | | | 25,659 | | | | 39,049 | |
| Institutional Shares | | | | | | | | | | | | | | | | |
Shares sold | | | 1,145,404 | | | | 11,290,237 | | | | 2,619,924 | | | | 37,776,009 | |
Reinvestment of distributions | | | 2,171,746 | | | | 19,362,035 | | | | 3,577,991 | | | | 45,552,679 | |
Shares redeemed | | | (2,636,426 | ) | | | (26,232,588 | ) | | | (15,544,589 | ) | | | (213,087,126 | ) |
| | | | 680,724 | | | | 4,419,684 | | | | (9,346,674 | ) | | | (129,758,438 | ) |
| Service Shares | | | | | | | | | | | | | | | | |
Shares sold | | | 13,521 | | | | 121,260 | | | | 10,389 | | | | 135,781 | |
Reinvestment of distributions | | | 23,135 | | | | 180,451 | | | | 9,390 | | | | 109,589 | |
Shares redeemed | | | (11,393 | ) | | | (110,465 | ) | | | (11,003 | ) | | | (134,395 | ) |
| | | | 25,263 | | | | 191,246 | | | | 8,776 | | | | 110,975 | |
| Investor Shares | | | | | | | | | | | | | | | | |
Shares sold | | | 139,864 | | | | 1,931,002 | | | | 44,221 | | | | 627,778 | |
Reinvestment of distributions | | | 123,585 | | | | 1,098,042 | | | | 36,139 | | | | 459,379 | |
Shares redeemed | | | (141,047 | ) | | | (1,378,963 | ) | | | (61,744 | ) | | | (857,438 | ) |
| | | | 122,402 | | | | 1,650,081 | | | | 18,616 | | | | 229,719 | |
| Class P Shares(a) | | | | | | | | | | | | | | | | |
Shares sold | | | 130,182 | | | | 1,226,996 | | | | 7,127,774 | | | | 100,285,960 | |
Reinvestment of distributions | | | 3,106,814 | | | | 27,631,178 | | | | — | | | | — | |
Shares redeemed | | | (2,542,973 | ) | | | (25,391,640 | ) | | | (107,358 | ) | | | (1,520,921 | ) |
| | | | 694,023 | | | | 3,466,534 | | | | 7,020,416 | | | | 98,765,039 | |
| Class R Shares | | | | | | | | | | | | | | | | |
Shares sold | | | 18,942 | | | | 167,384 | | | | 8,880 | | | | 108,748 | |
Reinvestment of distributions | | | 418 | | | | 3,190 | | | | 528 | | | | 6,082 | |
Shares redeemed | | | (2,077 | ) | | | (18,911 | ) | | | (2,986 | ) | | | (36,508 | ) |
| | | | 17,283 | | | | 151,663 | | | | 6,422 | | | | 78,322 | |
| Class R6 Shares | | | | | | | | | | | | | | | | |
Shares sold | | | 41,101 | | | | 363,495 | | | | — | | | | — | |
Reinvestment of distributions | | | 496 | | | | 4,416 | | | | 197 | | | | 2,515 | |
Shares redeemed | | | (523 | ) | | | (4,927 | ) | | | — | | | | — | |
| | | | 41,074 | | | | 362,984 | | | | 197 | | | | 2,515 | |
| | | | |
NET INCREASE (DECREASE) | | | 2,504,315 | | | $ | 16,799,016 | | | | (3,429,433 | ) | | $ | (48,053,168 | ) |
| (a) | | Class P Shares commenced operations on April 17, 2018. |
162
GOLDMAN SACHS FUNDAMENTAL EQUITY GROWTH FUNDS
|
| 11. SUMMARY OF SHARE TRANSACTIONS (continued) |
| | | | | | | | | | | | | | | | |
| | | Technology Opportunities Fund | |
| | | | |
| | | For the Six Months Ended
February 28, 2019
(Unaudited) | | | For the Fiscal Year Ended
August 31, 2018
| |
| | | | |
| | | Shares | | | Dollars | | | Shares | | | Dollars | |
| | | | |
| Class A Shares | | | | | | | | | | | | | | | | |
Shares sold | | | 1,666,237 | | | $ | 41,412,994 | | | | 1,564,274 | | | $ | 39,091,434 | |
Reinvestment of distributions | | | 2,856,623 | | | | 55,275,661 | | | | 808,376 | | | | 18,511,810 | |
Shares redeemed | | | (1,957,099 | ) | | | (41,861,332 | ) | | | (2,847,576 | ) | | | (70,590,861 | ) |
| | | | 2,565,761 | | | | 54,827,323 | | | | (474,926 | ) | | | (12,987,617 | ) |
| Class C Shares | | | | | | | | | | | | | | | | |
Shares sold | | | 116,390 | | | | 1,902,445 | | | | 234,796 | | | | 4,852,099 | |
Reinvestment of distributions | | | 392,107 | | | | 5,909,052 | | | | 214,052 | | | | 4,071,263 | |
Shares redeemed | | | (1,312,909 | ) | | | (28,236,419 | ) | | | (577,501 | ) | | | (11,975,931 | ) |
| | | | (804,412 | ) | | | (20,424,922 | ) | | | (128,653 | ) | | | (3,052,569 | ) |
| Institutional Shares | | | | | | | | | | | | | | | | |
Shares sold | | | 429,179 | | | | 10,559,192 | | | | 1,208,572 | | | | 32,670,100 | |
Reinvestment of distributions | | | 570,904 | | | | 12,497,081 | | | | 213,984 | | | | 5,390,254 | |
Shares redeemed | | | (794,306 | ) | | | (20,448,672 | ) | | | (1,962,841 | ) | | | (55,514,738 | ) |
| | | | 205,777 | | | | 2,607,601 | | | | (540,285 | ) | | | (17,454,384 | ) |
| Service Shares | | | | | | | | | | | | | | | | |
Shares sold | | | 278,094 | | | | 6,446,898 | | | | 785,455 | | | | 19,288,469 | |
Reinvestment of distributions | | | 317,847 | | | | 5,994,587 | | | | 66,210 | | | | 1,487,735 | |
Shares redeemed | | | (376,870 | ) | | | (8,074,144 | ) | | | (477,019 | ) | | | (11,667,353 | ) |
| | | | 219,071 | | | | 4,367,341 | | | | 374,646 | | | | 9,108,851 | |
| Investor Shares | | | | | | | | | | | | | | | | |
Shares sold | | | 41,363 | | | | 1,023,166 | | | | 118,583 | | | | 3,180,541 | |
Reinvestment of distributions | | | 171,725 | | | | 3,690,377 | | | | 65,944 | | | | 1,638,714 | |
Shares redeemed | | | (154,030 | ) | | | (3,596,903 | ) | | | (380,809 | ) | | | (10,032,936 | ) |
| | | | 59,058 | | | | 1,116,640 | | | | (196,282 | ) | | | (5,213,681 | ) |
| Class P Shares(a) | | | | | | | | | | | | | | | | |
Shares sold | | | 182,564 | | | | 5,213,688 | | | | 810,455 | | | | 23,928,160 | |
Reinvestment of distributions | | | 207,017 | | | | 4,533,680 | | | | — | | | | — | |
Shares redeemed | | | (335,136 | ) | | | (7,734,664 | ) | | | (34 | ) | | | (1,005 | ) |
| | | | 54,445 | | | | 2,012,704 | | | | 810,421 | | | | 23,927,155 | |
| Class R6 Shares(b) | | | | | | | | | | | | | | | | |
Shares sold | | | — | | | | — | | | | 399 | | | | 10,000 | |
Reinvestment of distributions | | | 92 | | | | 2,018 | | | | — | | | | — | |
| | | | 92 | | | | 2,018 | | | | 399 | | | | 10,000 | |
| | | | |
NET INCREASE (DECREASE) | | | 2,299,792 | | | $ | 44,508,705 | | | | (154,680 | ) | | $ | (5,662,245 | ) |
| (a) | | Class P Shares commenced operations on April 17, 2018. |
| (b) | | Commenced operations on December 29, 2017. |
163
GOLDMAN SACHS FUNDAMENTAL EQUITY GROWTH FUNDS
Fund Expenses — Six Month Period Ended February 28, 2019 (Unaudited)
As a shareholder of Class A, Class C, Institutional, Service, Investor, Class P, Class R or Class R6 Shares of a Fund, you incur two types of costs: (1) transaction costs, including sales charges on purchase payments (with respect to Class A Shares), contingent deferred sales charges on redemptions (with respect to Class C Shares), and (2) ongoing costs, including management fees; distribution and/or service (12b-1) fees (with respect to Class A, Class C and Class R Shares); and other Fund expenses. The example is intended to help you understand your ongoing costs (in dollars) of investing in Class A, Class C, Institutional, Service, Investor, Class P, Class R and Class R6 Shares of the Funds and to compare these costs with the ongoing costs of investing in other mutual funds.
The example is based on an investment of $1,000 invested at the beginning of the period and held for the entire period from September 1, 2018 through February 28, 2019, which represents a period of 181 days of a 365 day year.
Actual Expenses— The first line under each share class in the table below provides information about actual account values and actual expenses. You may use the information in this line, together with the amount you invested, to estimate the expenses that you paid over the period. Simply divide your account value by $1,000 (for example, an $8,600 account value divided by $1,000=8.6), then multiply the result by the number in the first line under the heading entitled “Expenses Paid” to estimate the expenses you paid on your account during this period.
Hypothetical Example for Comparison Purposes— The second line under each share class in the table below provides information about hypothetical account values and hypothetical expenses based on the Funds’ actual net expense ratios and an assumed rate of return of 5% per year before expenses, which is not the Funds’ actual return. The hypothetical account values and expenses may not be used to estimate the actual ending account balance or expenses you paid for the period. You may use this information to compare the ongoing costs of investing in the Funds and other funds. To do so, compare this 5% hypothetical example with the 5% hypothetical examples that appear in the shareholder reports of the other funds.
Please note that the expenses shown in the table are meant to highlight your ongoing costs only and do not reflect any transactional costs, such as sales charges, redemption fees, or exchange fees. Therefore, the second line of the table is useful in comparing ongoing costs only, and will not help you determine the relative total costs of owning different funds. In addition, if these transactional costs were included, your costs would have been higher.
| | | | | | | | | | | | | | | | | | | | | | | | | | | | | | | | | | | | | | | | | | | | | | | | |
| | | Blue Chip Fund | | | Capital Growth Fund | | | Concentrated Growth Fund | | | Flexible Cap Fund | |
| Share Class | | Beginning
Account
Value
9/1/18 | | | Ending
Account
Value
2/28/19 | | | Expenses
Paid for the
6 months ended
2/28/19* | | | Beginning
Account
Value
9/1/18 | | | Ending
Account
Value
2/28/19 | | | Expenses
Paid for the
6 months ended
2/28/19* | | | Beginning
Account
Value
9/1/18 | | | Ending
Account
Value
2/28/19 | | | Expenses
Paid for the
6 months ended
2/28/19* | | | Beginning
Account
Value
9/1/18 | | | Ending
Account
Value
2/28/19 | | | Expenses
Paid for the
6 months ended
2/28/19* | |
| Class A | | | | | | | | | | | | | | | | | | | | | | | | | | | | | | | | | | | | | | | | | | | | | | | | |
Actual | | $ | 1,000.00 | | | $ | 994.90 | | | $ | 5.09 | | | $ | 1,000.00 | | | $ | 966.60 | | | $ | 5.56 | | | $ | 1,000.00 | | | $ | 959.00 | | | $ | 5.63 | | | $ | 1,000.00 | | | $ | 965.90 | | | $ | 4.68 | |
Hypothetical 5% return | | | 1,000.00 | | | | 1,019.69 | + | | | 5.16 | | | | 1,000.00 | | | | 1,019.69 | + | | | 5.71 | | | | 1,000.00 | | | | 1,019.69 | + | | | 5.81 | | | | 1,000.00 | | | | 1,019.69 | + | | | 4.81 | |
| Class C | | | | | | | | | | | | | | | | | | | | | | | | | | | | | | | | | | | | | | | | | | | | | | | | |
Actual | | | 1,000.00 | | | | 991.40 | | | | 8.79 | | | | 1,000.00 | | | | 963.30 | | | | 9.20 | | | | 1,000.00 | | | | 956.20 | | | | 9.26 | | | | 1,000.00 | | | | 962.00 | | | | 8.32 | |
Hypothetical 5% return | | | 1,000.00 | | | | 1,015.97 | + | | | 8.90 | | | | 1,000.00 | | | | 1,015.42 | + | | | 9.44 | | | | 1,000.00 | | | | 1,015.32 | + | | | 9.54 | | | | 1,000.00 | | | | 1,016.31 | + | | | 8.55 | |
| Institutional | | | | | | | | | | | | | | | | | | | | | | | | | | | | | | | | | | | | | | | | | | | | | | | | |
Actual | | | 1,000.00 | | | | 996.90 | | | | 3.32 | | | | 1,000.00 | | | | 968.40 | | | | 3.66 | | | | 1,000.00 | | | | 961.30 | | | | 3.89 | | | | 1,000.00 | | | | 967.60 | | | | 2.88 | |
Hypothetical 5% return | | | 1,000.00 | | | | 1,021.47 | + | | | 3.36 | | | | 1,000.00 | | | | 1,021.08 | + | | | 3.76 | | | | 1,000.00 | | | | 1,020.83 | + | | | 4.01 | | | | 1,000.00 | | | | 1,021.87 | + | | | 2.96 | |
| Service | | | | | | | | | | | | | | | | | | | | | | | | | | | | | | | | | | | | | | | | | | | | | | | | |
Actual | | | — | | | | — | | | | — | | | | 1,000.00 | | | | 966.10 | | | | 6.09 | | | | — | | | | — | | | | — | | | | — | | | | — | | | | — | |
Hypothetical 5% return | | | — | | | | — | | | | — | | | | 1,000.00 | | | | 1,021.08 | + | | | 6.26 | | | | — | | | | — | | | | — | | | | — | | | | — | | | | — | |
| Investor | | | | | | | | | | | | | | | | | | | | | | | | | | | | | | | | | | | | | | | | | | | | | | | | |
Actual | | | 1,000.00 | | | | 996.40 | | | | 3.86 | | | | 1,000.00 | | | | 967.80 | | | | 4.34 | | | | 1,000.00 | | | | 960.50 | | | | 4.42 | | | | 1,000.00 | | | | 967.80 | | | | 3.46 | |
Hypothetical 5% return | | | 1,000.00 | | | | 1,020.93 | + | | | 3.91 | | | | 1,000.00 | | | | 1,020.38 | + | | | 4.46 | | | | 1,000.00 | | | | 1,020.28 | + | | | 4.56 | | | | 1,000.00 | | | | 1,021.27 | + | | | 3.56 | |
| Class P | | | | | | | | | | | | | | | | | | | | | | | | | | | | | | | | | | | | | | | | | | | | | | | | |
Actual | | | 1,000.00 | | | | 996.50 | | | | 3.27 | | | | 1,000.00 | | | | 968.60 | | | | 3.61 | | | | 1,000.00 | | | | 961.30 | | | | 3.84 | | | | 1,000.00 | | | | 968.30 | | | | 2.83 | |
Hypothetical 5% return | | | 1,000.00 | | | | 1,021.52 | + | | | 3.31 | | | | 1,000.00 | | | | 1,021.52 | + | | | 3.71 | | | | 1,000.00 | | | | 1,021.52 | + | | | 3.96 | | | | 1,000.00 | | | | 1,021.52 | + | | | 2.91 | |
| Class R | | | | | | | | | | | | | | | | | | | | | | | | | | | | | | | | | | | | | | | | | | | | | | | | |
Actual | | | 1,000.00 | | | | 994.10 | | | | 6.33 | | | | 1,000.00 | | | | 965.40 | | | | 6.77 | | | | 1,000.00 | | | | 958.10 | | | | 6.85 | | | | 1,000.00 | | | | 964.80 | | | | 5.89 | |
Hypothetical 5% return | | | 1,000.00 | | | | 1,018.45 | + | | | 6.41 | | | | 1,000.00 | | | | 1,018.45 | + | | | 6.95 | | | | 1,000.00 | | | | 1,018.45 | + | | | 7.05 | | | | 1,000.00 | | | | 1,018.45 | + | | | 6.06 | |
| Class R6 | | | | | | | | | | | | | | | | | | | | | | | | | | | | | | | | | | | | | | | | | | | | | | | | |
Actual | | | 1,000.00 | | | | 997.00 | | | | 3.27 | | | | 1,000.00 | | | | 968.50 | | | | 3.61 | | | | 1,000.00 | | | | 961.20 | | | | 3.84 | | | | 1,000.00 | | | | 968.10 | | | | 2.83 | |
Hypothetical 5% return | | | 1,000.00 | | | | 1,021.52 | + | | | 3.31 | | | | 1,000.00 | | | | 1,021.12 | + | | | 3.71 | | | | 1,000.00 | | | | 1,020.88 | + | | | 3.96 | | | | 1,000.00 | | | | 1,021.92 | + | | | 2.91 | |
| + | | Hypothetical expenses are based on each Fund’s actual annualized net expense ratios and an assumed rate of return of 5% per year before expenses. |
| * | | Expenses for each share class are calculated using each Fund’s annualized net expense ratio for each class, which represents the ongoing expenses as a percentage of net assets for the six months ended February 28, 2019. Expenses are calculated by multiplying the annualized net expense ratio by the average account value for the period; then multiplying the result by the number of days in the most recent fiscal half year; and then dividing that result by the number of days in the fiscal year. The annualized net expense ratios for the period were as follows: |
| | | | | | | | | | | | | | | | | | | | | | | | | | | | | | | | |
| Fund | | Class A | | | Class C | | | Institutional | | | Service | | | Investor | | | Class P | | | Class R | | | Class R6 | |
Blue Chip | | | 1.03 | % | | | 1.78 | % | | | 0.67 | % | | | — | | | | 0.78 | % | | | 0.66 | % | | | 1.28 | % | | | 0.66 | % |
Capital Growth | | | 1.14 | | | | 1.89 | | | | 0.75 | | | | 1.25 | % | | | 0.89 | | | | 0.74 | | | | 1.39 | | | | 0.74 | |
Concentrated Growth | | | 1.16 | | | | 1.91 | | | | 0.80 | | | | — | | | | 0.91 | | | | 0.79 | | | | 1.41 | | | | 0.79 | |
Flexible Cap Growth | | | 0.96 | | | | 1.71 | | | | 0.59 | | | | — | | | | 0.71 | | | | 0.58 | | | | 1.21 | | | | 0.58 | |
164
GOLDMAN SACHS FUNDAMENTAL EQUITY GROWTH FUNDS
Fund Expenses — Six Month Period Ended February 28, 2019 (Unaudited) (continued)
| | | | | | | | | | | | | | | | | | | | | | | | | | | | | | | | | | | | | | | | | | | | | | | | |
| | | Growth Opportunities Fund | | | Small/Mid Cap Growth Fund | | | Strategic Growth Fund | | | Technology Opportunities Fund | |
| Share Class | | Beginning
Account
Value
9/1/18 | | | Ending
Account
Value
2/28/19 | | | Expenses
Paid for the
6 months ended
2/28/19* | | | Beginning
Account
Value
9/1/18 | | | Ending
Account
Value
2/28/19 | | | Expenses
Paid for the
6 months ended
2/28/19* | | | Beginning
Account
Value
9/1/18 | | | Ending
Account
Value
2/28/19 | | | Expenses
Paid for the
6 months ended
2/28/19* | | | Beginning
Account
Value
9/1/18 | | | Ending
Account
Value
2/28/19 | | | Expenses
Paid for the
6 months ended
2/28/19* | |
| Class A | | | | | | | | | | | | | | | | | | | | | | | | | | | | | | | | | | | | | | | | | | | | | | | | |
Actual | | $ | 1,000.00 | | | $ | 988.30 | | | $ | 6.36 | | | $ | 1,000.00 | | | $ | 980.30 | | | $ | 6.24 | | | $ | 1,000.00 | | | $ | 959.60 | | | $ | 5.54 | | | $ | 1,000.00 | | | $ | 956.00 | | | $ | 6.60 | |
Hypothetical 5% return | | | 1,000.00 | | | | 1,018.50 | + | | | 6.46 | | | | 1,000.00 | | | | 1,018.50 | + | | | 6.36 | | | | 1,000.00 | | | | 1,018.50 | + | | | 5.71 | | | | 1,000.00 | | | | 1,018.50 | + | | | 6.80 | |
| Class C | | | | | | | | | | | | | | | | | | | | | | | | | | | | | | | | | | | | | | | | | | | | | | | | |
Actual | | | 1,000.00 | | | | 984.80 | | | | 10.04 | | | | 1,000.00 | | | | 976.80 | | | | 9.90 | | | | 1,000.00 | | | | 957.10 | | | | 9.17 | | | | 1,000.00 | | | | 952.70 | | | | 10.22 | |
Hypothetical 5% return | | | 1,000.00 | | | | 1,014.68 | + | | | 10.19 | | | | 1,000.00 | | | | 1,014.78 | + | | | 10.09 | | | | 1,000.00 | | | | 1,015.42 | + | | | 9.44 | | | | 1,000.00 | | | | 1,014.33 | + | | | 10.54 | |
| Institutional | | | | | | | | | | | | | | | | | | | | | | | | | | | | | | | | | | | | | | | | | | | | | | | | |
Actual | | | 1,000.00 | | | | 990.40 | | | | 4.69 | | | | 1,000.00 | | | | 981.70 | | | | 4.52 | | | | 1,000.00 | | | | 961.50 | | | | 3.65 | | | | 1,000.00 | | | | 958.00 | | | | 4.76 | |
Hypothetical 5% return | | | 1,000.00 | | | | 1,020.08 | + | | | 4.76 | | | | 1,000.00 | | | | 1,020.23 | + | | | 4.61 | | | | 1,000.00 | | | | 1,021.08 | + | | | 3.76 | | | | 1,000.00 | | | | 1,019.93 | + | | | 4.91 | |
| Service | | | | | | | | | | | | | | | | | | | | | | | | | | | | | | | | | | | | | | | | | | | | | | | | |
Actual | | | 1,000.00 | | | | 987.60 | | | | 7.15 | | | | 1,000.00 | | | | 979.30 | | | | 6.97 | | | | 1,000.00 | | | | 958.80 | | | | 6.07 | | | | 1,000.00 | | | | 955.80 | | | | 7.18 | |
Hypothetical 5% return | | | 1,000.00 | | | | 1,017.75 | + | | | 7.25 | | | | 1,000.00 | | | | 1,017.75 | + | | | 7.10 | | | | 1,000.00 | | | | 1,017.75 | + | | | 6.26 | | | | 1,000.00 | | | | 1,017.75 | + | | | 7.40 | |
| Investor | | | | | | | | | | | | | | | | | | | | | | | | | | | | | | | | | | | | | | | | | | | | | | | | |
Actual | | | 1,000.00 | | | | 989.80 | | | | 5.13 | | | | 1,000.00 | | | | 981.10 | | | | 5.01 | | | | 1,000.00 | | | | 960.60 | | | | 4.33 | | | | 1,000.00 | | | | 957.30 | | | | 5.39 | |
Hypothetical 5% return | | | 1,000.00 | | | | 1,019.64 | + | | | 5.21 | | | | 1,000.00 | | | | 1,019.74 | + | | | 5.11 | | | | 1,000.00 | | | | 1,020.38 | + | | | 4.46 | | | | 1,000.00 | | | | 1,019.29 | + | | | 5.56 | |
| Class P | | | | | | | | | | | | | | | | | | | | | | | | | | | | | | | | | | | | | | | | | | | | | | | | |
Actual | | | 1,000.00 | | | | 990.30 | | | | 4.64 | | | | 1,000.00 | | | | 982.10 | | | | 4.47 | | | | 1,000.00 | | | | 961.80 | | | | 3.60 | | | | 1,000.00 | | | | 958.00 | | | | 4.71 | |
Hypothetical 5% return | | | 1,000.00 | | | | 1,020.28 | + | | | 4.71 | | | | 1,000.00 | | | | 1,020.28 | + | | | 4.56 | | | | 1,000.00 | | | | 1,020.28 | + | | | 3.71 | | | | 1,000.00 | | | | 1,020.28 | + | | | 4.86 | |
| Class R | | | | | | | | | | | | | | | | | | | | | | | | | | | | | | | | | | | | | | | | | | | | | | | | |
Actual | | | 1,000.00 | | | | 987.70 | | | | 7.59 | | | | 1,000.00 | | | | 979.00 | | | | 7.46 | | | | 1,000.00 | | | | 958.50 | | | | 6.75 | | | | — | | | | — | | | | — | |
Hypothetical 5% return | | | 1,000.00 | | | | 1,017.26 | + | | | 7.70 | | | | 1,000.00 | | | | 1,017.26 | + | | | 7.60 | | | | 1,000.00 | | | | 1,017.26 | + | | | 6.95 | | | | — | | | | — | | | | — | |
| Class R6 | | | | | | | | | | | | | | | | | | | | | | | | | | | | | | | | | | | | | | | | | | | | | | | | |
Actual | | | 1,000.00 | | | | 990.00 | | | | 4.64 | | | | 1,000.00 | | | | 982.10 | | | | 4.47 | | | | 1,000.00 | | | | 961.60 | | | | 3.60 | | | | 1,000.00 | | | | 957.90 | | | | 4.76 | |
Hypothetical 5% return | | | 1,000.00 | | | | 1,020.13 | + | | | 4.71 | | | | 1,000.00 | | | | 1,020.28 | + | | | 4.56 | | | | 1,000.00 | | | | 1,021.12 | + | | | 3.71 | | | | 1,000.00 | | | | 1,019.93 | + | | | 4.91 | |
| + | | Hypothetical expenses are based on each Fund’s actual annualized net expense ratios and an assumed rate of return of 5% per year before expenses. |
| * | | Expenses for each share class are calculated using each Fund’s annualized net expense ratio for each class, which represents the ongoing expenses as a percentage of net assets for the six months ended February 28, 2019. Expenses are calculated by multiplying the annualized net expense ratio by the average account value for the period; then multiplying the result by the number of days in the most recent fiscal half year; and then dividing that result by the number of days in the fiscal year. The annualized net expense ratios for the period were as follows: |
| | | | | | | | | | | | | | | | | | | | | | | | | | | | | | | | |
| Fund | | Class A | | | Class C | | | Institutional | | | Service | | | Investor | | | Class P | | | Class R | | | Class R6 | |
Growth Opportunities | | | 1.29 | % | | | 2.04 | % | | | 0.95 | % | | | 1.45 | % | | | 1.04 | % | | | 0.94 | % | | | 1.54 | % | | | 0.94 | % |
Small/Mid Cap Growth | | | 1.27 | | | | 2.02 | | | | 0.92 | | | | 1.42 | | | | 1.02 | | | | 0.91 | | | | 1.52 | | | | 0.91 | |
Strategic Growth | | | 1.14 | | | | 1.89 | | | | 0.75 | | | | 1.25 | | | | 0.89 | | | | 0.74 | | | | 1.39 | | | | 0.74 | |
Technology Opportunities | | | 1.36 | | | | 2.11 | | | | 0.98 | | | | 1.48 | | | | 1.11 | | | | 0.97 | | | | — | | | | 0.98 | |
165
FUNDS PROFILE
Goldman Sachs Funds
Goldman Sachs is a premier financial services firm, known since 1869 for creating thoughtful and customized investment solutions in complex global markets.
Today, theInvestment Management Division of Goldman Sachs serves a diverse set of clients worldwide, including private institutions, public entities and individuals. With approximately $1.34 trillion in assets under supervision as of December 31, 2018, Goldman Sachs Asset Management (“GSAM”) has portfolio management teams located around the world and our investment professionals bring firsthand knowledge of local markets to every investment decision. Assets under supervision includes assets under management and other client assets for which Goldman Sachs does not have full discretion. GSAM leverages the resources of Goldman Sachs & Co. LLC subject to legal, internal and regulatory restrictions.
Money Market
Financial Square FundsSM
| ∎ | | Financial Square Treasury Solutions Fund1 |
| ∎ | | Financial Square Government Fund1 |
| ∎ | | Financial Square Money Market Fund2 |
| ∎ | | Financial Square Prime Obligations Fund2 |
| ∎ | | Financial Square Treasury Instruments Fund1 |
| ∎ | | Financial Square Treasury Obligations Fund1 |
| ∎ | | Financial Square Federal Instruments Fund1 |
Investor FundsSM
| ∎ | | Investor Money Market Fund3 |
| ∎ | | Investor Tax-Exempt Money Market Fund3 |
Fixed Income
Short Duration and Government
| ∎ | | High Quality Floating Rate Fund |
| ∎ | | Short-Term Conservative Income Fund |
| ∎ | | Short Duration Government Fund |
| ∎ | | Short Duration Income Fund |
| ∎ | | Inflation Protected Securities Fund |
Multi-Sector
Municipal andTax-Free
| ∎ | | High Yield Municipal Fund |
| ∎ | | Dynamic Municipal Income Fund |
| ∎ | | Municipal Income Completion Fund |
| ∎ | | Short DurationTax-Free Fund |
Single Sector
| ∎ | | Investment Grade Credit Fund |
| ∎ | | High Yield Floating Rate Fund |
| ∎ | | Emerging Markets Debt Fund |
| ∎ | | Local Emerging Markets Debt Fund |
Fixed Income Alternatives
| ∎ | | Long Short Credit Strategies Fund |
Fundamental Equity
| ∎ | | Small/Mid Cap Value Fund |
| ∎ | | Small/Mid Cap Growth Fund |
| ∎ | | Concentrated Growth Fund |
| ∎ | | Technology Opportunities Fund |
| ∎ | | Growth Opportunities Fund |
| ∎ | | Rising Dividend Growth Fund |
Tax-Advantaged Equity
| ∎ | | U.S.Tax-Managed Equity Fund |
| ∎ | | InternationalTax-Managed Equity Fund |
| ∎ | | U.S. Equity Dividend and Premium Fund |
| ∎ | | International Equity Dividend and Premium Fund |
Equity Insights
| ∎ | | Small Cap Equity Insights Fund |
| ∎ | | U.S. Equity Insights Fund |
| ∎ | | Small Cap Growth Insights Fund |
| ∎ | | Large Cap Growth Insights Fund |
| ∎ | | Large Cap Value Insights Fund |
| ∎ | | Small Cap Value Insights Fund |
| ∎ | | International Small Cap Insights Fund |
| ∎ | | International Equity Insights Fund |
| ∎ | | Emerging Markets Equity Insights Fund |
Fundamental Equity International
| ∎ | | International Equity Income Fund |
| ∎ | | International Equity ESG Fund |
| ∎ | | Emerging Markets Equity Fund |
| ∎ | | ESG Emerging Markets Equity Fund |
Select Satellite
| ∎ | | Real Estate Securities Fund |
| ∎ | | International Real Estate Securities Fund |
| ∎ | | Commodity Strategy Fund |
| ∎ | | Global Real Estate Securities Fund |
| ∎ | | Alternative Premia Fund |
| ∎ | | Absolute Return Tracker Fund |
| ∎ | | Managed Futures Strategy Fund |
| ∎ | | MLP Energy Infrastructure Fund |
| ∎ | | Multi-Manager Alternatives Fund |
| ∎ | | Absolute Return Multi-Asset Fund |
| ∎ | | Global Infrastructure Fund |
Total Portfolio Solutions
| ∎ | | Global Managed Beta Fund |
| ∎ | | Multi-ManagerNon-Core Fixed Income Fund |
| ∎ | | Multi-Manager U.S. Dynamic Equity Fund |
| ∎ | | Multi-Manager Global Equity Fund |
| ∎ | | Multi-Manager International Equity Fund |
| ∎ | | Tactical Tilt Overlay Fund |
| ∎ | | Balanced Strategy Portfolio |
| ∎ | | Multi-Manager U.S. Small Cap Equity Fund |
| ∎ | | Multi-Manager Real Assets Strategy Fund |
| ∎ | | Growth and Income Strategy Portfolio |
| ∎ | | Growth Strategy Portfolio |
| ∎ | | Dynamic Global Equity Fund4 |
| ∎ | | Satellite Strategies Portfolio |
| ∎ | | Enhanced Dividend Global Equity Portfolio |
| ∎ | | Tax-Advantaged Global Equity Portfolio |
| ∎ | | Strategic Factor Allocation Fund |
| ∎ | | Target Date 2020 Portfolio |
| ∎ | | Target Date 2025 Portfolio |
| ∎ | | Target Date 2030 Portfolio |
| ∎ | | Target Date 2035 Portfolio |
| ∎ | | Target Date 2040 Portfolio |
| ∎ | | Target Date 2045 Portfolio |
| ∎ | | Target Date 2050 Portfolio |
| ∎ | | Target Date 2055 Portfolio |
| ∎ | | Target Date 2060 Portfolio |
| ∎ | | GQG Partners International Opportunities Fund |
| 1 | | You could lose money by investing in the Fund. Although the Fund seeks to preserve the value of your investment at $1.00 per share, it cannot guarantee it will do so. An investment in the Fund is not a deposit of a bank and is not insured or guaranteed by the Federal Deposit Insurance Corporation or any other government agency. The Fund’s sponsor has no legal obligation to provide financial support to the Fund, and you should not expect that the sponsor will provide financial support to the Fund at any time. |
| 2 | | You could lose money by investing in the Fund. Because the share price of the Fund will fluctuate, when you sell your shares they may be worth more or less than what you originally paid for them. The Fund may impose a fee upon sale of your shares or may temporarily suspend your ability to sell shares if the Fund’s liquidity falls below required minimums because of market conditions or other factors. An investment in the Fund is not a deposit of a bank and is not insured or guaranteed by the Federal Deposit Insurance Corporation or any other government agency. The Fund’s sponsor has no legal obligation to provide financial support to the Fund, and you should not expect that the sponsor will provide financial support to the Fund at any time. |
| 3 | | You could lose money by investing in the Fund. Although the Fund seeks to preserve the value of your investment at $1.00 per share, it cannot guarantee it will do so. The Fund may impose a fee upon sale of your shares or may temporarily suspend your ability to sell shares if the Fund’s liquidity falls below required minimums because of market conditions or other factors. An investment in the Fund is not a deposit of a bank and is not insured or guaranteed by the Federal Deposit Insurance Corporation or any other government agency. The Fund’s sponsor has no legal obligation to provide financial support to the Fund, and you should not expect that the sponsor will provide financial support to the Fund at any time. |
| 4 | | Effective after the close of business on February 28, 2019, the Goldman Sachs Equity Growth Strategy Portfolio was renamed the Goldman Sachs Dynamic Global Equity Fund. |
Financial Square FundsSMand Investor FundsSMare registered service marks of Goldman Sachs & Co. LLC.
| * | | This list coversopen-end funds only. Please visit our website at www.GSAMFUNDS.com to learn about ourclosed-end funds and exchange-traded funds. |
| | |
TRUSTEES Jessica Palmer,Chair Kathryn A. Cassidy Diana M. Daniels James A. McNamara Roy W. Templin Gregory G. Weaver | | OFFICERS James A. McNamara,President Scott M. McHugh,Treasurer, Senior Vice President and Principal Financial Officer Joseph F. DiMaria,Assistant Treasurer and Principal Accounting Officer Caroline L. Kraus,Secretary |
| |
GOLDMAN SACHS & CO. LLC Distributor and Transfer Agent | | GOLDMAN SACHS ASSET MANAGEMENT, L.P. Investment Adviser |
Visit our web site atwww.GSAMFUNDS.com to obtain the most recentmonth-end returns.
Goldman Sachs Asset Management, L.P. 200 West Street, New York, New York 10282
The reports concerning the Funds included in this shareholder report may contain certain forward-looking statements about the factors that may affect the performance of the Funds in the future. These statements are based on Fund management’s predictions and expectations concerning certain future events and their expected impact on the Funds, such as performance of the economy as a whole and of specific industry sectors, changes in the levels of interest rates, the impact of developing world events, and other factors that may influence the future performance of the Funds. Management believes these forward-looking statements to be reasonable, although they are inherently uncertain and difficult to predict. Actual events may cause adjustments in portfolio management strategies from those currently expected to be employed.
A description of the policies and procedures that the Funds use to determine how to vote proxies relating to portfolio securities and information regarding how a Fund voted proxies relating to portfolio securities during the most recent12-month period ended June 30 is available (i) without charge, upon request by calling1-800-526-7384 (for Retail Shareholders) or1-800-621-2550 (for Institutional Shareholders); and (ii) on the Securities and Exchange Commission (“SEC”) web site at http://www.sec.gov.
The Funds will file portfolio holdings information for each month in a fiscal quarter within 60 days after the end of the relevant fiscal quarter on Form N-PORT. Portfolio holdings information for the third month of each fiscal quarter will be made available on the SEC’s web site at http://www.sec.gov. Portfolio holdings information may be obtained upon request and without charge by calling1-800-526-7384 (for Retail Shareholders) or1-800-621-2550 (for Institutional Shareholders).
Goldman Sachs & Co. LLC (‘‘Goldman Sachs’’) does not provide legal, tax or accounting advice. Any statement contained in this communication (including any attachments) concerning U.S. tax matters was not intended or written to be used, and cannot be used, for the purpose of avoiding penalties under the Internal Revenue Code, and was written to support the promotion or marketing of the transaction(s) or matter(s) addressed. Clients of Goldman Sachs should obtain their own independent tax advice based on their particular circumstances.
Fund holdings and allocations shown are as of February 28, 2019 and may not be representative of future investments. Fund holdings should not be relied on in making investment decisions and should not be construed as research or investment advice regarding particular securities. Current and future holdings are subject to risk.
The Global Industry Classification Standard (GICS) was developed by and is the exclusive property and a service mark of Morgan Stanley Capital International Inc. (MSCI) and Standard & Poor’s, a division of The McGraw-Hill Companies, Inc. (S&P) and is licensed for use by Goldman Sachs. Neither MSCI, S&P nor any other party involved in making or compiling the GICS or any GICS classifications makes any express or implied warranties or representations with respect to such standard or classification (or the results to be obtained by the use thereof), and all such parties hereby expressly disclaim all warranties of originality, accuracy, completeness, merchantability or fitness for a particular purpose with respect to any of such standard or classification. Without limiting any of the foregoing, in no event shall MSCI, S&P, any of their affiliates or any third party involved in making or compiling the GICS or any GICS classifications have any liability for any direct, indirect, special, punitive, consequential or any other damages (including lost profits) even if notified of the possibility of such damages.
The portfolio risk management process includes an effort to monitor and manage risk, but does not imply low risk.
This material is not authorized for distribution to prospective investors unless preceded or accompanied by a current Prospectus or summary prospectus, if applicable. Investors should consider a Fund’s objective, risks, and charges and expenses, and read the summary prospectus, if available, and/or the Prospectus carefully before investing or sending money. The summary prospectus, if available, and the Prospectus contain this and other information about a Fund and may be obtained from your authorized dealer or from Goldman Sachs & Co. LLC by calling (retail –1-800-526-7384) (institutional –1-800-621-2550).
© 2019 Goldman Sachs. All rights reserved. 162450-OTU-960957 EQGRWSAR-19/92K
Goldman Sachs Funds

| | | | |
| | |
| Semi-Annual Report | | | | February 28, 2019 |
| | |
| | | | Fundamental Equity Value Funds |
| | | | Equity Income |
| | | | Focused Value |
| | | | Large Cap Value |
| | | | Mid Cap Value |
| | | | Small Cap Value |
| | | | Small/Mid Cap Value |
It is our intention that beginning on January 1, 2021, paper copies of the Funds’ annual and semi-annual shareholder reports will no longer be sent by mail, unless you specifically request paper copies of the reports from a Funds or from your financial intermediary. Instead, the reports will be made available on a website, and you will be notified by mail each time a report is posted and provided with a website link to access the report.
If you already elected to receive shareholder reports electronically, you will not be affected by this change and you need not take any action. At any time, you may elect to receive reports and certain communications from a Fund electronically by calling the applicable toll-free number below or by contacting your financial intermediary.
You may elect to receive all future shareholder reports in paper free of charge. If you hold shares of a Fund directly with the Fund’s transfer agent, you can inform the transfer agent that you wish to receive paper copies of reports by calling toll-free 800-621-2550 for Institutional, Service, Class R6 and Class P shareholders or 800-526-7384 for all other shareholders. If you hold shares of a Fund through a financial intermediary, please contact your financial intermediary to make this election. Your election to receive reports in paper will apply to all Goldman Sachs Funds held in your account if you invest through your financial intermediary or all Goldman Sachs Funds held with the Funds’ transfer agent if you invest directly with the transfer agent.

Goldman Sachs Fundamental Equity Value Funds
| | | | |
| | | |
| NOT FDIC-INSURED | | May Lose Value | | No Bank Guarantee |
GOLDMAN SACHS FUNDAMENTAL EQUITY VALUE FUNDS
What Differentiates the Goldman Sachs Value Strategies’ Investment Process?
Goldman Sachs’ Fundamental Equity Value Strategies Team (the “Team”) believes that all successful investing should thoughtfully weigh two important attributes of a stock: price and prospects. Through independent fundamental research, the Team seeks to identify and invest in quality businesses that are selling at compelling valuations.


At the heart of our value investment philosophy is a belief in the rigorous analysis of business fundamentals. Our approach may include:
| ∎ | | Meetings with management teams and on-site company visits |
| ∎ | | Industry-specific, proprietary financial and valuation models |
| ∎ | | Assessment of management quality |
| ∎ | | Analysis of each company’s competitive position and industry dynamics |
| ∎ | | Interviews with competitors, suppliers and customers |

We seek to invest in companies when we believe:
| ∎ | | Market uncertainty exists |
| ∎ | | Their economic value is not recognized by the market |

We seek to buy companies with quality characteristics. For us, this means companies that have:
| ∎ | | Sustainable operating earnings, or competitive advantage |
| ∎ | | Excellent stewardship of capital |
| ∎ | | Capability to earn above their cost of capital |
| ∎ | | Strong or improving balance sheets and cash flow |

Value portfolios that strive to offer:
| | ∎ | | Capital appreciation potential as each company’s true value is recognized in the marketplace | |
| | ∎ | | Investment style consistency | |
1
MARKET REVIEW
Goldman Sachs Fundamental Equity Value Funds
Market Review
Overall, U.S. equities lost ground during the six months ended February 28, 2019 (the “Reporting Period”). The last few months of 2018 were challenging for equities, with markets declining due to investor fears of a Federal Reserve (“Fed”) policy mistake and a global growth slowdown in both corporate earnings and economic data. The tumultuous fourth quarter of 2018 was unable to be overcome by a strong rally in the first two months of the new year, which was driven by oversold equity market conditions, better than consensus anticipated corporate earnings growth and steady macroeconomic data. The Standard & Poor’s 500 Index (the “S&P 500 Index”) ended the Reporting Period with a return of-3.04%. The Russell 3000® Index generated a return of-3.51%.
U.S. equities inched higher as the Reporting Period began in September 2018, driven by robust U.S. macroeconomic data relative to other developed markets and to emerging markets. Against a backdrop of solid economic growth, near-target inflation and healthy monthly job gains, the Fed raised interest rates by 25 basis points, in line with market expectations. (A basis point is 1/100th of a percentage point.) The successful outcome of North American Free Trade Agreement negotiations to its new incarnation as the United States-Mexico-Canada Agreement near month end was also supportive of market sentiment. U.S. equities then fell in October 2018, as investor sentiment rapidly deteriorated on escalating trade and political uncertainty and in a delayed response to an earliersell-off in global rates. The correction resulted in tighter U.S. financial conditions, which had been resilient to Fed interest rate hikes earlier in the calendar year. U.S. equities saw a reprieve in November 2018 on more accommodative comments from Fed Chair Jerome Powell and encouraging progress inU.S.-China trade talks. However, the recovery was short-lived. U.S. equities subsequently plunged in December 2018 on renewed investor fears sparked by the arrest of a Chinese technology executive, a partial U.S. Federal government shutdown, the U.S. President’s criticism of Fed Chair Powell and reignited corporate earnings growth concerns. The Fed raised interest rates by another 25 basis points.
In January 2019, dovish Fed commentary indicating a pause in its hiking cycle, headlines of easing trade tensions and strong corporate earnings propelled U.S. equities higher despite the ongoing U.S. government shutdown and decelerating emerging market demand. (Dovish commentary tends to suggest lower interest rates; opposite of hawkish.) Investor sentiment improved as the release of generally healthy U.S. economic data and corporate earnings suggested that U.S. equity markets had likely oversold at the end of 2018. Toward month end, U.S. equities were supported by a resolution to the long-lasting U.S. government shutdown. The Fed kept its monetary policy unchanged at its January meeting and delivered dovish tilts, including the statement it would be “patient” and a description of inflationary pressures as “muted.”
The U.S. equity market rally continued in February 2019, as corporate earnings growth remained solid, surpassing consensus expectations, which had been reduced at the end of 2018. Investors also rallied around news the deadline for further U.S. tariffs on Chinese goods would be extended given promising developments in deal negotiations. The Fed reaffirmed its dovish tone, announcing its intention to conclude its balance sheet unwind in the near future. (The Fed unwinds, or shrinks, its balance sheet by selling securities on its balance sheet and/or not reinvesting maturing securities.) Additionally, U.S. equity markets were positively surprised by the 2.6% Gross Domestic Product (“GDP”) growth rate for the fourth quarter of 2018 reported at the end of the month. In further evidence of economic strength, U.S. unemployment remained low at 4.0%, and private payrolls grew by 296,000, beating the consensus estimate by 90,000.
2
MARKET REVIEW
For the Reporting Period overall, utilities, real estate and consumer staples, traditionally considered more defensive sectors, were the best performing sectors in the S&P 500 Index. The weakest performing sectors in the S&P 500 Index were energy, materials and information technology, each considered a more economically-sensitive cyclical sector.
Within the U.S. equity market, all capitalization segments posted single-digit negative absolute returns, but on a relative basis,mid-cap stocks, as measured by the Russell Midcap® Index, performed best, followed closely bylarge-cap stocks, as measured by the Russell 1000® Index, and then, at some distance, bysmall-cap stocks, as measured by the Russell 2000® Index. From a style perspective, value-oriented stocks outpaced growth-oriented stocks within thelarge-cap segment of the U.S. equity market, but growth outperformed value within themid-cap segment, and performance within thesmall-cap segment was rather similar between the two styles. (All as measured by the FTSE Russell indices.)
Looking Ahead
Amidst an environment of positive but moderating corporate earnings growth and economic data, we continued to view U.S. equities at the end of the Reporting Period with measured optimism for the remainder of 2019. We think the risk/reward profile of the broad U.S. equity market had become more positive following the late-2018sell-off, but that selectivity will likely be increasingly important in the months to come given higher volatility and downside risks involving trade, politics, slowing revenue growth and margin pressures.
A possible driver for U.S. equity returns in the coming months, in our view, revolves around strong growth momentum and generally positive economic data. GDP growth in the U.S. remained above-trend at the end of the Reporting Period, with the gap in GDP per capita growing steadily compared to the rest of both developed and emerging markets. The ISM Manufacturing Index remained firmly in expansionary territory, providing a durable backdrop, in our opinion, for continued GDP growth and U.S. equity returns. A well-rounded U.S. consumer has been another strong point for the U.S. economy, with above-trend consumer spending growth and suppressed levels of delinquency on consumer loans. At the end of the Reporting Period, we viewedsmaller-cap equities as possibly the biggest beneficiary of the positive economic backdrop, as they have relatively high revenue exposure to the U.S.
In our view, Fed policy will likely remain a focal point for capital markets, with investors looking for more insights into the dovish pivot the Fed took in the last months of the Reporting Period. If markets continue rapidly appreciating, supported by an uptick in inflation and a tightening of the labor market, the Fed could again shift to a more hawkish stance. Conversely, if markets view the recently dovish Fed policy as a sign of deeper macroeconomic issues, returns could potentially soften.
While many investors are concerned about the late-economic cycle pressures on corporate revenue growth and margin expansion, we continued to see opportunities at the end of the Reporting Period, especially on a stock-specific basis. These pressures could create a greater dispersion of U.S. equity returns that we believe can benefit higher quality companies. We also believe pricing power may be an increasingly important factor in this environment, enabling companies to continue growing margins despite a subdued economic environment.
Regardless of market direction, our fundamental,bottom-up stock selection continues to drive our process, rather than headlines or sentiment. We maintain high conviction in the companies the Funds own and believe they have the potential to outperform relative to the broader market regardless of economic growth conditions. We continue to focus on undervalued companies
3
MARKET REVIEW
that we believe have comparatively greater control of their own destiny, such as innovators with differentiated products, companies with low cost structures or companies that have been investing in their own businesses and may be poised to gain market share. We maintain our discipline in identifying companies with what we believe to be strong or improving balance sheets, led by quality management teams and trading at discounted valuations. We remain focused on the long-term performance of the Funds.
As always, deep research resources, a forward-looking investment process and truly actively managed portfolios are keys, in our view, to both preserving capital and outperforming the market over the long term.
4
PORTFOLIO RESULTS
Goldman Sachs Equity Income Fund
Portfolio Composition
Under normal circumstances, the Fund invests at least 80% of its net assets in equity investments that the Goldman Sachs Fundamental Equity U.S. Equity Team considers to have favorable prospects for capital appreciation and/or dividend-paying ability. Although the Fund will invest primarily in publicly traded U.S. securities, including preferred and convertible securities, it may invest up to 25% of its Net Assets in foreign securities, including securities of issuers in emerging countries and securities quoted in foreign currencies. The Fund may also invest up to 20% of its Net Assets in fixed income securities, such as government, corporate and bank debt obligations, that offer the potential to further the Fund’s investment objective of long-term capital appreciation and growth of income.
Portfolio Management Discussion and Analysis
Below, the Goldman Sachs Fundamental Equity U.S. Equity Team discusses the Goldman Sachs Equity Income Fund’s (the “Fund”) performance and positioning for thesix-month period ended February 28, 2019 (the “Reporting Period”).
| Q | | How did the Fund perform during the Reporting Period? |
| A | | During the Reporting Period, the Fund’s Class A, Class C, Institutional, Service, Investor, Class P, Class R and Class R6 Shares generated cumulative total returns, without sales charges, of-0.58%,-0.88%,-0.39%,-0.63%,-0.42%,-0.39%,-0.70% and-0.36%, respectively. These returns compare to the-1.62% cumulative total return of the Fund’s benchmark, the Russell 1000® Value Index (with dividends reinvested) (the “Russell Index”), during the same period. |
| Q | | What key factors were responsible for the Fund’s performance during the Reporting Period? |
| A | | While the Fund posted negative absolute returns, it outperformed the Russell Index on a relative basis during the Reporting Period due primarily to effective stock selection. Sector allocation as a whole also contributed positively to the Fund’s relative performance. |
| Q | | Which equity market sectors most significantly affected Fund performance? |
| A | | Contributing positively to the Fund’s relative results was effective stock selection in the energy, industrials and utilities sectors. Having an overweight to utilities, which outperformed the Russell Index during the Reporting Period, also added value. The sectors that detracted most from the Fund’s relative results during the Reporting Period were consumer staples and information technology, wherein stock selection proved challenging. Allocation positioning within communication services also hurt. |
| Q | | What were some of the Fund’s best-performing individual stocks? |
| A | | The Fund benefited most relative to the Russell Index from positions in utilities company Pinnacle West Capital, pharmaceuticals company Pfizer and rail transportation company Union Pacific. |
| | Pinnacle West Capital offers regulated retail and wholesale electricity in Arizona. Its stock appreciated following the rejection of a renewable energy requirement for electric utilities by voters. Arizona’s Proposition 127, a constitutionally-mandated renewable energy requirement, had weighed on the stock until it was overruled in early November 2018. We believe the defeat helped support the stock’s multiple expansion, boosted by a positive third quarter earnings per share and revenue results report that beat consensus estimates in November 2018. More favorable weather and lower federal income taxes also led to an increase for full-year 2018 guidance. At the end of the Reporting Period, we believed the company had a steady-state business with the potential to improve margins. |
| | Pfizer develops and produces medicines and vaccines for a wide range of medical disciplines. Its share price increased through most of the Reporting Period due to multiple factors. First, the company was able to provide notable visibility for the next few years given its impressive drug pipeline. Second, its share price was supported by the lack of any patent cliffs in the foreseeable future, meaning the threat of generics is limited and mitigating a potential threat to revenues. Third, drug approvals by the Food and Drug |
5
PORTFOLIO RESULTS
| | Administration benefited Pfizer’s stock during the Reporting Period. At the end of the Reporting Period, we believed Pfizer was trading at a relatively inexpensive valuation, had a management team committed to generating shareholder returns, and could benefit from what we view as one of the best drug pipelines in the industry. |
| | Much of Union Pacific’s stock’s strong performance was driven by an announcement in early January 2019 naming a new Chief Operating Officer with a successful track record spanning four decades. Its share price also benefited from a strong earnings reportmid-January and an announcement of share buybacks in February 2019. Overall, at the end of the Reporting Period, we believed Union Pacific had an accomplished and knowledgeable management team focused on improving operating metrics that could potentially continue generating shareholder value. |
| Q | | Which stocks detracted significantly from the Fund’s performance during the Reporting Period? |
| A | | Detracting most from the Fund’s results relative to the Russell Index were positions in information technology giant Apple, processed and packaged foods manufacturer and seller Conagra Brands and regional bank Bank OZK. |
| | Apple’s underperformance during the Reporting Period began when the company reported third quarter 2018 earnings at the start of November 2018. The report was received negatively by markets due to underwhelming forward guidance, softer iPhone sales, macro uncertainty and the announcement Apple will no longer be reporting unit details on products. However, the report had some silver lining, with solid cash flows and the repurchase of $20 billion worth of stock. Apple’s share price continued declining as the Reporting Period progressed due to lowered revenue guidance, legal challenges and declines in new iPhone orders. Its share price began to bounce back in January 2019 upon the announcement of fourth quarter 2018 earnings, which showed better than consensus anticipated iPhone sales and revenues that beatpre-announced numbers. Overall, at the end of the Reporting Period, we continued to like Apple given what we see as its potential for pricing power and unit growth, normalizing replacement rates and solid gross margins. |
| | Conagra Brands’ share prices fell late-September 2018 when the company reported weaker than consensus expected earnings. However, we believe this was largely attributed to higher taxes, as the underlying business continued showing solid growth. Its share price again declinedmid-December 2018 in response to a challenging earnings report that demonstrated issues with the acquisition of one of its peers. We viewed the acquisition concerns as a temporary headwind and continued to like the company at the end of the Reporting Period given our confidence in its base business and what we view as its relatively solid valuations and potential for significant outperformance if the company is able to continue turning around the business. |
| | Bank OZK’s weak 2018 performance started in July 2018, before the Reporting Period began, when the bank announced disappointing second quarter 2018 earnings results. While the headline earnings per share number was in line with market expectations, slower loan growth and net interest margins were below consensus expectations. The majority of Bank OZK’s share price decline, however, came on a single day inmid-October 2018 upon the announcement the bank had two large delinquent loans, one residential and one commercial. This challenged our investment thesis on the stock, and we exited the Fund’s position, believing the incident would be a long-term headwind to Bank OZK’s stock price. |
| Q | | How did the Fund use derivatives and similar instruments during the Reporting Period? |
| A | | During the Reporting Period, we did not use derivatives as part of an active management strategy. |
| Q | | Did the Fund make any significant purchases or sales during the Reporting Period? |
| A | | During the Reporting Period, we initiated a Fund position in multinational consumer goods company Procter & Gamble. We believe the company could start to see an inflection from its recent consolidation, and we remain positive that its price cuts could help improve sales in emerging markets. Additionally, we are confident in its management’s ability to adapt to the changing landscape and various business challenges. We think its innovative pipeline and brand awareness may well lead to continued sales momentum going forward. |
| | We established a Fund position in CMS Energy, a regulated electric, gas and enterprises utility operating in Michigan. We are confident in the company’s exposure to the favorable regulatory constructs in Michigan. We also believe the company was undervalued at the time of purchase given its consistent earnings per share growth and what we see as its effective management team and solid performance across a broad range of market cycles. |
6
PORTFOLIO RESULTS
| | Conversely, in addition to the sale already mentioned, we exited the Fund’s position in AT&T, one of the largest telecommunications companies in the U.S. Its stock remained relatively flat during the Reporting Period but was challenged in October 2018 upon issuing its third quarter 2018 earnings report, which highlighted significant losses in its television business and a decrease in its advertisement revenues. Additionally, certain competitors have become better positioned in the industry, in our view. While we originally liked the company for its diverse business base and industry positioning, we sold the stock in favor of companies we consider more directly exposed to the positive secular trends in the wireless industry. |
| | We sold the Fund’s position in ConocoPhillips, a natural gas and oil exploration and production company. After a span of strong performance related to improved company fundamentals and an appreciation of oil prices, ConocoPhillips hit our price target. We decided to sell the position to fund higher conviction ideas. |
| Q | | Were there any changes to the Fund’s portfolio management team during the Reporting Period? |
| A | | Effective September 30, 2018, Sean Gallagher retired from Goldman Sachs and no longer serves as a portfolio manager for the Fund. Dan Lochner and Charles “Brook” Dane continue to serve as portfolio managers for the Fund. |
| Q | | Were there any notable changes in the Fund’s weightings during the Reporting Period? |
| A | | In constructing the Fund’s portfolio, we focus on picking stocks rather than on making industry or sector bets. We seek to outpace the benchmark index by overweighting stocks that we expect to outperform and underweighting those that we think may lag. Consequently, changes in its sector weights are generally the direct result of individual stock selection or of stock appreciation or depreciation. That said, during the Reporting Period, the Fund’s allocations compared to the Russell Index in utilities, energy and consumer discretionary increased. The Fund’s exposure to health care, information technology and consumer staples decreased compared to the Russell Index. |
| Q | | How was the Fund positioned relative to its benchmark index at the end of February 2019? |
| A | | At the end of February 2019, the Fund had overweight positions relative to the Russell Index in the health care, utilities and energy sectors. On the same date, the Fund had underweight positions compared to the Russell Index in financials and consumer discretionary and was rather neutrally weighted to the Russell Index in information technology, consumer staples, real estate, industrials, materials and communication services. |
7
FUND BASICS
Equity Income Fund
as of February 28, 2019
| | | | | | | | | | |
| | PERFORMANCE REVIEW | |
| | | |
| | | September 1, 2018–February 28, 2019 | | Fund Total Return
(based on NAV)1 | | | Russell 1000®
Value Index2 | |
| | | |
| | Class A | | | -0.58 | % | | | -1.62 | % |
| | Class C | | | -0.88 | | | | -1.62 | |
| | Institutional | | | -0.39 | | | | -1.62 | |
| | Service | | | -0.63 | | | | -1.62 | |
| | Investor | | | -0.42 | | | | -1.62 | |
| | Class P | | | -0.39 | | | | -1.62 | |
| | Class R | | | -0.70 | | | | -1.62 | |
| | | Class R6 | | | -0.36 | | | | -1.62 | |
| | 1 | | The net asset value (“NAV”) represents the net assets of the class of the Fund (ex-dividend) divided by the total number of shares of the class outstanding. The Fund’s performance reflects the reinvestment of dividends and other distributions. The Fund’s performance does not reflect the deduction of any applicable sales charges. |
| | 2 | | The unmanaged Russell 1000 Value Index is a market capitalization weighted index of the 1,000 largest U.S. companies with lower price-to-book ratios and lower forecasted growth values. The Russell 1000 Value Index figures do not reflect any deduction of fees, expenses or taxes. It is not possible to invest directly in an unmanaged index. |
| | | | | | | | | | | | | | | | | | | | |
| | STANDARDIZED TOTAL RETURNS3 |
| | | | | | |
| | | For the period ended 12/31/18 | | One Year | | | Five Years | | | Ten Years | | | Since Inception | | | Inception Date |
| | | | | | |
| | Class A | | | -11.27 | % | | | 3.65 | % | | | 8.71 | % | | | 6.52 | % | | 2/5/93 |
| | Class C | | | -7.64 | | | | 4.06 | | | | 8.52 | | | | 3.02 | | | 8/15/97 |
| | Institutional | | | -5.72 | | | | 5.25 | | | | 9.76 | | | | 5.82 | | | 6/3/96 |
| | Service | | | -6.19 | | | | 4.72 | | | | 9.22 | | | | 5.37 | | | 3/6/96 |
| | Investor | | | -5.85 | | | | 5.10 | | | | 9.60 | | | | 4.40 | | | 11/30/07 |
| | Class P | | | N/A | | | | N/A | | | | N/A | | | | -4.78 | | | 4/17/18 |
| | Class R | | | -6.34 | | | | 4.56 | | | | 9.05 | | | | 3.88 | | | 11/30/07 |
| | | Class R6 | | | -5.70 | | | | N/A | | | | N/A | | | | 3.86 | | | 7/31/15 |
| | 3 | | The Standardized Total Returns are average annual total returns or cumulative total returns (only if the performance period is one year or less) as of the most recent calendar quarter-end. They assume reinvestment of all distributions at NAV. These returns reflect a maximum initial sales charge of 5.5% for Class A Shares and the assumed contingent deferred sales charge for Class C Shares (1% if redeemed within 12 months of purchase). Effective July 30, 2018, Class C Shares convert automatically to Class A Shares on or about the fifteenth day of the last month of the calendar quarter that is ten years after the purchase date. Because Institutional, Service, Investor, Class P, Class R, and Class R6 Shares do not involve a sales charge, such a charge is not applied to their Standardized Total Returns. |
The returns set forth in the tables above represent past performance. Past performance does not guarantee future results. The Fund’s investment return and principal value will fluctuate so that an investor’s shares, when redeemed, may be worth more or less than their original cost. Current performance may be lower or higher than the performance quoted above. Please visit our web site at www.GSAMFUNDS.com to obtain the most recent month-end returns. Performance reflects fee waivers and/or expense limitations in effect during the periods shown. In their absence, performance would be reduced. Returns do not reflect the deduction of taxes that a shareholder would pay on Fund distributions or the redemption of Fund shares.
8
FUND BASICS
| | | | | | | | | | |
| | EXPENSE RATIOS4 | |
| | | |
| | | | | Net Expense Ratio (Current) | | | Gross Expense Ratio (Before Waivers) | |
| | Class A | | | 1.08 | % | | | 1.27 | % |
| | Class C | | | 1.83 | | | | 2.02 | |
| | Institutional | | | 0.73 | | | | 0.88 | |
| | Service | | | 1.23 | | | | 1.38 | |
| | Investor | | | 0.83 | | | | 1.02 | |
| | Class P | | | 0.72 | | | | 0.87 | |
| | Class R | | | 1.33 | | | | 1.52 | |
| | | Class R6 | | | 0.72 | | | | 0.87 | |
| | 4 | | The expense ratios of the Fund, both current (net of applicable fee waivers and/or expense limitations) and before waivers (gross of applicable fee waivers and/or expense limitations) are as set forth above according to the most recent publicly available Prospectus for the Fund and may differ from the expense ratios disclosed in the Financial Highlights in this report. Pursuant to a contractual arrangement, the Fund’s waivers and/or expense limitations will remain in place through at least December 28, 2019, and prior to such date the investment adviser may not terminate the arrangements without the approval of the Fund’s Board of Trustees. If these arrangements are discontinued in the future, the expense ratios may change without shareholder approval. |
| | | | | | | | |
| | TOP TEN HOLDINGS AS OF 2/28/195 |
| | | |
| | | Holding | | % of Net Assets | | | Line of Business |
| | | |
| | Johnson & Johnson | | | 4.6 | % | | Pharmaceuticals |
| | Chevron Corp. | | | 3.6 | | | Oil, Gas & Consumable Fuels |
| | Cisco Systems, Inc. | | | 3.2 | | | Communications Equipment |
| | JPMorgan Chase & Co. | | | 3.1 | | | Banks |
| | Verizon Communications, Inc. | | | 3.0 | | | Diversified Telecommunication
Services |
| | Pfizer, Inc. | | | 2.9 | | | Pharmaceuticals |
| | Medtronic PLC | | | 2.6 | | | Health Care Equipment & Supplies |
| | Royal Dutch Shell PLC Class B ADR | | | 2.4 | | | Oil, Gas & Consumable Fuels |
| | The Procter & Gamble Co. | | | 2.3 | | | Household Products |
| | | Exxon Mobil Corp. | | | 2.1 | | | Oil, Gas & Consumable Fuels |
| | 5 | | The top 10 holdings may not be representative of the Fund’s future investments. |
9
FUND BASICS
|
| FUND VS. BENCHMARK SECTOR ALLOCATIONS6 |
|
| As of February 28, 2019 |
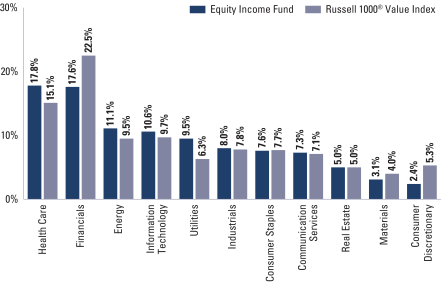
| | 6 | | The Fund is actively managed and, as such, its composition may differ over time. Consequently, the Fund’s overall sector allocations may differ from the percentages contained in the graph above. The graph categorizes investments using the Global Industry Classification Standard (“GICS”); however, the sector classifications used by the portfolio management team may differ from GICS. The percentage shown for each investment category reflects the value of investments in that category as a percentage of market value. The graph depicts the Fund’s investments but may not represent the Fund’s market exposure due to the exclusion of certain derivatives, if any, as listed in the Additional Investment Information section of the Schedule of Investments. |
10
PORTFOLIO RESULTS
Goldman Sachs Focused Value Fund
Portfolio Composition
The Fund’s investment objective is to seek long-term capital appreciation. The Fund invests, under normal circumstances, at least 80% of its net assets plus any borrowings for investment purposes (measured at time of purchase) in a portfolio of equity investments, including common stocks, preferred stocks and other securities and instruments having equity characteristics. The Fund seeks to achieve its investment objective by investing, under normal circumstances, in approximately 20-40 companies that are considered value opportunities, which the Investment Adviser defines as companies with identifiable competitive advantages whose intrinsic value is not reflected in the stock price. The Fund may invest in securities of companies of any capitalization. Although the Fund will invest primarily in publicly traded U.S. securities, it may invest up to 20% of its total assets in foreign securities, including securities of issuers in countries with emerging markets or economies (“emerging countries”) and securities quoted in foreign currencies. The Fund may invest in fixed income securities, such as government, corporate and bank debt obligations.
Portfolio Management Discussion and Analysis
Below, the Goldman Sachs Fundamental Equity U.S. Equity Team discusses the Goldman Sachs Focused Value Fund’s (the “Fund”) performance and positioning for the six-month period ended February 28, 2019 (the “Reporting Period”).
| Q | | How did the Fund perform during the Reporting Period? |
| A | | During the Reporting Period, the Fund’s Class A, Class C, Institutional, Investor, Class P, Class R and Class R6 Shares generated cumulative total returns, without sales charges, of-2.20%,-2.55%, -1.93%, -2.14%, -2.06%, -2.30% and-1.98%, respectively. These returns compare to the -1.62% cumulative total return of the Fund’s benchmark, the Russell 1000® Value Index (with dividends reinvested) (the “Russell Index”), during the same period. |
| Q | | What key factors were responsible for the Fund’s performance during the Reporting Period? |
| A | | The Fund underperformed the Russell Index on a relative basis due primarily to sector allocation as a whole. Stock selection overall contributed positively to the Fund’s performance relative to the Russell Index during the Reporting Period. |
| Q | | Which equity market sectors most significantly affected Fund performance? |
| A | | The sectors that most meaningfully detracted from the Fund’s relative results during the Reporting Period were materials, information technology and consumer staples, wherein both stock selection and allocation positioning in each proved challenging. Partially offsetting these detractors was effective stock selection and allocation positioning in communication services, industrials and financials, which contributed positively. |
| Q | | Which stocks detracted significantly from the Fund’s performance during the Reporting Period? |
| A | | Detracting most from the Fund’s results relative to the Russell Index were positions in materials, chemicals and agricultural products developer DowDuPont, health care conglomerate CVS Health and petroleum refiner and transporter Marathon Petroleum. |
| | Most of DowDuPont’s share price decline occurred during the first two months of the Reporting Period. Its share price fell at the end of September 2018 driven both by weakness in the materials and chemicals industries and by negative reports by several analysts. In October 2018, DowDuPont disclosed a $4.6 billion write-down of goodwill*, which was viewed negatively by investors. Despite the decline in the stock, we remained optimistic at the end of the Reporting Period on the company’s ability to unlock operating synergies, decrease costs and deploy cash on high return projects to further improve profitability. Overall, we believed DowDuPont was well positioned to benefit from inflecting |
| | * | | Goodwill impairment is an earnings charge that companies record on their income statements after they identify that there is persuasive evidence that the asset associated with the goodwill can no longer demonstrate financial results that were expected from it at the time of its purchase. Because many companies acquire other firms and pay a price that exceeds the fair value of identifiable assets and liabilities that the acquired firm possesses, the difference between the purchase price and the fair value of acquired assets is recorded as goodwill. However, if unforeseen circumstances arise that decrease expected cash flows from acquired assets, their fair value can be lower than what was originally paid for them, and a company must book a goodwill impairment. |
11
PORTFOLIO RESULTS
| | cyclical tailwinds across multiple business segments as it works to improve its operations and unlock efficiencies. |
| | CVS Health’s share price declined in October 2018 when the company faced regulatory challenges regarding its upcoming acquisition of Aetna. Its stock sold off more significantly in December 2018 and into 2019, as regulatory issues resurfaced and earnings fell short of consensus expectations. Given these challenges, we decided to exit the position in favor of what we saw as better risk/reward opportunities elsewhere. |
| | The majority of Marathon Petroleum’s weak performance was due to broader declines in the energy sector, as oil prices fell significantly during the Reporting Period. We viewed this as a temporary headwind and a possible long-term positive given the company’s relatively lower exposure to the commodity. Additionally, the company had recently acquired one of its peers in a deal we viewed as value accretive with significant potential synergies. Overall, at the end of the Reporting Period, we continued to like this company given what we consider to be its solid positioning amidst increased regulation, possible synergies, a steady macro environment and its management’s commitment to returning shareholder value through dividends and share buybacks. |
| Q | | What were some of the Fund’s best-performing individual stocks? |
| A | | The Fund benefited most relative to the Russell Index from positions in pharmaceutical company Eli Lilly, rail transportation company Union Pacific and telecommunications company Verizon Communications. |
| | Eli Lilly’s stock climbed through most of November 2018 after the company reported solid quarterly results in which it beat consensus earnings per share and revenue expectations and also raised guidance for the full year 2018. Then, in December 2018, Eli Lilly shares benefited from the announcement of better than market expected 2019 guidance, featuring significant improvements in revenue growth and long-term sales growth. The company had a volatile month of trading in January 2019, finishing the month in positive territory but lagging the health care sector as well as the broad U.S. equity market. Early on, a negative headline on drug pricing pressured the stock along with that of other pharmaceutical companies. Then news of Eli Lilly’s acquisition of Loxo Oncology, a cancer drug company, helped give a boost to its shares. These gains were quickly erased after a phase 3 soft tissue study did not meet its primary objective, leading the Food and Drug Administration to recommend new patients not start using the drug. All in all, we viewed January 2019 as a month of primarily short-term trading noise that did not alter the underlying fundamentals of the company or why we favor it. At the end of the Reporting Period, we believed the company maintained strong risk/reward prospects versus its peers, and we saw an upside to its diabetes franchise. We were also optimistic about its management’s commitment to creating shareholder value through increased dividends and share repurchases. Additionally, we viewed the company’s split with Elanco, its former animal health business segment, as value accretive. Overall, we viewed Eli Lilly as a high quality pharmaceuticals business with leading franchises, a robust drug pipeline and an improving financial profile. |
| | Much of Union Pacific’s stock’s strong performance was driven by an announcement in early January 2019 naming a new Chief Operating Officer with a successful track record spanning four decades. Its share price also benefited from a strong earnings report mid-January and an announcement of share buybacks in February 2019. Overall, at the end of the Reporting Period, we believed Union Pacific had an accomplished and knowledgeable management team focused on improving operating metrics that could potentially continue generating shareholder value. |
| | Verizon Communications’ stock appreciated significantly in October 2018, resulting from a strong earnings report that featured reduced subscriber attrition, improved revenues and potential for fifth-generation (“5G”) growth. While we remain positive on some of the company’s opportunities moving forward and on improving wireless market conditions, given its significant increase in share price, we exited the Fund’s position in Verizon Communications in favor of what we saw as better risk/reward opportunities elsewhere. |
| Q | | How did the Fund use derivatives and similar instruments during the Reporting Period? |
| A | | During the Reporting Period, we did not use derivatives as part of an active management strategy. |
| Q | | Did the Fund make any significant purchases or sales during the Reporting Period? |
| A | | During the Reporting Period, we initiated a Fund position in NextEra Energy, an electric power and energy infrastructure company located in Florida. We believe NextEra Energy is a high quality utilities company in a constructive regulatory environment. We are also positive on the company’s |
12
PORTFOLIO RESULTS
| | renewable energy efforts, including wind, natural gas and solar energy infrastructures. |
| | We established a Fund position in Honeywell International, a large industrial conglomerate. We are confident in the company given what we see as its impressive management execution and solid organic growth. Additionally, we believe the stock has positive upside opportunities given the potential alleviation of certain cost pressures relative to prices. |
| | Conversely, in addition to those sales mentioned earlier, we eliminated the Fund’s position in Berkshire Hathaway, a multinational conglomerate holding company. While we still like many aspects of the company, including what we consider to be solid free cash flows, optionality with excess cash and improving insurance operations, we became more concerned around immediate prospects for buying whole businesses because of high valuations. (In business, optionality is the value of additional optional investment opportunities available only after having made an initial investment.) Given this view, we exited the position in favor of higher conviction ideas elsewhere. |
| | We exited the Fund’s position in Zimmer Biomet Holdings, a large medical device company. We liked the company for its improving supply constraint, new products and solid valuation. However, as the stock performed well and our investment thesis played out, we sold the position in favor of what we felt were better risk/reward opportunities elsewhere. |
| Q | | Were there any changes to the Fund’s portfolio management team during the Reporting Period? |
| A | | Effective September 30, 2018, Sean Gallagher retired from Goldman Sachs and no longer serves as a portfolio manager for the Fund. Charles “Brook” Dane continues to serve as portfolio manager for the Fund. |
| Q | | Were there any notable changes in the Fund’s weightings during the Reporting Period? |
| A | | In constructing the Fund’s portfolio, we focus on picking stocks rather than on making industry or sector bets. We seek to outpace the benchmark index by overweighting stocks that we expect to outperform and underweighting those that we think may lag. Consequently, changes in its sector weights are generally the direct result of individual stock selection or of stock appreciation or depreciation. That said, during the Reporting Period, the Fund’s allocations compared to the Russell Index in industrials, health care and consumer staples increased. The Fund’s exposure to the information technology, materials and financials sectors decreased compared to the Russell Index. |
| Q | | How was the Fund positioned relative to its benchmark index at the end of February 2019? |
| A | | At the end of February 2019, the Fund was overweight in industrials, communication services and consumer discretionary relative to the Russell Index. On the same date, the Fund was underweight in financials, real estate and information technology and was rather neutrally weighted to the Russell Index in materials, health care, energy, utilities and consumer staples at the end of February 2019. |
13
FUND BASICS
Focused Value Fund
as of February 28, 2019
| | | | | | | | | | |
| | PERFORMANCE REVIEW | |
| | | |
| | | September 1, 2018–February 28, 2019 | | Fund Total Return
(based on NAV)1 | | | Russell 1000®
Value Index2 | |
| | | |
| | Class A | | | -2.20 | % | | | -1.62 | % |
| | Class C | | | -2.55 | | | | -1.62 | |
| | Institutional | | | -1.93 | | | | -1.62 | |
| | Investor | | | -2.14 | | | | -1.62 | |
| | Class P | | | -2.06 | | | | -1.62 | |
| | Class R | | | -2.30 | | | | -1.62 | |
| | | Class R6 | | | -1.98 | | | | -1.62 | |
| | 1 | | The net asset value (“NAV”) represents the net assets of the class of the Fund (ex-dividend) divided by the total number of shares of the class outstanding. The Fund’s performance reflects the reinvestment of dividends and other distributions. The Fund’s performance does not reflect the deduction of any applicable sales charges. |
| | 2 | | The unmanaged Russell 1000 Value Index is a market capitalization weighted index of the 1,000 largest U.S. companies with lower price-to-book ratios and lower forecasted growth values. The Russell 1000 Value Index figures do not reflect any deduction of fees, expenses or taxes. It is not possible to invest directly in an unmanaged index. |
| | | | | | | | | | | | |
| | STANDARDIZED TOTAL RETURNS3 |
| | | | |
| | | For the period ended 12/31/18 | | One Year | | | Since Inception | | | Inception Date |
| | | | |
| | Class A | | | -14.75 | % | | | 0.46 | % | | 7/31/15 |
| | Class C | | | -11.25 | | | | 1.41 | | | 7/31/15 |
| | Institutional | | | -9.36 | | | | 2.54 | | | 7/31/15 |
| | Investor | | | -9.48 | | | | 2.39 | | | 7/31/15 |
| | Class P | | | N/A | | | | -6.91 | | | 4/17/18 |
| | Class R | | | -9.96 | | | | 1.88 | | | 7/31/15 |
| | | Class R6 | | | -9.33 | | | | 2.58 | | | 7/31/15 |
| | 3 | | The Standardized Total Returns are average annual total returns or cumulative total returns (only if the performance period is one year or less) as of the most recent calendar quarter-end. They assume reinvestment of all distributions at NAV. These returns reflect a maximum initial sales charge of 5.5% for Class A Shares and the assumed contingent deferred sales charge for Class C Shares (1% if redeemed within 12 months of purchase). Because Institutional, Service, Investor, Class P, Class R, and Class R6 Shares do not involve a sales charge, such a charge is not applied to their Standardized Total Returns. |
The returns set forth in the tables above represent past performance. Past performance does not guarantee future results. The Fund’s investment return and principal value will fluctuate so that an investor’s shares, when redeemed, may be worth more or less than their original cost. Current performance may be lower or higher than the performance quoted above. Please visit our web site at www.GSAMFUNDS.com to obtain the most recent month-end returns. Performance reflects fee waivers and/or expense limitations in effect during the periods shown. In their absence, performance would be reduced. Returns do not reflect the deduction of taxes that a shareholder would pay on Fund distributions or the redemption of Fund shares.
14
FUND BASICS
| | | | | | | | | | |
| | EXPENSE RATIOS4 | |
| | | |
| | | | | Net Expense Ratio (Current) | | | Gross Expense Ratio (Before Waivers) | |
| | | |
| | Class A | | | 1.08 | % | | | 5.80 | % |
| | Class C | | | 1.83 | | | | 6.55 | |
| | Institutional | | | 0.73 | | | | 5.41 | |
| | Investor | | | 0.83 | | | | 5.55 | |
| | Class P | | | 0.72 | | | | 5.40 | |
| | Class R | | | 1.33 | | | | 6.05 | |
| | | Class R6 | | | 0.72 | | | | 5.40 | |
| | 4 | | The expense ratios of the Fund, both current (net of applicable fee waivers and/or expense limitations) and before waivers (gross of applicable fee waivers and/or expense limitations) are as set forth above according to the most recent publicly available Prospectus for the Fund and may differ from the expense ratios disclosed in the Financial Highlights in this report. Pursuant to a contractual arrangement, the Fund’s waivers and/or expense limitations will remain in place through at least December 28, 2019, and prior to such date the investment adviser may not terminate the arrangements without the approval of the Fund’s Board of Trustees. If these arrangements are discontinued in the future, the expense ratios may change without shareholder approval. |
| | | | | | | | | | |
| | TOP TEN HOLDINGS AS OF 2/28/195 | |
| | | |
| | | Holding | | % of Net Assets | | | Line of Business | |
| | | |
| | Alphabet, Inc. Class A | | | 5.4 | % | | | Interactive Media & Services | |
| | | |
| | NextEra Energy, Inc. | | | 5.3 | | | | Electric Utilities | |
| | | |
| | Bank of America Corp. | | | 5.1 | | | | Banks | |
| | | |
| | Walmart, Inc. | | | 5.1 | | | | Food & Staples Retailing | |
| | | |
| | Honeywell International, Inc. | | | 5.1 | | | | Industrial Conglomerates | |
| | | |
| | American Express Co. | | | 3.6 | | | | Consumer Finance | |
| | | |
| | JPMorgan Chase & Co. | | | 3.5 | | | | Banks | |
| | | |
| | Union Pacific Corp. | | | 3.5 | | | | Road & Rail | |
| | | |
| | DowDuPont, Inc. | | | 3.4 | | | | Chemicals | |
| | | The Cooper Cos., Inc. | | | 3.1 | | | | Health Care Equipment & Supplies | |
| | 5 | | The top 10 holdings may not be representative of the Fund’s future investments. |
15
FUND BASICS
|
| FUND VS. BENCHMARK SECTOR ALLOCATIONS6 |
|
| As of February 28, 2019 |
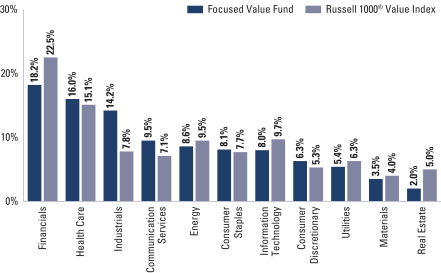
| | 6 | | The Fund is actively managed and, as such, its composition may differ over time. Consequently, the Fund’s overall sector allocations may differ from the percentages contained in the graph above. The graph categorizes investments using the Global Industry Classification Standard (“GICS”); however, the sector classifications used by the portfolio management team may differ from GICS. The percentage shown for each investment category reflects the value of investments in that category as a percentage of market value. The graph depicts the Fund’s investments but may not represent the Fund’s market exposure due to the exclusion of certain derivatives, if any, as listed in the Additional Investment Information section of the Schedule of Investments. |
16
PORTFOLIO RESULTS
Goldman Sachs Large Cap Value Fund
Portfolio Composition
The Fund invests, under normal circumstances, at least 80% of its net assets (plus borrowings for investment purposes) in a diversified portfolio of equity investments in large-cap issuers with public stock market capitalizations within the range of the market capitalization of companies constituting the Russell 1000® Value Index at the time of investment. The Fund seeks its investment objective of long-term capital appreciation by investing in value opportunities that the Goldman Sachs Fundamental Equity U.S. Equity Team defines as companies with identifiable competitive advantages whose intrinsic value is not reflected in the stock price. Although the Fund will invest primarily in publicly traded U.S. securities, including securities of issuers in countries with emerging markets or economies and preferred and convertible securities, it may invest in foreign securities, including securities quoted in foreign currencies. The Fund may also invest in fixed income securities, such as government, corporate and bank debt obligations.
Portfolio Management Discussion and Analysis
Below, the Goldman Sachs Fundamental Equity U.S. Equity Team discusses the Goldman Sachs Large Cap Value Fund’s (the “Fund”) performance and positioning for the six-month period ended February 28, 2019 (the “Reporting Period”).
| Q | | How did the Fund perform during the Reporting Period? |
| A | | During the Reporting Period, the Fund’s Class A, Class C, Institutional, Service, Investor, Class P, Class R and Class R6 Shares generated cumulative total returns, without sales charges, of -2.40%,-2.77%, -2.28%, -2.52%, -2.36%,-2.23%, -2.60% and-2.24%, respectively. These returns compare to the -1.62% cumulative total return of the Fund’s benchmark, the Russell 1000® Value Index (with dividends reinvested) (the “Russell Index”), during the same period. |
| Q | | What key factors were responsible for the Fund’s performance during the Reporting Period? |
| A | | The Fund underperformed the Russell Index during the Reporting Period, attributable to both sector allocation and stock selection overall. |
| Q | | Which equity market sectors most significantly affected Fund performance? |
| A | | Detracting most from the Fund’s performance relative to the Russell Index were consumer discretionary, materials and consumer staples, wherein stock selection in each was comparatively weak. Having an underweighted allocation to consumer staples, which outpaced the Russell Index during the Reporting Period, also hurt. Partially offsetting these detractors was the positive contribution made by effective stock selection in information technology, utilities and communication services. |
| Q | | Which stocks detracted significantly from the Fund’s performance during the Reporting Period? |
| A | | Detracting most from the Fund’s results relative to the Russell Index were positions in Delphi Technologies, a developer, designer and manufacturer of integrated powertrain technologies; Encana, an oil exploration and production company; and Bank OZK, a regional bank. |
| | | In October 2018, the stock of Delphi Technologies declined after the company announced the departure of its Chief Executive Officer and revised its outlook downward for the full year 2018. In its outlook, Delphi Technologies forecasted revenue for the full year to be consistent with the prior year level, compared to the previous guidance, which had projected low single-digit revenue growth. Upon the news, multiple research analysts downgraded the stock, sending its shares lower. In November 2018, Delphi Technologies reported weak quarterly results. Its quarterly results and guidance were in line with preannouncements, but its 2019 preliminary guidance was significantly below consensus expectations, as industry volumes continued to face headwinds, specifically in China, where there was negative product mix. We decided to sell the position in January 2019 given what we viewed as the company’s substantial operational and structural challenges, exacerbated by uncertainty related to its management change and potential macro headwinds. |
17
PORTFOLIO RESULTS
| | | There were few company-specific drivers of weaker stock performance for Encana during the Reporting Period. Its share price was more negatively affected by the sell-off in oil prices late in 2018. While we originally liked the company for its low cost structure, our investment thesis changed upon its acquisition of another company that, in our opinion, did not fit Encana’s long-term strategy and could negatively impact the quality of its business. Strict to our sell discipline, we exited the Fund position in favor of what we believed were better risk/reward opportunities elsewhere. |
| | | Bank OZK’s weak 2018 performance started in July 2018, before the Reporting Period began, when the bank announced disappointing second quarter 2018 earnings results. While the headline earnings per share number was in line with market expectations, slower loan growth and net interest margins were below consensus expectations. The majority of Bank OZK’s share price decline, however, came on a single day in mid-October 2018 upon the announcement the bank had two large delinquent loans, one residential and one commercial. This challenged our investment thesis on the stock, and we exited the Fund’s position, believing the incident would be a long-term headwind to Bank OZK’s stock price. |
| Q | | What were some of the Fund’s best-performing individual stocks? |
| A | | The Fund benefited most relative to the Russell Index from positions in enterprise software solutions company Red Hat, pharmaceutical company Eli Lilly and regulated utility Xcel Energy. |
| | | Shares of Red Hat, a new purchase for the Fund during the Reporting Period, soared in late October 2018 after IBM announced an offer to acquire Red Hat for a significant premium to its market price. This acquisition was in line with our thesis that the software industry is ripe for consolidation. We also believe Red Hat has impressive growth prospects, led mostly by new business, and has solid sales capacity through its partnerships with cloud providers. While we were encouraged by this news and continued to monitor developments as both companies work toward finalizing the acquisition, we opted to sell the Fund’s position in Red Hat, taking profits. |
| | | Eli Lilly’s stock climbed through most of November 2018 after the company reported solid quarterly results in which it beat consensus earnings per share and revenue expectations and also raised guidance for the full year 2018. Then, in December 2018, Eli Lilly shares benefited from the announcement of better than market expected 2019 guidance, featuring significant improvements in revenue growth and long-term sales growth. The company had a volatile month of trading in January 2019, finishing the month in positive territory but lagging the health care sector as well as the broad U.S. equity market. Early on, a negative headline on drug pricing pressured the stock along with that of other pharmaceutical companies. Then news of Eli Lilly’s acquisition of Loxo Oncology, a cancer drug company, helped give a boost to its shares. These gains were quickly erased after a phase 3 soft tissue study did not meet its primary objective, leading the Food and Drug Administration to recommend new patients not start using the drug. All in all, we viewed January 2019 as a month of primarily short-term trading noise that did not alter the underlying fundamentals of the company or why we favor it. At the end of the Reporting Period, we believed the company maintained strong risk/reward prospects versus its peers, and we saw an upside to its diabetes franchise. We were also optimistic about its management’s commitment to creating shareholder value through increased dividends and share repurchases. Additionally, we viewed the company’s split with Elanco, its former animal health business segment, as value accretive. Overall, we viewed Eli Lilly as a high quality pharmaceuticals business with leading franchises, a robust drug pipeline and an improving financial profile. |
| | | Xcel Energy specializes in electricity and natural gas. Part of its strong performance was a factor of the general outperformance of the utilities sector in the volatile end to 2018. Additionally, its share price benefited from the company’s purchase of an energy center in Minnesota in November 2018 and the announcement of a cash dividend increase in February 2019. At the end of the Reporting Period, we continued to like what we see as the company’s above-average growth prospects driven by its investment in renewable energy. Additionally, we viewed its valuation as attractive at the end of the Reporting Period and believed the regulatory environment was supportive for the company. |
| Q | | How did the Fund use derivatives and similar instruments during the Reporting Period? |
| A | | During the Reporting Period, we did not use derivatives as part of an active management strategy. |
| Q | | Did the Fund make any significant purchases or sales during the Reporting Period? |
| A | | During the Reporting Period, in addition to those purchases already mentioned, we established a Fund position in |
18
PORTFOLIO RESULTS
| | banking company Wells Fargo & Company. We are impressed by the company’s relatively inexpensive valuation given an increase in its loan pipeline, loan growth and deposits. We also believe the company’s concrete steps to limit reputational and regulatory risks could continue having a positive effect. |
| | | We initiated a Fund position in fast-food restaurant company McDonald’s. Its stock had lagged the overall market during the third quarter of 2018, which we believe presented an attractive opportunity to add back what we view as a best-in-class franchise to the Fund’s portfolio after selling it in the Fund’s prior fiscal year. We are positive on many of the strategic initiatives McDonald’s has been rolling out, including a revamped value menu and fresh beef hamburgers, which we believe can help boost its stock. In our view, McDonald’s has a strong balance sheet with robust free cash flow and good return on equity. We also believe it was attractively valued at the time of purchase and poised for growth and market share gains. |
| | | Conversely, in addition to those sales already mentioned, we eliminated the Fund’s position in United Technologies, an aerospace manufacturing and services company. Following a positive third quarter 2018 earnings report, our investment thesis on the company was invalidated in late November 2018 upon the announcement the company would split into three companies controlling the Heating, Ventilation and Air Conditioning (“HVAC”), Elevator and Aerospace and Defense businesses separately. We exited the position in favor of what we saw as better risk/reward opportunities elsewhere. |
| | | We sold the Fund’s position in Equity Residential, a multifamily real estate investment trust that manages apartment complexes in the U.S. We had purchased the company because of what we considered to be its high quality portfolio of assets, strong balance sheet and valuation, the latter of which was well below the value of its assets. However, its stock price significantly appreciated in 2018, making its valuation appear less attractive. For this reason, we exited the position in favor of what we felt were better risk/reward opportunities elsewhere. |
| Q | | Were there any changes to the Fund’s portfolio management team during the Reporting Period? |
| A | | Effective September 30, 2018, Sean Gallagher retired from Goldman Sachs and no longer serves as a portfolio manager for the Fund. Charles “Brook” Dane continues to serve as portfolio manager for the Fund. |
| Q | | Were there any notable changes in the Fund’s weightings during the Reporting Period? |
| A | | In constructing the Fund’s portfolio, we focus on picking stocks rather than on making industry or sector bets. We seek to outpace the benchmark index by overweighting stocks that we expect to outperform and underweighting those that we think may lag. Consequently, changes in its sector weights are generally the direct result of individual stock selection or of stock appreciation or depreciation. That said, during the Reporting Period, the Fund’s allocations compared to the Russell Index in health care and consumer staples increased. The Fund’s exposure to information technology and industrials decreased compared to the Russell Index. |
| Q | | How was the Fund positioned relative to its benchmark index at the end of February 2019? |
| A | | At the end of February 2019, the Fund had overweight positions relative to the Russell Index in the communication services and health care sectors. On the same date, the Fund had underweight positions compared to the Russell Index in financials and materials and had rather neutral allocations relative to the Russell Index in information technology, energy, industrials, consumer discretionary, utilities, consumer staples and real estate. |
19
FUND BASICS
Large Cap Value Fund
as of February 28, 2019
| | | | | | | | | | |
| | PERFORMANCE REVIEW | |
| | | |
| | | September 1, 2018–February 28, 2019 | | Fund Total Return
(based on NAV)1 | | | Russell 1000®
Value Index2 | |
| | | |
| | Class A | | | -2.40 | % | | | -1.62 | % |
| | Class C | | | -2.77 | | | | -1.62 | |
| | Institutional | | | -2.28 | | | | -1.62 | |
| | Service | | | -2.52 | | | | -1.62 | |
| | Investor | | | -2.36 | | | | -1.62 | |
| | Class P | | | -2.23 | | | | -1.62 | |
| | Class R | | | -2.60 | | | | -1.62 | |
| | | Class R6 | | | -2.24 | | | | -1.62 | |
| | 1 | | The net asset value (“NAV”) represents the net assets of the class of the Fund (ex-dividend) divided by the total number of shares of the class outstanding. The Fund’s performance reflects the reinvestment of dividends and other distributions. The Fund’s performance does not reflect the deduction of any applicable sales charges. |
| | 2 | | The unmanaged Russell 1000 Value Index is a market capitalization weighted index of the 1,000 largest U.S. companies with lower price-to-book ratios and lower forecasted growth values. The Russell 1000 Value Index figures do not reflect any deduction of fees, expenses or taxes. It is not possible to invest directly in an unmanaged index. |
| | | | | | | | | | | | | | | | | | | | |
| | STANDARDIZED TOTAL RETURNS3 |
| | | | | | |
| | | For the period ended 12/31/18 | | One Year | | | Five Years | | | Ten Years | | | Since Inception | | | Inception Date |
| | | | | | |
| | Class A | | | -13.88 | % | | | 2.32 | % | | | 8.61 | % | | | 4.98 | % | | 12/15/99 |
| | Class C | | | -10.47 | | | | 2.72 | | | | 8.42 | | | | 4.50 | | | 12/15/99 |
| | Institutional | | | -8.61 | | | | 3.86 | | | | 9.64 | | | | 5.69 | | | 12/15/99 |
| | Service | | | -9.03 | | | | 3.36 | | | | 9.11 | | | | 5.20 | | | 12/15/99 |
| | Investor | | | -8.67 | | | | 3.74 | | | | 9.50 | | | | 4.11 | | | 11/30/07 |
| | Class P | | | N/A | | | | N/A | | | | N/A | | | | -6.93 | | | 4/17/18 |
| | Class R | | | -9.14 | | | | 3.22 | | | | 8.96 | | | | 3.61 | | | 11/30/07 |
| | | Class R6 | | | -8.56 | | | | N/A | | | | N/A | | | | 1.93 | | | 7/31/15 |
| | 3 | | The Standardized Total Returns are average annual total returns or cumulative total returns (only if the performance period is one year or less) as of the most recent calendar quarter-end. They assume reinvestment of all distributions at NAV. These returns reflect a maximum initial sales charge of 5.5% for Class A Shares and the assumed contingent deferred sales charge for Class C Shares (1% if redeemed within 12 months of purchase). Effective July 30, 2018, Class C Shares convert automatically to Class A Shares on or about the fifteenth day of the last month of the calendar quarter that is ten years after the purchase date. Because Institutional, Service, Investor, Class P, Class R, and Class R6 Shares do not involve a sales charge, such a charge is not applied to their Standardized Total Returns. |
The returns set forth in the tables above represent past performance. Past performance does not guarantee future results. The Fund’s investment return and principal value will fluctuate so that an investor’s shares, when redeemed, may be worth more or less than their original cost. Current performance may be lower or higher than the performance quoted above. Please visit our web site at www.GSAMFUNDS.com to obtain the most recent month-end returns. Performance reflects fee waivers and/or expense limitations in effect during the periods shown. In their absence, performance would be reduced. Returns do not reflect the deduction of taxes that a shareholder would pay on Fund distributions or the redemption of Fund shares.
20
FUND BASICS
| | | | | | | | | | |
| | EXPENSE RATIOS4 | |
| | | |
| | | | | Net Expense Ratio (Current) | | | Gross Expense Ratio (Before Waivers) | |
| | | |
| | Class A | | | 1.11 | % | | | 1.24 | % |
| | Class C | | | 1.86 | | | | 1.99 | |
| | Institutional | | | 0.79 | | | | 0.85 | |
| | Service | | | 1.29 | | | | 1.35 | |
| | Investor | | | 0.86 | | | | 0.99 | |
| | Class P | | | 0.78 | | | | 0.84 | |
| | Class R | | | 1.36 | | | | 1.49 | |
| | | Class R6 | | | 0.78 | | | | 0.84 | |
| | 4 | | The expense ratios of the Fund, both current (net of applicable fee waivers and/or expense limitations) and before waivers (gross of applicable fee waivers and/or expense limitations) are as set forth above according to the most recent publicly available Prospectus for the Fund and may differ from the expense ratios disclosed in the Financial Highlights in this report. Pursuant to a contractual arrangement, the Fund’s waivers and/or expense limitations will remain in place through at least December 28, 2019, and prior to such date the investment adviser may not terminate the arrangements without the approval of the Fund’s Board of Trustees. If these arrangements are discontinued in the future, the expense ratios may change without shareholder approval. |
| | | | | | | | |
| | TOP TEN HOLDINGS AS OF 2/28/195 |
| | | |
| | | Holding | | % of Net Assets | | | Line of Business |
| | | |
| | JPMorgan Chase & Co. | | | 3.6 | % | | Banks |
| | Berkshire Hathaway, Inc. Class B | | | 3.5 | | | Diversified Financial Services |
| | Bank of America Corp. | | | 3.0 | | | Banks |
| | Verizon Communications, Inc. | | | 2.9 | | | Diversified Telecommunication
Services |
| | Johnson & Johnson | | | 2.8 | | | Pharmaceuticals |
| | Chevron Corp. | | | 2.7 | | | Oil, Gas & Consumable Fuels |
| | Cisco Systems, Inc. | | | 2.7 | | | Communications Equipment |
| | The Procter & Gamble Co. | | | 2.6 | | | Household Products |
| | Comcast Corp. Class A | | | 2.3 | | | Media |
| | | Exxon Mobil Corp. | | | 2.2 | | | Oil, Gas & Consumable Fuels |
| | 5 | | The top 10 holdings may not be representative of the Fund’s future investments. |
21
FUND BASICS
|
| FUND VS. BENCHMARK SECTOR ALLOCATIONS6 |
|
| As of February 28, 2019 |
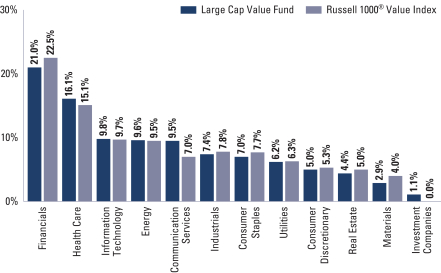
| | 6 | | The Fund is actively managed and, as such, its composition may differ over time. Consequently, the Fund’s overall sector allocations may differ from the percentages contained in the graph above. The graph categorizes investments using the Global Industry Classification Standard (“GICS”); however, the sector classifications used by the portfolio management team may differ from GICS. The percentage shown for each investment category reflects the value of investments in that category as a percentage of market value. The graph depicts the Fund’s investments but may not represent the Fund’s market exposure due to the exclusion of certain derivatives, if any, as listed in the Additional Investment Information section of the Schedule of Investments. |
22
PORTFOLIO RESULTS
Goldman Sachs Mid Cap Value Fund
Portfolio Composition
The Fund invests, under normal circumstances, at least 80% of its net assets (plus borrowings for investment purposes) (“Net Assets”) in a diversified portfolio of equity investments in mid-cap issuers with public stock market capitalizations within the range of the market capitalization of companies constituting the Russell Midcap® Value Index at the time of investment. The Fund seeks its investment objective of long-term capital appreciation by investing in value opportunities that the Investment Adviser defines as companies with identifiable competitive advantages whose intrinsic value is not reflected in the stock price. Although the Fund will invest primarily in publicly traded U.S. securities, it may invest up to 25% of its Net Assets in foreign securities, including securities of issuers in emerging countries and securities quoted in foreign currencies. The Fund may also invest in the aggregate up to 20% of its Net Assets in companies with public stock market capitalizations outside the range of companies constituting the Russell Midcap® Value Index at the time of investment and in fixed income securities, such as government, corporate and bank debt obligations.
Portfolio Management Discussion and Analysis
Below, the Goldman Sachs Fundamental Equity U.S. Equity Team discusses the Goldman Sachs Mid Cap Value Fund’s (the “Fund”) performance and positioning for the six-month period ended February 28, 2019 (the “Reporting Period”).
| Q | | How did the Fund perform during the Reporting Period? |
| A | | During the Reporting Period, the Fund’s Class A, Class C, Institutional, Service, Investor, Class P, Class R and Class R6 Shares generated cumulative total returns, without sales charges, of-2.56%,-2.96%,-2.40%,-2.63%,-2.48%,-2.38%, -2.72% and-2.39%, respectively. These returns compare to the -3.98% cumulative total return of the Fund’s benchmark, the Russell Midcap® Value Index (with dividends reinvested) (the “Russell Index”), during the same period. |
| Q | | What key factors were responsible for the Fund’s performance during the Reporting Period? |
| A | | While the Fund posted negative absolute returns, it outperformed the Russell Index on a relative basis during the Reporting Period due primarily to effective stock selection. Sector allocation as a whole also contributed positively to the Fund’s relative performance. |
| Q | | Which equity market sectors most significantly affected Fund performance? |
| A | | Contributing most positively to the Fund’s performance relative to the Russell Index was effective stock selection in information technology, materials and real estate. Only partially offsetting these positive contributors was weaker stock selection in industrials, consumer discretionary and consumer staples, which detracted. |
| Q | | What were some of the Fund’s best-performing individual stocks? |
| A | | The Fund benefited most relative to the Russell Index from positions in metal packaging company Ball, enterprise software solutions company Red Hat and regional bank Signature Bank. |
| | | Ball produces metal packaging goods for beverages, household products and aerospace technologies. Its stock’s weakness in the first half of 2018 turned around during the Reporting Period, as challenges surrounding its acquisition of Rexam, a London-based metal beverage can maker, began to subside. Its stock also reacted positively to an earnings report in October 2018 that highlighted strong cash generation and better than consensus expected sales and core earnings before interest, taxes, depreciation and amortization across all sectors. At the end of the Reporting Period, we viewed Ball as a highly diversified company with a growing market share in the defense industry, as a leader in the fragmented aerosol space and as one of the more sustainable companies in beverage can production. Additionally, we saw positive upside potential moving forward given the company’s wide range of commercial opportunities to leverage its new global leadership position along with the possibility of a multi-year stretch of margin improvement. |
| | | Shares of Red Hat, a new purchase for the Fund during the Reporting Period, soared in late October 2018 after IBM announced an offer to acquire Red Hat for a significant premium to its market price. This acquisition was in line with our thesis that the software industry is ripe for consolidation. |
23
PORTFOLIO RESULTS
| | We also believe Red Hat has impressive growth prospects, led mostly by new business, and has solid sales capacity through its partnerships with cloud providers. |
| | | Signature Bank is located primarily in the northeastern U.S. The strong performance of Signature Bank’s stock was primarily driven by an earnings report in January 2019 that showed improved earnings per share and revenues in addition to the announcement of a cash dividend. Quarter-over-quarter loan growth was particularly strong as well. At the end of the Reporting Period, we continued to like the stock given what we see as the company’s notable growth opportunities, potential for net interest income expansion and its management’s efforts to grow the regional bank’s deposit base. |
| Q | | Which stocks detracted significantly from the Fund’s performance during the Reporting Period? |
| A | | Detracting most from the Fund’s results relative to the Russell Index were positions in processed and packaged foods manufacturer and seller Conagra Brands, exploration and production oil company WPX Energy and transportation and logistics company XPO Logistics. |
| | | Conagra Brands’ share prices fell late-September 2018 when the company reported weaker than consensus expected earnings. However, we believe this was largely attributed to higher taxes, as the underlying business continued showing solid growth. Its share price again declined mid-December 2018 in response to a challenging earnings report that demonstrated issues with the acquisition of one of its peers. We viewed the acquisition concerns as a temporary headwind and continued to like the company at the end of the Reporting Period given our confidence in its base business and what we view as its relatively solid valuations and potential for significant outperformance if the company is able to continue turning around the business. |
| | | WPX Energy’s operations are primarily in the Williston and Permian Basins. Its stock had performed fairly well during the beginning of 2018 due to strong production and a divestiture to fund debt reduction. But its stock declined in the fourth quarter of 2018 in tandem with oil prices, as oil fell from approximately $75 per barrel to $45 per barrel during the quarter. WPX Energy performed in line with other exploration and production companies, with no company-specific issues. Similar to other exploration and production companies, WPX Energy announced it would slow growth to adjust to the lower oil price environment and spend within cash flow, which had the company growing at anticipated rates of approximately 20% and 15% in 2019 and 2020, respectively. At the end of the Reporting Period, we still had high conviction in WPX Energy given what we see as its impressive portfolio of low-cost acreage in the Permian Basin and relative attractiveness to small-cap peers. |
| | | While there were no stock-specific reasons for the decline in XPO Logistics’ share price during a volatile October 2018, the company, along with others in the industrials and freight industries, underperformed for the month. In mid-December 2018, a hedge fund issued a report that sent XPO Logistics’ shares tumbling more than 26% in one day. We were not particularly troubled by our initial read-through of the analysis but recognized several aspects that warranted follow up. After assessing various factors, we confirmed our previously held view that XPO Logistics’ business was well aligned with the structural changes in the freight industry, such as outsourcing and labor-saving technology,e-commerce exposure and the implementation of electronic logging devices. The market eventually recognized this as well, and its shares recovered all of the losses prompted by the hedge fund report. However, unrelated to the report, XPO Logistics’ stock tumbled in February 2019 after the company released its fourth quarter 2018 earnings report that revealed results below market estimates on earnings per share, revenue and 2019 guidance. Its management cited a reduction in business from its largest client, expressing it would negatively impact its growth for 2019. These developments led us to exit the Fund’s position in XPO Logistics. |
| Q | | How did the Fund use derivatives and similar instruments during the Reporting Period? |
| A | | During the Reporting Period, we did not use derivatives as part of an active management strategy. |
| Q | | Did the Fund make any significant purchases or sales during the Reporting Period? |
| A | | During the Reporting Period, we initiated a Fund position in AvalonBay Communities, a developer and owner of multi-family apartment communities in the U.S. We purchased the company given our confidence in what we believe is its supportive management team, robust development pipeline and strong balance sheet. |
| | | We established a Fund position in US Foods Holding, a food service distributor. We purchased its stock after inflationary pressures began to subside, having a positive effect on its margins and allowing for more reasonable volume expectations, in our opinion. Given what we believe are its |
24
PORTFOLIO RESULTS
| | accelerating sales volumes, improving earnings before interest, taxes, depreciation and amortization growth, more effective operations and solid organic growth, we have confidence in the company moving forward. |
| | | Conversely, in addition to those sales already mentioned, we eliminated the Fund’s position in Equity Residential, a multifamily real estate investment trust that manages apartment complexes in the U.S. We had purchased the company because of what we considered to be its high quality portfolio of assets, strong balance sheet and valuation, the latter of which was well below the value of its assets. However, its stock price significantly appreciated in 2018, making its valuation appear less attractive. For this reason, we exited the position in favor of what we felt were better risk/reward opportunities elsewhere. |
| | | We exited the Fund’s position in Westinghouse Air Brake Technologies (“Wabtec”), an equipment and system services company for the transit and freight rail industry. While we were originally positive on the company due to its technological advantages and favorable industry backdrop, our investment thesis changed as freight orders began to decrease. Demand for locomotives has declined as railroad companies have continued the transition to precision railroading, a process that maximizes the utilization of assets already held, in turn minimizing the need to purchase new assets, causing a severe cyclical headwind. Additionally, a lack of clarity from its management around margins hurt our confidence in the company. Given these conditions and the strong performance of the stock during the Reporting Period, we exited the position in favor of what we saw as better risk/reward opportunities elsewhere. |
| Q | | Were there any changes to the Fund’s portfolio management team during the Reporting Period? |
| A | | Effective September 30, 2018, Sean Gallagher retired from Goldman Sachs and no longer serves as a portfolio manager for the Fund. Adam Agress and Sung Cho continue to serve as portfolio managers for the Fund. |
| Q | | Were there any notable changes in the Fund’s weightings during the Reporting Period? |
| A | | In constructing the Fund’s portfolio, we focus on picking stocks rather than on making industry or sector bets. We seek to outpace the benchmark index by overweighting stocks that we expect to outperform and underweighting those that we think may lag. Consequently, changes in its sector weights are generally the direct result of individual stock selection or of stock appreciation or depreciation. That said, during the Reporting Period, the Fund’s allocations compared to the Russell Index in energy and health care increased. The Fund’s exposure to the financials and industrials sectors decreased compared to the Russell Index. |
| Q | | How was the Fund positioned relative to its benchmark index at the end of February 2019? |
| A | | At the end of February 2019, the Fund had overweight positions relative to the Russell Index in information technology and health care and an underweight position compared to the Russell Index in industrials. The Fund was rather neutrally weighted to the Russell Index in financials, real estate, consumer discretionary, utilities, energy, materials, consumer staples and communication services at the end of the Reporting Period. |
25
FUND BASICS
Mid Cap Value Fund
as of February 28, 2019
| | | | | | | | | | |
| | PERFORMANCE REVIEW | |
| | | |
| | | September 1, 2018–February 28, 2019 | | Fund Total Return
(based on NAV)1 | | | Russell Midcap®
Value Index2 | |
| | | |
| | Class A | | | -2.56 | % | | | -3.98 | % |
| | Class C | | | -2.96 | | | | -3.98 | |
| | Institutional | | | -2.40 | | | | -3.98 | |
| | Service | | | -2.63 | | | | -3.98 | |
| | Investor | | | -2.48 | | | | -3.98 | |
| | Class P | | | -2.38 | | | | -3.98 | |
| | Class R | | | -2.72 | | | | -3.98 | |
| | | Class R6 | | | -2.39 | | | | -3.98 | |
| | 1 | | The net asset value (“NAV”) represents the net assets of the class of the Fund (ex-dividend) divided by the total number of shares of the class outstanding. The Fund’s performance reflects the reinvestment of dividends and other distributions. The Fund’s performance does not reflect the deduction of any applicable sales charges. |
| | 2 | | The Russell Midcap Value® Index is an unmanaged index of common stock prices that measures the performance of those Russell Midcap companies with lower price-to-book ratios and lower forecasted growth values. The Russell Midcap Value Index figures do not reflect any deduction for fees, expenses or taxes. It is not possible to invest directly in an unmanaged index. |
| | | | | | | | | | | | | | | | | | | | |
| | STANDARDIZED TOTAL RETURNS3 |
| | | | | | |
| | | For the period ended 12/31/18 | | One Year | | | Five Years | | | Ten Years | | | Since Inception | | | Inception Date |
| | | | | | |
| | Class A | | | -15.74 | % | | | 1.53 | % | | | 10.02 | % | | | 7.49 | % | | 8/15/97 |
| | Class C | | | -12.40 | | | | 1.92 | | | | 9.81 | | | | 6.99 | | | 8/15/97 |
| | Institutional | | | -10.48 | | | | 3.10 | | | | 11.08 | | | | 9.92 | | | 8/1/95 |
| | Service | | | -10.94 | | | | 2.58 | | | | 10.53 | | | | 7.79 | | | 7/18/97 |
| | Investor | | | -10.63 | | | | 2.94 | | | | 10.91 | | | | 5.48 | | | 11/30/07 |
| | Class P | | | N/A | | | | N/A | | | | N/A | | | | -10.81 | | | 4/17/18 |
| | Class R | | | -11.08 | | | | 2.43 | | | | N/A | | | | 9.98 | | | 1/6/09 |
| | | Class R6 | | | -10.49 | | | | N/A | | | | N/A | | | | 0.95 | | | 7/31/15 |
| | 3 | | The Standardized Total Returns are average annual total returns or cumulative total returns (only if the performance period is one year or less) as of the most recent calendar quarter-end. They assume reinvestment of all distributions at NAV. These returns reflect a maximum initial sales charge of 5.5% for Class A Shares and the assumed contingent deferred sales charge for Class C Shares (1% if redeemed within 12 months of purchase). Effective July 30, 2018, Class C Shares convert automatically to Class A Shares on or about the fifteenth day of the last month of the calendar quarter that is ten years after the purchase date. Because Institutional, Service, Investor, Class P, Class R, and Class R6 Shares do not involve a sales charge, such a charge is not applied to their Standardized Total Returns. |
The returns set forth in the tables above represent past performance. Past performance does not guarantee future results. The Fund’s investment return and principal value will fluctuate so that an investor’s shares, when redeemed, may be worth more or less than their original cost. Current performance may be lower or higher than the performance quoted above. Please visit our web site at www.GSAMFUNDS.com to obtain the most recent month-end returns.Performance reflects fee waivers and/or expense limitations in effect during the periods shown. In their absence, performance would be reduced. Returns do not reflect the deduction of taxes that a shareholder would pay on Fund distributions or the redemption of Fund shares.
26
FUND BASICS
| | | | | | | | | | |
| | EXPENSE RATIOS4 | |
| | | |
| | | | | Net Expense Ratio (Current) | | | Gross Expense Ratio (Before Waivers) | |
| | | |
| | Class A | | | 1.22 | % | | | 1.22 | % |
| | Class C | | | 1.97 | | | | 1.97 | |
| | Institutional | | | 0.83 | | | | 0.83 | |
| | Service | | | 1.33 | | | | 1.33 | |
| | Investor | | | 0.97 | | | | 0.97 | |
| | Class P | | | 0.82 | | | | 0.82 | |
| | Class R | | | 1.47 | | | | 1.47 | |
| | | Class R6 | | | 0.82 | | | | 0.82 | |
| | 4 | | The expense ratios of the Fund, both current (net of applicable fee waivers and/or expense limitations) and before waivers (gross of applicable fee waivers and/or expense limitations), are as set forth above according to the most recent publicly available Prospectus for the Fund and may differ from the expense ratios disclosed in the Financial Highlights of this report. The expense ratios of the Fund do not have a fee waiver and/or expense limitation. The Net Expense Ratio and Gross Expense Ratio are the same. |
| | | | | | | | |
| | TOP TEN HOLDINGS AS OF 2/28/195 |
| | | |
| | | Holding | | % of Net Assets | | | Line of Business |
| | | |
| | Fidelity National Information Services, Inc. | | | 2.0 | % | | IT Services |
| | Xcel Energy, Inc. | | | 1.9 | | | Electric Utilities |
| | Stanley Black & Decker, Inc. | | | 1.9 | | | Machinery |
| | | |
| | M&T Bank Corp. | | | 1.9 | | | Banks |
| | Public Service Enterprise Group, Inc. | | | 1.8 | | | Multi-Utilities |
| | Sempra Energy | | | 1.7 | | | Multi-Utilities |
| | First Republic Bank | | | 1.7 | | | Banks |
| | The Cooper Cos., Inc. | | | 1.7 | | | Health Care Equipment & Supplies |
| | | |
| | Zimmer Biomet Holdings, Inc. | | | 1.7 | | | Health Care Equipment & Supplies |
| | | L3 Technologies, Inc. | | | 1.7 | | | Aerospace & Defense |
| | 5 | | The top 10 holdings may not be representative of the Fund’s future investments. |
27
FUND BASICS
|
| FUND VS. BENCHMARK SECTOR ALLOCATIONS6 |
|
| As of February 28, 2019 |
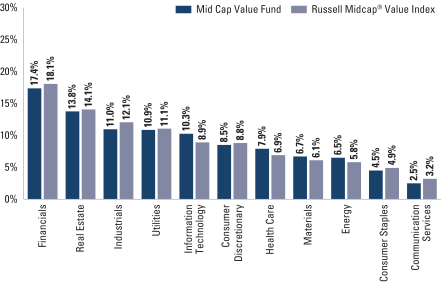
| | 6 | | The Fund is actively managed and, as such, its composition may differ over time. Consequently, the Fund’s overall sector allocations may differ from the percentages contained in the graph above. The graph categorizes investments using the Global Industry Classification Standard (“GICS”); however, the sector classifications used by the portfolio management team may differ from GICS. The percentage shown for each investment category reflects the value of investments in that category as a percentage of market value. The graph depicts the Fund’s investments but may not represent the Fund’s market exposure due to the exclusion of certain derivatives, if any, as listed in the Additional Investment Information section of the Schedule of Investments. |
28
PORTFOLIO RESULTS
Goldman Sachs Small Cap Value Fund
Portfolio Composition
The Fund invests, under normal circumstances, at least 80% of its net assets (plus any borrowings for investment purposes) (“Net Assets”) in a diversified portfolio of equity investments in small-cap issuers with public stock market capitalizations within the range of the market capitalization of companies constituting the Russell 2000® Value Index at the time of investment. Under normal circumstances, the Fund’s investment horizon for ownership of stocks will be two to three years. The Fund seeks its investment objective of long-term capital appreciation by investing in value opportunities that the Investment Adviser defines as companies with identifiable competitive advantages whose intrinsic value is not reflected in the stock price. Although the Fund will invest primarily in publicly traded U.S. securities, it may invest up to 25% of its Net Assets in foreign securities, including securities of issuers in emerging countries and securities quoted in foreign currencies. The Fund may also invest in the aggregate up to 20% of its Net Assets in companies with public stock market capitalizations outside the range of companies constituting the Russell 2000® Value Index at the time of investment and in fixed income securities, such as government, corporate and bank debt obligations.
Portfolio Management Discussion and Analysis
Below, the Goldman Sachs Small Cap Value Team discusses the Goldman Sachs Small Cap Value Fund’s (the “Fund”) performance and positioning for the six-month period ended February 28, 2019 (the “Reporting Period”).
| Q | | How did the Fund perform during the Reporting Period? |
| A | | During the Reporting Period, the Fund’s Class A, Class C, Institutional, Service, Investor, Class P, Class R and Class R6 Shares generated cumulative total returns, without sales charges, of-7.14%,-7.50%,-6.97%,-7.20%,-7.02%,-6.94%,-7.27% and-6.95%, respectively. These returns compare to the-8.59% cumulative total return of the Fund’s benchmark, the Russell 2000® Value Index (with dividends reinvested) (the “Russell Index”), during the same period. |
| Q | | What key factors were responsible for the Fund’s performance during the Reporting Period? |
| A | | While the Fund posted negative absolute returns, it outperformed the Russell Index on a relative basis during the Reporting Period due primarily to effective stock selection. Sector allocation as a whole detracted from the Fund’s relative performance, albeit only modestly. |
| Q | | Which equity market sectors most significantly affected Fund performance? |
| A | | Effective stock selection in the information technology, health care and materials sectors contributed most positively to the Fund’s performance relative to the Russell Index. Only partially offsetting these positive contributors was weaker stock selection in utilities and real estate, which detracted from the Fund’s relative results. Having underweighted allocations to utilities, real estate and communication services, each of which outperformed the Russell Index during the Reporting Period, also hurt. |
| Q | | What were some of the Fund’s best-performing individual stocks? |
| A | | The Fund benefited most relative to the Russell Index from positions in Lattice Semiconductor, PS Business Parks and Viavi Solutions. |
| | | Lattice Semiconductor is a company that produces programmable logic devices used in circuits of mobile phones, telecommunications and Internet-of-Things infrastructure. (The Internet-of-Things is the network of devices such as vehicles and home appliances that contain electronics, software, sensors, actuators, and connectivity that allows these things to connect, interact and exchange data.) Following a broader sell-off of semiconductors, Lattice Semiconductor’s stock trended downwards in late 2018 before sharply appreciating in early 2019. Its Chief Executive Officer (“CEO”) Jim Anderson, who has a background of turning around Advanced Micro Devices, another semiconductor company, started at Lattice Semiconductor in September 2018 and has demonstrated credibility with better than market expected fourth quarter 2018 earnings, released in February 2019. At the end of the |
| | Reporting Period, we had confidence in the company’s experienced executive team, including the new CEO, and in the company’s ability to expand its margins with better efficiencies of sales, manufacturing and marketing. |
29
PORTFOLIO RESULTS
| | | PS Business Parks is an industrial real estate investment trust that operates multi-tenant industrial, flex and office spaces. We believe the company’s steady execution, including in-line third quarter 2018 earnings, and its low leverage provided defensive characteristics during the somewhat tumultuous trading environment that dominated much of the Reporting Period. At the end of the Reporting Period, we continued to believe the company was attractively valued among its peers, had a solid management team and was a high quality company for the longer term. |
| | | Viavi Solutions is a company that engages in the provision of network testing, monitoring and assurance solutions to communications service providers, enterprises and their ecosystems. Despite a more challenging end to 2018, its stock performed well in the first two months of 2019, especially following the release of better than consensus expected fourth quarter 2018 earnings. These fourth quarter 2018 results included the announcement of the company buying Cobham AvComm and Wireless’ test and measurement assets, a former business under Aeroflex. The acquisition is widely expected to expand Viavi Solutions’ gross margins and support new product lines, especially those exposed to fifth generation (“5G”) tests. At the end of the Reporting Period, we believed Viavi Solutions’ test and measurement equipment business should benefit from the rollout of 5G globally, and its optical filter business should accelerate as three-dimensional facial recognition becomes more widely adopted in smart phones. Additionally, we viewed its management team favorably due to its track record of allocating capital through accretive deals and its near-term focus on operational efficiency. |
| Q | | Which stocks detracted significantly from the Fund’s performance during the Reporting Period? |
| A | | Detracting most from the Fund’s results relative to the Russell Index were positions in exploration and production oil company WPX Energy, transportation and logistics company XPO Logistics and data center real estate investment trust CyrusOne. |
| | | WPX Energy’s operations are primarily in the Williston and Permian Basins. Its stock had performed fairly well during the beginning of 2018 due to strong production and a divestiture to fund debt reduction. But its stock declined in the fourth quarter of 2018 in tandem with oil prices, as oil fell from approximately $75 per barrel to $45 per barrel during the quarter. WPX Energy performed in line with other exploration and production companies, with no company-specific issues. Similar to other exploration and production companies, WPX Energy announced it would slow growth to adjust to the lower oil price environment and spend within cash flow, which had the company growing at anticipated rates of approximately 20% and 15% in 2019 and 2020, respectively. At the end of the Reporting Period, we still had high conviction in WPX Energy given what we see as its impressive portfolio of low-cost acreage in the Permian Basin and relative attractiveness to small-cap peers. |
| | | While there were no stock-specific reasons for the decline in XPO Logistics’ share price during a volatile October 2018, the company, along with others in the industrials and freight industries, underperformed for the month. In mid-December 2018, a hedge fund issued a report that sent XPO Logistics’ shares tumbling more than 26% in one day. We were not particularly troubled by our initial read-through of the analysis but recognized several aspects that warranted follow up. After assessing various factors, we confirmed our previously held view that XPO Logistics’ business was well aligned with the structural changes in the freight industry, such as outsourcing and labor-saving technology,e-commerce exposure and the implementation of electronic logging devices. The market eventually recognized this as well, and its shares recovered all of the losses prompted by the hedge fund report. However, unrelated to the report, XPO Logistics’ stock tumbled in February 2019 after the company released its fourth quarter 2018 earnings report that revealed results below market estimates on earnings per share, revenue and 2019 guidance. Its management cited a reduction in business from its largest client, expressing it would negatively impact its growth for 2019. These developments led us to exit the Fund’s position in XPO Logistics. |
| | | In late 2018, CyrusOne reported weaker 2019 forward guidance due to a European acquisition and related investments that turned out to be more dilutive than the company expected. Subsequently, the stock traded downward in early 2019, coupled with mixed fourth quarter 2018 earnings announced in February 2019. Despite these near-term headwinds, we believed at the end of the Reporting Period that CyrusOne’s investments, including that in the European company, should be accretive over time given increasing demand for data centers and CyrusOne’s leadership in the space. Additionally, we viewed its management team favorably. |
| Q | | How did the Fund use derivatives and similar instruments during the Reporting Period? |
| A | | During the Reporting Period, we did not use derivatives as part of an active management strategy. |
30
PORTFOLIO RESULTS
| Q | | Did the Fund make any significant purchases or sales during the Reporting Period? |
| A | | During the Reporting Period, we initiated a Fund position in KBR, an engineering, procurement and construction company that was formerly a subsidiary of Halliburton. We like KBR’s business mix with a greater revenue share coming from governmental operations, which tends to be more contractual with less tail risk. (Tail risk is a form of portfolio risk that arises when the possibility that an investment will move more than three standard deviations from the mean is greater than what is shown by a normal distribution. Tail risks include events that have a small probability of occurring and occur at both ends of a normal distribution curve.) We believe the company has potential upside with liquefied natural gas contracts and an improving balance sheet as well as a CEO moving away from riskier lump-sum deals. (A lump-sum deal or contract is a contract with a single lump-sum price for all of the works, and the contractor is responsible for completing the project within the agreed fixed cost set forth in the contract. If the contractor completes the project under the fixed total cost, then the contractor makes additional profits from the project. The lump-sum contract is normally used in the construction industry to reduce contract administration costs.) |
| | | We established a Fund position in Darling Ingredients, an agricultural processor business that converts restaurant by-products into gelatin, plasma, fertilizers, grease and fuels. We believe the company has promising, long-term value creation potential in its Diamond Green Diesel division that produces biofuel and renewable diesel. |
| | | Conversely, in addition to those sales already mentioned, we sold the Fund’s position in Oasis Petroleum, an exploration and production company based in the Bakken Shale formation. Originally, we believed the company benefited from high oil prices and exposure to the Bakken Shale. Given the decline in oil prices during the Reporting Period and new drilling technology that has made the Bakken Shale more competitive with the Permian Basin with less inefficiencies to capitalize on, we exited the position in favor of what we considered better risk/reward opportunities. |
| | | We eliminated the Fund’s position in Nabors Industries, a company that manufactures and services oil drilling rigs with exposure to domestic and international markets. Given the recent headwinds to the energy market, including a lower oil price environment, we believe global demand for Nabors Industries’ high performance rigs has been strained. We started trimming the position in September 2018 and completely sold out of the stock in December 2018 in favor of what we saw as better risk/reward opportunities. |
| Q | | Were there any changes to the Fund’s portfolio management team during the Reporting Period? |
| A | | There were no changes to the Fund’s portfolio management team during the Reporting Period. |
| Q | | Were there any notable changes in the Fund’s weightings during the Reporting Period? |
| A | | In constructing the Fund’s portfolio, we focus on picking stocks rather than on making industry or sector bets. We seek to outpace the benchmark index by overweighting stocks that we expect to outperform and underweighting those that we think may lag. Consequently, changes in its sector weights are generally the direct result of individual stock selection or of stock appreciation or depreciation. That said, during the Reporting Period, the Fund’s allocation compared to the Russell Index in consumer staples increased. |
| Q | | How was the Fund positioned relative to its benchmark index at the end of February 2019? |
| A | | At the end of February 2019, the Fund was overweight compared to the Russell Index in industrials and was rather neutrally weighted to the remaining sectors in the Russell Index. |
31
FUND BASICS
Small Cap Value Fund
as of February 28, 2019
| | | | | | | | | | |
| | PERFORMANCE REVIEW | |
| | | |
| | | September 1, 2018–February 28, 2019 | | Fund Total Return (based on NAV)1 | | | Russell 2000® Value Index2 | |
| | | |
| | Class A | | | -7.14 | % | | | -8.59 | % |
| | Class C | | | -7.50 | | | | -8.59 | |
| | Institutional | | | -6.97 | | | | -8.59 | |
| | Service | | | -7.20 | | | | -8.59 | |
| | Investor | | | -7.02 | | | | -8.59 | |
| | Class P | | | -6.94 | | | | -8.59 | |
| | Class R | | | -7.27 | | | | -8.59 | |
| | | Class R6 | | | -6.95 | | | | -8.59 | |
| | 1 | | The net asset value (“NAV”) represents the net assets of the class of the Fund(ex-dividend) divided by the total number of shares of the class outstanding. The Fund’s performance reflects the reinvestment of dividends and other distributions. The Fund’s performance does not reflect the deduction of any applicable sales charges. |
| | 2 | | The Russell 2000 Value Index is an unmanaged index of common stock prices that measures the performance of those Russell 2000 companies with lowerprice-to-book ratios and lower forecasted growth values. The Russell 2000 Value Index figures do not reflect any deduction for fees, expenses or taxes. It is not possible to invest directly in an unmanaged index. |
| | | | | | | | | | | | | | | | | | | | |
| | STANDARDIZED TOTAL RETURNS3 |
| | | | | | |
| | | For the period ended 12/31/18 | | One Year | | | Five Years | | | Ten Years | | | Since Inception | | | Inception Date |
| | | | | | |
| | Class A | | | -19.06 | % | | | 2.51 | % | | | 11.35 | % | | | 9.58 | % | | 10/22/92 |
| | Class C | | | -15.85 | | | | 2.90 | | | | 11.16 | | | | 7.63 | | | 8/15/97 |
| | Institutional | | | -14.02 | | | | 4.09 | | | | 12.44 | | | | 8.88 | | | 8/15/97 |
| | Service | | | -14.46 | | | | 3.57 | | | | 11.88 | | | | 8.34 | | | 8/15/97 |
| | Investor | | | -14.14 | | | | 3.94 | | | | 12.27 | | | | 7.75 | | | 11/30/07 |
| | Class P | | | N/A | | | | N/A | | | | N/A | | | | -14.15 | | | 4/17/18 |
| | Class R | | | -14.57 | | | | 3.42 | | | | 11.72 | | | | 7.23 | | | 11/30/07 |
| | | Class R6 | | | -14.03 | | | | N/A | | | | N/A | | | | 3.62 | | | 7/31/15 |
| | 3 | | The Standardized Total Returns are average annual total returns or cumulative total returns (only if the performance period is one year or less) as of the most recent calendarquarter-end. They assume reinvestment of all distributions at NAV. These returns reflect a maximum initial sales charge of 5.5% for Class A Shares and the assumed contingent deferred sales charge for Class C Shares (1% if redeemed within 12 months of purchase). Effective July 30, 2018, Class C Shares convert automatically to Class A Shares on or about the fifteenth day of the last month of the calendar quarter that is ten years after the purchase date. Because Institutional, Service, Investor, Class P, Class R, and Class R6 Shares do not involve a sales charge, such a charge is not applied to their Standardized Total Returns. |
The returns set forth in the tables above represent past performance. Past performance does not guarantee future results. The Fund’s investment return and principal value will fluctuate so that an investor’s shares, when redeemed, may be worth more or less than their original cost. Current performance may be lower or higher than the performance quoted above. Please visit our web site at www.GSAMFUNDS.com to obtain the most recentmonth-end returns.Performance reflects fee waivers and/or expense limitations in effect during the periods shown. In their absence, performance would be reduced. Returns do not reflect the deduction of taxes that a shareholder would pay on Fund distributions or the redemption of Fund shares.
32
FUND BASICS
| | | | | | | | | | |
| | EXPENSE RATIOS4 | |
| | | |
| | | | | Net Expense Ratio (Current) | | | Gross Expense Ratio (Before Waivers) | |
| | | |
| | Class A | | | 1.33 | % | | | 1.36 | % |
| | Class C | | | 2.08 | | | | 2.11 | |
| | Institutional | | | 0.94 | | | | 0.97 | |
| | Service | | | 1.44 | | | | 1.47 | |
| | Investor | | | 1.08 | | | | 1.11 | |
| | Class P | | | 0.93 | | | | 0.96 | |
| | Class R | | | 1.58 | | | | 1.61 | |
| | | Class R6 | | | 0.93 | | | | 0.96 | |
| | 4 | | The expense ratios of the Fund, both current (net of applicable fee waivers and/or expense limitations) and before waivers (gross of applicable fee waivers and/or expense limitations) are as set forth above according to the most recent publicly available Prospectus for the Fund and may differ from the expense ratios disclosed in the Financial Highlights in this report. Pursuant to a contractual arrangement, the Fund’s waivers and/or expense limitations will remain in place through at least December 28, 2019, and prior to such date the investment adviser may not terminate the arrangements without the approval of the Fund’s Board of Trustees. If these arrangements are discontinued in the future, the expense ratios may change without shareholder approval. |
| | | | | | | | |
| | TOP TEN HOLDINGS AS OF 2/28/195 |
| | | |
| | | Holding | | % of Net Assets | | | Line of Business |
| | | |
| | Chesapeake Lodging Trust | | | 1.2 | % | | Equity Real Estate Investment
Trusts (REITs) |
| | ALLETE, Inc. | | | 1.1 | | | Electric Utilities |
| | Pebblebrook Hotel Trust | | | 1.1 | | | Equity Real Estate Investment
Trusts (REITs) |
| | Acadia Realty Trust | | | 1.0 | | | Equity Real Estate Investment
Trusts (REITs) |
| | Viavi Solutions, Inc. | | | 1.0 | | | Communications Equipment |
| | Healthcare Realty Trust, Inc. | | | 1.0 | | | Equity Real Estate Investment
Trusts (REITs) |
| | Portland General Electric Co. | | | 1.0 | | | Electric Utilities |
| | Banner Corp. | | | 1.0 | | | Banks |
| | CACI International, Inc. Class A | | | 1.0 | | | IT Services |
| | | Columbia Property Trust, Inc. | | | 1.0 | | | Equity Real Estate Investment
Trusts (REITs) |
| | 5 | | The top 10 holdings may not be representative of the Fund’s future investments. |
33
FUND BASICS
|
| FUND VS. BENCHMARK SECTOR ALLOCATIONS6 |
|
| As of February 28, 2019 |
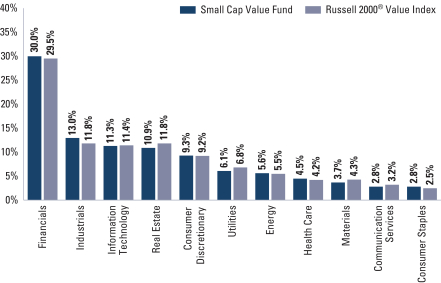
| | 6 | | The Fund is actively managed and, as such, its composition may differ over time. Consequently, the Fund’s overall sector allocations may differ from the percentages contained in the graph above. The graph categorizes investments using the Global Industry Classification Standard (“GICS”); however, the sector classifications used by the portfolio management team may differ from GICS. Underlying sector allocations of Exchange Traded Funds held by the Fund are not reflected in the graph above. The percentage shown for each investment category reflects the value of investments in that category as a percentage of market value (excluding investments in the securities lending reinvestment vehicle, if any). Investments in the securities lending reinvestment vehicle represented 0.2% of the Fund’s net assets as of February 28, 2019. The graph depicts the Fund’s investments but may not represent the Fund’s market exposure due to the exclusion of certain derivatives, if any, as listed in the Additional Investment Information section of the Schedule of Investments. |
34
PORTFOLIO RESULTS
Goldman Sachs Small/Mid Cap Value Fund
Portfolio Composition
The Fund’s investment objective is to seek long-term capital appreciation. The Fund invests, under normal circumstances, at least 80% of its net assets plus any borrowings for investment purposes (measured at time of purchase) in a diversified portfolio of equity investments in small- and mid-cap issuers with public stock market capitalizations within the range of the market capitalization of companies constituting the Russell 2000® Value Index and the Russell Midcap Value Index, respectively, at the time of investment. As of September 30, 2018, the capitalization range of the companies in these indexes was between $75 million and $37.1 billion. Under normal circumstances, the Fund’s investment horizon for ownership of stocks will be two to three years. Although the Fund will invest primarily in publicly traded U.S. securities, it may also invest in foreign securities, including securities of issuers in emerging countries and securities quoted in foreign currencies. The Fund may invest in companies with public stock market capitalizations outside the range of companies constituting the Russell 2000® Value Index and the Russell Midcap Value Index at the time of investment and in fixed income securities, such as government, corporate and bank debt obligations.
Portfolio Management Discussion and Analysis
Below, the Goldman Sachs Small Cap Value Team discusses the Goldman Sachs Small/Mid Cap Value Fund’s (the “Fund”) performance and positioning for the six-month period ended February 28, 2019 (the “Reporting Period”).
| Q | | How did the Fund perform during the Reporting Period? |
| A | | During the Reporting Period, the Fund’s Class A, Class C, Institutional, Investor, Class P, Class R and Class R6 Shares generated cumulative total returns, without sales charges, of-5.66%,-5.99%,-5.47%,-5.59%, -5.52%, -5.81% and-5.45%, respectively. These returns compare to the-6.47% cumulative total return of the Fund’s benchmark, the Russell 2500® Value Index (with dividends reinvested) (the “Russell Index”), during the same period. |
| Q | | What key factors were responsible for the Fund’s performance during the Reporting Period? |
| A | | While the Fund posted negative absolute returns, it outperformed the Russell Index on a relative basis during the Reporting Period due primarily to effective stock selection. Sector allocation as a whole also contributed positively to the Fund’s relative performance, albeit only modestly. |
| Q | | Which equity market sectors most significantly affected Fund performance? |
| A | | Effective stock selection in the information technology, industrials and energy sectors contributed most positively to the Fund’s performance relative to the Russell Index. Having a position in cash during a Reporting Period when the Russell Index declined also proved beneficial. Only partially offsetting these positive contributors was challenging stock selection in the financials, utilities and real estate sectors, which detracted. Having underweighted allocations to these same three sectors, each of which outperformed the Russell Index during the Reporting Period, hurt as well. |
| Q | | What were some of the Fund’s best-performing individual stocks? |
| A | | The Fund benefited most relative to the Russell Index from positions in Equity LifeStyle Properties, Live Nation Entertainment and Pinnacle West Capital. |
| | | Equity LifeStyle Properties is a real estate investment trust that manages and operates high quality home resort communities, including rental homes and recreational vehicle campgrounds. At the end of October 2018, the company reported positive earnings, with revenue and adjusted earnings before taxes, interest, depreciation and amortization above consensus expectations, and in-line cash generation, as measured by funds from operations. During the fourth quarter of 2018, its stock outperformed the real estate sector of the Russell Index as well as the broad Russell Index. At the end of the Reporting Period, we believed the company had demonstrated financial strength and a favorable risk profile given its low-levered balance sheet and leading supply of permits. These attributes, along with its early announcement of forward guidance, appeared to instill confidence in the stock amidst a more tumultuous trading environment. |
35
PORTFOLIO RESULTS
| | | Live Nation Entertainment is a company that engages in the production and marketing of concerts. The company executed well, with all segments of its business seeing growth during the Reporting Period. Margins within its Concerts segment expanded, and its Sponsorship & Advertising business segment is based on contracts, providing steady revenue streams. In our view, Live Nation Entertainment was well positioned at the end of the Reporting Period to take advantage of the growing demand for concerts through its strong amphitheater slate, higher per fan spending and better optimized ticket pricing. |
| | | Pinnacle West Capital is a utilities company that offers regulated retail and wholesale electricity in Arizona. Its stock appreciated following the overruling of a renewable energy requirement for electric utilities. Arizona’s Proposition 127, a constitutionally-mandated renewable energy requirement, had weighed on the stock until it was overruled in early November 2018. We believe the defeat helped support the stock’s multiple expansion, boosted by a positive third quarter earnings per share and revenue results report that beat consensus estimates in November 2018. More favorable weather and lower federal income taxes also led to an increase for full-year 2018 guidance. At the end of the Reporting Period, we believed the company had a steady-state business with the potential to improve margins. |
| Q | | Which stocks detracted significantly from the Fund’s performance during the Reporting Period? |
| A | | Detracting most from the Fund’s results relative to the Russell Index were positions in XPO Logistics, WPX Energy and Parsley Energy. |
| | | XPO Logistics is a transportation and logistics company. While there were no stock-specific reasons for the decline in XPO Logistics’ share price during a volatile October 2018, the company, along with others in the industrials and freight industries, underperformed for the month. In mid-December 2018, a hedge fund issued a report that sent XPO Logistics’ shares tumbling more than 26% in one day. We were not particularly troubled by our initial read-through of the analysis but recognized several aspects that warranted follow up. After assessing various factors, we confirmed our previously held view that XPO Logistics’ business was well aligned with the structural changes in the freight industry, such as outsourcing and labor-saving technology,e-commerce exposure and the implementation of electronic logging devices. The market eventually recognized this as well, and its shares recovered all of the losses prompted by the hedge fund report. However, unrelated to the report, XPO Logistics’ stock tumbled in February 2019 after the company released its fourth quarter 2018 earnings report that revealed results below market estimates on earnings per share, revenue and 2019 guidance. Its management cited a reduction in business from its largest client, expressing it would negatively impact its growth for 2019. These developments led us to reduce the Fund’s position in XPO Logistics. |
| | | WPX Energy is an exploration and production oil company whose operations are primarily in the Williston and Permian Basins. Its stock had performed fairly well during the beginning of 2018 due to strong production and a divestiture to fund debt reduction. But its stock declined in the fourth quarter of 2018 in tandem with oil prices, as oil fell from approximately $75 per barrel to $45 per barrel during the quarter. WPX Energy performed in line with other exploration and production companies, with no company-specific issues. Similar to other exploration and production companies, WPX Energy announced it would slow growth to adjust to the lower oil price environment and spend within cash flow, which had the company growing at anticipated rates of approximately 20% and 15% in 2019 and 2020, respectively. At the end of the Reporting Period, we still had high conviction in WPX Energy given what we see as its impressive portfolio of low-cost acreage in the Permian Basin and relative attractiveness to small-cap peers. |
| | | Parsley Energy is an oil exploration and production company based in the Permian Basin. Its performance was not company-specific but rather a consequence of declining oil prices in the latter half of 2018. Overall, the smaller oil companies were relatively more impacted than larger companies due to greater leverage and more perceived risk. While we trimmed the Fund’s position in Parsley Energy, we still held the stock due to its compounding rig count and oil production. Additionally, we believed at the end of the Reporting Period the company had improved operating performance and had a high quality asset base within the Permian Basin. |
| Q | | How did the Fund use derivatives and similar instruments during the Reporting Period? |
| A | | During the Reporting Period, we did not use derivatives as part of an active management strategy. |
| Q | | Did the Fund make any significant purchases or sales during the Reporting Period? |
| A | | During the Reporting Period, we initiated a Fund position in Viper Energy Partners LP, a mineral rights holder in the |
36
PORTFOLIO RESULTS
| | Permian Basin. As a mineral rights holder, the company owns a percentage of all oil and gas revenue generated on its acreage with no associated costs besides production tax and some operational expenses. We, therefore, believe Viper Energy Partners LP is an attractive investment vehicle that benefits from organic growth and commodity price upside potential while offering a differentiated capital return given the payout of its cash flow in a variable dividend. |
| | | We established a Fund position in Umpqua Holdings, a holding company of a regional bank located in Portland, Oregon. At the time of purchase, the company had recently undergone a management change, with a new Chief Executive Officer introducing a significant efficiency and cost reduction program, combined with a restructured banking model and innovative technology investments. We believe the company’s strategy should result in improved profitability and shareholder returns. |
| | | Conversely, in addition to the sale mentioned earlier, we exited the Fund’s position in Everest Re Group, a holding company that engages in the provision of reinsurance and insurance services. While we believe the company is a high quality reinsurer that has continued to diversify and grow its U.S.-based insurance platform, the high level of catastrophes that occurred in 2018 and early 2019 led us reevaluate and reduce the Fund’s overall portfolio positioning in the reinsurance sector. |
| | | We sold the Fund’s position in Tribune Media, a media and entertainment conglomerate located in Chicago, Illinois. Its stock jumped following the announcement that Nexstar Media Group, one of the largest owners of U.S. television stations, would acquire the company for approximately $6.4 billion in cash and debt. The deal is expected to close in the third quarter of 2019, and we sold the Fund’s position in January 2019. |
| Q | | Were there any changes to the Fund’s portfolio management team during the Reporting Period? |
| A | | There were no changes to the Fund’s portfolio management team during the Reporting Period. |
| Q | | Were there any notable changes in the Fund’s weightings during the Reporting Period? |
| A | | In constructing the Fund’s portfolio, we focus on picking stocks rather than on making industry or sector bets. We seek to outpace the benchmark index by overweighting stocks that we expect to outperform and underweighting those that we think may lag. Consequently, changes in its sector weights are generally the direct result of individual stock selection or of stock appreciation or depreciation. That said, during the Reporting Period, the Fund’s allocations compared to the Russell Index in materials and consumer staples increased, and its allocation compared to the Russell Index in real estate decreased. |
| Q | | How was the Fund positioned relative to its benchmark index at the end of February 2019? |
| A | | At the end of February 2019, the Fund had an underweight position compared to the Russell Index in communication services and was rather neutrally weighted to the Russell Index in information technology, healthcare, financials, real estate, industrials, consumer discretionary, energy, utilities, materials and consumer staples. |
37
FUND BASICS
Small/Mid Cap Value Fund
as of February 28, 2019
| | | | | | | | | | |
| | PERFORMANCE REVIEW | |
| | | |
| | | September 1, 2018–February 28, 2019 | | Fund Total Return
(based on NAV)1 | | | Russell 2500®
Value Index2 | |
| | | |
| | Class A | | | -5.66 | % | | | -6.47 | % |
| | Class C | | | -5.99 | | | | -6.47 | |
| | Institutional | | | -5.47 | | | | -6.47 | |
| | Investor | | | -5.59 | | | | -6.47 | |
| | Class P | | | -5.52 | | | | -6.47 | |
| | Class R | | | -5.81 | | | | -6.47 | |
| | | Class R6 | | | -5.45 | | | | -6.47 | |
| | 1 | | The net asset value (“NAV”) represents the net assets of the class of the Fund(ex-dividend) divided by the total number of shares of the class outstanding. The Fund’s performance reflects the reinvestment of dividends and other distributions. The Fund’s performance does not reflect the deduction of any applicable sales charges. |
| | 2 | | The Russell 2500 Value Index is composed of the smallest 2,500 of the 3,000 largest U.S. companies based on total market capitalization with lowerprice-to-book ratios and lower forecast growth values. It is calculated by Frank Russell Company, and reflects reinvestment of all dividends and capital gains. The Russell 2500 Value Index figures do not reflect any deduction for fees, expenses or taxes. It is not possible to invest directly in an unmanaged index. |
| | | | | | | | | | | | |
| | STANDARDIZED TOTAL RETURNS3 |
| | | | |
| | | For the period ended 12/31/18 | | One Year | | | Since Inception | | | Inception Date |
| | | | |
| | Class A | | | -19.81 | % | | | 2.62 | % | | 1/31/14 |
| | Class C | | | -16.70 | | | | 3.05 | | | 1/31/14 |
| | Institutional | | | -14.81 | | | | 4.26 | | | 1/31/14 |
| | Investor | | | -15.04 | | | | 4.06 | | | 1/31/14 |
| | Class P | | | N/A | | | | -14.49 | | | 4/17/18 |
| | Class R | | | -15.41 | | | | 3.55 | | | 1/31/14 |
| | | Class R6 | | | -14.89 | | | | 2.31 | | | 7/31/15 |
| | 3 | | The Standardized Total Returns are average annual total returns or cumulative total returns (only if the performance period is one year or less) as of the most recent calendarquarter-end. They assume reinvestment of all distributions at NAV. These returns reflect a maximum initial sales charge of 5.5% for Class A Shares and the assumed contingent deferred sales charge for Class C Shares (1% if redeemed within 12 months of purchase). Because Institutional, Service, Investor, Class P, Class R, and Class R6 Shares do not involve a sales charge, such a charge is not applied to their Standardized Total Returns. |
The returns set forth in the tables above represent past performance. Past performance does not guarantee future results. The Fund’s investment return and principal value will fluctuate so that an investor’s shares, when redeemed, may be worth more or less than their original cost. Current performance may be lower or higher than the performance quoted above. Please visit our web site at www.GSAMFUNDS.com to obtain the most recentmonth-end returns. Performance reflects fee waivers and/or expense limitations in effect during the periods shown. In their absence, performance would be reduced. Returns do not reflect the deduction of taxes that a shareholder would pay on Fund distributions or the redemption of Fund shares.
38
FUND BASICS
| | | | | | | | | | |
| | EXPENSE RATIOS4 | |
| | | |
| | | | | Net Expense Ratio (Current) | | | Gross Expense Ratio (Before Waivers) | |
| | Class A | | | 1.23 | % | | | 1.46 | % |
| | Class C | | | 1.98 | | | | 2.21 | |
| | Institutional | | | 0.84 | | | | 1.07 | |
| | Investor | | | 0.98 | | | | 1.21 | |
| | Class P | | | 0.83 | | | | 1.06 | |
| | Class R | | | 1.48 | | | | 1.71 | |
| | | Class R6 | | | 0.83 | | | | 1.06 | |
| | 4 | | The expense ratios of the Fund, both current (net of applicable fee waivers and/or expense limitations) and before waivers (gross of applicable fee waivers and/or expense limitations) are as set forth above according to the most recent publicly available Prospectus for the Fund and may differ from the expense ratios disclosed in the Financial Highlights in this report. Pursuant to a contractual arrangement, the Fund’s waivers and/or expense limitations will remain in place through at least December 28, 2019, and prior to such date the investment adviser may not terminate the arrangements without the approval of the Fund’s Board of Trustees. If these arrangements are discontinued in the future, the expense ratios may change without shareholder approval. |
| | | | | | | | |
| | TOP TEN HOLDINGS AS OF 2/28/195 |
| | | |
| | | Holding | | % of Net Assets | | | Line of Business |
| | | |
| | Equity LifeStyle Properties, Inc. | | | 1.4 | % | | Equity Real Estate Investment Trusts
(REITs) |
| | Camden Property Trust | | | 1.3 | | | Equity Real Estate Investment Trusts
(REITs) |
| | Federal Realty Investment Trust | | | 1.3 | | | Equity Real Estate Investment Trusts
(REITs) |
| | Alliant Energy Corp. | | | 1.2 | | | Electric Utilities |
| | Atmos Energy Corp. | | | 1.2 | | | Gas Utilities |
| | ALLETE, Inc. | | | 1.1 | | | Electric Utilities |
| | Pinnacle West Capital Corp. | | | 1.1 | | | Electric Utilities |
| | Pebblebrook Hotel Trust | | | 1.0 | | | Equity Real Estate Investment Trusts
(REITs) |
| | Burlington Stores, Inc. | | | 1.0 | | | Specialty Retail |
| | | |
| | | Commerce Bancshares, Inc. | | | 1.0 | | | Banks |
| | 5 | | The top 10 holdings may not be representative of the Fund’s future investments. |
39
FUND BASICS
|
| FUND VS. BENCHMARK SECTOR ALLOCATIONS6 |
|
| As of February 28, 2019 |
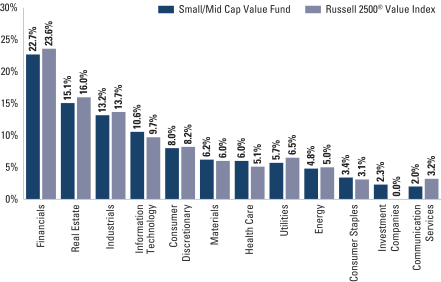
| | 6 | | The Fund is actively managed and, as such, its composition may differ over time. Consequently, the Fund’s overall sector allocations may differ from the percentages contained in the graph above. The graph categorizes investments using the Global Industry Classification Standard (“GICS”); however, the sector classifications used by the portfolio management team may differ from GICS. The percentage shown for each investment category reflects the value of investments in that category as a percentage of market value (excluding investments in the securities lending reinvestment vehicle, if any). Investments in the securities lending reinvestment vehicle represented 0.1% of the Fund’s net assets as of February 28, 2019. The graph depicts the Fund’s investments but may not represent the Fund’s market exposure due to the exclusion of certain derivatives, if any, as listed in the Additional Investment Information section of the Schedule of Investments. |
40
FUND BASICS
Index Definition
The S&P 500® Index is the Standard & Poor’s 500 Composite Index of 500 stocks, an unmanaged index of common stock prices. The S&P 500® Index figures do not reflect any deduction for fees, expenses or taxes. It is not possible to invest directly in an index.
The Russell 3000® Index is a market capitalization weighted equity index maintained by the FTSE Russell that provides exposure to the entire U.S. stock market. The index tracks the performance of the 3,000 largest U.S.-traded stocks which represent about 98% of all U.S incorporated equity securities.
The ISM Manufacturing Index is a widely-watched indicator of recent U.S. economic activity. It is often referred to as the Purchasing Manager’s Index (PMI). Based on a survey of purchasing managers at more than 300 manufacturing firms by the Institute for Supply Management (“ISM”), the Index monitors changes in production levels from month to month.
The Russell Midcap Index is a market capitalization weighted index comprised of 800 publicly traded U.S. companies with market caps of between $2 and $10 billion. The 800 companies in the Russell Midcap Index are the same 800 of the 1,000 companies that comprise Russell 1000 Index.
The Russell 1000® Index is an index of approximately 1,000 of the largest companies in the U.S. equity market. The Russell 1000 Index is a subset of the Russell 3000 Index. It represents the top companies by market capitalization. The Russell 1000 Index typically comprises approximately 90% of the total market capitalization of all listed U.S. stocks. It is considered a bellwether index for large-cap investing.
The Russell 2000® Index is an index measuring the performance of approximately 2,000 of the smallest-cap American companies in the Russell 3000 Index, which is made up of 3,000 of the largest U.S. stocks. It is a market-cap weighted index.
41
GOLDMAN SACHS EQUITY INCOME FUND
Schedule of Investments
February 28, 2019 (Unaudited)
| | | | | | | | |
| Shares | | | Description | | Value | |
|
| Common Stocks – 99.3% | |
| Aerospace & Defense – 1.9% | |
| | 16,785 | | | Northrop Grumman Corp. | | $ | 4,866,979 | |
| | 10,395 | | | Raytheon Co. | | | 1,938,667 | |
| | | | | | | | |
| | | | | | | 6,805,646 | |
| | |
| Banks – 11.5% | |
| | 229,110 | | | Bank of America Corp. | | | 6,662,519 | |
| | 122,059 | | | BB&T Corp. | | | 6,221,347 | |
| | 49,876 | | | Commerce Bancshares, Inc. | | | 3,138,697 | |
| | 17,479 | | | Cullen/Frost Bankers, Inc. | | | 1,812,223 | |
| | 105,353 | | | JPMorgan Chase & Co. | | | 10,994,639 | |
| | 17,896 | | | M&T Bank Corp. | | | 3,097,082 | |
| | 97,011 | | | SunTrust Banks, Inc. | | | 6,293,103 | |
| | 57,736 | | | Wells Fargo & Co. | | | 2,880,449 | |
| | | | | | | | |
| | | | | | | 41,100,059 | |
| | |
| Capital Markets – 2.5% | |
| | 56,343 | | | Northern Trust Corp. | | | 5,251,168 | |
| | 41,973 | | | Singapore Exchange Ltd. ADR | | | 3,636,960 | |
| | | | | | | | |
| | | | | | | 8,888,128 | |
| | |
| Chemicals – 3.0% | |
| | 95,704 | | | DowDuPont, Inc. | | | 5,094,324 | |
| | 17,986 | | | Ecolab, Inc. | | | 3,038,015 | |
| | 16,063 | | | Linde PLC | | | 2,782,754 | |
| | | | | | | | |
| | | | | | | 10,915,093 | |
| | |
| Commercial Services & Supplies – 1.3% | |
| | 57,509 | | | Republic Services, Inc. | | | 4,510,431 | |
| | |
| Communications Equipment – 3.2% | |
| | 220,097 | | | Cisco Systems, Inc. | | | 11,394,422 | |
| | |
| Construction & Engineering – 0.7% | |
| | 97,677 | | | Vinci SA ADR | | | 2,325,689 | |
| | |
| Diversified Telecommunication Services – 3.1% | |
| | 192,081 | | | Verizon Communications, Inc. | | | 10,933,251 | |
| | |
| Electric Utilities – 2.7% | |
| | 55,610 | | | Pinnacle West Capital Corp. | | | 5,212,881 | |
| | 82,254 | | | Xcel Energy, Inc. | | | 4,512,455 | |
| | | | | | | | |
| | | | | | | 9,725,336 | |
| | |
| Electronic Equipment, Instruments & Components – 0.7% | |
| | 32,394 | | | TE Connectivity Ltd. | | | 2,659,223 | |
| | |
| Energy Equipment & Services – 0.3% | |
| | 24,583 | | | Schlumberger Ltd. | | | 1,083,127 | |
| | |
| Equity Real Estate Investment Trusts (REITs) – 5.0% | |
| | 37,207 | | | Crown Castle International Corp. | | | 4,418,331 | |
| | 55,826 | | | Equity Residential | | | 4,113,818 | |
| | 112,266 | | | Hudson Pacific Properties, Inc. | | | 3,729,477 | |
| | 165,129 | | | SITE Centers Corp. | | | 2,204,472 | |
| | 56,395 | | | Ventas, Inc. | | | 3,538,786 | |
| | | | | | | | |
| | | | | | | 18,004,884 | |
| | |
|
| Common Stocks – (continued) | |
| Food & Staples Retailing – 1.8% | |
| | 65,836 | | | Walmart, Inc. | | | 6,517,106 | |
| | |
| Food Products – 0.7% | |
| | 104,686 | | | Conagra Brands, Inc. | | | 2,446,512 | |
| | |
| Health Care Equipment & Supplies – 4.6% | |
| | 94,561 | | | Abbott Laboratories | | | 7,339,825 | |
| | 103,146 | | | Medtronic PLC | | | 9,334,713 | |
| | | | | | | | |
| | | | | | | 16,674,538 | |
| | |
| Health Care Providers & Services – 0.9% | |
| | 55,853 | | | CVS Health Corp. | | | 3,229,979 | |
| | |
| Hotels, Restaurants & Leisure – 1.6% | |
| | 31,795 | | | McDonald’s Corp. | | | 5,845,193 | |
| | |
| Household Durables – 0.7% | |
| | 67,472 | | | D.R. Horton, Inc. | | | 2,623,986 | |
| | |
| Household Products – 2.8% | |
| | 11,821 | | | The Clorox Co. | | | 1,868,073 | |
| | 82,261 | | | The Procter & Gamble Co. | | | 8,106,821 | |
| | | | | | | | |
| | | | | | | 9,974,894 | |
| | |
| Industrial Conglomerates – 1.6% | |
| | 37,311 | | | Honeywell International, Inc. | | | 5,748,506 | |
| | |
| Insurance – 3.6% | |
| | 64,382 | | | Principal Financial Group, Inc. | | | 3,389,069 | |
| | 45,024 | | | ProAssurance Corp. | | | 1,827,974 | |
| | 19,948 | | | RenaissanceRe Holdings Ltd. | | | 2,933,353 | |
| | 34,693 | | | The Travelers Cos., Inc. | | | 4,611,047 | |
| | | | | | | | |
| | | | | | | 12,761,443 | |
| | |
| Interactive Media & Services* – 1.3% | |
| | 4,065 | | | Alphabet, Inc. Class A | | | 4,579,426 | |
| | |
| IT Services – 1.5% | |
| | 27,510 | | | Fidelity National Information Services, Inc. | | | 2,975,206 | |
| | 16,865 | | | Visa, Inc. Class A | | | 2,498,044 | |
| | | | | | | | |
| | | | | | | 5,473,250 | |
| | |
| Machinery – 1.0% | |
| | 26,583 | | | Stanley Black & Decker, Inc. | | | 3,520,387 | |
| | |
| Media – 2.1% | |
| | 196,966 | | | Comcast Corp. Class A | | | 7,616,675 | |
| | |
| Multi-Utilities – 5.3% | |
| | 63,220 | | | Ameren Corp. | | | 4,503,793 | |
| | 84,107 | | | CMS Energy Corp. | | | 4,575,421 | |
| | 76,336 | | | Public Service Enterprise Group, Inc. | | | 4,489,320 | |
| | 45,429 | | | Sempra Energy | | | 5,471,468 | |
| | | | | | | | |
| | | | | | | 19,040,002 | |
| | |
| Oil, Gas & Consumable Fuels – 10.7% | |
| | 94,933 | | | BP PLC ADR | | | 4,048,892 | |
| | 108,589 | | | Chevron Corp. | | | 12,985,073 | |
| | |
| | |
| 42 | | The accompanying notes are an integral part of these financial statements. |
GOLDMAN SACHS EQUITY INCOME FUND
| | | | | | | | |
| Shares | | | Description | | Value | |
|
| Common Stocks – (continued) | |
| Oil, Gas & Consumable Fuels – (continued) | |
| | 96,925 | | | Exxon Mobil Corp. | | $ | 7,659,983 | |
| | 43,744 | | | Marathon Petroleum Corp. | | | 2,712,565 | |
| | 133,445 | | | Royal Dutch Shell PLC Class B ADR | | | 8,488,437 | |
| | 98,567 | | | The Williams Cos., Inc. | | | 2,630,753 | |
| | | | | | | | |
| | | | | | | 38,525,703 | |
| | |
| Personal Products – 1.2% | |
| | 76,614 | | | Unilever NV | | | 4,135,624 | |
| | |
| Pharmaceuticals – 12.1% | |
| | 90,088 | | | AstraZeneca PLC ADR | | | 3,745,859 | |
| | 99,686 | | | Bristol-Myers Squibb Co. | | | 5,149,779 | |
| | 121,916 | | | Johnson & Johnson | | | 16,658,602 | |
| | 90,164 | | | Merck & Co., Inc. | | | 7,329,431 | |
| | 244,405 | | | Pfizer, Inc. | | | 10,594,957 | |
| | | | | | | | |
| | | | | | | 43,478,628 | |
| | |
| Road & Rail – 1.5% | |
| | 32,988 | | | Union Pacific Corp. | | | 5,532,088 | |
| | |
| Semiconductors & Semiconductor Equipment – 2.7% | |
| | 152,230 | | | Marvell Technology Group Ltd. | | | 3,036,989 | |
| | 59,859 | | | Taiwan Semiconductor Manufacturing Co. Ltd. ADR | | | 2,337,494 | |
| | 42,030 | | | Texas Instruments, Inc. | | | 4,445,933 | |
| | | | | | | | |
| | | | | | | 9,820,416 | |
| | |
| Software – 1.0% | |
| | 33,147 | | | Microsoft Corp. | | | 3,713,458 | |
| | |
| Technology Hardware, Storage & Peripherals – 1.3% | |
| | 27,546 | | | Apple, Inc. | | | 4,769,590 | |
| | |
| Tobacco – 1.2% | |
| | 80,166 | | | Altria Group, Inc. | | | 4,201,500 | |
| | |
| Water Utilities – 1.4% | |
| | 50,307 | | | American Water Works Co., Inc. | | | 5,112,197 | |
| | |
| Wireless Telecommunication Services – 0.8% | |
| | 160,577 | | | Vodafone Group PLC ADR | | | 2,866,299 | |
| | |
| | TOTAL COMMON STOCKS – 99.3% | | | | |
| | (Cost $320,934,328) | | $ | 356,552,689 | |
| | |
| OTHER ASSETS IN EXCESS OF
LIABILITIES – 0.7% | | | 2,633,424 | |
| | |
| | NET ASSETS – 100.0% | | $ | 359,186,113 | |
| | |
| | |
|
| The percentage shown for each investment category reflects the value of investments in that category as a percentage of net assets. |
| |
* | | Non-income producing security. |
| | |
|
Investment Abbreviations: |
ADR | | —American Depositary Receipt |
BP | | —British Pound Offered Rate |
PLC | | —Public Limited Company |
|
| | |
| The accompanying notes are an integral part of these financial statements. | | 43 |
GOLDMAN SACHS FOCUSED VALUE FUND
Schedule of Investments
February 28, 2019 (Unaudited)
| | | | | | | | |
| Shares | | | Description | | Value | |
|
| Common Stocks – 98.2% | |
| Aerospace & Defense – 3.0% | |
| | 723 | | | Raytheon Co. | | $ | 134,840 | |
| | |
| Banks – 10.8% | |
| | 7,871 | | | Bank of America Corp. | | | 228,889 | |
| | 1,507 | | | JPMorgan Chase & Co. | | | 157,270 | |
| | 550 | | | M&T Bank Corp. | | | 95,183 | |
| | | | | | | | |
| | | | | | | 481,342 | |
| | |
| Biotechnology* – 2.8% | |
| | 488 | | | Alexion Pharmaceuticals, Inc. | | | 66,041 | |
| | 645 | | | BioMarin Pharmaceutical, Inc. | | | 60,153 | |
| | | | | | | | |
| | | | | | | 126,194 | |
| | |
| Capital Markets – 3.6% | |
| | 1,410 | | | Intercontinental Exchange, Inc. | | | 108,781 | |
| | 529 | | | Northern Trust Corp. | | | 49,303 | |
| | | | | | | | |
| | | | | | | 158,084 | |
| | |
| Chemicals – 3.4% | |
| | 2,841 | | | DowDuPont, Inc. | | | 151,226 | |
| | |
| Consumer Finance – 3.6% | |
| | 1,473 | | | American Express Co. | | | 158,701 | |
| | |
| Electric Utilities – 5.3% | |
| | 1,269 | | | NextEra Energy, Inc. | | | 238,217 | |
| | |
| Entertainment* – 2.3% | |
| | 1,800 | | | Live Nation Entertainment, Inc. | | | 101,808 | |
| | |
| Equity Real Estate Investment Trusts (REITs) – 2.1% | |
| | 699 | | | Alexandria Real Estate Equities, Inc. | | | 94,987 | |
| | |
| Food & Staples Retailing – 5.1% | |
| | 2,312 | | | Walmart, Inc. | | | 228,865 | |
| | |
| Health Care Equipment & Supplies – 4.5% | |
| | 1,583 | | | Boston Scientific Corp.* | | | 63,510 | |
| | 479 | | | The Cooper Cos., Inc. | | | 136,989 | |
| | | | | | | | |
| | | | | | | 200,499 | |
| | |
| Health Care Providers & Services – 3.0% | |
| | 1,075 | | | CVS Health Corp. | | | 62,168 | |
| | 256 | | | Humana, Inc. | | | 72,970 | |
| | | | | | | | |
| | | | | | | 135,138 | |
| | |
| Hotels, Restaurants & Leisure – 2.8% | |
| | 1,042 | | | Royal Caribbean Cruises Ltd. | | | 123,456 | |
| | |
| Household Durables – 2.3% | |
| | 2,600 | | | D.R. Horton, Inc. | | | 101,114 | |
| | |
| Household Products – 2.8% | |
| | 1,258 | | | The Procter & Gamble Co. | | | 123,976 | |
| | |
| Industrial Conglomerates – 5.1% | |
| | 1,484 | | | Honeywell International, Inc. | | | 228,640 | |
| | |
|
| Common Stocks – (continued) | |
| Interactive Media & Services* – 7.1% | |
| | 214 | | | Alphabet, Inc. Class A | | | 241,082 | |
| | 456 | | | Facebook, Inc. Class A | | | 73,621 | |
| | | | | | | | |
| | | | | | | 314,703 | |
| | |
| IT Services – 2.5% | |
| | 698 | | | Accenture PLC Class A | | | 112,643 | |
| | |
| Machinery – 2.3% | |
| | 761 | | | Stanley Black & Decker, Inc. | | | 100,779 | |
| | |
| Oil, Gas & Consumable Fuels – 8.4% | |
| | 1,390 | | | Cheniere Energy, Inc.* | | | 89,586 | |
| | 1,076 | | | Chevron Corp. | | | 128,668 | |
| | 586 | | | Concho Resources, Inc. | | | 64,460 | |
| | 1,504 | | | Marathon Petroleum Corp. | | | 93,263 | |
| | | | | | | | |
| | | | | | | 375,977 | |
| | |
| Pharmaceuticals – 5.4% | |
| | 3,082 | | | AstraZeneca PLC ADR | | | 128,149 | |
| | 878 | | | Eli Lilly & Co. | | | 110,883 | |
| | | | | | | | |
| | | | | | | 239,032 | |
| | |
| Road & Rail – 3.5% | |
| | 928 | | | Union Pacific Corp. | | | 155,626 | |
| | |
| Semiconductors & Semiconductor Equipment – 1.6% | |
| | 3,636 | | | Marvell Technology Group Ltd. | | | 72,538 | |
| | |
| Software – 3.7% | |
| | 399 | | | Intuit, Inc. | | | 98,605 | |
| | 584 | | | Microsoft Corp. | | | 65,425 | |
| | | | | | | | |
| | | | | | | 164,030 | |
| | |
| Textiles, Apparel & Luxury Goods – 1.2% | |
| | 451 | | | PVH Corp. | | | 51,793 | |
| | |
| | TOTAL COMMON STOCKS – 98.2% | | | | |
| | (Cost $4,206,541) | | $ | 4,374,208 | |
| | |
| OTHER ASSETS IN EXCESS OF
LIABILITIES – 1.8% | | | 79,429 | |
| | |
| | NET ASSETS – 100.0% | | $ | 4,453,637 | |
| | |
| | |
|
| The percentage shown for each investment category reflects the value of investments in that category as a percentage of net assets. |
| |
* | | Non-income producing security. |
| | |
|
Investment Abbreviations: |
ADR | | —American Depositary Receipt |
PLC | | —Public Limited Company |
|
| | |
| 44 | | The accompanying notes are an integral part of these financial statements. |
GOLDMAN SACHS LARGE CAP VALUE FUND
Schedule of Investments
February 28, 2019 (Unaudited)
| | | | | | | | |
| Shares | | | Description | | Value | |
| |
| Common Stocks – 97.3% | | | |
| Aerospace & Defense – 0.9% | |
| | 25,098 | | | Raytheon Co. | | $ | 4,680,777 | |
| | |
| Banks – 11.5% | |
| | 509,053 | | | Bank of America Corp. | | | 14,803,261 | |
| | 33,846 | | | First Republic Bank | | | 3,553,153 | |
| | 169,233 | | | JPMorgan Chase & Co. | | | 17,661,156 | |
| | 27,598 | | | M&T Bank Corp. | | | 4,776,110 | |
| | 18,433 | | | Signature Bank | | | 2,502,464 | |
| | 95,187 | | | SunTrust Banks, Inc. | | | 6,174,781 | |
| | 148,716 | | | Wells Fargo & Co. | | | 7,419,441 | |
| | | | | | | | |
| | | | | | | 56,890,366 | |
| | |
| Biotechnology* – 1.4% | |
| | 28,535 | | | Alexion Pharmaceuticals, Inc. | | | 3,861,642 | |
| | 31,451 | | | BioMarin Pharmaceutical, Inc. | | | 2,933,120 | |
| | | | | | | | |
| | | | | | | 6,794,762 | |
| | |
| Capital Markets – 1.7% | |
| | 49,676 | | | Intercontinental Exchange, Inc. | | | 3,832,503 | |
| | 50,613 | | | Northern Trust Corp. | | | 4,717,132 | |
| | | | | | | | |
| | | | | | | 8,549,635 | |
| | |
| Chemicals – 2.4% | |
| | 32,805 | | | Celanese Corp. | | | 3,355,623 | |
| | 163,713 | | | DowDuPont, Inc. | | | 8,714,443 | |
| | | | | | | | |
| | | | | | | 12,070,066 | |
| | |
| Commercial Services & Supplies – 0.5% | |
| | 31,451 | | | Waste Connections, Inc. | | | 2,623,013 | |
| | |
| Communications Equipment – 2.7% | |
| | 253,901 | | | Cisco Systems, Inc. | | | 13,144,455 | |
| | |
| Construction Materials – 0.4% | |
| | 11,351 | | | Martin Marietta Materials, Inc. | | | 2,131,718 | |
| | |
| Consumer Finance – 0.6% | |
| | 28,014 | | | American Express Co. | | | 3,018,228 | |
| | |
| Diversified Financial Services* – 3.5% | |
| | 87,063 | | | Berkshire Hathaway, Inc. Class B | | | 17,525,782 | |
| | |
| Diversified Telecommunication Services – 3.8% | |
| | 151,007 | | | AT&T, Inc. | | | 4,699,338 | |
| | 250,464 | | | Verizon Communications, Inc. | | | 14,256,411 | |
| | | | | | | | |
| | | | | | | 18,955,749 | |
| | |
| Electric Utilities – 3.0% | |
| | 46,760 | | | NextEra Energy, Inc. | | | 8,777,787 | |
| | 111,121 | | | Xcel Energy, Inc. | | | 6,096,098 | |
| | | | | | | | |
| | | | | | | 14,873,885 | |
| | |
| Entertainment – 1.8% | |
| | 62,069 | | | Live Nation Entertainment, Inc.* | | | 3,510,623 | |
| | 111,330 | | | Twenty-First Century Fox, Inc. Class A | | | 5,614,372 | |
| | | | | | | | |
| | | | | | | 9,124,995 | |
| | |
| |
| Common Stocks – (continued) | | | |
| Equity Real Estate Investment Trusts (REITs) – 4.3% | |
| | 22,182 | | | Alexandria Real Estate Equities, Inc. | | | 3,014,312 | |
| | 30,201 | | | AvalonBay Communities, Inc. | | | 5,878,021 | |
| | 19,787 | | | Federal Realty Investment Trust | | | 2,643,345 | |
| | 81,752 | | | Hudson Pacific Properties, Inc. | | | 2,715,801 | |
| | 55,508 | | | Prologis, Inc. | | | 3,888,891 | |
| | 49,468 | | | Ventas, Inc. | | | 3,104,117 | |
| | | | | | | | |
| | | | | | | 21,244,487 | |
| | |
| Food & Staples Retailing – 2.2% | |
| | 107,476 | | | Walmart, Inc. | | | 10,639,049 | |
| | |
| Food Products – 1.3% | |
| | 131,012 | | | Mondelez International, Inc. Class A | | | 6,178,526 | |
| | |
| Health Care Equipment & Supplies – 6.0% | |
| | 114,661 | | | Boston Scientific Corp.* | | | 4,600,199 | |
| | 44,156 | | | Danaher Corp. | | | 5,608,695 | |
| | 102,060 | | | Medtronic PLC | | | 9,236,430 | |
| | 15,621 | | | The Cooper Cos., Inc. | | | 4,467,450 | |
| | 45,406 | | | Zimmer Biomet Holdings, Inc. | | | 5,635,793 | |
| | | | | | | | |
| | | | | | | 29,548,567 | |
| | |
| Health Care Providers & Services – 2.0% | |
| | 72,796 | | | CVS Health Corp. | | | 4,209,793 | |
| | 10,310 | | | Humana, Inc. | | | 2,938,762 | |
| | 19,578 | | | Laboratory Corp. of America Holdings* | | | 2,902,243 | |
| | | | | | | | |
| | | | | | | 10,050,798 | |
| | |
| Hotels, Restaurants & Leisure – 1.9% | |
| | 34,992 | | | McDonald’s Corp. | | | 6,432,929 | |
| | 25,098 | | | Royal Caribbean Cruises Ltd. | | | 2,973,611 | |
| | | | | | | | |
| | | | | | | 9,406,540 | |
| | |
| Household Durables – 0.5% | |
| | 60,819 | | | D.R. Horton, Inc. | | | 2,365,251 | |
| | |
| Household Products – 2.6% | |
| | 129,866 | | | The Procter & Gamble Co. | | | 12,798,294 | |
| | |
| Industrial Conglomerates – 2.2% | |
| | 386,788 | | | General Electric Co. | | | 4,018,727 | |
| | 43,011 | | | Honeywell International, Inc. | | | 6,626,705 | |
| | | | | | | | |
| | | | | | | 10,645,432 | |
| | |
| Insurance – 3.3% | |
| | 40,303 | | | American Financial Group, Inc. | | | 4,016,597 | |
| | 34,992 | | | Arthur J. Gallagher & Co. | | | 2,809,158 | |
| | 35,929 | | | Chubb Ltd. | | | 4,810,893 | |
| | 100,706 | | | MetLife, Inc. | | | 4,550,904 | |
| | | | | | | | |
| | | | | | | 16,187,552 | |
| | |
| Interactive Media & Services* – 1.4% | |
| | 4,061 | | | Alphabet, Inc. Class A | | | 4,574,920 | |
| | 14,267 | | | Facebook, Inc. Class A | | | 2,303,407 | |
| | | | | | | | |
| | | | | | | 6,878,327 | |
| | |
| | |
| The accompanying notes are an integral part of these financial statements. | | 45 |
GOLDMAN SACHS LARGE CAP VALUE FUND
Schedule of Investments(continued)
February 28, 2019 (Unaudited)
| | | | | | | | |
| Shares | | | Description | | Value | |
| |
| Common Stocks – (continued) | | | |
| IT Services – 0.8% | |
| | 24,161 | | | Accenture PLC Class A | | $ | 3,899,102 | |
| | |
| Machinery – 2.8% | |
| | 16,454 | | | Deere & Co. | | | 2,699,114 | |
| | 92,479 | | | ITT, Inc. | | | 5,341,587 | |
| | 40,824 | | | Stanley Black & Decker, Inc. | | | 5,406,323 | |
| | 2,077 | | | Wabtec Corp. | | | 152,193 | |
| | | | | | | | |
| | | | | | | 13,599,217 | |
| | |
| Media – 2.3% | |
| | 289,206 | | | Comcast Corp. Class A | | | 11,183,596 | |
| | |
| Multi-Utilities – 2.3% | |
| | 77,066 | | | Ameren Corp. | | | 5,490,182 | |
| | 107,892 | | | CMS Energy Corp. | | | 5,869,325 | |
| | | | | | | | |
| | | | | | | 11,359,507 | |
| | |
| Oil, Gas & Consumable Fuels – 9.4% | |
| | 111,073 | | | Chevron Corp. | | | 13,282,109 | |
| | 40,303 | | | Concho Resources, Inc. | | | 4,433,330 | |
| | 18,751 | | | Diamondback Energy, Inc. | | | 1,930,041 | |
| | 59,850 | | | EOG Resources, Inc. | | | 5,625,900 | |
| | 135,698 | | | Exxon Mobil Corp. | | | 10,724,213 | |
| | 98,027 | | | Marathon Petroleum Corp. | | | 6,078,654 | |
| | 69,776 | | | Royal Dutch Shell PLC Class B ADR | | | 4,438,451 | |
| | | | | | | | |
| | | | | | | 46,512,698 | |
| | |
| Pharmaceuticals – 6.5% | |
| | 61,236 | | | AstraZeneca PLC ADR | | | 2,546,193 | |
| | 34,159 | | | Eli Lilly & Co. | | | 4,313,940 | |
| | 101,227 | | | Johnson & Johnson | | | 13,831,657 | |
| | 59,986 | | | Merck & Co., Inc. | | | 4,876,262 | |
| | 146,946 | | | Pfizer, Inc. | | | 6,370,109 | |
| | | | | | | | |
| | | | | | | 31,938,161 | |
| | |
| Road & Rail – 0.9% | |
| | 26,139 | | | Union Pacific Corp. | | | 4,383,510 | |
| | |
| Semiconductors & Semiconductor Equipment – 3.4% | |
| | 50,092 | | | Advanced Micro Devices, Inc.* | | | 1,178,665 | |
| | 144,623 | | | Intel Corp. | | | 7,659,234 | |
| | 211,202 | | | Marvell Technology Group Ltd. | | | 4,213,480 | |
| | 36,723 | | | Texas Instruments, Inc. | | | 3,884,559 | |
| | | | | | | | |
| | | | | | | 16,935,938 | |
| | |
| Software – 2.3% | |
| | 22,286 | | | Check Point Software Technologies Ltd.* | | | 2,725,578 | |
| | 18,537 | | | Intuit, Inc. | | | 4,581,049 | |
| | 34,054 | | | Microsoft Corp. | | | 3,815,069 | |
| | | | | | | | |
| | | | | | | 11,121,696 | |
| | |
| Specialty Retail – 1.6% | |
| | 11,351 | | | Advance Auto Parts, Inc. | | | 1,836,365 | |
| | 29,056 | | | Ross Stores, Inc. | | | 2,755,380 | |
| | 19,162 | | | The Home Depot, Inc. | | | 3,547,653 | |
| | | | | | | | |
| | | | | | | 8,139,398 | |
| | |
| |
| Common Stocks – (continued) | | | |
| Technology Hardware, Storage & Peripherals – 0.5% | |
| | 14,163 | | | Apple, Inc. | | | 2,452,323 | |
| | |
| Textiles, Apparel & Luxury Goods – 0.9% | |
| | 39,991 | | | PVH Corp. | | | 4,592,566 | |
| | |
| Tobacco – 0.9% | |
| | 86,126 | | | Altria Group, Inc. | | | 4,513,864 | |
| | |
| Water Utilities – 0.8% | |
| | 37,908 | | | American Water Works Co., Inc. | | | 3,852,211 | |
| | |
| | TOTAL COMMON STOCKS | | | | |
| | (Cost $424,170,686) | | $ | 480,810,041 | |
| | |
| | | | | | | | |
| Shares | | | Dividend
Rate | | Value | |
| |
| Investment Company(a) – 1.1% | | | |
| Goldman Sachs Financial Square Government Fund –
Institutional Shares |
|
| | 5,281,073 | | | 2.395% | | $ | 5,281,073 | |
| | (Cost $5,281,073) | | | | |
| | |
| | TOTAL INVESTMENTS – 98.4% | | | | |
| | (Cost $429,451,759) | | $ | 486,091,114 | |
| | |
| OTHER ASSETS IN EXCESS OF
LIABILITIES – 1.6% | | | 7,851,032 | |
| | |
| | NET ASSETS – 100.0% | | $ | 493,942,146 | |
| | |
| | |
|
| The percentage shown for each investment category reflects the value of investments in that category as a percentage of net assets. |
| |
* | | Non-income producing security. |
| |
(a) | | Represents an affiliated fund. |
| | |
|
Investment Abbreviations: |
ADR | | —American Depositary Receipt |
PLC | | —Public Limited Company |
|
| | |
| 46 | | The accompanying notes are an integral part of these financial statements. |
GOLDMAN SACHS MID CAP VALUE FUND
| | | | | | | | |
| Shares | | | Description | | Value | |
|
| Common Stocks – 98.9% | |
| Aerospace & Defense – 1.7% | |
| | 101,195 | | | L3 Technologies, Inc. | | $ | 21,428,041 | |
| | |
| Airlines* – 1.0% | |
| | 756,750 | | | JetBlue Airways Corp. | | | 12,637,725 | |
| | |
| Auto Components – 0.8% | |
| | 122,256 | | | Aptiv PLC | | | 10,160,696 | |
| | |
| Banks – 7.2% | |
| | 267,814 | | | Citizens Financial Group, Inc. | | | 9,893,049 | |
| | 134,205 | | | Comerica, Inc. | | | 11,690,598 | |
| | 207,244 | | | First Republic Bank | | | 21,756,475 | |
| | 138,678 | | | M&T Bank Corp. | | | 23,999,615 | |
| | 90,686 | | | Signature Bank | | | 12,311,531 | |
| | 197,939 | | | SunTrust Banks, Inc. | | | 12,840,303 | |
| | | | | | | | |
| | | | | | | 92,491,571 | |
| | |
| Beverages* – 1.0% | |
| | 274,124 | | | Coca-Cola European Partners PLC | | | 12,922,205 | |
| | |
| Biotechnology* – 0.7% | |
| | 28,622 | | | Alexion Pharmaceuticals, Inc. | | | 3,873,415 | |
| | 60,689 | | | BioMarin Pharmaceutical, Inc. | | | 5,659,856 | |
| | | | | | | | |
| | | | | | | 9,533,271 | |
| | |
| Capital Markets – 2.8% | |
| | 74,442 | | | Cboe Global Markets, Inc. | | | 7,139,732 | |
| | 208,928 | | | E*TRADE Financial Corp. | | | 10,235,383 | |
| | 152,938 | | | Lazard Ltd. Class A | | | 5,724,469 | |
| | 139,783 | | | Northern Trust Corp. | | | 13,027,776 | |
| | | | | | | | |
| | | | | | | 36,127,360 | |
| | |
| Chemicals – 2.8% | |
| | 192,532 | | | Celanese Corp. | | | 19,694,098 | |
| | 203,314 | | | W.R. Grace & Co. | | | 15,791,399 | |
| | | | | | | | |
| | | | | | | 35,485,497 | |
| | |
| Communications Equipment – 1.7% | |
| | 66,320 | | | Motorola Solutions, Inc. | | | 9,491,718 | |
| | 970,980 | | | Viavi Solutions, Inc.* | | | 12,748,968 | |
| | | | | | | | |
| | | | | | | 22,240,686 | |
| | |
| Construction & Engineering – 1.1% | |
| | 185,078 | | | Jacobs Engineering Group, Inc. | | | 13,655,055 | |
| | |
| Construction Materials – 1.2% | |
| | 81,717 | | | Martin Marietta Materials, Inc. | | | 15,346,453 | |
| | |
| Containers & Packaging – 0.8% | |
| | 194,435 | | | Ball Corp. | | | 10,651,149 | |
| | |
| Diversified Telecommunication Services – 0.9% | |
| | 492,522 | | | CenturyLink, Inc. | | | 6,496,365 | |
| | 189,048 | | | Zayo Group Holdings, Inc.* | | | 4,688,391 | |
| | | | | | | | |
| | | | | | | 11,184,756 | |
| | |
| Electric Utilities – 4.1% | |
| | 277,994 | | | Evergy, Inc. | | | 15,542,645 | |
| | 142,443 | | | PG&E Corp.* | | | 2,425,804 | |
| | 109,634 | | | Pinnacle West Capital Corp. | | | 10,277,091 | |
| | |
|
| Common Stocks – (continued) | |
| Electric Utilities – (continued) | |
| | 449,948 | | | Xcel Energy, Inc. | | | 24,684,147 | |
| | | | | | | | |
| | | | | | | 52,929,687 | |
| | |
| Electrical Equipment – 1.6% | |
| | 165,039 | | | AMETEK, Inc. | | | 13,133,803 | |
| | 159,827 | | | Sensata Technologies Holding PLC* | | | 8,108,024 | |
| | | | | | | | |
| | | | | | | 21,241,827 | |
| | |
| Entertainment* – 0.8% | |
| | 172,801 | | | Live Nation Entertainment, Inc. | | | 9,773,625 | |
| | |
| Equity Real Estate Investment Trusts (REITs) – 13.2% | |
| | 249,580 | | | Acadia Realty Trust | | | 7,110,534 | |
| | 139,884 | | | Alexandria Real Estate Equities, Inc. | | | 19,008,837 | |
| | 102,088 | | | AvalonBay Communities, Inc. | | | 19,869,387 | |
| | 116,199 | | | Boston Properties, Inc. | | | 15,418,445 | |
| | 150,719 | | | Camden Property Trust | | | 14,784,027 | |
| | 138,527 | | | CyrusOne, Inc. | | | 6,904,186 | |
| | 117,989 | | | Equity LifeStyle Properties, Inc. | | | 12,818,325 | |
| | 50,331 | | | Essex Property Trust, Inc. | | | 14,084,627 | |
| | 227,705 | | | HCP, Inc. | | | 7,006,483 | |
| | 222,958 | | | Hudson Pacific Properties, Inc. | | | 7,406,665 | |
| | 136,474 | | | Prologis, Inc. | | | 9,561,368 | |
| | 79,069 | | | Ryman Hospitality Properties, Inc. | | | 6,403,798 | |
| | 52,209 | | | SBA Communications Corp.* | | | 9,426,857 | |
| | 311,117 | | | Ventas, Inc. | | | 19,522,592 | |
| | | | | | | | |
| | | | | | | 169,326,131 | |
| | |
| Food & Staples Retailing* – 1.1% | |
| | 418,340 | | | US Foods Holding Corp. | | | 14,742,302 | |
| | |
| Food Products – 2.3% | |
| | 105,727 | | | Bunge Ltd. | | | 5,611,989 | |
| | 282,247 | | | Conagra Brands, Inc. | | | 6,596,113 | |
| | 70,238 | | | McCormick & Co., Inc. | | | 9,550,963 | |
| | 401,818 | | | Nomad Foods Ltd.* | | | 8,076,542 | |
| | | | | | | | |
| | | | | | | 29,835,607 | |
| | |
| Gas Utilities – 0.7% | |
| | 94,547 | | | Atmos Energy Corp. | | | 9,345,971 | |
| | |
| Health Care Equipment & Supplies – 4.0% | |
| | 30,503 | | | Teleflex, Inc. | | | 8,840,989 | |
| | 75,845 | | | The Cooper Cos., Inc. | | | 21,690,912 | |
| | 173,964 | | | Zimmer Biomet Holdings, Inc. | | | 21,592,412 | |
| | | | | | | | |
| | | | | | | 52,124,313 | |
| | |
| Health Care Providers & Services* – 1.6% | |
| | 191,760 | | | Acadia Healthcare Co., Inc. | | | 5,041,371 | |
| | 104,318 | | | Laboratory Corp. of America Holdings | | | 15,464,100 | |
| | | | | | | | |
| | | | | | | 20,505,471 | |
| | |
| Hotels, Restaurants & Leisure – 3.0% | |
| | 353,318 | | | MGM Resorts International | | | 9,451,256 | |
| | 167,066 | | | Restaurant Brands International, Inc. | | | 10,560,242 | |
| | 152,483 | | | Royal Caribbean Cruises Ltd. | | | 18,066,186 | |
| | | | | | | | |
| | | | | | | 38,077,684 | |
| | |
| | |
| The accompanying notes are an integral part of these financial statements. | | 47 |
GOLDMAN SACHS MID CAP VALUE FUND
Schedule of Investments(continued)
February 28, 2019 (Unaudited)
| | | | | | | | |
| Shares | | | Description | | Value | |
|
| Common Stocks – (continued) | |
| Household Durables – 0.9% | |
| | 289,231 | | | D.R. Horton, Inc. | | $ | 11,248,194 | |
| | |
| Insurance – 6.7% | |
| | 293,176 | | | Arch Capital Group Ltd.* | | | 9,578,060 | |
| | 31,738 | | | Everest Re Group Ltd. | | | 7,176,279 | |
| | 200,429 | | | Lincoln National Corp. | | | 12,530,821 | |
| | 6,298 | | | Markel Corp.* | | | 6,328,734 | |
| | 71,670 | | | Reinsurance Group of America, Inc. | | | 10,355,598 | |
| | 55,022 | | | The Hanover Insurance Group, Inc. | | | 6,531,662 | |
| | 221,096 | | | The Hartford Financial Services Group, Inc. | | | 10,913,299 | |
| | 120,615 | | | Torchmark Corp. | | | 9,957,974 | |
| | 74,250 | | | Willis Towers Watson PLC | | | 12,772,485 | |
| | | | | | | | |
| | | | | | | 86,144,912 | |
| | |
| Internet & Direct Marketing Retail – 0.7% | |
| | 75,523 | | | Expedia Group, Inc. | | | 9,312,741 | |
| | |
| IT Services – 3.5% | |
| | 237,658 | | | Fidelity National Information Services, Inc. | | | 25,702,712 | |
| | 114,552 | | | GoDaddy, Inc. Class A* | | | 8,551,307 | |
| | 108,922 | | | Total System Services, Inc. | | | 10,282,237 | |
| | | | | | | | |
| | | | | | | 44,536,256 | |
| | |
| Life Sciences Tools & Services – 1.4% | |
| | 223,501 | | | Agilent Technologies, Inc. | | | 17,754,919 | |
| | |
| Machinery – 4.7% | |
| | 230,329 | | | Flowserve Corp. | | | 10,228,911 | |
| | 361,574 | | | ITT, Inc. | | | 20,884,514 | |
| | 182,287 | | | Stanley Black & Decker, Inc. | | | 24,140,267 | |
| | 168,954 | | | Terex Corp. | | | 5,675,165 | |
| | | | | | | | |
| | | | | | | 60,928,857 | |
| | |
| Media* – 0.9% | |
| | 125,069 | | | Liberty Broadband Corp. Class C | | | 11,193,675 | |
| | |
| Metals & Mining – 1.9% | |
| | 958,422 | | | Freeport-McMoRan, Inc. | | | 12,363,644 | |
| | 210,385 | | | Newmont Mining Corp. | | | 7,178,336 | |
| | 128,206 | | | Steel Dynamics, Inc. | | | 4,784,648 | |
| | | | | | | | |
| | | | | | | 24,326,628 | |
| | |
| Mortgage Real Estate Investment Trusts (REITs) – 0.5% | |
| | 293,347 | | | Starwood Property Trust, Inc. | | | 6,579,773 | |
| | |
| Multi-Utilities – 5.0% | |
| | 341,904 | | | CMS Energy Corp. | | | 18,599,577 | |
| | 394,538 | | | Public Service Enterprise Group, Inc. | | | 23,202,780 | |
| | 186,011 | | | Sempra Energy | | | 22,403,165 | |
| | | | | | | | |
| | | | | | | 64,205,522 | |
| | |
| Multiline Retail – 0.9% | |
| | 97,610 | | | Dollar General Corp. | | | 11,562,881 | |
| | |
| Oil, Gas & Consumable Fuels – 6.4% | |
| | 209,261 | | | Cheniere Energy, Inc.* | | | 13,486,871 | |
| | 188,502 | | | Concho Resources, Inc. | | | 20,735,220 | |
| | |
|
| Common Stocks – (continued) | |
| Oil, Gas & Consumable Fuels – (continued) | |
| | 183,936 | | | Diamondback Energy, Inc. | | | 18,932,533 | |
| | 147,946 | | | Marathon Petroleum Corp. | | | 9,174,131 | |
| | 289,530 | | | The Williams Cos., Inc. | | | 7,727,556 | |
| | 197,588 | | | Viper Energy Partners LP | | | 6,502,621 | |
| | 521,434 | | | WPX Energy, Inc.* | | | 6,434,496 | |
| | | | | | | | |
| | | | | | | 82,993,428 | |
| | |
| Real Estate Management & Development* – 0.5% | |
| | 346,193 | | | Cushman & Wakefield PLC | | | 6,345,718 | |
| | |
| Road & Rail – 0.8% | |
| | 71,005 | | | Old Dominion Freight Line, Inc. | | | 10,705,424 | |
| | |
| Semiconductors & Semiconductor Equipment – 2.6% | |
| | 170,744 | | | Advanced Micro Devices, Inc.* | | | 4,017,606 | |
| | 60,916 | | | Analog Devices, Inc. | | | 6,515,575 | |
| | 823,830 | | | Marvell Technology Group Ltd. | | | 16,435,409 | |
| | 72,132 | | | NXP Semiconductors NV | | | 6,587,094 | |
| | | | | | | | |
| | | | | | | 33,555,684 | |
| | |
| Software – 1.6% | |
| | 59,930 | | | Check Point Software Technologies Ltd.* | | | 7,329,439 | |
| | 65,451 | | | PTC, Inc.* | | | 6,075,162 | |
| | 16,779 | | | Red Hat, Inc.* | | | 3,063,845 | |
| | 179,569 | | | Symantec Corp. | | | 4,038,507 | |
| | | | | | | | |
| | | | | | | 20,506,953 | |
| | |
| Specialty Retail – 1.0% | |
| | 54,047 | | | Advance Auto Parts, Inc. | | | 8,743,724 | |
| | 25,421 | | | Burlington Stores, Inc.* | | | 4,314,960 | |
| | | | | | | | |
| | | | | | | 13,058,684 | |
| | |
| Technology Hardware, Storage & Peripherals – 0.8% | |
| | 200,992 | | | Western Digital Corp. | | | 10,109,898 | |
| | |
| Textiles, Apparel & Luxury Goods – 1.1% | |
| | 123,409 | | | PVH Corp. | | | 14,172,290 | |
| | |
| Water Utilities – 0.9% | |
| | 119,315 | | | American Water Works Co., Inc. | | | 12,124,790 | |
| | |
| TOTAL COMMON STOCKS – 98.9%
(Cost $1,174,661,080) | | $ | 1,273,134,310 | |
| | |
| OTHER ASSETS IN EXCESS OF
LIABILITIES – 1.1% | | | 13,671,509 | |
| | |
| | NET ASSETS – 100.0% | | $ | 1,286,805,819 | |
| | |
| | |
|
| The percentage shown for each investment category reflects the value of investments in that category as a percentage of net assets. |
| |
* | | Non-income producing security. |
| | |
|
Investment Abbreviations: |
LP | | —Limited Partnership |
PLC | | —Public Limited Company |
|
| | |
| 48 | | The accompanying notes are an integral part of these financial statements. |
GOLDMAN SACHS SMALL CAP VALUE FUND
Schedule of Investments
February 28, 2019 (Unaudited)
| | | | | | | | |
| Shares | | | Description | | Value | |
|
| Common Stocks – 98.0% | |
| Aerospace & Defense – 1.5% | |
| | 260,169 | | | AAR Corp. | | $ | 9,503,974 | |
| | 264,916 | | | Curtiss-Wright Corp. | | | 32,661,494 | |
| | 184,526 | | | Esterline Technologies Corp.* | | | 22,466,040 | |
| | 115,488 | | | Mercury Systems, Inc.* | | | 7,335,798 | |
| | 203,523 | | | Moog, Inc. Class A | | | 19,123,021 | |
| | | | | | | | |
| | | | | | | 91,090,327 | |
| | |
| Air Freight & Logistics* – 0.7% | |
| | 922,070 | | | Air Transport Services Group, Inc. | | | 21,456,569 | |
| | 297,427 | | | Atlas Air Worldwide Holdings, Inc. | | | 15,983,727 | |
| | 192,838 | | | Echo Global Logistics, Inc. | | | 4,631,969 | |
| | | | | | | | |
| | | | | | | 42,072,265 | |
| | |
| Airlines – 1.2% | |
| | 756,068 | | | SkyWest, Inc. | | | 40,857,915 | |
| | 582,393 | | | Spirit Airlines, Inc.* | | | 32,759,606 | |
| | | | | | | | |
| | | | | | | 73,617,521 | |
| | |
| Auto Components – 0.5% | |
| | 1,563,900 | | | American Axle & Manufacturing Holdings, Inc.* | | | 25,178,790 | |
| | 121,204 | | | Standard Motor Products, Inc. | | | 5,975,357 | |
| | | | | | | | |
| | | | | | | 31,154,147 | |
| | |
| Banks – 17.8% | |
| | 692,427 | | | Amalgamated Bank Class A | | | 12,262,882 | |
| | 399,647 | | | Ameris Bancorp | | | 16,293,608 | |
| | 812,093 | | | BancorpSouth Bank | | | 26,466,111 | |
| | 947,311 | | | Banner Corp. | | | 58,856,432 | |
| | 1,269,123 | | | Boston Private Financial Holdings, Inc. | | | 15,089,872 | |
| | 1,346,705 | | | Brookline Bancorp, Inc. | | | 21,520,346 | |
| | 356,320 | | | Bryn Mawr Bank Corp. | | | 14,523,603 | |
| | 1,448,654 | | | CenterState Bank Corp. | | | 38,331,385 | |
| | 760,874 | | | Chemical Financial Corp. | | | 34,870,855 | |
| | 1,250,840 | | | Columbia Banking System, Inc. | | | 47,381,819 | |
| | 664,293 | | | Community Bank System, Inc. | | | 43,039,543 | |
| | 931,653 | | | ConnectOne Bancorp, Inc. | | | 20,095,755 | |
| | 2,166,587 | | | CVB Financial Corp. | | | 49,376,518 | |
| | 417,775 | | | FB Financial Corp. | | | 14,810,124 | |
| | 612,982 | | | First Financial Bankshares, Inc. | | | 39,751,883 | |
| | 996,915 | | | First Merchants Corp. | | | 40,265,397 | |
| | 1,241,150 | | | First Midwest Bancorp, Inc. | | | 28,732,623 | |
| | 684,243 | | | Flushing Financial Corp. | | | 15,881,280 | |
| | 1,164,615 | | | Glacier Bancorp, Inc. | | | 51,033,429 | |
| | 1,320,578 | | | Great Western Bancorp, Inc. | | | 49,587,704 | |
| | 633,716 | | | Heritage Financial Corp. | | | 20,861,931 | |
| | 1,084,335 | | | Home BancShares, Inc. | | | 21,122,846 | |
| | 578,780 | | | Independent Bank Corp. | | | 49,271,541 | |
| | 658,370 | | | Independent Bank Group, Inc. | | | 38,159,125 | |
| | 660,165 | | | Lakeland Financial Corp. | | | 31,899,173 | |
| | 1,245,313 | | | LegacyTexas Financial Group, Inc. | | | 51,966,911 | |
| | 335,278 | | | National Commerce Corp.* | | | 14,648,296 | |
| | 228,676 | | | Old Line Bancshares, Inc. | | | 6,549,281 | |
| | 311,490 | | | Pacific Premier Bancorp, Inc. | | | 9,297,977 | |
| | 650,996 | | | Pinnacle Financial Partners, Inc. | | | 38,206,955 | |
| | 1,077,638 | | | Renasant Corp. | | | 41,251,983 | |
| | |
|
| Common Stocks – (continued) | |
| Banks – (continued) | |
| | 429,261 | | | Sandy Spring Bancorp, Inc. | | | 15,054,183 | |
| | 433,745 | | | South State Corp. | | | 30,813,245 | |
| | 154,341 | | | Texas Capital Bancshares, Inc.* | | | 9,419,431 | |
| | 458,811 | | | The First of Long Island Corp. | | | 10,717,825 | |
| | 667,343 | | | Towne Bank | | | 18,398,647 | |
| | 449,325 | | | TriCo Bancshares | | | 18,071,852 | |
| | 677,370 | | | Union Bankshares Corp. | | | 24,094,051 | |
| | | | | | | | |
| | | | | | | 1,087,976,422 | |
| | |
| Beverages – 0.2% | |
| | 165,522 | | | MGP Ingredients, Inc. | | | 13,547,976 | |
| | |
| Biotechnology* – 0.2% | |
| | 232,363 | | | Emergent BioSolutions, Inc. | | | 13,558,381 | |
| | |
| Building Products – 0.3% | |
| | 218,378 | | | Armstrong World Industries, Inc. | | | 15,980,902 | |
| | |
| Capital Markets – 1.6% | |
| | 1,014,663 | | | BrightSphere Investment Group PLC | | | 14,357,481 | |
| | 531,421 | | | Houlihan Lokey, Inc. | | | 24,434,738 | |
| | 70,510 | | | PJT Partners, Inc. Class A | | | 3,259,677 | |
| | 800,290 | | | Stifel Financial Corp. | | | 43,559,785 | |
| | 466,482 | | | Virtu Financial, Inc. Class A | | | 11,727,357 | |
| | | | | | | | |
| | | | | | | 97,339,038 | |
| | |
| Chemicals – 1.7% | |
| | 29,698 | | | Ferro Corp.* | | | 575,844 | |
| | 516,155 | | | H.B. Fuller Co. | | | 26,055,504 | |
| | 316,369 | | | Ingevity Corp.* | | | 36,452,036 | |
| | 128,530 | | | Quaker Chemical Corp. | | | 26,861,485 | |
| | 143,668 | | | Sensient Technologies Corp. | | | 9,295,320 | |
| | 281,524 | | | Tronox Ltd. Class A | | | 3,330,429 | |
| | | | | | | | |
| | | | | | | 102,570,618 | |
| | |
| Commercial Services & Supplies – 1.3% | |
| | 587,121 | | | ABM Industries, Inc. | | | 20,936,735 | |
| | 813,012 | | | Advanced Disposal Services, Inc.* | | | 21,561,078 | |
| | 500,267 | | | Brady Corp. Class A | | | 23,667,632 | |
| | 361,583 | | | Mobile Mini, Inc. | | | 13,020,604 | |
| | | | | | | | |
| | | | | | | 79,186,049 | |
| | |
| Communications Equipment – 2.7% | |
| | 1,164,077 | | | Ciena Corp.* | | | 49,659,525 | |
| | 1,516,776 | | | NetScout Systems, Inc.* | | | 41,514,159 | |
| | 295,947 | | | Plantronics, Inc. | | | 14,868,377 | |
| | 4,617,509 | | | Viavi Solutions, Inc.* | | | 60,627,893 | |
| | | | | | | | |
| | | | | | | 166,669,954 | |
| | |
| Construction & Engineering – 1.3% | |
| | 376,517 | | | EMCOR Group, Inc. | | | 27,158,171 | |
| | 343,160 | | | Granite Construction, Inc. | | | 15,977,530 | |
| | 1,888,015 | | | KBR, Inc. | | | 37,307,176 | |
| | | | | | | | |
| | | | | | | 80,442,877 | |
| | |
| Diversified Consumer Services* – 1.1% | |
| | 900,182 | | | Adtalem Global Education, Inc. | | | 43,388,772 | |
| | 554,088 | | | Chegg, Inc. | | | 21,958,508 | |
| | | | | | | | |
| | | | | | | 65,347,280 | |
| | |
| | |
| The accompanying notes are an integral part of these financial statements. | | 49 |
GOLDMAN SACHS SMALL CAP VALUE FUND
Schedule of Investments(continued)
February 28, 2019 (Unaudited)
| | | | | | | | |
| Shares | | | Description | | Value | |
|
| Common Stocks – (continued) | |
| Electric Utilities – 4.4% | |
| | 859,280 | | | ALLETE, Inc. | | $ | 69,644,644 | |
| | 757,817 | | | El Paso Electric Co. | | | 40,770,555 | |
| | 569,769 | | | IDACORP, Inc. | | | 56,070,967 | |
| | 966,472 | | | PNM Resources, Inc. | | | 42,215,497 | |
| | 1,182,004 | | | Portland General Electric Co. | | | 59,265,680 | |
| | | | | | | | |
| | | | | | | 267,967,343 | |
| | |
| Electronic Equipment, Instruments & Components – 2.0% | |
| | 826,233 | | | CTS Corp. | | | 26,538,604 | |
| | 470,872 | | | II-VI, Inc.* | | | 20,002,643 | |
| | 971,115 | | | Knowles Corp.* | | | 15,809,752 | |
| | 120,072 | | | Rogers Corp.* | | | 18,641,178 | |
| | 388,913 | | | SYNNEX Corp. | | | 38,160,143 | |
| | | | | | | | |
| | | | | | | 119,152,320 | |
| | |
| Energy Equipment & Services* – 1.5% | |
| | 1,227,619 | | | Apergy Corp. | | | 51,535,446 | |
| | 940,503 | | | Cactus, Inc. Class A | | | 34,102,639 | |
| | 565,979 | | | NCS Multistage Holdings, Inc. | | | 3,118,544 | |
| | | | | | | | |
| | | | | | | 88,756,629 | |
| | |
| Entertainment* – 0.6% | |
| | 662,692 | | | Live Nation Entertainment, Inc. | | | 37,481,859 | |
| | |
| Equity Real Estate Investment Trusts (REITs) – 10.2% | |
| | 2,153,143 | | | Acadia Realty Trust | | | 61,343,044 | |
| | 667,075 | | | Chatham Lodging Trust | | | 13,328,158 | |
| | 2,380,341 | | | Chesapeake Lodging Trust | | | 71,695,871 | |
| | 2,709,595 | | | Columbia Property Trust, Inc. | | | 58,608,540 | |
| | 942,612 | | | CyrusOne, Inc. | | | 46,979,782 | |
| | 1,878,104 | | | Healthcare Realty Trust, Inc. | | | 59,441,992 | |
| | 929,636 | | | Hudson Pacific Properties, Inc. | | | 30,882,508 | |
| | 370,156 | | | Life Storage, Inc. | | | 36,127,226 | |
| | 719,611 | | | National Health Investors, Inc. | | | 56,151,246 | |
| | 2,011,681 | | | Pebblebrook Hotel Trust | | | 64,393,909 | |
| | 889,300 | | | Preferred Apartment Communities, Inc. Class A | | | 13,552,932 | |
| | 394,787 | | | PS Business Parks, Inc. | | | 58,100,803 | |
| | 2,685,948 | | | RLJ Lodging Trust | | | 49,878,054 | |
| | | | | | | | |
| | | | | | | 620,484,065 | |
| | |
| Food & Staples Retailing* – 0.3% | |
| | 525,151 | | | Performance Food Group Co. | | | 20,234,068 | |
| | |
| Food Products – 1.8% | |
| | 369,649 | | | B&G Foods, Inc.(a) | | | 9,100,758 | |
| | 1,556,977 | | | Darling Ingredients, Inc.* | | | 34,222,354 | |
| | 106,195 | | | Hostess Brands, Inc.* | | | 1,289,207 | |
| | 958,336 | | | Nomad Foods Ltd.* | | | 19,262,554 | |
| | 75,348 | | | Sanderson Farms, Inc. | | | 8,680,090 | |
| | 1,701,887 | | | The Simply Good Foods Co.* | | | 34,820,608 | |
| | | | | | | | |
| | | | | | | 107,375,571 | |
| | |
| Gas Utilities – 1.6% | |
| | 509,296 | | | Chesapeake Utilities Corp. | | | 45,841,733 | |
| | |
|
| Common Stocks – (continued) | |
| Gas Utilities – (continued) | |
| | 972,672 | | | New Jersey Resources Corp. | | | 47,077,325 | |
| | 164,146 | | | South Jersey Industries, Inc. | | | 4,752,026 | |
| | | | | | | | |
| | | | | | | 97,671,084 | |
| | |
| Health Care Equipment & Supplies – 1.8% | |
| | 784,090 | | | Avanos Medical, Inc.* | | | 36,914,957 | |
| | 450,481 | | | CONMED Corp. | | | 34,641,989 | |
| | 350,370 | | | Orthofix Medical, Inc.* | | | 21,407,607 | |
| | 578,715 | | | Wright Medical Group NV* | | | 18,119,567 | |
| | | | | | | | |
| | | | | | | 111,084,120 | |
| | |
| Health Care Providers & Services* – 0.4% | |
| | 411,738 | | | Acadia Healthcare Co., Inc. | | | 10,824,592 | |
| | 242,776 | | | AMN Healthcare Services, Inc. | | | 12,141,228 | |
| | | | | | | | |
| | | | | | | 22,965,820 | |
| | |
| Health Care Technology* – 0.8% | |
| | 3,431,342 | | | Allscripts Healthcare Solutions, Inc. | | | 36,783,986 | |
| | 366,573 | | | HMS Holdings Corp. | | | 12,632,106 | |
| | | | | | | | |
| | | | | | | 49,416,092 | |
| | |
| Hotels, Restaurants & Leisure – 2.0% | |
| | 112,561 | | | Belmond Ltd. Class A* | | | 2,797,141 | |
| | 563,458 | | | Boyd Gaming Corp. | | | 16,768,510 | |
| | 345,865 | | | Dine Brands Global, Inc. | | | 34,309,808 | |
| | 1,012,949 | | | Eldorado Resorts, Inc.* | | | 48,834,271 | |
| | 139,035 | | | Jack in the Box, Inc. | | | 11,197,879 | |
| | 345,935 | | | The Wendy’s Co. | | | 5,995,054 | |
| | | | | | | | |
| | | | | | | 119,902,663 | |
| | |
| Household Durables – 1.4% | |
| | 156,319 | | | Helen of Troy Ltd.* | | | 17,524,923 | |
| | 925,998 | | | KB Home | | | 21,122,014 | |
| | 637,413 | | | Meritage Homes Corp.* | | | 27,950,560 | |
| | 248,422 | | | Taylor Morrison Home Corp. Class A* | | | 4,166,037 | |
| | 289,818 | | | TopBuild Corp.* | | | 17,244,171 | |
| | | | | | | | |
| | | | | | | 88,007,705 | |
| | |
| Household Products* – 0.2% | |
| | 443,400 | | | Central Garden & Pet Co. Class A | | | 12,348,690 | |
| | |
| Insurance – 5.3% | |
| | 283,963 | | | AMERISAFE, Inc. | | | 17,920,905 | |
| | 1,828,932 | | | CNO Financial Group, Inc. | | | 31,146,712 | |
| | 137,553 | | | Enstar Group Ltd.* | | | 24,539,455 | |
| | 735,294 | | | James River Group Holdings Ltd. | | | 30,213,231 | |
| | 436,613 | | | Kemper Corp. | | | 36,282,540 | |
| | 584,771 | | | Kinsale Capital Group, Inc. | | | 39,039,312 | |
| | 265,155 | | | Primerica, Inc. | | | 33,154,981 | |
| | 532,227 | | | ProAssurance Corp. | | | 21,608,416 | |
| | 443,125 | | | RLI Corp. | | | 31,249,175 | |
| | 856,564 | | | Selective Insurance Group, Inc. | | | 56,498,962 | |
| | | | | | | | |
| | | | | | | 321,653,689 | |
| | |
| Interactive Media & Services* – 0.4% | |
| | 1,121,760 | | | Cars.com, Inc. | | | 26,406,230 | |
| | |
| | |
| 50 | | The accompanying notes are an integral part of these financial statements. |
GOLDMAN SACHS SMALL CAP VALUE FUND
| | | | | | | | |
| Shares | | | Description | | Value | |
|
| Common Stocks – (continued) | |
| Internet & Direct Marketing Retail* – 0.4% | |
| | 588,517 | | | Liberty Expedia Holdings, Inc. Class A | | $ | 26,071,303 | |
| | |
| IT Services* – 1.3% | |
| | 322,797 | | | CACI International, Inc. Class A | | | 58,832,981 | |
| | 382,158 | | | LiveRamp Holdings, Inc. | | | 20,540,993 | |
| | | | | | | | |
| | | | | | | 79,373,974 | |
| | |
| Life Sciences Tools & Services* – 0.8% | |
| | 358,379 | | | Cambrex Corp. | | | 14,815,388 | |
| | 813,111 | | | Syneos Health, Inc. | | | 33,963,646 | |
| | | | | | | | |
| | | | | | | 48,779,034 | |
| | |
| Machinery – 3.9% | |
| | 65,091 | | | Alamo Group, Inc. | | | 6,251,340 | |
| | 539,098 | | | CIRCOR International, Inc.* | | | 16,997,760 | |
| | 1,083,291 | | | Federal Signal Corp. | | | 26,627,293 | |
| | 485,441 | | | ITT, Inc. | | | 28,039,072 | |
| | 368,139 | | | Navistar International Corp.* | | | 14,125,493 | |
| | 176,578 | | | RBC Bearings, Inc.* | | | 24,747,407 | |
| | 1,859,401 | | | Rexnord Corp.* | | | 49,590,225 | |
| | 68,457 | | | Tennant Co. | | | 4,326,482 | |
| | 1,200,837 | | | TriMas Corp.* | | | 38,823,060 | |
| | 339,913 | | | Watts Water Technologies, Inc. Class A | | | 27,376,593 | |
| | | | | | | | |
| | | | | | | 236,904,725 | |
| | |
| Media – 1.7% | |
| | 524,670 | | | Gray Television, Inc.* | | | 11,495,520 | |
| | 1,310,019 | | | Liberty Latin America Ltd. Class C* | | | 25,401,268 | |
| | 676,059 | | | MSG Networks, Inc. Class A* | | | 16,320,064 | |
| | 222,513 | | | Nexstar Media Group, Inc. Class A | | | 21,746,196 | |
| | 2,107,676 | | | TEGNA, Inc. | | | 27,758,093 | |
| | | | | | | | |
| | | | | | | 102,721,141 | |
| | |
| Metals & Mining – 1.9% | |
| | 1,763,815 | | | Allegheny Technologies, Inc.* | | | 50,498,024 | |
| | 132,215 | | | Carpenter Technology Corp. | | | 6,206,172 | |
| | 1,869,721 | | | Cleveland-Cliffs, Inc.(a) | | | 20,735,206 | |
| | 368,111 | | | Commercial Metals Co. | | | 6,092,237 | |
| | 1,855,131 | | | Constellium NV Class A* | | | 17,549,539 | |
| | 156,527 | | | Royal Gold, Inc. | | | 13,838,552 | |
| | | | | | | | |
| | | | | | | 114,919,730 | |
| | |
| Mortgage Real Estate Investment Trusts (REITs) – 2.3% | |
| | 577,091 | | | Blackstone Mortgage Trust, Inc. Class A | | | 19,898,098 | |
| | 1,086,435 | | | Granite Point Mortgage Trust, Inc. | | | 20,663,994 | |
| | 5,575,678 | | | MFA Financial, Inc. | | | 40,535,179 | |
| | 1,117,531 | | | PennyMac Mortgage Investment Trust | | | 22,775,282 | |
| | 2,552,564 | | | Two Harbors Investment Corp. | | | 35,404,062 | |
| | | | | | | | |
| | | | | | | 139,276,615 | |
| | |
| Multiline Retail – 0.1% | |
| | 232,307 | | | Big Lots, Inc. | | | 7,324,640 | |
| | |
|
| Common Stocks – (continued) | |
| Oil, Gas & Consumable Fuels – 4.0% | |
| | 4,320,944 | | | Callon Petroleum Co.* | | | 33,055,222 | |
| | 1,029,828 | | | Centennial Resource Development, Inc. Class A* | | | 9,340,540 | |
| | 248,230 | | | Delek US Holdings, Inc. | | | 8,782,377 | |
| | 1,840,217 | | | Falcon Minerals Corp. | | | 14,261,682 | |
| | 1,740,753 | | | Golar LNG Ltd. | | | 35,929,142 | |
| | 764,440 | | | Matador Resources Co.* | | | 14,218,584 | |
| | 266,408 | | | PBF Energy, Inc. Class A | | | 8,277,297 | |
| | 451,258 | | | PDC Energy, Inc.* | | | 16,728,134 | |
| | 897,375 | | | SM Energy Co. | | | 14,663,107 | |
| | 1,412,712 | | | Viper Energy Partners LP | | | 46,492,352 | |
| | 3,416,880 | | | WPX Energy, Inc.* | | | 42,164,299 | |
| | | | | | | | |
| | | | | | | 243,912,736 | |
| | |
| Personal Products* – 0.2% | |
| | 268,913 | | | Edgewell Personal Care Co. | | | 11,928,981 | |
| | |
| Pharmaceuticals* – 0.3% | |
| | 835,130 | | | Mallinckrodt PLC | | | 20,844,845 | |
| | |
| Professional Services* – 0.4% | |
| | 368,542 | | | ASGN, Inc. | | | 23,737,790 | |
| | |
| Real Estate Management & Development – 0.5% | |
| | 1,625,794 | | | Kennedy-Wilson Holdings, Inc. | | | 33,783,999 | |
| | |
| Road & Rail* – 0.3% | |
| | 316,825 | | | Saia, Inc. | | | 20,961,142 | |
| | |
| Semiconductors & Semiconductor Equipment – 3.1% | |
| | 964,106 | | | Cree, Inc.* | | | 52,457,007 | |
| | 1,069,632 | | | Entegris, Inc. | | | 37,790,098 | |
| | 1,764,522 | | | Lattice Semiconductor Corp.* | | | 20,821,360 | |
| | 180,734 | | | MKS Instruments, Inc. | | | 14,977,427 | |
| | 467,598 | | | Semtech Corp.* | | | 25,736,594 | |
| | 238,897 | | | Silicon Laboratories, Inc.* | | | 19,355,435 | |
| | 372,909 | | | Synaptics, Inc.* | | | 15,613,700 | |
| | | | | | | | |
| | | | | | | 186,751,621 | |
| | |
| Software* – 2.1% | |
| | 663,703 | | | CommVault Systems, Inc. | | | 44,726,945 | |
| | 598,397 | | | Cornerstone OnDemand, Inc. | | | 33,809,431 | |
| | 887,588 | | | Verint Systems, Inc. | | | 47,264,061 | |
| | | | | | | | |
| | | | | | | 125,800,437 | |
| | |
| Specialty Retail – 2.8% | |
| | 679,159 | | | Aaron’s, Inc. | | | 36,871,542 | |
| | 160,185 | | | Abercrombie & Fitch Co. Class A | | | 3,516,061 | |
| | 290,547 | | | Asbury Automotive Group, Inc.* | | | 20,858,369 | |
| | 182,043 | | | At Home Group, Inc.*(a) | | | 4,456,413 | |
| | 92,136 | | | Bed Bath & Beyond, Inc. | | | 1,541,435 | |
| | 290,538 | | | Burlington Stores, Inc.* | | | 49,315,920 | |
| | 96,849 | | | Caleres, Inc. | | | 3,012,004 | |
| | 715,767 | | | DSW, Inc. Class A | | | 21,193,861 | |
| | 314,789 | | | Guess?, Inc. | | | 7,048,126 | |
| | 751,350 | | | Sally Beauty Holdings, Inc.* | | | 13,576,895 | |
| | 258,782 | | | Shoe Carnival, Inc. | | | 9,869,945 | |
| | 86,657 | | | Signet Jewelers Ltd. | | | 2,435,928 | |
| | | | | | | | |
| | | | | | | 173,696,499 | |
| | |
| | |
| The accompanying notes are an integral part of these financial statements. | | 51 |
GOLDMAN SACHS SMALL CAP VALUE FUND
Schedule of Investments(continued)
February 28, 2019 (Unaudited)
| | | | | | | | |
| Shares | | | Description | | Value | |
|
| Common Stocks – (continued) | |
| Textiles, Apparel & Luxury Goods – 0.7% | |
| | 208,047 | | | Columbia Sportswear Co. | | $ | 21,418,439 | |
| | 325,545 | | | G-III Apparel Group Ltd.* | | | 11,592,657 | |
| | 280,480 | | | Wolverine World Wide, Inc. | | | 10,029,965 | |
| | | | | | | | |
| | | | | | | 43,041,061 | |
| | |
| Thrifts & Mortgage Finance – 2.5% | |
| | 4,235,113 | | | MGIC Investment Corp.* | | | 54,971,766 | |
| | 1,304,564 | | | OceanFirst Financial Corp. | | | 32,875,013 | |
| | 1,076,222 | | | Provident Financial Services, Inc. | | | 29,542,294 | |
| | 1,153,947 | | | Washington Federal, Inc. | | | 35,403,094 | |
| | | | | | | | |
| | | | | | | 152,792,167 | |
| | |
| Trading Companies & Distributors – 1.9% | |
| | 978,098 | | | Beacon Roofing Supply, Inc.* | | | 35,475,614 | |
| | 984,973 | | | Foundation Building Materials, Inc.* | | | 10,952,900 | |
| | 700,560 | | | H&E Equipment Services, Inc. | | | 20,169,122 | |
| | 378,101 | | | Kaman Corp. | | | 23,283,460 | |
| | 1,119,638 | | | Univar, Inc.* | | | 25,315,015 | |
| | | | | | | | |
| | | | | | | 115,196,111 | |
| | |
| | TOTAL COMMON STOCKS | | | | |
| | (Cost $4,804,168,829) | | $ | 5,979,280,256 | |
| | |
| | | | | | | | |
|
| Exchange Traded Funds – 0.3% | |
| | 147,752 | | | iShares Russell 2000 Value ETF | | $ | 18,309,428 | |
| | (Cost $16,877,797) | | | | |
| | |
| TOTAL INVESTMENTS BEFORE
SECURITIES LENDING REINVESTMENT
VEHICLE | | | | |
| | (Cost $4,821,046,626) | | $ | 5,997,589,684 | |
| | |
| | |
| Shares | | | Dividend
Rate | | Value | |
|
| Securities Lending Reinvestment Vehicle(b) – 0.2% | |
| Goldman Sachs Financial Square Government Fund –
Institutional Shares |
|
| | 10,496,150 | | | 2.395% | | $ | 10,496,150 | |
| | (Cost $10,496,150) | | | | |
| | |
| | TOTAL INVESTMENTS – 98.5% | | | | |
| | (Cost $4,831,542,776) | | $ | 6,008,085,834 | |
| | |
| OTHER ASSETS IN EXCESS OF
LIABILITIES – 1.5% | | | 88,925,749 | |
| | |
| | NET ASSETS – 100.0% | | $ | 6,097,011,583 | |
| | |
| | |
|
| The percentage shown for each investment category reflects the value of investments in that category as a percentage of net assets. |
| |
* | | Non-income producing security. |
| |
(a) | | All or a portion of security is on loan. |
| |
(b) | | Represents an affiliated fund. |
| | |
|
Investment Abbreviations: |
ETF | | —Exchange Traded Fund |
LP | | —Limited Partnership |
PLC | | —Public Limited Company |
|
| | |
| 52 | | The accompanying notes are an integral part of these financial statements. |
GOLDMAN SACHS SMALL/MID CAP VALUE FUND
Schedule of Investments
February 28, 2019 (Unaudited)
| | | | | | | | |
Shares | | | Description | | Value | |
|
| Common Stocks – 96.3% | |
| Aerospace & Defense – 1.3% | |
| | 7,411 | | | Curtiss-Wright Corp. | | $ | 913,702 | |
| | 1,789 | | | Esterline Technologies Corp.* | | | 217,811 | |
| | 6,093 | | | Hexcel Corp. | | | 439,549 | |
| | | | | | | | |
| | | | | | | 1,571,062 | |
| | |
| Air Freight & Logistics* – 0.4% | |
| | 18,275 | | | Air Transport Services Group, Inc. | | | 425,259 | |
| | 499 | | | XPO Logistics, Inc. | | | 25,125 | |
| | | | | | | | |
| | | | | | | 450,384 | |
| | |
| Airlines – 1.1% | |
| | 14,847 | | | SkyWest, Inc. | | | 802,332 | |
| | 8,837 | | | Spirit Airlines, Inc.* | | | 497,081 | |
| | | | | | | | |
| | | | | | | 1,299,413 | |
| | |
| Auto Components – 0.2% | |
| | 5,968 | | | BorgWarner, Inc. | | | 242,360 | |
| | |
| Banks – 11.9% | |
| | 6,877 | | | Bank of Hawaii Corp. | | | 565,496 | |
| | 11,330 | | | BOK Financial Corp. | | | 1,024,685 | |
| | 10,514 | | | Chemical Financial Corp. | | | 481,857 | |
| | 19,774 | | | Commerce Bancshares, Inc. | | | 1,244,378 | |
| | 9,931 | | | Cullen/Frost Bankers, Inc. | | | 1,029,646 | |
| | 19,453 | | | East West Bancorp, Inc. | | | 1,062,328 | |
| | 17,886 | | | Glacier Bancorp, Inc. | | | 783,764 | |
| | 21,270 | | | PacWest Bancorp | | | 872,495 | |
| | 19,027 | | | Pinnacle Financial Partners, Inc. | | | 1,116,695 | |
| | 10,013 | | | Prosperity Bancshares, Inc. | | | 745,468 | |
| | 6,971 | | | Signature Bank | | | 946,383 | |
| | 6,015 | | | South State Corp. | | | 427,306 | |
| | 30,453 | | | Synovus Financial Corp. | | | 1,208,375 | |
| | 4,169 | | | Texas Capital Bancshares, Inc.* | | | 254,434 | |
| | 46,418 | | | Umpqua Holdings Corp. | | | 843,879 | |
| | 15,036 | | | Webster Financial Corp. | | | 863,367 | |
| | 13,227 | | | Wintrust Financial Corp. | | | 974,433 | |
| | | | | | | | |
| | | | | | | 14,444,989 | |
| | |
| Building Products – 0.8% | |
| | 4,316 | | | Armstrong World Industries, Inc. | | | 315,845 | |
| | 4,062 | | | Fortune Brands Home & Security, Inc. | | | 191,402 | |
| | 1,853 | | | Lennox International, Inc. | | | 454,448 | |
| | | | | | | | |
| | | | | | | 961,695 | |
| | |
| Capital Markets – 1.0% | |
| | 11,321 | | | BrightSphere Investment Group PLC | | | 160,192 | |
| | 6,128 | | | E*TRADE Financial Corp. | | | 300,211 | |
| | 10,368 | | | Stifel Financial Corp. | | | 564,330 | |
| | 8,298 | | | Virtu Financial, Inc. Class A | | | 208,612 | |
| | | | | | | | |
| | | | | | | 1,233,345 | |
| | |
| Chemicals – 3.2% | |
| | 15,528 | | | Ashland Global Holdings, Inc. | | | 1,201,557 | |
| | 3,777 | | | Celanese Corp. | | | 386,349 | |
| | 3,816 | | | CF Industries Holdings, Inc. | | | 161,035 | |
| | 10,779 | | | H.B. Fuller Co. | | | 544,124 | |
| | 7,396 | | | Huntsman Corp. | | | 183,347 | |
| | |
|
| Common Stocks – (continued) | |
| Chemicals – (continued) | |
| | 6,253 | | | Ingevity Corp.* | | | 720,471 | |
| | 6,714 | | | Methanex Corp. | | | 378,669 | |
| | 4,004 | | | W.R. Grace & Co. | | | 310,991 | |
| | | | | | | | |
| | | | | | | 3,886,543 | |
| | |
| Communications Equipment* – 1.4% | |
| | 10,054 | | | Ciena Corp. | | | 428,904 | |
| | 19,595 | | | NetScout Systems, Inc. | | | 536,315 | |
| | 56,402 | | | Viavi Solutions, Inc. | | | 740,558 | |
| | | | | | | | |
| | | | | | | 1,705,777 | |
| | |
| Construction & Engineering – 1.8% | |
| | 14,893 | | | AECOM* | | | 461,087 | |
| | 9,122 | | | Arcosa, Inc. | | | 305,496 | |
| | 13,077 | | | Jacobs Engineering Group, Inc. | | | 964,821 | |
| | 3,278 | | | Valmont Industries, Inc. | | | 447,742 | |
| | | | | | | | |
| | | | | | | 2,179,146 | |
| | |
| Construction Materials – 0.4% | |
| | 4,620 | | | Vulcan Materials Co. | | | 514,945 | |
| | |
| Containers & Packaging – 0.9% | |
| | 3,419 | | | Avery Dennison Corp. | | | 369,389 | |
| | 10,531 | | | Berry Global Group, Inc.* | | | 552,561 | |
| | 16,987 | | | Graphic Packaging Holding Co. | | | 206,902 | |
| | | | | | | | |
| | | | | | | 1,128,852 | |
| | |
| Diversified Consumer Services – 0.8% | |
| | 4,490 | | | Bright Horizons Family Solutions, Inc.* | | | 556,760 | |
| | 3,333 | | | Strategic Education, Inc. | | | 435,890 | |
| | | | | | | | |
| | | | | | | 992,650 | |
| | |
| Diversified Financial Services – 0.8% | |
| | 19,649 | | | Voya Financial, Inc. | | | 993,650 | |
| | |
| Electric Utilities – 4.0% | |
| | 16,068 | | | ALLETE, Inc. | | | 1,302,311 | |
| | 32,676 | | | Alliant Energy Corp. | | | 1,498,848 | |
| | 7,376 | | | IDACORP, Inc. | | | 725,872 | |
| | 13,756 | | | Pinnacle West Capital Corp. | | | 1,289,488 | |
| | | | | | | | |
| | | | | | | 4,816,519 | |
| | |
| Electrical Equipment – 1.9% | |
| | 7,626 | | | Hubbell, Inc. | | | 900,249 | |
| | 29,716 | | | nVent Electric PLC | | | 816,596 | |
| | 12,189 | | | Sensata Technologies Holding PLC* | | | 618,348 | |
| | | | | | | | |
| | | | | | | 2,335,193 | |
| | |
| Electronic Equipment, Instruments & Components* – 1.5% | |
| | 11,347 | | | Keysight Technologies, Inc. | | | 957,800 | |
| | 21,840 | | | Trimble, Inc. | | | 873,819 | |
| | | | | | | | |
| | | | | | | 1,831,619 | |
| | |
| Energy Equipment & Services* – 1.2% | |
| | 22,411 | | | Apergy Corp. | | | 940,814 | |
| | 13,494 | | | Cactus, Inc. Class A | | | 489,292 | |
| | | | | | | | |
| | | | | | | 1,430,106 | |
| | |
| | |
| The accompanying notes are an integral part of these financial statements. | | 53 |
GOLDMAN SACHS SMALL/MID CAP VALUE FUND
Schedule of Investments(continued)
February 28, 2019 (Unaudited)
| | | | | | | | |
Shares | | | Description | | Value | |
|
| Common Stocks – (continued) | |
| Entertainment – 1.0% | |
| | 17,225 | | | Live Nation Entertainment, Inc.* | | $ | 974,246 | |
| | 3,365 | | | World Wrestling Entertainment, Inc. Class A | | | 281,650 | |
| | | | | | | | |
| | | | | | | 1,255,896 | |
| | |
| Equity Real Estate Investment Trusts (REITs) – 14.0% | |
| | 10,945 | | | Acadia Realty Trust | | | 311,823 | |
| | 16,139 | | | Camden Property Trust | | | 1,583,074 | |
| | 45,179 | | | Columbia Property Trust, Inc. | | | 977,222 | |
| | 12,317 | | | CyrusOne, Inc. | | | 613,879 | |
| | 31,102 | | | Duke Realty Corp. | | | 919,686 | |
| | 67,554 | | | Empire State Realty Trust, Inc. Class A | | | 1,028,172 | |
| | 16,177 | | | Equity LifeStyle Properties, Inc. | | | 1,757,469 | |
| | 11,794 | | | Federal Realty Investment Trust | | | 1,575,560 | |
| | 34,348 | | | Healthcare Realty Trust, Inc. | | | 1,087,114 | |
| | 10,832 | | | Highwoods Properties, Inc. | | | 501,630 | |
| | 21,946 | | | Hudson Pacific Properties, Inc. | | | 729,046 | |
| | 3,955 | | | Life Storage, Inc. | | | 386,008 | |
| | 8,231 | | | Mid-America Apartment Communities, Inc. | | | 852,567 | |
| | 13,219 | | | National Health Investors, Inc. | | | 1,031,479 | |
| | 39,051 | | | Pebblebrook Hotel Trust | | | 1,250,023 | |
| | 5,451 | | | PS Business Parks, Inc. | | | 802,224 | |
| | 55,370 | | | RLJ Lodging Trust | | | 1,028,221 | |
| | 48,136 | | | SITE Centers Corp. | | | 642,616 | |
| | | | | | | | |
| | | | | | | 17,077,813 | |
| | |
| Food & Staples Retailing – 1.0% | |
| | 2,246 | | | Casey’s General Stores, Inc. | | | 302,626 | |
| | 24,398 | | | US Foods Holding Corp.* | | | 859,786 | |
| | | | | | | | |
| | | | | | | 1,162,412 | |
| | |
| Food Products – 2.4% | |
| | 2,437 | | | B&G Foods, Inc.(a) | | | 59,999 | |
| | 1,926 | | | Ingredion, Inc. | | | 178,059 | |
| | 1,492 | | | J&J Snack Foods Corp. | | | 231,678 | |
| | 8,876 | | | Lamb Weston Holdings, Inc. | | | 615,195 | |
| | 22,803 | | | Nomad Foods Ltd.* | | | 458,340 | |
| | 12,061 | | | Post Holdings, Inc.* | | | 1,228,775 | |
| | 1,590 | | | TreeHouse Foods, Inc.* | | | 96,322 | |
| | | | | | | | |
| | | | | | | 2,868,368 | |
| | |
| Gas Utilities – 1.7% | |
| | 14,680 | | | Atmos Energy Corp. | | | 1,451,118 | |
| | 10,975 | | | New Jersey Resources Corp. | | | 531,190 | |
| | 2,265 | | | South Jersey Industries, Inc. | | | 65,572 | |
| | | | | | | | |
| | | | | | | 2,047,880 | |
| | |
| Health Care Equipment & Supplies – 2.6% | |
| | 9,869 | | | Avanos Medical, Inc.* | | | 464,633 | |
| | 5,526 | | | Hill-Rom Holdings, Inc. | | | 586,032 | |
| | 4,584 | | | STERIS PLC | | | 554,481 | |
| | 3,813 | | | The Cooper Cos., Inc. | | | 1,090,480 | |
| | 4,454 | | | West Pharmaceutical Services, Inc. | | | 466,556 | |
| | | | | | | | |
| | | | | | | 3,162,182 | |
| | |
|
| Common Stocks – (continued) | |
| Health Care Providers & Services* – 0.4% | |
| | 10,083 | | | Acadia Healthcare Co., Inc. | | | 265,082 | |
| | 8,623 | | | MEDNAX, Inc. | | | 283,783 | |
| | | | | | | | |
| | | | | | | 548,865 | |
| | |
| Health Care Technology* – 0.4% | |
| | 44,143 | | | Allscripts Healthcare Solutions, Inc. | | | 473,213 | |
| | |
| Hotels, Restaurants & Leisure – 2.4% | |
| | 5,788 | | | Aramark | | | 175,376 | |
| | 11,752 | | | Boyd Gaming Corp. | | | 349,740 | |
| | 2,679 | | | Caesars Entertainment Corp.* | | | 23,093 | |
| | 5,633 | | | Dine Brands Global, Inc. | | | 558,794 | |
| | 19,624 | | | Eldorado Resorts, Inc.* | | | 946,073 | |
| | 1,070 | | | Jack in the Box, Inc. | | | 86,178 | |
| | 6,837 | | | The Wendy’s Co. | | | 118,485 | |
| | 2,929 | | | Vail Resorts, Inc. | | | 610,374 | |
| | | | | | | | |
| | | | | | | 2,868,113 | |
| | |
| Household Durables – 1.2% | |
| | 2,026 | | | Helen of Troy Ltd.* | | | 227,135 | |
| | 22,141 | | | Lennar Corp. Class A | | | 1,062,325 | |
| | 45 | | | NVR, Inc.* | | | 117,900 | |
| | | | | | | | |
| | | | | | | 1,407,360 | |
| | |
| Industrial Conglomerates – 0.6% | |
| | 6,234 | | | Carlisle Cos., Inc. | | | 767,281 | |
| | |
| Insurance – 6.2% | |
| | 11,722 | | | American Financial Group, Inc. | | | 1,168,214 | |
| | 22,978 | | | Brown & Brown, Inc. | | | 680,608 | |
| | 23,267 | | | CNO Financial Group, Inc. | | | 396,237 | |
| | 6,878 | | | Kemper Corp. | | | 571,562 | |
| | 5,024 | | | Primerica, Inc. | | | 628,201 | |
| | 10,440 | | | ProAssurance Corp. | | | 423,864 | |
| | 5,640 | | | Reinsurance Group of America, Inc. | | | 814,924 | |
| | 7,142 | | | The Hanover Insurance Group, Inc. | | | 847,827 | |
| | 10,960 | | | Torchmark Corp. | | | 904,857 | |
| | 13,754 | | | W.R. Berkley Corp. | | | 1,150,660 | |
| | | | | | | | |
| | | | | | | 7,586,954 | |
| | |
| Internet & Direct Marketing Retail* – 0.3% | |
| | 9,252 | | | Liberty Expedia Holdings, Inc. Class A | | | 409,864 | |
| | |
| IT Services – 1.9% | |
| | 9,514 | | | Booz Allen Hamilton Holding Corp. | | | 502,910 | |
| | 5,432 | | | CACI International, Inc. Class A* | | | 990,036 | |
| | 12,293 | | | Leidos Holdings, Inc. | | | 794,005 | |
| | | | | | | | |
| | | | | | | 2,286,951 | |
| | |
| Leisure Products – 0.3% | |
| | 7,026 | | | Brunswick Corp. | | | 370,551 | |
| | |
| Life Sciences Tools & Services – 1.7% | |
| | 8,017 | | | PerkinElmer, Inc. | | | 754,881 | |
| | 20,652 | | | QIAGEN NV* | | | 793,656 | |
| | 11,580 | | | Syneos Health, Inc.* | | | 483,697 | |
| | | | | | | | |
| | | | | | | 2,032,234 | |
| | |
| | |
| 54 | | The accompanying notes are an integral part of these financial statements. |
GOLDMAN SACHS SMALL/MID CAP VALUE FUND
| | | | | | | | |
Shares | | | Description | | Value | |
|
| Common Stocks – (continued) | |
| Machinery – 2.8% | |
| | 14,288 | | | Gardner Denver Holdings, Inc.* | | $ | 383,633 | |
| | 15,570 | | | ITT, Inc. | | | 899,323 | |
| | 22,909 | | | Rexnord Corp.* | | | 610,983 | |
| | 21,592 | | | The Timken Co. | | | 936,877 | |
| | 27,365 | | | Trinity Industries, Inc. | | | 640,614 | |
| | | | | | | | |
| | | | | | | 3,471,430 | |
| | |
| Media – 0.9% | |
| | 5,240 | | | GCI Liberty, Inc. Class A* | | | 280,550 | |
| | 4,435 | | | Nexstar Media Group, Inc. Class A | | | 433,433 | |
| | 32,897 | | | TEGNA, Inc. | | | 433,253 | |
| | | | | | | | |
| | | | | | | 1,147,236 | |
| | |
| Metals & Mining – 1.5% | |
| | 28,973 | | | Allegheny Technologies, Inc.* | | | 829,497 | |
| | 4,404 | | | Royal Gold, Inc. | | | 389,358 | |
| | 17,920 | | | Steel Dynamics, Inc. | | | 668,774 | |
| | | | | | | | |
| | | | | | | 1,887,629 | |
| | |
| Mortgage Real Estate Investment Trusts (REITs) – 1.9% | |
| | 137,103 | | | MFA Financial, Inc. | | | 996,739 | |
| | 16,496 | | | PennyMac Mortgage Investment Trust | | | 336,188 | |
| | 69,086 | | | Two Harbors Investment Corp. | | | 958,223 | |
| | | | | | | | |
| | | | | | | 2,291,150 | |
| | |
| Multiline Retail – 0.1% | |
| | 2,530 | | | Kohl’s Corp. | | | 170,851 | |
| | |
| Oil, Gas & Consumable Fuels – 3.6% | |
| | 9,804 | | | Diamondback Energy, Inc. | | | 1,009,126 | |
| | 10,640 | | | HollyFrontier Corp. | | | 544,768 | |
| | 34,872 | | | Parsley Energy, Inc. Class A* | | | 632,578 | |
| | 11,820 | | | SM Energy Co. | | | 193,139 | |
| | 27,792 | | | Viper Energy Partners LP | | | 914,635 | |
| | 88,237 | | | WPX Energy, Inc.* | | | 1,088,844 | |
| | | | | | | | |
| | | | | | | 4,383,090 | |
| | |
| Pharmaceuticals* – 0.8% | |
| | 22,187 | | | Catalent, Inc. | | | 958,922 | |
| | |
| Professional Services* – 0.4% | |
| | 6,939 | | | ASGN, Inc. | | | 446,941 | |
| | |
| Real Estate Management & Development – 0.9% | |
| | 38,908 | | | Cushman & Wakefield PLC* | | | 713,184 | |
| | 16,104 | | | Kennedy-Wilson Holdings, Inc. | | | 334,641 | |
| | | | | | | | |
| | | | | | | 1,047,825 | |
| | |
| Road & Rail – 0.9% | |
| | 2,209 | | | Landstar System, Inc. | | | 240,074 | |
| | 5,782 | | | Old Dominion Freight Line, Inc. | | | 871,752 | |
| | | | | | | | |
| | | | | | | 1,111,826 | |
| | |
| Semiconductors & Semiconductor Equipment – 2.5% | |
| | 46,319 | | | Cypress Semiconductor Corp. | | | 714,702 | |
| | 19,563 | | | Entegris, Inc. | | | 691,161 | |
| | 51,808 | | | Marvell Technology Group Ltd. | | | 1,033,570 | |
| | |
|
| Common Stocks – (continued) | |
| Semiconductors & Semiconductor Equipment – (continued) | |
| | 14,858 | | | Teradyne, Inc. | | | 606,652 | |
| | | | | | | | |
| | | | | | | 3,046,085 | |
| | |
| Software* – 3.2% | |
| | 12,593 | | | CommVault Systems, Inc. | | | 848,642 | |
| | 10,602 | | | Cornerstone OnDemand, Inc. | | | 599,013 | |
| | 55,904 | | | Nuance Communications, Inc. | | | 937,510 | |
| | 4,170 | | | PTC, Inc. | | | 387,060 | |
| | 14,061 | | | Teradata Corp. | | | 680,131 | |
| | 8,153 | | | Verint Systems, Inc. | | | 434,147 | |
| | | | | | | | |
| | | | | | | 3,886,503 | |
| | |
| Specialty Retail – 1.9% | |
| | 4,431 | | | Asbury Automotive Group, Inc.* | | | 318,101 | |
| | 7,334 | | | Burlington Stores, Inc.* | | | 1,244,873 | |
| | 2,009 | | | Five Below, Inc.* | | | 241,783 | |
| | 9,376 | | | Foot Locker, Inc. | | | 558,060 | |
| | | | | | | | |
| | | | | | | 2,362,817 | |
| | |
| Textiles, Apparel & Luxury Goods – 0.6% | |
| | 6,361 | | | PVH Corp. | | | 730,497 | |
| | |
| Thrifts & Mortgage Finance – 0.6% | |
| | 23,800 | | | MGIC Investment Corp.* | | | 308,924 | |
| | 14,252 | | | Washington Federal, Inc. | | | 437,251 | |
| | | | | | | | |
| | | | | | | 746,175 | |
| | |
| Trading Companies & Distributors* – 1.0% | |
| | 14,146 | | | Beacon Roofing Supply, Inc. | | | 513,076 | |
| | 914 | | | United Rentals, Inc. | | | 123,015 | |
| | 25,797 | | | Univar, Inc. | | | 583,270 | |
| | | | | | | | |
| | | | | | | 1,219,361 | |
| | |
| TOTAL COMMON STOCKS
(Cost $109,131,979) | | $ | 117,252,523 | |
| | |
| | | | | | | | |
| Shares | | | Dividend
Rate | | Value | |
|
| Investment Company(b) – 2.3% | |
| Goldman Sachs Financial Square Government Fund –
Institutional Shares |
|
| | 2,789,394 | | | 2.395% | | $ | 2,789,394 | |
| | (Cost $2,789,394) | | | | |
| | |
| TOTAL INVESTMENTS BEFORE SECURITIES LENDING
REINVESTMENT VEHICLE |
|
| | (Cost $111,921,373) | | $ | 120,041,917 | |
| | |
| | |
| | |
| The accompanying notes are an integral part of these financial statements. | | 55 |
GOLDMAN SACHS SMALL/MID CAP VALUE FUND
Schedule of Investments(continued)
February 28, 2019 (Unaudited)
| | | | | | | | |
| Shares | | | Dividend
Rate | | Value | |
|
| Securities Lending Reinvestment Vehicle(b) – 0.1% | |
| Goldman Sachs Financial Square Government Fund –
Institutional Shares |
|
| | 118,050 | | | 2.395% | | $ | 118,050 | |
| | (Cost $118,050) | | | | |
| | |
| | TOTAL INVESTMENTS – 98.7% | | | | |
| | (Cost $112,039,423) | | $ | 120,159,967 | |
| | |
| OTHER ASSETS IN EXCESS OF
LIABILITIES – 1.3% | | | 1,580,134 | |
| | |
| | NET ASSETS – 100.0% | | $ | 121,740,101 | |
| | |
| | |
|
| The percentage shown for each investment category reflects the value of investments in that category as a percentage of net assets. |
| |
* | | Non-income producing security. |
| |
(a) | | All or a portion of security is on loan. |
| |
(b) | | Represents an affiliated fund. |
| | |
|
Investment Abbreviations: |
LP | | —Limited Partnership |
PLC | | —Public Limited Company |
|
| | |
| 56 | | The accompanying notes are an integral part of these financial statements. |
GOLDMAN SACHS FUNDAMENTAL EQUITY VALUE FUNDS
Statements of Assets and Liabilities
February 28, 2019 (Unaudited)
| | | | | | | | | | | | | | |
| | | | | Equity
Income Fund | | | Focused
Value Fund | | | Large Cap
Value Fund | |
| | Assets: | |
| | Investments of unaffiliated issuers, at value (cost $320,934,328, $4,206,541 and $424,170,686) | | $ | 356,552,689 | | | $ | 4,374,208 | | | $ | 480,810,041 | |
| | Investments of affiliated issuers, at value (cost $0, $0 and $5,281,073) | | | — | | | | — | | | | 5,281,073 | |
| | Cash | | | 1,903,591 | | | | 70,623 | | | | 7,497,566 | |
| | Receivables: | |
| | Dividends | | | 1,263,622 | | | | 11,854 | | | | 1,126,204 | |
| | Foreign tax reclaims | | | 36,099 | | | | 194 | | | | 53,159 | |
| | Reimbursement from investment adviser | | | 27,776 | | | | 23,410 | | | | 34,837 | |
| | Fund shares sold | | | 11,464 | | | | — | | | | 25,932 | |
| | Other assets | | | 67,643 | | | | 51,702 | | | | 102,529 | |
| | Total assets | | | 359,862,884 | | | | 4,531,991 | | | | 494,931,341 | |
| | | | | | | | | | | | | | |
| | Liabilities: | |
| | Payables: | |
| | Fund shares redeemed | | | 206,828 | | | | — | | | | 523,332 | |
| | Management fees | | | 187,109 | | | | 2,333 | | | | 277,445 | |
| | Distribution and Service fees and Transfer Agency fees | | | 101,138 | | | | 156 | | | | 56,623 | |
| | Investments purchased | | | — | | | | — | | | | 875 | |
| | Accrued expenses | | | 181,696 | | | | 75,865 | | | | 130,920 | |
| | Total liabilities | | | 676,771 | | | | 78,354 | | | | 989,195 | |
| | | | | | | | | | | | | | |
| | Net Assets: | |
| | Paid-in capital | | | 322,221,921 | | | | 4,297,568 | | | | 440,387,149 | |
| | Total distributable earnings | | | 36,964,192 | | | | 156,069 | | | | 53,554,997 | |
| | | NET ASSETS | | $ | 359,186,113 | | | $ | 4,453,637 | | | $ | 493,942,146 | |
| | | Net Assets: | |
| | | Class A | | $ | 311,004,077 | | | $ | 50,745 | | | $ | 89,757,522 | |
| | | Class C | | | 8,771,859 | | | | 29,124 | | | | 23,556,426 | |
| | | Institutional | | | 18,646,272 | | | | 646,851 | | | | 155,249,633 | |
| | | Service | | | 102,961 | | | | — | | | | 989,002 | |
| | | Investor | | | 2,604,688 | | | | 30,185 | | | | 5,618,874 | |
| | | Class P | | | 11,011,337 | | | | 3,636,723 | | | | 211,631,975 | |
| | | Class R | | | 1,454,710 | | | | 29,648 | | | | 5,152,869 | |
| | | Class R6 | | | 5,590,209 | | | | 30,361 | | | | 1,985,845 | |
| | | Total Net Assets | | $ | 359,186,113 | | | $ | 4,453,637 | | | $ | 493,942,146 | |
| | | Shares Outstanding $0.001 par value (unlimited number of shares authorized): | |
| | | Class A | | | 8,310,578 | | | | 4,955 | | | | 6,403,833 | |
| | | Class C | | | 245,851 | | | | 2,857 | | | | 1,770,961 | |
| | | Institutional | | | 489,741 | | | | 63,071 | | | | 10,974,072 | |
| | | Service | | | 2,742 | | | | — | | | | 70,800 | |
| | | Investor | | | 69,708 | | | | 2,950 | | | | 401,271 | |
| | | Class P | | | 289,252 | | | | 355,060 | | | | 14,620,060 | |
| | | Class R | | | 39,084 | | | | 2,903 | | | | 379,080 | |
| | | Class R6 | | | 146,815 | | | | 2,965 | | | | 137,172 | |
| | | Net asset value, offering and redemption price per share:(a) | |
| | | Class A | | | $37.42 | | | | $10.24 | | | | $14.02 | |
| | | Class C | | | 35.68 | | | | 10.20 | | | | 13.30 | |
| | | Institutional | | | 38.07 | | | | 10.26 | | | | 14.15 | |
| | | Service | | | 37.55 | | | | — | | | | 13.97 | |
| | | Investor | | | 37.37 | | | | 10.23 | | | | 14.00 | |
| | | Class P | | | 38.07 | | | | 10.24 | | | | 14.48 | |
| | | Class R | | | 37.22 | | | | 10.21 | | | | 13.59 | |
| | | Class R6 | | | 38.08 | | | | 10.24 | | | | 14.48 | |
| | (a) | | Maximum public offering price per share for Class A Shares of the Equity Income, Focused Value and Large Cap Value Funds is $39.60, $10.84 and $14.84 respectively. At redemption, Class C Shares may be subject to a contingent deferred sales charge, assessed on the amount equal to the lesser of the current net asset value (“NAV”) or the original purchase price of the shares. |
| | |
| The accompanying notes are an integral part of these financial statements. | | 57 |
GOLDMAN SACHS FUNDAMENTAL EQUITY VALUE FUNDS
Statements of Assets and Liabilities(continued)
February 28, 2019 (Unaudited)
| | | | | | | | | | | | | | |
| | | | | Mid Cap
Value Fund | | | Small Cap
Value Fund | | | Small/Mid Cap
Value Fund | |
| | Assets: | |
| | Investments of unaffiliated issuers, at value (cost $1,174,661,080, $4,821,046,626 and $109,131,979)(a) | | $ | 1,273,134,310 | | | $ | 5,997,589,684 | | | $ | 117,252,523 | |
| | Investments of affiliated issuers, at value (cost $0, $0 and $2,789,394) | | | — | | | | — | | | | 2,789,394 | |
| | Investments in securities lending reinvestment vehicle — affiliated issuer, at value (cost $0, $10,496,150 and $118,050) | | | — | | | | 10,496,150 | | | | 118,050 | |
| | Cash | | | 11,163,029 | | | | 83,701,072 | | | | 1,806,957 | |
| | Receivables: | |
| | Investments sold | | | 11,210,508 | | | | 38,456,118 | | | | 496,377 | |
| | Dividends | | | 1,010,875 | | | | 4,004,234 | | | | 114,970 | |
| | Reimbursement from investment adviser | | | — | | | | 79,383 | | | | 26,077 | |
| | Fund shares sold | | | 626,568 | | | | 4,959,690 | | | | 178,970 | |
| | Securities lending income | | | 52 | | | | 19,473 | | | | 381 | |
| | Other assets | | | 129,524 | | | | 166,888 | | | | 77,540 | |
| | Total assets | | | 1,297,274,866 | | | | 6,139,472,692 | | | | 122,861,239 | |
| | | | | | | | | | | | | | |
| | Liabilities: | |
| | Payables: | |
| | Investments purchased | | | 6,391,712 | | | | 19,480,499 | | | | 831,251 | |
| | Fund shares redeemed | | | 2,710,212 | | | | 7,426,360 | | | | 214 | |
| | Management fees | | | 738,368 | | | | 4,182,129 | | | | 73,197 | |
| | Distribution and Service fees and Transfer Agency fees | | | 248,106 | | | | 461,798 | | | | 4,620 | |
| | Payable upon return of securities loaned | | | — | | | | 10,496,150 | | | | 118,050 | |
| | Accrued expenses | | | 380,649 | | | | 414,173 | | | | 93,806 | |
| | Total liabilities | | | 10,469,047 | | | | 42,461,109 | | | | 1,121,138 | |
| | | | | | | | | | | | | | |
| | Net Assets: | |
| | Paid-in capital | | | 1,226,860,853 | | | | 4,995,109,114 | | | | 118,242,967 | |
| | Total distributable earnings | | | 59,944,966 | | | | 1,101,902,469 | | | | 3,497,134 | |
| | | NET ASSETS | | $ | 1,286,805,819 | | | $ | 6,097,011,583 | | | $ | 121,740,101 | |
| | | Net Assets: | |
| | | Class A | | $ | 542,911,884 | | | $ | 714,338,398 | | | $ | 1,545,089 | |
| | | Class C | | | 36,469,893 | | | | 13,379,998 | | | | 1,006,361 | |
| | | Institutional | | | 382,863,708 | | | | 3,404,216,830 | | | | 6,110,311 | |
| | | Service | | | 54,166,136 | | | | 85,001,516 | | | | — | |
| | | Investor | | | 43,118,699 | | | | 157,055,443 | | | | 3,356,119 | |
| | | Class P | | | 146,190,182 | | | | 262,553,525 | | | | 51,645,642 | |
| | | Class R | | | 23,845,395 | | | | 100,796,773 | | | | 199,338 | |
| | | Class R6 | | | 57,239,922 | | | | 1,359,669,100 | | | | 57,877,241 | |
| | | Total Net Assets | | $ | 1,286,805,819 | | | $ | 6,097,011,583 | | | $ | 121,740,101 | |
| | | Shares Outstanding $0.001 par value (unlimited number of shares authorized): | |
| | | Class A | | | 17,820,187 | | | | 14,477,244 | | | | 129,151 | |
| | | Class C | | | 1,371,784 | | | | 375,347 | | | | 86,160 | |
| | | Institutional | | | 12,426,834 | | | | 63,291,333 | | | | 504,161 | |
| | | Service | | | 1,819,045 | | | | 1,786,211 | | | | — | |
| | | Investor | | | 1,452,064 | | | | 3,211,656 | | | | 278,632 | |
| | | Class P | | | 4,749,110 | | | | 4,883,800 | | | | 4,266,945 | |
| | | Class R | | | 809,899 | | | | 2,095,644 | | | | 16,691 | |
| | | Class R6 | | | 1,859,080 | | | | 25,290,841 | | | | 4,780,956 | |
| | | Net asset value, offering and redemption price per share:(b) | |
| | | Class A | | | $30.47 | | | | $49.34 | | | | $11.96 | |
| | | Class C | | | 26.59 | | | | 35.65 | | | | 11.68 | |
| | | Institutional | | | 30.81 | | | | 53.79 | | | | 12.12 | |
| | | Service | | | 29.78 | | | | 47.59 | | | | — | |
| | | Investor | | | 29.69 | | | | 48.90 | | | | 12.04 | |
| | | Class P | | | 30.78 | | | | 53.76 | | | | 12.10 | |
| | | Class R | | | 29.44 | | | | 48.10 | | | | 11.94 | |
| | | Class R6 | | | 30.79 | | | | 53.76 | | | | 12.11 | |
| | (a) | | Includes loaned securities having a market value of $ 10,187,102 and $ 114,650 for the Small Cap Value and Small/Mid Cap Value Funds, respectively. |
| | (b) | | Maximum public offering price per share for Class A Shares of the Mid Cap Value, Small Cap Value and Small/Mid Cap Value Funds is $32.24, $52.21 and $12.66, respectively. At redemption, Class C Shares may be subject to a contingent deferred sales charge, assessed on the amount equal to the lesser of the current net asset value (“NAV”) or the original purchase price of the shares. |
| | |
| 58 | | The accompanying notes are an integral part of these financial statements. |
GOLDMAN SACHS FUNDAMENTAL EQUITY VALUE FUNDS
Statements of Operations
For the Six Months Ended February 28, 2019 (Unaudited)
| | | | | | | | | | | | | | |
| | | | | Equity
Income Fund | | | Focused
Value Fund | | | Large Cap
Value Fund | |
| | Investment income: | | | | | | | | | | | | |
| | | | |
| | Dividends — unaffiliated issuers (net of foreign withholding taxes of $25,343, $137 and $10,899) | | $ | 5,454,643 | | | $ | 51,442 | | | $ | 5,698,667 | |
| | | | |
| | Dividends — affiliated issuers | | | 420 | | | | 217 | | | | 18,509 | |
| | | | |
| | Securities lending income — affiliated issuer | | | 2,956 | | | | — | | | | — | |
| | | | |
| | Total investment income | | | 5,458,019 | | | | 51,659 | | | | 5,717,176 | |
| | | | | | | | | | | | | | |
| | Expenses: | | | | | | | | | | | | |
| | | | |
| | Management fees | | | 1,218,596 | | | | 17,493 | | | | 1,893,880 | |
| | | | |
| | Distribution and Service fees(a) | | | 432,608 | | | | 274 | | | | 247,511 | |
| | | | |
| | Transfer Agency fees(a) | | | 293,494 | | | | 896 | | | | 178,188 | |
| | | | |
| | Professional fees | | | 62,223 | | | | 50,250 | | | | 58,594 | |
| | | | |
| | Registration fees | | | 61,958 | | | | 55,228 | | | | 76,507 | |
| | | | |
| | Custody, accounting and administrative services | | | 39,696 | | | | 20,069 | | | | 47,863 | |
| | | | |
| | Printing and mailing costs | | | 30,476 | | | | 10,887 | | | | 33,166 | |
| | | | |
| | Trustee fees | | | 8,251 | | | | 7,927 | | | | 8,415 | |
| | | | |
| | Service Share fees — Service Plan | | | 127 | | | | — | | | | 1,299 | |
| | | | |
| | Service Share fees — Shareholder Administration Plan | | | 127 | | | | — | | | | 1,299 | |
| | | | |
| | Other | | | 8,790 | | | | 3,917 | | | | 9,412 | |
| | | | |
| | Total expenses | | | 2,156,346 | | | | 166,941 | | | | 2,556,134 | |
| | | | |
| | Less — expense reductions | | | (226,397 | ) | | | (148,202 | ) | | | (269,532 | ) |
| | | | |
| | Net expenses | | | 1,929,949 | | | | 18,739 | | | | 2,286,602 | |
| | | | |
| | NET INVESTMENT INCOME | | | 3,528,070 | | | | 32,920 | | | | 3,430,574 | |
| | | | | | | | | | | | | | |
| | Realized and unrealized gain (loss): | | | | |
| | | | |
| | Net realized gain from: | | | | | | | | | | | | |
| | | | |
| | Investments — unaffiliated issuers (including commission recapture of $0, $0 and $7,657) | | | 6,936,855 | | | | 187,015 | | | | 4,062,786 | |
| | | | |
| | Net change in unrealized loss on: | | | | | | | | | | | | |
| | | | |
| | Investments — unaffiliated issuers | | | (13,058,537 | ) | | | (375,660 | ) | | | (23,990,196 | ) |
| | | | |
| | Net realized and unrealized loss | | | (6,121,682 | ) | | | (188,645 | ) | | | (19,927,410 | ) |
| | | | |
| | NET DECREASE IN NET ASSETS RESULTING FROM OPERATIONS | | $ | (2,593,612 | ) | | $ | (155,725 | ) | | $ | (16,496,836 | ) |
| | (a) | | Class specific Distribution and/or Service and Transfer Agency fees were as follows: |
| | | | | | | | | | | | | | | | | | | | | | | | | | | | | | | | | | | | | | | | | | | | |
| | | Distribution and/or Service Fees | | | Transfer Agency Fees | |
Fund | | Class A | | | Class C | | | Class R | | | Class A | | | Class C | | | Institutional | | | Service | | | Investor | | | Class P | | | Class R | | | Class R6 | |
Equity Income | | $ | 382,270 | | | $ | 46,781 | | | $ | 3,557 | | | $ | 275,234 | | | $ | 8,421 | | | $ | 4,415 | | | $ | 20 | | | $ | 2,349 | | | $ | 1,568 | | | $ | 1,280 | | | $ | 207 | |
Focused Value | | | 61 | | | | 141 | | | | 72 | | | | 44 | | | | 25 | | | | 139 | | | | — | | | | 26 | | | | 632 | | | | 26 | | | | 4 | |
Large Cap Value | | | 113,998 | | | | 121,230 | | | | 12,283 | | | | 82,079 | | | | 21,822 | | | | 30,761 | | | | 208 | | | | 5,306 | | | | 33,406 | | | | 4,422 | | | | 184 | |
| | |
| The accompanying notes are an integral part of these financial statements. | | 59 |
GOLDMAN SACHS FUNDAMENTAL EQUITY VALUE FUNDS
Statements of Operations(continued)
For the Six Months Ended February 28, 2019 (Unaudited)
| | | | | | | | | | | | | | |
| | | | | Mid Cap
Value Fund | | | Small Cap
Value Fund | | | Small/Mid Cap
Value Fund | |
| | Investment income: | | | | | | | | | | | | |
| | | | |
| | Dividends — unaffiliated issuers (net of foreign withholding taxes of $17,920, $0 and $0) | | $ | 11,265,059 | | | $ | 55,549,624 | | | $ | 1,133,039 | |
| | | | |
| | Dividends — affiliated issuers | | | 40,997 | | | | 129,957 | | | | 18,336 | |
| | | | |
| | Securities lending income — affiliated issuer | | | 785 | | | | 240,270 | | | | 2,251 | |
| | | | |
| | Total investment income | | | 11,306,841 | | | | 55,919,851 | | | | 1,153,626 | |
| | | | | | | | | | | | | | |
| | Expenses: | | | | | | | | | | | | |
| | | | |
| | Management fees | | | 5,131,478 | | | | 27,577,691 | | | | 470,062 | |
| | | | |
| | Distribution and Service fees(a) | | | 978,438 | | | | 1,252,509 | | | | 7,150 | |
| | | | |
| | Transfer Agency fees(a) | | | 738,207 | | | | 1,848,430 | | | | 23,084 | |
| | | | |
| | Printing and mailing costs | | | 110,304 | | | | 213,651 | | | | 13,472 | |
| | | | |
| | Registration fees | | | 90,689 | | | | 145,723 | | | | 62,857 | |
| | | | |
| | Custody, accounting and administrative services | | | 76,238 | | | | 188,743 | | | | 30,958 | |
| | | | |
| | Service Share fees — Service Plan | | | 71,387 | | | | 114,366 | | | | — | |
| | | | |
| | Service Share fees — Shareholder Administration Plan | | | 71,387 | | | | 114,366 | | | | — | |
| | | | |
| | Professional fees | | | 51,529 | | | | 52,782 | | | | 50,251 | |
| | | | |
| | Trustee fees | | | 9,334 | | | | 14,009 | | | | 8,035 | |
| | | | |
| | Other | | | 27,410 | | | | 52,421 | | | | 6,103 | |
| | | | |
| | Total expenses | | | 7,356,401 | | | | 31,574,691 | | | | 671,972 | |
| | | | |
| | Less — expense reductions | | | (3,772 | ) | | | (557,207 | ) | | | (170,768 | ) |
| | | | |
| | Net expenses | | | 7,352,629 | | | | 31,017,484 | | | | 501,204 | |
| | | | |
| | NET INVESTMENT INCOME | | | 3,954,212 | | | | 24,902,367 | | | | 652,422 | |
| | | | | | | | | | | | | | |
| | Realized and unrealized gain (loss): | | | | |
| | | | |
| | Net realized gain (loss) from: | | | | | | | | | | | | |
| | | | |
| | Investments — unaffiliated issuers (including commission recapture of $11,070, $4,301 and $1,212) | | | 338,753 | | | | (18,628,221 | ) | | | (4,287,070 | ) |
| | | | |
| | Net change in unrealized loss on: | | | | | | | | | | | | |
| | | | |
| | Investments — unaffiliated issuers | | | (57,530,836 | ) | | | (518,290,983 | ) | | | (3,911,176 | ) |
| | | | |
| | Net realized and unrealized loss | | | (57,192,083 | ) | | | (536,919,204 | ) | | | (8,198,246 | ) |
| | | | |
| | NET DECREASE IN NET ASSETS RESULTING FROM OPERATIONS | | $ | (53,237,871 | ) | | $ | (512,016,837 | ) | | $ | (7,545,824 | ) |
| | (a) | | Class specific Distribution/or and Service and Transfer Agency fees were as follows: |
| | | | | | | | | | | | | | | | | | | | | | | | | | | | | | | | | | | | | | | | | | | | |
| | | Distribution and/or Service Fees | | | Transfer Agency Fees | |
Fund | | Class A | | | Class C | | | Class R | | | Class A | | | Class C | | | Institutional | | | Service | | | Investor | | | Class P | | | Class R | | | Class R6 | |
Mid Cap Value | | $ | 707,531 | | | $ | 209,137 | | | $ | 61,770 | | | $ | 509,422 | | | $ | 37,645 | | | $ | 89,236 | | | $ | 11,422 | | | $ | 40,036 | | | $ | 22,648 | | | $ | 22,237 | | | $ | 5,561 | |
Small Cap Value | | | 911,088 | | | | 82,191 | | | | 259,230 | | | | 655,983 | | | | 14,794 | | | | 713,125 | | | | 18,299 | | | | 137,697 | | | | 40,814 | | | | 93,323 | | | | 174,395 | |
Small/Mid Cap Value | | | 1,870 | | | | 4,806 | | | | 474 | | | | 1,346 | | | | 865 | | | | 1,125 | | | | — | | | | 3,829 | | | | 7,476 | | | | 171 | | | | 8,272 | |
| | |
| 60 | | The accompanying notes are an integral part of these financial statements. |
GOLDMAN SACHS FUNDAMENTAL EQUITY VALUE FUNDS
Statements of Changes in Net Assets
| | | | | | | | | | | | | | | | | | | | | | |
| | | | | Equity Income Fund | | | | | | Focused Value Fund | |
| | | | | For the
Six Months Ended
February 28, 2019
(Unaudited) | | | For the Fiscal
Year Ended
August 31, 2018 | | | | | | For the
Six Months Ended
February 28, 2019
(Unaudited) | | | For the Fiscal
Year Ended
August 31, 2018 | |
| | From operations: | | | | | | | | | | | | | |
| | | | | | |
| | Net investment income | | $ | 3,528,070 | | | $ | 6,912,858 | | | | | | | $ | 32,920 | | | $ | 50,976 | |
| | | | | | |
| | Net realized gain | | | 6,936,855 | | | | 22,834,667 | | | | | | | | 187,015 | | | | 113,023 | |
| | | | | | |
| | Net change in unrealized gain (loss) | | | (13,058,537 | ) | | | 9,945,582 | | | | | | | | (375,660 | ) | | | 382,741 | |
| | | | | | |
| | Net increase (decrease) in net assets resulting from operations | | | (2,593,612 | ) | | | 39,693,107 | | | | | | | | (155,725 | ) | | | 546,740 | |
| | | | | | | | | | | | | | | | | | | | | | |
| | Distributions to shareholders: | | | | | | | | | | | | | |
| | | | | | |
| | From distributable earnings: | | | | | | | | | | | | | | | | | | | | |
| | | | | | |
| | Class A Shares | | | (4,956,050 | ) | | | (6,132,663 | )(b) | | | | | | | (2,623 | ) | | | (4,676 | )(b) |
| | | | | | |
| | Class C Shares | | | (94,738 | ) | | | (225,722 | )(b) | | | | | | | (1,396 | ) | | | (2,157 | )(b) |
| | | | | | |
| | Institutional Shares | | | (422,898 | ) | | | (757,952 | )(b) | | | | | | | (36,446 | ) | | | (439,580 | )(b) |
| | | | | | |
| | Service Shares | | | (1,623 | ) | | | (1,511 | )(b) | | | | | | | — | | | | — | |
| | | | | | |
| | Investor Shares | | | (45,388 | ) | | | (60,208 | )(b) | | | | | | | (1,721 | ) | | | (2,468 | )(b) |
| | | | | | |
| | Class P Shares(a) | | | (193,437 | ) | | | (71,219 | )(b) | | | | | | | (248,134 | ) | | | — | |
| | | | | | |
| | Class R Shares | | | (21,196 | ) | | | (24,306 | )(b) | | | | | | | (1,556 | ) | | | (2,313 | )(b) |
| | | | | | |
| | Class R6 Shares | | | (216 | ) | | | (268 | )(b) | | | | | | | (1,772 | ) | | | (2,519 | )(b) |
| | | | | | |
| | Total distributions to shareholders | | | (5,735,546 | ) | | | (7,273,849 | ) | | | | | | | (293,648 | ) | | | (453,713 | ) |
| | | | | | | | | | | | | | | | | | | | | | |
| | From share transactions: | | | | | | | | | | | | | |
| | | | | | |
| | Proceeds from sales of shares | | | 22,663,683 | | | | 24,540,213 | | | | | | | | 380,879 | | | | 8,020,093 | |
| | | | | | |
| | Reinvestment of distributions | | | 5,603,494 | | | | 7,092,658 | | | | | | | | 293,648 | | | | 453,712 | |
| | | | | | |
| | Cost of shares redeemed | | | (36,626,243 | ) | | | (75,994,046 | ) | | | | | | | (2,604,345 | ) | | | (6,718,862 | ) |
| | | | | | |
| | Net increase (decrease) in net assets resulting from share transactions | | | (8,359,066 | ) | | | (44,361,175 | ) | | | | | | | (1,929,818 | ) | | | 1,754,943 | |
| | | | | | |
| | TOTAL INCREASE (DECREASE) | | | (16,688,224 | ) | | | (11,941,917 | ) | | | | | | | (2,379,191 | ) | | | 1,847,970 | |
| | | | | | | | | | | | | | | | | | | | | | |
| | Net assets:(c) | | | | | | | | | | | | | |
| | | | | | |
| | Beginning of period | | | 375,874,337 | | | | 387,816,254 | | | | | | | | 6,832,828 | | | | 4,984,858 | |
| | | | | | |
| | End of period | | $ | 359,186,113 | | | $ | 375,874,337 | | | | | | | $ | 4,453,637 | | | $ | 6,832,828 | |
| | (a) | | Class P Shares commenced operations on April 17, 2018. |
| | (b) | | Prior year information has been revised to conform to current year presentation, see prior year presentation below: |
| | | | | | | | | | | | | | | | | | | | | | | | | | | | | | | | |
Distributions from net investment income: | | Class A | | | Class C | | | Institutional | | | Service | | | Investor | | | Class P | | | Class R | | | Class R6 | |
Equity Income | | $ | (6,132,663 | ) | | $ | (225,722 | ) | | $ | (757,952 | ) | | $ | (1,511 | ) | | $ | (60,208 | ) | | $ | (71,219 | ) | | $ | (24,306 | ) | | $ | (268 | ) |
Focused Value | | | (434 | ) | | | — | | | | (56,946 | ) | | | — | | | | (283 | ) | | | — | | | | (142 | ) | | | (329 | ) |
| | | | | | | | |
Distributions from net realized gains: | | | | | Class A | | | Class C | | | Institutional | | | Service | | | Investor | | | Class R | | | Class R6 | |
Focused Value | | | | | | $ | (4,242 | ) | | $ | (2,157 | ) | | $ | (382,634 | ) | | $ | — | | | $ | (2,185 | ) | | $ | (2,171 | ) | | $ | (2,190 | ) |
| | (c) | | Prior year information has been revised to conform with current year presentation. Undistributed net investment income was $ 1,174,812 and $ 33,292 for the Equity Income and Focused Value Funds as of August 31, 2018. |
| | |
| The accompanying notes are an integral part of these financial statements. | | 61 |
GOLDMAN SACHS FUNDAMENTAL EQUITY VALUE FUNDS
Statements of Changes in Net Assets(continued)
| | | | | | | | | | | | | | | | | | | | | | |
| | | | | Large Cap Value Fund | | | | | | Mid Cap Value Fund | |
| | | | | For the
Six Months Ended
February 28, 2019
(Unaudited) | | | For the Fiscal
Year Ended
August 31, 2018 | | | | | | For the
Six Months Ended
February 28, 2019
(Unaudited) | | | For the Fiscal
Year Ended
August 31, 2018 | |
| | From operations: | | | | | | | | | | | | | |
| | | | | | |
| | Net investment income | | $ | 3,430,574 | | | $ | 7,003,431 | | | | | | | $ | 3,954,212 | | | $ | 7,874,994 | |
| | | | | | |
| | Net realized gain | | | 4,062,786 | | | | 79,648,698 | | | | | | | | 338,753 | | | | 253,719,524 | |
| | | | | | |
| | Net change in unrealized gain (loss) | | | (23,990,196 | ) | | | (22,561,147 | ) | | | | | | | (57,530,836 | ) | | | (42,318,723 | ) |
| | | | | | |
| | Net increase (decrease) in net assets resulting from operations | | | (16,496,836 | ) | | | 64,090,982 | | | | | | | | (53,237,871 | ) | | | 219,275,795 | |
| | | | | | | | | | | | | | | | | | | | | | |
| | Distributions to shareholders: | | | | | | | | | | | | | |
| | | | | | |
| | From distributable earnings: | | | | | | | | | | | | | | | | | | | | |
| | | | | | |
| | Class A Shares | | | (10,013,173 | ) | | | (16,617,728 | )(b) | | | | | | | (80,350,023 | ) | | | (107,494,646 | )(b) |
| | | | | | |
| | Class C Shares | | | (2,416,782 | ) | | | (5,867,147 | )(b) | | | | | | | (5,982,773 | ) | | | (14,362,231 | )(b) |
| | | | | | |
| | Institutional Shares | | | (17,040,940 | ) | | | (81,543,072 | )(b) | | | | | | | (65,676,202 | ) | | | (173,256,802 | )(b) |
| | | | | | |
| | Service Shares | | | (105,614 | ) | | | (420,112 | )(b) | | | | | | | (8,245,430 | ) | | | (11,309,204 | )(b) |
| | | | | | |
| | Investor Shares | | | (616,179 | ) | | | (1,021,804 | )(b) | | | | | | | (6,590,529 | ) | | | (9,478,659 | )(b) |
| | | | | | |
| | Class P Shares(a) | | | (24,947,700 | ) | | | — | | | | | | | | (21,987,888 | ) | | | — | |
| | | | | | |
| | Class R Shares | | | (536,342 | ) | | | (930,857 | )(b) | | | | | | | (3,452,428 | ) | | | (4,519,818 | )(b) |
| | | | | | |
| | Class R6 Shares | | | (106,537 | ) | | | (23,298 | )(b) | | | | | | | (3,562,454 | ) | | | (10,340,743 | )(b) |
| | | | | | |
| | Total distributions to shareholders | | | (55,783,267 | ) | | | (106,424,018 | ) | | | | | | | (195,847,727 | ) | | | (330,762,103 | ) |
| | | | | | | | | | | | | | | | | | | | | | |
| | From share transactions: | | | | | | | | | | | | | |
| | | | | | |
| | Proceeds from sales of shares | | | 48,889,550 | | | | 336,834,925 | | | | | | | | 146,163,591 | | | | 427,486,951 | |
| | | | | | |
| | Reinvestment of distributions | | | 54,109,142 | | | | 101,042,965 | | | | | | | | 179,466,797 | | | | 302,049,331 | |
| | | | | | |
| | Cost of shares redeemed | | | (103,642,186 | ) | | | (682,887,277 | ) | | | | | | | (412,115,172 | ) | | | (1,647,750,292 | ) |
| | | | | | |
| | Net increase (decrease) in net assets resulting from share transactions | | | (643,494 | ) | | | (245,009,387 | ) | | | | | | | (86,484,784 | ) | | | (918,214,010 | ) |
| | | | | | |
| | TOTAL INCREASE (DECREASE) | | | (72,923,597 | ) | | | (287,342,423 | ) | | | | | | | (335,570,382 | ) | | | (1,029,700,318 | ) |
| | | | | | | | | | | | | | | | | | | | | | |
| | Net assets:(c) | | | | | | | | | | | | | |
| | | | | | |
| | Beginning of period | | | 566,865,743 | | | | 854,208,166 | | | | | | | | 1,622,376,201 | | | | 2,652,076,519 | |
| | | | | | |
| | End of period | | $ | 493,942,146 | | | $ | 566,865,743 | | | | | | | $ | 1,286,805,819 | | | $ | 1,622,376,201 | |
| | (a) | | Class P Shares commenced operations on April 17, 2018. |
| | (b) | | Prior year information has been revised to conform to current year presentation, see prior year presentation below: |
| | | | | | | | | | | | | | | | | | | | | | | | | | | | |
Distributions from net investment income: | | Class A | | | Class C | | | Institutional | | | Service | | | Investor | | | Class R | | | Class R6 | |
Large Cap Value | | $ | (1,439,786 | ) | | $ | (326,872 | ) | | $ | (9,497,922 | ) | | $ | (33,746 | ) | | $ | (119,672 | ) | | $ | (81,410 | ) | | $ | — | |
Mid Cap Value | | | (3,307,340 | ) | | | — | | | | (9,586,444 | ) | | | (299,520 | ) | | | (360,363 | ) | | | (87,344 | ) | | | (518,762 | ) |
| | | | | | | |
Distributions from net realized gains: | | Class A | | | Class C | | | Institutional | | | Service | | | Investor | | | Class R | | | Class R6 | |
Large Cap Value | | $ | (15,177,942 | ) | | $ | (5,540,275 | ) | | $ | (72,045,150 | ) | | $ | (386,366 | ) | | $ | (902,132 | ) | | $ | (849,447 | ) | | $ | (23,298 | ) |
Mid Cap Value | | | (104,187,306 | ) | | | (14,362,231 | ) | | | (163,670,358 | ) | | | (11,009,684 | ) | | | (9,118,296 | ) | | | (4,432,474 | ) | | | (9,821,981 | ) |
| | (c) | | Prior year information has been revised to conform with current year presentation. Undistributed net investment income was $ 4,845,111 and $270,300 for the Large Cap Value and Mid Cap Value Funds as of August 31, 2018. |
| | |
| 62 | | The accompanying notes are an integral part of these financial statements. |
GOLDMAN SACHS FUNDAMENTAL EQUITY VALUE FUNDS
Statements of Changes in Net Assets(continued)
| | | | | | | | | | | | | | | | | | | | | | |
| | | | | Small Cap Value Fund | | | | | | Small/Mid Cap Value Fund | |
| | | | | For the
Six Months Ended
February 28, 2019
(Unaudited) | | | For the Fiscal
Year Ended
August 31, 2018 | | | | | | For the
Six Months Ended
February 28, 2019
(Unaudited) | | | For the Fiscal
Year Ended
August 31, 2018 | |
| | From operations: | | | | | | | | | | | | | |
| | | | | | |
| | Net investment income | | $ | 24,902,367 | | | $ | 25,131,142 | | | | | | | $ | 652,422 | | | $ | 861,999 | |
| | | | | | |
| | Net realized gain (loss) | | | (18,628,221 | ) | | | 694,975,746 | | | | | | | | (4,287,070 | ) | | | 7,650,955 | |
| | | | | | |
| | Net change in unrealized gain (loss) | | | (518,290,983 | ) | | | 431,991,515 | | | | | | | | (3,911,176 | ) | | | 8,151,309 | |
| | | | | | |
| | Net increase (decrease) in net assets resulting from operations | | | (512,016,837 | ) | | | 1,152,098,403 | | | | | | | | (7,545,824 | ) | | | 16,664,263 | |
| | | | | | | | | | | | | | | | | | | | | | |
| | Distributions to shareholders: | | | | | | | | | | | | | |
| | | | | | |
| | From distributable earnings: | | | | | | | | | | | | | | | | | | | | |
| | | | | | |
| | Class A Shares | | | (80,325,941 | ) | | | (90,296,447 | )(b) | | | | | | | (96,381 | ) | | | (68,649 | )(b) |
| | | | | | |
| | Class C Shares | | | (2,159,452 | ) | | | (5,250,602 | )(b) | | | | | | | (60,960 | ) | | | (43,477 | )(b) |
| | | | | | |
| | Institutional Shares | | | (373,807,352 | ) | | | (461,156,882 | )(b) | | | | | | | (360,731 | ) | | | (2,213,891 | )(b) |
| | | | | | |
| | Service Shares | | | (10,384,854 | ) | | | (13,771,001 | )(b) | | | | | | | — | | | | — | |
| | | | | | |
| | Investor Shares | | | (17,181,572 | ) | | | (19,178,515 | )(b) | | | | | | | (214,689 | ) | | | (234,641 | )(b) |
| | | | | | |
| | Class P Shares(a) | | | (29,152,639 | ) | | | — | | | | | | | | (3,324,027 | ) | | | — | |
| | | | | | |
| | Class R Shares | | | (11,383,758 | ) | | | (13,586,906 | )(b) | | | | | | | (11,847 | ) | | | (5,587 | )(b) |
| | | | | | |
| | Class R6 Shares | | | (117,489,659 | ) | | | (92,487,505 | )(b) | | | | | | | (3,632,477 | ) | | | (2,832,291 | )(b) |
| | | | | | |
| | Total distributions to shareholders | | | (641,885,227 | ) | | | (695,727,858 | ) | | | | | | | (7,701,112 | ) | | | (5,398,536 | ) |
| | | | | | | | | | | | | | | | | | | | | | |
| | From share transactions: | | | | | | | | | | | | | |
| | | | | | |
| | Proceeds from sales of shares | | | 850,200,982 | | | | 1,602,296,827 | | | | | | | | 12,376,366 | | | | 77,203,850 | |
| | | | | | |
| | Reinvestment of distributions | | | 614,744,607 | | | | 667,790,846 | | | | | | | | 7,693,950 | | | | 5,387,653 | |
| | | | | | |
| | Cost of shares redeemed | | | (1,229,604,573 | ) | | | (2,191,842,059 | ) | | | | | | | (12,926,984 | ) | | | (73,354,014 | ) |
| | | | | | |
| | Net increase (decrease) in net assets resulting from share transactions | | | 235,341,016 | | | | 78,245,614 | | | | | | | | 7,143,332 | | | | 9,237,489 | |
| | | | | | |
| | TOTAL INCREASE (DECREASE) | | | (918,561,048 | ) | | | 534,616,159 | | | | | | | | (8,103,604 | ) | | | 20,503,216 | |
| | | | | | | | | | | | | | | | | | | | | | |
| | Net assets:(c) | | | | | | | | | | | | | |
| | | | | | |
| | Beginning of period | | | 7,015,572,631 | | | | 6,480,956,472 | | | | | | | | 129,843,705 | | | | 109,340,489 | |
| | | | | | |
| | End of period | | $ | 6,097,011,583 | | | $ | 7,015,572,631 | | | | | | | $ | 121,740,101 | | | $ | 129,843,705 | |
| | (a) | | Class P Shares commenced operations on April 17, 2018. |
| | (b) | | Prior year information has been revised to conform to current year presentation, see prior year presentation below: |
| | | | | | | | | | | | | | | | | | | | | | | | | | | | |
Distributions from net investment income: | | Class A | | | Class C | | | Institutional | | | Service | | | Investor | | | Class R | | | Class R6 | |
Small Cap Value | | $ | (1,178,855 | ) | | $ | — | | | $ | (23,542,391 | ) | | $ | (39,508 | ) | | $ | (742,667 | ) | | $ | — | | | $ | (4,966,579 | ) |
Small/Mid Cap Value | | | (10,160 | ) | | | — | | | | (468,442 | ) | | | — | | | | (45,272 | ) | | | (512 | ) | | | (607,300 | ) |
| | | | | | | |
Distributions from net realized gains: | | Class A | | | Class C | | | Institutional | | | Service | | | Investor | | | Class R | | | Class R6 | |
Small Cap Value | | $ | (89,117,592 | ) | | $ | (5,250,602 | ) | | $ | (437,614,491 | ) | | $ | (13,731,493 | ) | | $ | (18,435,848 | ) | | $ | (13,586,906 | ) | | $ | (87,520,926 | ) |
Small/Mid Cap Value | | | (58,489 | ) | | | (43,477 | ) | | | (1,745,449 | ) | | | — | | | | (189,369 | ) | | | (5,075 | ) | | | (2,224,991 | ) |
| | (c) | | Prior year information has been revised to conform with current year presentation. Undistributed net investment income was $ 4,433,547 and $ 332,639 for the Small Cap Value and Small/Mid Cap Value Funds as of August 31, 2018. |
| | |
| The accompanying notes are an integral part of these financial statements. | | 63 |
GOLDMAN SACHS EQUITY INCOME FUND
Financial Highlights
Selected Share Data for a Share Outstanding Throughout Each Period
| | | | | | | | | | | | | | | | | | | | | | | | | | |
| | | | | Goldman Sachs Equity Income Fund | |
| | | | | Class A Shares | |
| | | | | Six Months Ended
February 28, 2019
(Unaudited) | | | Year Ended August 31, | |
| | | | | 2018 | | | 2017 | | | 2016 | | | 2015 | | | 2014 | |
| | Per Share Data | | | | | | | | | | | | | | | | | | | | | | | | |
| | | | | | | |
| | Net asset value, beginning of period | | $ | 38.26 | | | $ | 35.17 | | | $ | 32.53 | | | $ | 30.47 | | | $ | 32.21 | | | $ | 26.70 | |
| | | | | | | |
| | Net investment income(a) | | | 0.36 | | | | 0.67 | | | | 0.61 | | | | 0.68 | | | | 0.55 | | | | 0.42 | |
| | | | | | | |
| | Net realized and unrealized gain (loss) | | | (0.61 | ) | | | 3.12 | | | | 2.60 | | | | 2.02 | | | | (1.80 | ) | | | 5.48 | |
| | | | | | | |
| | Total from investment operations | | | (0.25 | ) | | | 3.79 | | | | 3.21 | | | | 2.70 | | | | (1.25 | ) | | | 5.90 | |
| | | | | | | |
| | Distributions to shareholders from net investment income | | | (0.29 | ) | | | (0.70 | ) | | | (0.57 | ) | | | (0.64 | ) | | | (0.49 | ) | | | (0.39 | ) |
| | | | | | | |
| | Distributions to shareholders from net realized gains | | | (0.30 | ) | | | — | | | | — | | | | — | | | | — | | | | — | |
| | | | | | | |
| | Total distributions | | | (0.59 | ) | | | (0.70 | ) | | | (0.57 | ) | | | (0.64 | ) | | | (0.49 | ) | | | (0.39 | ) |
| | | | | | | |
| | Net asset value, end of period | | $ | 37.42 | | | $ | 38.26 | | | $ | 35.17 | | | $ | 32.53 | | | $ | 30.47 | | | $ | 32.21 | |
| | | | | | | |
| | Total return(b) | | | (0.58 | )% | | | 10.88 | % | | | 9.93 | % | | | 9.01 | % | | | (3.98 | )% | | | 22.27 | % |
| | | | | | | |
| | Net assets, end of period (in 000s) | | $ | 311,004 | | | $ | 318,960 | | | $ | 327,650 | | | $ | 359,003 | | | $ | 369,115 | | | $ | 414,276 | |
| | | | | | | |
| | Ratio of net expenses to average net assets | | | 1.11 | %(c) | | | 1.12 | % | | | 1.13 | % | | | 1.13 | % | | | 1.14 | % | | | 1.18 | % |
| | | | | | | |
| | Ratio of total expenses to average net assets | | | 1.24 | %(c) | | | 1.27 | % | | | 1.24 | % | | | 1.26 | % | | | 1.22 | % | | | 1.24 | % |
| | | | | | | |
| | Ratio of net investment income to average net assets | | | 1.98 | %(c) | | | 1.81 | % | | | 1.77 | % | | | 2.22 | % | | | 1.68 | % | | | 1.42 | % |
| | | | | | | |
| | Portfolio turnover rate(d) | | | 23 | % | | | 69 | % | | | 43 | % | | | 61 | % | | | 47 | % | | | 40 | % |
| | (a) | | Calculated based on the average shares outstanding methodology. |
| | (b) | | Assumes investment at the NAV at the beginning of the period, reinvestment of all dividends and distributions, a complete redemption of the investment at the NAV at the end of the period and no sales or redemption charges. Total returns would be reduced if a sales or redemption charge was taken into account. Returns do not reflect the impact of taxes to shareholders relating to Fund distributions or the redemption of Fund shares. Total returns for periods less than one full year are not annualized. |
| | (d) | | The Fund’s portfolio turnover rate is calculated in accordance with regulatory requirements, without regard to transactions involving short term investments. If such transactions were included, the Fund’s portfolio turnover rate may be higher. |
| | |
| 64 | | The accompanying notes are an integral part of these financial statements. |
GOLDMAN SACHS EQUITY INCOME FUND
Financial Highlights(continued)
Selected Share Data for a Share Outstanding Throughout Each Period
| | | | | | | | | | | | | | | | | | | | | | | | | | |
| | | | | Goldman Sachs Equity Income Fund | |
| | | | | Class C Shares | |
| | | | | Six Months Ended
February 28, 2019
(Unaudited) | | | Year Ended August 31, | |
| | | | | 2018 | | | 2017 | | | 2016 | | | 2015 | | | 2014 | |
| | Per Share Data | | | | | | | | | | | | | | | | | | | | | | | | |
| | | | | | | |
| | Net asset value, beginning of period | | $ | 36.41 | | | $ | 33.50 | | | $ | 31.01 | | | $ | 29.08 | | | $ | 30.77 | | | $ | 25.54 | |
| | | | | | | |
| | Net investment income(a) | | | 0.21 | | | | 0.37 | | | | 0.33 | | | | 0.43 | | | | 0.29 | | | | 0.19 | |
| | | | | | | |
| | Net realized and unrealized gain (loss) | | | (0.55 | ) | | | 2.98 | | | | 2.48 | | | | 1.93 | | | | (1.72 | ) | | | 5.23 | |
| | | | | | | |
| | Total from investment operations | | | (0.34 | ) | | | 3.35 | | | | 2.81 | | | | 2.36 | | | | (1.43 | ) | | | 5.42 | |
| | | | | | | |
| | Distributions to shareholders from net investment income | | | (0.09 | ) | | | (0.44 | ) | | | (0.32 | ) | | | (0.43 | ) | | | (0.26 | ) | | | (0.19 | ) |
| | | | | | | |
| | Distributions to shareholders from net realized gains | | | (0.30 | ) | | | — | | | | — | | | | — | | | | — | | | | — | |
| | | | | | | |
| | Total distributions | | | (0.39 | ) | | | (0.44 | ) | | | (0.32 | ) | | | (0.43 | ) | | | (0.26 | ) | | | (0.19 | ) |
| | | | | | | |
| | Net asset value, end of period | | $ | 35.68 | | | $ | 36.41 | | | $ | 33.50 | | | $ | 31.01 | | | $ | 29.08 | | | $ | 30.77 | |
| | | | | | | |
| | Total return(b) | | | (0.88 | )% | | | 10.06 | % | | | 9.10 | % | | | 8.21 | % | | | (4.70 | )% | | | 21.32 | % |
| | | | | | | |
| | Net assets, end of period (in 000s) | | $ | 8,772 | | | $ | 16,982 | | | $ | 18,460 | | | $ | 22,371 | | | $ | 23,534 | | | $ | 26,742 | |
| | | | | | | |
| | Ratio of net expenses to average net assets | | | 1.86 | %(c) | | | 1.87 | % | | | 1.88 | % | | | 1.88 | % | | | 1.89 | % | | | 1.93 | % |
| | | | | | | |
| | Ratio of total expenses to average net assets | | | 1.99 | %(c) | | | 2.02 | % | | | 1.99 | % | | | 2.01 | % | | | 1.97 | % | | | 1.99 | % |
| | | | | | | |
| | Ratio of net investment income to average net assets | | | 1.22 | %(c) | | | 1.06 | % | | | 1.02 | % | | | 1.47 | % | | | 0.93 | % | | | 0.67 | % |
| | | | | | | |
| | Portfolio turnover rate(d) | | | 23 | % | | | 69 | % | | | 43 | % | | | 61 | % | | | 47 | % | | | 40 | % |
| | (a) | | Calculated based on the average shares outstanding methodology. |
| | (b) | | Assumes investment at the NAV at the beginning of the period, reinvestment of all dividends and distributions, a complete redemption of the investment at the NAV at the end of the period and no sales or redemption charges. Total returns would be reduced if a sales or redemption charge was taken into account. Returns do not reflect the impact of taxes to shareholders relating to Fund distributions or the redemption of Fund shares. Total returns for periods less than one full year are not annualized. |
| | (d) | | The Fund’s portfolio turnover rate is calculated in accordance with regulatory requirements, without regard to transactions involving short term investments. If such transactions were included, the Fund’s portfolio turnover rate may be higher. |
| | |
| The accompanying notes are an integral part of these financial statements. | | 65 |
GOLDMAN SACHS EQUITY INCOME FUND
Financial Highlights(continued)
Selected Share Data for a Share Outstanding Throughout Each Period
| | | | | | | | | | | | | | | | | | | | | | | | | | |
| | | | | Goldman Sachs Equity Income Fund | |
| | | | | Institutional Shares | |
| | | | | Six Months Ended
February 28, 2019
(Unaudited) | | | Year Ended August 31, | |
| | | | | 2018 | | | 2017 | | | 2016 | | | 2015 | | | 2014 | |
| | Per Share Data | | | | | | | | | | | | | | | | | | | | | | | | |
| | | | | | | |
| | Net asset value, beginning of period | | $ | 38.92 | | | $ | 35.77 | | | $ | 33.07 | | | $ | 30.96 | | | $ | 32.72 | | | $ | 27.12 | |
| | | | | | | |
| | Net investment income(a) | | | 0.43 | | | | 0.81 | | | | 0.77 | | | | 0.82 | | �� | | 0.69 | | | | 0.55 | |
| | | | | | | |
| | Net realized and unrealized gain (loss) | | | (0.62 | ) | | | 3.18 | | | | 2.64 | | | | 2.06 | | | | (1.83 | ) | | | 5.56 | |
| | | | | | | |
| | Total from investment operations | | | (0.19 | ) | | | 3.99 | | | | 3.41 | | | | 2.88 | | | | (1.14 | ) | | | 6.11 | |
| | | | | | | |
| | Distributions to shareholders from net investment income | | | (0.36 | ) | | | (0.84 | ) | | | (0.71 | ) | | | (0.77 | ) | | | (0.62 | ) | | | (0.51 | ) |
| | | | | | | |
| | Distributions to shareholders from net realized gains | | | (0.30 | ) | | | — | | | | — | | | | — | | | | — | | | | — | |
| | | | | | | |
| | Total distributions | | | (0.66 | ) | | | (0.84 | ) | | | (0.71 | ) | | | (0.77 | ) | | | (0.62 | ) | | | (0.51 | ) |
| | | | | | | |
| | Net asset value, end of period | | $ | 38.07 | | | $ | 38.92 | | | $ | 35.77 | | | $ | 33.07 | | | $ | 30.96 | | | $ | 32.72 | |
| | | | | | | |
| | Total return(b) | | | (0.39 | )% | | | 11.30 | % | | | 10.38 | % | | | 9.46 | % | | | (3.59 | )% | | | 22.73 | % |
| | | | | | | |
| | Net assets, end of period (in 000s) | | $ | 18,646 | | | $ | 24,658 | | | $ | 37,415 | | | $ | 31,409 | | | $ | 29,243 | | | $ | 29,476 | |
| | | | | | | |
| | Ratio of net expenses to average net assets | | | 0.73 | %(c) | | | 0.73 | % | | | 0.73 | % | | | 0.73 | % | | | 0.74 | % | | | 0.78 | % |
| | | | | | | |
| | Ratio of total expenses to average net assets | | | 0.85 | %(c) | | | 0.87 | % | | | 0.84 | % | | | 0.86 | % | | | 0.82 | % | | | 0.84 | % |
| | | | | | | |
| | Ratio of net investment income to average net assets | | | 2.35 | %(c) | | | 2.17 | % | | | 2.19 | % | | | 2.61 | % | | | 2.09 | % | | | 1.82 | % |
| | | | | | | |
| | Portfolio turnover rate(d) | | | 23 | % | | | 69 | % | | | 43 | % | | | 61 | % | | | 47 | % | | | 40 | % |
| | (a) | | Calculated based on the average shares outstanding methodology. |
| | (b) | | Assumes investment at the NAV at the beginning of the period, reinvestment of all dividends and distributions, a complete redemption of the investment at the NAV at the end of the period and no sales or redemption charges. Total returns would be reduced if a sales or redemption charge was taken into account. Returns do not reflect the impact of taxes to shareholders relating to Fund distributions or the redemption of Fund shares. Total returns for periods less than one full year are not annualized. |
| | (d) | | The Fund’s portfolio turnover rate is calculated in accordance with regulatory requirements, without regard to transactions involving short term investments. If such transactions were included, the Fund’s portfolio turnover rate may be higher. |
| | |
| 66 | | The accompanying notes are an integral part of these financial statements. |
GOLDMAN SACHS EQUITY INCOME FUND
Financial Highlights(continued)
Selected Share Data for a Share Outstanding Throughout Each Period
| | | | | | | | | | | | | | | | | | | | | | | | | | |
| | | | | Goldman Sachs Equity Income Fund | |
| | | | | Service Shares | |
| | | | | Six Months Ended
February 28, 2019
(Unaudited) | | | Year Ended August 31, | |
| | | | | 2018 | | | 2017 | | | 2016 | | | 2015 | | | 2014 | |
| | Per Share Data | | | | | | | | | | | | | | | | | | | | | | | | |
| | | | | | | |
| | Net asset value, beginning of period | | $ | 38.39 | | | $ | 35.28 | | | $ | 32.53 | | | $ | 30.46 | | | $ | 32.20 | | | $ | 26.69 | |
| | | | | | | |
| | Net investment income(a) | | | 0.33 | | | | 0.63 | | | | 0.57 | | | | 0.65 | | | | 0.51 | | | | 0.39 | |
| | | | | | | |
| | Net realized and unrealized gain (loss) | | | (0.60 | ) | | | 3.13 | | | | 2.61 | | | | 2.02 | | | | (1.79 | ) | | | 5.48 | |
| | | | | | | |
| | Total from investment operations | | | (0.27 | ) | | | 3.76 | | | | 3.18 | | | | 2.67 | | | | (1.28 | ) | | | 5.87 | |
| | | | | | | |
| | Distributions to shareholders from net investment income | | | (0.27 | ) | | | (0.65 | ) | | | (0.43 | ) | | | (0.60 | ) | | | (0.46 | ) | | | (0.36 | ) |
| | | | | | | |
| | Distributions to shareholders from net realized gains | | | (0.30 | ) | | | — | | | | — | | | | — | | | | — | | | | — | |
| | | | | | | |
| | Total distributions | | | (0.57 | ) | | | (0.65 | ) | | | (0.43 | ) | | | (0.60 | ) | | | (0.46 | ) | | | (0.36 | ) |
| | | | | | | |
| | Net asset value, end of period | | $ | 37.55 | | | $ | 38.39 | | | $ | 35.28 | | | $ | 32.53 | | | $ | 30.46 | | | $ | 32.20 | |
| | | | | | | |
| | Total return(b) | | | (0.63 | )% | | | 10.77 | % | | | 9.84 | % | | | 8.88 | % | | | (4.06 | )% | | | 22.12 | % |
| | | | | | | |
| | Net assets, end of period (in 000s) | | $ | 103 | | | $ | 84 | | | $ | 86 | | | $ | 324 | | | $ | 397 | | | $ | 368 | |
| | | | | | | |
| | Ratio of net expenses to average net assets | | | 1.23 | %(c) | | | 1.23 | % | | | 1.23 | % | | | 1.23 | % | | | 1.24 | % | | | 1.28 | % |
| | | | | | | |
| | Ratio of total expenses to average net assets | | | 1.35 | %(c) | | | 1.38 | % | | | 1.33 | % | | | 1.36 | % | | | 1.32 | % | | | 1.34 | % |
| | | | | | | |
| | Ratio of net investment income to average net assets | | | 1.84 | %(c) | | | 1.70 | % | | | 1.66 | % | | | 2.11 | % | | | 1.58 | % | | | 1.33 | % |
| | | | | | | |
| | Portfolio turnover rate(d) | | | 23 | % | | | 69 | % | | | 43 | % | | | 61 | % | | | 47 | % | | | 40 | % |
| | (a) | | Calculated based on the average shares outstanding methodology. |
| | (b) | | Assumes investment at the NAV at the beginning of the period, reinvestment of all dividends and distributions, a complete redemption of the investment at the NAV at the end of the period and no sales or redemption charges. Total returns would be reduced if a sales or redemption charge was taken into account. Returns do not reflect the impact of taxes to shareholders relating to Fund distributions or the redemption of Fund shares. Total returns for periods less than one full year are not annualized. |
| | (d) | | The Fund’s portfolio turnover rate is calculated in accordance with regulatory requirements, without regard to transactions involving short term investments. If such transactions were included, the Fund’s portfolio turnover rate may be higher. |
| | |
| The accompanying notes are an integral part of these financial statements. | | 67 |
GOLDMAN SACHS EQUITY INCOME FUND
Financial Highlights(continued)
Selected Share Data for a Share Outstanding Throughout Each Period
| | | | | | | | | | | | | | | | | | | | | | | | | | |
| | | | | Goldman Sachs Equity Income Fund | |
| | | | | Investor Shares | |
| | | | | Six Months Ended
February 28, 2019
(Unaudited) | | | Year Ended August 31, | |
| | | | | 2018 | | | 2017 | | | 2016 | | | 2015 | | | 2014 | |
| | Per Share Data | | | | | | | | | | | | | | | | | | | | | | | | |
| | | | | | | |
| | Net asset value, beginning of period | | $ | 38.20 | | | $ | 35.12 | | | $ | 32.49 | | | $ | 30.41 | | | $ | 32.15 | | | $ | 26.65 | |
| | | | | | | |
| | Net investment income(a) | | | 0.40 | | | | 0.76 | | | | 0.75 | | | | 0.76 | | | | 0.62 | | | | 0.51 | |
| | | | | | | |
| | Net realized and unrealized gain (loss) | | | (0.59 | ) | | | 3.11 | | | | 2.55 | | | | 2.02 | | | | (1.79 | ) | | | 5.46 | |
| | | | | | | |
| | Total from investment operations | | | (0.19 | ) | | | 3.87 | | | | 3.30 | | | | 2.78 | | | | (1.17 | ) | | | 5.97 | |
| | | | | | | |
| | Distributions to shareholders from net investment income | | | (0.34 | ) | | | (0.79 | ) | | | (0.67 | ) | | | (0.70 | ) | | | (0.57 | ) | | | (0.47 | ) |
| | | | | | | |
| | Distributions to shareholders from net realized gains | | | (0.30 | ) | | | — | | | | — | | | | — | | | | — | | | | — | |
| | | | | | | |
| | Total distributions | | | (0.64 | ) | | | (0.79 | ) | | | (0.67 | ) | | | (0.70 | ) | | | (0.57 | ) | | | (0.47 | ) |
| | | | | | | |
| | Net asset value, end of period | | $ | 37.37 | | | $ | 38.20 | | | $ | 35.12 | | | $ | 32.49 | | | $ | 30.41 | | | $ | 32.15 | |
| | | | | | | |
| | Total return(b) | | | (0.42 | )% | | | 11.15 | % | | | 10.21 | % | | | 9.27 | % | | | (3.74 | )% | | | 22.58 | % |
| | | | | | | |
| | Net assets, end of period (in 000s) | | $ | 2,605 | | | $ | 2,851 | | | $ | 2,623 | | | $ | 743 | | | $ | 614 | | | $ | 3,937 | |
| | | | | | | |
| | Ratio of net expenses to average net assets | | | 0.86 | %(c) | | | 0.87 | % | | | 0.88 | % | | | 0.88 | % | | | 0.89 | % | | | 0.93 | % |
| | | | | | | |
| | Ratio of total expenses to average net assets | | | 0.99 | %(c) | | | 1.02 | % | | | 1.00 | % | | | 1.01 | % | | | 0.97 | % | | | 0.98 | % |
| | | | | | | |
| | Ratio of net investment loss to average net assets | | | 2.22 | %(c) | | | 2.07 | % | | | 2.17 | % | | | 2.47 | % | | | 1.90 | % | | | 1.71 | % |
| | | | | | | |
| | Portfolio turnover rate(d) | | | 23 | % | | | 69 | % | | | 43 | % | | | 61 | % | | | 47 | % | | | 40 | % |
| | (a) | | Calculated based on the average shares outstanding methodology. |
| | (b) | | Assumes investment at the NAV at the beginning of the period, reinvestment of all dividends and distributions, a complete redemption of the investment at the NAV at the end of the period and no sales or redemption charges. Total returns would be reduced if a sales or redemption charge was taken into account. Returns do not reflect the impact of taxes to shareholders relating to Fund distributions or the redemption of Fund shares. Total returns for periods less than one full year are not annualized. |
| | (d) | | The Fund’s portfolio turnover rate is calculated in accordance with regulatory requirements, without regard to transactions involving short term investments. If such transactions were included, the Fund’s portfolio turnover rate may be higher. |
| | |
| 68 | | The accompanying notes are an integral part of these financial statements. |
GOLDMAN SACHS EQUITY INCOME FUND
Financial Highlights(continued)
Selected Share Data for a Share Outstanding Throughout Each Period
| | | | | | | | | | |
| | | | | Goldman Sachs Equity Income Fund | |
| | | | | Class P Shares | |
| | | | | Six Months Ended
February 28, 2019
(Unaudited) | | | Period Ended August 31, 2018(a) | |
| | Per Share Data | |
| | | |
| | Net asset value, beginning of period | | $ | 38.92 | | | $ | 37.37 | |
| | | |
| | Net investment income(b) | | | 0.44 | | | | 0.31 | |
| | | |
| | Net realized and unrealized gain (loss) | | | (0.62 | ) | | | 1.48 | |
| | | |
| | Total from investment operations | | | (0.18 | ) | | | 1.79 | |
| | | |
| | Distributions to shareholders from net investment income | | | (0.37 | ) | | | (0.24 | ) |
| | | |
| | Distributions to shareholders from net realized gains | | | (0.30 | ) | | | — | |
| | | |
| | Total distributions | | | (0.67 | ) | | | (0.24 | ) |
| | | |
| | Net asset value, end of period | | $ | 38.07 | | | $ | 38.92 | |
| | | |
| | Total return(c) | | | (0.39 | )% | | | 4.84 | % |
| | | |
| | Net assets, end of period (in 000s) | | $ | 11,011 | | | $ | 10,835 | |
| | | |
| | Ratio of net expenses to average net assets(d) | | | 0.72 | % | | | 0.72 | % |
| | | |
| | Ratio of total expenses to average net assets(d) | | | 0.84 | % | | | 0.95 | % |
| | | |
| | Ratio of net investment income to average net assets(d) | | | 2.36 | % | | | 2.20 | % |
| | | |
| | Portfolio turnover rate(e) | | | 23 | % | | | 69 | % |
| | (a) | | Commenced operations on April 17, 2018. |
| | (b) | | Calculated based on the average shares outstanding methodology. |
| | (c) | | Assumes investment at the NAV at the beginning of the period, reinvestment of all dividends and distributions, a complete redemption of the investment at the NAV at the end of the period and no sales or redemption charges. Total returns would be reduced if a sales or redemption charge was taken into account. Returns do not reflect the impact of taxes to shareholders relating to Fund distributions or the redemption of Fund shares. Total returns for periods less than one full year are not annualized. |
| | (e) | | The Fund’s portfolio turnover rate is calculated in accordance with regulatory requirements, without regard to transactions involving short term investments. If such transactions were included, the Fund’s portfolio turnover rate may be higher. |
| | |
| The accompanying notes are an integral part of these financial statements. | | 69 |
GOLDMAN SACHS EQUITY INCOME FUND
Financial Highlights(continued)
Selected Share Data for a Share Outstanding Throughout Each Period
| | | | | | | | | | | | | | | | | | | | | | | | | | |
| | | | | Goldman Sachs Equity Income Fund | |
| | | | | Class R Shares | |
| | | | | Six Months Ended
February 28, 2019
(Unaudited) | | | Year Ended August 31, | |
| | | | | 2018 | | | 2017 | | | 2016 | | | 2015 | | | 2014 | |
| | Per Share Data | | | | | | | | | | | | | | | | | | | | | | | | |
| | | | | | | |
| | Net asset value, beginning of period | | $ | 38.05 | | | $ | 34.98 | | | $ | 32.35 | | | $ | 30.32 | | | $ | 32.05 | | | $ | 26.60 | |
| | | | | | | |
| | Net investment income(a) | | | 0.31 | | | | 0.57 | | | | 0.53 | | | | 0.60 | | | | 0.46 | | | | 0.35 | |
| | | | | | | |
| | Net realized and unrealized gain (loss) | | | (0.60 | ) | | | 3.10 | | | | 2.59 | | | | 2.00 | | | | (1.78 | ) | | | 5.45 | |
| | | | | | | |
| | Total from investment operations | | | (0.29 | ) | | | 3.67 | | | | 3.12 | | | | 2.60 | | | | (1.32 | ) | | | 5.80 | |
| | | | | | | |
| | Distributions to shareholders from net investment income | | | (0.24 | ) | | | (0.60 | ) | | | (0.49 | ) | | | (0.57 | ) | | | (0.41 | ) | | | (0.35 | ) |
| | | | | | | |
| | Distributions to shareholders from net realized gains | | | (0.30 | ) | | | — | | | | — | | | | — | | | | — | | | | — | |
| | | | | | | |
| | Total distributions | | | (0.54 | ) | | | (0.60 | ) | | | (0.49 | ) | | | (0.57 | ) | | | (0.41 | ) | | | (0.35 | ) |
| | | | | | | |
| | Net asset value, end of period | | $ | 37.22 | | | $ | 38.05 | | | $ | 34.98 | | | $ | 32.35 | | | $ | 30.32 | | | $ | 32.05 | |
| | | | | | | |
| | Total return(b) | | | (0.70 | )% | | | 10.59 | % | | | 9.68 | % | | | 8.71 | % | | | (4.19 | )% | | | 21.94 | % |
| | | | | | | |
| | Net assets, end of period (in 000s) | | $ | 1,455 | | | $ | 1,492 | | | $ | 1,571 | | | $ | 1,477 | | | $ | 1,167 | | | $ | 1,462 | |
| | | | | | | |
| | Ratio of net expenses to average net assets | | | 1.36 | %(c) | | | 1.37 | % | | | 1.38 | % | | | 1.38 | % | | | 1.39 | % | | | 1.43 | % |
| | | | | | | |
| | Ratio of total expenses to average net assets | | | 1.49 | %(c) | | | 1.52 | % | | | 1.49 | % | | | 1.51 | % | | | 1.47 | % | | | 1.49 | % |
| | | | | | | |
| | Ratio of net investment income to average net assets | | | 1.73 | %(c) | | | 1.55 | % | | | 1.54 | % | | | 1.96 | % | | | 1.44 | % | | | 1.16 | % |
| | | | | | | |
| | Portfolio turnover rate(d) | | | 23 | %(c) | | | 69 | % | | | 43 | % | | | 61 | % | | | 47 | % | | | 40 | % |
| | (a) | | Calculated based on the average shares outstanding methodology. |
| | (b) | | Assumes investment at the NAV at the beginning of the period, reinvestment of all dividends and distributions, a complete redemption of the investment at the NAV at the end of the period and no sales or redemption charges. Total returns would be reduced if a sales or redemption charge was taken into account. Returns do not reflect the impact of taxes to shareholders relating to Fund distributions or the redemption of Fund shares. Total returns for periods less than one full year are not annualized. |
| | (d) | | The Fund’s portfolio turnover rate is calculated in accordance with regulatory requirements, without regard to transactions involving short term investments. If such transactions were included, the Fund’s portfolio turnover rate may be higher. |
| | |
| 70 | | The accompanying notes are an integral part of these financial statements. |
GOLDMAN SACHS EQUITY INCOME FUND
Financial Highlights(continued)
Selected Share Data for a Share Outstanding Throughout Each Period
| | | | | | | | | | | | | | | | | | | | | | |
| | | | | Goldman Sachs Equity Income Fund | |
| | | | | Class R6 Shares | |
| | | | | Six Months Ended
February 28, 2019
(Unaudited) | | | Year Ended August 31, | | | Period Ended
August 31, 2015(a) | |
| | | | | 2018 | | | 2017 | | | 2016 | |
| | Per Share Data | | | | | | | | | | | | | | | | | | | | |
| | | | | | |
| | Net asset value, beginning of period | | $ | 38.92 | | | $ | 35.76 | | | $ | 33.06 | | | $ | 30.97 | | | $ | 33.24 | |
| | | | | | |
| | Net investment income(b) | | | 0.47 | | | | 0.83 | | | | 0.77 | | | | 0.82 | | | | 0.08 | |
| | | | | | |
| | Net realized and unrealized gain (loss) | | | (0.64 | ) | | | 3.17 | | | | 2.64 | | | | 2.04 | | | | (2.35 | ) |
| | | | | | |
| | Total from investment operations | | | (0.17 | ) | | | 4.00 | | | | 3.41 | | | | 2.86 | | | | (2.27 | ) |
| | | | | | |
| | Distributions to shareholders from net investment income | | | (0.37 | ) | | | (0.84 | ) | | | (0.71 | ) | | | (0.77 | ) | | | — | |
| | | | | | |
| | Distributions to shareholders from net realized gains | | | (0.30 | ) | | | — | | | | — | | | | — | | | | — | |
| | | | | | |
| | Total distributions | | | (0.67 | ) | | | (0.84 | ) | | | (0.71 | ) | | | (0.77 | ) | | | — | |
| | | | | | |
| | Net asset value, end of period | | $ | 38.08 | | | $ | 38.92 | | | $ | 35.76 | | | $ | 33.06 | | | $ | 30.97 | |
| | | | | | |
| | Total return(c) | | | (0.36 | )% | | | 11.34 | % | | | 10.39 | % | | | 9.40 | % | | | (6.83 | )% |
| | | | | | |
| | Net assets, end of period (in 000s) | | $ | 5,590 | | | $ | 13 | | | $ | 11 | | | $ | 10 | | | $ | 9 | |
| | | | | | |
| | Ratio of net expenses to average net assets | | | 0.72 | %(d) | | | 0.72 | % | | | 0.73 | % | | | 0.73 | % | | | 0.69 | %(d) |
| | | | | | |
| | Ratio of total expenses to average net assets | | | 0.83 | %(d) | | | 0.86 | % | | | 0.84 | % | | | 0.86 | % | | | 0.84 | %(d) |
| | | | | | |
| | Ratio of net investment income to average net assets | | | 2.57 | %(d) | | | 2.22 | % | | | 2.20 | % | | | 2.62 | % | | | 2.79 | %(d) |
| | | | | | |
| | Portfolio turnover rate(e) | | | 23 | % | | | 69 | % | | | 43 | % | | | 61 | % | | | 47 | % |
| | (a) | | Commenced operations on July 31, 2015. |
| | (b) | | Calculated based on the average shares outstanding methodology. |
| | (c) | | Assumes investment at the NAV at the beginning of the period, reinvestment of all dividends and distributions, a complete redemption of the investment at the NAV at the end of the period and no sales or redemption charges. Total returns would be reduced if a sales or redemption charge was taken into account. Returns do not reflect the impact of taxes to shareholders relating to Fund distributions or the redemption of Fund shares. Total returns for periods less than one full year are not annualized. |
| | (e) | | The Fund’s portfolio turnover rate is calculated in accordance with regulatory requirements, without regard to transactions involving short term investments. If such transactions were included, the Fund’s portfolio turnover rate may be higher. |
| | |
| The accompanying notes are an integral part of these financial statements. | | 71 |
GOLDMAN SACHS FOCUSED VALUE FUND
Financial Highlights(continued)
Selected Share Data for a Share Outstanding Throughout Each Period
| | | | | | | | | | | | | | | | | | | | | | |
| | | | | Goldman Sachs Focused Value Fund | |
| | | | | Class A Shares | |
| | | | | Six Months Ended
February 28, 2019
(Unaudited) | | | Year Ended August 31, | | | Period Ended August 31, 2015(a) | |
| | | | | 2018 | | | 2017 | | | 2016 | |
| | Per Share Data | | | | | | | | | | | | | | | | | | | | |
| | | | | | |
| | Net asset value, beginning of period | | $ | 11.08 | | | $ | 11.10 | | | $ | 9.89 | | | $ | 9.28 | | | $ | 10.00 | |
| | | | | | |
| | Net investment income(b) | | | 0.05 | | | | 0.05 | | | | 0.10 | | | | 0.12 | | | | 0.01 | |
| | | | | | |
| | Net realized and unrealized gain (loss) | | | (0.33 | ) | | | 0.87 | | | | 1.22 | | | | 0.52 | | | | (0.73 | ) |
| | | | | | |
| | Total from investment operations | | | (0.28 | ) | | | 0.92 | | | | 1.32 | | | | 0.64 | | | | (0.72 | ) |
| | | | | | |
| | Distributions to shareholders from net investment income | | | (0.05 | ) | | | (0.08 | ) | | | (0.11 | ) | | | (0.03 | ) | | | — | |
| | | | | | |
| | Distributions to shareholders from net realized gains | | | (0.51 | ) | | | (0.86 | ) | | | — | | | | — | | | | — | |
| | | | | | |
| | Total distributions | | | (0.56 | ) | | | (0.94 | ) | | | (0.11 | ) | | | (0.03 | ) | | | — | |
| | | | | | |
| | Net asset value, end of period | | $ | 10.24 | | | $ | 11.08 | | | $ | 11.10 | | | $ | 9.89 | | | $ | 9.28 | |
| | | | | | |
| | Total return(c) | | | (2.20 | )% | | | 8.64 | % | | | 13.42 | % | | | 6.93 | % | | | (7.20 | )% |
| | | | | | |
| | Net assets, end of period (in 000s) | | $ | 51 | | | $ | 52 | | | $ | 50 | | | $ | 25 | | | $ | 23 | |
| | | | | | |
| | Ratio of net expenses to average net assets | | | 1.11 | %(d) | | | 1.12 | % | | | 1.13 | % | | | 1.13 | % | | | 1.13 | %(d) |
| | | | | | |
| | Ratio of total expenses to average net assets | | | 7.14 | %(d) | | | 4.84 | % | | | 7.96 | % | | | 14.54 | % | | | 25.55 | %(d) |
| | | | | | |
| | Ratio of net investment income to average net assets | | | 0.98 | %(d) | | | 0.50 | % | | | 0.95 | % | | | 1.33 | % | | | 0.97 | %(d) |
| | | | | | |
| | Portfolio turnover rate(e) | | | 57 | % | | | 204 | % | | | 126 | % | | | 161 | % | | | 2 | % |
| | (a) | | Commenced operations on July 31, 2015. |
| | (b) | | Calculated based on the average shares outstanding methodology. |
| | (c) | | Assumes investment at the NAV at the beginning of the period, reinvestment of all dividends and distributions, a complete redemption of the investment at the NAV at the end of the period and no sales or redemption charges. Total returns would be reduced if a sales or redemption charge was taken into account. Returns do not reflect the impact of taxes to shareholders relating to Fund distributions or the redemption of Fund shares. Total returns for periods less than one full year are not annualized. |
| | (e) | | The Fund’s portfolio turnover rate is calculated in accordance with regulatory requirements, without regard to transactions involving short term investments. If such transactions were included, the Fund’s portfolio turnover rate may be higher. |
| | |
| 72 | | The accompanying notes are an integral part of these financial statements. |
GOLDMAN SACHS FOCUSED VALUE FUND
Financial Highlights(continued)
Selected Share Data for a Share Outstanding Throughout Each Period
| | | | | | | | | | | | | | | | | | | | | | |
| | | | | Goldman Sachs Focused Value Fund | |
| | | | | Class C Shares | |
| | | | | Six Months Ended
February 28, 2019
(Unaudited) | | | Year Ended August 31, | | | Period Ended August 31, 2015(a) | |
| | | | | 2018 | | | 2017 | | | 2016 | |
| | Per Share Data | | | | | | | | | | | | | | | | | | | | |
| | | | | | |
| | Net asset value, beginning of period | | $ | 11.03 | | | $ | 11.05 | | | $ | 9.84 | | | $ | 9.28 | | | $ | 10.00 | |
| | | | | | |
| | Net investment income (loss)(b) | | | 0.01 | | | | (0.03 | ) | | | 0.03 | | | | 0.05 | | | | — | (c) |
| | | | | | | |
| | Net realized and unrealized gain (loss) | | | (0.32 | ) | | | 0.87 | | | | 1.21 | | | | 0.51 | | | | (0.72 | ) |
| | | | | | |
| | Total from investment operations | | | (0.31 | ) | | | 0.84 | | | | 1.24 | | | | 0.56 | | | | (0.72 | ) |
| | | | | | |
| | Distributions to shareholders from net investment income | | | (0.01 | ) | | | — | | | | (0.03 | ) | | | — | (c) | | | — | |
| | | | | | |
| | Distributions to shareholders from net realized gains | | | (0.51 | ) | | | (0.86 | ) | | | — | | | | — | | | | — | |
| | | | | | |
| | Total distributions | | | (0.52 | ) | | | (0.86 | ) | | | (0.03 | ) | | | — | (c) | | | — | |
| | | | | | |
| | Net asset value, end of period | | $ | 10.20 | | | $ | 11.03 | | | $ | 11.05 | | | $ | 9.84 | | | $ | 9.28 | |
| | | | | | |
| | Total return(d) | | | (2.55 | )% | | | 7.87 | % | | | 12.64 | % | | | 6.06 | % | | | (7.20 | )% |
| | | | | | |
| | Net assets, end of period (in 000s) | | $ | 29 | | | $ | 30 | | | $ | 48 | | | $ | 25 | | | $ | 23 | |
| | | | | | |
| | Ratio of net expenses to average net assets | | | 1.86 | %(e) | | | 1.87 | % | | | 1.88 | % | | | 1.88 | % | | | 1.89 | %(e) |
| | | | | | |
| | Ratio of total expenses to average net assets | | | 7.89 | %(e) | | | 5.77 | % | | | 8.66 | % | | | 15.30 | % | | | 26.30 | %(e) |
| | | | | | |
| | Ratio of net investment income (loss) to average net assets | | | 0.23 | %(e) | | | (0.24 | )% | | | 0.25 | % | | | 0.58 | % | | | 0.21 | %(e) |
| | | | | | |
| | Portfolio turnover rate(f) | | | 57 | % | | | 204 | % | | | 126 | % | | | 161 | % | | | 2 | % |
| | (a) | | Commenced operations on July 31, 2015. |
| | (b) | | Calculated based on the average shares outstanding methodology. |
| | (c) | | Amount is less than $0.005 per share. |
| | (d) | | Assumes investment at the NAV at the beginning of the period, reinvestment of all dividends and distributions, a complete redemption of the investment at the NAV at the end of the period and no sales or redemption charges. Total returns would be reduced if a sales or redemption charge was taken into account. Returns do not reflect the impact of taxes to shareholders relating to Fund distributions or the redemption of Fund shares. Total returns for periods less than one full year are not annualized. |
| | (f) | | The Fund’s portfolio turnover rate is calculated in accordance with regulatory requirements, without regard to transactions involving short term investments. If such transactions were included, the Fund’s portfolio turnover rate may be higher. |
| | |
| The accompanying notes are an integral part of these financial statements. | | 73 |
GOLDMAN SACHS FOCUSED VALUE FUND
Financial Highlights(continued)
Selected Share Data for a Share Outstanding Throughout Each Period
| | | | | | | | | | | | | | | | | | | | | | |
| | | | | Goldman Sachs Focused Value Fund | |
| | | | | Institutional Shares | |
| | | | | Six Months Ended
February 28, 2019
(Unaudited) | | | Year Ended August 31, | | | Period Ended August 31, 2015(a) | |
| | | | | 2018 | | | 2017 | | | 2016 | |
| | Per Share Data | | | | | | | | | | | | | | | | | | | | |
| | | | | | |
| | Net asset value, beginning of period | | $ | 11.13 | | | $ | 11.14 | | | $ | 9.92 | | | $ | 9.29 | | | $ | 10.00 | |
| | | | | | |
| | Net investment income(b) | | | 0.07 | | | | 0.09 | | | | 0.15 | | | | 0.16 | | | | 0.01 | |
| | | | | | |
| | Net realized and unrealized gain (loss) | | | (0.33 | ) | | | 0.88 | | | | 1.21 | | | | 0.52 | | | | (0.72 | ) |
| | | | | | |
| | Total from investment operations | | | (0.26 | ) | | | 0.97 | | | | 1.36 | | | | 0.68 | | | | (0.71 | ) |
| | | | | | |
| | Distributions to shareholders from net investment income | | | (0.10 | ) | | | (0.12 | ) | | | (0.14 | ) | | | (0.05 | ) | | | — | |
| | | | | | |
| | Distributions to shareholders from net realized gains | | | (0.51 | ) | | | (0.86 | ) | | | — | | | | — | | | | — | |
| | | | | | |
| | Total distributions | | | (0.61 | ) | | | (0.98 | ) | | | (0.14 | ) | | | (0.05 | ) | | | — | |
| | | | | | |
| | Net asset value, end of period | | $ | 10.26 | | | $ | 11.13 | | | $ | 11.14 | | | $ | 9.92 | | | $ | 9.29 | |
| | | | | | |
| | Total return(c) | | | (1.93 | )% | | | 9.06 | % | | | 13.79 | % | | | 7.33 | % | | | (7.10 | )% |
| | | | | | |
| | Net assets, end of period (in 000s) | | $ | 647 | | | $ | 1,007 | | | $ | 4,802 | | | $ | 3,206 | | | $ | 1,741 | |
| | | | | | |
| | Ratio of net expenses to average net assets | | | 0.73 | %(d) | | | 0.73 | % | | | 0.73 | % | | | 0.73 | % | | | 0.74 | %(d) |
| | | | | | |
| | Ratio of total expenses to average net assets | | | 6.58 | %(d) | | | 4.40 | % | | | 7.40 | % | | | 13.52 | % | | | 25.15 | %(d) |
| | | | | | |
| | Ratio of net investment income to average net assets | | | 1.34 | %(d) | | | 0.86 | % | | | 1.39 | % | | | 1.73 | % | | | 1.37 | %(d) |
| | | | | | |
| | Portfolio turnover rate(e) | | | 57 | % | | | 204 | % | | | 126 | % | | | 161 | % | | | 2 | % |
| | (a) | | Commenced operations on July 31, 2015. |
| | (b) | | Calculated based on the average shares outstanding methodology. |
| | (c) | | Assumes investment at the NAV at the beginning of the period, reinvestment of all dividends and distributions, a complete redemption of the investment at the NAV at the end of the period and no sales or redemption charges. Total returns would be reduced if a sales or redemption charge was taken into account. Returns do not reflect the impact of taxes to shareholders relating to Fund distributions or the redemption of Fund shares. Total returns for periods less than one full year are not annualized. |
| | (e) | | The Fund’s portfolio turnover rate is calculated in accordance with regulatory requirements, without regard to transactions involving short term investments. If such transactions were included, the Fund’s portfolio turnover rate may be higher. |
| | |
| 74 | | The accompanying notes are an integral part of these financial statements. |
GOLDMAN SACHS FOCUSED VALUE FUND
Financial Highlights(continued)
Selected Share Data for a Share Outstanding Throughout Each Period
| | | | | | | | | | | | | | | | | | | | | | |
| | | | | Goldman Sachs Focused Value Fund | |
| | | | | Investor Shares | |
| | | | | Six Months Ended
February 28, 2019
(Unaudited) | | | Year Ended August 31, | | | Period Ended August 31, 2015(a) | |
| | | | | 2018 | | | 2017 | | | 2016 | |
| | Per Share Data | | | | | | | | | | | | | | | | | | | | |
| | | | | | |
| | Net asset value, beginning of period | | $ | 11.13 | | | $ | 11.13 | | | $ | 9.91 | | | $ | 9.29 | | | $ | 10.00 | |
| | | | | | |
| | Net investment income(b) | | | 0.06 | | | | 0.08 | | | | 0.13 | | | | 0.15 | | | | 0.01 | |
| | | | | | |
| | Net realized and unrealized gain (loss) | | | (0.34 | ) | | | 0.88 | | | | 1.22 | | | | 0.51 | | | | (0.72 | ) |
| | | | | | |
| | Total from investment operations | | | (0.28 | ) | | | 0.96 | | | | 1.35 | | | | 0.66 | | | | (0.71 | ) |
| | | | | | |
| | Distributions to shareholders from net investment income | | | (0.11 | ) | | | (0.10 | ) | | | (0.13 | ) | | | (0.04 | ) | | | — | |
| | | | | | |
| | Distributions to shareholders from net realized gains | | | (0.51 | ) | | | (0.86 | ) | | | — | | | | — | | | | — | |
| | | | | | |
| | Total distributions | | | (0.62 | ) | | | (0.96 | ) | | | (0.13 | ) | | | (0.04 | ) | | | — | |
| | | | | | |
| | Net asset value, end of period | | $ | 10.23 | | | $ | 11.13 | | | $ | 11.13 | | | $ | 9.91 | | | $ | 9.29 | |
| | | | | | |
| | Total return(c) | | | (2.14 | )% | | | 9.01 | % | | | 13.65 | % | | | 7.26 | % | | | (7.20 | )% |
| | | | | | |
| | Net assets, end of period (in 000s) | | $ | 30 | | | $ | 31 | | | $ | 28 | | | $ | 25 | | | $ | 23 | |
| | | | | | |
| | Ratio of net expenses to average net assets | | | 0.86 | %(d) | | | 0.87 | % | | | 0.88 | % | | | 0.88 | % | | | 0.89 | %(d) |
| | | | | | |
| | Ratio of total expenses to average net assets | | | 6.89 | %(d) | | | 4.77 | % | | | 7.61 | % | | | 14.28 | % | | | 25.30 | %(d) |
| | | | | | |
| | Ratio of net investment loss to average net assets | | | 1.23 | %(d) | | | 0.72 | % | | | 1.20 | % | | | 1.58 | % | | | 1.21 | %(d) |
| | | | | | |
| | Portfolio turnover rate(e) | | | 57 | % | | | 204 | % | | | 126 | % | | | 161 | % | | | 2 | % |
| | (a) | | Commenced operations on July 31, 2015. |
| | (b) | | Calculated based on the average shares outstanding methodology. |
| | (c) | | Assumes investment at the NAV at the beginning of the period, reinvestment of all dividends and distributions, a complete redemption of the investment at the NAV at the end of the period and no sales or redemption charges. Total returns would be reduced if a sales or redemption charge was taken into account. Returns do not reflect the impact of taxes to shareholders relating to Fund distributions or the redemption of Fund shares. Total returns for periods less than one full year are not annualized. |
| | (e) | | The Fund’s portfolio turnover rate is calculated in accordance with regulatory requirements, without regard to transactions involving short term investments. If such transactions were included, the Fund’s portfolio turnover rate may be higher. |
| | |
| The accompanying notes are an integral part of these financial statements. | | 75 |
GOLDMAN SACHS FOCUSED VALUE FUND
Financial Highlights(continued)
Selected Share Data for a Share Outstanding Throughout Each Period
| | | | | | | | | | |
| | | | | Goldman Sachs Focused Value Fund | |
| | | | | Class P Shares | |
| | | | | Six Months Ended
February 28, 2019
(Unaudited) | | | Period Ended August 31, 2018(a) | |
| | | |
| | Per Share Data | |
| | | |
| | Net asset value, beginning of period | | $ | 11.15 | | | $ | 10.54 | |
| | | |
| | Net investment income(b) | | | 0.07 | | | | 0.04 | |
| | | |
| | Net realized and unrealized gain (loss) | | | (0.34 | ) | | | 0.57 | |
| | | |
| | Total from investment operations | | | (0.27 | ) | | | 0.61 | |
| | | |
| | Distributions to shareholders from net investment income | | | (0.13 | ) | | | — | |
| | | |
| | Distributions to shareholders from net realized gains | | | (0.51 | ) | | | — | |
| | | |
| | Total distributions | | | (0.64 | ) | | | — | |
| | | |
| | Net asset value, end of period | | $ | 10.24 | | | $ | 11.15 | |
| | | |
| | Total return(c) | | | (2.06 | )% | | | 5.79 | % |
| | | |
| | Net assets, end of period (in 000s) | | $ | 3,637 | | | $ | 5,652 | |
| | | |
| | Ratio of net expenses to average net assets(d) | | | 0.72 | % | | | 0.72 | % |
| | | |
| | Ratio of total expenses to average net assets(d) | | | 6.56 | % | | | 5.91 | % |
| | | |
| | Ratio of net investment income to average net assets(d) | | | 1.31 | % | | | 0.89 | % |
| | | |
| | Portfolio turnover rate(e) | | | 57 | % | | | 204 | % |
| | (a) | | Class P Shares commenced operations April 17, 2018. |
| | (b) | | Calculated based on the average shares outstanding methodology. |
| | (c) | | Assumes investment at the NAV at the beginning of the period, reinvestment of all dividends and distributions, a complete redemption of the investment at the NAV at the end of the period and no sales or redemption charges. Total returns would be reduced if a sales or redemption charge was taken into account. Returns do not reflect the impact of taxes to shareholders relating to Fund distributions or the redemption of Fund shares. Total returns for periods less than one full year are not annualized. |
| | (e) | | The Fund’s portfolio turnover rate is calculated in accordance with regulatory requirements, without regard to transactions involving short term investments. If such transactions were included, the Fund’s portfolio turnover rate may be higher. |
| | |
| 76 | | The accompanying notes are an integral part of these financial statements. |
GOLDMAN SACHS FOCUSED VALUE FUND
Financial Highlights(continued)
Selected Share Data for a Share Outstanding Throughout Each Period
| | | | | | | | | | | | | | | | | | | | | | |
| | | | | Goldman Sachs Focused Value Fund | |
| | | | | Class R Shares | |
| | | | | Six Months Ended
February 28, 2019
(Unaudited) | | | Year Ended August 31, | | | Period Ended August 31, 2015(a) | |
| | | | | 2018 | | | 2017 | | | 2016 | |
| | Per Share Data | | | | | | | | | | | | | | | | | | | | |
| | | | | | |
| | Net asset value, beginning of period | | $ | 11.07 | | | $ | 11.09 | | | $ | 9.88 | | | $ | 9.28 | | | $ | 10.00 | |
| | | | | | |
| | Net investment income(b) | | | 0.04 | | | | 0.02 | | | | 0.07 | | | | 0.10 | | | | 0.01 | |
| | | | | | |
| | Net realized and unrealized gain (loss) | | | (0.33 | ) | | | 0.87 | | | | 1.22 | | | | 0.52 | | | | (0.73 | ) |
| | | | | | |
| | Total from investment operations | | | (0.29 | ) | | | 0.89 | | | | 1.29 | | | | 0.62 | | | | (0.72 | ) |
| | | | | | |
| | Distributions to shareholders from net investment income | | | (0.06 | ) | | | (0.05 | ) | | | (0.08 | ) | | | (0.02 | ) | | | — | |
| | | | | | |
| | Distributions to shareholder from net realized gains | | | (0.51 | ) | | | (0.86 | ) | | | — | | | | — | | | | — | |
| | | | | | |
| | Total distributions | | | (0.57 | ) | | | (0.91 | ) | | | (0.08 | ) | | | (0.02 | ) | | | — | |
| | | | | | |
| | Net asset value, end of period | | $ | 10.21 | | | $ | 11.07 | | | $ | 11.09 | | | $ | 9.88 | | | $ | 9.28 | |
| | | | | | |
| | Total return(c) | | | (2.30 | )% | | | 8.35 | % | | | 13.08 | % | | | 6.60 | % | | | (7.10 | )% |
| | | | | | |
| | Net assets, end of period (in 000s) | | $ | 30 | | | $ | 30 | | | $ | 28 | | | $ | 25 | | | $ | 23 | |
| | | | | | |
| | Ratio of net expenses to average net assets | | | 1.36 | %(d) | | | 1.37 | % | | | 1.38 | % | | | 1.38 | % | | | 1.39 | %(d) |
| | | | | | |
| | Ratio of total expenses to average net assets | | | 7.39 | %(d) | | | 5.27 | % | | | 8.12 | % | | | 14.79 | % | | | 25.80 | %(d) |
| | | | | | |
| | Ratio of net investment income to average net assets | | | 0.73 | %(d) | | | 0.22 | % | | | 0.70 | % | | | 1.08 | % | | | 0.71 | %(d) |
| | | | | | |
| | Portfolio turnover rate(e) | | | 57 | % | | | 204 | % | | | 126 | % | | | 161 | % | | | 2 | % |
| | (a) | | Commenced operations on July 31, 2015. |
| | (b) | | Calculated based on the average shares outstanding methodology. |
| | (c) | | Assumes investment at the NAV at the beginning of the period, reinvestment of all dividends and distributions, a complete redemption of the investment at the NAV at the end of the period and no sales or redemption charges. Total returns would be reduced if a sales or redemption charge was taken into account. Returns do not reflect the impact of taxes to shareholders relating to Fund distributions or the redemption of Fund shares. Total returns for periods less than one full year are not annualized. |
| | (e) | | The Fund’s portfolio turnover rate is calculated in accordance with regulatory requirements, without regard to transactions involving short term investments. If such transactions were included, the Fund’s portfolio turnover rate may be higher. |
| | |
| The accompanying notes are an integral part of these financial statements. | | 77 |
GOLDMAN SACHS FOCUSED VALUE FUND
Financial Highlights(continued)
Selected Share Data for a Share Outstanding Throughout Each Period
| | | | | | | | | | | | | | | | | | | | | | |
| | | | | Goldman Sachs Focused Value Fund | |
| | | | | Class R6 Shares | |
| | | | | Six Months Ended
February 28, 2019
(Unaudited) | | | Year Ended August 31, | | | Period Ended August 31, 2015(a) | |
| | | | | 2018 | | | 2017 | | | 2016 | |
| | Per Share Data | | | | | | | | | | | | | | | | | | | | |
| | | | | | |
| | Net asset value, beginning of period | | $ | 11.14 | | | $ | 11.15 | | | $ | 9.92 | | | $ | 9.29 | | | $ | 10.00 | |
| | | | | | |
| | Net investment income(b) | | | 0.07 | | | | 0.10 | | | | 0.15 | | | | 0.16 | | | | 0.01 | |
| | | | | | |
| | Net realized and unrealized gain (loss) | | | (0.33 | ) | | | 0.87 | | | | 1.22 | | | | 0.52 | | | | (0.72 | ) |
| | | | | | |
| | Total from investment operations | | | (0.26 | ) | | | 0.97 | | | | 1.37 | | | | 0.68 | | | | (0.71 | ) |
| | | | | | |
| | Distributions to shareholders from net investment income | | | (0.13 | ) | | | (0.12 | ) | | | (0.14 | ) | | | (0.05 | ) | | | — | |
| | | | | | |
| | Distributions to shareholders from net realized gains | | | (0.51 | ) | | | (0.86 | ) | | | — | | | | — | | | | — | |
| | | | | | |
| | Total distributions | | | (0.64 | ) | | | (0.98 | ) | | | (0.14 | ) | | | (0.05 | ) | | | — | |
| | | | | | |
| | Net asset value, end of period | | $ | 10.24 | | | $ | 11.14 | | | $ | 11.15 | | | $ | 9.92 | | | $ | 9.29 | |
| | | | | | |
| | Total return(c) | | | (1.98 | )% | | | 9.06 | % | | | 13.91 | % | | | 7.34 | % | | | (7.10 | )% |
| | | | | | |
| | Net assets, end of period (in 000s) | | $ | 30 | | | $ | 31 | | | $ | 28 | | | $ | 25 | | | $ | 23 | |
| | | | | | |
| | Ratio of net expenses to average net assets | | | 0.72 | %(d) | | | 0.72 | % | | | 0.71 | % | | | 0.71 | % | | | 0.72 | %(d) |
| | | | | | |
| | Ratio of total expenses to average net assets | | | 6.74 | %(d) | | | 4.64 | % | | | 7.46 | % | | | 14.11 | % | | | 25.14 | %(d) |
| | | | | | |
| | Ratio of net investment income to average net assets | | | 1.37 | %(d) | | | 0.87 | % | | | 1.37 | % | | | 1.75 | % | | | 1.39 | %(d) |
| | | | | | |
| | Portfolio turnover rate(e) | | | 57 | % | | | 204 | % | | | 126 | % | | | 161 | % | | | 2 | % |
| | (a) | | Commenced operations on July 31, 2015. |
| | (b) | | Calculated based on the average shares outstanding methodology. |
| | (c) | | Assumes investment at the NAV at the beginning of the period, reinvestment of all dividends and distributions, a complete redemption of the investment at the NAV at the end of the period and no sales or redemption charges. Total returns would be reduced if a sales or redemption charge was taken into account. Returns do not reflect the impact of taxes to shareholders relating to Fund distributions or the redemption of Fund shares. Total returns for periods less than one full year are not annualized. |
| | (e) | | The Fund’s portfolio turnover rate is calculated in accordance with regulatory requirements, without regard to transactions involving short term investments. If such transactions were included, the Fund’s portfolio turnover rate may be higher. |
| | |
| 78 | | The accompanying notes are an integral part of these financial statements. |
GOLDMAN SACHS LARGE CAP VALUE FUND
Financial Highlights(continued)
Selected Share Data for a Share Outstanding Throughout Each Period
| | | | | | | | | | | | | | | | | | | | | | | | | | |
| | | | | Goldman Sachs Large Cap Value Fund | |
| | | | | Class A Shares | |
| | | | | Six Months Ended
February 28, 2019
(Unaudited) | | | Year Ended August 31, | |
| | | | | 2018 | | | 2017 | | | 2016 | | | 2015 | | | 2014 | |
| | Per Share Data | | | | | | | | | | | | | | | | | | | | | | | | |
| | | | | | | |
| | Net asset value, beginning of period | | $ | 16.16 | | | $ | 17.25 | | | $ | 16.08 | | | $ | 16.45 | | | $ | 18.50 | | | $ | 15.06 | |
| | | | | | | |
| | Net investment income(a) | | | 0.08 | | | | 0.13 | | | | 0.19 | | | | 0.24 | | | | 0.16 | | | | 0.13 | |
| | | | | | | |
| | Net realized and unrealized gain (loss) | | | (0.57 | ) | | | 1.35 | | | | 1.26 | | | | 0.95 | | | | (1.11 | ) | | | 3.41 | |
| | | | | | | |
| | Total from investment operations | | | (0.49 | ) | | | 1.48 | | | | 1.45 | | | | 1.19 | | | | (0.95 | ) | | | 3.54 | |
| | | | | | | |
| | Distributions to shareholders from net investment income | | | (0.14 | ) | | | (0.21 | ) | | | (0.28 | ) | | | (0.12 | ) | | | (0.14 | ) | | | (0.10 | ) |
| | | | | | | |
| | Distributions to shareholders from net realized gains | | | (1.51 | ) | | | (2.36 | ) | | | — | | | | (1.44 | ) | | | (0.96 | ) | | | — | |
| | | | | | | |
| | Total distributions | | | (1.65 | ) | | | (2.57 | ) | | | (0.28 | ) | | | (1.56 | ) | | | (1.10 | ) | | | (0.10 | ) |
| | | | | | | |
| | Net asset value, end of period | | $ | 14.02 | | | $ | 16.16 | | | $ | 17.25 | | | $ | 16.08 | | | $ | 16.45 | | | $ | 18.50 | |
| | | | | | | |
| | Total return(b) | | | (2.40 | )% | | | 9.29 | % | | | 9.04 | % | | | 7.73 | % | | | (5.51 | )% | | | 23.62 | % |
| | | | | | | |
| | Net assets, end of period (in 000s) | | $ | 89,758 | | | $ | 92,226 | | | $ | 153,608 | | | $ | 197,754 | | | $ | 234,810 | | | $ | 260,256 | |
| | | | | | | |
| | Ratio of net expenses to average net assets | | | 1.11 | %(c) | | | 1.11 | % | | | 1.14 | % | | | 1.18 | % | | | 1.17 | % | | | 1.19 | % |
| | | | | | | |
| | Ratio of total expenses to average net assets | | | 1.27 | %(c) | | | 1.24 | % | | | 1.22 | % | | | 1.22 | % | | | 1.20 | % | | | 1.20 | % |
| | | | | | | |
| | Ratio of net investment income to average net assets | | | 1.16 | %(c) | | | 0.81 | % | | | 1.14 | % | | | 1.54 | % | | | 0.92 | % | | | 0.74 | % |
| | | | | | | |
| | Portfolio turnover rate(d) | | | 33 | % | | | 171 | % | | | 124 | % | | | 116 | % | | | 79 | % | | | 67 | % |
| | (a) | | Calculated based on the average shares outstanding methodology. |
| | (b) | | Assumes investment at the NAV at the beginning of the period, reinvestment of all dividends and distributions, a complete redemption of the investment at the NAV at the end of the period and no sales or redemption charges. Total returns would be reduced if a sales or redemption charge was taken into account. Returns do not reflect the impact of taxes to shareholders relating to Fund distributions or the redemption of Fund shares. Total returns for periods less than one full year are not annualized. |
| | (d) | | The Fund’s portfolio turnover rate is calculated in accordance with regulatory requirements, without regard to transactions involving short term investments. If such transactions were included, the Fund’s portfolio turnover rate may be higher. |
| | |
| The accompanying notes are an integral part of these financial statements. | | 79 |
GOLDMAN SACHS LARGE CAP VALUE FUND
Financial Highlights(continued)
Selected Share Data for a Share Outstanding Throughout Each Period
| | | | | | | | | | | | | | | | | | | | | | | | | | |
| | | | | Goldman Sachs Large Cap Value Fund | |
| | | | | Class C Shares | |
| | | | | Six Months Ended
February 28, 2019
(Unaudited) | | | Year Ended August 31, | |
| | | | | 2018 | | | 2017 | | | 2016 | | | 2015 | | | 2014 | |
| | Per Share Data | | | | | | | | | | | | | | | | | | | | | | | | |
| | | | | | | |
| | Net asset value, beginning of period | | $ | 15.32 | | | $ | 16.51 | | | $ | 15.43 | | | $ | 15.83 | | | $ | 17.86 | | | $ | 14.56 | |
| | | | | | | |
| | Net investment income(a) | | | 0.03 | | | | 0.01 | | | | 0.07 | | | | 0.12 | | | | 0.03 | | | | — | (b) |
| | | | | | | | |
| | Net realized and unrealized gain (loss) | | | (0.54 | ) | | | 1.29 | | | | 1.19 | | | | 0.93 | | | | (1.08 | ) | | | 3.31 | |
| | | | | | | |
| | Total from investment operations | | | (0.51 | ) | | | 1.30 | | | | 1.26 | | | | 1.05 | | | | (1.05 | ) | | | 3.31 | |
| | | | | | | |
| | Distributions to shareholders from net investment income | | | — | | | | (0.13 | ) | | | (0.18 | ) | | | (0.01 | ) | | | (0.02 | ) | | | (0.01 | ) |
| | | | | | | |
| | Distributions to shareholder from net realized gains | | | (1.51 | ) | | | (2.36 | ) | | | — | | | | (1.44 | ) | | | (0.96 | ) | | | — | |
| | | | | | | |
| | Total distributions | | | (1.51 | ) | | | (2.49 | ) | | | (0.18 | ) | | | (1.45 | ) | | | (0.98 | ) | | | (0.01 | ) |
| | | | | | | |
| | Net asset value, end of period | | $ | 13.30 | | | $ | 15.32 | | | $ | 16.51 | | | $ | 15.43 | | | $ | 15.83 | | | $ | 17.86 | |
| | | | | | | |
| | Total return(c) | | | (2.77 | )% | | | 8.46 | % | | | 8.18 | % | | | 7.01 | % | | | (6.28 | )% | | | 22.73 | % |
| | | | | | | |
| | Net assets, end of period (in 000s) | | $ | 23,556 | | | $ | 36,819 | | | $ | 39,403 | | | $ | 41,587 | | | $ | 42,221 | | | $ | 45,535 | |
| | | | | | | |
| | Ratio of net expenses to average net assets | | | 1.86 | %(d) | | | 1.86 | % | | | 1.89 | % | | | 1.93 | % | | | 1.92 | % | | | 1.94 | % |
| | | | | | | |
| | Ratio of total expenses to average net assets | | | 2.02 | %(d) | | | 1.99 | % | | | 1.97 | % | | | 1.97 | % | | | 1.95 | % | | | 1.95 | % |
| | | | | | | |
| | Ratio of net investment income (loss) to average net assets | | | 0.40 | %(d) | | | 0.06 | % | | | 0.41 | % | | | 0.79 | % | | | 0.16 | % | | | (0.01 | )% |
| | | | | | | |
| | Portfolio turnover rate(e) | | | 33 | % | | | 171 | % | | | 124 | % | | | 116 | % | | | 79 | % | | | 67 | % |
| | (a) | | Calculated based on the average shares outstanding methodology. |
| | (b) | | Amount is less than $0.005 per share. |
| | (c) | | Assumes investment at the NAV at the beginning of the period, reinvestment of all dividends and distributions, a complete redemption of the investment at the NAV at the end of the period and no sales or redemption charges. Total returns would be reduced if a sales or redemption charge was taken into account. Returns do not reflect the impact of taxes to shareholders relating to Fund distributions or the redemption of Fund shares. Total returns for periods less than one full year are not annualized. |
| | (e) | | The Fund’s portfolio turnover rate is calculated in accordance with regulatory requirements, without regard to transactions involving short term investments. If such transactions were included, the Fund’s portfolio turnover rate may be higher. |
| | |
| 80 | | The accompanying notes are an integral part of these financial statements. |
GOLDMAN SACHS LARGE CAP VALUE FUND
Financial Highlights(continued)
Selected Share Data for a Share Outstanding Throughout Each Period
| | | | | | | | | | | | | | | | | | | | | | | | | | |
| | | | | Goldman Sachs Large Cap Value Fund | |
| | | | | Institutional Shares | |
| | | | | Six Months Ended
February 28, 2019
(Unaudited) | | | Year Ended August 31, | |
| | | | | 2018 | | | 2017 | | | 2016 | | | 2015 | | | 2014 | |
| | Per Share Data | | | | | | | | | | | | | | | | | | | | | | | | |
| | | | | | | |
| | Net asset value, beginning of period | | $ | 16.32 | | | $ | 17.42 | | | $ | 16.25 | | | $ | 16.61 | | | $ | 18.67 | | | $ | 15.20 | |
| | | | | | | |
| | Net investment income(a) | | | 0.11 | | | | 0.19 | | | | 0.25 | | | | 0.30 | | | | 0.24 | | | | 0.19 | |
| | | | | | | |
| | Net realized and unrealized gain (loss) | | | (0.59 | ) | | | 1.36 | | | | 1.27 | | | | 0.97 | | | | (1.12 | ) | | | 3.45 | |
| | | | | | | |
| | Total from investment operations | | | (0.48 | ) | | | 1.55 | | | | 1.52 | | | | 1.27 | | | | (0.88 | ) | | | 3.64 | |
| | | | | | | |
| | Distributions to shareholders from net investment income | | | (0.18 | ) | | | (0.28 | ) | | | (0.35 | ) | | | (0.19 | ) | | | (0.22 | ) | | | (0.17 | ) |
| | | | | | | |
| | Distributions to shareholders from net realized gains | | | (1.51 | ) | | | (2.37 | ) | | | — | | | | (1.44 | ) | | | (0.96 | ) | | | — | |
| | | | | | | |
| | Total distributions | | | (1.69 | ) | | | (2.65 | ) | | | (0.35 | ) | | | (1.63 | ) | | | (1.18 | ) | | | (0.17 | ) |
| | | | | | | |
| | Net asset value, end of period | | $ | 14.15 | | | $ | 16.32 | | | $ | 17.42 | | | $ | 16.25 | | | $ | 16.61 | | | $ | 18.67 | |
| | | | | | | |
| | Total return(b) | | | (2.28 | )% | | | 9.65 | % | | | 9.41 | % | | | 8.17 | % | | | (5.13 | )% | | | 24.15 | % |
| | | | | | | |
| | Net assets, end of period (in 000s) | | $ | 155,250 | | | $ | 174,803 | | | $ | 645,552 | | | $ | 905,400 | | | $ | 1,037,653 | | | $ | 1,206,895 | |
| | | | | | | |
| | Ratio of net expenses to average net assets | | | 0.79 | %(c) | | | 0.79 | % | | | 0.78 | % | | | 0.78 | % | | | 0.77 | % | | | 0.79 | % |
| | | | | | | |
| | Ratio of total expenses to average net assets | | | 0.88 | %(c) | | | 0.85 | % | | | 0.82 | % | | | 0.82 | % | | | 0.80 | % | | | 0.80 | % |
| | | | | | | |
| | Ratio of net investment income to average net assets | | | 1.47 | %(c) | | | 1.13 | % | | | 1.46 | % | | | 1.93 | % | | | 1.31 | % | | | 1.14 | % |
| | | | | | | |
| | Portfolio turnover rate(d) | | | 33 | % | | | 171 | % | | | 124 | % | | | 116 | % | | | 79 | % | | | 67 | % |
| | (a) | | Calculated based on the average shares outstanding methodology. |
| | (b) | | Assumes investment at the NAV at the beginning of the period, reinvestment of all dividends and distributions, a complete redemption of the investment at the NAV at the end of the period and no sales or redemption charges. Total returns would be reduced if a sales or redemption charge was taken into account. Returns do not reflect the impact of taxes to shareholders relating to Fund distributions or the redemption of Fund shares. Total returns for periods less than one full year are not annualized. |
| | (d) | | The Fund’s portfolio turnover rate is calculated in accordance with regulatory requirements, without regard to transactions involving short term investments. If such transactions were included, the Fund’s portfolio turnover rate may be higher. |
| | |
| The accompanying notes are an integral part of these financial statements. | | 81 |
GOLDMAN SACHS LARGE CAP VALUE FUND
Financial Highlights(continued)
Selected Share Data for a Share Outstanding Throughout Each Period
| | | | | | | | | | | | | | | | | | | | | | | | | | |
| | | | | Goldman Sachs Large Cap Value Fund | |
| | | | | Service Shares | |
| | | | | Six Months Ended
February 28, 2019
(Unaudited) | | | Year Ended August 31, | |
| | | | | 2018 | | | 2017 | | | 2016 | | | 2015 | | | 2014 | |
| | Per Share Data | | | | | | | | | | | | | | | | | | | | | | | | |
| | | | | | | |
| | Net asset value, beginning of period | | $ | 16.03 | | | $ | 17.14 | | | $ | 15.99 | | | $ | 16.36 | | | $ | 18.42 | | | $ | 14.99 | |
| | | | | | | |
| | Net investment income(a) | | | 0.07 | | | | 0.10 | | | | 0.17 | | | | 0.22 | | | | 0.15 | | | | 0.11 | |
| | | | | | | |
| | Net realized and unrealized gain (loss) | | | (0.57 | ) | | | 1.35 | | | | 1.23 | | | | 0.96 | | | | (1.11 | ) | | | 3.40 | |
| | | | | | | |
| | Total from investment operations | | | (0.50 | ) | | | 1.45 | | | | 1.40 | | | | 1.18 | | | | (0.96 | ) | | | 3.51 | |
| | | | | | | |
| | Distributions to shareholders from net investment income | | | (0.05 | ) | | | (0.20 | ) | | | (0.25 | ) | | | (0.11 | ) | | | (0.14 | ) | | | (0.08 | ) |
| | | | | | | |
| | Distributions to shareholders from net realized gains | | | (1.51 | ) | | | (2.36 | ) | | | — | | | | (1.44 | ) | | | (0.96 | ) | | | — | |
| | | | | | | |
| | Total distributions | | | (1.56 | ) | | | (2.56 | ) | | | (0.25 | ) | | | (1.55 | ) | | | (1.10 | ) | | | (0.08 | ) |
| | | | | | | |
| | Net asset value, end of period | | $ | 13.97 | | | $ | 16.03 | | | $ | 17.14 | | | $ | 15.99 | | | $ | 16.36 | | | $ | 18.42 | |
| | | | | | | |
| | Total return(b) | | | (2.52 | )% | | | 9.15 | % | | | 8.80 | % | | | 7.67 | % | | | (5.63 | )% | | | 23.53 | % |
| | | | | | | |
| | Net assets, end of period (in 000s) | | $ | 989 | | | $ | 1,201 | | | $ | 2,914 | | | $ | 3,549 | | | $ | 4,294 | | | $ | 3,185 | |
| | | | | | | |
| | Ratio of net expenses to average net assets | | | 1.29 | %(c) | | | 1.29 | % | | | 1.28 | % | | | 1.28 | % | | | 1.27 | % | | | 1.29 | % |
| | | | | | | |
| | Ratio of total expenses to average net assets | | | 1.38 | %(c) | | | 1.35 | % | | | 1.32 | % | | | 1.32 | % | | | 1.30 | % | | | 1.30 | % |
| | | | | | | |
| | Ratio of net investment income to average net assets | | | 0.96 | %(c) | | | 0.64 | % | | | 1.01 | % | | | 1.45 | % | | | 0.84 | % | | | 0.64 | % |
| | | | | | | |
| | Portfolio turnover rate(d) | | | 33 | % | | | 171 | % | | | 124 | % | | | 116 | % | | | 79 | % | | | 67 | % |
| | (a) | | Calculated based on the average shares outstanding methodology. |
| | (b) | | Assumes investment at the NAV at the beginning of the period, reinvestment of all dividends and distributions, a complete redemption of the investment at the NAV at the end of the period and no sales or redemption charges. Total returns would be reduced if a sales or redemption charge was taken into account. Returns do not reflect the impact of taxes to shareholders relating to Fund distributions or the redemption of Fund shares. Total returns for periods less than one full year are not annualized. |
| | (d) | | The Fund’s portfolio turnover rate is calculated in accordance with regulatory requirements, without regard to transactions involving short term investments. If such transactions were included, the Fund’s portfolio turnover rate may be higher. |
| | |
| 82 | | The accompanying notes are an integral part of these financial statements. |
GOLDMAN SACHS LARGE CAP VALUE FUND
Financial Highlights(continued)
Selected Share Data for a Share Outstanding Throughout Each Period
| | | | | | | | | | | | | | | | | | | | | | | | | | |
| | | | | Goldman Sachs Large Cap Value Fund | |
| | | | | Investor Shares | |
| | | | | Six Months Ended
February 28, 2019
(Unaudited) | | | Year Ended August 31, | |
| | | | | 2018 | | | 2017 | | | 2016 | | | 2015 | | | 2014 | |
| | Per Share Data | | | | | | | | | | | | | | | | | | | | | | | | |
| | | | | | | |
| | Net asset value, beginning of period | | $ | 16.17 | | | $ | 17.28 | | | $ | 16.11 | | | $ | 16.47 | | | $ | 18.34 | | | $ | 14.94 | |
| | | | | | | |
| | Net investment income(a) | | | 0.10 | | | | 0.17 | | | | 0.25 | | | | 0.27 | | | | 0.21 | | | | 0.17 | |
| | | | | | | |
| | Net realized and unrealized gain (loss) | | | (0.59 | ) | | | 1.36 | | | | 1.23 | | | | 0.97 | | | | (1.12 | ) | | | 3.38 | |
| | | | | | | |
| | Total from investment operations | | | (0.49 | ) | | | 1.53 | | | | 1.48 | | | | 1.24 | | | | (0.91 | ) | | | 3.55 | |
| | | | | | | |
| | Distributions to shareholders from net investment income | | | (0.17 | ) | | | (0.27 | ) | | | (0.31 | ) | | | (0.16 | ) | | | — | | | | (0.15 | ) |
| | | | | | | |
| | Distributions to shareholders from net realized gains | | | (1.51 | ) | | | (2.37 | ) | | | — | | | | (1.44 | ) | | | (0.96 | ) | | | — | |
| | | | | | | |
| | Total distributions | | | (1.68 | ) | | | (2.64 | ) | | | (0.31 | ) | | | (1.60 | ) | | | (0.96 | ) | | | (0.15 | ) |
| | | | | | | |
| | Net asset value, end of period | | $ | 14.00 | | | $ | 16.17 | | | $ | 17.28 | | | $ | 16.11 | | | $ | 16.47 | | | $ | 18.34 | |
| | | | | | | |
| | Total return(b) | | | (2.36 | )% | | | 9.61 | % | | | 9.26 | % | | | 8.05 | % | | | (5.29 | )% | | | 23.93 | % |
| | | | | | | |
| | Net assets, end of period (in 000s) | | $ | 5,619 | | | $ | 7,447 | | | $ | 6,516 | | | $ | 3,654 | | | $ | 6,878 | | | $ | 6,618 | |
| | | | | | | |
| | Ratio of net expenses to average net assets | | | 0.86 | %(c) | | | 0.86 | % | | | 0.88 | % | | | 0.93 | % | | | 0.92 | % | | | 0.95 | % |
| | | | | | | |
| | Ratio of total expenses to average net assets | | | 1.02 | %(c) | | | 0.99 | % | | | 0.97 | % | | | 0.97 | % | | | 0.95 | % | | | 0.95 | % |
| | | | | | | |
| | Ratio of net investment loss to average net assets | | | 1.39 | %(c) | | | 1.06 | % | | | 1.47 | % | | | 1.77 | % | | | 1.17 | % | | | 1.05 | % |
| | | | | | | |
| | Portfolio turnover rate(d) | | | 33 | % | | | 171 | % | | | 124 | % | | | 116 | % | | | 79 | % | | | 67 | % |
| | (a) | | Calculated based on the average shares outstanding methodology. |
| | (b) | | Assumes investment at the NAV at the beginning of the period, reinvestment of all dividends and distributions, a complete redemption of the investment at the NAV at the end of the period and no sales or redemption charges. Total returns would be reduced if a sales or redemption charge was taken into account. Returns do not reflect the impact of taxes to shareholders relating to Fund distributions or the redemption of Fund shares. Total returns for periods less than one full year are not annualized. |
| | (d) | | The Fund’s portfolio turnover rate is calculated in accordance with regulatory requirements, without regard to transactions involving short term investments. If such transactions were included, the Fund’s portfolio turnover rate may be higher. |
| | |
| The accompanying notes are an integral part of these financial statements. | | 83 |
GOLDMAN SACHS LARGE CAP VALUE FUND
Financial Highlights(continued)
Selected Share Data for a Share Outstanding Throughout Each Period
| | | | | | | | | | |
| | | | | Goldman Sachs Large Cap Value Fund | |
| | | | | Class P Shares | |
| | | | | Six Months Ended
February 28, 2019
(Unaudited) | | | Period Ended
August 31, 2018(a) | |
| | | | | | | | | | |
| | | |
| | Net asset value, beginning of Period | | $ | 16.66 | | | $ | 15.81 | |
| | | |
| | Net investment income(b) | | | 0.11 | | | | 0.08 | |
| | | |
| | Net realized and unrealized gain (loss) | | | (0.59 | ) | | | 0.77 | |
| | | |
| | Total from investment operations | | | (0.48 | ) | | | 0.85 | |
| | | |
| | Distributions to shareholders from net investment income | | | (0.19 | ) | | | — | |
| | | |
| | Distributions to shareholders from net realized gains | | | (1.51 | ) | | | — | |
| | | |
| | Total Distributions | | | (1.70 | ) | | | — | |
| | | |
| | Net asset value, end of Period | | $ | 14.48 | | | $ | 16.66 | |
| | | |
| | Total return(c) | | | (2.23 | )% | | | 5.38 | % |
| | | |
| | Net assets, end of period (in 000s) | | $ | 211,632 | | | $ | 248,012 | |
| | | |
| | Ratio of net expenses to average net assets(d) | | | 0.78 | % | | | 0.78 | % |
| | | |
| | Ratio of total expenses to average net assets(d) | | | 0.87 | % | | | 0.85 | % |
| | | |
| | Ratio of net investment income to average net assets(d) | | | 1.48 | % | | | 1.26 | % |
| | | |
| | Portfolio turnover rate(e) | | | 33 | % | | | 171 | % |
| | (a) | | Commenced operations April 17, 2018. |
| | (b) | | Calculated based on the average shares outstanding methodology. |
| | (c) | | Assumes investment at the NAV at the beginning of the period, reinvestment of all dividends and distributions, a complete redemption of the investment at the NAV at the end of the period and no sales or redemption charges. Total returns would be reduced if a sales or redemption charge was taken into account. Returns do not reflect the impact of taxes to shareholders relating to Fund distributions or the redemption of Fund shares. Total returns for periods less than one full year are not annualized. |
| | (e) | | The Fund’s portfolio turnover rate is calculated in accordance with regulatory requirements, without regard to transactions involving short term investments. If such transactions were included, the Fund’s portfolio turnover rate may be higher. |
| | |
| 84 | | The accompanying notes are an integral part of these financial statements. |
GOLDMAN SACHS LARGE CAP VALUE FUND
Financial Highlights(continued)
Selected Share Data for a Share Outstanding Throughout Each Period
| | | | | | | | | | | | | | | | | | | | | | | | | | |
| | | | | Goldman Sachs Large Cap Value Fund | |
| | | | | Class R Shares | |
| | | | | Six Months Ended
February 28, 2019
(Unaudited) | | | Year Ended August 31, | |
| | | | | 2018 | | | 2017 | | | 2016 | | | 2015 | | | 2014 | |
| | Per Share Data | | | | | | | | | | | | | | | | | | | | | | | | |
| | | | | | | |
| | Net asset value, beginning of period | | $ | 15.71 | | | $ | 16.86 | | | $ | 15.73 | | | $ | 16.12 | | | $ | 18.17 | | | $ | 14.80 | |
| | | | | | | |
| | Net investment income(a) | | | 0.06 | | | | 0.09 | | | | 0.15 | | | | 0.20 | | | | 0.12 | | | | 0.08 | |
| | | | | | | |
| | Net realized and unrealized gain (loss) | | | (0.57 | ) | | | 1.32 | | | | 1.22 | | | | 0.94 | | | | (1.09 | ) | | | 3.36 | |
| | | | | | | |
| | Total from investment operations | | | (0.51 | ) | | | 1.41 | | | | 1.37 | | | | 1.14 | | | | (0.97 | ) | | | 3.44 | |
| | | | | | | |
| | Distributions to shareholders from net investment income | | | (0.10 | ) | | | (0.20 | ) | | | (0.24 | ) | | | (0.09 | ) | | | (0.12 | ) | | | (0.07 | ) |
| | | | | | | |
| | Distributions to shareholders from net realized gains | | | (1.51 | ) | | | (2.36 | ) | | | — | | | | (1.44 | ) | | | (0.96 | ) | | | — | |
| | | | | | | |
| | Total distributions | | | (1.61 | ) | | | (2.56 | ) | | | (0.24 | ) | | | (1.53 | ) | | | (1.08 | ) | | | (0.07 | ) |
| | | | | | | |
| | Net asset value, end of period | | $ | 13.59 | | | $ | 15.71 | | | $ | 16.86 | | | $ | 15.73 | | | $ | 16.12 | | | $ | 18.17 | |
| | | | | | | |
| | Total return(b) | | | (2.60 | )% | | | 9.05 | % | | | 8.73 | % | | | 7.51 | % | | | (5.77 | )% | | | 23.33 | % |
| | | | | | | |
| | Net assets, end of period (in 000s) | | $ | 5,153 | | | $ | 5,252 | | | $ | 6,204 | | | $ | 7,130 | | | $ | 7,710 | | | $ | 7,705 | |
| | | | | | | |
| | Ratio of net expenses to average net assets | | | 1.36 | %(c) | | | 1.36 | % | | | 1.39 | % | | | 1.43 | % | | | 1.42 | % | | | 1.44 | % |
| | | | | | | |
| | Ratio of total expenses to average net assets | | | 1.52 | %(c) | | | 1.49 | % | | | 1.47 | % | | | 1.47 | % | | | 1.45 | % | | | 1.45 | % |
| | | | | | | |
| | Ratio of net investment income to average net assets | | | 0.92 | %(c) | | | 0.56 | % | | | 0.90 | % | | | 1.30 | % | | | 0.66 | % | | | 0.49 | % |
| | | | | | | |
| | Portfolio turnover rate(d) | | | 33 | % | | | 171 | % | | | 124 | % | | | 116 | % | | | 79 | % | | | 67 | % |
| | (a) | | Calculated based on the average shares outstanding methodology. |
| | (b) | | Assumes investment at the NAV at the beginning of the period, reinvestment of all dividends and distributions, a complete redemption of the investment at the NAV at the end of the period and no sales or redemption charges. Total returns would be reduced if a sales or redemption charge was taken into account. Returns do not reflect the impact of taxes to shareholders relating to Fund distributions or the redemption of Fund shares. Total returns for periods less than one full year are not annualized. |
| | (d) | | The Fund’s portfolio turnover rate is calculated in accordance with regulatory requirements, without regard to transactions involving short term investments. If such transactions were included, the Fund’s portfolio turnover rate may be higher. |
| | |
| The accompanying notes are an integral part of these financial statements. | | 85 |
GOLDMAN SACHS LARGE CAP VALUE FUND
Financial Highlights(continued)
Selected Share Data for a Share Outstanding Throughout Each Period
| | | | | | | | | | | | | | | | | | | | | | |
| | | | | Goldman Sachs Large Cap Value Fund | |
| | | | | Class R6 Shares | |
| | | | | Six Months Ended
February 28, 2019
(Unaudited) | | | Year Ended August 31, | | | Period Ended
August 31, 2015(a) | |
| | | | | 2018 | | | 2017 | | | 2016 | |
| | Per Share Data | | | | | | | | | | | | | | | | | | | | |
| | | | | | |
| | Net asset value, beginning of period | | $ | 16.66 | | | $ | 17.45 | | | $ | 16.25 | | | $ | 16.61 | | | $ | 17.88 | |
| | | | | | |
| | Net investment income(b) | | | 0.11 | | | | 0.18 | | | | 0.21 | | | | 0.31 | | | | 0.03 | |
| | | | | | |
| | Net realized and unrealized gain (loss) | | | (0.59 | ) | | | 1.39 | | | | 1.34 | | | | 0.96 | | | | (1.30 | ) |
| | | | | | |
| | Total from investment operations | | | (0.48 | ) | | | 1.57 | | | | 1.55 | | | | 1.27 | | | | (1.27 | ) |
| | | | | | |
| | Distributions to shareholders from net investment income | | | (0.19 | ) | | | — | | | | (0.35 | ) | | | (0.19 | ) | | | — | |
| | | | | | |
| | Distributions to shareholders from net realized gains | | | (1.51 | ) | | | (2.36 | ) | | | — | | | | (1.44 | ) | | | — | |
| | | | | | |
| | Total distributions | | | (1.70 | ) | | | (2.36 | ) | | | (0.35 | ) | | | (1.63 | ) | | | — | |
| | | | | | |
| | Net asset value, end of period | | $ | 14.48 | | | $ | 16.66 | | | $ | 17.45 | | | $ | 16.25$ | | | | 16.61 | |
| | | | | | |
| | Total return(c) | | | (2.24 | )% | | | 9.67 | % | | | 9.63 | % | | | 8.21 | % | | | (7.10 | )% |
| | | | | | |
| | Net assets, end of period (in 000s) | | $ | 1,986 | | | $ | 1,106 | | | $ | 11 | | | $ | 121,773 | | | $ | 9 | |
| | | | | | |
| | Ratio of net expenses to average net assets | | | 0.78 | %(d) | | | 0.78 | % | | | 0.76 | % | | | 0.76 | % | | | 0.77 | %(d) |
| | | | | | |
| | Ratio of total expenses to average net assets | | | 0.87 | %(d) | | | 0.85 | % | | | 0.79 | % | | | 0.80 | % | | | 0.81 | %(d) |
| | | | | | |
| | Ratio of net investment income to average net assets | | | 1.55 | %(d) | | | 1.12 | % | | | 1.27 | % | | | 2.05 | % | | | 2.01 | %(d) |
| | | | | | |
| | Portfolio turnover rate(e) | | | 33 | % | | | 171 | % | | | 124 | % | | | 116 | % | | | 79 | % |
| | (a) | | Commenced operations on July 31, 2015. |
| | (b) | | Calculated based on the average shares outstanding methodology. |
| | (c) | | Assumes investment at the NAV at the beginning of the period, reinvestment of all dividends and distributions, a complete redemption of the investment at the NAV at the end of the period and no sales or redemption charges. Total returns would be reduced if a sales or redemption charge was taken into account. Returns do not reflect the impact of taxes to shareholders relating to Fund distributions or the redemption of Fund shares. Total returns for periods less than one full year are not annualized. |
| | (e) | | The Fund’s portfolio turnover rate is calculated in accordance with regulatory requirements, without regard to transactions involving short term investments. If such transactions were included, the Fund’s portfolio turnover rate may be higher. |
| | |
| 86 | | The accompanying notes are an integral part of these financial statements. |
GOLDMAN SACHS MID CAP VALUE FUND
Financial Highlights(continued)
Selected Share Data for a Share Outstanding Throughout Each Period
| | | | | | | | | | | | | | | | | | | | | | | | | | |
| | | | | Goldman Sachs Mid Cap Value Fund | |
| | | | | Class A Shares | |
| | | | | Six Months Ended
February 28, 2019
(Unaudited) | | | Year Ended August 31, | |
| | | | | 2018 | | | 2017 | | | 2016 | | | 2015 | | | 2014 | |
| | Per Share Data | | | | | | | | | | | | | | | | | | | | | | | | |
| | | | | | | |
| | Net asset value, beginning of period | | $ | 36.62 | | | $ | 38.27 | | | $ | 35.25 | | | $ | 38.81 | | | $ | 49.03 | | | $ | 46.08 | |
| | | | | | | |
| | Net investment income(a) | | | 0.07 | | | | 0.08 | | | | 0.19 | | | | 0.32 | | | | 0.13 | | | | 0.18 | |
| | | | | | | |
| | Net realized and unrealized gain (loss) | | | (1.37 | ) | | | 3.71 | | | | 3.20 | | | | 0.56 | | | | (1.75 | ) | | | 10.10 | |
| | | | | | | |
| | Total from investment operations | | | (1.30 | ) | | | 3.79 | | | | 3.39 | | | | 0.88 | | | | (1.62 | ) | | | 10.28 | |
| | | | | | | |
| | Distributions to shareholders from net investment income | | | (0.14 | ) | | | (0.15 | ) | | | (0.37 | ) | | | (0.10 | ) | | | (0.13 | ) | | | (0.22 | ) |
| | | | | | | |
| | Distributions to shareholders from net realized gains | | | (4.71 | ) | | | (5.29 | ) | | | — | | | | (4.34 | ) | | | (8.47 | ) | | | (7.11 | ) |
| | | | | | | |
| | Total distributions | | | (4.85 | ) | | | (5.44 | ) | | | (0.37 | ) | | | (4.44 | ) | | | (8.60 | ) | | | (7.33 | ) |
| | | | | | | |
| | Net asset value, end of period | | $ | 30.47 | | | $ | 36.62 | | | $ | 38.27 | | | $ | 35.25 | | | $ | 38.81 | | | $ | 49.03 | |
| | | | | | | |
| | Total return(b) | | | (2.56 | )% | | | 10.68 | % | | | 9.66 | % | | | 3.00 | % | | | (4.21 | )% | | | 24.77 | % |
| | | | | | | |
| | Net assets, end of period (in 000s) | | $ | 542,912 | | | $ | 630,820 | | | $ | 851,681 | | | $ | 1,363,093 | | | $ | 1,876,387 | | | $ | 3,153,971 | |
| | | | | | | |
| | Ratio of net expenses to average net assets | | | 1.23 | %(c) | | | 1.22 | % | | | 1.17 | % | | | 1.15 | % | | | 1.14 | % | | | 1.14 | % |
| | | | | | | |
| | Ratio of total expenses to average net assets | | | 1.23 | %(c) | | | 1.22 | % | | | 1.17 | % | | | 1.15 | % | | | 1.14 | % | | | 1.14 | % |
| | | | | | | |
| | Ratio of net investment income to average net assets | | | 0.42 | %(c) | | | 0.22 | % | | | 0.51 | % | | | 0.92 | % | | | 0.31 | % | | | 0.38 | % |
| | | | | | | |
| | Portfolio turnover rate(d) | | | 44 | % | | | 137 | % | | | 124 | % | | | 111 | % | | | 95 | % | | | 87 | % |
| | (a) | | Calculated based on the average shares outstanding methodology. |
| | (b) | | Assumes investment at the NAV at the beginning of the period, reinvestment of all dividends and distributions, a complete redemption of the investment at the NAV at the end of the period and no sales or redemption charges. Total returns would be reduced if a sales or redemption charge was taken into account. Returns do not reflect the impact of taxes to shareholders relating to Fund distributions or the redemption of Fund shares. Total returns for periods less than one full year are not annualized. |
| | (d) | | The Fund’s portfolio turnover rate is calculated in accordance with regulatory requirements, without regard to transactions involving short term investments. If such transactions were included, the Fund’s portfolio turnover rate may be higher. |
| | |
| The accompanying notes are an integral part of these financial statements. | | 87 |
GOLDMAN SACHS MID CAP VALUE FUND
Financial Highlights(continued)
Selected Share Data for a Share Outstanding Throughout Each Period
| | | | | | | | | | | | | | | | | | | | | | | | | | |
| | | | | Goldman Sachs Mid Cap Value Fund | |
| | | | | Class C Shares | |
| | | | | Six Months Ended
February 28, 2019
(Unaudited) | | | Year Ended August 31, | |
| | | | | 2018 | | | 2017 | | | 2016 | | | 2015 | | | 2014 | |
| | Per Share Data | | | | | | | | | | | | | | | | | | | | | | | | |
| | | | | | | |
| | Net asset value, beginning of period | | $ | 32.59 | | | $ | 34.68 | | | $ | 32.00 | | | $ | 35.80 | | | $ | 46.05 | | | $ | 43.79 | |
| | | | | | | |
| | Net investment income (loss)(a) | | | (0.04 | ) | | | (0.17 | ) | | | (0.09 | ) | | | 0.05 | | | | (0.19 | ) | | | (0.17 | ) |
| | | | | | | |
| | Net realized and unrealized gain (loss) | | | (1.25 | ) | | | 3.33 | | | | 2.92 | | | | 0.49 | | | | (1.59 | ) | | | 9.54 | |
| | | | | | | |
| | Total from investment operations | | | (1.29 | ) | | | 3.16 | | | | 2.83 | | | | 0.54 | | | | (1.78 | ) | | | 9.37 | |
| | | | | | | |
| | Distributions to shareholders from net investment income | | | — | | | | — | | | | (0.15 | ) | | | — | | | | — | (b) | | | — | |
| | | | | | | |
| | Distributions to shareholders from net realized gains | | | (4.71 | ) | | | (5.25 | ) | | | — | | | | (4.34 | ) | | | (8.47 | ) | | | (7.11 | ) |
| | | | | | | |
| | Total distributions | | | (4.71 | ) | | | (5.25 | ) | | | (0.15 | ) | | | (4.34 | ) | | | (8.47 | ) | | | (7.11 | ) |
| | | | | | | |
| | Net asset value, end of period | | $ | 26.59 | | | $ | 32.59 | | | $ | 34.68 | | | $ | 32.00 | | | $ | 35.80 | | | $ | 46.05 | |
| | | | | | | |
| | Total return(c) | | | (2.96 | )% | | | 9.86 | % | | | 8.86 | % | | | 2.20 | % | | | (4.91 | )% | | | 23.81 | % |
| | | | | | | |
| | Net assets, end of period (in 000s) | | $ | 36,470 | | | $ | 78,897 | | | $ | 102,928 | | | $ | 141,081 | | | $ | 180,780 | | | $ | 202,083 | |
| | | | | | | |
| | Ratio of net expenses to average net assets | | | 1.98 | %(d) | | | 1.97 | % | | | 1.92 | % | | | 1.90 | % | | | 1.89 | % | | | 1.89 | % |
| | | | | | | |
| | Ratio of total expenses to average net assets | | | 1.98 | %(d) | | | 1.97 | % | | | 1.92 | % | | | 1.90 | % | | | 1.89 | % | | | 1.89 | % |
| | | | | | | |
| | Ratio of net investment income (loss) to average net assets | | | (0.31 | )%(d) | | | (0.53 | )% | | | (0.25 | )% | | | 0.16 | % | | | (0.47 | )% | | | (0.38 | )% |
| | | | | | | |
| | Portfolio turnover rate(e) | | | 44 | % | | | 137 | % | | | 124 | % | | | 111 | % | | | 95 | % | | | 87 | % |
| | (a) | | Calculated based on the average shares outstanding methodology. |
| | (b) | | Amount is less than $0.005 per share. |
| | (c) | | Assumes investment at the NAV at the beginning of the period, reinvestment of all dividends and distributions, a complete redemption of the investment at the NAV at the end of the period and no sales or redemption charges. Total returns would be reduced if a sales or redemption charge was taken into account. Returns do not reflect the impact of taxes to shareholders relating to Fund distributions or the redemption of Fund shares. Total returns for periods less than one full year are not annualized. |
| | (e) | | The Fund’s portfolio turnover rate is calculated in accordance with regulatory requirements, without regard to transactions involving short term investments. If such transactions were included, the Fund’s portfolio turnover rate may be higher. |
| | |
| 88 | | The accompanying notes are an integral part of these financial statements. |
GOLDMAN SACHS MID CAP VALUE FUND
Financial Highlights(continued)
Selected Share Data for a Share Outstanding Throughout Each Period
| | | | | | | | | | | | | | | | | | | | | | | | | | |
| | | | | Goldman Sachs Mid Cap Value Fund | |
| | | | | Institutional Shares | |
| | | | | Six Months Ended
February 28, 2019
(Unaudited) | | | Year Ended August 31, | |
| | | | | 2018 | | | 2017 | | | 2016 | | | 2015 | | | 2014 | |
| | Per Share Data | | | | | | | | | | | | | | | | | | | | | | | | |
| | | | | | | |
| | Net asset value, beginning of period | | $ | 37.06 | | | $ | 38.68 | | | $ | 35.64 | | | $ | 39.22 | | | $ | 49.55 | | | $ | 46.52 | |
| | | | | | | |
| | Net investment income(a) | | | 0.13 | | | | 0.21 | | | | 0.34 | | | | 0.46 | | | | 0.29 | | | | 0.36 | |
| | | | | | | |
| | Net realized and unrealized gain (loss) | | | (1.40 | ) | | | 3.77 | | | | 3.25 | | | | 0.56 | | | | (1.75 | ) | | | 10.19 | |
| | | | | | | |
| | Total from investment operations | | | (1.27 | ) | | | 3.98 | | | | 3.59 | | | | 1.02 | | | | (1.46 | ) | | | 10.55 | |
| | | | | | | |
| | Distributions to shareholders from net investment income | | | (0.27 | ) | | | (0.26 | ) | | | (0.55 | ) | | | (0.26 | ) | | | (0.40 | ) | | | (0.41 | ) |
| | | | | | | |
| | Distributions to shareholders from net realized gains | | | (4.71 | ) | | | (5.34 | ) | | | — | | | | (4.34 | ) | | | (8.47 | ) | | | (7.11 | ) |
| | | | | | | |
| | Total distributions | | | (4.98 | ) | | | (5.60 | ) | | | (0.55 | ) | | | (4.60 | ) | | | (8.87 | ) | | | (7.52 | ) |
| | | | | | | |
| | Net asset value, end of period | | $ | 30.81 | | | $ | 37.06 | | | $ | 38.68 | | | $ | 35.64 | | | $ | 39.22 | | | $ | 49.55 | |
| | | | | | | |
| | Total return(b) | | | (2.40 | )% | | | 11.13 | % | | | 10.12 | % | | | 3.39 | % | | | (3.82 | )% | | | 25.25 | % |
| | | | | | | |
| | Net assets, end of period (in 000s) | | $ | 382,864 | | | $ | 555,930 | | | $ | 1,424,886 | | | $ | 3,687,681 | | | $ | 5,868,055 | | | $ | 6,347,006 | |
| | | | | | | |
| | Ratio of net expenses to average net assets | | | 0.84 | %(c) | | | 0.83 | % | | | 0.77 | % | | | 0.75 | % | | | 0.74 | % | | | 0.74 | % |
| | | | | | | |
| | Ratio of total expenses to average net assets | | | 0.84 | %(c) | | | 0.83 | % | | | 0.77 | % | | | 0.75 | % | | | 0.74 | % | | | 0.74 | % |
| | | | | | | |
| | Ratio of net investment income to average net assets | | | 0.82 | %(c) | | | 0.58 | % | | | 0.91 | % | | | 1.31 | % | | | 0.68 | % | | | 0.77 | % |
| | | | | | | |
| | Portfolio turnover rate(d) | | | 44 | % | | | 137 | % | | | 124 | % | | | 111 | % | | | 95 | % | | | 87 | % |
| | (a) | | Calculated based on the average shares outstanding methodology. |
| | (b) | | Assumes investment at the NAV at the beginning of the period, reinvestment of all dividends and distributions, a complete redemption of the investment at the NAV at the end of the period and no sales or redemption charges. Total returns would be reduced if a sales or redemption charge was taken into account. Returns do not reflect the impact of taxes to shareholders relating to Fund distributions or the redemption of Fund shares. Total returns for periods less than one full year are not annualized. |
| | (d) | | The Fund’s portfolio turnover rate is calculated in accordance with regulatory requirements, without regard to transactions involving short term investments. If such transactions were included, the Fund’s portfolio turnover rate may be higher. |
| | |
| The accompanying notes are an integral part of these financial statements. | | 89 |
GOLDMAN SACHS MID CAP VALUE FUND
Financial Highlights(continued)
Selected Share Data for a Share Outstanding Throughout Each Period
| | | | | | | | | | | | | | | | | | | | | | | | | | |
| | | | | Goldman Sachs Mid Cap Value Fund | |
| | | | | Service Shares | |
| | | | | Six Months Ended
February 28, 2019
(Unaudited) | | | Year Ended August 31, | |
| | | | | 2018 | | | 2017 | | | 2016 | | | 2015 | | | 2014 | |
| | Per Share Data | | | | | | | | | | | | | | | | | | | | | | | | |
| | | | | | | |
| | Net asset value, beginning of period | | $ | 35.89 | | | $ | 37.61 | | | $ | 34.63 | | | $ | 38.21 | | | $ | 48.40 | | | $ | 45.59 | |
| | | | | | | |
| | Net investment income(a) | | | 0.05 | | | | 0.04 | | | | 0.15 | | | | 0.28 | | | | 0.08 | | | | 0.13 | |
| | | | | | | |
| | Net realized and unrealized gain (loss) | | | (1.35 | ) | | | 3.65 | | | | 3.15 | | | | 0.54 | | | | (1.71 | ) | | | 9.97 | |
| | | | | | | |
| | Total from investment operations | | | (1.30 | ) | | | 3.69 | | | | 3.30 | | | | 0.82 | | | | (1.63 | ) | | | 10.10 | |
| | | | | | | |
| | Distributions to shareholders from net investment income | | | (0.10 | ) | | | (0.12 | ) | | | (0.32 | ) | | | (0.06 | ) | | | (0.09 | ) | | | (0.18 | ) |
| | | | | | | |
| | Distributions to shareholders from net realized gains | | | (4.71 | ) | | | (5.29 | ) | | | — | | | | (4.34 | ) | | | (8.47 | ) | | | (7.11 | ) |
| | | | | | | |
| | Total distributions | | | (4.81 | ) | | | (5.41 | ) | | | (0.32 | ) | | | (4.40 | ) | | | (8.56 | ) | | | (7.29 | ) |
| | | | | | | |
| | Net asset value, end of period | | $ | 29.78 | | | $ | 35.89 | | | $ | 37.61 | | | $ | 34.63 | | | $ | 38.21 | | | $ | 48.40 | |
| | | | | | | |
| | Total return(b) | | | (2.63 | )% | | | 10.58 | % | | | 9.56 | % | | | 2.87 | % | | | (4.30 | )% | | | 24.63 | % |
| | | | | | | |
| | Net assets, end of period (in 000s) | | $ | 54,166 | | | $ | 65,727 | | | $ | 87,438 | | | $ | 139,677 | | | $ | 222,149 | | | $ | 368,720 | |
| | | | | | | |
| | Ratio of net expenses to average net assets | | | 1.34 | %(c) | | | 1.33 | % | | | 1.27 | % | | | 1.25 | % | | | 1.24 | % | | | 1.24 | % |
| | | | | | | |
| | Ratio of total expenses to average net assets | | | 1.34 | %(c) | | | 1.33 | % | | | 1.28 | % | | | 1.25 | % | | | 1.24 | % | | | 1.24 | % |
| | | | | | | |
| | Ratio of net investment income to average net assets | | | 0.31 | %(c) | | | 0.11 | % | | | 0.40 | % | | | 0.84 | % | | | 0.19 | % | | | 0.28 | % |
| | | | | | | |
| | Portfolio turnover rate(d) | | | 44 | % | | | 137 | % | | | 124 | % | | | 111 | % | | | 95 | % | | | 87 | % |
| | (a) | | Calculated based on the average shares outstanding methodology. |
| | (b) | | Assumes investment at the NAV at the beginning of the period, reinvestment of all dividends and distributions, a complete redemption of the investment at the NAV at the end of the period and no sales or redemption charges. Total returns would be reduced if a sales or redemption charge was taken into account. Returns do not reflect the impact of taxes to shareholders relating to Fund distributions or the redemption of Fund shares. Total returns for periods less than one full year are not annualized. |
| | (d) | | The Fund’s portfolio turnover rate is calculated in accordance with regulatory requirements, without regard to transactions involving short term investments. If such transactions were included, the Fund’s portfolio turnover rate may be higher. |
| | |
| 90 | | The accompanying notes are an integral part of these financial statements. |
GOLDMAN SACHS MID CAP VALUE FUND
Financial Highlights(continued)
Selected Share Data for a Share Outstanding Throughout Each Period
| | | | | | | | | | | | | | | | | | | | | | | | | | |
| | | | | Goldman Sachs Mid Cap Value Fund | |
| | | | | Investor Shares | |
| | | | | Six Months Ended
February 28, 2019
(Unaudited) | | | Year Ended August 31, | |
| | | | | 2018 | | | 2017 | | | 2016 | | | 2015 | | | 2014 | |
| | Per Share Data | | | | | | | | | | | | | | | | | | | | | | | | |
| | | | | | | |
| | Net asset value, beginning of period | | $ | 35.89 | | | $ | 37.57 | | | $ | 34.63 | | | $ | 38.23 | | | $ | 48.52 | | | $ | 45.70 | |
| | | | | | | |
| | Net investment income(a) | | | 0.10 | | | | 0.17 | | | | 0.27 | | | | 0.39 | | | | 0.22 | | | | 0.30 | |
| | | | | | | |
| | Net realized and unrealized gain (loss) | | | (1.36 | ) | | | 3.63 | | | | 3.17 | | | | 0.55 | | | | (1.70 | ) | | | 9.98 | |
| | | | | | | |
| | Total from investment operations | | | (1.26 | ) | | | 3.80 | | | | 3.44 | | | | 0.94 | | | | (1.48 | ) | | | 10.28 | |
| | | | | | | |
| | Distributions to shareholders from net investment income | | | (0.23 | ) | | | (0.18 | ) | | | (0.50 | ) | | | (0.20 | ) | | | (0.34 | ) | | | (0.35 | ) |
| | | | | | | |
| | Distributions to shareholders from net realized gains | | | (4.71 | ) | | | (5.30 | ) | | | — | | | | (4.34 | ) | | | (8.47 | ) | | | (7.11 | ) |
| | | | | | | |
| | Total distributions | | | (4.94 | ) | | | (5.48 | ) | | | (0.50 | ) | | | (4.54 | ) | | | (8.81 | ) | | | (7.46 | ) |
| | | | | | | |
| | Net asset value, end of period | | $ | 29.69 | | | $ | 35.89 | | | $ | 37.57 | | | $ | 34.63 | | | $ | 38.23 | | | $ | 48.52 | |
| | | | | | | |
| | Total return(b) | | | (2.48 | )% | | | 10.98 | % | | | 9.94 | % | | | 3.24 | % | | | (3.96 | )% | | | 25.07 | % |
| | | | | | | |
| | Net assets, end of period (in 000s) | | $ | 43,119 | | | $ | 51,375 | | | $ | 77,446 | | | $ | 220,429 | | | $ | 304,390 | | | $ | 295,017 | |
| | | | | | | |
| | Ratio of net expenses to average net assets | | | 0.98 | %(c) | | | 0.97 | % | | | 0.92 | % | | | 0.90 | % | | | 0.89 | % | | | 0.89 | % |
| | | | | | | |
| | Ratio of total expenses to average net assets | | | 0.98 | %(c) | | | 0.97 | % | | | 0.92 | % | | | 0.90 | % | | | 0.89 | % | | | 0.89 | % |
| | | | | | | |
| | Ratio of net investment loss to average net assets | | | 0.66 | %(c) | | | 0.47 | % | | | 0.73 | % | | | 1.16 | % | | | 0.52 | % | | | 0.66 | % |
| | | | | | | |
| | Portfolio turnover rate(d) | | | 44 | % | | | 137 | % | | | 124 | % | | | 111 | % | | | 95 | % | | | 87 | % |
| | (a) | | Calculated based on the average shares outstanding methodology. |
| | (b) | | Assumes investment at the NAV at the beginning of the period, reinvestment of all dividends and distributions, a complete redemption of the investment at the NAV at the end of the period and no sales or redemption charges. Total returns would be reduced if a sales or redemption charge was taken into account. Returns do not reflect the impact of taxes to shareholders relating to Fund distributions or the redemption of Fund shares. Total returns for periods less than one full year are not annualized. |
| | (d) | | The Fund’s portfolio turnover rate is calculated in accordance with regulatory requirements, without regard to transactions involving short term investments. If such transactions were included, the Fund’s portfolio turnover rate may be higher. |
| | |
| The accompanying notes are an integral part of these financial statements. | | 91 |
GOLDMAN SACHS MID CAP VALUE FUND
Financial Highlights(continued)
Selected Share Data for a Share Outstanding Throughout Each Period
| | | | | | | | | | |
| | | | | Goldman Sachs Mid Cap Value Fund | |
| | | | | Class P Shares | |
| | | | | Six Months Ended
February 28, 2019
(Unaudited) | | | Period Ended August 31, 2018(a) | |
| | | |
| | Per Share Data | | | | | | | | |
| | | |
| | Net asset value, beginning of period | | $ | 37.04 | | | $ | 35.64 | |
| | | |
| | Net investment income(b) | | | 0.13 | | | | 0.13 | |
| | | |
| | Net realized and unrealized gain (loss) | | | (1.40 | ) | | | 1.27 | |
| | | |
| | Total from investment operations | | | (1.27 | ) | | | 1.40 | |
| | | |
| | Distributions to shareholders from net investment income | | | (0.28 | ) | | | — | |
| | | |
| | Distributions to shareholders from net realized gains | | | (4.71 | ) | | | — | |
| | | |
| | Total distributions | | | (4.99 | ) | | | — | |
| | | |
| | Net asset value, end of period | | $ | 30.78 | | | $ | 37.04 | |
| | | |
| | Total return(c) | | | (2.38 | )% | | | 3.93 | % |
| | | |
| | Net assets, end of period (in 000s) | | $ | 146,190 | | | $ | 172,003 | |
| | | |
| | Ratio of net expenses to average net assets(d) | | | 0.83 | % | | | 0.86 | % |
| | | |
| | Ratio of total expenses to average net assets(d) | | | 0.83 | % | | | 0.86 | % |
| | | |
| | Ratio of net investment income to average net assets(d) | | | 0.82 | % | | | 0.94 | % |
| | | |
| | Portfolio turnover rate(e) | | | 44 | % | | | 137 | % |
| | (a) | | Commenced operations on April 17, 2018. |
| | (b) | | Calculated based on the average shares outstanding methodology. |
| | (c) | | Assumes investment at the NAV at the beginning of the period, reinvestment of all dividends and distributions, a complete redemption of the investment at the NAV at the end of the period and no sales or redemption charges. Total returns would be reduced if a sales or redemption charge was taken into account. Returns do not reflect the impact of taxes to shareholders relating to Fund distributions or the redemption of Fund shares. Total returns for periods less than one full year are not annualized. |
| | (e) | | The Fund’s portfolio turnover rate is calculated in accordance with regulatory requirements, without regard to transactions involving short term investments. If such transactions were included, the Fund’s portfolio turnover rate may be higher. |
| | |
| 92 | | The accompanying notes are an integral part of these financial statements. |
GOLDMAN SACHS MID CAP VALUE FUND
Financial Highlights(continued)
Selected Share Data for a Share Outstanding Throughout Each Period
| | | | | | | | | | | | | | | | | | | | | | | | | | |
| | | | | Goldman Sachs Mid Cap Value Fund | |
| | | | | Class R Shares | |
| | | | | Six Months Ended
February 28, 2019
(Unaudited) | | | Year Ended August 31, | |
| | | | | 2018 | | | 2017 | | | 2016 | | | 2015 | | | 2014 | |
| | Per Share Data | | | | | | | | | | | | | | | | | | | | | | | | |
| | | | | | | |
| | Net asset value, beginning of period | | $ | 35.52 | | | $ | 37.28 | | | $ | 34.38 | | | $ | 38.00 | | | $ | 48.28 | | | $ | 45.54 | |
| | | | | | | |
| | Net investment income (loss)(a) | | | 0.03 | | | | (0.01 | ) | | | 0.09 | | | | 0.22 | | | | — | (b) | | | 0.05 | |
| | | | | | | |
| | Net realized and unrealized gain (loss) | | | (1.34 | ) | | | 3.61 | | | | 3.13 | | | | 0.55 | | | | (1.69 | ) | | | 9.97 | |
| | | | | | | |
| | Total from investment operations | | | (1.31 | ) | | | 3.60 | | | | 3.22 | | | | 0.77 | | | | (1.69 | ) | | | 10.02 | |
| | | | | | | |
| | Distributions to shareholders from net investment income | | | (0.06 | ) | | | (0.09 | ) | | | (0.32 | ) | | | (0.05 | ) | | | (0.12 | ) | | | (0.17 | ) |
| | | | | | | |
| | Distributions to shareholders from net realized gains | | | (4.71 | ) | | | (5.27 | ) | | | — | | | | (4.34 | ) | | | (8.47 | ) | | | (7.11 | ) |
| | | | | | | |
| | Total distributions | | | (4.77 | ) | | | (5.36 | ) | | | (0.32 | ) | | | (4.39 | ) | | | (8.59 | ) | | | (7.28 | ) |
| | | | | | | |
| | Net asset value, end of period | | $ | 29.44 | | | $ | 35.52 | | | $ | 37.28 | | | $ | 34.38 | | | $ | 38.00 | | | $ | 48.28 | |
| | | | | | | |
| | Total return(c) | | | (2.72 | )% | | | 10.43 | % | | | 9.40 | % | | | 2.72 | % | | | (4.45 | )% | | | 24.44 | % |
| | | | | | | |
| | Net assets, end of period (in 000s) | | $ | 23,845 | | | $ | 28,103 | | | $ | 34,193 | | | $ | 40,111 | | | $ | 42,277 | | | $ | 35,896 | |
| | | | | | | |
| | Ratio of net expenses to average net assets | | | 1.48 | %(d) | | | 1.47 | % | | | 1.42 | % | | | 1.40 | % | | | 1.39 | % | | | 1.39 | % |
| | | | | | | |
| | Ratio of total expenses to average net assets | | | 1.48 | %(d) | | | 1.47 | % | | | 1.43 | % | | | 1.40 | % | | | 1.39 | % | | | 1.39 | % |
| | | | | | | |
| | Ratio of net investment income (loss) to average net assets | | | 0.17 | %(d) | | | (0.03 | )% | | | 0.25 | % | | | 0.66 | % | | | 0.01 | % | | | 0.12 | % |
| | | | | | | |
| | Portfolio turnover rate(e) | | | 44 | % | | | 137 | % | | | 124 | % | | | 111 | % | | | 95 | % | | | 87 | % |
| | (a) | | Calculated based on the average shares outstanding methodology. |
| | (b) | | Amount is less than $0.005 per share. |
| | (c) | | Assumes investment at the NAV at the beginning of the period, reinvestment of all dividends and distributions, a complete redemption of the investment at the NAV at the end of the period and no sales or redemption charges. Total returns would be reduced if a sales or redemption charge was taken into account. Returns do not reflect the impact of taxes to shareholders relating to Fund distributions or the redemption of Fund shares. Total returns for periods less than one full year are not annualized. |
| | (e) | | The Fund’s portfolio turnover rate is calculated in accordance with regulatory requirements, without regard to transactions involving short term investments. If such transactions were included, the Fund’s portfolio turnover rate may be higher. |
| | |
| The accompanying notes are an integral part of these financial statements. | | 93 |
GOLDMAN SACHS MID CAP VALUE FUND
Financial Highlights(continued)
Selected Share Data for a Share Outstanding Throughout Each Period
| | | | | | | | | | | | | | | | | | | | | | |
| | | | | Goldman Sachs Mid Cap Value Fund | |
| | | | | Class R6 Shares | |
| | | | | Six Months Ended
February 28, 2019
(Unaudited) | | | Year Ended August 31, | | | Period Ended
August 31, 2015(a) | |
| | | | | 2018 | | | 2017 | | | 2016 | |
| | Per Share Data | | | | | | | | | | | | | | | | | | | | |
| | | | | | |
| | Net asset value, beginning of period | | $ | 37.04 | | | $ | 38.66 | | | $ | 35.64 | | | $ | 39.23 | | | $ | 41.24 | |
| | | | | | |
| | Net investment income (loss)(b) | | | 0.11 | | | | 0.22 | | | | 0.36 | | | | 0.47 | | | | (0.02 | ) |
| | | | | | |
| | Net realized and unrealized gain (loss) | | | (1.38 | ) | | | 3.76 | | | | 3.22 | | | | 0.56 | | | | (1.99 | ) |
| | | | | | |
| | Total from investment operations | | | (1.27 | ) | | | 3.98 | | | | 3.58 | | | | 1.03 | | | | (2.01 | ) |
| | | | | | |
| | Distributions to shareholders from net investment income | | | (0.27 | ) | | | (0.27 | ) | | | (0.56 | ) | | | (0.28 | ) | | | — | |
| | | | | | |
| | Distributions to shareholders from net realized gains | | | (4.71 | ) | | | (5.33 | ) | | | — | | | | (4.34 | ) | | | — | |
| | | | | | |
| | Total distributions | | | (4.98 | ) | | | (5.60 | ) | | | (0.56 | ) | | | (4.62 | ) | | | — | |
| | | | | | |
| | Net asset value, end of period | | $ | 30.79 | | | $ | 37.04 | | | $ | 38.66 | | | $ | 35.64 | | | $ | 39.23 | |
| | | | | | |
| | Total return(c) | | | (2.39 | )% | | | 11.10 | % | | | 10.13 | % | | | 3.41 | % | | | (4.87 | )% |
| | | | | | |
| | Net assets, end of period (in 000s) | | $ | 57,240 | | | $ | 39,520 | | | $ | 73,505 | | | $ | 372,313 | | | $ | 10 | |
| | | | | | |
| | Ratio of net expenses to average net assets | | | 0.83 | %(d) | | | 0.82 | % | | | 0.75 | % | | | 0.73 | % | | | 0.73 | %(d) |
| | | | | | |
| | Ratio of total expenses to average net assets | | | 0.83 | %(d) | | | 0.82 | % | | | 0.75 | % | | | 0.73 | % | | | 0.73 | %(d) |
| | | | | | |
| | Ratio of Net investment income (loss) | | | 0.69 | %(d) | | | 0.60 | % | | | 0.97 | % | | | 1.39 | % | | | (0.62 | )%(d) |
| | | | | | |
| | Portfolio turnover rate(e) | | | 44 | % | | | 137 | % | | | 124 | % | | | 111 | % | | | 95 | % |
| | (a) | | Commenced operations on July 31, 2015. |
| | (b) | | Calculated based on the average shares outstanding methodology. |
| | (c) | | Assumes investment at the NAV at the beginning of the period, reinvestment of all dividends and distributions, a complete redemption of the investment at the NAV at the end of the period and no sales or redemption charges. Total returns would be reduced if a sales or redemption charge was taken into account. Returns do not reflect the impact of taxes to shareholders relating to Fund distributions or the redemption of Fund shares. Total returns for periods less than one full year are not annualized. |
| | (e) | | The Fund’s portfolio turnover rate is calculated in accordance with regulatory requirements, without regard to transactions involving short term investments. If such transactions were included, the Fund’s portfolio turnover rate may be higher. |
| | |
| 94 | | The accompanying notes are an integral part of these financial statements. |
GOLDMAN SACHS SMALL CAP VALUE FUND
Financial Highlights(continued)
Selected Share Data for a Share Outstanding Throughout Each Period
| | | | | | | | | | | | | | | | | | | | | | | | | | |
| | | | | Goldman Sachs Small Cap Value Fund | |
| | | | | Class A Shares | |
| | | | | Six Months Ended
February 28, 2019
(Unaudited) | | | Year Ended August 31, | |
| | | | | 2018 | | | 2017 | | | 2016 | | | 2015 | | | 2014 | |
| | Per Share Data | | | | | | | | | | | | | | | | | | | | | | | | |
| | | | | | | |
| | Net asset value, beginning of period | | $ | 59.98 | | | $ | 56.63 | | | $ | 52.52 | | | $ | 49.78 | | | $ | 55.40 | | | $ | 50.43 | |
| | | | | | | |
| | Net investment income(a) | | | 0.13 | | | | 0.04 | | | | 0.16 | | | | 0.20 | | | | 0.16 | (b) | | | 0.12 | |
| | | | | | | |
| | Net realized and unrealized gain (loss) | | | (4.91 | ) | | | 9.70 | | | | 5.92 | | | | 5.11 | | | | (1.32 | ) | | | 9.94 | |
| | | | | | | |
| | Total from investment operations | | | (4.78 | ) | | | 9.74 | | | | 6.08 | | | | 5.31 | | | | (1.16 | ) | | | 10.06 | |
| | | | | | | |
| | Distributions to shareholders from net investment income | | | (0.02 | ) | | | (0.08 | ) | | | (0.22 | ) | | | (0.16 | ) | | | (0.10 | ) | | | (0.18 | ) |
| | | | | | | |
| | Distributions to shareholders from net realized gains | | | (5.84 | ) | | | (6.31 | ) | | | (1.75 | ) | | | (2.41 | ) | | | (4.36 | ) | | | (4.91 | ) |
| | | | | | | |
| | Total distributions | | | (5.86 | ) | | | (6.39 | ) | | | (1.97 | ) | | | (2.57 | ) | | | (4.46 | ) | | | (5.09 | ) |
| | | | | | | |
| | Net asset value, end of period | | $ | 49.34 | | | $ | 59.98 | | | $ | 56.63 | | | $ | 52.52 | | | $ | 49.78 | | | $ | 55.40 | |
| | | | | | | |
| | Total return(c) | | | (7.14 | )% | | | 18.15 | % | | | 11.56 | % | | | 11.22 | % | | | (2.31 | )% | | | 20.72 | % |
| | | | | | | |
| | Net assets, end of period (in 000s) | | $ | 714,338 | | | $ | 803,918 | | | $ | 851,497 | | | $ | 928,091 | | | $ | 950,196 | | | $ | 1,080,393 | |
| | | | | | | |
| | Ratio of net expenses to average net assets | | | 1.34 | %(d) | | | 1.33 | % | | | 1.34 | % | | | 1.35 | % | | | 1.34 | % | | | 1.35 | % |
| | | | | | | |
| | Ratio of total expenses to average net assets | | | 1.36 | %(d) | | | 1.36 | % | | | 1.38 | % | | | 1.39 | % | | | 1.39 | % | | | 1.40 | % |
| | | | | | | |
| | Ratio of net investment income to average net assets | | | 0.49 | %(d) | | | 0.07 | % | | | 0.29 | % | | | 0.42 | % | | | 0.30 | %(b) | | | 0.22 | % |
| | | | | | | |
| | Portfolio turnover rate(e) | | | 22 | % | | | 55 | % | | | 68 | % | | | 46 | % | | | 49 | % | | | 46 | % |
| | (a) | | Calculated based on the average shares outstanding methodology. |
| | (b) | | Reflects income recognized from special dividends which amounted to $0.10 per share and 0.18% of average net assets. |
| | (c) | | Assumes investment at the NAV at the beginning of the period, reinvestment of all dividends and distributions, a complete redemption of the investment at the NAV at the end of the period and no sales or redemption charges. Total returns would be reduced if a sales or redemption charge was taken into account. Returns do not reflect the impact of taxes to shareholders relating to Fund distributions or the redemption of Fund shares. Total returns for periods less than one full year are not annualized. |
| | (e) | | The Fund’s portfolio turnover rate is calculated in accordance with regulatory requirements, without regard to transactions involving short term investments. If such transactions were included, the Fund’s portfolio turnover rate may be higher. |
| | |
| The accompanying notes are an integral part of these financial statements. | | 95 |
GOLDMAN SACHS SMALL CAP VALUE FUND
Financial Highlights(continued)
Selected Share Data for a Share Outstanding Throughout Each Period
| | | | | | | | | | | | | | | | | | | | | | | | | | |
| | | | | Goldman Sachs Small Cap Value Fund | |
| | | | | Class C Shares | |
| | | | | Six Months Ended
February 28, 2019
(Unaudited) | | | Year Ended August 31, | |
| | | | | 2018 | | | 2017 | | | 2016 | | | 2015 | | | 2014 | |
| | Per Share Data | | | | | | | | | | | | | | | | | | | | | | | | |
| | | | | | | |
| | Net asset value, beginning of period | | $ | 45.37 | | | $ | 44.50 | | | $ | 41.75 | | | $ | 40.23 | | | $ | 45.84 | | | $ | 42.64 | |
| | | | | | | |
| | Net investment loss(a) | | | (0.05 | ) | | | (0.31 | ) | | | (0.20 | ) | | | (0.13 | ) | | | (0.19 | )(b) | | | (0.25 | ) |
| | | | | | | |
| | Net realized and unrealized gain (loss) | | | (3.83 | ) | | | 7.49 | | | | 4.70 | | | | 4.06 | | | | (1.06 | ) | | | 8.36 | |
| | | | | | | |
| | Total from investment operations | | | (3.88 | ) | | | 7.18 | | | | 4.50 | | | | 3.93 | | | | (1.25 | ) | | | 8.11 | |
| | | | | | | |
| | Distributions to shareholders from net investment income | | | — | | | | — | | | | — | | | | (0.00 | )(c) | | | — | | | | — | |
| | | | | | | |
| | Distributions to shareholders from net realized gains | | | (5.84 | ) | | | (6.31 | ) | | | (1.75 | ) | | | (2.41 | ) | | | (4.36 | ) | | | (4.91 | ) |
| | | | | | | |
| | Total distributions | | | (5.84 | ) | | | (6.31 | ) | | | (1.75 | ) | | | (2.41 | ) | | | (4.36 | ) | | | (4.91 | ) |
| | | | | | | |
| | Net asset value, end of period | | $ | 35.65 | | | $ | 45.37 | | | $ | 44.50 | | | $ | 41.75 | | | $ | 40.23 | | | $ | 45.84 | |
| | | | | | | |
| | Total return(d) | | | (7.50 | )% | | | 17.26 | % | | | 10.72 | % | | | 10.40 | % | | | (3.04 | )% | | | 19.85 | % |
| | | | | | | |
| | Net assets, end of period (in 000s) | | $ | 13,380 | | | $ | 37,157 | | | $ | 37,357 | | | $ | 47,925 | | | $ | 59,341 | | | $ | 69,319 | |
| | | | | | | |
| | Ratio of net expenses to average net assets | | | 2.09 | %(e) | | | 2.08 | % | | | 2.09 | % | | | 2.10 | % | | | 2.09 | % | | | 2.10 | % |
| | | | | | | |
| | Ratio of total expenses to average net assets | | | 2.11 | %(e) | | | 2.11 | % | | | 2.13 | % | | | 2.14 | % | | | 2.14 | % | | | 2.15 | % |
| | | | | | | |
| | Ratio of net investment loss to average net assets | | | (0.27 | )%(e) | | | (0.69 | )% | | | (0.45 | )% | | | (0.33 | )% | | | (0.45 | )%(b) | | | (0.55 | )% |
| | | | | | | |
| | Portfolio turnover rate(f) | | | 22 | % | | | 55 | % | | | 68 | % | | | 46 | % | | | 49 | % | | | 46 | % |
| | (a) | | Calculated based on the average shares outstanding methodology. |
| | (b) | | Reflects income recognized from special dividends which amounted to $0.10 per share and 0.18% of average net assets. |
| | (c) | | Amount is less than $0.005 per share. |
| | (d) | | Assumes investment at the NAV at the beginning of the period, reinvestment of all dividends and distributions, a complete redemption of the investment at the NAV at the end of the period and no sales or redemption charges. Total returns would be reduced if a sales or redemption charge was taken into account. Returns do not reflect the impact of taxes to shareholders relating to Fund distributions or the redemption of Fund shares. Total returns for periods less than one full year are not annualized. |
| | (f) | | The Fund’s portfolio turnover rate is calculated in accordance with regulatory requirements, without regard to transactions involving short term investments. If such transactions were included, the Fund’s portfolio turnover rate may be higher. |
| | |
| 96 | | The accompanying notes are an integral part of these financial statements. |
GOLDMAN SACHS SMALL CAP VALUE FUND
Financial Highlights(continued)
Selected Share Data for a Share Outstanding Throughout Each Period
| | | | | | | | | | | | | | | | | | | | | | | | | | |
| | | | | Goldman Sachs Small Cap Value Fund | |
| | | | | Institutional Shares | |
| | | | | Six Months Ended
February 28, 2019
(Unaudited) | | | Year Ended August 31, | |
| | | | | 2018 | | | 2017 | | | 2016 | | | 2015 | | | 2014 | |
| | Per Share Data | | | | | | | | | | | | | | | | | | | | | | | | |
| | | | | | | |
| | Net asset value, beginning of period | | $ | 64.90 | | | $ | 60.78 | | | $ | 56.20 | | | $ | 53.10 | | | $ | 58.80 | | | $ | 53.22 | |
| | | | | | | |
| | Net investment income(a) | | | 0.25 | | | | 0.28 | | | | 0.41 | | | | 0.42 | | | | 0.39 | (b) | | | 0.33 | |
| | | | | | | |
| | Net realized and unrealized gain (loss) | | | (5.30 | ) | | | 10.46 | | | | 6.34 | | | | 5.45 | | | | (1.40 | ) | | | 10.53 | |
| | | | | | | |
| | Total from investment operations | | | (5.05 | ) | | | 10.74 | | | | 6.75 | | | | 5.87 | | | | (1.01 | ) | | | 10.86 | |
| | | | | | | |
| | Distributions to shareholders from net investment income | | | (0.22 | ) | | | (0.31 | ) | | | (0.42 | ) | | | (0.36 | ) | | | (0.33 | ) | | | (0.37 | ) |
| | | | | | | |
| | Distributions to shareholders from net realized gains | | | (5.84 | ) | | | (6.31 | ) | | | (1.75 | ) | | | (2.41 | ) | | | (4.36 | ) | | | (4.91 | ) |
| | | | | | | |
| | Total distributions | | | (6.06 | ) | | | (6.62 | ) | | | (2.17 | ) | | | (2.77 | ) | | | (4.69 | ) | | | (5.28 | ) |
| | | | | | | |
| | Net asset value, end of period | | $ | 53.79 | | | $ | 64.90 | | | $ | 60.78 | | | $ | 56.20 | | | $ | 53.10 | | | $ | 58.80 | |
| | | | | | | |
| | Total return(c) | | | (6.97 | )% | | | 18.62 | % | | | 12.00 | % | | | 11.66 | % | | | (1.92 | )% | | | 21.22 | % |
| | | | | | | |
| | Net assets, end of period (in 000s) | | $ | 3,404,217 | | | $ | 4,304,041 | | | $ | 4,393,986 | | | $ | 4,476,848 | | | $ | 4,503,821 | | | $ | 4,694,737 | |
| | | | | | | |
| | Ratio of net expenses to average net assets | | | 0.95 | %(d) | | | 0.94 | % | | | 0.94 | % | | | 0.95 | % | | | 0.94 | % | | | 0.95 | % |
| | | | | | | |
| | Ratio of total expenses to average net assets | | | 0.97 | %(d) | | | 0.97 | % | | | 0.98 | % | | | 0.99 | % | | | 0.99 | % | | | 1.00 | % |
| | | | | | | |
| | Ratio of net investment income to average net assets | | | 0.89 | %(d) | | | 0.45 | % | | | 0.69 | % | | | 0.82 | % | | | 0.70 | %(b) | | | 0.58 | % |
| | | | | | | |
| | Portfolio turnover rate(e) | | | 22 | % | | | 55 | % | | | 68 | % | | | 46 | % | | | 49 | % | | | 46 | % |
| | (a) | | Calculated based on the average shares outstanding methodology. |
| | (b) | | Reflects income recognized from special dividends which amounted to $0.10 per share and 0.18% of average net assets. |
| | (c) | | Assumes investment at the NAV at the beginning of the period, reinvestment of all dividends and distributions, a complete redemption of the investment at the NAV at the end of the period and no sales or redemption charges. Total returns would be reduced if a sales or redemption charge was taken into account. Returns do not reflect the impact of taxes to shareholders relating to Fund distributions or the redemption of Fund shares. Total returns for periods less than one full year are not annualized. |
| | (e) | | The Fund’s portfolio turnover rate is calculated in accordance with regulatory requirements, without regard to transactions involving short term investments. If such transactions were included, the Fund’s portfolio turnover rate may be higher. |
| | |
| The accompanying notes are an integral part of these financial statements. | | 97 |
GOLDMAN SACHS SMALL CAP VALUE FUND
Financial Highlights(continued)
Selected Share Data for a Share Outstanding Throughout Each Period
| | | | | | | | | | | | | | | | | | | | | | | | | | |
| | | | | Goldman Sachs Small Cap Value Fund | |
| | | | | Service Shares | |
| | | | | Six Months Ended
February 28, 2019
(Unaudited) | | | Year Ended August 31, | |
| | | | | 2018 | | | 2017 | | | 2016 | | | 2015 | | | 2014 | |
| | Per Share Data | | | | | | | | | | | | | | | | | | | | | | | | |
| | | | | | | |
| | Net asset value, beginning of period | | $ | 58.10 | | | $ | 55.04 | | | $ | 51.10 | | | $ | 48.50 | | | $ | 54.08 | | | $ | 49.36 | |
| | | | | | | |
| | Net investment income (loss)(a) | | | 0.10 | | | | (0.03 | ) | | | 0.09 | | | | 0.15 | | | | 0.11 | (b) | | | 0.05 | |
| | | | | | | |
| | Net realized and unrealized gain (loss) | | | (4.77 | ) | | | 9.42 | | | | 5.77 | | | | 4.96 | | | | (1.29 | ) | | | 9.74 | |
| | | | | | | |
| | Total from investment operations | | | (4.67 | ) | | | 9.39 | | | | 5.86 | | | | 5.11 | | | | (1.18 | ) | | | 9.79 | |
| | | | | | | |
| | Distributions to shareholders from net investment income | | | — | | | | (0.02 | ) | | | (0.17 | ) | | | (0.10 | ) | | | (0.04 | ) | | | (0.16 | ) |
| | | | | | | |
| | Distributions to shareholders from net realized gains | | | (5.84 | ) | | | (6.31 | ) | | | (1.75 | ) | | | (2.41 | ) | | | (4.36 | ) | | | (4.91 | ) |
| | | | | | | |
| | Total distributions | | | (5.84 | ) | | | (6.33 | ) | | | (1.92 | ) | | | (2.51 | ) | | | (4.40 | ) | | | (5.07 | ) |
| | | | | | | |
| | Net asset value, end of period | | $ | 47.59 | | | $ | 58.10 | | | $ | 55.04 | | | $ | 51.10 | | | $ | 48.50 | | | $ | 54.08 | |
| | | | | | | |
| | Total return(c) | | | (7.20 | )% | | | 18.02 | % | | | 11.44 | % | | | 11.11 | % | | | (2.41 | )% | | | 20.62 | % |
| | | | | | | |
| | Net assets, end of period (in 000s) | | $ | 85,002 | | | $ | 110,636 | | | $ | 145,996 | | | $ | 119,315 | | | $ | 134,195 | | | $ | 176,500 | |
| | | | | | | |
| | Ratio of net expenses to average net assets | | | 1.45 | %(d) | | | 1.44 | % | | | 1.44 | % | | | 1.45 | % | | | 1.44 | % | | | 1.45 | % |
| | | | | | | |
| | Ratio of total expenses to average net assets | | | 1.47 | %(d) | | | 1.47 | % | | | 1.48 | % | | | 1.49 | % | | | 1.49 | % | | | 1.50 | % |
| | | | | | | |
| | Ratio of net investment income (loss) to average net assets | | | 0.40 | %(d) | | | (0.06 | )% | | | 0.17 | % | | | 0.32 | % | | | 0.21 | %(b) | | | 0.10 | % |
| | | | | | | |
| | Portfolio turnover rate(e) | | | 22 | % | | | 55 | % | | | 68 | % | | | 46 | % | | | 49 | % | | | 46 | % |
| | (a) | | Calculated based on the average shares outstanding methodology. |
| | (b) | | Reflects income recognized from special dividends which amounted to $0.10 per share and 0.18% of average net assets. |
| | (c) | | Assumes investment at the NAV at the beginning of the period, reinvestment of all dividends and distributions, a complete redemption of the investment at the NAV at the end of the period and no sales or redemption charges. Total returns would be reduced if a sales or redemption charge was taken into account. Returns do not reflect the impact of taxes to shareholders relating to Fund distributions or the redemption of Fund shares. Total returns for periods less than one full year are not annualized. |
| | (e) | | The Fund’s portfolio turnover rate is calculated in accordance with regulatory requirements, without regard to transactions involving short term investments. If such transactions were included, the Fund’s portfolio turnover rate may be higher. |
| | |
| 98 | | The accompanying notes are an integral part of these financial statements. |
GOLDMAN SACHS SMALL CAP VALUE FUND
Financial Highlights(continued)
Selected Share Data for a Share Outstanding Throughout Each Period
| | | | | | | | | | | | | | | | | | | | | | | | | | |
| | | | | Goldman Sachs Small Cap Value Fund | |
| | | | | Investor Shares | |
| | | | | Six Months Ended
February 28, 2019
(Unaudited) | | | Year Ended August 31, | |
| | | | | 2018 | | | 2017 | | | 2016 | | | 2015 | | | 2014 | |
| | Per Share Data | | | | | | | | | | | | | | | | | | | | | | | | |
| | | | | | | |
| | Net asset value, beginning of period | | $ | 59.60 | | | $ | 56.32 | | | $ | 52.23 | | | $ | 49.55 | | | $ | 55.18 | | | $ | 50.25 | |
| | | | | | | |
| | Net investment income(a) | | | 0.19 | | | | 0.18 | | | | 0.29 | | | | 0.32 | | | | 0.28 | (b) | | | 0.23 | |
| | | | | | | |
| | Net realized and unrealized gain (loss) | | | (4.90 | ) | | | 9.64 | | | | 5.90 | | | | 5.07 | | | | (1.30 | ) | | | 9.93 | |
| | | | | | | |
| | Total from investment operations | | | (4.71 | ) | | | 9.82 | | | | 6.19 | | | | 5.39 | | | | (1.02 | ) | | | 10.16 | |
| | | | | | | |
| | Distributions to shareholders from net investment income | | | (0.15 | ) | | | (0.23 | ) | | | (0.35 | ) | | | (0.30 | ) | | | (0.25 | ) | | | (0.32 | ) |
| | | | | | | |
| | Distributions to shareholders from net realized gains | | | (5.84 | ) | | | (6.31 | ) | | | (1.75 | ) | | | (2.41 | ) | | | (4.36 | ) | | | (4.91 | ) |
| | | | | | | |
| | Total distributions | | | (5.99 | ) | | | (6.54 | ) | | | (2.10 | ) | | | (2.71 | ) | | | (4.61 | ) | | | (5.23 | ) |
| | | | | | | |
| | Net asset value, end of period | | $ | 48.90 | | | $ | 59.60 | | | $ | 56.32 | | | $ | 52.23 | | | $ | 49.55 | | | $ | 55.18 | |
| | | | | | | |
| | Total return(c) | | | (7.02 | )% | | | 18.44 | % | | | 11.84 | % | | | 11.50 | % | | | (2.07 | )% | | | 21.05 | % |
| | | | | | | |
| | Net assets, end of period (in 000s) | | $ | 157,055 | | | $ | 173,176 | | | $ | 168,986 | | | $ | 162,661 | | | $ | 128,838 | | | $ | 121,895 | |
| | | | | | | |
| | Ratio of net expenses to average net assets | | | 1.09 | %(d) | | | 1.08 | % | | | 1.09 | % | | | 1.10 | % | | | 1.09 | % | | | 1.10 | % |
| | | | | | | |
| | Ratio of total expenses to average net assets | | | 1.11 | %(d) | | | 1.11 | % | | | 1.13 | % | | | 1.14 | % | | | 1.14 | % | | | 1.15 | % |
| | | | | | | |
| | Ratio of net investment loss to average net assets | | | 0.74 | %(d) | | | 0.31 | % | | | 0.53 | % | | | 0.67 | % | | | 0.54 | %(b) | | | 0.43 | % |
| | | | | | | |
| | Portfolio turnover rate(e) | | | 22 | % | | | 55 | % | | | 68 | % | | | 46 | % | | | 49 | % | | | 46 | % |
| | (a) | | Calculated based on the average shares outstanding methodology. |
| | (b) | | Reflects income recognized from special dividends which amounted to $0.10 per share and 0.18% of average net assets. |
| | (c) | | Assumes investment at the NAV at the beginning of the period, reinvestment of all dividends and distributions, a complete redemption of the investment at the NAV at the end of the period and no sales or redemption charges. Total returns would be reduced if a sales or redemption charge was taken into account. Returns do not reflect the impact of taxes to shareholders relating to Fund distributions or the redemption of Fund shares. Total returns for periods less than one full year are not annualized. |
| | (e) | | The Fund’s portfolio turnover rate is calculated in accordance with regulatory requirements, without regard to transactions involving short term investments. If such transactions were included, the Fund’s portfolio turnover rate may be higher. |
| | |
| The accompanying notes are an integral part of these financial statements. | | 99 |
GOLDMAN SACHS SMALL CAP VALUE FUND
Financial Highlights(continued)
Selected Share Data for a Share Outstanding Throughout Each Period
| | | | | | | | | | |
| | | | | Goldman Sachs Small Cap Value Fund | |
| | | | | Class P Shares | |
| | | | | Six Months Ended
February 28, 2019
(Unaudited) | | | Year Ended
August 31, 2018(a) | |
| | | |
| | Per Share Data | | | | | | | | |
| | | |
| | Net asset value, beginning of period | | $ | 64.88 | | | $ | 60.80 | |
| | | |
| | Net investment income(b) | | | 0.25 | | | | 0.11 | |
| | | |
| | Net realized and unrealized gain (loss) | | | (5.30 | ) | | | 3.97 | |
| | | |
| | Total from investment operations | | | (5.05 | ) | | | 4.08 | |
| | | |
| | Distributions to shareholders from net investment income | | | (0.23 | ) | | | — | |
| | | |
| | Distributions to shareholders from net realized gains | | | (5.84 | ) | | | — | |
| | | |
| | Total distributions | | | (6.07 | ) | | | — | |
| | | |
| | Net asset value, end of period | | $ | 53.76 | | | $ | 64.88 | |
| | | |
| | Total return(c) | | | (6.94 | )% | | | 6.71 | % |
| | | |
| | Net assets, end of period (in 000s) | | $ | 262,554 | | | $ | 317,224 | |
| | | |
| | Ratio of net expenses to average net assets | | | 0.94 | %(d) | | | 0.93 | %(d) |
| | | |
| | Ratio of total expenses to average net assets | | | 0.96 | %(d) | | | 0.97 | %(d) |
| | | |
| | Ratio of net investment income to average net assets | | | 0.90 | %(d) | | | 0.46 | %(d) |
| | | |
| | Portfolio turnover rate(e) | | | 22 | % | | | 55 | % |
| | (a) | | Commenced operations on April 17, 2018. |
| | (b) | | Calculated based on the average shares outstanding methodology. |
| | (c) | | Assumes investment at the NAV at the beginning of the period, reinvestment of all dividends and distributions, a complete redemption of the investment at the NAV at the end of the period and no sales or redemption charges. Total returns would be reduced if a sales or redemption charge was taken into account. Returns do not reflect the impact of taxes to shareholders relating to Fund distributions or the redemption of Fund shares. Total returns for periods less than one full year are not annualized. |
| | (e) | | The Fund’s portfolio turnover rate is calculated in accordance with regulatory requirements, without regard to transactions involving short term investments. If such transactions were included, the Fund’s portfolio turnover rate may be higher. |
| | |
| 100 | | The accompanying notes are an integral part of these financial statements. |
GOLDMAN SACHS SMALL CAP VALUE FUND
Financial Highlights(continued)
Selected Share Data for a Share Outstanding Throughout Each Period
| | | | | | | | | | | | | | | | | | | | | | | | | | |
| | | | | Goldman Sachs Small Cap Value Fund | |
| | | | | Class R Shares | |
| | | | | Six Months Ended
February 28, 2019
(Unaudited) | | | Year Ended August 31, | |
| | | | | 2018 | | | 2017 | | | 2016 | | | 2015 | | | 2014 | |
| | Per Share Data | | | | | | | | | | | | | | | | | | | | | | | | |
| | | | | | | |
| | Net asset value, beginning of period | | $ | 58.69 | | | $ | 55.60 | | | $ | 51.62 | | | $ | 48.95 | | | $ | 54.58 | | | $ | 49.80 | |
| | | | | | | |
| | Net investment income (loss)(a) | | | 0.06 | | | | (0.11 | ) | | | 0.02 | | | | 0.08 | | | | 0.03 | (b) | | | (0.03 | ) |
| | | | | | | |
| | Net realized and unrealized gain (loss) | | | (4.81 | ) | | | 9.51 | | | | 5.82 | | | | 5.03 | | | | (1.30 | ) | | | 9.82 | |
| | | | | | | |
| | Total from investment operations | | | (4.75 | ) | | | 9.40 | | | | 5.84 | | | | 5.11 | | | | (1.27 | ) | | | 9.79 | |
| | | | | | | |
| | Distributions to shareholders from net investment income | | | — | | | | — | | | | (0.11 | ) | | | (0.03 | ) | | | — | | | | (0.10 | ) |
| | | | | | | |
| | Distributions to shareholders from net realized gains | | | (5.84 | ) | | | (6.31 | ) | | | (1.75 | ) | | | (2.41 | ) | | | (4.36 | ) | | | (4.91 | ) |
| | | | | | | |
| | Total distributions | | | (5.84 | ) | | | (6.31 | ) | | | (1.86 | ) | | | (2.44 | ) | | | (4.36 | ) | | | (5.01 | ) |
| | | | | | | |
| | Net asset value, end of period | | $ | 48.10 | | | $ | 58.69 | | | $ | 55.60 | | | $ | 51.62 | | | $ | 48.95 | | | $ | 54.58 | |
| | | | | | | |
| | Total return(c) | | | (7.27 | )% | | | 17.85 | % | | | 11.28 | % | | | 10.96 | % | | | (2.56 | )% | | | 20.44 | % |
| | | | | | | |
| | Net assets, end of period (in 000s) | | $ | 100,797 | | | $ | 123,288 | | | $ | 124,039 | | | $ | 122,526 | | | $ | 136,644 | | | $ | 139,858 | |
| | | | | | | |
| | Ratio of net expenses to average net assets | | | 1.59 | %(d) | | | 1.58 | % | | | 1.59 | % | | | 1.60 | % | | | 1.59 | % | | | 1.60 | % |
| | | | | | | |
| | Ratio of total expenses to average net assets | | | 1.61 | %(d) | | | 1.61 | % | | | 1.63 | % | | | 1.64 | % | | | 1.64 | % | | | 1.65 | % |
| | | | | | | |
| | Ratio of net investment income (loss) to average net assets | | | 0.25 | %(d) | | | (0.19 | )% | | | 0.04 | % | | | 0.18 | % | | | 0.05 | %(b) | | | (0.06 | )% |
| | | | | | | |
| | Portfolio turnover rate(e) | | | 22 | % | | | 55 | % | | | 68 | % | | | 46 | % | | | 49 | % | | | 46 | % |
| | (a) | | Calculated based on the average shares outstanding methodology. |
| | (b) | | Reflects income recognized from special dividends which amounted to $0.10 per share and 0.18% of average net assets. |
| | (c) | | Assumes investment at the NAV at the beginning of the period, reinvestment of all dividends and distributions, a complete redemption of the investment at the NAV at the end of the period and no sales or redemption charges. Total returns would be reduced if a sales or redemption charge was taken into account. Returns do not reflect the impact of taxes to shareholders relating to Fund distributions or the redemption of Fund shares. Total returns for periods less than one full year are not annualized. |
| | (e) | | The Fund’s portfolio turnover rate is calculated in accordance with regulatory requirements, without regard to transactions involving short term investments. If such transactions were included, the Fund’s portfolio turnover rate may be higher. |
| | |
| The accompanying notes are an integral part of these financial statements. | | 101 |
GOLDMAN SACHS SMALL CAP VALUE FUND
Financial Highlights(continued)
Selected Share Data for a Share Outstanding Throughout Each Period
| | | | | | | | | | | | | | | | | | | | | | |
| | | | | Goldman Sachs Small Cap Value Fund | |
| | | | | Class R6 Shares | |
| | | | | Six Months Ended
February 28, 2019
(Unaudited) | | | Year Ended August 31, | | | Period Ended
August 31, 2015(a) | |
| | | | | 2018 | | | 2017 | | | 2016 | |
| | Per Share Data | | | | | | | | | | | | | | | | | | | | |
| | | | | | |
| | Net asset value, beginning of period | | $ | 64.88 | | | $ | 60.77 | | | $ | 56.19 | | | $ | 53.10 | | | $ | 56.15 | |
| | | | | | |
| | Net investment income (loss)(b) | | | 0.24 | | | | 0.27 | | | | 0.38 | | | | 0.37 | | | | (0.03 | )(c) |
| | | | | | |
| | Net realized and unrealized gain (loss) | | | (5.29 | ) | | | 10.47 | | | | 6.39 | | | | 5.51 | | | | (3.02 | ) |
| | | | | | |
| | Total from investment operations | | | (5.05 | ) | | | 10.74 | | | | 6.77 | | | | 5.88 | | | | (3.05 | ) |
| | | | | | |
| | Distributions to shareholders from net investment income | | | (0.23 | ) | | | (0.32 | ) | | | (0.44 | ) | | | (0.38 | ) | | | — | |
| | | | | | |
| | Distributions to shareholders from net realized gains | | | (5.84 | ) | | | (6.31 | ) | | | (1.75 | ) | | | (2.41 | ) | | | — | |
| | | | | | |
| | Total distributions | | | (6.07 | ) | | | (6.63 | ) | | | (2.19 | ) | | | (2.79 | ) | | | — | |
| | | | | | |
| | Net asset value, end of period | | $ | 53.76 | | | $ | 64.88 | | | $ | 60.77 | | | $ | 56.19 | | | $ | 53.10 | |
| | | | | | |
| | Total return(d) | | | (6.95 | )% | | | 18.63 | % | | | 12.03 | % | | | 11.68 | % | | | (5.43 | )% |
| | | | | | |
| | Net assets, end of period (in 000s) | | $ | 1,359,669 | | | $ | 1,146,132 | | | $ | 759,095 | | | $ | 317,289 | | | $ | 26,847 | |
| | | | | | |
| | Ratio of net expenses to average net assets | | | 0.94 | %(e) | | | 0.93 | % | | | 0.92 | % | | | 0.93 | % | | | 0.93 | %(e) |
| | | | | | |
| | Ratio of total expenses to average net assets | | | 0.96 | %(e) | | | 0.96 | % | | | 0.96 | % | | | 0.98 | % | | | 1.00 | %(e) |
| | | | | | |
| | Ratio of Net investment income (loss) | | | 0.88 | %(e) | | | 0.44 | % | | | 0.63 | % | | | 0.71 | % | | | (0.62 | )%(c) |
| | | | | | |
| | Portfolio turnover rate(f) | | | 22 | % | | | 55 | % | | | 68 | % | | | 46 | % | | | 49 | % |
| | (a) | | Commenced operations on July 31, 2015. |
| | (b) | | Calculated based on the average shares outstanding methodology. |
| | (c) | | Reflects income recognized from special dividends which amounted to $0.10 per share and 0.18% of average net assets. |
| | (d) | | Assumes investment at the NAV at the beginning of the period, reinvestment of all dividends and distributions, a complete redemption of the investment at the NAV at the end of the period and no sales or redemption charges. Total returns would be reduced if a sales or redemption charge was taken into account. Returns do not reflect the impact of taxes to shareholders relating to Fund distributions or the redemption of Fund shares. Total returns for periods less than one full year are not annualized. |
| | (f) | | The Fund’s portfolio turnover rate is calculated in accordance with regulatory requirements, without regard to transactions involving short term investments. If such transactions were included, the Fund’s portfolio turnover rate may be higher. |
| | |
| 102 | | The accompanying notes are an integral part of these financial statements. |
GOLDMAN SACHS SMALL/MID CAP VALUE FUND
Financial Highlights(continued)
Selected Share Data for a Share Outstanding Throughout Each Period
| | | | | | | | | | | | | | | | | | | | | | | | | | |
| | | | | Goldman Sachs Small/Mid Cap Value Fund | |
| | | | | Class A Shares | |
| | | | | Six Months Ended
February 28, 2019
(Unaudited) | | | Year Ended August 31, | | | Period Ended
August 31, 2014(a) | |
| | | | | 2018 | | | 2017 | | | 2016 | | | 2015 | |
| | Per Share Data | | | | | | | | | | | | | | | | | | | | | | | | |
| | | | | | | |
| | Net asset value, beginning of period | | $ | 13.58 | | | $ | 12.37 | | | $ | 11.18 | | | $ | 10.46 | | | $ | 11.01 | | | $ | 10.00 | |
| | | | | | | |
| | Net investment income (loss)(b) | | | 0.04 | | | | 0.04 | | | | 0.07 | | | | 0.08 | (c) | | | 0.02 | | | | (0.02 | ) |
| | | | | | | |
| | Net realized and unrealized gain (loss) | | | (0.88 | ) | | | 1.72 | | | | 1.19 | | | | 0.70 | | | | (0.38 | ) | | | 1.03 | |
| | | | | | | |
| | Total from investment operations | | | (0.84 | ) | | | 1.76 | | | | 1.26 | | | | 0.78 | | | | (0.36 | ) | | | 1.01 | |
| | | | | | | |
| | Distributions to shareholders from net investment income | | | (0.02 | ) | | | (0.08 | ) | | | (0.07 | ) | | | (0.01 | ) | | | (0.03 | ) | | | — | |
| | | | | | | |
| | Distributions to shareholders from net realized gains | | | (0.76 | ) | | | (0.47 | ) | | | — | | | | (0.05 | ) | | | (0.16 | ) | | | — | |
| | | | | | | |
| | Total distributions | | | (0.78 | ) | | | (0.55 | ) | | | (0.07 | ) | | | (0.06 | ) | | | (0.19 | ) | | | — | |
| | | | | | | |
| | Net asset value, end of period | | $ | 11.96 | | | $ | 13.58 | | | $ | 12.37 | | | $ | 11.18 | | | $ | 10.46 | | | $ | 11.01 | |
| | | | | | | |
| | Total return(d) | | | (5.66 | )% | | | 14.47 | % | | | 11.30 | % | | | 7.49 | % | | | (3.34 | )% | | | 10.10 | % |
| | | | | | | |
| | Net assets, end of period (in 000s) | | $ | 1,545 | | | $ | 1,699 | | | $ | 1,497 | | | $ | 1,128 | | | $ | 530 | | | $ | 150 | |
| | | | | | | |
| | Ratio of net expenses to average net assets | | | 1.23 | %(e) | | | 1.23 | % | | | 1.24 | % | | | 1.26 | % | | | 1.34 | % | | | 1.33 | %(e) |
| | | | | | | |
| | Ratio of total expenses to average net assets | | | 1.52 | %(e) | | | 1.47 | % | | | 1.73 | % | | | 2.25 | % | | | 4.38 | % | | | 6.90 | %(e) |
| | | | | | | |
| | Ratio of net investment income (loss) to average net assets | | | 0.73 | %(e) | | | 0.34 | % | | | 0.58 | % | | | 0.78 | %(c) | | | 0.14 | % | | | (0.27 | )%(e) |
| | | | | | | |
| | Portfolio turnover rate(f) | | | 40 | % | | | 105 | % | | | 108 | % | | | 109 | % | | | 122 | % | | | 53 | % |
| | (a) | | Commenced operations on January 31, 2014. |
| | (b) | | Calculated based on the average shares outstanding methodology. |
| | (c) | | Reflects income recognized from special dividends which amounted to $0.03 per share and 0.29% of average net assets. |
| | (d) | | Assumes investment at the NAV at the beginning of the period, reinvestment of all dividends and distributions, a complete redemption of the investment at the NAV at the end of the period and no sales or redemption charges. Total returns would be reduced if a sales or redemption charge was taken into account. Returns do not reflect the impact of taxes to shareholders relating to Fund distributions or the redemption of Fund shares. Total returns for periods less than one full year are not annualized. |
| | (f) | | The Fund’s portfolio turnover rate is calculated in accordance with regulatory requirements, without regard to transactions involving short term investments. If such transactions were included, the Fund’s portfolio turnover rate may be higher. |
| | |
| The accompanying notes are an integral part of these financial statements. | | 103 |
GOLDMAN SACHS SMALL/MID CAP VALUE FUND
Financial Highlights(continued)
Selected Share Data for a Share Outstanding Throughout Each Period
| | | | | | | | | | | | | | | | | | | | | | | | | | |
| | | | | Goldman Sachs Small/Mid Cap Value Fund | |
| | | | | Class C Shares | |
| | | | | Six Months Ended
February 28, 2019
(Unaudited) | | | Year Ended August 31, | | | Period Ended
August 31, 2014(a) | |
| | | | | 2018 | | | 2017 | | | 2016 | | | 2015 | |
| | Per Share Data | | | | | | | | | | | | | | | | | | | | | | | | |
| | | | | | | |
| | Net asset value, beginning of period | | $ | 13.30 | | | $ | 12.14 | | | $ | 11.01 | | | $ | 10.37 | | | $ | 10.97 | | | $ | 10.00 | |
| | | | | | | |
| | Net investment income (loss)(b) | | | — | (d) | | | (0.06 | ) | | | (0.02 | ) | | | — | (c)(d) | | | (0.07 | ) | | | (0.06 | ) |
| | | | | | | |
| | Net realized and unrealized gain (loss) | | | (0.86 | ) | | | 1.69 | | | | 1.17 | | | | 0.69 | | | | (0.37 | ) | | | 1.03 | |
| | | | | | | |
| | Total from investment operations | | | (0.86 | ) | | | 1.63 | | | | 1.15 | | | | 0.69 | | | | (0.44 | ) | | | 0.97 | |
| | | | | | | |
| | Distributions to shareholders from net investment income | | | — | | | | — | | | | (0.02 | ) | | | — | | | | — | | | | — | |
| | | | | | | |
| | Distributions to shareholders from net realized gains | | | (0.76 | ) | | | (0.47 | ) | | | — | | | | (0.05 | ) | | | (0.16 | ) | | | — | |
| | | | | | | |
| | Total distributions | | | (0.76 | ) | | | (0.47 | ) | | | (0.02 | ) | | | (0.05 | ) | | | (0.16 | ) | | | — | |
| | | | | | | |
| | Net asset value, end of period | | $ | 11.68 | | | $ | 13.30 | | | $ | 12.14 | | | $ | 11.01 | | | $ | 10.37 | | | $ | 10.97 | |
| | | | | | | |
| | Total return(e) | | | (5.99 | )% | | | 13.63 | % | | | 10.48 | % | | | 6.71 | % | | | (4.02 | )% | | | 9.70 | % |
| | | | | | | |
| | Net assets, end of period (in 000s) | | $ | 1,006 | | | $ | 1,140 | | | $ | 1,126 | | | $ | 618 | | | $ | 321 | | | $ | 105 | |
| | | | | | | |
| | Ratio of net expenses to average net assets | | | 1.98 | %(f) | | | 1.98 | % | | | 1.99 | % | | | 2.01 | % | | | 2.09 | % | | | 2.08 | %(f) |
| | | | | | | |
| | Ratio of total expenses to average net assets | | | 2.27 | %(f) | | | 2.22 | % | | | 2.47 | % | | | 2.99 | % | | | 5.25 | % | | | 8.31 | %(f) |
| | | | | | | |
| | Ratio of net investment income (loss) to average net assets | | | (0.02 | )%(f) | | | (0.44 | )% | | | (0.17 | )% | | | 0.04 | %(c) | | | (0.61 | )% | | | (1.01 | )%(f) |
| | | | | | | |
| | Portfolio turnover rate(g) | | | 40 | % | | | 105 | % | | | 108 | % | | | 109 | % | | | 122 | % | | | 53 | % |
| | (a) | | Commenced operations on January 31, 2014. |
| | (b) | | Calculated based on the average shares outstanding methodology. |
| | (c) | | Reflects income recognized from special dividends which amounted to $0.03 per share and 0.29% of average net assets. |
| | (d) | | Amount is less than $0.005 per share. |
| | (e) | | Assumes investment at the NAV at the beginning of the period, reinvestment of all dividends and distributions, a complete redemption of the investment at the NAV at the end of the period and no sales or redemption charges. Total returns would be reduced if a sales or redemption charge was taken into account. Returns do not reflect the impact of taxes to shareholders relating to Fund distributions or the redemption of Fund shares. Total returns for periods less than one full year are not annualized. |
| | (g) | | The Fund’s portfolio turnover rate is calculated in accordance with regulatory requirements, without regard to transactions involving short term investments. If such transactions were included, the Fund’s portfolio turnover rate may be higher. |
| | |
| 104 | | The accompanying notes are an integral part of these financial statements. |
GOLDMAN SACHS SMALL/MID CAP VALUE FUND
Financial Highlights(continued)
Selected Share Data for a Share Outstanding Throughout Each Period
| | | | | | | | | | | | | | | | | | | | | | | | | | |
| | | | | Goldman Sachs Small/Mid Cap Value Fund | |
| | | | | Institutional Shares | |
| | | | | Six Months Ended
February 28, 2019
(Unaudited) | | | Year Ended August 31, | | | Period Ended
August 31, 2014(a) | |
| | | | | 2018 | | | 2017 | | | 2016 | | | 2015 | |
| | Per Share Data | | | | | | | | | | | | | | | | | | | | | | | | |
| | | | | | | |
| | Net asset value, beginning of period | | $ | 13.74 | | | $ | 12.50 | | | $ | 11.29 | | | $ | 10.53 | | | $ | 11.04 | | | $ | 10.00 | |
| | | | | | | |
| | Net investment income(b) | | | 0.07 | | | | 0.08 | | | | 0.12 | | | | 0.12 | (c) | | | 0.06 | | | | 0.03 | |
| | | | | | | |
| | Net realized and unrealized gain (loss) | | | (0.89 | ) | | | 1.75 | | | | 1.20 | | | | 0.71 | | | | (0.36 | ) | | | 1.01 | |
| | | | | | | |
| | Total from investment operations | | | (0.82 | ) | | | 1.83 | | | | 1.32 | | | | 0.83 | | | | (0.30 | ) | | | 1.04 | |
| | | | | | | |
| | Distributions to shareholders from net investment income | | | (0.04 | ) | | | (0.12 | ) | | | (0.11 | ) | | | (0.02 | ) | | | (0.05 | ) | | | — | |
| | | | | | | |
| | Distributions to shareholders from net realized gains | | | (0.76 | ) | | | (0.47 | ) | | | — | | | | (0.05 | ) | | | (0.16 | ) | | | — | |
| | | | | | | |
| | Total distributions | | | (0.80 | ) | | | (0.59 | ) | | | (0.11 | ) | | | (0.07 | ) | | | (0.21 | ) | | | — | |
| | | | | | | |
| | Net asset value, end of period | | $ | 12.12 | | | $ | 13.74 | | | $ | 12.50 | | | $ | 11.29 | | | $ | 10.53 | | | $ | 11.04 | |
| | | | | | | |
| | Total return(d) | | | (5.47 | )% | | | 14.93 | % | | | 11.71 | % | | | 7.96 | % | | | (2.79 | )% | | | 10.40 | % |
| | | | | | | |
| | Net assets, end of period (in 000s) | | $ | 6,110 | | | $ | 5,666 | | | $ | 42,085 | | | $ | 39,176 | | | $ | 25,756 | | | $ | 3,755 | |
| | | | | | | |
| | Ratio of net expenses to average net assets | | | 0.84 | %(e) | | | 0.84 | % | | | 0.84 | % | | | 0.87 | % | | | 0.93 | % | | | 0.93 | %(e) |
| | | | | | | |
| | Ratio of total expenses to average net assets | | | 1.13 | %(e) | | | 1.08 | % | | | 1.35 | % | | | 1.84 | % | | | 3.41 | % | | | 12.86 | %(e) |
| | | | | | | |
| | Ratio of net investment income to average net assets | | | 1.12 | %(e) | | | 0.58 | % | | | 0.97 | % | | | 1.18 | %(c) | | | 0.51 | % | | | 0.49 | %(e) |
| | | | | | | |
| | Portfolio turnover rate(f) | | | 40 | % | | | 105 | % | | | 108 | % | | | 109 | % | | | 122 | % | | | 53 | % |
| | (a) | | Commenced operations on January 31, 2014. |
| | (b) | | Calculated based on the average shares outstanding methodology. |
| | (c) | | Reflects income recognized from special dividends which amounted to $0.03 per share and 0.29% of average net assets. |
| | (d) | | Assumes investment at the NAV at the beginning of the period, reinvestment of all dividends and distributions, a complete redemption of the investment at the NAV at the end of the period and no sales or redemption charges. Total returns would be reduced if a sales or redemption charge was taken into account. Returns do not reflect the impact of taxes to shareholders relating to Fund distributions or the redemption of Fund shares. Total returns for periods less than one full year are not annualized. |
| | (f) | | The Fund’s portfolio turnover rate is calculated in accordance with regulatory requirements, without regard to transactions involving short term investments. If such transactions were included, the Fund’s portfolio turnover rate may be higher. |
| | |
| The accompanying notes are an integral part of these financial statements. | | 105 |
GOLDMAN SACHS SMALL/MID CAP VALUE FUND
Financial Highlights(continued)
Selected Share Data for a Share Outstanding Throughout Each Period
| | | | | | | | | | | | | | | | | | | | | | | | | | |
| | | | | Goldman Sachs Small/Mid Cap Value Fund | |
| | | | | Investor Shares | |
| | | | | Six Months Ended
February 28, 2019
(Unaudited) | | | Year Ended August 31, | | | Period Ended
August 31, 2014(a) | |
| | | | | 2018 | | | 2017 | | | 2016 | | | 2015 | |
| | Per Share Data | | | | | | | | | | | | | | | | | | | | | | | | |
| | | | | | | |
| | Net asset value, beginning of period | | $ | 13.67 | | | $ | 12.44 | | | $ | 11.23 | | | $ | 10.49 | | | $ | 11.03 | | | $ | 10.00 | |
| | | | | | | |
| | Net investment income(b) | | | 0.06 | | | | 0.08 | | | | 0.10 | | | | 0.11 | (c) | | | 0.05 | | | | 0.02 | |
| | | | | | | |
| | Net realized and unrealized gain (loss) | | | (0.89 | ) | | | 1.73 | | | | 1.19 | | | | 0.71 | | | | (0.39 | ) | | | 1.01 | |
| | | | | | | |
| | Total from investment operations | | | (0.83 | ) | | | 1.81 | | | | 1.29 | | | | 0.82 | | | | (0.34 | ) | | | 1.03 | |
| | | | | | | |
| | Distributions to shareholders from net investment income | | | (0.04 | ) | | | (0.11 | ) | | | (0.08 | ) | | | (0.03 | ) | | | (0.04 | ) | | | — | |
| | | | | | | |
| | Distributions to shareholders from net realized gains | | | (0.76 | ) | | | (0.47 | ) | | | — | | | | (0.05 | ) | | | (0.16 | ) | | | — | |
| | | | | | | |
| | Total distributions | | | (0.80 | ) | | | (0.58 | ) | | | (0.08 | ) | | | (0.08 | ) | | | (0.20 | ) | | | — | |
| | | | | | | |
| | Net asset value, end of period | | $ | 12.04 | | | $ | 13.67 | | | $ | 12.44 | | | $ | 11.23 | | | $ | 10.49 | | | $ | 11.03 | |
| | | | | | | |
| | Total return(d) | | | (5.59 | )% | | | 14.82 | % | | | 11.52 | % | | | 7.81 | % | | | (3.11 | )% | | | 10.30 | % |
| | | | | | | |
| | Net assets, end of period (in 000s) | | $ | 3,356 | | | $ | 5,541 | | | $ | 3,250 | | | $ | 2,846 | | | $ | 119 | | | $ | 28 | |
| | | | | | | |
| | Ratio of net expenses to average net assets | | | 0.98 | %(e) | | | 0.98 | % | | | 0.99 | % | | | 1.01 | % | | | 1.09 | % | | | 1.08 | %(e) |
| | | | | | | |
| | Ratio of total expenses to average net assets | | | 1.27 | %(e) | | | 1.22 | % | | | 1.48 | % | | | 2.03 | % | | | 4.00 | % | | | 13.25 | %(e) |
| | | | | | | |
| | Ratio of net investment loss to average net assets | | | 0.95 | %(e) | | | 0.61 | % | | | 0.82 | % | | | 1.08 | %(c) | | | 0.43 | % | | | 0.39 | %(e) |
| | | | | | | |
| | Portfolio turnover rate(f) | | | 40 | % | | | 105 | % | | | 108 | % | | | 109 | % | | | 122 | % | | | 53 | % |
| | (a) | | Commenced operations on January 31, 2014. |
| | (b) | | Calculated based on the average shares outstanding methodology. |
| | (c) | | Reflects income recognized from special dividends which amounted to $0.03 per share and 0.29% of average net assets. |
| | (d) | | Assumes investment at the NAV at the beginning of the period, reinvestment of all dividends and distributions, a complete redemption of the investment at the NAV at the end of the period and no sales or redemption charges. Total returns would be reduced if a sales or redemption charge was taken into account. Returns do not reflect the impact of taxes to shareholders relating to Fund distributions or the redemption of Fund shares. Total returns for periods less than one full year are not annualized. |
| | (f) | | The Fund’s portfolio turnover rate is calculated in accordance with regulatory requirements, without regard to transactions involving short term investments. If such transactions were included, the Fund’s portfolio turnover rate may be higher. |
| | |
| 106 | | The accompanying notes are an integral part of these financial statements. |
GOLDMAN SACHS SMALL/MID CAP VALUE FUND
Financial Highlights(continued)
Selected Share Data for a Share Outstanding Throughout Each Period
| | | | | | | | | | |
| | | | | Goldman Sachs Small/Mid Cap Value Fund | |
| | | | | Class P Shares | |
| | | | | Six Months Ended
February 28, 2019
(Unaudited) | | | Period Ended
August 31, 2018(a) | |
| | | |
| | Per Share Data | | | | | | | | |
| | | |
| | Net asset value, beginning of period | | $ | 13.75 | | | $ | 13.26 | |
| | | |
| | Net investment income(b) | | | 0.07 | | | | 0.05 | |
| | | |
| | Net realized and unrealized gain (loss) | | | (0.90 | ) | | | 0.44 | |
| | | |
| | Total from investment operations | | | (0.83 | ) | | | 0.49 | |
| | | |
| | Distributions to shareholders from net investment income | | | (0.06 | ) | | | — | |
| | | |
| | Distributions to shareholders from net realized gains | | | (0.76 | ) | | | — | |
| | | |
| | Total distributions | | | (0.82 | ) | | | — | |
| | | |
| | Net asset value, end of period | | $ | 12.10 | | | $ | 13.75 | |
| | | |
| | Total return(c) | | | (5.52 | )% | | | 3.70 | % |
| | | |
| | Net assets, end of period (in 000s) | | $ | 51,646 | | | $ | 54,660 | |
| | | |
| | Ratio of net expenses to average net assets(d) | | | 0.83 | % | | | 0.83 | % |
| | | |
| | Ratio of total expenses to average net assets(d) | | | 1.12 | % | | | 1.09 | % |
| | | |
| | Ratio of net investment income to average net assets(d) | | | 1.13 | % | | | 0.99 | % |
| | | |
| | Portfolio turnover rate(e) | | | 40 | % | | | 105 | % |
| | (a) | | Commenced operations on April 17, 2018. |
| | (b) | | Calculated based on the average shares outstanding methodology. |
| | (c) | | Assumes investment at the NAV at the beginning of the period, reinvestment of all dividends and distributions, a complete redemption of the investment at the NAV at the end of the period and no sales or redemption charges. Total returns would be reduced if a sales or redemption charge was taken into account. Returns do not reflect the impact of taxes to shareholders relating to Fund distributions or the redemption of Fund shares. Total returns for periods less than one full year are not annualized. |
| | (e) | | The Fund’s portfolio turnover rate is calculated in accordance with regulatory requirements, without regard to transactions involving short term investments. If such transactions were included, the Fund’s portfolio turnover rate may be higher. |
| | |
| The accompanying notes are an integral part of these financial statements. | | 107 |
GOLDMAN SACHS SMALL/MID CAP VALUE FUND
Financial Highlights(continued)
Selected Share Data for a Share Outstanding Throughout Each Period
| | | | | | | | | | | | | | | | | | | | | | | | | | |
| | | | | Goldman Sachs Small/Mid Cap Value Fund | |
| | | | | Class R Shares | |
| | | | | Six Months Ended
February 28, 2019
(Unaudited) | | | Year Ended August 31, | | | Period ended
August 31, 2014(a) | |
| | | | | 2018 | | | 2017 | | | 2016 | | | 2015 | |
| | Per Share Data | | | | | | | | | | | | | | | | | | | | | | | | |
| | | | | | | |
| | Net asset value, beginning of period | | $ | 13.56 | | | $ | 12.35 | | | $ | 11.15 | | | $ | 10.45 | | | $ | 11.00 | | | $ | 10.00 | |
| | | | | | | |
| | Net investment income (loss)(b) | | | 0.03 | | | | 0.01 | | | | 0.04 | | | | 0.05 | (c) | | | (0.02 | ) | | | (0.01 | ) |
| | | | | | | |
| | Net realized and unrealized gain (loss) | | | (0.88 | ) | | | 1.72 | | | | 1.19 | | | | 0.70 | | | | (0.37 | ) | | | 1.01 | |
| | | | | | | |
| | Total from investment operations | | | (0.85 | ) | | | 1.73 | | | | 1.23 | | | | 0.75 | | | | (0.39 | ) | | | 1.00 | |
| | | | | | | |
| | Distributions to shareholders from net investment income | | | (0.01 | ) | | | (0.05 | ) | | | (0.03 | ) | | | — | | | | — | | | | — | |
| | | | | | | |
| | Distributions to shareholders from net realized gains | | | (0.76 | ) | | | (0.47 | ) | | | — | | | | (0.05 | ) | | | (0.16 | ) | | | — | |
| | | | | | | |
| | Total distributions | | | (0.77 | ) | | | (0.52 | ) | | | (0.03 | ) | | | (0.05 | ) | | | (0.16 | ) | | | — | |
| | | | | | | |
| | Net asset value, end of period | | $ | 11.94 | | | $ | 13.56 | | | $ | 12.35 | | | $ | 11.15 | | | $ | 10.45 | | | $ | 11.00 | |
| | | | | | | |
| | Total return(d) | | | (5.81 | )% | | | 14.20 | % | | | 11.06 | % | | | 7.24 | % | | | (3.55 | )% | | | 10.00 | % |
| | | | | | | |
| | Net assets, end of period (in 000s) | | $ | 199 | | | $ | 207 | | | $ | 131 | | | $ | 132 | | | $ | 130 | | | $ | 28 | |
| | | | | | | |
| | Ratio of net expenses to average net assets | | | 1.48 | %(e) | | | 1.48 | % | | | 1.49 | % | | | 1.52 | % | | | 1.59 | % | | | 1.58 | %(e) |
| | | | | | | |
| | Ratio of total expenses to average net assets | | | 1.77 | %(e) | | | 1.72 | % | | | 2.00 | % | | | 2.50 | % | | | 3.81 | % | | | 13.76 | %(e) |
| | | | | | | |
| | Ratio of net investment income (loss) to average net assets | | | 0.49 | %(e) | | | 0.09 | % | | | 0.32 | % | | | 0.49 | %(c) | | | (0.19 | )% | | | (0.11 | )%(e) |
| | | | | | | |
| | Portfolio turnover rate(f) | | | 40 | % | | | 105 | % | | | 108 | % | | | 109 | % | | | 122 | % | | | 53 | % |
| | (a) | | Commenced operations on January 31, 2014. |
| | (b) | | Calculated based on the average shares outstanding methodology. |
| | (c) | | Reflects income recognized from special dividends which amounted to $0.03 per share and 0.29% of average net assets. |
| | (d) | | Assumes investment at the NAV at the beginning of the period, reinvestment of all dividends and distributions, a complete redemption of the investment at the NAV at the end of the period and no sales or redemption charges. Total returns would be reduced if a sales or redemption charge was taken into account. Returns do not reflect the impact of taxes to shareholders relating to Fund distributions or the redemption of Fund shares. Total returns for periods less than one full year are not annualized. |
| | (f) | | The Fund’s portfolio turnover rate is calculated in accordance with regulatory requirements, without regard to transactions involving short term investments. If such transactions were included, the Fund’s portfolio turnover rate may be higher. |
| | |
| 108 | | The accompanying notes are an integral part of these financial statements. |
GOLDMAN SACHS SMALL/MID CAP VALUE FUND
Financial Highlights(continued)
Selected Share Data for a Share Outstanding Throughout Each Period
| | | | | | | | | | | | | | | | | | | | | | |
| | | | | Goldman Sachs Small/Mid Cap Value Fund | |
| | | | | Class R6 Shares | |
| | | | | Six Months Ended
February 28, 2019
(Unaudited) | | | Year Ended August 31, | | | Period ended
August 31, 2015(a) | |
| | | | | 2018 | | | 2017 | | | 2016 | |
| | Per Share Data | | | | | | | | | | | | | | | | | | | | |
| | | | | | |
| | Net asset value, beginning of period | | $ | 13.75 | | | $ | 12.51 | | | $ | 11.29 | | | $ | 10.53 | | | $ | 11.14 | |
| | | | | | |
| | Net investment income(b) | | | 0.07 | | | | 0.10 | | | | 0.12 | | | | 0.12 | (c) | | | — | (d) |
| | | | | | |
| | Net realized and unrealized gain (loss) | | | (0.90 | ) | | | 1.73 | | | | 1.21 | | | | 0.72 | | | | (0.61 | ) |
| | | | | | |
| | Total from investment operations | | | (0.83 | ) | | | 1.83 | | | | 1.33 | | | | 0.84 | | | | (0.61 | ) |
| | | | | | |
| | Distributions to shareholders from net investment income | | | (0.05 | ) | | | (0.12 | ) | | | (0.11 | ) | | | (0.03 | ) | | | — | |
| | | | | | |
| | Distributions to shareholders from net realized gains | | | (0.76 | ) | | | (0.47 | ) | | | — | | | | (0.05 | ) | | | — | |
| | | | | | |
| | Total distributions | | | (0.81 | ) | | | (0.59 | ) | | | (0.11 | ) | | | (0.08 | ) | | | — | |
| | | | | | |
| | Net asset value, end of period | | $ | 12.11 | | | $ | 13.75 | | | $ | 12.51 | | | $ | 11.29 | | | $ | 10.53 | |
| | | | | | |
| | Total return(e) | | | (5.45 | )% | | | 14.94 | % | | | 11.80 | % | | | 7.98 | % | | | (5.48 | )% |
| | | | | | |
| | Net assets, end of period (in 000s) | | $ | 57,877 | | | $ | 60,931 | | | $ | 61,251 | | | $ | 10 | | | $ | 9 | |
| | | | | | |
| | Ratio of net expenses to average net assets | | | 0.83 | %(f) | | | 0.83 | % | | | 0.83 | % | | | 0.88 | % | | | 0.94 | %(f) |
| | | | | | |
| | Ratio of total expenses to average net assets | | | 1.12 | %(f) | | | 1.07 | % | | | 1.08 | % | | | 1.90 | % | | | 4.88 | %(f) |
| | | | | | |
| | Ratio of Net investment income (loss) | | | 1.13 | %(f) | | | 0.75 | % | | | 0.97 | % | | | 1.14 | %(c) | | | (0.43 | )%(f) |
| | | | | | |
| | Portfolio turnover rate(g) | | | 40 | % | | | 105 | % | | | 108 | % | | | 109 | % | | | 122 | % |
| | (a) | | Commenced operations on July 31, 2015. |
| | (b) | | Calculated based on the average shares outstanding methodology. |
| | (c) | | Reflects income recognized from special dividends which amounted to $0.03 per share and 0.29% of average net assets. |
| | (d) | | Amount is less than $0.005 per share. |
| | (e) | | Assumes investment at the NAV at the beginning of the period, reinvestment of all dividends and distributions, a complete redemption of the investment at the NAV at the end of the period and no sales or redemption charges. Total returns would be reduced if a sales or redemption charge was taken into account. Returns do not reflect the impact of taxes to shareholders relating to Fund distributions or the redemption of Fund shares. Total returns for periods less than one full year are not annualized. |
| | (g) | | The Fund’s portfolio turnover rate is calculated in accordance with regulatory requirements, without regard to transactions involving short term investments. If such transactions were included, the Fund’s portfolio turnover rate may be higher. |
| | |
| The accompanying notes are an integral part of these financial statements. | | 109 |
GOLDMAN SACHS FUNDAMENTAL EQUITY VALUE FUNDS
Notes to Financial Statements
February 28, 2019 (Unaudited)
Goldman Sachs Trust (the “Trust”) is a Delaware statutory trust registered under the Investment Company Act of 1940, as amended (the “Act”), as an open-end management investment company. The following table lists those series of the Trust that are included in this report (collectively, the “Funds” or individually a “Fund”), along with their corresponding share classes and respective diversification status under the Act:
| | | | |
| Fund | | Share Classes Offered | | Diversified/
Non-diversified |
Focused Value | | A, C, Institutional, Investor, P, R and R6 | | Non-diversified |
Equity Income, Large Cap Value, Mid Cap Value, Small Cap Value | | A, C, Institutional, Service, Investor, P, R and R6 | | Diversified |
Small/Mid Cap Value | | A, C, Institutional, Investor, P, R and R6 | | Diversified |
Class A Shares are sold with a front-end sales charge of up to 5.50%. Class C Shares are sold with a contingent deferred sales charge (“CDSC”) of 1.00%, which is imposed on redemptions made within 12 months of purchase. Institutional, Service, Investor, Class P, Class R and Class R6 Shares are not subject to a sales charge.
Goldman Sachs Asset Management, L.P. (“GSAM”), an affiliate of Goldman Sachs & Co. LLC (“Goldman Sachs”), serves as investment adviser to the Funds pursuant to a management agreement (the “Agreement”) with the Trust.
|
| 2. SIGNIFICANT ACCOUNTING POLICIES |
The financial statements have been prepared in accordance with accounting principles generally accepted in the United States of America (“GAAP”) and require management to make estimates and assumptions that may affect the reported amounts and disclosures. Actual results may differ from those estimates and assumptions.
A. Investment Valuation — The Funds’ valuation policy is to value investments at fair value.
B. Investment Income and Investments — Investment income includes interest income, dividend income, and securities lending income, if any. Interest income is accrued daily and adjusted for amortization of premiums and accretion of discounts. Dividend income is recognized on ex-dividend date or, for certain foreign securities, as soon as such information is obtained subsequent to the ex-dividend date. Investment transactions are reflected on trade date. Realized gains and losses are calculated using identified cost. Investment transactions are recorded on the following business day for daily net asset value (“NAV”) calculations. Investment income is recorded net of any foreign withholding taxes, less any amounts reclaimable. The Funds may file withholding tax reclaims in certain jurisdictions to recover a portion of amounts previously withheld. Any foreign capital gains tax is accrued daily based upon net unrealized gains, and is payable upon sale of such investments. Distributions received from the Funds’ investments in U.S. real estate investment trusts (“REITs”) may be characterized as ordinary income, net capital gain or a return of capital. A return of capital is recorded by the Funds as a reduction to the cost basis of the REIT.
C. Class Allocations and Expenses — Investment income, realized and unrealized gain (loss), if any, and non-class specific expenses of each Fund are allocated daily based upon the proportion of net assets of each class. Non-class specific expenses directly incurred by a Fund are charged to that Fund, while such expenses incurred by the Trust are allocated across the applicable Funds on a straight-line and/or pro-rata basis depending upon the nature of the expenses. Class specific expenses, where applicable, are borne by the respective share classes and include Distribution and Service, Transfer Agency, and Service and Shareholder Administration fees.
D. Federal Taxes and Distributions to Shareholders — It is each Fund’s policy to comply with the requirements of the Internal Revenue Code of 1986, as amended (the “Code”), applicable to regulated investment companies and to distribute each year substantially all of its investment company taxable income and capital gains to its shareholders. Accordingly, each Fund is not
110
GOLDMAN SACHS FUNDAMENTAL EQUITY VALUE FUNDS
|
| 2. SIGNIFICANT ACCOUNTING POLICIES (continued) |
required to make any provisions for the payment of federal income tax. Distributions to shareholders are recorded on the ex-dividend date. Income and capital gains distributions, if any, are declared and paid according to the following schedule:
| | | | | | |
| Fund | | | | Income Distributions
Declared/Paid | | Capital Gains Distributions Declared/Paid |
Equity Income | | | | Quarterly | | Annually |
Focused Value, Large Cap Value, Mid Cap Value,
Small Cap Value and Small/Mid Cap Value | | | | Annually | | Annually |
Net capital losses, if any, are carried forward to future fiscal years and may be used to the extent allowed by the Code to offset any future capital gains. Losses that are carried forward will retain their character as either short-term or long-term capital losses. Utilization of capital loss carryforwards will reduce the requirement of future capital gains distributions.
The characterization of distributions to shareholders for financial reporting purposes is determined in accordance with federal income tax rules, which may differ from GAAP. The source of each Fund’s distributions may be shown in the accompanying financial statements as either from distributable earnings or capital. Certain components of the Funds’ net assets on the Statements of Assets and Liabilities reflect permanent GAAP/tax differences based on the appropriate tax character.
E. Foreign Currency Translation — The accounting records and reporting currency of the Funds are maintained in U.S. dollars. Assets and liabilities denominated in foreign currencies are translated into U.S. dollars using the current exchange rates at the close of each business day. The effect of changes in foreign currency exchange rates on investments is included within net realized and unrealized gain (loss) on investments. Changes in the value of other assets and liabilities as a result of fluctuations in foreign exchange rates are included in the Statements of Operations within net change in unrealized gain (loss) on foreign currency translation. Transactions denominated in foreign currencies are translated into U.S. dollars on the date the transaction occurred, the effects of which are included within net realized gain (loss) on foreign currency transactions.
F. Commission Recapture — GSAM, on behalf of certain Funds, may direct portfolio trades, subject to seeking best execution, to various brokers who have agreed to rebate a portion of the commissions generated. Such rebates are made directly to the Funds as cash payments and are included in net realized gain (loss) from investments on the Statements of Operations.
| | |
| 3. INVESTMENTS AND FAIR VALUE MEASUREMENTS |
U.S. GAAP defines the fair value of a financial instrument as the amount that would be received to sell an asset or paid to transfer a liability in an orderly transaction between market participants at the measurement date (i.e., the exit price); the Funds’ policy is to use the market approach. GAAP establishes a fair value hierarchy that prioritizes the inputs to valuation techniques used to measure fair value. The hierarchy gives the highest priority to unadjusted quoted prices in active markets for identical assets or liabilities (Level 1 measurements) and the lowest priority to unobservable inputs (Level 3 measurements). The levels used for classifying investments are not necessarily an indication of the risk associated with investing in these investments. The three levels of the fair value hierarchy are described below:
Level 1 — Unadjusted quoted prices in active markets that are accessible at the measurement date for identical, unrestricted assets or liabilities;
Level 2 — Quoted prices in markets that are not active or financial instruments for which significant inputs are observable (including, but not limited to, quoted prices for similar investments, interest rates, foreign exchange rates, volatility and credit spreads), either directly or indirectly;
Level 3 — Prices or valuations that require significant unobservable inputs (including GSAM’s assumptions in determining fair value measurement).
The Board of Trustees (“Trustees”) has approved Valuation Procedures that govern the valuation of the portfolio investments held by the Funds, including investments for which market quotations are not readily available. The Trustees have delegated to GSAM
111
GOLDMAN SACHS FUNDAMENTAL EQUITY VALUE FUNDS
Notes to Financial Statements(continued)
February 28, 2019 (Unaudited)
|
| 3. INVESTMENTS AND FAIR VALUE MEASUREMENTS (continued) |
day-to-day responsibility for implementing and maintaining internal controls and procedures related to the valuation of the Funds’ investments. To assess the continuing appropriateness of pricing sources and methodologies, GSAM regularly performs price verification procedures and issues challenges as necessary to third party pricing vendors or brokers, and any differences are reviewed in accordance with the Valuation Procedures.
A. Level 1 and Level 2 Fair Value Investments — The valuation techniques and significant inputs used in determining the fair values for investments classified as Level 1 and Level 2 are as follows:
Equity Securities — Equity securities traded on a United States (“U.S.”) securities exchange or the NASDAQ system, or those located on certain foreign exchanges, including but not limited to the Americas, are valued daily at their last sale price or official closing price on the principal exchange or system on which they are traded. If there is no sale or official closing price or such price is believed by GSAM to not represent fair value, equity securities are valued at the last bid price for long positions and at the last ask price for short positions. To the extent these investments are actively traded, they are classified as Level 1 of the fair value hierarchy, otherwise they are generally classified as Level 2.
Unlisted equity securities for which market quotations are available are valued at the last sale price on the valuation date, or if no sale occurs, at the last bid price, and are generally classified as Level 2. Securities traded on certain foreign securities exchanges are valued daily at fair value determined by an independent fair value service (if available) under Valuation Procedures approved by the Trustees and consistent with applicable regulatory guidance. The independent fair value service takes into account multiple factors including, but not limited to, movements in the securities markets, certain depositary receipts, futures contracts and foreign currency exchange rates that have occurred subsequent to the close of the foreign securities exchange. These investments are generally classified as Level 2 of the fair value hierarchy.
Underlying Funds (including Money Market Funds)— Underlying Funds (“Underlying Funds”) include other investment companies and exchange-traded funds (“ETFs”). Investments in the Underlying Funds (except ETFs) are valued at the NAV per share on the day of valuation. ETFs are valued daily at the last sale price or official closing price on the principal exchange or system on which the investment is traded. Because the Funds invest in Underlying Funds that fluctuate in value, the Funds’ shares will correspondingly fluctuate in value. To the extent these investments are actively traded, they are classified as Level 1 of the fair value hierarchy, otherwise they are generally classified as Level 2. For information regarding an Underlying Fund’s accounting policies and investment holdings, please see the Underlying Fund’s shareholder report.
B. Level 3 Fair Value Investments— To the extent that significant inputs to valuation models and other alternative pricing sources are unobservable, or if quotations are not readily available, or if GSAM believes that such quotations do not accurately reflect fair value, the fair value of a Fund’s investments may be determined under Valuation Procedures approved by the Trustees. GSAM, consistent with its procedures and applicable regulatory guidance, may make an adjustment to the most recent valuation prices of either domestic or foreign securities in light of significant events to reflect what it believes to be the fair value of the securities at the time of determining a Fund’s NAV.
C. Fair Value Hierarchy — The following is a summary of the Funds’ investments and derivatives classified in the fair value hierarchy as of February 28, 2019:
| | | | | | | | | | | | |
| | | |
| EQUITY INCOME | | | | | | | | | | | | |
| | | |
| Investment Type | | Level 1 | | | Level 2 | | | Level 3 | |
|
| Assets | |
| | | |
Common Stock and/or Other Equity Investments(a) | | | | | | | | | | | | |
| | | |
Asia | | $ | 5,974,454 | | | $ | — | | | $ | — | |
| | | |
Europe | | | 40,387,490 | | | | — | | | | — | |
| | | |
North America | | | 310,190,745 | | | | — | | | | — | |
| | | |
| Total | | $ | 356,552,689 | | | $ | — | | | $ | — | |
| (a) | | Amounts are disclosed by continent to highlight the impact of time zone differences between local market close and the calculation of net asset value. Security valuations are based on the principal exchange or system on which they are traded, which may differ from country of domicile. |
112
GOLDMAN SACHS FUNDAMENTAL EQUITY VALUE FUNDS
|
| 3. INVESTMENTS AND FAIR VALUE MEASUREMENTS (continued) |
| | | | | | | | | | | | |
| | | |
| FOCUSED VALUE | | | | | | | | | | | | |
| | | |
| Investment Type | | Level 1 | | | Level 2 | | | Level 3 | |
|
| Assets | |
| | | |
Common Stock and/or Other Equity Investments(a) | | | | | | | | | | | | |
| | | |
Europe | | $ | 240,792 | | | $ | — | | | $ | — | |
| | | |
North America | | | 4,133,416 | | | | — | | | | — | |
| | | |
| Total | | $ | 4,374,208 | | | $ | — | | | $ | — | |
| | | |
| LARGE CAP VALUE | | | | | | | | | | | | |
| | | |
| Investment Type | | Level 1 | | | Level 2 | | | Level 3 | |
|
| Assets | |
| | | |
Common Stock and/or Other Equity Investments(a) | | | | | | | | | | | | |
| | | |
Asia | | $ | 2,725,578 | | | $ | — | | | $ | — | |
| | | |
Europe | | | 24,931,069 | | | | — | | | | — | |
| | | |
North America | | | 453,153,394 | | | | — | | | | — | |
| | | |
Investment Company | | | 5,281,073 | | | | — | | | | — | |
| | | |
| Total | | $ | 486,091,114 | | | $ | — | | | $ | — | |
| | | |
| MID CAP VALUE | | | | | | | | | | | | |
| | | |
| Investment Type | | Level 1 | | | Level 2 | | | Level 3 | |
|
| Assets | |
| | | |
Common Stock and/or Other Equity Investments(a) | | | | | | | | | | | | |
| | | |
Asia | | $ | 7,329,439 | | | $ | — | | | $ | — | |
| | | |
Europe | | | 50,519,022 | | | | — | | | | — | |
| | | |
North America | | | 1,215,285,849 | | | | — | | | | — | |
| | | |
| Total | | $ | 1,273,134,310 | | | $ | — | | | $ | — | |
| | | |
| SMALL CAP VALUE | | | | | | | | | | | | |
| | | |
| Investment Type | | Level 1 | | | Level 2 | | | Level 3 | |
| | | |
| Assets | | | | | | | | | | | | |
| | | |
Common Stock and/or Other Equity Investments(a) | | | | | | | | | | | | |
| | | |
Europe | | $ | 72,086,282 | | | $ | — | | | $ | — | |
| | | |
North America | | | 5,907,193,974 | | | | — | | | | — | |
| | | |
Exchange Traded Fund | | | 18,309,428 | | | | — | | | | — | |
| | | |
Securities Lending Reinvestment Vehicle | | | 10,496,150 | | | | — | | | | — | |
| | | |
| Total | | $ | 6,008,085,834 | | | $ | — | | | $ | — | |
| (a) | | Amounts are disclosed by continent to highlight the impact of time zone differences between local market close and the calculation of net asset value. Security valuations are based on the principal exchange or system on which they are traded, which may differ from country of domicile. |
113
GOLDMAN SACHS FUNDAMENTAL EQUITY VALUE FUNDS
Notes to Financial Statements(continued)
February 28, 2019 (Unaudited)
|
| 3. INVESTMENTS AND FAIR VALUE MEASUREMENTS (continued) |
| | | | | | | | | | | | |
| | | |
| SMALL/MID CAP VALUE | | | | | | | | | | | | |
| | | |
| Investment Type | | Level 1 | | | Level 2 | | | Level 3 | |
| | | |
| Assets | | | | | | | | | | | | |
| | | |
Common Stock and/or Other Equity Investments(a) | | | | | | | | | | | | |
| | | |
Europe | | $ | 2,783,265 | | | $ | — | | | $ | — | |
| | | |
North America | | | 114,469,258 | | | | — | | | | — | |
| | | |
Investment Company | | | 2,789,394 | | | | — | | | | — | |
| | | |
Securities Lending Reinvestment Vehicle | | | 118,050 | | | | — | | | | — | |
| | | |
| Total | | $ | 120,159,967 | | | $ | — | | | $ | — | |
| (a) | | Amounts are disclosed by continent to highlight the impact of time zone differences between local market close and the calculation of net asset value. Security valuations are based on the principal exchange or system on which they are traded, which may differ from country of domicile. |
For further information regarding security characteristics, see the Schedules of Investments.
|
| 4. AGREEMENTS AND AFFILIATED TRANSACTIONS |
A. Management Agreement — Under the Agreement, GSAM manages the Funds, subject to the general supervision of the Trustees.
As compensation for the services rendered pursuant to the Agreement, the assumption of the expenses related thereto and administration of the Funds’ business affairs, including providing facilities, GSAM is entitled to a management fee, accrued daily and paid monthly, equal to an annual percentage rate of each Fund’s average daily net assets.
As of February 28, 2019, the contractual management fees with GSAM were as stated below. The effective contractual management rates and effective net management rates represent the rates for the six months ended February 28, 2019.
| | | | | | | | | | | | | | | | | | | | | | | | | | | | | | |
| | | | | Contractual Management Rate | | | Effective
Contractual
Management
Rate | | | Effective Net
Management
Rate# | |
| Fund | | | | First $1 Billion | | | Next $1 Billion | | | Next $3 Billion | | | Next $3 Billion | | | Over $8 Billion | |
Equity Income | | | | | 0.69 | % | | | 0.62 | % | | | 0.59 | % | | | 0.58 | % | | | 0.57 | % | | | 0.69 | % | | | 0.69 | % |
Focused Value | | | | | 0.69 | | | | 0.62 | | | | 0.59 | | | | 0.58 | | | | 0.57 | | | | 0.69 | | | | 0.69 | |
Large Cap Value | | | | | 0.75 | | | | 0.68 | | | | 0.65 | | | | 0.64 | | | | 0.63 | | | | 0.75 | | | | 0.75 | |
Mid Cap Value | | | | | 0.75 | | | | 0.75 | | | | 0.68 | | | | 0.65 | | | | 0.64 | | | | 0.75 | | | | 0.75 | |
Small Cap Value | | | | | 0.98 | | | | 0.98 | | | | 0.88 | | | | 0.84 | | | | 0.82 | | | | 0.91 | | | | 0.91 | |
Small/Mid Cap Value | | | | | 0.80 | | | | 0.80 | | | | 0.72 | | | | 0.68 | | | | 0.67 | | | | 0.80 | | | | 0.80 | |
| # | | The Effective Net Management Rate includes the impact of management fee waivers of affiliated underlying funds, if any. The Effective Net Management Rate may not correlate to the Contractual Management Rate as a result of management fee waivers that may be in effect from time to time. |
The Funds invest in Institutional Shares of the Goldman Sachs Financial Square Government Fund (“Government Money Market Fund”) which is an affiliated Underlying Fund. GSAM has agreed to waive a portion of its management fee payable by the Funds in an amount equal to the management fee it earns as an investment adviser to the affiliated Underlying Fund in which the Funds invest, except those management fees it earns from the Funds’ investments of cash collateral received in connection with
114
GOLDMAN SACHS FUNDAMENTAL EQUITY VALUE FUNDS
|
| 4. AGREEMENTS AND AFFILIATED TRANSACTIONS (continued) |
securities lending transactions in the Government Money Market Fund. For the six months ended February 28, 2019, the management fee waived by GSAM for each Fund was as follows:
| | | | | | |
| Fund | | | | Management Fee Waived | |
Equity Income | | | | $ | 30 | |
Focused Value | | | | | 15 | |
Large Cap Value | | | | | 1,347 | |
Mid Cap Value | | | | | 3,441 | |
Small Cap Value | | | | | 11,296 | |
Small/Mid Cap Value | | | | | 1,439 | |
B. Distribution and/or Service (12b-1) Plans — The Trust, on behalf of Class A and Class R Shares of each applicable Fund, has adopted Distribution and Service Plans subject to Rule 12b-1 under the Act. Under the Distribution and Service Plans, Goldman Sachs, which serves as distributor (the “Distributor”), is entitled to a fee accrued daily and paid monthly for distribution services and personal and account maintenance services, which may then be paid by Goldman Sachs to authorized dealers. These fees are equal to an annual percentage rate of the average daily net assets attributable to Class A or Class R Shares of the Funds, as set forth below.
The Trust, on behalf of Class C Shares of each applicable Fund, has adopted a Distribution Plan subject to Rule 12b-1 under the Act. Under the Distribution Plan, Goldman Sachs as Distributor is entitled to a fee accrued daily and paid monthly for distribution services, which may then be paid by Goldman Sachs to authorized dealers. These fees are equal to an annual percentage rate of the average daily net assets attributable to Class C Shares of the Funds, as set forth below.
The Trust, on behalf of Service Shares of each applicable Fund, has adopted a Service Plan subject to Rule 12b-1 under the Act to allow Service Shares to compensate service organizations (including Goldman Sachs) for providing personal and account maintenance services to their customers who are beneficial owners of such shares. The Service Plan provides for compensation to the service organizations equal to an annual percentage rate of the average daily net assets attributable to Service Shares of the Funds, as set forth below.
| | | | | | | | | | | | | | | | |
| | | Distribution and/or Service Plan Rates | |
| | | Class A* | | | Class C | | | Class R* | | | Service | |
Distribution and/or Service Plan | | | 0.25 | % | | | 0.75 | % | | | 0.50 | % | | | 0.25 | % |
| * | | With respect to Class A and Class R Shares, the Distributor at its discretion may use compensation for distribution services paid under the Distribution and Service Plans to compensate service organizations for personal and account maintenance services and expenses as long as such total compensation does not exceed the maximum cap on “service fees” imposed by the Financial Industry Regulatory Authority. |
115
GOLDMAN SACHS FUNDAMENTAL EQUITY VALUE FUNDS
Notes to Financial Statements(continued)
February 28, 2019 (Unaudited)
|
| 4. AGREEMENTS AND AFFILIATED TRANSACTIONS (continued) |
C. Distribution Agreement — Goldman Sachs, as Distributor of the shares of the Funds pursuant to a Distribution Agreement, may retain a portion of the Class A Shares’ front end sales charge and Class C Shares’ CDSC. During the six months ended February 28, 2019, Goldman Sachs advised that it retained the following amounts:
| | | | | | | | | | |
| | | | | Front End
Sales Charge | | | Contingent Deferred
Sales Charge | |
| Fund | | | | Class A | | | Class C | |
Equity Income | | | | $ | 9,203 | | | $ | 116 | |
Large Cap Value | | | | | 1,353 | | | | 18 | |
Mid Cap Value | | | | | 7,787 | | | | 15 | |
Small Cap Value | | | | | 1,296 | | | | 22 | |
Small/Mid Cap Value | | | | | 331 | | | | — | |
D. Service and/or Shareholder Administration Plans — The Trust, on behalf of each applicable Fund, has adopted Service and/or Shareholder Administration Plans to allow Class C and Service Shares, respectively, to compensate service organizations (including Goldman Sachs) for providing varying levels of personal and account maintenance and/or shareholder administration services to their customers who are beneficial owners of such shares. The Service and/or Shareholder Administration Plans each provide for compensation to the service organizations equal to an annual percentage rate of 0.25% of the average daily net assets attributable to Class C or Service Shares of the Funds, respectively.
E. Transfer Agency Agreement — Goldman Sachs also serves as the transfer agent of the Funds for a fee pursuant to the Transfer Agency Agreement. The fees charged for such transfer agency services are accrued daily and paid monthly at annual rates as follows: 0.18% of the average daily net assets of Class A, Class C, Investor and Class R Shares; 0.03% of the average daily net assets of Class P and Class R6 Shares; and 0.04% of the average daily net assets of Institutional and Service Shares.
Goldman Sachs has agreed to waive a portion of its transfer agency fee equal to 0.07% as an annual percentage rate of the average daily net assets attributable to Class A, Class C, Investor and Class R Shares of the Large Cap Value Fund. This arrangement will remain in effect through at least December 28, 2019, and prior to such date, the Goldman Sachs may not terminate the arrangement without the approval of the Board of Trustees.
Effective December 28, 2018, Goldman Sachs has agreed to waive a portion of its transfer agency fee equal to 0.04% as an annual percentage rate of the average daily net assets attributable to Class A, Class C, Investor and Class R Shares of the Equity Income Fund and Focused Value Fund. This arrangement will remain in effect through at least December 28, 2019, and prior to such date, the Goldman Sachs may not terminate the arrangement without the approval of the Board of Trustees.
F. Other Expense Agreements and Affiliated Transactions — GSAM has agreed to limit certain “Other Expenses” of the Funds (excluding acquired fund fees and expenses, transfer agency fees and expenses, service fees and shareholder administration fees (as applicable), taxes, interest, brokerage fees, expenses of shareholder meetings, litigation and indemnification, and extraordinary expenses) to the extent such expenses exceed, on an annual basis, a percentage rate of the average daily net assets of each Fund. Such Other Expense reimbursements, if any, are accrued daily and paid monthly. In addition, the Funds are not obligated to reimburse GSAM for prior fiscal year expense reimbursements, if any. The Other Expense limitations as an annual percentage rate of average daily net assets for Equity Income, Focused Value, Large Cap Value, Small Cap Value and Small/Mid Cap Value Funds is 0.004% and for Mid Cap Value Fund is 0.104%. These Other Expense limitations will remain in place through at least December 28, 2019, and prior to such date GSAM may not terminate the arrangements without the approval of the Trustees. In addition, the Funds have entered into certain offset arrangements with the transfer agent, which may result in a reduction of the Funds’ expenses and are received irrespective of the application of the “Other Expense” limitations described above.
116
GOLDMAN SACHS FUNDAMENTAL EQUITY VALUE FUNDS
|
| 4. AGREEMENTS AND AFFILIATED TRANSACTIONS (continued) |
For the six months ended February 28, 2019, these expense reductions, including any fee waivers and Other Expense reimbursements, were as follows:
| | | | | | | | | | | | | | | | | | |
| Fund | | | | Management
Fee Waiver | | | Transfer Agency Fee
Waiver/Credits | | | Other
Expense
Reimbursements | | | Total
Expense
Reductions | |
Equity Income | | | | $ | 30 | | | $ | 22,039 | | | $ | 204,328 | | | $ | 226,397 | |
Focused Value | | | | | 15 | | | | 9 | | | | 148,178 | | | | 148,202 | |
Large Cap Value | | | | | 1,347 | | | | 44,331 | | | | 223,854 | | | | 269,532 | |
Mid Cap Value | | | | | 3,441 | | | | 331 | | | | — | | | | 3,772 | |
Small Cap Value | | | | | 11,296 | | | | 459 | | | | 545,452 | | | | 557,207 | |
Small/Mid Cap Value | | | | | 1,439 | | | | 3 | | | | 169,326 | | | | 170,768 | |
G. Line of Credit Facility — As of February 28, 2019, the Funds participated in a $770,000,000 committed, unsecured revolving line of credit facility (the “facility”) together with other funds of the Trust and certain registered investment companies having management agreements with GSAM or its affiliates. This facility is to be used for temporary emergency purposes, or to allow for an orderly liquidation of securities to meet redemption requests. The interest rate on borrowings is based on the federal funds rate. The facility also requires a fee to be paid by the Funds based on the amount of the commitment that has not been utilized. For the six months ended February 28, 2019, the Funds did not have any borrowings under the facility.
H. Other Transactions with Affiliates — For the six months ended February 28, 2019, Goldman Sachs earned $198, $4,316, $5,719, $5,693 and $ 239 in brokerage commissions from portfolio transactions, including futures transactions executed with Goldman Sachs as the Futures Commission Merchant, on behalf of the Focused Value Fund, Large Cap Value, Mid Cap Value, Small Cap Value and Small/Mid Cap Value Funds, respectively.
The table below shows the transactions in and earnings from the investments by the Funds in the Government Money Market Fund for the six months ended February 28, 2019:
| | | | | | | | | | | | | | | | | | | | | | | | | | |
| Fund | | | | Beginning Value as of August 31, 2018 | | | Purchases
at Cost | | | Proceeds
from Sales | | | Ending
Value as of
February 28, 2019 | | | Shares
as of
February 28, 2019 | | | Dividend
Income | |
Equity Income | | | | $ | — | | | $ | 1,335,886 | | | $ | (1,335,886 | ) | | $ | — | | | | — | | | $ | 420 | |
Focused Value | | | | | — | | | | 340,359 | | | | (340,359 | ) | | | — | | | | — | | | | 217 | |
Large Cap Value | | | | | 1,040 | | | | 53,139,266 | | | | (47,859,233 | ) | | | 5,281,073 | | | | 5,281,073 | | | | 18,509 | |
Mid Cap Value | | | | | 14,476,801 | | | | 101,681,350 | | | | (116,158,151 | ) | | | — | | | | — | | | | 40,997 | |
Small Cap Value | | | | | 93,635,202 | | | | 80,386,632 | | | | (174,021,834 | ) | | | — | | | | — | | | | 129,957 | |
Small/Mid Cap Value | | | | | 2,899,902 | | | | 16,545,900 | | | | (16,656,408 | ) | | | 2,789,394 | | | | 2,789,394 | | | | 18,336 | |
As of February 28, 2019, The Goldman Sachs Group, Inc. was the beneficial owner of 5% or more of total outstanding shares of the following funds:
| | | | | | | | | | | | | | | | | | | | | | | | | | | | | | |
| Fund | | | | Class A | | | Class C | | | Institutional | | | Investor | | | Class P | | | Class R | | | Class R6 | |
Focused Value | | | | | 59 | % | | | 100 | % | | | 100 | % | | | 100 | % | | | — | % | | | 100 | % | | | 100 | % |
Small/Mid Cap Value | | | | | — | | | | — | | | | — | | | | — | | | | — | | | | 6 | | | | — | |
117
GOLDMAN SACHS FUNDAMENTAL EQUITY VALUE FUNDS
Notes to Financial Statements(continued)
February 28, 2019 (Unaudited)
|
| 5. PORTFOLIO SECURITIES TRANSACTIONS |
The cost of purchases and proceeds from sales and maturities of long-term securities for the six months ended February 28, 2019, were as follows:
| | | | | | | | | | |
| Fund | | | | Purchases | | | Sales and Maturities | |
Equity Income | | | | $ | 80,739,519 | | | $ | 89,409,454 | |
Focused Value | | | | | 2,945,712 | | | | 5,062,595 | |
Large Cap Value | | | | | 164,823,468 | | | | 219,419,574 | |
Mid Cap Value | | | | | 605,193,186 | | | | 856,893,661 | |
Small Cap Value | | | | | 1,368,334,071 | | | | 1,640,747,645 | |
Small/Mid Cap Value | | | | | 47,284,649 | | | | 46,629,929 | |
The Funds may lend their securities through a securities lending agent, the Bank of New York Mellon (“BNYM”), to certain qualified borrowers. In accordance with the Funds’ securities lending procedures, the Funds receive cash collateral at least equal to the market value of the securities on loan. The market value of the loaned securities is determined at the close of business of the Funds at their last sale price or official closing price on the principal exchange or system on which they are traded, and any additional required collateral is delivered to the Funds on the next business day. As with other extensions of credit, the Funds may experience delay in the recovery of their securities or incur a loss should the borrower of the securities breach its agreement with the Funds or become insolvent at a time when the collateral is insufficient to cover the cost of repurchasing securities on loan. Dividend income received from securities on loan may not be subject to withholding taxes and therefore withholding taxes paid may differ from the amounts listed in the Statements of Operations. Loans of securities are terminable at any time and as such 1) the remaining contractual maturities of the outstanding securities lending transactions are considered to be overnight and continuous and 2) the borrower, after notice, is required to return borrowed securities within the standard time period for settlement of securities transactions.
The Funds invest the cash collateral received in connection with securities lending transactions in the Goldman Sachs Financial Square Government Fund (“Government Money Market Fund”), an affiliated series of the Goldman Sachs Trust. The Government Money Market Fund is registered under the Act as an open end investment company, is subject to Rule 2a-7 under the Act, and is managed by GSAM, for which GSAM may receive a management fee of up to 0.16% on an annualized basis of the average daily net assets of the Government Money Market Fund.
In the event of a default by a borrower with respect to any loan, BNYM may exercise any and all remedies provided under the applicable borrower agreement to make the Funds whole. These remedies include purchasing replacement securities by applying the collateral held from the defaulting broker against the purchase cost of the replacement securities. If BNYM is unable to purchase replacement securities, BNYM will indemnify the Funds by paying the Funds an amount equal to the market value of the securities loaned minus the value of cash collateral received from the borrower for the loan, subject to an exclusion for any shortfalls resulting from a loss of value in such cash collateral due to reinvestment risk. The Funds may enter into master netting agreements with borrowers, which provide the right, in the event of a default (including bankruptcy or insolvency), for the non-defaulting party to liquidate the collateral and calculate net exposure to the defaulting party or request additional collateral. However, in the event of a default by a borrower, a resolution authority could determine that such rights are not enforceable due to the restrictions or prohibitions against the right of set-off that may be imposed in accordance with a particular jurisdiction’s bankruptcy or insolvency laws. The Funds’ loaned securities were all subject to enforceable Securities Lending Agreements and the value of the collateral was at least equal to the value of the cash received. The amounts of the Funds’ overnight and continuous agreements, which represent the gross amounts of recognized liabilities for securities lending transactions outstanding as of February 28, 2019, are disclosed as “Payable upon return of securities loaned” on the Statements of Assets and Liabilities, where applicable.
118
GOLDMAN SACHS FUNDAMENTAL EQUITY VALUE FUNDS
|
| 6.SECURITIES LENDING (continued) |
Each of the Funds and BNYM received compensation relating to the lending of the Funds’ securities. The amounts earned, if any, by the Funds’ for the six months ended February 28, 2019, are reported under Investment Income on the Statements of Operations.
The following table provides information about the Funds’ investments in the Government Money Market Fund for the six months ended February 28, 2019:
| | | | | | | | | | | | | | | | | | |
| Fund | | | | Market
Value as of
August 31, 2018 | | | Purchases
at Cost | | | Proceeds
from Sales | | | Market Value as of
February 28,2019 | |
Equity Income | | | | $ | 2,181,096 | | | $ | 5,385,830 | | | $ | (7,566,926 | ) | | $ | — | |
Large Cap Value | | | | | 1,386,000 | | | | 476,280 | | | | (1,862,280 | ) | | | — | |
Mid Cap Value | | | | | 231,315 | | | | 15,945,306 | | | | (16,176,621 | ) | | | — | |
Small Cap Value | | | | | 22,026,433 | | | | 158,652,276 | | | | (170,182,559 | ) | | | 10,496,150 | |
Small/Mid Cap Value | | | | | 531,675 | | | | 4,047,606 | | | | (4,461,231 | ) | | | 118,050 | |
As of the Funds’ most recent fiscal year end, August 31, 2018, the Funds’ certain timing differences on a tax basis were as follows:
| | | | | | | | | | | | | | | | | | | | | | | | |
| | | Equity Income | | | Focused
Value | | | Large Cap
Value | | | Mid Cap
Value | | | Small Cap
Value | | | Small/Mid Cap
Value | |
Timing differences (Qualified Late Year Loss Deferral and Post October Losses) | | $ | (4,545,198 | ) | | $ | (31,746 | ) | | $ | (67,542 | ) | | $ | — | | | $ | — | | | $ | — | |
As of February 28, 2019, the Funds’ aggregate security unrealized gains and losses based on cost for U.S. federal income tax purposes were as follows:
| | | | | | | | | | | | | | | | | | | | | | | | |
| | | | | | |
| | | Equity Income | | | Focused
Value | | | Large Cap
Value | | | Mid Cap
Value | | | Small Cap
Value | | | Small/Mid Cap
Value | |
Tax Cost | | $ | 320,610,626 | | | $ | 4,238,153 | | | $ | 431,817,925 | | | $ | 1,187,797,215 | | | $ | 4,849,031,142 | | | $ | 112,819,434 | |
Gross unrealized gain | | | 49,331,931 | | | | 311,076 | | | | 68,866,716 | | | | 129,425,967 | | | | 1,357,010,976 | | | | 12,157,943 | |
Gross unrealized loss | | | (13,389,868 | ) | | | (175,021 | ) | | | (14,593,527 | ) | | | (44,088,872 | ) | | | (197,956,284 | ) | | | (4,817,410 | ) |
Net unrealized security gain | | $ | 35,942,063 | | | $ | 136,055 | | | $ | 54,273,189 | | | $ | 85,337,095 | | | $ | 1,159,054,692 | | | $ | 7,340,533 | |
The difference between GAAP-basis and tax-basis unrealized gains (losses) is attributable to wash sales, differences related to the tax treatment of partnerships and underlying fund investments.
GSAM has reviewed the Funds’ tax positions for all open tax years (the current and prior three years, as applicable) and has concluded that no provision for income tax is required in the Funds’ financial statements. Such open tax years remain subject to examination and adjustment by tax authorities.
The Funds’ risks include, but are not limited to, the following:
Foreign and Emerging Countries Risk — Investing in foreign markets may involve special risks and considerations not typically associated with investing in the United States. Foreign securities may be subject to risk of loss because of more or less foreign government regulation, less public information and less economic, political and social stability in the countries in which a
119
GOLDMAN SACHS FUNDAMENTAL EQUITY VALUE FUNDS
Notes to Financial Statements(continued)
February 28, 2019 (Unaudited)
|
| 8. OTHER RISKS (continued) |
Fund invests. The imposition of exchange controls (including repatriation restrictions), confiscations, trade restrictions (including tariffs) and other government restrictions by the United States or other governments, or from problems in share registration, settlement or custody, may also result in losses. Foreign risk also involves the risk of negative foreign currency rate fluctuations, which may cause the value of securities denominated in such foreign currency (or other instruments through which a Fund has exposure to foreign currencies) to decline in value. Currency exchange rates may fluctuate significantly over short periods of time.
Investments in Other Investment Companies— As a shareholder of another investment company, including an exchange-traded fund (“ETF”), a Fund will indirectly bear its proportionate share of any net management fees and other expenses paid by such other investment companies, in addition to the fees and expenses regularly borne by the Fund. ETFs are subject to risks that do not apply to conventional mutual funds, including but not limited to the following: (i) the market price of the ETF’s sharesmay trade at a premium or a discount to their NAV; and (ii) an active trading market for an ETF’s shares may not develop or be maintained.
Large Shareholder Transactions Risk — A Fund may experience adverse effects when certain large shareholders, such as other funds, institutional investors (including those trading by use of non-discretionary mathematical formulas), financial intermediaries (who may make investment decisions on behalf of underlying clients and/or include a Fund in their investment model), individuals, accounts and Goldman Sachs affiliates, purchase or redeem large amounts of shares of a Fund. Such largeshareholder redemptions, which may occur rapidly or unexpectedly, may cause a Fund to sell portfolio securities at times when it would not otherwise do so, which may negatively impact a Fund’s NAV and liquidity. These transactions may also accelerate the realization of taxable income to shareholders if such sales of investments resulted in gains, and may also increase transaction costs. In addition, a large redemption could result in a Fund’s current expenses being allocated over a smaller asset base, leading to an increase in the Fund’s expense ratio. Similarly, large Fund share purchases may adversely affect a Fund’s performance to the extent that the Fund is delayed in investing new cash or otherwise maintains a larger cash position than it ordinarily would.
Liquidity Risk— The Fund may make investments that are illiquid or that may become less liquid in response to market developments or adverse investor perceptions. Illiquid investments may be more difficult to value. Liquidity risk may also refer to the risk that a Fund will not be able to pay redemption proceeds within the allowable time period or without significant dilution to remaining investors’ interests because of unusual market conditions, an unusually high volume of redemption requests, or other reasons. To meet redemption requests, a Fund may be forced to sell investments at an unfavorable time and/or under unfavorable conditions. If a Fund is forced to sell securities at an unfavorable time and/or under unfavorable conditions, such sales may adversely affect the Fund’s NAV and dilute remaining investors’ interests.
Market and Credit Risks — In the normal course of business, a Fund trades financial instruments and enters into financial transactions where risk of potential loss exists due to changes in the market (market risk). Additionally, a Fund may also be exposed to credit risk in the event that an issuer or guarantor fails to perform or that an institution or entity with which the Fund has unsettled or open transactions defaults.
Non-Diversification Risk — The Focused Value Fund is non-diversified, meaning that it is permitted to invest a larger percentage of its assets in fewer issuers than diversified mutual funds. Thus, the Fund may be more susceptible to adverse developments affecting any single issuer held in its portfolio, and may be more susceptible to greater losses because of these developments.
Under the Trust’s organizational documents, its Trustees, officers, employees and agents are indemnified, to the extent permitted by the Act and state law, against certain liabilities that may arise out of performance of their duties to the Funds. Additionally, in the course of business, the Funds enter into contracts that contain a variety of indemnification clauses. The Funds’ maximum exposure under these arrangements is unknown, as this would involve future claims that may be made against the Funds that have not yet occurred. However, GSAM believes the risk of loss under these arrangements to be remote.
Subsequent events after the Statements of Assets and Liabilities date have been evaluated, and GSAM has concluded that there is no impact requiring adjustment or disclosure in the financial statements.
120
GOLDMAN SACHS FUNDAMENTAL EQUITY VALUE FUNDS
|
| 11. SUMMARY OF SHARE TRANSACTIONS |
Share activity is as follows:
| | | | | | | | | | | | | | | | |
| | | Equity Income Fund | |
| | | | |
| | | For the Six Months Ended
February 28, 2019
(Unaudited) | | | For the Fiscal Year Ended
August 31, 2018
| |
| | | | |
| | | Shares | | | Dollars | | | Shares | | | Dollars | |
| | | | |
| Class A Shares | | | | | | | | | | | | | | | | |
Shares sold | | | 360,320 | | | $ | 13,420,057 | | | | 167,725 | | | $ | 6,200,329 | |
Reinvestment of distributions | | | 135,590 | | | | 4,861,673 | | | | 165,032 | | | | 6,010,247 | |
Shares redeemed | | | (522,163 | ) | | | (18,967,463 | ) | | | (1,312,242 | ) | | | (48,351,410 | ) |
| | | | (26,253 | ) | | | (685,733 | ) | | | (979,485 | ) | | | (36,140,834 | ) |
| Class C Shares | | | | | | | | | | | | | | | | |
Shares sold | | | 38,230 | | | | 1,292,717 | | | | 22,099 | | | | 776,712 | |
Reinvestment of distributions | | | 2,319 | | | | 78,609 | | | | 5,908 | | | | 205,492 | |
Shares redeemed | | | (261,090 | ) | | | (9,431,711 | ) | | | (112,657 | ) | | | (3,954,929 | ) |
| | | | (220,541 | ) | | | (8,060,385 | ) | | | (84,650 | ) | | | (2,972,725 | ) |
| Institutional Shares | | | | | | | | | | | | | | | | |
Shares sold | | | 31,412 | | | | 1,170,607 | | | | 147,137 | | | | 5,528,674 | |
Reinvestment of distributions | | | 11,157 | | | | 407,060 | | | | 19,620 | | | | 725,998 | |
Shares redeemed | | | (186,356 | ) | | | (6,652,230 | ) | | | (579,337 | ) | | | (21,764,841 | ) |
| | | | (143,787 | ) | | | (5,074,563 | ) | | | (412,580 | ) | | | (15,510,169 | ) |
| Service Shares | | | | | | | | | | | | | | | | |
Shares sold | | | 801 | | | | 30,190 | | | | 9 | | | | 337 | |
Reinvestment of distributions | | | 41 | | | | 1,474 | | | | 37 | | | | 1,340 | |
Shares redeemed | | | (291 | ) | | | (10,705 | ) | | | (280 | ) | | | (10,575 | ) |
| | | | 551 | | | | 20,959 | | | | (234 | ) | | | (8,898 | ) |
| Investor Shares | | | | | | | | | | | | | | | | |
Shares sold | | | 6,143 | | | | 222,067 | | | | 21,421 | | | | 783,804 | |
Reinvestment of distributions | | | 1,266 | | | | 45,361 | | | | 1,656 | | | | 60,208 | |
Shares redeemed | | | (12,318 | ) | | | (451,802 | ) | | | (23,145 | ) | | | (857,137 | ) |
| | | | (4,909 | ) | | | (184,374 | ) | | | (68 | ) | | | (13,125 | ) |
| Class P Shares(a) | | | | | | | | | | | | | | | | |
Shares sold | | | 30,536 | | | | 1,166,462 | | | | 293,384 | | | | 11,062,520 | |
Reinvestment of distributions | | | 5,308 | | | | 193,437 | | | | 1,931 | | | | 71,219 | |
Shares redeemed | | | (25,021 | ) | | | (929,149 | ) | | | (16,886 | ) | | | (638,114 | ) |
| | | | 10,823 | | | | 430,750 | | | | 278,429 | | | | 10,495,625 | |
| Class R Shares | | | | | | | | | | | | | | | | |
Shares sold | | | 2,221 | | | | 80,720 | | | | 5,116 | | | | 187,837 | |
Reinvestment of distributions | | | 439 | | | | 15,664 | | | | 493 | | | | 17,886 | |
Shares redeemed | | | (2,782 | ) | | | (100,710 | ) | | | (11,318 | ) | | | (417,040 | ) |
| | | | (122 | ) | | | (4,326 | ) | | | (5,709 | ) | | | (211,317 | ) |
| Class R6 Shares | | | | | | | | | | | | | | | | |
Shares sold | | | 148,726 | | | | 5,280,863 | | | | — | | | | — | |
Reinvestment of distributions | | | 6 | | | | 216 | | | | 7 | | | | 268 | |
Shares redeemed | | | (2,239 | ) | | | (82,473 | ) | | | — | | | | — | |
| | | | 146,493 | | | | 5,198,606 | | | | 7 | | | | 268 | |
| | | | |
NET DECREASE | | | (237,745 | ) | | $ | (8,359,066 | ) | | | (1,204,290 | ) | | $ | (44,361,175 | ) |
| (a) | | Class P Shares commenced operations April 17, 2018. |
121
GOLDMAN SACHS FUNDAMENTAL EQUITY VALUE FUNDS
Notes to Financial Statements(continued)
February 28, 2019 (Unaudited)
|
| 11. SUMMARY OF SHARE TRANSACTIONS (continued) |
| | | | | | | | | | | | | | | | |
| | | Focused Value Fund | |
| | | | |
| | | For the Six Months Ended
February 28, 2019
(Unaudited) | | | For the Fiscal Year Ended
August 31, 2018
| |
| | | | |
| | | Shares | | | Dollars | | | Shares | | | Dollars | |
| | | | |
| Class A Shares | | | | | | | | | | | | | | | | |
Shares sold | | | — | | | $ | — | | | | 7,233 | | | $ | 79,731 | |
Reinvestment of distributions | | | 273 | | | | 2,623 | | | | 435 | | | | 4,676 | |
Shares redeemed | | | — | | | | — | | | | (7,498 | ) | | | (80,667 | ) |
| | | | 273 | | | | 2,623 | | | | 170 | | | | 3,740 | |
| Class C Shares | | | | | | | | | | | | | | | | |
Reinvestment of distributions | | | 146 | | | | 1,396 | | | | 203 | | | | 2,157 | |
Shares redeemed | | | — | | | | — | | | | (1,878 | ) | | | (21,446 | ) |
| | | | 146 | | | | 1,396 | | | | (1,675 | ) | | | (19,289 | ) |
| Institutional Shares | | | | | | | | | | | | | | | | |
Shares sold | | | — | | | | — | | | | 221,978 | | | | 2,357,778 | |
Reinvestment of distributions | | | 3,789 | | | | 36,446 | | | | 40,754 | | | | 439,580 | |
Shares redeemed | | | (31,167 | ) | | | (350,000 | ) | | | (603,240 | ) | | | (6,615,744 | ) |
| | | | (27,378 | ) | | | (313,554 | ) | | | (340,508 | ) | | | (3,818,386 | ) |
| Investor Shares | | | | | | | | | | | | | | | | |
Reinvestment of distributions | | | 179 | | | | 1,721 | | | | 229 | | | | 2,468 | |
| | | | 179 | | | | 1,721 | | | | 229 | | | | 2,468 | |
| Class P Shares(a) | | | | | | | | | | | | | | | | |
Shares sold | | | 36,638 | | | | 380,879 | | | | 507,094 | | | | 5,582,584 | |
Reinvestment of distributions | | | 25,771 | | | | 248,134 | | | | — | | | | — | |
Shares redeemed | | | (214,353 | ) | | | (2,254,345 | ) | | | (90 | ) | | | (1,005 | ) |
| | | | (151,944 | ) | | | (1,625,332 | ) | | | 507,004 | | | | 5,581,579 | |
| Class R Shares | | | | | | | | | | | | | | | | |
Reinvestment of distributions | | | 162 | | | | 1,556 | | | | 216 | | | | 2,312 | |
| | | | 162 | | | | 1,556 | | | | 216 | | | | 2,312 | |
| Class R6 Shares | | | | | | | | | | | | | | | | |
Reinvestment of distributions | | | 184 | | | | 1,772 | | | | 234 | | | | 2,519 | |
| | | | 184 | | | | 1,772 | | | | 234 | | | | 2,519 | |
| | | | |
NET INCREASE (DECREASE) | | | (178,378 | ) | | $ | (1,929,818 | ) | | | 165,670 | | | $ | 1,754,943 | |
| (a) | | Class P Shares commenced operations April 17, 2018. |
122
GOLDMAN SACHS FUNDAMENTAL EQUITY VALUE FUNDS
|
| 11. SUMMARY OF SHARE TRANSACTIONS (continued) |
| | | | | | | | | | | | | | | | |
| | | Large Cap Value Fund | |
| | | | |
| | | For the Six Months Ended
February 28, 2019
(Unaudited) | | | For the Fiscal Year Ended
August 31, 2018
| |
| | | | |
| | | Shares | | | Dollars | | | Shares | | | Dollars | |
| | | | |
| Class A Shares | | | | | | | | | | | | | | | | |
Shares sold | | | 984,382 | | | $ | 15,331,677 | | | | 413,289 | | | $ | 6,750,744 | |
Reinvestment of distributions | | | 706,075 | | | | 9,409,667 | | | | 994,820 | | | | 15,573,596 | |
Shares redeemed | | | (993,192 | ) | | | (14,339,467 | ) | | | (4,607,514 | ) | | | (77,164,803 | ) |
| | | | 697,265 | | | | 10,401,877 | | | | (3,199,405 | ) | | | (54,840,463 | ) |
| Class C Shares | | | | | | | | | | | | | | | | |
Shares sold | | | 141,106 | | | | 1,883,488 | | | | 148,820 | | | | 2,245,882 | |
Reinvestment of distributions | | | 184,223 | | | | 2,321,210 | | | | 378,911 | | | | 5,627,260 | |
Shares redeemed | | | (957,011 | ) | | | (14,373,911 | ) | | | (511,674 | ) | | | (7,725,106 | ) |
| | | | (631,682 | ) | | | (10,169,213 | ) | | | 16,057 | | | | 148,036 | |
| Institutional Shares | | | | | | | | | | | | | | | | |
Shares sold | | | 1,828,913 | | | | 25,491,173 | | | | 4,776,774 | | | | 81,141,273 | |
Reinvestment of distributions | | | 1,200,415 | | | | 16,163,241 | | | | 4,915,169 | | | | 77,828,811 | |
Shares redeemed | | | (2,767,566 | ) | | | (39,228,320 | ) | | | (36,044,704 | ) | | | (585,375,990 | ) |
| | | | 261,762 | | | | 2,426,094 | | | | (26,352,761 | ) | | | (426,405,906 | ) |
| Service Shares | | | | | | | | | | | | | | | | |
Shares sold | | | 2,590 | | | | 35,817 | | | | 9,376 | | | | 149,981 | |
Reinvestment of distributions | | | 3,114 | | | | 41,241 | | | | 5,596 | | | | 86,929 | |
Shares redeemed | | | (9,837 | ) | | | (146,806 | ) | | | (109,997 | ) | | | (1,710,617 | ) |
| | | | (4,133 | ) | | | (69,748 | ) | | | (95,025 | ) | | | (1,473,707 | ) |
| Investor Shares | | | | | | | | | | | | | | | | |
Shares sold | | | 78,187 | | | | 1,125,304 | | | | 317,252 | | | | 4,948,653 | |
Reinvestment of distributions | | | 46,233 | | | | 616,179 | | | | 65,107 | | | | 1,021,804 | |
Shares redeemed | | | (183,771 | ) | | | (2,761,815 | ) | | | (298,820 | ) | | | (4,734,474 | ) |
| | | | (59,351 | ) | | | (1,020,332 | ) | | | 83,539 | | | | 1,235,983 | |
| Class P Shares(a) | | | | | | | | | | | | | | | | |
Shares sold | | | 229,115 | | | | 3,411,106 | | | | 15,124,375 | | | | 239,722,964 | |
Reinvestment of distributions | | | 1,811,077 | | | | 24,947,700 | | | | — | | | | — | |
Shares redeemed | | | (2,303,073 | ) | | | (32,090,296 | ) | | | (241,434 | ) | | | (3,936,526 | ) |
| | | | (262,881 | ) | | | (3,731,490 | ) | | | 14,882,941 | | | | 235,786,438 | |
| Class R Shares | | | | | | | | | | | | | | | | |
Shares sold | | | 46,705 | | | | 629,092 | | | | 52,171 | | | | 827,332 | |
Reinvestment of distributions | | | 39,199 | | | | 506,341 | | | | 57,961 | | | | 883,060 | |
Shares redeemed | | | (41,150 | ) | | | (571,715 | ) | | | (143,771 | ) | | | (2,227,470 | ) |
| | | | 44,754 | | | | 563,718 | | | | (33,639 | ) | | | (517,078 | ) |
| Class R6 Shares | | | | | | | | | | | | | | | | |
Shares sold | | | 71,691 | | | | 981,893 | | | | 65,132 | | | | 1,048,096 | |
Reinvestment of distributions | | | 7,519 | | | | 103,563 | | | | 1,353 | | | | 21,505 | |
Shares redeemed | | | (8,398 | ) | | | (129,856 | ) | | | (757 | ) | | | (12,291 | ) |
| | | | 70,812 | | | | 955,600 | | | | 65,728 | | | | 1,057,310 | |
| | | | |
NET INCREASE (DECREASE) | | | 116,546 | | | $ | (643,494 | ) | | | (14,632,565 | ) | | $ | (245,009,387 | ) |
| (a) | | Class P Shares commenced operations April 17, 2018. |
123
GOLDMAN SACHS FUNDAMENTAL EQUITY VALUE FUNDS
Notes to Financial Statements(continued)
February 28, 2019 (Unaudited)
|
| 11. SUMMARY OF SHARE TRANSACTIONS (continued) |
| | | | | | | | | | | | | | | | |
| | | Mid Cap Value Fund | |
| | | | |
| | | For the Six Months Ended
February 28, 2019
(Unaudited) | | | For the Fiscal Year Ended
August 31, 2018
| |
| | | | |
| | | Shares | | | Dollars | | | Shares | | | Dollars | |
| | | | |
| Class A Shares | | | | | | | | | | | | | | | | |
Shares sold | | | 1,743,440 | | | $ | 58,232,364 | | | | 1,689,841 | | | $ | 60,988,913 | |
Reinvestment of distributions | | | 2,582,868 | | | | 73,645,934 | | | | 2,769,823 | | | | 96,713,734 | |
Shares redeemed | | | (3,731,124 | ) | | | (117,599,842 | ) | | | (9,488,943 | ) | | | (345,257,202 | ) |
| | | | 595,184 | | | | 14,278,456 | | | | (5,029,279 | ) | | | (187,554,555 | ) |
| Class C Shares | | | | | | | | | | | | | | | | |
Shares sold | | | 110,232 | | | | 2,867,782 | | | | 119,263 | | | | 3,804,604 | |
Reinvestment of distributions | | | 201,798 | | | | 5,012,677 | | | | 422,621 | | | | 13,135,057 | |
Shares redeemed | | | (1,361,143 | ) | | | (42,586,281 | ) | | | (1,088,760 | ) | | | (35,349,571 | ) |
| | | | (1,049,113 | ) | | | (34,705,822 | ) | | | (546,876 | ) | | | (18,409,910 | ) |
| Institutional Shares | | | | | | | | | | | | | | | | |
Shares sold | | | 1,114,731 | | | | 34,571,074 | | | | 3,300,008 | | | | 122,071,434 | |
Reinvestment of distributions | | | 2,038,582 | | | | 58,898,123 | | | | 4,486,235 | | | | 158,696,786 | |
Shares redeemed | | | (5,728,636 | ) | | | (179,782,122 | ) | | | (29,621,732 | ) | | | (1,085,024,436 | ) |
| | | | (2,575,323 | ) | | | (86,312,925 | ) | | | (21,835,489 | ) | | | (804,256,216 | ) |
| Service Shares | | | | | | | | | | | | | | | | |
Shares sold | | | 107,143 | | | | 3,203,379 | | | | 227,119 | | | | 8,067,372 | |
Reinvestment of distributions | | | 267,972 | | | | 7,463,360 | | | | 293,774 | | | | 10,052,364 | |
Shares redeemed | | | (387,665 | ) | | | (11,894,013 | ) | | | (1,013,997 | ) | | | (36,255,293 | ) |
| | | | (12,550 | ) | | | (1,227,274 | ) | | | (493,104 | ) | | | (18,135,557 | ) |
| Investor Shares | | | | | | | | | | | | | | | | |
Shares sold | | | 115,285 | | | | 3,537,673 | | | | 287,629 | | | | 10,241,742 | |
Reinvestment of distributions | | | 236,814 | | | | 6,590,455 | | | | 277,123 | | | | 9,478,658 | |
Shares redeemed | | | (331,593 | ) | | | (10,222,084 | ) | | | (1,194,802 | ) | | | (42,912,039 | ) |
| | | | 20,506 | | | | (93,956 | ) | | | (630,050 | ) | | | (23,191,639 | ) |
| Class P Shares(a) | | | | | | | | | | | | | | | | |
Shares sold | | | 91,049 | | | | 2,982,674 | | | | 4,776,284 | | | | 173,045,622 | |
Reinvestment of distributions | | | 761,603 | | | | 21,987,888 | | | | — | | | | — | |
Shares redeemed | | | (746,863 | ) | | | (23,192,013 | ) | | | (132,963 | ) | | | (4,855,301 | ) |
| | | | 105,789 | | | | 1,778,549 | | | | 4,643,321 | | | | 168,190,321 | |
| Class R Shares | | | | | | | | | | | | | | | | |
Shares sold | | | 106,394 | | | | 3,184,098 | | | | 187,295 | | | | 6,554,523 | |
Reinvestment of distributions | | | 99,833 | | | | 2,747,197 | | | | 107,540 | | | | 3,641,285 | |
Shares redeemed | | | (187,602 | ) | | | (5,820,987 | ) | | | (420,640 | ) | | | (14,898,479 | ) |
| | | | 18,625 | | | | 110,308 | | | | (125,805 | ) | | | (4,702,671 | ) |
| Class R6 Shares | | | | | | | | | | | | | | | | |
Shares sold | | | 1,304,695 | | | | 37,584,547 | | | | 1,130,178 | | | | 42,712,741 | |
Reinvestment of distributions | | | 108,107 | | | | 3,121,163 | | | | 292,138 | | | | 10,331,447 | |
Shares redeemed | | | (620,679 | ) | | | (21,017,830 | ) | | | (2,256,422 | ) | | | (83,197,971 | ) |
| | | | 792,123 | | | | 19,687,880 | | | | (834,106 | ) | | | (30,153,783 | ) |
| | | | |
NET DECREASE | | | (2,104,759 | ) | | $ | (86,484,784 | ) | | | (24,851,388 | ) | | $ | (918,214,010 | ) |
| (a) | | Class P Shares commenced operations April 17, 2018. |
124
GOLDMAN SACHS FUNDAMENTAL EQUITY VALUE FUNDS
|
| 11. SUMMARY OF SHARE TRANSACTIONS (continued) |
| | | | | | | | | | | | | | | | |
| | | Small Cap Value Fund | |
| | | | |
| | | For the Six Months Ended
February 28, 2019
(Unaudited) | | | For the Fiscal Year Ended
August 31, 2018
| |
| | | | |
| | | Shares | | | Dollars | | | Shares | | | Dollars | |
| | | | |
| Class A Shares | | | | | | | | | | | | | | | | |
Shares sold | | | 2,105,930 | | | $ | 113,382,069 | | | | 1,885,581 | | | $ | 108,294,329 | |
Reinvestment of distributions | | | 1,521,374 | | | | 69,208,229 | | | | 1,452,938 | | | | 80,392,189 | |
Shares redeemed | | | (2,553,303 | ) | | | (127,338,411 | ) | | | (4,970,676 | ) | | | (287,382,882 | ) |
| | | | 1,074,001 | | | | 55,251,887 | | | | (1,632,157 | ) | | | (98,696,364 | ) |
| Class C Shares | | | | | | | | | | | | | | | | |
Shares sold | | | 22,843 | | | | 788,080 | | | | 62,836 | | | | 2,782,130 | |
Reinvestment of distributions | | | 52,489 | | | | 1,727,412 | | | | 114,621 | | | | 4,815,235 | |
Shares redeemed | | | (518,992 | ) | | | (22,357,040 | ) | | | (197,962 | ) | | | (8,704,686 | ) |
| | | | (443,660 | ) | | | (19,841,548 | ) | | | (20,505 | ) | | | (1,107,321 | ) |
| Institutional Shares | | | | | | | | | | | | | | | | |
Shares sold | | | 5,362,759 | | | | 285,522,217 | | | | 10,568,911 | | | | 656,337,622 | |
Reinvestment of distributions | | | 7,284,890 | | | | 361,589,851 | | | | 7,430,046 | | | | 445,393,173 | |
Shares redeemed | | | (15,678,571 | ) | | | (851,500,534 | ) | | | (23,965,147 | ) | | | (1,492,845,058 | ) |
| | | | (3,030,922 | ) | | | (204,388,466 | ) | | | (5,966,190 | ) | | | (391,114,263 | ) |
| Service Shares | | | | | | | | | | | | | | | | |
Shares sold | | | 172,377 | | | | 8,107,076 | | | | 368,465 | | | | 20,550,477 | |
Reinvestment of distributions | | | 226,267 | | | | 9,928,596 | | | | 245,726 | | | | 13,164,152 | |
Shares redeemed | | | (516,736 | ) | | | (24,346,698 | ) | | | (1,362,304 | ) | | | (76,531,473 | ) |
| | | | (118,092 | ) | | | (6,311,026 | ) | | | (748,113 | ) | | | (42,816,844 | ) |
| Investor Shares | | | | | | | | | | | | | | | | |
Shares sold | | | 468,215 | | | | 22,706,287 | | | | 729,099 | | | | 42,041,386 | |
Reinvestment of distributions | | | 380,668 | | | | 17,177,765 | | | | 348,331 | | | | 19,174,365 | |
Shares redeemed | | | (542,866 | ) | | | (26,602,283 | ) | | | (1,172,281 | ) | | | (67,276,389 | ) |
| | | | 306,017 | | | | 13,281,769 | | | | (94,851 | ) | | | (6,060,638 | ) |
| Class P Shares(a) | | | | | | | | | | | | | | | | |
Shares sold | | | 150,871 | | | | 7,843,719 | | | | 4,991,921 | | | | 317,463,914 | |
Reinvestment of distributions | | | 587,525 | | | | 29,152,639 | | | | — | | | | — | |
Shares redeemed | | | (743,817 | ) | | | (37,782,229 | ) | | | (102,700 | ) | | | (6,523,801 | ) |
| | | | (5,421 | ) | | | (785,871 | ) | | | 4,889,221 | | | | 310,940,113 | |
| Class R Shares | | | | | | | | | | | | | | | | |
Shares sold | | | 175,487 | | | | 8,351,046 | | | | 341,452 | | | | 19,175,194 | |
Reinvestment of distributions | | | 237,161 | | | | 10,520,466 | | | | 231,881 | | | | 12,556,367 | |
Shares redeemed | | | (417,743 | ) | | | (20,637,085 | ) | | | (703,547 | ) | | | (39,648,438 | ) |
| | | | (5,095 | ) | | | (1,765,573 | ) | | | (130,214 | ) | | | (7,916,877 | ) |
| Class R6 Shares | | | | | | | | | | | | | | | | |
Shares sold | | | 7,478,060 | | | | 403,500,488 | | | | 7,043,109 | | | | 435,651,775 | |
Reinvestment of distributions | | | 2,326,545 | | | | 115,439,649 | | | | 1,539,895 | | | | 92,295,365 | |
Shares redeemed | | | (2,180,219 | ) | | | (119,040,293 | ) | | | (3,407,239 | ) | | | (212,929,332 | ) |
| | | | 7,624,386 | | | | 399,899,844 | | | | 5,175,765 | | | | 315,017,808 | |
| | | | |
NET INCREASE | | | 5,401,214 | | | $ | 235,341,016 | | | | 1,472,956 | | | $ | 78,245,614 | |
| (a) | | Class P Shares commenced operations on April 17, 2018. |
125
GOLDMAN SACHS FUNDAMENTAL EQUITY VALUE FUNDS
Notes to Financial Statements(continued)
February 28, 2019 (Unaudited)
|
| 11. SUMMARY OF SHARE TRANSACTIONS (continued) |
| | | | | | | | | | | | | | | | |
| | | Small/Mid Cap Value Fund | |
| | | | |
| | | For the Six Months Ended
February 28, 2019
(Unaudited) | | | For the Fiscal Year Ended
August 31, 2018
| |
| | | | |
| | | Shares | | | Dollars | | | Shares | | | Dollars | |
| | | | |
| Class A Shares | | | | | | | | | | | | | | | | |
Shares sold | | | 11,944 | | | $ | 140,196 | | | | 60,914 | | | $ | 806,813 | |
Reinvestment of distributions | | | 8,738 | | | | 96,381 | | | | 5,273 | | | | 68,649 | |
Shares redeemed | | | (16,570 | ) | | | (202,013 | ) | | | (62,160 | ) | | | (805,737 | ) |
| | | | 4,112 | | | | 34,564 | | | | 4,027 | | | | 69,725 | |
| Class C Shares | | | | | | | | | | | | | | | | |
Shares sold | | | 16,124 | | | | 188,853 | | | | 30,390 | | | | 394,026 | |
Reinvestment of distributions | | | 5,617 | | | | 60,556 | | | | 3,393 | | | | 43,226 | |
Shares redeemed | | | (21,304 | ) | | | (259,463 | ) | | | (40,839 | ) | | | (533,227 | ) |
| | | | 437 | | | | (10,054 | ) | | | (7,056 | ) | | | (95,975 | ) |
| Institutional Shares | | | | | | | | | | | | | | | | |
Shares sold | | | 114,476 | | | | 1,413,701 | | | | 997,011 | | | | 13,157,832 | |
Reinvestment of distributions | | | 31,723 | | | | 353,973 | | | | 167,240 | | | | 2,203,258 | |
Shares redeemed | | | (54,363 | ) | | | (669,874 | ) | | | (4,118,975 | ) | | | (55,872,180 | ) |
| | | | 91,836 | | | | 1,097,800 | | | | (2,954,724 | ) | | | (40,511,090 | ) |
| Investor Shares | | | | | | | | | | | | | | | | |
Shares sold | | | 23,378 | | | | 282,686 | | | | 213,402 | | | | 2,778,201 | |
Reinvestment of distributions | | | 19,341 | | | | 214,689 | | | | 17,904 | | | | 234,641 | |
Shares redeemed | | | (169,401 | ) | | | (2,042,511 | ) | | | (87,125 | ) | | | (1,146,515 | ) |
| | | | (126,682 | ) | | | (1,545,136 | ) | | | 144,181 | | | | 1,866,327 | |
| Class P Shares(a) | | | | | | | | | | | | | | | | |
Shares sold | | | 406,531 | | | | 4,789,230 | | | | 4,045,544 | | | | 54,958,773 | |
Reinvestment of distributions | | | 298,105 | | | | 3,324,027 | | | | — | | | | — | |
Shares redeemed | | | (413,740 | ) | | | (4,564,038 | ) | | | (69,495 | ) | | | (936,324 | ) |
| | | | 290,896 | | | | 3,549,219 | | | | 3,976,049 | | | | 54,022,449 | |
| Class R Shares | | | | | | | | | | | | | | | | |
Shares sold | | | 363 | | | | 4,370 | | | | 4,284 | | | | 54,483 | |
Reinvestment of distributions | | | 1,077 | | | | 11,847 | | | | 430 | | | | 5,587 | |
Shares redeemed | | | (2 | ) | | | (26 | ) | | | (88 | ) | | | (1,159 | ) |
| | | | 1,438 | | | | 16,191 | | | | 4,626 | | | | 58,911 | |
| Class R6 Shares | | | | | | | | | | | | | | | | |
Shares sold | | | 458,636 | | | | 5,557,330 | | | | 380,711 | | | | 5,053,722 | |
Reinvestment of distributions | | | 325,719 | | | | 3,632,477 | | | | 214,858 | | | | 2,832,292 | |
Shares redeemed | | | (435,477 | ) | | | (5,189,059 | ) | | | (1,061,479 | ) | | | (14,058,872 | ) |
| | | | 348,878 | | | | 4,000,748 | | | | (465,910 | ) | | | (6,172,858 | ) |
| | | | |
NET INCREASE | | | 610,915 | | | $ | 7,143,332 | | | | 701,193 | | | $ | 9,237,489 | |
| (a) | | Class P Shares commenced operations on April 17, 2018. |
126
GOLDMAN SACHS FUNDAMENTAL EQUITY VALUE FUNDS
Fund Expenses — Six Month Period Ended February 28, 2019 (Unaudited)
As a shareholder of Class A, Class C, Institutional, Service, Investor, Class P, Class R and Class R6 Shares of a Fund, you incur two types of costs: (1) transaction costs, including sales charges on purchase payments (with respect to Class A Shares), contingent deferred sales charges on redemptions (with respect to Class C Shares), and (2) ongoing costs, including management fees; distribution and/or service (12b-1) fees (with respect to Class A, Class C, Service and Class R Shares); and other Fund expenses. This example is intended to help you understand your ongoing costs (in dollars) of investing in Class A, Class C, Institutional, Service, Investor, Class P, Class R and Class R6 Shares of the Funds and to compare these costs with the ongoing costs of investing in other mutual funds.
The example is based on an investment of $1,000 invested at the beginning of the period and held for the entire period from September 1, 2018 through February 28, 2019, which represents a period of 181 days in a 365-day year.
Actual Expenses— The first line under each share class in the table below provides information about actual account values and actual expenses. You may use the information in this line, together with the amount you invested, to estimate the expenses that you paid over the period. Simply divide your account value by $1,000 (for example, an $8,600 account value divided by $1,000=8.6), then multiply the result by the number in the first line under the heading entitled “Expenses Paid” to estimate the expenses you paid on your account during this period.
Hypothetical Example for Comparison Purposes— The second line under each share class in the table below provides information about hypothetical account values and hypothetical expenses based on the Funds’ actual net expense ratios and an assumed rate of return of 5% per year before expenses, which is not the Funds’ actual return. The hypothetical account values and expenses may not be used to estimate the actual ending account balance or expenses you paid for the period. You may use this information to compare the ongoing costs of investing in the Funds and other funds. To do so, compare this 5% hypothetical example with the 5% hypothetical examples that appear in the shareholder reports of the other funds.
Please note that the expenses shown in the table are meant to highlight your ongoing costs only and do not reflect any transactional costs, such as sales charges, redemption fees, or exchange fees. Therefore, the second line of the table is useful in comparing ongoing costs only, and will not help you determine the relative total costs of owning different funds. In addition, if these transactional costs were included, your costs would have been higher:
| | | | | | | | | | | | | | | | | | | | | | | | | | | | | | | | | | | | |
| | | Equity Income Fund | | | Focused Value Fund | | | Large Cap Value Fund | |
| Share Class | | Beginning
Account
Value
9/1/18 | | | Ending
Account
Value
2/28/19 | | | Expenses
Paid for the
6 months ended
2/28/19* | | | Beginning
Account
Value
9/1/18 | | | Ending
Account
Value
2/28/19 | | | Expenses
Paid for the
6 months ended
2/28/19* | | | Beginning
Account
Value
9/1/18 | | | Ending
Account
Value
2/28/19 | | | Expenses
Paid for the
6 months ended
2/28/19* | |
| Class A | | | | | | | | | | | | | | | | | | | | | | | | | | | | | | | | | | | | |
Actual | | $ | 1,000.00 | | | $ | 994.20 | | | $ | 5.49 | | | $ | 1,000.00 | | | $ | 978.00 | | | $ | 5.44 | | | $ | 1,000.00 | | | $ | 976.00 | | | $ | 5.44 | |
Hypothetical 5% return | | | 1,000.00 | | | | 1,019.29 | + | | | 5.56 | | | | 1,000.00 | | | | 1,019.29 | + | | | 5.56 | | | | 1,000.00 | | | | 1,019.29 | + | | | 5.56 | |
| Class C | | | | | | | | | | | | | | | | | | | | | | | | | | | | | | | | | | | | |
Actual | | | 1,000.00 | | | | 991.20 | | | | 9.18 | | | | 1,000.00 | | | | 974.50 | | | | 9.11 | | | | 1,000.00 | | | | 972.30 | | | | 9.10 | |
Hypothetical 5% return | | | 1,000.00 | | | | 1,015.57 | + | | | 9.30 | | | | 1,000.00 | | | | 1,015.57 | + | | | 9.30 | | | | 1,000.00 | | | | 1,015.57 | + | | | 9.30 | |
| Institutional | | | | | | | | | | | | | | | | | | | | | | | | | | | | | | | | | | | | |
Actual | | | 1,000.00 | | | | 996.10 | | | | 3.61 | | | | 1,000.00 | | | | 980.70 | | | | 3.59 | | | | 1,000.00 | | | | 977.20 | | | | 3.87 | |
Hypothetical 5% return | | | 1,000.00 | | | | 1,021.17 | + | | | 3.66 | | | | 1,000.00 | | | | 1,021.17 | + | | | 3.66 | | | | 1,000.00 | | | | 1,020.88 | + | | | 3.96 | |
| Service | | | | | | | | | | | | | | | | | | | | | | | | | | | | | | | | | | | | |
Actual | | | 1,000.00 | | | | 993.70 | | | | 6.08 | | | | — | | | | 1,000.00 | | | | — | | | | 1,000.00 | | | | 974.80 | | | | 6.32 | |
Hypothetical 5% return | | | 1,000.00 | | | | — | + | | | 6.16 | | | | — | | | | — | + | | | — | | | | 1,000.00 | | | | — | + | | | 6.46 | |
| Investor | | | | | | | | | | | | | | | | | | | | | | | | | | | | | | | | | | | | |
Actual | | | 1,000.00 | | | | 995.80 | | | | 4.26 | | | | 1,000.00 | | | | 978.60 | | | | 4.22 | | | | 1,000.00 | | | | 976.40 | | | | 4.21 | |
Hypothetical 5% return | | | 1,000.00 | | | | 1,020.53 | + | | | 4.31 | | | | 1,000.00 | | | | 1,020.53 | + | | | 4.31 | | | | 1,000.00 | | | | 1,020.53 | + | | | 4.31 | |
| Class P | | | | | | | | | | | | | | | | | | | | | | | | | | | | | | | | | | | | |
Actual | | | 1,000.00 | | | | 996.10 | | | | 3.56 | | | | 1,000.00 | | | | 979.40 | | | | 3.53 | | | | 1,000.00 | | | | 977.70 | | | | 3.82 | |
Hypothetical 5% return | | | 1,000.00 | | | | 1,021.22 | + | | | 3.61 | | | | 1,000.00 | | | | 1,021.22 | + | | | 3.61 | | | | 1,000.00 | | | | 1,021.22 | + | | | 3.91 | |
| Class R | | | | | | | | | | | | | | | | | | | | | | | | | | | | | | | | | | | | |
Actual | | | 1,000.00 | | | | 993.00 | | | | 6.72 | | | | 1,000.00 | | | | 977.00 | | | | 6.67 | | | | 1,000.00 | | | | 974.00 | | | | 6.66 | |
Hypothetical 5% return | | | 1,000.00 | | | | 1,018.05 | + | | | 6.80 | | | | 1,000.00 | | | | 1,018.05 | + | | | 6.80 | | | | 1,000.00 | | | | 1,018.05 | + | | | 6.80 | |
| Class R6 | | | | | | | | | | | | | | | | | | | | | | | | | | | | | | | | | | | | |
Actual | | | 1,000.00 | | | | 996.40 | | | | 3.56 | | | | 1,000.00 | | | | 980.20 | | | | 3.54 | | | | 1,000.00 | | | | 977.60 | | | | 3.82 | |
Hypothetical 5% return | | | 1,000.00 | | | | 1,021.22 | + | | | 3.61 | | | | 1,000.00 | | | | 1,021.22 | + | | | 3.61 | | | | 1,000.00 | | | | 1,020.93 | + | | | 3.91 | |
| + | | Hypothetical expenses are based on each Fund’s actual annualized net expense ratios and an assumed rate of return of 5% per year before expenses. |
| * | | Expenses for each share class are calculated using each Fund’s annualized net expense ratio for each class, which represents the ongoing expenses as a percentage of net assets for the six months ended February 28, 2019. Expenses are calculated by multiplying the annualized net expense ratio by the average account value for the period; then multiplying the result by the number of days in the most recent fiscal half year; and then dividing that result by the number of days in the fiscal year. The annualized net expense ratios for the period were as follows: |
| | | | | | | | | | | | | | | | | | | | | | | | | | | | | | | | |
| Fund | | Class A | | | Class C | | | Institutional | | | Service | | | Investor | | | Class P | | | Class R | | | Class R6 | |
Equity Income | | | 1.11 | % | | | 1.86 | % | | | 0.73 | % | | | 1.23 | % | | | 0.86 | % | | | 0.72 | % | | | 1.36 | % | | | 0.72 | % |
Focused Value | | | 1.11 | | | | 1.86 | | | | 0.73 | | | | N/A | | | | 0.86 | | | | 0.72 | | | | 1.36 | | | | 0.72 | |
Large Cap Value | | | 1.11 | | | | 1.86 | | | | 0.79 | | | | 1.29 | | | | 0.86 | | | | 0.78 | | | | 1.36 | | | | 0.78 | |
127
GOLDMAN SACHS FUNDAMENTAL EQUITY VALUE FUNDS
Fund Expenses — Six Month Period Ended February 28, 2019 (Unaudited) (continued)
| | | | | | | | | | | | | | | | | | | | | | | | | | | | | | | | | | | | |
| | | Mid Cap Value Fund | | | Small Cap Value Fund | | | Small/Mid Cap Value Fund | |
| Share Class | | Beginning
Account
Value
9/1/18 | | | Ending
Account
Value
2/28/19 | | | Expenses
Paid for the
6 months ended
2/28/19* | | | Beginning
Account
Value
9/1/18 | | | Ending
Account
Value
2/28/19 | | | Expenses
Paid for the
6 months ended
2/28/19* | | | Beginning
Account
Value
9/1/18 | | | Ending
Account
Value
2/28/19 | | | Expenses
Paid for the
6 months ended
2/28/19* | |
| Class A | | | | | | | | | | | | | | | | | | | | | | | | | | | | | | | | | | | | |
Actual | | $ | 1,000.00 | | | $ | 974.40 | | | $ | 6.02 | | | $ | 1,000.00 | | | $ | 928.60 | | | $ | 6.41 | | | $ | 1,000.00 | | | $ | 943.40 | | | $ | 5.93 | |
Hypothetical 5% return | | | 1,000.00 | | | | 1,019.29 | + | | | 6.16 | | | | 1,000.00 | | | | 1,019.29 | + | | | 6.71 | | | | 1,000.00 | | | | 1,019.29 | + | | | 6.16 | |
| Class C | | | | | | | | | | | | | | | | | | | | | | | | | | | | | | | | | | | | |
Actual | | | 1,000.00 | | | | 970.40 | | | | 9.67 | | | | 1,000.00 | | | | 925.00 | | | | 9.98 | | | | 1,000.00 | | | | 940.10 | | | | 9.52 | |
Hypothetical 5% return | | | 1,000.00 | | | | 1,014.98 | + | | | 9.89 | | | | 1,000.00 | | | | 1,014.43 | + | | | 10.44 | | | | 1,000.00 | | | | 1,014.98 | + | | | 9.89 | |
| Institutional | | | | | | | | | | | | | | | | | | | | | | | | | | | | | | | | | | | | |
Actual | | | 1,000.00 | | | | 976.00 | | | | 4.12 | | | | 1,000.00 | | | | 930.30 | | | | 4.55 | | | | 1,000.00 | | | | 945.30 | | | | 4.05 | |
Hypothetical 5% return | | | 1,000.00 | | | | 1,020.63 | + | | | 4.21 | | | | 1,000.00 | | | | 1,020.08 | + | | | 4.76 | | | | 1,000.00 | | | | 1,020.63 | + | | | 4.21 | |
| Service | | | | | | | | | | | | | | | | | | | | | | | | | | | | | | | | | | | | |
Actual | | | 1,000.00 | | | | 973.70 | | | | 6.56 | | | | 1,000.00 | | | | 928.00 | | | | 6.93 | | | | — | | | | 1,000.00 | | | | — | |
Hypothetical 5% return | | | 1,000.00 | | | | — | + | | | 6.71 | | | | 1,000.00 | | | | — | + | | | 7.25 | | | | — | | | | — | | | | — | |
| Investor | | | | | | | | | | | | | | | | | | | | | | | | | | | | | | | | | | | | |
Actual | | | 1,000.00 | | | | 975.20 | | | | 4.80 | | | | 1,000.00 | | | | 929.80 | | | | 5.22 | | | | 1,000.00 | | | | 944.10 | | | | 4.72 | |
Hypothetical 5% return | | | 1,000.00 | | | | 1,019.93 | + | | | 4.91 | | | | 1,000.00 | | | | 1,019.39 | + | | | 5.46 | | | | 1,000.00 | | | | 1,019.93 | + | | | 4.91 | |
| Class P | | | | | | | | | | | | | | | | | | | | | | | | | | | | | | | | | | | | |
Actual | | | 1,000.00 | | | | 976.20 | | | | 4.07 | | | | 1,000.00 | | | | 930.60 | | | | 4.50 | | | | 1,000.00 | | | | 944.80 | | | | 4.00 | |
Hypothetical 5% return | | | 1,000.00 | | | | 1,021.22 | + | | | 4.16 | | | | 1,000.00 | | | | 1,021.22 | + | | | 4.71 | | | | 1,000.00 | | | | 1,021.22 | + | | | 4.16 | |
| Class R | | | | | | | | | | | | | | | | | | | | | | | | | | | | | | | | | | | | |
Actual | | | 1,000.00 | | | | 972.80 | | | | 7.24 | | | | 1,000.00 | | | | 927.30 | | | | 7.60 | | | | 1,000.00 | | | | 941.90 | | | | 7.13 | |
Hypothetical 5% return | | | 1,000.00 | | | | 1,018.05 | + | | | 7.40 | | | | 1,000.00 | | | | 1,018.05 | + | | | 7.95 | | | | 1,000.00 | | | | 1,018.05 | + | | | 7.40 | |
| Class R6 | | | | | | | | | | | | | | | | | | | | | | | | | | | | | | | | | | | | |
Actual | | | 1,000.00 | | | | 976.10 | | | | 4.07 | | | | 1,000.00 | | | | 930.50 | | | | 4.50 | | | | 1,000.00 | | | | 945.50 | | | | 4.00 | |
Hypothetical 5% return | | | 1,000.00 | | | | 1,020.68 | + | | | 4.16 | | | | 1,000.00 | | | | 1,020.13 | + | | | 4.71 | | | | 1,000.00 | | | | 1,020.68 | + | | | 4.16 | |
| + | | Hypothetical expenses are based on each Fund’s actual annualized net expense ratios and an assumed rate of return of 5% per year before expenses. |
| * | | Expenses for each share class are calculated using each Fund’s annualized net expense ratio for each class, which represents the ongoing expenses as a percentage of net assets for the six months ended February 28, 2019. Expenses are calculated by multiplying the annualized net expense ratio by the average account value for the period; then multiplying the result by the number of days in the most recent fiscal half year; and then dividing that result by the number of days in the fiscal year. The annualized net expense ratios for the period were as follows: |
| | | | | | | | | | | | | | | | | | | | | | | | | | | | | | | | |
| Fund | | Class A | | | Class C | | | Institutional | | | Service | | | Investor | | | Class P | | | Class R | | | Class R6 | |
Mid Cap Value | | | 1.23 | % | | | 1.98 | % | | | 0.84 | % | | | 1.34 | % | | | 0.98 | % | | | 0.83 | % | | | 1.48 | % | | | 0.83 | % |
Small Cap Value | | | 1.34 | | | | 2.09 | | | | 0.95 | | | | 1.45 | | | | 1.09 | | | | 0.94 | | | | 1.59 | | | | 0.94 | |
Small/Mid Cap Value | | | 1.23 | | | | 1.98 | | | | 0.84 | | | | N/A | | | | 0.98 | | | | 0.83 | | | | 1.48 | | | | 0.83 | |
128
FUNDS PROFILE
Goldman Sachs Funds
Goldman Sachs is a premier financial services firm, known since 1869 for creating thoughtful and customized investment solutions in complex global markets.
Today, theInvestment Management Division of Goldman Sachs serves a diverse set of clients worldwide, including private institutions, public entities and individuals. With approximately $1.34 trillion in assets under supervision as of December 31, 2018, Goldman Sachs Asset Management (“GSAM”) has portfolio management teams located around the world and our investment professionals bring firsthand knowledge of local markets to every investment decision. Assets under supervision includes assets under management and other client assets for which Goldman Sachs does not have full discretion. GSAM leverages the resources of Goldman Sachs & Co. LLC subject to legal, internal and regulatory restrictions.
Money Market
Financial Square FundsSM
| ∎ | | Financial Square Treasury Solutions Fund1 |
| ∎ | | Financial Square Government Fund1 |
| ∎ | | Financial Square Money Market Fund2 |
| ∎ | | Financial Square Prime Obligations Fund2 |
| ∎ | | Financial Square Treasury Instruments Fund1 |
| ∎ | | Financial Square Treasury Obligations Fund1 |
| ∎ | | Financial Square Federal Instruments Fund1 |
Investor FundsSM
| ∎ | | Investor Money Market Fund3 |
| ∎ | | Investor Tax-Exempt Money Market Fund3 |
Fixed Income
Short Duration and Government
| ∎ | | High Quality Floating Rate Fund |
| ∎ | | Short-Term Conservative Income Fund |
| ∎ | | Short Duration Government Fund |
| ∎ | | Short Duration Income Fund |
| ∎ | | Inflation Protected Securities Fund |
Multi-Sector
Municipal and Tax-Free
| ∎ | | High Yield Municipal Fund |
| ∎ | | Dynamic Municipal Income Fund |
| ∎ | | Municipal Income Completion Fund |
| ∎ | | Short Duration Tax-Free Fund |
Single Sector
| ∎ | | Investment Grade Credit Fund |
| ∎ | | High Yield Floating Rate Fund |
| ∎ | | Emerging Markets Debt Fund |
| ∎ | | Local Emerging Markets Debt Fund |
Fixed Income Alternatives
| ∎ | | Long Short Credit Strategies Fund |
Fundamental Equity
| ∎ | | Small/Mid Cap Value Fund |
| ∎ | | Small/Mid Cap Growth Fund |
| ∎ | | Concentrated Growth Fund |
| ∎ | | Technology Opportunities Fund |
| ∎ | | Growth Opportunities Fund |
| ∎ | | Rising Dividend Growth Fund |
Tax-Advantaged Equity
| ∎ | | U.S. Tax-Managed Equity Fund |
| ∎ | | International Tax-Managed Equity Fund |
| ∎ | | U.S. Equity Dividend and Premium Fund |
| ∎ | | International Equity Dividend and Premium Fund |
Equity Insights
| ∎ | | Small Cap Equity Insights Fund |
| ∎ | | U.S. Equity Insights Fund |
| ∎ | | Small Cap Growth Insights Fund |
| ∎ | | Large Cap Growth Insights Fund |
| ∎ | | Large Cap Value Insights Fund |
| ∎ | | Small Cap Value Insights Fund |
| ∎ | | International Small Cap Insights Fund |
| ∎ | | International Equity Insights Fund |
| ∎ | | Emerging Markets Equity Insights Fund |
Fundamental Equity International
| ∎ | | International Equity Income Fund |
| ∎ | | International Equity ESG Fund |
| ∎ | | Emerging Markets Equity Fund |
| ∎ | | ESG Emerging Markets Equity Fund |
Select Satellite
| ∎ | | Real Estate Securities Fund |
| ∎ | | International Real Estate Securities Fund |
| ∎ | | Commodity Strategy Fund |
| ∎ | | Global Real Estate Securities Fund |
| ∎ | | Alternative Premia Fund |
| ∎ | | Absolute Return Tracker Fund |
| ∎ | | Managed Futures Strategy Fund |
| ∎ | | MLP Energy Infrastructure Fund |
| ∎ | | Multi-Manager Alternatives Fund |
| ∎ | | Absolute Return Multi-Asset Fund |
| ∎ | | Global Infrastructure Fund |
Total Portfolio Solutions
| ∎ | | Global Managed Beta Fund |
| ∎ | | Multi-Manager Non-Core Fixed Income Fund |
| ∎ | | Multi-Manager U.S. Dynamic Equity Fund |
| ∎ | | Multi-Manager Global Equity Fund |
| ∎ | | Multi-Manager International Equity Fund |
| ∎ | | Tactical Tilt Overlay Fund |
| ∎ | | Balanced Strategy Portfolio |
| ∎ | | Multi-Manager U.S. Small Cap Equity Fund |
| ∎ | | Multi-Manager Real Assets Strategy Fund |
| ∎ | | Growth and Income Strategy Portfolio |
| ∎ | | Growth Strategy Portfolio |
| ∎ | | Dynamic Global Equity Fund4 |
| ∎ | | Satellite Strategies Portfolio |
| ∎ | | Enhanced Dividend Global Equity Portfolio |
| ∎ | | Tax-Advantaged Global Equity Portfolio |
| ∎ | | Strategic Factor Allocation Fund |
| ∎ | | Target Date 2020 Portfolio |
| ∎ | | Target Date 2025 Portfolio |
| ∎ | | Target Date 2030 Portfolio |
| ∎ | | Target Date 2035 Portfolio |
| ∎ | | Target Date 2040 Portfolio |
| ∎ | | Target Date 2045 Portfolio |
| ∎ | | Target Date 2050 Portfolio |
| ∎ | | Target Date 2055 Portfolio |
| ∎ | | Target Date 2060 Portfolio |
| ∎ | | GQG Partners International Opportunities Fund |
| 1 | | You could lose money by investing in the Fund. Although the Fund seeks to preserve the value of your investment at $1.00 per share, it cannot guarantee it will do so. An investment in the Fund is not a deposit of a bank and is not insured or guaranteed by the Federal Deposit Insurance Corporation or any other government agency. The Fund’s sponsor has no legal obligation to provide financial support to the Fund, and you should not expect that the sponsor will provide financial support to the Fund at any time. |
| 2 | | You could lose money by investing in the Fund. Because the share price of the Fund will fluctuate, when you sell your shares they may be worth more or less than what you originally paid for them. The Fund may impose a fee upon sale of your shares or may temporarily suspend your ability to sell shares if the Fund’s liquidity falls below required minimums because of market conditions or other factors. An investment in the Fund is not a deposit of a bank and is not insured or guaranteed by the Federal Deposit Insurance Corporation or any other government agency. The Fund’s sponsor has no legal obligation to provide financial support to the Fund, and you should not expect that the sponsor will provide financial support to the Fund at any time. |
| 3 | | You could lose money by investing in the Fund. Although the Fund seeks to preserve the value of your investment at $1.00 per share, it cannot guarantee it will do so. The Fund may impose a fee upon sale of your shares or may temporarily suspend your ability to sell shares if the Fund’s liquidity falls below required minimums because of market conditions or other factors. An investment in the Fund is not a deposit of a bank and is not insured or guaranteed by the Federal Deposit Insurance Corporation or any other government agency. The Fund’s sponsor has no legal obligation to provide financial support to the Fund, and you should not expect that the sponsor will provide financial support to the Fund at any time. |
| 4 | | Effective after the close of business on February 28, 2019, the Goldman Sachs Equity Growth Strategy Portfolio was renamed the Goldman Sachs Dynamic Global Equity Fund. |
| | | Financial Square FundsSM and Investor FundsSM are registered service marks of Goldman Sachs & Co. LLC. |
*This list covers open-end funds only. Please visit our website at www.GSAMFUNDS.com to learn about our closed-end funds and exchange-traded funds.
| | |
TRUSTEES Jessica Palmer,Chair Kathryn A. Cassidy Diana M. Daniels James A. McNamara Roy W. Templin Gregory G. Weaver | | OFFICERS James A. McNamara,President Scott M. McHugh,Treasurer, Senior Vice President and Principal Financial Officer Joseph F. DiMaria,Assistant Treasurer and Principal Accounting Officer Caroline L. Kraus,Secretary |
| |
GOLDMAN SACHS & CO. LLC Distributor and Transfer Agent | | GOLDMAN SACHS ASSET MANAGEMENT, L.P. Investment Adviser |
Visit our web site atwww.GSAMFUNDS.com to obtain the most recent month-end returns.
Goldman Sachs Asset Management, L .P. 200 West Street, New York, New York 10282
The reports concerning the Funds included in this shareholder report may contain certain forward-looking statements about the factors that may affect the performance of the Funds in the future. These statements are based on Fund management’s predictions and expectations concerning certain future events and their expected impact on the Funds, such as performance of the economy as a whole and of specific industry sectors, changes in the levels of interest rates, the impact of developing world events, and other factors that may influence the future performance of the Funds. Management believes these forward-looking statements to be reasonable, although they are inherently uncertain and difficult to predict. Actual events may cause adjustments in portfolio management strategies from those currently expected to be employed.
A description of the policies and procedures that the Funds use to determine how to vote proxies relating to portfolio securities and information regarding how a Fund voted proxies relating to portfolio securities during the most recent 12-month period ended June 30 is available (i) without charge, upon request by calling1-800-526-7384 (for Retail Shareholders) or 1-800-621-2550 (for Institutional Shareholders); and (ii) on the Securities and Exchange Commission (“SEC”) web site at http://www.sec.gov.
The Funds will file portfolio holdings information for each month in a fiscal quarter within 60 days after the end of the relevant fiscal quarter on Form N-PORT. Portfolio holdings information for the third month of each fiscal quarter will be made available on the SEC’s web site at http://www.sec.gov. Portfolio holdings information may be obtained upon request and without charge by calling 1-800-526-7384 (for Retail Shareholders) or 1-800-621-2550 (for Institutional Shareholders).
Goldman Sachs & Co. LLC (‘‘Goldman Sachs’’) does not provide legal, tax or accounting advice. Any statement contained in this communication (including any attachments) concerning U.S. tax matters was not intended or written to be used, and cannot be used, for the purpose of avoiding penalties under the Internal Revenue Code, and was written to support the promotion or marketing of the transaction(s) or matter(s) addressed. Clients of Goldman Sachs should obtain their own independent tax advice based on their particular circumstances.
Fund holdings and allocations shown are as of February 28, 2019 and may not be representative of future investments. Fund holdings should not be relied on in making investment decisions and should not be construed as research or investment advice regarding particular securities. Current and future holdings are subject to risk.
The Global Industry Classification Standard (GICS) was developed by and is the exclusive property and a service mark of Morgan Stanley Capital International Inc. (MSCI) and Standard & Poor’s, a division of The McGraw-Hill Companies, Inc. (S&P) and is licensed for use by Goldman Sachs. Neither MSCI, S&P nor any other party involved in making or compiling the GICS or any GICS classifications makes any express or implied warranties or representations with respect to such standard or classification (or the results to be obtained by the use thereof), and all such parties hereby expressly disclaim all warranties of originality, accuracy, completeness, merchantability or fitness for a particular purpose with respect to any of such standard or classification. Without limiting any of the foregoing, in no event shall MSCI, S&P, any of their affiliates or any third party involved in making or compiling the GICS or any GICS classifications have any liability for any direct, indirect, special, punitive, consequential or any other damages (including lost profits) even if notified of the possibility of such damages.
The portfolio risk management process includes an effort to monitor and manage risk, but does not imply low risk.
This material is not authorized for distribution to prospective investors unless preceded or accompanied by a current Prospectus or summary prospectus, if applicable. Investors should consider a Fund’s objective, risks, and charges and expenses, and read the summary prospectus, if available, and/or the Prospectus carefully before investing or sending money. The summary prospectus, if available, and the Prospectus contain this and other information about a Fund and may be obtained from your Authorized Institution or from Goldman Sachs & Co. LLC by calling (retail – 1-800-526-7384) (institutional – 1-800-621-2550).
© 2019 Goldman Sachs. All rights reserved. 162451-OTU-960960 EQVALSAR-19/118K
Goldman Sachs Funds

| | | | |
| | |
| Semi-Annual Report | | | | February 28, 2019 |
| | |
| | | | Global Managed Beta Fund |
It is our intention that beginning on January 1, 2021, paper copies of the Fund’s annual and semi-annual shareholder reports will no longer be sent by mail, unless you specifically request paper copies of the reports from the Fund or from your financial intermediary. Instead, the reports will be made available on a website, and you will be notified by mail each time a report is posted and provided with a website link to access the report.
If you already elected to receive shareholder reports electronically, you will not be affected by this change and you need not take any action. At any time, you may elect to receive reports and certain communications from the Fund electronically by calling the toll-free number below or by contacting your financial intermediary.
You may elect to receive all future shareholder reports in paper free of charge. If you hold shares of the Fund directly with the Fund’s transfer agent, you can inform the transfer agent that you wish to receive paper copies of reports by calling toll-free800-621-2550. If you hold shares of the Fund through a financial intermediary, please contact your financial intermediary to make this election. Your election to receive reports in paper will apply to all Goldman Sachs Funds held in your account if you invest through your financial intermediary or all Goldman Sachs Funds held with the Fund’s transfer agent if you invest directly with the transfer agent.

Goldman Sachs Global Managed Beta Fund
| | | | |
| | | |
| NOT FDIC-INSURED | | May Lose Value | | No Bank Guarantee |
PORTFOLIO RESULTS
Goldman Sachs Global Managed Beta Fund
Investment Objective
The Fund seeks to provide long-term capital growth.
Portfolio Management Discussion and Analysis
Below, the Goldman Sachs Global Portfolio Solutions Team (“GPS Team”) discusses the Goldman Sachs Global Managed Beta Fund’s (the “Fund”) performance and positioning for thesix-month period ended February 28, 2019 (the “Reporting Period”).
| Q | | How did the Fund perform during the Reporting Period? |
| A | | During the Reporting Period, the Fund’s Institutional Shares generated a cumulative total return of-3.38%. This return compares to the-3.13% cumulative total return of the Fund’s benchmark, the MSCI All Country World Index Investable Market Index (“ACWI IMI”) (Net, USD, 50%Non-US Developed Hedged to USD) (the “Index”), during the same time period. |
| Q | | What economic and market factors most influenced the Fund during the Reporting Period? |
| A | | When the Reporting Period began in September 2018, global economic growth moderated, as third calendar quarter Gross Domestic Product (“GDP”) in both the U.S. and China slowed. However, economic growth overall remained healthy, especially in the U.S. In terms of geopolitics, the U.S. Administration imposed tariffs on $200 billion of imports from China. Major developed markets equity indices were up during September, outperforming emerging markets equities indices, such as the MSCI China Index(-1.39%) and MSCI India Index(-9.10%), which declined. Regarding fixed income, the10-year U.S. Treasury yield rose 20 basis points, and real yields (i.e., nominal yields adjusted for inflation) rose 15 basis points. (A basis point is 1/100th of a percentage point.) The increase in yields reflected strong U.S. economic activity, with ongoing fiscal stimulus boosting economic activity despite moderating growth outside the U.S. The Federal Reserve (“Fed”) raised short-term interest rates by 25 basis points, much as the markets expected, at its September policy meeting. Additionally, the Fed’s dot plot pointed to one more rate hike by the end of 2018. (The “dot plot” shows rate projections of the members of the Fed’s Open Market Committee.) |
| | In October 2018, global equities sold off as higher U.S. real yields and softer than market expected earnings guidance from U.S. corporations weighed on investors’ risk sentiment. Emerging markets equities were dragged down by a more than 10%sell-off in Chinese, Korean and Taiwanese stocks. Within fixed income, the10-year U.S. Treasury yield rose from 3.05% to 3.20%, driven by a record high in the U.S. Institute for Supply Management’sNon-Manufacturing Purchasing Manufacturing Index (“PMI”) as well as by Fed Chair Jerome Powell’s comment that the Fed was “a long way” from getting short-term interest rates to neutral. Then, in the latter half of October 2018, the U.S.10-year Treasury yield fell to 3.15%, as investors flocked to bonds amid increasedrisk-off sentiment, or reduced risk appetite. For the month overall, the U.S.10-year Treasury yield was up 10 basis points, driven by an 18 basis point increase in real yields and an eight basis point decrease in the breakeven inflation rate due to lower crude oil prices. (The breakeven inflation rate is a market-based measure of expected inflation.) |
| | Global economic growth stabilized somewhat in November 2018, as the global composite PMI improved modestly, driven by better global services PMI readings. China’s industrial output and fixed asset investment data were also better than market expected. However, European economic growth continued to look weak, as both manufacturing PMI and GDP surprised to the downside. European stocks lagged their developed markets peers in November, as weaker economic growth and investor concerns about auto tariffs weighed on their performance, especially the performance of German stocks. Within fixed income, less hawkish Fed commentary and weaker inflation led U.S.10-year Treasury yields to fall by approximately 15 basis points. (Hawkish tends to suggest higher interest rates; opposite of dovish.) On the geopolitical front, U.S. and Chinese policymakers eased market concerns around ongoing trade disputes ahead of the G20 meeting at month end. (Also known as Group of 20 nations, the G20 is a forum attended by finance ministers |
1
PORTFOLIO RESULTS
| | and central bank governors from the world’s highly developed economies consisting of 19 countries and the European Union.) |
| | In December 2018, global economic growth continued to decelerate. In addition, macroeconomic data seemed to suggest U.S. manufacturing growth had started to moderate. The Fed hiked short-term interest rates by 25 basis points at its December meeting, in line with market expectations. At the same time, the Fed lowered its projection for 2019 rate increases from 75 basis points to 50 basis points, while also signaling it would continue to reduce its balance sheet. (The Fed reduces its balance sheet by selling securities on its balance sheet and/or not reinvesting maturing securities.) Risk assets reacted negatively to the announcement. Global equities, as represented by the Index, returned-7.5%, fueled by significant sell-offs in U.S. and Japanese equities. Meanwhile, with trade war fears subsiding and higher interest rates prevailing, globallarge-cap equities outperformed their globalsmall-cap counterparts for the fourth calendar quarter overall, after underperforming for most of 2018. |
| | Given the sharp tightening in U.S. financial conditions during the fourth quarter of 2018 and a benign inflation outlook by the U.S. central bank, the Fed signaled in January 2019 that it was willing to be “patient” in raising interest rates further and would be flexible about balance sheet reduction. As a result, global equities, as measured by the Index, returned more than 8% during January. Emerging markets equities, as represented by the MSCI Emerging Markets Index, rallied 8.75% and outperformed developed markets equities, benefiting in particular from the performance of Brazilian and Russian stocks. Brazilian stocks, as measured by the MSCI Brazil Index, climbed 17.76% based on expectations of potential reforms by the nation’s new government and relatively better macro data. Russian stocks, as measured by the MSCI Russia Index, rose 13.54%, supported by a rebound in Brent crude oil prices. In fixed income, the10-year U.S. Treasury yield fell six basis points. Notably, U.S. breakeven inflation expectations rose 13 basis points due to a rebound in crude oil and equity prices. Real yields declined 19 basis points in response to the Fed’s significantly dovish tone in January. |
| | Global equities continued their positive momentum into February 2019. Developed markets equities across Europe, Japan and the U.S. posted positive returns despite weak global manufacturing and trade data. The performance of emerging markets equities was rather flat overall, with significant dispersion across regions. Within the emerging markets, Chinese onshore equities posted double-digit gains, benefiting from a pickup in Chinese credit growth and positive developments in U.S.-China trade negotiations. Brazilian and South African equities, however, each delivered negative returns, with the decline in Brazilian stocks driven by rumors of a delay in pension reform and the decline in South African stocks driven by concerns around credit risk. In fixed income, the10-year U.S. Treasury yield was up modestly, driven primarily by an increase in the breakeven inflation rate. |
| Q | | What key factors were responsible for the Fund’s performance during the Reporting Period? |
| A | | The Fund primarily seeks to achieve its investment objective by investing in a diversified portfolio of underlying asset classes that provide broad beta exposure to the global equity markets. (Beta refers to the component of returns that is attributable to market risk exposure, rather than manager skill.) The GPS Team determines allocations to the underlying asset classes—and within the underlying asset classes—based on its cycle-aware long-term strategic allocation model, which may include factor-based diversification. The factor-based diversification approach is implemented through a separately managed account composed of individual stock positions. |
| | During the Reporting Period, the Fund marginally underperformed the Index, largely because of its exposure to the broad equity marketsell-off in the fourth quarter of 2018. The Fund held strategic overweights relative to the Index in U.S. and internationalsmall-cap equities. Mitigating some of these losses was the Fund’s strategic allocation to the macro hedging strategy (through which we seek to diversify the Fund’s overall exposure to global equity asset classes), which benefited from investors’risk-off sentiment during the fourth calendar quarter. |
| | The Fund was also hurt during the Reporting Period by allocations to three of our factor-based strategies—Momentum, Valuation and Quality. However, an allocation to the Volatility factor buoyed performance, helping to offset some of the negative performance. The Momentum factor seeks to identify companies whose stock prices are expected to increase or decrease (by, among other things, evaluating each company’s recent performance results). The Valuation factor seeks to identify companies whose stock prices are trading at a discount to their fundamental or intrinsic value (by, among other things, comparing each company’s book value to market value). The Quality factor seeks to identify |
2
PORTFOLIO RESULTS
| | companies that are expected to generate higher returns on assets (i.e., more profitable). The Volatility factor seeks to identify companies whose stock prices are expected to have a relatively lower degree of fluctuation over time. |
| Q | | How was the Fund positioned at the beginning of the Reporting Period? |
| A | | In terms of its strategic allocation at the beginning of the Reporting Period, the Fund had 98.09% of its total net assets invested in equity-related investments, 1.78% in the macro hedging strategy and 0.13% in cash and cash equivalents. The Fund also maintained a position in cash and cash equivalents to cover the exposure of various derivatives positions. This above sector breakout is inclusive of derivative exposure across all asset classes. |
| Q | | How did you tactically manage the Fund’s allocations during the Reporting Period? |
| A | | When the Reporting Period began, and as had been the case for most of 2018, the Fund maintained an overweight versus the Index in emerging markets equities versus developed markets equities. However, in October 2018, we modestly reduced the Fund’s overweight in emerging markets equities due to heightened market volatility driven by emerging markets currency risk. This overweight was decreased further at the beginning of 2019. We had expected to see the start of a rebound in China’s economic data by the end of the fourth quarter of 2018 in response to policy initiatives that sought to stimulate growth, but fresh data releases showed continued deterioration. We were particularly worried about weak industrial production data in December 2018 and the drop below 50 of both China’s official manufacturing PMI and the Caixin/Markit China manufacturing PMI during the same month. |
| | Also, at the beginning of the Reporting Period, the Fund held a steepening position on the front, or short-term, end of the U.S. Treasury yield curve. (Yield curve is a spectrum of maturities of varying lengths. A steepening position seeks to take advantage of a widening differential between yields at the shorter- and longer-term ends of a range of maturities.) In December 2018, we allowed the longer end of this steepening position to expire. |
| Q | | How did the Fund use derivatives and similar instruments during the Reporting Period? |
| A | | During the Reporting Period, equity futures were employed to express our passive investment views with greater versatility. The use of these instruments to gain exposure to the Canadian equity market and the U.S.small-cap equity market during the Reporting Period detracted from the Fund’s performance, as these positions generated returns similar to the asset classes they represented. In addition, the Fund employed currency forwards and interest rate options to afford greater risk management of macroeconomic and foreign exchange risks in the portfolio. Currency forwards contributed positively to the Fund’s returns due to strength in the U.S. dollar. Interest rate options also added to Fund performance and broadly accomplished their intended purpose in therisk-off environment of the fourth quarter of 2018. |
| Q | | How was the Fund positioned at the end of the Reporting Period? |
| A | | In terms of its strategic allocation at the end of the Reporting Period, the Fund had 98.00% of its total net assets invested in equity-related investments, 1.72% in the macro hedging strategy and 0.28% in cash and cash equivalents. The Fund also maintained a position in cash and cash equivalents to cover the exposure of various derivatives positions. This above sector breakout is inclusive of derivative exposure across all asset classes. |
| Q | | What is the Fund’s tactical asset allocation view and strategy for the months ahead? |
| A | | At the end of the Reporting Period, we believed the global economy remained in the expansionary phase of the business cycle and was likely to grow above trend through 2019. That said, the risks to this view increased in late 2018 as global economic growth data deteriorated more than we had expected. The overall level of economic activity, however, did not fall to levels that would have forced us to change our core views, and at the end of the Reporting Period, our forward-looking indicators still suggested a positive economic growth environment into 2020. Also at the end of the Reporting Period, we believed some causes of the global economic slowdown would prove temporary and predictions by some market participants of a recession in 2019 would turn out to be premature. |
| | In the U.S., we saw certain downside risks to our economic outlook, ranging from seasonal weakness in first quarter 2019 economic data, potential negative impacts from the partial federal government shutdown and a medium-term economic growth slowdown. Overall, however, we expected to reach a time when the U.S. economic growth outlook would be more balanced. As for Europe, we expected economic growth to improve. China should experience mild |
3
PORTFOLIO RESULTS
| | improvements on the back of ongoing fiscal policy measures, in our view, though we acknowledge this is taking longer to materialize than we had originally anticipated. Should all our economic views materialize, we expect a convergence in global economic growth and, therefore, a softening of the U.S. dollar — an important reversal of what drove negative market conditions in 2018, in our view. |
| | A further note about China: The economic slowdown in that country has lasted longer than we expected and remains the biggest challenge to our core views. We believe some of this may be explained by front-loading strategies — where economic pain is endured up front — ahead of the imposition of tariffs, as evidenced perhaps by the temporary increase in China’s industrial production during October 2018 and thepick-up in inventories and deterioration of net exports to the U.S. during the third quarter of 2018. In our opinion, much of China’s slowdown can be explained by its central bank’s tightening of monetary policy in 2017, with a lesser contribution from trade tensions than market consensus has suggested. Although the latter is certainly having an impact, we believe policy actions could result in a partial reversal of the weakening trend. In our view, better than market expected fourth calendar quarter GDP and December 2018 industrial production, retail sales and fixed asset investment may indicate the stabilization we have expected is beginning to emerge. We also believe there is ample room for further measures if policymakers deem them necessary. |
| | On the asset class level, at the end of the Reporting Period, we expected global equities to generate positive returns over the near term should they continue to recover from the losses they experienced in 2018. Interestingly, at the end of the Reporting Period, the Japanese equity market was trading at its lowestprice-to-earnings multiple since before “Abenomics,” despite an approximately 40% improvement in its return on equity since that time. (Abenomics refers to the multi-pronged economic program of Japanese Prime Minister Shinzo Abe. It seeks to remedy two decades of economic stagnation by increasing Japan’s money supply, boosting government spending and enacting reforms to make the economy more competitive.) As for fixed income, we observed the market was actually pricing in 2019 Fed interest rate cuts at the end of the Reporting Period, something it did not do during previous periods of slower economic growth, such as 2011, 2012 and 2015-2016. |
| | Overall, we expect higher levels of market volatility in the near term. We plan to continue focusing on potential risks and opportunities, such as those related to U.S.-China trade negotiations, Brexit, debate over the U.S. fiscal ceiling, Fed monetary policy and fourth quarter 2018 corporate earnings reports. (Brexit refers to the U.K’s efforts to exit the European Union.) |
| | As for the Fund’s macro hedging strategy, we consider it a long-term structural allocation and a capital-efficient means of diversifying the Fund’s exposure to global equities. As the Fed shifts into a more “patient” and flexible approach to short-term interest rate policy, we plan to continue monitoring the potential impact of events related to key political and monetary policy decisions in the near term. |
4
FUND BASICS
Global Managed Beta Fund
as of February 28, 2019
| | | | | | | | | | |
| | PERFORMANCE REVIEW | |
| | | |
| | | September 1, 2018–February 28, 2019 | | Fund Total Return
(based on NAV)1 | | | MSCI All Country World Index
Investable Market Index2 | |
| | | |
| | | Institutional Shares | | | -3.38 | % | | | -3.13 | % |
| | 1 | | The net asset value (“NAV”) represents the net assets of the class of the Fund(ex-dividend) divided by the total number of shares of the class outstanding. The Fund’s performance assumes the reinvestment of dividends and other distributions. The Fund’s performance does not reflect the deduction of any applicable sales charges. |
| | 2 | | The MSCI All Country World Index Investable Market Index (Net, USD, 50%Non-US Developed Hedged to USD) captures large, mid and small cap representation across 23 developed markets and 24 emerging markets. With 8,686 constituents, the MSCI ACWI IMI is comprehensive, covering approximately 99% of the global equity investment opportunity set. As of February 28, 2019, the 23 developed markets in the MSCI ACWI IMI include Australia, Austria, Belgium, Canada, Denmark, Finland, France, Germany, Hong Kong, Ireland, Israel, Italy, Japan, Netherlands, New Zealand, Norway, Portugal, Singapore, Spain, Sweden, Switzerland, the U.K. and the U.S. The 24 emerging markets include Brazil, Chile, China, Colombia, Czech Republic, Egypt, Greece, Hungary, India, Indonesia, Korea, Malaysia, Mexico, Pakistan, Peru, Philippines, Poland, Russia, Qatar, South Africa, Taiwan, Thailand, Turkey and United Arab Emirates. |
| | | | | | | | | | | | | | |
| | STANDARDIZED TOTAL RETURNS3 | |
| | | | |
| | | For the period ended 12/31/18 | | One Year | | | Since Inception | | | Inception Date | |
| | | Institutional | | | -9.61 | % | | | 3.58 | % | | | 4/30/15 | |
| | 3 | | The Standardized Total Returns are average annual total returns or cumulative total returns (only if the performance period is one year or less) as of the most recent calendarquarter-end. They assume reinvestment of all distributions at NAV. Because Institutional Shares do not involve a sales charge, such a charge is not applied to their Standardized Total Returns. |
The returns set forth in the tables above represent past performance. Past performance does not guarantee future results. The Fund’s investment return and principal value will fluctuate so that an investor’s shares, when redeemed, may be worth more or less than their original cost. Current performance may be lower or higher than the performance quoted above. Please visit our web site at www.GSAMFUNDS.com to obtain the most recentmonth-end returns. Performance reflects applicable fee waivers and/or expense limitations in effect during the periods shown. In their absence, performance would be reduced. Returns do not reflect the deduction of taxes that a shareholder would pay on Fund distributions or the redemption of Fund shares.
| | | | | | | | | | |
| | EXPENSE RATIOS4 | |
| | | |
| | | | | Net Expense Ratio (Current) | | | Gross Expense Ratio (Before Waivers) | |
| | | Institutional Shares | | | 0.19 | % | | | 0.52 | % |
| | 4 | | The expense ratios of the Fund, both current (net of applicable fee waivers and/or expense limitations) and before waivers (gross of applicable fee waivers and/or expense limitations) are as set forth above according to the most recent publicly available Prospectus for the Fund and may differ from the expense ratios disclosed in the Financial Highlights in this report. Pursuant to a contractual arrangement, the Fund’s waivers and/or expense limitations will remain in place through at least December 28, 2019, and prior to such date the investment adviser may not terminate the arrangements without the approval of the Fund’s Board of Trustees. If these arrangements are discontinued in the future, the expense ratios may change without shareholder approval. |
5
FUND BASICS
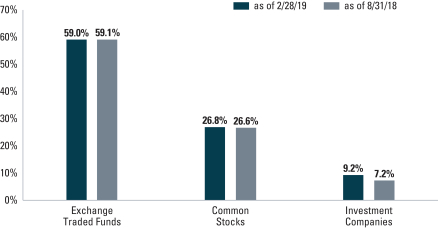
| | 5 | | Underlying sector allocations of exchange traded funds and investment companies held by the Fund are not reflected in the graph above. The percentage shown for each investment category reflects the value of investments in that category as a percentage of net assets. Figures in the graph may not sum to 100% due to the exclusion of other assets and liabilities. The graph does not depict the investment in the securities lending reinvestment vehicle. The investment in the securities lending reinvestment vehicle represented 0.0% of the Fund’s net assets as of February 28, 2019. The graph depicts the Fund’s investments but may not represent the Fund’s market exposure due to the exclusion of certain derivatives, if any, as listed in the Additional Investment Information section of the Schedule of Investments. |
6
GOLDMAN SACHS GLOBAL MANAGED BETA FUND
Index Definitions
MSCI China Index represents the performance of large- andmid-cap segments with H shares, B shares, red chips, P chips and foreign listings (e.g., ADRs) of Chinese stocks. China A shares are partially included in the index, making it the de facto index for all of China.
MSCI India Index is designed to measure the performance of the large and mid cap segments of the Indian market.
MSCI Emerging Markets Index captureslarge-cap andmid-cap representation across 24 emerging markets countries. The index covers approximately 85% of the free float-adjusted market capitalization in each country. Emerging markets countries in the index include Brazil, Chile, China, Colombia, the Czech Republic, Egypt, Greece, Hungary, India, Indonesia, South Korea, Malaysia, Mexico, Pakistan, Peru, the Philippines, Poland, Russia, Qatar, South Africa, Taiwan, Thailand, Turkey and the United Arab Emirates.
MSCI Brazil Index is designed to measure the performance of the large and mid cap segments of the Brazilian market.
MSCI Russia Index is designed to measure the performance of the large and mid cap segments of the Russian market.
It is not possible to invest directly in an unmanaged index.
7
GOLDMAN SACHS GLOBAL MANAGED BETA FUND
Schedule of Investments
February 28, 2019 (Unaudited)
| | | | | | | | |
Shares | | | Description | | Value | |
|
| Common Stocks – 26.8% | |
| Aerospace & Defense – 0.4% | |
| | 1,689 | | | Airbus SE | | $ | 217,598 | |
| | 10,417 | | | BAE Systems PLC | | | 64,228 | |
| | 3,140 | | | CAE, Inc. | | | 66,214 | |
| | 61 | | | Dassault Aviation SA | | | 102,689 | |
| | 567 | | | General Dynamics Corp. | | | 96,515 | |
| | 288 | | | Harris Corp. | | | 47,500 | |
| | 216 | | | Huntington Ingalls Industries, Inc. | | | 45,232 | |
| | 995 | | | L3 Technologies, Inc. | | | 210,691 | |
| | 17,930 | | | Leonardo SpA | | | 180,602 | |
| | 460 | | | Lockheed Martin Corp. | | | 142,329 | |
| | 29,016 | | | Meggitt PLC | | | 207,584 | |
| | 621 | | | MTU Aero Engines AG | | | 133,103 | |
| | 855 | | | Northrop Grumman Corp. | | | 247,916 | |
| | 1,445 | | | Raytheon Co. | | | 269,492 | |
| | 17,669 | | | Rolls-Royce Holdings PLC* | | | 224,143 | |
| | 1,335 | | | Safran SA | | | 181,982 | |
| | 13,131 | | | Singapore Technologies Engineering Ltd. | | | 36,245 | |
| | 1,047 | | | Spirit AeroSystems Holdings, Inc. Class A | | | 103,444 | |
| | 5,400 | | | Textron, Inc. | | | 293,220 | |
| | 702 | | | Thales SA | | | 86,379 | |
| | 2,665 | | | The Boeing Co. | | | 1,172,493 | |
| | 563 | | | TransDigm Group, Inc.* | | | 244,393 | |
| | 3,249 | | | United Technologies Corp. | | | 408,302 | |
| | | | | | | | |
| | | | | | | 4,782,294 | |
| | |
| Air Freight & Logistics – 0.2% | |
| | 14,716 | | | Bollore SA | | | 65,352 | |
| | 4,654 | | | C.H. Robinson Worldwide, Inc. | | | 420,628 | |
| | 9,771 | | | Deutsche Post AG | | | 303,049 | |
| | 1,377 | | | Expeditors International of Washington, Inc. | | | 103,206 | |
| | 742 | | | FedEx Corp. | | | 134,302 | |
| | 85,994 | | | Royal Mail PLC | | | 323,195 | |
| | 9,021 | | | SG Holdings Co. Ltd. | | | 264,842 | |
| | 2,381 | | | United Parcel Service, Inc. Class B | | | 262,386 | |
| | 4,348 | | | XPO Logistics, Inc.* | | | 218,922 | |
| | 1,941 | | | Yamato Holdings Co. Ltd. | | | 50,691 | |
| | | | | | | | |
| | | | | | | 2,146,573 | |
| | |
| Airlines – 0.1% | |
| | 1,986 | | | ANA Holdings, Inc. | | | 73,686 | |
| | 5,915 | | | Delta Air Lines, Inc. | | | 293,266 | |
| | 9,525 | | | Deutsche Lufthansa AG | | | 243,189 | |
| | 1,751 | | | Japan Airlines Co. Ltd. | | | 63,922 | |
| | 5,674 | | | Southwest Airlines Co. | | | 317,971 | |
| | 4,741 | | | United Continental Holdings, Inc.* | | | 416,307 | |
| | | | | | | | |
| | | | | | | 1,408,341 | |
| | |
| Auto Components – 0.1% | |
| | 1,208 | | | Aisin Seiki Co. Ltd. | | | 47,448 | |
| | 570 | | | Aptiv PLC | | | 47,373 | |
| | 551 | | | Autoliv, Inc. | | | 45,077 | |
| | 3,725 | | | BorgWarner, Inc. | | | 151,272 | |
| | 1,822 | | | Bridgestone Corp. | | | 72,172 | |
| | |
|
| Common Stocks – (continued) | |
| Auto Components – (continued) | |
| | 830 | | | Cie Generale des Etablissements Michelin SCA | | | 99,494 | |
| | 381 | | | Continental AG | | | 62,402 | |
| | 1,444 | | | Denso Corp. | | | 62,208 | |
| | 2,061 | | | Faurecia SA | | | 98,181 | |
| | 1,752 | | | Lear Corp. | | | 266,427 | |
| | 3,640 | | | Magna International, Inc. | | | 192,075 | |
| | 1,490 | | | Nokian Renkaat Oyj | | | 52,732 | |
| | 1,716 | | | Stanley Electric Co. Ltd. | | | 49,539 | |
| | 3,801 | | | Sumitomo Electric Industries Ltd. | | | 53,063 | |
| | 2,877 | | | Sumitomo Rubber Industries Ltd. | | | 37,083 | |
| | 6,917 | | | The Goodyear Tire & Rubber Co. | | | 136,818 | |
| | 4,619 | | | The Yokohama Rubber Co. Ltd. | | | 94,541 | |
| | 1,013 | | | Valeo SA | | | 31,853 | |
| | | | | | | | |
| | | | | | | 1,599,758 | |
| | |
| Automobiles – 0.3% | |
| | 766 | | | Bayerische Motoren Werke AG | | | 64,750 | |
| | 1,409 | | | Daimler AG | | | 84,357 | |
| | 1,326 | | | Ferrari NV | | | 170,606 | |
| | 16,614 | | | Fiat Chrysler Automobiles NV* | | | 245,520 | |
| | 45,379 | | | Ford Motor Co. | | | 397,974 | |
| | 1,329 | | | General Motors Co. | | | 52,469 | |
| | 4,141 | | | Harley-Davidson, Inc. | | | 153,714 | |
| | 13,782 | | | Honda Motor Co. Ltd. | | | 389,204 | |
| | 7,313 | | | Isuzu Motors Ltd. | | | 105,121 | |
| | 19,321 | | | Mazda Motor Corp. | | | 227,601 | |
| | 11,286 | | | Nissan Motor Co. Ltd. | | | 97,796 | |
| | 10,509 | | | Peugeot SA | | | 267,201 | |
| | 517 | | | Renault SA | | | 35,428 | |
| | 1,564 | | | Subaru Corp. | | | 39,849 | |
| | 1,742 | | | Suzuki Motor Corp. | | | 89,451 | |
| | 6,150 | | | Toyota Motor Corp. | | | 371,636 | |
| | 239 | | | Volkswagen AG | | | 42,266 | |
| | | | | | | | |
| | | | | | | 2,834,943 | |
| | |
| Banks – 1.5% | |
| | 5,105 | | | ABN AMRO Group NV(a) | | | 123,584 | |
| | 1,430 | | | Aozora Bank Ltd. | | | 41,291 | |
| | 16,110 | | | Australia & New Zealand Banking Group Ltd. | | | 320,052 | |
| | 24,225 | | | Banco Bilbao Vizcaya Argentaria SA | | | 150,264 | |
| | 37,761 | | | Banco de Sabadell SA | | | 42,965 | |
| | 54,193 | | | Banco Santander SA | | | 263,747 | |
| | 6,651 | | | Bank Hapoalim BM | | | 45,791 | |
| | 15,743 | | | Bank Leumi Le-Israel BM | | | 104,121 | |
| | 48,528 | | | Bank of America Corp. | | | 1,411,194 | |
| | 12,237 | | | Bank of Ireland Group PLC | | | 79,505 | |
| | 4,014 | | | Bank of Montreal | | | 313,018 | |
| | 19,875 | | | Bank of Queensland Ltd. | | | 127,156 | |
| | 3,984 | | | Bankinter SA | | | 32,703 | |
| | 47,503 | | | Barclays PLC | | | 103,299 | |
| | 4,955 | | | BB&T Corp. | | | 252,556 | |
| | 19,337 | | | Bendigo & Adelaide Bank Ltd. | | | 135,234 | |
| | 5,378 | | | BNP Paribas SA | | | 275,305 | |
| | 16,775 | | | BOC Hong Kong Holdings Ltd. | | | 70,074 | |
| | |
| | |
| 8 | | The accompanying notes are an integral part of these financial statements. |
GOLDMAN SACHS GLOBAL MANAGED BETA FUND
| | | | | | | | |
Shares | | | Description | | Value | |
|
| Common Stocks – (continued) | |
| Banks – (continued) | |
| | 3,282 | | | Canadian Imperial Bank of Commerce | | $ | 278,407 | |
| | 2,892 | | | CIT Group, Inc. | | | 147,405 | |
| | 9,798 | | | Citigroup, Inc. | | | 626,876 | |
| | 5,955 | | | Citizens Financial Group, Inc. | | | 219,978 | |
| | 1,280 | | | Comerica, Inc. | | | 111,501 | |
| | 6,202 | | | Commerzbank AG* | | | 51,118 | |
| | 5,131 | | | Commonwealth Bank of Australia | | | 269,199 | |
| | 11,900 | | | Credit Agricole SA | | | 152,303 | |
| | 4,699 | | | Danske Bank A/S | | | 93,468 | |
| | 9,078 | | | DBS Group Holdings Ltd. | | | 166,434 | |
| | 2,734 | | | DNB ASA | | | 52,367 | |
| | 848 | | | East West Bancorp, Inc. | | | 46,309 | |
| | 1,120 | | | Erste Groupe Bank AG | | | 42,238 | |
| | 8,951 | | | Fifth Third Bancorp | | | 246,869 | |
| | 554 | | | First Republic Bank | | | 58,159 | |
| | 7,124 | | | Hang Seng Bank Ltd. | | | 176,418 | |
| | 71,169 | | | HSBC Holdings PLC | | | 580,175 | |
| | 8,182 | | | Huntington Bancshares, Inc. | | | 117,903 | |
| | 16,541 | | | ING Groep NV | | | 218,641 | |
| | 111,080 | | | Intesa Sanpaolo SpA | | | 273,304 | |
| | 5,360 | | | Japan Post Bank Co. Ltd. | | | 59,912 | |
| | 19,550 | | | JPMorgan Chase & Co. | | | 2,040,238 | |
| | 980 | | | KBC Group NV | | | 72,535 | |
| | 3,592 | | | KeyCorp. | | | 63,435 | |
| | 224,900 | | | Lloyds Banking Group PLC | | | 189,384 | |
| | 486 | | | M&T Bank Corp. | | | 84,107 | |
| | 9,825 | | | Mediobanca Banca di Credito Finanziario SpA | | | 98,338 | |
| | 36,882 | | | Mitsubishi UFJ Financial Group, Inc. | | | 191,395 | |
| | 2,319 | | | Mizrahi Tefahot Bank Ltd. | | | 44,405 | |
| | 114,647 | | | Mizuho Financial Group, Inc. | | | 180,271 | |
| | 7,920 | | | National Australia Bank Ltd. | | | 141,380 | |
| | 3,961 | | | National Bank of Canada | | | 186,890 | |
| | 9,462 | | | Nordea Bank Abp | | | 85,722 | |
| | 21,878 | | | Oversea-Chinese Banking Corp. Ltd. | | | 178,491 | |
| | 4,962 | | | People’s United Financial, Inc. | | | 88,125 | |
| | 3,857 | | | Raiffeisen Bank International AG | | | 98,276 | |
| | 7,471 | | | Regions Financial Corp. | | | 122,524 | |
| | 7,526 | | | Resona Holdings, Inc. | | | 34,091 | |
| | 7,128 | | | Royal Bank of Canada | | | 557,099 | |
| | 19,664 | | | Royal Bank of Scotland Group PLC | | | 69,156 | |
| | 12,441 | | | Seven Bank Ltd. | | | 36,385 | |
| | 2,594 | | | Shinsei Bank Ltd. | | | 35,686 | |
| | 272 | | | Signature Bank | | | 36,927 | |
| | 4,532 | | | Skandinaviska Enskilda Banken AB Class A | | | 46,105 | |
| | 3,883 | | | Societe Generale SA | | | 119,286 | |
| | 5,420 | | | Standard Chartered PLC | | | 43,222 | |
| | 8,300 | | | Sumitomo Mitsui Financial Group, Inc. | | | 294,926 | |
| | 3,264 | | | Sumitomo Mitsui Trust Holdings, Inc. | | | 124,008 | |
| | 3,601 | | | SunTrust Banks, Inc. | | | 233,597 | |
| | 288 | | | SVB Financial Group* | | | 71,182 | |
| | 3,846 | | | Svenska Handelsbanken AB Class A | | | 43,815 | |
| | 2,687 | | | Swedbank AB Class A | | | 49,327 | |
| | 43,728 | | | The Bank of East Asia Ltd. | | | 152,239 | |
| | |
|
| Common Stocks – (continued) | |
| Banks – (continued) | |
| | 5,969 | | | The Bank of Nova Scotia | | | 331,755 | |
| | 3,246 | | | The PNC Financial Services Group, Inc. | | | 409,061 | |
| | 7,651 | | | The Toronto-Dominion Bank | | | 438,728 | |
| | 5,973 | | | U.S. Bancorp | | | 308,744 | |
| | 9,219 | | | UniCredit SpA | | | 125,202 | |
| | 9,016 | | | United Overseas Bank Ltd. | | | 166,173 | |
| | 22,877 | | | Wells Fargo & Co. | | | 1,141,333 | |
| | 14,507 | | | Westpac Banking Corp. | | | 277,681 | |
| | 4,732 | | | Yamaguchi Financial Group, Inc. | | | 44,255 | |
| | 2,086 | | | Zions Bancorp NA | | | 106,595 | |
| | | | | | | | |
| | | | | | | 17,042,937 | |
| | |
| Beverages – 0.5% | |
| | 946 | | | Anheuser-Busch InBev SA | | | 73,900 | |
| | 3,212 | | | Asahi Group Holdings Ltd. | | | 139,052 | |
| | 6,352 | | | Brown-Forman Corp. Class B | | | 314,361 | |
| | 3,500 | | | Carlsberg A/S Class B | | | 424,046 | |
| | 8,253 | | | Coca-Cola Amatil Ltd. | | | 46,667 | |
| | 10,021 | | | Coca-Cola Bottlers Japan Holdings, Inc. | | | 258,597 | |
| | 6,199 | | | Coca-Cola European Partners PLC | | | 292,221 | |
| | 3,368 | | | Coca-Cola HBC AG* | | | 113,280 | |
| | 742 | | | Constellation Brands, Inc. Class A | | | 125,517 | |
| | 5,358 | | | Davide Campari-Milano SpA | | | 51,082 | |
| | 8,995 | | | Diageo PLC | | | 348,324 | |
| | 3,572 | | | Heineken Holding NV | | | 345,165 | |
| | 1,015 | | | Heineken NV | | | 102,169 | |
| | 5,599 | | | Kirin Holdings Co. Ltd. | | | 125,455 | |
| | 6,953 | | | Molson Coors Brewing Co. Class B | | | 428,722 | |
| | 4,982 | | | Monster Beverage Corp.* | | | 318,001 | |
| | 6,693 | | | PepsiCo, Inc. | | | 773,979 | |
| | 1,326 | | | Pernod Ricard SA | | | 228,215 | |
| | 355 | | | Remy Cointreau SA | | | 46,240 | |
| | 4,311 | | | Suntory Beverage & Food Ltd. | | | 189,911 | |
| | 13,700 | | | TheCoca-Cola Co. | | | 621,158 | |
| | | | | | | | |
| | | | | | | 5,366,062 | |
| | |
| Biotechnology – 0.4% | |
| | 6,797 | | | AbbVie, Inc. | | | 538,594 | |
| | 259 | | | Alexion Pharmaceuticals, Inc.* | | | 35,050 | |
| | 3,566 | | | Alkermes PLC* | | | 118,641 | |
| | 2,636 | | | Amgen, Inc. | | | 501,051 | |
| | 1,464 | | | Biogen, Inc.* | | | 480,207 | |
| | 484 | | | BioMarin Pharmaceutical, Inc.* | | | 45,138 | |
| | 3,074 | | | Celgene Corp.* | | | 255,511 | |
| | 2,648 | | | CSL Ltd. | | | 362,915 | |
| | 6,245 | | | Gilead Sciences, Inc. | | | 406,050 | |
| | 2,064 | | | Incyte Corp.* | | | 177,979 | |
| | 311 | | | Regeneron Pharmaceuticals, Inc.* | | | 133,960 | |
| | 1,347 | | | Seattle Genetics, Inc.* | | | 100,055 | |
| | 5,078 | | | United Therapeutics Corp.* | | | 641,301 | |
| | 2,438 | | | Vertex Pharmaceuticals, Inc.* | | | 460,172 | |
| | | | | | | | |
| | | | | | | 4,256,624 | |
| | |
| | |
| The accompanying notes are an integral part of these financial statements. | | 9 |
GOLDMAN SACHS GLOBAL MANAGED BETA FUND
Schedule of Investments(continued)
February 28, 2019 (Unaudited)
| | | | | | | | |
Shares | | | Description | | Value | |
|
| Common Stocks – (continued) | |
| Building Products – 0.2% | |
| | 1,354 | | | A.O. Smith Corp. | | $ | 70,313 | |
| | 1,821 | | | Allegion PLC | | | 163,817 | |
| | 2,175 | | | Assa Abloy AB Class B | | | 44,953 | |
| | 4,056 | | | Cie de Saint-Gobain | | | 145,970 | |
| | 472 | | | Daikin Industries Ltd. | | | 51,380 | |
| | 3,802 | | | Fortune Brands Home & Security, Inc. | | | 179,150 | |
| | 107 | | | Geberit AG | | | 42,672 | |
| | 5,509 | | | Johnson Controls International PLC | | | 194,302 | |
| | 1,540 | | | Lennox International, Inc. | | | 377,685 | |
| | 5,980 | | | Masco Corp. | | | 224,609 | |
| | 6,118 | | | Owens Corning | | | 305,472 | |
| | 953 | | | TOTO Ltd. | | | 36,128 | |
| | | | | | | | |
| | | | | | | 1,836,451 | |
| | |
| Capital Markets – 0.8% | |
| | 20,020 | | | 3i Group PLC | | | 251,408 | |
| | 1,143 | | | Ameriprise Financial, Inc. | | | 150,453 | |
| | 3,652 | | | ASX Ltd. | | | 180,921 | |
| | 442 | | | BlackRock, Inc. | | | 195,903 | |
| | 3,140 | | | Brookfield Asset Management, Inc. Class A | | | 141,830 | |
| | 911 | | | Cboe Global Markets, Inc. | | | 87,374 | |
| | 22,999 | | | CI Financial Corp. | | | 325,074 | |
| | 2,305 | | | CME Group, Inc. | | | 419,303 | |
| | 10,150 | | | Credit Suisse Group AG* | | | 125,179 | |
| | 7,467 | | | Daiwa Securities Group, Inc. | | | 37,914 | |
| | 554 | | | Deutsche Boerse AG | | | 69,947 | |
| | 2,745 | | | E*TRADE Financial Corp. | | | 134,478 | |
| | 5,488 | | | Eaton Vance Corp. | | | 229,673 | |
| | 1,871 | | | Franklin Resources, Inc. | | | 61,013 | |
| | 22,870 | | | Hargreaves Lansdown PLC | | | 528,637 | |
| | 5,371 | | | Hong Kong Exchanges & Clearing Ltd. | | | 185,134 | |
| | 1,745 | | | IGM Financial, Inc. | | | 45,589 | |
| | 2,161 | | | Intercontinental Exchange, Inc. | | | 166,721 | |
| | 8,839 | | | Invesco Ltd. | | | 171,035 | |
| | 13,176 | | | Investec PLC | | | 86,148 | |
| | 1,839 | | | Japan Exchange Group, Inc. | | | 32,553 | |
| | 927 | | | Julius Baer Group Ltd.* | | | 40,391 | |
| | 1,334 | | | KKR & Co., Inc. Class A | | | 29,655 | |
| | 2,536 | | | London Stock Exchange Group PLC | | | 151,445 | |
| | 2,504 | | | Macquarie Group Ltd. | | | 228,627 | |
| | 4,446 | | | Moody’s Corp. | | | 769,691 | |
| | 7,473 | | | Morgan Stanley | | | 313,717 | |
| | 4,087 | | | MSCI, Inc. | | | 754,951 | |
| | 2,294 | | | Nasdaq, Inc. | | | 210,062 | |
| | 12,110 | | | Natixis SA | | | 66,492 | |
| | 13,692 | | | Nomura Holdings, Inc. | | | 53,368 | |
| | 684 | | | Northern Trust Corp. | | | 63,749 | |
| | 431 | | | Partners Group Holding AG | | | 311,405 | |
| | 580 | | | Raymond James Financial, Inc. | | | 47,896 | |
| | 3,248 | | | S&P Global, Inc. | | | 650,802 | |
| | 2,933 | | | SBI Holdings, Inc. | | | 62,019 | |
| | 2,308 | | | Schroders PLC | | | 83,776 | |
| | 5,452 | | | SEI Investments Co. | | | 287,593 | |
| | 67,566 | | | Singapore Exchange Ltd. | | | 391,272 | |
| | 2,819 | | | St. James’s Place PLC | | | 36,376 | |
| | |
|
| Common Stocks – (continued) | |
| Capital Markets – (continued) | |
| | 1,512 | | | State Street Corp. | | | 108,667 | |
| | 3,281 | | | T. Rowe Price Group, Inc. | | | 329,511 | |
| | 2,641 | | | TD Ameritrade Holding Corp. | | | 148,768 | |
| | 4,507 | | | The Bank of New York Mellon Corp. | | | 236,527 | |
| | 4,441 | | | The Charles Schwab Corp. | | | 204,330 | |
| | 12,467 | | | UBS Group AG* | | | 158,205 | |
| | | | | | | | |
| | | | | | | 9,365,582 | |
| | |
| Chemicals – 0.5% | |
| | 1,806 | | | Air Liquide SA | | | 225,117 | |
| | 774 | | | Air Products & Chemicals, Inc. | | | 140,233 | |
| | 1,858 | | | Akzo Nobel NV | | | 168,447 | |
| | 5,672 | | | Arkema SA | | | 571,598 | |
| | 4,293 | | | Asahi Kasei Corp. | | | 46,940 | |
| | 1,429 | | | Axalta Coating Systems Ltd.* | | | 38,197 | |
| | 2,615 | | | BASF SE | | | 199,046 | |
| | 480 | | | Celanese Corp. | | | 49,099 | |
| | 3,461 | | | CF Industries Holdings, Inc. | | | 146,054 | |
| | 859 | | | Chr Hansen Holding A/S | | | 87,433 | |
| | 4,580 | | | Covestro AG(a) | | | 260,773 | |
| | 2,033 | | | Croda International PLC | | | 129,706 | |
| | 2,801 | | | DowDuPont, Inc. | | | 149,097 | |
| | 2,652 | | | Eastman Chemical Co. | | | 219,294 | |
| | 1,318 | | | Ecolab, Inc. | | | 222,623 | |
| | 86 | | | EMS-Chemie Holding AG | | | 49,584 | |
| | 1,961 | | | Evonik Industries AG | | | 55,226 | |
| | 368 | | | FMC Corp. | | | 32,936 | |
| | 70 | | | Givaudan SA | | | 174,955 | |
| | 413 | | | International Flavors & Fragrances, Inc. | | | 52,710 | |
| | 7,739 | | | Israel Chemicals Ltd. | | | 43,309 | |
| | 1,291 | | | Koninklijke DSM NV | | | 138,865 | |
| | 1,626 | | | Linde PLC | | | 281,688 | |
| | 2,813 | | | LyondellBasell Industries NV Class A | | | 240,568 | |
| | 563 | | | Methanex Corp. | | | 31,689 | |
| | 11,481 | | | Mitsubishi Chemical Holdings Corp. | | | 84,904 | |
| | 2,131 | | | Mitsui Chemicals, Inc. | | | 52,000 | |
| | 1,061 | | | Nissan Chemical Corp. | | | 53,633 | |
| | 1,285 | | | Novozymes A/S Class B | | | 58,351 | |
| | 1,107 | | | Nutrien Ltd. | | | 60,256 | |
| | 1,047 | | | PPG Industries, Inc. | | | 117,233 | |
| | 1,322 | | | Showa Denko KK | | | 49,473 | |
| | 780 | | | Sika AG | | | 105,361 | |
| | 296 | | | Solvay SA | | | 33,115 | |
| | 1,071 | | | Symrise AG | | | 94,388 | |
| | 2,581 | | | Taiyo Nippon Sanso Corp. | | | 36,594 | |
| | 3,775 | | | Teijin Ltd. | | | 63,393 | |
| | 1,034 | | | The Chemours Co. | | | 39,323 | |
| | 4,031 | | | The Mosaic Co. | | | 126,049 | |
| | 393 | | | The Sherwin-Williams Co. | | | 170,248 | |
| | 5,058 | | | Toray Industries, Inc. | | | 35,142 | |
| | 2,381 | | | Tosoh Corp. | | | 35,204 | |
| | 1,559 | | | Westlake Chemical Corp. | | | 108,927 | |
| | | | | | | | |
| | | | | | | 5,078,781 | |
| | |
| | |
| 10 | | The accompanying notes are an integral part of these financial statements. |
GOLDMAN SACHS GLOBAL MANAGED BETA FUND
| | | | | | | | |
Shares | | | Description | | Value | |
|
| Common Stocks – (continued) | |
| Commercial Services & Supplies – 0.2% | |
| | 21,585 | | | Babcock International Group PLC | | $ | 154,802 | |
| | 7,396 | | | Brambles Ltd. | | | 61,741 | |
| | 937 | | | Cintas Corp. | | | 193,584 | |
| | 3,532 | | | Copart, Inc.* | | | 207,222 | |
| | 2,109 | | | Dai Nippon Printing Co. Ltd. | | | 48,893 | |
| | 1,897 | | | Edenred | | | 84,133 | |
| | 1,662 | | | ISS A/S | | | 51,833 | |
| | 1,840 | | | Republic Services, Inc. | | | 144,311 | |
| | 13,831 | | | Rollins, Inc. | | | 548,538 | |
| | 611 | | | Secom Co. Ltd. | | | 52,851 | |
| | 7,037 | | | Securitas AB Class B | | | 110,262 | |
| | 1,084 | | | Societe BIC SA | | | 102,502 | |
| | 2,580 | | | Toppan Printing Co. Ltd. | | | 41,097 | |
| | 2,100 | | | Waste Connections, Inc. | | | 175,140 | |
| | 2,265 | | | Waste Management, Inc. | | | 229,331 | |
| | | | | | | | |
| | | | | | | 2,206,240 | |
| | |
| Communications Equipment – 0.3% | |
| | 879 | | | Arista Networks, Inc.* | | | 250,735 | |
| | 21,994 | | | Cisco Systems, Inc. | | | 1,138,629 | |
| | 10,542 | | | CommScope Holding Co., Inc.* | | | 245,734 | |
| | 3,226 | | | F5 Networks, Inc.* | | | 542,420 | |
| | 9,881 | | | Juniper Networks, Inc. | | | 267,577 | |
| | 1,992 | | | Motorola Solutions, Inc. | | | 285,095 | |
| | 8,914 | | | Nokia Oyj | | | 53,905 | |
| | 25,135 | | | Telefonaktiebolaget LM Ericsson Class B | | | 229,112 | |
| | | | | | | | |
| | | | | | | 3,013,207 | |
| | |
| Construction & Engineering – 0.2% | |
| | 2,794 | | | ACS Actividades de Construccion y Servicios SA | | | 123,783 | |
| | 1,849 | | | CIMIC Group Ltd. | | | 65,823 | |
| | 3,288 | | | Eiffage SA | | | 320,681 | |
| | 7,578 | | | Ferrovial SA | | | 174,517 | |
| | 556 | | | HOCHTIEF AG | | | 88,135 | |
| | 4,671 | | | Jacobs Engineering Group, Inc. | | | 344,626 | |
| | 5,965 | | | Kajima Corp. | | | 88,396 | |
| | 9,733 | | | Obayashi Corp. | | | 94,871 | |
| | 5,542 | | | Skanska AB Class B | | | 99,862 | |
| | 2,108 | | | Taisei Corp. | | | 99,629 | |
| | 2,101 | | | Vinci SA | | | 200,521 | |
| | 11,214 | | | WSP Global, Inc. | | | 593,870 | |
| | | | | | | | |
| | | | | | | 2,294,714 | |
| | |
| Construction Materials – 0.0% | |
| | 1,961 | | | CRH PLC | | | 62,153 | |
| | 2,814 | | | HeidelbergCement AG | | | 207,054 | |
| | 797 | | | Imerys SA | | | 45,302 | |
| | 769 | | | LafargeHolcim Ltd.* | | | 38,002 | |
| | 1,211 | | | Taiheiyo Cement Corp. | | | 41,437 | |
| | | | | | | | |
| | | | | | | 393,948 | |
| | |
|
| Common Stocks – (continued) | |
| Consumer Finance – 0.1% | |
| | 2,590 | | | AEON Financial Service Co. Ltd. | | | 51,015 | |
| | 13,630 | | | Ally Financial, Inc. | | | 369,237 | |
| | 3,056 | | | American Express Co. | | | 329,253 | |
| | 3,067 | | | Capital One Financial Corp. | | | 256,340 | |
| | 2,986 | | | Credit Saison Co. Ltd. | | | 43,459 | |
| | 2,580 | | | Discover Financial Services | | | 184,754 | |
| | 5,706 | | | Synchrony Financial | | | 186,072 | |
| | | | | | | | |
| | | | | | | 1,420,130 | |
| | |
| Containers & Packaging – 0.1% | |
| | 4,414 | | | Amcor Ltd. | | | 47,101 | |
| | 1,379 | | | Avery Dennison Corp. | | | 148,987 | |
| | 5,058 | | | Ball Corp. | | | 277,077 | |
| | 919 | | | Crown Holdings, Inc.* | | | 49,893 | |
| | 932 | | | International Paper Co. | | | 42,704 | |
| | 373 | | | Packaging Corp. of America | | | 35,655 | |
| | 1,396 | | | Sealed Air Corp. | | | 60,894 | |
| | 1,347 | | | Smurfit Kappa Group PLC | | | 38,161 | |
| | 3,509 | | | Toyo Seikan Group Holdings Ltd. | | | 74,229 | |
| | 4,981 | | | Westrock Co. | | | 186,190 | |
| | | | | | | | |
| | | | | | | 960,891 | |
| | |
| Distributors – 0.0% | |
| | 1,849 | | | Genuine Parts Co. | | | 201,134 | |
| | 6,027 | | | Jardine Cycle & Carriage Ltd. | | | 148,233 | |
| | 6,250 | | | LKQ Corp.* | | | 173,125 | |
| | | | | | | | |
| | | | | | | 522,492 | |
| | |
| Diversified Consumer Services – 0.1% | |
| | 26,491 | | | H&R Block, Inc. | | | 639,758 | |
| | |
| Diversified Financial Services – 0.2% | |
| | 1,894 | | | AXA Equitable Holdings, Inc. | | | 36,213 | |
| | 4,431 | | | Berkshire Hathaway, Inc. Class B* | | | 891,960 | |
| | 1,816 | | | Eurazeo SE | | | 136,449 | |
| | 2,536 | | | EXOR NV | | | 156,016 | |
| | 422 | | | Groupe Bruxelles Lambert SA | | | 40,571 | |
| | 2,453 | | | Industrivarden AB Class C | | | 51,058 | |
| | 2,186 | | | Investor AB | | | 97,551 | |
| | 11,452 | | | Jefferies Financial Group, Inc. | | | 232,132 | |
| | 2,178 | | | Kinnevik AB Class B | | | 55,118 | |
| | 1,234 | | | L E Lundbergforetagen AB Class B | | | 38,038 | |
| | 11,541 | | | Mitsubishi UFJ Lease & Finance Co. Ltd. | | | 58,929 | |
| | 976 | | | Onex Corp. | | | 58,703 | |
| | 5,681 | | | ORIX Corp. | | | 82,253 | |
| | 1,413 | | | Pargesa Holding SA | | | 115,928 | |
| | 19,160 | | | Standard Life Aberdeen PLC | | | 62,719 | |
| | 1,033 | | | Tokyo Century Corp. | | | 46,125 | |
| | 931 | | | Voya Financial, Inc. | | | 47,081 | |
| | 247 | | | Wendel SA | | | 31,138 | |
| | | | | | | | |
| | | | | | | 2,237,982 | |
| | |
| Diversified Telecommunication Services – 0.4% | |
| | 35,040 | | | AT&T, Inc. | | | 1,090,445 | |
| | 1,043 | | | BCE, Inc. | | | 46,382 | |
| | |
| | |
| The accompanying notes are an integral part of these financial statements. | | 11 |
GOLDMAN SACHS GLOBAL MANAGED BETA FUND
Schedule of Investments(continued)
February 28, 2019 (Unaudited)
| | | | | | | | |
Shares | | | Description | | Value | |
|
| Common Stocks – (continued) | |
| Diversified Telecommunication Services – (continued) | |
| | 64,580 | | | Bezeq The Israeli Telecommunication Corp. Ltd. | | $ | 56,619 | |
| | 19,862 | | | BT Group PLC | | | 56,648 | |
| | 21,946 | | | CenturyLink, Inc. | | | 289,468 | |
| | 3,789 | | | Deutsche Telekom AG | | | 62,459 | |
| | 786 | | | Elisa Oyj | | | 32,981 | |
| | 71,358 | | | HKT Trust and HKT Ltd. | | | 111,449 | |
| | 18,073 | | | Koninklijke KPN NV | | | 55,712 | |
| | 5,795 | | | Nippon Telegraph & Telephone Corp. | | | 250,475 | |
| | 4,176 | | | Orange SA | | | 63,829 | |
| | 559,007 | | | PCCW Ltd. | | | 336,142 | |
| | 15,280 | | | Singapore Telecommunications Ltd. | | | 34,103 | |
| | 11,929 | | | Spark New Zealand Ltd. | | | 30,283 | |
| | 153 | | | Swisscom AG | | | 70,783 | |
| | 130,091 | | | Telecom Italia SpA* | | | 79,186 | |
| | 155,044 | | | Telecom Italia SpA RSP | | | 84,381 | |
| | 9,726 | | | Telefonica Deutschland Holding AG | | | 31,891 | |
| | 13,421 | | | Telefonica SA | | | 115,762 | |
| | 5,931 | | | Telenor ASA | | | 115,665 | |
| | 8,289 | | | Telia Co. AB | | | 35,949 | |
| | 1,660 | | | TELUS Corp. | | | 60,297 | |
| | 14,582 | | | TPG Telecom Ltd. | | | 68,865 | |
| | 17,889 | | | Verizon Communications, Inc. | | | 1,018,242 | |
| | | | | | | | |
| | | | | | | 4,198,016 | |
| | |
| Electric Utilities – 0.5% | |
| | 2,445 | | | Alliant Energy Corp. | | | 112,152 | |
| | 2,372 | | | American Electric Power Co., Inc. | | | 192,488 | |
| | 31,146 | | | AusNet Services | | | 38,382 | |
| | 10,668 | | | Chubu Electric Power Co., Inc. | | | 168,023 | |
| | 6,468 | | | CK Infrastructure Holdings Ltd. | | | 53,900 | |
| | 12,262 | | | CLP Holdings Ltd. | | | 145,294 | |
| | 3,048 | | | Duke Energy Corp. | | | 273,284 | |
| | 560 | | | Edison International | | | 33,538 | |
| | 48,462 | | | EDP – Energias de Portugal SA | | | 177,686 | |
| | 5,022 | | | Electricite de France SA | | | 72,911 | |
| | 1,284 | | | Emera, Inc. | | | 45,683 | |
| | 2,051 | | | Endesa SA | | | 51,665 | |
| | 33,990 | | | Enel SpA | | | 205,542 | |
| | 1,260 | | | Entergy Corp. | | | 117,596 | |
| | 2,168 | | | Evergy, Inc. | | | 121,213 | |
| | 2,121 | | | Eversource Energy | | | 148,067 | |
| | 8,427 | | | Exelon Corp. | | | 409,468 | |
| | 5,349 | | | FirstEnergy Corp. | | | 217,972 | |
| | 1,434 | | | Fortis, Inc. | | | 51,707 | |
| | 7,446 | | | Fortum Oyj | | | 165,344 | |
| | 117,130 | | | HK Electric Investments & HK Electric Investments Ltd. | | | 122,058 | |
| | 2,970 | | | Hydro One Ltd.(a) | | | 46,605 | |
| | 22,668 | | | Iberdrola SA | | | 189,650 | |
| | 4,208 | | | Kyushu Electric Power Co., Inc. | | | 50,077 | |
| | 2,078 | | | NextEra Energy, Inc. | | | 390,082 | |
| | 3,334 | | | OGE Energy Corp. | | | 141,762 | |
| | 1,941 | | | Orsted A/S(a) | | | 140,886 | |
| | 974 | | | Pinnacle West Capital Corp. | | | 91,303 | |
| | |
|
| Common Stocks – (continued) | |
| Electric Utilities – (continued) | |
| | 7,233 | | | Power Assets Holdings Ltd. | | $ | 50,195 | |
| | 3,824 | | | PPL Corp. | | | 123,018 | |
| | 4,221 | | | SSE PLC | | | 66,425 | |
| | 13,589 | | | Terna Rete Elettrica Nazionale SpA | | | 84,540 | |
| | 8,166 | | | The Chugoku Electric Power Co., Inc. | | | 106,124 | |
| | 12,562 | | | The Kansai Electric Power Co., Inc. | | | 188,096 | |
| | 4,133 | | | The Southern Co. | | | 205,369 | |
| | 3,373 | | | Tohoku Electric Power Co., Inc. | | | 44,278 | |
| | 34,781 | | | Tokyo Electric Power Co. Holdings, Inc.* | | | 216,987 | |
| | 1,053 | | | Verbund AG | | | 50,624 | |
| | 2,013 | | | Xcel Energy, Inc. | | | 110,433 | |
| | | | | | | | |
| | | | | | | 5,220,427 | |
| | |
| Electrical Equipment – 0.2% | |
| | 3,174 | | | ABB Ltd. | | | 62,493 | |
| | 2,737 | | | Acuity Brands, Inc. | | | 356,138 | |
| | 2,324 | | | AMETEK, Inc. | | | 184,944 | |
| | 2,667 | | | Eaton Corp. PLC | | | 212,747 | |
| | 2,181 | | | Emerson Electric Co. | | | 148,635 | |
| | 945 | | | Legrand SA | | | 62,322 | |
| | 2,843 | | | Prysmian SpA | | | 57,986 | |
| | 1,266 | | | Rockwell Automation, Inc. | | | 226,057 | |
| | 2,027 | | | Schneider Electric SE | | | 157,509 | |
| | 2,704 | | | Sensata Technologies Holding PLC* | | | 137,174 | |
| | 2,045 | | | Siemens Gamesa Renewable Energy SA* | | | 31,273 | |
| | 1,735 | | | Vestas Wind Systems A/S | | | 144,550 | |
| | | | | | | | |
| | | | | | | 1,781,828 | |
| | |
| Electronic Equipment, Instruments & Components – 0.2% | |
| | 1,739 | | | Amphenol Corp. Class A | | | 163,414 | |
| | 1,039 | | | Arrow Electronics, Inc.* | | | 82,808 | |
| | 2,723 | | | CDW Corp. | | | 255,663 | |
| | 4,481 | | | Cognex Corp. | | | 239,285 | |
| | 2,736 | | | Corning, Inc. | | | 95,240 | |
| | 4,679 | | | FLIR Systems, Inc. | | | 240,735 | |
| | 1,398 | | | Hamamatsu Photonics KK | | | 49,355 | |
| | 1,397 | | | Hitachi Ltd. | | | 41,994 | |
| | 2,491 | | | Ingenico Group SA | | | 166,944 | |
| | 594 | | | IPG Photonics Corp.* | | | 92,088 | |
| | 65 | | | Keyence Corp. | | | 38,010 | |
| | 1,669 | | | Keysight Technologies, Inc.* | | | 140,880 | |
| | 294 | | | Murata Manufacturing Co. Ltd. | | | 45,860 | |
| | 2,616 | | | Nippon Electric Glass Co. Ltd. | | | 70,849 | |
| | 3,597 | | | Omron Corp. | | | 155,646 | |
| | 2,000 | | | Shimadzu Corp. | | | 49,437 | |
| | 1,582 | | | TE Connectivity Ltd. | | | 129,866 | |
| | 1,907 | | | Trimble, Inc.* | | | 76,299 | |
| | 3,152 | | | Venture Corp. Ltd. | | | 41,443 | |
| | 1,604 | | | Yaskawa Electric Corp. | | | 45,772 | |
| | 2,373 | | | Yokogawa Electric Corp. | | | 45,790 | |
| | | | | | | | |
| | | | | | | 2,267,378 | |
| | |
| | |
| 12 | | The accompanying notes are an integral part of these financial statements. |
GOLDMAN SACHS GLOBAL MANAGED BETA FUND
| | | | | | | | |
Shares | | | Description | | Value | |
|
| Common Stocks – (continued) | |
| Energy Equipment & Services – 0.0% | |
| | 2,087 | | | Halliburton Co. | | $ | 64,050 | |
| | 9,728 | | | John Wood Group PLC | | | 67,195 | |
| | 6,421 | | | National Oilwell Varco, Inc. | | | 180,687 | |
| | 2,022 | | | Schlumberger Ltd. | | | 89,089 | |
| | | | | | | | |
| | | | | | | 401,021 | |
| | |
| Entertainment – 0.3% | |
| | 1,419 | | | Activision Blizzard, Inc. | | | 59,797 | |
| | 3,878 | | | DeNA Co. Ltd. | | | 59,918 | |
| | 2,645 | | | Electronic Arts, Inc.* | | | 253,338 | |
| | 740 | | | Konami Holdings Corp. | | | 30,605 | |
| | 970 | | | Liberty Media Corp.-Liberty Formula One Class C* | | | 30,186 | |
| | 1,331 | | | Live Nation Entertainment, Inc.* | | | 75,281 | |
| | 1,534 | | | Netflix, Inc.* | | | 549,325 | |
| | 2,746 | | | Nexon Co. Ltd.* | | | 43,788 | |
| | 519 | | | Take-Two Interactive Software, Inc.* | | | 45,288 | |
| | 6,328 | | | The Walt Disney Co. | | | 714,052 | |
| | 834 | | | Toho Co. Ltd. | | | 29,813 | |
| | 5,472 | | | Twenty-First Century Fox, Inc. Class A | | | 275,953 | |
| | 4,138 | | | Twenty-First Century Fox, Inc. Class B | | | 207,562 | |
| | 3,645 | | | Ubisoft Entertainment SA* | | | 262,770 | |
| | 11,616 | | | Viacom, Inc. Class B | | | 339,420 | |
| | 2,451 | | | Vivendi SA | | | 71,575 | |
| | | | | | | | |
| | | | | | | 3,048,671 | |
| | |
| Equity Real Estate Investment Trusts (REITs) – 0.6% | |
| | 694 | | | Alexandria Real Estate Equities, Inc. | | | 94,308 | |
| | 1,616 | | | American Tower Corp. | | | 284,658 | |
| | 22,935 | | | Ascendas Real Estate Investment Trust | | | 47,458 | |
| | 1,140 | | | AvalonBay Communities, Inc. | | | 221,878 | |
| | 811 | | | Boston Properties, Inc. | | | 107,612 | |
| | 3,072 | | | Brookfield Property REIT, Inc. Class A | | | 60,273 | |
| | 2,388 | | | Camden Property Trust | | | 234,239 | |
| | 25,440 | | | CapitaLand Commercial Trust | | | 36,483 | |
| | 54,658 | | | CapitaLand Mall Trust | | | 96,991 | |
| | 890 | | | Covivio | | | 90,097 | |
| | 1,393 | | | Crown Castle International Corp. | | | 165,419 | |
| | 30 | | | Daiwa House REIT Investment Corp. | | | 66,881 | |
| | 4,704 | | | Dexus | | | 40,153 | |
| | 1,599 | | | Digital Realty Trust, Inc. | | | 180,879 | |
| | 3,697 | | | Duke Realty Corp. | | | 109,320 | |
| | 251 | | | Equinix, Inc. | | | 106,298 | |
| | 2,213 | | | Equity Residential | | | 163,076 | |
| | 474 | | | Essex Property Trust, Inc. | | | 132,644 | |
| | 1,600 | | | Extra Space Storage, Inc. | | | 153,504 | |
| | 423 | | | Federal Realty Investment Trust | | | 56,509 | |
| | 453 | | | Gecina SA | | | 67,082 | |
| | 11,584 | | | Goodman Group | | | 105,364 | |
| | 3,121 | | | H&R Real Estate Investment Trust | | | 53,861 | |
| | 3,669 | | | HCP, Inc. | | | 112,895 | |
| | 14,389 | | | Host Hotels & Resorts, Inc. | | | 282,168 | |
| | 751 | | | ICADE | | | 63,939 | |
| | 2,899 | | | Invitation Homes, Inc. | | | 66,677 | |
| | 2,465 | | | Iron Mountain, Inc. | | | 87,310 | |
| | 25 | | | Japan Prime Realty Investment Corp. | | | 98,103 | |
| | |
|
| Common Stocks – (continued) | |
| Equity Real Estate Investment Trusts (REITs) – (continued) | |
| | 15 | | | Japan Real Estate Investment Corp. | | | 86,853 | |
| | 31 | | | Japan Retail Fund Investment Corp. | | | 62,535 | |
| | 3,438 | | | Kimco Realty Corp. | | | 60,474 | |
| | 1,038 | | | Klepierre SA | | | 36,211 | |
| | 7,476 | | | Land Securities Group PLC | | | 89,283 | |
| | 2,034 | | | Liberty Property Trust | | | 96,269 | |
| | 12,382 | | | Link REIT | | | 140,055 | |
| | 1,246 | | | Mid-America Apartment Communities, Inc. | | | 129,061 | |
| | 17,970 | | | Mirvac Group | | | 32,841 | |
| | 2,061 | | | National Retail Properties, Inc. | | | 107,378 | |
| | 32 | | | Nippon Building Fund, Inc. | | | 208,364 | |
| | 30 | | | Nippon Prologis REIT, Inc. | | | 63,806 | |
| | 50 | | | Nomura Real Estate Master Fund, Inc. | | | 68,497 | |
| | 2,477 | | | Prologis, Inc. | | | 173,539 | |
| | 664 | | | Public Storage | | | 140,429 | |
| | 2,111 | | | Realty Income Corp. | | | 145,997 | |
| | 1,076 | | | Regency Centers Corp. | | | 70,209 | |
| | 2,724 | | | RioCan Real Estate Investment Trust | | | 52,039 | |
| | 497 | | | SBA Communications Corp.* | | | 89,738 | |
| | 21,040 | | | Scentre Group | | | 57,869 | |
| | 20,258 | | | Segro PLC | | | 177,669 | |
| | 1,288 | | | Simon Property Group, Inc. | | | 233,334 | |
| | 514 | | | SL Green Realty Corp. | | | 46,630 | |
| | 1,820 | | | SmartCentres Real Estate Investment Trust | | | 46,691 | |
| | 25,680 | | | Suntec Real Estate Investment Trust | | | 36,575 | |
| | 8,722 | | | The British Land Co. PLC | | | 69,806 | |
| | 16,181 | | | The GPT Group | | | 67,198 | |
| | 935 | | | The Macerich Co. | | | 40,766 | |
| | 2,430 | | | UDR, Inc. | | | 107,941 | |
| | 337 | | | Unibail-Rodamco-Westfield* | | | 54,258 | |
| | 59 | | | United Urban Investment Corp. | | | 91,510 | |
| | 2,071 | | | Ventas, Inc. | | | 129,955 | |
| | 11,198 | | | VEREIT, Inc. | | | 89,248 | |
| | 20,856 | | | Vicinity Centres | | | 36,442 | |
| | 857 | | | Vornado Realty Trust | | | 57,685 | |
| | 1,954 | | | Welltower, Inc. | | | 145,202 | |
| | 2,443 | | | Weyerhaeuser Co. | | | 60,806 | |
| | 1,708 | | | WP Carey, Inc. | | | 126,170 | |
| | | | | | | | |
| | | | | | | 6,915,412 | |
| | |
| Food & Staples Retailing – 0.9% | |
| | 5,620 | | | Aeon Co. Ltd. | | | 118,578 | |
| | 1,103 | | | Alimentation Couche-Tard, Inc. Class B | | | 62,168 | |
| | 3,913 | | | Carrefour SA | | | 80,065 | |
| | 4,387 | | | Casino Guichard Perrachon SA | | | 231,985 | |
| | 24,243 | | | Coles Group Ltd.* | | | 194,839 | |
| | 3,233 | | | Colruyt SA | | | 230,593 | |
| | 3,538 | | | Costco Wholesale Corp. | | | 773,902 | |
| | 46,738 | | | Dairy Farm International Holdings Ltd. | | | 418,365 | |
| | 34,265 | | | Empire Co. Ltd. Class A | | | 795,989 | |
| | 6,204 | | | FamilyMart UNY Holdings Co. Ltd. | | | 177,385 | |
| | 3,651 | | | George Weston Ltd. | | | 260,241 | |
| | 1,271 | | | ICA Gruppen AB | | | 48,839 | |
| | |
| | |
| The accompanying notes are an integral part of these financial statements. | | 13 |
GOLDMAN SACHS GLOBAL MANAGED BETA FUND
Schedule of Investments(continued)
February 28, 2019 (Unaudited)
| | | | | | | | |
Shares | | | Description | | Value | |
|
| Common Stocks – (continued) | |
| Food & Staples Retailing – (continued) | |
| | 64,421 | | | J Sainsbury PLC | | $ | 195,754 | |
| | 12,025 | | | Jeronimo Martins SGPS SA | | | 180,993 | |
| | 28,473 | | | Koninklijke Ahold Delhaize NV | | | 733,812 | |
| | 3,424 | | | Lawson, Inc. | | | 207,325 | |
| | 4,057 | | | Loblaw Cos. Ltd. | | | 202,056 | |
| | 6,718 | | | METRO AG | | | 112,729 | |
| | 1,518 | | | Metro, Inc. | | | 57,054 | |
| | 2,273 | | | Seven & i Holdings Co. Ltd. | | | 100,038 | |
| | 6,105 | | | Sundrug Co. Ltd. | | | 187,143 | |
| | 9,425 | | | Sysco Corp. | | | 636,659 | |
| | 119,534 | | | Tesco PLC | | | 358,681 | |
| | 18,103 | | | The Kroger Co. | | | 530,961 | |
| | 1,474 | | | Tsuruha Holdings, Inc. | | | 130,859 | |
| | 8,617 | | | Walgreens Boots Alliance, Inc. | | | 613,444 | |
| | 15,225 | | | Walmart, Inc. | | | 1,507,123 | |
| | 5,133 | | | Welcia Holdings Co. Ltd. | | | 181,948 | |
| | 60,485 | | | Wm Morrison Supermarkets PLC | | | 184,780 | |
| | 26,799 | | | Woolworths Group Ltd. | | | 545,787 | |
| | | | | | | | |
| | | | | | | 10,060,095 | |
| | |
| Food Products – 0.6% | |
| | 10,888 | | | a2 Milk Co. Ltd.* | | | 105,819 | |
| | 7,009 | | | Ajinomoto Co., Inc. | | | 106,176 | |
| | 3,566 | | | Archer-Daniels-Midland Co. | | | 151,555 | |
| | 3,306 | | | Associated British Foods PLC | | | 98,476 | |
| | 160 | | | Barry Callebaut AG | | | 275,224 | |
| | 1,176 | | | Bunge Ltd. | | | 62,422 | |
| | 6,189 | | | Calbee, Inc. | | | 171,818 | |
| | 3,544 | | | Campbell Soup Co. | | | 127,655 | |
| | 21 | | | Chocoladefabriken Lindt & Spruengli AG | | | 271,337 | |
| | 5,554 | | | Conagra Brands, Inc. | | | 129,797 | |
| | 4,859 | | | Danone SA | | | 366,997 | |
| | 4,015 | | | General Mills, Inc. | | | 189,227 | |
| | 702,491 | | | Golden Agri-Resources Ltd. | | | 142,308 | |
| | 3,754 | | | Hormel Foods Corp. | | | 162,773 | |
| | 3,664 | | | Ingredion, Inc. | | | 338,737 | |
| | 1,285 | | | Kellogg Co. | | | 72,294 | |
| | 687 | | | Kerry Group PLC Class A | | | 70,719 | |
| | 3,605 | | | Kikkoman Corp. | | | 179,816 | |
| | 1,641 | | | Lamb Weston Holdings, Inc. | | | 113,738 | |
| | 1,014 | | | McCormick & Co., Inc. | | | 137,884 | |
| | 1,950 | | | MEIJI Holdings Co. Ltd. | | | 154,607 | |
| | 4,486 | | | Mondelez International, Inc. Class A | | | 211,560 | |
| | 8,224 | | | Mowi ASA | | | 189,786 | |
| | 11,031 | | | Nestle SA | | | 997,797 | |
| | 940 | | | NH Foods Ltd. | | | 34,324 | |
| | 3,302 | | | Nisshin Seifun Group, Inc. | | | 70,958 | |
| | 638 | | | Nissin Foods Holdings Co. Ltd. | | | 44,381 | |
| | 4,833 | | | Orkla ASA | | | 38,095 | |
| | 3,979 | | | Saputo, Inc. | | | 129,685 | |
| | 3,654 | | | The Hershey Co. | | | 404,425 | |
| | 3,454 | | | The J.M. Smucker Co. | | | 365,813 | |
| | 1,004 | | | The Kraft Heinz Co. | | | 33,323 | |
| | 1,029 | | | Toyo Suisan Kaisha Ltd. | | | 38,231 | |
| | 8,238 | | | Tyson Foods, Inc. Class A | | | 507,955 | |
| | |
|
| Common Stocks – (continued) | |
| Food Products – (continued) | |
| | 160,457 | | | WH Group Ltd.(a) | | | 142,286 | |
| | 16,781 | | | Wilmar International Ltd. | | | 39,634 | |
| | 743 | | | Yakult Honsha Co. Ltd. | | | 49,930 | |
| | 7,742 | | | Yamazaki Baking Co. Ltd. | | | 132,865 | |
| | | | | | | | |
| | | | | | | 6,860,427 | |
| | |
| Gas Utilities – 0.1% | |
| | 4,326 | | | APA Group | | | 30,728 | |
| | 1,107 | | | Atmos Energy Corp. | | | 109,427 | |
| | 110,481 | | | Hong Kong & China Gas Co. Ltd. | | | 255,736 | |
| | 4,595 | | | Naturgy Energy Group SA | | | 124,707 | |
| | 6,687 | | | Osaka Gas Co. Ltd. | | | 137,233 | |
| | 1,369 | | | Toho Gas Co. Ltd. | | | 62,347 | |
| | 1,411 | | | Tokyo Gas Co. Ltd. | | | 38,897 | |
| | 10,912 | | | UGI Corp. | | | 599,069 | |
| | | | | | | | |
| | | | | | | 1,358,144 | |
| | |
| Health Care Equipment & Supplies – 0.7% | |
| | 6,903 | | | Abbott Laboratories | | | 535,811 | |
| | 1,303 | | | ABIOMED, Inc.* | | | 435,854 | |
| | 1,671 | | | Align Technology, Inc.* | | | 432,739 | |
| | 2,702 | | | Baxter International, Inc. | | | 201,921 | |
| | 1,128 | | | Becton Dickinson & Co. | | | 280,635 | |
| | 1,621 | | | BioMerieux | | | 133,580 | |
| | 5,990 | | | Boston Scientific Corp.* | | | 240,319 | |
| | 3,284 | | | Cochlear Ltd. | | | 397,362 | |
| | 2,214 | | | Coloplast A/S Class B | | | 220,798 | |
| | 45,135 | | | ConvaTec Group PLC(a) | | | 79,387 | |
| | 2,559 | | | Danaher Corp. | | | 325,044 | |
| | 884 | | | DENTSPLY SIRONA, Inc. | | | 36,916 | |
| | 1,512 | | | DexCom, Inc.* | | | 210,667 | |
| | 2,378 | | | Edwards Lifesciences Corp.* | | | 402,572 | |
| | 10,193 | | | Fisher & Paykel Healthcare Corp. Ltd. | | | 101,987 | |
| | 1,835 | | | Hologic, Inc.* | | | 86,520 | |
| | 5,460 | | | Hoya Corp. | | | 333,810 | |
| | 2,513 | | | IDEXX Laboratories, Inc.* | | | 530,318 | |
| | 597 | | | Intuitive Surgical, Inc.* | | | 326,923 | |
| | 4,484 | | | Koninklijke Philips NV | | | 178,428 | |
| | 4,886 | | | Medtronic PLC | | | 442,183 | |
| | 5,911 | | | Olympus Corp. | | | 262,490 | |
| | 1,513 | | | ResMed, Inc. | | | 154,977 | |
| | 986 | | | Siemens Healthineers AG(a) | | | 39,901 | |
| | 16,942 | | | Smith & Nephew PLC | | | 321,910 | |
| | 658 | | | Sonova Holding AG | | | 122,775 | |
| | 277 | | | Straumann Holding AG | | | 215,702 | |
| | 1,628 | | | Stryker Corp. | | | 306,894 | |
| | 2,976 | | | Sysmex Corp. | | | 179,966 | |
| | 354 | | | Teleflex, Inc. | | | 102,603 | |
| | 2,056 | | | Terumo Corp. | | | 126,292 | |
| | 404 | | | The Cooper Cos., Inc. | | | 115,540 | |
| | 1,393 | | | Varian Medical Systems, Inc.* | | | 187,164 | |
| | 2,144 | | | William Demant Holding A/S* | | | 64,355 | |
| | 1,314 | | | Zimmer Biomet Holdings, Inc. | | | 163,094 | |
| | | | | | | | |
| | | | | | | 8,297,437 | |
| | |
| | |
| 14 | | The accompanying notes are an integral part of these financial statements. |
GOLDMAN SACHS GLOBAL MANAGED BETA FUND
| | | | | | | | |
Shares | | | Description | | Value | |
|
| Common Stocks – (continued) | |
| Health Care Providers & Services – 0.6% | |
| | 6,783 | | | Alfresa Holdings Corp. | | $ | 196,733 | |
| | 2,322 | | | AmerisourceBergen Corp. | | | 193,423 | |
| | 1,540 | | | Anthem, Inc. | | | 463,124 | |
| | 4,626 | | | Cardinal Health, Inc. | | | 251,377 | |
| | 5,248 | | | Centene Corp.* | | | 319,551 | |
| | 2,923 | | | Cigna Corp. | | | 509,888 | |
| | 9,906 | | | CVS Health Corp. | | | 572,864 | |
| | 2,262 | | | DaVita, Inc.* | | | 128,708 | |
| | 2,214 | | | Fresenius Medical Care AG & Co. KGaA | | | 173,090 | |
| | 1,695 | | | Fresenius SE & Co. KGaA | | | 95,228 | |
| | 1,982 | | | HCA Healthcare, Inc. | | | 275,577 | |
| | 3,051 | | | Henry Schein, Inc.* | | | 180,924 | |
| | 1,403 | | | Humana, Inc. | | | 399,911 | |
| | 1,455 | | | Laboratory Corp. of America Holdings* | | | 215,689 | |
| | 2,874 | | | McKesson Corp. | | | 365,458 | |
| | 10,047 | | | Medipal Holdings Corp. | | | 234,504 | |
| | 2,304 | | | Quest Diagnostics, Inc. | | | 199,411 | |
| | 10,679 | | | Ryman Healthcare Ltd. | | | 79,850 | |
| | 3,017 | | | Sonic Healthcare Ltd. | | | 51,683 | |
| | 4,549 | | | Suzuken Co. Ltd. | | | 249,116 | |
| | 6,020 | | | UnitedHealth Group, Inc. | | | 1,458,164 | |
| | 1,348 | | | Universal Health Services, Inc. Class B | | | 187,143 | |
| | 347 | | | WellCare Health Plans, Inc.* | | | 87,992 | |
| | | | | | | | |
| | | | | | | 6,889,408 | |
| | |
| Health Care Technology – 0.0% | |
| | 4,968 | | | Cerner Corp.* | | | 277,960 | |
| | 5,592 | | | M3, Inc. | | | 92,502 | |
| | 969 | | | Veeva Systems, Inc. Class A* | | | 114,255 | |
| | | | | | | | |
| | | | | | | 484,717 | |
| | |
| Hotels, Restaurants & Leisure – 0.5% | |
| | 1,454 | | | Accor SA | | | 61,377 | |
| | 10,612 | | | Aramark | | | 321,544 | |
| | 5,685 | | | Aristocrat Leisure Ltd. | | | 99,305 | |
| | 2,262 | | | Carnival Corp. | | | 130,653 | |
| | 1,276 | | | Carnival PLC | | | 71,544 | |
| | 90 | | | Chipotle Mexican Grill, Inc.* | | | 54,678 | |
| | 5,309 | | | Compass Group PLC | | | 117,249 | |
| | 5,388 | | | Crown Resorts Ltd. | | | 43,851 | |
| | 1,214 | | | Darden Restaurants, Inc. | | | 136,102 | |
| | 2,034 | | | Domino’s Pizza, Inc. | | | 510,412 | |
| | 10,360 | | | Flight Centre Travel Group Ltd. | | | 336,547 | |
| | 1,891 | | | Hilton Worldwide Holdings, Inc. | | | 157,142 | |
| | 5,507 | | | InterContinental Hotels Group PLC | | | 329,289 | |
| | 956 | | | Las Vegas Sands Corp. | | | 58,727 | |
| | 868 | | | Marriott International, Inc. Class A | | | 108,734 | |
| | 3,198 | | | McDonald’s Corp. | | | 587,920 | |
| | 2,051 | | | McDonald’s Holdings Co. Japan Ltd. | | | 91,890 | |
| | 1,285 | | | MGM Resorts International | | | 34,374 | |
| | 4,464 | | | Norwegian Cruise Line Holdings Ltd.* | | | 247,886 | |
| | 1,436 | | | Oriental Land Co. Ltd. | | | 157,913 | |
| | 486 | | | Restaurant Brands International, Inc. | | | 30,734 | |
| | 430 | | | Royal Caribbean Cruises Ltd. | | | 50,947 | |
| | 10,597 | | | Sands China Ltd. | | | 52,857 | |
| | |
|
| Common Stocks – (continued) | |
| Hotels, Restaurants & Leisure – (continued) | |
| | 29,593 | | | Shangri-La Asia Ltd. | | | 42,031 | |
| | 334,103 | | | SJM Holdings Ltd. | | | 376,313 | |
| | 6,726 | | | Starbucks Corp. | | | 472,569 | |
| | 11,539 | | | Tabcorp Holdings Ltd. | | | 38,681 | |
| | 262 | | | Vail Resorts, Inc. | | | 54,598 | |
| | 2,525 | | | Whitbread PLC | | | 162,579 | |
| | 49,807 | | | Wynn Macau Ltd. | | | 123,049 | |
| | 7,282 | | | Yum! Brands, Inc. | | | 688,149 | |
| | | | | | | | |
| | | | | | | 5,749,644 | |
| | |
| Household Durables – 0.2% | |
| | 28,605 | | | Barratt Developments PLC | | | 226,991 | |
| | 8,243 | | | Berkeley Group Holdings PLC | | | 431,747 | |
| | 1,704 | | | Garmin Ltd. | | | 143,085 | |
| | 2,023 | | | Iida Group Holdings Co. Ltd. | | | 36,964 | |
| | 970 | | | Leggett & Platt, Inc. | | | 44,057 | |
| | 1,853 | | | Lennar Corp. Class A | | | 88,907 | |
| | 286 | | | Mohawk Industries, Inc.* | | | 38,930 | |
| | 4,909 | | | Nikon Corp. | | | 74,424 | |
| | 71 | | | NVR, Inc.* | | | 186,020 | |
| | 7,810 | | | Panasonic Corp. | | | 72,178 | |
| | 1,408 | | | Persimmon PLC | | | 45,477 | |
| | 6,697 | | | PulteGroup, Inc. | | | 180,819 | |
| | 493 | | | Rinnai Corp. | | | 33,165 | |
| | 1,885 | | | SEB SA | | | 324,250 | |
| | 2,616 | | | Sekisui Chemical Co. Ltd. | | | 41,156 | |
| | 4,211 | | | Sekisui House Ltd. | | | 63,400 | |
| | 6,153 | | | Sony Corp. | | | 295,439 | |
| | 67,647 | | | Taylor Wimpey PLC | | | 162,630 | |
| | 35,310 | | | Techtronic Industries Co. Ltd. | | | 235,880 | |
| | | | | | | | |
| | | | | | | 2,725,519 | |
| | |
| Household Products – 0.3% | |
| | 1,808 | | | Church & Dwight Co., Inc. | | | 118,966 | |
| | 10,391 | | | Colgate-Palmolive Co. | | | 684,455 | |
| | 1,146 | | | Essity AB Class B | | | 31,980 | |
| | 1,093 | | | Henkel AG & Co. KGaA | | | 105,888 | |
| | 2,637 | | | Kimberly-Clark Corp. | | | 308,081 | |
| | 15,875 | | | Lion Corp. | | | 325,655 | |
| | 1,410 | | | Pigeon Corp. | | | 57,569 | |
| | 1,157 | | | Reckitt Benckiser Group PLC | | | 88,365 | |
| | 2,647 | | | The Clorox Co. | | | 418,306 | |
| | 7,955 | | | The Procter & Gamble Co. | | | 783,965 | |
| | 3,231 | | | Unicharm Corp. | | | 102,918 | |
| | | | | | | | |
| | | | | | | 3,026,148 | |
| | |
| Independent Power and Renewable Electricity Producers – 0.1% | |
| | 9,888 | | | AES Corp. | | | 170,370 | |
| | 3,886 | | | Electric Power Development Co. Ltd. | | | 97,249 | |
| | 33,845 | | | Meridian Energy Ltd. | | | 85,011 | |
| | 10,977 | | | NRG Energy, Inc. | | | 457,522 | |
| | 29,053 | | | Vistra Energy Corp.* | | | 756,540 | |
| | | | | | | | |
| | | | | | | 1,566,692 | |
| | |
| | |
| The accompanying notes are an integral part of these financial statements. | | 15 |
GOLDMAN SACHS GLOBAL MANAGED BETA FUND
Schedule of Investments(continued)
February 28, 2019 (Unaudited)
| | | | | | | | |
Shares | | | Description | | Value | |
|
| Common Stocks – (continued) | |
| Industrial Conglomerates – 0.2% | |
| | 2,909 | | | 3M Co. | | $ | 603,297 | |
| | 22,290 | | | CK Hutchison Holdings Ltd. | | | 237,167 | |
| | 514 | | | DCC PLC | | | 44,473 | |
| | 6,174 | | | General Electric Co. | | | 64,148 | |
| | 2,210 | | | Honeywell International, Inc. | | | 340,495 | |
| | 1,508 | | | Jardine Matheson Holdings Ltd. | | | 103,279 | |
| | 2,644 | | | Keihan Holdings Co. Ltd. | | | 109,516 | |
| | 30,405 | | | NWS Holdings Ltd. | | | 73,669 | |
| | 618 | | | Roper Technologies, Inc. | | | 200,016 | |
| | 1,760 | | | Siemens AG | | | 192,268 | |
| | 1,594 | | | Smiths Group PLC | | | 30,274 | |
| | | | | | | | |
| | | | | | | 1,998,602 | |
| | |
| Insurance – 1.1% | |
| | 19,238 | | | Admiral Group PLC | | | 557,062 | |
| | 34,734 | | | Aegon NV | | | 186,369 | |
| | 6,416 | | | Aflac, Inc. | | | 315,282 | |
| | 4,180 | | | Ageas | | | 206,003 | |
| | 46,242 | | | AIA Group Ltd. | | | 461,510 | |
| | 125 | | | Alleghany Corp. | | | 80,370 | |
| | 2,500 | | | Allianz SE | | | 556,492 | |
| | 908 | | | American Financial Group, Inc. | | | 90,491 | |
| | 1,934 | | | American International Group, Inc. | | | 83,549 | |
| | 1,310 | | | Aon PLC | | | 224,704 | |
| | 2,826 | | | Arch Capital Group Ltd.* | | | 92,325 | |
| | 1,700 | | | Arthur J. Gallagher & Co. | | | 136,476 | |
| | 14,843 | | | Assicurazioni Generali SpA | | | 264,661 | |
| | 1,242 | | | Assurant, Inc. | | | 127,914 | |
| | 2,623 | | | Athene Holding Ltd. Class A* | | | 116,855 | |
| | 19,413 | | | Aviva PLC | | | 108,821 | |
| | 4,282 | | | AXA SA | | | 108,425 | |
| | 696 | | | Baloise Holding AG | | | 113,484 | |
| | 3,410 | | | Brighthouse Financial, Inc.* | | | 132,035 | |
| | 1,539 | | | Chubb Ltd. | | | 206,072 | |
| | 922 | | | Cincinnati Financial Corp. | | | 80,048 | |
| | 4,820 | | | CNP Assurances | | | 111,357 | |
| | 7,890 | | | Dai-ichi Life Holdings, Inc. | | | 120,228 | |
| | 22,196 | | | Direct Line Insurance Group PLC | | | 104,931 | |
| | 269 | | | Everest Re Group Ltd. | | | 60,824 | |
| | 154 | | | Fairfax Financial Holdings Ltd. | | | 76,246 | |
| | 3,780 | | | Fidelity National Financial, Inc. | | | 132,640 | |
| | 2,993 | | | Gjensidige Forsikring ASA | | | 53,648 | |
| | 4,402 | | | Great-West Lifeco, Inc. | | | 101,223 | |
| | 694 | | | Hannover Rueck SE | | | 103,411 | |
| | 5,114 | | | IA Financial Corp., Inc. | | | 196,212 | |
| | 9,359 | | | Insurance Australia Group Ltd. | | | 48,821 | |
| | 995 | | | Intact Financial Corp. | | | 83,172 | |
| | 14,741 | | | Japan Post Holdings Co. Ltd. | | | 179,191 | |
| | 83,069 | | | Legal & General Group PLC | | | 309,110 | |
| | 2,269 | | | Lincoln National Corp. | | | 141,858 | |
| | 2,455 | | | Loews Corp. | | | 116,907 | |
| | 7,360 | | | Manulife Financial Corp. | | | 124,386 | |
| | 19,604 | | | Mapfre SA | | | 55,349 | |
| | 135 | | | Markel Corp.* | | | 135,659 | |
| | 3,940 | | | Marsh & McLennan Cos., Inc. | | | 366,499 | |
| | 48,741 | | | Medibank Pvt. Ltd. | | | 98,241 | |
| | |
|
| Common Stocks – (continued) | |
| Insurance – (continued) | |
| | 6,119 | | | MetLife, Inc. | | | 276,518 | |
| | 2,066 | | | MS&AD Insurance Group Holdings, Inc. | | | 62,195 | |
| | 656 | | | Muenchener Rueckversicherungs-Gesellschaft AG in Muenchen | | | 154,497 | |
| | 6,427 | | | NN Group NV | | | 279,739 | |
| | 16,715 | | | Poste Italiane SpA(a) | | | 150,694 | |
| | 9,746 | | | Power Corp. of Canada | | | 208,036 | |
| | 7,773 | | | Power Financial Corp. | | | 173,481 | |
| | 2,685 | | | Principal Financial Group, Inc. | | | 141,338 | |
| | 2,427 | | | Prudential Financial, Inc. | | | 232,628 | |
| | 9,352 | | | Prudential PLC | | | 197,173 | |
| | 3,913 | | | QBE Insurance Group Ltd. | | | 34,352 | |
| | 1,216 | | | Reinsurance Group of America, Inc. | | | 175,700 | |
| | 429 | | | RenaissanceRe Holdings Ltd. | | | 63,084 | |
| | 8,607 | | | RSA Insurance Group PLC | | | 58,279 | |
| | 1,264 | | | Sampo Oyj Class A | | | 60,811 | |
| | 970 | | | SCOR SE | | | 43,641 | |
| | 878 | | | Sompo Holdings, Inc. | | | 32,850 | |
| | 2,333 | | | Sony Financial Holdings, Inc. | | | 44,296 | |
| | 4,946 | | | Sun Life Financial, Inc. | | | 187,248 | |
| | 12,316 | | | Suncorp Group Ltd. | | | 118,454 | |
| | 352 | | | Swiss Life Holding AG* | | | 153,173 | |
| | 1,643 | | | Swiss Re AG | | | 162,411 | |
| | 2,881 | | | T&D Holdings, Inc. | | | 34,810 | |
| | 2,802 | | | The Allstate Corp. | | | 264,453 | |
| | 1,868 | | | The Hartford Financial Services Group, Inc. | | | 92,204 | |
| | 5,303 | | | The Progressive Corp. | | | 386,589 | |
| | 1,664 | | | The Travelers Cos., Inc. | | | 221,162 | |
| | 3,894 | | | Tokio Marine Holdings, Inc. | | | 190,337 | |
| | 2,955 | | | Torchmark Corp. | | | 243,965 | |
| | 3,691 | | | Tryg A/S | | | 100,605 | |
| | 3,571 | | | Unum Group | | | 133,413 | |
| | 1,820 | | | W.R. Berkley Corp. | | | 152,261 | |
| | 631 | | | Willis Towers Watson PLC | | | 108,545 | |
| | 647 | | | Zurich Insurance Group AG | | | 213,437 | |
| | | | | | | | |
| | | | | | | 12,121,240 | |
| | |
| Interactive Media & Services – 0.7% | |
| | 1,635 | | | Alphabet, Inc. Class A* | | | 1,841,909 | |
| | 1,562 | | | Alphabet, Inc. Class C* | | | 1,749,315 | |
| | 81,327 | | | Auto Trader Group PLC(a) | | | 513,413 | |
| | 14,289 | | | Facebook, Inc. Class A* | | | 2,306,959 | |
| | 22,788 | | | Kakaku.com, Inc. | | | 438,599 | |
| | 3,963 | | | LINE Corp.* | | | 144,973 | |
| | 1,893 | | | REA Group Ltd. | | | 109,823 | |
| | 6,740 | | | TripAdvisor, Inc.* | | | 358,366 | |
| | 4,165 | | | Twitter, Inc.* | | | 128,199 | |
| | 951 | | | Zillow Group, Inc. Class C* | | | 39,752 | |
| | | | | | | | |
| | | | | | | 7,631,308 | |
| | |
| Internet & Direct Marketing Retail – 0.5% | |
| | 2,396 | | | Amazon.com, Inc.* | | | 3,929,033 | |
| | 269 | | | Booking Holdings, Inc.* | | | 456,504 | |
| | 8,191 | | | eBay, Inc. | | | 304,295 | |
| | |
| | |
| 16 | | The accompanying notes are an integral part of these financial statements. |
GOLDMAN SACHS GLOBAL MANAGED BETA FUND
| | | | | | | | |
Shares | | | Description | | Value | |
|
| Common Stocks – (continued) | |
| Internet & Direct Marketing Retail – (continued) | |
| | 1,715 | | | Expedia Group, Inc. | | $ | 211,477 | |
| | 411 | | | MercadoLibre, Inc.* | | | 188,563 | |
| | 18,784 | | | Qurate Retail, Inc.* | | | 338,300 | |
| | 4,475 | | | Rakuten, Inc. | | | 35,270 | |
| | 1,784 | | | Wayfair, Inc. Class A* | | | 295,573 | |
| | 4,809 | | | Zalando SE*(a) | | | 177,376 | |
| | 10,019 | | | ZOZO, Inc. | | | 189,013 | |
| | | | | | | | |
| | | | | | | 6,125,404 | |
| | |
| IT Services – 1.1% | |
| | 5,791 | | | Accenture PLC Class A | | | 934,552 | |
| | 2,743 | | | Akamai Technologies, Inc.* | | | 191,077 | |
| | 2,024 | | | Alliance Data Systems Corp. | | | 350,152 | |
| | 3,990 | | | Amadeus IT Group SA | | | 300,137 | |
| | 5,812 | | | Atos SE | | | 557,604 | |
| | 2,186 | | | Automatic Data Processing, Inc. | | | 334,524 | |
| | 2,376 | | | Broadridge Financial Solutions, Inc. | | | 240,570 | |
| | 1,757 | | | Capgemini SE | | | 210,011 | |
| | 5,296 | | | CGI, Inc.* | | | 355,079 | |
| | 5,068 | | | Cognizant Technology Solutions Corp. Class A | | | 359,727 | |
| | 4,687 | | | Computershare Ltd. | | | 57,336 | |
| | 9,574 | | | DXC Technology Co. | | | 630,544 | |
| | 3,671 | | | Fidelity National Information Services, Inc. | | | 397,019 | |
| | 3,380 | | | Fiserv, Inc.* | | | 286,252 | |
| | 819 | | | FleetCor Technologies, Inc.* | | | 191,056 | |
| | 1,528 | | | Fujitsu Ltd. | | | 103,122 | |
| | 787 | | | Gartner, Inc.* | | | 111,990 | |
| | 1,520 | | | Global Payments, Inc. | | | 198,178 | |
| | 2,155 | | | GoDaddy, Inc. Class A* | | | 160,871 | |
| | 5,081 | | | International Business Machines Corp. | | | 701,838 | |
| | 1,839 | | | Jack Henry & Associates, Inc. | | | 243,906 | |
| | 8,326 | | | Leidos Holdings, Inc. | | | 537,776 | |
| | 4,814 | | | Mastercard, Inc. Class A | | | 1,082,043 | |
| | 9,143 | | | NTT Data Corp. | | | 100,137 | |
| | 376 | | | Obic Co. Ltd. | | | 36,027 | |
| | 1,128 | | | Otsuka Corp. | | | 40,612 | |
| | 2,892 | | | Paychex, Inc. | | | 222,742 | |
| | 4,399 | | | PayPal Holdings, Inc.* | | | 431,410 | |
| | 5,952 | | | Sabre Corp. | | | 133,503 | |
| | 514 | | | Shopify, Inc. Class A* | | | 97,367 | |
| | 2,257 | | | Square, Inc. Class A* | | | 183,359 | |
| | 18,926 | | | The Western Union Co. | | | 338,208 | |
| | 3,244 | | | Total System Services, Inc. | | | 306,234 | |
| | 2,768 | | | VeriSign, Inc.* | | | 492,815 | |
| | 7,678 | | | Visa, Inc. Class A | | | 1,137,265 | |
| | 934 | | | Wirecard AG | | | 127,749 | |
| | 1,260 | | | Wix.com Ltd.* | | | 137,655 | |
| | 2,214 | | | Worldpay, Inc. Class A* | | | 212,101 | |
| | | | | | | | |
| | | | | | | 12,532,548 | |
| | |
| Leisure Products – 0.1% | |
| | 2,504 | | | Bandai Namco Holdings, Inc. | | | 106,635 | |
| | 3,365 | | | Hasbro, Inc. | | | 285,688 | |
| | 2,342 | | | Mattel, Inc.* | | | 33,772 | |
| | |
|
| Common Stocks – (continued) | |
| Leisure Products – (continued) | |
| | 1,976 | | | Polaris Industries, Inc. | | | 168,414 | |
| | 1,332 | | | Sankyo Co. Ltd. | | | 49,121 | |
| | 208 | | | Shimano, Inc. | | | 31,638 | |
| | 1,300 | | | Yamaha Corp. | | | 64,114 | |
| | | | | | | | |
| | | | | | | 739,382 | |
| | |
| Life Sciences Tools & Services – 0.2% | |
| | 1,994 | | | Agilent Technologies, Inc. | | | 158,403 | |
| | 480 | | | Illumina, Inc.* | | | 150,130 | |
| | 2,395 | | | IQVIA Holdings, Inc.* | | | 335,540 | |
| | 284 | | | Lonza Group AG* | | | 78,870 | |
| | 798 | | | Mettler-Toledo International, Inc.* | | | 543,366 | |
| | 1,225 | | | QIAGEN NV* | | | 46,851 | |
| | 284 | | | Sartorius Stedim Biotech | | | 33,406 | |
| | 1,873 | | | Thermo Fisher Scientific, Inc. | | | 486,175 | |
| | 597 | | | Waters Corp.* | | | 144,605 | |
| | | | | | | | |
| | | | | | | 1,977,346 | |
| | |
| Machinery – 0.3% | |
| | 1,640 | | | Alfa Laval AB | | | 35,839 | |
| | 2,896 | | | Alstom SA | | | 125,840 | |
| | 2,910 | | | ANDRITZ AG | | | 145,253 | |
| | 4,286 | | | Atlas Copco AB Class A | | | 116,163 | |
| | 3,592 | | | Atlas Copco AB Class B | | | 90,138 | |
| | 1,094 | | | Caterpillar, Inc. | | | 150,250 | |
| | 18,816 | | | CNH Industrial NV | | | 203,572 | |
| | 1,103 | | | Cummins, Inc. | | | 169,961 | |
| | 423 | | | Deere & Co. | | | 69,389 | |
| | 779 | | | Dover Corp. | | | 70,523 | |
| | 1,909 | | | Fortive Corp. | | | 155,717 | |
| | 1,040 | | | IDEX Corp. | | | 149,864 | |
| | 1,244 | | | Illinois Tool Works, Inc. | | | 179,236 | |
| | 2,021 | | | Ingersoll-Rand PLC | | | 213,337 | |
| | 727 | | | Kone Oyj Class B | | | 35,520 | |
| | 7,195 | | | MISUMI Group, Inc. | | | 175,019 | |
| | 3,503 | | | Mitsubishi Heavy Industries Ltd. | | | 142,854 | |
| | 1,979 | | | NGK Insulators Ltd. | | | 30,247 | |
| | 687 | | | PACCAR, Inc. | | | 46,579 | |
| | 1,212 | | | Parker-Hannifin Corp. | | | 213,506 | |
| | 4,941 | | | Pentair PLC | | | 210,190 | |
| | 3,231 | | | Sandvik AB | | | 52,960 | |
| | 442 | | | Schindler Holding AG | | | 98,947 | |
| | 1,875 | | | SKF AB Class B | | | 31,491 | |
| | 1,565 | | | Snap-on, Inc. | | | 250,400 | |
| | 487 | | | Stanley Black & Decker, Inc. | | | 64,493 | |
| | 1,571 | | | Sumitomo Heavy Industries Ltd. | | | 53,977 | |
| | 480 | | | The Middleby Corp.* | | | 58,843 | |
| | 5,196 | | | Volvo AB Class B | | | 76,421 | |
| | 1,291 | | | WABCO Holdings, Inc.* | | | 177,551 | |
| | 33 | | | Wabtec Corp. | | | 2,429 | |
| | 1,459 | | | Xylem, Inc. | | | 110,227 | |
| | | | | | | | |
| | | | | | | 3,706,736 | |
| | |
| Marine – 0.0% | |
| | 2,724 | | | Kuehne & Nagel International AG | | | 354,868 | |
| | |
| | |
| The accompanying notes are an integral part of these financial statements. | | 17 |
GOLDMAN SACHS GLOBAL MANAGED BETA FUND
Schedule of Investments(continued)
February 28, 2019 (Unaudited)
| | | | | | | | |
Shares | | | Description | | Value | |
|
| Common Stocks – (continued) | |
| Media – 0.4% | |
| | 1,350 | | | Axel Springer SE | | $ | 77,078 | |
| | 1,090 | | | CBS Corp. Class B | | | 54,729 | |
| | 500 | | | Charter Communications, Inc. Class A* | | | 172,455 | |
| | 20,462 | | | Comcast Corp. Class A | | | 791,266 | |
| | 5,293 | | | CyberAgent, Inc. | | | 164,703 | |
| | 4,284 | | | Discovery, Inc. Class A* | | | 123,808 | |
| | 5,035 | | | Discovery, Inc. Class C* | | | 137,204 | |
| | 1,468 | | | Eutelsat Communications SA | | | 28,965 | |
| | 3,884 | | | Hakuhodo DY Holdings, Inc. | | | 59,699 | |
| | 5,358 | | | Informa PLC | | | 50,106 | |
| | 391 | | | Liberty Broadband Corp. Class C* | | | 34,994 | |
| | 826 | | | Liberty Global PLC Class A* | | | 21,765 | |
| | 1,092 | | | Liberty Global PLC Class C* | | | 27,726 | |
| | 7,467 | | | Liberty Media Corp.-Liberty SiriusXM Class A* | | | 305,400 | |
| | 6,969 | | | Liberty Media Corp.-Liberty SiriusXM Class C* | | | 287,192 | |
| | 16,355 | | | News Corp. Class A | | | 212,942 | |
| | 2,422 | | | Omnicom Group, Inc. | | | 183,345 | |
| | 19,412 | | | Pearson PLC | | | 218,866 | |
| | 1,658 | | | Publicis Groupe SA | | | 91,777 | |
| | 2,760 | | | RTL Group SA | | | 155,538 | |
| | 10,443 | | | Schibsted ASA Class B | | | 386,884 | |
| | 1,481 | | | SES SA | | | 29,750 | |
| | 1,717 | | | Shaw Communications, Inc. Class B | | | 35,411 | |
| | 25,317 | | | Sirius XM Holdings, Inc. | | | 150,130 | |
| | 177 | | | Telenet Group Holding NV | | | 7,978 | |
| | 2,606 | | | The Interpublic Group of Cos., Inc. | | | 60,016 | |
| | 8,405 | | | WPP PLC | | | 92,141 | |
| | | | | | | | |
| | | | | | | 3,961,868 | |
| | |
| Metals & Mining – 0.3% | |
| | 44,809 | | | Alumina Ltd. | | | 80,888 | |
| | 16,583 | | | Anglo American PLC | | | 439,809 | |
| | 3,920 | | | Antofagasta PLC | | | 48,572 | |
| | 11,926 | | | ArcelorMittal | | | 273,239 | |
| | 15,395 | | | BHP Group Ltd. | | | 406,604 | |
| | 6,867 | | | BHP Group PLC | | | 159,288 | |
| | 20,845 | | | BlueScope Steel Ltd. | | | 198,155 | |
| | 4,040 | | | Boliden AB | | | 110,450 | |
| | 17,087 | | | Freeport-McMoRan, Inc. | | | 220,422 | |
| | 51,319 | | | Glencore PLC* | | | 206,763 | |
| | 3,360 | | | JFE Holdings, Inc. | | | 58,736 | |
| | 2,143 | | | Maruichi Steel Tube Ltd. | | | 64,605 | |
| | 3,317 | | | Newcrest Mining Ltd. | | | 57,044 | |
| | 1,640 | | | Newmont Mining Corp. | | | 55,957 | |
| | 2,356 | | | Nippon Steel & Sumitomo Metal Corp. | | | 42,491 | |
| | 743 | | | Nucor Corp. | | | 45,003 | |
| | 1,668 | | | Rio Tinto Ltd. | | | 113,685 | |
| | 5,293 | | | Rio Tinto PLC | | | 304,066 | |
| | 90,801 | | | South32 Ltd. | | | 253,826 | |
| | 3,260 | | | Steel Dynamics, Inc. | | | 121,663 | |
| | 1,620 | | | Sumitomo Metal Mining Co. Ltd. | | | 47,495 | |
| | 9,951 | | | Teck Resources Ltd. Class B | | | 222,999 | |
| | | | | | | | |
| | | | | | | 3,531,760 | |
| | |
|
| Common Stocks – (continued) | |
| Mortgage Real Estate Investment Trusts (REITs) – 0.0% | |
| | 12,649 | | | AGNC Investment Corp. | | | 223,255 | |
| | 27,947 | | | Annaly Capital Management, Inc. | | | 283,103 | |
| | | | | | | | |
| | | | | | | 506,358 | |
| | |
| Multi-Utilities – 0.3% | |
| | 9,228 | | | AGL Energy Ltd. | | | 138,974 | |
| | 1,810 | | | Ameren Corp. | | | 128,945 | |
| | 1,539 | | | Atco Ltd. Class I | | | 51,797 | |
| | 1,900 | | | Canadian Utilities Ltd. Class A | | | 50,519 | |
| | 3,149 | | | CenterPoint Energy, Inc. | | | 94,911 | |
| | 74,415 | | | Centrica PLC | | | 123,062 | |
| | 2,118 | | | CMS Energy Corp. | | | 115,219 | |
| | 1,478 | | | Consolidated Edison, Inc. | | | 121,861 | |
| | 2,991 | | | Dominion Energy, Inc. | | | 221,603 | |
| | 1,347 | | | DTE Energy Co. | | | 166,435 | |
| | 7,652 | | | E.ON SE | | | 84,162 | |
| | 9,988 | | | Engie SA | | | 150,477 | |
| | 2,016 | | | Innogy SE(a) | | | 93,192 | |
| | 12,540 | | | National Grid PLC | | | 141,319 | |
| | 3,463 | | | NiSource, Inc. | | | 93,432 | |
| | 4,231 | | | Public Service Enterprise Group, Inc. | | | 248,825 | |
| | 18,150 | | | RWE AG | | | 442,819 | |
| | 548 | | | Sempra Energy | | | 66,001 | |
| | 2,341 | | | Suez | | | 29,916 | |
| | 3,578 | | | Veolia Environnement SA | | | 78,507 | |
| | 2,000 | | | WEC Energy Group, Inc. | | | 152,560 | |
| | | | | | | | |
| | | | | | | 2,794,536 | |
| | |
| Multiline Retail – 0.5% | |
| | 6,603 | | | Dollar General Corp. | | | 782,191 | |
| | 6,508 | | | Dollar Tree, Inc.* | | | 626,916 | |
| | 10,696 | | | Dollarama, Inc. | | | 289,518 | |
| | 8,752 | | | Isetan Mitsukoshi Holdings Ltd. | | | 87,134 | |
| | 10,564 | | | Kohl’s Corp. | | | 713,387 | |
| | 22,939 | | | Macy’s, Inc. | | | 568,658 | |
| | 106,047 | | | Marks & Spencer Group PLC | | | 383,233 | |
| | 1,899 | | | Marui Group Co. Ltd. | | | 33,460 | |
| | 4,895 | | | Next PLC | | | 330,136 | |
| | 10,559 | | | Nordstrom, Inc. | | | 499,229 | |
| | 1,243 | | | Ryohin Keikaku Co. Ltd. | | | 294,081 | |
| | 9,897 | | | Target Corp. | | | 718,918 | |
| | 13,492 | | | Wesfarmers Ltd. | | | 318,064 | |
| | | | | | | | |
| | | | | | | 5,644,925 | |
| | |
| Oil, Gas & Consumable Fuels – 1.1% | |
| | 3,804 | | | Aker BP ASA | | | 128,943 | |
| | 700 | | | Anadarko Petroleum Corp. | | | 30,450 | |
| | 80,840 | | | BP PLC | | | 573,099 | |
| | 1,320 | | | Cabot Oil & Gas Corp. | | | 32,498 | |
| | 2,034 | | | Caltex Australia Ltd. | | | 41,244 | |
| | 12,734 | | | Cameco Corp. | | | 147,763 | |
| | 3,642 | | | Canadian Natural Resources Ltd. | | | 103,452 | |
| | 13,280 | | | Cenovus Energy, Inc. | | | 121,704 | |
| | 1,372 | | | Cheniere Energy, Inc.* | | | 88,425 | |
| | 8,172 | | | Chevron Corp. | | | 977,208 | |
| | 5,868 | | | ConocoPhillips | | | 398,144 | |
| | |
| | |
| 18 | | The accompanying notes are an integral part of these financial statements. |
GOLDMAN SACHS GLOBAL MANAGED BETA FUND
| | | | | | | | |
Shares | | | Description | | Value | |
|
| Common Stocks – (continued) | |
| Oil, Gas & Consumable Fuels – (continued) | |
| | 1,954 | | | Continental Resources, Inc.* | | $ | 87,168 | |
| | 9,975 | | | Enagas SA | | | 284,123 | |
| | 5,468 | | | Enbridge, Inc. | | | 202,274 | |
| | 20,551 | | | Eni SpA | | | 354,419 | |
| | 2,545 | | | EOG Resources, Inc. | | | 239,230 | |
| | 9,379 | | | Equinor ASA | | | 210,952 | |
| | 16,229 | | | Exxon Mobil Corp. | | | 1,282,578 | |
| | 2,580 | | | Galp Energia SGPS SA | | | 42,300 | |
| | 1,483 | | | Hess Corp. | | | 85,791 | |
| | 7,889 | | | HollyFrontier Corp. | | | 403,917 | |
| | 15,776 | | | Husky Energy, Inc. | | | 175,389 | |
| | 5,694 | | | Imperial Oil Ltd. | | | 154,168 | |
| | 1,892 | | | Inter Pipeline Ltd. | | | 30,423 | |
| | 8,112 | | | Kinder Morgan, Inc. | | | 155,426 | |
| | 621 | | | Koninklijke Vopak NV | | | 30,335 | |
| | 3,377 | | | Lundin Petroleum AB | | | 110,639 | |
| | 5,736 | | | Marathon Oil Corp. | | | 95,218 | |
| | 10,350 | | | Marathon Petroleum Corp. | | | 641,803 | |
| | 1,356 | | | Neste Oyj | | | 130,382 | |
| | 4,311 | | | Occidental Petroleum Corp. | | | 285,173 | |
| | 14,231 | | | Oil Search Ltd. | | | 84,415 | |
| | 1,662 | | | OMV AG | | | 87,497 | |
| | 2,821 | | | ONEOK, Inc. | | | 181,277 | |
| | 30,730 | | | Origin Energy Ltd.* | | | 160,635 | |
| | 2,204 | | | Pembina Pipeline Corp. | | | 80,660 | |
| | 6,083 | | | Phillips 66 | | | 586,158 | |
| | 285 | | | Pioneer Natural Resources Co. | | | 40,171 | |
| | 20,583 | | | Repsol SA | | | 354,229 | |
| | 21,278 | | | Royal Dutch Shell PLC Class A | | | 663,278 | |
| | 17,704 | | | Royal Dutch Shell PLC Class B | | | 555,379 | |
| | 45,112 | | | Santos Ltd. | | | 221,409 | |
| | 5,602 | | | Showa Shell Sekiyu K.K | | | 84,060 | |
| | 15,612 | | | Snam SpA | | | 77,066 | |
| | 7,392 | | | Suncor Energy, Inc. | | | 254,798 | |
| | 901 | | | Targa Resources Corp. | | | 36,256 | |
| | 3,219 | | | The Williams Cos., Inc. | | | 85,915 | |
| | 9,884 | | | TOTAL SA | | | 562,584 | |
| | 1,223 | | | TransCanada Corp. | | | 54,693 | |
| | 6,172 | | | Valero Energy Corp. | | | 503,388 | |
| | 1,461 | | | Washington H Soul Pattinson & Co. Ltd. | | | 30,517 | |
| | 4,501 | | | Woodside Petroleum Ltd. | | | 115,345 | |
| | | | | | | | |
| | | | | | | 12,464,368 | |
| | |
| Paper & Forest Products – 0.1% | |
| | 1,631 | | | Mondi PLC | | | 37,338 | |
| | 16,187 | | | Oji Holdings Corp. | | | 96,692 | |
| | 3,853 | | | Stora Enso Oyj Class R | | | 51,606 | |
| | 3,938 | | | UPM-Kymmene Oyj | | | 118,746 | |
| | 4,527 | | | West Fraser Timber Co. Ltd. | | | 222,815 | |
| | | | | | | | |
| | | | | | | 527,197 | |
| | |
| Personal Products – 0.4% | |
| | 1,847 | | | Beiersdorf AG | | | 171,296 | |
| | 4,066 | | | Kao Corp. | | | 308,274 | |
| | 1,051 | | | Kobayashi Pharmaceutical Co. Ltd. | | | 85,009 | |
| | |
|
| Common Stocks – (continued) | |
| Personal Products – (continued) | |
| | 2,297 | | | Kose Corp. | | | 372,873 | |
| | 2,636 | | | L’Oreal SA | | | 664,825 | |
| | 9,147 | | | Pola Orbis Holdings, Inc. | | | 257,673 | |
| | 7,074 | | | Shiseido Co. Ltd. | | | 467,892 | |
| | 5,017 | | | The Estee Lauder Cos., Inc. Class A | | | 787,368 | |
| | 8,736 | | | Unilever NV | | | 473,121 | |
| | 7,002 | | | Unilever PLC | | | 372,771 | |
| | | | | | | | |
| | | | | | | 3,961,102 | |
| | |
| Pharmaceuticals – 1.3% | |
| | 4,495 | | | Allergan PLC | | | 619,006 | |
| | 24,384 | | | Astellas Pharma, Inc. | | | 378,064 | |
| | 5,001 | | | AstraZeneca PLC | | | 407,547 | |
| | 9,092 | | | Aurora Cannabis, Inc.* | | | 68,538 | |
| | 9,543 | | | Bausch Health Cos., Inc.* | | | 226,691 | |
| | 6,509 | | | Bayer AG | | | 520,010 | |
| | 8,570 | | | Bristol-Myers Squibb Co. | | | 442,726 | |
| | 885 | | | Canopy Growth Corp.* | | | 41,952 | |
| | 1,032 | | | Chugai Pharmaceutical Co. Ltd. | | | 70,246 | |
| | 2,483 | | | Daiichi Sankyo Co. Ltd. | | | 93,027 | |
| | 856 | | | Eisai Co. Ltd. | | | 70,743 | |
| | 4,750 | | | Eli Lilly & Co. | | | 599,878 | |
| | 24,168 | | | GlaxoSmithKline PLC | | | 481,686 | |
| | 4,251 | | | H. Lundbeck A/S | | | 194,070 | |
| | 2,171 | | | Ipsen SA | | | 300,170 | |
| | 1,841 | | | Jazz Pharmaceuticals PLC* | | | 257,795 | |
| | 14,205 | | | Johnson & Johnson | | | 1,940,971 | |
| | 12,161 | | | Merck & Co., Inc. | | | 988,568 | |
| | 1,729 | | | Merck KGaA | | | 178,671 | |
| | 2,215 | | | Mitsubishi Tanabe Pharma Corp. | | | 31,950 | |
| | 14,125 | | | Mylan NV* | | | 372,759 | |
| | 2,277 | | | Nektar Therapeutics* | | | 92,310 | |
| | 7,771 | | | Novartis AG | | | 708,202 | |
| | 8,319 | | | Novo Nordisk A/S Class B | | | 407,844 | |
| | 7,057 | | | Orion Oyj Class B | | | 251,946 | |
| | 1,073 | | | Otsuka Holdings Co. Ltd. | | | 44,775 | |
| | 8,373 | | | Perrigo Co. PLC | | | 407,765 | |
| | 31,938 | | | Pfizer, Inc. | | | 1,384,512 | |
| | 2,657 | | | Recordati SpA | | | 99,864 | |
| | 3,520 | | | Roche Holding AG | | | 976,885 | |
| | 4,312 | | | Sanofi | | | 359,575 | |
| | 917 | | | Shionogi & Co. Ltd. | | | 58,678 | |
| | 5,295 | | | Sumitomo Dainippon Pharma Co. Ltd. | | | 130,874 | |
| | 671 | | | Taisho Pharmaceutical Holdings Co. Ltd. | | | 68,165 | |
| | 1,134 | | | Takeda Pharmaceutical Co. Ltd. | | | 45,636 | |
| | 29,725 | | | Teva Pharmaceutical Industries Ltd. ADR* | | | 500,272 | |
| | 2,965 | | | UCB SA | | | 248,410 | |
| | 4,709 | | | Zoetis, Inc. | | | 443,729 | |
| | | | | | | | |
| | | | | | | 14,514,510 | |
| | |
| Professional Services – 0.3% | |
| | 1,630 | | | Adecco Group AG | | | 84,432 | |
| | 2,147 | | | Bureau Veritas SA | | | 51,278 | |
| | 538 | | | CoStar Group, Inc.* | | | 246,151 | |
| | |
| | |
| The accompanying notes are an integral part of these financial statements. | | 19 |
GOLDMAN SACHS GLOBAL MANAGED BETA FUND
Schedule of Investments(continued)
February 28, 2019 (Unaudited)
| | | | | | | | |
Shares | | | Description | | Value | |
|
| Common Stocks – (continued) | |
| Professional Services – (continued) | |
| | 287 | | | Equifax, Inc. | | $ | 31,429 | |
| | 9,899 | | | Experian PLC | | | 257,519 | |
| | 2,273 | | | IHS Markit Ltd.* | | | 120,855 | |
| | 678 | | | Intertek Group PLC | | | 45,747 | |
| | 2,144 | | | ManpowerGroup, Inc. | | | 180,632 | |
| | 5,355 | | | Nielsen Holdings PLC | | | 140,301 | |
| | 5,776 | | | Persol Holdings Co. Ltd. | | | 99,317 | |
| | 4,214 | | | Randstad NV | | | 224,710 | |
| | 12,727 | | | Recruit Holdings Co. Ltd. | | | 356,804 | |
| | 9,756 | | | RELX PLC | | | 223,956 | |
| | 8,235 | | | Robert Half International, Inc. | | | 561,545 | |
| | 130 | | | SGS SA | | | 331,009 | |
| | 802 | | | Teleperformance | | | 143,105 | |
| | 1,787 | | | Thomson Reuters Corp. | | | 97,175 | |
| | 2,034 | | | Verisk Analytics, Inc.* | | | 257,159 | |
| | 4,652 | | | Wolters Kluwer NV | | | 306,550 | |
| | | | | | | | |
| | | | | | | 3,759,674 | |
| | |
| Real Estate Management & Development – 0.3% | |
| | 9,814 | | | Aroundtown SA | | | 82,407 | |
| | 12,853 | | | CapitaLand Ltd. | | | 32,468 | |
| | 10,161 | | | CBRE Group, Inc. Class A* | | | 505,611 | |
| | 17,722 | | | CK Asset Holdings Ltd. | | | 147,040 | |
| | 1,281 | | | Daito Trust Construction Co. Ltd. | | | 177,529 | |
| | 7,041 | | | Daiwa House Industry Co. Ltd. | | | 218,060 | |
| | 2,557 | | | Deutsche Wohnen SE | | | 118,996 | |
| | 2,069 | | | First Capital Realty, Inc. | | | 33,678 | |
| | 6,226 | | | Henderson Land Development Co. Ltd. | | | 35,202 | |
| | 4,960 | | | Hongkong Land Holdings Ltd. | | | 35,576 | |
| | 4,221 | | | Hulic Co. Ltd. | | | 38,870 | |
| | 3,782 | | | Jones Lang LaSalle, Inc. | | | 624,484 | |
| | 39,221 | | | Kerry Properties Ltd. | | | 163,858 | |
| | 1,932 | | | Mitsubishi Estate Co. Ltd. | | | 33,189 | |
| | 1,397 | | | Mitsui Fudosan Co. Ltd. | | | 33,152 | |
| | 25,527 | | | New World Development Co. Ltd. | | | 40,756 | |
| | 1,599 | | | Nomura Real Estate Holdings, Inc. | | | 30,303 | |
| | 2,070 | | | Sumitomo Realty & Development Co. Ltd. | | | 77,480 | |
| | 3,935 | | | Sun Hung Kai Properties Ltd. | | | 65,241 | |
| | 12,798 | | | Swire Pacific Ltd. Class A | | | 152,251 | |
| | 12,673 | | | Swire Properties Ltd. | | | 50,872 | |
| | 670 | | | Swiss Prime Site AG* | | | 56,479 | |
| | 6,849 | | | Tokyu Fudosan Holdings Corp. | | | 37,907 | |
| | 11,797 | | | UOL Group Ltd. | | | 57,778 | |
| | 2,863 | | | Vonovia SE | | | 138,573 | |
| | 5,636 | | | Wharf Real Estate Investment Co. Ltd. | | | 39,572 | |
| | 5,604 | | | Wheelock & Co. Ltd. | | | 37,975 | |
| | | | | | | | |
| | | | | | | 3,065,307 | |
| | |
| Road & Rail – 0.3% | |
| | 127 | | | AMERCO | | | 48,843 | |
| | 9,277 | | | Aurizon Holdings Ltd. | | | 29,764 | |
| | 2,620 | | | Canadian National Railway Co. | | | 224,819 | |
| | 748 | | | Canadian Pacific Railway Ltd. | | | 154,562 | |
| | 1,242 | | | Central Japan Railway Co. | | | 278,708 | |
| | 16,747 | | | ComfortDelGro Corp. Ltd. | | | 29,558 | |
| | |
|
| Common Stocks – (continued) | |
| Road & Rail – (continued) | |
| | 3,104 | | | CSX Corp. | | | 225,568 | |
| | 1,578 | | | DSV A/S | | | 131,253 | |
| | 775 | | | East Japan Railway Co. | | | 74,235 | |
| | 1,598 | | | Hankyu Hanshin Holdings, Inc. | | | 58,013 | |
| | 726 | | | J.B. Hunt Transport Services, Inc. | | | 78,168 | |
| | 715 | | | Kansas City Southern | | | 77,678 | |
| | 901 | | | Keio Corp. | | | 52,944 | |
| | 1,742 | | | Keisei Electric Railway Co. Ltd. | | | 59,474 | |
| | 1,884 | | | Kintetsu Group Holdings Co. Ltd. | | | 85,122 | |
| | 1,923 | | | Kyushu Railway Co. | | | 65,849 | |
| | 12,338 | | | MTR Corp. Ltd. | | | 70,894 | |
| | 2,714 | | | Nagoya Railroad Co. Ltd. | | | 74,772 | |
| | 1,088 | | | Norfolk Southern Corp. | | | 195,078 | |
| | 2,507 | | | Odakyu Electric Railway Co. Ltd. | | | 58,590 | |
| | 809 | | | Old Dominion Freight Line, Inc. | | | 121,973 | |
| | 1,810 | | | Seibu Holdings, Inc. | | | 32,226 | |
| | 1,623 | | | Tobu Railway Co. Ltd. | | | 45,344 | |
| | 5,634 | | | Tokyu Corp. | | | 95,504 | |
| | 2,775 | | | Union Pacific Corp. | | | 465,367 | |
| | 1,689 | | | West Japan Railway Co. | | | 127,268 | |
| | | | | | | | |
| | | | | | | 2,961,574 | |
| | |
| Semiconductors & Semiconductor Equipment – 0.6% | |
| | 20,696 | | | Advanced Micro Devices, Inc.* | | | 486,977 | |
| | 1,008 | | | Analog Devices, Inc. | | | 107,816 | |
| | 6,569 | | | Applied Materials, Inc. | | | 251,855 | |
| | 7,149 | | | ASM Pacific Technology Ltd. | | | 75,762 | |
| | 1,374 | | | ASML Holding NV | | | 251,355 | |
| | 1,268 | | | Broadcom, Inc. | | | 349,157 | |
| | 266 | | | Disco Corp. | | | 36,806 | |
| | 1,611 | | | Infineon Technologies AG | | | 35,405 | |
| | 28,070 | | | Intel Corp. | | | 1,486,587 | |
| | 1,426 | | | KLA-Tencor Corp. | | | 164,689 | |
| | 1,694 | | | Lam Research Corp. | | | 298,296 | |
| | 5,355 | | | Marvell Technology Group Ltd. | | | 106,832 | |
| | 1,545 | | | Maxim Integrated Products, Inc. | | | 84,094 | |
| | 533 | | | Microchip Technology, Inc. | | | 46,302 | |
| | 16,383 | | | Micron Technology, Inc.* | | | 669,737 | |
| | 3,985 | | | NVIDIA Corp. | | | 614,726 | |
| | 2,957 | | | NXP Semiconductors NV | | | 270,033 | |
| | 11,810 | | | ON Semiconductor Corp.* | | | 253,679 | |
| | 2,884 | | | Qorvo, Inc.* | | | 202,284 | |
| | 2,343 | | | QUALCOMM, Inc. | | | 125,093 | |
| | 6,091 | | | Renesas Electronics Corp.* | | | 35,798 | |
| | 2,241 | | | Skyworks Solutions, Inc. | | | 183,000 | |
| | 5,879 | | | STMicroelectronics NV | | | 96,085 | |
| | 2,460 | | | Sumco Corp. | | | 31,364 | |
| | 8,023 | | | Texas Instruments, Inc. | | | 848,673 | |
| | 374 | | | Tokyo Electron Ltd. | | | 51,127 | |
| | 856 | | | Xilinx, Inc. | | | 107,257 | |
| | | | | | | | |
| | | | | | | 7,270,789 | |
| | |
| Software – 1.3% | |
| | 3,102 | | | Adobe, Inc.* | | | 814,275 | |
| | 1,080 | | | ANSYS, Inc.* | | | 191,441 | |
| | 2,565 | | | Autodesk, Inc.* | | | 418,121 | |
| | |
| | |
| 20 | | The accompanying notes are an integral part of these financial statements. |
GOLDMAN SACHS GLOBAL MANAGED BETA FUND
| | | | | | | | |
Shares | | | Description | | Value | |
|
| Common Stocks – (continued) | |
| Software – (continued) | |
| | 10,941 | | | Cadence Design Systems, Inc.* | | $ | 626,372 | |
| | 1,639 | | | CDK Global, Inc. | | | 95,078 | |
| | 457 | | | Check Point Software Technologies Ltd.* | | | 55,891 | |
| | 4,874 | | | Citrix Systems, Inc. | | | 514,207 | |
| | 756 | | | Constellation Software, Inc. | | | 645,572 | |
| | 1,360 | | | Dassault Systemes SE | | | 198,830 | |
| | 6,008 | | | Fortinet, Inc.* | | | 521,434 | |
| | 4,336 | | | Intuit, Inc. | | | 1,071,556 | |
| | 3,265 | | | Micro Focus International PLC | | | 81,165 | |
| | 43,208 | | | Microsoft Corp. | | | 4,840,592 | |
| | 492 | | | Nice Ltd.* | | | 58,031 | |
| | 797 | | | Open Text Corp. | | | 30,210 | |
| | 14,947 | | | Oracle Corp. | | | 793,054 | |
| | 1,136 | | | Palo Alto Networks, Inc.* | | | 279,763 | |
| | 828 | | | PTC, Inc.* | | | 76,855 | |
| | 2,687 | | | Red Hat, Inc.* | | | 490,646 | |
| | 3,626 | | | salesforce.com, Inc.* | | | 593,395 | |
| | 2,323 | | | SAP SE | | | 248,623 | |
| | 2,319 | | | ServiceNow, Inc.* | | | 555,261 | |
| | 2,043 | | | Splunk, Inc.* | | | 277,603 | |
| | 2,163 | | | SS&C Technologies Holdings, Inc. | | | 133,197 | |
| | 18,422 | | | Symantec Corp. | | | 414,311 | |
| | 2,098 | | | Synopsys, Inc.* | | | 213,325 | |
| | 1,069 | | | Tableau Software, Inc. Class A* | | | 141,001 | |
| | 1,272 | | | Temenos AG* | | | 183,893 | |
| | 26,176 | | | The Sage Group PLC | | | 229,618 | |
| | 712 | | | Trend Micro, Inc. | | | 35,220 | |
| | 1,096 | | | VMware, Inc. Class A | | | 188,304 | |
| | 712 | | | Workday, Inc. Class A* | | | 140,926 | |
| | | | | | | | |
| | | | | | | 15,157,770 | |
| | |
| Specialty Retail – 1.0% | |
| | 954 | | | ABC-Mart, Inc. | | | 54,658 | |
| | 3,591 | | | Advance Auto Parts, Inc. | | | 580,952 | |
| | 795 | | | AutoZone, Inc.* | | | 746,481 | |
| | 11,904 | | | Best Buy Co., Inc. | | | 819,471 | |
| | 2,382 | | | Burlington Stores, Inc.* | | | 404,321 | |
| | 555 | | | CarMax, Inc.* | | | 34,466 | |
| | 1,614 | | | Dufry AG* | | | 163,484 | |
| | 758 | | | Fast Retailing Co. Ltd. | | | 356,537 | |
| | 27,862 | | | Hennes & Mauritz AB Class B | | | 422,300 | |
| | 721 | | | Hikari Tsushin, Inc. | | | 129,298 | |
| | 13,241 | | | Industria de Diseno Textil SA | | | 399,694 | |
| | 18,754 | | | Kingfisher PLC | | | 60,280 | |
| | 14,937 | | | L Brands, Inc. | | | 390,453 | |
| | 7,869 | | | Lowe’s Cos., Inc. | | | 826,953 | |
| | 1,181 | | | Nitori Holdings Co. Ltd. | | | 147,517 | |
| | 1,601 | | | O’Reilly Automotive, Inc.* | | | 595,508 | |
| | 7,195 | | | Ross Stores, Inc. | | | 682,302 | |
| | 832 | | | Shimamura Co. Ltd. | | | 70,368 | |
| | 15,850 | | | The Gap, Inc. | | | 402,590 | |
| | 8,104 | | | The Home Depot, Inc. | | | 1,500,375 | |
| | 16,556 | | | The TJX Cos., Inc. | | | 849,157 | |
| | 2,354 | | | Tiffany & Co. | | | 223,724 | |
| | 6,239 | | | Tractor Supply Co. | | | 594,889 | |
| | |
|
| Common Stocks – (continued) | |
| Specialty Retail – (continued) | |
| | 1,847 | | | Ulta Salon, Cosmetics & Fragrance, Inc.* | | | 577,169 | |
| | 2,167 | | | USS Co. Ltd. | | | 39,539 | |
| | 26,353 | | | Yamada Denki Co. Ltd. | | | 127,296 | |
| | | | | | | | |
| | | | | | | 11,199,782 | |
| | |
| Technology Hardware, Storage & Peripherals – 0.7% | |
| | 30,413 | | | Apple, Inc. | | | 5,266,011 | |
| | 3,649 | | | Brother Industries Ltd. | | | 66,826 | |
| | 4,852 | | | Canon, Inc. | | | 139,363 | |
| | 9,270 | | | Dell Technologies Class C* | | | 517,452 | |
| | 3,575 | | | FUJIFILM Holdings Corp. | | | 160,153 | |
| | 4,910 | | | Hewlett Packard Enterprise Co. | | | 80,426 | |
| | 16,410 | | | HP, Inc. | | | 323,769 | |
| | 7,226 | | | Konica Minolta, Inc. | | | 70,275 | |
| | 2,902 | | | NetApp, Inc. | | | 189,210 | |
| | 3,306 | | | Ricoh Co. Ltd. | | | 33,643 | |
| | 4,839 | | | Seagate Technology PLC | | | 225,304 | |
| | 6,644 | | | Western Digital Corp. | | | 334,193 | |
| | 8,611 | | | Xerox Corp. | | | 266,080 | |
| | | | | | | | |
| | | | | | | 7,672,705 | |
| | |
| Textiles, Apparel & Luxury Goods – 0.7% | |
| | 1,739 | | | adidas AG | | | 422,139 | |
| | 12,842 | | | Asics Corp. | | | 171,641 | |
| | 20,891 | | | Burberry Group PLC | | | 523,770 | |
| | 8,972 | | | Capri Holdings Ltd. | | | 409,123 | |
| | 1,142 | | | Cie Financiere Richemont SA | | | 87,250 | |
| | 1,036 | | | EssilorLuxottica SA | | | 125,381 | |
| | 914 | | | Hermes International | | | 578,808 | |
| | 4,713 | | | HUGO BOSS AG | | | 348,559 | |
| | 504 | | | Kering SA | | | 274,964 | |
| | 4,828 | | | Lululemon Athletica, Inc.* | | | 726,228 | |
| | 1,767 | | | LVMH Moet Hennessy Louis Vuitton SE | | | 606,414 | |
| | 9,626 | | | Moncler SpA | | | 369,104 | |
| | 11,483 | | | NIKE, Inc. Class B | | | 984,438 | |
| | 2,304 | | | Pandora A/S | | | 120,902 | |
| | 559 | | | Puma SE | | | 315,056 | |
| | 2,280 | | | PVH Corp. | | | 261,835 | |
| | 3,544 | | | Ralph Lauren Corp. | | | 443,603 | |
| | 7,840 | | | Tapestry, Inc. | | | 273,930 | |
| | 1,137 | | | The Swatch Group AG | | | 158,285 | |
| | 16,368 | | | Under Armour, Inc. Class A* | | | 369,098 | |
| | 17,466 | | | Under Armour, Inc. Class C* | | | 350,717 | |
| | 5,879 | | | VF Corp. | | | 513,589 | |
| | | | | | | | |
| | | | | | | 8,434,834 | |
| | |
| Tobacco – 0.2% | |
| | 3,211 | | | Altria Group, Inc. | | | 168,289 | |
| | 9,699 | | | British American Tobacco PLC | | | 355,595 | |
| | 7,683 | | | Imperial Brands PLC | | | 256,015 | |
| | 2,193 | | | Japan Tobacco, Inc. | | | 55,851 | |
| | 7,204 | | | Philip Morris International, Inc. | | | 626,316 | |
| | 6,370 | | | Swedish Match AB | | | 298,544 | |
| | | | | | | | |
| | | | | | | 1,760,610 | |
| | |
| | |
| The accompanying notes are an integral part of these financial statements. | | 21 |
GOLDMAN SACHS GLOBAL MANAGED BETA FUND
Schedule of Investments(continued)
February 28, 2019 (Unaudited)
| | | | | | | | |
Shares | | | Description | | Value | |
|
| Common Stocks – (continued) | |
| Trading Companies & Distributors – 0.3% | |
| | 1,527 | | | AerCap Holdings NV* | | $ | 68,929 | |
| | 1,171 | | | Brenntag AG | | | 58,140 | |
| | 2,855 | | | Bunzl PLC | | | 89,830 | |
| | 9,033 | | | Fastenal Co. | | | 568,537 | |
| | 3,916 | | | Ferguson PLC | | | 270,552 | |
| | 8,606 | | | HD Supply Holdings, Inc.* | | | 370,144 | |
| | 12,972 | | | ITOCHU Corp. | | | 233,015 | |
| | 24,929 | | | Marubeni Corp. | | | 178,103 | |
| | 12,804 | | | Mitsubishi Corp. | | | 361,563 | |
| | 8,540 | | | Mitsui & Co. Ltd. | | | 134,413 | |
| | 4,984 | | | MonotaRO Co. Ltd. | | | 117,942 | |
| | 16,778 | | | Rexel SA | | | 208,961 | |
| | 13,514 | | | Sumitomo Corp. | | | 194,431 | |
| | 3,740 | | | Toyota Tsusho Corp. | | | 119,155 | |
| | 1,174 | | | United Rentals, Inc.* | | | 158,009 | |
| | 1,954 | | | W.W. Grainger, Inc. | | | 595,521 | |
| | | | | | | | |
| | | | | | | 3,727,245 | |
| | |
| Transportation Infrastructure – 0.0% | |
| | 238 | | | Aena SME SA(a) | | | 42,446 | |
| | 359 | | | Aeroports de Paris | | | 69,643 | |
| | 5,885 | | | Auckland International Airport Ltd. | | | 31,116 | |
| | 393 | | | Fraport AG Frankfurt Airport Services Worldwide | | | 31,579 | |
| | 3,702 | | | Getlink SE | | | 54,645 | |
| | 4,911 | | | Kamigumi Co. Ltd. | | | 114,078 | |
| | 5,980 | | | Sydney Airport | | | 30,556 | |
| | 10,774 | | | Transurban Group | | | 95,325 | |
| | | | | | | | |
| | | | | | | 469,388 | |
| | |
| Water Utilities – 0.0% | |
| | 1,790 | | | American Water Works Co., Inc. | | | 181,900 | |
| | 1,671 | | | Severn Trent PLC | | | 44,759 | |
| | 4,329 | | | United Utilities Group PLC | | | 48,241 | |
| | | | | | | | |
| | | | | | | 274,900 | |
| | |
| Wireless Telecommunication Services – 0.1% | |
| | 8,737 | | | KDDI Corp. | | | 211,170 | |
| | 600 | | | Millicom International Cellular SA SDR* | | | 36,112 | |
| | 9,425 | | | NTT DOCOMO, Inc. | | | 219,412 | |
| | 2,080 | | | Rogers Communications, Inc. Class B | | | 114,926 | |
| | 578 | | | SoftBank Group Corp. | | | 53,635 | |
| | 5,194 | | | Sprint Corp.* | | | 32,982 | |
| | 4,117 | | | T-Mobile US, Inc.* | | | 297,289 | |
| | 133,091 | | | Vodafone Group PLC | | | 237,081 | |
| | | | | | | | |
| | | | | | | 1,202,607 | |
| | |
| | TOTAL COMMON STOCKS | | | | |
| | (Cost $283,558,007) | | $ | 302,309,935 | |
| | |
Shares | | | Rate | | Value | |
|
| Preferred Stocks – 0.0% | |
| Automobiles – 0.0% | |
| | Bayerische Motoren Werke AG | |
| | 440 | | | 6.270% | | $ | 32,534 | |
| | Volkswagen AG | |
| | 211 | | | 2.750 | | | 36,180 | |
| | | | | | | | |
| | | | | | | 68,714 | |
| | |
| Chemicals – 0.0% | |
| | FUCHS PETROLUB SE | |
| | 3,146 | | | 2.250 | | | 140,469 | |
| | |
| Health Care Equipment & Supplies – 0.0% | |
| | Sartorius AG | |
| | 348 | | | 0.340 | | | 55,162 | |
| | |
| | TOTAL PREFERRED STOCKS | |
| | (Cost $298,010) | | $ | 264,345 | |
| | |
| | |
| Shares | | | Description | | Value | |
|
| Exchange Traded Funds – 59.0% | |
| | 943,269 | | | Goldman Sachs ActiveBeta Emerging Markets Equity ETF(b) | | $ | 30,778,867 | |
| | 2,808,698 | | | iShares Core MSCI Emerging Markets ETF | | | 143,580,642 | |
| | 2,483,251 | | | iShares MSCI EAFE ETF | | | 159,598,542 | |
| | 1,312,784 | | | iShares MSCI EAFE Small-Cap ETF | | | 75,025,606 | |
| | 1,006,078 | | | Vanguard S&P 500 ETF | | | 257,626,393 | |
| | |
| | TOTAL EXCHANGE TRADED FUNDS | | | | |
| | (Cost $614,447,429) | | $ | 666,610,050 | |
| | |
| | |
| Shares | | | Dividend Rate | | Value | |
|
| Investment Company(b) – 9.2% | |
| Goldman Sachs Financial Square Government Fund –
Institutional Shares |
|
| | 104,405,858 | | | 2.395% | | $ | 104,405,858 | |
| | (Cost $104,405,858) | | | | |
| | |
| | TOTAL INVESTMENTS – 95.0% | | | | |
| | (Cost $1,002,709,304) | | $ | 1,073,590,188 | |
| | |
| OTHER ASSETS IN EXCESS OF
LIABILITIES – 5.0% | | | 56,434,838 | |
| | |
| | NET ASSETS – 100.0% | | $ | 1,130,025,026 | |
| | |
| | |
|
| The percentage shown for each investment category reflects the value of investments in that category as a percentage of net assets. |
| |
* | | Non-income producing security. |
| |
(a) | | Exempt from registration under Rule 144A of the Securities Act of 1933. |
| |
(b) | | Represents affiliated funds. |
| | |
| 22 | | The accompanying notes are an integral part of these financial statements. |
GOLDMAN SACHS GLOBAL MANAGED BETA FUND
| | |
|
Currency Abbreviations: |
AUD | | —Australian Dollar |
CAD | | —Canadian Dollar |
CHF | | —Swiss Franc |
DKK | | —Danish Krone |
EUR | | —Euro |
GBP | | —British Pound |
HKD | | —Hong Kong Dollar |
ILS | | —Israeli Shekel |
JPY | | —Japanese Yen |
NOK | | —Norwegian Krone |
NZD | | —New Zealand Dollar |
SEK | | —Swedish Krona |
SGD | | —Singapore Dollar |
USD | | —U.S. Dollar |
| | |
Investment Abbreviations: |
ADR | | —American Depositary Receipt |
ETF | | —Exchange Traded Fund |
PLC | | —Public Limited Company |
REIT | | —Real Estate Investment Trust |
SDR | | —Special Drawing Rights |
|
|
| ADDITIONAL INVESTMENT INFORMATION |
FORWARD FOREIGN CURRENCY EXCHANGE CONTRACTS — At February 28, 2019, the Fund had the following forward foreign currency exchange contracts:
FORWARD FOREIGN CURRENCY EXCHANGE CONTRACTS WITH UNREALIZED GAIN
| | | | | | | | | | | | | | | | | | | | |
| | | Currency
Purchased | | | Currency
Sold | | | | | | | |
| Counterparty | | Settlement
Date | | | Unrealized
Gain | |
MS & Co. Int. PLC | | USD | | | 11,726,692 | | | AUD | | | 16,240,000 | | | | 03/20/19 | | | $ | 202,582 | |
| | USD | | | 14,749,025 | | | CHF | | | 14,490,000 | | | | 03/20/19 | | | | 202,458 | |
| | USD | | | 2,902,345 | | | DKK | | | 18,870,000 | | | | 03/20/19 | | | | 20,218 | |
| | USD | | | 53,175,006 | | | EUR | | | 46,300,000 | | | | 03/20/19 | | | | 419,883 | |
| | USD | | | 6,100,077 | | | HKD | | | 47,600,000 | | | | 03/20/19 | | | | 31,686 | |
| | USD | | | 1,581,189 | | | JPY | | | 175,422,474 | | | | 03/04/19 | | | | 6,929 | |
| | USD | | | 3,038,638 | | | JPY | | | 329,000,000 | | | | 03/20/19 | | | | 82,224 | |
| | USD | | | 1,195,490 | | | NOK | | | 10,150,000 | | | | 03/20/19 | | | | 8,173 | |
| | USD | | | 337,681 | | | NZD | | | 490,000 | | | | 03/20/19 | | | | 3,845 | |
| | USD | | | 4,607,834 | | | SEK | | | 41,175,000 | | | | 03/20/19 | | | | 142,440 | |
| | | USD | | | 111,504 | | | SGD | | | 150,000 | | | | 03/20/19 | | | | 521 | |
| | | | | | |
| TOTAL | | | | | | | | | | | | | | | | | | $ | 1,120,959 | |
| | |
| The accompanying notes are an integral part of these financial statements. | | 23 |
GOLDMAN SACHS GLOBAL MANAGED BETA FUND
Schedule of Investments(continued)
February 28, 2019 (Unaudited)
|
| ADDITIONAL INVESTMENT INFORMATION (continued) |
FORWARD FOREIGN CURRENCY EXCHANGE CONTRACTS WITH UNREALIZED LOSS
| | | | | | | | | | | | | | | | | | | | |
| Counterparty | | Currency
Purchased | | | Currency
Sold | | | Settlement
Date | | | Unrealized
Loss | |
MS & Co. Int. PLC | | CAD | | | 460,452 | | | USD | | | 350,138 | | | | 03/04/19 | | | $ | (205 | ) |
| | USD | | | 5,177,379 | | | CAD | | | 6,930,000 | | | | 03/20/19 | | | | (91,429 | ) |
| | USD | | | 28,052,179 | | | GBP | | | 21,810,000 | | | | 03/20/19 | | | | (906,209 | ) |
| | USD | | | 463,706 | | | ILS | | | 1,720,000 | | | | 03/20/19 | | | | (11,458 | ) |
| | USD | | | 37,527,901 | | | JPY | | | 4,178,000,000 | | | | 03/20/19 | | | | (15,856 | ) |
| | USD | | | 34,910 | | | NOK | | | 300,000 | | | | 03/20/19 | | | | (183 | ) |
| | USD | | | 40,451 | | | NZD | | | 60,000 | | | | 03/20/19 | | | | (427 | ) |
| | | USD | | | 2,147,392 | | | SGD | | | 2,930,000 | | | | 03/20/19 | | | | (20,474 | ) |
| | | | | | |
| TOTAL | | | | | | | | | | | | | | | | | | $ | (1,046,241 | ) |
FUTURES CONTRACTS — At February 28, 2019, the Fund had the following futures contracts:
| | | | | | | | | | | | | | | | |
| Description | | Number of
Contracts | | | Expiration
Date | | | Notional
Amount | | | Unrealized
Appreciation/
(Depreciation) | |
Long position contracts: | | | | | | | | | | | | | | | | |
E-mini Russell 2000 Index | | | 1,448 | | | | 03/15/19 | | | $ | 114,066,200 | | | $ | 13,231,452 | |
S&P Toronto Stock Exchange 60 Index | | | 164 | | | | 03/14/19 | | | | 23,738,531 | | | | 1,926,861 | |
| | | | |
| TOTAL FUTURES CONTRACTS | | | | | | | | | | | | | | $ | 15,158,313 | |
| | |
| 24 | | The accompanying notes are an integral part of these financial statements. |
GOLDMAN SACHS GLOBAL MANAGED BETA FUND
|
| ADDITIONAL INVESTMENT INFORMATION (continued) |
PURCHASED OPTIONS CONTRACTS — At February 28, 2019, the Fund had the following purchased options:
EXCHANGE TRADED OPTIONS ON FUTURES
| | | | | | | | | | | | | | | | | | | | | | | | | | | | |
| Description | | | | Exercise
Price | | Expiration
Date | | | Number of
Contracts | | | Notional
Amount | | | Market
Value | | | Premiums
Paid (Received)
by Portfolio | | | Unrealized
Appreciation/
(Depreciation) | |
Purchased option contracts | | | | | | | | | | | | | | | | | | | | | | | | | | | | |
Calls | | | | | | | | | | | | | | | | | | | | | | | | | | | | |
Eurodollar Futures | | | | 97.13 USD | | | 03/18/2019 | | | | 917 | | | $ | 2,292,500 | | | $ | 630,438 | | | $ | 1,940,158 | | | $ | (1,309,720 | ) |
Eurodollar Futures | | | | 97.88 USD | | | 03/18/2019 | | | | 99 | | | | 247,500 | | | | 619 | | | | 143,779 | | | | (143,160 | ) |
Eurodollar Futures | | | | 98.00 USD | | | 03/18/2019 | | | | 141 | | | | 352,500 | | | | 881 | | | | 296,584 | | | | (295,703 | ) |
Eurodollar Futures | | | | 99.00 USD | | | 03/18/2019 | | | | 5,264 | | | | 13,160,000 | | | | 32,900 | | | | 372,335 | | | | (339,435 | ) |
Eurodollar Futures | | | | 96.88 USD | | | 06/17/2019 | | | | 1,498 | | | | 3,745,000 | | | | 1,947,400 | | | | 2,509,057 | | | | (561,657 | ) |
Eurodollar Futures | | | | 97.75 USD | | | 06/17/2019 | | | | 166 | | | | 415,000 | | | | 1,038 | | | | 357,871 | | | | (356,833 | ) |
Eurodollar Futures | | | | 99.00 USD | | | 06/17/2019 | | | | 2,194 | | | | 5,485,000 | | | | 13,713 | | | | 180,981 | | | | (167,268 | ) |
Eurodollar Futures | | | | 97.75 USD | | | 09/16/2019 | | | | 337 | | | | 842,500 | | | | 12,637 | | | | 211,403 | | | | (198,766 | ) |
Eurodollar Futures | | | | 96.75 USD | | | 03/16/2020 | | | | 211 | | | | 527,500 | | | | 361,337 | | | | 237,864 | | | | 123,473 | |
Eurodollar Futures | | | | 97.38 USD | | | 03/16/2020 | | | | 2,513 | | | | 6,282,500 | | | | 1,287,912 | | | | 1,547,244 | | | | (259,332 | ) |
Eurodollar Futures | | | | 97.13 USD | | | 06/15/2020 | | | | 383 | | | | 957,500 | | | | 414,119 | | | | 297,714 | | | | 116,405 | |
Eurodollar Futures | | | | 97.50 USD | | | 06/15/2020 | | | | 2,368 | | | | 5,920,000 | | | | 1,272,800 | | | | 1,504,785 | | | | (231,985 | ) |
Eurodollar Futures | | | | 97.13 USD | | | 09/14/2020 | | | | 329 | | | | 822,500 | | | | 407,138 | | | | 300,976 | | | | 106,162 | |
Eurodollar Futures | | | | 97.50 USD | | | 09/14/2020 | | | | 2,616 | | | | 6,540,000 | | | | 1,798,500 | | | | 2,030,688 | | | | (232,188 | ) |
Eurodollar Futures | | | | 97.50 USD | | | 12/14/2020 | | | | 2,462 | | | | 6,155,000 | | | | 1,923,437 | | | | 2,348,039 | | | | (424,602 | ) |
Eurodollar Futures | | | | 97.50 USD | | | 03/15/2021 | | | | 2,373 | | | | 5,932,500 | | | | 2,106,038 | | | | 2,675,758 | | | | (569,720 | ) |
Eurodollar Futures | | | | 97.50 USD | | | 06/14/2021 | | | | 2,165 | | | | 5,412,500 | | | | 2,083,812 | | | | 2,525,624 | | | | (441,812 | ) |
| | | | | | | | |
| | | | | | | | | | | | 26,036 | | | $ | 65,090,000 | | | $ | 14,294,719 | | | $ | 19,480,860 | | | $ | (5,186,141 | ) |
Puts | | | | | | | | | | | | | | | | | | | | | | | | | | | | |
Eurodollar Futures | | | | 100.00 USD | | | 03/16/2020 | | | | 3,202 | | | | 8,005,000 | | | | 20,572,850 | | | | 20,360,870 | | | | 211,980 | |
| | | | | | |
| TOTAL PURCHASED OPTIONS CONTRACTS | | | | | | | 29,238 | | | $ | 73,095,000 | | | $ | 34,867,569 | | | $ | 39,841,730 | | | $ | (4,974,161 | ) |
|
|
Abbreviations: |
MS & Co. Int. PLC—Morgan Stanley & Co. International PLC |
|
| | |
| The accompanying notes are an integral part of these financial statements. | | 25 |
GOLDMAN SACHS GLOBAL MANAGED BETA FUND
Statement of Assets and Liabilities
February 28, 2019 (Unaudited)
| | | | | | |
| | | | | |
| | Assets: | | | | |
| | |
| | Investments of unaffiliated issuers, at value (cost $866,144,306) | | $ | 938,405,463 | |
| | |
| | Investments of affiliated issuers, at value (cost $136,564,998) | | | 135,184,725 | |
| | |
| | Purchased options (cost $39,841,730) | | | 34,867,569 | |
| | |
| | Cash | | | 17,636,672 | |
| | |
| | Foreign currencies, at value (cost $443,335) | | | 438,076 | |
| | |
| | Unrealized gain on forward foreign currency exchange contracts | | | 1,120,959 | |
| | |
| | Receivables: | | | | |
| | |
| | Investments sold | | | 18,808,657 | |
| | |
| | Collateral on certain derivative contracts(a) | | | 4,707,666 | |
| | |
| | Dividends | | | 730,935 | |
| | |
| | Foreign tax reclaims | | | 61,998 | |
| | |
| | Reimbursement from investment adviser | | | 21,819 | |
| | |
| | Other assets | | | 15,593 | |
| | |
| | Total assets | | | 1,152,000,132 | |
| | | | | | |
| | Liabilities: | | | | |
| | |
| | Unrealized loss on forward foreign currency exchange contracts | | | 1,046,241 | |
| | |
| | Variation margin on futures | | | 615,335 | |
| | |
| | Payables: | | | | |
| | |
| | Fund shares redeemed | | | 10,500,000 | |
| | |
| | Investments purchased | | | 9,512,939 | |
| | |
| | Transfer Agency fees | | | 17,273 | |
| | |
| | Accrued expenses | | | 283,318 | |
| | |
| | Total liabilities | | | 21,975,106 | |
| | | | | | |
| | Net Assets: | | | | |
| | |
| | Paid-in capital | | | 1,081,856,557 | |
| | |
| | Total distributable earnings | | | 48,168,469 | |
| | |
| | NET ASSETS | | $ | 1,130,025,026 | |
| | |
| | Shares Outstanding $0.001 par value (unlimited number of shares authorized): | | | 99,352,003 | |
| | |
| | Institutional | | | $11.37 | |
| | (a) | | Includes amount segregated for initial margin and/or collateral on futures contracts and forward foreign currecncy exchange contracts of $1,067,666 and $3,640,000, respectively. |
| | |
| 26 | | The accompanying notes are an integral part of these financial statements. |
GOLDMAN SACHS GLOBAL MANAGED BETA FUND
Statement of Operations
For the Six Months Ended February 28, 2019 (Unaudited)
| | | | | | |
| | | | | | |
| | Investment income: | | | | |
| | |
| | Dividends — unaffiliated issuers (net of foreign withholding taxes of $102,895) | | $ | 10,083,423 | |
| | |
| | Dividends — affiliated issuers | | | 1,318,509 | |
| | |
| | Securities lending income | | | 163,950 | |
| | |
| | Interest | | | 15,323 | |
| | |
| | Total investment income | | | 11,581,205 | |
| | | | | | |
| | Expenses: | | | | |
| | |
| | Management fees | | | 1,632,122 | |
| | |
| | Custody, accounting and administrative services | | | 158,192 | |
| | |
| | Transfer Agency fees | | | 108,808 | |
| | |
| | Professional fees | | | 61,796 | |
| | |
| | Printing and mailing costs | | | 26,706 | |
| | |
| | Registration fees | | | 12,804 | |
| | |
| | Trustee fees | | | 8,959 | |
| | |
| | Prime Broker Fees | | | 1,770 | |
| | |
| | Other | | | 15,954 | |
| | |
| | Total expenses | | | 2,027,111 | |
| | |
| | Less — expense reductions | | | (1,760,819 | ) |
| | |
| | Net expenses | | | 266,292 | |
| | |
| | NET INVESTMENT INCOME | | | 11,314,913 | |
| | | | | | |
| | Realized and unrealized gain (loss): | | | | |
| | |
| | Net realized gain (loss) from: | | | | |
| | |
| | Investments — unaffiliated issuers | | | (11,662,539 | ) |
| | |
| | Purchased options | | | 1,246,983 | |
| | |
| | Futures contracts | | | (20,956,784 | ) |
| | |
| | Forward foreign currency exchange contracts | | | 6,661,084 | |
| | |
| | Foreign currency transactions | | | 5,192 | |
| | |
| | Net change in unrealized gain (loss) on: | | | | |
| | |
| | Investments — unaffiliated issuers | | | (24,133,738 | ) |
| | |
| | Investments — affiliated issuers | | | (226,385 | ) |
| | |
| | Purchased options | | | (1,199,244 | ) |
| | |
| | Futures contracts | | | 10,874,670 | |
| | |
| | Forward foreign currency exchange contracts | | | (3,204,236 | ) |
| | |
| | Foreign currency translation | | | (10,723 | ) |
| | |
| | Net realized and unrealized loss | | | (42,605,720 | ) |
| | |
| | NET DECREASE IN NET ASSETS RESULTING FROM OPERATIONS | | $ | (31,290,807 | ) |
| | |
| The accompanying notes are an integral part of these financial statements. | | 27 |
GOLDMAN SACHS GLOBAL MANAGED BETA FUND
Statements of Changes in Net Assets
| | | | | | | | | | |
| | | | | For the Six
Months Ended
February 28, 2019
(Unaudited) | | | For the Fiscal
Year Ended
August 31, 2018 | |
| | From operations: | | | | | | | | |
| | | |
| | Net investment income | | $ | 11,314,913 | | | $ | 17,014,431 | |
| | | |
| | Net realized gain (loss) | | | (24,706,064 | ) | | | 11,054,603 | |
| | | |
| | Net change in unrealized gain (loss) | | | (17,899,656 | ) | | | 48,653,598 | |
| | | |
| | Net increase (decrease) in net assets resulting from operations | | | (31,290,807 | ) | | | 76,722,632 | |
| | | | | | | | | | |
| | Distributions to shareholders: | | | | | | | | |
| | | |
| | From distributable earnings | | | (39,877,290 | ) | | | (21,487,711 | )(a) |
| | | | | | | | | | |
| | From share transactions: | | | | | | | | |
| | | |
| | Proceeds from sales of shares | | | 90,890,000 | | | | 808,670,005 | |
| | | |
| | Reinvestment of distributions | | | 39,877,290 | | | | 21,487,711 | |
| | | |
| | Cost of shares redeemed | | | (113,850,553 | ) | | | (143,186,818 | ) |
| | | |
| | Net increase in net assets resulting from share transactions | | | 16,916,737 | �� | | | 686,970,898 | |
| | | |
| | TOTAL INCREASE (DECREASE) | | | (54,251,360 | ) | | | 742,205,819 | |
| | | | | | | | | | |
| | Net assets:(b) | | | | | | | | |
| | | |
| | Beginning of period | | | 1,184,276,386 | | | | 442,070,567 | |
| | | |
| | End of period | | $ | 1,130,025,026 | | | $ | 1,184,276,386 | |
| | (a) | | Prior year information has been revised to conform with current year presentation. Distributions to shareholders for the Fund consisted of $(8,851,460) of net investment income and $(12,636,251) of net realized gains for the fiscal year ended August 31, 2018. |
| | (b) | | Prior year information has been revised to conform with current year presentation. Undistributed net investment income was $11,876,859 as of August 31, 2018. |
| | |
| 28 | | The accompanying notes are an integral part of these financial statements. |
GOLDMAN SACHS GLOBAL MANAGED BETA FUND
Financial Highlights
Selected Share Data for a Share Outstanding Throughout Each Period
| | | | | | | | | | | | | | | | | | | | | | |
| | | | | Global Managed Beta Fund
Institutional Shares | |
| | | | | Six Months Ended
February 28, 2019
(Unaudited) | | | Year Ended
August 31,
2018 | | | Period
November 1,
2016 – August 31,
2017* | | | Year Ended
October 31,
2016 | | | Period Ended
October 31,
2015(a) | |
| | Per Share Data | | | | | | | | | | | | | | | | | | | | |
| | | | | | |
| | Net asset value, beginning of period | | $ | 12.23 | | | $ | 11.33 | | | $ | 9.84 | | | $ | 9.68 | | | $ | 10.00 | |
| | | | | | |
| | Net investment income(b) | | | 0.12 | | | | 0.25 | | | | 0.15 | | | | 0.18 | | | | 0.05 | |
| | | | | | |
| | Net realized and unrealized gain (loss) | | | (0.59 | ) | | | 1.00 | | | | 1.54 | | | | 0.11 | | | | (0.37 | ) |
| | | | | | |
| | Total from investment operations | | | (0.47 | ) | | | 1.25 | | | | 1.69 | | | | 0.29 | | | | (0.32 | ) |
| | | | | | |
| | Distributions to shareholders from net investment income | | | (0.27 | ) | | | (0.14 | ) | | | (0.20 | ) | | | (0.11 | ) | | | — | |
| | | | | | |
| | Distributions to shareholders from net realized gains | | | (0.12 | ) | | | (0.21 | ) | | | — | | | | (0.02 | ) | | | — | |
| | | | | | |
| | Total distributions | | | (0.39 | ) | | | (0.35 | ) | | | (0.20 | ) | | | (0.13 | ) | | | — | |
| | | | | | |
| | Net asset value, end of period | | $ | 11.37 | | | $ | 12.23 | | | $ | 11.33 | | | $ | 9.84 | | | $ | 9.68 | |
| | | | | | |
| | Total return(c) | | | (3.38 | )% | | | 11.18 | % | | | 17.43 | % | | | 3.08 | % | | | (3.20 | )% |
| | | | | | |
| | Net assets, end of period (in 000s) | | $ | 1,130,025 | | | $ | 1,184,276 | | | $ | 442,071 | | | $ | 144,246 | | | $ | 136,984 | |
| | | | | | |
| | Ratio of net expenses to average net assets(d) | | | 0.05 | %(e) | | | 0.07 | % | | | 0.10 | %(e) | | | 0.17 | % | | | 0.37 | %(e) |
| | | | | | |
| | Ratio of total expenses to average net assets(d) | | | 0.37 | %(e) | | | 0.39 | % | | | 0.42 | %(e) | | | 0.48 | % | | | 0.68 | %(e) |
| | | | | | |
| | Ratio of net investment income to average net assets | | | 2.08 | %(e) | | | 2.07 | % | | | 1.71 | %(e) | | | 1.90 | % | | | 1.04 | %(e) |
| | | | | | |
| | Portfolio turnover rate(f) | | | 14 | % | | | 18 | % | | | 44 | % | | | 37 | % | | | — | %(g) |
| | * | | The Fund changed its fiscal year end from October 31 to August 31. |
| | (a) | | Commenced operations April 30, 2015. |
| | (b) | | Calculated based on the average shares outstanding methodology. |
| | (c) | | Assumes investment at the NAV at the beginning of the period, reinvestment of all dividends and distributions, a complete redemption of the investment at the NAV at the end of the period and no sales or redemption charges. Total returns would be reduced if a sales or redemption charge was taken into account. Returns do not reflect the impact of taxes to shareholders relating to Fund distributions or the redemption of Fund shares. Total returns for periods less than one full year are not annualized. |
| | (d) | | Expense ratios exclude the expenses of the Underlying Funds in which the Fund invests. |
| | (f) | | The Fund’s portfolio turnover rate is calculated in accordance with regulatory requirements, without regard to transactions involving short term investments and certain derivatives. If such transactions were included, the Fund’s portfolio turnover rate may be higher. |
| | (g) | | Portfolio Turnover rounds to less than 0.5%. |
| | |
| The accompanying notes are an integral part of these financial statements. | | 29 |
GOLDMAN SACHS GLOBAL MANAGED BETA FUND
Notes to Financial Statements
February 28, 2019 (Unaudited)
Goldman Sachs Trust (the “Trust”) is a Delaware statutory trust registered under the Investment Company Act of 1940, as amended (the “Act”), as anopen-end management investment company. Goldman Sachs Global Managed Beta Fund (the “Fund”) is a diversified fund that currently offers one class of shares — Institutional Shares. Goldman Sachs Asset Management, L.P. (“GSAM”), an affiliate of Goldman Sachs & Co. LLC (“Goldman Sachs”), serves as investment adviser to the Fund pursuant to a management agreement (the “Agreement”) with the Trust.
|
| 2. SIGNIFICANT ACCOUNTING POLICIES |
The financial statements have been prepared in accordance with accounting principles generally accepted in the United States of America (“GAAP”) and require management to make estimates and assumptions that may affect the reported amounts and disclosures. Actual results may differ from those estimates and assumptions.
A. Investment Valuation — The Fund’s valuation policy is to value investments at fair value.
B. Investment Income and Investments — Investment income includes interest income, dividend income, and securities lending income, if any. Interest income is accrued daily and adjusted for amortization of premiums and accretion of discounts. Dividend income is recognized onex-dividend date or, for certain foreign securities, as soon as such information is obtained subsequent to theex-dividend date. Investment transactions are reflected on trade date. Realized gains and losses are calculated using identified cost. Investment transactions are recorded on the following business day for daily net asset value (“NAV”) calculations. Investment income is recorded net of any foreign withholding taxes, less any amounts reclaimable. The Fund may file withholding tax reclaims in certain jurisdictions to recover a portion of amounts previously withheld. Any foreign capital gains tax is accrued daily based upon net unrealized gains, and is payable upon sale of such investments. Distributions received from the Fund’s investments in U.S. real estate investment trusts (“REITs”) may be characterized as ordinary income, net capital gain or a return of capital. A return of capital is recorded by the Fund as a reduction to the cost basis of the REIT.
For derivative contracts, realized gains and losses are recorded upon settlement of the contract.
C. Expenses — Expenses incurred directly by the Fund are charged to the Fund, and certain expenses incurred by the Trust that may not solely relate to the Fund are allocated to the Fund and the other applicable funds of the Trust on a straight-line and/orpro-rata basis, depending upon the nature of the expenses, and are accrued daily.
D. Federal Taxes and Distributions to Shareholders — It is the Fund’s policy to comply with the requirements of the Internal Revenue Code of 1986, as amended (the “Code”), applicable to regulated investment companies and to distribute each year substantially all of its investment company taxable income and capital gains to its shareholders. Accordingly, the Fund is not required to make any provisions for the payment of federal income tax. Distributions to shareholders are recorded on theex-dividend date. Income and capital gains distributions, if any, are declared and paid annually.
Net capital losses, if any, are carried forward to future fiscal years and may be used to the extent allowed by the Code to offset any future capital gains. Losses that are carried forward will retain their character as either short-term or long-term capital losses. Utilization of capital loss carryforwards will reduce the requirement of future capital gains distributions.
The characterization of distributions to shareholders for financial reporting purposes is determined in accordance with federal income tax rules, which may differ from GAAP. The source of the Fund’s distributions may be shown in the accompanying financial statements as either from distributable earnings or capital. Certain components of the Fund’s net assets on the Statement of Assets and Liabilities reflect permanent GAAP/tax differences based on the appropriate tax character.
E. Foreign Currency Translation — The accounting records and reporting currency of the Fund are maintained in U.S. dollars. Assets and liabilities denominated in foreign currencies are translated into U.S. dollars using the current exchange rates at the close of each business day. The effect of changes in foreign currency exchange rates on investments is included within net realized and unrealized gain (loss) on investments. Changes in the value of other assets and liabilities as a result of fluctuations in foreign exchange rates are included in the Statement of Operations within net change in unrealized gain (loss) on foreign currency translation. Transactions denominated in foreign currencies are translated into U.S. dollars on the date the transaction occurred, the effects of which are included within net realized gain (loss) on foreign currency transactions.
30
GOLDMAN SACHS GLOBAL MANAGED BETA FUND
|
| 3. INVESTMENTS AND FAIR VALUE MEASUREMENTS |
U.S. GAAP defines the fair value of a financial instrument as the amount that would be received to sell an asset or paid to transfer a liability in an orderly transaction between market participants at the measurement date (i.e., the exit price); the Fund’s policy is to use the market approach. GAAP establishes a fair value hierarchy that prioritizes the inputs to valuation techniques used to measure fair value. The hierarchy gives the highest priority to unadjusted quoted prices in active markets for identical assets or liabilities (Level 1 measurements) and the lowest priority to unobservable inputs (Level 3 measurements). The levels used for classifying investments are not necessarily an indication of the risk associated with investing in these investments. The three levels of the fair value hierarchy are described below:
Level 1 — Unadjusted quoted prices in active markets that are accessible at the measurement date for identical, unrestricted assets or liabilities;
Level 2 — Quoted prices in markets that are not active or financial instruments for which significant inputs are observable (including, but not limited to, quoted prices for similar investments, interest rates, foreign exchange rates, volatility and credit spreads), either directly or indirectly;
Level 3 — Prices or valuations that require significant unobservable inputs (including GSAM’s assumptions in determining fair value measurement).
The Board of Trustees (“Trustees”) has approved Valuation Procedures that govern the valuation of the portfolio investments held by the Fund, including investments for which market quotations are not readily available. The Trustees have delegated to GSAMday-to-day responsibility for implementing and maintaining internal controls and procedures related to the valuation of the Fund’s investments. To assess the continuing appropriateness of pricing sources and methodologies, GSAM regularly performs price verification procedures and issues challenges as necessary to third party pricing vendors or brokers, and any differences are reviewed in accordance with the Valuation Procedures.
A. Level 1 and Level 2 Fair Value Investments — The valuation techniques and significant inputs used in determining the fair values for investments classified as Level 1 and Level 2 are as follows:
Equity Securities — Equity securities traded on a United States (“U.S.”) securities exchange or the NASDAQ system, or those located on certain foreign exchanges, including but not limited to the Americas, are valued daily at their last sale price or official closing price on the principal exchange or system on which they are traded. If there is no sale or official closing price or such price is believed by GSAM to not represent fair value, equity securities are valued at the last bid price for long positions and at the last ask price for short positions. To the extent these investments are actively traded, they are classified as Level 1 of the fair value hierarchy, otherwise they are generally classified as Level 2.
Unlisted equity securities for which market quotations are available are valued at the last sale price on the valuation date, or if no sale occurs, at the last bid price, and are generally classified as Level 2.
Securities traded on certain foreign securities exchanges are valued daily at fair value determined by an independent fair value service (if available) under Valuation Procedures approved by the Trustees and consistent with applicable regulatory guidance. The independent fair value service takes into account multiple factors including, but not limited to, movements in the securities markets, certain depositary receipts, futures contracts and foreign currency exchange rates that have occurred subsequent to the close of the foreign securities exchange. These investments are generally classified as Level 2 of the fair value hierarchy.
Underlying Funds (including Money Market Funds) — Underlying funds (“Underlying Funds”) include other investment companies and exchange-traded funds (“ETFs”). Investments in the Underlying Funds (except ETFs) are valued at the NAV per share on the day of valuation. ETFs are valued daily at the last sale price or official closing price on the principal exchange or system on which the investment is traded. Because the Fund invests in Underlying Funds that fluctuate in value, the Fund’s shares will correspondingly fluctuate in value. To the extent these investments are actively traded, they are classified as Level 1 of the fair value hierarchy, otherwise they are generally classified as Level 2. For information regarding an Underlying Fund’s accounting policies and investment holdings, please see the Underlying Fund’s shareholder report.
Derivative Contracts — A derivative is an instrument whose value is derived from underlying assets, indices, reference rates or a combination of these factors. The Fund enters into derivative transactions to hedge against changes in interest rates, securities prices, and/or currency exchange rates, to increase total return, or to gain access to certain markets or attain exposure to other underliers.
31
GOLDMAN SACHS GLOBAL MANAGED BETA FUND
Notes to Financial Statements(continued)
February 28, 2019 (Unaudited)
|
| 3. INVESTMENTS AND FAIR VALUE MEASUREMENTS (continued) |
Exchange-traded derivatives, including futures and options contracts, are generally valued at the last sale or settlement price on the exchange where they are principally traded. Exchange-traded options without settlement prices are generally valued at the midpoint of the bid and ask prices on the exchange where they are principally traded (or, in the absence of two way trading, at the last bid price for long positions and the last ask price for short positions). Exchange-traded derivatives typically fall within Level 1 of the fair value hierarchy.Over-the-counter (“OTC”) and centrally cleared derivatives are valued using market transactions and other market evidence, including market-based inputs to models, calibration to market-clearing transactions, broker or dealer quotations, or other alternative pricing sources. Where models are used, the selection of a particular model to value OTC and centrally cleared derivatives depends upon the contractual terms of, and specific risks inherent in, the instrument, as well as the availability of pricing information in the market. Valuation models require a variety of inputs, including contractual terms, market prices, yield curves, credit curves, measures of volatility, voluntary and involuntary prepayment rates, loss severity rates and correlations of such inputs. For OTC and centrally cleared derivatives that trade in liquid markets, model inputs can generally be verified and model selection does not involve significant management judgment. OTC and centrally cleared derivatives are classified within Level 2 of the fair value hierarchy when significant inputs are corroborated by market evidence.
i. Forward Contracts — A forward contract is a contract between two parties to buy or sell an asset at a specified price on a future date. A forward contract settlement can occur on a cash or delivery basis. Forward contracts aremarked-to-market daily using independent vendor prices, and the change in value, if any, is recorded as an unrealized gain or loss. Cash and certain investments may be used to collateralize forward contracts.
Aforward foreign currency exchange contractis a forward contract in which the Fund agrees to receive or deliver a fixed quantity of one currency for another, at apre-determined price at a future date. All forward foreign currency exchange contracts aremarked-to-market daily at the applicable forward rate.Non-deliverable forward foreign currency exchange contracts are settled with the counterparty in cash without the delivery of foreign currency.
ii. Futures Contracts — Futures contracts are contracts to buy or sell a standardized quantity of a specified commodity or security. Upon entering into a futures contract, the Fund deposits cash or securities in an account on behalf of the broker in an amount sufficient to meet the initial margin requirement. Subsequent payments are made or received by the Fund equal to the daily change in the contract value and are recorded as variation margin receivable or payable with a corresponding offset to unrealized gains or losses. For financial reporting purposes, cash collateral that has been pledged to cover obligations of the Fund and cash collateral received, if any, is reported separately on the Statement of Assets and Liabilities as receivables/payables for collateral on certain derivative contracts.Non-cash collateral pledged by the Fund, if any, is noted in the Schedule of Investments.
iii. Options — When the Fund writes call or put options, an amount equal to the premium received is recorded as a liability and is subsequentlymarked-to-market to reflect the current value of the option written. Swaptions are options on interest rate swap contracts.
Upon the purchase of a call option or a put option by the Fund, the premium paid is recorded as an investment and subsequentlymarked-to-market to reflect the current value of the option. Certain options may be purchased with premiums to be determined on a future date. The premiums for these options are based upon implied volatility parameters at specified terms.
B. Level 3 Fair Value Investments — To the extent that significant inputs to valuation models and other alternative pricing sources are unobservable, or if quotations are not readily available, or if GSAM believes that such quotations do not accurately reflect fair value, the fair value of the Fund’s investments may be determined under Valuation Procedures approved by the Trustees. GSAM, consistent with its procedures and applicable regulatory guidance, may make an adjustment to the most recent valuation prices of either domestic or foreign securities in light of significant events to reflect what it believes to be the fair value of the securities at the time of determining the Fund’s NAV.
32
GOLDMAN SACHS GLOBAL MANAGED BETA FUND
|
| 3. INVESTMENTS AND FAIR VALUE MEASUREMENTS (continued) |
C. Fair Value Hierarchy — The following is a summary of the Fund’s investments and derivatives classified in the fair value hierarchy as of February 28, 2019:
| | | | | | | | | | | | |
|
| GLOBAL MANAGED BETA | |
| | | |
| Investment Type | | Level 1 | | | Level 2 | | | Level 3 | |
| | | |
| Assets | | | | | | | | | | | | |
| | | |
Common Stock and/or Other Equity Investments(a) | | | | | | | | | | | | |
| | | |
Africa | | $ | — | | | $ | 86,148 | | | $ | — | |
| | | |
Asia | | | 927,325 | | | | 32,245,514 | | | | — | |
| | | |
Australia and Oceania | | | 194,839 | | | | 7,578,701 | | | | — | |
| | | |
Europe | | | 6,957,131 | | | | 61,107,104 | | | | — | |
| | | |
North America | | | 193,168,787 | | | | 71,596 | | | | — | |
| | | |
South America | | | 188,563 | | | | 48,572 | | | | — | |
| | | |
Exchange Traded Funds | | | 666,610,050 | | | | — | | | | — | |
| | | |
Investment Company | | | 104,405,858 | | | | — | | | | — | |
| | | |
| Total | | $ | 972,452,553 | | | $ | 101,137,635 | | | $ | — | |
| | | |
| Derivative Type | | | | | | | | | |
| | | |
| Assets | | | | | | | | | | | | |
| | | |
Forward Foreign Currency Exchange Contracts(b) | | $ | — | | | $ | 1,120,959 | | | $ | — | |
| | | |
Futures Contracts(b) | | | 15,158,313 | | | | — | | | | — | |
| | | |
Options Purchased | | | 34,867,569 | | | | — | | | | — | |
| | | |
| Total | | $ | 50,025,882 | | | $ | 1,120,959 | | | $ | — | |
| | | |
| Liabilities(b) | | | | | | | | | | | | |
| | | |
Forward Foreign Currency Exchange Contracts | | $ | — | | | $ | (1,046,241 | ) | | $ | — | |
| (a) | | Amounts are disclosed by continent to highlight the impact of time zone differences between local market close and the calculation of net asset value. Security valuations are based on the principal exchange or system on which they are traded, which may differ from country of domicile. The Funds utilize fair value model prices provided by an independent fair value service for international equities, resulting in a Level 2 classification. |
| (b) | | Amount shown represents unrealized gain (loss) at period end. |
For further information regarding security characteristics, see the Schedule of Investments.
|
| 4. INVESTMENTS IN DERIVATIVES |
The following tables set forth, by certain risk types, the gross value of derivative contracts (not considered to be hedging instruments for accounting disclosure purposes) as of February 28, 2019. These instruments were used as part of the Fund’s investment strategies and to obtain and/or manage exposure related to the risks below. The values in the tables below exclude the effects of cash collateral received or posted pursuant to these derivative contracts, and therefore are not representative of the Fund’s net exposure.
| | | | | | | | | | | | |
| Risk | | Statement of Assets and Liabilities | | Assets | | | Statement of Assets and Liabilities | | Liabilities | |
Interest | | Purchased options, at value | | $ | 34,867,569 | | | — | | $ | — | |
Currency | | Receivable for unrealized gain on forward foreign currency exchange contracts | | | 1,120,959 | | | Payable for unrealized loss on forward foreign currency exchange contracts | | | (1,046,241 | ) |
Equity | | Variation margin on future contracts | | | 15,158,313 | (a) | | — | | | — | |
| Total | | | | $ | 51,146,841 | | | | | $ | (1,046,241 | ) |
| (a) | | Represents unrealized gain (loss) on futures contracts described in the Additional Investment Information sections of the Schedule of Investments. Only current day’s variation margin is reported within the Statement of Assets and Liabilities. |
33
GOLDMAN SACHS GLOBAL MANAGED BETA FUND
Notes to Financial Statements(continued)
February 28, 2019 (Unaudited)
|
| 4. INVESTMENTS IN DERIVATIVES (continued) |
The following tables set forth, by certain risk types, the Fund’s gains (losses) related to these derivatives and their indicative volumes for the six months ended February 28, 2019. These gains (losses) should be considered in the context that these derivative contracts may have been executed to create investment opportunities and/or economically hedge certain investments, and accordingly, certain gains (losses) on such derivative contracts may offset certain (losses) gains attributable to investments. These gains (losses) are included in “Net realized gain (loss)” or “Net change in unrealized gain (loss)” on the Statement of Operations:
| | | | | | | | | | | | | | |
| Risk | | Statement of Operations | | Net Realized Gain (Loss) | | | Net Change in
Unrealized
Gain (Loss) | | | Average
Number of
Contracts(a) | |
| Interest | | Net realized gain (loss) on purchased options/ Net change in unrealized gain (loss) on purchased options | | $ | 1,246,983 | | | $ | (1,199,244 | ) | | | 21 | |
| Currency | | Net realized gain (loss) on forward foreign currency exchange contracts/Net change in unrealized gain (loss) on forward foreign currency exchange contracts | | | 6,661,084 | | | | (3,204,236 | ) | | | 25 | |
| Equity | | Net realized gain (loss) on futures contracts/ Net change in unrealized gain (loss) on futures contracts | | | (20,956,784 | ) | | | 10,874,670 | | | | 1,614 | |
| Total | | | | $ | (13,048,717 | ) | | $ | 6,471,190 | | | | 1,660 | |
| (a) | | Average number of contracts is based on the average of month end balances for the six months ended February 28, 2019. |
In order to better define its contractual rights and to secure rights that will help the Fund mitigate its counterparty risk, the Fund may enter into an International Swaps and Derivatives Association, Inc. Master Agreement (“ISDA Master Agreement”) or similar agreement with its derivatives counterparties. An ISDA Master Agreement is a bilateral agreement between the Fund and a counterparty that governs OTC derivatives (including forward foreign currency exchange contracts, and certain options and swaps), and typically contains, among other things, collateral posting terms and netting provisions in the event of a default and/or termination event. The provisions of the ISDA Master Agreement typically permit a single net payment in the event of a default(close-out netting) or similar event, including the bankruptcy or insolvency of the counterparty.
Collateral and margin requirements differ between exchange traded derivatives and OTC derivatives. Margin requirements are established by the broker or clearing house for exchange-traded and centrally cleared derivatives (financial futures contracts, options and centrally cleared swaps) pursuant to governing agreements for those instrument types. Brokers can ask for margin in excess of the minimum in certain circumstances. Collateral terms are contract-specific for OTC derivatives. For derivatives traded under an ISDA Master Agreement, the collateral requirements are typically calculated by netting the marked to market amount for each transaction under such agreement and comparing that amount to the value of any collateral currently pledged by the Fund and the counterparty. Additionally, the Fund may be required to post initial margin to the counterparty, the terms of which would be outlined in the confirmation of the OTC transaction.
For financial reporting purposes, cash collateral that has been pledged to cover obligations of the Fund and cash collateral received from the counterparty, if any, is reported separately on the Statement of Assets and Liabilities as receivables/payables for collateral on certain derivative contracts.Non-cash collateral pledged by the Fund, if any, is noted in the Schedule of Investments. Generally, the amount of collateral due from or to a counterparty must exceed a minimum transfer amount threshold before a transfer is required to be made. To the extent amounts due to the Fund from its counterparties are not fully collateralized, contractually or otherwise, the Fund bears the risk of loss from counterparty nonperformance. The Fund attempts to mitigate counterparty risk by only entering into agreements with counterparties that the Investment Adviser believes to be of good standing and by monitoring the financial stability of those counterparties.
Additionally, the netting of assets and liabilities and the offsetting of collateral pledged or received are based on contractualnetting/set-off provisions in the ISDA Master Agreement or similar agreements. However, in the event of a default or insolvency of a counterparty, a court could determine that such rights are not enforceable due to the restrictions or prohibitions against the right of setoff that may be imposed in accordance with a particular jurisdiction’s bankruptcy or insolvency laws.
34
GOLDMAN SACHS GLOBAL MANAGED BETA FUND
|
| 5. AGREEMENTS AND AFFILIATED TRANSACTIONS |
A. Management Agreement — Under the Agreement, GSAM manages the Fund, subject to the general supervision of the Trustees.
As compensation for the services rendered pursuant to the Agreement, the assumption of the expenses related thereto and administration of the Fund’s business affairs, including providing facilities, GSAM is entitled to a management fee, accrued daily and paid monthly, equal to an annual percentage rate of 0.30% of the Fund’s average daily net assets.
GSAM has agreed to waive all management fees payable by the Fund, except those management fees it earns from the Fund’s investment of cash collateral received in connection with securities lending transactions in the Goldman Sachs Financial Square Government Fund (the “Government Money Market Fund”). This arrangement will remain in place through at least December 28, 2019 and prior to such date GSAM may not terminate this arrangement without the approval of the Trustees. For the six months ended February 28, 2019, GSAM waived $1,632,122 in management fees.
B. Transfer Agency Agreement — Goldman Sachs also serves as the transfer agent of the Fund for a fee pursuant to the Transfer Agency Agreement. The fees charged for such transfer agency services are accrued daily and paid monthly at annual rate of 0.02% of the average daily net assets of Institutional Shares.
C. Other Expense Agreements and Affiliated Transactions — GSAM has agreed to limit certain “Other Expenses” of the Fund (excluding acquired fund fees and expenses, transfer agency fees and expenses, service fees and shareholder administration fees (as applicable), taxes, interest, brokerage fees, expenses of shareholder meetings, litigation and indemnification, and extraordinary expenses) to the extent such expenses exceed, on an annual basis, a percentage rate of the average daily net assets of the Fund. Such Other Expense reimbursements, if any, are accrued daily and paid monthly. In addition, the Fund is not obligated to reimburse GSAM for prior fiscal year expense reimbursements, if any. The Other Expense limitations as an annual percentage rate of average daily net assets for the Fund is 0.204%. For the period ended February 28, 2019, the Fund did not have any other expense reimbursements from GSAM.
The Fund invests in Institutional Shares of the Government Money Market Fund and the shares of the Goldman Sachs ActiveBeta Emerging Markets Equity ETF Fund, which are affiliated Underlying Funds. GSAM has agreed to reduce or limit “Other Expenses” in an amount equal to the management fee it earns as an investment adviser to any of the affiliated funds in which the Fund invests. For the six months ended February 28, 2019, GSAM waived $128,697 of the Fund’s management fee.
These Other Expense limitations will remain in place through at least December 28, 2019, and prior to such date GSAM may not terminate the arrangements without the approval of the Trustees. In addition, the Fund has entered into certain offset arrangements with the transfer agent, which may result in a reduction of the Fund’s expenses and are received irrespective of the application of the “Other Expense” limitations described above.
D. Line of Credit Facility — As of February 28, 2019, the Fund participated in a $770,000,000 committed, unsecured revolving line of credit facility (the “facility”) together with other funds of the Trust and certain registered investment companies having management agreements with GSAM or its affiliates. This facility is to be used for temporary emergency purposes, or to allow for an orderly liquidation of securities to meet redemption requests. The interest rate on borrowings is based on the federal funds rate. The facility also requires a fee to be paid by the Fund based on the amount of the commitment that has not been utilized. For the six months ended February 28, 2019, the Fund did not have any borrowings under the facility.
E. Other Transactions with Affiliates — The table below shows the transaction in and earnings from investments in the Underlying Funds for the six months ended February 28, 2019.
| | | | | | | | | | | | | | | | | | | | | | | | | | | | |
| Underlying Fund | | Beginning
Value as of August 31,
2018 | | | Purchases
at Cost | | | Proceeds
from Sales | | | Change in
unrealized
gain (loss) | | | Ending Value as of February 28,
2019 | | | Shares as of
February 28,
2019 | | | Dividend
Income | |
Goldman Sachs Financial Square Government Fund — Institutional Shares | | | $84,833,299 | | | $ | 186,653,529 | | | $ | (167,080,970 | ) | | $ | — | | | $ | 104,405,858 | | | | 104,405,858 | | | $ | 931,080 | |
Goldman Sachs ActiveBeta Emerging Markets Equity ETF | | | 31,005,252 | | | | — | | | | — | | | | (226,385 | ) | | | 30,778,867 | | | | 943,269 | | | | 387,429 | |
35
GOLDMAN SACHS GLOBAL MANAGED BETA FUND
Notes to Financial Statements(continued)
February 28, 2019 (Unaudited)
|
| 6. PORTFOLIO SECURITIES TRANSACTIONS |
The cost of purchases and proceeds from sales and maturities of long-term securities for the six months ended February 28, 2019, were $137,879,483 and $145,012,534 respectively.
The Fund may lend its securities through a securities lending agent, the Bank of New York Mellon (“BNYM”), to certain qualified borrowers. In accordance with the Fund’s securities lending procedures, the Fund receives cash collateral at least equal to the market value of the securities on loan. The market value of the loaned securities is determined at the close of business of the Fund, at their last sale price or official closing price on the principal exchange or system on which they are traded, and any additional required collateral is delivered to the Fund on the next business day. As with other extensions of credit, the Fund may experience delay in the recovery of its securities or incur a loss should the borrower of the securities breach its agreement with the Fund or become insolvent at a time when the collateral is insufficient to cover the cost of repurchasing securities on loan. Dividend income received from securities on loan may not be subject to withholding taxes and therefore withholding taxes paid may differ from the amounts listed in the Statement of Operations. Loans of securities are terminable at any time and as such 1) the remaining contractual maturities of the outstanding securities lending transactions are considered to be overnight and continuous and 2) the borrower, after notice, is required to return borrowed securities within the standard time period for settlement of securities transactions.
The Fund invested the cash collateral received in connection with securities lending transactions in the Government Money Market Fund, an affiliated series of the Trust. The Government Money Market Fund is registered under the Act as an open end investment company, is subject to Rule 2a-7 under the Act, and is managed by GSAM, for which GSAM may receive a management fee of up to 0.16% on an annualized basis of the average daily net assets of the Government Money Market Fund.
In the event of a default by a borrower with respect to any loan, BNYM may exercise any and all remedies provided under the applicable borrower agreement to make the Fund whole. These remedies include purchasing replacement securities by applying the collateral held from the defaulting broker against the purchase cost of the replacement securities. If BNYM is unable to purchase replacement securities, BNYM will indemnify the Fund by paying an amount equal to the market value of the securities loaned minus the value of cash collateral received from the borrower for the loan, subject to an exclusion for any shortfalls resulting from a loss of value in such cash collateral due to reinvestment risk. The Funds may enter into master netting agreements with borrowers, which provide the right, in the event of a default (including bankruptcy or insolvency), for the non-defaulting party to liquidate the collateral and calculate net exposure to the defaulting party or request additional collateral. However, in the event of a default by a borrower, a resolution authority could determine that such rights are not enforceable due to the restrictions or prohibitions against the right of set-off that may be imposed in accordance with a particular jurisdiction’s bankruptcy or insolvency laws. The Fund’s loaned securities were all subject to enforceable Securities Lending Agreements and the value of the collateral was at least equal to the value of the cash received. The amounts of the Fund’s overnight and continuous agreements, which represent the gross amounts of recognized liabilities for securities lending transactions outstanding as of February 28, 2019, are disclosed as “Payable upon return of securities loaned” on the Statement of Assets and Liabilities, where applicable. The Fund did not have securities on loan as of February 28, 2019.
Both the Fund and BNYM received compensation relating to the lending of the Fund’s securities. The amounts earned by the Fund for the six months ended February 28, 2019, are reported under Investment Income on the Statement of Operations.
The following table provides information about the Fund’s investment in the Government Money Market Fund for the six months ended February 28, 2019:
| | | | | | | | | | | | | | |
Beginning value
as of August 31, 2018 | | | Purchases at Cost | | | Proceeds from
Sales | | | Ending value as
of February 28, 2019 | |
| $ | 532,050 | | | $ | 73,957,931 | | | $ | (74,489,981 | ) | | $ | — | |
36
GOLDMAN SACHS GLOBAL MANAGED BETA FUND
As of the Fund’s most recent fiscal year ended August 31, 2018 the Fund’s certain timing differences on a tax basis were as follows:
| | | | |
Timing differences (Straddle Loss Deferral) | | $ | (98,995 | ) |
As of February 28, 2019, the Fund’s aggregate security unrealized gains and losses based on cost for U.S. federal income tax purposes were as follows:
| | | | |
Tax Cost | | $ | 1,008,635,307 | |
Gross unrealized gain | | | 137,575,750 | |
Gross unrealized loss | | | (72,620,869 | ) |
Net unrealized gains (losses) | | $ | 64,954,881 | |
The difference between GAAP-basis and tax basis unrealized gains (losses) is attributable primarily to wash sales, net mark to market gains/(losses) on regulated futures and options contracts, net mark to market gains/(losses) on foreign currency contracts, and differences in the tax treatment of underlying fund investments, partnership investments, and passive foreign investment company investments.
GSAM has reviewed the Fund’s tax positions for all open tax years (the current and prior three years, as applicable) and has concluded that no provision for income tax is required in the Fund’s financial statements. Such open tax years remain subject to examination and adjustment by tax authorities.
Derivatives Risk — The Fund’s use of derivatives may result in loss. Derivative instruments, which may pose risks in addition to and greater than those associated with investing directly in securities, currencies or other instruments, may be illiquid or less liquid, volatile, difficult to price and leveraged so that small changes in the value of the underlying instruments may produce disproportionate losses to the Fund. Derivatives are also subject to counterparty risk, which is the risk that the other party in the transaction will not fulfill its contractual obligation. The use of derivatives is a highly specialized activity that involves investment techniques and risks different from those associated with investments in more traditional securities and instruments. Losses from derivatives can also result from a lack of correlation between changes in the value of derivative instruments and the portfolio assets (if any) being hedged.
Foreign and Emerging Countries Risk — Investing in foreign markets may involve special risks and considerations not typically associated with investing in the United States. Foreign securities may be subject to risk of loss because of more or less foreign government regulation, less public information and less economic, political and social stability in the countries in which the Fund invests. The imposition of exchange controls (including repatriation restrictions), confiscations, trade restrictions (including tariffs) and other government restrictions by the United States or other governments, or from problems in share registration, settlement or custody, may also result in losses. Foreign risk also involves the risk of negative foreign currency rate fluctuations, which may cause the value of securities denominated in such foreign currency (or other instruments through which the Fund has exposure to foreign currencies) to decline in value. Currency exchange rates may fluctuate significantly over short periods of time. To the extent that the Fund also invests in securities of issuers located in emerging markets, these risks may be more pronounced.
Foreign Custody Risk — If the Fund invests in foreign securities the Fund may hold such securities and cash with foreign banks, agents, and securities depositories appointed by the Fund’s custodian (each a “Foreign Custodian”). Some foreign custodians may be recently organized or new to the foreign custody business. In some countries, Foreign Custodians may be subject to little or no regulatory oversight over, or independent evaluation of, their operations. Further, the laws of certain countries may place limitations on the Fund’s ability to recover its assets if a Foreign Custodian enters bankruptcy. Investments in emerging markets
37
GOLDMAN SACHS GLOBAL MANAGED BETA FUND
Notes to Financial Statements(continued)
February 28, 2019 (Unaudited)
|
| 9. OTHER RISKS (continued) |
may be subject to even greater custody risks than investments in more developed markets. Custody services in emerging market countries are very often undeveloped and may be considerably less well regulated than in more developed countries, and thus may not afford the same level of investor protection as would apply in developed countries.
Geographic Risk — If the Fund focuses its investments in securities of issuers located in a particular country or geographic region, the Fund may be subjected, to a greater extent than if its investments were less focused, to the risks of volatile economic cycles and/or conditions and developments that may be particular to that country or region, such as: adverse securities markets; adverse exchange rates; adverse social, political, regulatory, economic, business, environmental or other developments; or natural disasters.
Investments in Other Investment Companies Risk — As a shareholder of another investment company, including an exchange-traded fund (“ETF”), the Fund will indirectly bear its proportionate share of any net management fees and other expenses paid by such other investment companies, in addition to the fees and expenses regularly borne by the Fund. ETFs are subject to risks that do not apply to conventional mutual funds, including but not limited to the following: (i) the market price of the ETF’s shares may trade at a premium or a discount to their NAV; and (ii) an active trading market for an ETF’s shares may not develop or be maintained.
Large Shareholder Transactions Risk — The Fund may experience adverse effects when certain large shareholders, such as other funds, institutional investors (including those trading by use ofnon-discretionary mathematical formulas), financial intermediaries (who may make investment decisions on behalf of underlying clients and/or include the Fund in their investment model), individuals, accounts and Goldman Sachs affiliates, purchase or redeem large amounts of shares of the Fund. Such large shareholder redemptions, which may occur rapidly or unexpectedly, may cause the Fund to sell portfolio securities at times when it would not otherwise do so, which may negatively impact the Fund’s NAV and liquidity. These transactions may also accelerate the realization of taxable income to shareholders if such sales of investments resulted in gains, and may also increase transaction costs. In addition, a large redemption could result in the Fund’s current expenses being allocated over a smaller asset base, leading to an increase in the Fund’s expense ratio. Similarly, large Fund share purchases may adversely affect the Fund’s performance to the extent that the Fund is delayed in investing new cash or otherwise maintains a larger cash position than it ordinarily would.
Market and Credit Risks — In the normal course of business, the Fund trades financial instruments and enters into financial transactions where risk of potential loss exists due to changes in the market (market risk). Additionally, the Fund may also be exposed to credit risk in the event that an issuer or guarantor fails to perform or that an institution or entity with which the Fund has unsettled or open transactions defaults.
Sector Risk— To the extent the Fund focuses its investments in securities of issuers in one or more sectors (such as the financial services or telecommunications sectors), the Fund may be subjected, to a greater extent than if its investments were diversified across different sectors, to the risks of volatile economic cycles and/or conditions and developments that may be particular to that sector, such as: adverse economic, business, political, environmental or other developments.
Under the Trust’s organizational documents, its Trustees, officers, employees and agents are indemnified, to the extent permitted by the Act and state law, against certain liabilities that may arise out of performance of their duties to the Fund. Additionally, in the course of business, the Fund enters into contracts that contain a variety of indemnification clauses. The Fund’s maximum exposure under these arrangements is unknown, as this would involve future claims that may be made against the Fund that have not yet occurred. However, GSAM believes the risk of loss under these arrangements to be remote.
38
GOLDMAN SACHS GLOBAL MANAGED BETA FUND
Subsequent events after the Statement of Assets and Liabilities date have been evaluated, and GSAM has concluded that there is no impact requiring adjustment or disclosure in the financial statements.
|
| 12. SUMMARY OF SHARE TRANSACTIONS |
| | | | | | | | | | | | | | | | |
| | | For the Six Months Ended
February 28, 2019
(Unaudited) | | | For the Fiscal Year Ended
August 31, 2018 | |
| | | Shares | | | Dollars | | | Shares | | | Dollars | |
| | | | |
| Institutional Shares | | | | | | | | | | | | | | | | |
Shares sold | | | 8,553,279 | | | $ | 90,890,000 | | | | 67,979,907 | | | $ | 808,670,005 | |
Reinvestment of distributions | | | 3,834,358 | | | | 39,877,290 | | | | 1,818,458 | | | | 21,487,711 | |
Shares redeemed | | | (9,905,250 | ) | | | (113,850,553 | ) | | | (11,945,951 | ) | | | (143,186,818 | ) |
| | | | |
NET INCREASE | | | 2,482,387 | | | $ | 16,916,737 | | | | 57,852,414 | | | $ | 686,970,898 | |
39
GOLDMAN SACHS GLOBAL MANAGED BETA FUND
| | |
| | |
Fund Expenses — Six Month Period Ended February 28, 2019 (Unaudited) | | |
As a shareholder of Institutional Shares of the Fund, you incur two types of costs: (1) transaction costs and (2) ongoing costs and other Fund expenses. This example is intended to help you understand your ongoing costs (in dollars) of investing in the Fund and to compare these costs with the ongoing costs of investing in other mutual funds.
The example is based on an investment of $1,000 invested at the beginning of the period and held for the entire period from September 1, 2018 through February 28, 2019, which represents a period of 181 days out of a 365 day year.
Actual Expenses— The first line in the table below provides information about actual account values and actual expenses. You may use the information in this line, together with the amount you invested, to estimate the expenses that you paid over the period. Simply divide your account value by $1,000 (for example, an $8,600 account value divided by $1,000=8.6), then multiply the result by the number in the first line under the heading entitled “Expenses Paid” to estimate the expenses you paid on your account during this period.
Hypothetical Example for Comparison Purposes— The second line in the table below provides information about hypothetical account values and hypothetical expenses based on the Fund’s actual net expense ratios and an assumed rate of return of 5% per year before expenses, which is not the Fund’s actual return. The hypothetical account values and expenses may not be used to estimate the actual ending account balance or expenses you paid for the period. You may use this information to compare the ongoing costs of investing in the Fund and other funds. To do so, compare this 5% hypothetical example with the 5% hypothetical examples that appear in the shareholder reports of the other funds.
Please note that the expenses shown in the table are meant to highlight your ongoing costs only and do not reflect any transactional costs, such as sales charges, redemption fees, or exchange fees. Therefore, the second line of the table is useful in comparing ongoing costs only, and will not help you determine the relative total costs of owning different funds. In addition, if these transactional costs were included, your costs
| | | | | | | | | | | | |
| Share Class | | Beginning
Account
Value
9/1/18 | | | Ending
Account
Value
2/28/19 | | | Expenses
Paid for the
6 months
ended
2/28/19* | |
| Institutional | | | | | | | | | | | | |
Actual | | $ | 1,000.00 | | | $ | 966.20 | | | $ | 0.10 | |
Hypothetical 5% return | | | 1,000.00 | | | | 1,024.70 | + | | | 0.10 | |
| | + | | Hypothetical expenses are based on each Fund’s actual annualized net expense ratios and an assumed rate of return of 5% per year before expenses. | |
| | * | | Expenses are calculated using the Fund’s annualized net expense ratio for each class, which represents the ongoing expenses as a percentage of net assets for the six months ended February 28, 2019. Expenses are calculated by multiplying the annualized net expense ratio by the average account value for the period; then multiplying the result by the number of days in the most recent fiscal half year; and then dividing that result by the number of days in the fiscal year. The annualized net expense ratios for the period was 0.05%. | |
40
FUNDS PROFILE
Goldman Sachs Funds
Goldman Sachs is a premier financial services firm, known since 1869 for creating thoughtful and customized investment solutions in complex global markets.
Today, theInvestment Management Division of Goldman Sachs serves a diverse set of clients worldwide, including private institutions, public entities and individuals. With approximately $1.34 trillion in assets under supervision as of December 31, 2018, Goldman Sachs Asset Management (“GSAM”) has portfolio management teams located around the world and our investment professionals bring firsthand knowledge of local markets to every investment decision. Assets under supervision includes assets under management and other client assets for which Goldman Sachs does not have full discretion. GSAM leverages the resources of Goldman Sachs & Co. LLC subject to legal, internal and regulatory restrictions.
Money Market
Financial Square FundsSM
| ∎ | | Financial Square Treasury Solutions Fund1 |
| ∎ | | Financial Square Government Fund1 |
| ∎ | | Financial Square Money Market Fund2 |
| ∎ | | Financial Square Prime Obligations Fund2 |
| ∎ | | Financial Square Treasury Instruments Fund1 |
| ∎ | | Financial Square Treasury Obligations Fund1 |
| ∎ | | Financial Square Federal Instruments Fund1 |
Investor FundsSM
| ∎ | | Investor Money Market Fund3 |
| ∎ | | InvestorTax-Exempt Money Market Fund3 |
Fixed Income
Short Duration and Government
| ∎ | | High Quality Floating Rate Fund |
| ∎ | | Short-Term Conservative Income Fund |
| ∎ | | Short Duration Government Fund |
| ∎ | | Short Duration Income Fund |
| ∎ | | Inflation Protected Securities Fund |
Multi-Sector
Municipal andTax-Free
| ∎ | | High Yield Municipal Fund |
| ∎ | | Dynamic Municipal Income Fund |
| ∎ | | Short DurationTax-Free Fund |
| ∎ | | Municipal Income Completion Fund |
Single Sector
| ∎ | | Investment Grade Credit Fund |
| ∎ | | High Yield Floating Rate Fund |
| ∎ | | Emerging Markets Debt Fund |
| ∎ | | Local Emerging Markets Debt Fund |
Fixed Income Alternatives
| ∎ | | Long Short Credit Strategies Fund |
Fundamental Equity
| ∎ | | Small/Mid Cap Value Fund |
| ∎ | | Small/Mid Cap Growth Fund |
| ∎ | | Concentrated Growth Fund |
| ∎ | | Technology Opportunities Fund |
| ∎ | | Growth Opportunities Fund |
| ∎ | | Rising Dividend Growth Fund |
Tax-Advantaged Equity
| ∎ | | U.S.Tax-Managed Equity Fund |
| ∎ | | InternationalTax-Managed Equity Fund |
| ∎ | | U.S. Equity Dividend and Premium Fund |
| ∎ | | International Equity Dividend and Premium Fund |
Equity Insights
| ∎ | | Small Cap Equity Insights Fund |
| ∎ | | U.S. Equity Insights Fund |
| ∎ | | Small Cap Growth Insights Fund |
| ∎ | | Large Cap Growth Insights Fund |
| ∎ | | Large Cap Value Insights Fund |
| ∎ | | Small Cap Value Insights Fund |
| ∎ | | International Small Cap Insights Fund |
| ∎ | | International Equity Insights Fund |
| ∎ | | Emerging Markets Equity Insights Fund |
Fundamental Equity International
| ∎ | | International Equity Income Fund |
| ∎ | | International Equity ESG Fund |
| ∎ | | Emerging Markets Equity Fund |
| ∎ | | ESG Emerging Markets Equity Fund |
Select Satellite
| ∎ | | Real Estate Securities Fund |
| ∎ | | International Real Estate Securities Fund |
| ∎ | | Commodity Strategy Fund |
| ∎ | | Global Real Estate Securities Fund |
| ∎ | | Alternative Premia Fund |
| ∎ | | Absolute Return Tracker Fund |
| ∎ | | Managed Futures Strategy Fund |
| ∎ | | MLP Energy Infrastructure Fund |
| ∎ | | Multi-Manager Alternatives Fund |
| ∎ | | Absolute Return Multi-Asset Fund |
| ∎ | | Global Infrastructure Fund |
Total Portfolio Solutions
| ∎ | | Global Managed Beta Fund |
| ∎ | | Multi-ManagerNon-Core Fixed Income Fund |
| ∎ | | Multi-Manager U.S. Dynamic Equity Fund |
| ∎ | | Multi-Manager Global Equity Fund |
| ∎ | | Multi-Manager International Equity Fund |
| ∎ | | Tactical Tilt Overlay Fund |
| ∎ | | Balanced Strategy Portfolio |
| ∎ | | Multi-Manager U.S. Small Cap Equity Fund |
| ∎ | | Multi-Manager Real Assets Strategy Fund |
| ∎ | | Growth and Income Strategy Portfolio |
| ∎ | | Growth Strategy Portfolio |
| ∎ | | Dynamic Global Equity Fund4 |
| ∎ | | Satellite Strategies Portfolio |
| ∎ | | Enhanced Dividend Global Equity Portfolio |
| ∎ | | Tax-Advantaged Global Equity Portfolio |
| ∎ | | Strategic Factor Allocation Fund |
| ∎ | | Target Date 2020 Portfolio |
| ∎ | | Target Date 2025 Portfolio |
| ∎ | | Target Date 2030 Portfolio |
| ∎ | | Target Date 2035 Portfolio |
| ∎ | | Target Date 2040 Portfolio |
| ∎ | | Target Date 2045 Portfolio |
| ∎ | | Target Date 2050 Portfolio |
| ∎ | | Target Date 2055 Portfolio |
| ∎ | | Target Date 2060 Portfolio |
| ∎ | | GQG Partners International Opportunities Fund |
| 1 | | You could lose money by investing in the Fund. Although the Fund seeks to preserve the value of your investment at $1.00 per share, it cannot guarantee it will do so. An investment in the Fund is not a deposit of a bank and is not insured or guaranteed by the Federal Deposit Insurance Corporation or any other government agency. The Fund’s sponsor has no legal obligation to provide financial support to the Fund, and you should not expect that the sponsor will provide financial support to the Fund at any time. |
| 2 | | You could lose money by investing in the Fund. Because the share price of the Fund will fluctuate, when you sell your shares they may be worth more or less than what you originally paid for them. The Fund may impose a fee upon sale of your shares or may temporarily suspend your ability to sell shares if the Fund’s liquidity falls below required minimums because of market conditions or other factors. An investment in the Fund is not a deposit of a bank and is not insured or guaranteed by the Federal Deposit Insurance Corporation or any other government agency. The Fund’s sponsor has no legal obligation to provide financial support to the Fund, and you should not expect that the sponsor will provide financial support to the Fund at any time. |
| 3 | | You could lose money by investing in the Fund. Although the Fund seeks to preserve the value of your investment at $1.00 per share, it cannot guarantee it will do so. The Fund may impose a fee upon sale of your shares or may temporarily suspend your ability to sell shares if the Fund’s liquidity falls below required minimums because of market conditions or other factors. An investment in the Fund is not a deposit of a bank and is not insured or guaranteed by the Federal Deposit Insurance Corporation or any other government agency. The Fund’s sponsor has no legal obligation to provide financial support to the Fund, and you should not expect that the sponsor will provide financial support to the Fund at any time. |
| 4 | | Effective after the close of business on February 28, 2019, the Goldman Sachs Equity Growth Strategy Portfolio was renamed the Goldman Sachs Dynamic Global Equity Fund. |
Financial Square FundsSM and Investor FundsSM are registered service marks of Goldman Sachs & Co. LLC.
| * | | This list coversopen-end funds only. Please visit our website at www.GSAMFUNDS.com to learn about ourclosed-end funds and exchange-traded funds. |
| | |
TRUSTEES Jessica Palmer,Chair Kathryn A. Cassidy Diana M. Daniels James A. McNamara Roy W. Templin Gregory G. Weaver | | OFFICERS James A. McNamara,President Scott M. McHugh,Treasurer, Senior Vice President and Principal Financial Officer Joseph F. DiMaria,Assistant Treasurerand Principal Accounting Officer Caroline L. Kraus,Secretary |
| |
GOLDMAN SACHS & CO. LLC Distributor and Transfer Agent | | GOLDMAN SACHS ASSET MANAGEMENT, L.P. Investment Adviser |
Visit our web site atwww.GSAMFUNDS.com to obtain the most recentmonth-end returns.
Goldman Sachs Asset Management, L.P., 200 West Street, New York, New York 10282
The reports concerning the Fund included in this shareholder report may contain certain forward-looking statements about the factors that may affect the performance of the Fund in the future. These statements are based on Fund management’s predictions and expectations concerning certain future events and their expected impact on the Fund, such as performance of the economy as a whole and of specific industry sectors, changes in the levels of interest rates, the impact of developing world events, and other factors that may influence the future performance of the Fund. Management believes these forward-looking statements to be reasonable, although they are inherently uncertain and difficult to predict. Actual events may cause adjustments in portfolio management strategies from those currently expected to be employed.
A description of the policies and procedures that the Fund uses to determine how to vote proxies relating to portfolio securities and information regarding how a Fund voted proxies relating to portfolio securities during the most recent12-month period ended June 30 is available (I) without charge, upon request by calling1-800-621-2550 (for Institutional Shareholders); and (II) on the Securities and Exchange Commission (’’SEC’’) web site at http://www.sec.gov.
The website links provided are for your convenience only and are not an endorsement or recommendation by GSAM of any of these websites or the products or services offered. GSAM is not responsible for the accuracy and validity of the content of these websites.
The Fund will file portfolio holdings information for each month in a fiscal quarter within 60 days after the end of the relevant fiscal quarter on Form N-PORT. Portfolio holdings information for the third month of each fiscal quarter will be made available on the SEC’s web site at http://www.sec.gov. Portfolio holdings information may be obtained upon request and without charge by calling1-800-621-2550 (for Institutional Shareholders).
Fund holdings and allocations shown are as of February 28, 2019 and may not be representative of future investments. Fund holdings should not be relied on in making investment decisions and should not be construed as research or investment advice regarding particular securities. Current and future holdings are subject to risk.
Economic and market forecasts presented herein reflect our judgment as of the date of this presentation and are subject to change without notice. These forecasts do not take into account the specific investment objectives, restrictions, tax and financial situation or other needs of any specific client. Actual data will vary and may not be reflected here. These forecasts are subject to high levels of uncertainty that may affect actual performance. Accordingly, these forecasts should be viewed as merely representative of a broad range of possible outcomes. These forecasts are estimated, based on assumptions, and are subject to significant revision and may change materially as economic and market conditions change. Goldman Sachs has no obligation to provide updates or changes to these forecasts. Case studies and examples are for illustrative purposes only.
Diversification does not protect an investor from market risk and does not ensure a profit.
This material is not authorized for distribution to prospective investors unless preceded or accompanied by a current Prospectus or summary prospectus, if applicable. Investors should consider the Fund’s objective, risks, and charges and expenses, and read the summary prospectus, if available, and/or the Prospectus carefully before investing or sending money. The summary prospectus, if available, and the Prospectus contain this and other information about the Fund and may be obtained from your authorized dealer or from Goldman Sachs & Co. LLC by calling1-800-621-2550.
© 2019 Goldman Sachs. All rights reserved. 162452-OTU-960951 MGDBETASAR-19/136
Goldman Sachs Funds

| | | | |
| | |
| Semi-Annual Report | | | | February 28, 2019 |
| | |
| | | | GlobalTax-Aware Equity Portfolios |
| | | | Enhanced Dividend Global Equity Portfolio |
| | | | Tax-Advantaged Global Equity Portfolio |
It is our intention that beginning on January 1, 2021, paper copies of the Portfolios’ annual and semi-annual shareholder reports will no longer be sent by mail, unless you specifically request paper copies of the reports from a Portfolio or from your financial intermediary. Instead, the reports will be made available on a website, and you will be notified by mail each time a report is posted and provided with a website link to access the report.
If you already elected to receive shareholder reports electronically, you will not be affected by this change and you need not take any action. At any time, you may elect to receive reports and certain communications from a Portfolio electronically by calling the applicable toll-free number below or by contacting your financial intermediary.
You may elect to receive all future shareholder reports in paper free of charge. If you hold shares of a Portfolio directly with the Portfolio’s transfer agent, you can inform the transfer agent that you wish to receive paper copies of reports by calling toll-free 800-621-2550 for Institutional, Class R6 and Class P shareholders or 800-526-7384 for all other shareholders. If you hold shares of a Portfolio through a financial intermediary, please contact your financial intermediary to make this election. Your election to receive reports in paper will apply to all Goldman Sachs Funds held in your account if you invest through your financial intermediary or all Goldman Sachs Funds held with the Portfolios’ transfer agent if you invest directly with the transfer agent.

Goldman Sachs GlobalTax-Aware Equity Portfolios
| ∎ | | ENHANCED DIVIDEND GLOBAL EQUITY PORTFOLIO |
| ∎ | | TAX-ADVANTAGED GLOBAL EQUITY PORTFOLIO |
| | | | |
| | | |
| NOT FDIC-INSURED | | May Lose Value | | No Bank Guarantee |
MARKET REVIEW
Goldman Sachs GlobalTax-Aware Equity Portfolios
|
| |
| Investment Strategy |
| |
| The Portfolios invest in a strategic mix of Underlying Funds and other securities with the goal of achieving long-term growth of capital (both Portfolios) and current income (Goldman Sachs Enhanced Dividend Global Equity Portfolio only). Under normal conditions, at least 80% of the Portfolios’ total assets measured at the time of purchase will be allocated among the Underlying Funds that currently exist or that may become available for investment in the future for which Goldman Sachs Asset Management (“GSAM”) or an affiliate, now or in the future, acts as investment adviser or principal underwriter. Some of the Underlying Funds invest primarily in fixed income or money market instruments and other Underlying Funds invest primarily in equity securities. The Portfolios may also invest directly in the Underlying Tactical Fund (as defined below) and other securities or instruments, including unaffiliated exchange-traded funds and derivatives, and can use these investments for implementing tactical tilts. Under normal circumstances, each of the Portfolios also has a small strategic allocation to U.S. investment grade corporate bonds, which is used to help fund the tactical tilts. |
Market Review
During the six months ended February 28, 2019 (the “Reporting Period”), the financial markets were influenced most by global economic growth data, central bank monetary policy and geopolitics. U.S. and international stocks lost ground, while emerging markets equities eked out a small gain. The fixed income market recorded a positive return during the Reporting Period.
Equity Markets
When the Reporting Period began in September 2018, volatility was high in the equity markets, fueled by harsh trade rhetoric between the U.S. and China as well as key U.S. allies and by strong U.S. macroeconomic data relative to other developed markets and to emerging markets. Against a backdrop of solid U.S. economic growth, near-target inflation and healthy monthly job gains, the Federal Reserve (“Fed”) raised short-term interest rates by 25 basis points, in line with market expectations. (A basis point is 1/100th of a percentage point.)
In October 2018, global equities broadly retreated, as investor sentiment rapidly deteriorated on a delayed response to a rise in global interest rates earlier in the month, a moderation of global economic growth expectations, hawkish rhetoric from the Fed, and corporate concerns about global economic growth and trade expressed in third quarter 2018 earnings guidance. (Hawkish rhetoric tends to imply higher interest rates; opposite of dovish.) U.S. stocks and emerging markets equities then rebounded in November 2018 on more accommodative comments from Fed Chair Jerome Powell and on headway being made in U.S.-China trade talks. However, international equities see-sawed during the month based on trade, political and economic growth concerns on the one hand and Fed Chair Powell’s dovish comments and encouraging progress in U.S.-China trade talks on the other. During December 2018, global equities broadly plunged on renewed investor fears sparked by the arrest of a Chinese technology executive, the partial U.S. federal government shutdown, the U.S. President’s criticism of Fed Chair Powell and reignited corporate earnings growth concerns. Escalating trade tensions, worries about slowing global economic growth and populist politics also weighed on market sentiment during the month.
1
MARKET REVIEW
In January 2019, dovish Fed commentary indicating a possible pause in its hiking cycle, headlines about easing trade tensions, and strong corporate earnings propelled global equity markets higher despite the ongoing U.S. government shutdown and decelerating emerging markets demand. Releases of economic data in January indicated economic growth had stabilized in the U.S. but had continued to weaken in other developed economies, such as those of Europe and Japan. The International Monetary Fund also lowered its expectations for global economic growth. In Europe, Brexit headlines remained center-stage as the outcome remained uncertain. (Brexit refers to the U.K. efforts to leave the European Union.) Toward month end, U.S. and international equities were supported by a resolution to the U.S. government shutdown. The Fed kept its monetary policy unchanged at its January meeting and maintained its dovish tilt, saying it would be “patient” about interest rate increases and describing inflationary pressures as “muted.”
U.S. and international equities continued to rally in February 2019, as corporate earnings growth remained solid, surpassing consensus expectations. Emerging markets equities ended the month relatively unchanged. Investor sentiment was buoyed overall by news that the deadline for further U.S. tariffs on Chinese goods would be extended because of promising developments in deal negotiations. The Fed reaffirmed its dovish stance, announcing its intention to conclude its balance sheet unwind in the near future. (The Fed unwinds, or shrinks, its balance sheet by selling securities on its balance sheet and/or not reinvesting maturing securities.) Additionally, U.S. and international equity markets were positively surprised by the 2.6% U.S. Gross Domestic Product growth rate for the fourth quarter of 2018, which was reported at the end of February 2019. Signs of weakening economic momentum persisted in Europe, however, while Brexit continued to weigh on business sentiment during the month.
Fixed Income Markets
Spread, or non-government bond, sectors generally performed well in September 2018. U.S. economic growth remained strong, though some major economies, including those of the Eurozone, the U.K. and China, exhibited a gradual weakening trend. The Fed delivered the eighth interest rate hike of its current tightening cycle, with its dot plot pointing to another increase by the end of 2018 and three more during 2019. (The “dot plot” shows rate projections of the members of the Fed’s Open Market Committee.) Fed Chair Powell delivered an upbeat assessment of the U.S. economy, which supported market expectations for these additional Fed rate hikes in 2019. U.S. Treasury rates rose in response, followed, in turn, by the interest rates of several other developed markets countries. The U.S. dollar was broadly flat versus many major currencies during the month.
During the fourth quarter of 2018, investor concerns about slowing global economic growth momentum as well as tighter financial conditions, mainly in the U.S., weighed on spread sector performance. In particular, U.S. corporate bonds experienced notable weakness, as credit spreads, or yield differentials versus U.S. Treasury securities, widened significantly. U.S. Treasury yields fell as investors grew fearful about the possible end of the global economic cycle and as their expectations for Fed rate hikes diminished. In December 2018, Fed policymakers raised short-term interest rates, much as the market had expected, but lowered their projection for 2019 monetary policy tightening from three rate hikes to two. U.S. economic activity data remained in expansionary territory during the fourth calendar quarter but moderated from cycle highs. Headline inflation pressures eased as crude oil prices declined. The U.S. dollar appreciated relative to many major currencies in the fourth calendar quarter.
2
MARKET REVIEW
Spread sectors generally posted gains in January 2019, as investor risk sentiment heightened on the back of a more dovish Fed. Other factors supporting spread sector performance were higher crude oil prices, several upside corporate earnings surprises and somewhat positive U.S.-China trade developments. The Fed left its monetary policy unchanged and eliminated language about “further gradual increases in rates,” cementing investor expectations for a near-term pause in short-term rate hikes. Fed Chair Powell emphasized that the U.S. central bank would be largely guided by inflation indicators as well as by the global economic growth backdrop and the potential for financial market volatility. In January, the U.S. dollar weakened versus many major currencies.
Spread sectors overall continued to advance during February 2019, supported by the accommodative stances of global central banks overall and the de-escalation of U.S.-China trade tensions. In the U.S., the release of the minutes from the Fed’s January meeting confirmed policymakers’ dovish tilt. U.S. economic growth softened but continued to hold its own as global economic growth slowed. While European economic growth weakened, the European Central Bank (“ECB”) left its monetary policy unchanged at its February meeting.(On March 7th, after the end of the Reporting Period, the ECB extended its forward guidance to signal unchanged rates through 2019 and unveiled financing support for the banking sector.) In the U.K., uncertainty about Britain’s exit from the European Union led the Bank of England to adopt a slightly more dovish tone. The U.S. dollar strengthened slightly versus many major currencies during February 2019.
Looking Ahead
At the end of the Reporting Period, we believed the pace of U.S. economic growth would moderate during 2019 and the slowdown in other economies would stabilize. Meanwhile, we believed many emerging markets economies remained in the early stages of recovery with room to run. In our view, continued global economic expansion may well underpin corporate earnings growth and support the performance of risk assets over the near team. Additionally, corporate profit margins have been expanding, and we believed financial imbalances pose idiosyncratic rather than systemic challenges. In the months ahead, we expect investor concerns about the long economic cycle, trade tensions and populist politics to persist.
3
PORTFOLIO RESULTS
Goldman Sachs Enhanced Dividend
Global Equity Portfolio
Investment Objective
The Portfolio seeks long-term growth of capital and current income.
Portfolio Management Discussion and Analysis
Below, the Goldman Sachs Quantitative Investment Strategies Team discusses the Goldman Sachs Enhanced Dividend Global Equity Portfolio’s (the “Portfolio”) performance and positioning for the six-month period ended February 28, 2019 (the “Reporting Period”).
| Q | | How did the Portfolio perform during the Reporting Period? |
| A | | During the Reporting Period, the Portfolio’s Class A, Institutional, Class P and Class R6 Shares generated cumulative total returns, without sales charges, of -3.03%,-2.88%, -2.88% and -2.97%, respectively. These returns compare to the-2.78% cumulative total return of the Portfolio’s blended benchmark, the Enhanced Dividend Global Equity Composite Index (“EDGE Composite Index”), over the same time period. The components of the EDGE Composite Index — the MSCI All Country World Index (ACWI) Investable Market Index (“MSCI ACWI IMI”) (90%) and the Bloomberg Barclays U.S. Aggregate Bond Index (10%) — returned -3.46% and 1.99%, respectively, during the Reporting Period. |
| Q | | What key factors affected the Portfolio’s performance during the Reporting Period? |
| A | | During the Reporting Period, the Portfolio’s strategic weightings detracted from its performance versus the EDGE Composite Index. (The strategic weightings are based upon Goldman Sachs Investment Strategy Group’s (“ISG”) assumptions regarding long-term expected returns, expected volatilities and expected correlations, as well as the investments views of Goldman Sachs ISG.) Our tactical asset allocation decisions (“tactical tilts”) also detracted, albeit more slightly, from relative returns. The overall performance of the Underlying Funds contributed positively to the Fund’s relative results during the Reporting Period. |
| Q | | How were the Portfolio’s tactical asset allocation decisions managed during the Reporting Period? |
| A | | In keeping with our investment process, we implement tactical tilts, based on Goldman Sachs ISG’s views about near-term expected market returns, in an attempt to enhance performance. These tactical tilts are implemented through an investment in the Goldman Sachs Tactical Tilt Overlay Fund (the “Underlying Tactical Fund”), which seeks long-term total return through the implementation of investment ideas that are generally derived from short-term or medium-term market views on a variety of asset classes and instruments. As mentioned previously, the Portfolio’s tactical tilts slightly detracted from its performance during the Reporting Period. |
| Q | | How did the Portfolio’s Underlying Funds perform relative to their respective benchmark indices during the Reporting Period? |
| A | | To implement strategic weightings and our tactical tilts, the Portfolio invests in 10 Underlying Funds. Nine of these Underlying Funds may be used to implement strategic weightings (“Underlying Strategic Funds”). The Underlying Tactical Fund, as mentioned previously, is used to implement tactical tilts. |
| | During the Reporting Period, the Portfolio was invested in eight of the nine Underlying Strategic Funds, six of which underperformed their respective benchmark indices. (The Portfolio did not have an allocation to the Goldman Sachs Core Fixed Income Fund during the Reporting Period.) |
| | The Underlying Strategic Funds that underperformed their respective benchmark indices most during the Reporting Period were the Goldman Sachs Emerging Markets Equity Insights Fund, the Goldman Sachs Global Infrastructure Fund, the Goldman Sachs International Small Cap Insights Fund, the Goldman Sachs Small Cap Equity Insights Fund and the Goldman Sachs MLP Energy Infrastructure Fund. Another one of the Underlying Strategic Funds that underperformed in relative terms — the Goldman Sachs International Equity Dividend and Premium Fund — is one of two in which the Portfolio invested a significant percentage of its equity allocation. |
4
PORTFOLIO RESULTS
| | The Goldman Sachs U.S. Equity Dividend and Premium Fund, the other Underlying Strategic Fund in which the Portfolio invested a significant percentage of its equity allocation, outperformed its benchmark index during the Reporting Period. In addition, the Goldman Sachs Global Real Estate Securities Fund outperformed its benchmark index during the Reporting Period. |
| | The Portfolio’s Underlying Tactical Fund outperformed its cash benchmark1 index by approximately 48 basis points1 during the Reporting Period. (A basis point is 1/100th of a percent.) |
| Q | | How did call writing affect performance? |
| A | | As mentioned above, the Portfolio’s two largest allocations were to the Goldman Sachs U.S. Equity Dividend and Premium Fund and the Goldman Sachs International Equity Dividend and Premium Fund, which earn premiums through an equity index call writing strategy. When equity markets are down, flat or modestly positive, these Underlying Strategic Funds tend to outperform their respective benchmark indices because of the premiums they earn from call writing. When equity markets rally strongly, these two Underlying Strategic Funds are likely to trail their respective benchmark indices. Although the Underlying Strategic Funds keep the premiums they earn from call writing, they can underperform when the call options are exercised. |
| | As the U.S. and international equity markets declined during the Reporting Period, the call writing strategies of the Goldman Sachs U.S. Equity Dividend and Premium Fund and the Goldman Sachs International Equity Dividend and Premium Fund added to performance. |
| Q | | How did the Portfolio use derivatives and similar instruments during the Reporting Period? |
| A | | During the Reporting Period, the Portfolio employed Standard & Poor’s 500® Index (“S&P 500® Index”) futures as part of its strategic weightings in U.S. large-cap growth stocks and U.S. large-cap value stocks, which did not have a material impact on performance. The Portfolio also utilized forward foreign currency exchange contracts to take positions in the British pound, euro, Australian dollar, Swiss franc and Japanese yen. These currency hedging positions had a positive impact on the Portfolio’s performance during the Reporting Period. |
| | In addition, some of the Portfolio’s Underlying Funds, including the Portfolio’s Underlying Tactical Fund, used derivatives during the Reporting Period to apply their active investment views with greater versatility or to afford greater risk management precision. As market conditions warranted during the Reporting Period, some of these Underlying Funds engaged in forward foreign currency exchange contracts, financial futures contracts, options and swap contracts to enhance portfolio return and for hedging purposes. |
| Q | | What changes did you make during the Reporting Period within the Portfolio? |
| A | | No significant changes were made within the Portfolio during the Reporting Period. |
| Q | | What was the Portfolio’s strategy at the end of the Reporting Period? |
| A | | Going forward, we plan to maintain a diversified equity portfolio that implements our strategic and tactical views as we continue to seek long-term growth of capital and current income. |
| | 1 | | Performance quoted is for Institutional Shares. |
5
FUND BASICS
Enhanced Dividend Global Equity Portfolio
as of February 28, 2019
| | | | | | | | | | | | | | | | | | |
| | PERFORMANCE REVIEW | |
| | | | | |
| | | September 1, 2018–February 28, 2019 | | Portfolio
Total Return
(based on NAV)1 | | | EDGE
Composite
Index2 | | | Bloomberg
Barclays U.S.
Aggregate Bond
Index3 | | | MSCI ACWI
IMI4 | |
| | | | | |
| | Class A | | | -3.03 | % | | | -2.78 | % | | | 1.99 | % | | | -3.46 | % |
| | Institutional | | | -2.88 | | | | -2.78 | | | | 1.99 | | | | -3.46 | |
| | Class P | | | -2.88 | | | | -2.78 | | | | 1.99 | | | | -3.46 | |
| | | Class R6 | | | -2.97 | | | | -2.78 | | | | 1.99 | | | | -3.46 | |
| | 1 | | The net asset value (“NAV”) represents the net assets of the class of the Portfolio(ex-dividend) divided by the total number of shares of the class outstanding. The Portfolio’s performance reflects the reinvestment of dividends and other distributions. The Portfolio’s performance does not reflect the deduction of any applicable sales charges. |
| | 2 | | The EDGE Composite Index (“EDGE Composite”) is a composite representation prepared by the investment adviser of the performance of the Portfolio’s asset classes weighted according to their respective weightings in the Portfolio’s target range. |
| | | | The EDGE Composite is comprised of MSCI ACWI IMI (90%) and the Bloomberg Barclays U.S. Aggregate Bond Index (10%). The EDGE Composite figures do not reflect any deduction for fees, expenses or taxes. |
| | 3 | | The Bloomberg Barclays U.S. Aggregate Bond Index represents an unmanaged diversified portfolio of fixed income securities, including U.S. Treasuries, investment grade corporate bonds and mortgage backed and asset-backed securities. |
| | 4 | | The MSCI ACWI IMI captures large, mid and small cap representation across 23 developed markets and 23 emerging markets. With 8,686 constituents, the MSCI ACWI IMI is comprehensive, covering approximately 99% of the global equity investment opportunity set. As of February 28, 2019, the 23 developed markets in the MSCI ACWI IMI include Australia, Austria, Belgium, Canada, Denmark, Finland, France, Germany, Hong Kong, Ireland, Israel, Italy, Japan, Netherlands, New Zealand, Norway, Portugal, Singapore, Spain, Sweden, Switzerland, the U.K. and the U.S. The 23 emerging markets include Brazil, Chile, China, Colombia, Czech Republic, Egypt, Greece, Hungary, India, Indonesia, South Korea, Malaysia, Mexico, Peru, Philippines, Poland, Russia, Qatar, South Africa, Taiwan, Thailand, Turkey and United Arab Emirates. |
| | | | | | | | | | | | | | | | | | | | |
| | STANDARDIZED TOTAL RETURNS5 | | | |
| | | | | | |
| | | For the period ended
12/31/18 | | One Year | | | Five Years | | | Ten Years | | | Since Inception | | | Inception Date |
| | | | | | |
| | Class A | | | -13.63 | % | | | 2.01 | % | | | 8.01 | % | | | 3.93 | % | | 4/30/08 |
| | Institutional | | | -8.27 | | | | 3.59 | | | | 9.06 | | | | 4.91 | | | 4/30/08 |
| | Class P | | | N/A | | | | N/A | | | | N/A | | | | -8.72 | | | 4/17/18 |
| | | Class R6 | | | -8.27 | | | | N/A | | | | N/A | | | | -8.20 | | | 12/29/17 |
| | 5 | | The Standardized Total Returns are average annual total returns or cumulative total returns (only if the performance period is one year or less) as of the most recent calendarquarter-end. They assume reinvestment of all distributions at NAV. These returns reflect a maximum initial sales charge of 5.50% for Class A Shares. Because Institutional, Class P and Class R6 Shares do not involve a sales charge, such a charge is not applied to their Standardized Total Returns. |
The returns set forth in the tables above represent past performance. Past performance does not guarantee future results. The Portfolio’s investment return and principal value will fluctuate so that an investor’s shares, when redeemed, may be worth more or less than their original cost. Current performance may be lower or higher than the performance quoted above. Please visit our web site at www.GSAMFUNDS.com to obtain the most recentmonth-end returns. Performance reflects applicable fee waivers and/or expense limitations in effect during the periods shown. In their absence, performance would be reduced. Returns do not reflect the deduction of taxes that a shareholder would pay on Portfolio distributions or the redemption of Portfolio shares.
6
FUND BASICS
| | | | | | | | | | |
| | EXPENSE RATIOS6 | |
| | | |
| | | | | Net Expense Ratio (Current) | | | Gross Expense Ratio (Before Waivers) | |
| | | |
| | Class A | | | 1.34 | % | | | 1.44 | % |
| | Institutional | | | 0.95 | | | | 1.05 | |
| | Class P | | | 0.94 | | | | 1.04 | |
| | | Class R6 | | | 0.94 | | | | 1.04 | |
| | 6 | | The expense ratios of the Portfolio, both current (net of applicable fee waivers and/or expense limitations) and before waivers (gross of applicable fee waivers and/or expense limitations), are as set forth above according to the most recent publicly available Prospectus for the Portfolio and may differ from the expense ratios disclosed in the Financial Highlights in this report. Pursuant to contractual arrangements, the Portfolio’s waivers and/or expense limitations will remain in place through at least December 28, 2019, and prior to such date the Investment Adviser may not terminate the arrangements without the approval of the Portfolio’s Board of Trustees. If these arrangements are discontinued in the future, the expense ratios may change without shareholder approval. |
| | | | | | | | | | | | | | | | | | |
| | STANDARDIZED AFTER-TAX PERFORMANCE AS OF 12/31/187 | |
| | | | | |
| | | Class A Shares | | One Year | | | Five Years | | | Ten Years | | | Since Inception
(4/30/08) | |
| | | | | |
| | Return before taxes* | | | -13.63 | % | | | 2.01 | % | | | 8.01 | % | | | 3.93 | % |
| | Return after taxes on distributions** | | | -14.72 | | | | 0.89 | | | | 7.06 | | | | 3.04 | |
| | | Return after taxes on distributions
and sale of Portfolio shares*** | | | -7.32 | | | | 1.46 | | | | 6.46 | | | | 3.04 | |
| 7 | | The after-tax returns are calculated using the historically highest individual federal marginal income tax rates at the time of distributions and do not reflect state and local taxes. The 2017 tax rates (23.8% for qualifying ordinary income dividends and long-term capital gain distributions and 43.4% for non-qualifying ordinary income dividends) and tax characteristics of distributions were used to estimate after-tax returns in 2018. Actualafter-tax returns will be calculated at calendaryear-end and depend on an investor’s tax situation and may differ from those shown. In addition, theafter-tax returns shown are not relevant to investors who hold Portfolio shares throughtax-deferred arrangements such as 401(k) plans or individual retirement accounts. Under certain circumstances, the addition of the tax benefits from capital losses resulting from redemptions may cause the Returns After Taxes on Distributions and Sale of Portfolio Shares to be greater than the Returns After Taxes on Distributions or even Returns Before Taxes.Standardizedafter-tax returns assume reinvestment of all distributions at NAV and reflect a maximum initial sales charge of 5.50% for Class A Shares. |
| * | | Returns Before Taxesdo not reflect taxes on distributions on the Portfolio’s Class A Shares nor do they show how performance can be impacted by taxes when shares are redeemed. |
| ** | | Returns After Taxes on Distributionsassume that taxes are paid on distributions on the Portfolio’s Class A Shares (i.e., dividends and capital gains) but do not reflect taxes that may be incurred upon redemption of the Class A Shares at the end of the performance period. |
| *** | | Returns After Taxes on Distributions and Sale of Portfolio Sharesreflect taxes paid on distributions on the Portfolio’s Class A Shares and taxes applicable when the shares are redeemed. |
7
FUND BASICS
| | | | | | |
| | OVERALL UNDERLYING FUND WEIGHTINGS8,9 |
| |
| | | Percentage of Net Assets |
| |
| | | 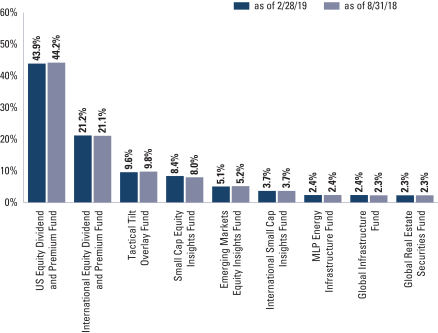 |
| | 8 | | The Portfolio is actively managed and, as such, its composition may differ over time. The percentage shown for each Underlying Fund reflects the value of that Underlying Fund as a percentage of net assets of the Portfolio. Figures in the graph above may not sum to 100% due to rounding and/or exclusion of other assets and liabilities. The above graph depicts the Portfolio’s investments but may not represent the Portfolio’s market exposure due to the exclusion of certain derivatives, if any, as listed in the Additional Investment Information section of the Schedule of Investments. |
| | 9 | | Represents affiliated funds. |
8
PORTFOLIO RESULTS
Goldman Sachs Tax-Advantaged
Global Equity Portfolio
Investment Objective
The Portfolio seeks long-term growth of capital.
Portfolio Management Discussion and Analysis
Below, the Goldman Sachs Quantitative Investment Strategies Team discusses the Goldman Sachs Tax-Advantaged Global Equity Portfolio’s (the “Portfolio”) performance and positioning for the six-month period ended February 28, 2019 (the “Reporting Period”).
| Q | | How did the Portfolio perform during the Reporting Period? |
| A | | During the Reporting Period, the Portfolio’s Class A, Institutional, Class P and Class R6 Shares generated cumulative total returns, without sales charges, of -5.26%,-5.10%, -5.10% and -5.13%, respectively. These returns compare to the-2.78% cumulative total return of the Portfolio’s blended benchmark, the Tax-Advantaged Global Equity Composite Index (“TAG Composite Index”), over the same time period. The components of the TAG Composite Index — the MSCI All Country World Index (ACWI) Investable Market Index (“MSCI ACWI IMI”) (90%) and the Bloomberg Barclays U.S. Aggregate Bond Index (10%) — returned -3.46% and 1.99%, respectively, during the Reporting Period. |
| Q | | What key factors affected the Portfolio’s performance during the Reporting Period? |
| A | | During the Reporting Period, the Portfolio’s strategic weightings detracted from its performance versus the TAG Composite Index. (The strategic weightings are based upon Goldman Sachs Investment Strategy Group’s (“ISG”) assumptions regarding long-term expected returns, expected volatilities and expected correlations, as well as the investments views of Goldman Sachs ISG.) Our tactical asset allocation decisions (“tactical tilts”) and the overall performance of the Underlying Funds also detracted from the Portfolio’s relative returns during the Reporting Period. |
| Q | | How were the Portfolio’s tactical asset allocation decisions managed during the Reporting Period? |
| A | | In keeping with our investment process, we implement tactical tilts, based on Goldman Sachs ISG’s views about near-term expected market returns, in an attempt to enhance performance. These tactical tilts are implemented through an investment in the Goldman Sachs Tactical Tilt Overlay Fund (the “Underlying Tactical Fund”), which seeks long-term total return through the implementation of investment ideas that are generally derived from short-term or medium-term market views on a variety of asset classes and instruments. As mentioned previously, the Portfolio’s tactical tilts detracted from performance during the Reporting Period. |
| Q | | How did the Portfolio’s Underlying Funds perform relative to their respective benchmark indices during the Reporting Period? |
| A | To implement strategic weightings and our tactical tilts, the Portfolio invests in nine Underlying Funds. Eight of these Underlying Funds may be used to implement strategic asset allocation decisions (“Underlying Strategic Funds”). The Underlying Tactical Fund, as mentioned previously, is used to implement tactical tilts. |
| | During the Reporting Period, the Portfolio was invested in seven of the eight Underlying Strategic Funds, six of which underperformed their respective benchmark indices. (The Portfolio did not have an allocation to the Goldman Sachs Core Fixed Income Fund during the Reporting Period.) |
| | The Underlying Strategic Funds that underperformed their respective benchmark indices most were the Goldman Sachs Emerging Markets Equity Insights Fund, the Goldman Sachs Global Infrastructure Fund, the Goldman Sachs International Small Cap Insights Fund and the Goldman Sachs MLP Energy Infrastructure Fund. In addition, two of the Underlying Strategic Funds that underperformed in relative terms — the Goldman Sachs U.S. Tax-Managed Equity Fund and the Goldman Sachs International Tax-Managed Equity Fund — are those in which the Portfolio held its largest weightings. |
| | The Goldman Sachs Global Real Estate Securities Fund outperformed its benchmark index during the Reporting Period overall. |
9
PORTFOLIO RESULTS
| | The Portfolio’s Underlying Tactical Fund outperformed its cash benchmark index1 by more than 48 basis points1 during the Reporting Period. (A basis point is 1/100th of a percent.) |
| Q | | How did the Portfolio use derivatives and similar instruments during the Reporting Period? |
| A | During the Reporting Period, the Portfolio employed Standard & Poor’s 500® Index (“S&P 500® Index”) futures as part as part of its strategic weightings in U.S. large-cap growth stocks and U.S. large-cap value stocks, which did not have a material impact on performance. The Portfolio also utilized forward foreign currency exchange contracts to take positions in the British pound, euro, Australian dollar, Swiss franc and Japanese yen. These currency hedging positions contributed positively to the Portfolio’s performance during the Reporting Period. |
| | In addition, some of the Portfolio’s Underlying Funds, including the Portfolio’s Underlying Tactical Fund, used derivatives during the Reporting Period to apply their active investment views with greater versatility or to afford greater risk management precision. As market conditions warranted during the Reporting Period, some of these Underlying Funds engaged in forward foreign currency exchange contracts, financial futures contracts, options and swap contracts to enhance portfolio return and for hedging purposes. |
| Q | | What changes did you make during the Reporting Period within the Portfolio? |
| A | No significant changes were made within the Portfolio during the Reporting Period. |
| Q | | What was the Portfolio’s strategy at the end of the Reporting Period? |
| A | | Going forward, we plan to maintain a diversified equity portfolio that implements our strategic and tactical views as we continue to seek long-term growth of capital. |
| | 1 | | Performance quoted is for Institutional Shares. |
10
FUND BASICS
Tax-Advantaged Global Equity Portfolio
as of February 28, 2019
| | | | | | | | | | | | | | | | | | |
| | PERFORMANCE REVIEW | |
| | | | | |
| | | September 1, 2018–February 28, 2019 | | Portfolio
Total Return
(based on NAV)1 | | | TAG
Composite
Index2 | | | Bloomberg
Barclays U.S.
Aggregate
Bond Index3 | | | MSCI ACWI
IMI4 | |
| | | | | |
| | Class A | | | -5.26 | % | | | -2.78 | % | | | 1.99 | % | | | -3.46 | % |
| | Institutional | | | -5.10 | | | | -2.78 | | | | 1.99 | | | | -3.46 | |
| | Class P | | | -5.10 | | | | -2.78 | | | | 1.99 | | | | -3.46 | |
| | | Class R6 | | | -5.13 | | | | -2.78 | | | | 1.99 | | | | -3.46 | |
| | 1 | | The net asset value (“NAV”) represents the net assets of the class of the Portfolio(ex-dividend) divided by the total number of shares of the class outstanding. The Portfolio’s performance reflects the reinvestment of dividends and other distributions. The Portfolio’s performance does not reflect the deduction of any applicable sales charges. |
| | 2 | | The TAG Composite Index (“TAG Composite”) is a composite representation prepared by the investment adviser of the performance of the Portfolio’s asset classes weighted according to their respective weightings in the Portfolio’s target range. |
| | | | The TAG Composite is comprised of the MSCI ACWI IMI (90%) and the Bloomberg Barclays U.S. Aggregate Bond Index (10%). The TAG Composite figures do not reflect any deduction for fees, expenses or taxes. |
| | 3 | | The Bloomberg Barclays U.S. Aggregate Bond Index represents an unmanaged diversified portfolio of fixed income securities, including U.S. Treasuries, investment grade corporate bonds and mortgage-backed and asset-backed securities. |
| | 4 | | The MSCI ACWI IMI captures large, mid and small cap representation across 23 developed markets and 23 emerging markets. With 8,686 constituents, the MSCI ACWI IMI is comprehensive, covering approximately 99% of the global equity investment opportunity set. As of February 28, 2019, the 23 developed markets in the MSCI ACWI IMI include Australia, Austria, Belgium, Canada, Denmark, Finland, France, Germany, Hong Kong, Ireland, Israel, Italy, Japan, Netherlands, New Zealand, Norway, Portugal, Singapore, Spain, Sweden, Switzerland, the U.K. and the U.S. The 23 emerging markets include Brazil, Chile, China, Colombia, Czech Republic, Egypt, Greece, Hungary, India, Indonesia, South Korea, Malaysia, Mexico, Peru, Philippines, Poland, Russia, Qatar, South Africa, Taiwan, Thailand, Turkey and United Arab Emirates. |
| | | | | | | | | | | | | | | | | | | | |
| | STANDARDIZED TOTAL RETURNS5 | | | |
| | | | | | |
| | | For the period ended 12/31/18 | | One Year | | | Five Years | | | Ten Years | | | Since Inception | | | Inception Date |
| | | | | | |
| | Class A | | | -14.91 | % | | | 2.53 | % | | | 8.85 | % | | | 4.45 | % | | 4/30/08 |
| | Institutional | | | -9.63 | | | | 4.12 | | | | 9.92 | | | | 5.43 | | | 4/30/08 |
| | Class P | | | N/A | | | | N/A | | | | N/A | | | | -11.00 | | | 4/17/18 |
| | | Class R6 | | | -9.60 | | | | N/A | | | | N/A | | | | -9.52 | | | 12/29/17 |
| | 5 | | The Standardized Total Returns are average annual total returns or cumulative total returns (only if the performance period is one year or less) as of the most recent calendarquarter-end. They assume reinvestment of all distributions at NAV. These returns reflect a maximum initial sales charge of 5.50% for Class A Shares. Because Institutional, Class P and Class R6 Shares do not involve a sales charge, such a charge is not applied to their Standardized Total Returns. |
The returns set forth in the tables above represent past performance. Past performance does not guarantee future results. The Portfolio’s investment return and principal value will fluctuate so that an investor’s shares, when redeemed, may be worth more or less than their original cost. Current performance may be lower or higher than the performance quoted above. Please visit our web site at www.GSAMFUNDS.com to obtain the most recentmonth-end returns.
Performance reflects applicable fee waivers and/or expense limitations in effect during the periods shown. In their absence, performance would be reduced. Returns do not reflect the deduction of taxes that a shareholder would pay on Portfolio distributions or the redemption of Portfolio shares.
11
FUND BASICS
| | | | | | | | | | |
| | EXPENSE RATIOS6 | |
| | | |
| | | | | Net Expense Ratio (Current) | | | Gross Expense Ratio (Before Waivers) | |
| | | |
| | Class A | | | 1.32 | % | | | 1.40 | % |
| | Institutional | | | 0.93 | | | | 1.01 | |
| | Class P | | | 0.92 | | | | 1.00 | |
| | | Class R6 | | | 0.92 | | | | 1.00 | |
| | 6 | | The expense ratios of the Portfolio, both current (net of applicable fee waivers and/or expense limitations) and before waivers (gross of applicable fee waivers and/or expense limitations) are as set forth above according to the most recent publicly available Prospectus for the Portfolio and may differ from the expense ratios disclosed in the Financial Highlights in this report. Pursuant to contractual arrangements, the Portfolio’s waivers and/or expense limitations will remain in place through at least December 28, 2019, and prior to such date the Investment Adviser may not terminate the arrangements without the approval of the Portfolio’s Board of Trustees. If these arrangements are discontinued in the future, the expense ratios may change without shareholder approval. |
| | | | | | | | | | | | | | | | | | |
| | STANDARDIZED AFTER-TAX PERFORMANCE AS OF 12/31/187 | |
| | | | | |
| | | Class A Shares | | One Year | | | Five Years | | | Ten Years | | | Since Inception
(4/30/08) | |
| | | | | |
| | Return before taxes* | | | -14.91 | % | | | 2.53 | % | | | 8.85 | % | | | 4.45 | % |
| | Return after taxes on distributions** | | | -15.24 | | | | 2.11 | | | | 8.43 | | | | 4.04 | |
| | | Return after taxes on distributions
and sale of Portfolio shares*** | | | -8.59 | | | | 1.91 | | | | 7.21 | | | | 3.48 | |
| 7 | | The after-tax returns are calculated using the historically highest individual federal marginal income tax rates at the time of distributions and do not reflect state and local taxes. The 2017 tax rates (23.8% for qualifying ordinary income dividends and long-term capital gain distributions and 43.4% for non-qualifying ordinary income dividends) and tax characteristics of distributions were used to estimate after-tax returns in 2018. Actualafter-tax returns will be calculated at calendaryear-end and depend on an investor’s tax situation and may differ from those shown. In addition, theafter-tax returns shown are not relevant to investors who hold Portfolio shares throughtax-deferred arrangements such as 401(k) plans or individual retirement accounts. Under certain circumstances, the addition of the tax benefits from capital losses resulting from redemptions may cause the Returns After Taxes on Distributions and Sale of Portfolio Shares to be greater than the Returns After Taxes on Distributions or even Returns Before Taxes.Standardizedafter-tax returns assume reinvestment of all distributions at NAV and reflect a maximum initial sales charge of 5.50% for Class A Shares. |
| * | | Returns Before Taxesdo not reflect taxes on distributions on the Portfolio’s Class A Shares nor do they show how performance can be impacted by taxes when shares are redeemed. |
| ** | | Returns After Taxes on Distributionsassume that taxes are paid on distributions on the Portfolio’s Class A Shares (i.e., dividends and capital gains) but do not reflect taxes that may be incurred upon redemption of the Class A Shares at the end of the performance period. |
| *** | | Returns After Taxes on Distributions and Sale of Portfolio Sharesreflect taxes paid on distributions on the Portfolio’s Class A Shares and taxes applicable when the shares are redeemed. |
12
FUND BASICS
|
| OVERALL UNDERLYING FUND WEIGHTINGS8,9 |
|
| Percentage of Net Assets |
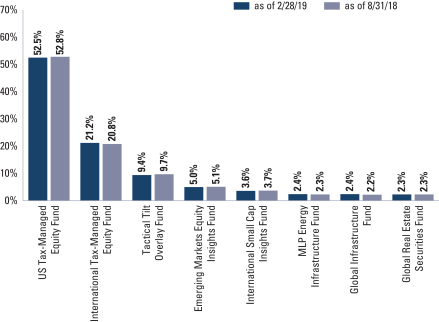
| 8 | | The Portfolio is actively managed and, as such, its composition may differ over time. The percentage shown for each Underlying Fund reflects the value of that Underlying Fund as a percentage of net assets of the Portfolio. Figures in the graph above may not sum to 100% due to rounding and/or exclusion of other assets and liabilities. The above graph depicts the Portfolio’s investments but may not represent the Portfolio’s market exposure due to the exclusion of certain derivatives, if any, as listed in the Additional Investment Information section of the Schedule of Investments. |
| 9 | | Represents affiliated funds. |
13
GOLDMAN SACHS GLOBAL TAX-AWARE EQUITY PORTFOLIOS
Index Definition
S&P 500® Index is a U.S. stock market index based on the market capitalizations of 500 large companies having common stock listed on the New York Stock Exchange or NASDAQ. The S&P 500® Index components and their weightings are determined by S&P Dow Jones Indices.
It is not possible to invest directly in an unmanaged index.
TheICE® BofAML® U.S. Dollar Three-Month LIBOR Constant Maturity Index tracks the performance of a synthetic asset paying LIBOR to a stated maturity. It is based on the assumed purchase at par of a synthetic instrument having exactly its stated maturity and with a coupon equal to that day’s fixing rate. That issue is assumed to be sold the following day (priced at a yield equal to the current day fixing rate) and rolled into a new instrument.
14
GOLDMAN SACHS ENHANCED DIVIDEND GLOBAL EQUITY PORTFOLIO
Schedule of Investments
February 28, 2019 (Unaudited)
| | | | | | | | |
Shares | | | Description | | Value | |
|
| Underlying Funds (Class R6 Shares)(a) – 99.0% | |
| Equity – 99.0% | |
| | 21,840,640 | | | Goldman Sachs US Equity Dividend and Premium Fund | | $ | 274,536,850 | |
| | 19,288,921 | | | Goldman Sachs International Equity Dividend and Premium Fund | | | 132,514,888 | |
| | 6,137,938 | | | Goldman Sachs Tactical Tilt Overlay Fund | | | 59,906,273 | |
| | 2,013,275 | | | Goldman Sachs Small Cap Equity Insights Fund | | | 52,365,286 | |
| | 3,406,900 | | | Goldman Sachs Emerging Markets Equity Insights Fund | | | 32,024,859 | |
| | 2,039,478 | | | Goldman Sachs International Small Cap Insights Fund | | | 23,005,311 | |
| | 2,313,890 | | | Goldman Sachs MLP Energy Infrastructure Fund | | | 15,271,674 | |
| | 1,373,471 | | | Goldman Sachs Global Infrastructure Fund | | | 14,957,102 | |
| | 1,355,109 | | | Goldman Sachs Global Real Estate Securities Fund | | | 14,648,725 | |
| | |
| | TOTAL INVESTMENTS – 99.0% | | | | |
| | (Cost $524,164,129) | | $ | 619,230,968 | |
| | |
| OTHER ASSETS IN EXCESS OF
LIABILITIES – 1.0% | | | 6,183,526 | |
| | |
| | NET ASSETS – 100.0% | | $ | 625,414,494 | |
| | |
| | |
|
| The percentage shown for each investment and investment category reflects the value of the respective investment or category as a percentage of net assets. |
| |
(a) | | Represents an Affiliated Issuer. |
| | |
|
Currency Abbreviations: |
AUD | | —Australian Dollar |
CHF | | —Swiss Franc |
EUR | | —Euro |
GBP | | —British Pound |
JPY | | —Japanese Yen |
USD | | —United States Dollar |
|
|
| ADDITIONAL INVESTMENT INFORMATION |
FORWARD FOREIGN CURRENCY EXCHANGE CONTRACTS — At February 28, 2019, the Portfolio had the following forward foreign currency exchange contracts:
FORWARD FOREIGN CURRENCY EXCHANGE CONTRACTS WITH UNREALIZED GAIN
| | | | | | | | | | | | | | | | | | | | |
| Counterparty | | Currency
Purchased | | | Currency
Sold | | | Settlement
Date | | | Unrealized
Gain | |
Morgan Stanley Co., Inc. | | AUD | | | 860,000 | | | USD | | | 606,601 | | | | 03/20/2019 | | | $ | 3,621 | |
| | GBP | | | 1,830,000 | | | USD | | | 2,340,217 | | | | 03/20/2019 | | | | 89,053 | |
| | USD | | | 5,861,029 | | | AUD | | | 8,109,962 | | | | 03/20/2019 | | | | 106,519 | |
| | USD | | | 6,996,553 | | | CHF | | | 6,870,844 | | | | 03/20/2019 | | | | 101,643 | |
| | | USD | | | 26,948,874 | | | EUR | | | 23,464,225 | | | | 03/20/2019 | | | | 222,822 | |
| | | | | | |
| TOTAL | | | | | | | | | | | | | | | | | | $ | 523,658 | |
| | |
| The accompanying notes are an integral part of these financial statements. | | 15 |
GOLDMAN SACHS ENHANCED DIVIDEND GLOBAL EQUITY PORTFOLIO
Schedule of Investments(continued)
February 28, 2019 (Unaudited)
|
| ADDITIONAL INVESTMENT INFORMATION (continued) |
FORWARD FOREIGN CURRENCY EXCHANGE CONTRACTS WITH UNREALIZED LOSS
| | | | | | | | | | | | | | | | | | | | |
| Counterparty | | Currency
Purchased | | | Currency
Sold | | | Settlement
Date | | | Unrealized
Loss | |
Morgan Stanley Co., Inc. | | CHF | | | 630,000 | | | USD | | | 644,885 | | | | 03/20/2019 | | | $ | (12,679 | ) |
| | EUR | | | 3,520,000 | | | USD | | | 4,055,653 | | | | 03/20/2019 | | | | (46,328 | ) |
| | JPY | | | 372,000,000 | | | USD | | | 3,411,502 | | | | 03/20/2019 | | | | (69,823 | ) |
| | USD | | | 14,987,817 | | | GBP | | | 11,659,415 | | | | 03/20/2019 | | | | (489,701 | ) |
| | | USD | | | 21,110,766 | | | JPY | | | 2,350,272,100 | | | | 03/20/2019 | | | | (1,747 | ) |
| | | | | | |
| TOTAL | | | | | | | | | | | | | | | | | | $ | (620,278 | ) |
FUTURES CONTRACTS — At February 28, 2019, the Portfolio had the following futures contracts:
| | | | | | | | | | | | | | | | |
| Description | | Number of
Contracts | | | Expiration
Date | | | Notional
Amount | | | Unrealized
Appreciation/
(Depreciation) | |
Long position contracts: | | | | | | | | | | | | | | | | |
S&P 500 E-Mini Index | | | 47 | | | | 03/15/2019 | | | $ | 6,544,045 | | | $ | 421,270 | |
| | |
| 16 | | The accompanying notes are an integral part of these financial statements. |
GOLDMAN SACHS TAX-ADVANTAGED GLOBAL EQUITY PORTFOLIO
Schedule of Investments
February 28, 2019 (Unaudited)
| | | | | | | | |
Shares | | | Description | | Value | |
|
| Underlying Funds (Class R6 Shares)(a) – 98.8% | |
| Equity – 98.8% | | | |
| | 61,629,753 | | | Goldman Sachs US Tax-Managed Equity Fund | | $ | 1,444,601,400 | |
| | 60,660,430 | | | Goldman Sachs International Tax-Managed Equity Fund | | | 584,159,938 | |
| | 26,634,712 | | | Goldman Sachs Tactical Tilt Overlay Fund | | | 259,954,790 | |
| | 14,778,025 | | | Goldman Sachs Emerging Markets Equity Insights Fund | | | 138,913,438 | |
| | 8,782,797 | | | Goldman Sachs International Small Cap Insights Fund | | | 99,069,955 | |
| | 10,021,370 | | | Goldman Sachs MLP Energy Infrastructure Fund | | | 66,141,040 | |
| | 5,955,609 | | | Goldman Sachs Global Infrastructure Fund | | | 64,856,586 | |
| | 5,874,556 | | | Goldman Sachs Global Real Estate Securities Fund | | | 63,503,946 | |
| | |
| | TOTAL INVESTMENTS – 98.8% | | | | |
| | (Cost $2,061,056,297) | | $ | 2,721,201,093 | |
| | |
| OTHER ASSETS IN EXCESS OF
LIABILITIES – 1.2% | | | 31,927,374 | |
| | |
| | NET ASSETS – 100.0% | | $ | 2,753,128,467 | |
| | |
| | |
|
| The percentage shown for each investment and investment category reflects the value of the respective investment or category as a percentage of net assets. |
| |
(a) | | Represents an Affiliated Issuer. |
| | |
|
Currency Abbreviations: |
AUD | | —Australian Dollar |
CHF | | —Swiss Franc |
EUR | | —Euro |
GBP | | —British Pound |
JPY | | —Japanese Yen |
USD | | —United States Dollar |
|
|
| ADDITIONAL INVESTMENT INFORMATION |
FORWARD FOREIGN CURRENCY EXCHANGE CONTRACTS — At February 28, 2019, the Portfolio had the following forward foreign currency exchange contracts:
FORWARD FOREIGN CURRENCY EXCHANGE CONTRACTS WITH UNREALIZED GAIN
| | | | | | | | | | | | | | | | | | | | |
| Counterparty | | Currency
Purchased | | | Currency
Sold | | | Settlement
Date | | | Unrealized
Gain | |
Morgan Stanley Co., Inc. | | GBP | | | 6,690,000 | | | USD | | | 8,555,219 | | | | 03/20/2019 | | | $ | 325,552 | |
| | USD | | | 23,368,180 | | | AUD | | | 32,334,774 | | | | 03/20/2019 | | | | 424,697 | |
| | USD | | | 29,329,964 | | | CHF | | | 28,802,984 | | | | 03/20/2019 | | | | 426,095 | |
| | | USD | | | 113,959,609 | | | EUR | | | 99,223,958 | | | | 03/20/2019 | | | | 942,253 | |
| | | | | | |
| TOTAL | | | | | | | | | | | | | | | | | | $ | 2,118,597 | |
FORWARD FOREIGN CURRENCY EXCHANGE CONTRACTS WITH UNREALIZED LOSS
| | | | | | | | | | | | | | | | | | | | |
| Counterparty | | Currency
Purchased | | | Currency
Sold | | | Settlement
Date | | | Unrealized
Loss | |
Morgan Stanley Co., Inc. | | CHF | | | 2,420,000 | | | USD | | | 2,477,178 | | | | 03/20/2019 | | | $ | (48,702 | ) |
| | EUR | | | 14,900,000 | | | USD | | | 17,167,393 | | | | 03/20/2019 | | | | (196,102 | ) |
| | JPY | | | 1,490,000,000 | | | USD | | | 13,664,350 | | | | 03/20/2019 | | | | (279,669 | ) |
| | USD | | | 62,025,382 | | | GBP | | | 48,251,169 | | | | 03/20/2019 | | | | (2,026,573 | ) |
| | | USD | | | 88,629,390 | | | JPY | | | 9,867,154,282 | | | | 03/20/2019 | | | | (7,336 | ) |
| | | | | | |
| TOTAL | | | | | | | | | | | | | | | | | | $ | (2,558,382 | ) |
| | |
| The accompanying notes are an integral part of these financial statements. | | 17 |
GOLDMAN SACHS TAX-ADVANTAGED GLOBAL EQUITY PORTFOLIO
Schedule of Investments(continued)
February 28, 2019 (Unaudited)
|
| ADDITIONAL INVESTMENT INFORMATION (continued) |
FUTURES CONTRACTS— At February 28, 2019, the Portfolio had the following futures contracts:
| | | | | | | | | | | | | | | | |
| Description | | Number of
Contracts | | | Expiration
Date | | | Notional
Amount | | | Unrealized
Appreciation/
(Depreciation) | |
Long position contracts: | | | | | | | | | | | | | | | | |
S&P 500 E-Mini Index | | | 195 | | | | 03/15/2019 | | | $ | 27,150,825 | | | $ | 1,747,824 | |
| | |
| 18 | | The accompanying notes are an integral part of these financial statements. |
GOLDMAN SACHS GLOBAL TAX-AWARE EQUITY PORTFOLIOS
Statements of Assets and Liabilities
February 28, 2019 (Unaudited)
| | | | | | | | | | |
| | | | | Enhanced Dividend
Global Equity
Portfolio | | | Tax-Advantaged
Global Equity
Portfolio | |
| | Assets: | |
| | Investments in affiliated Underlying Funds, at value (cost $524,164,129 and $2,061,056,297) | | $ | 619,230,968 | | | $ | 2,721,201,093 | |
| | Cash | | | 5,157,689 | | | | 30,601,113 | |
| | Foreign currencies, at value (cost $0 and $121,499) | | | — | | | | 123,770 | |
| | Receivables: | | | | | | | | |
| | Investments sold | | | 858,743 | | | | — | |
| | Portfolio shares sold | | | 667,179 | | | | 5,743,646 | |
| | Collateral on certain derivative contracts(a) | | | 450,000 | | | | 2,510,000 | |
| | Reimbursement from investment adviser | | | 30,139 | | | | 42,529 | |
| | Foreign tax reclaims | | | — | | | | 7,249 | |
| | Unrealized gain on forward foreign currency exchange contracts | | | 523,658 | | | | 2,118,597 | |
| | Other assets | | | 77,785 | | | | 93,092 | |
| | | |
| | Total assets | | | 626,996,161 | | | | 2,762,441,089 | |
| | | | | | | | | | |
| | Liabilities: | | | | | | | | |
| | Unrealized loss on forward foreign currency exchange contracts | | | 620,278 | | | | 2,558,382 | |
| | Variation margin on futures | | | 24,437 | | | | 101,397 | |
| | Payables: | | | | | | | | |
| | Portfolio shares redeemed | | | 805,738 | | | | 1,529,537 | |
| | Management fees | | | 38,123 | | | | 166,688 | |
| | Distribution and Service fees and Transfer Agency fees | | | 17,477 | | | | 63,047 | |
| | Investments purchased | | | — | | | | 4,705,125 | |
| | Accrued expenses | | | 75,614 | | | | 188,446 | |
| | | |
| | Total liabilities | | | 1,581,667 | | | | 9,312,622 | |
| | | | | | | | | | |
| | Net Assets: | | | | | | | | |
| | Paid-in capital | | | 543,840,816 | | | | 2,158,573,238 | |
| | Total distributable earnings | | | 81,573,678 | | | | 594,555,229 | |
| | | NET ASSETS | | $ | 625,414,494 | | | $ | 2,753,128,467 | |
| | | Net Assets: | | | | | | | | |
| | | Class A | | $ | 9,706,263 | | | $ | 620,140 | |
| | | Institutional | | | 27,824,340 | | | | 45,968,176 | |
| | | Class P | | | 587,873,855 | | | | 2,706,530,132 | |
| | | Class R6 | | | 10,036 | | | | 10,019 | |
| | | Total Net Assets | | $ | 625,414,494 | | | $ | 2,753,128,467 | |
| | | Shares outstanding $0.001 par value (unlimited shares authorized): | | | | | | | | |
| | | Class A | | | 847,108 | | | | 40,294 | |
| | | Institutional | | | 2,401,661 | | | | 2,966,590 | |
| | | Class P | | | 50,861,106 | | | | 176,943,354 | |
| | | Class R6 | | | 868 | | | | 655 | |
| | | Net asset value, offering and redemption price per share:(b) | | | | | | | | |
| | | Class A | | | $11.46 | | | | $15.39 | |
| | | Institutional | | | 11.59 | | | | 15.50 | |
| | | Class P | | | 11.56 | | | | 15.30 | |
| | | Class R6 | | | 11.56 | | | | 15.29 | |
| | (a) | | Segregated for initial margin and/or collateral on transactions as follows: |
| | | | | | | | |
| Portfolio | | Forwards | | | Futures | |
Enhanced Dividend Global Equity | | $ | — | | | $ | 450,000 | |
| | |
Tax-Advantaged Global Equity | | | 970,000 | | | | 1,540,000 | |
| | (b) | | Maximum public offering price per share for Class A Shares of the Enhanced Dividend Global Equity and Tax-Advantaged Global Equity Portfolios is $12.13 and $16.29, respectively. |
| | |
| The accompanying notes are an integral part of these financial statements. | | 19 |
GOLDMAN SACHS GLOBAL TAX-AWARE EQUITY PORTFOLIOS
Statements of Operations
For the Six Months Ended February 28, 2019 (Unaudited)
| | | | | | | | | | |
| | | | | Enhanced Dividend
Global Equity
Portfolio | | | Tax-Advantaged
Global Equity
Portfolio | |
| | Investment income: | |
| | | |
| | Dividends from affiliated Underlying Funds | | $ | 7,213,083 | | | $ | 35,976,286 | |
| | | | | | | | | | |
| | Expenses: | | | | | | | | |
| | | |
| | Management fees | | | 466,287 | | | | 1,986,192 | |
| | | |
| | Transfer Agency fees(a) | | | 102,259 | | | | 400,259 | |
| | | |
| | Registration fees | | | 78,578 | | | | 105,858 | |
| | | |
| | Custody, accounting and administrative services | | | 45,109 | | | | 150,400 | |
| | | |
| | Professional fees | | | 38,738 | | | | 39,064 | |
| | | |
| | Printing and mailing costs | | | 19,603 | | | | 31,773 | |
| | | |
| | Distribution and Service fees — Class A Shares | | | 12,513 | | | | 743 | |
| | | |
| | Trustee fees | | | 8,677 | | | | 10,556 | |
| | | |
| | Other | | | 18,051 | | | | 54,244 | |
| | | |
| | Total expenses | | | 789,815 | | | | 2,779,089 | |
| | | |
| | Less — expense reductions | | | (377,652 | ) | | | (1,114,948 | ) |
| | | |
| | Net expenses | | | 412,163 | | | | 1,664,141 | |
| | | |
| | NET INVESTMENT INCOME | | | 6,800,920 | | | | 34,312,145 | |
| | | | | | | | | | |
| | Realized and unrealized gain (loss): | | | | | | | | |
| | | |
| | Net realized gain (loss) from: | | | | | | | | |
| | | |
| | Investments in affiliated Underlying Funds | | | (3,326,523 | ) | | | (13,986,578 | ) |
| | | |
| | Investments — unaffiliated issuers | | | — | | | | (151,877 | ) |
| | | |
| | Futures contracts | | | (410,680 | ) | | | (1,812,467 | ) |
| | | |
| | Forward foreign currency exchange contracts | | | 3,392,041 | | | | 13,627,202 | |
| | | |
| | Foreign currency transactions | | | — | | | | (155 | ) |
| | | |
| | Capital gain distributions from affiliated Underlying Funds | | | 16,018,113 | | | | — | |
| | | |
| | Net change in unrealized gain (loss) on: | | | | | | | | |
| | | |
| | Investments in affiliated Underlying Funds | | | (41,688,612 | ) | | | (171,536,109 | ) |
| | | |
| | Futures contracts | | | 116,382 | | | | 582,075 | |
| | | |
| | Forward foreign currency exchange contracts | | | (1,933,854 | ) | | | (7,649,229 | ) |
| | | |
| | Foreign currency translation | | | — | | | | (145 | ) |
| | | |
| | Net realized and unrealized loss | | | (27,833,133 | ) | | | (180,927,283 | ) |
| | | |
| | NET DECREASE IN NET ASSETS RESULTING FROM OPERATIONS | | $ | (21,032,213 | ) | | $ | (146,615,138 | ) |
| | (a) | | Class specific Transfer Agency fees were as follows: |
| | | | | | | | | | | | | | | | |
| | | Transfer Agency Fees | |
Portfolio | | Class A | | | Institutional | | | Class P | | | Class R6 | |
Enhanced Dividend Global Equity | | $ | 9,010 | | | $ | 5,980 | | | $ | 87,267 | | | $ | 2 | |
Tax-Advantaged Global Equity | | | 535 | | | | 10,336 | | | | 389,386 | | | | 2 | |
| | |
| 20 | | The accompanying notes are an integral part of these financial statements. |
GOLDMAN SACHS GLOBAL TAX-AWARE EQUITY PORTFOLIOS
Statements of Changes in Net Assets
| | | | | | | | | | | | | | | | | | | | | | |
| | | | | Enhanced Dividend
Global Equity Portfolio | | | | | | Tax-Advantaged
Global Equity Portfolio | |
| | | | | For the
Six Months Ended
February 28, 2019
(Unaudited) | | | For the Fiscal
Year Ended
August 31, 2018 | | | | | | For the
Six Months Ended
February 28, 2019
(Unaudited) | | | For the Fiscal
Year Ended
August 31, 2018 | |
| | From operations: | |
| | | | | | |
| | Net investment income | | $ | 6,800,920 | | | $ | 11,182,516 | | | | | | | $ | 34,312,145 | | | $ | 25,044,835 | |
| | | | | | |
| | Net realized gain (loss) | | | 15,672,951 | | | | 18,730,524 | | | | | | | | (2,323,875 | ) | | | 19,444,413 | |
| | | | | | |
| | Net change in unrealized gain (loss) | | | (43,506,084 | ) | | | 30,379,698 | | | | | | | | (178,603,408 | ) | | | 263,591,756 | |
| | | | | | |
| | Net increase (decrease) in net assets resulting from operations | | | (21,032,213 | ) | | | 60,292,738 | | | | | | | | (146,615,138 | ) | | | 308,081,004 | |
| | | | | | | | | | | | | | | | | | | | | | |
| | Distributions to shareholders: | | | | | | | | | | | | | | | | | | | | |
| | | | | | |
| | From distributable earnings: | | | | | | | | | | | | | | | | | | | | |
| | | | | | |
| | Class A Shares | | | (425,620 | ) | | | (319,947 | )(a) | | | | | | | (8,664 | ) | | | (6,733 | )(a) |
| | | | | | |
| | Institutional Shares | | | (1,289,271 | ) | | | (20,182,584 | )(a) | | | | | | | (376,203 | ) | | | (32,796,134 | )(a) |
| | | | | | |
| | Class P Shares(b) | | | (25,502,864 | ) | | | (3,566,150 | )(a) | | | | | | | (51,683,171 | ) | | | — | |
| | | | | | |
| | Class R6 Shares(c) | | | (424 | ) | | | (97 | )(a) | | | | | | | (191 | ) | | | — | |
| | | | | | |
| | Total distributions to shareholders | | | (27,218,179 | ) | | | (24,068,778 | ) | | | | | | | (52,068,229 | ) | | | (32,802,867 | ) |
| | | | | | | | | | | | | | | | | | | | | | |
| | From share transactions: | | | | | | | | | | | | | | | | | | | | |
| | | | | | |
| | Proceeds from sales of shares | | | 46,637,186 | | | | 707,181,772 | | | | | | | | 219,856,681 | | | | 3,154,128,273 | |
| | | | | | |
| | Reinvestment of distributions | | | 26,811,089 | | | | 23,731,281 | | | | | | | | 52,065,950 | | | | 32,786,693 | |
| | | | | | |
| | Cost of shares redeemed | | | (80,435,590 | ) | | | (732,774,402 | ) | | | | | | | (180,768,060 | ) | | | (2,809,978,324 | ) |
| | | | | | |
| | Net increase (decrease) in net assets resulting from share transactions | | | (6,987,315 | ) | | | (1,861,349 | ) | | | | | | | 91,154,571 | | | | 376,936,642 | |
| | | | | | |
| | TOTAL INCREASE (DECREASE) | | | (55,237,707 | ) | | | 34,362,611 | | | | | | | | (107,528,796 | ) | | | 652,214,779 | |
| | | | | | | | | | | | | | | | | | | | | | |
| | Net assets:(d) | | | | | | | | | | | | | | | | | | | | |
| | | | | | |
| | Beginning of period | | | 680,652,201 | | | | 646,289,590 | | | | | | | | 2,860,657,263 | | | | 2,208,442,484 | |
| | | | | | |
| | End of period | | $ | 625,414,494 | | | $ | 680,652,201 | | | | | | | $ | 2,753,128,467 | | | $ | 2,860,657,263 | |
| | (a) | | Prior year information has been revised to conform to current year presentation, see prior year presentation below: |
| | | | | | | | | | | | | | | | |
| | | Class A | | | Institutional | | | Class P(b) | | | Class R6(c) | |
Distribution from net investment income: | | | | |
| | | | |
Enhanced Dividend Global Equity Portfolio: | | $ | (203,951 | ) | | $ | (12,726,620 | ) | | $ | (3,566,150 | ) | | $ | (97 | ) |
Tax-Advantaged Global Equity Portfolio: | | $ | (6,733 | ) | | $ | (32,796,134 | ) | | $ | — | | | $ | — | |
| | | | |
Distributions from net realized gains: | | | | | | | | | | | | | | | | |
| | | | |
Enhanced Dividend Global Equity Portfolio: | | $ | (115,996 | ) | | $ | (7,455,964 | ) | | $ | — | | | $ | — | |
| | (b) | | Commenced operations on April 17, 2018. |
| | (c) | | Commenced operations on December 29, 2017. |
| | (d) | | Prior fiscal year information has been revised to conform with current year presentation. Undistributed net investment income was $– and $1,654,828 for the Enhanced Dividend Global Equity and Tax-Advantaged Global Equity Portfolios, respectively, as of August 31, 2018. |
| | |
| The accompanying notes are an integral part of these financial statements. | | 21 |
GOLDMAN SACHS ENHANCED DIVIDEND GLOBAL EQUITY PORTFOLIO
Financial Highlights
Selected Data for a Share Outstanding Throughout Each Period
| | | | | | | | | | | | | | | | | | | | | | | | | | |
| | | | | Goldman Sachs Enhanced Dividend Global Equity Portfolio | |
| | | | | Class A Shares | |
| | | | | Six Months Ended
February 28, 2019
(Unaudited) | | | Year Ended August 31, | |
| | | | | 2018 | | | 2017 | | | 2016 | | | 2015 | | | 2014 | |
| | Per Share Data | | | | | | | | | | | | | | | | | | | | | | | | |
| | | | | | | |
| | Net asset value, beginning of period | | $ | 12.34 | | | $ | 11.70 | | | $ | 10.68 | | | $ | 10.69 | | | $ | 11.83 | | | $ | 10.64 | |
| | | | | | | |
| | Net investment income(a)(b) | | | 0.10 | | | | 0.15 | | | | 0.17 | | | | 0.11 | | | | 0.16 | | | | 0.23 | |
| | | | | | | |
| | Net realized and unrealized gain (loss) | | | (0.50 | ) | | | 0.88 | | | | 1.12 | | | | 0.52 | | | | (0.73 | ) | | | 1.62 | |
| | | | | | | |
| | Total from investment operations | | | (0.40 | ) | | | 1.03 | | | | 1.29 | | | | 0.63 | | | | (0.57 | ) | | | 1.85 | |
| | | | | | | |
| | Distributions to shareholders from net investment income | | | (0.16 | ) | | | (0.25 | ) | | | (0.20 | ) | | | (0.31 | ) | | | (0.21 | ) | | | (0.24 | ) |
| | | | | | | |
| | Distributions to shareholders from net realized gains | | | (0.32 | ) | | | (0.14 | ) | | | (0.07 | ) | | | (0.33 | ) | | | (0.36 | ) | | | (0.42 | ) |
| | | | | | | |
| | Total distributions | | | (0.48 | ) | | | (0.39 | ) | | | (0.27 | ) | | | (0.64 | ) | | | (0.57 | ) | | | (0.66 | ) |
| | | | | | | |
| | Net asset value, end of period | | $ | 11.46 | | | $ | 12.34 | | | $ | 11.70 | | | $ | 10.68 | | | $ | 10.69 | | | $ | 11.83 | |
| | | | | | | |
| | Total return(c) | | | (3.03 | )% | | | 8.94 | % | | | 12.25 | % | | | 6.32 | % | | | (4.82 | )% | | | 17.92 | % |
| | | | | | | |
| | Net assets, end of period (in 000s) | | $ | 9,706 | | | $ | 10,418 | | | $ | 9,289 | | | $ | 4,993 | | | $ | 1,729 | | | $ | 220 | |
| | | | | | | |
| | Ratio of net expenses to average net assets(d) | | | 0.53 | %(e) | | | 0.52 | % | | | 0.53 | % | | | 0.53 | % | | | 0.55 | % | | | 0.60 | % |
| | | | | | | |
| | Ratio of total expenses to average net assets(d) | | | 0.65 | %(e) | | | 0.62 | % | | | 0.63 | % | | | 0.64 | % | | | 0.66 | % | | | 0.66 | % |
| | | | | | | |
| | Ratio of net investment income to average net assets(b) | | | 1.80 | %(e) | | | 1.21 | % | | | 1.54 | % | | | 1.09 | % | | | 1.40 | % | | | 2.02 | % |
| | | | | | | |
| | Portfolio turnover rate(f) | | | 10 | % | | | 20 | % | | | 8 | % | | | 19 | % | | | 25 | % | | | 14 | % |
| | (a) | | Calculated based on the average shares outstanding methodology. |
| | (b) | | Recognition of net investment income by the Portfolio is affected by the timing of declaration of dividends by the Underlying Funds in which the Portfolio invests. |
| | (c) | | Assumes investment at the net asset value at the beginning of the period, reinvestment of all distributions, a complete redemption of the investment at the net asset value at the end of the period and no sales or redemption charges. Total returns would be reduced if a sales or redemption charge was taken into account. Returns do not reflect the impact of taxes to shareholders relating to Portfolio distributions or the redemption of Portfolio shares. Total returns for periods less than one full year are not annualized. |
| | (d) | | Expense ratios exclude the expenses of the Underlying Funds in which the Portfolio invests. |
| | (f) | | The portfolio turnover rate is calculated in accordance with regulatory requirements, without regard to transactions involving short term investments and certain derivatives. If such transactions were included, the portfolio turnover rate may be higher. |
| | |
| 22 | | The accompanying notes are an integral part of these financial statements. |
GOLDMAN SACHS ENHANCED DIVIDEND GLOBAL EQUITY PORTFOLIO
Financial Highlights(continued)
Selected Data for a Share Outstanding Throughout Each Period
| | | | | | | | | | | | | | | | | | | | | | | | | | |
| | | | | Goldman Sachs Enhanced Dividend Global Equity Portfolio | |
| | | | | Institutional Shares | |
| | | | | Six Months Ended
February 28, 2019
(Unaudited) | | | Year Ended August 31, | |
| | | | | 2018 | | | 2017 | | | 2016 | | | 2015 | | | 2014 | |
| | Per Share Data | | | | | | | | | | | | | | | | | | | | | | | | |
| | | | | | | |
| | Net asset value, beginning of period | | $ | 12.48 | | | $ | 11.80 | | | $ | 10.76 | | | $ | 10.76 | | | $ | 11.89 | | | $ | 10.69 | |
| | | | | | | |
| | Net investment income(a)(b) | | | 0.12 | | | | 0.17 | | | | 0.22 | | | | 0.16 | | | | 0.22 | | | | 0.28 | |
| | | | | | | |
| | Net realized and unrealized gain (loss) | | | (0.50 | ) | | | 0.93 | | | | 1.12 | | | | 0.51 | | | | (0.74 | ) | | | 1.62 | |
| | | | | | | |
| | Total from investment operations | | | (0.38 | ) | | | 1.10 | | | | 1.34 | | | | 0.67 | | | | (0.52 | ) | | | 1.90 | |
| | | | | | | |
| | Distributions to shareholders from net investment income | | | (0.19 | ) | | | (0.28 | ) | | | (0.23 | ) | | | (0.34 | ) | | | (0.25 | ) | | | (0.28 | ) |
| | | | | | | |
| | Distributions to shareholders from net realized gains | | | (0.32 | ) | | | (0.14 | ) | | | (0.07 | ) | | | (0.33 | ) | | | (0.36 | ) | | | (0.42 | ) |
| | | | | | | |
| | Total distributions | | | (0.51 | ) | | | (0.42 | ) | | | (0.30 | ) | | | (0.67 | ) | | | (0.61 | ) | | | (0.70 | ) |
| | | | | | | |
| | Net asset value, end of period | | $ | 11.59 | | | $ | 12.48 | | | $ | 11.80 | | | $ | 10.76 | | | $ | 10.76 | | | $ | 11.89 | |
| | | | | | | |
| | Total return(c) | | | (2.88 | )% | | | 9.45 | % | | | 12.66 | % | | | 6.67 | % | | | (4.29 | )% | | | 18.29 | % |
| | | | | | | |
| | Net assets, end of period (in 000s) | | $ | 27,824 | | | $ | 33,490 | | | $ | 637,000 | | | $ | 507,845 | | | $ | 424,196 | | | $ | 373,665 | |
| | | | | | | |
| | Ratio of net expenses to average net assets(d) | | | 0.14 | %(e) | | | 0.13 | % | | | 0.13 | % | | | 0.13 | % | | | 0.17 | % | | | 0.20 | % |
| | | | | | | |
| | Ratio of total expenses to average net assets(d) | | | 0.26 | %(e) | | | 0.23 | % | | | 0.24 | % | | | 0.24 | % | | | 0.26 | % | | | 0.26 | % |
| | | | | | | |
| | Ratio of net investment income to average net assets(b) | | | 2.17 | %(e) | | | 1.43 | % | | | 1.93 | % | | | 1.58 | % | | | 1.95 | % | | | 2.43 | % |
| | | | | | | |
| | Portfolio turnover rate(f) | | | 10 | % | | | 20 | % | | | 8 | % | | | 19 | % | | | 25 | % | | | 14 | % |
| | (a) | | Calculated based on the average shares outstanding methodology. |
| | (b) | | Recognition of net investment income by the Portfolio is affected by the timing of declaration of dividends by the Underlying Funds in which the Portfolio invests. |
| | (c) | | Assumes investment at the net asset value at the beginning of the period, reinvestment of all distributions, a complete redemption of the investment at the net asset value at the end of the period and no sales or redemption charges. Total returns would be reduced if a sales or redemption charge was taken into account. Returns do not reflect the impact of taxes to shareholders relating to Portfolio distributions or the redemption of Portfolio shares. Total returns for periods less than one full year are not annualized. |
| | (d) | | Expense ratios exclude the expenses of the Underlying Funds in which the Portfolio invests. |
| | (f) | | The portfolio turnover rate is calculated in accordance with regulatory requirements, without regard to transactions involving short term investments and certain derivatives. If such transactions were included, the portfolio turnover rate may be higher. |
| | |
| The accompanying notes are an integral part of these financial statements. | | 23 |
GOLDMAN SACHS ENHANCED DIVIDEND GLOBAL EQUITY PORTFOLIO
Financial Highlights(continued)
Selected Data for a Share Outstanding Throughout Each Period
| | | | | | | | | | |
| | | | | Goldman Sachs Enhanced
Dividend Global Equity Portfolio | |
| | | | | Class P Shares | |
| | | | | Six Months Ended
February 28, 2019
(Unaudited) | | | For the Period
April 17, 2018* to August 31, 2018 | |
| | Per Share Data | | | | | | | | |
| | | |
| | Net asset value, beginning of period | | $ | 12.45 | | | $ | 12.18 | |
| | | |
| | Net investment income(a)(b) | | | 0.13 | | | | 0.11 | |
| | | |
| | Net realized and unrealized gain (loss) | | | (0.51 | ) | | | 0.23 | |
| | | |
| | Total from investment operations | | | (0.38 | ) | | | 0.34 | |
| | | |
| | Distributions to shareholders from net investment income | | | (0.19 | ) | | | (0.07 | ) |
| | | |
| | Distributions to shareholders from net realized gains | | | (0.32 | ) | | | — | |
| | | |
| | Total distributions | | | (0.51 | ) | | | (0.07 | ) |
| | | |
| | Net asset value, end of period | | $ | 11.56 | | | $ | 12.45 | |
| | | |
| | Total return(c) | | | (2.88 | )% | | | 2.80 | % |
| | | |
| | Net assets, end of period (in 000s) | | $ | 587,874 | | | $ | 636,733 | |
| | | |
| | Ratio of net expenses to average net assets(d) | | | 0.13 | %(e) | | | 0.13 | %(e) |
| | | |
| | Ratio of total expenses to average net assets(d) | | | 0.25 | %(e) | | | 0.25 | %(e) |
| | | |
| | Ratio of net investment income to average net assets(b) | | | 2.20 | %(e) | | | 2.48 | %(e) |
| | | |
| | Portfolio turnover rate(f) | | | 10 | % | | | 20 | % |
| | * | | Commencement of operations. |
| | (a) | | Calculated based on the average shares outstanding methodology. |
| | (b) | | Recognition of net investment income by the Portfolio is affected by the timing of declaration of dividends by the Underlying Funds in which the Portfolio invests. |
| | (c) | | Assumes investment at the net asset value at the beginning of the period, reinvestment of all distributions, a complete redemption of the investment at the net asset value at the end of the period and no sales or redemption charges. Total returns would be reduced if a sales or redemption charge was taken into account. Returns do not reflect the impact of taxes to shareholders relating to Portfolio distributions or the redemption of Portfolio shares. Total returns for periods less than one full year are not annualized. |
| | (d) | | Expense ratios exclude the expenses of the Underlying Funds in which the Portfolio invests. |
| | (f) | | The portfolio turnover rate is calculated in accordance with regulatory requirements, without regard to transactions involving short term investments and certain derivatives. If such transactions were included, the portfolio turnover rate may be higher. |
| | |
| 24 | | The accompanying notes are an integral part of these financial statements. |
GOLDMAN SACHS ENHANCED DIVIDEND GLOBAL EQUITY PORTFOLIO
Financial Highlights(continued)
Selected Data for a Share Outstanding Throughout Each Period
| | | | | | | | | | |
| | | | | Goldman Sachs Enhanced
Dividend Global Equity Portfolio | |
| | | | | Class R6 Shares | |
| | | | | Six Months Ended
February 28, 2019 (Unaudited) | | | For the Period
December 29, 2017* to August 31, 2018 | |
| | Per Share Data | | | | | | | | |
| | | |
| | Net asset value, beginning of period | | $ | 12.46 | | | $ | 12.17 | |
| | | |
| | Net investment income(a)(b) | | | 0.13 | | | | 0.10 | |
| | | |
| | Net realized and unrealized gain (loss) | | | (0.52 | ) | | | 0.31 | |
| | | |
| | Total from investment operations | | | (0.39 | ) | | | 0.41 | |
| | | |
| | Distributions to shareholders from net investment income | | | (0.19 | ) | | | (0.12 | ) |
| | | |
| | Distributions to shareholders from net realized gains | | | (0.32 | ) | | | — | |
| | | |
| | Total distributions | | | (0.51 | ) | | | (0.12 | ) |
| | | |
| | Net asset value, end of period | | $ | 11.56 | | | $ | 12.46 | |
| | | |
| | Total return(c) | | | (2.97 | )% | | | 3.39 | % |
| | | |
| | Net assets, end of period (in 000s) | | $ | 10 | | | $ | 10 | |
| | | |
| | Ratio of net expenses to average net assets(d) | | | 0.13 | %(e) | | | 0.12 | %(e) |
| | | |
| | Ratio of total expenses to average net assets(d) | | | 0.23 | %(e) | | | 0.18 | %(e) |
| | | |
| | Ratio of net investment income to average net assets(b) | | | 2.18 | %(e) | | | 1.27 | %(e) |
| | | |
| | Portfolio turnover rate(f) | | | 10 | % | | | 20 | % |
| | * | | Commencement of operations. |
| | (a) | | Calculated based on the average shares outstanding methodology. |
| | (b) | | Recognition of net investment income by the Portfolio is affected by the timing of declaration of dividends by the Underlying Funds in which the Portfolio invests. |
| | (c) | | Assumes investment at the net asset value at the beginning of the period, reinvestment of all distributions, a complete redemption of the investment at the net asset value at the end of the period and no sales or redemption charges. Total returns would be reduced if a sales or redemption charge was taken into account. Returns do not reflect the impact of taxes to shareholders relating to Portfolio distributions or the redemption of Portfolio shares. Total returns for periods less than one full year are not annualized. |
| | (d) | | Expense ratios exclude the expenses of the Underlying Funds in which the Portfolio invests. |
| | (f) | | The portfolio turnover rate is calculated in accordance with regulatory requirements, without regard to transactions involving short term investments and certain derivatives. If such transactions were included, the portfolio turnover rate may be higher. |
| | |
| The accompanying notes are an integral part of these financial statements. | | 25 |
GOLDMAN SACHSTAX-ADVANTAGED GLOBAL EQUITY PORTFOLIO
Financial Highlights(continued)
Selected Data for a Share Outstanding Throughout Each Period
| | | | | | | | | | | | | | | | | | | | | | | | | | |
| | | | | Goldman SachsTax-Advantaged Global Equity Portfolio | |
| | | | | Class A Shares | |
| | | | | Six Months Ended
February 28, 2019
(Unaudited) | | | Year Ended August 31, | |
| | | | | 2018 | | | 2017 | | | 2016 | | | 2015 | | | 2014 | |
| | Per Share Data | | | | | | | | | | | | | | | | | | | | | | | | |
| | | | | | | |
| | Net asset value, beginning of period | | $ | 16.51 | | | $ | 14.78 | | | $ | 12.91 | | | $ | 12.58 | | | $ | 13.51 | | | $ | 11.31 | |
| | | | | | | |
| | Net investment income(a)(b) | | | 0.15 | | | | 0.12 | | | | 0.11 | | | | 0.08 | | | | 0.09 | | | | 0.20 | |
| | | | | | | |
| | Net realized and unrealized gain (loss) | | | (1.04 | ) | | | 1.77 | | | | 1.85 | | | | 0.52 | | | | (0.69 | ) | | | 2.31 | |
| | | | | | | |
| | Total from investment operations | | | (0.89 | ) | | | 1.89 | | | | 1.96 | | | | 0.60 | | | | (0.60 | ) | | | 2.51 | |
| | | | | | | |
| | Distributions to shareholders from net investment income | | | (0.13 | ) | | | (0.16 | ) | | | (0.09 | ) | | | (0.18 | ) | | | (0.10 | ) | | | — | |
| | | | | | | |
| | Distributions to shareholders from net realized gains | | | (0.10 | ) | | | — | | | | — | | | | (0.09 | ) | | | (0.23 | ) | | | (0.31 | ) |
| | | | | | | |
| | Total distributions | | | (0.23 | ) | | | (0.16 | ) | | | (0.09 | ) | | | (0.27 | ) | | | (0.33 | ) | | | (0.31 | ) |
| | | | | | | |
| | Net asset value, end of period | | $ | 15.39 | | | $ | 16.51 | | | $ | 14.78 | | | $ | 12.91 | | | $ | 12.58 | | | $ | 13.51 | |
| | | | | | | |
| | Total return(c) | | | (5.26 | )% | | | 12.81 | % | | | 15.23 | % | | | 4.88 | % | | | (4.39 | )% | | | 22.55 | % |
| | | | | | | |
| | Net assets, end of period (in 000s) | | $ | 620 | | | $ | 658 | | | $ | 615 | | | $ | 591 | | | $ | 543 | | | $ | 235 | |
| | | | | | | |
| | Ratio of net expenses to average net assets(d) | | | 0.53 | %(e) | | | 0.52 | % | | | 0.53 | % | | | 0.53 | % | | | 0.56 | % | | | 0.60 | % |
| | | | | | | |
| | Ratio of total expenses to average net assets(d) | | | 0.61 | %(e) | | | 0.60 | % | | | 0.61 | % | | | 0.61 | % | | | 0.61 | % | | | 0.62 | % |
| | | | | | | |
| | Ratio of net investment income to average net assets(b) | | | 1.93 | %(e) | | | 0.77 | % | | | 0.80 | % | | | 0.64 | % | | | 0.66 | % | | | 1.56 | % |
| | | | | | | |
| | Portfolio turnover rate(f) | | | 8 | % | | | 17 | % | | | 8 | % | | | 19 | % | | | 22 | % | | | 9 | % |
| | (a) | | Calculated based on the average shares outstanding methodology. |
| | (b) | | Recognition of net investment income by the Portfolio is affected by the timing of declaration of dividends by the Underlying Funds in which the Portfolio invests. |
| | (c) | | Assumes investment at the net asset value at the beginning of the period, reinvestment of all distributions, a complete redemption of the investment at the net asset value at the end of the period and no sales or redemption charges. Total returns would be reduced if a sales or redemption charge was taken into account. Returns do not reflect the impact of taxes to shareholders relating to Portfolio distributions or the redemption of Portfolio shares. Total returns for periods less than one full year are not annualized. |
| | (d) | | Expense ratios exclude the expenses of the Underlying Funds in which the Portfolio invests. |
| | (f) | | The portfolio turnover rate is calculated in accordance with regulatory requirements, without regard to transactions involving short term investments and certain derivatives. If such transactions were included, the portfolio turnover rate may be higher. |
| | |
| 26 | | The accompanying notes are an integral part of these financial statements. |
GOLDMAN SACHSTAX-ADVANTAGED GLOBAL EQUITY PORTFOLIO
Financial Highlights(continued)
Selected Data for a Share Outstanding Throughout Each Period
| | | | | | | | | | | | | | | | | | | | | | | | | | |
| | | | | Goldman SachsTax-Advantaged Global Equity Portfolio | |
| | | | | Institutional Shares | |
| | | | | Six Months Ended
February 28, 2019
(Unaudited) | | | Year Ended August 31, | |
| | | | | 2018 | | | 2017 | | | 2016 | | | 2015 | | | 2014 | |
| | Per Share Data | | | | | | | | | | | | | | | | | | | | | | | | |
| | | | | | | |
| | Net asset value, beginning of period | | $ | 16.46 | | | $ | 14.72 | | | $ | 12.86 | | | $ | 12.53 | | | $ | 13.48 | | | $ | 11.38 | |
| | | | | | | |
| | Net investment income(a)(b) | | | 0.19 | | | | 0.17 | | | | 0.17 | | | | 0.11 | | | | 0.17 | | | | 0.18 | |
| | | | | | | |
| | Net realized and unrealized gain (loss) | | | (1.03 | ) | | | 1.78 | | | | 1.84 | | | | 0.53 | | | | (0.71 | ) | | | 2.39 | |
| | | | | | | |
| | Total from investment operations | | | (0.84 | ) | | | 1.95 | | | | 2.01 | | | | 0.64 | | | | (0.54 | ) | | | 2.57 | |
| | | | | | | |
| | Distributions to shareholders from net investment income | | | (0.02 | ) | | | (0.21 | ) | | | (0.15 | ) | | | (0.22 | ) | | | (0.18 | ) | | | (0.16 | ) |
| | | | | | | |
| | Distributions to shareholders from net realized gains | | | (0.10 | ) | | | — | | | | — | | | | (0.09 | ) | | | (0.23 | ) | | | (0.31 | ) |
| | | | | | | |
| | Total distributions | | | (0.12 | ) | | | (0.21 | ) | | | (0.15 | ) | | | (0.31 | ) | | | (0.41 | ) | | | (0.47 | ) |
| | | | | | | |
| | Net asset value, end of period | | $ | 15.50 | | | $ | 16.46 | | | $ | 14.72 | | | $ | 12.86 | | | $ | 12.53 | | | $ | 13.48 | |
| | | | | | | |
| | Total return(c) | | | (5.10 | )% | | | 13.32 | % | | | 15.74 | % | | | 5.22 | % | | | (3.96 | )% | | | 23.05 | % |
| | | | | | | |
| | Net assets, end of period (in 000s) | | $ | 45,968 | | | $ | 62,718 | | | $ | 2,207,827 | | | $ | 1,816,911 | | | $ | 1,701,226 | | | $ | 1,233,566 | |
| | | | | | | |
| | Ratio of net expenses to average net assets(d) | | | 0.14 | %(e) | | | 0.13 | % | | | 0.13 | % | | | 0.13 | % | | | 0.17 | % | | | 0.20 | % |
| | | | | | | |
| | Ratio of total expenses to average net assets(d) | | | 0.22 | %(e) | | | 0.21 | % | | | 0.21 | % | | | 0.21 | % | | | 0.21 | % | | | 0.22 | % |
| | | | | | | |
| | Ratio of net investment income to average net assets(b) | | | 2.50 | %(e) | | | 1.06 | % | | | 1.26 | % | | | 0.92 | % | | | 1.31 | % | | | 1.43 | % |
| | | | | | | |
| | Portfolio turnover rate(f) | | | 8 | % | | | 17 | % | | | 8 | % | | | 19 | % | | | 22 | % | | | 9 | % |
| | (a) | | Calculated based on the average shares outstanding methodology. |
| | (b) | | Recognition of net investment income by the Portfolio is affected by the timing of declaration of dividends by the Underlying Funds in which the Portfolio invests. |
| | (c) | | Assumes investment at the net asset value at the beginning of the period, reinvestment of all distributions, a complete redemption of the investment at the net asset value at the end of the period and no sales or redemption charges. Total returns would be reduced if a sales or redemption charge was taken into account. Returns do not reflect the impact of taxes to shareholders relating to Portfolio distributions or the redemption of Portfolio shares. Total returns for periods less than one full year are not annualized. |
| | (d) | | Expense ratios exclude the expenses of the Underlying Funds in which the Portfolio invests. |
| | (f) | | The portfolio turnover rate is calculated in accordance with regulatory requirements, without regard to transactions involving short term investments and certain derivatives. If such transactions were included, the portfolio turnover rate may be higher. |
| | |
| The accompanying notes are an integral part of these financial statements. | | 27 |
GOLDMAN SACHSTAX-ADVANTAGED GLOBAL EQUITY PORTFOLIO
Financial Highlights(continued)
Selected Data for a Share Outstanding Throughout Each Period
| | | | | | | | | | |
| | | | | Goldman Sachs Tax-Advantaged
Global Equity Portfolio | |
| | | | | Class P Shares | |
| | | | | Six Months Ended
February 28,
2019 (Unaudited) | | | For the Period
April 17, 2018* to August 31, 2018 | |
| | Per Share Data | | | | | | | | |
| | | |
| | Net asset value, beginning of period | | $ | 16.47 | | | $ | 15.84 | |
| | | |
| | Net investment income(a)(b) | | | 0.19 | | | | 0.01 | |
| | | |
| | Net realized and unrealized gain (loss) | | | (1.06 | ) | | | 0.62 | |
| | | |
| | Total from investment operations | | | (0.87 | ) | | | 0.63 | |
| | | |
| | Distributions to shareholders from net investment income | | | (0.20 | ) | | | — | |
| | | |
| | Distributions to shareholders from net realized gains | | | (0.10 | ) | | | — | |
| | | |
| | Total distributions | | | (0.30 | ) | | | — | |
| | | |
| | Net asset value, end of period | | $ | 15.30 | | | $ | 16.47 | |
| | | |
| | Total return(c) | | | (5.10 | )% | | | 3.98 | % |
| | | |
| | Net assets, end of period (in 000s) | | $ | 2,706,530 | | | $ | 2,797,271 | |
| | | |
| | Ratio of net expenses to average net assets(d) | | | 0.13 | %(e) | | | 0.12 | %(e) |
| | | |
| | Ratio of total expenses to average net assets(d) | | | 0.21 | %(e) | | | 0.20 | %(e) |
| | | |
| | Ratio of net investment income to average net assets(b) | | | 2.59 | %(e) | | | 0.15 | %(e) |
| | | |
| | Portfolio turnover rate(f) | | | 8 | % | | | 17 | % |
| | * | | Commencement of operations. |
| | (a) | | Calculated based on the average shares outstanding methodology. |
| | (b) | | Recognition of net investment income by the Portfolio is affected by the timing of declaration of dividends by the Underlying Funds in which the Portfolio invests. |
| | (c) | | Assumes investment at the net asset value at the beginning of the period, reinvestment of all distributions, a complete redemption of the investment at the net asset value at the end of the period and no sales or redemption charges. Total returns would be reduced if a sales or redemption charge was taken into account. Returns do not reflect the impact of taxes to shareholders relating to Portfolio distributions or the redemption of Portfolio shares. Total returns for periods less than one full year are not annualized. |
| | (d) | | Expense ratios exclude the expenses of the Underlying Funds in which the Portfolio invests. |
| | (f) | | The portfolio turnover rate is calculated in accordance with regulatory requirements, without regard to transactions involving short term investments and certain derivatives. If such transactions were included, the portfolio turnover rate may be higher. |
| | |
| 28 | | The accompanying notes are an integral part of these financial statements. |
GOLDMAN SACHSTAX-ADVANTAGED GLOBAL EQUITY PORTFOLIO
Financial Highlights(continued)
Selected Data for a Share Outstanding Throughout Each Period
| | | | | | | | | | |
| | | | | Goldman Sachs Tax-Advantaged
Global Equity Portfolio | |
| | | | | Class R6 Shares | |
| | | | | Six Months Ended
February 28, 2019 (Unaudited) | | | For the Period
December 29, 2017* to August 31, 2018 | |
| | Per Share Data | | | | | | | | |
| | | |
| | Net asset value, beginning of period | | $ | 16.46 | | | $ | 15.59 | |
| | | |
| | Net investment income (loss)(a)(b) | | | 0.19 | | | | (0.01 | ) |
| | | |
| | Net realized and unrealized gain (loss) | | | (1.06 | ) | | | 0.88 | |
| | | |
| | Total from investment operations | | | (0.87 | ) | | | 0.87 | |
| | | |
| | Distributions to shareholders from net investment income | | | (0.20 | ) | | | — | |
| | | |
| | Distributions to shareholders from net realized gains | | | (0.10 | ) | | | — | |
| | | |
| | Total distributions | | | (0.30 | ) | | | — | |
| | | |
| | Net asset value, end of period | | $ | 15.29 | | | $ | 16.46 | |
| | | |
| | Total return(c) | | | (5.13 | )% | | | 5.58 | % |
| | | |
| | Net assets, end of period (in 000s) | | $ | 10 | | | $ | 11 | |
| | | |
| | Ratio of net expenses to average net assets(d) | | | 0.13 | %(e) | | | 0.12 | %(e) |
| | | |
| | Ratio of total expenses to average net assets(d) | | | 0.19 | %(e) | | | 0.18 | %(e) |
| | | |
| | Ratio of net investment income (loss) to average net assets(b) | | | 2.59 | %(e) | | | (0.05 | )%(e) |
| | | |
| | Portfolio turnover rate(f) | | | 8 | % | | | 17 | % |
| | * | | Commencement of operations. |
| | (a) | | Calculated based on the average shares outstanding methodology. |
| | (b) | | Recognition of net investment income by the Portfolio is affected by the timing of declaration of dividends by the Underlying Funds in which the Portfolio invests. |
| | (c) | | Assumes investment at the net asset value at the beginning of the period, reinvestment of all distributions, a complete redemption of the investment at the net asset value at the end of the period and no sales or redemption charges. Total returns would be reduced if a sales or redemption charge was taken into account. Returns do not reflect the impact of taxes to shareholders relating to Portfolio distributions or the redemption of Portfolio shares. Total returns for periods less than one full year are not annualized. |
| | (d) | | Expense ratios exclude the expenses of the Underlying Funds in which the Portfolio invests. |
| | (f) | | The portfolio turnover rate is calculated in accordance with regulatory requirements, without regard to transactions involving short term investments and certain derivatives. If such transactions were included, the portfolio turnover rate may be higher. |
| | |
| The accompanying notes are an integral part of these financial statements. | | 29 |
GOLDMAN SACHS GLOBAL TAX-AWARE EQUITY PORTFOLIOS
Notes to Financial Statements
February 28, 2019 (Unaudited)
Goldman Sachs Trust (the “Trust”) is a Delaware statutory trust registered under the Investment Company Act of 1940, as amended (the “Act”), as anopen-end management investment company. The following table lists those series of the Trust that are included in this report (collectively, the “Portfolios” or individually a “Portfolio”), along with their corresponding share classes and respective diversification status under the Act:
| | | | |
| Portfolio | | Share Classes Offered | | Diversified/
Non-diversified |
| Enhanced Dividend Global Equity andTax-Advantaged Global Equity | | A, Institutional, P and R6 | | Diversified |
Class A Shares are sold with afront-end sales charge of up to 5.50%. Institutional, Class P and Class R6 Shares are not subject to a sales charge.
Goldman Sachs Asset Management, L.P. (“GSAM”), an affiliate of Goldman Sachs & Co. LLC (“Goldman Sachs”), serves as investment adviser to the Portfolios pursuant to a management agreement (the “Agreement”) with the Trust.
The Portfolios are expected to invest primarily in a combination of domestic and international equity and fixed income underlying funds (“Underlying Funds”) which are registered under the Act, for which GSAM acts as the investment adviser. Additionally, these Portfolios may invest a portion of their assets directly in other securities and instruments, including unaffiliated exchange traded funds.
|
| 2. SIGNIFICANT ACCOUNTING POLICIES |
The financial statements have been prepared in accordance with accounting principles generally accepted in the United States of America (“GAAP”) and require management to make estimates and assumptions that may affect the reported amounts and disclosures. Actual results may differ from those estimates and assumptions.
A. Investment Valuation — The valuation policy of the Portfolios and Underlying Funds is to value investments at fair value.
B. Investment Income and Investments — Investment income includes interest income, dividend income, and securities lending income, if any. Interest income is accrued daily and adjusted for amortization of premiums and accretion of discounts. Dividend income is recognized onex-dividend date or, for certain foreign securities, as soon as such information is obtained subsequent to theex-dividend date. Investment transactions are reflected on trade date. Realized gains and losses are calculated using identified cost. Investment transactions are recorded on the following business day for daily net asset value (“NAV”) calculations. Distributions from master limited partnerships (“MLPs”) are generally recorded based on the characterization reported on the MLP’s tax return. The Goldman Sachs MLP Energy Infrastructure Fund (the “Underlying MLP Fund”) records itspro-rata share of the income/loss and capital gains/losses, allocated from the underlying partnerships and adjusts the cost basis of the underlying partnerships accordingly. Income distributions are recognized as capital gains or income in the financial statements in accordance with the character that is distributed.
For derivative contracts, realized gains and losses are recorded upon settlement of the contract.
C. Class Allocations and Expenses — Investment income, realized and unrealized gain (loss), if any, andnon-class specific expenses of each Portfolio are allocated daily based upon the proportion of net assets of each class. Non-class specific expenses directly incurred by a Portfolio are charged to that Portfolio, while such expenses incurred by the Trust are allocated across the applicable Portfolios on a straight-line and/orpro-rata basis depending upon the nature of the expenses. Class specific expenses, where applicable, are borne by the respective share classes and include Distribution and Service and Transfer Agency fees. Expenses included in the accompanying financial statements reflect the expenses of each Portfolio and do not include any expenses associated with the Underlying Funds. Because the Underlying Funds have varied expense and fee levels and the Portfolios may own different proportions of the Underlying Funds at different times, the amount of fees and expenses incurred indirectly by each Portfolio will vary.
30
GOLDMAN SACHS GLOBAL TAX-AWARE EQUITY PORTFOLIOS
|
| 2. SIGNIFICANT ACCOUNTING POLICIES (continued) |
D. Federal Taxes and Distributions to Shareholders — It is each Portfolio’s policy to comply with the requirements of the Internal Revenue Code of 1986, as amended (the “Code”), applicable to regulated investment companies and to distribute each year substantially all of its investment company taxable income and capital gains to its shareholders. Accordingly, each Portfolio is not required to make any provisions for the payment of federal income tax. Distributions to shareholders are recorded on theex-dividend date. Income and capital gains distributions, if any, are declared and paid according to the following schedule:
| | | | | | |
| Portfolio | | | | Income Distributions
Declared/Paid | | Capital Gains Distributions
Declared/Paid |
Enhanced Dividend Global Equity | | | | Quarterly | | Annually |
Tax-Advantaged Global Equity | | | | Annually | | Annually |
Net capital losses, if any, are carried forward to future fiscal years and may be used to the extent allowed by the Code to offset any future capital gains. Losses that are carried forward will retain their character as either short-term or long-term capital losses. Utilization of capital loss carryforwards will reduce the requirement of future capital gains distributions.
The characterization of distributions to shareholders for financial reporting purposes is determined in accordance with federal income tax rules, which may differ from GAAP. The source of each Portfolio’s distributions may be shown in the accompanying financial statements as either from distributable earnings or capital. Certain components of the Portfolios’ net assets on the Statements of Assets and Liabilities reflect permanent GAAP/tax differences based on the appropriate tax character.
E. Foreign Currency Translation — The accounting records and reporting currency of a Portfolio are maintained in United States (“U.S.”) dollars. Assets and liabilities denominated in foreign currencies are translated into U.S. dollars using the current exchange rates at the close of each business day. The effect of changes in foreign currency exchange rates on investments is included within net realized and unrealized gain (loss) on investments. Changes in the value of other assets and liabilities as a result of fluctuations in foreign exchange rates are included in the Statements of Operations within net change in unrealized gain (loss) on foreign currency translation. Transactions denominated in foreign currencies are translated into U.S. dollars on the date the transaction occurred, the effects of which are included within net realized gain (loss) on foreign currency transactions.
|
| 3. INVESTMENTS AND FAIR VALUE MEASUREMENTS |
U.S. GAAP defines the fair value of a financial instrument as the amount that would be received to sell an asset or paid to transfer a liability in an orderly transaction between market participants at the measurement date (i.e., the exit price); the Portfolios’ policy is to use the market approach. GAAP establishes a fair value hierarchy that prioritizes the inputs to valuation techniques used to measure fair value. The hierarchy gives the highest priority to unadjusted quoted prices in active markets for identical assets or liabilities (Level 1 measurements) and the lowest priority to unobservable inputs (Level 3 measurements). The levels used for classifying investments are not necessarily an indication of the risk associated with investing in these investments. The three levels of the fair value hierarchy are described below:
Level 1 — Unadjusted quoted prices in active markets that are accessible at the measurement date for identical, unrestricted assets or liabilities;
Level 2 — Quoted prices in markets that are not active or financial instruments for which significant inputs are observable (including, but not limited to, quoted prices for similar investments, interest rates, foreign exchange rates, volatility and credit spreads), either directly or indirectly;
Level 3 — Prices or valuations that require significant unobservable inputs (including GSAM’s assumptions in determining fair value measurement).
The Board of Trustees (“Trustees”) has approved Valuation Procedures that govern the valuation of the portfolio investments held by the Portfolios, including investments for which market quotations are not readily available. The Trustees have delegated to GSAMday-to-day responsibility for implementing and maintaining internal controls and procedures related to the valuation of the
31
GOLDMAN SACHS GLOBAL TAX-AWARE EQUITY PORTFOLIOS
Notes to Financial Statements(continued)
February 28, 2019 (Unaudited)
|
| 3. INVESTMENTS AND FAIR VALUE MEASUREMENTS (continued) |
Portfolios’ investments. To assess the continuing appropriateness of pricing sources and methodologies, GSAM regularly performs price verification procedures and issues challenges as necessary to third party pricing vendors or brokers, and any differences are reviewed in accordance with the Valuation Procedures.
A. Level 1 and Level 2 Fair Value Investments — The valuation techniques and significant inputs used in determining the fair values for investments classified as Level 1 and Level 2 are as follows:
Equity Securities — Equity securities traded on a U.S. securities exchange or the NASDAQ system, or those located on certain foreign exchanges, including but not limited to the Americas, are valued daily at their last sale price or official closing price on the principal exchange or system on which they are traded. If there is no sale or official closing price or such price is believed by GSAM to not represent fair value, equity securities are valued at the last bid price for long positions and at the last ask price for short positions. To the extent these investments are actively traded, they are classified as Level 1 of the fair value hierarchy, otherwise they are generally classified as Level 2.
Unlisted equity securities for which market quotations are available are valued at the last sale price on the valuation date, or if no sale occurs, at the last bid price, and are generally classified as Level 2. Securities traded on certain foreign securities exchanges are valued daily at fair value determined by an independent fair value service (if available) under Valuation Procedures approved by the Trustees and consistent with applicable regulatory guidance. The independent fair value service takes into account multiple factors including, but not limited to, movements in the securities markets, certain depositary receipts, futures contracts and foreign currency exchange rates that have occurred subsequent to the close of the foreign securities exchange. These investments are generally classified as Level 2 of the fair value hierarchy.
Underlying Funds — Investments in the Underlying Funds are valued at the NAV per share on the day of valuation. Because each Portfolio invests primarily in other mutual funds that fluctuate in value, the Portfolios’ shares will correspondingly fluctuate in value. These investments are generally classified as Level 1 of the fair value hierarchy. For information regarding an Underlying Fund’s accounting policies and investment holdings, please see the Underlying Fund’s shareholder report.
Derivative Contracts — A derivative is an instrument whose value is derived from underlying assets, indices, reference rates or a combination of these factors. A Portfolio enters into derivative transactions to hedge against changes in interest rates, securities prices, and/or currency exchange rates, to increase total return, or to gain access to certain markets or attain exposure to other underliers.
Exchange-traded derivatives, including futures and options contracts, are generally valued at the last sale or settlement price on the exchange where they are principally traded. Exchange-traded options without settlement prices are generally valued at the midpoint of the bid and ask prices on the exchange where they are principally traded (or, in the absence oftwo-way trading, at the last bid price for long positions and the last ask price for short positions). Exchange-traded derivatives typically fall within Level 1 of the fair value hierarchy.Over-the-counter (“OTC”) and centrally cleared derivatives are valued using market transactions and other market evidence, including market-based inputs to models, calibration to market-clearing transactions, broker or dealer quotations, or other alternative pricing sources. Where models are used, the selection of a particular model to value OTC and centrally cleared derivatives depends upon the contractual terms of, and specific risks inherent in, the instrument, as well as the availability of pricing information in the market. Valuation models require a variety of inputs, including contractual terms, market prices, yield curves, credit curves, measures of volatility, voluntary and involuntary prepayment rates, loss severity rates and correlations of such inputs. For OTC and centrally cleared derivatives that trade in liquid markets, model inputs can generally be verified and model selection does not involve significant management judgment. OTC and centrally cleared derivatives are classified within Level 2 of the fair value hierarchy when significant inputs are corroborated by market evidence.
i. Forward Contracts — A forward contract is a contract between two parties to buy or sell an asset at a specified price on a future date. A forward contract settlement can occur on a cash or delivery basis. Forward contracts aremarked-to-market daily using independent vendor prices, and the change in value, if any, is recorded as an unrealized gain or loss. Cash and certain investments may be used to collateralize forward contracts.
32
GOLDMAN SACHS GLOBAL TAX-AWARE EQUITY PORTFOLIOS
|
| 3. INVESTMENTS AND FAIR VALUE MEASUREMENTS (continued) |
Aforward foreign currency exchange contract is a forward contract in which a Portfolio agrees to receive or deliver a fixed quantity of one currency for another, at apre-determined price at a future date. All forward foreign currency exchange contracts aremarked-to-market daily at the applicable forward rate.Non-deliverable forward foreign currency exchange contracts are settled with the counterparty in cash without the delivery of foreign currency.
ii. Futures Contracts — Futures contracts are contracts to buy or sell a standardized quantity of a specified commodity or security. Upon entering into a futures contract, a Portfolio deposits cash or securities in an account on behalf of the broker in an amount sufficient to meet the initial margin requirement. Subsequent payments are made or received by a Portfolio equal to the daily change in the contract value and are recorded as variation margin receivable or payable with a corresponding offset to unrealized gains or losses. For financial reporting purposes, cash collateral that has been pledged to cover obligations of the Portfolios and cash collateral received, if any, is reported separately on the Statements of Assets and Liabilities as receivables/payables for collateral on certain derivative contracts.Non-cash collateral pledged by the Portfolios, if any, is noted in the Schedules of Investments.
B. Level 3 Fair Value Investments — To the extent that significant inputs to valuation models and other alternative pricing sources are unobservable, or if quotations are not readily available, or if GSAM believes that such quotations do not accurately reflect fair value, the fair value of a Portfolio’s investments may be determined under Valuation Procedures approved by the Trustees. GSAM, consistent with its procedures and applicable regulatory guidance, may make an adjustment to the most recent valuation prices of either domestic or foreign securities in light of significant events to reflect what it believes to be the fair value of the securities at the time of determining a Portfolio’s NAV.
C. Fair Value Hierarchy — The following is a summary of the Portfolios’ investments and derivatives classified in the fair value hierarchy as of February 28, 2019:
| | | | | | | | | | | | |
|
| ENHANCED DIVIDEND GLOBAL EQUITY | |
| | | |
| Investment Type | | Level 1 | | | Level 2 | | | Level 3 | |
| | | |
| Assets | | | | | | | | | | | | |
| | | |
Underlying Equity Funds | | $ | 619,230,968 | | | $ | — | | | $ | — | |
| | | |
| Derivative Type | | | | | | | | | |
| | | |
| Assets(a) | | | | | | | | | | | | |
| | | |
Forward Foreign Currency Exchange Contracts | | $ | — | | | $ | 523,658 | | | $ | — | |
| | | |
Futures Contracts | | | 421,270 | | | | — | | | | — | |
| | | |
| Total | | $ | 421,270 | | | $ | 523,658 | | | $ | — | |
| | | |
| Liabilities(a) | | | | | | | | | | | | |
| | | |
Forward Foreign Currency Exchange Contracts | | $ | — | | | $ | (620,278) | | | $ | — | |
| | | |
| TAX-ADVANTAGED GLOBAL EQUITY | | | | | | | | | | | | |
| | | |
| Investment Type | | Level 1 | | | Level 2 | | | Level 3 | |
| | | |
| Assets | | | | | | | | | | | | |
| | | |
Underlying Equity Funds | | $ | 2,721,201,093 | | | $ | — | | | $ | — | |
| (a) | | Amount shown represents unrealized gain (loss) at period end. |
33
GOLDMAN SACHS GLOBAL TAX-AWARE EQUITY PORTFOLIOS
Notes to Financial Statements(continued)
February 28, 2019 (Unaudited)
|
| 3. INVESTMENTS AND FAIR VALUE MEASUREMENTS (continued) |
| | | | | | | | | | | | |
| | | |
| TAX-ADVANTAGED GLOBAL EQUITY (continued) | | | | | | | | | | | | |
| | | |
| Derivative Type | | Level 1 | | | Level 2 | | | Level 3 | |
| | | |
| Assets(a) | | | | | | | | | | | | |
| | | |
Forward Foreign Currency Exchange Contracts | | $ | — | | | $ | 2,118,597 | | | $ | — | |
| | | |
Futures Contracts | | | 1,747,824 | | | | — | | | | — | |
| | | |
| Total | | $ | 1,747,824 | | | $ | 2,118,597 | | | $ | — | |
| | | |
| Liabilities(a) | | | | | | | | | | | | |
| | | |
Forward Foreign Currency Exchange Contracts | | $ | — | | | $ | (2,558,382 | ) | | $ | — | |
| (a) | | Amount shown represents unrealized gain (loss) at period end. |
For further information regarding security characteristics, see the Schedules of Investments.
|
| 4. INVESTMENTS IN DERIVATIVES |
The following tables set forth, by certain risk types, the gross value of derivative contracts (not considered to be hedging instruments for accounting disclosure purposes) as of February 28, 2019. These instruments were used as part of the Portfolios’ investment strategies and to obtain and/or manage exposure related to the risks below. The values in the tables below exclude the effects of cash collateral received or posted pursuant to these derivative contracts, and therefore are not representative of the Portfolios’ net exposure:
| | | | | | | | | | | | |
| | | |
| Enhanced Dividend Global Equity | | | | | | | | | | |
| Risk | | Statements of Assets
and Liabilities | | Assets | | | Statements of Assets
and Liabilities | | Liabilities | |
Currency | | Receivable for unrealized gain on forward foreign currency exchange contracts | | $ | 523,658 | | | Payable for unrealized loss on forward foreign currency exchange contracts | | $ | (620,278) | |
Equity | | Variation margin on futures contracts | | | 421,270 | (a) | | — | | | — | |
| Total | | | | $ | 944,928 | | | | | $ | (620,278) | |
| | | |
| Tax-Advantaged Global Equity | | | | | | | | | | |
| Risk | | Statements of Assets
and Liabilities | | Assets | | | Statements of Assets
and Liabilities | | Liabilities | |
Currency | | Receivable for unrealized gain on forward foreign currency exchange contracts | | $ | 2,118,597 | | | Payable for unrealized loss on forward foreign currency exchange contracts | | $ | (2,558,382) | |
Equity | | Variation margin on futures contracts | | | 1,747,824 | (a) | | — | | | — | |
| Total | | | | $ | 3,866,421 | | | | | $ | (2,558,382) | |
| (a) | | Includes unrealized gain (loss) on futures contracts described in the Additional Investment Information sections of the Schedules of Investments. Only the variation margin as of February 28, 2019 is reported within the Statements of Assets and Liabilities. |
34
GOLDMAN SACHS GLOBAL TAX-AWARE EQUITY PORTFOLIOS
|
| 4. INVESTMENTS IN DERIVATIVES (continued) |
The following tables set forth, by certain risk types, the Portfolios’ gains (losses) related to these derivatives and their indicative volumes for the six months ended February 28, 2019. These gains (losses) should be considered in the context that these derivative contracts may have been executed to create investment opportunities and/or economically hedge certain investments, and accordingly, certain gains (losses) on such derivative contracts may offset certain (losses) gains attributable to investments. These gains (losses) are included in “Net realized gain (loss)” or “Net change in unrealized gain (loss)” on the Statements of Operations:
| | | | | | | | | | | | | | |
| | | |
| Enhanced Dividend Global Equity | | | | | | | | | | | | |
| Risk | | Statements of Operations | | Net
Realized
Gain (Loss) | | | Net Change in
Unrealized
Gain (Loss) | | | Average
Number of
Contracts(a) | |
| Currency | | Net realized gain (loss) from forward foreign currency exchange contracts/Net change in unrealized gain (loss) on forward foreign currency exchange contracts | | | $ 3,392,041 | | | | $(1,933,854) | | | | 9 | |
| Equity | | Net realized gain (loss) from futures contracts/Net change in unrealized gain (loss) on futures contracts | | | (410,680 | ) | | | 116,382 | | | | 47 | |
| Total | | | | $ | 2,981,361 | | | $ | (1,817,472) | | | | 56 | |
| | | |
| Tax-Advantaged Global Equity | | | | | | | | | | | | |
| Risk | | Statements of Operations | | Net
Realized
Gain (Loss) | | | Net Change in
Unrealized
Gain (Loss) | | | Average
Number of
Contracts(a) | |
| Currency | | Net realized gain (loss) from forward foreign currency exchange contracts/Net change in unrealized gain (loss) on forward foreign currency exchange contracts | | $ | 13,627,202 | | | $ | (7,649,229) | | | | 9 | |
| Equity | | Net realized gain (loss) from futures contracts/Net change in unrealized gain (loss) on futures contracts | | | (1,812,467 | ) | | | 582,075 | | | | 195 | |
| Total | | | | $ | 11,814,735 | | | $ | (7,067,154) | | | | 204 | |
| (a) | | Average number of contracts is based on the average of month end balances for the six months ended February 28, 2019. |
|
| 5. AGREEMENTS AND AFFILIATED TRANSACTIONS |
A. Management Agreement — Under the Agreement, GSAM manages the Portfolios, subject to the general supervision of the Trustees.
As compensation for the services rendered pursuant to the Agreement, the assumption of the expenses related thereto and administration of the Portfolios’ business affairs, including providing facilities, GSAM is entitled to a management fee, accrued daily and paid monthly, equal to an annual percentage rate of 0.15% of each Portfolio’s average daily net assets. GSAM has agreed to waive a portion of its management fee in order to achieve an effective rate of 0.08% as an annual percentage rate of average daily net assets of each Portfolio through at least December 28, 2019, and prior to such date, GSAM may not terminate the arrangement without the approval of the Trustees.
B. Distribution and/or Service(12b-1) Plan — The Trust, on behalf of Class A Shares of each Portfolio, has adopted a Distribution and Service Plan subject to Rule12b-1 under the Act. Under the Distribution and Service Plan, Goldman Sachs, which serves as distributor (the “Distributor”), is entitled to a fee accrued daily and paid monthly for distribution services and personal and account maintenance services, which may then be paid by Goldman Sachs to authorized dealers. These fees are equal to an annual percentage rate of 0.25% of the average daily net assets attributable to Class A Shares of the Portfolios.
35
GOLDMAN SACHS GLOBAL TAX-AWARE EQUITY PORTFOLIOS
Notes to Financial Statements(continued)
February 28, 2019 (Unaudited)
|
| 5. AGREEMENTS AND AFFILIATED TRANSACTIONS (continued) |
C. Distribution Agreement — Goldman Sachs, as Distributor of the shares of the Portfolios pursuant to a Distribution Agreement, may retain a portion of the Class A Shares’ front end sales charge. During the six months ended February 28, 2019, Goldman Sachs advised that it retainedfront-end sales charges of $1,545 and $0 for the Enhanced Dividend Global Equity Portfolio andTax-Advantaged Global Equity Portfolio, respectively.
D. Transfer Agency Agreement — Goldman Sachs also serves as the transfer agent of the Portfolios for a fee pursuant to the Transfer Agency Agreement. The fees charged for such transfer agency services are accrued daily and paid monthly at annual rates as follows: 0.18% of the average daily net assets of Class A Shares; 0.03% of the average daily net assets of Class P and Class R6 Shares; and 0.04% of the average daily net assets of Institutional Shares.
E. Other Expense Agreements and Affiliated Transactions — GSAM has agreed to limit certain “Other Expenses” of the Portfolios (excluding acquired (underlying) fund fees and expenses, transfer agency fees and expenses, service fees and shareholder administration fees (as applicable), taxes, interest, brokerage fees, expenses of shareholder meetings, litigation and indemnification, and extraordinary expenses) to the extent such expenses exceed, on an annual basis, a percentage rate of the average daily net assets of each Portfolio. Such Other Expense reimbursements, if any, are accrued daily and paid monthly. In addition, the Portfolios are not obligated to reimburse GSAM for prior fiscal year expense reimbursements, if any. The Other Expense limitations as an annual percentage rate of average daily net assets for the Portfolios is 0.014%. These Other Expense limitations will remain in place through at least December 28, 2019, and prior to such date GSAM may not terminate the arrangements without the approval of the Trustees. In addition, the Portfolios have entered into certain offset arrangements with the custodian and the transfer agent, which may result in a reduction of the Portfolios’ expenses and are received irrespective of the application of the “Other Expense” limitations described above.
For the six month ended February 28, 2019, these expense reductions, including any fee waivers and Other Expense reimbursements, were as follows:
| | | | | | | | | | | | | | | | | | |
| Portfolio | | | | Management
Fee Waiver | | | Other
Expense
Reimbursement | | | Custody Fee
Credits | | | Total
Expense
Reductions | |
Enhanced Dividend Global Equity | | | | $ | 217,599 | | | $ | 157,672 | | | $ | 2,381 | | | $ | 377,652 | |
Tax-Advantaged Global Equity | | | | | 926,883 | | | | 179,580 | | | | 8,485 | | | | 1,114,948 | |
F. Line of Credit Facility — As of February 28, 2019, the Portfolios participated in a $770,000,000 committed, unsecured revolving line of credit facility (the “facility”) together with other funds of the Trust and certain registered investment companies having management agreements with GSAM or its affiliates. This facility is to be used for temporary emergency purposes, or to allow for an orderly liquidation of securities to meet redemption requests. The interest rate on borrowings is based on the federal funds rate. The facility also requires a fee to be paid by the Portfolios based on the amount of the commitment that has not been utilized. For the six months ended February 28, 2019, the Portfolios did not have any borrowings under the facility.
36
GOLDMAN SACHS GLOBAL TAX-AWARE EQUITY PORTFOLIOS
|
| 5. AGREEMENTS AND AFFILIATED TRANSACTIONS (continued) |
G. Other Transactions with Affiliates — The Portfolios invest primarily in Class R6 Shares of the Underlying Funds. These Underlying Funds are considered to be affiliated with the Portfolios. The tables below show the transactions in and earnings from investments in these Underlying Funds for the six months ended February 28, 2019:
| | | | | | | | | | | | | | | | | | | | | | | | | | | | | | | | | | | | | | | | |
|
| Enhanced Dividend Global Equity | |
| Underlying Funds | | Beginning
Value as of
August 31,
2018 | | | Purchases
at Cost | | | Proceeds
from Sales | | | Return of
Capital on
Dividends | | | Net
Realized
Gain/(Loss)
from
Affiliated
Investment
Companies | | |
Change in
Unrealized
Appreciation/
(Depreciation) | | | Ending
Value as of
February 28,
2019 | | | Shares
as of
February 28,
2019 | | | Dividend
Income from
Affiliated
Investment
Companies | | | Capital Gain
Distributions
from
Affiliated
Investment
Companies | |
Goldman Sachs Emerging Markets Equity Insights Fund | | $ | 35,112,555 | | | $ | 2,710,087 | | | $ | (3,627,644 | ) | | $ | — | | | $ | (373,366 | ) | | $ | (1,796,773 | ) | | $ | 32,024,859 | | | | 3,406,900 | | | $ | 692,800 | | �� | $ | — | |
Goldman Sachs Global Infrastructure Fund | | | 15,612,484 | | | | 1,263,658 | | | | (2,351,834 | ) | | | — | | | | (208,266 | ) | | | 641,060 | | | | 14,957,102 | | | | 1,373,471 | | | | 122,365 | | | | — | |
Goldman Sachs Global Real Estate Securities Fund | | | 15,597,639 | | | | 1,373,338 | | | | (2,351,834 | ) | | | (22,872 | ) | | | (99,474 | ) | | | 151,928 | | | | 14,648,725 | | | | 1,355,109 | | | | 189,173 | | | | — | |
Goldman Sachs International Equity Dividend and Premium Fund | | | 143,854,054 | | | | 8,495,828 | | | | (12,821,175 | ) | | | — | | | | (838,926 | ) | | | (6,174,893 | ) | | | 132,514,888 | | | | 19,288,921 | | | | 1,238,921 | | | | — | |
Goldman Sachs International Small Cap Insights Fund | | | 25,359,630 | | | | 2,253,654 | | | | (2,207,012 | ) | | | — | | | | (277,779 | ) | | | (2,123,182 | ) | | | 23,005,311 | | | | 2,039,478 | | | | 338,680 | | | | — | |
Goldman Sachs MLP Energy Infrastructure Fund | | | 16,266,217 | | | | 2,146,116 | | | | (1,381,834 | ) | | | (664,227 | ) | | | 115,803 | | | | (1,210,401 | ) | | | 15,271,674 | | | | 2,313,890 | | | | (109,405 | )(a) | | | — | |
Goldman Sachs Small Cap Equity Insights Fund | | | 54,548,989 | | | | 9,476,444 | | | | (4,661,466 | ) | | | — | | | | 282,476 | | | | (7,281,157 | ) | | | 52,365,286 | | | | 2,013,275 | | | | 111,850 | | | | 2,463,665 | |
Goldman Sachs Tactical Tilt Overlay Fund | | | 66,830,501 | | | | 5,157,413 | | | | (11,120,618 | ) | | | — | | | | (1,143,122 | ) | | | 182,099 | | | | 59,906,273 | | | | 6,137,938 | | | | 1,702,590 | | | | — | |
Goldman Sachs US Equity Dividend and Premium Fund | | | 300,497,217 | | | | 29,460,500 | | | | (30,559,705 | ) | | | — | | | | (783,869 | ) | | | (24,077,293 | ) | | | 274,536,850 | | | | 21,840,640 | | | | 2,926,109 | | | | 13,554,448 | |
| | | | | | | | | | |
Total | | $ | 673,679,286 | | | $ | 62,337,038 | | | $ | (71,083,122 | ) | | $ | (687,099 | ) | | $ | (3,326,523 | ) | | $ | (41,688,612 | ) | | $ | 619,230,968 | | | | | | | $ | 7,213,083 | | | $ | 16,018,113 | |
| (a) | | Amount includes return of capital distributions of $664,227, which represents the difference between the estimated amount related to the fiscal year ended August 31, 2018 and the final amount recorded during the period ended February 28, 2019. |
| | | | | | | | | | | | | | | | | | | | | | | | | | | | | | | | | | | | |
|
| Tax-Advantaged Global Equity | |
| Underlying Funds | | Beginning
Value as of
August 31,
2018 | | | Purchases
at Cost | | | Proceeds
from Sales | | | Return of
Capital on
Dividends | | | Net
Realized
Gain/(Loss)
from
Affiliated
Investment
Companies | | |
Change in
Unrealized
Appreciation/
(Depreciation) | | | Ending
Value as of
February 28,
2019 | | |
Shares
as of
February 28,
2019 | | | Dividend
Income from
Affiliated
Investment
Companies | |
Goldman Sachs Emerging Markets Equity Insights Fund | | $ | 145,338,015 | | | $ | 13,505,156 | | | $ | (10,908,840 | ) | | $ | — | | | $ | (2,357,527 | ) | | $ | (6,663,366 | ) | | $ | 138,913,438 | | | | 14,778,025 | | | $ | 3,018,567 | |
Goldman Sachs Global Infrastructure Fund | | | 64,491,434 | | | | 6,328,736 | | | | (7,864,828 | ) | | | — | | | | (886,345 | ) | | | 2,787,589 | | | | 64,856,586 | | | | 5,955,609 | | | | 526,742 | |
Goldman Sachs Global Real Estate Securities Fund | | | 65,925,422 | | | | 5,339,249 | | | | (7,944,828 | ) | | | (93,863 | ) | | | (554,802 | ) | | | 832,768 | | | | 63,503,946 | | | | 5,874,556 | | | | 813,393 | |
37
GOLDMAN SACHS GLOBAL TAX-AWARE EQUITY PORTFOLIOS
Notes to Financial Statements(continued)
February 28, 2019 (Unaudited)
|
| 5. AGREEMENTS AND AFFILIATED TRANSACTIONS (continued) |
| | | | | | | | | | | | | | | | | | | | | | | | | | | | | | | | | | | | |
|
| Tax-Advantaged Global Equity (continued) | |
| Underlying Funds | | Beginning
Value as of
August 31,
2018 | | | Purchases
at Cost | | | Proceeds
from Sales | | | Return of
Capital on
Dividends | | | Net
Realized
Gain/(Loss)
from
Affiliated
Investment
Companies | | |
Change in
Unrealized
Appreciation/
(Depreciation) | | | Ending
Value as of
February 28,
2019 | | |
Shares
as of
February 28,
2019 | | | Dividend
Income from
Affiliated
Investment
Companies | |
Goldman Sachs International Small Cap Insights Fund | | $ | 105,010,891 | | | $ | 7,515,195 | | | $ | (3,020,171 | ) | | $ | — | | | $ | (703,038 | ) | | $ | (9,732,922 | ) | | $ | 99,069,955 | | | | 8,782,797 | | | $ | 1,485,938 | |
Goldman Sachs InternationalTax-Managed Equity Fund | | | 594,924,163 | | | | 65,711,024 | | | | (17,478,342 | ) | | | — | | | | (3,338,434 | ) | | | (55,658,473 | ) | | | 584,159,938 | | | | 60,660,430 | | | | 11,604,648 | |
Goldman Sachs MLP Energy Infrastructure Fund | | | 67,225,300 | | | | 8,294,980 | | | | (1,884,828 | ) | | | (2,696,687 | ) | | | (64,734 | ) | | | (4,732,991 | ) | | | 66,141,040 | | | | 10,021,370 | | | | (293,702 | )(a) |
Goldman Sachs Tactical Tilt Overlay Fund | | | 276,668,789 | | | | 25,755,026 | | | | (38,189,390 | ) | | | — | | | | (4,461,690 | ) | | | 182,055 | | | | 259,954,790 | | | | 26,634,712 | | | | 7,418,486 | |
Goldman Sachs USTax-Managed Equity Fund | | | 1,510,652,685 | | | | 118,783,222 | | | | (84,663,730 | ) | | | — | | | | (1,620,008 | ) | | | (98,550,769 | ) | | | 1,444,601,400 | | | | 61,629,753 | | | | 11,402,214 | |
| | | | | | | | | |
Total | | $ | 2,830,236,699 | | | $ | 251,232,588 | | | $ | (171,954,957 | ) | | $ | (2,970,550 | ) | | $ | (13,986,578 | ) | | $ | (171,536,109 | ) | | $ | 2,721,201,093 | | | | | | | $ | 35,976,286 | |
| (a) | | Amount includes return of capital distributions of $2,696,687, which represents the difference between the estimated amount related to the fiscal year ended August 31, 2018 and the final amount recorded during the period ended February 28, 2019. |
As of February 28, 2019, the Portfolios were beneficial owners of 5% or more of total outstanding shares of the following Funds:
| | | | | | | | | | |
| Underlying Funds | | | | Enhanced Dividend
Global Equity | | | Tax-Advantaged
Global Equity | |
Goldman Sachs Emerging Markets Equity Insights Fund | | | | | — | % | | | 7 | % |
Goldman Sachs Global Infrastructure Fund | | | | | 7 | | | | 31 | |
Goldman Sachs Global Real Estate Securities Fund | | | | | 5 | | | | 23 | |
Goldman Sachs International Equity Dividend and Premium Fund | | | | | 42 | | | | — | |
Goldman Sachs InternationalTax-Managed Equity Fund | | | | | — | | | | 83 | |
Goldman Sachs Small Cap Equity Insights Fund | | | | | 8 | | | | — | |
Goldman Sachs Tactical Tilt Overlay Fund | | | | | — | | | | 7 | |
Goldman Sachs U.S. Equity Dividend and Premium Fund | | | | | 9 | | | | — | |
Goldman Sachs U.S.Tax-Managed Equity Fund | | | | | — | | | | 85 | |
As of February 28, 2019, The Goldman Sachs Group, Inc. was the beneficial owner of the following share classes of the Portfolios:
| | | | | | |
| Portfolio | | | | Class R6 | |
Enhanced Dividend Global Equity | | | | | 100 | % |
Tax-Advantaged Global Equity | | | | | 100 | |
38
GOLDMAN SACHS GLOBAL TAX-AWARE EQUITY PORTFOLIOS
|
| 6. PORTFOLIO SECURITIES TRANSACTIONS |
The cost of purchases and proceeds from sales and maturities of long-term securities for the six month ended February 28, 2019 were as follows:
| | | | | | | | | | |
| Portfolio | | | | Purchases | | | Sales | |
Enhanced Dividend Global Equity | | | | $ | 62,337,039 | | | $ | 71,083,123 | |
Tax-Advantaged Global Equity | | | | | 251,232,588 | | | | 213,334,120 | |
As of the Portfolios’ most recent fiscal year end, August 31, 2018, the Portfolios’ certain timing differences, on atax-basis were as follows:
| | | | | | | | |
| | | Enhanced Dividend
Global Equity | | | Tax-Advantaged
Global Equity | |
Timing differences (Qualified Late Year Loss Deferral) | | $ | — | | | $ | (419 | ) |
As of February 28, 2019, the Portfolios’ aggregate security unrealized gains and losses based on cost for U.S. federal income tax purposes were as follows:
| | | | | | | | |
| | | Enhanced Dividend
Global Equity | | | Tax-Advantaged
Global Equity | |
Tax cost | | $ | 548,679,898 | | | $ | 2,120,122,368 | |
Gross unrealized gain | | | 96,198,073 | | | | 671,241,455 | |
Gross unrealized loss | | | (25,647,003 | ) | | | 70,162,730 | |
Net unrealized gain | | $ | 70,551,070 | | | $ | 601,078,725 | |
The difference between GAAP-basis andtax-basis unrealized gains (losses) is attributable primarily to wash sales, net mark to market gains (losses) on regulated futures and net mark to market gains (losses) on foreign currency contracts and differences in the tax treatment of underlying fund investments.
GSAM has reviewed the Portfolios’ tax positions for all open tax years (the current and prior three years, as applicable) and has concluded that no provision for income tax is required in the Portfolios’ financial statements. Such open tax years remain subject to examination and adjustment by tax authorities.
The Portfolios’ and Underlying Funds’ risks include, but are not limited to, the following:
Derivatives Risk — The Portfolios’ use of derivatives may result in loss. Derivative instruments, which may pose risks in addition to and greater than those associated with investing directly in securities, currencies or other instruments, may be illiquid or less liquid, volatile, difficult to price and leveraged so that small changes in the value of the underlying instruments may produce disproportionate losses to the Portfolios. Derivatives are also subject to counterparty risk, which is the risk that the other party in the transaction will not fulfill its contractual obligation. The use of derivatives is a highly specialized activity that involves investment techniques and risks different from those associated with investments in more traditional securities and instruments. Losses from derivatives can also result from a lack of correlation between changes in the value of derivative instruments and the portfolio assets (if any) being hedged.
39
GOLDMAN SACHS GLOBAL TAX-AWARE EQUITY PORTFOLIOS
Notes to Financial Statements(continued)
February 28, 2019 (Unaudited)
|
| 8. OTHER RISKS (continued) |
Energy Sector Risk — The Underlying MLP Fund concentrates its investments in the energy sector, and will therefore be susceptible to adverse economic, environmental, business, regulatory or other occurrences affecting that sector. The energy sector has historically experienced substantial price volatility. MLPs and other companies operating in the energy sector are subject to specific risks, including, among others: fluctuations in commodity prices; reduced consumer demand for commodities such as oil, natural gas or petroleum products; reduced availability of natural gas or other commodities for transporting, processing, storing or delivering; slowdowns in new construction; extreme weather or other natural disasters; and threats of attack by terrorists on energy assets. Additionally, changes in the regulatory environment for energy companies may adversely impact their profitability. Over time, depletion of natural gas reserves and other energy reserves may also affect the profitability of energy companies.
Foreign and Emerging Countries Risk — Investing in foreign markets may involve special risks and considerations not typically associated with investing in the U.S. Foreign securities may be subject to risk of loss because of more or less foreign government regulation, less public information and less economic, political and social stability in the countries in which a Portfolio or an Underlying Fund invests. The imposition of exchange controls (including repatriation restrictions), confiscations, trade restrictions (including tariffs) and other government restrictions by the U.S. or other governments, or from problems in share registration, settlement or custody, may also result in losses. Foreign risk also involves the risk of negative foreign currency rate fluctuations, which may cause the value of securities denominated in such foreign currency (or other instruments through which a Portfolio or an Underlying Fund has exposure to foreign currencies) to decline in value. Currency exchange rates may fluctuate significantly over short periods of time. To the extent that a Portfolio or an Underlying Fund also invests in securities of issuers located in emerging markets, these risks may be more pronounced.
Investments in the Underlying Funds — The Portfolios invest primarily in a combination of Underlying Funds, and are subject to the risk factors associated with the investments of those Underlying Funds in direct proportion to the amount of assets allocated to each. As of February 28, 2019, the Enhanced Dividend Global Equity Portfolio invested 43.9% and 21.2% of its net assets in the Goldman Sachs U.S. Equity Dividend and Premium Fund (the “U.S. Equity Dividend and Premium Fund”) and the Goldman Sachs International Equity Dividend and Premium Fund (the “International Equity Dividend and Premium Fund”), respectively. Because of the high concentration of its assets in these Underlying Funds, the Enhanced Dividend Global Equity Portfolio has greater exposure to the risks associated with these Underlying Funds than it does to the risks associated with the other Underlying Funds in which it invests. The U.S. Equity Dividend and Premium Fund invests primarily in dividend paying equity investments in large-capitalization U.S. issuers, with public stock market capitalizations within the range of the market capitalization of the S&P 500® Index at the time of investment. This Underlying Fund expects that, under normal circumstances, it will write (sell) call options on the S&P 500® Index or related exchange-traded funds in an amount that is between 20% and 75% of the value of its portfolio. The International Equity Dividend and Premium Fund invests primarily in dividend-paying equity investments in non-U.S. issuers with public stock market capitalizations within the range of capitalization of the Morgan Stanley Capital International (“MSCI”) Europe, Australasia, Far East (“EAFE”) Index (“MSCI EAFE Index”) at the time of investment. This Underlying Fund expects that, under normal circumstances, it will write (sell) call options on the MSCI EAFE Index, other national or regional stock market indices or related exchange-traded funds in an amount that is between 20% and 75% of the value of its portfolio.
As of February 28, 2019, theTax-Advantaged Global Equity Portfolio invested 52.5% and 21.2% of its net assets in the Goldman Sachs U.S.Tax-Managed Equity Fund (the “U.S.Tax-Managed Equity Fund”) and the Goldman Sachs InternationalTax-Managed Equity Fund (the “InternationalTax-Managed Equity Fund”), respectively. Because of the high concentration of its assets in these Underlying Funds, theTax-Advantaged Global Equity Portfolio has greater exposure to the risks associated with these Underlying Funds than it does to the risks associated with the other Underlying Funds in which it invests. The U.S.Tax-Managed Equity Fund invests primarily in equity investments in U.S. issuers. This Underlying Fund will seek to maintain risk, style, capitalization and industry characteristics similar to the Russell 3000 Index. The InternationalTax-Managed Equity Fund invests primarily in equity investments in non-U.S. issuers. This Underlying Fund will seek to maintain risk, style, capitalization and industry characteristics similar to the MSCI EAFE Index. The investment adviser may seektax-efficiency by offsetting gains and losses, limiting portfolio turnover or selling high tax basis securities for both Underlying Funds.
40
GOLDMAN SACHS GLOBAL TAX-AWARE EQUITY PORTFOLIOS
|
| 8. OTHER RISKS (continued) |
The Portfolios do not invest in the Underlying Funds for the purpose of exercising management or control; however, investments by the Portfolios within their principal investment strategies may represent a significant portion of an Underlying Fund’s net assets.
Large Shareholder Transactions Risk — A Portfolio or an Underlying Fund may experience adverse effects when certain large shareholders, such as other funds, institutional investors (including those trading by use ofnon-discretionary mathematical formulas), financial intermediaries (who may make investment decisions on behalf of underlying clients and/or include a Portfolio or an Underlying Fund in their investment model), individuals, accounts and Goldman Sachs affiliates, purchase or redeem large amounts of shares of a Portfolio or an Underlying Fund. Such large shareholder redemptions, which may occur rapidly or unexpectedly, may cause a Portfolio or an Underlying Fund to sell portfolio securities at times when it would not otherwise do so, which may negatively impact a Portfolio’s or an Underlying Fund’s NAV and liquidity. These transactions may also accelerate the realization of taxable income to shareholders if such sales of investments resulted in gains, and may also increase transaction costs. In addition, a large redemption could result in a Portfolio’s or an Underlying Fund’s current expenses being allocated over a smaller asset base, leading to an increase in the Portfolio’s or the Underlying Fund’s expense ratio. Similarly, large Portfolio or Underlying Fund share purchases may adversely affect a Portfolio’s or an Underlying Fund’s performance to the extent that the Portfolio or the Underlying Fund is delayed in investing new cash or otherwise maintains a larger cash position than it ordinarily would.
Liquidity Risk — An Underlying Fund may make investments that are illiquid or that may become less liquid in response to market developments or adverse investor perceptions. Illiquid investments may be more difficult to value. Liquidity risk may also refer to the risk that a Portfolio will not be able to pay redemption proceeds within the allowable time period or without significant dilution to remaining investors’ interests because of unusual market conditions, an unusually high volume of redemption requests, or other reasons. To meet redemption requests, a Portfolio may be forced to sell investments at an unfavorable time and/or under unfavorable conditions. If a Portfolio is forced to sell securities at an unfavorable time and/or under unfavorable conditions, such sales may adversely affect the Portfolio’s NAV and dilute remaining investors’ interests. Liquidity risk may be the result of, among other things, the reduced number and capacity of traditional market participants to make a market in fixed income securities or the lack of an active market. The potential for liquidity risk may be magnified by a rising interest rate environment or other circumstances where investor redemptions from fixed income mutual funds may be higher than normal, potentially causing increased supply in the market due to selling activity. These risks may be more pronounced in connection with the Portfolios’ investments in securities of issuers located in emerging market countries.
Market and Credit Risks — In the normal course of business, a Portfolio and an Underlying Fund trade financial instruments and enter into financial transactions where risk of potential loss exists due to changes in the market (market risk). Additionally, a Portfolio and/or an Underlying Fund may also be exposed to credit risk in the event that an issuer or guarantor fails to perform or that an institution or entity with which the Portfolio and the Underlying Fund have unsettled or open transactions defaults.
Under the Trust’s organizational documents, its Trustees, officers, employees and agents are indemnified, to the extent permitted by the Act and state law, against certain liabilities that may arise out of performance of their duties to the Portfolios. Additionally, in the course of business, the Portfolios enter into contracts that contain a variety of indemnification clauses. The Portfolios’ maximum exposure under these arrangements is unknown, as this would involve future claims that may be made against the Portfolios that have not yet occurred. However, GSAM believes the risk of loss under these arrangements to be remote.
Subsequent events after the Statements of Assets and Liabilities date have been evaluated, and GSAM has concluded that there is no impact requiring adjustment or disclosure in the financial statements.
41
GOLDMAN SACHS GLOBAL TAX-AWARE EQUITY PORTFOLIOS
Notes to Financial Statements(continued)
February 28, 2019 (Unaudited)
|
| 11. SUMMARY OF SHARE TRANSACTIONS |
Share activity is as follows:
| | | | | | | | | | | | | | | | |
| | | Enhanced Dividend Global Equity Portfolio | |
| | | | |
| | | For the Six Months Ended
February 28, 2019
(Unaudited) | | | For the Fiscal Year Ended
August 31, 2018 | |
| | | | |
| | | Shares | | | Dollars | | | Shares | | | Dollars | |
| | | | |
| Class A Shares | | | | | | | | | | | | | | | | |
Shares sold | | | 164,329 | | | $ | 1,958,065 | | | | 324,709 | | | $ | 3,943,586 | |
Reinvestment of distributions | | | 37,624 | | | | 415,198 | | | | 26,616 | | | | 319,508 | |
Shares redeemed | | | (198,839 | ) | | | (2,263,527 | ) | | | (301,614 | ) | | | (3,632,003 | ) |
| | | | 3,114 | | | | 109,736 | | | | 49,711 | | | | 631,091 | |
| Institutional Shares | | | | | | | | | | | | | | | | |
Shares sold | | | 321,245 | | | | 3,759,086 | | | | 4,309,057 | | | | 52,413,693 | |
Reinvestment of distributions | | | 79,759 | | | | 892,604 | | | | 1,640,101 | | | | 19,845,526 | |
Shares redeemed | | | (683,627 | ) | | | (7,734,444 | ) | | | (57,258,674 | ) | | | (708,001,831 | ) |
| | | | (282,623 | ) | | | (3,082,754 | ) | | | (51,309,516 | ) | | | (635,742,612 | ) |
| Class P Shares(a) | | | | | | | | | | | | | | | | |
Shares sold | | | 3,635,398 | | | | 40,920,035 | | | | 52,581,452 | | | | 650,814,493 | |
Reinvestment of distributions | | | 2,289,136 | | | | 25,502,863 | | | | 295,701 | | | | 3,566,150 | |
Shares redeemed | | | (6,210,561 | ) | | | (70,437,619 | ) | | | (1,730,020 | ) | | | (21,140,571 | ) |
| | | | (286,027 | ) | | | (4,014,721 | ) | | | 51,147,133 | | | | 633,240,072 | |
| Class R6 Shares(b) | | | | | | | | | | | | | | | | |
Shares sold | | | — | | | | — | | | | 822 | | | | 10,000 | |
Reinvestment of distributions | | | 38 | | | | 424 | | | | 8 | | | | 97 | |
Shares redeemed | | | — | | | | — | | | | — | | | | 3 | |
| | | | 38 | | | | 424 | | | | 830 | | | | 10,100 | |
| | | | |
NET DECREASE | | | (565,498 | ) | | $ | (6,987,315 | ) | | | (111,842 | ) | | $ | (1,861,349 | ) |
| (a) | | Commenced operations on April 17, 2018. |
| (b) | | Commenced operations on December 29, 2017. |
42
GOLDMAN SACHS GLOBAL TAX-AWARE EQUITY PORTFOLIOS
|
| 11. SUMMARY OF SHARE TRANSACTIONS (continued) |
| | | | | | | | | | | | | | | | |
| | | Tax-Advantaged Global Equity Portfolio | |
| | | | |
| | | For the Six Months Ended
February 28, 2019
(Unaudited) | | | For the Fiscal Year Ended
August 31, 2018 | |
| | | | |
| | | Shares | | | Dollars | | | Shares | | | Dollars | |
| | | | |
| Class A Shares | | | | | | | | | | | | | | | | |
Shares sold | | | 5,402 | | | $ | 74,986 | | | | 8,348 | | | $ | 129,809 | |
Reinvestment of distributions | | | 612 | | | | 8,663 | | | | 428 | | | | 6,733 | |
Shares redeemed | | | (5,535 | ) | | | (80,181 | ) | | | (10,588 | ) | | | (167,246 | ) |
| | | | 479 | | | | 3,468 | | | | (1,812 | ) | | | (30,704 | ) |
| Institutional Shares | | | | | | | | | | | | | | | | |
Shares sold | | | 37,818 | | | | 547,248 | | | | 24,560,793 | | | | 384,930,184 | |
Reinvestment of distributions | | | 25,730 | | | | 373,925 | | | | 2,094,566 | | | | 32,779,960 | |
Shares redeemed | | | (908,355 | ) | | | (13,621,721 | ) | | | (172,784,396 | ) | | | (2,794,881,954 | ) |
| | | | (844,807 | ) | | | (12,700,548 | ) | | | (146,129,037 | ) | | | (2,377,171,810 | ) |
| Class P Shares(a) | | | | | | | | | | | | | | | | |
Shares sold | | | 14,662,084 | | | | 219,234,447 | | | | 170,800,885 | | | | 2,769,058,280 | |
Reinvestment of distributions | | | 3,693,484 | | | | 51,683,171 | | | | — | | | | — | |
Shares redeemed | | | (11,297,705 | ) | | | (167,066,158 | ) | | | (915,394 | ) | | | (14,929,124 | ) |
| | | | 7,057,863 | | | | 103,851,460 | | | | 169,885,491 | | | | 2,754,129,156 | |
| Class R6 Shares(b) | | | | | | | | | | | | | | | | |
Shares sold | | | — | | | | — | | | | 641 | | | | 10,000 | |
Reinvestment of distributions | | | 14 | | | | 191 | | | | — | | | | — | |
| | | | 14 | | | | 191 | | | | 641 | | | | 10,000 | |
| | | | |
NET INCREASE | | | 6,213,549 | | | $ | 91,154,571 | | | | 23,755,283 | | | $ | 376,936,642 | |
| (a) | | Commenced operations on April 17, 2018. |
| (b) | | Commenced operations on December 29, 2017. |
43
GOLDMAN SACHS GLOBALTAX-AWARE EQUITY PORTFOLIOS
| | |
| | |
Portfolio Expenses — Six Month Period Ended February 28, 2019 (Unaudited) | | |
As a shareholder of Class A, Institutional, Class P or Class R6 Shares of a Portfolio, you incur two types of costs: (1) transaction costs, including sales charges on purchase payments (with respect to Class A Shares), and (2) ongoing costs, including management fees; distribution and/or service(12b-1) fees (with respect to Class A Shares); and other Portfolio expenses. This example is intended to help you understand your ongoing costs (in dollars) of investing in Class A, Institutional, Class P and Class R6 Shares of the Portfolios and to compare these costs with the ongoing costs of investing in other mutual funds.
The example is based on an investment of $1,000 invested at the beginning of the period and held for the entire period from September 1, 2018 through February 28, 2019,which represents a period of 181 days of a 365 day year.
Actual Expenses — The first line under each share class in the table below provides information about actual account values and actual expenses. You may use the information in this line, together with the amount you invested, to estimate the expenses that you paid over the period. Simply divide your account value by $1,000 (for example, an $8,600 account value divided by $1,000=8.6), then multiply the result by the number in the first line under the heading entitled “Expenses Paid” to estimate the expenses you paid on your account during this period.
Hypothetical Example for Comparison Purposes — The second line under each share class in the table below provides information about hypothetical account values and hypothetical expenses based on the Portfolios’ actual net expense ratios and an assumed rate of return of 5% per year before expenses, which is not the Portfolios’ actual return. The hypothetical account values and expenses may not be used to estimate the actual ending account balance or expenses you paid for the period. You may use this information to compare the ongoing costs of investing in the Portfolios and other funds. To do so, compare this 5% hypothetical example with the 5% hypothetical examples that appear in the shareholder reports of the other funds.
Please note that the expenses shown in the table are meant to highlight your ongoing costs only and do not reflect any transactional costs, such as sales charges, redemption fees, or exchange fees and do not include expenses of Underlying Funds in which the Portfolios invest. Therefore, the second line of the table is useful in comparing ongoing costs only and will not help you determine the relative total costs of owning different funds. In addition, if these transactional costs were included, your costs would have been higher.
| | | | | | | | | | | | | | | | | | | | | | | | |
| | | Enhanced Dividend Global Equity Portfolio | | | Tax-Advantaged Global Equity Portfolio | |
| Share Class | | Beginning
Account Value
9/01/18 | | | Ending
Account Value
2/28/19 | | | Expenses
Paid for the
6 Months
Ended
2/28/19* | | | Beginning
Account Value
9/01/18 | | | Ending
Account Value
2/28/19 | | | Expenses
Paid for the
6 Months
Ended
2/28/19* | |
| Class A | | | | | | | | | | | | | | | | | | | | | | | | |
Actual | | $ | 1,000 | | | $ | 969.70 | | | $ | 2.59 | | | $ | 1,000 | | | $ | 947.40 | | | $ | 2.56 | |
Hypothetical 5% return | | | 1,000 | | | | 1,022.17 | + | | | 2.66 | | | | 1,000 | | | | 1,022.17 | + | | | 2.66 | |
| Institutional | | | | | | | | | | | | | | | | | | | | | | | | |
Actual | | | 1,000 | | | | 971.20 | | | | 0.68 | | | | 1,000 | | | | 949.00 | | | | 0.68 | |
Hypothetical 5% return | | | 1,000 | | | | 1,024.10 | + | | | 0.70 | | | | 1,000 | | | | 1,024.10 | + | | | 0.70 | |
| Class P | | | | | | | | | | | | | | | | | | | | | | | | |
Actual | | | 1,000 | | | | 971.20 | | | | 0.64 | | | | 1,000 | | | | 949.00 | | | | 0.63 | |
Hypothetical 5% return | | | 1,000 | | | | 1,024.15 | + | | | 0.65 | | | | 1,000 | | | | 1,024.15 | + | | | 0.65 | |
| Class R6 | | | | | | | | | | | | | | | | | | | | | | | | |
Actual | | | 1,000 | | | | 970.30 | | | | 0.64 | | | | 1,000 | | | | 948.70 | | | | 0.63 | |
Hypothetical 5% return | | | 1,000 | | | | 1,024.15 | + | | | 0.65 | | | | 1,000 | | | | 1,024.15 | + | | | 0.65 | |
| | + | | Hypothetical expenses are based on each Portfolio’s actual annualized net expense ratios and an assumed rate of return of 5% per year before expenses. | |
| | * | | Expenses are calculated using each Portfolio’s annualized net expense ratio for each class, which represents the ongoing expenses as a percentage of net assets for the six months ended February 28, 2019. Expenses are calculated by multiplying the annualized net expense ratio by the average account value for the period; then multiplying the result by the number of days in the most recent fiscal half year; and then dividing that result by the number of days in the fiscal year. The annualized net expense ratios for the period were as follows: | |
| | | | | | | | | | | | | | | | |
| Portfolio | | Class A | | | Institutional | | | Class P | | | Class R6 | |
Enhanced Dividend Global Equity | | | 0.53 | % | | | 0.14 | % | | | 0.13 | % | | | 0.13 | % |
| | | | |
Tax-Advantaged Global Equity | | | 0.53 | | | | 0.14 | | | | 0.13 | | | | 0.13 | |
44
FUNDS PROFILE
Goldman Sachs Funds
Goldman Sachs is a premier financial services firm, known since 1869 for creating thoughtful and customized investment solutions in complex global markets.
Today, theInvestment Management Division of Goldman Sachs serves a diverse set of clients worldwide, including private institutions, public entities and individuals. With approximately $1.34 trillion in assets under supervision as of December 31, 2018 Goldman Sachs Asset Management (“GSAM”) has portfolio management teams located around the world and our investment professionals bring firsthand knowledge of local markets to every investment decision. Assets under supervision includes assets under management and other client assets for which Goldman Sachs does not have full discretion. GSAM leverages the resources of Goldman Sachs & Co. LLC subject to legal, internal and regulatory restrictions.
Money Market
Financial Square FundsSM
| ∎ | | Financial Square Treasury Solutions Fund1 |
| ∎ | | Financial Square Government Fund1 |
| ∎ | | Financial Square Money Market Fund2 |
| ∎ | | Financial Square Prime Obligations Fund2 |
| ∎ | | Financial Square Treasury Instruments Fund1 |
| ∎ | | Financial Square Treasury Obligations Fund1 |
| ∎ | | Financial Square Federal Instruments Fund1 |
Investor FundsSM
| ∎ | | Investor Money Market Fund3 |
| ∎ | | Investor Tax-Exempt Money Market Fund3 |
Fixed Income
Short Duration and Government
| ∎ | | High Quality Floating Rate Fund |
| ∎ | | Short-Term Conservative Income Fund |
| ∎ | | Short Duration Government Fund |
| ∎ | | Short Duration Income Fund |
| ∎ | | Inflation Protected Securities Fund |
Multi-Sector
Municipal and Tax-Free
| ∎ | | High Yield Municipal Fund |
| ∎ | | Dynamic Municipal Income Fund |
| ∎ | | Short Duration Tax-Free Fund |
| ∎ | | Municipal Income Completion Fund |
Single Sector
| ∎ | | Investment Grade Credit Fund |
| ∎ | | High Yield Floating Rate Fund |
| ∎ | | Emerging Markets Debt Fund |
| ∎ | | Local Emerging Markets Debt Fund |
Fixed Income Alternatives
| ∎ | | Long Short Credit Strategies Fund |
Fundamental Equity
| ∎ | | Small/Mid Cap Value Fund |
| ∎ | | Small/Mid Cap Growth Fund |
| ∎ | | Concentrated Growth Fund |
| ∎ | | Technology Opportunities Fund |
| ∎ | | Growth Opportunities Fund |
| ∎ | | Rising Dividend Growth Fund |
Tax-Advantaged Equity
| ∎ | | U.S. Tax-Managed Equity Fund |
| ∎ | | International Tax-Managed Equity Fund |
| ∎ | | U.S. Equity Dividend and Premium Fund |
| ∎ | | International Equity Dividend and Premium Fund |
Equity Insights
| ∎ | | Small Cap Equity Insights Fund |
| ∎ | | U.S. Equity Insights Fund |
| ∎ | | Small Cap Growth Insights Fund |
| ∎ | | Large Cap Growth Insights Fund |
| ∎ | | Large Cap Value Insights Fund |
| ∎ | | Small Cap Value Insights Fund |
| ∎ | | International Small Cap Insights Fund |
| ∎ | | International Equity Insights Fund |
| ∎ | | Emerging Markets Equity Insights Fund |
Fundamental Equity International
| ∎ | | International Equity Income Fund |
| ∎ | | International Equity ESG Fund |
| ∎ | | Emerging Markets Equity Fund |
| ∎ | | ESG Emerging Markets Equity Fund |
Select Satellite
| ∎ | | Real Estate Securities Fund |
| ∎ | | International Real Estate Securities Fund |
| ∎ | | Commodity Strategy Fund |
| ∎ | | Global Real Estate Securities Fund |
| ∎ | | Alternative Premia Fund |
| ∎ | | Absolute Return Tracker Fund |
| ∎ | | Managed Futures Strategy Fund |
| ∎ | | MLP Energy Infrastructure Fund |
| ∎ | | Multi-Manager Alternatives Fund |
| ∎ | | Absolute Return Multi-Asset Fund |
| ∎ | | Global Infrastructure Fund |
Total Portfolio Solutions
| ∎ | | Global Managed Beta Fund |
| ∎ | | Multi-Manager Non-Core Fixed Income Fund |
| ∎ | | Multi-Manager U.S. Dynamic Equity Fund |
| ∎ | | Multi-Manager Global Equity Fund |
| ∎ | | Multi-Manager International Equity Fund |
| ∎ | | Tactical Tilt Overlay Fund |
| ∎ | | Balanced Strategy Portfolio |
| ∎ | | Multi-Manager U.S. Small Cap Equity Fund |
| ∎ | | Multi-Manager Real Assets Strategy Fund |
| ∎ | | Growth and Income Strategy Portfolio |
| ∎ | | Growth Strategy Portfolio |
| ∎ | | Dynamic Global Equity Fund4 |
| ∎ | | Satellite Strategies Portfolio |
| ∎ | | Enhanced Dividend Global Equity Portfolio |
| ∎ | | Tax-Advantaged Global Equity Portfolio |
| ∎ | | Strategic Factor Allocation Fund |
| ∎ | | Target Date 2020 Portfolio |
| ∎ | | Target Date 2025 Portfolio |
| ∎ | | Target Date 2030 Portfolio |
| ∎ | | Target Date 2035 Portfolio |
| ∎ | | Target Date 2040 Portfolio |
| ∎ | | Target Date 2045 Portfolio |
| ∎ | | Target Date 2050 Portfolio |
| ∎ | | Target Date 2055 Portfolio |
| ∎ | | Target Date 2060 Portfolio |
| ∎ | | GQG Partners International Opportunities Fund |
| 1 | | You could lose money by investing in the Fund. Although the Fund seeks to preserve the value of your investment at $1.00 per share, it cannot guarantee it will do so. An investment in the Fund is not a deposit of a bank and is not insured or guaranteed by the Federal Deposit Insurance Corporation or any other government agency. The Fund’s sponsor has no legal obligation to provide financial support to the Fund, and you should not expect that the sponsor will provide financial support to the Fund at any time. |
| 2 | | You could lose money by investing in the Fund. Because the share price of the Fund will fluctuate, when you sell your shares they may be worth more or less than what you originally paid for them. The Fund may impose a fee upon sale of your shares or may temporarily suspend your ability to sell shares if the Fund’s liquidity falls below required minimums because of market conditions or other factors. An investment in the Fund is not a deposit of a bank and is not insured or guaranteed by the Federal Deposit Insurance Corporation or any other government agency. The Fund’s sponsor has no legal obligation to provide financial support to the Fund, and you should not expect that the sponsor will provide financial support to the Fund at any time. |
| 3 | | You could lose money by investing in the Fund. Although the Fund seeks to preserve the value of your investment at $1.00 per share, it cannot guarantee it will do so. The Fund may impose a fee upon sale of your shares or may temporarily suspend your ability to sell shares if the Fund’s liquidity falls below required minimums because of market conditions or other factors. An investment in the Fund is not a deposit of a bank and is not insured or guaranteed by the Federal Deposit Insurance Corporation or any other government agency. The Fund’s sponsor has no legal obligation to provide financial support to the Fund, and you should not expect that the sponsor will provide financial support to the Fund at any time. |
| 4 | | Effective after the close of business on February 28, 2019, the Goldman Sachs Equity Growth Strategy Portfolio was renamed the Goldman Sachs Dynamic Global Equity Fund. |
Financial Square FundsSMand Investor FundsSMare registered service marks of Goldman Sachs & Co. LLC.
| *This | | list coversopen-end funds only. Please visit our website at www.GSAMFUNDS.com to learn about ourclosed-end funds and exchange-traded funds. |
| | |
TRUSTEES Jessica Palmer,Chair Kathryn A. Cassidy Diana M. Daniels James A. McNamara Roy W. Templin Gregory G. Weaver | | OFFICERS James A. McNamara,President Scott M. McHugh,Treasurer, Senior Vice President and Principal Financial Officer Joseph F. DiMaria,Assistant Treasurer and Principal Accounting Officer Caroline L. Kraus,Secretary |
| |
GOLDMAN SACHS & CO. LLC Distributor and Transfer Agent | | GOLDMAN SACHS ASSET MANAGEMENT, L.P. Investment Adviser |
Visit our web site atwww.GSAMFUNDS.com to obtain the most recentmonth-end returns.
Goldman Sachs Asset Management, L.P., 200 West Street, New York, New York 10282
The reports concerning the Portfolios included in this shareholder report may contain certain forward-looking statements about the factors that may affect the performance of the Portfolios in the future. These statements are based on Portfolio management’s predictions and expectations concerning certain future events and their expected impact on the Portfolios, such as performance of the economy as a whole and of specific industry sectors, changes in the levels of interest rates, the impact of developing world events, and other factors that may influence the future performance of the Portfolios. Management believes these forward-looking statements to be reasonable, although they are inherently uncertain and difficult to predict. Actual events may cause adjustments in portfolio management strategies from those currently expected to be employed.
A description of the policies and procedures that the Portfolios use to determine how to vote proxies relating to portfolio securities and information regarding how a Portfolio voted proxies relating to portfolio securities during the most recent12-month period ended June 30 is available (i) without charge, upon request by calling1-800-526-7384 (for Retail Shareholders) or1-800-621-2550 (for Institutional Shareholders); and (ii) on the Securities and Exchange Commission (“SEC”) web site at http://www.sec.gov.
The Portfolios will file portfolio holdings information for each month in a fiscal quarter within 60 days after the end of the relevant fiscal quarter on Form N-PORT. Portfolio holdings information for the third month of each fiscal quarter will be made available on the SEC’s web site at http://www.sec.gov. Portfolio holdings information may be obtained upon request and without charge by calling1-800-526-7384 (for Retail Shareholders) or1-800-621-2550 (for Institutional Shareholders).
Economic and market forecasts presented herein reflect our judgment as of the date of this report and are subject to change without notice. These forecasts do not take into account the specific investment objectives, restrictions, tax and financial situation or other needs of any specific client. Actual data will vary and may not be reflected here. These forecasts are subject to high levels of uncertainty that may affect actual performance. Accordingly, these forecasts should be viewed as merely representative of a broad range of possible outcomes. These forecasts are estimated, based on assumptions, and are subject to significant revision and may change materially as economic and market conditions change. Goldman Sachs has no obligation to provide updates or changes to these forecasts. Case studies and examples are for illustrative purposes only.
Goldman Sachs & Co. LLC (“Goldman Sachs”) does not provide legal, tax or accounting advice. Any statement contained in this communication (including any attachments) concerning U.S. tax matters was not intended or written to be used, and cannot be used, for the purpose of avoiding penalties under the Internal Revenue Code, and was written to support the promotion or marketing of the transaction(s) or matter(s) addressed. Clients of Goldman Sachs should obtain their own independent tax advice based on their particular circumstances.
Fund holdings and allocations shown are as of February 28, 2019 and may not be representative of future investments. Portfolio holdings should not be relied on in making investment decisions and should not be construed as research or investment advice regarding particular securities. Current and future holdings are subject to risk. Diversification does not protect an investor from market risk and does not ensure a profit.
This material is not authorized for distribution to prospective investors unless preceded or accompanied by a current Prospectus or summary prospectus, if applicable. Investors should consider a Portfolio’s objective, risks, and charges and expenses, and read the summary prospectus, if available, and/or the Prospectus carefully before investing or sending money. The summary prospectus, if available, and the Prospectus contain this and other information about a Portfolio and may be obtained from your authorized dealer or from Goldman Sachs & Co. LLC by calling (retail –1-800-526-7384) (institutional –1-800-621-2550).
Goldman Sachs & Co. LLC is the distributor of the Goldman Sachs Funds.
© 2019 Goldman Sachs. All rights reserved. 162453-OTU-961806/TAGEDSAR-19/2.6K
Goldman Sachs Funds

| | | | |
| | |
| Semi-Annual Report | | | | February 28, 2019 |
| | |
| | | | Investor FundsSM |
| | | | Money Market |
| | | | Tax-Exempt Money Market |
It is our intention that beginning on January 1, 2021, paper copies of the Funds’ annual and semi-annual shareholder reports will no longer be sent by mail, unless you specifically request paper copies of the reports from a Fund or from your financial intermediary. Instead, the reports will be made available on a website, and you will be notified by mail each time a report is posted and provided with a website link to access the report.
If you already elected to receive shareholder reports electronically, you will not be affected by this change and you need not take any action. At any time, you may elect to receive reports and certain communications from a Fund electronically by calling the applicable toll-free number below or by contacting your financial intermediary.
You may elect to receive all future shareholder reports in paper free of charge. If you hold shares of a Fund directly with the Fund’s transfer agent, you can inform the transfer agent that you wish to receive paper copies of reports by calling toll-free 800-621-2550 for Class I, Administration, Capital, Cash Management, Preferred, Premier, Resource, Select and Service shareholders or 800-526-7384 for Class A and Class C shareholders. If you hold shares of a Fund through a financial intermediary, please contact your financial intermediary to make this election. Your election to receive reports in paper will apply to all Goldman Sachs Funds held in your account if you invest through your financial intermediary or all Goldman Sachs Funds held with a Fund’s transfer agent if you invest directly with the transfer agent.

Goldman Sachs Investor Funds
| ∎ | | TAX-EXEMPT MONEY MARKET |
| | | | |
| | | |
| NOT FDIC-INSURED | | May Lose Value | | No Bank Guarantee |
PORTFOLIO RESULTS
Goldman Sachs Investor Funds
Portfolio Management Discussion and Analysis
Below, the Goldman Sachs Money Market Portfolio Management Team discusses the Goldman Sachs Investor Funds’ (the “Funds”) performance and positioning for thesix-month period ended February 28, 2019 (the “Reporting Period”).
| Q | | What economic and market factors most influenced the money markets as a whole during the Reporting Period? |
| A | | During the Reporting Period, taxable andtax-exempt money market yields remained low but continued to move higher as the Federal Reserve (“Fed”) tightened monetary policy. Fed officials raised the targeted federal funds rate twice — in September and December 2018 — such that at the end of the Reporting Period, it was in a range of between 2.25% and 2.50%. Other influences on the money markets during the Reporting Period were the continuation of the Fed’s balance sheet normalization and the dovish stance of most developed markets central banks. (Balance sheet normalization refers to the steps the Fed is taking to reverse quantitative easing and remove the substantial monetary accommodation it has provided to the economy since the financial crisis began in 2007. Dovish tends to imply lower interest rates; opposite of hawkish.) |
| | When the Reporting Period started in September 2018, U.S. economic growth was robust, though some major economies, including those of the Eurozone, the U.K. and China, exhibited a gradual weakening trend. The Fed raised the targeted federal funds rate by 25 basis points, citing ongoing strength in the labor market and a pickup in household spending and business fixed investment. (A basis point is 1/100th of a percentage point.) The Fed’s dot plot pointed to another increase by the end of 2018 and three more during 2019. (The “dot plot” shows rate projections of the members of the Fed’s Open Market Committee.) Fed Chair Jerome Powell delivered an upbeat assessment of the U.S. economy, which supported market expectations for these additional Fed rate hikes in 2019. During the fourth quarter of 2018, investor concerns about slowing global economic growth momentum as well as tighter financial conditions weighed on financial markets. Global interest rates, which had risen for most of the calendar year, fell, as investors grew fearful about the possible end of the global economic cycle and as their expectations for Fed rate hikes diminished. In December 2018, Fed policymakers raised short-term interest rates by an additional 25 basis points, much as the market had expected, but lowered their projection for 2019 monetary policy tightening from three rate hikes to two. In January 2019, the Fed left monetary policy unchanged and also eliminated language about “further gradual increases in rates,” cementing investor expectations for a near-term pause in rate hikes. Fed Chair Powell emphasized that the U.S. central bank would be largely guided by inflation indicators as well as by the global economic growth backdrop and the potential for financial market volatility. During February 2019, the release of minutes from the Fed’s January meeting confirmed policymakers’ dovish tilt. |
| | In thetax-exempt money markets, investment inflows increased slightly from approximately $130 billion in August 2018 to approximately $138 billion in February 2019. In December 2018 and January 2019, investment inflows had jumped to more than $140 billion amid asell-off in the equity markets. During the Reporting Period overall, the Securities Industry and Financial Markets Association (“SIFMA”) Municipal Swap Index, representingseven-daytax-exempt variable rate demand obligations, rose 18 basis points, from 1.56% on August 31, 2018 to 1.74% on February 28, 2019. The increase was driven primarily by the Fed’s rate hikes in September and December 2018. At the end of the Reporting Period, the ratio of the SIFMA Municipal Swap Index toone-month LIBOR was approximately 70% compared to its less than 71% average since 1997. (LIBOR, or the London Inter-Bank Offered Rate, is the interest rate that banks charge each other for short-term loans.) |
| Q | | What key factors were responsible for the performance of the Funds during the Reporting Period? |
| A | The yields of the Goldman Sachs Investor Money Market Fund (“the taxable Fund”) and the Goldman Sachs InvestorTax-Exempt Money Market Fund (“thetax-exempt Fund”) rose during the Reporting Period, driven by the increase in money market yields, which occurred primarily because of the economic and market factors discussed above. The taxable andtax-exempt money market yield curves flattened, meaning yields on shorter-term maturities rose more than those on longer-term maturities. (Yield curve is a spectrum of interest rates based on maturities of varying lengths.) |
1
PORTFOLIO RESULTS
| Q | | How did you manage the taxable Fund during the Reporting Period? |
| A | During the Reporting Period, the taxable Fund had investments in commercial paper, asset-backed commercial paper, repurchase agreements, government agency securities, U.S. Treasury securities, time deposits, certificates of deposit, short-term corporate obligations, municipal debt, floating rate securities and variable rate demand notes (“VRDNs”). |
| | Rather consistent clarity from the Fed around potential September and December 2018 interest rate hikes led us to maintain a somewhat short weighted average maturity of between 32 and 40 days in the taxable Fund during the first four months of the Reporting Period. Purchases were focused on floating rate securities, asset-backed commercial paper and government agency securities, all of which helped us to manage duration. (Duration is the taxable Fund’s sensitivity to changes in interest rates). After the December rate hike, the Fed’s path became less clear to us. As a result, we lengthened the weighted average maturity of the taxable Fund to between 51 and 55 days during the last two months of the Reporting Period. |
| | | The weighted average maturity of a money market fund is a measure of its price sensitivity to changes in interest rates. Also known as effective maturity, weighted average maturity measures the weighted average of the maturity date of bonds held by a Fund, taking into consideration any available maturity shortening features. |
| Q | | How did you manage thetax-exempt Fund during the Reporting Period? |
| A | | Thetax-exempt Fund had investments in VRDNs, short-termtax-exempt securities,non-financialtax-exempt commercial paper and other municipal securities during the Reporting Period. |
| | | During the first four months of the Reporting Period, we maintained a rather short weighted average maturity of between 14 and 20 days in thetax-exempt Fund in response to the Fed’s interest rate hikes. We extended the weighted average maturity of thetax-exempt Fund to between 23 and 25 days during the last two months of the Reporting Period. Overall, thetax-exempt Fund’s positioning was driven largely by the relative value of securities in the front, or short-term, end of thetax-exempt money market yield curve. Given the market’s muted expectations for Fed rate hikes in 2019 and the flattertax-exempt money market yield curve, we looked for opportunities to extend thetax-exempt Fund’s duration, while maintaining adequate liquidity to take advantage of opportunities driven by market technicals (or supply and demand dynamics). |
| Q | | How did you manage the Funds’ weighted average life during the Reporting Period? |
| A | | During the Reporting Period, we managed the weighted average life of the taxable andtax-exempt Funds below 120 days. In the taxable Fund, we maintained a weighted average life in a range between 92 days and 103 days. In thetax-exempt Fund, we maintained a weighted average life in a range between 15 days and 25 days. The weighted average life of a money market fund is a measure of a money market fund’s price sensitivity to changes in liquidity and/or credit risk. |
| | | Under amendments to SEC Rule2a-7 that became effective in May 2010, the maximum allowable weighted average life of a money market fund is 120 days. While one of the goals of the SEC’s money market fund rule is to reinforce conservative investment practices across the money market fund industry, our security selection process has long emphasized conservative investment choices. |
| Q | | Did you make any changes to the Funds’ portfolios during the Reporting Period? |
| A | | During the Reporting Period, we made adjustments to the Funds’ weighted average maturities and their allocations to specific investments based on then-current market conditions, our near-term view and anticipated and actual Fed monetary policy statements. |
| Q | | What is the Funds’ tactical view and strategy for the months ahead? |
| A | | At the end of the Reporting Period, we expected the elongated U.S. economic expansion to continue and considered market concerns around a near-term recession premature. However, we believed global economic growth was likely to moderate in 2019. More than 60% of the 32 economies for which we track manufacturing data closed 2018 with a lower reading than where they commenced the year. This contrasts with 2017 when almost 80% of these economies ended the year with higher readings. However, manufacturing activity remained in expansionary territory for 70% of these countries, in our view. |
| | Regarding inflation, the moderation in crude oil prices in October 2018 is likely, we believe, to feed through to lower headline inflation in key economies in the short term. Meanwhile, we think cyclical improvements — namely, a |
2
PORTFOLIO RESULTS
| | decline in unemployment rates and improving wage growth — could result in firmer core inflation in key developed economies. Potential downside inflation risks include slower than consensus anticipated economic growth and, therefore, stalling or declining labor market improvements, while potential upside risks include continued labor market improvements that lead to inflation or an increase in tariffs. |
| | | As for monetary policy, at the end of the Reporting Period, we had scaled back our expectations for 2019 Fed action from three interest rate hikes to one. We also anticipated a near-term pause in the Fed’s rate increases. Regarding other central banks, we expected the European Central Bank to start lifting its policy rates out of negative territory toward the end of 2019, though we thought low interest rates would continue for a prolonged period due to the subdued inflation outlook for the region. We also saw scope for monetary policy normalization in several other developed markets countries, including the U.K. once uncertainty about the country’s exit from the European Union subsides. |
| | | Overall, the taxable andtax-exempt Funds continue to be flexibly guided by shifting market conditions, and we have positioned them to seek to take advantage of anticipated interest rate movements. As always, we intend to continue to use our actively managed approach to seek the best possible return within the framework of our Funds’ investment guidelines and objectives. In addition, we will continue to manage interest, liquidity and credit risk daily. We will also continue to closely monitor economic data, Fed policy and any shifts in the taxable andtax-exempt money market yield curves, as we strive to navigate the interest rate environment. |
RETAIL MONEY MARKET FUNDS
You could lose money by investing in the Fund. Although the Fund seeks to preserve the value of your investment at $1.00 per share, it cannot guarantee it will do so. The Fund may impose a fee upon sale of your shares or may temporarily suspend your ability to sell shares if the Fund’s liquidity falls below required minimums because of market conditions or other factors. An investment in the Fund is not a deposit of a bank and is not insured or guaranteed by the Federal Deposit Insurance Corporation or any other government agency. The Fund’s sponsor has no legal obligation to provide financial support to the Fund, and you should not expect that the sponsor will provide financial support to the Fund at any time.
3
FUND BASICS
Investor Funds
as of February 28, 2019

| | | | | | | | | | |
| | PERFORMANCE REVIEW1,2 | |
| | | |
| | | September 1, 2018–February 28, 2019 | | Fund Total Return (based on NAV)3
Class I Shares | | | iMoneyNet Institutional
Average4 | |
| | | |
| | Investor Money Market | | | 1.16 | % | | | 1.92 | %5 |
| | | Investor Tax-Exempt Money Market | | | 0.70 | | | | 1.16 | 6 |
The returns represent past performance. Past performance does not guarantee future results. The Fund’s investment returns will fluctuate. Current performance may be lower or higher than the performance quoted above. Please visit our Web site at www.GSAMFUNDS.com to obtain the most recent month-end returns.Performance reflects applicable fee waivers and/or expense limitations in effect during the periods shown. In their absence, performance would be reduced. Returns do not reflect the deduction of taxes that a shareholder would pay on Fund distributions or the redemption of Fund shares.
| | 1 | | The Money Market Fund offers seven separate classes of shares (Class I, Administration, Service, Resource, Cash Management, Class A and Class C Shares) and the Tax-Exempt Money Market Fund offers eleven separate classes of shares (Class I, Select, Preferred, Capital, Administration, Premier, Service, Resource, Cash Management, Class A and Class C Shares), each of which is subject to different fees and expenses that affect performance and entitles shareholders to different services. The Class I Shares do not have distribution and/or service (12b-1) or administration and/or service(non-12b-1) fees. The Select, Preferred, Capital, Administration, Premier, Service, Resource, Cash Management, Class A and Class C Shares offer financial institutions the opportunity to receive fees for providing certain distribution, administrative support and/or shareholder services (as applicable). As an annualized percentage of average daily net assets, these share classes pay combined distribution and/or service (12b-1) or administration and/or service (non-12b-1) fees (as applicable) at the following contractual rates: Select Shares pay 0.03%, Preferred Shares pay 0.10%, Capital Shares pay 0.15%, Administration Shares pay 0.25%, Premier Shares pay 0.35%, Service Shares pay 0.50%, Resource Shares pay 0.65%, Cash Management Shares pay 0.80%, Class A Shares pay 0.25%, and Class C Shares pay 1.00%. If these fees were reflected in the above performance, performance would have been reduced. In addition, the Fund’s performance does not reflect the deduction of any applicable sales charges. |
| | 2 | | The investment adviser may contractually agree to waive or reimburse certain fees and expenses until a specified date. The investment adviser may also voluntarily waive certain fees and expenses, and such voluntary waivers may be discontinued or modified at any time without notice. The performance shown above reflects any waivers or reimbursements that were in effect for all or a portion of the periods shown. When waivers or reimbursements are in place, the Fund’s operating expenses are reduced and the Fund’s yield and total returns to the shareholder are increased. |
| | 3 | | The net asset value (“NAV”) represents the net assets of the class of the Fund (ex-dividend) divided by the total number of shares of the class outstanding. A Fund’s total return assumes the reinvestment of dividends and other distributions. |
| | 4 | | Source: iMoneyNet, Inc. February 2019. |
| | 5 | | First Tier Retail–Category includes only non-government retail funds that also are not holding any second-tier securities. Portfolio holdings of first-tier funds include US Treasury, US other, repos, time deposits, domestic bank obligations, foreign bank obligations, first-tier commercial paper, floating rate notes and asset-backed commercial paper. |
| | 6 | | Tax-Free National Retail–Category includes all retail national and state tax-free and municipal money funds. Portfolio holdings of tax-free funds include rated and unrated demand notes, rated and unrated general market notes, commercial paper, put bonds—6 months & less, put bonds—over 6 months, alternative minimum tax paper and other tax-free holdings. Consists of all funds in the National Tax-Free Retail and State-Specific Retail categories. |
4
FUND BASICS
| | | | | | | | | | | | | | | | | | | | | | | | |
| | STANDARDIZED TOTAL RETURNS1,2,7 |
| | | | | | | |
| | | For the period ended 12/31/18 | | SEC 7-Day
Current
Yield8 | | | One Year | | | Five Years | | | Ten Years | | | Since
Inception | | | Inception
Date |
| | | | | | | |
| | Investor Money Market | | | 2.48 | % | | | 1.96 | % | | | N/A | | | | N/A | | | | 3.52 | % | | 1/29/16 |
| | | Investor Tax-Exempt Money Market | | | 1.54 | | | | 1.24 | | | | 0.45 | % | | | 0.28 | % | | | 1.73 | | | 7/19/94 |
| | 7 | | The Standardized Total Returns are average annual or cumulative total returns (only if the performance period is one year or less) of Class I Shares as of the most recent calendar quarter-end. They assume reinvestment of all distributions at NAV. The SEC 7-Day Current Yield is not a Standardized Total Return. |
Because Class I Shares do not involve a sales charge, such a charge is not applied to their Standardized Total Returns.
The yields and returns represent past performance. Past performance does not guarantee future results. The Funds’ investment yields and returns will fluctuate as market conditions change. Current performance may be lower or higher than the performance quoted above. Please visit our Web site at www.GSAMFUNDS.com to obtain the most recent month-end yields and returns.
Performance reflects applicable fee waivers and/or expense limitations in effect during the periods shown. In their absence, performance would be reduced. Returns do not reflect the deduction of taxes that a shareholder would pay on Fund distributions or the redemption of Fund shares.
| | 8 | | The SEC 7-Day Current Yield figures are as of December 31, 2018 and are calculated in accordance with securities industry regulations and do not include net capital gains. SEC 7-Day Current Yield may differ slightly from the actual distribution rate of a given Fund because of the exclusion of distributed capital gains, which are non-recurring.The SEC 7-Day Current Yield more closely reflects a Fund’s current earnings than do the Standardized Total Return figures. |
5
YIELD SUMMARY
| | | | | | | | | | | | | | | | | | | | | | |
| | SUMMARY OF THE CLASS I SHARES AS OF 2/28/191,2 | |
| | | | | | |
| | | Fund | | 7-Day
Dist. Yield9 | | | SEC 7-Day
Effective
Yield10 | | | 30-Day
Average
Yield11 | | | Weighted
Avg. Maturity
(days)12 | | | Weighted
Avg. Life
(days)13 | |
| | | | | | |
| | Investor Money Market | | | 2.54 | % | | | 2.57 | % | | | 2.54 | % | | | 51 | | | | 95 | |
| | | Investor Tax-Exempt Money Market | | | 1.57 | | | | 1.58 | | | | 1.45 | | | | 23 | | | | 23 | |
The Yields represent past performance. Past performance does not guarantee future results. Current performance may be lower or higher than the performance quoted above.
Yields reflect fee waivers and expense limitations in effect and will fluctuate as market conditions change. The yield quotations more closely reflect the current earnings of the Fund. Please visit our Web site at www.GSAMFUNDS.com to obtain the most recent month-end performance.
| | 9 | | The 7-Day Distribution Yield is an annualized measure of a Fund’s dividends per share, divided by the price per share. This yield can include capital gain/loss distribution, if any. This is not an SEC Yield. |
| | 10 | | The SEC 7-Day Effective Yield of a Fund is calculated in accordance with securities industry regulations and does not include net capital gains. The SEC 7-Day Effective Yield assumes reinvestment of dividends for one year. |
| | 11 | | The 30-Day Average Yield is a net annualized yield of 30 days back from the current date listed. This yield includes capital gain/loss distribution. |
| | 12 | | A Fund’s weighted average maturity (WAM) is an average of the effective maturities of all securities held in the portfolio, weighted by each security’s percentage of net assets. This must not exceed 60 days as calculated under SEC Rule 2a-7. |
| | 13 | | A Fund’s weighted average life (WAL) is an average of the final maturities of all securities held in the portfolio, weighted by each security’s percentage of net assets. This must not exceed 120 days as calculated under SEC Rule 2a-7. |
6
SECTOR ALLOCATIONS
| | | | | | |
| | INVESTOR MONEY MARKET FUND14 | | | | |
| | |
| | | As of February 28, 2019 | | | |
| | |
| | | Security Type | | Percentage of
Net Assets | |
| | |
| | Certificates of Deposit | | | 0.8 | % |
| | |
| | Certificates of Deposit - Eurodollar | | | 4.5 | |
| | |
| | Certificates of Deposit - Yankeedollar | | | 3.4 | |
| | |
| | Commercial Paper & Corporate Obligations | | | 34.1 | |
| | |
| | Fixed Rate Municipal Debt Obligations | | | 4.8 | |
| | |
| | Repurchase Agreements | | | 27.2 | |
| | |
| | U.S. Treasury Obligations | | | 4.1 | |
| | |
| | Variable Rate Municipal Debt Obligations | | | 2.4 | |
| | |
| | | Variable Rate Obligations | | | 20.2 | |
| | |
| | | As of August 31, 2018 | | | |
| | |
| | | Security Type | | Percentage of
Net Assets | |
| | |
| | Certificates of Deposit - Eurodollar | | | 1.7 | % |
| | |
| | Certificates of Deposit - Yankeedollar | | | 3.8 | |
| | |
| | Commercial Paper & Corporate Obligations | | | 35.1 | |
| | |
| | Fixed Rate Municipal Debt Obligations | | | 2.0 | |
| | |
| | Repurchase Agreements | | | 23.6 | |
| | |
| | U.S. Treasury Obligations | | | 9.4 | |
| | |
| | Variable Rate Municipal Debt Obligations | | | 3.3 | |
| | |
| | | Variable Rate Obligations | | | 22.3 | |
| | 14 | | The Fund is actively managed and, as such, its portfolio composition may differ over time. The percentage shown for each investment category reflects the value (based on amortized cost) of investments in that category as a percentage of net assets. Figures in the above table may not sum to 100% due to the exclusion of other assets and liabilities. |
7
SECTOR ALLOCATIONS
| | | | | | |
| | INVESTOR TAX-EXEMPT MONEY MARKET FUND15 | | | | |
| | |
| | | As of February 28, 2019 | | | |
| | |
| | | Security Type | | Percentage of
Net Assets | |
| | |
| | Commercial Paper | | | 13.6 | % |
| | |
| | Revenue Anticipation Notes | | | 1.6 | |
| | |
| | Tax and Revenue Anticipation Note | | | 1.3 | |
| | |
| | Tax Anticipation Note | | | 1.2 | |
| | |
| | | Variable Rate Obligations | | | 82.2 | |
| | |
| | | As of August 31, 2018 | | | |
| | |
| | | Security Type | | Percentage of
Net Assets | |
| | |
| | Commercial Paper | | | 15.9 | % |
| | |
| | General Obligation | | | 0.5 | |
| | |
| | Revenue Anticipation Notes | | | 1.9 | |
| | |
| | Revenue Bond | | | 0.1 | |
| | |
| | Tax and Revenue Anticipation Note | | | 0.6 | |
| | |
| | | Variable Rate Obligations | | | 79.5 | |
| | 15 | | The Fund is actively managed and, as such, its portfolio composition may differ over time. The percentage shown for each investment category reflects the value (based on amortized cost) of investments in that category as a percentage of net assets. Figures in the above table may not sum to 100% due to the exclusion of other assets and liabilities. |
8
Index Definitions
Securities Industry and Financial Markets Association (“SIFMA”) Municipal Swap Indexis aseven-day high-grade market index comprised oftax-exempt variable rate demand obligations with certain characteristics. The Index is calculated and published by Bloomberg. The Index is overseen by SIFMA’s municipal swap index committee.
It is not possible to invest directly in an unmanaged index.
9
INVESTOR MONEY MARKET FUND
Schedule of Investments
February 28, 2019 (Unaudited)
| | | | | | | | | | | | | | |
Principal Amount | | | Interest Rate | | | Maturity Date | | | Amortized
Cost | |
|
| Commercial Paper and Corporate Obligations – 34.1% | |
| | Albion Capital LLC | |
| $ | 10,607,000 | | | | 2.516 | % | | | 03/01/19 | | | $ | 10,607,000 | |
| | 1,500,000 | | | | 2.570 | | | | 03/28/19 | | | | 1,497,154 | |
| | Antalis S.A. | |
| | 8,294,000 | | | | 2.806 | | | | 04/10/19 | | | | 8,268,657 | |
| | ANZ New Zealand International Ltd. (London) | |
| | 6,050,000 | | | | 2.811 | | | | 03/08/19 | | | | 6,046,765 | |
| | Atlantic Asset Securitization LLC | |
| | 6,000,000 | | | | 2.839 | | | | 03/04/19 | | | | 5,998,610 | |
| | 2,000,000 | | | | 2.871 | | | | 03/11/19 | | | | 1,998,439 | |
| | 4,000,000 | | | | 2.911 | | | | 03/21/19 | | | | 3,993,666 | |
| | Banque et Caisse d’Epargne de l’Etat | |
| | 2,000,000 | | | | 2.696 | (a) | | | 05/07/19 | | | | 1,990,173 | |
| | 4,000,000 | | | | 2.662 | (a) | | | 07/01/19 | | | | 3,964,756 | |
| | Barclays US CCP Funding LLC | |
| | 3,500,000 | | | | 2.910 | | | | 03/07/19 | | | | 3,498,337 | |
| | 2,000,000 | | | | 2.709 | | | | 03/26/19 | | | | 1,996,306 | |
| | Barton Capital S.A. | |
| | 10,000,000 | | | | 2.798 | | | | 04/16/19 | | | | 9,964,989 | |
| | CAFCO, LLC | |
| | 4,000,000 | | | | 3.015 | | | | 07/01/19 | | | | 3,960,282 | |
| | 4,000,000 | | | | 2.818 | | | | 08/01/19 | | | | 3,953,420 | |
| | Cancara Asset Securitisation LLC | |
| | 3,500,000 | | | | 2.903 | | | | 03/22/19 | | | | 3,494,202 | |
| | 1,500,000 | | | | 2.901 | | | | 04/30/19 | | | | 1,492,950 | |
| | 1,026,000 | | | | 3.005 | | | | 05/28/19 | | | | 1,018,676 | |
| | Cancara Asset Securitisation Ltd. | |
| | 3,000,000 | | | | 3.037 | | | | 06/03/19 | | | | 2,976,892 | |
| | Chariot Funding LLC | |
| | 6,000,000 | | | | 3.037 | | | | 07/08/19 | | | | 5,936,575 | |
| | China Construction Bank Corp. | |
| | 1,050,000 | | | | 3.044 | | | | 04/08/19 | | | | 1,046,697 | |
| | CNPC Finance (HK) Ltd. | |
| | 3,000,000 | | | | 2.968 | | | | 03/14/19 | | | | 2,996,837 | |
| | Coca-Cola Company (The) | |
| | 2,000,000 | | | | 2.822 | | | | 02/11/20 | | | | 1,947,757 | |
| | Collateralized Commercial Paper II Co., LLC | |
| | 5,000,000 | | | | 2.984 | | | | 07/08/19 | | | | 4,948,042 | |
| | 993,000 | | | | 3.309 | | | | 11/25/19 | | | | 969,553 | |
| | Dexia Credit Local-New York Branch | |
| | 3,500,000 | | | | 2.644 | | | | 05/07/19 | | | | 3,483,324 | |
| | 5,000,000 | | | | 2.866 | | | | 10/10/19 | | | | 4,914,207 | |
| | DNB Bank ASA | |
| | 10,000,000 | | | | 2.434 | | | | 03/06/19 | | | | 9,996,667 | |
| | Erste Abwicklungsanstalt | |
| | 10,000,000 | | | | 2.584 | | | | 05/08/19 | | | | 9,952,117 | |
| | Federation des caisses Desjardins du Quebec | |
| | 3,000,000 | | | | 3.102 | | | | 08/13/19 | | | | 2,958,887 | |
| | 3,000,000 | | | | 2.803 | | | | 02/25/20 | | | | 2,919,076 | |
| | First Abu Dhabi Bank P.J.S.C. | |
| | 4,000,000 | | | | 2.736 | | | | 05/06/19 | | | | 3,980,347 | |
| | 4,000,000 | | | | 2.762 | | | | 06/05/19 | | | | 3,971,200 | |
| | Industrial & Commercial Bank of China Ltd.-New York Branch | |
| | 4,250,000 | | | | 3.066 | | | | 04/15/19 | | | | 4,234,062 | |
| | J.P. Morgan Securities LLC | |
| | 2,000,000 | | | | 2.992 | | | | 06/03/19 | | | | 1,984,855 | |
| | 6,000,000 | | | | 3.012 | | | | 08/01/19 | | | | 5,925,540 | |
| | |
|
| Commercial Paper and Corporate Obligations – (continued) | |
| | Liberty Street Funding LLC | |
| 6,000,000 | | | | 2.859 | | | | 04/04/19 | | | | 5,984,133 | |
| | LMA-Americas LLC | |
| | 4,000,000 | | | | 2.870 | | | | 03/05/19 | | | | 3,998,751 | |
| | 1,500,000 | | | | 2.900 | | | | 03/08/19 | | | | 1,499,172 | |
| | Longship Funding LLC | |
| | 3,000,000 | | | | 2.592 | | | | 04/02/19 | | | | 2,993,200 | |
| | 8,000,000 | | | | 2.617 | | | | 04/23/19 | | | | 7,969,731 | |
| | Macquarie Bank Ltd. | |
| | 2,400,000 | | | | 2.807 | | | | 04/10/19 | | | | 2,392,667 | |
| | Manhattan Asset Funding Company LLC | |
| | 1,250,000 | | | | 2.498 | | | | 03/21/19 | | | | 1,248,292 | |
| | Matchpoint Finance PLC | |
| | 5,000,000 | | | | 2.516 | | | | 03/07/19 | | | | 4,997,933 | |
| | 2,000,000 | | | | 2.807 | | | | 04/18/19 | | | | 1,992,720 | |
| | 3,500,000 | | | | 3.004 | | | | 05/13/19 | | | | 3,479,276 | |
| | 3,000,000 | | | | 3.029 | | | | 05/20/19 | | | | 2,980,333 | |
| | 3,000,000 | | | | 3.030 | | | | 06/03/19 | | | | 2,976,892 | |
| | Mercy Health | |
| | 2,000,000 | | | | 2.662 | | | | 03/18/19 | | | | 1,997,525 | |
| | Metlife Short Term Funding LLC | |
| | 3,000,000 | | | | 2.816 | | | | 07/24/19 | | | | 2,966,892 | |
| | Mitsubishi UFJ Trust and Banking Corp. | |
| | 5,000,000 | | | | 2.777 | | | | 04/16/19 | | | | 4,982,622 | |
| | 4,000,000 | | | | 2.813 | | | | 05/09/19 | | | | 3,978,917 | |
| | National Securities Clearing Corp. | |
| | 3,500,000 | | | | 3.245 | | | | 12/13/19 | | | | 3,413,501 | |
| | 4,000,000 | | | | 3.137 | | | | 01/02/20 | | | | 3,897,667 | |
| | Natixis-New York Branch | |
| | 6,000,000 | | | | 3.006 | | | | 07/01/19 | | | | 5,940,627 | |
| | Nieuw Amsterdam Receivables Corp. | |
| | 2,000,000 | | | | 2.617 | | | | 04/03/19 | | | | 1,995,288 | |
| | 3,000,000 | | | | 2.562 | | | | 04/08/19 | | | | 2,992,020 | |
| | 1,673,000 | | | | 2.562 | (b) | | | 04/09/19 | | | | 1,668,433 | |
| | Old Line Funding Corp. | |
| | 3,500,000 | | | | 3.057 | | | | 06/17/19 | | | | 3,468,815 | |
| | Ridgefield Funding Company LLC | |
| | 4,000,000 | | | | 2.828 | | | | 04/16/19 | | | | 3,985,842 | |
| | 7,500,000 | | | | 3.089 | | | | 06/10/19 | | | | 7,436,875 | |
| | 3,000,000 | | | | 3.015 | | | | 07/08/19 | | | | 2,968,503 | |
| | Skandinaviska Enskilda Banken AB | |
| | 4,000,000 | | | | 2.742 | | | | 11/13/19 | | | | 3,924,328 | |
| | State of the Netherlands (The) | |
| | 12,000,000 | | | | 2.455 | (b) | | | 03/07/19 | | | | 11,995,160 | |
| | Sumitomo Mitsui Trust Bank, Ltd.-Singapore Branch | |
| | 5,000,000 | | | | 2.873 | | | | 03/20/19 | | | | 4,992,585 | |
| | 6,000,000 | | | | 2.907 | | | | 05/03/19 | | | | 5,970,180 | |
| | Swedbank AB | |
| | 9,000,000 | | | | 2.763 | | | | 05/16/19 | | | | 8,948,700 | |
| | Thunder Bay Funding, LLC | |
| | 3,500,000 | | | | 3.057 | | | | 06/17/19 | | | | 3,468,815 | |
| | 3,000,000 | | | | 3.046 | | | | 06/26/19 | | | | 2,971,140 | |
| | Toronto-Dominion Bank (The) | |
| | 2,200,000 | | | | 3.136 | | | | 10/18/19 | | | | 2,157,650 | |
| | Versailles Commercial Paper LLC | |
| | 3,000,000 | | | | 2.788 | | | | 03/01/19 | | | | 3,000,000 | |
| | 2,000,000 | | | | 2.821 | | | | 03/04/19 | | | | 1,999,533 | |
| | |
| | |
| 10 | | The accompanying notes are an integral part of these financial statements. |
INVESTOR MONEY MARKET FUND
| | | | | | | | | | | | | | |
Principal Amount | | | Interest Rate | | | Maturity Date | | | Amortized
Cost | |
|
| Commercial Paper and Corporate Obligations – (continued) | |
| | Versailles Commercial Paper LLC – (continued) | |
| $ | 8,000,000 | | | | 2.965 | % | | | 04/08/19 | | | $ | 7,975,511 | |
| | Victory Receivables Corp. | |
| | 3,000,000 | | | | 2.859 | | | | 03/05/19 | | | | 2,999,067 | |
| | |
| TOTAL COMMERCIAL PAPER AND
CORPORATE OBLIGATIONS |
| | $ | 303,496,313 | |
| | |
| | |
|
| Certificate of Deposit – 0.8% | |
| | Branch Banking and Trust Company | |
| $ | 7,000,000 | | | | 2.410 | % | | | 03/05/19 | | | $ | 7,000,000 | |
| | |
| | | | | | | | | | | | | | |
|
| Certificates of Deposit-Eurodollar – 4.5% | |
| | Credit Industriel et Commercial | |
| $ | 8,000,000 | | | | 2.900 | % | | | 08/01/19 | | | $ | 7,902,871 | |
| | DZ Bank AG Deutsche Zentral-Genossenschaftsbank | |
| | 5,000,000 | | | | 2.595 | | | | 06/28/19 | | | | 4,957,478 | |
| | KBC Bank NV | |
| | 4,000,000 | | | | 2.750 | | | | 04/25/19 | | | | 4,000,000 | |
| | 4,500,000 | | | | 2.620 | (b) | | | 07/01/19 | | | | 4,500,076 | |
| | 5,500,000 | | | | 2.770 | | | | 07/01/19 | | | | 5,500,000 | |
| | Mitsubishi UFJ Trust and Banking Corp. | |
| | 5,000,000 | | | | 2.705 | | | | 05/07/19 | | | | 4,975,001 | |
| | Sumitomo Mitsui Trust Bank Ltd. | |
| | 4,000,000 | | | | 2.795 | | | | 05/24/19 | | | | 3,974,154 | |
| | 4,000,000 | | | | 2.835 | | | | 07/31/19 | | | | 3,952,793 | |
| | |
| TOTAL CERTIFICATES OF
DEPOSIT-EURODOLLAR |
| | $ | 39,762,373 | |
| | |
| | |
|
| Certificates of Deposit-Yankeedollar – 3.4% | |
| | Banco Del Estado De Chile | |
| $ | 4,000,000 | | | | 2.970 | % | | | 08/09/19 | | | $ | 4,000,000 | |
| | Mizuho Bank, Ltd.-New York Branch | |
| | 6,000,000 | | | | 2.710 | | | | 09/20/19 | | | | 6,000,000 | |
| | MUFG Bank, Ltd. | |
| | 4,500,000 | | | | 2.840 | | | | 02/24/20 | | | | 4,500,000 | |
| | National Bank of Kuwait S.A.K.P | |
| | 3,000,000 | | | | 2.800 | | | | 03/01/19 | | | | 3,000,000 | |
| | 2,250,000 | | | | 2.850 | | | | 04/29/19 | | | | 2,250,000 | |
| | 3,000,000 | | | | 2.900 | | | | 05/20/19 | | | | 3,000,000 | |
| | Natixis-New York Branch | |
| | 3,100,000 | | | | 2.900 | | | | 08/12/19 | | | | 3,100,000 | |
| | Sumitomo Mitsui Trust Bank Ltd. | |
| | 4,000,000 | | | | 2.820 | | | | 03/19/19 | | | | 4,000,000 | |
| | |
| TOTAL CERTIFICATES OF
DEPOSIT-YANKEEDOLLAR |
| | $ | 29,850,000 | |
| | |
| | |
|
| Fixed Rate Municipal Debt Obligations – 4.8% | |
| | Banque Federative du Credit Mutuel | |
| $ | 2,000,000 | | | | 1.900 | %(a) | | | 03/28/19 | | | $ | 1,998,386 | |
| | 1,000,000 | | | | 2.000 | (a) | | | 04/12/19 | | | | 998,696 | |
| | |
|
| Fixed Rate Municipal Debt Obligations – (continued) | |
| | Cooperatieve Rabobank UA | |
| 4,000,000 | | | | 2.250 | | | | 01/14/20 | | | | 3,978,990 | |
| | Credit Agricole S.A. | |
| | 1,300,000 | | | | 2.500 | (a) | | | 04/15/19 | | | | 1,299,836 | |
| | Credit Suisse AG-New York Branch | |
| | 4,000,000 | | | | 5.300 | | | | 08/13/19 | | | | 4,046,127 | |
| | ING Bank NV | |
| | 2,000,000 | | | | 2.500 | (a) | | | 10/01/19 | | | | 1,991,009 | |
| | Santander UK PLC | |
| | 2,000,000 | | | | 2.500 | | | | 03/14/19 | | | | 1,999,762 | |
| | Skandinaviska Enskilda Banken AB | |
| | 3,000,000 | | | | 2.375 | (a) | | | 03/25/19 | | | | 2,999,221 | |
| | Sumitomo Mitsui Banking Corp. | |
| | 6,000,000 | | | | 2.514 | | | | 01/17/20 | | | | 5,978,808 | |
| | Svenska Handelsbanken AB | |
| | 5,000,000 | | | | 2.250 | | | | 06/17/19 | | | | 4,993,870 | |
| | Wells Fargo Bank N.A. | |
| | 5,000,000 | | | | 1.750 | | | | 05/24/19 | | | | 4,986,560 | |
| | 3,000,000 | | | | 2.150 | | | | 12/06/19 | | | | 2,974,946 | |
| | Westpac Banking Corp. | |
| | 4,000,000 | | | | 1.600 | | | | 08/19/19 | | | | 3,978,750 | |
| | |
| TOTAL FIXED RATE MUNICIPAL
DEBT OBLIGATIONS |
| | $ | 42,224,961 | |
| | |
| | |
|
| U.S. Treasury Obligations – 4.1% | |
| United States Treasury Floating Rate Note (3 Mo. U.S. T-Bill
MMY + 0.00%) |
|
| $ | 12,300,000 | | | | 2.420 | %(c) | | | 01/31/20 | | | $ | 12,297,529 | |
| United States Treasury Floating Rate Note (3 Mo. U.S. T-Bill
MMY + 0.03%) |
|
| | 8,500,000 | | | | 2.453 | (c) | | | 04/30/20 | | | | 8,500,468 | |
| United States Treasury Floating Rate Note (3 Mo. U.S. T-Bill
MMY + 0.04%) |
|
| | 15,700,000 | | | | 2.463 | (c) | | | 07/31/20 | | | | 15,698,772 | |
| | |
| TOTAL U.S. TREASURY
OBLIGATIONS |
| | $ | 36,496,769 | |
| | |
| | |
|
| Variable Rate Municipal Debt Obligations(d) – 2.4% | |
| Alaska Housing Finance Corp. VRDN RB Refunding for State
Capital Project Bonds II Series 2017 B |
|
| $ | 2,000,000 | | | | 2.420 | % | | | 03/07/19 | | | $ | 2,000,000 | |
| BlackRock Municipal Bond Trust VRDN RB Putters
Series 2012-T0014 (JPMorgan Chase N.A., LIQ)(a) |
|
| | 4,000,000 | | | | 2.500 | | | | 03/01/19 | | | | 4,000,000 | |
| BlackRock MuniVest Fund II, Inc. VRDN RB Putters
Series 2012-T0005 (JPMorgan Chase Bank N.A., LIQ)(a) |
|
| | 4,000,000 | | | | 2.500 | | | | 03/01/19 | | | | 4,000,000 | |
| City of Portland, Maine GO VRDN for Taxable Pension Bonds
Series 2001 RMKT (Sumitomo Mitsui Banking Corp., SPA) |
|
| | 2,970,000 | | | | 2.440 | | | | 03/07/19 | | | | 2,970,000 | |
| Providence St. Joseph Health Obligated Group VRDN Series 16G
(Bank of Tokyo-Mitsubishi UFJ, LOC) |
|
| | 5,000,000 | | | | 2.460 | | | | 03/07/19 | | | | 5,000,000 | |
| | |
| | |
| The accompanying notes are an integral part of these financial statements. | | 11 |
INVESTOR MONEY MARKET FUND
Schedule of Investments(continued)
February 28, 2019 (Unaudited)
| | | | | | | | | | | | | | |
Principal Amount | | | Interest Rate | | | Maturity Date | | | Amortized
Cost | |
|
| Variable Rate Municipal Debt Obligations(d) – (continued) | |
| Regents of the University of California VRDN RB Taxable
Series 2011 Z-1 |
|
| $ | 3,530,000 | | | | 2.380 | % | | | 03/07/19 | | | $ | 3,530,000 | |
| | |
| TOTAL VARIABLE RATE MUNICIPAL
DEBT OBLIGATIONS |
| | $ | 21,500,000 | |
| | |
| | |
|
| Variable Rate Obligations(c) – 20.2% | |
| Australia & New Zealand Banking Group Ltd. (3 Mo. LIBOR
+ 0.25%) |
|
| $ | 2,160,000 | | | | 3.054 | %(a) | | | 12/19/19 | | | $ | 2,163,641 | |
| Australia & New Zealand Banking Group Ltd. (3 Mo. LIBOR
+ 0.66%) |
|
| | 1,255,000 | | | | 3.484 | (a) | | | 09/23/19 | | | | 1,259,661 | |
| | Banco Del Estado De Chile (3 Mo. LIBOR + 0.07%) | |
| | 4,000,000 | | | | 2.860 | | | | 03/21/19 | | | | 4,000,000 | |
| | Banco Del Estado De Chile (3 Mo. LIBOR + 0.08%) | |
| | 1,500,000 | | | | 2.851 | | | | 07/25/19 | | | | 1,500,000 | |
| | Bank of America, N.A. (1 Mo. LIBOR + 0.20%) | |
| | 5,000,000 | | | | 2.709 | | | | 05/01/19 | | | | 5,000,000 | |
| | Bank of Montreal (1 Mo. LIBOR + 0.40%) | |
| | 3,500,000 | | | | 2.917 | | | | 12/10/19 | | | | 3,500,000 | |
| | Bank of Montreal (3 Mo. LIBOR + 0.21%) | |
| | 3,500,000 | | | | 2.946 | | | | 11/01/19 | | | | 3,500,000 | |
| | Bank of Montreal (3 Mo. LIBOR + 0.33%) | |
| | 5,000,000 | | | | 3.106 | | | | 06/12/19 | | | | 5,002,678 | |
| | Bank of Nova Scotia (The) (3 Mo. LIBOR + 0.08%) | |
| | 8,000,000 | | | | 2.904 | (a) | | | 06/24/19 | | | | 8,000,000 | |
| | Bedford Row Funding Corp. (1 Mo. LIBOR + 0.19%) | |
| | 4,000,000 | | | | 2.671 | (a) | | | 05/22/19 | | | | 4,000,000 | |
| | Bedford Row Funding Corp. (3 Mo. LIBOR + 0.16%) | |
| | 6,000,000 | | | | 2.939 | (a) | | | 01/10/20 | | | | 6,000,000 | |
| | BNZ International Funding Ltd. (3 Mo. LIBOR + 0.25%) | |
| | 2,251,000 | | | | 3.045 | (a) | | | 04/05/19 | | | | 2,251,000 | |
| | Canadian Imperial Bank of Commerce (1 Mo. LIBOR + 0.35%) | |
| | 2,500,000 | | | | 2.864 | | | | 11/05/19 | | | | 2,500,000 | |
| | Canadian Imperial Bank of Commerce (1 Mo. LIBOR + 0.40%) | |
| | 6,500,000 | | | | 2.917 | | | | 12/10/19 | | | | 6,500,000 | |
| | Cooeperatieve Rabobank U.A. (1 Mo. LIBOR + 0.28%) | |
| | 3,500,000 | | | | 2.773 | | | | 05/29/19 | | | | 3,500,000 | |
| | Credit Suisse AG (3 Mo. LIBOR + 0.25%) | |
| | 4,700,000 | | | | 3.054 | | | | 01/08/20 | | | | 4,700,000 | |
| | Credit Suisse AG-New York Branch (1 Mo. LIBOR + 0.22%) | |
| | 4,000,000 | | | | 2.737 | | | | 12/09/19 | | | | 4,000,000 | |
| | HSBC Bank PLC (1 Mo. LIBOR + 0.27%) | |
| | 7,000,000 | | | | 2.751 | (a) | | | 05/22/19 | | | | 7,000,000 | |
| | ING (U.S.) Funding LLC (3 Mo. LIBOR + 0.11%) | |
| | 2,000,000 | | | | 2.807 | | | | 05/10/19 | | | | 2,000,000 | |
| | J.P. Morgan Securities LLC (1 Mo. LIBOR + 0.32%) | |
| | 3,000,000 | | | | 2.800 | (a) | | | 07/17/19 | | | | 3,000,000 | |
| | Macquarie Bank Ltd. (3 Mo. LIBOR + 0.35%) | |
| | 1,750,000 | | | | 3.138 | (a) | | | 03/15/19 | | | | 1,750,165 | |
| | Mizuho Bank, Ltd.-New York Branch (3 Mo. LIBOR + 0.05%) | |
| | 6,000,000 | | | | 2.830 | | | | 07/18/19 | | | | 6,000,000 | |
| | Mizuho Bank, Ltd.-New York Branch (3 Mo. LIBOR + 0.08%) | |
| | 4,000,000 | | | | 2.867 | | | | 07/15/19 | | | | 4,000,000 | |
| | |
|
| Variable Rate Obligations(c) – (continued) | |
| | Natixis-New York Branch (3 Mo. LIBOR + 0.18%) | |
| 2,000,000 | | | | 2.847 | | | | 06/06/19 | | | | 2,000,000 | |
| | Nordea Bank AB (1 Mo. LIBOR + 0.15%) | |
| | 7,000,000 | | | | 2.659 | | | | 04/01/19 | | | | 7,000,000 | |
| | Nordea Bank AB (3 Mo. LIBOR + 0.20%) | |
| | 260,000 | | | | 2.978 | | | | 03/14/19 | | | | 260,015 | |
| | Old Line Funding Corp. (1 Mo. LIBOR + 0.37%) | |
| | 4,269,000 | | | | 2.884 | (a) | | | 03/04/19 | | | | 4,269,152 | |
| | Oversea-Chinese Banking Corp., Ltd. (3 Mo. LIBOR + 0.21%) | |
| | 4,000,000 | | | | 2.989 | | | | 10/24/19 | | | | 4,000,000 | |
| | Societe Generale (3 Mo. LIBOR + 0.16%) | |
| | 2,000,000 | | | | 2.939 | | | | 04/24/19 | | | | 2,000,000 | |
| | Societe Generale (3 Mo. LIBOR + 0.21%) | |
| | 3,500,000 | | | | 2.849 | | | | 03/03/20 | | | | 3,500,000 | |
| | Societe Generale (3 Mo. LIBOR + 0.41%) | |
| | 3,400,000 | | | | 3.211 | (a) | | | 12/18/19 | | | | 3,400,000 | |
| | Standard Chartered Bank (3 Mo. LIBOR + 0.06%) | |
| | 6,000,000 | | | | 2.850 | | | | 03/21/19 | | | | 6,000,000 | |
| | Standard Chartered Bank (3 Mo. LIBOR + 0.21%) | |
| | 2,000,000 | | | | 2.884 | | | | 06/10/19 | | | | 2,000,000 | |
| | Sumitomo Mitsui Banking Corp. (1 Mo. LIBOR + 0.19%) | |
| | 6,000,000 | | | | 2.674 | | | | 03/26/19 | | | | 6,000,598 | |
| | Sumitomo Mitsui Banking Corp. (3 Mo. LIBOR + 0.10%) | |
| | 5,000,000 | | | | 2.897 | | | | 04/12/19 | | | | 5,000,000 | |
| | Sumitomo Mitsui Banking Corp. (3 Mo. LIBOR + 0.31%) | |
| | 3,000,000 | | | | 3.090 | | | | 10/18/19 | | | | 3,002,525 | |
| | Svenska Handelsbanken AB (1 Mo. LIBOR + 0.31%) | |
| | 1,500,000 | | | | 2.800 | | | | 08/23/19 | | | | 1,500,000 | |
| | Svenska Handelsbanken AB (1 Mo. LIBOR + 0.34%) | |
| | 2,000,000 | | | | 2.821 | | | | 11/22/19 | | | | 2,000,000 | |
| | Toronto-Dominion Bank (The) (3 Mo. LIBOR + 0.11%) | |
| | 4,000,000 | | | | 2.934 | | | | 09/23/19 | | | | 4,000,000 | |
| | Toyota Finance Australia Limited (3 Mo. LIBOR + 0.08%) | |
| | 1,000,000 | | | | 2.863 | | | | 07/02/19 | | | | 1,000,000 | |
| | Toyota Motor Credit Corp. (3 Mo. LIBOR + 0.10%) | |
| | 3,500,000 | | | | 2.883 | | | | 01/10/20 | | | | 3,493,979 | |
| Toyota Motor Finance (Netherlands) B.V. (3 Mo. LIBOR
+ 0.09%) |
|
| | 5,000,000 | | | | 2.880 | | | | 03/18/19 | | | | 5,000,000 | |
| | U.S. Bank N.A. (3 Mo. LIBOR + 0.15%) | |
| | 4,000,000 | | | | 2.801 | | | | 05/24/19 | | | | 4,000,919 | |
| | UBS AG-London Branch (3 Mo. LIBOR + 0.00%) | |
| | 4,000,000 | | | | 2.824 | (a) | | | 09/24/19 | | | | 4,000,000 | |
| | UBS AG-London Branch (3 Mo. LIBOR + 0.12%) | |
| | 2,000,000 | | | | 2.871 | (a) | | | 06/05/19 | | | | 2,000,000 | |
| | Wells Fargo Bank N.A. (1 Mo. LIBOR + 0.30%) | |
| | 3,000,000 | | | | 2.790 | | | | 07/23/19 | | | | 3,000,000 | |
| | Wells Fargo Bank N.A. (1 Mo. LIBOR + 0.39%) | |
| | 3,000,000 | | | | 2.903 | | | | 12/09/19 | | | | 3,000,000 | |
| | Westpac Banking Corp. (3 Mo. LIBOR + 0.10%) | |
| | 4,000,000 | | | | 2.892 | (a) | | | 09/20/19 | | | | 4,000,000 | |
| | Westpac Banking Corp. (3 Mo. LIBOR + 0.18%) | |
| | 3,000,000 | | | | 2.924 | (a) | | | 10/31/19 | | | | 3,000,000 | |
| | |
| TOTAL VARIABLE RATE
OBLIGATIONS |
| | $ | 179,554,333 | |
| | |
| TOTAL INVESTMENTS BEFORE
REPURCHASE AGREEMENTS |
| | $ | 659,884,749 | |
| | |
| | |
| | |
| 12 | | The accompanying notes are an integral part of these financial statements. |
INVESTOR MONEY MARKET FUND
| | | | | | | | | | | | | | |
Principal Amount | | | Interest Rate | | | Maturity Date | | | Amortized
Cost | |
|
| Repurchase Agreements(e) – 27.2% | |
| | BNP Paribas (OBFR + 0.20%) | |
| $ | 5,000,000 | | | | 2.600 | %(c) | | | 03/07/19 | | | $ | 5,000,000 | |
| | Maturity Value: $5,259,277 | |
| | Settlement Date: 03/24/17 | |
| Collateralized by mortgage-backed obligations, 4.640% to
6.090%, due 04/25/24 to 10/25/48, various corporate security
issuers, 4.250% to 10.750%, due 05/13/19 to 12/31/99 and
various sovereign debt security issuers, 4.250% to 8.875%, due
04/15/24 to 04/14/26. The aggregate market value of the
collateral, including accrued interest, was $5,551,925. |
|
| | |
| | Citigroup Global Markets, Inc. (3 Mo. LIBOR + 0.43%) | |
| | 6,000,000 | | | | 3.209 | (c) | | | 06/03/19 | | | | 6,000,000 | |
| | Maturity Value: $6,146,007 | |
| | Settlement Date: 09/10/18 | |
| Collateralized by mortgage-backed obligations, 4.259% to
5.739%, due 10/15/21 to 12/15/37 and various asset-backed
obligations, 0.000% to 8.360%, due 08/15/21 to 03/25/45. The
aggregate market value of the collateral, including accrued
interest, was $6,600,003. |
|
| | |
| | Joint Repurchase Agreement Account III | |
| | 216,100,000 | | | | 2.595 | | | | 03/01/19 | | | | 216,100,000 | |
| | Maturity Value: $216,115,577 | |
| | |
| | Merrill Lynch, Pierce, Fenner & Smith, Inc. (OBFR + 0.30%) | |
| | 9,000,000 | | | | 2.700 | (c) | | | 04/04/19 | | | | 9,000,000 | |
| | Maturity Value: $9,036,450 | |
| | Settlement Date: 02/14/19 | |
| Collateralized by mortgage-backed obligations, 3.184% to
9.240%, due 01/25/24 to 05/25/57 and various asset-backed
obligations, 2.370% to 3.869%, due 03/15/23 to 07/26/66. The
aggregate market value of the collateral, including accrued
interest, was $10,350,001. |
|
| | |
| | Wells Fargo Securities LLC (3 Mo. LIBOR + 0.20%) | |
| | 6,000,000 | | | | 2.890 | (c) | | | 05/10/19 | | | | 6,000,000 | |
| | Maturity Value: $6,057,800 | |
| | Settlement Date: 01/10/19 | |
| Collateralized by various asset-backed obligations, 1.750% to
8.151%, due 05/17/21 to 01/17/38. The aggregate market value
of the collateral, including accrued interest, was $6,600,000. |
|
| | |
| | TOTAL REPURCHASE AGREEMENTS | | | $ | 242,100,000 | |
| | |
| | TOTAL INVESTMENTS – 101.5% | | | $ | 901,984,749 | |
| | |
| LIABILITIES IN EXCESS OF
OTHER ASSETS – (1.5)% |
| | | (12,997,812 | ) |
| | |
| | NET ASSETS – 100.0% | | | $ | 888,986,937 | |
| | |
| | |
|
| The percentage shown for each investment category reflects the value of investments in that category as a percentage of net assets. |
| |
(a) | | Exempt from registration under Rule 144A of the Securities Act of 1933. |
| |
(b) | | All or a portion represents a forward commitment. |
| |
(c) | | Variable or floating rate security. Except for floating rate notes (for which final maturity is disclosed), maturity date disclosed is the next interest reset date. Interest rate disclosed is that which is in effect on February 28, 2019. |
| |
(d) | | Rate shown is that which is in effect on February 28, 2019. Certain variable rate securities are not based on a published reference rate and spread but are determined by the issuer or agent and are based on current market conditions. |
| |
(e) | | Unless noted, all repurchase agreements were entered into on February 28, 2019. Additional information on Joint Repurchase Agreement Account III appears on page 21. |
Interest rates represent either the stated coupon rate, annualized yield on date of purchase for discounted securities, or, for floating rate securities, the current reset rate, which is based upon current interest rate indices.
Maturity dates represent either the final legal maturity date on the security, the demand date for puttable securities, the date of the next interest rate reset for variable rate securities, or the prerefunded date for those types of securities.
| | |
|
Investment Abbreviations: |
GO | | —General Obligation |
LIBOR | | —London Interbank Offered Rates |
LIQ | | —Liquidity Agreement |
LOC | | —Letter of Credit |
MMY | | —Money Market Yield |
OBFR | | —Overnight Bank Funding Rate |
RB | | —Revenue Bond |
RMKT | | —Remarketed |
SPA | | —Stand-by Purchase Agreement |
T-Bill | | —Treasury Bill |
VRDN | | —Variable Rate Demand Notes |
|
| | |
| The accompanying notes are an integral part of these financial statements. | | 13 |
INVESTOR TAX-EXEMPT MONEY MARKET FUND
Schedule of Investments
February 28, 2019 (Unaudited)
| | | | | | | | | | | | | | |
Principal Amount | | | Interest Rate | | | Maturity Date | | | Amortized Cost | |
|
| Municipal Debt Obligations – 99.9% | |
| Alabama – 3.2% | |
| Columbia IDB VRDN PCRB Refunding for Alabama Power Co.
Project Series 2014 C(a) |
|
| $ | 10,000,000 | | | | 1.770 | % | | | 03/01/19 | | | $ | 10,000,000 | |
| | Huntsville Health Care Authority CP Series 2019A-2 | |
| | 13,410,000 | | | | 1.670 | | | | 03/01/19 | | | | 13,410,000 | |
| | 6,550,000 | | | | 1.560 | | | | 05/02/19 | | | | 6,550,000 | |
| Mobile IDB VRDN PCRB for Alabama Power Co. Barry Plant
Project Series 2007 C RMKT(a) |
|
| | 11,500,000 | | | | 1.830 | | | | 03/07/19 | | | | 11,500,000 | |
| | | | | | | | | | | | | | |
| | | | | | | | | | | | | 41,460,000 | |
| | |
| Alaska – 3.8% | |
| Alaska Housing Finance Corp. Home Mortgage VRDN RB
Refunding Series 2009 D RMKT (Bank of America
N.A., SPA) |
|
| | 8,575,000 | | | | 1.710 | | | | 03/07/19 | | | | 8,575,000 | |
| Alaska Housing Finance Corp. VRDN RB Refunding for
Governmental Purpose Series 2001 B RMKT(a) |
|
| | 25,480,000 | | | | 1.720 | | | | 03/07/19 | | | | 25,480,000 | |
| Alaska Housing Finance Corp. VRDN RB State Capital Project
Series 2002 C RMKT(a) |
|
| | 4,120,000 | | | | 1.730 | | | | 03/07/19 | | | | 4,120,000 | |
| City of Valdez Marine Terminal VRDN RB Refunding for
ExxonMobil Project Series 2001 (GTY AGMT – Exxon
Mobil Corp.)(a) |
|
| | 9,920,000 | | | | 1.720 | | | | 03/01/19 | | | | 9,920,000 | |
| | | | | | | | | | | | | | |
| | | | | | | | | | | | | 48,095,000 | |
| | |
| Arizona – 0.2% | |
| Arizona Health Facilities Authority VRDN RB for Banner Health
Series 2015 C RMKT (Bank of America N.A., LOC)(a) |
|
| | 450,000 | | | | 1.720 | | | | 03/01/19 | | | | 450,000 | |
| Arizona Health Facilities Authority VRDN RB Refunding for
Banner Health Series 2008 F (JPMorgan Chase Bank
N.A., LOC) |
|
| | 1,350,000 | | | | 1.770 | | | | 03/07/19 | | | | 1,350,000 | |
| Arizona Health Facilities Authority VRDN RB Refunding for
Banner Health Series 2008 G (Wells Fargo Bank N.A., LOC)(a) |
|
| | 650,000 | | | | 1.770 | | | | 03/07/19 | | | | 650,000 | |
| City of Phoenix IDA Health Care Facilities VRDN RB for Mayo
Clinic Series 2014 B (Wells Fargo Bank N.A., SPA) (GTY
AGMT – Mayo Clinic) |
|
| | 400,000 | | | | 1.650 | | | | 03/01/19 | | | | 400,000 | |
| | | | | | | | | | | | | | |
| | | | | | | | | | | | | 2,850,000 | |
| | |
| California – 0.2% | |
| State of California GO VRDN Refunding SIFMA Index
Series 2012 B (SIFMA + 1.00%) |
|
| | 3,000,000 | | | | 2.740 | | | | 05/01/19 | | | | 3,000,000 | |
| | |
| Colorado – 5.5% | |
| City of Colorado Springs Utilities System VRDN RB for
Subordinate Lien Series 2000 A RMKT (Landesbank Hessen-
Thueringen Girozentrale, SPA)(a) |
|
| | 6,075,000 | | | | 1.760 | | | | 03/07/19 | | | | 6,075,000 | |
| | |
|
| Municipal Debt Obligations – (continued) | |
| Colorado – (continued) | |
| City of Colorado Springs Utilities System VRDN RB for
Subordinate Lien Series 2005 A RMKT (Mizuho Bank,
Ltd., SPA)(a) |
|
| 9,075,000 | | | | 1.780 | | | | 03/07/19 | | | | 9,074,621 | |
| City of Colorado Springs Utilities System VRDN RB for
Subordinate Lien Series 2006 B RMKT (Landesbank Hessen-
Thueringen Girozentrale, SPA)(a) |
|
| | 1,400,000 | | | | 1.830 | | | | 03/07/19 | | | | 1,400,000 | |
| City of Colorado Springs Utilities System VRDN RB Series 2008 A
(U.S. Bank N.A., SPA)(a) |
|
| | 795,000 | | | | 1.800 | | | | 03/07/19 | | | | 795,000 | |
| City of Colorado Springs Utilities System VRDN RB Series 2010 C
RMKT (Barclays Bank PLC, SPA)(a) |
|
| | 8,535,000 | | | | 1.710 | | | | 03/07/19 | | | | 8,535,000 | |
| City of Colorado Springs Utilities System VRDN RB Series 2012 A
(U.S. Bank N.A., SPA)(a) |
|
| | 12,720,000 | | | | 1.710 | | | | 03/07/19 | | | | 12,720,000 | |
| Colorado Health Facilities Authority VRDN RB for SCL Health
System Series 2016 B (Wells Fargo Bank N.A., LIQ)(a) |
|
| | 12,200,000 | | | | 1.750 | | | | 03/07/19 | | | | 12,200,000 | |
| Colorado Health Facilities Authority VRDN RB for SCL Health
System Series 2016 D (Wells Fargo Bank N.A., LIQ)(a) |
|
| | 5,600,000 | | | | 1.750 | | | | 03/07/19 | | | | 5,600,000 | |
| Colorado Housing & Finance Authority VRDN RB Refunding for
Single Family Mortgage Class I Series 2001 AA-2 (Sumitomo
Mitsui Banking Corp., LOC)(a) |
|
| | 9,365,000 | | | | 1.800 | | | | 03/07/19 | | | | 9,365,000 | |
| University of Colorado Hospital Authority VRDN RB Refunding
Series 2017 B-1(a) |
|
| | 490,000 | | | | 1.710 | | | | 03/07/19 | | | | 490,000 | |
| University of Colorado Hospital Authority VRDN RB Refunding
Series 2017 B-2(a) |
|
| | 3,770,000 | | | | 1.710 | | | | 03/07/19 | | | | 3,770,000 | |
| | | | | | | | | | | | | | |
| | | | | | | | | | | | | 70,024,621 | |
| | |
| Connecticut – 3.7% | |
| Connecticut Housing Finance Authority VRDN RB Housing
Mortgage Finance Program Refunding Series 2012
Subseries B-3 (Royal Bank of Canada, SPA)(a) |
|
| | 8,920,000 | | | | 1.740 | | | | 03/07/19 | | | | 8,920,000 | |
| Connecticut Housing Finance Authority VRDN RB Housing
Mortgage Finance Program Refunding Series 2013
Subseries B-6 (Bank of Tokyo-Mitsubishi UFJ, SPA)(a) |
|
| | 3,650,000 | | | | 1.730 | | | | 03/07/19 | | | | 3,650,000 | |
| Connecticut Housing Finance Authority VRDN RB Housing
Mortgage Finance Program Refunding Series 2014
Subseries C-2 RMKT (Bank of Tokyo-Mitsubishi UFJ, SPA)(a) |
|
| | 9,675,000 | | | | 1.760 | | | | 03/07/19 | | | | 9,675,000 | |
| Connecticut Housing Finance Authority VRDN RB Housing
Mortgage Finance Program Refunding Series 2016Subseries E-3
(Landesbank Hessen-Thueringen Girozentrale, SPA)(a) |
|
| | 24,220,000 | | | | 1.760 | | | | 03/07/19 | | | | 24,220,000 | |
| Connecticut Housing Finance Authority VRDN RB Housing
Mortgage Finance Program Refunding Series 2017Subseries A-3
(Landesbank Hessen-Thueringen Girozentrale, SPA)(a) |
|
| | 675,000 | | | | 1.780 | | | | 03/07/19 | | | | 675,000 | |
| | | | | | | | | | | | | | |
| | | | | | | | | | | | | 47,140,000 | |
| | |
| | |
| 14 | | The accompanying notes are an integral part of these financial statements. |
INVESTOR TAX-EXEMPT MONEY MARKET FUND
| | | | | | | | | | | | | | |
Principal Amount | | | Interest Rate | | | Maturity Date | | | Amortized Cost | |
|
| Municipal Debt Obligations – (continued) | |
| Delaware – 1.2% | |
| Delaware State Health Facilities Authority VRDN RB for
Christiana Care Health Services, Inc. Series 2010 B(a) |
|
| $ | 15,415,000 | | | | 1.800 | % | | | 03/07/19 | | | $ | 15,415,000 | |
| | |
| District of Columbia – 3.8% | |
| | District of Columbia CP Series 2019A-2 | |
| | 10,100,000 | | | | 1.950 | | | | 03/04/19 | | | | 10,100,000 | |
| | 5,000,000 | | | | 1.800 | | | | 04/03/19 | | | | 5,000,000 | |
| District of Columbia Water & Sewer Authority Public Utility
Systems VRDN RB Subordinate Lien Series 2014
Subseries B-2 (TD Bank N.A., SPA)(a) |
|
| | 15,315,000 | | | | 1.730 | | | | 03/07/19 | | | | 15,315,000 | |
| Metropolitan Washington Airports Authority Airport System CP
Series 2019-1 |
|
| | 1,250,000 | | | | 1.520 | | | | 03/21/19 | | | | 1,249,913 | |
| Metropolitan Washington Airports Authority Airport System
VRDN RB Refunding Series 2009 D Subseries D-1 (TD Bank
N.A., LOC)(a) |
|
| | 1,750,000 | | | | 1.820 | | | | 03/07/19 | | | | 1,750,000 | |
| Metropolitan Washington Airports Authority Airport System
VRDN RB Refunding Series 2009 D Subseries D-2 (TD Bank
N.A., LOC)(a) |
|
| | 14,300,000 | | | | 1.700 | | | | 03/01/19 | | | | 14,300,000 | |
| Metropolitan Washington Airports Authority Airport System
VRDN RB Refunding Series 2010 C Subseries C-2 RMKT
(Sumitomo Mitsui Banking Corp., LOC)(a) |
|
| | 750,000 | | | | 1.710 | | | | 03/07/19 | | | | 750,000 | |
| | | | | | | | | | | | | | |
| | | | | | | | | | | | | 48,464,913 | |
| | |
| Florida – 6.2% | |
| City of Gainesville Utilities System VRDN RB Refunding
Series 2007 A RMKT (State Street Bank & Trust Co., SPA)(a) |
|
| | 15,965,000 | | | | 1.800 | | | | 03/07/19 | | | | 15,965,000 | |
| City of Gainesville Utilities System VRDN RB Refunding
Series 2012 B RMKT (Citibank N.A., SPA)(a) |
|
| | 24,525,000 | | | | 1.800 | | | | 03/07/19 | | | | 24,525,000 | |
| Orlando Utilities Commission VRDN RB Water Utility
ImprovementsSeries 2008-2 RMKT (TD Bank N.A., SPA)(a) |
|
| | 26,150,000 | | | | 1.700 | | | | 03/07/19 | | | | 26,150,000 | |
| Pinellas County Health Facilities Authority VRDN RB Refunding
for BayCare Health System Series 2009 A2 (Northern Trust
Co., LOC)(a) |
|
| | 12,905,000 | | | | 1.740 | | | | 03/07/19 | | | | 12,905,000 | |
| | | | | | | | | | | | | | |
| | | | | | | | | | | | | 79,545,000 | |
| | |
| Georgia – 2.7% | |
| Private Colleges & Universities Authority VRDN RB Refunding
for Emory University Series 2005 B-1(a) |
|
| | 2,300,000 | | | | 1.700 | | | | 03/07/19 | | | | 2,300,000 | |
| Private Colleges & Universities Authority VRDN RB Refunding
for Emory University Series 2005 B-2(a) |
|
| | 1,755,000 | | | | 1.700 | | | | 03/07/19 | | | | 1,755,000 | |
| Private Colleges & Universities Authority VRDN RB Refunding
for Emory University Series 2005 B-3(a) |
|
| | 975,000 | | | | 1.710 | | | | 03/07/19 | | | | 975,000 | |
| Private Colleges & Universities Authority VRDN RB Refunding
for Emory University Series 2005 C-1 RMKT(a) |
|
| | 19,875,000 | | | | 1.780 | | | | 03/07/19 | | | | 19,875,000 | |
| | |
|
| Municipal Debt Obligations – (continued) | |
| Georgia – (continued) | |
| Private Colleges & Universities Authority VRDN RB Refunding
for Emory University Series 2005 C-5 RMKT(a) |
|
| 9,725,000 | | | | 1.780 | | | | 03/07/19 | | | | 9,725,000 | |
| | | | | | | | | | | | | | |
| | | | | | | | | | | | | 34,630,000 | |
| | |
| Illinois – 3.6% | |
| Illinois Educational Facilities Authority VRDN RB for University
of Chicago Series 2003 B(a) |
|
| | 300,000 | | | | 1.730 | | | | 03/07/19 | | | | 300,000 | |
| Illinois Finance Authority VRDN RB for Northwestern
University Series 2004 Subseries C(a) |
|
| | 8,200,000 | | | | 1.740 | | | | 03/07/19 | | | | 8,200,000 | |
| Illinois Finance Authority VRDN RB for Northwestern
University Series 2008 Subseries B(a) |
|
| | 2,200,000 | | | | 1.730 | | | | 03/07/19 | | | | 2,200,000 | |
| Illinois Finance Authority VRDN RB for University of Chicago
Series 2004 B(a) |
|
| | 723,000 | | | | 1.730 | | | | 03/07/19 | | | | 723,000 | |
| Illinois Finance Authority VRDN RB Refunding for
Northwestern Memorial Hospital Series 2007A-1 (JPMorgan
Chase Bank N.A., SPA) |
|
| | 1,400,000 | | | | 1.720 | | | | 03/01/19 | | | | 1,400,000 | |
| Illinois Finance Authority VRDN RB Refunding for
Northwestern Memorial Hospital Series 2007A-3 (JPMorgan
Chase Bank N.A., SPA)(a) |
|
| | 1,540,000 | | | | 1.720 | | | | 03/01/19 | | | | 1,540,000 | |
| Illinois Finance Authority VRDN RB Refunding for University of
Chicago Series 2004 C(a) |
|
| | 615,000 | | | | 1.730 | | | | 03/07/19 | | | | 615,000 | |
| Illinois Health Facilities Authority VRDN RB Refunding for
Evanston Hospital Corp. Series 1996 RMKT (JPMorgan Chase
Bank N.A., SPA)(a) |
|
| | 16,100,000 | | | | 1.790 | | | | 03/07/19 | | | | 16,100,000 | |
| Illinois Housing Development Authority VRDN Homeowner
Mortgage RB Series 2018 SubseriesA-2 (GNMA/FNMA/
FHLMC)(FHLB, SPA)(a) |
|
| | 895,000 | | | | 1.730 | | | | 03/07/19 | | | | 895,000 | |
| Illinois Toll Highway Authority VRDN RB Senior Priority
Series 2007A-1B RMKT (Bank of America N.A., LOC)(a) |
|
| | 9,400,000 | | | | 1.750 | | | | 03/07/19 | | | | 9,400,000 | |
| Joliet Regional Port District VRDN Marine Terminal RB
Refunding for Exxon Project Series 1989(a) |
|
| | 4,500,000 | | | | 1.720 | | | | 03/01/19 | | | | 4,500,000 | |
| | | | | | | | | | | | | | |
| | | | | | | | | | | | | 45,873,000 | |
| | |
| Indiana – 0.4% | |
| Indiana Finance Authority VRDN RB for Ascension Health
Senior Credit Group Series 2008E-4 |
|
| | 3,000,000 | | | | 1.760 | | | | 03/07/19 | | | | 3,000,000 | |
| Indiana Health Facility Financing Authority VRDN RB
Refunding for Ascension Health Credit Group
Series 2003E-6(a) |
|
| | 2,100,000 | | | | 1.760 | | | | 03/07/19 | | | | 2,100,000 | |
| | | | | | | | | | | | | | |
| | | | | | | | | | | | | 5,100,000 | |
| | |
| | |
| The accompanying notes are an integral part of these financial statements. | | 15 |
INVESTOR TAX-EXEMPT MONEY MARKET FUND
Schedule of Investments(continued)
February 28, 2019 (Unaudited)
| | | | | | | | | | | | | | |
Principal Amount | | | Interest Rate | | | Maturity Date | | | Amortized Cost | |
|
| Municipal Debt Obligations – (continued) | |
| Louisiana – 0.9% | |
| East Baton Rouge Parish IDB, Inc. VRDN RB for ExxonMobil
Project Gulf Opportunity Zone Bonds Series 2010 A(a) |
|
| $ | 4,700,000 | | | | 1.720 | % | | | 03/01/19 | | | $ | 4,700,000 | |
| East Baton Rouge Parish IDB, Inc. VRDN RB for ExxonMobil
Project Gulf Opportunity Zone Bonds Series 2010 B(a) |
|
| | 4,000,000 | | | | 1.720 | | | | 03/01/19 | | | | 4,000,000 | |
| East Baton Rouge Parish IDB, Inc. VRDN RB for ExxonMobil
Project Gulf Opportunity Zone Series 2011(a) |
|
| | 2,850,000 | | | | 1.720 | | | | 03/01/19 | | | | 2,850,000 | |
| | | | | | | | | | | | | | |
| | | | | | | | | | | | | 11,550,000 | |
| | |
| Maryland – 0.2% | |
| Maryland State Economic Development Corp. VRDN RB
Refunding for Howard Hughes Medical Institute Project
Series 2008 B(a) |
|
| | 2,360,000 | | | | 1.750 | | | | 03/07/19 | | | | 2,360,000 | |
| | |
| Massachusetts – 9.1% | |
| | Commonwealth of Massachusetts GO RANS Series 2018 A | |
| | 5,000,000 | | | | 4.000 | | | | 04/25/19 | | | | 5,016,754 | |
| | Commonwealth of Massachusetts GO RANS Series 2018 C | |
| | 5,000,000 | | | | 4.000 | | | | 06/20/19 | | | | 5,032,753 | |
| Commonwealth of Massachusetts GO VRDN for Central Artery/
Ted Williams Tunnel Infrastructure Loan Act Series 2000 A
RMKT (Citibank N.A., SPA)(a) |
|
| | 14,550,000 | | | | 1.710 | | | | 03/07/19 | | | | 14,550,000 | |
| Commonwealth of Massachusetts GO VRDN Refunding
Series 2001 C RMKT (Barclays Bank PLC, SPA) |
|
| | 1,300,000 | | | | 1.770 | | | | 03/07/19 | | | | 1,300,000 | |
| Massachusetts Bay Transportation Authority VRDN RB
Refunding for General Transportation System Series 2000A-2
RMKT (Barclays Bank PLC, SPA)(a) |
|
| | 15,270,000 | | | | 1.750 | | | | 03/07/19 | | | | 15,270,000 | |
| Massachusetts Health & Educational Facilities Authority CP
Series 2019 EE |
|
| | 24,750,000 | | | | 1.750 | | | | 10/02/19 | | | | 24,750,000 | |
| | 10,000,000 | | | | 1.750 | | | | 10/03/19 | | | | 10,000,000 | |
| | 6,750,000 | | | | 1.750 | | | | 10/10/19 | | | | 6,750,000 | |
| Massachusetts Health & Educational Facilities Authority VRDN
RB for Harvard University Series 2000 Y(a) |
|
| | 2,000,000 | | | | 1.680 | | | | 03/07/19 | | | | 2,000,000 | |
| Massachusetts Health & Educational Facilities Authority VRDN
RB for Massachusetts Institute of Technology Series 2001 J-1 |
|
| | 1,280,000 | | | | 1.700 | | | | 03/07/19 | | | | 1,280,000 | |
| Massachusetts Health & Educational Facilities Authority VRDN
RB for Museum of Fine Arts Series 2007A-1 RMKT (Wells
Fargo Bank N.A., SPA)(a) |
|
| | 5,300,000 | | | | 1.720 | | | | 03/01/19 | | | | 5,300,000 | |
| Massachusetts State Development Finance Agency VRDN RB for
Partners HealthCare Systems Series 2011 K-2 (Barclays Bank,
SPA) (GTY AGMT – Brigham and Women’s Hospital, Inc.,
Faulkner Hospital, Massachusetts General Hospital and The
General Hospital Corp.)(a) |
|
| | 7,800,000 | | | | 1.690 | | | | 03/07/19 | | | | 7,800,000 | |
| | Massachusetts Water Resources Authority CP Series 1999A-2 | |
| | 6,750,000 | | | | 1.860 | | | | 05/02/19 | | | | 6,750,000 | |
| | |
|
| Municipal Debt Obligations – (continued) | |
| Massachusetts – (continued) | |
| Massachusetts Water Resources Authority VRDN RB Refunding
Series 2008A-1 RMKT (JP Morgan Chase Bank SPA)(a) |
|
| 355,000 | | | | 1.720 | | | | 03/07/19 | | | | 355,000 | |
| Massachusetts Water Resources Authority VRDN RB Refunding
Subordinated General Series 2008A-3 RMKT (Wells Fargo
Bank N.A. SPA)(a) |
|
| | 1,725,000 | | | | 1.720 | | | | 03/07/19 | | | | 1,725,000 | |
| Massachusetts Water Resources Authority VRDN RB Refunding
Subordinated General Series 2008 E (JPMorgan Chase Bank
N.A., SPA)(a) |
|
| | 9,240,000 | | | | 1.760 | | | | 03/07/19 | | | | 9,240,000 | |
| | | | | | | | | | | | | | |
| | | | | | | | | | | | | 117,119,507 | |
| | |
| Michigan – 6.4% | |
| Michigan Finance Authority State Aid RN Series 2018A-1 (State
Aid Withholding) |
|
| | 10,000,000 | | | | 4.000 | | | | 08/20/19 | | | | 10,104,189 | |
| Michigan Finance Authority VRDN RB Refunding for Hospital
Project Ascension Senior Credit Group Series 2016E-2(a) |
|
| | 7,690,000 | | | | 1.770 | | | | 03/07/19 | | | | 7,690,000 | |
| Michigan State University VRDN RB General Series 2000 A
(Northern Trust Co., SPA)(a) |
|
| | 1,330,000 | | | | 1.780 | | | | 03/07/19 | | | | 1,330,000 | |
| Michigan State University VRDN RB General Series 2005 (Royal
Bank of Canada, SPA)(a) |
|
| | 13,145,000 | | | | 1.780 | | | | 03/07/19 | | | | 13,145,000 | |
| Michigan State University VRDN RB Refunding for General
Series 2003 A (Northern Trust Co., SPA)(a) |
|
| | 21,415,000 | | | | 1.780 | | | | 03/07/19 | | | | 21,415,000 | |
| Regents of the University of Michigan VRDN RB Refunding
General Series 2012 D-1(a) |
|
| | 635,000 | | | | 1.570 | | | | 03/01/19 | | | | 635,000 | |
| Regents of the University of Michigan VRDN RB Refunding
Series 2012 A(a) |
|
| | 16,500,000 | | | | 1.680 | | | | 03/07/19 | | | | 16,500,000 | |
| | University of Michigan CP Series 2019 K-1 | |
| | 4,135,000 | | | | 1.400 | | | | 04/02/19 | | | | 4,135,000 | |
| | 6,675,000 | | | | 1.420 | | | | 04/09/19 | | | | 6,675,000 | |
| | | | | | | | | | | | | | |
| | | | | | | | | | | | | 81,629,189 | |
| | |
| Minnesota – 3.0% | |
| County of Hennepin GO VRDN Series 2017 B (U.S. Bank N.A.,
SPA)(a) |
|
| | 23,545,000 | | | | 1.720 | | | | 03/07/19 | | | | 23,545,000 | |
| Minnesota Higher Education Facilities Authority VRDN RB
Refunding for Carleton College Series 2005 Six D (JPMorgan
Chase Bank N.A., SPA)(a) |
|
| | 4,630,000 | | | | 1.770 | | | | 03/07/19 | | | | 4,630,000 | |
| | University of Minnesota CP Series 2019 H | |
| | 9,800,000 | | | | 1.700 | | | | 05/01/19 | | | | 9,800,000 | |
| | | | | | | | | | | | | | |
| | | | | | | | | | | | | 37,975,000 | |
| | |
| Mississippi – 2.1% | |
| Mississippi Business Finance Commission Gulf Opportunity Zone
VRDN RB for Chevron USA, Inc. Project Series 2009 C (GTY
AGMT-Chevron Corp.)(a) |
|
| | 170,000 | | | | 1.690 | | | | 03/01/19 | | | | 170,000 | |
| | |
| | |
| 16 | | The accompanying notes are an integral part of these financial statements. |
INVESTOR TAX-EXEMPT MONEY MARKET FUND
| | | | | | | | | | | | | | |
Principal Amount | | | Interest Rate | | | Maturity Date | | | Amortized Cost | |
|
| Municipal Debt Obligations – (continued) | |
| Mississippi – (continued) | |
| Mississippi Business Finance Commission Gulf Opportunity Zone
VRDN RB for Chevron USA, Inc. Project Series 2010 C (GTY
AGMT-Chevron Corp.)(a) |
|
| $ | 220,000 | | | | 1.780 | % | | | 03/07/19 | | | $ | 220,000 | |
| Mississippi Business Finance Commission Gulf Opportunity Zone
VRDN RB for Chevron USA, Inc. Project Series 2010 G (GTY
AGMT- Chevron Corp.)(a) |
|
| | 325,000 | | | | 1.690 | | | | 03/01/19 | | | | 325,000 | |
| Mississippi Business Finance Commission Gulf Opportunity Zone
VRDN RB for Chevron USA, Inc. Project Series 2011 E (GTY
AGMT – Chevron Corp.)(a) |
|
| | 8,000,000 | | | | 1.720 | | | | 03/01/19 | | | | 8,000,000 | |
| Mississippi Business Finance Corporation Gulf Opportunity Zone
VRDN RB for Chevron USA, Inc. Project Series 2007 A (GTY
AGMT – Chevron Corp.)(a) |
|
| | 1,800,000 | | | | 1.720 | | | | 03/01/19 | | | | 1,800,000 | |
| Mississippi Business Finance Corporation Gulf Opportunity Zone
VRDN RB for Chevron USA, Inc. Project Series 2007 D (GTY
AGMT – Chevron Corp.)(a) |
|
| | 7,900,000 | | | | 1.720 | | | | 03/01/19 | | | | 7,900,000 | |
| Mississippi Business Finance Corporation Gulf Opportunity Zone
VRDN RB for Chevron USA, Inc. Project Series 2010 A (GTY
AGMT – Chevron Corp.)(a) |
|
| | 340,000 | | | | 1.770 | | | | 03/07/19 | | | | 340,000 | |
| Mississippi Business Finance Corporation Gulf Opportunity Zone
VRDN RB for Chevron USA, Inc. Project Series 2010 B (GTY
AGMT – Chevron Corp.)(a) |
|
| | 3,735,000 | | | | 1.770 | | | | 03/07/19 | | | | 3,735,000 | |
| Mississippi Business Finance Corporation Gulf Opportunity Zone
VRDN RB for Chevron USA, Inc. Project Series 2010 E (GTY
AGMT – Chevron Corp.)(a) |
|
| | 700,000 | | | | 1.780 | | | | 03/07/19 | | | | 700,000 | |
| Mississippi Business Finance Corporation Gulf Opportunity Zone
VRDN RB for Chevron USA, Inc. Project Series 2010 J (GTY
AGMT – Chevron Corp.)(a) |
|
| | 3,600,000 | | | | 1.720 | | | | 03/01/19 | | | | 3,600,000 | |
| | | | | | | | | | | | | | |
| | | | | | | | | | | | | 26,790,000 | |
| | |
| Missouri – 2.7% | |
| | Curators University of Missouri CPSeries 2019-A | |
| | 18,300,000 | | | | 1.680 | | | | 06/05/19 | | | | 18,300,000 | |
| Missouri Development Finance Board Cultural Facilities VRDN
RB for Nelson Gallery Foundation Series 2004 A (Northern
Trust Co., SPA)(a) |
|
| | 10,550,000 | | | | 1.710 | | | | 03/01/19 | | | | 10,550,000 | |
| Missouri Health & Educational Facilities Authority VRDN RB
for Ascension Health Senior Credit Group Series 2008 C4(a) |
|
| | 335,000 | | | | 1.770 | | | | 03/07/19 | | | | 335,000 | |
| Missouri Health & Educational Facilities Authority VRDN RB
for BJC Health System Series 2008 A (BJC Health
System, LIQ) |
|
| | 1,350,000 | | | | 1.700 | | | | 03/07/19 | | | | 1,350,000 | |
| Missouri Health & Educational Facilities Authority VRDN RB
Refunding for Ascension Health Credit Group Series 2003C-2
RMKT(a) |
|
| | 4,470,000 | | | | 1.750 | | | | 03/07/19 | | | | 4,470,000 | |
| | | | | | | | | | | | | | |
| | | | | | | | | | | | | 35,005,000 | |
| | |
|
| Municipal Debt Obligations – (continued) | |
| Multi-State – 2.8% | |
| Federal Home Loan Mortgage Corporation VRDN RB for Multi-
Family Variable Rate CertificatesSeries 2013-M027 Class A
(FHLMC, LIQ)(a) |
|
| 20,075,000 | | | | 1.760 | | | | 03/07/19 | | | | 20,075,000 | |
| Federal Home Loan Mortgage Corporation VRDN RB for Multi-
Family Variable Rate CertificatesSeries 2014-M031 Class A
(FHLMC, LIQ)(a) |
|
| | 11,850,000 | | | | 1.770 | | | | 03/07/19 | | | | 11,850,000 | |
| Federal Home Loan Mortgage Corporation VRDN RB for Multi-
Family Variable Rate CertificatesSeries 2015-M033 Class A
(FHLMC, LIQ)(a) |
|
| | 3,995,000 | | | | 1.770 | | | | 03/07/19 | | | | 3,995,000 | |
| | | | | | | | | | | | | | |
| | | | | | | | | | | | | 35,920,000 | |
| | |
| New Hampshire – 0.6% | |
| New Hampshire Health & Education Facilities Authority VRDN
RB Refunding for Dartmouth College Series 2007 B (The Bank
of New York Mellon, SPA)(a) |
|
| | 8,105,000 | | | | 1.670 | | | | 03/01/19 | | | | 8,105,000 | |
| | |
| New York – 13.5% | |
| Metropolitan Transportation Authority Dedicated Tax
Fund VRDN RB Refunding Series 2008A-1 RMKT (TD Bank
N.A., LOC)(a) |
|
| | 4,990,000 | | | | 1.680 | | | | 03/01/19 | | | | 4,990,000 | |
| Nassau County Interim Finance Authority GO TAN
Series 2018 A |
|
| | 15,850,000 | | | | 4.000 | | | | 03/15/19 | | | | 15,863,244 | |
| Nassau County Interim Finance Authority VRDN RB Refunding
for Sales Tax Revenue Series 2008 A (TD Bank N.A., SPA)(a) |
|
| | 9,975,000 | | | | 1.730 | | | | 03/07/19 | | | | 9,975,000 | |
| Nassau County Interim Finance Authority VRDN RB Refunding
for Sales Tax Revenue Series 2008 B (Sumitomo Mitsui
Banking Corp., SPA)(a) |
|
| | 1,970,000 | | | | 1.730 | | | | 03/07/19 | | | | 1,970,000 | |
| New York City GO VRDN Series 2018 Subseries B-5 (Barclays
Bank PLC, SPA)(a) |
|
| | 3,000,000 | | | | 1.730 | | | | 03/01/19 | | | | 3,000,000 | |
| New York City Housing Development Corp. Multi-Family
Mortgage VRDN RB for 245 East 124th Street Series 2008
(FHLMC, LIQ) (FHLMC, LOC) |
|
| | 450,000 | | | | 1.750 | | | | 03/07/19 | | | | 450,000 | |
| New York City Housing Development Corp. Multi-Family
Mortgage VRDN RB for Elliot Chelsea Development
Series 2010 A (FHLMC, LIQ)(a) |
|
| | 17,800,000 | | | | 1.740 | | | | 03/07/19 | | | | 17,800,000 | |
| New York City Municipal Water Finance Authority Water &
Sewer System VRDN RB Refunding for Second General
Resolution Series 2007 CC-2 (Bank of Montreal, SPA)(a) |
|
| | 10,000,000 | | | | 1.700 | | | | 03/01/19 | | | | 10,000,000 | |
| New York City Municipal Water Finance Authority Water &
Sewer System VRDN RB Refunding for Second General
Resolution Series 2015 Subseries BB-4 (Barclays Bank
PLC, SPA)(a) |
|
| | 2,675,000 | | | | 1.730 | | | | 03/01/19 | | | | 2,675,000 | |
| | |
| | |
| The accompanying notes are an integral part of these financial statements. | | 17 |
INVESTOR TAX-EXEMPT MONEY MARKET FUND
Schedule of Investments(continued)
February 28, 2019 (Unaudited)
| | | | | | | | | | | | | | |
Principal Amount | | | Interest Rate | | | Maturity Date | | | Amortized Cost | |
|
| Municipal Debt Obligations – (continued) | |
| New York – (continued) | |
| New York City Municipal Water Finance Authority Water &
Sewer System VRDN RB Refunding for Second General
ResolutionSeries 2019-BB (Industrial & Commercial Bank of
China, SPA)(a) |
|
| $ | 10,000,000 | | | | 1.770 | % | | | 03/07/19 | | | $ | 10,000,000 | |
| New York City Municipal Water Finance Authority Water &
Sewer System VRDN RB Refunding Series 2008 Subseries B-3
(Bank of America N.A., SPA)(a) |
|
| | 7,000,000 | | | | 1.730 | | | | 03/01/19 | | | | 7,000,000 | |
| New York City Municipal Water Finance Authority Water &
Sewer System VRDN RB Second General Resolution
Series 2011 Subseries FF-2 (Landesbank Hessen-Thueringen
Girozentrale, SPA)(a) |
|
| | 5,800,000 | | | | 1.730 | | | | 03/01/19 | | | | 5,800,000 | |
| New York City Trust for Cultural Resources VRDN RB for
Metropolitan Museum of Art Series 2006 A2 RMKT(a) |
|
| | 17,000,000 | | | | 1.680 | | | | 03/07/19 | | | | 17,000,000 | |
| New York City Trust for Cultural Resources VRDN RB
Refunding for The New York Botanical Garden Series 2009 A
(JPMorgan Chase Bank N.A., LOC)(a) |
|
| | 1,795,000 | | | | 1.680 | | | | 03/07/19 | | | | 1,795,000 | |
| New York State Dormitory Authority Non-State Supported
VRDN RB for Rockefeller University Series 2008 A
(JPMorgan Chase Bank N.A., SPA)(a) |
|
| | 200,000 | | | | 1.750 | | | | 03/07/19 | | | | 200,000 | |
| New York State Housing Finance Agency VRDN RB for 10
Barclay Street Series 2004 A (FNMA, LIQ) (FNMA, LOC)(a) |
|
| | 4,600,000 | | | | 1.740 | | | | 03/07/19 | | | | 4,600,000 | |
| New York State Housing Finance Agency VRDN RB for 100
Maiden Lane Series 2004 A RMKT (FNMA, LIQ)
(FNMA, LOC)(a) |
|
| | 9,000,000 | | | | 1.750 | | | | 03/07/19 | | | | 9,000,000 | |
| New York State Housing Finance Agency VRDN RB for Chelsea
Apartments Series 2003 A (FNMA, LIQ) (FNMA, LOC)(a) |
|
| | 7,100,000 | | | | 1.840 | | | | 03/07/19 | | | | 7,100,000 | |
| New York State Housing Finance Agency VRDN RB for Clinton
Park Housing Series 2010 A (FHLMC, LIQ)(a) |
|
| | 350,000 | | | | 1.750 | | | | 03/07/19 | | | | 350,000 | |
| New York State Housing Finance Agency VRDN RB Refunding
for Economic Development Series 2005 C RMKT (JPMorgan
Chase Bank N.A., SPA)(a) |
|
| | 7,000,000 | | | | 1.750 | | | | 03/07/19 | | | | 7,000,000 | |
| New York State Housing Finance Agency VRDN RB Refunding
for Taconic Housing West 17th Street Series 2009 A (FNMA,
LIQ) (FNMA, LOC)(a) |
|
| | 13,500,000 | | | | 1.740 | | | | 03/07/19 | | | | 13,500,000 | |
| New York State Local Government Assistance Corp. VRDN RB
Refunding for Subordinated Lien Series 2008 B-3V (JPMorgan
Chase Bank N.A., SPA) |
|
| | 1,000,000 | | | | 1.750 | | | | 03/07/19 | | | | 1,000,000 | |
| New York State Urban Development Corp. VRDN RB Refunding
for State Facilities and Equipment 2004A-3B RMKT
(JPMorgan Chase Bank N.A., SPA)(a) |
|
| | 8,900,000 | | | | 1.740 | | | | 03/07/19 | | | | 8,900,000 | |
| Triborough Bridge & Tunnel Authority VRDN RB Refunding
Series 2002 F RMKT (Citibank N.A., LOC)(a) |
|
| | 3,980,000 | | | | 1.710 | | | | 03/01/19 | | | | 3,980,000 | |
| | |
|
| Municipal Debt Obligations – (continued) | |
| New York – (continued) | |
| Triborough Bridge & Tunnel Authority VRDN RB Refunding
Series 2005 Subseries B-3 RMKT (State Street Bank &
Trust Co., LOC)(a) |
|
| 8,515,000 | | | | 1.700 | | | | 03/01/19 | | | | 8,515,000 | |
| | | | | | | | | | | | | | |
| | | | | | | | | | | | | 172,463,244 | |
| | |
| North Carolina – 1.4% | |
| Charlotte-Mecklenburg Hospital Authority (The) VRDN RB for
Atrium Health Series 2018 G (JP Morgan Chase Bank
N.A., SPA) |
|
| | 4,000,000 | | | | 1.730 | | | | 03/01/19 | | | | 4,000,000 | |
| City of Raleigh Combined Enterprise System VRDN RB
Series 2008 A RMKT (Bank of America N.A., SPA)(a) |
|
| | 3,925,000 | | | | 1.740 | | | | 03/07/19 | | | | 3,925,000 | |
| North Carolina Capital Facilities Finance Agency Educational
Facilities VRDN RB Refunding for Wake Forest University
Series 2004 A(a) |
|
| | 6,900,000 | | | | 1.740 | | | | 03/07/19 | | | | 6,900,000 | |
| University of North Carolina Hospital at Chapel Hill VRDN RB
Refunding Series 2003 A (Bank of America N.A., SPA)(a) |
|
| | 3,705,000 | | | | 1.720 | | | | 03/07/19 | | | | 3,705,000 | |
| | | | | | | | | | | | | | |
| | | | | | | | | | | | | 18,530,000 | |
| | |
| Ohio – 7.0% | |
| City of Columbus GO VRDN for Sanitation Sewer System
Series 2006-1(a) |
|
| | 1,145,000 | | | | 1.750 | | | | 03/07/19 | | | | 1,145,000 | |
| City of Columbus Sewerage System VRDN RB Refunding
Series 2008 B(a) |
|
| | 650,000 | | | | 1.750 | | | | 03/07/19 | | | | 650,000 | |
| County of Hamilton VRDN RB Refunding for Cincinnati
Children’s Hospital Medical Center Series 2018 AA(a) |
|
| | 14,370,000 | | | | 1.730 | | | | 03/07/19 | | | | 14,370,000 | |
| Franklin County Hospital VRDN RB Improvement for
Nationwide Children’s Hospital Project Series 2008 B(a) |
|
| | 14,500,000 | | | | 1.770 | | | | 03/07/19 | | | | 14,500,000 | |
| Franklin County Hospital VRDN RB Refunding for Ohio Health
Facilities Series 2009 B RMKT (Barclays Bank PLC, SPA)(a) |
|
| | 5,440,000 | | | | 1.730 | | | | 03/07/19 | | | | 5,440,000 | |
| Ohio Higher Educational Facility Commission VRDN RB
Refunding for Cleveland Clinic Health System Series 2013 B-1
(Wells Fargo Bank N.A., SPA)(a) |
|
| | 600,000 | | | | 1.670 | | | | 03/01/19 | | | | 600,000 | |
| Ohio State University General Receipts VRDN RB Refunding
Series 2010 E(a) |
|
| | 3,000,000 | | | | 1.720 | | | | 03/07/19 | | | | 3,000,000 | |
| Ohio State University General Receipts VRDN RB
Series 2005 B(a) |
|
| | 1,200,000 | | | | 1.700 | | | | 03/07/19 | | | | 1,200,000 | |
| Ohio State University General Receipts VRDN RB
Series 2008 B(a) |
|
| | 5,600,000 | | | | 1.700 | | | | 03/07/19 | | | | 5,600,000 | |
| Ohio State University General Receipts VRDN RB
Series 2014 B-1(a) |
|
| | 1,130,000 | | | | 1.700 | | | | 03/07/19 | | | | 1,130,000 | |
| | |
| | |
| 18 | | The accompanying notes are an integral part of these financial statements. |
INVESTOR TAX-EXEMPT MONEY MARKET FUND
| | | | | | | | | | | | | | |
Principal Amount | | | Interest Rate | | | Maturity Date | | | Amortized Cost | |
|
| Municipal Debt Obligations – (continued) | |
| Ohio – (continued) | |
| Ohio State University General Receipts VRDN RB
Series 2014 B-2(a) |
|
| $ | 2,140,000 | | | | 1.700 | % | | | 03/07/19 | | | $ | 2,140,000 | |
| State of Ohio GO VRDN for Common Schools Series 2003 D
RMKT(a) |
|
| | 30,000,000 | | | | 1.730 | | | | 03/07/19 | | | | 30,000,000 | |
| State of Ohio GO VRDN for Common Schools Series 2005 A
(State of Ohio, LIQ)(a) |
|
| | 965,000 | | | | 1.700 | | | | 03/07/19 | | | | 965,000 | |
| State of Ohio GO VRDN for Common Schools Series 2005 B
(State of Ohio, LIQ)(a) |
|
| | 4,700,000 | | | | 1.700 | | | | 03/07/19 | | | | 4,700,000 | |
| | State of Ohio GO VRDN for Common Schools Series 2006 C(a) | |
| | 3,420,000 | | | | 1.710 | | | | 03/07/19 | | | | 3,420,000 | |
| State of Ohio GO VRDN Refunding for Infrastructure
Improvement Series 2004 A(a) |
|
| | 930,000 | | | | 1.730 | | | | 03/07/19 | | | | 930,000 | |
| | | | | | | | | | | | | | |
| | | | | | | | | | | | | 89,790,000 | |
| | |
| Rhode Island – 0.5% | |
| Rhode Island Health & Educational Building Corp. Higher
Education Facilities VRDN RB for Brown University
Series 2003 B (Northern Trust Co., SPA)(a) |
|
| | 6,855,000 | | | | 1.750 | | | | 03/07/19 | | | | 6,855,000 | |
| | |
| South Carolina – 0.5% | |
| City of Columbia, South Carolina Waterworks & Sewer System
VRDN RB Series 2009 RMKT (Sumitomo Mitsui Banking
Corp., LOC)(a) |
|
| | 6,750,000 | | | | 1.740 | | | | 03/07/19 | | | | 6,750,000 | |
| | |
| Texas – 8.0% | |
| | Dallas Area Rapid Transit CP Series 2019A-2 | |
| | 3,615,000 | | | | 1.520 | | | | 04/02/19 | | | | 3,615,000 | |
| Gulf Coast Waste Disposal Authority VRDN PCRB Refunding
for Exxon Project Series 1989(a) |
|
| | 3,630,000 | | | | 1.720 | | | | 03/01/19 | | | | 3,630,000 | |
| Harris County Cultural Education Facilities Finance Corp. CP
Series 2019 C-1 |
|
| | 6,300,000 | | | | 1.750 | | | | 06/04/19 | | | | 6,298,353 | |
| | 16,400,000 | | | | 1.870 | | | | 06/20/19 | | | | 16,400,000 | |
| Harris County Cultural Education Facilities Finance Corp. CP
Series 2019 C-2 |
|
| | 6,230,000 | | | | 1.550 | | | | 05/02/19 | | | | 6,230,000 | |
| | 9,355,000 | | | | 1.750 | | | | 06/04/19 | | | | 9,352,554 | |
| Harris County Cultural Education Facilities Finance Corp. VRDN
RB Refunding for Memorial Hermann Health System
Series 2015 C(a) |
|
| | 6,700,000 | | | | 1.780 | | | | 03/07/19 | | | | 6,700,000 | |
| Harris County Cultural Education Facilities Finance Corp. VRDN
RB Refunding for Memorial Hermann Health System
Series 2016 C(a) |
|
| | 970,000 | | | | 1.780 | | | | 03/07/19 | | | | 970,000 | |
| Harris County Cultural Education Facilities Finance Corp. VRDN
RB Refunding for Methodist Hospital System Series 2008
Subseries C-1(a) |
|
| | 1,000,000 | | | | 1.730 | | | | 03/01/19 | | | | 1,000,000 | |
| | |
|
| Municipal Debt Obligations – (continued) | |
| Texas – (continued) | |
| Harris County Cultural Education Facilities Finance Corp. VRDN
RB Refunding for Methodist Hospital System Series 2008
Subseries C-2(a) |
|
| 3,550,000 | | | | 1.730 | | | | 03/01/19 | | | | 3,550,000 | |
| Harris County Industrial Development Corp. VRDN PCRB for
Exxon Project Series 1984(a) |
|
| | 300,000 | | | | 1.720 | | | | 03/01/19 | | | | 300,000 | |
| Lower Neches Valley Authority Industrial Development Corp.
VRDN RB for ExxonMobil Project Series 2010 (GTY AGMT –
Exxon Mobil Corp.)(a) |
|
| | 1,000,000 | | | | 1.730 | | | | 03/01/19 | | | | 1,000,000 | |
| Port of Port Arthur Navigation District VRDN RB Refunding for
Texaco, Inc. Project Series 1994(a) |
|
| | 7,400,000 | | | | 1.720 | | | | 03/01/19 | | | | 7,400,000 | |
| | State of Texas TRANS Series 2018 | |
| | 16,800,000 | | | | 4.000 | | | | 08/29/19 | | | | 16,977,111 | |
| Tarrant County Cultural Education Facilities Finance Corp.
VRDN RB Refunding for Texas Health Resources
Series 2008 A(a) |
|
| | 1,220,000 | | | | 1.730 | | | | 03/07/19 | | | | 1,220,000 | |
| Tarrant County Cultural Education Facilities Finance Corp.
VRDN RB Refunding for Texas Health Resources
Series 2008 B(a) |
|
| | 15,285,000 | | | | 1.790 | | | | 03/07/19 | | | | 15,285,000 | |
| University of Texas System Permanent University Fund CP
Series 2019 A |
|
| | 2,000,000 | | | | 1.640 | | | | 03/05/19 | | | | 2,000,000 | |
| University of Texas System VRDN RB Refunding for Financing
System Series 2008 B (University of Texas Investment
Management Co., LIQ)(a) |
|
| | 200,000 | | | | 1.720 | | | | 03/07/19 | | | | 200,000 | |
| | | | | | | | | | | | | | |
| | | | | | | | | | | | | 102,128,018 | |
| | |
| Virginia – 4.7% | |
| City of Norfolk Economic Development Authority Hospital
Facilities VRDN RB Refunding for Sentara Healthcare
Series 2016 B(a) |
|
| | 18,835,000 | | | | 1.720 | | | | 03/07/19 | | | | 18,835,000 | |
| Fairfax County IDA VRDN RB Refunding for Inova Health
System Project Series 2018 C |
|
| | 1,890,000 | | | | 1.740 | | | | 03/07/19 | | | | 1,890,000 | |
| Loudoun County IDA VRDN RB for Howard Hughes Medical
Institute Series 2003 C(a) |
|
| | 26,270,000 | | | | 1.750 | | | | 03/07/19 | | | | 26,270,000 | |
| Loudoun County IDA VRDN RB for Howard Hughes Medical
Institute Series 2003 D(a) |
|
| | 4,000,000 | | | | 1.750 | | | | 03/07/19 | | | | 4,000,000 | |
| Loudoun County IDA VRDN RB for Howard Hughes Medical
Institute Series 2003 E(a) |
|
| | 1,250,000 | | | | 1.750 | | | | 03/07/19 | | | | 1,250,000 | |
| Loudoun County IDA VRDN RB for Howard Hughes Medical
Institute Series 2003 F(a) |
|
| | 940,000 | | | | 1.750 | | | | 03/07/19 | | | | 940,000 | |
| Loudoun County IDA VRDN RB for Howard Hughes Medical
Institute Series 2009 B(a) |
|
| | 220,000 | | | | 1.750 | | | | 03/07/19 | | | | 220,000 | |
| | |
| | |
| The accompanying notes are an integral part of these financial statements. | | 19 |
INVESTOR TAX-EXEMPT MONEY MARKET FUND
Schedule of Investments(continued)
February 28, 2019 (Unaudited)
| | | | | | | | | | | | | | |
Principal Amount | | | Interest Rate | | | Maturity Date | | | Amortized Cost | |
|
| Municipal Debt Obligations – (continued) | |
| Virginia – (continued) | |
| | University of Virginia CP Series 2019 A | |
| $ | 3,550,000 | | | | 1.600 | % | | | 03/11/19 | | | $ | 3,550,000 | |
| | 3,000,000 | | | | 1.800 | | | | 04/04/19 | | | | 3,000,000 | |
| | | | | | | | | | | | | | |
| | | | | | | | | | | | | 59,955,000 | |
| | |
| Washington – 2.0% | |
| County of King Sewer Revenue VRDN RB Junior Lien
Series 2001 A (Landesbank Hessen-Thueringen
Girozentrale, LOC)(a) |
|
| | 350,000 | | | | 1.760 | | | | 03/07/19 | | | | 350,000 | |
| Washington Health Care Facilities Authority VRDN RB
Refunding for Providence Health & Services Series 2012 C
(U.S. Bank N.A., SPA)(a) |
|
| | 16,080,000 | | | | 1.750 | | | | 03/07/19 | | | | 16,080,000 | |
| Washington State Housing Finance Commission VRDN RB for
Discovery Heights Apartments Series 2010 (FHLMC, LIQ)(a) |
|
| | 9,450,000 | | | | 1.830 | | | | 03/07/19 | | | | 9,450,000 | |
| | | | | | | | | | | | | | |
| | | | | | | | | | | | | 25,880,000 | |
| | |
| | TOTAL INVESTMENTS – 99.9% | | | $ | 1,280,402,492 | |
| | |
| OTHER ASSETS IN EXCESS OF
LIABILITIES – 0.1% |
| | | 1,693,402 | |
| | |
| | NET ASSETS – 100.0% | | | $ | 1,282,095,894 | |
| | |
| | |
|
| The percentage shown for each investment category reflects the value of investments in that category as a percentage of net assets. |
| |
(a) | | Rate shown is that which is in effect on February 28, 2019. Certain variable rate securities are not based on a published reference rate and spread but are determined by the issuer or agent and are based on current market conditions. |
|
| Interest rates represent either the stated coupon rate, or for floating rate securities, the current reset rate, which is based upon current interest rate indices. |
|
| Maturity dates represent either the final legal maturity date on the security, the demand date for puttable securities, or the prerefunded date for those types of securities. |
| | |
|
Investment Abbreviations: |
CP | | —Commercial Paper |
FHLB | | —Insured by Federal Home Loan Bank |
FHLMC | | —Insured by Federal Home Loan Mortgage Corp. |
FNMA | | —Insured by Federal National Mortgage Association |
GNMA | | —Insured by Government National Mortgage Association |
GO | | —General Obligation |
GTY AGMT | | —Guaranty Agreement |
IDA | | —Industrial Development Agency |
IDB | | —Industrial Development Board |
LIQ | | —Liquidity Agreement |
LOC | | —Letter of Credit |
PCRB | | —Pollution Control Revenue Bond |
RANS | | —Revenue Anticipation Notes |
RB | | —Revenue Bond |
RN | | —Revenue Notes |
RMKT | | —Remarketed |
SIFMA | | —Securities Industry and Financial Markets Association |
SPA | | —Stand-by Purchase Agreement |
TRANS | | —Tax Revenue Anticipation Notes |
VRDN | | —Variable Rate Demand Notes |
|
| | |
| 20 | | The accompanying notes are an integral part of these financial statements. |
GOLDMAN SACHS FUNDS — INVESTOR FUNDS
|
| ADDITIONAL INVESTMENT INFORMATION |
JOINT REPURCHASE AGREEMENT ACCOUNT III — At February 28, 2019, the Investor Money Market Fund had undivided interests in the Joint Repurchase Agreement Account III, with a maturity date of March 1, 2019, as follows:
| | | | |
| Principal Amount | | Maturity Value | | Collateral Value |
| $216,100,000 | | $216,115,577 | | $222,327,313 |
REPURCHASE AGREEMENTS — At February 28, 2019, the Principal Amounts of the Investor Money Market Fund’s interests in the Joint Repurchase Agreement Account III were as follows:
| | | | | | | | |
| Counterparty | | Interest Rate | | | Principal Amount | |
ABN Amro Bank N.V. | | | 2.600 | % | | | $17,796,470 | |
Bank of America, N.A. | | | 2.580 | | | | 12,711,765 | |
Bank of Nova Scotia (The) | | | 2.620 | | | | 55,931,765 | |
BNP Paribas | | | 2.610 | | | | 12,711,765 | |
Merrill Lynch, Pierce, Fenner & Smith, Inc. | | | 2.570 | | | | 45,762,353 | |
Wells Fargo Securities, LLC | | | 2.590 | | | | 71,185,882 | |
TOTAL | | | | | | $ | 216,100,000 | |
At February 28, 2019, the Joint Repurchase Agreement Account III was fully collateralized by:
| | | | | | | | |
| Issuer | | Interest Rates | | | Maturity Dates | |
Federal Farm Credit Bank | | | 2.450 to 4.150 | % | | | 03/01/21 to 06/27/33 | |
Federal Home Loan Bank | | | 3.930 | | | | 07/11/33 | |
Federal Home Loan Mortgage Corp. | | | 2.000 to 9.500 | | | | 11/01/19 to 03/01/49 | |
Federal Home Loan Mortgage Corp. Stripped Securities | | | 0.000 | | | | 07/15/32 | |
Federal National Mortgage Association | | | 1.750 to 7.500 | | | | 03/01/19 to 03/01/49 | |
Federal National Mortgage Association Stripped Securities | | | 0.000 | | | | 03/23/28 to 11/15/30 | |
Government National Mortgage Association | | | 2.500 to 7.500 | | | | 09/15/24 to 02/20/49 | |
U.S. Treasury Bonds | | | 2.750 to 3.375 | | | | 11/15/47 to 11/15/48 | |
U.S. Treasury Inflation-Indexed Bonds | | | 2.375 to 3.875 | | | | 01/15/25 to 04/15/29 | |
U.S. Treasury Inflation-Indexed Notes | | | 0.125 | | | | 01/15/22 | |
U.S. Treasury Interest-Only Stripped Securities | | | 0.000 | | | | 08/15/37 | |
U.S. Treasury Notes | | | 1.250 to 2.875 | | | | 11/30/19 to 11/15/24 | |
| | |
| The accompanying notes are an integral part of these financial statements. | | 21 |
GOLDMAN SACHS FUNDS — INVESTOR FUNDS
Statements of Assets and Liabilities
February 28, 2019 (Unaudited)
| | | | | | | | | | |
| | | |
| | | | | Investor
Money Market
Fund | | | Investor
Tax-Exempt
Money Market
Fund | |
| | Assets: | | | | | | | | |
| | Investments based on amortized cost | | $ | 659,884,749 | | | $ | 1,280,402,492 | |
| | Repurchase agreements based on amortized cost | | | 242,100,000 | | | | — | |
| | Cash | | | 38,703 | | | | 2,888,532 | |
| | Receivables: | | | | | | | | |
| | Interest | | | 1,120,294 | | | | 416,416 | |
| | Fund shares sold | | | 6,463,047 | | | | 25,954 | |
| | Reimbursement from investment advisor | | | 12,246 | | | | 23,746 | |
| | Other assets | | | 3,810 | | | | 6,201 | |
| | Total assets | | | 909,622,849 | | | | 1,283,763,341 | |
| | | | | | | | | | |
| | Liabilities: | | | | | | | | |
| | Payables: | | | | | | | | |
| | Dividend distribution | | | 286,177 | | | | 1,246,043 | |
| | Management fees | | | 105,895 | | | | 157,473 | |
| | Fund shares redeemed | | | 2,004,648 | | | | 107,786 | |
| | Distribution and Service fees and Transfer Agency fees | | | 7,115 | | | | 10,146 | |
| | Investments purchased | | | 18,163,668 | | | | — | |
| | Accrued expenses | | | 68,409 | | | | 145,999 | |
| | Total liabilities | | | 20,635,912 | | | | 1,667,447 | |
| | | | | | | | | | |
| | Net Assets: | | | | | | | | |
| | Paid-in capital | | | 888,962,164 | | | | 1,282,102,573 | |
| | Total distributal earnings (loss) | | | 24,773 | | | | (6,679 | ) |
| | NET ASSETS | | $ | 888,986,937 | | | $ | 1,282,095,894 | |
| | | Net asset value, offering and redemption price per share | | | $1.00 | | | | $1.00 | |
| | | Net Assets: | | | | | | | | |
| | | Class I Shares | | $ | 739,456,413 | | | $ | 1,274,471,773 | |
| | | Select Shares | | | — | | | | 3,199 | |
| | | Preferred Shares | | | — | | | | 58,232 | |
| | | Capital Shares | | | — | | | | 1,020 | |
| | | Administration Shares | | | 112,941,727 | | | | 796,979 | |
| | | Premier Shares | | | — | | | | 1,015 | |
| | | Service Shares | | | 10,628 | | | | 2,515,030 | |
| | | Resource Shares | | | 10,499 | | | | 2,187,257 | |
| | | Cash Management Shares | | | 3,004,288 | | | | 1,006 | |
| | | Class A Shares | | | 33,553,113 | | | | 2,051,357 | |
| | | Class C Shares | | | 10,269 | | | | 9,026 | |
| | | Total Net Assets | | $ | 888,986,937 | | | $ | 1,282,095,894 | |
| | | Shares outstanding $0.001 par value (unlimited number of shares authorized): | | | | | | | | |
| | | Class I Shares | | | 739,435,815 | | | | 1,274,427,760 | |
| | | Select Shares | | | — | | | | 3,199 | |
| | | Preferred Shares | | | — | | | | 58,230 | |
| | | Capital Shares | | | — | | | | 1,020 | |
| | | Administration Shares | | | 112,938,564 | | | | 796,952 | |
| | | Premier Shares | | | — | | | | 1,015 | |
| | | Service Shares | | | 10,628 | | | | 2,514,943 | |
| | | Resource Shares | | | 10,499 | | | | 2,187,182 | |
| | | Cash Management Shares | | | 3,004,204 | | | | 1,006 | |
| | | Class A Shares | | | 33,552,185 | | | | 2,051,286 | |
| | | Class C Shares | | | 10,269 | | | | 9,026 | |
| | |
| 22 | | The accompanying notes are an integral part of these financial statements. |
GOLDMAN SACHS FUNDS — INVESTOR FUNDS
Statements of Operations
For the Six Months Ended February 28, 2019 (Unaudited)
| | | | | | | | | | |
| | | |
| | | | | Investor Money Market
Fund | | | Investor Tax-Exempt
Money Market
Fund | |
| | Investment income: | | | | | |
| | | |
| | Interest income | | $ | 9,600,810 | | | $ | 9,221,000 | |
| | | |
| | Total investment income | | | 9,600,810 | | | | 9,221,000 | |
| | | | | | | | | | |
| | Expenses: | | | | | |
| | Fund-Level Expenses: | | | | | | | | |
| | | |
| | Management fees | | | 608,203 | | | | 931,949 | |
| | | |
| | Professional fees | | | 54,636 | | | | 49,867 | |
| | | |
| | Registration fees | | | 45,502 | | | | 74,721 | |
| | | |
| | Transfer Agency fees | | | 38,013 | | | | 58,247 | |
| | | |
| | Custody, accounting and administrative services | | | 28,689 | | | | 60,194 | |
| | | |
| | Trustee fees | | | 8,437 | | | | 13,516 | |
| | | |
| | Printing and mailing fees | | | 7,146 | | | | 21,777 | |
| | | |
| | Other | | | 862 | | | | 24,359 | |
| | | |
| | Subtotal | | | 791,488 | | | | 1,234,630 | |
| | Class Specific Expenses: | | | | | | | | |
| | | |
| | Administration Share fees | | | 152,194 | | | | 63 | |
| | | |
| | Distribution and Service fees — Class A Shares | | | 20,624 | | | | 2,709 | |
| | | |
| | Cash Management Share fees | | | 2,738 | | | | 2 | |
| | | |
| | Distribution fees — Cash Management Shares | | | 1,643 | | | | 1 | |
| | | |
| | Distribution fees — Class C Shares | | | 38 | | | | 34 | |
| | | |
| | Resource Share fees | | | 26 | | | | 5,679 | |
| | | |
| | Service Share fees | | | 26 | | | | 2,395 | |
| | | |
| | Class C Share fees | | | 13 | | | | 11 | |
| | | |
| | Distribution fees — Resource Shares | | | 8 | | | | 1,704 | |
| | | |
| | Preferred Share fees | | | — | | | | 32 | |
| | | |
| | Premier Share fees | | | — | | | | 2 | |
| | | |
| | Capital Share fees | | | — | | | | 1 | |
| | | |
| | Select Share fees | | | — | | | | 1 | |
| | | |
| | Total expenses | | | 968,798 | | | | 1,247,264 | |
| | | |
| | Less — expense reductions | | | (92,050 | ) | | | (186,218 | ) |
| | | |
| | Net expenses | | | 876,748 | | | | 1,061,046 | |
| | | |
| | NET INVESTMENT INCOME | | $ | 8,724,062 | | | $ | 8,159,954 | |
| | | |
| | Net realized gain from investment transactions | | | 15,081 | | | | 8 | |
| | | |
| | NET INCREASE IN NET ASSETS RESULTING FROM OPERATIONS | | $ | 8,739,143 | | | $ | 8,159,962 | |
| | |
| The accompanying notes are an integral part of these financial statements. | | 23 |
GOLDMAN SACHS FUNDS — INVESTOR FUNDS
Statements of Changes in Net Assets
| | | | | | | | | | | | | | | | | | | | | | |
| | | | | Investor Money Market Fund | | | | | | Investor Tax-Exempt Money Market Fund | |
| | | | | For the
Six Months Ended
February 28, 2019
(Unaudited) | | | For the Fiscal
Year Ended
August 31, 2018 | | | | | | For the
Six Months Ended
February 28, 2019
(Unaudited) | | | For the Fiscal
Year Ended
August 31, 2018 | |
| | From operations: | | | | | | | | | | | | | |
| | Net investment income | | $ | 8,724,062 | | | $ | 6,248,660 | | | | | | | $ | 8,159,954 | | | $ | 10,782,417 | |
| | Net realized gain (loss) from investment transactions | | | 15,081 | | | | 12,206 | | | | | | | | 8 | | | | (6,657 | ) |
| | Net increase in net assets resulting from operations | | | 8,739,143 | | | | 6,260,866 | | | | | | | | 8,159,962 | | | | 10,775,760 | |
| | | | | | | | | | | | | | | | | | | | | | |
| | Distributions to shareholders: | | | | | | | | | | | | | |
| | From distributable earnings: | | | | | | | | | | | | | | | | | | | | |
| | Class I Shares | | | (7,269,578 | ) | | | (4,773,851 | )(a) | | | | | | | (8,133,666 | ) | | | (10,701,557 | )(a) |
| | Select Shares | | | — | | | | — | | | | | | | | (23 | ) | | | (13,704 | )(a) |
| | Preferred Shares | | | — | | | | — | | | | | | | | (425 | ) | | | (445 | )(a) |
| | Capital Shares | | | — | | | | — | | | | | | | | (8 | ) | | | (13 | )(a) |
| | Administration Shares | | | (1,262,306 | ) | | | (1,436,061 | )(a) | | | | | | | (316 | ) | | | (21,141 | )(a) |
| | Premier Shares | | | — | | | | — | | | | | | | | (7 | ) | | | (10 | )(a) |
| | Service Shares | | | (97 | ) | | | (314 | )(a) | | | | | | | (4,335 | ) | | | (4,638 | )(a) |
| | Resource Shares | | | (89 | ) | | | (261 | )(a) | | | | | | | (8,572 | ) | | | (11,907 | )(a) |
| | Cash Management Shares | | | (8,744 | ) | | | (5,856 | )(a) | | | | | | | (5 | ) | | | (98 | )(a) |
| | Class A Shares | | | (176,310 | ) | | | (42,376 | )(a) | | | | | | | (12,580 | ) | | | (29,474 | )(a) |
| | Class C Shares | | | (68 | ) | | | (164 | )(a) | | | | | | | (17 | ) | | | (13 | )(a) |
| | Total distributions to shareholders | | | (8,717,192 | ) | | | (6,258,883 | ) | | | | | | | (8,159,954 | ) | | | (10,783,000 | ) |
| | | | | | | | | | | | | | | | | | | | | | |
| | From share transactions: (at $1.00 per share): | | | | | | | | | | | | | |
| | Proceeds from sales of shares | | | 905,187,864 | | | | 801,426,361 | | | | | | | | 980,550,837 | | | | 1,654,445,910 | |
| | Reinvestment of distributions | | | 6,947,706 | | | | 4,214,509 | | | | | | | | 1,156,798 | | | | 1,638,479 | |
| | Cost of shares redeemed | | | (669,032,145 | ) | | | (477,393,348 | ) | | | | | | | (757,469,261 | ) | | | (1,536,838,676 | ) |
| | Net increase in net assets resulting from share transactions | | | 243,103,425 | | | | 328,247,522 | | | | | | | | 224,238,374 | | | | 119,245,713 | |
| | NET INCREASE | | | 243,125,376 | | | | 328,249,505 | | | | | | | | 224,238,382 | | | | 119,238,473 | |
| | | | | | | | | | | | | | | | | | | | | | |
| | Net assets:(b) | | | | | | | | | | | | | |
| | Beginning of period | | | 645,861,561 | | | | 317,612,056 | | | | | | | | 1,057,857,512 | | | | 938,619,039 | |
| | End of period | | $ | 888,986,937 | | | $ | 645,861,561 | | | | | | | $ | 1,282,095,894 | | | $ | 1,057,857,512 | |
| | (a) | | Prior year information has been revised to conform to current year presentation, see prior year presentation below: |
| | | | | | | | | | | | | | | | | | | | | | | | | | | | | | | | | | | | | | | | | | | | |
Distributions from net investment income: | | Class I
Shares | | | Select
Shares | | | Preferred
Shares | | | Capital
Shares | | | Administration
Shares | | | Premier
Shares | | | Service
Shares | | | Class A
Shares | | | Class C
Shares | | | Resource
Shares | | | Cash Management
Shares | |
Investor Money Market Fund | | | (4,766,356 | ) | | | — | | | | — | | | | — | | | | (1,433,408 | ) | | | — | | | | (313 | ) | | | (42,317 | ) | | | (163 | ) | | | (260 | ) | | | (5,843 | ) |
Investor Tax-Exempt Money Market Fund | | | (10,700,983 | ) | | | (13,702 | ) | | | (445 | ) | | | (13 | ) | | | (21,139 | ) | | | (10 | ) | | | (4,637 | ) | | | (29,472 | ) | | | (13 | ) | | | (11,905 | ) | | | (98 | ) |
| | | | | | | | | | | | | | | | | | | | | | | | | | | | | | | | | | | | | | | | | | | | |
Distributions from net realized gains: | | Class I
Shares | | | Select
Shares | | | Preferred
Shares | | | Capital
Shares | | | Administration
Shares | | | Premier
Shares | | | Service
Shares | | | Class A
Shares | | | Class C
Shares | | | Resource
Shares | | | Cash Management
Shares | |
Investor Money Market Fund | | | (7,495 | ) | | | — | | | | — | | | | — | | | | (2,653 | ) | | | — | | | | (1 | ) | | | (59 | ) | | | (1 | ) | | | (1 | ) | | | (13 | ) |
Investor Tax-Exempt Money Market Fund | | | (574 | ) | | | (2 | ) | | | 0 | | | | — | | | | (2 | ) | | | — | | | | (1 | ) | | | (2 | ) | | | 0 | | | | (2 | ) | | | 0 | |
| | (b) | | Prior fiscal year information has been revised to conform with current year presentation. Undistributed (distributions in excess of) net investment income was $13,291 and $(30) for the Investor Money Market Fund and Investor Tax-Exempt Money Market Fund, respectively as of August 31, 2018. |
| | |
| 24 | | The accompanying notes are an integral part of these financial statements. |
GOLDMAN SACHS INVESTOR MONEY MARKET FUND
Financial Highlights
Selected Data for a Share Outstanding Throughout Each Period
| | | | | | | | | | | | | | | | | | |
| | | | | Investor Money Market Fund | |
| | | | | Class I Shares | |
| | | | | Six Months Ended
February 28, 2019
(Unaudited) | | | Year Ended August 31, | | | Period Ended
August 31, 2016* | |
| | | | | 2018 | | | 2017 | |
| | Per Share Data: | | | | | | | | | | | | | | | | |
| | | | | |
| | Net asset value, beginning of period | | $ | 1.00 | | | $ | 1.00 | | | $ | 1.00 | | | $ | 1.00 | |
| | | | | |
| | Net investment income(a) | | | 0.015 | | | | 0.017 | | | | 0.009 | | | | 0.002 | |
| | | | | |
| | Net realized loss | | | (0.003 | ) | | | (0.001 | ) | | | — | (b) | | | — | (b) |
| | | | | | |
| | Total from investment operations | | | 0.012 | | | | 0.016 | | | | 0.009 | | | | 0.002 | |
| | | | | |
| | Distributions to shareholders from net investment income | | | (0.012 | ) | | | (0.016 | ) | | | (0.009 | ) | | | (0.002 | ) |
| | | | | |
| | Distributions to shareholders from net realized gains | | | — | (b) | | | — | (b) | | | — | (b) | | | — | (b) |
| | | | | | |
| | Total distributions(c) | | | (0.012 | ) | | | (0.016 | ) | | | (0.009 | ) | | | (0.002 | ) |
| | | | | |
| | Net asset value, end of period | | $ | 1.00 | | | $ | 1.00 | | | $ | 1.00 | | | $ | 1.00 | |
| | | | | |
| | Total return(d) | | | 1.16 | % | | | 1.61 | % | | | 0.87 | % | | | 0.24 | % |
| | | | | |
| | Net assets, end of period (in 000’s) | | $ | 739,456 | | | $ | 504,770 | | | $ | 216,443 | | | $ | 10,679 | |
| | | | | |
| | Ratio of net expenses to average net assets | | | 0.18 | %(e) | | | 0.18 | % | | | 0.18 | % | | | 0.18 | %(e) |
| | | | | |
| | Ratio of total expenses to average net assets | | | 0.20 | %(e) | | | 0.29 | % | | | 0.51 | % | | | 4.88 | %(e) |
| | | | | |
| | Ratio of net investment income to average net assets | | | 2.34 | %(e) | | | 1.68 | % | | | 0.90 | % | | | 0.41 | %(e) |
| | * | | Commenced operations on January 29, 2016. |
| | (a) | | Calculated based on the average shares outstanding methodology. |
| | (b) | | Amount is less than $0.0005 per share. |
| | (c) | | Distributions may not coincide with the current year net investment income or net realized gains as distributions may be paid from current or prior year earnings. |
| | (d) | | Assumes reinvestment of all distributions. Returns do not reflect the deduction of taxes that a shareholder would pay on Fund distributions. Total returns for periods less than one full year are not annualized. |
| | |
| The accompanying notes are an integral part of these financial statements. | | 25 |
GOLDMAN SACHS INVESTOR MONEY MARKET FUND
Financial Highlights(continued)
Selected Data for a Share Outstanding Throughout Each Period
| | | | | | | | | | | | | | | | | | |
| | | | | Investor Money Market Fund | |
| | | | | Administration Shares | |
| | | | | Six Months Ended
February 28, 2019
(Unaudited) | | | Year Ended August 31, | | | Period Ended
August 31, 2016* | |
| | | | | 2018 | | | 2017 | |
| | Per Share Data: | | | | | | | | | | | | | | | | |
| | | | | |
| | Net asset value, beginning of period | | $ | 1.00 | | | $ | 1.00 | | | $ | 1.00 | | | $ | 1.00 | |
| | | | | |
| | Net investment income(a) | | | 0.011 | | | | 0.014 | | | | 0.007 | | | | 0.001 | |
| | | | | |
| | Net realized loss | | | (0.001 | ) | | | (0.001 | ) | | | (0.001 | ) | | | — | (b) |
| | | | | | |
| | Total from investment operations | | | 0.010 | | | | 0.013 | | | | 0.006 | | | | 0.001 | |
| | | | | |
| | Distributions to shareholders from net investment income | | | (0.010 | ) | | | (0.013 | ) | | | (0.006 | ) | | | (0.001 | ) |
| | | | | |
| | Distributions to shareholders from net realized gains | | | — | (b) | | | — | (b) | | | — | (b) | | | — | (b) |
| | | | | | |
| | Total distributions(c) | | | (0.010 | ) | | | (0.013 | ) | | | (0.006 | ) | | | (0.001 | ) |
| | | | | |
| | Net asset value, end of period | | $ | 1.00 | | | $ | 1.00 | | | $ | 1.00 | | | $ | 1.00 | |
| | | | | |
| | Total return(d) | | | 1.04 | % | | | 1.36 | % | | | 0.62 | % | | | 0.09 | % |
| | | | | |
| | Net assets, end of period (in 000’s) | | $ | 112,942 | | | $ | 132,200 | | | $ | 100,351 | | | $ | 50 | |
| | | | | |
| | Ratio of net expenses to average net assets | | | 0.43 | %(e) | | | 0.43 | % | | | 0.43 | % | | | 0.43 | %(e) |
| | | | | |
| | Ratio of total expenses to average net assets | | | 0.45 | %(e) | | | 0.54 | % | | | 0.76 | % | | | 5.13 | %(e) |
| | | | | |
| | Ratio of net investment income to average net assets | | | 2.08 | %(e) | | | 1.37 | % | | | 0.72 | % | | | 0.16 | %(e) |
| | * | | Commenced operations on January 29, 2016. |
| | (a) | | Calculated based on the average shares outstanding methodology. |
| | (b) | | Amount is less than $0.0005 per share. |
| | (c) | | Distributions may not coincide with the current year net investment income or net realized gains as distributions may be paid from current or prior year earnings. |
| | (d) | | Assumes reinvestment of all distributions. Returns do not reflect the deduction of taxes that a shareholder would pay on Fund distributions. Total returns for periods less than one full year are not annualized. |
| | |
| 26 | | The accompanying notes are an integral part of these financial statements. |
GOLDMAN SACHS INVESTOR MONEY MARKET FUND
Financial Highlights(continued)
Selected Data for a Share Outstanding Throughout Each Period
| | | | | | | | | | | | | | | | | | |
| | | | | Investor Money Market Fund | |
| | | | | Service Shares | |
| | | | | Six Months Ended
February 28, 2019
(Unaudited) | | | Year Ended August 31, | | | Period Ended
August 31, 2016* | |
| | | | | 2018 | | | 2017 | |
| | Per Share Data: | | | | | | | | | | | | | | | | |
| | | | | |
| | Net asset value, beginning of period | | $ | 1.00 | | | $ | 1.00 | | | $ | 1.00 | | | $ | 1.00 | |
| | | | | |
| | Net investment income(a) | | | 0.007 | | | | 0.009 | | | | 0.004 | | | | — | (b) |
| | | | | | |
| | Net realized gain | | | 0.002 | | | | 0.002 | | | | — | (b) | | | — | (b) |
| | | | | | |
| | Total from investment operations | | | 0.009 | | | | 0.011 | | | | 0.004 | | | | — | (b) |
| | | | | | |
| | Distributions to shareholders from net investment income | | | (0.009 | ) | | | (0.011 | ) | | | (0.004 | ) | | | — | (b) |
| | | | | | |
| | Distributions to shareholders from net realized gains | | | — | (b) | | | — | (b) | | | — | (b) | | | — | (b) |
| | | | | | |
| | Total distributions(c) | | | (0.009 | ) | | | (0.011 | ) | | | (0.004 | ) | | | — | (b) |
| | | | | | |
| | Net asset value, end of period | | $ | 1.00 | | | $ | 1.00 | | | $ | 1.00 | | | $ | 1.00 | |
| | | | | |
| | Total return(d) | | | 0.91 | % | | | 1.11 | % | | | 0.39 | % | | | 0.05 | % |
| | | | | |
| | Net assets, end of period (in 000’s) | | $ | 11 | | | $ | 11 | | | $ | 50 | | | $ | 50 | |
| | | | | |
| | Ratio of net expenses to average net assets | | | 0.67 | %(e) | | | 0.68 | % | | | 0.68 | % | | | 0.61 | %(e) |
| | | | | |
| | Ratio of total expenses to average net assets | | | 0.70 | %(e) | | | 0.79 | % | | | 1.01 | % | | | 5.38 | %(e) |
| | | | | |
| | Ratio of net investment income to average net assets | | | 1.85 | %(e) | | | 0.92 | % | | | 0.36 | % | | | 0.02 | %(e) |
| | * | | Commenced operations on May 31, 2016. |
| | (a) | | Calculated based on the average shares outstanding methodology. |
| | (b) | | Amount is less than $0.0005 per share. |
| | (c) | | Distributions may not coincide with the current year net investment income or net realized gains as distributions may be paid from current or prior year earnings. |
| | (d) | | Assumes reinvestment of all distributions. Returns do not reflect the deduction of taxes that a shareholder would pay on Fund distributions. Total returns for periods less than one full year are not annualized. |
| | |
| The accompanying notes are an integral part of these financial statements. | | 27 |
GOLDMAN SACHS INVESTOR MONEY MARKET FUND
Financial Highlights(continued)
Selected Data for a Share Outstanding Throughout Each Period
| | | | | | | | | | | | | | | | | | |
| | | | | Investor Money Market Fund | |
| | | | | Resource Shares | |
| | | | | Six Months Ended
February 28, 2019
(Unaudited) | | | Year Ended August 31, | | | Period Ended
August 31, 2016* | |
| | | | | 2018 | | | 2017 | |
| | Per Share Data: | | | | | | | | | | | | | | | | |
| | | | | |
| | Net asset value, beginning of period | | $ | 1.00 | | | $ | 1.00 | | | $ | 1.00 | | | $ | 1.00 | |
| | | | | |
| | Net investment income(a) | | | 0.006 | | | | 0.008 | | | | 0.002 | | | | — | (b) |
| | | | | | |
| | Net realized gain | | | 0.002 | | | | 0.002 | | | | 0.001 | | | | — | (b) |
| | | | | | |
| | Total from investment operations | | | 0.008 | | | | 0.010 | | | | 0.003 | | | | — | (b) |
| | | | | | |
| | Distributions to shareholders from net investment income | | | (0.008 | ) | | | (0.010 | ) | | | (0.003 | ) | | | — | (b) |
| | | | | | |
| | Distributions to shareholders from net realized gains | | | — | (b) | | | — | (b) | | | — | (b) | | | — | (b) |
| | | | | | |
| | Total distributions(c) | | | (0.008 | ) | | | (0.010 | ) | | | (0.003 | ) | | | — | (b) |
| | | | | | |
| | Net asset value, end of period | | $ | 1.00 | | | $ | 1.00 | | | $ | 1.00 | | | $ | 1.00 | |
| | | | | |
| | Total return(d) | | | 0.84 | % | | | 0.96 | % | | | 0.26 | % | | | 0.05 | % |
| | | | | |
| | Net assets, end of period (in 000’s) | | $ | 10 | | | $ | 11 | | | $ | 50 | | | $ | 50 | |
| | | | | |
| | Ratio of net expenses to average net assets | | | 0.81 | %(e) | | | 0.83 | % | | | 0.82 | % | | | 0.62 | %(e) |
| | | | | |
| | Ratio of total expenses to average net assets | | | 0.85 | %(e) | | | 0.94 | % | | | 1.16 | % | | | 5.53 | %(e) |
| | | | | |
| | Ratio of net investment income to average net assets | | | 1.71 | %(e) | | | 0.77 | % | | | 0.22 | % | | | 0.01 | %(e) |
| | * | | Commenced operations on May 31, 2016. |
| | (a) | | Calculated based on the average shares outstanding methodology. |
| | (b) | | Amount is less than $0.0005 per share. |
| | (c) | | Distributions may not coincide with the current year net investment income or net realized gains as distributions may be paid from current or prior year earnings. |
| | (d) | | Assumes reinvestment of all distributions. Returns do not reflect the deduction of taxes that a shareholder would pay on Fund distributions. Total returns for periods less than one full year are not annualized. |
| | |
| 28 | | The accompanying notes are an integral part of these financial statements. |
GOLDMAN SACHS INVESTOR MONEY MARKET FUND
Financial Highlights(continued)
Selected Data for a Share Outstanding Throughout Each Period
| | | | | | | | | | | | | | | | | | |
| | | | | Investor Money Market Fund
| |
| | | | | Cash Management Shares | |
| | | | | Six Months Ended
February 28, 2019
(Unaudited) | | | Year Ended August 31, | | | Period Ended
August 31, 2016* | |
| | | | | 2018 | | | 2017 | |
| | Per Share Data: | | | | | | | | | | | | | | | | |
| | | | | |
| | Net asset value, beginning of period | | $ | 1.00 | | | $ | 1.00 | | | $ | 1.00 | | | $ | 1.00 | |
| | | | | |
| | Net investment income(a) | | | 0.009 | | | | 0.009 | | | | 0.002 | | | | — | (b) |
| | | | | | |
| | Net realized loss | | | (0.001 | ) | | | (0.001 | ) | | | (0.001 | ) | | | — | (b) |
| | | | | | |
| | Total from investment operations | | | 0.008 | | | | 0.008 | | | | 0.001 | | | | — | (b) |
| | | | | | |
| | Distributions to shareholders from net investment income | | | (0.008 | ) | | | (0.008 | ) | | | (0.001 | ) | | | — | (b) |
| | | | | | |
| | Distributions to shareholders from net realized gains | | | — | (b) | | | — | (b) | | | — | (b) | | | — | (b) |
| | | | | | |
| | Total distributions(c) | | | (0.008 | ) | | | (0.008 | ) | | | (0.001 | ) | | | — | (b) |
| | | | | | |
| | Net asset value, end of period | | $ | 1.00 | | | $ | 1.00 | | | $ | 1.00 | | | $ | 1.00 | |
| | | | | |
| | Total return(d) | | | 0.76 | % | | | 0.81 | % | | | 0.15 | % | | | 0.05 | % |
| | | | | |
| | Net assets, end of period (in 000’s) | | $ | 3,004 | | | $ | 927 | | | $ | 91 | | | $ | 50 | |
| | | | | |
| | Ratio of net expenses to average net assets | | | 0.98 | %(e) | | | 0.98 | % | | | 0.95 | % | | | 0.62 | %(e) |
| | | | | |
| | Ratio of total expenses to average net assets | | | 1.00 | %(e) | | | 1.09 | % | | | 1.31 | % | | | 5.68 | %(e) |
| | | | | |
| | Ratio of net investment income to average net assets | | | 1.60 | %(e) | | | 0.88 | % | | | 0.18 | % | | | 0.01 | %(e) |
| | * | | Commenced operations on May 31, 2016. |
| | (a) | | Calculated based on the average shares outstanding methodology. |
| | (b) | | Amount is less than $0.0005 per share. |
| | (c) | | Distributions may not coincide with the current year net investment income or net realized gains as distributions may be paid from current or prior year earnings. |
| | (d) | | Assumes reinvestment of all distributions. Returns do not reflect the deduction of taxes that a shareholder would pay on Fund distributions. Total returns for periods less than one full year are not annualized. |
| | |
| The accompanying notes are an integral part of these financial statements. | | 29 |
GOLDMAN SACHS INVESTOR MONEY MARKET FUND
Financial Highlights(continued)
Selected Data for a Share Outstanding Throughout Each Period
| | | | | | | | | | | | | | | | | | |
| | | | | Investor Money Market Fund
| |
| | | | | Class A Shares | |
| | | | | Six Months Ended
February 28, 2019
(Unaudited) | | | Year Ended August 31, | | | Period Ended
August 31, 2016* | |
| | | | | 2018 | | | 2017 | |
| | Per Share Data: | | | | | | | | | | | | | | | | |
| | | | | |
| | Net asset value, beginning of period | | $ | 1.00 | | | $ | 1.00 | | | $ | 1.00 | | | $ | 1.00 | |
| | | | | |
| | Net investment income(a) | | | 0.017 | | | | 0.016 | | | | 0.008 | | | | 0.001 | |
| | | | | |
| | Net realized loss | | | (0.007 | ) | | | (0.003 | ) | | | (0.002 | ) | | | — | (b) |
| | | | | | |
| | Total from investment operations | | | 0.010 | | | | 0.013 | | | | 0.006 | | | | 0.001 | |
| | | | | |
| | Distributions to shareholders from net investment income | | | (0.010 | ) | | | (0.013 | ) | | | (0.006 | ) | | | (0.001 | ) |
| | | | | |
| | Distributions to shareholders from net realized gains | | | — | (b) | | | — | (b) | | | — | (b) | | | — | (b) |
| | | | | | |
| | Total distributions(c) | | | (0.010 | ) | | | (0.013 | ) | | | (0.006 | ) | | | (0.001 | ) |
| | | | | |
| | Net asset value, end of period | | $ | 1.00 | | | $ | 1.00 | | | $ | 1.00 | | | $ | 1.00 | |
| | | | | |
| | Total return(d) | | | 1.04 | % | | | 1.36 | % | | | 0.62 | % | | | 0.09 | % |
| | | | | |
| | Net assets, end of period (in 000’s) | | $ | 33,553 | | | $ | 7,933 | | | $ | 563 | | | $ | 50 | |
| | | | | |
| | Ratio of net expenses to average net assets | | | 0.43 | %(e) | | | 0.43 | % | | | 0.43 | % | | | 0.43 | %(e) |
| | | | | |
| | Ratio of total expenses to average net assets | | | 0.45 | %(e) | | | 0.54 | % | | | 0.76 | % | | | 5.13 | %(e) |
| | | | | |
| | Ratio of net investment income to average net assets | | | 2.14 | %(e) | | | 1.59 | % | | | 0.81 | % | | | 0.16 | %(e) |
| | * | | Commenced operations on January 29, 2016. |
| | (a) | | Calculated based on the average shares outstanding methodology. |
| | (b) | | Amount is less than $0.0005 per share. |
| | (c) | | Distributions may not coincide with the current year net investment income or net realized gains as distributions may be paid from current or prior year earnings. |
| | (d) | | Assumes reinvestment of all distributions. Returns do not reflect the deduction of taxes that a shareholder would pay on Fund distributions. Total returns for periods less than one full year are not annualized. |
| | |
| 30 | | The accompanying notes are an integral part of these financial statements. |
GOLDMAN SACHS INVESTOR MONEY MARKET FUND
Financial Highlights(continued)
Selected Data for a Share Outstanding Throughout Each Period
| | | | | | | | | | | | | | | | | | |
| | | | | Investor Money Market Fund
| |
| | | | | Class C Shares | |
| | | | | Six Months Ended
February 28, 2019
(Unaudited) | | | Year Ended August 31, | | | Period Ended
August 31, 2016* | |
| | | | | 2018 | | | 2017 | |
| | Per Share Data: | | | | | | | | | | | | | | | | |
| | | | | |
| | Net asset value, beginning of period | | $ | 1.00 | | | $ | 1.00 | | | $ | 1.00 | | | $ | 1.00 | |
| | | | | |
| | Net investment income(a) | | | 0.005 | | | | 0.004 | | | | — | (b) | | | — | (b) |
| | | | | | |
| | Net realized gain | | | 0.002 | | | | 0.002 | | | | 0.001 | | | | — | (b) |
| | | | | | |
| | Total from investment operations | | | 0.007 | | | | 0.006 | | | | 0.001 | | | | — | (b) |
| | | | | | |
| | Distributions to shareholders from net investment income | | | (0.007 | ) | | | (0.006 | ) | | | (0.001 | ) | | | — | (b) |
| | | | | | |
| | Distributions to shareholders from net realized gains | | | — | (b) | | | — | (b) | | | — | (b) | | | — | (b) |
| | | | | | |
| | Total distributions(c) | | | (0.007 | ) | | | (0.006 | ) | | | (0.001 | ) | | | — | (b) |
| | | | | | |
| | Net asset value, end of period | | $ | 1.00 | | | $ | 1.00 | | | $ | 1.00 | | | $ | 1.00 | |
| | | | | |
| | Total return(d) | | | 0.66 | % | | | 0.60 | % | | | 0.06 | % | | | 0.05 | % |
| | | | | |
| | Net assets, end of period (in 000’s) | | $ | 10 | | | $ | 10 | | | $ | 64 | | | $ | 50 | |
| | | | | |
| | Ratio of net expenses to average net assets | | | 1.18 | %(e) | | | 1.18 | % | | | 1.02 | % | | | 0.58 | %(e) |
| | | | | |
| | Ratio of total expenses to average net assets | | | 1.20 | %(e) | | | 1.29 | % | | | 1.51 | % | | | 5.88 | %(e) |
| | | | | |
| | Ratio of net investment income to average net assets | | | 1.34 | %(e) | | | 0.40 | % | | | 0.04 | % | | | 0.01 | %(e) |
| | * | | Commenced operations on January 29, 2016. |
| | (a) | | Calculated based on the average shares outstanding methodology. |
| | (b) | | Amount is less than $0.0005 per share. |
| | (c) | | Distributions may not coincide with the current year net investment income or net realized gains as distributions may be paid from current or prior year earnings. |
| | (d) | | Assumes reinvestment of all distributions. Returns do not reflect the deduction of taxes that a shareholder would pay on Fund distributions. Total returns for periods less than one full year are not annualized. |
| | |
| The accompanying notes are an integral part of these financial statements. | | 31 |
GOLDMAN SACHS INVESTOR TAX-EXEMPT MONEY MARKET FUND
Financial Highlights(continued)
Selected Data for a Share Outstanding Throughout Each Period
| | | | | | | | | | | | | | | | | | | | | | | | | | |
| | | | | Investor Tax-Exempt Money Market Fund | |
| | | | | Class I Shares | |
| | | | | Six Months Ended
February 28, 2019
(Unaudited) | | | Year Ended August 31, | |
| | | | | 2018 | | | 2017 | | | 2016 | | | 2015 | | | 2014 | |
| | Per Share Data: | | | | | | | | | | | | | | | | | | | | | | | | |
| | | | | | | |
| | Net asset value, beginning of period | | $ | 1.00 | | | $ | 1.00 | | | $ | 1.00 | | | $ | 1.00 | | | $ | 1.00 | | | $ | 1.00 | |
| | | | | | | |
| | Net investment income(a) | | | 0.007 | | | | 0.010 | | | | 0.006 | | | | 0.001 | | | | — | (b) | | | — | (b) |
| | | | | | | | |
| | Net realized gain | | | — | (b) | | | — | (b) | | | 0.001 | | | | — | (b) | | | — | (b) | | | — | (b) |
| | | | | | | | |
| | Total from investment operations | | | 0.007 | | | | 0.010 | | | | 0.007 | | | | 0.001 | | | | — | (b) | | | — | (b) |
| | | | | | | | |
| | Distributions to shareholders from net investment income | | | (0.007 | ) | | | (0.010 | ) | | | (0.006 | ) | | | (0.001 | ) | | | — | (b) | | | — | (b) |
| | | | | | | | |
| | Distributions to shareholders from net realized gains | | | — | | | | — | (b) | | | (0.001 | ) | | | — | (b) | | | — | (b) | | | — | (b) |
| | | | | | | | |
| | Total distributions(c) | | | (0.007 | ) | | | (0.010 | ) | | | (0.007 | ) | | | (0.001 | ) | | | — | (b) | | | — | (b) |
| | | | | | | | |
| | Net asset value, end of period | | $ | 1.00 | | | $ | 1.00 | | | $ | 1.00 | | | $ | 1.00 | | | $ | 1.00 | | | $ | 1.00 | |
| | | | | | | |
| | Total return(d) | | | 0.70 | % | | | 1.03 | % | | | 0.63 | % | | | 0.11 | % | | | 0.01 | % | | | 0.01 | % |
| | | | | | | |
| | Net assets, end of period (in 000’s) | | $ | 1,274,472 | | | $ | 1,052,229 | | | $ | 924,326 | | | $ | 1,387,634 | | | $ | 4,955,885 | | | $ | 5,225,304 | |
| | | | | | | |
| | Ratio of net expenses to average net assets | | | 0.18 | %(e) | | | 0.18 | % | | | 0.18 | % | | | 0.11 | % | | | 0.08 | % | | | 0.10 | % |
| | | | | | | |
| | Ratio of total expenses to average net assets | | | 0.21 | %(e) | | | 0.22 | % | | | 0.29 | % | | | 0.24 | % | | | 0.23 | % | | | 0.23 | % |
| | | | | | | |
| | Ratio of net investment income to average net assets | | | 1.40 | %(e) | | | 1.02 | % | | | 0.57 | % | | | 0.07 | % | | | 0.01 | % | | | 0.01 | % |
| | (a) | | Calculated based on the average shares outstanding methodology. |
| | (b) | | Amount is less than $0.0005 per share. |
| | (c) | | Distributions may not coincide with the current year net investment income or net realized gains as distributions may be paid from current or prior year earnings. |
| | (d) | | Assumes reinvestment of all distributions. Returns do not reflect the deduction of taxes that a shareholder would pay on Fund distributions. Total returns for periods less than one full year are not annualized. |
| | |
| 32 | | The accompanying notes are an integral part of these financial statements. |
GOLDMAN SACHS INVESTOR TAX-EXEMPT MONEY MARKET FUND
Financial Highlights(continued)
Selected Data for a Share Outstanding Throughout Each Period
| | | | | | | | | | | | | | | | | | | | | | | | | | |
| | | | | Investor Tax-Exempt Money Market Fund | |
| | | | | Select Shares | |
| | | | | Six Months Ended
February 28, 2019
(Unaudited) | | | Year Ended August 31, | |
| | | | | 2018 | | | 2017 | | | 2016 | | | 2015 | | | 2014 | |
| | Per Share Data: | | | | | | | | | | | | | | | | | | | | | | | | |
| | | | | | | |
| | Net asset value, beginning of period | | $ | 1.00 | | | $ | 1.00 | | | $ | 1.00 | | | $ | 1.00 | | | $ | 1.00 | | | $ | 1.00 | |
| | | | | | | |
| | Net investment income(a) | | | — | (b) | | | 0.009 | | | | 0.006 | | | | 0.001 | | | | — | (b) | | | — | (b) |
| | | | | | | | |
| | Net realized gain | | | 0.007 | | | | 0.001 | | | | — | (b) | | | — | (b) | | | — | (b) | | | — | (b) |
| | | | | | | | |
| | Total from investment operations | | | 0.007 | | | | 0.010 | | | | 0.006 | | | | 0.001 | | | | — | (b) | | | — | (b) |
| | | | | | | | |
| | Distributions to shareholders from net investment income | | | (0.007 | ) | | | (0.010 | ) | | | (0.005 | ) | | | (0.001 | ) | | | — | (b) | | | — | (b) |
| | | | | | | | |
| | Distributions to shareholders from net realized gains | | | — | | | | — | (b) | | | (0.001 | ) | | | — | (b) | | | — | (b) | | | — | (b) |
| | | | | | | | |
| | Total distributions(c) | | | (0.007 | ) | | | (0.010 | ) | | | (0.006 | ) | | | (0.001 | ) | | | — | (b) | | | — | (b) |
| | | | | | | | |
| | Net asset value, end of period | | $ | 1.00 | | | $ | 1.00 | | | $ | 1.00 | | | $ | 1.00 | | | $ | 1.00 | | | $ | 1.00 | |
| | | | | | | |
| | Total return(d) | | | 0.68 | % | | | 1.00 | % | | | 0.60 | % | | | 0.09 | % | | | 0.01 | % | | | 0.01 | % |
| | | | | | | |
| | Net assets, end of period (in 000’s) | | $ | 3 | | | $ | 3 | | | $ | 5,401 | | | $ | — | | | $ | 193,506 | | | $ | 267,104 | |
| | | | | | | |
| | Ratio of net expenses to average net assets | | | 0.18 | %(e) | | | 0.21 | % | | | 0.21 | % | | | 0.11 | % | | | 0.08 | % | | | 0.10 | % |
| | | | | | | |
| | Ratio of total expenses to average net assets | | | 0.24 | %(e) | | | 0.25 | % | | | 0.32 | % | | | 0.27 | % | | | 0.26 | % | | | 0.26 | % |
| | | | | | | |
| | Ratio of net investment income to average net assets | | | 1.44 | %(e) | | | 0.95 | % | | | 0.62 | % | | | 0.01 | % | | | 0.01 | % | | | 0.01 | % |
| | (a) | | Calculated based on the average shares outstanding methodology. |
| | (b) | | Amount is less than $0.0005 per share. |
| | (c) | | Distributions may not coincide with the current year net investment income or net realized gains as distributions may be paid from current or prior year earnings. |
| | (d) | | Assumes reinvestment of all distributions. Returns do not reflect the deduction of taxes that a shareholder would pay on Fund distributions. Total returns for periods less than one full year are not annualized. |
| | |
| The accompanying notes are an integral part of these financial statements. | | 33 |
GOLDMAN SACHS INVESTOR TAX-EXEMPT MONEY MARKET FUND
Financial Highlights(continued)
Selected Data for a Share Outstanding Throughout Each Period
| | | | | | | | | | | | | | | | | | | | | | | | | | |
| | | | | Investor Tax-Exempt Money Market Fund | |
| | | | | Preferred Shares | |
| | | | | Six Months Ended
February 28, 2019
(Unaudited) | | | Year Ended August 31, | |
| | | | | 2018 | | | 2017 | | | 2016 | | | 2015 | | | 2014 | |
| | Per Share Data: | | | | | | | | | | | | | | | | | | | | | | | | |
| | | | | | | |
| | Net asset value, beginning of period | | $ | 1.00 | | | $ | 1.00 | | | $ | 1.00 | | | $ | 1.00 | | | $ | 1.00 | | | $ | 1.00 | |
| | | | | | | |
| | Net investment income(a) | | | 0.007 | | | | 0.009 | | | | 0.005 | | | | 0.001 | | | | — | (b) | | | — | (b) |
| | | | | | | | |
| | Net realized gain (loss) | | | (0.001 | ) | | | — | (b) | | | 0.001 | | | | — | (b) | | | — | (b) | | | — | (b) |
| | | | | | | | |
| | Total from investment operations | | | 0.006 | | | | 0.009 | | | | 0.006 | | | | 0.001 | | | | — | (b) | | | — | (b) |
| | | | | | | | |
| | Distributions to shareholders from net investment income | | | (0.006 | ) | | | (0.009 | ) | | | (0.005 | ) | | | (0.001 | ) | | | — | (b) | | | — | (b) |
| | | | | | | | |
| | Distributions to shareholders from net realized gains | | | — | | | | — | (b) | | | (0.001 | ) | | | — | (b) | | | — | (b) | | | — | (b) |
| | | | | | | | |
| | Total distributions(c) | | | (0.006 | ) | | | (0.009 | ) | | | (0.006 | ) | | | (0.001 | ) | | | — | (b) | | | — | (b) |
| | | | | | | | |
| | Net asset value, end of period | | $ | 1.00 | | | $ | 1.00 | | | $ | 1.00 | | | $ | 1.00 | | | $ | 1.00 | | | $ | 1.00 | |
| | | | | | | |
| | Total return(d) | | | 0.65 | % | | | 0.93 | % | | | 0.53 | % | | | 0.06 | % | | | 0.01 | % | | | 0.01 | % |
| | | | | | | |
| | Net assets, end of period (in 000’s) | | $ | 58 | | | $ | 68 | | | $ | 37 | | | $ | 46 | | | $ | 6,914 | | | $ | 15,635 | |
| | | | | | | |
| | Ratio of net expenses to average net assets | | | 0.28 | %(e) | | | 0.28 | % | | | 0.28 | % | | | 0.13 | % | | | 0.08 | % | | | 0.10 | % |
| | | | | | | |
| | Ratio of total expenses to average net assets | | | 0.31 | %(e) | | | 0.32 | % | | | 0.39 | % | | | 0.34 | % | | | 0.33 | % | | | 0.33 | % |
| | | | | | | |
| | Ratio of net investment income to average net assets | | | 1.31 | %(e) | | | 0.93 | % | | | 0.48 | % | | | 0.03 | % | | | 0.01 | % | | | 0.01 | % |
| | (a) | | Calculated based on the average shares outstanding methodology. |
| | (b) | | Amount is less than $0.0005 per share. |
| | (c) | | Distributions may not coincide with the current year net investment income or net realized gains as distributions may be paid from current or prior year earnings. |
| | (d) | | Assumes reinvestment of all distributions. Returns do not reflect the deduction of taxes that a shareholder would pay on Fund distributions. Total returns for periods less than one full year are not annualized. |
| | |
| 34 | | The accompanying notes are an integral part of these financial statements. |
GOLDMAN SACHS INVESTOR TAX-EXEMPT MONEY MARKET FUND
Financial Highlights(continued)
Selected Data for a Share Outstanding Throughout Each Period
| | | | | | | | | | | | | | | | | | | | | | | | | | |
| | | | | Investor Tax-Exempt Money Market Fund | |
| | | | | Capital Shares | |
| | | | | Six Months Ended
February 28, 2019
(Unaudited) | | | Year Ended August 31, | |
| | | | | 2018 | | | 2017 | | | 2016 | | | 2015 | | | 2014 | |
| | Per Share Data: | | | | | | | | | | | | | | | | | | | | | | | | |
| | | | | | | |
| | Net asset value, beginning of period | | $ | 1.00 | | | $ | 1.00 | | | $ | 1.00 | | | $ | 1.00 | | | $ | 1.00 | | | $ | 1.00 | |
| | | | | | | |
| | Net investment income(a) | | | 0.008 | | | | 0.013 | | | | 0.003 | | | | — | (b) | | | — | (b) | | | — | (b) |
| | | | | | | | |
| | Net realized gain | | | — | (b) | | | — | (b) | | | 0.002 | | | | — | (b) | | | — | (b) | | | — | (b) |
| | | | | | | | |
| | Total from investment operations | | | 0.008 | | | | 0.013 | | | | 0.005 | | | | — | (b) | | | — | (b) | | | — | (b) |
| | | | | | | | |
| | Distributions to shareholders from net investment income | | | (0.008 | ) | | | (0.013 | ) | | | (0.004 | ) | | | — | (b) | | | — | (b) | | | — | (b) |
| | | | | | | | |
| | Distributions to shareholders from net realized gains | | | — | | | | — | (b) | | | (0.001 | ) | | | — | (b) | | | — | (b) | | | — | (b) |
| | | | | | | | |
| | Total distributions(c) | | | (0.008 | ) | | | (0.013 | ) | | | (0.005 | ) | | | — | (b) | | | — | (b) | | | — | (b) |
| | | | | | | | |
| | Net asset value, end of period | | $ | 1.00 | | | $ | 1.00 | | | $ | 1.00 | | | $ | 1.00 | | | $ | 1.00 | | | $ | 1.00 | |
| | | | | | | |
| | Total return(d) | | | 0.62 | % | | | 0.88 | % | | | 0.48 | % | | | 0.04 | % | | | 0.01 | % | | | 0.01 | % |
| | | | | | | |
| | Net assets, end of period (in 000’s) | | $ | 1 | | | $ | 1 | | | $ | 1 | | | $ | 886 | | | $ | 22,788 | | | $ | 5,728 | |
| | | | | | | |
| | Ratio of net expenses to average net assets | | | 0.18 | %(e) | | | 0.18 | % | | | 0.33 | % | | | 0.19 | % | | | 0.08 | % | | | 0.10 | % |
| | | | | | | |
| | Ratio of total expenses to average net assets | | | 0.36 | %(e) | | | 0.37 | % | | | 0.44 | % | | | 0.39 | % | | | 0.38 | % | | | 0.38 | % |
| | | | | | | |
| | Ratio of net investment income to average net assets | | | 1.68 | %(e) | | | 1.31 | % | | | 0.30 | % | | | 0.04 | % | | | 0.01 | % | | | 0.01 | % |
| | (a) | | Calculated based on the average shares outstanding methodology. |
| | (b) | | Amount is less than $0.0005 per share. |
| | (c) | | Distributions may not coincide with the current year net investment income or net realized gains as distributions may be paid from current or prior year earnings. |
| | (d) | | Assumes reinvestment of all distributions. Returns do not reflect the deduction of taxes that a shareholder would pay on Fund distributions. Total returns for periods less than one full year are not annualized. |
| | |
| The accompanying notes are an integral part of these financial statements. | | 35 |
GOLDMAN SACHS INVESTOR TAX-EXEMPT MONEY MARKET FUND
Financial Highlights(continued)
Selected Data for a Share Outstanding Throughout Each Period
| | | | | | | | | | | | | | | | | | | | | | | | | | |
| | | | | Investor Tax-Exempt Money Market Fund | |
| | | | | Administration Shares | |
| | | | | Six Months Ended
February 28, 2019
(Unaudited) | | | Year Ended August 31, | |
| | | | | 2018 | | | 2017 | | | 2016 | | | 2015 | | | 2014 | |
| | Per Share Data: | | | | | | | | | | | | | | | | | | | | | | | | |
| | | | | | | |
| | Net asset value, beginning of period | | $ | 1.00 | | | $ | 1.00 | | | $ | 1.00 | | | $ | 1.00 | | | $ | 1.00 | | | $ | 1.00 | |
| | | | | | | |
| | Net investment income(a) | | | — | (b) | | | 0.008 | | | | 0.003 | | | | — | (b) | | | — | (b) | | | — | (b) |
| | | | | | | | |
| | Net realized gain | | | 0.006 | | | | — | (b) | | | 0.001 | | | | — | (b) | | | — | (b) | | | — | (b) |
| | | | | | | | |
| | Total from investment operations | | | 0.006 | | | | 0.008 | | | | 0.004 | | | | — | (b) | | | — | (b) | | | — | (b) |
| | | | | | | | |
| | Distributions to shareholders from net investment income | | | (0.006 | ) | | | (0.008 | ) | | | (0.003 | ) | | | — | (b) | | | — | (b) | | | — | (b) |
| | | | | | | | |
| | Distributions to shareholders from net realized gains | | | — | | | | — | (b) | | | (0.001 | ) | | | — | (b) | | | — | (b) | | | — | (b) |
| | | | | | | | |
| | Total distributions(c) | | | (0.006 | ) | | | (0.008 | ) | | | (0.004 | ) | | | — | (b) | | | — | (b) | | | — | (b) |
| | | | | | | | |
| | Net asset value, end of period | | $ | 1.00 | | | $ | 1.00 | | | $ | 1.00 | | | $ | 1.00 | | | $ | 1.00 | | | $ | 1.00 | |
| | | | | | | |
| | Total return(d) | | | 0.57 | % | | | 0.78 | % | | | 0.38 | % | | | 0.01 | % | | | 0.01 | % | | | 0.01 | % |
| | | | | | | |
| | Net assets, end of period (in 000’s) | | $ | 797 | | | $ | 2 | | | $ | 3,575 | | | $ | 13,041 | | | $ | 107,676 | | | $ | 155,732 | |
| | | | | | | |
| | Ratio of net expenses to average net assets | | | 0.43 | %(e) | | | 0.43 | % | | | 0.43 | % | | | 0.18 | % | | | 0.08 | % | | | 0.10 | % |
| | | | | | | |
| | Ratio of total expenses to average net assets | | | 0.46 | %(e) | | | 0.47 | % | | | 0.54 | % | | | 0.49 | % | | | 0.48 | % | | | 0.48 | % |
| | | | | | | |
| | Ratio of net investment income to average net assets | | | 1.25 | %(e) | | | 0.75 | % | | | 0.30 | % | | | 0.01 | % | | | 0.01 | % | | | 0.01 | % |
| | (a) | | Calculated based on the average shares outstanding methodology. |
| | (b) | | Amount is less than $0.0005 per share. |
| | (c) | | Distributions may not coincide with the current year net investment income or net realized gains as distributions may be paid from current or prior year earnings. |
| | (d) | | Assumes reinvestment of all distributions. Returns do not reflect the deduction of taxes that a shareholder would pay on Fund distributions. Total returns for periods less than one full year are not annualized. |
| | |
| 36 | | The accompanying notes are an integral part of these financial statements. |
GOLDMAN SACHS INVESTOR TAX-EXEMPT MONEY MARKET FUND
Financial Highlights(continued)
Selected Data for a Share Outstanding Throughout Each Period
| | | | | | | | | | | | | | | | | | | | | | | | | | |
| | | | | Investor Tax-Exempt Money Market Fund | |
| | | | | Premier Shares | |
| | | | | Six Months Ended
February 28, 2019
(Unaudited) | | | Year Ended August 31, | |
| | | | | 2018 | | | 2017 | | | 2016 | | | 2015 | | | 2014 | |
| | Per Share Data: | | | | | | | | | | | | | | | | | | | | | | | | |
| | | | | | | |
| | Net asset value, beginning of period | | $ | 1.00 | | | $ | 1.00 | | | $ | 1.00 | | | $ | 1.00 | | | $ | 1.00 | | | $ | 1.00 | |
| | | | | | | |
| | Net investment income(a) | | | 0.007 | | | | 0.010 | | | | 0.004 | | | | — | (b) | | | — | (b) | | | — | (b) |
| | | | | | | | |
| | Net realized gain (loss) | | | — | | | | — | (b) | | | (0.001 | ) | | | — | (b) | | | — | (b) | | | — | (b) |
| | | | | | | | |
| | Total from investment operations | | | 0.007 | | | | 0.010 | | | | 0.003 | | | | — | (b) | | | — | (b) | | | — | (b) |
| | | | | | | | |
| | Distributions to shareholders from net investment income | | | (0.007 | ) | | | (0.010 | ) | | | (0.002 | ) | | | — | (b) | | | — | (b) | | | — | (b) |
| | | | | | | | |
| | Distributions to shareholders from net realized gains | | | — | | | | — | (b) | | | (0.001 | ) | | | — | (b) | | | — | (b) | | | — | (b) |
| | | | | | | | |
| | Total distributions(c) | | | (0.007 | ) | | | (0.010 | ) | | | (0.003 | ) | | | — | (b) | | | — | (b) | | | — | (b) |
| | | | | | | | |
| | Net asset value, end of period | | $ | 1.00 | | | $ | 1.00 | | | $ | 1.00 | | | $ | 1.00 | | | $ | 1.00 | | | $ | 1.00 | |
| | | | | | | |
| | Total return(d) | | | 0.52 | % | | | 0.68 | % | | | 0.29 | % | | | 0.01 | % | | | 0.01 | % | | | 0.01 | % |
| | | | | | | |
| | Net assets, end of period (in 000’s) | | $ | 1 | | | $ | 1 | | | $ | 1 | | | $ | 1 | | | $ | 1 | | | $ | 1,858 | |
| | | | | | | |
| | Ratio of net expenses to average net assets | | | 0.54 | %(e) | | | 0.54 | % | | | 0.47 | % | | | 0.12 | % | | | 0.08 | % | | | 0.10 | % |
| | | | | | | |
| | Ratio of total expenses to average net assets | | | 0.56 | %(e) | | | 0.57 | % | | | 0.64 | % | | | 0.59 | % | | | 0.58 | % | | | 0.58 | % |
| | | | | | | |
| | Ratio of net investment income to average net assets | | | 1.31 | %(e) | | | 0.95 | % | | | 0.43 | % | | | 0.37 | % | | | 0.01 | % | | | 0.01 | % |
| | (a) | | Calculated based on the average shares outstanding methodology. |
| | (b) | | Amount is less than $0.0005 per share. |
| | (c) | | Distributions may not coincide with the current year net investment income or net realized gains as distributions may be paid from current or prior year earnings. |
| | (d) | | Assumes reinvestment of all distributions. Returns do not reflect the deduction of taxes that a shareholder would pay on Fund distributions. Total returns for periods less than one full year are not annualized. |
| | |
| The accompanying notes are an integral part of these financial statements. | | 37 |
GOLDMAN SACHS INVESTOR TAX-EXEMPT MONEY MARKET FUND
Financial Highlights(continued)
Selected Data for a Share Outstanding Throughout Each Period
| | | | | | | | | | | | | | | | | | | | | | | | | | |
| | | | | Investor Tax-Exempt Money Market Fund | |
| | | | | Service Shares | |
| | | | | Six Months Ended
February 28, 2019
(Unaudited) | | | Year Ended August 31, | |
| | | | | 2018 | | | 2017 | | | 2016 | | | 2015 | | | 2014 | |
| | Per Share Data: | | | | | | | | | | | | | | | | | | | | | | | | |
| | | | | | | |
| | Net asset value, beginning of period | | $ | 1.00 | | | $ | 1.00 | | | $ | 1.00 | | | $ | 1.00 | | | $ | 1.00 | | | $ | 1.00 | |
| | | | | | | |
| | Net investment income(a) | | | 0.004 | | | | 0.005 | | | | — | (b) | | | — | (b) | | | — | (b) | | | — | (b) |
| | | | | | | | |
| | Net realized gain | | | — | (b) | | | — | (b) | | | 0.002 | | | | — | (b) | | | — | (b) | | | — | (b) |
| | | | | | | | |
| | Total from investment operations | | | 0.004 | | | | 0.005 | | | | 0.002 | | | | — | (b) | | | — | (b) | | | — | (b) |
| | | | | | | | |
| | Distributions to shareholders from net investment income | | | (0.004 | ) | | | (0.005 | ) | | | (0.001 | ) | | | — | (b) | | | — | (b) | | | — | (b) |
| | | | | | | | |
| | Distributions to shareholders from net realized gains | | | — | | | | — | (b) | | | (0.001 | ) | | | — | (b) | | | — | (b) | | | — | (b) |
| | | | | | | | |
| | Total distributions(c) | | | (0.004 | ) | | | (0.005 | ) | | | (0.002 | ) | | | — | (b) | | | — | (b) | | | — | (b) |
| | | | | | | | |
| | Net asset value, end of period | | $ | 1.00 | | | $ | 1.00 | | | $ | 1.00 | | | $ | 1.00 | | | $ | 1.00 | | | $ | 1.00 | |
| | | | | | | |
| | Total return(d) | | | 0.45 | % | | | 0.53 | % | | | 0.15 | % | | | 0.01 | % | | | 0.01 | % | | | 0.01 | % |
| | | | | | | |
| | Net assets, end of period (in 000’s) | | $ | 2,515 | | | $ | 836 | | | $ | 841 | | | $ | 58,173 | | | $ | 72,003 | | | $ | 66,226 | |
| | | | | | | |
| | Ratio of net expenses to average net assets | | | 0.68 | %(e) | | | 0.68 | % | | | 0.63 | % | | | 0.21 | % | | | 0.08 | % | | | 0.10 | % |
| | | | | | | |
| | Ratio of total expenses to average net assets | | | 0.71 | %(e) | | | 0.72 | % | | | 0.79 | % | | | 0.74 | % | | | 0.73 | % | | | 0.73 | % |
| | | | | | | |
| | Ratio of net investment income to average net assets | | | 0.91 | %(e) | | | 0.52 | % | | | 0.04 | % | | | 0.01 | % | | | 0.01 | % | | | 0.01 | % |
| | (a) | | Calculated based on the average shares outstanding methodology. |
| | (b) | | Amount is less than $0.0005 per share. |
| | (c) | | Distributions may not coincide with the current year net investment income or net realized gains as distributions may be paid from current or prior year earnings. |
| | (d) | | Assumes reinvestment of all distributions. Returns do not reflect the deduction of taxes that a shareholder would pay on Fund distributions. Total returns for periods less than one full year are not annualized. |
| | |
| 38 | | The accompanying notes are an integral part of these financial statements. |
GOLDMAN SACHS INVESTOR TAX-EXEMPT MONEY MARKET FUND
Financial Highlights(continued)
Selected Data for a Share Outstanding Throughout Each Period
| | | | | | | | | | | | | | | | | | | | | | | | | | |
| | | | | Investor Tax-Exempt Money Market Fund | |
| | | | | Resource Shares | |
| | | | | Six Months Ended
February 28, 2019
(Unaudited) | | | Year Ended August 31, | |
| | | | | 2018 | | | 2017 | | | 2016 | | | 2015 | | | 2014 | |
| | Per Share Data: | | | | | | | | | | | | | | | | | | | | | | | | |
| | | | | | | |
| | Net asset value, beginning of period | | $ | 1.00 | | | $ | 1.00 | | | $ | 1.00 | | | $ | 1.00 | | | $ | 1.00 | | | $ | 1.00 | |
| | | | | | | |
| | Net investment income(a) | | | 0.003 | | | | 0.004 | | | | — | (b) | | | — | (b) | | | — | (b) | | | — | (b) |
| | | | | | | | |
| | Net realized gain | | | 0.001 | | | | — | (b) | | | 0.001 | | | | — | (b) | | | — | (b) | | | — | (b) |
| | | | | | | | |
| | Total from investment operations | | | 0.004 | | | | 0.004 | | | | 0.001 | | | | — | (b) | | | — | (b) | | | — | (b) |
| | | | | | | | |
| | Distributions to shareholders from net investment income | | | (0.004 | ) | | | (0.004 | ) | | | — | (b) | | | — | (b) | | | — | (b) | | | — | (b) |
| | | | | | | | |
| | Distributions to shareholders from net realized gains | | | — | | | | — | (b) | | | (0.001 | ) | | | — | (b) | | | — | (b) | | | — | (b) |
| | | | | | | | |
| | Total distributions(c) | | | (0.004 | ) | | | (0.004 | ) | | | (0.001 | ) | | | — | (b) | | | — | (b) | | | — | (b) |
| | | | | | | | |
| | Net asset value, end of period | | $ | 1.00 | | | $ | 1.00 | | | $ | 1.00 | | | $ | 1.00 | | | $ | 1.00 | | | $ | 1.00 | |
| | | | | | | |
| | Total return(d) | | | 0.38 | % | | | 0.37 | % | | | 0.08 | % | | | 0.01 | % | | | 0.01 | % | | | 0.01 | % |
| | | | | | | |
| | Net assets, end of period (in 000’s) | | $ | 2,187 | | | $ | 2,412 | | | $ | 3,731 | | | $ | 6,469 | | | $ | 8,268 | | | $ | 12,979 | |
| | | | | | | |
| | Ratio of net expenses to average net assets | | | 0.83 | %(e) | | | 0.83 | % | | | 0.73 | % | | | 0.20 | % | | | 0.08 | % | | | 0.10 | % |
| | | | | | | |
| | Ratio of total expenses to average net assets | | | 0.86 | %(e) | | | 0.87 | % | | | 0.94 | % | | | 0.89 | % | | | 0.88 | % | | | 0.88 | % |
| | | | | | | |
| | Ratio of net investment income to average net assets | | | 0.75 | %(e) | | | 0.36 | % | | | 0.02 | % | | | 0.01 | % | | | 0.01 | % | | | 0.01 | % |
| | (a) | | Calculated based on the average shares outstanding methodology. |
| | (b) | | Amount is less than $0.0005 per share. |
| | (c) | | Distributions may not coincide with the current year net investment income or net realized gains as distributions may be paid from current or prior year earnings. |
| | (d) | | Assumes reinvestment of all distributions. Returns do not reflect the deduction of taxes that a shareholder would pay on Fund distributions. Total returns for periods less than one full year are not annualized. |
| | |
| The accompanying notes are an integral part of these financial statements. | | 39 |
GOLDMAN SACHS INVESTOR TAX-EXEMPT MONEY MARKET FUND
Financial Highlights(continued)
Selected Data for a Share Outstanding Throughout Each Period
| | | | | | | | | | | | | | | | | | | | | | | | | | |
| | | | | Investor Tax-Exempt Money Market Fund | |
| | | | | Cash Management Shares | |
| | | | | Six Months Ended
February 28, 2019
(Unaudited) | | | Year Ended August 31, | |
| | | | | 2018 | | | 2017 | | | 2016 | | | 2015 | | | 2014 | |
| | Per Share Data: | | | | | | | | | | | | | | | | | | | | | | | | |
| | | | | | | |
| | Net asset value, beginning of period | | $ | 1.00 | | | $ | 1.00 | | | $ | 1.00 | | | $ | 1.00 | | | $ | 1.00 | | | $ | 1.00 | |
| | | | | | | |
| | Net investment income(a) | | | — | (b) | | | 0.002 | | | | — | (b) | | | — | (b) | | | — | (b) | | | — | (b) |
| | | | | | | | |
| | Net realized gain | | | 0.005 | | | | 0.001 | | | | 0.001 | | | | — | (b) | | | — | (b) | | | — | (b) |
| | | | | | | | |
| | Total from investment operations | | | 0.005 | | | | 0.003 | | | | 0.001 | | | | — | (b) | | | — | (b) | | | — | (b) |
| | | | | | | | |
| | Distributions to shareholders from net investment income | | | (0.005 | ) | | | (0.003 | ) | | | — | (b) | | | — | (b) | | | — | (b) | | | — | (b) |
| | | | | | | | |
| | Distributions to shareholders from net realized gains | | | — | | | | — | (b) | | | (0.001 | ) | | | — | (b) | | | — | (b) | | | — | (b) |
| | | | | | | | |
| | Total distributions(c) | | | (0.005 | ) | | | (0.003 | ) | | | (0.001 | ) | | | — | (b) | | | — | (b) | | | — | (b) |
| | | | | | | | |
| | Net asset value, end of period | | $ | 1.00 | | | $ | 1.00 | | | $ | 1.00 | | | $ | 1.00 | | | $ | 1.00 | | | $ | 1.00 | |
| | | | | | | |
| | Total return(d) | | | 0.30 | % | | | 0.24 | % | | | 0.09 | % | | | 0.01 | % | | | 0.01 | % | | | 0.01 | % |
| | | | | | | |
| | Net assets, end of period (in 000’s) | | $ | 1 | | | $ | 1 | | | $ | 54 | | | $ | 1 | | | $ | 1 | | | $ | 1 | |
| | | | | | | |
| | Ratio of net expenses to average net assets | | | 0.90 | %(e) | | | 0.96 | % | | | 0.77 | % | | | 0.12 | % | | | 0.08 | % | | | 0.10 | % |
| | | | | | | |
| | Ratio of total expenses to average net assets | | | 1.01 | %(e) | | | 1.02 | % | | | 1.09 | % | | | 1.04 | % | | | 1.03 | % | | | 1.03 | % |
| | | | | | | |
| | Ratio of net investment income to average net assets | | | 0.95 | %(e) | | | 0.24 | % | | | 0.01 | % | | | 0.37 | % | | | 0.40 | % | | | 0.40 | % |
| | (a) | | Calculated based on the average shares outstanding methodology. |
| | (b) | | Amount is less than $0.0005 per share. |
| | (c) | | Distributions may not coincide with the current year net investment income or net realized gains as distributions may be paid from current or prior year earnings. |
| | (d) | | Assumes reinvestment of all distributions. Returns do not reflect the deduction of taxes that a shareholder would pay on Fund distributions. Total returns for periods less than one full year are not annualized. |
| | |
| 40 | | The accompanying notes are an integral part of these financial statements. |
GOLDMAN SACHS INVESTOR TAX-EXEMPT MONEY MARKET FUND
Financial Highlights(continued)
Selected Data for a Share Outstanding Throughout Each Period
| | | | | | | | | | | | | | | | | | |
| | | | | Investor Tax-Exempt Money Market Fund | |
| | | | | Class A Shares | |
| | | | | Six Months Ended
February 28, 2019
(Unaudited) | | | Year Ended August 31, | | | Period Ended
August 31, 2016* | |
| | | | | 2018 | | | 2017 | |
| | Per Share Data: | | | | | | | | | | | | | | | | |
| | | | | |
| | Net asset value, beginning of period | | $ | 1.00 | | | $ | 1.00 | | | $ | 1.00 | | | $ | 1.00 | |
| | | | | |
| | Net investment income(a) | | | 0.003 | | | | 0.008 | | | | 0.004 | | | | — | (b) |
| | | | | | |
| | Net realized gain | | | 0.003 | | | | — | (b) | | | — | (b) | | | — | (b) |
| | | | | | |
| | Total from investment operations | | | 0.006 | | | | 0.008 | | | | 0.004 | | | | — | (b) |
| | | | | | |
| | Distributions to shareholders from net investment income | | | (0.006 | ) | | | (0.008 | ) | | | (0.003 | ) | | | — | (b) |
| | | | | | |
| | Distributions to shareholders from net realized gains | | | — | | | | — | (b) | | | (0.001 | ) | | | — | (b) |
| | | | | | |
| | Total distributions(c) | | | (0.006 | ) | | | (0.008 | ) | | | (0.004 | ) | | | — | (b) |
| | | | | | |
| | Net asset value, end of period | | $ | 1.00 | | | $ | 1.00 | | | $ | 1.00 | | | $ | 1.00 | |
| | | | | |
| | Total return(d) | | | 0.57 | % | | | 0.78 | % | | | 0.38 | % | | | 0.01 | % |
| | | | | |
| | Net assets, end of period (in 000’s) | | $ | 2,051 | | | $ | 2,296 | | | $ | 643 | | | $ | 10 | |
| | | | | |
| | Ratio of net expenses to average net assets | | | 0.43 | %(e) | | | 0.43 | % | | | 0.43 | % | | | 0.30 | %(e) |
| | | | | |
| | Ratio of total expenses to average net assets | | | 0.46 | %(e) | | | 0.47 | % | | | 0.54 | % | | | 0.49 | %(e) |
| | | | | |
| | Ratio of net investment income to average net assets | | | 1.16 | %(e) | | | 0.82 | % | | | 0.35 | % | | | 0.04 | %(e) |
| | * | | Commenced operations on March 31, 2016. |
| | (a) | | Calculated based on the average shares outstanding methodology. |
| | (b) | | Amount is less than $0.0005 per share. |
| | (c) | | Distributions may not coincide with the current year net investment income or net realized gains as distributions may be paid from current or prior year earnings. |
| | (d) | | Assumes reinvestment of all distributions. Returns do not reflect the deduction of taxes that a shareholder would pay on Fund distributions. Total returns for periods less than one full year are not annualized. |
| | |
| The accompanying notes are an integral part of these financial statements. | | 41 |
GOLDMAN SACHS INVESTOR TAX-EXEMPT MONEY MARKET FUND
Financial Highlights(continued)
Selected Data for a Share Outstanding Throughout Each Period
| | | | | | | | | | | | | | | | | | |
| | | | | Investor Tax-Exempt Money Market Fund
| |
| | | | | Class C Shares | |
| | | | | Six Months Ended
February 28, 2019
(Unaudited) | | | Year Ended August 31, | | | Period Ended
August 31, 2016* | |
| | | | | 2018 | | | 2017 | |
| | Per Share Data: | | | | | | | | | | | | | | | | |
| | | | | |
| | Net asset value, beginning of period | | $ | 1.00 | | | $ | 1.00 | | | $ | 1.00 | | | $ | 1.00 | |
| | | | | |
| | Net investment income(a) | | | 0.002 | | | | 0.001 | | | | — | (b) | | | — | (b) |
| | | | | | |
| | Net realized gain | | | — | (b) | | | — | (b) | | | 0.001 | | | | — | (b) |
| | | | | | |
| | Total from investment operations | | | 0.002 | | | | 0.001 | | | | 0.001 | | | | — | (b) |
| | | | | | |
| | Distributions to shareholders from net investment income | | | (0.002 | ) | | | (0.001 | ) | | | — | (b) | | | — | (b) |
| | | | | | |
| | Distributions to shareholders from net realized gains | | | — | | | | — | (b) | | | (0.001 | ) | | | — | (b) |
| | | | | | |
| | Total distributions(c) | | | (0.002 | ) | | | (0.001 | ) | | | (0.001 | ) | | | — | (b) |
| | | | | | |
| | Net asset value, end of period | | $ | 1.00 | | | $ | 1.00 | | | $ | 1.00 | | | $ | 1.00 | |
| | | | | |
| | Total return(d) | | | 0.20 | % | | | 0.13 | % | | | 0.07 | % | | | 0.01 | % |
| | | | | |
| | Net assets, end of period (in 000’s) | | $ | 9 | | | $ | 9 | | | $ | 9 | | | $ | 10 | |
| | | | | |
| | Ratio of net expenses to average net assets | | | 1.19 | %(e) | | | 1.06 | % | | | 0.72 | % | | | 0.31 | %(e) |
| | | | | |
| | Ratio of total expenses to average net assets | | | 1.21 | %(e) | | | 1.22 | % | | | 1.29 | % | | | 1.24 | %(e) |
| | | | | |
| | Ratio of net investment income to average net assets | | | 0.39 | %(e) | | | 0.15 | % | | | 0.04 | % | | | 0.04 | %(e) |
| | * | | Commenced operations on March 31, 2016. |
| | (a) | | Calculated based on the average shares outstanding methodology. |
| | (b) | | Amount is less than $0.0005 per share. |
| | (c) | | Distributions may not coincide with the current year net investment income or net realized gains as distributions may be paid from current or prior year earnings. |
| | (d) | | Assumes reinvestment of all distributions. Returns do not reflect the deduction of taxes that a shareholder would pay on Fund distributions. Total returns for periods less than one full year are not annualized. |
| | |
| 42 | | The accompanying notes are an integral part of these financial statements. |
GOLDMAN SACHS FUNDS — INVESTOR FUNDS
Notes to Financial Statements
February 28, 2019 (Unaudited)
Goldman Sachs Trust (the “Trust”) is a Delaware statutory trust registered under the Investment Company Act of 1940, as amended (the “Act”), as anopen-end management investment company. The following table lists those series of the Trust that are included in this report (collectively, the “Funds” or individually a “Fund”), along with their corresponding share classes and respective diversification status under the Act:
| | | | |
| Fund | | Share Classes Offered | | Diversified/
Non-Diversified |
Investor Money Market | | Class I, Administration, Service, Resource, Cash Management, Class A and Class C | | Diversified |
Investor Tax-Exempt Money Market | | Class I, Select, Preferred, Capital, Administration, Premier, Service, Resource, Cash Management, Class A and Class C | | Diversified |
Class C Shares may typically be acquired only in an exchange for Class C Shares of another Goldman Sachs Fund. Class C Shares may be subject to a contingent deferred sales charge (“CDSC”) of 1.00% during the first 12 months, measured from the time the original shares subject to the CDSC were acquired.
Goldman Sachs Asset Management, L.P. (“GSAM”), an affiliate of Goldman Sachs & Co. LLC (“Goldman Sachs”), serves as investment adviser to the Funds pursuant to management agreements (the “Agreements”) with the Trust.
|
| 2. SIGNIFICANT ACCOUNTING POLICIES |
The financial statements have been prepared in accordance with accounting principles generally accepted in the United States of America (“GAAP”) and require management to make estimates and assumptions that may affect the reported amounts and disclosures. Actual results may differ from those estimates and assumptions.
A. Investment Valuation — The investment valuation policy of the Funds is to use theamortized-cost method permitted by Rule2a-7 under the Act for valuing portfolio securities. Theamortized-cost method of valuation involves valuing a security at its cost and thereafter applying a constant accretion or amortization to maturity of any discount or premium. Normally, a security’s amortized cost will approximate its market value. Under procedures and tolerances approved by the Board of Trustees (“Trustees”), GSAM evaluates daily the difference between each Fund’s net asset value (“NAV”) per share using the amortized costs of its portfolio securities and the Fund’s NAV per share using market-based values of its portfolio securities. The market-based value of a portfolio security is determined, where readily available, on the basis of market quotations provided by pricing services or securities dealers, or, where accurate market quotations are not readily available, on the basis of the security’s fair value as determined in accordance with Valuation Procedures approved by the Trustees. The pricing services may use valuation models or matrix pricing, which may consider (among other things): (i) yield or price with respect to debt securities that are considered comparable in characteristics such as rating, interest rate and maturity date or (ii) quotations from securities dealers to determine current value.
B. Investment Income and Investments — Interest income is accrued daily and adjusted for amortization of premiums and accretion of discounts. Investment transactions are reflected on trade date. Realized gains and losses are calculated using identified cost.
C. Class Allocations and Expenses — Investment income, realized and unrealized gain (loss), if any, andnon-class specific expenses of each Fund are allocated daily based upon the proportion of net assets of each class. Class specific expenses, where applicable, are borne by the respective share classes and include Distribution, Service, Distribution and Service, Administration, Service and Administration, and Shareholder Administration fees and Transfer Agency fees.Non-class specific expenses directly incurred by a Fund are charged to that Fund, while such expenses incurred by the Trust are allocated across the respective Funds on a straight-line and/orpro-rata basis depending upon the nature of the expenses.
43
GOLDMAN SACHS FUNDS — INVESTOR FUNDS
Notes to Financial Statements(continued)
February 28, 2019 (Unaudited)
|
| 2. SIGNIFICANT ACCOUNTING POLICIES (continued) |
D. Federal Taxes and Distributions to Shareholders — It is each Fund’s policy to comply with the requirements of the Internal Revenue Code of 1986, as amended (the “Code”), applicable to regulated investment companies (mutual funds) and to distribute each year substantially all of its investment company taxable andtax-exempt income and capital gains to its shareholders. Accordingly, the Funds are not required to make any provisions for the payment of federal income tax. Distributions to shareholders are declared and recorded daily and paid monthly by the Funds and may include short-term capital gains. Long-term capital gain distributions, if any, are declared and paid annually. A Fund may defer or accelerate the timing of the distributions of short-term capital gains (or any portion thereof).
Net capital losses, if any, are carried forward to future fiscal years and may be used to the extent allowed by the Code to offset any future capital gains. Utilization of capital loss carryforwards will reduce the requirement of future capital gains distributions.
The characterization of distributions to shareholders for financial reporting purposes is determined in accordance with federal income tax rules, which may differ from GAAP. The source of each Fund’s distributions may be shown in the accompanying financial statements as either from distributable earnings or capital. Certain components of the Funds’ net assets on the Statements of Assets and Liabilities reflect permanent GAAP/tax differences based on the appropriate tax character.
E. Forward Commitments — A forward commitment involves entering into a contract to purchase or sell securities, typically on an extended settlement basis, for a fixed price at a future date. The purchase of securities on a forward commitment basis involves a risk of loss if the value of the security to be purchased declines before the settlement date. Conversely, the sale of securities on a forward commitment basis involves the risk that the value of the securities sold may increase before the settlement date. Although a Fund will generally purchase securities on a forward commitment basis with the intention of acquiring the securities for its portfolio, the Fund may dispose of forward commitments prior to settlement which may result in a realized gain or loss.
F. Repurchase Agreements — Repurchase agreements involve the purchase of securities subject to the seller’s agreement to repurchase the securities at a mutually agreed upon date and price, under the terms of a Master Repurchase Agreement (“MRA”). During the term of a repurchase agreement, the value of the underlying securities held as collateral on behalf of a Fund, including accrued interest, is required to exceed the value of the repurchase agreement, including accrued interest. The gross value of repurchase agreements is included in the Statements of Assets and Liabilities for financial reporting purposes. The underlying securities for all repurchase agreements are held at the Funds’ custodian or designatedsub-custodians undertri-party repurchase agreements.
An MRA governs transactions between a Fund and select counterparties. An MRA contains provisions for, among other things, initiation of the transaction, income payments, events of default, and maintenance of securities for repurchase agreements. An MRA also permits offsetting with collateral to create one single net payment in the event of default or similar events, including the bankruptcy or insolvency of a counterparty.
If the seller defaults, a Fund could suffer a loss to the extent that the proceeds from the sale of the underlying securities and other collateral held by the Fund are less than the repurchase price and the Fund’s costs associated with delay and enforcement of the repurchase agreement. In addition, in the event of default or insolvency of the seller, a court could determine that a Fund’s interest in the collateral is not enforceable, resulting in additional losses to the Fund.
Pursuant to exemptive relief granted by the Securities and Exchange Commission (“SEC”) and terms and conditions contained therein, the Funds, together with other funds of the Trust and registered investment companies having management agreements with GSAM or its affiliates, may transfer uninvested cash into joint accounts, the daily aggregate balance of which is invested in one or more repurchase agreements. Under these joint accounts, the Funds maintainpro-rata credit exposure to the underlying repurchase agreements’ counterparties. With the exception of certain transaction fees, the Funds are not subject to any expenses in relation to these investments.
44
GOLDMAN SACHS FUNDS — INVESTOR FUNDS
|
| 3. INVESTMENTS AND FAIR VALUE MEASUREMENTS |
U.S. GAAP defines the fair value of a financial instrument as the amount that would be received to sell an asset or paid to transfer a liability in an orderly transaction between market participants at the measurement date (i.e., the exit price); the Funds’ policy is to use the market approach. GAAP establishes a fair value hierarchy that prioritizes the inputs to valuation techniques used to measure fair value. The hierarchy gives the highest priority to unadjusted quoted prices in active markets for identical assets or liabilities (Level 1 measurements) and the lowest priority to unobservable inputs (Level 3 measurements). The levels used for classifying investments are not necessarily an indication of the risk associated with investing in these investments. The three levels of the fair value hierarchy are described below:
Level 1 — Unadjusted quoted prices in active markets that are accessible at the measurement date for identical, unrestricted assets or liabilities;
Level 2 — Quoted prices in markets that are not active or financial instruments for which significant inputs are observable (including, but not limited to, quoted prices for similar investments, interest rates, foreign exchange rates, volatility and credit spreads), either directly or indirectly;
Level 3 — Prices or valuations that require significant unobservable inputs (including GSAM’s assumptions in determining fair value measurement).
The Trustees have approved Valuation Procedures that govern the valuation of the portfolio investments held by the Funds, including investments for which market quotations are not readily available. The Trustees have delegated to GSAMday-to-day responsibility for implementing and maintaining internal controls and procedures related to the valuation (including both the amortized cost and market-based methods of valuation) of the Funds’ investments. To assess the continuing appropriateness of pricing sources and methodologies related to the market-based method of valuation, GSAM regularly performs price verification procedures and issues challenges as necessary to third party pricing vendors or brokers, and any differences are reviewed in accordance with the Valuation Procedures.
As of February 28, 2019, all investments are classified as Level 2 of the fair value hierarchy. Please refer to the Schedules of Investments for further detail.
|
| 4. AGREEMENTS AND AFFILIATED TRANSACTIONS |
A. Management Agreements — Under the Agreements, GSAM manages the Funds, subject to the general supervision of the Trustees.
As compensation for the services rendered pursuant to the Agreements, the assumption of the expenses related thereto and administration of the Funds’ business affairs, including providing facilities, GSAM is entitled to a management fee, accrued daily and paid monthly, equal to an annual percentage rate of each Fund’s average daily net assets.
B. Administration, Service and/or Shareholder Administration Plans — The Trust, on behalf of each applicable Fund, has adopted Administration, Service and/or Shareholder Administration Plans (the “Plans”) to allow Class C, Select, Preferred, Capital, Administration, Premier, Service, Resource and Cash Management Shares to compensate service organizations (including Goldman Sachs) for providing varying levels of account administration and/or personal and account maintenance services to their customers who are beneficial owners of such shares. The Plans provide for compensation to the service organizations equal to an annual percentage rate of the average daily net assets of such shares.
C. Distribution and/or Service(12b-1) Plans — The Trust, on behalf of the Class A Shares of each applicable Fund, has adopted a Distribution and Service Plan subject to Rule12b-1 under the Act. Under the Distribution and Service Plan, Goldman Sachs, which serves as distributor (the “Distributor”), is entitled to a fee accrued daily and paid monthly for distribution services and personal and account maintenance services, which may then be paid by Goldman Sachs to authorized dealers. These fees are equal to an annual percentage rate of the average daily net assets attributable to Class A Shares of the Funds, as set forth below.
The Trust, on behalf of Class C, Resource and Cash Management Shares of each applicable Fund, has adopted Distribution Plans subject to Rule12b-1 under the Act. Under the Distribution Plans, Goldman Sachs as Distributor is entitled to a fee accrued
45
GOLDMAN SACHS FUNDS — INVESTOR FUNDS
Notes to Financial Statements(continued)
February 28, 2019 (Unaudited)
|
| 4. AGREEMENTS AND AFFILIATED TRANSACTIONS (continued) |
daily and paid monthly for distribution services, which may then be paid by Goldman Sachs to authorized dealers. These fees are equal to an annual percentage rate of the average daily net assets attributable to Class C, Resource and Cash Management Shares of the Funds, as set forth below.
The Trust, on behalf of the Service Shares of each applicable Fund, has adopted a Service Plan subject to Rule12b-1 under the Act to allow Service Shares to compensate service organizations (including Goldman Sachs) for providing personal and account maintenance services to their customers who are beneficial owners of such shares. The Service Plan provides for compensation to the service organizations equal to an annual percentage rate of the average daily net assets attributable to Service Shares of the Funds, as set forth below.
D. Distribution Agreement — Goldman Sachs, as Distributor of the shares of the Funds pursuant to a Distribution Agreement, may retain a portion of the Class C Shares’ CDSC. During the six months ended February 28, 2019, Goldman Sachs has advised that it did not retain any CDSCs with respect to Class C Shares of the Funds.
E. Transfer Agency Agreement — Goldman Sachs also serves as the transfer agent of the Funds for a fee pursuant to a Transfer Agency Agreement. The fee charged for such transfer agency services is accrued daily and paid monthly and is equal to an annual percentage rate of each Fund’s average daily net assets.
F. Other Agreements — GSAM has agreed to limit certain “Other Expenses” of the Funds (excluding transfer agency fees and expenses, administration fees (as applicable), service fees (as applicable), shareholder administration fees (as applicable), taxes, interest, brokerage fees, expenses of shareholder meetings, litigation and indemnification, and extraordinary expenses) to the extent such expenses exceed, on an annual basis, 0.014% of the average daily net assets of each Fund. Such Other Expense reimbursements, if any, are accrued daily and paid monthly. These Other Expense limitations will remain in place through at least December 28, 2019, and prior to such date GSAM may not terminate the arrangements without the approval of the Trustees.
In addition, the Funds have entered into certain offset arrangements with the custodian and the transfer agent, which may result in a reduction of the Funds’ expenses and are received irrespective of the application of the “Other Expense” limitations described above.
G. Total Fund Expenses
Fund Contractual Fees
The contractual annualized rates for each of the Funds are as follows:
| | | | | | | | | | | | | | | | | | | | | | | | | | | | | | | | | | | | | | | | | | | | |
| | | Class I
Shares | | | Select
Shares(a) | | | Preferred
Shares(a) | | | Capital
Shares(a) | | | Administration
Shares | | | Premier
Shares(a) | | | Service
Shares | | | Resource
Shares | | | Cash
Management
Shares | | | Class A
Shares | | | Class C
Shares | |
Management Fee | | | 0.16 | % | | | 0.16 | % | | | 0.16 | % | | | 0.16 | % | | | 0.16 | % | | | 0.16 | % | | | 0.16 | % | | | 0.16 | % | | | 0.16 | % | | | 0.16 | % | | | 0.16 | % |
Administration, Service and/or Shareholder Administration Fees | | | N/A | | | | 0.03 | | | | 0.10 | | | | 0.15 | | | | 0.25 | | | | 0.35 | | | | 0.25 | | | | 0.50 | | | | 0.50 | | | | N/A | | | | 0.25 | |
Distribution and/or Service(12b-1) Fees | | | N/A | | | | N/A | | | | N/A | | | | N/A | | | | N/A | | | | N/A | | | | 0.25 | (b) | | | 0.15 | (c) | | | 0.30 | (c) | | | 0.25 | | | | 0.75 | (c) |
Transfer Agency Fee | | | 0.01 | | | | 0.01 | | | | 0.01 | | | | 0.01 | | | | 0.01 | | | | 0.01 | | | | 0.01 | | | | 0.01 | | | | 0.01 | | | | 0.01 | | | | 0.01 | |
N/A—Fees not applicable to respective share class
| (a) | | Tax-Exempt Money Market Fund only. |
| (b) | | Service(12b-1) fee only. |
| (c) | | Distribution(12b-1) fee only. |
46
GOLDMAN SACHS FUNDS — INVESTOR FUNDS
|
| 4. AGREEMENTS AND AFFILIATED TRANSACTIONS (continued) |
Fund Effective Net Expenses (After Waivers and Reimbursements)
The investment adviser may contractually agree to waive or reimburse certain fees and expenses until a specified date. The investment adviser may also voluntarily waive certain fees and expenses, and such voluntary waivers may be discontinued or modified at any time without notice.
During the six months ended February 28, 2019, GSAM and Goldman Sachs (as applicable) agreed to waive all or a portion of the management fees and respective class-specific fees described above attributable to the Funds. The Funds are not obligated to reimburse GSAM or Goldman Sachs for prior fiscal year fee waivers and/or expense reimbursements, if any.
For the six months ended February 28, 2019, expense reductions including any fee waivers and Other Expense reimbursements were as follows (in thousands):
| | | | | | | | | | | | | | | | | | | | | | |
| Fund | | | | Management
Fee Waivers | | | Distribution,
Administration,
Service and/or
Shareholder
Administration
Plans Fee Waivers | | | Custody Fee
Reduction | | | Other Expense
Reimbursements | | | Total
Expense
Reductions | |
Investor Money Market | | | | $ | — | | | $ | — | * | | $ | — | | | $ | 92 | | | $ | 92 | |
Investor Tax-Exempt Money Market | | | | | — | | | | — | * | | | — | | | | 186 | | | | 186 | |
| * | | Amount less than one thousand. |
For the six months ended February 28, 2019, the net effective management fee rate for each of the Funds was 0.16%.
H. Other Transactions with Affiliates — A Fund may purchase securities from, or sell securities to, an affiliated fund provided the affiliation is solely due to having a common investment adviser, common officers, or common Trustees. For the six months ended February 28, 2019, the purchase and sale transactions and related net realized gain (loss) for the Funds with affiliated funds in compliance with Rule17a-7 under the Act were as follows:
| | | | | | | | | | | | | | |
| Fund | | �� | | Purchases | | | Sales | | | Net Realized
Gain (Loss) | |
Investor Money Market | | | | $ | — | | | $ | 8,001,416 | | | $ | — | |
InvestorTax-Exempt Money Market | | | | | 52,120,739 | | | | 20,311,116 | | | | — | |
As of February 28, 2019, The Goldman Sachs Group, Inc. was the beneficial owner of 5% or more of the outstanding share classes of the following Funds:
| | | | | | | | | | | | | | | | | | | | | | | | | | | | | | | | | | | | | | | | | | | | |
| Fund | | Class I
Shares | | | Select
Shares | | | Preferred
Shares | | | Capital
Shares | | | Administration
Shares | | | Premier
Shares | | | Service
Shares | | | Resource
Shares | | | Cash
Management
Shares | | | Class A
Shares | | | Class C
Shares | |
Investor Money Market | | | — | | | | — | | | | — | | | | — | | | | — | | | | — | | | | 100 | % | | | 100 | % | | | — | | | | — | | | | 100 | % |
InvestorTax-Exempt Money Market | | | — | | | | 32 | % | | | — | | | | 100 | % | | | — | | | | 100 | % | | | — | | | | — | | | | 100 | % | | | — | | | | 100 | |
I. Line of Credit Facility — As of February 28, 2019, the Funds participated in a $770,000,000 committed, unsecured revolving line of credit facility (the “facility”) together with other funds of the Trust and registered investment companies having management agreements with GSAM or its affiliates. This facility is to be used for temporary emergency purposes, or to allow for an orderly liquidation of securities to meet redemption requests. The interest rate on borrowings is based on the federal funds rate. The facility also requires a fee to be paid by the Funds based on the amount of the commitment that has not been utilized. For the six months ended February 28, 2019, the Funds did not have any borrowings under the facility.
47
GOLDMAN SACHS FUNDS — INVESTOR FUNDS
Notes to Financial Statements(continued)
February 28, 2019 (Unaudited)
As of the Funds’ most recent fiscal year end, August 31, 2018, the Funds’ capital loss carryforwards and certain timing differences on a tax basis were as follows:
| | | | | | | | |
| | | Investor
Money
Market | | | Investor
Tax-Exempt
Money Market | |
Capital loss carryforwards (Perpetual Short-Term) | | $ | — | | | $ | (6,657 | ) |
Timing differences (Distribution Payable) | | | (254,148 | ) | | | (1,007,681 | ) |
At February 28, 2019, the aggregate cost for each Fund stated in the accompanying Statements of Assets and Liabilities also represents aggregate cost for U.S. federal income tax purposes.
GSAM has reviewed the Funds’ tax positions for all open tax years (the current and prior three tax years, as applicable) and has concluded that no provision for income tax is required in the Funds’ financial statements. Such open tax years remain subject to examination and adjustment by tax authorities.
The Funds’ risks include, but are not limited to, the following:
Large Shareholder Transactions Risk — A Fund may experience adverse effects when certain large shareholders, such as financial intermediaries (who may make investment decisions on behalf of underlying clients) and individuals, purchase or redeem large amounts of shares of a Fund. Such large shareholder redemptions, which may occur rapidly or unexpectedly, may cause a Fund to sell portfolio securities at times when it would not otherwise do so, which may negatively impact the Fund’s NAV and liquidity. Similarly, large Fund share purchases may adversely affect a Fund’s performance to the extent that the Fund is delayed in investing new cash or otherwise maintains a larger cash position than it ordinarily would. These transactions may also accelerate the realization of taxable income to shareholders if such sales of investments resulted in gains, and may also increase transaction costs. In addition, a large redemption could result in a Fund’s current expenses being allocated over a smaller asset base, leading to an increase in the Fund’s expense ratio.
Interest Rate Risk — When interest rates increase, a Fund’s yield will tend to be lower than prevailing market rates, and the market value of its securities or instruments may also be adversely affected. A low interest rate environment poses additional risks to a Fund, because low yields on the Fund’s portfolio holdings may have an adverse impact on the Fund’s ability to provide a positive yield to its shareholders, pay expenses out of Fund assets, or, at times, maintain a stable $1.00 share price. The risks associated with changing interest rates may have unpredictable effects on the markets and a Fund’s investments. Fluctuations in interest rates may also affect the liquidity of fixed income securities and instruments held by the Funds.
Market and Credit Risks — In the normal course of business, the Funds trade financial instruments and enter into financial transactions where risk of potential loss exists due to changes in the market (market risk). Additionally, a Fund may also be exposed to credit risk in the event that an issuer or guarantor fails to perform or that an institution or entity with which a Fund has unsettled or open transactions defaults.
Geographic and Sector Risk — The InvestorTax-Exempt Money Market Fund may invest a significant portion of its total assets in certain issuers within the same state, geographic region or economic sector, which may subject the value of the Fund’s investments to risks associated with an adverse economic, business, political or environmental development affecting that state, region or sector.
48
GOLDMAN SACHS FUNDS — INVESTOR FUNDS
|
| 6. OTHER RISKS (continued) |
Credit/Default Risk — An issuer or guarantor of a security held by the Fund, or a bank or other financial institution that has entered into a repurchase agreement with the Fund, may default on its obligation to pay interest and repay principal or default on any other obligation. Additionally, the credit quality of securities may deteriorate rapidly, which may impair the Fund’s liquidity and cause significant deterioration in NAV.
Under the Trust’s organizational documents, its Trustees, officers, employees and agents are indemnified, to the extent permitted by the Act and state law, against certain liabilities that may arise out of performance of their duties to the Funds. Additionally, in the course of business, the Funds enter into contracts that contain a variety of indemnification clauses. The Funds’ maximum exposure under these arrangements is unknown, as this would involve future claims that may be made against the Funds that have not yet occurred. However, GSAM believes the risk of loss under these arrangements to be remote.
Exemptive Orders — Pursuant to SEC exemptive orders, the Funds may enter into certain principal transactions, including repurchase agreements, with Goldman Sachs.
Subsequent events after the Statements of Assets and Liabilities date have been evaluated and GSAM has concluded that there is no impact requiring adjustment or disclosure in the financial statements.
49
GOLDMAN SACHS FUNDS — INVESTOR FUNDS
Notes to Financial Statements(continued)
February 28, 2019 (Unaudited)
|
| 10. SUMMARY OF SHARE TRANSACTIONS (AT $1.00 PER SHARE) |
Share activity is as follows:
| | | | | | | | |
| | | Investor Money Market Fund | |
| | | For the Six Months Ended
February 28, 2019
(Unaudited) | | | For the Fiscal Year Ended
August 31, 2018 | |
| | | | |
| Class I Shares | | | | | | | | |
Shares sold | | | 818,767,990 | | | | 716,352,662 | |
Reinvestment of distributions | | | 5,535,848 | | | | 2,763,014 | |
Shares redeemed | | | (589,636,190 | ) | | | (430,789,541 | ) |
| | | | 234,667,648 | | | | 288,326,135 | |
| Administration Shares | | | | | | | | |
Shares sold | | | 50,557,260 | | | | 66,436,013 | |
Reinvestment of distributions | | | 1,226,566 | | | | 1,402,584 | |
Shares redeemed | | | (71,044,932 | ) | | | (35,989,338 | ) |
| | | | (19,261,106 | ) | | | 31,849,259 | |
| Service Shares | | | | | | | | |
Shares sold | | | — | | | | — | |
Reinvestment of distributions | | | 96 | | | | 313 | |
Shares redeemed | | | — | | | | (40,000 | ) |
| | | | 96 | | | | (39,687 | ) |
| Resource Shares | | | | | | | | |
Shares sold | | | — | | | | — | |
Reinvestment of distributions | | | 87 | | | | 261 | |
Shares redeemed | | | — | | | | (40,000 | ) |
| | | | 87 | | | | (39,739 | ) |
| Cash Management Shares | | | | | | | | |
Shares sold | | | 4,670,415 | | | | 2,929,009 | |
Reinvestment of distributions | | | 8,744 | | | | 5,819 | |
Shares redeemed | | | (2,601,675 | ) | | | (2,099,476 | ) |
| | | | 2,077,484 | | | | 835,352 | |
| Class A Shares | | | | | | | | |
Shares sold | | | 31,192,197 | | | | 15,708,677 | |
Reinvestment of distributions | | | 176,298 | | | | 42,358 | |
Shares redeemed | | | (5,749,346 | ) | | | (8,381,415 | ) |
| | | | 25,619,149 | | | | 7,369,620 | |
| Class C Shares | | | | | | | | |
Shares sold | | | — | | | | — | |
Reinvestment of distributions | | | 68 | | | | 160 | |
Shares redeemed | | | (1 | ) | | | (53,578 | ) |
| | | | 67 | | | | (53,418 | ) |
| | |
NET INCREASE IN SHARES | | | 243,103,425 | | | | 328,247,522 | |
50
GOLDMAN SACHS FUNDS — INVESTOR FUNDS
|
| 10. SUMMARY OF SHARE TRANSACTIONS (AT $1.00 PER SHARE) (continued) |
Share activity is as follows:
| | | | | | | | |
| | | InvestorTax-Exempt Money Market Fund | |
| | | For the Six Months Ended
February 28, 2019
(Unaudited) | | | For the Fiscal Year Ended
August 31, 2018 | |
| | | | |
| Class I Shares | | | | | | | | |
Shares sold | | | 970,791,283 | | | | 1,608,090,653 | |
Reinvestment of distributions | | | 1,133,200 | | | | 1,581,148 | |
Shares redeemed | | | (749,681,366 | ) | | | (1,481,762,959 | ) |
| | | | 222,243,117 | | | | 127,908,842 | |
| Select Shares | | | | | | | | |
Shares sold | | | — | | | | 5,049,149 | |
Reinvestment of distributions | | | 22 | | | | 13,703 | |
Shares redeemed | | | — | | | | (10,460,376 | ) |
| | | | 22 | | | | (5,397,524 | ) |
| Preferred Shares | | | | | | | | |
Shares sold | | | 3,033 | | | | 32,634 | |
Reinvestment of distributions | | | 7 | | | | 11 | |
Shares redeemed | | | (12,898 | ) | | | (1,486 | ) |
| | | | (9,858 | ) | | | 31,159 | |
| Capital Shares | | | | | | | | |
Shares sold | | | — | | | | — | |
Reinvestment of distributions | | | 6 | | | | 9 | |
Shares redeemed | | | — | | | | — | |
| | | | 6 | | | | 9 | |
| Administration Shares | | | | | | | | |
Shares sold | | | 946,528 | | | | 9,267,994 | |
Reinvestment of distributions | | | 231 | | | | 243 | |
Shares redeemed | | | (151,997 | ) | | | (12,840,341 | ) |
| | | | 794,762 | | | | (3,572,104 | ) |
| Premier Shares | | | | | | | | |
Shares sold | | | — | | | | — | |
Reinvestment of distributions | | | 5 | | | | 7 | |
Shares redeemed | | | — | | | | — | |
| | | | 5 | | | | 7 | |
| Service Shares | | | | | | | | |
Shares sold | | | 1,928,689 | | | | 188,313 | |
Reinvestment of distributions | | | 2,506 | | | | 2,712 | |
Shares redeemed | | | (252,087 | ) | | | (195,928 | ) |
| | | | 1,679,108 | | | | (4,903 | ) |
| Resource Shares | | | | | | | | |
Shares sold | | | 3,840,456 | | | | 13,214,184 | |
Reinvestment of distributions | | | 8,219 | | | | 11,065 | |
Shares redeemed | | | (4,073,485 | ) | | | (14,544,306 | ) |
| | | | (224,810 | ) | | | (1,319,057 | ) |
| Cash Management Shares | | | | | | | | |
Shares sold | | | — | | | | 180,115 | |
Reinvestment of distributions | | | 3 | | | | 84 | |
Shares redeemed | | | — | | | | (233,485 | ) |
| | | | 3 | | | | (53,286 | ) |
| Class A Shares | | | | | | | | |
Shares sold | | | 3,040,848 | | | | 18,422,868 | |
Reinvestment of distributions | | | 12,580 | | | | 29,486 | |
Shares redeemed | | | (3,297,427 | ) | | | (16,799,795 | ) |
| | | | (243,999 | ) | | | 1,652,559 | |
| Class C Shares | | | | | | | | |
Shares sold | | | — | | | | — | |
Reinvestment of distributions | | | 18 | | | | 11 | |
Shares redeemed | | | — | | | | — | |
| | | | 18 | | | | 11 | |
| | |
NET INCREASE (DECREASE) IN SHARES | | | 224,238,374 | | | | 119,245,713 | |
51
GOLDMAN SACHS FUNDS — INVESTOR FUNDS
| | |
| | |
Fund Expenses — Six Month Period Ended February 28, 2019 (Unaudited) | | |
As a shareholder of Class I Shares, Select Shares, Preferred Shares, Capital Shares, Administration Shares, Premier Shares, Service Shares, Resource Shares, Cash Management Shares, Class A Shares, or Class C Shares of a Fund you incur two types of costs: (1) transaction costs, including contingent deferred sales charges (with respect to Class C Shares); and (2) ongoing costs, including management fees and distribution, service, administration and/or shareholder administration fees (with respect to all share classes except Class I Shares) and other Fund expenses. This example is intended to help you understand your ongoing costs (in dollars) of investing in Class I Shares, Select Shares, Preferred Shares, Capital Shares, Administration Shares, Premier Shares, Service Shares, Resource Shares, Cash Management Shares, Class A Shares, or Class C Shares of the Funds and to compare these costs with the ongoing costs of investing in other mutual funds.
The example is based on an investment of $1,000 invested at the beginning of the period and held for the entire period from September 1, 2018 through February 28, 2019, which represents a period of 181 days in a 365-day year.
Actual Expenses — The first line under each Share class in the table below provides information about actual account values and actual expenses. You may use the information in this line, together with the amount you invested, to estimate the expenses that you paid over the period. Simply divide your account value by $1,000 (for example, an $8,600 account value divided by $1,000=8.6), then multiply the result by the number in the first line under the heading entitled “Expenses Paid” to estimate the expenses you paid on your account during this period.
Hypothetical Example for Comparison Purposes — The second line under each Share class in the table below provides information about hypothetical account values and hypothetical expenses based on the Funds’ actual net expense ratios and an assumed rate of return of 5% per year before expenses, which is not the Funds’ actual return. The hypothetical account values and expenses may not be used to estimate the actual ending account balance or expenses you paid for the period. You may use this information to compare the ongoing costs of investing in the Funds and other funds. To do so, compare this 5% hypothetical example with the 5% hypothetical examples that appear in the shareholder reports of the other funds.
Please note that the expenses shown in the table are meant to highlight your ongoing costs only and do not reflect any transactional costs, such as sales charges, redemption fees, or exchange fees. Therefore, the second line of the table is useful in comparing ongoing costs only, and will not help you determine the relative total costs of owning different funds. In addition, if these transactional costs were included, your costs would have been higher.
| | | | | | | | | | | | |
| | | Investor Money Market Fund | |
| Share Class | | Beginning
Account Value
9/1/18 | | | Ending
Account Value
2/28/19 | | | Expenses Paid for the
6 months ended
2/28/19* | |
| Class I Shares | | | | | | | | | | | | |
Actual | | $ | 1,000.00 | | | $ | 1,011.61 | | | $ | 0.90 | |
Hypothetical (5% return before expenses) | | | 1,000.00 | | | | 1,023.90 | + | | | 0.90 | |
| Administration Shares | | | | | | | | | | | | |
Actual | | | 1,000.00 | | | | 1,010.35 | | | | 2.14 | |
Hypothetical (5% return before expenses) | | | 1,000.00 | | | | 1,022.66 | + | | | 2.16 | |
| Service Shares | | | | | | | | | | | | |
Actual | | | 1,000.00 | | | | 1,009.11 | | | | 3.34 | |
Hypothetical (5% return before expenses) | | | 1,000.00 | | | | 1,021.47 | + | | | 3.36 | |
| Resource Shares | | | | | | | | | | | | |
Actual | | | 1,000.00 | | | | 1,008.36 | | | | 4.03 | |
Hypothetical (5% return before expenses) | | | 1,000.00 | | | | 1,020.78 | + | | | 4.06 | |
| Cash Management Shares | | | | | | | | | | | | |
Actual | | | 1,000.00 | | | | 1,007.61 | | | | 4.88 | |
Hypothetical (5% return before expenses) | | | 1,000.00 | | | | 1,019.93 | + | | | 4.91 | |
| Class A Shares | | | | | | | | | | | | |
Actual | | | 1,000.00 | | | | 1,010.35 | | | | 2.14 | |
Hypothetical (5% return before expenses) | | | 1,000.00 | | | | 1,022.66 | + | | | 2.16 | |
| Class C Shares | | | | | | | | | | | | |
Actual | | | 1,000.00 | | | | 1,006.61 | | | | 5.87 | |
Hypothetical (5% return before expenses) | | | 1,000.00 | | | | 1,018.94 | + | | | 5.91 | |
| | * | | Expenses for each share class are calculated using the Fund’s annualized net expense ratio for each class, which represents the ongoing expenses as a percentage of net assets for the six months ended February 28, 2019. Expenses are calculated by multiplying the annualized net expense ratio by the average account value for the period; then multiplying the result by the number of days in the most recent fiscal half year; and then dividing that result by the number of days in the fiscal year. The annualized net expense ratios for the period were as follows: | |
| | | | | | | | | | | | | | | | | | | | | | | | | | | | |
| Fund | | Class I
Shares | | | Administration
Shares | | | Service
Shares | | | Resource
Shares | | | Cash
Management
Shares | | | Class A
Shares | | | Class C
Shares | |
Investor Money Market | | | 0.18 | % | | | 0.43 | % | | | 0.67 | % | | | 0.81 | % | | | 0.98 | % | | | 0.43 | % | | | 1.18 | % |
| | + | | Hypothetical expenses are based on the Fund’s actual annualized net expense ratios and an assumed rate of return of 5% per year before expenses. | |
52
GOLDMAN SACHS FUNDS — INVESTOR FUNDS
| | |
| | |
Fund Expenses — Six Month Period Ended February 28, 2019 (Unaudited) (continued) | | |
| | | | | | | | | | | | |
| | | InvestorTax-Exempt Money Market Fund | |
| Share Class | | Beginning
Account Value
9/1/18 | | | Ending
Account Value
2/28/19 | | | Expenses Paid for the
6 months ended
2/28/19* | |
| Class I Shares | | | | | | | | | | | | |
Actual | | $ | 1,000.00 | | | $ | 1,006.99 | | | $ | 0.90 | |
Hypothetical (5% return before expenses) | | | 1,000.00 | | | | 1,023.90 | + | | | 0.90 | |
| Select Shares | | | | | | | | | | | | |
Actual | | | 1,000.00 | | | | 1,006.84 | | | | 0.90 | |
Hypothetical (5% return before expenses) | | | 1,000.00 | | | | 1,023.90 | + | | | 0.90 | |
| Preferred Shares | | | | | | | | | | | | |
Actual | | | 1,000.00 | | | | 1,006.49 | | | | 1.39 | |
Hypothetical (5% return before expenses) | | | 1,000.00 | | | | 1,023.41 | + | | | 1.40 | |
| Capital Shares | | | | | | | | | | | | |
Actual | | | 1,000.00 | | | | 1,006.25 | | | | 0.90 | |
Hypothetical (5% return before expenses) | | | 1,000.00 | | | | 1,023.90 | + | | | 0.90 | |
| Administration Shares | | | | | | | | | | | | |
Actual | | | 1,000.00 | | | | 1,005.75 | | | | 2.14 | |
Hypothetical (5% return before expenses) | | | 1,000.00 | | | | 1,022.66 | + | | | 2.16 | |
| Premier Shares | | | | | | | | | | | | |
Actual | | | 1,000.00 | | | | 1,005.25 | | | | 2.68 | |
Hypothetical (5% return before expenses) | | | 1,000.00 | | | | 1,022.12 | + | | | 2.71 | |
| Service Shares | | | | | | | | | | | | |
Actual | | | 1,000.00 | | | | 1,004.50 | | | | 3.38 | |
Hypothetical (5% return before expenses) | | | 1,000.00 | | | | 1,021.42 | + | | | 3.41 | |
| Resource Shares | | | | | | | | | | | | |
Actual | | | 1,000.00 | | | | 1,003.76 | | | | 4.12 | |
Hypothetical (5% return before expenses) | | | 1,000.00 | | | | 1,020.68 | + | | | 4.16 | |
| Cash Management Shares | | | | | | | | | | | | |
Actual | | | 1,000.00 | | | | 1,003.01 | | | | 4.47 | |
Hypothetical (5% return before expenses) | | | 1,000.00 | | | | 1,020.33 | + | | | 4.51 | |
| Class A Shares | | | | | | | | | | | | |
Actual | | | 1,000.00 | | | | 1,005.75 | | | | 2.14 | |
Hypothetical (5% return before expenses) | | | 1,000.00 | | | | 1,022.66 | + | | | 2.16 | |
| Class C Shares | | | | | | | | | | | | |
Actual | | | 1,000.00 | | | | 1,002.02 | | | | 5.91 | |
Hypothetical (5% return before expenses) | | | 1,000.00 | | | | 1,018.89 | + | | | 5.96 | |
| | * | | Expenses for each share class are calculated using the Fund’s annualized net expense ratio for each class, which represents the ongoing expenses as a percentage of net assets for the six months ended February 28, 2019. Expenses are calculated by multiplying the annualized net expense ratio by the average account value for the period; then multiplying the result by the number of days in the most recent fiscal half year; and then dividing that result by the number of days in the fiscal year. The annualized net expense ratios for the period were as follows: | |
| | | | | | | | | | | | | | | | | | | | | | | | | | | | | | | | | | | | | | | | | | | | |
| Fund | | Class I
Shares | | | Select
Shares | | | Preferred
Shares | | | Capital
Shares | | | Administration
Shares | | | Premier
Shares | | | Service
Shares | | | Resource
Shares | | | Cash
Management
Shares | | | Class A
Shares | | | Class C
Shares | |
| | | | | | | | | | | |
Investor Tax-Exempt Money Market | | | 0.18 | % | | | 0.18 | % | | | 0.28 | % | | | 0.33 | % | | | 0.43 | % | | | 0.54 | % | | | 0.68 | % | | | 0.83 | % | | | 0.90 | % | | | 0.43 | % | | | 1.19 | % |
| | + | | Hypothetical expenses are based on the Fund’s actual annualized net expense ratios and an assumed rate of return of 5% per year before expenses. | |
53
FUNDS PROFILE
Goldman Sachs Funds
Goldman Sachs is a premier financial services firm, known since 1869 for creating thoughtful and customized investment solutions in complex global markets.
Today, theInvestment Management Division of Goldman Sachs serves a diverse set of clients worldwide, including private institutions, public entities and individuals. With approximately $1.34 trillion in assets under supervision as of December 31, 2018, Goldman Sachs Asset Management (“GSAM”) has portfolio management teams located around the world and our investment professionals bring firsthand knowledge of local markets to every investment decision. Assets under supervision includes assets under management and other client assets for which Goldman Sachs does not have full discretion. GSAM leverages the resources of Goldman Sachs & Co. LLC subject to legal, internal and regulatory restrictions.
Money Market
Financial Square FundsSM
| ∎ | | Financial Square Treasury Solutions Fund1 |
| ∎ | | Financial Square Government Fund1 |
| ∎ | | Financial Square Money Market Fund2 |
| ∎ | | Financial Square Prime Obligations Fund2 |
| ∎ | | Financial Square Treasury Instruments Fund1 |
| ∎ | | Financial Square Treasury Obligations Fund1 |
| ∎ | | Financial Square Federal Instruments Fund1 |
Investor FundsSM
| ∎ | | Investor Money Market Fund3 |
| ∎ | | Investor Tax-Exempt Money Market Fund3 |
Fixed Income
Short Duration and Government
| ∎ | | High Quality Floating Rate Fund |
| ∎ | | Short-Term Conservative Income Fund |
| ∎ | | Short Duration Government Fund |
| ∎ | | Short Duration Income Fund |
| ∎ | | Inflation Protected Securities Fund |
Multi-Sector
Municipal and Tax-Free
| ∎ | | High Yield Municipal Fund |
| ∎ | | Dynamic Municipal Income Fund |
| ∎ | | Short Duration Tax-Free Fund |
Single Sector
| ∎ | | Investment Grade Credit Fund |
| ∎ | | High Yield Floating Rate Fund |
| ∎ | | Emerging Markets Debt Fund |
| ∎ | | Local Emerging Markets Debt Fund |
Fixed Income Alternatives
| ∎ | | Long Short Credit Strategies Fund |
Fundamental Equity
| ∎ | | Small/Mid Cap Value Fund |
| ∎ | | Small/Mid Cap Growth Fund |
| ∎ | | Concentrated Growth Fund |
| ∎ | | Technology Opportunities Fund |
| ∎ | | Growth Opportunities Fund |
| ∎ | | Rising Dividend Growth Fund |
Tax-Advantaged Equity
| ∎ | | U.S. Tax-Managed Equity Fund |
| ∎ | | International Tax-Managed Equity Fund |
| ∎ | | U.S. Equity Dividend and Premium Fund |
| ∎ | | International Equity Dividend and Premium Fund |
Equity Insights
| ∎ | | Small Cap Equity Insights Fund |
| ∎ | | U.S. Equity Insights Fund |
| ∎ | | Small Cap Growth Insights Fund |
| ∎ | | Large Cap Growth Insights Fund |
| ∎ | | Large Cap Value Insights Fund |
| ∎ | | Small Cap Value Insights Fund |
| ∎ | | International Small Cap Insights Fund |
| ∎ | | International Equity Insights Fund |
| ∎ | | Emerging Markets Equity Insights Fund |
Fundamental Equity International
| ∎ | | International Equity Income Fund |
| ∎ | | International Equity ESG Fund |
| ∎ | | Emerging Markets Equity Fund |
| ∎ | | ESG Emerging Markets Equity Fund |
Select Satellite
| ∎ | | Real Estate Securities Fund |
| ∎ | | International Real Estate Securities Fund |
| ∎ | | Commodity Strategy Fund |
| ∎ | | Global Real Estate Securities Fund |
| ∎ | | Alternative Premia Fund |
| ∎ | | Absolute Return Tracker Fund |
| ∎ | | Managed Futures Strategy Fund |
| ∎ | | MLP Energy Infrastructure Fund |
| ∎ | | Multi-Manager Alternatives Fund |
| ∎ | | Absolute Return Multi-Asset Fund |
| ∎ | | Global Infrastructure Fund |
Total Portfolio Solutions
| ∎ | | Global Managed Beta Fund |
| ∎ | | Multi-Manager Non-Core Fixed Income Fund |
| ∎ | | Multi-Manager U.S. Dynamic Equity Fund |
| ∎ | | Multi-Manager Global Equity Fund |
| ∎ | | Multi-Manager International Equity Fund |
| ∎ | | Tactical Tilt Overlay Fund |
| ∎ | | Balanced Strategy Portfolio |
| ∎ | | Multi-Manager U.S. Small Cap Equity Fund |
| ∎ | | Multi-Manager Real Assets Strategy Fund |
| ∎ | | Growth and Income Strategy Portfolio |
| ∎ | | Growth Strategy Portfolio |
| ∎ | | Dynamic Global Equity Fund4 |
| ∎ | | Satellite Strategies Portfolio |
| ∎ | | Enhanced Dividend Global Equity Portfolio |
| ∎ | | Tax-Advantaged Global Equity Portfolio |
| ∎ | | Strategic Factor Allocation Fund |
| ∎ | | Target Date 2020 Portfolio |
| ∎ | | Target Date 2025 Portfolio |
| ∎ | | Target Date 2030 Portfolio |
| ∎ | | Target Date 2035 Portfolio |
| ∎ | | Target Date 2040 Portfolio |
| ∎ | | Target Date 2045 Portfolio |
| ∎ | | Target Date 2050 Portfolio |
| ∎ | | Target Date 2055 Portfolio |
| ∎ | | Target Date 2060 Portfolio |
| ∎ | | GQG Partners International Opportunities Fund |
| 1 | | You could lose money by investing in the Fund. Although the Fund seeks to preserve the value of your investment at $1.00 per share, it cannot guarantee it will do so. An investment in the Fund is not a deposit of a bank and is not insured or guaranteed by the Federal Deposit Insurance Corporation or any other government agency. The Fund’s sponsor has no legal obligation to provide financial support to the Fund, and you should not expect that the sponsor will provide financial support to the Fund at any time. |
| 2 | | You could lose money by investing in the Fund. Because the share price of the Fund will fluctuate, when you sell your shares they may be worth more or less than what you originally paid for them. The Fund may impose a fee upon sale of your shares or may temporarily suspend your ability to sell shares if the Fund’s liquidity falls below required minimums because of market conditions or other factors. An investment in the Fund is not a deposit of a bank and is not insured or guaranteed by the Federal Deposit Insurance Corporation or any other government agency. The Fund’s sponsor has no legal obligation to provide financial support to the Fund, and you should not expect that the sponsor will provide financial support to the Fund at any time. |
| 3 | | You could lose money by investing in the Fund. Although the Fund seeks to preserve the value of your investment at $1.00 per share, it cannot guarantee it will do so. The Fund may impose a fee upon sale of your shares or may temporarily suspend your ability to sell shares if the Fund’s liquidity falls below required minimums because of market conditions or other factors. An investment in the Fund is not a deposit of a bank and is not insured or guaranteed by the Federal Deposit Insurance Corporation or any other government agency. The Fund’s sponsor has no legal obligation to provide financial support to the Fund, and you should not expect that the sponsor will provide financial support to the Fund at any time. |
| 4 | | Effective after the close of business on February 28, 2019, the Goldman Sachs Equity Growth Strategy Portfolio was renamed the Goldman Sachs Dynamic Global Equity Fund. |
Financial Square FundsSM and Investor FundsSM are registered service marks of Goldman Sachs & Co. LLC.
| * | | This list covers open-end funds only. Please visit our website at www.GSAMFUNDS.com to learn about our closed-end funds and exchange-traded funds. |
| | |
TRUSTEES Jessica Palmer,Chair Kathryn A. Cassidy Diana M. Daniels James A. McNamara Roy W. Templin Gregory G. Weaver | | OFFICERS James A. McNamara,President Scott M. McHugh,Treasurer, Senior Vice President and Principal Financial Officer Joseph F. DiMaria,Assistant Treasurer and Principal Accounting Officer Caroline L. Kraus,Secretary |
| |
GOLDMAN SACHS & CO. LLC Distributor and Transfer Agent | | GOLDMAN SACHS ASSET MANAGEMENT, L.P. Investment Adviser |
Visit our web site atwww.GSAMFUNDS.com to obtain the most recent month-end returns.
Goldman Sachs Asset Management, L.P., 200 West Street, New York, New York 10282
Economic and market forecasts presented herein reflect our judgment as of the date of this presentation and are subject to change without notice. These forecasts do not take into account the specific investment objectives, restrictions, tax and financial situation or other needs of any specific client. Actual data will vary and may not be reflected here. These forecasts are subject to high levels of uncertainty that may affect actual performance. Accordingly, these forecasts should be viewed as merely representative of a broad range of possible outcomes. These forecasts are estimated, based on assumptions, and are subject to significant revision and may change materially as economic and market conditions change. Goldman Sachs has no obligation to provide updates or changes to these forecasts. Case studies and examples are for illustrative purposes only.
The reports concerning the Funds included in this shareholder report may contain certain forward-looking statements about the factors that may affect the performance of the Funds in the future. These statements are based on Fund management’s predictions and expectations concerning certain future events and their expected impact on the Funds, such as performance of the economy as a whole and of specific industry sectors, changes in the levels of interest rates, the impact of developing world events, and other factors that may influence the future performance of the Funds. Management believes these forward-looking statements to be reasonable, although they are inherently uncertain and difficult to predict. Actual events may cause adjustments in portfolio management strategies from those currently expected to be employed.
A description of the policies and procedures that the Funds use to determine how to vote proxies relating to portfolio securities and information regarding how a Fund voted proxies relating to portfolio securities during the most recent 12-month period ended June 30 is available (i) without charge, upon request by calling 1-800-526-7384 (for shareholders of Class A Shares or Class C Shares of a Fund) or 1-800-621-2550 (for shareholders of all other share classes of a Fund); and (ii) on the Securities and Exchange Commission (“SEC”) web site at http://www.sec.gov.
Each Fund files its complete schedule of portfolio holdings with the SEC for the first and third quarters of each fiscal year on Form N-Qs. The Funds’ Form N-Qs are available on the SEC’s web site at http://www.sec.gov within 60 days after the Fund’s first and third fiscal quarters. Form N-Qs may be obtained upon request and without charge by calling 1-800-526-7384 (for shareholders of Class A Shares or Class C Shares) or 1-800-621-2550 (for shareholders of all other share classes of a Fund).
Goldman Sachs & Co. LLC (‘‘Goldman Sachs’’) does not provide legal, tax or accounting advice. Any statement contained in this communication (including any attachments) concerning U.S. tax matters was not intended or written to be used, and cannot be used, for the purpose of avoiding penalties under the Internal Revenue Code, and was written to support the promotion or marketing of the transaction(s) or matter(s) addressed. Clients of Goldman Sachs should obtain their own independent tax advice based on their particular circumstances.
Fund holdings and allocations shown are as of February 28, 2019 and may not be representative of future investments. Fund holdings should not be relied on in making investment decisions and should not be construed as research or investment advice regarding particular securities. Current and future holdings are subject to risk.
Goldman Sachs Investor FundsSM is a service mark of Goldman Sachs & Co. LLC.
The portfolio risk management process includes an effort to monitor and manage risk, but does not imply low risk.
This material is not authorized for distribution to prospective investors unless preceded or accompanied by a current Prospectus or summary prospectus, if applicable. Investors should consider a Fund’s objective, risks, and charges and expenses, and read the summary prospectus, if available, and/or the Prospectus carefully before investing or sending money. The summary prospectus, if available, and the Prospectus contain this and other information about a Fund and may be obtained from your Intermediary or from Goldman Sachs & Co. LLC by calling (Class A Shares and Class C Shares – 1-800-526-7384) (all other share classes – 1-800-621-2550).
© 2019 Goldman Sachs. All rights reserved. 162570-OTU-960929 IMMITEMMSAR-19/2.3K
Goldman Sachs Funds

| | | | |
| | |
| Semi-Annual Report | | | | February 28, 2019 |
| | |
| | | | Strategic Factor Allocation Fund |
It is our intention that beginning on January 1, 2021, paper copies of the Portfolio’s annual and semi-annual shareholder reports will no longer be sent by mail, unless you specifically request paper copies of the reports from the Portfolio or from your financial intermediary. Instead, the reports will be made available on a website, and you will be notified by mail each time a report is posted and provided with a website link to access the report.
If you already elected to receive shareholder reports electronically, you will not be affected by this change and you need not take any action. At any time, you may elect to receive reports and certain communications from the Portfolio electronically by calling the applicable toll-free number below or by contacting your financial intermediary.
You may elect to receive all future shareholder reports in paper free of charge. If you hold shares of the Portfolio directly with the Portfolio’s transfer agent, you can inform the transfer agent that you wish to receive paper copies of reports by callingtoll-free 800-621-2550 for Institutional, Class R6 and Class P shareholders. If you hold shares of the Portfolio through a financial intermediary, please contact your financial intermediary to make this election. Your election to receive reports in paper will apply to all Goldman Sachs Funds held in your account if you invest through your financial intermediary or all Goldman Sachs Funds held with the Portfolio’s transfer agent if you invest directly with the transfer agent.

Goldman Sachs Strategic Factor Allocation Fund
| | | | |
| | | |
| NOT FDIC-INSURED | | May Lose Value | | No Bank Guarantee |
PORTFOLIO RESULTS
Goldman Sachs Strategic Factor Allocation Fund
Investment Objective
The Portfolio seeks long-term total return.
Portfolio Management Discussion and Analysis
Below, the Goldman Sachs Quantitative Investment Strategies Team (“QIS Team”) discusses the Goldman Sachs Strategic Factor Allocation Fund’s (the “Portfolio”) performance and positioning for thesix-month period ended February 28, 2019 (the “Reporting Period”).
| Q | | How did the Portfolio perform during the Reporting Period? |
| A | | During the Reporting Period, the Portfolio’s Institutional, Class P and Class R6 Shares generated cumulative total returns of-1.13%,-1.06% and-1.09%, respectively. This compares to the-0.28% cumulative total return of the Portfolio’s blended benchmark, the Strategic Factor Allocation Composite Index (the “Index”), which is composed 50% of the S&P 500® Index and 50% of the Bloomberg Barclays U.S. Aggregate Bond Index, during the same period. The components of the Portfolio’s blended benchmark, the S&P 500® Index and the Bloomberg Barclays U.S. Aggregate Bond Index, generated cumulative total returns of-3.04% and 1.99%, respectively, during the Reporting Period. |
| Q | | What economic and market factors most influenced the Portfolio as a whole during the Reporting Period? |
| A | | During the Reporting Period, global economic growth data, central bank monetary policy and geopolitics most influenced the financial markets and the Portfolio. U.S. equities lost ground, while the fixed income market recorded a gain. |
| | U.S. equities inched higher as the Reporting Period began in September 2018, driven by robust U.S. macroeconomic data relative to other developed markets and to emerging markets. Against a backdrop of solid economic growth, near-target inflation and healthy monthly job gains, the Federal Reserve (“Fed”) raised interest rates by 25 basis points, in line with market expectations. (A basis point is 1/100th of a percentage point.) The successful outcome of North American Free Trade Agreement negotiations to its new incarnation as the United States-Mexico-Canada Agreement near month end was also supportive of market sentiment. U.S. equities then fell in October 2018, as investor sentiment rapidly deteriorated on escalating trade and political uncertainty and in a delayed response to an earliersell-off in global interest rates. The retreat resulted in tighter U.S. financial conditions, which had been resilient to Fed interest rate hikes earlier in the calendar year. U.S. equities saw a reprieve in November 2018 on more accommodative comments from Fed Chair Jerome Powell and encouraging progress in U.S.-China trade talks. However, the recovery was short-lived. U.S. equities subsequently plunged in December 2018 on renewed investor fears sparked by the arrest of a Chinese technology executive, the partial U.S. federal government shutdown, the U.S. President’s criticism of Fed Chair Powell and reignited corporate earnings growth concerns. |
| | In January 2019, dovish Fed commentary indicating a possible pause in its rate hiking cycle, headlines of easing trade tensions and strong corporate earnings propelled U.S. equities higher despite the ongoing U.S. government shutdown and decelerating emerging markets demand. (Dovish commentary tends to suggest lower interest rates; opposite of hawkish.) Investor sentiment improved as the release of generally healthy U.S. economic data and corporate earnings suggested that U.S. equity markets had likely oversold at the end of 2018. Toward month end, U.S. equities were supported by a resolution to the long-lasting U.S. government shutdown. The Fed kept its monetary policy unchanged at its January meeting and maintained its dovish tilt, saying it would be “patient” about interest rate increases and describing inflationary pressures as “muted.” |
| | The U.S. equity market rally continued in February 2019, as corporate earnings growth remained solid, surpassing consensus expectations, which had been reduced at the end of 2018. Investors also rallied around news the deadline for further U.S. tariffs on Chinese goods would be extended given promising developments in deal negotiations. The Fed reaffirmed its dovish tone, announcing its intention to conclude its balance sheet unwind in the near future. (The |
1
PORTFOLIO RESULTS
| | Fed unwinds, or shrinks, its balance sheet by selling securities on its balance sheet and/or not reinvesting maturing securities.) Additionally, U.S. equity markets were positively surprised by the 2.6% Gross Domestic Product growth rate for the fourth quarter of 2018 reported at the end of the month. In further evidence of economic strength, U.S. unemployment remained low at 4.0%, and private payrolls grew by 296,000, beating the consensus estimate by 90,000. |
| | As for the fixed income markets, spread, ornon-government bond, sectors generally performed well in September 2018. U.S. economic growth remained strong, though some major economies, including those of the Eurozone, the U.K. and China, exhibited a gradual weakening trend. The Fed delivered the eighth interest rate hike of its current tightening cycle, with its dot plot pointing to another increase by the end of 2018 and three more during 2019. (The “dot plot” shows rate projections of the members of the Fed’s Open Market Committee.) Fed Chair Powell delivered an upbeat assessment of the U.S. economy, which supported market expectations for these additional Fed rate hikes in 2019. U.S. Treasury rates rose in response, followed, in turn, by the interest rates of several other developed markets countries. The U.S. dollar was broadly flat versus many major currencies during the month. |
| | During the fourth quarter of 2018, investor concerns about slowing global economic growth momentum as well as tighter financial conditions, mainly in the U.S., weighed on spread sector performance. In particular, U.S. corporate bonds experienced notable weakness, as credit spreads, or yield differentials versus U.S. Treasury securities, widened significantly. U.S. Treasury yields fell as investors grew fearful about the possible end of the global economic cycle and as their expectations for Fed rate hikes diminished. In December 2018, Fed policymakers raised short-term interest rates, much as the market had expected, but lowered their projection for 2019 monetary policy tightening from three rate hikes to two. U.S. economic activity data remained in expansionary territory during the fourth quarter but moderated from cycle highs. Headline inflation pressures eased as crude oil prices declined. The U.S. dollar appreciated relative to many major currencies in the fourth calendar quarter. |
| | Spread sectors generally posted gains in January 2019, as investor risk sentiment improved on the back of a more dovish Fed. Other factors supporting spread sector performance were higher crude oil prices, several upside corporate earnings surprises and somewhat positiveU.S.-China trade developments. The Fed left its monetary policy unchanged and eliminated language about “further gradual increases in rates,” cementing investor expectations for a near-term pause in short-term rate hikes. Fed Chair Powell emphasized the U.S. central bank would be largely guided by inflation indicators as well as by the global economic growth backdrop and the potential for financial market volatility. In January, the U.S. dollar weakened versus many major currencies. |
| | In February 2019, spread sectors continued to advance overall, supported by the accommodative stances of several global central banks and thede-escalation of U.S.-China trade tensions. In the U.S., the release of the minutes from the Fed’s January meeting confirmed policymakers’ dovish tilt. U.S. economic growth softened but continued to hold its own as global economic growth slowed. The U.S. dollar strengthened slightly versus many major currencies during February 2019. |
| Q | | What were the primary contributors to and detractors from the Portfolio’s performance during the Reporting Period? |
| A | The Portfolio seeks to achieve its investment objective through the implementation of the Goldman Sachs Strategic Factor Allocation process (“Strategic Allocation”), which is derived from the Goldman Sachs Investment Strategy Group’s (“ISG”) market views on a variety of asset classes and instruments. The Strategic Allocation was developed to provide exposure to “factors,” which are academically derived drivers of investment returns that the Goldman Sachs ISG believes offer the potential for greater and more consistent returns in various market environments. These factors include, but are not limited to, Equity, Term, Flow and Volatility. The Equity factor seeks to capture the premium associated with equity risk. The Term factor seeks to capture the premium associated with interest rate and inflation risk. The Flow factor seeks to systematically capitalize on flows within and across asset classes. The Volatility factor seeks to capture the “fear premium” associated with equity risk. (The fear premium is the amount investors tend to overpay to preserve capital during periods of financial market volatility.) The QIS Team implements the Strategic Allocation by investing primarily in derivatives; pooled investment vehicles, such as exchange-traded funds (“ETFs”), exchange-traded notes (“ETNs”) and underlying funds; and equities, fixed income and currencies. |
| | During the Reporting Period, the Strategic Allocation detracted from the Portfolio’s performance. On an absolute |
2
PORTFOLIO RESULTS
| | basis, the Equity, Volatility and Term factors hurt returns, while the Flow factor contributed positively. |
| | In terms of underlying asset classes and instruments, the Portfolio’s allocations to U.S. equity index options and U.S. fixed income detracted from returns. On the other hand, exposure to U.S. equities contributed most positively. The Portfolio’s allocations to developed markets currencies, accomplished through the use of forward foreign currency exchange contracts, generated mixed results overall. More specifically, the Portfolio benefited from its positions in the Swiss franc, British pound, Canadian dollar and euro, but this was partially offset by its position in the New Zealand dollar, which detracted. Allocations to the Australian dollar and Japanese yen did not have a meaningful impact on performance during the Reporting Period. |
| Q | | How was the Portfolio positioned at the beginning of the Reporting Period? |
| A | | In terms of its Strategic Allocation at the beginning of the Reporting Period, the Portfolio maintained equal weightings in the Equity, Term, Flow and Volatility factors. |
| | In terms of underlying asset classes and instruments, the Portfolio maintained positions in U.S. equities, listed U.S. equity index options and U.S. fixed income. In terms of currencies, it held long positions versus the U.S. dollar in the Canadian dollar and the euro. It held short positions relative to the U.S. dollar in the Australian dollar, British pound and the New Zealand dollar at the start of the Reporting Period. The Portfolio did not hold positions versus the U.S. dollar in the Swiss franc or Japanese yen at the beginning of the Reporting Period. |
| Q | | How did the Portfolio use derivatives and similar instruments during the Reporting Period? |
| A | | The Portfolio uses derivatives for both hedging andnon-hedging purposes in the implementation of the Strategic Allocation. During the Reporting Period, the Portfolio employed listed equity index options to implement views on the U.S. equity market, which had a negative impact on performance. It used bond futures to express views on the U.S. fixed income market, which detracted from returns. In addition, forward foreign currency exchange contracts, which were used to take long and short positions in select developed markets currencies, had a negative impact on the Portfolio’s results during the Reporting Period. |
| Q | | How was the Portfolio positioned at the end of the Reporting Period? |
| A | | In terms of its Strategic Allocation at the end of the Reporting Period, the Portfolio maintained equal weightings in the Equity, Flow and Volatility factors. It had a relatively smaller weighting in the Term factor. |
| | In terms of underlying asset classes and instruments, the Portfolio maintained positions in U.S. equities, listed U.S. equity index options and U.S. fixed income. In terms of currencies, it held long positions versus the U.S. dollar in the euro, Canadian dollar and Japanese yen. It held short positions relative to the U.S. dollar in the Australian dollar, Swiss franc and New Zealand dollar. The Portfolio did not hold a position in the British pound versus the U.S. dollar at the end of the Reporting Period. |
| Q | | What was the Portfolio’s strategy at the end of the Reporting Period? |
| A | | Going forward, the QIS Team plans to continue implementing the Goldman Sachs Strategic Factor Allocation process as it seeks long-term total return. |
3
PORTFOLIO BASICS
Strategic Factor Allocation Fund
as of February 28, 2019
| | | | | | | | | | | | | | | | | | |
| | PERFORMANCE REVIEW | | | | | | | | | | | | | |
| | | | | |
| | | September 1, 2018–February 28, 2019 | | Portfolio Total
Return
(based on NAV)1 | | | Strategic Factor
Allocation
Composite
Index2 | | | S&P 500®
Index3 | | | Bloomberg
Barclays U.S.
Aggregate Bond
Index4 | |
| | | | | |
| | Institutional | | | -1.13 | % | | | -0.28 | % | | | -3.04 | % | | | 1.99 | % |
| | Class P | | | -1.06 | | | | -0.28 | | | | -3.04 | | | | 1.99 | |
| | | Class R6 | | | -1.09 | | | | -0.28 | | | | -3.04 | | | | 1.99 | |
| | 1 | | The net asset value (“NAV”) represents the net assets of the class of the Portfolio(ex-dividend) divided by the total number of shares of the class outstanding. The Portfolio’s performance assumes the reinvestment of dividends and other distributions. The Portfolio’s performance does not reflect the deduction of any applicable sales charges. |
| | 2 | | The Strategic Factor Allocation Composite Index is a blend of 50% the S&P 500® Index and 50% the Bloomberg Barclays U.S. Aggregate Bond Index. It is not possible to invest in an unmanaged index. |
| | 3 | | The S&P 500® Index is the Standard & Poor’s Composite Index of 500 stocks, an unmanaged index of common stock prices. The index figure does not reflect any deduction for fees, expenses or taxes. It is not possible to invest directly in an index. |
| | 4 | | The Bloomberg Barclays U.S. Aggregate Bond Index represents an unmanaged diversified portfolio of fixed income securities, including U.S. Treasuries, investment-grade corporate bonds and mortgage-backed and asset-backed securities. The index figure does not reflect any deduction for fees, expenses or taxes. It is not possible to invest directly in an index. |
| | | | | | | | | | | | |
| | STANDARDIZED TOTAL RETURNS5 | | | | | | | |
| | | | |
| | | For the period ended 12/31/18 | | One Year | | | Since Inception | | | Inception Date |
| | | | |
| | Institutional | | | -3.62 | % | | | 3.91 | % | | 5/31/16 |
| | Class P | | | N/A | | | | -1.29 | | | 4/17/18 |
| | | Class R6 | | | -3.71 | | | | -3.68 | | | 12/29/17 |
| | 5 | | The Standardized Total Returns are average annual total returns or cumulative total returns (only if the performance period is one year or less) as of the most recent calendar quarter-end. They assume reinvestment of all distributions at NAV. Because Institutional, Class P and Class R6 Shares do not involve a sales charge, such a charge is not applied to their Standardized Total Returns. |
The returns set forth in the tables above represent past performance. Past performance does not guarantee future results. The Portfolio’s investment return and principal value will fluctuate so that an investor’s shares, when redeemed, may be worth more or less than their original cost. Current performance may be lower or higher than the performance quoted above. Please visit our web site at www.GSAMFUNDS.com to obtain the most recent month-end returns.Performance reflects applicable fee waivers and/or expense limitations in effect during the periods shown. In their absence, performance would be reduced. Returns do not reflect the deduction of taxes that a shareholder would pay on Portfolio distributions or the redemption of Portfolio shares.
4
PORTFOLIO BASICS
| | | | | | | | | | |
| | EXPENSE RATIOS6 | | | | | |
| | | |
| | | | | Net Expense Ratio (Current) | | | Gross Expense Ratio (Before Waivers) | |
| | | |
| | Institutional | | | 0.85 | % | | | 0.93 | % |
| | Class P | | | 0.84 | | | | 0.92 | |
| | | Class R6 | | | 0.84 | | | | 0.92 | |
| | 6 | | The expense ratios of the Portfolio, both current (net of applicable fee waivers and/or expense limitations) and before waivers (gross of applicable fee waivers and/or expense limitations) are as set forth above according to the most recent publicly available Prospectus for the Portfolio and may differ from the expense ratios disclosed in the Financial Highlights in this report. Pursuant to contractual arrangements, the Portfolio’s waivers and/or expense limitations will remain in place through at least December 28, 2019, and prior to such date Goldman Sachs Asset Management, L.P., the Portfolio’s investment adviser, may not terminate the arrangements without the approval of the Portfolio’s Board of Trustees. If these arrangements are discontinued in the future, the expense ratios may change without shareholder approval. |
| | | | | | | | |
| | HOLDINGS AS OF 2/28/197 | | | | | | |
| | | |
| | | Holding | | % of Net Assets | | | Line of Business |
| | | |
| | Goldman Sachs Financial Square Government Fund — Institutional Shares | | | 53.9 | % | | Investment Companies |
| | | SPDR S&P 500 ETF Trust | | | 44.2 | | | Exchange Traded Funds |
| | 7 | | The holdings may not be representative of the Portfolio’s future investments. Figures in the table above may not sum to 100% due to the exclusion of other assets and liabilities. |
5
GOLDMAN SACHS STRATEGIC FACTOR ALLOCATION FUND
Schedule of Investments
February 28, 2019 (Unaudited)
| | | | | | | | |
| Shares | | | Description | | Value | |
| |
| Exchange Traded Fund – 44.2% | | | |
| | 2,491,295 | | | SPDR S&P 500 ETF Trust | | $ | 694,274,090 | |
| | (Cost $659,950,682) | | | | |
| | |
| | | | | | | | |
| Shares | | | Dividend
Rate | | Value | |
| |
| Investment Company(a) – 53.9% | | | |
| Goldman Sachs Financial Square Government Fund –
Institutional Shares |
|
| | 844,974,227 | | | 2.395% | | $ | 844,974,227 | |
| | (Cost $844,974,227) | | | | | | | |
| | |
| | TOTAL INVESTMENTS – 98.1% | | | | |
| | (Cost $1,504,924,909) | | $ | 1,539,248,317 | |
| | |
| OTHER ASSETS IN EXCESS OF
LIABILITIES – 1.9% | | | 29,066,593 | |
| | |
| | NET ASSETS – 100.0% | | $ | 1,568,314,910 | |
| | |
| | |
|
| The percentage shown for each investment category reflects the value of investments in that category as a percentage of net assets. |
| |
(a) | | Represents an affiliated fund. |
| | |
|
Currency Abbreviations: |
AUD | | —Australian Dollar |
CAD | | —Canadian Dollar |
CHF | | —Swiss Franc |
EUR | | —Euro |
JPY | | —Japanese Yen |
NZD | | —New Zealand Dollar |
USD | | —U.S. Dollar |
|
Investment Abbreviations: |
ETF | | —Exchange Traded Fund |
PLC | | —Public Limited Company |
|
|
| ADDITIONAL INVESTMENT INFORMATION |
FORWARD FOREIGN CURRENCY EXCHANGE CONTRACTS — At February 28, 2019, the Portfolio had the following forward foreign currency exchange contracts:
FORWARD FOREIGN CURRENCY EXCHANGE CONTRACTS WITH UNREALIZED GAIN
| | | | | | | | | | | | | | | | | | | | | | | | |
| Counterparty | | Currency
Purchased | | | Currency
Sold | | | Settlement
Date | | | Unrealized
Gain | |
| | | | | | |
MS & Co. Int. PLC | | | CAD | | | | 19,980,000 | | | | USD | | | | 15,155,483 | | | | 03/25/19 | | | $ | 37,117 | |
| | | | | | |
| | | EUR | | | | 26,670,000 | | | | USD | | | | 30,386,819 | | | | 03/25/19 | | | | 14,960 | |
| | | | | | |
| | | USD | | | | 103,383,672 | | | | AUD | | | | 145,200,000 | | | | 03/25/19 | | | | 339,379 | |
| | | | | | |
| | | | USD | | | | 51,259,977 | | | | NZD | | | | 75,080,000 | | | | 03/25/19 | | | | 102,857 | |
| | | | | | |
| TOTAL | | | | | | | | | | | | | | | | | | | | | | $ | 494,313 | |
FORWARD FOREIGN CURRENCY EXCHANGE CONTRACTS WITH UNREALIZED LOSS
| | | | | | | | | | | | | | | | | | | | | | | | |
| Counterparty | | Currency
Purchased | | | Currency
Sold | | | Settlement
Date | | | Unrealized
Loss | |
| | | | | | |
MS & Co. Int. PLC | | | JPY | | | | 1,683,590,000 | | | | USD | | | | 15,225,975 | | | | 03/25/19 | | | $ | (90,690 | ) |
| | | | | | |
| | | | USD | | | | 51,850,105 | | | | CHF | | | | 51,680,000 | | | | 03/25/19 | | | | (57,476 | ) |
| | | | | | |
| TOTAL | | | | | | | | | | | | | | | | | | | | | | $ | (148,166 | ) |
FUTURES CONTRACTS — At February 28, 2019, the Portfolio had the following futures contracts:
| | | | | | | | | | | | | | |
| Type | | Number of
Contracts | | Expiration
Date | | | Notional
Amount | | | Unrealized
Appreciation/
(Depreciation) | |
Long position contracts: | | | | | | | | | | |
| | | | |
Ultra Long U.S. Treasury Bonds | | 1,892 | | | 06/19/19 | | | $ | 301,951,375 | | | $ | (4,321,033 | ) |
| | |
| 6 | | The accompanying notes are an integral part of these financial statements. |
GOLDMAN SACHS STRATEGIC FACTOR ALLOCATION FUND
|
| ADDITIONAL INVESTMENT INFORMATION (continued) |
WRITTEN OPTIONS CONTRACTS — At February 28, 2019, the Portfolio had the following written options:
EXCHANGE TRADED OPTIONS ON EQUITIES CONTRACTS
| | | | | | | | | | | | | | | | | | | | | | | | | | | | |
| Description | | Exercise
Price | | | Expiration
Date | | | Number of
Contracts | | | Notional
Amount | | | Market
Value | | | Premiums
Paid (Received)
by Portfolio | | | Unrealized
Appreciation/
(Depreciation) | |
Written option contracts | | | | | | | | | | | | | |
Puts | | | | | | | | | | | | | | | | | | | | | | | | | | | | |
| | | | | | | |
S&P 500 Index | | $ | 2,665.00 | | | | 04/18/2019 | | | | (1,178 | ) | | $ | (117,800) | | | $ | (2,361,890 | ) | | $ | (2,658,064 | ) | | $ | 296,174 | |
| | | | | | | |
S&P 500 Index | | | 2,680.00 | | | | 04/18/2019 | | | | (2,349 | ) | | | (234,900) | | | | (5,214,780 | ) | | | (4,954,283 | ) | | | (260,497 | ) |
| | | | | | | |
S&P 500 Index | | | 2,615.00 | | | | 03/15/2019 | | | | (1,187 | ) | | | (118,700) | | | | (379,840 | ) | | | (1,931,922 | ) | | | 1,552,082 | |
| | | | | |
| TOTAL | | | | (4,714 | ) | | $ | (471,400) | | | $ | (7,956,510 | ) | | $ | (9,544,269 | ) | | $ | 1,587,759 | |
| | |
|
Abbreviations: |
| MS & Co. Int. PLC | | —Morgan Stanley & Co. International PLC |
|
| | |
| The accompanying notes are an integral part of these financial statements. | | 7 |
GOLDMAN SACHS STRATEGIC FACTOR ALLOCATION FUND
Statement of Assets and Liabilities
February 28, 2019 (Unaudited)
| | | | | | |
| | | | | | |
| | Assets: | |
| | |
| | Investments of unaffiliated issuers, at value (cost $659,950,682) | | $ | 694,274,090 | |
| | |
| | Investments of affiliated issuers, at value (cost $844,974,227) | | | 844,974,227 | |
| | |
| | Cash | | | 44,215,290 | |
| | |
| | Unrealized gain on forward foreign currency exchange contracts | | | 494,313 | |
| | |
| | Receivables: | | | | |
| | |
| | Collateral on certain derivative contracts(a) | | | 142,200,307 | |
| | |
| | Investments sold | | | 18,815,637 | |
| | |
| | Dividends | | | 1,502,412 | |
| | |
| | Portfolio shares sold | | | 1,040,500 | |
| | |
| | Other assets | | | 101,803 | |
| | |
| | Total assets | | | 1,747,618,579 | |
| | | | | | |
| | Liabilities: | |
| | Unrealized loss on forward foreign currency exchange contracts | | | 148,166 | |
| | |
| | Variation margin on futures | | | 802,198 | |
| | |
| | Written option contracts, at value (premium received $9,544,269) | | | 7,956,510 | |
| | |
| | Payables: | | | | |
| | |
| | Investments purchased | | | 163,741,917 | |
| | |
| | Portfolio shares redeemed | | | 5,723,204 | |
| | |
| | Management fees | | | 801,104 | |
| | |
| | Transfer Agency fees | | | 36,293 | |
| | |
| | Accrued expenses | | | 94,277 | |
| | |
| | Total liabilities | | | 179,303,669 | |
| | | | | | |
| | Net Assets: | | | | |
| | |
| | Paid-in capital | | | 1,635,716,917 | |
| | Total distributable loss | | | (67,402,007 | ) |
| | | NET ASSETS | | $ | 1,568,314,910 | |
| | | Net Assets: | | | | |
| | | Institutional | | $ | 9,938,649 | |
| | | Class P | | | 1,558,366,231 | |
| | | Class R6 | | | 10,030 | |
| | | Total Net Assets | | $ | 1,568,314,910 | |
| | | Shares Outstanding $0.001 par value (unlimited number of shares authorized): | | | | |
| | | Institutional | | | 946,444 | |
| | | Class P | | | 149,805,698 | |
| | | Class R6 | | | 964 | |
| | | Net asset value, offering and redemption price per share: | | | | |
| | | Institutional | | | $10.50 | |
| | | Class P | | | 10.40 | |
| | | Class R6 | | | 10.41 | |
| | (a) | | Includes amounts segregated for initial margin requirements and/or collateral on futures, options and forward foreign currency exchange contract transactions of $7,596,380, $131,713,927 and $2,890,000, respectively. |
| | |
| 8 | | The accompanying notes are an integral part of these financial statements. |
GOLDMAN SACHS STRATEGIC FACTOR ALLOCATION FUND
Statement of Operations
For the Six Months Ended February 28, 2019 (Unaudited)
| | | | | | |
| | | | | | |
| | Investment income: | | | | |
| | |
| | Dividends — unaffiliated issuers | | $ | 3,283,368 | |
| | |
| | Dividends — affiliated issuers | | | 13,156,494 | |
| | |
| | Interest | | | 164,726 | |
| | |
| | Securities lending income — affiliated issuer | | | 10,550 | |
| | |
| | Total investment income | | | 16,615,138 | |
| | | | | | |
| | Expenses: | | | | |
| | |
| | Management fees | | | 7,242,942 | |
| | |
| | Transfer Agency fees(a) | | | 292,558 | |
| | |
| | Registration fees | | | 95,432 | |
| | |
| | Custody, accounting and administrative services | | | 72,665 | |
| | |
| | Professional fees | | | 65,708 | |
| | |
| | Printing and mailing costs | | | 42,368 | |
| | |
| | Prime Broker Fees | | | 16,154 | |
| | |
| | Trustee fees | | | 10,075 | |
| | |
| | Other | | | 24,055 | |
| | |
| | Total expenses | | | 7,861,957 | |
| | |
| | Less — expense reductions | | | (994,223 | ) |
| | |
| | Net expenses | | | 6,867,734 | |
| | |
| | NET INVESTMENT INCOME | | | 9,747,404 | |
| | | | | | |
| | Realized and unrealized gain (loss): | | | | |
| | |
| | Net realized gain (loss) from: | | | | |
| | |
| | Investments — unaffiliated issuers | | | 11,139,183 | |
| | |
| | Futures contracts | | | (16,172,743 | ) |
| | |
| | Written options | | | (38,627,645 | ) |
| | |
| | Forward foreign currency exchange contracts | | | 6,181 | |
| | |
| | Foreign currency transactions | | | (3,322,315 | ) |
| | |
| | Net change in unrealized loss on: | | | | |
| | |
| | Investments — unaffiliated issuers | | | (14,720,617 | ) |
| | |
| | Futures contracts | | | (7,845,421 | ) |
| | |
| | Written options | | | (1,447,910 | ) |
| | |
| | Forward foreign currency exchange contracts | | | (985,917 | ) |
| | |
| | Net realized and unrealized gain (loss) | | | (71,977,204 | ) |
| | |
| | NET DECREASE IN NET ASSETS RESULTING FROM OPERATIONS | | $ | (62,229,800 | ) |
| | (a) | | Class specific Transfer Agency fees were as follows: |
| | | | | | | | | | |
| Transfer Agency Fees | |
Institutional | | | Class P | | | Class R6 | |
| $ | 3,149 | | | $ | 289,407 | | | $ | 2 | |
| | |
| The accompanying notes are an integral part of these financial statements. | | 9 |
GOLDMAN SACHS STRATEGIC FACTOR ALLOCATION FUND
Statements of Changes in Net Assets
| | | | | | | | | | |
| | | | | For the Six Months Ended
February 28, 2019
(Unaudited) | | | For the Fiscal
Year Ended
August 31, 2018 | |
| | From operations: | | | | | | | | |
| | | |
| | Net investment income | | $ | 9,747,404 | | | $ | 12,681,424 | |
| | | |
| | Net realized gain (loss) | | | (46,977,339 | ) | | | 58,522,161 | |
| | | |
| | Net change in unrealized gain (loss) | | | (24,999,865 | ) | | | 30,575,292 | |
| | | |
| | Net increase (decrease) in net assets resulting from operations | | | (62,229,800 | ) | | | 101,778,877 | |
| | | | | | | | | | |
| | Distributions to shareholders: | | | | | | | | |
| | | |
| | From distributable earnings: | | | | | | | | |
| | | |
| | Institutional Shares | | | (935,279 | ) | | | (47,358,676 | )(a) |
| | | |
| | Class P Shares | | | (118,182,472 | ) | | | — | |
| | | |
| | Class R6 Shares | | | (638 | ) | | | — | |
| | | |
| | Total distributions to shareholders | | | (119,118,389 | ) | | | (47,358,676 | ) |
| | | | | | | | | | |
| | From share transactions: | | | | | | | | |
| | | |
| | Proceeds from sales of shares | | | 159,977,907 | | | | 3,709,070,464 | |
| | | |
| | Reinvestment of distributions | | | 119,118,391 | | | | 47,358,677 | |
| | | |
| | Cost of shares redeemed | | | (1,016,967,627 | ) | | | (2,782,548,551 | ) |
| | | |
| | Net increase (decrease) in net assets resulting from share transactions | | | (737,871,329 | ) | | | 973,880,590 | |
| | | |
| | TOTAL INCREASE (DECREASE) | | | (919,219,518 | ) | | | 1,028,300,791 | |
| | | | | | | | | | |
| | Net assets:(b) | | | | | | | | |
| | | |
| | Beginning of period | | | 2,487,534,428 | | | | 1,459,233,637 | |
| | | |
| | End of period | | $ | 1,568,314,910 | | | $ | 2,487,534,428 | |
| | (a) | | Prior year information has been revised to conform with current year presentation. Distributions to shareholders for the Portfolio consisted of $2,205,857 of net investment income and $45,152,819 of net realized gains for the fiscal year ended August 31, 2018. |
| | (b) | | Prior year information has been revised to conform with current year presentation. Undistributed net investment income was $14,035,031 for the Portfolio as of August 31, 2018. |
| | |
| 10 | | The accompanying notes are an integral part of these financial statements. |
GOLDMAN SACHS STRATEGIC FACTOR ALLOCATION FUND
Financial Highlights
Selected Share Data for a Share Outstanding Throughout Each Period
| | | | | | | | | | | | | | | | | | |
| | | | | Goldman Sachs Strategic Factor Allocation Fund | |
| | | | | Institutional Shares | |
| | | | | Six Months Ended
February 28, 2019 (Unaudited) | | | Year Ended August 31, | | | Period Ended
August 31, 2016(a) | |
| | | | | 2018 | | | 2017 | |
| | Per Share Data | | | | | | | | | | | | | | | | |
| | | | | |
| | Net asset value, beginning of period | | $ | 11.26 | | | $ | 10.96 | | | $ | 10.34 | | | $ | 10.00 | |
| | | | | |
| | Net investment income (loss)(b) | | | 0.05 | | | | 0.06 | | | | — | (c) | | | (0.01 | ) |
| | | | | |
| | Net realized and unrealized gain (loss) | | | (0.20 | ) | | | 0.50 | | | | 0.70 | | | | 0.35 | |
| | | | | |
| | Total from investment operations | | | (0.15 | ) | | | 0.56 | | | | 0.70 | | | | 0.34 | |
| | | | | |
| | Distributions to shareholders from net investment income | | | — | | | | (0.01 | ) | | | (0.00 | )(c) | | | — | |
| | | | | |
| | Distributions to shareholders from net realized gains | | | (0.61 | ) | | | (0.25 | ) | | | (0.08 | ) | | | — | |
| | | | | |
| | Total distributions | | | (0.61 | ) | | | (0.26 | ) | | | (0.08 | ) | | | — | |
| | | | | |
| | Net asset value, end of period | | $ | 10.50 | | | $ | 11.26 | | | $ | 10.96 | | | $ | 10.34 | |
| | | | | |
| | Total return(d) | | | (1.13 | )% | | | 5.18 | % | | | 6.88 | % | | | 3.40 | % |
| | | | | |
| | Net assets, end of period (in 000s) | | $ | 9,939 | | | $ | 20,035 | | | $ | 1,459,234 | | | $ | 338,592 | |
| | | | | |
| | Ratio of net expenses to average net assets | | | 0.72 | %(e) | | | 0.71 | % | | | 0.74 | % | | | 0.87 | %(e) |
| | | | | |
| | Ratio of total expenses to average net assets | | | 0.82 | %(e) | | | 0.80 | % | | | 0.84 | % | | | 1.07 | %(e) |
| | | | | |
| | Ratio of net investment income to average net assets | | | 1.00 | %(e) | | | 0.59 | % | | | 0.01 | % | | | 0.51 | %(e) |
| | | | | |
| | Portfolio turnover rate(f) | | | 554 | % | | | 725 | % | | | 589 | % | | | 86 | % |
| | (a) | | Commenced operations on May 31, 2016. |
| | (b) | | Calculated based on the average shares outstanding methodology. |
| | (c) | | Amount is less than $0.005 per share. |
| | (d) | | Assumes investment at the NAV at the beginning of the period, reinvestment of all dividends and distributions, a complete redemption of the investment at the NAV at the end of the period and no sales or redemption charges. Total returns would be reduced if a sales or redemption charge was taken into account. Returns do not reflect the impact of taxes to shareholder relating to Portfolio distributions or the redemption of Portfolio shares. Total returns for periods less than one full year are not annualized. |
| | (f) | | The Portfolio’s portfolio turnover rate is calculated in accordance with regulatory requirements, without regard to transactions involving short term investments and certain derivatives. If such transactions were included, the Portfolio’s portfolio turnover rate may be higher. |
| | |
| The accompanying notes are an integral part of these financial statements. | | 11 |
GOLDMAN SACHS STRATEGIC FACTOR ALLOCATION FUND
Financial Highlights(continued)
Selected Share Data for a Share Outstanding Throughout Each Period
| | | | | | | | | | |
| | | | | Goldman Sachs Strategic Factor Allocation Fund | |
| | | | | Class P Shares | |
| | | | | Six Months Ended
February 28, 2019 (Unaudited) | | | Period Ended
August 31, 2018(a) | |
| | Per Share Data | | | | | | | | |
| | | |
| | Net asset value, beginning of period | | $ | 11.26 | | | $ | 10.83 | |
| | | |
| | Net investment income(b) | | | 0.05 | | | | 0.02 | |
| | | |
| | Net realized and unrealized gain (loss) | | | (0.21 | ) | | | 0.41 | |
| | | |
| | Total from investment operations | | | (0.16 | ) | | | 0.43 | |
| | | |
| | Distributions to shareholders from net investment income | | | (0.09 | ) | | | — | |
| | | |
| | Distributions to shareholders from net realized gains | | | (0.61 | ) | | | — | |
| | | |
| | Total distributions | | | (0.70 | ) | | | — | |
| | | |
| | Net asset value, end of period | | $ | 10.40 | | | $ | 11.26 | |
| | | |
| | Total return(c) | | | (1.06 | )% | | | 3.97 | % |
| | | |
| | Net assets, end of period (in 000s) | | $ | 1,558,366 | | | $ | 2,467,490 | |
| | | |
| | Ratio of net expenses to average net assets(d) | | | 0.71 | % | | | 0.71 | % |
| | | |
| | Ratio of total expenses to average net assets(d) | | | 0.81 | % | | | 0.80 | % |
| | | |
| | Ratio of net investment income to average net assets(d) | | | 1.00 | % | | | 0.40 | % |
| | | |
| | Portfolio turnover rate(e) | | | 554 | % | | | 725 | % |
| | (a) | | Commenced operations on April 17, 2018. |
| | (b) | | Calculated based on the average shares outstanding methodology. |
| | (c) | | Assumes investment at the NAV at the beginning of the period, reinvestment of all dividends and distributions, a complete redemption of the investment at the NAV at the end of the period and no sales or redemption charges. Total returns would be reduced if a sales or redemption charge was taken into account. Returns do not reflect the impact of taxes to shareholder relating to Portfolio distributions or the redemption of Portfolio shares. Total returns for periods less than one full year are not annualized. |
| | (e) | | The Portfolio’s portfolio turnover rate is calculated in accordance with regulatory requirements, without regard to transactions involving short term investments and certain derivatives. If such transactions were included, the Portfolio’s portfolio turnover rate may be higher. |
| | |
| 12 | | The accompanying notes are an integral part of these financial statements. |
GOLDMAN SACHS STRATEGIC FACTOR ALLOCATION FUND
Financial Highlights(continued)
Selected Share Data for a Share Outstanding Throughout Each Period
| | | | | | | | | | |
| | | | | Goldman Sachs Strategic Factor Allocation Fund | |
| | | | | Class R6 Shares | |
| | | | | Six Months Ended
February 28, 2019
(Unaudited) | | | Period Ended
August 31, 2018(a) | |
| | Per Share Data | | | | | | | | |
| | | |
| | Net asset value, beginning of period | | $ | 11.26 | | | $ | 11.10 | |
| | | |
| | Net investment income(b) | | | 0.05 | | | | 0.04 | |
| | | |
| | Net realized and unrealized gain (loss) | | | (0.20 | ) | | | 0.12 | |
| | | |
| | Total from investment operations | | | (0.15 | ) | | | 0.16 | |
| | | |
| | Distributions to shareholders from net investment income | | | (0.09 | ) | | | — | |
| | | |
| | Distributions to shareholders from net realized gains | | | (0.61 | ) | | | — | |
| | | |
| | Total distributions | | | (0.70 | ) | | | — | |
| | | |
| | Net asset value, end of period | | $ | 10.41 | | | $ | 11.26 | |
| | | |
| | Total return(c) | | | (1.09 | )% | | | 1.44 | % |
| | | |
| | Net assets, end of period (in 000s) | | $ | 10 | | | $ | 10 | |
| | | |
| | Ratio of net expenses to average net assets(d) | | | 0.69 | % | | | 0.69 | % |
| | | |
| | Ratio of total expenses to average net assets(d) | | | 0.79 | % | | | 0.79 | % |
| | | |
| | Ratio of net investment income to average net assets(d) | | | 0.98 | % | | | 0.58 | % |
| | | |
| | Portfolio turnover rate(e) | | | 554 | % | | | 725 | % |
| | (a) | | Commenced operations on December 29, 2017. |
| | (b) | | Calculated based on the average shares outstanding methodology. |
| | (c) | | Assumes investment at the NAV at the beginning of the period, reinvestment of all dividends and distributions, a complete redemption of the investment at the NAV at the end of the period and no sales or redemption charges. Total returns would be reduced if a sales or redemption charge was taken into account. Returns do not reflect the impact of taxes to shareholder relating to Portfolio distributions or the redemption of Portfolio shares. Total returns for periods less than one full year are not annualized. |
| | (e) | | The Portfolio’s portfolio turnover rate is calculated in accordance with regulatory requirements, without regard to transactions involving short term investments and certain derivatives. If such transactions were included, the Portfolio’s portfolio turnover rate may be higher. |
| | |
| The accompanying notes are an integral part of these financial statements. | | 13 |
GOLDMAN SACHS STRATEGIC FACTOR ALLOCATION FUND
Notes to Financial Statements
February 28, 2019 (Unaudited)
Goldman Sachs Trust (the “Trust”) is a Delaware statutory trust registered under the Investment Company Act of 1940, as amended (the “Act”), as an open-end management investment company. Goldman Sachs Strategic Factor Allocation Fund (the “Portfolio”) is a non-diversified portfolio and currently offers three classes of shares — Institutional, Class P, and Class R6 Shares. Goldman Sachs Asset Management, L.P. (“GSAM”), an affiliate of Goldman Sachs & Co. LLC (“Goldman Sachs”), serves as investment adviser to the Portfolio pursuant to a management agreement (the “Agreement”) with the Trust.
|
| 2. SIGNIFICANT ACCOUNTING POLICIES |
The financial statements have been prepared in accordance with accounting principles generally accepted in the United States of America (“GAAP”) and require management to make estimates and assumptions that may affect the reported amounts and disclosures. Actual results may differ from those estimates and assumptions.
A. Investment Valuation — The Portfolio’s valuation policy is to value investments at fair value.
B. Investment Income and Investments — Investment income includes interest income, dividend income, and securities lending income, if any. Interest income is accrued daily and adjusted for amortization of premiums and accretion of discounts. Dividend income is recognized on ex-dividend date or, for certain foreign securities, as soon as such information is obtained subsequent to the ex-dividend date. Investment transactions are reflected on trade date. Realized gains and losses are calculated using identified cost. Investment transactions are recorded on the following business day for daily net asset value (“NAV”) calculations. For derivative contracts, realized gains and losses are recorded upon settlement of the contract.
C. Class Allocations and Expenses — Investment income, realized and unrealized gain (loss), if any, and non-class specific expenses of the Portfolio are allocated daily based upon the proportion of net assets of each class. Non-class specific expenses directly incurred by the Portfolio are charged to the Portfolio, while such expenses incurred by the Trust are allocated across the Portfolio on a straight-line and/or pro-rata basis depending upon the nature of the expenses. Class specific expenses, where applicable, are borne by the respective share classes and include Transfer Agency fees.
D. Federal Taxes and Distributions to Shareholders — It is the Portfolio’s policy to comply with the requirements of the Internal Revenue Code of 1986, as amended (the “Code”), applicable to regulated investment companies and to distribute each year substantially all of its investment company taxable income and capital gains to its shareholders. Accordingly, the Portfolio is not required to make any provisions for the payment of federal income tax. Distributions to shareholders are recorded on the ex-dividend date. Income and capital gains distributions, if any, are declared and paid annually.
Net capital losses, if any, are carried forward to future fiscal years and may be used to the extent allowed by the Code to offset any future capital gains. Losses that are carried forward will retain their character as either short-term or long-term capital losses. Utilization of capital loss carryforwards will reduce the requirement of future capital gains distributions.
The characterization of distributions to shareholders for financial reporting purposes is determined in accordance with federal income tax rules, which may differ from GAAP. The source of the Portfolio’s distributions may be shown in the accompanying financial statements as either from distributable earnings or capital. Certain components of the Portfolio’s net assets on the Statement of Assets and Liabilities reflect permanent GAAP/tax differences based on the appropriate tax character.
E. Foreign Currency Translation — The accounting records and reporting currency of the Portfolio are maintained in U.S. dollars. Assets and liabilities denominated in foreign currencies are translated into U.S. dollars using the current exchange rates at the close of each business day. The effect of changes in foreign currency exchange rates on investments is included within net realized and unrealized gain (loss) on investments. Changes in the value of other assets and liabilities as a result of fluctuations in foreign exchange rates are included in the Statement of Operations within net change in unrealized gain (loss) on foreign currency translation. Transactions denominated in foreign currencies are translated into U.S. dollars on the date the transaction occurred, the effects of which are included within net realized gain (loss) on foreign currency transactions.
14
GOLDMAN SACHS STRATEGIC FACTOR ALLOCATION FUND
|
| 3. INVESTMENTS AND FAIR VALUE MEASUREMENTS |
U.S. GAAP defines the fair value of a financial instrument as the amount that would be received to sell an asset or paid to transfer a liability in an orderly transaction between market participants at the measurement date (i.e., the exit price); the Portfolio’s policy is to use the market approach. GAAP establishes a fair value hierarchy that prioritizes the inputs to valuation techniques used to measure fair value. The hierarchy gives the highest priority to unadjusted quoted prices in active markets for identical assets or liabilities (Level 1 measurements) and the lowest priority to unobservable inputs (Level 3 measurements). The levels used for classifying investments are not necessarily an indication of the risk associated with investing in these investments. The three levels of the fair value hierarchy are described below:
Level 1 — Unadjusted quoted prices in active markets that are accessible at the measurement date for identical, unrestricted assets or liabilities;
Level 2 — Quoted prices in markets that are not active or financial instruments for which significant inputs are observable (including, but not limited to, quoted prices for similar investments, interest rates, foreign exchange rates, volatility and credit spreads), either directly or indirectly;
Level 3 — Prices or valuations that require significant unobservable inputs (including GSAM’s assumptions in determining fair value measurement).
The Board of Trustees (“Trustees”) has approved Valuation Procedures that govern the valuation of the portfolio investments held by the Portfolio, including investments for which market quotations are not readily available. The Trustees have delegated to GSAM day-to-day responsibility for implementing and maintaining internal controls and procedures related to the valuation of the Portfolio’s investments. To assess the continuing appropriateness of pricing sources and methodologies, GSAM regularly performs price verification procedures and issues challenges as necessary to third party pricing vendors or brokers, and any differences are reviewed in accordance with the Valuation Procedures.
A. Level 1 and Level 2 Fair Value Investments — The valuation techniques and significant inputs used in determining the fair values for investments classified as Level 1 and Level 2 are as follows:
Underlying Funds (including Money Market Funds) — Underlying Funds (“Underlying Funds”) include other investment companies and exchange-traded funds (“ETFs”). Investments in the Underlying Funds (except ETFs) are valued at the NAV per share on the day of valuation. ETFs are valued daily at the last sale price or official closing price on the principal exchange or system on which the investment is traded. Because the Portfolio invests in Underlying Funds that fluctuate in value, the Portfolio’s shares will correspondingly fluctuate in value. To the extent these investments are actively traded, they are classified as Level 1 of the fair value hierarchy, otherwise they are generally classified as Level 2. For information regarding an Underlying Fund’s accounting policies and investment holdings, please see the Underlying Fund’s shareholder report.
Derivative Contracts — A derivative is an instrument whose value is derived from underlying assets, indices, reference rates or a combination of these factors. The Portfolio enters into derivative transactions to hedge against changes in interest rates, securities prices, and/or currency exchange rates, to increase total return, or to gain access to certain markets or attain exposure to other underliers.
Exchange-traded derivatives, including futures and options contracts, are generally valued at the last sale or settlement price on the exchange where they are principally traded. Exchange-traded options without settlement prices are generally valued at the midpoint of the bid and ask prices on the exchange where they are principally traded (or, in the absence of two-way trading, at the last bid price for long positions and the last ask price for short positions). Exchange-traded derivatives typically fall within Level 1 of the fair value hierarchy. Over-the-counter (“OTC”) and centrally cleared derivatives are valued using market transactions and other market evidence, including market-based inputs to models, calibration to market-clearing transactions, broker or dealer quotations, or other alternative pricing sources. Where models are used, the selection of a particular model to value OTC and centrally cleared derivatives depends upon the contractual terms of, and specific risks inherent in, the instrument, as well as the availability of pricing information in the market. Valuation models require a variety of inputs, including contractual terms, market prices, yield curves, credit curves, measures of volatility, voluntary and involuntary prepayment rates, loss severity rates and correlations of such inputs. For OTC and centrally cleared derivatives that trade in liquid markets, model inputs can generally be
15
GOLDMAN SACHS STRATEGIC FACTOR ALLOCATION FUND
Notes to Financial Statements(continued)
February 28, 2019 (Unaudited)
|
| 3. INVESTMENTS AND FAIR VALUE MEASUREMENTS (continued) |
verified and model selection does not involve significant management judgment. OTC and centrally cleared derivatives are classified within Level 2 of the fair value hierarchy when significant inputs are corroborated by market evidence.
i. Forward Contracts — A forward contract is a contract between two parties to buy or sell an asset at a specified price on a future date. A forward contract settlement can occur on a cash or delivery basis. Forward contracts are marked-to-market daily using independent vendor prices, and the change in value, if any, is recorded as an unrealized gain or loss. Cash and certain investments may be used to collateralize forward contracts.
Aforward foreign currency exchange contractis a forward contract in which the Portfolio agrees to receive or deliver a fixed quantity of one currency for another, at a pre-determined price at a future date. All forward foreign currency exchange contracts are marked-to-market daily at the applicable forward rate. Non-deliverable forward foreign currency exchange contracts are settled with the counterparty in cash without the delivery of foreign currency.
ii. Futures Contracts — Futures contracts are contracts to buy or sell a standardized quantity of a specified commodity or security. Upon entering into a futures contract, the Portfolio deposits cash or securities in an account on behalf of the broker in an amount sufficient to meet the initial margin requirement. Subsequent payments are made or received by the Portfolio equal to the daily change in the contract value and are recorded as variation margin receivable or payable with a corresponding offset to unrealized gains or losses. For financial reporting purposes, cash collateral that has been pledged to cover obligations of the Portfolio and cash collateral received, if any, is reported separately on the Statement of Assets and Liabilities as receivables/payables for collateral on certain derivative contracts. Non-cash collateral pledged by the Portfolio, if any, is noted in the Schedule of Investments.
iii. Options — When the Portfolio writes call or put options, an amount equal to the premium received is recorded as a liability and is subsequently marked-to-market to reflect the current value of the option written. Swaptions are options on interest rate swap contracts.
Upon the purchase of a call option or a put option by the Portfolio, the premium paid is recorded as an investment and subsequently marked-to-market to reflect the current value of the option. Certain options may be purchased with premiums to be determined on a future date. The premiums for these options are based upon implied volatility parameters at specified terms.
B. Level 3 Fair Value Investments — To the extent that significant inputs to valuation models and other alternative pricing sources are unobservable, or if quotations are not readily available, or if GSAM believes that such quotations do not accurately reflect fair value, the fair value of the Portfolio’s investments may be determined under Valuation Procedures approved by the Trustees. GSAM, consistent with its procedures and applicable regulatory guidance, may make an adjustment to the most recent valuation prices of either domestic or foreign securities in light of significant events to reflect what it believes to be the fair value of the securities at the time of determining the Portfolio’s NAV.
C. Fair Value Hierarchy — The following is a summary of the Portfolio’s investments and derivatives classified in the fair value hierarchy as of February 28, 2019:
| | | | | | | | | | | | |
|
| STRATEGIC FACTOR ALLOCATION | |
| | | |
| Investment Type | | Level 1 | | | Level 2 | | | Level 3 | |
| | | |
| Assets | | | | | | | | | | | | |
| | | |
Exchange Traded Fund | | $ | 694,274,090 | | | $ | — | | | $ | — | |
| | | |
Investment Company | | | 844,974,227 | | | | — | | | | — | |
| | | |
| Total | | $ | 1,539,248,317 | | | $ | — | | | $ | — | |
16
GOLDMAN SACHS STRATEGIC FACTOR ALLOCATION FUND
|
| 3. INVESTMENTS AND FAIR VALUE MEASUREMENTS (continued) |
| | | | | | | | | | | | |
| | | |
| Derivative Type | | Level 1 | | | Level 2 | | | Level 3 | |
| | | |
| Assets(a) | | | | | | | | | | | | |
| | | |
Forward Foreign Currency Exchange Contracts | | $ | — | | | $ | 494,313 | | | $ | — | |
| | | |
| Liabilities | | | | | | | | | | | | |
| | | |
Forward Foreign Currency Exchange Contracts(a) | | $ | — | | | $ | (148,166 | ) | | $ | — | |
| | | |
Futures Contracts(a) | | | (4,321,033 | ) | | | — | | | | — | |
| | | |
Written option contracts | | | (7,956,510 | ) | | | — | | | | — | |
| | | |
| Total | | $ | (12,277,543 | ) | | $ | (148,166 | ) | | $ | — | |
| (a) | | Amount shown represents unrealized gain (loss) at period end. |
For further information regarding security characteristics, see the Schedule of Investments.
|
| 4. INVESTMENTS IN DERIVATIVES |
The following table sets forth, by certain risk types, the gross value of derivative contracts (not considered to be hedging instruments for accounting disclosure purposes) as of February 28, 2019. These instruments were used as part of the Portfolio’s investment strategies and to obtain and/or manage exposure related to the risks below. The values in the tables below exclude the effects of cash collateral received or posted pursuant to these derivative contracts, and therefore are not representative of the Portfolio’s net exposure.
| | | | | | | | | | | | |
| Risk | | Statement of Assets and Liabilities | | Assets | | | Statement of Assets and Liabilities | | Liabilities | |
Interest rate | | — | | $ | — | | | Variation margin on futures contracts | | $ | (4,321,033) | (a) |
Currency | | Receivable for unrealized gain on forward foreign currency exchange contracts | | | 494,313 | | | Payable for unrealized loss on forward foreign currency exchange contracts | | | (148,166) | |
Equity | | — | | | — | | | Written Options, at value | | | (7,956,510) | |
| Total | | | | $ | 494,313 | | | | | $ | (12,425,709) | |
| (a) | | Includes unrealized gain (loss) on futures contracts described in the Additional Investment Information sections of the Schedule of Investments. Only current day’s variation margin is reported within the Statement of Assets and Liabilities. |
The following table sets forth, by certain risk types, the Portfolio’s gains (losses) related to these derivatives and their indicative volumes for the six months ended February 28, 2019. These gains (losses) should be considered in the context that these derivative contracts may have been executed to create investment opportunities and/or economically hedge certain investments, and accordingly, certain gains (losses) on such derivative contracts may offset certain (losses) gains attributable to investments.
17
GOLDMAN SACHS STRATEGIC FACTOR ALLOCATION FUND
Notes to Financial Statements(continued)
February 28, 2019 (Unaudited)
|
| 4. INVESTMENTS IN DERIVATIVES (continued) |
These gains (losses) are included in “Net realized gain (loss)” or “Net change in unrealized gain (loss)” on the Statement of Operations:
| | | | | | | | | | | | | | |
| Risk | | Statement of Operations | | Net
Realized Gain (Loss) | | | Net Change in
Unrealized Gain (Loss) | | | Average Number of Contracts(a) | |
| Interest rate | | Net realized gain (loss) from futures contracts/Net change in unrealized gain (loss) on futures contracts | | $ | (16,172,742 | ) | | $ | (7,845,421 | ) | | | 3,727 | |
| Currency | | Net realized gain (loss) from forward foreign currency exchange contracts/Net change in unrealized gain (loss) on forward foreign currency exchange contracts | | | 6,181 | | | | (985,917 | ) | | | 13 | |
| Equity | | Net realized gain (loss) from written options contracts/change in unrealized gain (loss) from written options contracts | | | (38,627,645 | ) | | | (1,447,910 | ) | | | 3 | |
| Total | | | | $ | (54,794,206 | ) | | $ | (10,279,248 | ) | | | 3,743 | |
| (a) | | Average number of contracts is based on the average of month end balances for the period ended February 28, 2019. |
In order to better define its contractual rights and to secure rights that will help the Portfolio mitigate its counterparty risk, the Portfolio may enter into an International Swaps and Derivatives Association, Inc. Master Agreement (“ISDA Master Agreement”) or similar agreement with its derivatives counterparties. An ISDA Master Agreement is a bilateral agreement between the Portfolio and a counterparty that governs OTC derivatives (including forward foreign currency exchange contracts, and certain options and swaps), and typically contains, among other things, collateral posting terms and netting provisions in the event of a default and/or termination event. The provisions of the ISDA Master Agreement typically permit a single net payment in the event of a default (close-out netting) or similar event, including the bankruptcy or insolvency of the counterparty.
Collateral and margin requirements differ between exchange traded derivatives and OTC derivatives. Margin requirements are established by the broker or clearing house for exchange-traded and centrally cleared derivatives (financial futures contracts, options and centrally cleared swaps) pursuant to governing agreements for those instrument types. Brokers can ask for margin in excess of the minimum in certain circumstances. Collateral terms are contract-specific for OTC derivatives. For derivatives traded under an ISDA Master Agreement, the collateral requirements are typically calculated by netting the marked to market amount for each transaction under such agreement and comparing that amount to the value of any collateral currently pledged by the Portfolio and the counterparty. Additionally, the Portfolio may be required to post initial margin to the counterparty, the terms of which would be outlined in the confirmation of the OTC transaction.
For financial reporting purposes, cash collateral that has been pledged to cover obligations of the Portfolio and cash collateral received from the counterparty, if any, is reported separately on the Statement of Assets and Liabilities as receivables/payables for collateral on certain derivative contracts. Non-cash collateral pledged by the Portfolio, if any, is noted in the Schedule of Investments. Generally, the amount of collateral due from or to a counterparty must exceed a minimum transfer amount threshold before a transfer is required to be made. To the extent amounts due to the Portfolio from its counterparties are not fully collateralized, contractually or otherwise, the Portfolio bears the risk of loss from counterparty nonperformance. The Portfolio attempts to mitigate counterparty risk by only entering into agreements with counterparties that the Investment Adviser believes to be of good standing and by monitoring the financial stability of those counterparties.
Additionally, the netting of assets and liabilities and the offsetting of collateral pledged or received are based on contractual netting/set-off provisions in the ISDA Master Agreement or similar agreements. However, in the event of a default or insolvency of a counterparty, a court could determine that such rights are not enforceable due to the restrictions or prohibitions against the right of setoff that may be imposed in accordance with a particular jurisdiction’s bankruptcy or insolvency laws.
18
GOLDMAN SACHS STRATEGIC FACTOR ALLOCATION FUND
|
| 5. AGREEMENTS AND AFFILIATED TRANSACTIONS |
A. Management Agreement — Under the Agreement, GSAM manages the Portfolio, subject to the general supervision of the Trustees.
As compensation for the services rendered pursuant to the Agreement, the assumption of the expenses related thereto and administration of the Portfolio’s business affairs, including providing facilities, GSAM is entitled to a management fee, accrued daily and paid monthly, equal to an annual percentage rate of the Portfolio’s average daily net assets.
For the six months ended February 28, 2019, contractual and effective net management fees with GSAM were at the following rates:
| | | | | | | | | | | | | | | | | | | | | | |
| Contractual Management Rate | | | | | | | |
First $2 Billion | | | Next $3 Billion | | | Next $3 Billion | | | Over $8 Billion | | | Effective
Rate | | | Effective Net
Management
Rate*^ | |
| | 0.75% | | | | 0.68% | | | | 0.64% | | | | 0.62% | | | | 0.75% | | | | 0.64% | |
| * | | GSAM has agreed to waive a portion of its management fee payable by the Portfolio in an amount equal to any management fee it earns as an investment adviser to any of the affiliated funds in which the Portfolio invests through at least December 28, 2019. Prior to such date GSAM may not terminate the arrangement without the approval of the Trustees. |
| ^ | | Effective Net Management Rate includes the impact of management fee waivers of affiliated Underlying Funds, if any. |
The Portfolio invests in Institutional Shares of the Goldman Sachs Financial Square Government Fund (“Government Money Market Fund”), which is an affiliated Underlying Fund. GSAM has agreed to waive a portion of its management fee payable by the Portfolio in an amount equal to the management fee it earns as an investment adviser to the affiliated Underlying Fund in which the Portfolio invests, except those management fees it earns from the Portfolio’s investment of cash collateral received in connection with securities lending transactions in the Government Money Market Fund. For the six months ended February 28, 2019, GSAM waived $994,223 of the Portfolio’s management fee.
B. Transfer Agency Agreement — Goldman Sachs also serves as the transfer agent of the Portfolio for a fee pursuant to the Transfer Agency Agreement. The fees charged for such transfer agency services are accrued daily and paid monthly at annual rates as follows: 0.04% of the average daily net assets of Institutional Shares and 0.03% of the average daily net assets of Class P and Class R6 Shares.
C. Other Expense Agreements and Affiliated Transactions — GSAM has agreed to limit certain “Other Expenses” of the Portfolio (excluding acquired (underlying) fund fees and expenses, transfer agency fees and expenses, service fees and shareholder administration fees (as applicable), taxes, interest, brokerage fees, expenses of shareholder meetings, litigation and indemnification, and extraordinary expenses) to the extent such expenses exceed, on an annual basis, a percentage rate of the average daily net assets of the Portfolio. Such Other Expense reimbursements, if any, are accrued daily and paid monthly. In addition, the Portfolio is not obligated to reimburse GSAM for prior fiscal year expense reimbursements, if any. The Other Expense limitation as an annual percentage rate of average daily net assets for the Portfolio is 0.164%. The Other Expense limitation will remain in place through at least December 28, 2019, and prior to such date GSAM may not terminate the arrangements without the approval of the Trustees. In addition, the Portfolio has entered into certain offset arrangements with the transfer agent, which may result in a reduction of the Portfolio’s expenses and are received irrespective of the application of the “Other Expense” limitation described above.
D. Line of Credit Facility — As of February 28, 2019, the Portfolio participated in a $770,000,000 committed, unsecured revolving line of credit facility (the “facility”) together with other funds of the Trust and certain registered investment companies having management agreements with GSAM or its affiliates. This facility is to be used for temporary emergency purposes, or to allow for an orderly liquidation of securities to meet redemption requests. The interest rate on borrowings is based on the federal funds rate. The facility also requires a fee to be paid by the Portfolio based on the amount of the commitment that has not been utilized. For the six months ended February 28, 2019, the Portfolio did not have any borrowings under the facility.
19
GOLDMAN SACHS STRATEGIC FACTOR ALLOCATION FUND
Notes to Financial Statements(continued)
February 28, 2019 (Unaudited)
|
| 5. AGREEMENTS AND AFFILIATED TRANSACTIONS (continued) |
E. Other Transactions with Affiliates — For the six months ended February 28, 2019 , Goldman Sachs earned did not earn any brokerage commissions from portfolio transactions, including futures transactions executed with Goldman Sachs as the Futures Commission Merchant, on behalf of the Portfolio.
As of February 28, 2019, The Goldman Sachs Group, Inc. was the beneficial owner of approximately 100% of Class R6 Shares of the Portfolio.
The table below shows the transactions in and earnings from investments in the Goldman Sachs Financial Square Government Fund for the six months ended February 28, 2019:
| | | | | | | | | | | | | | | | | | | | | | | | |
| Affiliated Investment Company | | Beginning
Value as of
August 31,
2018 | | | Purchases
at Cost | | | Proceeds from Sales | | | Ending
Value as of
February 28,
2019 | | | Shares as of
February 28,
2019 | | | Dividend
Income from
Affiliated
Investment
Companies | |
Goldman Sachs Financial Square Government Fund — Institutional Shares | | $ | 1,243,562,349 | | | $ | 3,643,331,560 | | | $ | (4,041,919,682 | ) | | $ | 844,974,227 | | | | 844,974,227 | | | $ | 13,156,494 | |
|
| 6. PORTFOLIO SECURITIES TRANSACTIONS |
The cost of purchases and proceeds from sales and maturities of long-term securities for the six months ended February 28, 2019, were $3,493,665,712, and $3,859,302,494, respectively.
Pursuant to exemptive relief granted by the Securities and Exchange Commission (“SEC”) and the terms and conditions contained therein, the Portfolio may lend its securities through a securities lending agent, Goldman Sachs Agency Lending (“GSAL”), a wholly-owned subsidiary of Goldman Sachs, to certain qualified borrowers including Goldman Sachs and affiliates. In accordance with the Portfolio’s securities lending procedures, the Portfolio receives cash collateral at least equal to the market value of the securities on loan. The market value of the loaned securities is determined at the close of business of the Portfolio, at their last sale price or official closing price on the principal exchange or system on which they are traded, and any additional required collateral is delivered to the Portfolio on the next business day. As with other extensions of credit, the Portfolio may experience delay in the recovery of their securities or incur a loss should the borrower of the securities breach its agreement with the Portfolio or become insolvent at a time when the collateral is insufficient to cover the cost of repurchasing securities on loan. Dividend income received from securities on loan may not be subject to withholding taxes and therefore withholding taxes paid may differ from the amounts listed in the Statement of Operations. Loans of securities are terminable at any time and as such 1) the remaining contractual maturities of the outstanding securities lending transactions are considered to be overnight and continuous and 2) the borrower, after notice, is required to return borrowed securities within the standard time period for settlement of securities transactions.
The Portfolio invests the cash collateral received in connection with securities lending transactions in the Goldman Sachs Financial Square Government Fund (“Government Money Market Fund”), an affiliated series of the Trust. The Government Money Market Fund is registered under the Act as an open end investment company, is subject to Rule 2a-7 under the Act, and is managed by GSAM, for which GSAM may receive a management fee of up to 0.16% on an annualized basis of the average daily net assets of the Government Money Market Fund.
In the event of a default by a borrower with respect to any loan, GSAL will exercise any and all remedies provided under the applicable borrower agreement to make the Portfolio whole. These remedies include purchasing replacement securities by applying the collateral held from the defaulting broker against the purchase cost of the replacement securities. If GSAL is unable to purchase replacement securities, GSAL will indemnify the Portfolio by paying the Portfolio an amount equal to the market value of the securities loaned minus the value of cash collateral received from the borrower for the loan, subject to an exclusion for any
20
GOLDMAN SACHS STRATEGIC FACTOR ALLOCATION FUND
|
| 7. SECURITIES LENDING (continued) |
shortfalls resulting from a loss of value in such cash collateral due to reinvestment risk. The Funds may enter into master netting agreements with borrowers, which provide the right, in the event of a default (including bankruptcy or insolvency), for the non-defaulting party to liquidate the collateral and calculate net exposure to the defaulting party or request additional collateral. However, in the event of a default by a borrower, a resolution authority could determine that such rights are not enforceable due to the restrictions or prohibitions against the right of set-off that may be imposed in accordance with a particular jurisdiction’s bankruptcy or insolvency laws. The Portfolio’s loaned securities were all subject to enforceable Securities Lending Agreements and the value of the collateral was at least equal to the value of the cash received. The amounts of the Portfolio’s overnight and continuous agreements, which represent the gross amounts of recognized liabilities for securities lending transactions outstanding as of February 28, 2019, are disclosed as “Payable upon return of securities loaned” on the Statement of Assets and Liabilities, where applicable. The Portfolio did not have securities on loan as of February 28, 2019.
Both the Portfolio and GSAL received compensation relating to the lending of the Portfolio’s securities. The amounts earned, if any, by the Portfolio’s for the six months ended February 28, 2019, are reported under Investment Income on the Statement of Operations.
The table below details securities lending activity with affiliates of Goldman Sachs:
| | | | | | | | | | | | | | |
| | | | | For the six months ended February 28, 2019 | | | Amounts Payable to
Goldman Sachs
Upon Return of
Securities Loaned as of
February 28, 2019 | |
| Portfolio | | | | Earnings of GSAL
Relating to
Securities
Loaned | | | Amounts Received
by the Portfolio’s
from Lending to
Goldman Sachs | |
Strategic Factor Allocation | | | | $ | 1,172 | | | $ | — | | | $ | — | |
The following table provides information about the Portfolio’s investment in the Government Money Market Fund for the six months ended February 28, 2019.
| | | | | | | | | | | | | | |
Beginning Value as of August 31, 2018 | | | Purchases at Cost | | | Proceeds from Sales | | | Ending Value as of February 28, 2019 | |
| $ | — | | | $ | 588,403,225 | | | $ | (588,403,225 | ) | | $ | — | |
As of the Portfolio’s most recent fiscal year end, August 31, 2018, the Portfolio had no capital loss carryforwards nor certain timing differences on a tax basis.
As of February 28, 2019, the Portfolio’s aggregate security unrealized gains and losses based on cost for U.S. federal income tax purposes were as follows:
| | |
Tax Cost | | $ 1,567,016,983 |
Gross unrealized gain | | 34,323,408 |
Gross unrealized loss | | (62,092,074) |
Net unrealized gains (losses) on securities | | $ (27,768,666) |
The difference between GAAP-basis and tax basis unrealized gains (losses) is attributable primarily to wash sales and net mark to market gains (losses) on regulated futures contracts, options contracts and foreign currency contracts.
GSAM has reviewed the Portfolio’s tax positions for all open tax years (the current and prior three years as applicable) and has concluded that no provision for income tax is required in the Portfolio’s financial statements. Such open tax years remain subject to examination and adjustment by tax authorities.
21
GOLDMAN SACHS STRATEGIC FACTOR ALLOCATION FUND
Notes to Financial Statements(continued)
February 28, 2019 (Unaudited)
The Portfolio’s risks include, but are not limited to, the following:
Derivatives Risk — The Portfolio’s use of derivatives may result in loss. Derivative instruments, which may pose risks in addition to and greater than those associated with investing directly in securities, currencies or other instruments, may be illiquid or less liquid, volatile, difficult to price and leveraged so that small changes in the value of the underlying instruments may produce disproportionate losses to the Portfolio. Derivatives are also subject to counterparty risk, which is the risk that the other party in the transaction will not fulfill its contractual obligation. The use of derivatives is a highly specialized activity that involves investment techniques and risks different from those associated with investments in more traditional securities and instruments. Losses from derivatives can also result from a lack of correlation between changes in the value of derivative instruments and the portfolio assets (if any) being hedged.
Foreign Countries Risk — Investing in foreign markets may involve special risks and considerations not typically associated with investing in the United States. Foreign securities may be subject to risk of loss because of more or less foreign government regulation, less public information and less economic, political and social stability in the countries in which the Portfolio invests. The imposition of exchange controls (including repatriation restrictions), confiscations, trade restrictions (including tariffs) and other government restrictions by the United States or other governments, or from problems in share registration, settlement or custody, may also result in losses. Foreign risk also involves the risk of negative foreign currency rate fluctuations, which may cause the value of securities denominated in such foreign currency (or other instruments through which the Portfolio has exposure to foreign currencies) to decline in value. Currency exchange rates may fluctuate significantly over short periods of time.
Foreign Custody Risk — If the Portfolio invests in foreign securities the Portfolio may hold such securities and cash with foreign banks, agents, and securities depositories appointed by the Portfolio’s custodian (each a “Foreign Custodian”). Some foreign custodians may be recently organized or new to the foreign custody business. In some countries, Foreign Custodians may be subject to little or no regulatory oversight over, or independent evaluation of, their operations. Further, the laws of certain countries may place limitations on the Portfolio’s ability to recover its assets if a Foreign Custodian enters bankruptcy. Investments in emerging markets may be subject to even greater custody risks than investments in more developed markets. Custody services in emerging market countries are very often undeveloped and may be considerably less well regulated than in more developed countries, and thus may not afford the same level of investor protection as would apply in developed countries.
Geographic Risk — If the Portfolio focuses its investments in securities of issuers located in a particular country or geographic region, the Portfolio may be subjected, to a greater extent than if its investments were less focused, to the risks of volatile economic cycles and/or conditions and developments that may be particular to that country or region, such as: adverse securities markets; adverse exchange rates; adverse social, political, regulatory, economic, business, environmental or other developments; or natural disasters.
Interest Rate Risk — When interest rates increase, fixed income securities or instruments held by the Portfolio will generally decline in value. Long-term fixed income securities or instruments will normally have more price volatility because of this risk than short-term fixed income securities or instruments. The risks associated with increasing rates are heightened given that interest rates are near historic lows, but may be expected to increase in the future with unpredictable effects on the markets and the Portfolio’s investments. Fluctuations in interest rates may also affect the liquidity of fixed income securities and instruments held by the Portfolio.
Investments in Other Investment Companies Risk — As a shareholder of another investment company, including an ETF, the Portfolio will indirectly bear its proportionate share of any net management fees and other expenses paid by such other investment companies, in addition to the fees and expenses regularly borne by the Portfolio. ETFs are subject to risks that do not apply to conventional mutual funds, including but not limited to the following: (i) the market price of the ETF’s shares may trade at a premium or a discount to their NAV; and (ii) an active trading market for an ETF’s shares may not develop or be maintained.
Large Shareholder Transactions Risk — The Portfolio may experience adverse effects when certain large shareholders, such as other funds, institutional investors (including those trading by use of non-discretionary mathematical formulas), financial
22
GOLDMAN SACHS STRATEGIC FACTOR ALLOCATION FUND
|
| 9. OTHER RISKS (continued) |
intermediaries (who may make investment decisions on behalf of underlying clients and/or include the Portfolio in their investment model), individuals, accounts and Goldman Sachs affiliates, purchase or redeem large amounts of shares of a Portfolio. Such large shareholder redemptions, which may occur rapidly or unexpectedly may cause the Portfolio to sell portfolio securities at times when it would not otherwise do so, which may negatively impact the Portfolio’s NAV and liquidity. These transactions may also accelerate the realization of taxable income to shareholders if such sales of investments resulted in gains, and may also increase transaction costs. In addition, a large redemption could result in the Portfolio’s current expenses being allocated over a smaller asset base, leading to an increase in the Portfolio’s expense ratio. Similarly, large Portfolio share purchases may adversely affect the Portfolio’s performance to the extent that the Portfolio is delayed in investing new cash or otherwise maintains a larger cash position than it ordinarily would.
Liquidity Risk — The Portfolio may make investments that are illiquid or that may become less liquid in response to market developments or adverse investor perceptions. Illiquid investments may be more difficult to value. Liquidity risk may also refer to the risk that the Portfolio will not be able to pay redemption proceeds within the allowable time period or without significant dilution to remaining investors’ interests because of unusual market conditions, an unusually high volume of redemption requests, or other reasons. To meet redemption requests, the Portfolio may be forced to sell investments at an unfavorable time and/or under unfavorable conditions. If the Portfolio is forced to sell securities at an unfavorable time and/or under unfavorable conditions, such sales may adversely affect the Portfolio’s NAV and dilute remaining investors’ interests. Liquidity risk may be the result of, among other things, the reduced number and capacity of traditional market participants to make a market in fixed income securities or the lack of an active market. The potential for liquidity risk may be magnified by a rising interest rate environment or other circumstances where investor redemptions from fixed income mutual funds may be higher than normal, potentially causing increased supply in the market due to selling activity.
Market and Credit Risks — In the normal course of business, the Portfolio trades financial instruments and enters into financial transactions where risk of potential loss exists due to changes in the market (market risk). Additionally, the Portfolio may also be exposed to credit risk in the event that an issuer or guarantor fails to perform or that an institution or entity with which the Portfolio has unsettled or open transactions defaults.
Non-Diversification Risk — The Portfolio is non-diversified, meaning that it is permitted to invest a larger percentage of its assets in fewer issuers than diversified mutual funds. Thus, the Portfolio may be more susceptible to adverse developments affecting any single issuer held in its portfolio, and may be more susceptible to greater losses because of these developments.
Under the Trust’s organizational documents, its Trustees, officers, employees and agents are indemnified, to the extent permitted by the Act and state law, against certain liabilities that may arise out of performance of their duties to the Portfolio. Additionally, in the course of business, the Portfolio enters into contracts that contain a variety of indemnification clauses. The Portfolio’s maximum exposure under these arrangements is unknown, as this would involve future claims that may be made against the Portfolio that have not yet occurred. However, GSAM believes the risk of loss under these arrangements to be remote.
23
GOLDMAN SACHS STRATEGIC FACTOR ALLOCATION FUND
Notes to Financial Statements(continued)
February 28, 2019 (Unaudited)
Subsequent events after the Statement of Assets and Liabilities date have been evaluated, and GSAM has concluded that there is no impact requiring adjustment or disclosure in the financial statements.
|
| 12. SUMMARY OF SHARE TRANSACTIONS |
Share activity is as follows:
| | | | | | | | | | | | | | | | |
| | | For the Six Months Ended
February 28, 2019 (Unaudited) | | | For the Fiscal Year Ended
August 31, 2018
| |
| | | Shares | | | Dollars | | | Shares | | | Dollars | |
| | | | |
| Institutional Shares | | | | | | | | | | | | | | | | |
Shares sold | | | 14,318 | | | $ | 152,319 | | | | 112,967,854 | | | $ | 1,246,492,116 | |
Reinvestment of distributions | | | 91,964 | | | | 935,279 | | | | 4,267,627 | | | | 47,358,677 | |
Shares redeemed | | | (938,976 | ) | | | (9,828,303 | ) | | | (248,616,561 | ) | | | (2,738,342,880 | ) |
| | | | (832,694 | ) | | | (8,740,705 | ) | | | (131,381,080 | ) | | | (1,444,492,087 | ) |
| Class P Shares(a) | | | | | | | | | | | | | | | | |
Shares sold | | | 15,465,756 | | | | 159,825,588 | | | | 223,146,844 | | | | 2,462,568,348 | |
Reinvestment of distributions | | | 11,657,218 | | | | 118,182,473 | | | | — | | | | — | |
Shares redeemed | | | (96,509,295 | ) | | | (1,007,139,324 | ) | | | (3,954,825 | ) | | | (44,205,671 | ) |
| | | | (69,386,321 | ) | | | (729,131,263 | ) | | | 219,192,019 | | | | 2,418,362,677 | |
| Class R6 Shares(b) | | | | | | | | | | | | | | | | |
Shares sold | | | — | | | | — | | | | 901 | | | | 10,000 | |
Reinvestment of distributions | | | 63 | | | | 639 | | | | — | | | | — | |
| | | | 63 | | | | 639 | | | | 901 | | | | 10,000 | |
| | | | |
NET INCREASE (DECREASE) | | | (70,218,952 | ) | | $ | (737,871,329 | ) | | | 87,811,840 | | | $ | 973,880,590 | |
| (a) | | Class P Shares commenced operations on April 17, 2018. |
| (b) | | Class R6 Shares commenced operations on December 29, 2017. |
24
GOLDMAN SACHS STRATEGIC FACTOR ALLOCATION FUND
| | |
| | |
Fund Expenses — Six Month Period Ended February 28, 2019 (Unaudited) | | |
As a shareholder of Institutional, Class P or Class R6 Shares of the Portfolio, you incur two types of costs: (1) transaction costs, and (2) ongoing costs, including management fees and other Portfolio expenses. This example is intended to help you understand your ongoing costs (in dollars) of investing in Institutional, Class P, and Class R6 Shares of the Portfolio and to compare these costs with the ongoing costs of investing in other mutual funds.
The example is based on an investment of $1,000 invested at the beginning of the period and held for the entire period from September 1, 2018 through February 28, 2019, which represents a period of 181 days in a 365 day year.
Actual Expenses — The first line under each share class in the table below provides information about actual account values and actual expenses. You may use the information in this line, together with the amount you invested, to estimate the expenses that you paid over the period. Simply divide your account value by $1,000 (for example, an $8,600 account value divided by $1,000=8.6), then multiply the result by the number in the first line under the heading entitled “Expenses Paid” to estimate the expenses you paid on your account during this period.
Hypothetical Example for Comparison Purposes— The second line under each share class in the table below provides information about hypothetical account values and hypothetical expenses based on the Portfolio’s actual net expense ratio and an assumed rate of return of 5% per year before expenses, which is not the Portfolio’s actual return. The hypothetical account values and expenses may not be used to estimate the actual ending account balance or expenses you paid for the period. You may use this information to compare the ongoing costs of investing in the Portfolio and other funds. To do so, compare this 5% hypothetical example with the 5% hypothetical examples that appear in the shareholder reports of the other funds.
Please note that the expenses shown in the table are meant to highlight your ongoing costs only and do not reflect any transactional costs, such as sales charges, redemption fees, or exchange fees. Therefore, the second line of the table is useful in comparing ongoing costs only, and will not help you determine the relative total costs of owning different funds. In addition, if these transactional costs were included, your costs would have been higher.
| | | | | | | | | | | | |
| | | Strategic Factor Allocation Fund | |
| Share Class | | Beginning
Account Value
9/1/18 | | | Ending
Account Value
2/28/19 | | | Expenses Paid for the
6 months ended
2/28/19* | |
| Institutional | | | | | | | | | | | | |
Actual | | $ | 1,000.00 | | | $ | 988.70 | | | $ | 3.55 | |
Hypothetical 5% return | | | 1,000.00 | | | | 1,021.22 | + | | | 3.61 | |
| Class P | | | | | | | | | | | | |
Actual | | | 1,000.00 | | | | 989.40 | | | | 3.50 | |
Hypothetical 5% return | | | 1,000.00 | | | | 1,021.27 | + | | | 3.56 | |
| Class R6 | | | | | | | | | | | | |
Actual | | | 1,000.00 | | | | 989.10 | | | | 3.40 | |
Hypothetical 5% return | | | 1,000.00 | | | | 1,021.37 | + | | | 3.46 | |
| | * | | Expenses are calculated using the Portfolio’s annualized net expense ratio for each class, which represents the ongoing expenses as a percentage of net assets for the six months ended February 28, 2019. Expenses are calculated by multiplying the annualized net expense ratio by the average account value for the period; then multiplying the result by the number of days in the most recent fiscal half year; and then dividing that result by the number of days in the fiscal year. The annualized net expense ratios for the period were as follows: 0.72% for Institutional Shares, 0.71% for Class P Shares and 0.69% for Class R6 Shares. | |
| | + | | Hypothetical expenses are based on the Portfolio’s actual annualized net expense ratios and an assumed rate of return of 5% per year before expenses. | |
25
PORTFOLIO PROFILE
Goldman Sachs Funds
Goldman Sachs is a premier financial services firm, known since 1869 for creating thoughtful and customized investment solutions in complex global markets.
Today, theInvestment Management Division of Goldman Sachs serves a diverse set of clients worldwide, including private institutions, public entities and individuals. With approximately $1.34 trillion in assets under supervision as of December 31, 2018, Goldman Sachs Asset Management (“GSAM”) has portfolio management teams located around the world and our investment professionals bring firsthand knowledge of local markets to every investment decision. Assets under supervision includes assets under management and other client assets for which Goldman Sachs does not have full discretion. GSAM leverages the resources of Goldman Sachs & Co. LLC subject to legal, internal and regulatory restrictions.
Money Market
Financial Square FundsSM
| ∎ | | Financial Square Treasury Solutions Fund1 |
| ∎ | | Financial Square Government Fund1 |
| ∎ | | Financial Square Money Market Fund2 |
| ∎ | | Financial Square Prime Obligations Fund2 |
| ∎ | | Financial Square Treasury Instruments Fund1 |
| ∎ | | Financial Square Treasury Obligations Fund1 |
| ∎ | | Financial Square Federal Instruments Fund1 |
Investor FundsSM
| ∎ | | Investor Money Market Fund3 |
| ∎ | | Investor Tax-Exempt Money Market Fund3 |
Fixed Income
Short Duration and Government
| ∎ | | High Quality Floating Rate Fund |
| ∎ | | Short-Term Conservative Income Fund |
| ∎ | | Short Duration Government Fund |
| ∎ | | Short Duration Income Fund |
| ∎ | | Inflation Protected Securities Fund |
Multi-Sector
Municipal and Tax-Free
| ∎ | | High Yield Municipal Fund |
| ∎ | | Dynamic Municipal Income Fund |
| ∎ | | Municipal Income Completion Fund |
| ∎ | | Short Duration Tax-Free Fund |
Single Sector
| ∎ | | Investment Grade Credit Fund |
| ∎ | | High Yield Floating Rate Fund |
| ∎ | | Emerging Markets Debt Fund |
| ∎ | | Local Emerging Markets Debt Fund |
Fixed Income Alternatives
| ∎ | | Long Short Credit Strategies Fund |
Fundamental Equity
| ∎ | | Small/Mid Cap Value Fund |
| ∎ | | Small/Mid Cap Growth Fund |
| ∎ | | Concentrated Growth Fund |
| ∎ | | Technology Opportunities Fund |
| ∎ | | Growth Opportunities Fund |
| ∎ | | Rising Dividend Growth Fund |
Tax-Advantaged Equity
| ∎ | | U.S. Tax-Managed Equity Fund |
| ∎ | | International Tax-Managed Equity Fund |
| ∎ | | U.S. Equity Dividend and Premium Fund |
| ∎ | | International Equity Dividend and Premium Fund |
Equity Insights
| ∎ | | Small Cap Equity Insights Fund |
| ∎ | | U.S. Equity Insights Fund |
| ∎ | | Small Cap Growth Insights Fund |
| ∎ | | Large Cap Growth Insights Fund |
| ∎ | | Large Cap Value Insights Fund |
| ∎ | | Small Cap Value Insights Fund |
| ∎ | | International Small Cap Insights Fund |
| ∎ | | International Equity Insights Fund |
| ∎ | | Emerging Markets Equity Insights Fund |
Fundamental Equity International
| ∎ | | International Equity Income Fund |
| ∎ | | International Equity ESG Fund |
| ∎ | | Emerging Markets Equity Fund |
| ∎ | | ESG Emerging Markets Equity Fund |
Select Satellite
| ∎ | | Real Estate Securities Fund |
| ∎ | | International Real Estate Securities Fund |
| ∎ | | Commodity Strategy Fund |
| ∎ | | Global Real Estate Securities Fund |
| ∎ | | Alternative Premia Fund |
| ∎ | | Absolute Return Tracker Fund |
| ∎ | | Managed Futures Strategy Fund |
| ∎ | | MLP Energy Infrastructure Fund |
| ∎ | | Multi-Manager Alternatives Fund |
| ∎ | | Absolute Return Multi-Asset Fund |
| ∎ | | Global Infrastructure Fund |
Total Portfolio Solutions
| ∎ | | Global Managed Beta Fund |
| ∎ | | Multi-Manager Non-Core Fixed Income Fund |
| ∎ | | Multi-Manager U.S. Dynamic Equity Fund |
| ∎ | | Multi-Manager Global Equity Fund |
| ∎ | | Multi-Manager International Equity Fund |
| ∎ | | Tactical Tilt Overlay Fund |
| ∎ | | Balanced Strategy Portfolio |
| ∎ | | Multi-Manager U.S. Small Cap Equity Fund |
| ∎ | | Multi-Manager Real Assets Strategy Fund |
| ∎ | | Growth and Income Strategy Portfolio |
| ∎ | | Growth Strategy Portfolio |
| ∎ | | Dynamic Global Equity Fund4 |
| ∎ | | Satellite Strategies Portfolio |
| ∎ | | Enhanced Dividend Global Equity Portfolio |
| ∎ | | Tax-Advantaged Global Equity Portfolio |
| ∎ | | Strategic Factor Allocation Fund |
| ∎ | | Target Date 2020 Portfolio |
| ∎ | | Target Date 2025 Portfolio |
| ∎ | | Target Date 2030 Portfolio |
| ∎ | | Target Date 2035 Portfolio |
| ∎ | | Target Date 2040 Portfolio |
| ∎ | | Target Date 2045 Portfolio |
| ∎ | | Target Date 2050 Portfolio |
| ∎ | | Target Date 2055 Portfolio |
| ∎ | | Target Date 2060 Portfolio |
| ∎ | | GQG Partners International Opportunities Fund |
| 1 | | You could lose money by investing in the Fund. Although the Fund seeks to preserve the value of your investment at $1.00 per share, it cannot guarantee it will do so. An investment in the Fund is not a deposit of a bank and is not insured or guaranteed by the Federal Deposit Insurance Corporation or any other government agency. The Fund’s sponsor has no legal obligation to provide financial support to the Fund, and you should not expect that the sponsor will provide financial support to the Fund at any time. |
| 2 | | You could lose money by investing in the Fund. Because the share price of the Fund will fluctuate, when you sell your shares they may be worth more or less than what you originally paid for them. The Fund may impose a fee upon sale of your shares or may temporarily suspend your ability to sell shares if the Fund’s liquidity falls below required minimums because of market conditions or other factors. An investment in the Fund is not a deposit of a bank and is not insured or guaranteed by the Federal Deposit Insurance Corporation or any other government agency. The Fund’s sponsor has no legal obligation to provide financial support to the Fund, and you should not expect that the sponsor will provide financial support to the Fund at any time. |
| 3 | | You could lose money by investing in the Fund. Although the Fund seeks to preserve the value of your investment at $1.00 per share, it cannot guarantee it will do so. The Fund may impose a fee upon sale of your shares or may temporarily suspend your ability to sell shares if the Fund’s liquidity falls below required minimums because of market conditions or other factors. An investment in the Fund is not a deposit of a bank and is not insured or guaranteed by the Federal Deposit Insurance Corporation or any other government agency. The Fund’s sponsor has no legal obligation to provide financial support to the Fund, and you should not expect that the sponsor will provide financial support to the Fund at any time. |
| 4 | | Effective after the close of business on February 28, 2019, the Goldman Sachs Equity Growth Strategy Portfolio was renamed the Goldman Sachs Dynamic Global Equity Fund. |
Financial Square FundsSM and Investor FundsSM are registered service marks of Goldman Sachs & Co. LLC.
| * | | This list covers open-end funds only. Please visit our website at www.GSAMFUNDS.com to learn about our closed-end funds and exchange-traded funds. |
| | |
TRUSTEES Jessica Palmer,Chair Kathryn A. Cassidy Diana M. Daniels James A. McNamara Roy W. Templin Gregory G. Weaver | | OFFICERS James A. McNamara,President Scott M. McHugh,Treasurer, Senior Vice President and Principal Financial Officer Joseph F. DiMaria,Assistant Treasurer and Principal Accounting Officer Caroline L. Kraus, Secretary |
| |
GOLDMAN SACHS & CO. LLC Distributor and Transfer Agent | | GOLDMAN SACHS ASSET MANAGEMENT, L.P. Investment Adviser |
Visit our web site atwww.GSAMFUNDS.com to obtain the most recent month-end returns.
Goldman Sachs Asset Management, L.P. 200 West Street, New York, New York 10282
The reports concerning the Portfolio included in this shareholder report may contain certain forward-looking statements about the factors that may affect the performance of the Portfolio in the future. These statements are based on Portfolio management’s predictions and expectations concerning certain future events and their expected impact on the Portfolio, such as performance of the economy as a whole and of specific industry sectors, changes in the levels of interest rates, the impact of developing world events, and other factors that may influence the future performance of the Portfolio. Management believes these forward-looking statements to be reasonable, although they are inherently uncertain and difficult to predict. Actual events may cause adjustments in portfolio management strategies from those currently expected to be employed.
A description of the policies and procedures that the Portfolio uses to determine how to vote proxies relating to portfolio securities and information regarding how the Portfolio voted proxies relating to portfolio securities for the most recent 12-month period ended June 30, are available (I) without charge, upon request by calling 1-800-526-7384; and (II) on the Securities and Exchange Commission (“SEC’’) web site at http://www.sec.gov.
The Portfolio will file portfolio holdings information for each month in a fiscal quarter within 60 days after the end of the relevant fiscal quarter on Form N-PORT. Portfolio holdings information for the third month of each fiscal quarter will be made available on the SEC’s web site at http://www.sec.gov. Portfolio holdings information may be obtained upon request and without charge by calling 1-800-621-2550.
Portfolio holdings and allocations shown are as of February 28, 2019 and may not be representative of future investments. Portfolio holdings should not be relied on in making investment decisions and should not be construed as research or investment advice regarding particular securities. Current and future holdings are subject to risk.
The portfolio risk management process includes an effort to monitor and manage risk, but does not imply low risk.
This material is not authorized for distribution to prospective investors unless preceded or accompanied by a current Prospectus or summary prospectus, if applicable. Investors should consider the Portfolio’s objective, risks, and charges and expenses, and read the summary prospectus, if available, and/or the Prospectus carefully before investing or sending money. The summary prospectus, if available, and the Prospectus contain this and other information about the Portfolio and may be obtained from your authorized dealer or from Goldman Sachs & Co. LLC by calling 1-800-621-2550.
© 2019 Goldman Sachs. All rights reserved. 162456-OTU-961812/STRATFACALSAR-19/606
Goldman Sachs Funds

| | | | |
| | |
| Semi-Annual Report | | | | February 28, 2019 |
| | |
| | | | Tactical Exposure Fund |
It is our intention that beginning on January 1, 2021, paper copies of the Fund’s annual and semi-annual shareholder reports will no longer be sent by mail, unless you specifically request paper copies of the reports from the Fund or from your financial intermediary. Instead, the reports will be made available on a website, and you will be notified by mail each time a report is posted and provided with a website link to access the report.
If you already elected to receive shareholder reports electronically, you will not be affected by this change and you need not take any action. At any time, you may elect to receive reports and certain communications from the Fund electronically by calling the toll-free number below or by contacting your financial intermediary.
You may elect to receive all future shareholder reports in paper free of charge. If you hold shares of the Fund directly with the Fund’s transfer agent, you can inform the transfer agent that you wish to receive paper copies of reports by calling toll-free800-621-2550. If you hold shares of the Fund through a financial intermediary, please contact your financial intermediary to make this election. Your election to receive reports in paper will apply to all Goldman Sachs Funds held in your account if you invest through your financial intermediary or all Goldman Sachs Funds held with the Fund’s transfer agent if you invest directly with the transfer agent.

Goldman Sachs Tactical Exposure Fund
| | | | |
| | | |
| NOT FDIC-INSURED | | May Lose Value | | No Bank Guarantee |
PORTFOLIO RESULTS
Goldman Sachs Tactical Exposure Fund
Investment Objective
The Fund seeks long-term total return.
Portfolio Management Discussion and Analysis
Below, the Goldman Sachs Global Portfolio Solutions Group discusses the Goldman Sachs Tactical Exposure Fund’s (the “Fund”) performance and positioning for thesix-month period ended February 28, 2019 (the “Reporting Period”).
| Q | | How did the Fund perform during the Reporting Period? |
| A | | During the Reporting Period, the Fund’s Institutional, Class P and Class R6 Shares generated cumulative total returns of 0.37%, 0.38% and 0.47%, respectively. These returns compare to the 1.24% cumulative total return of the Fund’s benchmark, the ICE® BofAML® U.S. Dollar Three-Month LIBOR Constant Maturity Index (the “Index”), during the same time period. |
| | References to the Fund’s benchmark and to other indices, if any, mentioned herein are for informational purposes only, and unless otherwise noted, are not indications of how the Fund is managed. The use of the Index as the Fund’s benchmark does not imply the Fund is being managed like cash and does not imply low risk or low volatility. |
| Q | | What economic and market factors most influenced the Fund during the Reporting Period? |
| A | | During the Reporting Period, global economic growth slowed, led by weakness in Europe and China. However, it remained healthy overall. U.S. economic growth was stronger than the growth of other major developed countries. The news flow around U.S.-China trade negotiations, which was volatile early in the Reporting Period, improved in late 2018 as positive developments emerged. |
| | Global equities sold off significantly in the fourth quarter of 2018 amid concerns about the magnitude of the global economic growth slowdown. Market participants, who had appeared to be underpricing the pace of Federal Reserve (“Fed”) interest rate hikes when the Reporting Period began in September 2018, repriced their expectations in response to the global equitysell-off. In January 2019, the Fed’s tone became less hawkish, sparking a rally in risk assets, including equities, corporate credit and emerging markets currencies, that continued through the end of the Reporting Period. (Hawkish tends to suggest higher interest rates; opposite of dovish.) |
| | Regarding commodities, December 2018 production cuts by the Organization of the Petroleum Exporting Countries (“OPEC”) supported crude oil prices in early 2019 following a substantial decline in the fourth quarter of 2018. |
| Q | | What key factors were responsible for the Fund’s performance during the Reporting Period? |
| A | | The Fund seeks to achieve its investment objective through the implementation of investment ideas that are generally derived from short-term or medium-term market views on a variety of asset classes and instruments. |
| | Overall, our equity views detracted from the Fund’s performance during the Reporting Period. Specifically, the Fund was hurt by its tactical long position in Japanese equities during October 2018, as global economic growth slowed and a stronger Japanese yen weighed on the Japanese stock market. In addition, the Fund’s tactical long position in U.S. equities, led by energy and information technology stocks, detracted from returns. The energy sector was hurt by lower crude oil prices, while the information technology sector suffered due to investor fears about the pace of global economic growth and an inventory buildup by semiconductor companies. |
| | Within fixed income, which detracted overall, the Fund was hampered by our view that the Fed would hike interest rates in 2019, expressed through a tactical short position in Eurodollar futures, as the market priced in no rate hike at all. (Eurodollar futures are contracts that have underlying assets linked to time deposits denominated in U.S. dollars at banks outside the U.S.) |
| | On the positive side, our commodities views added to the Fund’s performance. During the Reporting Period, the Fund benefited from its tactical positioning in crude oil. In our |
1
PORTFOLIO RESULTS
| | view, crude oil prices should have ranged between $45 and $65 a barrel because we believed OPEC production cuts would limit downside price movements and political pressure would cap the upside. To express this view, we opportunistically sold call and put options when crude oil prices were close to the upper and lower ends of our expected range. (A call option is an option that gives the holder the right, but not the obligation, to buy an underlying asset at an agreed-upon price at any time up to an agreed-upon date. A put option is an option contract giving the owner the right, but not the obligation, to sell a specified amount of an underlying asset at a specified price within a specified time.) In addition, the Fund was helped by its tactical long positions in platinum and gold. |
| | Tactical exposure to a basket of currencies also contributed positively to the Fund’s performance during the Reporting Period. |
| Q | | How was the Fund positioned at the beginning of the Reporting Period? |
| A | | At the beginning of the Reporting Period, the Fund had approximately 21.43% of its total net assets in long equity-related investments; approximately 104.81% of its total net assets in long fixed income-related investments; approximately 40.51% of its total net assets in long commodity-related investments; and approximately 20.70% of its total net assets in long currency-related investments. It had no short positions in equity-related investments at the beginning of the Reporting Period. The Fund had approximately-90.74% of its total net assets in short fixed income-related investments; approximately-35.95% of its total net assets in short commodity-related investments; and approximately-3.11% of its total net assets in short currency-related investments. These positions were accomplished through the use of exchange traded funds, equity futures, equity index options, interest rates futures, crude oil options and currency forwards. Although the above sector breakout is inclusive of derivative exposure across all asset classes, it does not necessarily include the cash held to support those positions. Derivatives positions are mostly supported by cash and short-term investments held in the Fund specifically to cover its exposure and any potential margin calls or future losses experienced. |
| Q | | How did you tactically manage the Fund’s allocations during the Reporting Period? |
| A | During the Reporting Period, in response to shifting macroeconomic and market dynamics, we made a number of changes to the Fund’s tactical exposures. First, because the global economic growth slowdown was more pronounced than we expected, we gradually reduced the Fund’s tactical exposure to equities during the first four months of the Reporting Period. We then increased the Fund’s tactical exposure to equities during January 2019 amid tentative signs of global economic growth stabilization and in response to the Fed’s dovish shift. Second, we gradually reduced the Fund’s short tactical exposure to U.S. interest rates (implemented through positions in Eurodollar futures) throughout the fourth quarter of 2018, as risk assets sold off and financial conditions tightened. However, we maintained some of the Fund’s exposure to U.S. interest rates at the front, or short-term, end of the U.S. Treasury yield curve, in line with our view that the market was underpricing the pace of Fed rate hikes. (Yield curve is a spectrum of maturities of varying lengths.) In February 2019, we increased the Fund’s short tactical exposure to U.S. interest rates based on our belief the Fed would hike interest rates at least once in 2019. Third, when the Reporting Period began, the Fund had only modest exposure to commodities through a tactical long position in platinum and relative value positions in West Texas Intermediate (“WTI”) and Brent crude oil futures. By December 2018, we had moved the Fund to an outright long position in commodities, accomplished through tactical long positions in gold, platinum and crude oil. Finally, we reduced the Fund’s tactical long exposure to emerging markets currencies throughout the Reporting Period to reduce overall risk. However, in January 2019, we increased its tactical long position in emerging markets currencies, as the Fed hinted at fewer interest rate hikes than markets had previously expected. |
| Q | | How did the Fund use derivatives and similar instruments during the Reporting Period? |
| A | | The Fund used derivatives and similar instruments as part of its investment strategy to express views implemented in the Fund. Positions were supported predominantly by cash held in the Fund specifically to cover its exposure to derivative instruments and any potential margin calls or future losses experienced. |
| | During the Reporting Period, the Fund employed forward foreign currency exchange contracts to express our currency views, which added to performance. The Fund used equity futures and equity index options to gain exposure to or express our bullish and/or bearish views about the equities of certain countries. Collectively, the use of equity futures and equity index options had a negative impact on Fund |
2
PORTFOLIO RESULTS
| | performance. In addition, the Fund used call and put options to express our views on emerging markets equities, U.S. bank stocks, crude oil and gold, which had a positive impact on returns. Commodity futures and options, which were used to express our views on crude oil, gold, silver, platinum, heating oil and gasoline, added to performance. In addition, the Fund employed U.S. Treasury and Eurodollar futures to express our views on interest rates, both of which had a negative impact on performance. The Fund utilized interest rate swaps and bond futures to express our views on the shape of the U.S. Treasury yield curve and the shape of the European government bond yield curve, which contributed positively to returns. Total return swaps, which were used to express our views on European banks, added to performance. Finally, the Fund used credit default swaps to express our bullish views of U.S. high yield and investment grade corporate bonds, which had a positive impact on performance during the Reporting Period. |
| Q | | How was the Fund positioned at the end of the Reporting Period? |
| A | | At the end of the Reporting Period, the Fund had approximately 13.05% of its total net assets in long equity-related investments; approximately 65.09% of its total net assets in long fixed income-related investments; approximately 11.74% of its total net assets in long commodity-related investments; and approximately 17.99% of its total net assets in long currency-related investments. The Fund had approximately-5.03% of its total net assets in short equity-related investments; approximately-71.53% of its total net assets in short fixed income-related investments; and approximately-9.31% of its total net assets in short commodity-related investments. It had none of its total net assets in short currency-related investments at the end of the Reporting Period. These positions were accomplished through the use of exchange traded funds, equity futures, equity index options, interest rates futures, crude oil options and currency forwards. Although the above sector breakout is inclusive of derivative exposure across all asset classes, it does not necessarily include the cash held to support those positions. Derivatives positions are mostly supported by cash and short-term investments held in the Fund specifically to cover its exposure and any potential margin calls or future losses experienced. |
| Q | | Were there any changes to the Fund’s portfolio management team during the Reporting Period? |
| A | | As of February 8, 2019, Joshua Sheldon no longer served as a portfolio manager of the Fund. Effective February 19, 2019, Raymond Chan no longer served as a portfolio manager of the Fund, and Siwen Wu became a portfolio manager of the Fund. By design, all investment decisions for the Fund are performed within aco-lead or team structure, with multiple subject matter experts. This strategic decision making has been the cornerstone of our approach and helps to ensure continuity in the Fund. At the end of the Reporting Period, the portfolio managers for the Fund were Neill Nuttall, Robert Surgent and Siwen Wu. |
| Q | | What is the Fund’s tactical asset allocation view and strategy for the months ahead? |
| A | At the end of the Reporting Period, we did not find equity valuations attractive given that market prices were significantly higher than they had been at the start of 2019. Overall, the risk/reward outlook for equities was limited, in our view, as these less attractive valuations as well as weaker global economic growth were being countered by a supportive Fed and China policymakers’ stimulus measures. However, we may seek to increase the Fund’s global equity exposure if global economic growth stabilizes in 2019, as we expect. Regarding fixed income, at the end of the Reporting Period, we believed global yields would continue to rise, driven by diminishing economic slack and higher inflation around the world. Within the commodities markets, we expected crude oil prices to remain range-bound, with OPEC production cuts continuing to provide support and with political pressure from consumer nations, as well as shale producers, limiting price increases. Accordingly, at the end of the Reporting Period, we maintained a neutral view on commodities. |
| | In terms of positioning, we favored equities over corporate credit and corporate credit over government bonds at the end of the Reporting Period. Within equities, we preferred ChinaA-shares and European banks, as they appeared undervalued relative to our macro views about economic growth stability in the two regions. As for fixed income, we expected the Fed to raise short-term interest rates at least once in 2019, which we continued to express through the Fund’s short position in Eurodollar futures. |
| | Three risks may cause us to modify the Fund’s positioning. The first risk is an escalation in the U.S.-China trade war, though we believed at the end of the Reporting Period that negotiations were proceeding well and that markets were reacting positively overall. That said, if we see signs of a breakdown in talks, we plan to reevaluate the Fund’s growth-sensitive exposures overall and its tactical long position in Chinese equities in particular. The second risk is that |
3
PORTFOLIO RESULTS
| | inflation increases at a faster pace than we anticipate. Though not a near-term risk, in our view, we believe higher wage growth and inflation could eventually become a headwind for equities. Higher inflation might lead us to reduce the Fund’s tactical long positions in equities and increase its tactical short positions in fixed income. The third risk, in our opinion, is a slowdown in global economic growth, though this is not our base case. If we do see economic growth weakness outside the U.S., we plan to reexamine the Fund’s tactical long positions in Chinese equities and its tactical short positions in the U.S. dollar. |
4
PORTFOLIO BASICS
Tactical Exposure Fund
as of February 28, 2019
| | | | | | | | | | |
| | PERFORMANCE REVIEW | |
| | | |
| | | September 1, 2018–February 28, 2019 | | Fund Total Return
(based on NAV)1 | | | ICE® BofAML® U.S. Dollar
Three-Month LIBOR
Constant Maturity Index2 | |
| | | |
| | Institutional | | | 0.37 | % | | | 1.24 | % |
| | Class P | | | 0.38 | | | | 1.24 | |
| | | Class R6 | | | 0.47 | | | | 1.24 | |
| | 1 | | The net asset value (“NAV”) represents the net assets of the class of the Fund (ex-dividend) divided by the total number of shares of the class outstanding. The Fund’s performance assumes the reinvestment of dividends and other distributions. The Fund’s performance does not reflect the deduction of any applicable sales charges. |
| | 2 | | The ICE® BofAML® U.S. Dollar Three-Month LIBOR Constant Maturity Index (the “Index”) tracks the performance of a synthetic asset paying LIBOR to a stated maturity. The Index is based on the assumed purchase at par of a synthetic instrument having exactly its stated maturity and with a coupon equal to that day’s fixing rate. That issue is assumed to be sold the following day (priced at a yield equal to the current day fixing rate) and rolled into a new instrument. The Index figure does not reflect any deductions for fees, expenses or taxes. It is not possible to invest directly in an index. |
| | | | | | | | | | | | |
| | STANDARDIZED TOTAL RETURNS3 |
| | | | |
| | | For the period ended 12/31/18 | | One Year | | | Since Inception | | | Inception Date |
| | | | |
| | Institutional | | | -5.55 | % | | | -4.83 | % | | 9/6/17 |
| | Class P | | | N/A | | | | -5.87 | | | 4/17/18 |
| | | Class R6 | | | -5.50 | | | | -4.78 | | | 9/6/17 |
| | 3 | | The Standardized Total Returns are average annual total returns or cumulative total returns (only if the performance period is one year or less) as of the most recent calendar quarter-end. They assume reinvestment of all distributions at NAV. Because Institutional, Class P and Class R6 Shares do not involve a sales charge, such a charge is not applied to their Standardized Total Returns. |
The returns set forth in the tables above represent past performance. Past performance does not guarantee future results. The Fund’s investment return and principal value will fluctuate so that an investor’s shares, when redeemed, may be worth more or less than their original cost. Current performance may be lower or higher than the performance quoted above. Please visit our web site at www.GSAMFUNDS.com to obtain the most recent month-end returns. Performance reflects applicable fee waivers and/or expense limitations in effect during the periods shown. In their absence, performance would be reduced. Returns do not reflect the deduction of taxes that a shareholder would pay on Fund distributions or the redemption of Fund shares.
5
PORTFOLIO BASICS
| | | | | | | | | | |
| | EXPENSE RATIOS4 | |
| | | |
| | | | | Net Expense Ratio (Current) | | | Gross Expense Ratio (Before Waivers) | |
| | | |
| | Institutional | | | 0.91 | % | | | 1.22 | % |
| | Class P | | | 0.90 | | | | 1.21 | |
| | | Class R6 | | | 0.90 | | | | 1.21 | |
| | 4 | | The expense ratios of the Fund, both current (net of applicable fee waivers and/or expense limitations) and before waivers (gross of applicable fee waivers and/or expense limitations) are as set forth above according to the most recent publicly available Prospectus for the Fund and may differ from the expense ratios disclosed in the Consolidated Financial Highlights in this report. Pursuant to a contractual arrangement, the Fund’s waivers and/or expense limitations will remain in place through at least December 28, 2019, and prior to such date the Investment Adviser may not terminate the arrangements without the approval of the Fund’s Board of Trustees. If these arrangements are discontinued in the future, the expense ratios may change without shareholder approval. |
| | | | | | | | | | |
| | PORTFOLIO COMPOSITION5 | | | | | | | | |
| | |
| | | | | Percentage of Net Assets | |
| | | |
| | | | | as of 2/28/19 | | | as of 8/31/18 | |
| | | |
| | Investment Companies | | | 92.6 | % | | | 73.4 | % |
| | | Exchange Traded Funds | | | 0.0 | | | | 15.1 | |
| | 5 | | The percentage shown for each investment category reflects the value of investments in that category as a percentage of net assets. Figures in the graph may not sum to 100% due to the exclusion of other assets and liabilities. The graph depicts the Fund’s investments but may not represent the Fund’s market exposure due to the exclusion of certain derivatives, if any, as listed in the Additional Investment Information section of the Consolidated Schedule of Investments. |
| | | | | | | | |
| | TOP HOLDINGS AS OF 2/28/196 |
| | | |
| | | Holding | | % of Net Assets | | | Line of Business |
| | | |
| | Goldman Sachs Short-Term Conservative Income Fund – Class R6 Shares | | | 68.2 | % | | Investment Companies |
| | | Goldman Sachs Financial Square Government Fund – Institutional Shares | | | 24.4 | | | Investment Companies |
| | 6 | | The top holdings may not be representative of the Fund’s future investments. Figures in the table above may not sum to 100% due to the exclusion of other assets and liabilities. |
6
GOLDMAN SACHS TACTICAL EXPOSURE FUND
Consolidated Schedule of Investments
February 28, 2019 (Unaudited)
| | | | | | | | |
| Shares | | | Dividend
Rate | |
Value | |
| |
| Investment Companies(a) – 92.6% | | | |
| Goldman Sachs Financial Square Government Fund –
Institutional Shares |
|
| | 59,298,770 | | | 2.395% | | $ | 59,298,770 | |
| Goldman Sachs Short-Term Conservative Income Fund –
Class R6 Shares |
|
| | 16,559,789 | | | 2.634 | | | 166,094,687 | |
| | |
| TOTAL INVESTMENT COMPANIES
(Cost $225,349,231) | | $ | 225,393,457 | |
| | |
| TOTAL INVESTMENTS – 92.6%
(Cost $225,349,231) | | $ | 225,393,457 | |
| | |
| OTHER ASSETS IN EXCESS OF
LIABILITIES – 7.4% | | | 17,918,293 | |
| | |
| | NET ASSETS – 100.0% | | $ | 243,311,750 | |
| | |
| | |
|
| The percentage shown for each investment category reflects the value of investments in that category as a percentage of net assets. |
| |
(a) | | Represents affiliated funds. |
| | |
|
Currency Abbreviations: |
AUD | | —Australian Dollar |
BRL | | —Brazilian Real |
CAD | | —Canadian Dollar |
CHF | | —Swiss Franc |
EUR | | —Euro |
IDR | | —Indonesian Rupiah |
INR | | —Indian Rupee |
KRW | | —South Korean Won |
MXN | | —Mexican Peso |
NOK | | —Norwegian Krone |
NZD | | —New Zealand Dollar |
PHP | | —Philippine Peso |
THB | | —Thai Baht |
TRY | | —Turkish Lira |
TWD | | —Taiwan Dollar |
USD | | —U.S. Dollar |
ZAR | | —South African Rand |
| | |
Investment Abbreviations: |
ETF | | —Exchange Traded Fund |
EURO | | —Euro Offered Rate |
LIBOR | | —London Interbank Offered Rate |
PLC | | —Public Limited Company |
|
| | |
| The accompanying notes are an integral part of these financial statements. | | 7 |
GOLDMAN SACHS TACTICAL EXPOSURE FUND
Consolidated Schedule of Investments(continued)
February 28, 2019 (Unaudited)
|
| ADDITIONAL INVESTMENT INFORMATION |
FORWARD FOREIGN CURRENCY EXCHANGE CONTRACTS — At February 28, 2019, the Fund had the following forward foreign currency exchange contracts:
FORWARD FOREIGN CURRENCY EXCHANGE CONTRACTS WITH UNREALIZED GAIN
| | | | | | | | | | | | | | | | | | | | | | | | |
| Counterparty | | Currency
Purchased | | | Currency
Sold | | | Settlement
Date | | | Unrealized
Gain | |
| | | | | | |
MS & Co. Int. PLC | | | BRL | | | | 18,020,000 | | | | USD | | | | 4,761,024 | | | | 03/06/19 | | | $ | 34,306 | |
| | | | | | |
| | | CAD | | | | 11,800,000 | | | | USD | | | | 8,873,794 | | | | 03/20/19 | | | | 97,627 | |
| | | | | | |
| | | EUR | | | | 6,370,000 | | | | USD | | | | 7,232,313 | | | | 03/20/19 | | | | 25,789 | |
| | | | | | |
| | | IDR | | | | 132,660,000,000 | | | | USD | | | | 9,153,404 | | | | 03/20/19 | | | | 196,021 | |
| | | | | | |
| | | INR | | | | 519,500,000 | | | | USD | | | | 7,244,211 | | | | 03/20/19 | | | | 70,030 | |
| | | | | | |
| | | MXN | | | | 181,125,000 | | | | USD | | | | 8,690,830 | | | | 03/20/19 | | | | 672,637 | |
| | | | | | |
| | | NOK | | | | 600,000 | | | | USD | | | | 69,975 | | | | 03/20/19 | | | | 211 | |
| | | | | | |
| | | PHP | | | | 465,000,000 | | | | USD | | | | 8,776,056 | | | | 03/20/19 | | | | 182,168 | |
| | | | | | |
| | | THB | | | | 291,000,000 | | | | USD | | | | 9,102,866 | | | | 03/20/19 | | | | 135,356 | |
| | | | | | |
| | | TRY | | | | 25,950,000 | | | | USD | | | | 4,636,330 | | | | 03/20/19 | | | | 167,737 | |
| | | | | | |
| | | USD | | | | 7,284,480 | | | | AUD | | | | 10,240,000 | | | | 03/20/19 | | | | 18,046 | |
| | | | | | |
| | | USD | | | | 4,840,203 | | | | BRL | | | | 18,020,000 | | | | 03/06/19 | | | | 44,871 | |
| | | | | | |
| | | USD | | | | 8,991,554 | | | | CHF | | | | 8,830,000 | | | | 03/20/19 | | | | 127,083 | |
| | | | | | |
| | | USD | | | | 10,936,146 | | | | EUR | | | | 9,500,000 | | | | 03/20/19 | | | | 111,660 | |
| | | | | | |
| | | USD | | | | 7,416,913 | | | | IDR | | | | 104,670,000,000 | | | | 03/20/19 | | | | 40,129 | |
| | | | | | |
| | | USD | | | | 9,163,203 | | | | KRW | | | | 10,140,000,000 | | | | 03/20/19 | | | | 149,138 | |
| | | | | | |
| | | USD | | | | 7,341,306 | | | | MXN | | | | 141,500,000 | | | | 03/20/19 | | | | 26,298 | |
| | | | | | |
| | | USD | | | | 241,292 | | | | NOK | | | | 2,050,000 | | | | 03/20/19 | | | | 1,488 | |
| | | | | | |
| | | USD | | | | 128,685 | | | | TRY | | | | 690,000 | | | | 03/20/19 | | | | 947 | |
| | | | | | |
| | | USD | | | | 12,297,049 | | | | TWD | | | | 373,500,000 | | | | 03/20/19 | | | | 171,434 | |
| | | | | | |
| | | | ZAR | | | | 81,620,000 | | | | USD | | | | 5,693,042 | | | | 03/20/19 | | | | 84,249 | |
| | | | | | |
| TOTAL | | | | | | | | | | | | | | | | | | | | | | $ | 2,357,225 | |
FORWARD FOREIGN CURRENCY EXCHANGE CONTRACTS WITH UNREALIZED LOSS
| | | | | | | | | | | | | | | | | | | | | | |
| Counterparty | | Currency
Purchased | | | Currency
Sold | | | Settlement
Date | | | Unrealized
Loss | |
| | | | | | |
MS & Co. Int. PLC | | AUD | | | 22,410,000 | | | | USD | | | | 16,070,637 | | | | 03/20/19 | | | $ | (168,215 | ) |
| | | | | | |
| | CHF | | | 8,830,000 | | | | USD | | | | 8,989,530 | | | | 03/20/19 | | | | (125,059 | ) |
| | | | | | |
| | EUR | | | 22,450,000 | | | | USD | | | | 25,610,302 | | | | 03/20/19 | | | | (30,334 | ) |
| | | | | | |
| | KRW | | | 10,140,000,000 | | | | USD | | | | 9,175,267 | | | | 03/20/19 | | | | (161,202 | ) |
| | | | | | |
| | NOK | | | 76,000,000 | | | | USD | | | | 8,947,903 | | | | 03/20/19 | | | | (57,643 | ) |
| | | | | | |
| | TRY | | | 600,000 | | | | USD | | | | 111,544 | | | | 03/20/19 | | | | (468 | ) |
| | | | | | |
| | TWD | | | 75,000,000 | | | | USD | | | | 2,460,321 | | | | 03/20/19 | | | | (25,459 | ) |
| | | | | | |
| | USD | | | 1,372,522 | | | | AUD | | | | 1,950,000 | | | | 03/20/19 | | | | (11,223 | ) |
| | | | | | |
| | USD | | | 8,815,851 | | | | CAD | | | | 11,800,000 | | | | 03/20/19 | | | | (155,569 | ) |
| | | | | | |
| | USD | | | 11,390 | | | | EUR | | | | 10,000 | | | | 03/20/19 | | | | (4 | ) |
| | | | | | |
| | USD | | | 1,906,143 | | | | IDR | | | | 27,990,000,000 | | | | 03/20/19 | | | | (66,496 | ) |
| | | | | | |
| | USD | | | 7,259,541 | | | | INR | | | | 519,500,000 | | | | 03/20/19 | | | | (54,700 | ) |
| | | | | | |
| | USD | | | 1,989,572 | | | | MXN | | | | 39,625,000 | | | | 03/20/19 | | | | (58,888 | ) |
| | | | | | |
| | USD | | | 1,408,424 | | | | NOK | | | | 12,300,000 | | | | 03/20/19 | | | | (30,394 | ) |
| | |
| 8 | | The accompanying notes are an integral part of these financial statements. |
GOLDMAN SACHS TACTICAL EXPOSURE FUND
|
| ADDITIONAL INVESTMENT INFORMATION (continued) |
FORWARD FOREIGN CURRENCY EXCHANGE CONTRACTS WITH UNREALIZED LOSS (continued)
| | | | | | | | | | | | | | | | | | | | | | | | |
| Counterparty | | Currency
Purchased | | | Currency
Sold | | | Settlement
Date | | | Unrealized
Loss | |
| | | | | | |
| | | USD | | | | 7,259,012 | | | | NZD | | | | 10,660,000 | | | | 03/20/19 | | | $ | (3,607 | ) |
| | | | | | |
| | | USD | | | | 8,815,206 | | | | PHP | | | | 465,000,000 | | | | 03/20/19 | | | | (143,018 | ) |
| | | | | | |
| | | USD | | | | 8,895,900 | | | | THB | | | | 291,000,000 | | | | 03/20/19 | | | | (342,323 | ) |
| | | | | | |
| | | | USD | | | | 5,721,100 | | | | ZAR | | | | 81,620,000 | | | | 03/20/19 | | | | (56,190 | ) |
| | | | | | |
| TOTAL | | | | | | | | | | | | | | | | | | | | | | $ | (1,490,792 | ) |
FUTURES CONTRACTS— At February 28, 2019, the Fund had the following futures contracts:
| | | | | | | | | | | | | | | | |
| Description | | Number of
Contracts | | | Expiration
Date | | | Notional
Amount | | | Unrealized
Appreciation/
(Depreciation) | |
Long position contracts: | | | | | | | | | | | | | | | | |
| | | | |
Australian 10 Year Government Bonds | | | 127 | | | | 03/15/19 | | | $ | 12,162,918 | | | $ | 13,162 | |
| | | | |
Brent Crude | | | 83 | | | | 03/29/19 | | | | 5,503,730 | | | | (2,807 | ) |
| | | | |
Crude Oil | | | 45 | | | | 03/20/19 | | | | 2,574,900 | | | | 108,573 | |
| | | | |
FTSE China A50 Index | | | 610 | | | | 03/28/19 | | | | 7,646,350 | | | | 268,823 | |
| | | | |
Gasoline RBOB | | | 47 | | | | 04/30/19 | | | | 3,485,689 | | | | 55,751 | |
| | | | |
MSCI Emerging Markets Index | | | 226 | | | | 03/15/19 | | | | 11,827,710 | | | | (275,732 | ) |
| | | | |
Platinum | | | 309 | | | | 04/26/19 | | | | 13,521,840 | | | | 1,231,950 | |
| | | | |
Silver | | | 45 | | | | 05/29/19 | | | | 3,517,650 | | | | (79,074 | ) |
| | | | |
10 Year German Euro-Bund | | | 224 | | | | 03/07/19 | | | | 42,119,114 | | | | 146,350 | |
| | | | |
10 Year U.S. Treasury Notes | | | 1 | | | | 06/19/19 | | | | 122,000 | | | | (188 | ) |
| |
| Total | | | $ | 1,466,808 | |
Short position contracts: | | | | | | | | | | | | | | | | |
| | | | |
Eurodollars | | | (1,936 | ) | | | 09/16/19 | | | | (471,367,600 | ) | | | (344,191 | ) |
| | | | |
Euro Stoxx 50 Index | | | (326 | ) | | | 03/15/19 | | | | (12,229,264 | ) | | | (13,756 | ) |
| | | | |
Gold 100 Oz | | | (67 | ) | | | 04/26/19 | | | | (8,817,870 | ) | | | (187,375 | ) |
| | | | |
NY Harbor ULSD | | | (30 | ) | | | 04/30/19 | | | | (2,547,342 | ) | | | (37,732 | ) |
| |
| Total | | | $ | (583,054 | ) |
| |
| TOTAL FUTURES CONTRACTS | | | $ | 883,754 | |
| | |
| The accompanying notes are an integral part of these financial statements. | | 9 |
GOLDMAN SACHS TACTICAL EXPOSURE FUND
Consolidated Schedule of Investments(continued)
February 28, 2019 (Unaudited)
|
| ADDITIONAL INVESTMENT INFORMATION (continued) |
SWAP CONTRACTS — At February 28, 2019, the Fund had the following swap contracts:
CENTRALLY CLEARED INTEREST RATE SWAP CONTRACTS
| | | | | | | | | | | | | | | | | | | | | | |
| Payments Made by the Fund | | Payments
Received
by Fund | | | Termination
Date | | Notional
Amount
(000s)(a) | | | Market
Value | | | Upfront
Premium
(Received)
Paid | | | Unrealized
Appreciation/
(Depreciation) | |
| | | | | | |
3M LIBOR(b) | | | 2.900%(c) | | | 04/13/23 | | | $ 103,622 | | | | $ 752,918 | | | | $ 938 | | | | $ 751,980 | |
| | | | | | |
0.900%(d) | | | 6M EURO(c) | | | 04/13/23 | | | EUR 76,529 | | | | (1,080,700 | ) | | | 854 | | | | (1,081,554 | ) |
| | | | | | |
3M LIBOR(b) | | | 3.066(c) | | | 11/17/23 | | | $ 228,229 | | | | 2,173,196 | | | | 2,065 | | | | 2,171,131 | |
| | | | | | |
0.750(d) | | | 6M EURO(c) | | | 11/17/23 | | | EUR 191,003 | | | | (1,448,013 | ) | | | 1,970 | | | | (1,449,983 | ) |
| | | | | | |
6M EURO(c) | | | 1.568(d) | | | 04/13/31 | | | 16,182 | | | | 828,849 | | | | 280 | | | | 828,569 | |
| | | | | | |
2.965(c) | | | 3M LIBOR(b) | | | 04/13/31 | | | $ 22,840 | | | | (251,998 | ) | | | 320 | | | | (252,318 | ) |
| | | | | | |
6M EURO(c) | | | 1.510(d) | | | 11/17/31 | | | EUR 39,192 | | | | 1,299,524 | | | | (59,641 | ) | | | 1,359,165 | |
| | | | | | |
3.269(c) | | | 3M LIBOR(b) | | | 11/17/31 | | | $ 50,198 | | | | (1,648,116 | ) | | | 228,663 | | | | (1,876,779 | ) |
| | | | | | |
| TOTAL | | | | | | | | | | | | | $ 625,660 | | | | $175,449 | | | | $ 450,211 | |
| | (a) | | Represents forward starting interest rate swaps whose effective dates of commencement of accruals and cash flows occur subsequent to February 28, 2019. |
| | (b) | | Payments made quarterly. |
| | (c) | | Payments made semi-annually. |
| | (d) | | Payments made annually. |
CENTRALLY CLEARED CREDIT DEFAULT SWAP CONTRACT
| | | | | | | | | | | | | | | | | | | | | | | | |
| Referenced Obligation/Index | | Financing Rate
Received
by the Fund(a) | | Credit
Spread at
February 28,
2019(b) | | Termination
Date | | | Notional
Amount
(000s) | | | Value | | | Upfront
Premiums
(Received)
Paid | | | Unrealized
Appreciation/
(Depreciation) | |
Protection Sold: | | | | | | | | | | | | | | | | | | | | | | | | |
| | | | | | | |
CDX.NA.HY Index 31 | | 5.000% | | 3.466% | | | 12/20/23 | | | $ | 6,644 | | | $ | 480,796 | | | $ | 251,191 | | | $ | 229,605 | |
| | (a) | | Payments made quarterly. |
| | (b) | | Credit spread on the referenced obligation, together with the term of the swap contract, are indicators of payment/performance risk. The likelihood of a credit event occurring which would require a fund or its counterparty to make a payment or otherwise be required to perform under the swap contract is generally greater as the credit spread and the term of the swap contract increase. |
OVER THE COUNTER TOTAL RETURN SWAP CONTRACTS
| | | | | | | | | | | | | | | | |
| Reference Obligation/ Index | | Financing Rate
Paid by the
Fund(a) | | Counterparty | | Termination
Date | | | Notional
Amount
(000s) | | | Unrealized
Appreciation/
(Depreciation)* | |
| | | | | |
SX7T Index | | (1.300)% | | Citibank NA | | | 08/30/19 | | | $ | (4,856 | ) | | $ | — | |
| | | | | |
SX7T Index | | (2.630) | | Deutsche Bank AG | | | 05/31/19 | | | | (7,300 | ) | | | 146,736 | |
| |
| TOTAL | | | $ | 146,736 | |
| | (a) | | The Fund pays/receives quarterly coupon payments in accordance with the swap contracts. On the termination date of the swap contracts, the Fund will either receive from or pay to the counterparty an amount equal to the net of the accrued financing fees and the value of the reference security subtracted from the original notional cost (notional multiplied by the price change of the reference security, converted to U.S. Dollars). |
| | * | | There are no upfront payments on the swap contracts, therefore the unrealized gain (loss) on the swap contracts is equal to their market value. |
| | |
| 10 | | The accompanying notes are an integral part of these financial statements. |
GOLDMAN SACHS TACTICAL EXPOSURE FUND
|
| ADDITIONAL INVESTMENT INFORMATION (continued) |
WRITTEN AND PURCHASED OPTIONS CONTRACTS — At February 28, 2019, the Fund had the following written and purchased options:
OVER-THE-COUNTER OPTIONS ON EQUITIES
| | | | | | | | | | | | | | | | | | | | | | | | | | | | | | |
| Description | | Counterparty | | Exercise
Price | | | Expiration
Date | | | Number of
Contracts | | | Notional
Amount | | | Market
Value | | | Premiums
Paid (Received)
by Portfolio | | | Unrealized
Appreciation/
(Depreciation) | |
Purchased option contracts | | | | | | | | | | | | | | | | | | | | | | | | | | | | |
Calls | | | | | | | | | | | | | | | | | | | | | | | | | | | | |
| | | | | | | | |
iShares MSCI Emerging Markets ETF | | Barclays Bank PLC | | | 43.00 | | | | 03/15/2019 | | | | 371,287 | | | $ | 371,287 | | | $ | 121,781 | | | $ | 316,003 | | | $ | (194,222 | ) |
Puts | | | | | | | | | | | | | | | | | | | | | | | | | | | | |
USO Indices | | MS & Co. Int. PLC | | | 10.16 | | | | 03/14/2019 | | | | 445,589 | | | | 445,589 | | | | 1,032 | | | | 57,570 | | | | (56,538 | ) |
| | | | | |
| Total Purchased option contracts | | | | 816,876 | | | $ | 816,876 | | | $ | 122,813 | | | $ | 373,573 | | | $ | (250,760 | ) |
| | | | | | | |
Written option contracts | | | | | | | | | | | | | | | | | | | | | | | | | | | | |
Calls | | | | | | | | | | | | | | | | | | | | | | | | | | | | | | |
| | | | | | | | |
USO Indices | | Citibank NA | | | 11.74 | | | | 03/14/2019 | | | | (575,105 | ) | | $ | (575,105 | ) | | $ | (210,428 | ) | | $ | (135,955 | ) | | $ | (74,473 | ) |
| | | | | | | | |
USO Indices | | MS & Co. Int. PLC | | | 11.87 | | | | 03/14/2019 | | | | (734,134 | ) | | | (734,134 | ) | | | (208,973 | ) | | | (209,228 | ) | | | 255 | |
| | | | | | | | |
USO Indices | | Citibank NA | | | 11.33 | | | | 03/14/2019 | | | | (222,794 | ) | | | (222,794 | ) | | | (151,509 | ) | | | (58,260 | ) | | | (93,249 | ) |
| | | | | | | | |
iShares MSCI Emerging Markets ETF | | MS & Co. Int. PLC | | | 43.00 | | | | 03/15/2019 | | | | (371,287 | ) | | | (371,287 | ) | | | (121,781 | ) | | | (432,661 | ) | | | 310,880 | |
| | | | | | | | |
iShares iBoxx High Yield Corporate Bond ETF | | MS & Co. Int. PLC | | | 85.59 | | | | 03/14/2019 | | | | (84,832 | ) | | | (84,832 | ) | | | (18,579 | ) | | | (17,501 | ) | | | (1,078 | ) |
| | | | | | | | |
| | | | | | | | | | | | | | (1,988,152 | ) | | $ | (1,988,152 | ) | | $ | (711,270 | ) | | $ | (853,605 | ) | | $ | 142,335 | |
Puts | | | | | | | | | | | | | | | | | | | | | | | | | | | | |
| | | | | | | | |
USO Indices | | MS & Co. Int. PLC | | | 10.90 | | | | 03/14/2019 | | | | (734,134 | ) | | | (734,134 | ) | | | (12,775 | ) | | | (227,582 | ) | | | 214,807 | |
| | | | | | | | |
USO Indices | | MS & Co. Int. PLC | | | 10.76 | | | | 03/14/2019 | | | | (445,589 | ) | | | (445,589 | ) | | | (5,223 | ) | | | (124,765 | ) | | | 119,542 | |
| | | | | | | | |
| | | | | | | | | | | | | | (1,179,723 | ) | | $ | (1,179,723 | ) | | $ | (17,998 | ) | | $ | (352,347 | ) | | $ | 334,349 | |
| | | | | |
| Total Written option contracts | | | | (3,167,875 | ) | | $ | (3,167,875 | ) | | $ | (729,268 | ) | | $ | (1,205,952 | ) | | $ | 476,684 | |
| | | | | |
| TOTAL | | | | (2,350,999 | ) | | $ | (2,350,999 | ) | | $ | (606,455 | ) | | $ | (832,379 | ) | | $ | 225,924 | |
| | |
|
Abbreviations: |
CDX.NA.HY Index 31 | | — CDX North America High Yield Index 31 |
MS & Co. Int. PLC | | —Morgan Stanley & Co. International PLC |
SX7T Index | | —Euro STOXX Bank Net Return Index EUR |
USO Indices | | —United States Oil Fund LP ETF Indices |
|
| | |
| The accompanying notes are an integral part of these financial statements. | | 11 |
GOLDMAN SACHS TACTICAL EXPOSURE FUND
Consolidated Statement of Assets and Liabilities(a)
February 28, 2019 (Unaudited)
| | | | | | |
| | | | | | |
| | Assets: | |
| | |
| | Investments of affiliated issuers, at value (cost $225,349,231) | | $ | 225,393,457 | |
| | |
| | Purchased options (cost $373,573) | | | 122,813 | |
| | |
| | Cash | | | 3,703,719 | |
| | |
| | Foreign currencies, at value (cost $311,929) | | | 315,541 | |
| | |
| | Unrealized gain on swap contracts | | | 146,736 | |
| | |
| | Unrealized gain on forward foreign currency exchange contracts | | | 2,357,225 | |
| | |
| | Variation margin on futures | | | 381,834 | |
| | |
| | Receivables: | | | | |
| | |
| | Collateral on certain derivative contracts(b) | | | 14,476,297 | |
| | |
| | Dividends | | | 462,429 | |
| | |
| | Reimbursement from investment adviser | | | 29,232 | |
| | |
| | Other assets | | | 35,180 | |
| | |
| | Total assets | | | 247,424,463 | |
| | | | | | |
| | Liabilities: | | | | |
| | |
| | Unrealized loss on forward foreign currency exchange contracts | | | 1,490,792 | |
| | |
| | Variation margin on swaps | | | 175,051 | |
| | |
| | Written option contracts, at value (premium received $1,205,952) | | | 729,268 | |
| | |
| | Payables: | | | | |
| | |
| | Collateral on certain derivative contracts(c) | | | 970,000 | |
| | |
| | Investments purchased | | | 462,429 | |
| | |
| | Management fees | | | 109,354 | |
| | |
| | Transfer Agency fees | | | 5,571 | |
| | |
| | Due to broker — upfront payment | | | 1,654 | |
| | |
| | Accrued expenses | | | 168,594 | |
| | |
| | Total liabilities | | | 4,112,713 | |
| | | | | | |
| | Net Assets: | | | | |
| | |
| | Paid-in capital | | $ | 258,673,110 | |
| | |
| | Total distributable loss | | | (15,361,360 | ) |
| | | NET ASSETS | | $ | 243,311,750 | |
| | | Net Assets: | | | | |
| | | Institutional | | | 56,851 | |
| | | Class P | | | 96,488 | |
| | | Class R6 | | | 243,158,411 | |
| | | Total Net Assets | | $ | 243,311,750 | |
| | | Shares Outstanding $0.001 par value (unlimited number of shares authorized): | | | | |
| | | Institutional | | | 5,956 | |
| | | Class P | | | 10,238 | |
| | | Class R6 | | | 25,795,929 | |
| | | Net asset value, offering and redemption price per share: | | | | |
| | | Institutional | | | $9.55 | |
| | | Class P | | | 9.42 | |
| | | Class R6 | | | 9.43 | |
| | (a) | | Statement of Assets and Liabilities for the Fund is consolidated and includes the balances of a wholly owned subsidiary, Cayman Commodity-TEX, Ltd. Accordingly, all interfund balances and transactions have been eliminated. |
| | (b) | | Includes amounts segregated for initial margin requirements and/or collateral on futures and swaps of $3,501,233 and $10,975,064, respectively. |
| | (c) | | Amount segregated for initial margin requirements and/or collateral on swaps. |
| | |
| 12 | | The accompanying notes are an integral part of these financial statements. |
GOLDMAN SACHS TACTICAL EXPOSURE FUND
Consolidated Statement of Operations(a)
For the Six Months Ended February 28, 2019 (Unaudited)
| | | | | | |
| | | | | | |
| | Investment income: | | | | |
| | |
| | Dividends — affiliated issuers | | $ | 2,944,120 | |
| | |
| | Dividends — unaffiliated issuers | | | 585,896 | |
| | |
| | Interest | | | 61,453 | |
| | |
| | Total investment income | | | 3,591,469 | |
| | | | | | |
| | Expenses: | | | | |
| | |
| | Management fees | | | 1,054,790 | |
| | |
| | Professional fees | | | 109,087 | |
| | |
| | Custody, accounting and administrative services | | | 61,843 | |
| | |
| | Transfer Agency fees(b) | | | 42,195 | |
| | |
| | Registration fees | | | 21,812 | |
| | |
| | Printing and mailing costs | | | 12,746 | |
| | |
| | Trustee fees | | | 8,196 | |
| | |
| | Prime Broker Fees | | | 2,509 | |
| | |
| | Other | | | 4,865 | |
| | |
| | Total expenses | | | 1,318,043 | |
| | |
| | Less — expense reductions | | | (381,920 | ) |
| | |
| | Net expenses | | | 936,123 | |
| | |
| | NET INVESTMENT INCOME | | | 2,655,346 | |
| | | | | | |
| | Realized and unrealized gain (loss): | | | | |
| | |
| | Capital gain distributions from Affiliated Underlying Funds | | | 9,869 | |
| | |
| | Net realized gain (loss) from: | | | | |
| | |
| | Investments — unaffiliated issuers | | | (4,366,567 | ) |
| | |
| | Investment — affiliated issuers | | | (6,773,265 | ) |
| | |
| | Purchased options | | | (975,528 | ) |
| | |
| | Futures contracts | | | 1,136,135 | |
| | |
| | Written options | | | 1,857,988 | |
| | |
| | Swap contracts | | | (297,686 | ) |
| | |
| | Forward foreign currency exchange contracts | | | (2,163,302 | ) |
| | |
| | Foreign currency transactions | | | (54,987 | ) |
| | |
| | Net change in unrealized gain (loss) on: | | | | |
| | |
| | Investments — unaffiliated issuers | | | (228,362 | ) |
| | |
| | Investments — affiliated issuers | | | 5,937,973 | |
| | |
| | Purchased options | | | (250,760 | ) |
| | |
| | Futures contracts | | | (2,186,677 | ) |
| | |
| | Written options | | | 476,684 | |
| | |
| | Swap contracts | | | 1,902,273 | |
| | |
| | Forward foreign currency exchange contracts | | | 3,125,746 | |
| | |
| | Foreign currency translation | | | (67,680 | ) |
| | |
| | Net realized and unrealized loss | | | (2,918,146 | ) |
| | |
| | NET DECREASE IN NET ASSETS RESULTING FROM OPERATIONS | | $ | (262,800 | ) |
| | (a) | | Statement of Operations for the Fund is consolidated and includes the balances of a wholly owned subsidiary, Cayman Commodity-TEX, Ltd. Accordingly, all interfund balances and transactions have been eliminated. |
| | (b) | | Class specific Transfer Agency fees were as follows: |
| | | | | | | | | | | | | | | | | | | | | | | | | | | | | | | | | | | | | | |
| Transfer Agency Fees | | | | | | | | | | | | | | | | | | | | | | |
Institutional | | | Class P | | | Class R6 | | | | | | | | | | | | | | | | | | | | | | |
| $ | 13 | | | $ | 14 | | | $ | 42,168 | | | | | | | | | | | | | | | | | | | | | | | | | | | | | |
| | |
| The accompanying notes are an integral part of these financial statements. | | 13 |
GOLDMAN SACHS TACTICAL EXPOSURE FUND
Consolidated Statements of Changes in Net Assets(a)
| | | | | | | | | | |
| | | | | For the
Six Months Ended
February 28, 2019
(Unaudited) | | | For the Period Ended
August 31, 2018(b) | |
| | From operations: | |
| | | |
| | Net investment income | | $ | 2,655,346 | | | $ | 3,869,630 | |
| | | |
| | Net realized loss | | | (11,627,343 | ) | | | (8,420,719 | ) |
| | | |
| | Net change in unrealized gain (loss) | | | 8,709,197 | | | | (5,858,696 | ) |
| | | |
| | Net decrease in net assets resulting from operations | | | (262,800 | ) | | | (10,409,785 | ) |
| | | | | | | | | | |
| | Distributions to shareholders: | |
| | | |
| | From distributable earnings: | | | | | | | | |
| | | |
| | Institutional Shares | | | (437 | ) | | | (1,600,152 | )(c) |
| | | |
| | Class P Shares(d) | | | (1,914 | ) | | | — | |
| | | |
| | Class R6 Shares | | | (5,278,574 | ) | | | (69 | )(c) |
| | | |
| | Total distributions to shareholders | | | (5,280,925 | ) | | | (1,600,221 | ) |
| | | | | | | | | | |
| | From share transactions: | |
| | | |
| | Proceeds from sales of shares | | | 1,607,472 | | | | 603,000,995 | |
| | | |
| | Reinvestment of distributions | | | 5,280,860 | | | | 1,600,221 | |
| | | |
| | Cost of shares redeemed | | | (74,451,278 | ) | | | (276,172,789 | ) |
| | | |
| | Net increase (decrease) in net assets resulting from share transactions | | | (67,562,946 | ) | | | 328,428,427 | |
| | | |
| | TOTAL INCREASE (DECREASE) | | | (73,106,671 | ) | | | 316,418,421 | |
| | | | | | | | | | |
| | Net assets(e): | |
| | | |
| | Beginning of period | | | 316,418,421 | | | | — | |
| | | |
| | End of period | | $ | 243,311,750 | | | $ | 316,418,421 | |
| | (a) | | Statement of Changes in Net Assets for the Fund is consolidated and includes the balances of a wholly owned subsidiary, Cayman Commodity-TEX, Ltd. Accordingly, all interfund balances and transactions have been eliminated. |
| | (b) | | Commenced operations on September 6, 2017. |
| | (c) | | Prior year information has been revised to conform to current year presentation, see prior year presentation below: |
| | | | | | | | |
| | | Institutional | | | Class R6 | |
| | |
Distributions from net investment income | | $ | (577,823) | | | $ | (25) | |
| | |
Distributions from net realized gains | | | (1,022,329) | | | | (44) | |
| | (d) | | Commenced operations on April 17, 2018. |
| | (e) | | Prior year information has been revised to conform with current year presentation. Distributions in excess of net investment income was $(3,210,141) as of August 31, 2018. |
| | |
| 14 | | The accompanying notes are an integral part of these financial statements. |
GOLDMAN SACHS TACTICAL EXPOSURE FUND
Consolidated Financial Highlights
Selected Share Data for a Share Outstanding Throughout Each Period
| | | | | | | | | | |
| | | | | Goldman Sachs
Tactical Exposure Fund | |
| | | | | Institutional Shares | |
| | | | | Six Months Ended
February 28, 2019
(Unaudited) | | | Period Ended
August 31, 2018(a) | |
| | Per Share Data | |
| | | |
| | Net asset value, beginning of period | | $ | 9.58 | | | $ | 10.00 | |
| | | |
| | Net investment income(b) | | | 0.09 | | | | 0.09 | |
| | | |
| | Net realized and unrealized loss | | | (0.05 | ) | | | (0.45 | ) |
| | | |
| | Total from investment operations | | | 0.04 | | | | (0.36 | ) |
| | | |
| | Distributions to shareholders from net investment income | | | — | (c) | | | (0.02 | ) |
| | | |
| | Distributions to shareholders from net realized gains | | | (0.07 | ) | | | (0.04 | ) |
| | | |
| | Total distributions | | | (0.07 | ) | | | (0.06 | ) |
| | | |
| | Net asset value, end of period | | $ | 9.55 | | | $ | 9.58 | |
| | | |
| | Total return(d) | | | 0.37 | % | | | (3.54 | )% |
| | | |
| | Net assets, end of period (in 000s) | | $ | 57 | | | $ | 99 | |
| | | |
| | Ratio of net expenses to average net assets(e) | | | 0.68 | %(f) | | | 0.68 | %(f) |
| | | |
| | Ratio of total expenses to average net assets(e) | | | 0.94 | %(f) | | | 1.04 | %(f) |
| | | |
| | Ratio of net investment income to average net assets | | | 1.97 | %(f) | | | 0.91 | %(f) |
| | | |
| | Portfolio turnover rate(g) | | | 89 | % | | | 132 | % |
| | (a) | | Commenced operations on September 6, 2017. |
| | (b) | | Calculated based on the average shares outstanding methodology. |
| | (c) | | Amount is less than $(0.005). |
| | (d) | | Assumes investment at the NAV at the beginning of the year, reinvestment of all dividends and distributions, a complete redemption of the investment at the NAV at the end of the year and no sales or redemption charges. Total returns would be reduced if a sales or redemption charge was taken into account. Returns do not reflect the impact of taxes to shareholders relating to Fund distributions or the redemption of Fund shares. Total returns for periods less than one full year are not annualized. |
| | (e) | | Expense ratios exclude the expenses of the Underlying Funds in which the Portfolio invests. |
| | (g) | | The Fund’s portfolio turnover rate is calculated in accordance with regulatory requirements, without regard to transactions involving short term investments and certain derivatives. If such transactions were included, the Fund’s portfolio turnover rate may be higher. |
| | |
| The accompanying notes are an integral part of these financial statements. | | 15 |
GOLDMAN SACHS TACTICAL EXPOSURE FUND
Consolidated Financial Highlights(continued)
Selected Share Data for a Share Outstanding Throughout Each Period
| | | | | | | | | | |
| | | | | Goldman Sachs
Tactical Exposure Fund
| |
| | | | | Class P | |
| | | | | Six Months Ended
February 28, 2019
(Unaudited) | | | Period Ended
August 31, 2018(a) | |
| | Per Share Data | |
| | | |
| | Net asset value, beginning of period | | $ | 9.58 | | | $ | 9.88 | |
| | | |
| | Net investment income(b) | | | 0.09 | | | | 0.08 | |
| | | |
| | Net realized and unrealized loss | | | (0.06 | ) | | | (0.38 | ) |
| | | |
| | Total from investment operations | | | 0.03 | | | | (0.30 | ) |
| | | |
| | Distributions to shareholders from net investment income | | | (0.12 | ) | | | — | |
| | | |
| | Distributions to shareholders from net realized gains | | | (0.07 | ) | | | — | |
| | | |
| | Total distributions | | | (0.19 | ) | | | — | |
| | | |
| | Net asset value, end of period | | $ | 9.42 | | | $ | 9.58 | |
| | | |
| | Total return(c) | | | 0.38 | % | | | (3.04 | )% |
| | | |
| | Net assets, end of period (in 000s) | | $ | 96 | | | $ | 96 | |
| | | |
| | Ratio of net expenses to average net assets(d) | | | 0.67 | %(e) | | | 0.63 | %(e) |
| | | |
| | Ratio of total expenses to average net assets(d) | | | 0.94 | %(e) | | | 1.10 | %(e) |
| | | |
| | Ratio of net investment income to average net assets | | | 1.88 | %(e) | | | 2.18 | %(e) |
| | | |
| | Portfolio turnover rate(f) | | | 89 | % | | | 132 | % |
| | (a) | | Commenced operations April 17, 2018. |
| | (b) | | Calculated based on the average shares outstanding methodology. |
| | (c) | | Assumes investment at the NAV at the beginning of the year, reinvestment of all dividends and distributions, a complete redemption of the investment at the NAV at the end of the year and no sales or redemption charges. Total returns would be reduced if a sales or redemption charge was taken into account. Returns do not reflect the impact of taxes to shareholders relating to Fund distributions or the redemption of Fund shares. Total returns for periods less than one full year are not annualized. |
| | (d) | | Expense ratios exclude the expenses of the Underlying Funds in which the Portfolio invests. |
| | (f) | | The Fund’s portfolio turnover rate is calculated in accordance with regulatory requirements, without regard to transactions involving short term investments and certain derivatives. If such transactions were included, the Fund’s portfolio turnover rate may be higher. |
| | |
| 16 | | The accompanying notes are an integral part of these financial statements. |
GOLDMAN SACHS TACTICAL EXPOSURE FUND
Consolidated Financial Highlights(continued)
Selected Share Data for a Share Outstanding Throughout Each Period
| | | | | | | | | | |
| | | | | Goldman Sachs
Tactical Exposure Fund
| |
| | | | | Class R6 Shares | |
| | | | | Six Months Ended
February 28, 2019
(Unaudited) | | | Period Ended
August 31, 2018(a) | |
| | Per Share Data | |
| | | |
| | Net asset value, beginning of period | | $ | 9.58 | | | $ | 10.00 | |
| | | |
| | Net investment income(b) | | | 0.09 | | | | 0.18 | |
| | | |
| | Net realized and unrealized gain (loss) | | | (0.06 | ) | | | (0.54 | ) |
| | | |
| | Total from investment operations | | | 0.03 | | | | (0.36 | ) |
| | | |
| | Distributions to shareholders from net investment income | | | (0.11 | ) | | | (0.02 | ) |
| | | |
| | Distributions to shareholders from net realized gains | | | (0.07 | ) | | | (0.04 | ) |
| | | |
| | Total distributions | | | (0.18 | ) | | | (0.06 | ) |
| | | |
| | Net asset value, end of period | | $ | 9.43 | | | $ | 9.58 | |
| | | |
| | Total return(c) | | | 0.47 | % | | | (3.54 | )% |
| | | |
| | Net assets, end of period (in 000s) | | $ | 243,158 | | | $ | 316,223 | |
| | | |
| | Ratio of net expenses to average net assets(d) | | | 0.67 | %(e) | | | 0.60 | %(e) |
| | | |
| | Ratio of total expenses to average net assets(d) | | | 0.94 | %(e) | | | 0.99 | %(e) |
| | | |
| | Ratio of net investment income to average net assets | | | 1.89 | %(e) | | | 1.90 | %(e) |
| | | |
| | Portfolio turnover rate(f) | | | 89 | % | | | 132 | % |
| | (a) | | Commenced operations on September 6, 2017. |
| | (b) | | Calculated based on the average shares outstanding methodology. |
| | (c) | | Assumes investment at the NAV at the beginning of the year, reinvestment of all dividends and distributions, a complete redemption of the investment at the NAV at the end of the year and no sales or redemption charges. Total returns would be reduced if a sales or redemption charge was taken into account. Returns do not reflect the impact of taxes to shareholders relating to Fund distributions or the redemption of Fund shares. Total returns for periods less than one full year are not annualized. |
| | (d) | | Expense ratios exclude the expenses of the Underlying Funds in which the Portfolio invests. |
| | (f) | | The Fund’s portfolio turnover rate is calculated in accordance with regulatory requirements, without regard to transactions involving short term investments and certain derivatives. If such transactions were included, the Fund’s portfolio turnover rate may be higher. |
| | |
| The accompanying notes are an integral part of these financial statements. | | 17 |
GOLDMAN SACHS TACTICAL EXPOSURE FUND
Consolidated Notes to Financial Statements
February 28, 2019 (Unaudited)
Goldman Sachs Trust (the “Trust”) is a Delaware statutory trust registered under the Investment Company Act of 1940, as amended (the “Act”), as an open-end management investment company. Goldman Sachs Tactical Exposure Fund (the “Fund”) is a diversified fund and currently offers three classes of shares — Institutional, Class P and Class R6 Shares. Goldman Sachs Asset Management, L.P. (“GSAM”), an affiliate of Goldman Sachs & Co. LLC (“Goldman Sachs”), serves as investment adviser to the Fund pursuant to a management agreement (the “Agreement”) with the Trust.
|
| 2. SIGNIFICANT ACCOUNTING POLICIES |
The financial statements have been prepared in accordance with accounting principles generally accepted in the United States of America (“GAAP”) and require management to make estimates and assumptions that may affect the reported amounts and disclosures. Actual results may differ from those estimates and assumptions.
A. Basis of Consolidation for Goldman Sachs Tactical Exposure Fund— The Cayman Commodity – TEX, Ltd. (the “Subsidiary”), a Cayman Islands exempted company, was incorporated on June 27, 2017 and is currently a wholly-owned subsidiary of the Fund. The Subsidiary acts as an investment vehicle for the Fund to enable the Fund to gain exposure to certain types of commodity-linked derivative instruments. The Fund is the sole shareholder of the Subsidiary pursuant to a subscription agreement dated as of September 6, 2017, and it is intended that the Fund will remain the sole shareholder and will continue to control the Subsidiary. Under the Memorandum and Articles of Association of the Subsidiary, shares issued by the Subsidiary confer upon a shareholder the right to vote at general meetings of the Subsidiary and certain rights in connection with any winding-up or repayment of capital, as well as the right to participate in the profits or assets of the Subsidiary. All inter-fund balances and transactions have been eliminated in consolidation. As of February 28, 2019, the Fund’s net assets were $243,311,750, of which, $15,957,801, or 6.6%, represented the Subsidiary’s net assets.
B. Investment Valuation — The Fund’s valuation policy is to value investments at fair value.
C. Investment Income and Investments — Investment income includes interest income, dividend income, less any amounts reclaimable, and securities lending income, if any. Interest income is accrued daily and adjusted for amortization of premiums and accretion of discounts. Dividend income is recognized on ex-dividend date or, for certain foreign securities, as soon as such information is obtained subsequent to the ex-dividend date. Investment transactions are reflected on trade date. Realized gains and losses are calculated using identified cost. Investment transactions are recorded on the following business day for daily net asset value (“NAV”) calculations.
For derivative contracts, realized gains and losses are recorded upon settlement of the contract. Upfront payments, if any, are made or received upon entering into a swap agreement and are reflected in the Consolidated Statement of Assets and Liabilities. Upfront payments are recognized over the contract’s term/event as realized gains or losses, with the exception of forward starting swap contracts whose realized gains or losses are recognized from the effective start date.
D. Class Allocations and Expenses — Investment income, realized and unrealized gain (loss), if any, and non-class specific expenses of the Fund are allocated daily based upon the proportion of net assets of each class. Non-class specific expenses directly incurred by the Fund are charged to the Fund, while such expenses incurred by the Trust are allocated across the Fund on a straight-line and/or pro-rata basis depending upon the nature of the expenses. Class-specific expenses, where applicable, are borne by the respective share classes and include Transfer Agency fees.
E. Federal Taxes and Distributions to Shareholders — It is the Fund’s policy to comply with the requirements of the Internal Revenue Code of 1986, as amended (the “Code”), applicable to regulated investment companies and to distribute each year substantially all of its investment company taxable income and capital gains to its shareholders. Accordingly, the Fund is not required to make any provisions for the payment of federal income tax. Distributions to shareholders are recorded on the ex-dividend date. Income and capital gains distributions, if any, are declared and paid annually.
18
GOLDMAN SACHS TACTICAL EXPOSURE FUND
|
| 2. SIGNIFICANT ACCOUNTING POLICIES (continued) |
The Subsidiary is classified as a controlled foreign corporation under the Code. Therefore, the Fund is required to increase its taxable income by its share of the Subsidiary’s income. Net losses of the Subsidiary cannot be deducted by the Fund in the current period nor carried forward to offset taxable income in future periods.
Net capital losses, if any, are carried forward to future fiscal years and may be used to the extent allowed by the Code to offset any future capital gains. Losses that are carried forward will retain their character as either short-term or long-term capital losses. Utilization of capital loss carryforwards will reduce the requirement of future capital gains distributions.
The characterization of distributions to shareholders for financial reporting purposes is determined in accordance with federal income tax rules, which may differ from GAAP. The source of the Fund’s distributions may be shown in the accompanying financial statements as either from distributable earnings or capital. Certain components of the Fund’s net assets on the Consolidated Statement of Assets and Liabilities reflect permanent GAAP/tax differences based on the appropriate tax character.
F. Foreign Currency Translation — The accounting records and reporting currency of the Fund are maintained in U.S. dollars. Assets and liabilities denominated in foreign currencies are translated into U.S. dollars using the current exchange rates at the close of each business day. The effect of changes in foreign currency exchange rates on investments is included within net realized and unrealized gain (loss) on investments. Changes in the value of other assets and liabilities as a result of fluctuations in foreign exchange rates are included in the Consolidated Statement of Operations within net change in unrealized gain (loss) on foreign currency translation. Transactions denominated in foreign currencies are translated into U.S. dollars on the date the transaction occurred, the effects of which are included within net realized gain (loss) on foreign currency transactions.
| | |
| 3. INVESTMENTS AND FAIR VALUE MEASUREMENTS | | |
U.S. GAAP defines the fair value of a financial instrument as the amount that would be received to sell an asset or paid to transfer a liability in an orderly transaction between market participants at the measurement date (i.e., the exit price); the Fund’s policy is to use the market approach. GAAP establishes a fair value hierarchy that prioritizes the inputs to valuation techniques used to measure fair value. The hierarchy gives the highest priority to unadjusted quoted prices in active markets for identical assets or liabilities (Level 1 measurements) and the lowest priority to unobservable inputs (Level 3 measurements). The levels used for classifying investments are not necessarily an indication of the risk associated with investing in these investments. The three levels of the fair value hierarchy are described below:
Level 1 — Unadjusted quoted prices in active markets that are accessible at the measurement date for identical, unrestricted assets or liabilities;
Level 2 — Quoted prices in markets that are not active or financial instruments for which significant inputs are observable (including, but not limited to, quoted prices for similar investments, interest rates, foreign exchange rates, volatility and credit spreads), either directly or indirectly;
Level 3 — Prices or valuations that require significant unobservable inputs (including GSAM’s assumptions in determining fair value measurement).
The Board of Trustees (“Trustees”) has approved Valuation Procedures that govern the valuation of the portfolio investments held by the Fund, including investments for which market quotations are not readily available. The Trustees have delegated to GSAM day-to-day responsibility for implementing and maintaining internal controls and procedures related to the valuation of the Fund’s investments. To assess the continuing appropriateness of pricing sources and methodologies, GSAM regularly performs price verification procedures and issues challenges as necessary to third party pricing vendors or brokers, and any differences are reviewed in accordance with the Valuation Procedures.
A. Level 1 and Level 2 Fair Value Investments — The valuation techniques and significant inputs used in determining the fair values for investments classified as Level 1 and Level 2 are as follows:
Underlying Funds (including Money Market Funds) — Underlying funds (“Underlying Funds”) include other investment companies and exchange-traded funds (“ETFs”). Investments in the Underlying Funds (except ETFs) are valued at the NAV per
19
GOLDMAN SACHS TACTICAL EXPOSURE FUND
Consolidated Notes to Financial Statements(continued)
February 28, 2019 (Unaudited)
|
| 3. INVESTMENTS AND FAIR VALUE MEASUREMENTS (continued) |
share on the day of valuation. ETFs are valued daily at the last sale price or official closing price on the principal exchange or system on which the investment is traded. Because the Fund invests in Underlying Funds that fluctuate in value, the Fund’s shares will correspondingly fluctuate in value. To the extent these investments are actively traded, they are classified as Level 1 of the fair value hierarchy, otherwise they are generally classified as Level 2. For information regarding an Underlying Fund’s accounting policies and investment holdings, please see the Underlying Fund’s shareholder report.
Derivative Contracts —A derivative is an instrument whose value is derived from underlying assets, indices, reference rates or a combination of these factors. The Fund enters into derivative transactions to hedge against changes in interest rates, securities prices, and/or currency exchange rates, to increase total return, or to gain access to certain markets or attain exposure to other underliers.
Exchange-traded derivatives, including futures and options contracts, are generally valued at the last sale or settlement price on the exchange where they are principally traded. Exchange-traded options without settlement prices are generally valued at the midpoint of the bid and ask prices on the exchange where they are principally traded (or, in the absence of two-way trading, at the last bid price for long positions and the last ask price for short positions). Exchange-traded derivatives typically fall within Level 1 of the fair value hierarchy. Over-the-counter (“OTC”) and centrally cleared derivatives are valued using market transactions and other market evidence, including market-based inputs to models, calibration to market-clearing transactions, broker or dealer quotations, or other alternative pricing sources. Where models are used, the selection of a particular model to value OTC and centrally cleared derivatives depends upon the contractual terms of, and specific risks inherent in, the instrument, as well as the availability of pricing information in the market. Valuation models require a variety of inputs, including contractual terms, market prices, yield curves, credit curves, measures of volatility, voluntary and involuntary prepayment rates, loss severity rates and correlations of such inputs. For OTC and centrally cleared derivatives that trade in liquid markets, model inputs can generally be verified and model selection does not involve significant management judgment. OTC and centrally cleared derivatives are classified within Level 2 of the fair value hierarchy when significant inputs are corroborated by market evidence.
i. Forward Contracts — A forward contract is a contract between two parties to buy or sell an asset at a specified price on a future date. A forward contract settlement can occur on a cash or delivery basis. Forward contracts are marked-to-market daily using independent vendor prices, and the change in value, if any, is recorded as an unrealized gain or loss. Cash and certain investments may be used to collateralize forward contracts.
Aforward foreign currency exchange contractis a forward contract in which the Fund agrees to receive or deliver a fixed quantity of one currency for another, at a pre-determined price at a future date. All forward foreign currency exchange contracts are marked-to-market daily at the applicable forward rate. Non-deliverable forward foreign currency exchange contracts are settled with the counterparty in cash without the delivery of foreign currency.
ii. Futures Contracts — Futures contracts are contracts to buy or sell a standardized quantity of a specified commodity or security. Upon entering into a futures contract, the Fund deposits cash or securities in an account on behalf of the broker in an amount sufficient to meet the initial margin requirement. Subsequent payments are made or received by the Fund equal to the daily change in the contract value and are recorded as variation margin receivable or payable with a corresponding offset to unrealized gains or losses. For financial reporting purposes, cash collateral that has been pledged to cover obligations of the Fund and cash collateral received, if any, is reported separately on the Consolidated Statement of Assets and Liabilities as receivables/payables for collateral on certain derivative contracts. Non-cash collateral pledged by the Fund, if any, is noted in the Consolidated Schedule of Investments.
iii. Options — When the Fund writes call or put options, an amount equal to the premium received is recorded as a liability and is subsequently marked-to-market to reflect the current value of the option written. Swaptions are options on interest rate swap contracts.
Upon the purchase of a call option or a put option by the Fund, the premium paid is recorded as an investment and subsequently marked-to-market to reflect the current value of the option. Certain options may be purchased with premiums to be determined on a future date. The premiums for these options are based upon implied volatility parameters at specified terms.
20
GOLDMAN SACHS TACTICAL EXPOSURE FUND
|
| 3. INVESTMENTS AND FAIR VALUE MEASUREMENTS (continued) |
iv. Swap Contracts — Bilateral swap contracts are agreements in which the Fund and a counterparty agree to exchange periodic payments on a specified notional amount or make a net payment upon termination. Bilateral swap transactions are privately negotiated in the OTC market and payments are settled through direct payments between the Fund and the counterparty. By contrast, certain swap transactions are subject to mandatory central clearing. These swaps are executed through a derivatives clearing member (“DCM”), acting in an agency capacity, and submitted to a central counterparty (“CCP”)(“centrally cleared swaps”), in which case all payments are settled with the CCP through the DCM. Swaps are marked-to-market daily using pricing vendor quotations, counterparty or clearinghouse prices or model prices, and the change in value, if any, is recorded as an unrealized gain or loss. Upon entering into a swap contract, the Fund is required to satisfy an initial margin requirement by delivering cash or securities to the counterparty (or in some cases, segregated in a triparty account on behalf of the counterparty), which can be adjusted by any mark-to-market gains or losses pursuant to bilateral or centrally cleared arrangements. For centrally cleared swaps the daily change in valuation, if any, is recorded as a receivable or payable for variation margin.
An interest rate swap is an agreement that obligates two parties to exchange a series of cash flows at specified intervals, based upon or calculated by reference to changes in interest rates on a specified notional principal amount. The payment flows are usually netted against each other, with the difference being paid by one party to the other.
A credit default swap is an agreement that involves one party (the buyer of protection) making a stream of payments to another party (the seller of protection) in exchange for the right to receive protection on a reference security or obligation, including a group of assets or exposure to the performance of an index. The Fund’s investment in credit default swaps may involve greater risks than if the Fund had invested in the referenced obligation directly. Credit events are contract specific but may include bankruptcy, failure to pay, restructuring and obligation acceleration. If the Fund buys protection through a credit default swap and no credit event occurs, its payments are limited to the periodic payments previously made to the counterparty. Upon the occurrence of a specified credit event, the Fund, as a buyer of credit protection, is entitled to receive an amount equal to the notional amount of the swap and deliver to the seller the defaulted reference obligation in a physically settled trade. The Fund may also receive a net settlement amount in the form of cash or securities equal to the notional amount of the swap reduced by the recovery value of the reference obligation in a cash settled trade.
As a seller of protection, the Fund generally receives a payment stream throughout the term of the swap, provided that there is no credit event. In addition, if the Fund sells protection through a credit default swap, the Fund could suffer a loss because the value of the referenced obligation and the premium payments received may be less than the notional amount of the swap paid to the buyer of protection. Upon the occurrence of a specified credit event, the Fund, as a seller of credit protection, may be required to take possession of the defaulted reference obligation and pay the buyer an amount equal to the notional amount of the swap in a physically settled trade. The Fund may also pay a net settlement amount in the form of cash or securities equal to the notional amount of the swap reduced by the recovery value of the reference obligation in a cash settled trade. Recovery values are at times established through the credit event auction process in which market participants are ensured that a transparent price has been set for the defaulted security or obligation. In addition, the Fund is entitled to a return of any assets, which have been pledged as collateral to the counterparty upon settlement.
The maximum potential amount of future payments (undiscounted) that the Fund as seller of protection could be required to make under a credit default swap would be an amount equal to the notional amount of the agreement. These potential amounts would be partially offset by any recovery values of the respective referenced obligations or net amounts received from a settlement of a credit default swap for the same reference security or obligation where the Fund bought credit protection.
A total return swap is an agreement that gives the Fund the right to receive the appreciation in the value of a specified security, basket of investments or indices, index or other instrument in return for a fee paid to the counterparty, which will typically be an agreed upon interest rate. If the underlying asset declines in value over the term of the swap, the Fund may also be required to pay the dollar value of that decline to the counterparty.
B. Level 3 Fair Value Investments — To the extent that significant inputs to valuation models and other alternative pricing sources are unobservable, or if quotations are not readily available, or if GSAM believes that such quotations do not accurately
21
GOLDMAN SACHS TACTICAL EXPOSURE FUND
Consolidated Notes to Financial Statements(continued)
February 28, 2019 (Unaudited)
|
| 3. INVESTMENTS AND FAIR VALUE MEASUREMENTS (continued) |
reflect fair value, the fair value of the Fund’s investments may be determined under Valuation Procedures approved by the Trustees. GSAM, consistent with its procedures and applicable regulatory guidance, may make an adjustment to the most recent valuation prices of either domestic or foreign securities in light of significant events to reflect what it believes to be the fair value of the securities at the time of determining the Fund’s NAV.
C. Fair Value Hierarchy — The following is a summary of the Fund’s investments and derivatives classified in the fair value hierarchy as of February 28, 2019:
| | | | | | | | | | | | |
| | | |
| Investment Type | | Level 1 | | | Level 2 | | | Level 3 | |
| | | |
| Assets | | | | | | | | | | | | |
| | | |
Investment Companies | | $ | 225,393,457 | | | $ | — | | | $ | — | |
| | | |
| Total | | $ | 225,393,457 | | | $ | — | | | $ | — | |
| | | |
| Derivative Type | | | | | | | | | |
| | | |
| Assets | | | | | | | | | | | | |
| | | |
Forward Foreign Currency Exchange Contracts(a) | | $ | — | | | $ | 2,357,225 | | | $ | — | |
| | | |
Futures Contracts(a) | | | 1,824,609 | | | | — | | | | — | |
| | | |
Interest Rate Swap Contracts(a) | | | — | | | | 5,110,845 | | | | — | |
| | | |
Credit Default Swap Contracts(a) | | | — | | | | 229,605 | | | | — | |
| | | |
Total Return Swap Contracts(a) | | | — | | | | 146,736 | | | | — | |
| | | |
Options Purchased | | | — | | | | 122,813 | | | | — | |
| | | |
| Total | | $ | 1,824,609 | | | $ | 7,967,224 | | | $ | — | |
| | | |
| Liabilities | | | | | | | | | | | | |
| | | |
Forward Foreign Currency Exchange Contracts(a) | | $ | — | | | $ | (1,490,792 | ) | | $ | — | |
| | | |
Futures Contracts(a) | | | (940,855 | ) | | | — | | | | — | |
| | | |
Interest Rate Swap Contracts(a) | | | — | | | | (4,660,634 | ) | | | — | |
| | | |
Written option contracts | | | — | | | | (729,268 | ) | | | — | |
| | | |
| Total | | $ | (940,855 | ) | | $ | (6,880,694 | ) | | $ | — | |
| (a) | | Amount shown represents unrealized gain (loss) at period end. |
For further information regarding security characteristics, see the Consolidated Schedule of Investments.
22
GOLDMAN SACHS TACTICAL EXPOSURE FUND
|
| 4. INVESTMENTS IN DERIVATIVES |
The following tables set forth, by certain risk types, the gross value of derivative contracts (not considered to be hedging instruments for accounting disclosure purposes) as of February 28, 2019. These instruments were used as part of the Fund’s investment strategies and to obtain and/or manage exposure related to the risks below. The values in the tables below exclude the effects of cash collateral received or posted pursuant to these derivative contracts, and therefore are not representative of the Fund’s net exposure.
| | | | | | | | | | | | |
| Risk | | Consolidated Statement of Assets
and Liabilities | | Assets | | | Consolidated Statement of Assets
and Liabilities | | Liabilities | |
Interest rate | | Variation margin on swap contracts; Variation margin on futures contracts | | $ | 5,270,367 | (a) | | Variation margin on swap contracts; Variation margin on futures contracts; Written option contracts, at value | | $ | (5,023,592) | (a) |
Credit | | Variation margin on swap contracts | | | 229,605 | (a) | | — | | | — | |
Currency | | Receivable for unrealized gain on forward foreign currency exchange contracts | | | 2,357,225 | | | Payable for unrealized loss on forward foreign currency exchange contracts | | | (1,490,792) | |
Commodity | | Variation margin on futures contracts; Purchased options, at value | | | 1,397,306 | (a) | | Variation margin on futures contracts; Written option contracts, at value | | | (895,896) | (a) |
Equity | | Receivable for unrealized gain on swap contracts Variation margin on futures contracts; Purchased options, at value | | | 537,340 | (a) | | Variation margin on futures contracts; Written option contracts, at value | | | (411,269) | (a) |
| Total | | | | $ | 9,791,843 | | | | | $ | (7,821,549) | |
| (a) | | Includes unrealized gain (loss) on futures contracts and centrally cleared swaps described in the Additional Investment Information sections of the Consolidated Schedule of Investments. Only current day’s variation margin is reported within the Consolidated Statement of Assets and Liabilities. |
The following tables set forth, by certain risk types, the Fund’s gains (losses) related to these derivatives and their indicative volumes for the six months ended February 28, 2019. These gains (losses) should be considered in the context that these derivative contracts may have been executed to create investment opportunities and/or economically hedge certain investments, and accordingly, certain gains (losses) on such derivative contracts may offset certain (losses) gains attributable to investments. These gains (losses) are included in “Net realized gain (loss)” or “Net change in unrealized gain (loss)” on the Consolidated Statement of Operations:
| | | | | | | | | | | | | | |
| Risk | | Consolidated Statement of Operations | | Net Realized
Gain (Loss) | | | Net Change in
Unrealized
Gain (Loss) | | | Average
Number of
Contracts(a) | |
| Interest rate | | Net realized gain (loss) from futures contracts and written options/Net change in unrealized gain (loss) on futures contracts, swap contracts and written options | | $ | (61,624 | ) | | $ | (1,123,131 | ) | | | 3,307 | |
| Credit | | Net realized gain (loss) from swap contracts/Net change in unrealized gain (loss) on swap contracts | | | 110,083 | | | | 229,605 | | | | 1 | |
| Commodity | | Net realized gain (loss) from purchased options, futures contracts, swap contracts and written options/Net change in unrealized gain (loss) on purchased options, futures contracts, swap contracts and written options | | | (139,529 | ) | | | 1,353,386 | | | | 1,810 | |
| Currency | | Net realized gain (loss) from purchased options and forward foreign currency exchange contracts /Net change in unrealized gain (loss) on forward foreign currency exchange contracts | | | (2,390,631 | ) | | | 3,125,746 | | | | 49 | |
23
GOLDMAN SACHS TACTICAL EXPOSURE FUND
Consolidated Notes to Financial Statements(continued)
February 28, 2019 (Unaudited)
|
| 4. INVESTMENTS IN DERIVATIVES (continued) |
| | | | | | | | | | | | | | |
| | | | |
| Risk | | Consolidated Statement of Operations | | Net Realized
Gain (Loss) | | | Net Change in
Unrealized
Gain (Loss) | | | Average
Number of
Contracts(a) | |
| Equity | | Net realized gain (loss) from from purchased options, futures contracts, swap contracts and written options/Net change in unrealized gain (loss) on purchased options, futures contracts, swap contracts and written options | | | 2,039,308 | | | | (518,340 | ) | | | 727 | |
| Total | | | | $ | (442,393 | ) | | $ | 3,067,276 | | | | 5,894 | |
| (a) | | Average number of contracts is based on the average of month end balances for the six months ended February 28, 2019. |
In order to better define its contractual rights and to secure rights that will help the Fund mitigate its counterparty risk, the Fund may enter into an International Swaps and Derivatives Association, Inc. Master Agreement (“ISDA Master Agreement”) or similar agreement with its derivatives counterparties. An ISDA Master Agreement is a bilateral agreement between the Fund and a counterparty that governs OTC derivatives (including forward foreign currency exchange contracts, and certain options and swaps), and typically contains, among other things, collateral posting terms and netting provisions in the event of a default and/or termination event. The provisions of the ISDA Master Agreement typically permit a single net payment in the event of a default (close-out netting) or similar event, including the bankruptcy or insolvency of the counterparty.
Collateral and margin requirements differ between exchange traded derivatives and OTC derivatives. Margin requirements are established by the broker or clearing house for exchange-traded and centrally cleared derivatives (financial futures contracts, options and centrally cleared swaps) pursuant to governing agreements for those instrument types. Brokers can ask for margin in excess of the minimum in certain circumstances. Collateral terms are contract-specific for OTC derivatives. For derivatives traded under an ISDA Master Agreement, the collateral requirements are typically calculated by netting the marked to market amount for each transaction under such agreement and comparing that amount to the value of any collateral currently pledged by the Fund and the counterparty. Additionally, the Fund may be required to post initial margin to the counterparty, the terms of which would be outlined in the confirmation of the OTC transaction.
For financial reporting purposes, cash collateral that has been pledged to cover obligations of the Fund and cash collateral received from the counterparty, if any, is reported separately on the Consolidated Statement of Assets and Liabilities as receivables/payables for collateral on certain derivative contracts. Non-cash collateral pledged by the Fund, if any, is noted in the Consolidated Schedule of Investments. Generally, the amount of collateral due from or to a counterparty must exceed a minimum transfer amount threshold before a transfer is required to be made. To the extent amounts due to the Fund from its counterparties are not fully collateralized, contractually or otherwise, the Fund bears the risk of loss from counterparty nonperformance. The Fund attempts to mitigate counterparty risk by only entering into agreements with counterparties that the Investment Adviser believes to be of good standing and by monitoring the financial stability of those counterparties.
Additionally, the netting of assets and liabilities and the offsetting of collateral pledged or received are based on contractual netting/set-off provisions in the ISDA Master Agreement or similar agreements. However, in the event of a default or insolvency of a counterparty, a court could determine that such rights are not enforceable due to the restrictions or prohibitions against the right of setoff that may be imposed in accordance with a particular jurisdiction’s bankruptcy or insolvency laws.
24
GOLDMAN SACHS TACTICAL EXPOSURE FUND
|
| 4. INVESTMENTS IN DERIVATIVES (continued) |
The following tables set forth the Fund’s net exposure for derivative instruments that are subject to enforceable master netting arrangements or similar agreements as of February 28, 2019:
| | | | | | | | | | | | | | | | | | | | | | | | | | | | | | | | | | | | | | | | |
| | | Derivative Assets(1) | | | Derivative Liabilities(1) | | | Net Derivative
Asset
(Liabilities) | | | Collateral
(Received)
Pledged(1) | | | Net
Amount(2) | |
| Counterparty | | Options
Purchased | | | Swaps | | | Forward
Currency
Contracts | | | Total | | | Forward
Currency
Contracts | | | Options
Written | | | Total | |
Barclays Bank PLC | | $ | 121,781 | | | $ | — | | | $ | — | | | $ | 121,781 | | | $ | — | | | $ | — | | | $ | — | | | $ | 121,781 | | | $ | (121,781 | ) | | $ | — | |
Citibank NA | | | — | | | | — | | | | — | | | | — | | | | — | | | | (361,937 | ) | | | (361,937 | ) | | | (361,937 | ) | | | — | | | | (361,937 | ) |
Deutsche Bank AG | | | — | | | | 146,736 | | | | — | | | | 146,736 | | | | — | | | | — | | | | — | | | | 146,736 | | | | — | | | | 146,736 | |
Morgan Stanley & Co. International PLC | | | 1,032 | | | | — | | | | 2,357,225 | | | | 2,358,257 | | | | (1,490,792 | ) | | | (367,331 | ) | | | (1,858,123 | ) | | | 500,134 | | | | — | | | | 500,134 | |
| | | | | | | | | | |
Total | | $ | 122,813 | | | $ | 146,736 | | | $ | 2,357,225 | | | $ | 2,626,774 | | | $ | (1,490,792 | ) | | $ | (729,268 | ) | | $ | (2,220,060 | ) | | $ | 406,714 | | | $ | (121,781 | ) | | $ | 284,933 | |
| (1) | | Gross amounts available for offset but not netted in the Consolidated Statement of Assets and Liabilities. |
| (2) | | Net amount represents the net amount due (to) from counterparty in the event of a default based on the contractual set-off rights under the agreement. Net amount excludes any over-collateralized amounts. |
|
| 5. AGREEMENTS AND AFFILIATED TRANSACTIONS |
A. Management Agreement — Under the Agreement, GSAM manages the Fund, subject to the general supervision of the Trustees.
As compensation for the services rendered pursuant to the Agreement, the assumption of the expenses related thereto and administration of the Fund’s business affairs, including providing facilities, GSAM is entitled to a management fee, accrued daily and paid monthly, equal to an annual percentage rate of each Fund’s average daily net assets.
As of February 28, 2019, the contractual management fee with GSAM were as stated below. The effective contractual management rate and the effective net management fee rate represent the rates for the six months ended February 28, 2019.
| | | | | | | | | | | | | | | | | | | | | | |
| Contractual Management Rate | | | | |
First
$2 billion | | | Next
$3 billion | | | Next
$3 billion | | | Over
$8 billion | | | Effective
Fee Rate | | | Effective Net
Management
Fee Rate^ | |
| | 0.75% | | | | 0.68% | | | | 0.64% | | | | 0.63% | | | | 0.75% | | | | 0.59% | |
| ^ | | Effective Net Management Rate includes impact of management fee waivers of underlying funds, if any. |
The Fund invested in Institutional and/or Class R6 Shares of the Goldman Sachs Emerging Markets Debt Fund, Goldman Sachs Financial Square Government Fund and the Goldman Sachs Short-Term Conservative Income Fund, which are affiliated Underlying Funds. GSAM has agreed to waive a portion of its management fee payable by the Fund in an amount equal to the management fee it earns as an investment adviser to the affiliated Underlying Funds in which the Fund invests. For the period ended February 28, 2019, GSAM waived $229,112 of the Fund’s management fee.
GSAM also provides management services to the Subsidiary pursuant to a Subsidiary Management Agreement (the “Subsidiary Agreement”) and is entitled to a management fee accrued daily and paid monthly, equal to an annual percentage rate of 0.42% of the Subsidiary’s average daily net assets. In consideration of the Subsidiary’s management fee, and for as long as the Subsidiary Agreement remains in effect, GSAM has contractually agreed to waive irrevocably a portion of the Fund’s management fee in an amount equal to the management fee accrued and paid to GSAM by the Subsidiary under the Subsidiary Agreement. For the six months ended February 28, 2019, GSAM waived $27,567 of the Fund’s management fee. This waiver represents an inter-fund transaction and, accordingly, has been eliminated in consolidation.
B. Transfer Agency Agreement — Goldman Sachs also serves as the transfer agent of the Fund for a fee pursuant to the Transfer Agency Agreement. The fees charged for such transfer agency services are accrued daily and paid monthly at annual rates
25
GOLDMAN SACHS TACTICAL EXPOSURE FUND
Consolidated Notes to Financial Statements(continued)
February 28, 2019 (Unaudited)
|
| 5. AGREEMENTS AND AFFILIATED TRANSACTIONS (continued) |
as follows: 0.03% of the average daily net assets of Class P and Class R6 Shares; and 0.04% of the average daily net assets of Institutional Shares.
C. Other Expense Agreements and Affiliated Transactions — GSAM has agreed to limit certain “Other Expenses” of the Fund (excluding acquired (underlying) fund fees and expenses, transfer agency fees and expenses, service fees and shareholder administration fees (as applicable), taxes, interest, brokerage fees, expenses of shareholder meetings, litigation and indemnification, and extraordinary expenses) to the extent such expenses exceed, on an annual basis, a percentage rate of the average daily net assets of the Fund. Such Other Expense reimbursements, if any, are accrued daily and paid monthly. In addition, the Fund is not obligated to reimburse GSAM for prior fiscal year expense reimbursements, if any. The Other Expense limitation as an annual percentage rate of average daily net assets for the Fund are 0.044%. The Other Expense limitation will remain in place through at least December 28, 2019, and prior to such date GSAM may not terminate the arrangements without the approval of the Trustees. In addition, the Fund has entered into certain offset arrangements with the transfer agent, which may result in a reduction of the Fund’s expenses and are received irrespective of the application of the “Other Expense” limitations described above.
For the six months ended February 28, 2019, these expense reductions, including any fee waivers and Other Expense reimbursements, were as follows:
| | | | | | | | | | |
Management
Fees | | | Other Expense
Reimbursements | | | Total Expense
Reductions | |
| $ | 229,112 | | | $ | 152,808 | | | $ | 381,920 | |
D. Line of Credit Facility — As of February 28, 2019, the Fund participated in a $770,000,000 committed, unsecured revolving line of credit facility (the “facility”) together with other funds of the Trust and certain registered investment companies having management agreements with GSAM or its affiliates. This facility is to be used for temporary emergency purposes, or to allow for an orderly liquidation of securities to meet redemption requests. The interest rate on borrowings is based on the federal funds rate. The facility also requires a fee to be paid by the Fund based on the amount of the commitment that has not been utilized. For the six months ended February 28, 2019, the Fund did not have any borrowings under the facility.
E. Other Transactions with Affiliates — For the six months ended February 28, 2019, Goldman Sachs did not earn any brokerage commissions from portfolio transactions on behalf of the Fund.
The table below shows the transactions in and earnings from investments in the Underlying Funds for the six months ended February 28, 2019:
| | | | | | | | | | | | | | | | | | | | | | | | | | | | | | | | | | | | |
| Underlying Funds | | Beginning Value as of August 31, 2018 | | | Purchases
at Cost | | | Proceeds
from Sales | | | Net Realized
Gain/(Loss)
on sales of
Affiliated
Investment
Companies | | | Change in
Unrealized
Appreciation/
Depreciation | | | Ending
Value as of
February 28,
2019 | | | Shares as of
February 28, 2019 | | | Dividend
Income from
Affiliated
Investment
Companies | | | Capital Gain
Distributions
from
Affiliated
Investment
Companies | |
Goldman Sachs Emerging Markets Debt Fund — Class R6 Shares | | $ | 64,291,556 | | | $ | 272,149 | | | $ | (63,684,187 | ) | | $ | (6,773,265 | ) | | $ | 5,893,747 | | | $ | — | | | | — | | | $ | 335,733 | | | $ | — | |
Goldman Sachs Financial Square Government Fund — Institutional Shares | | | 168,107,291 | | | | 241,455,867 | | | | (350,264,388 | ) | | | — | | | | — | | | | 59,298,770 | | | | 59,298,770 | | | | 857,925 | | | | — | |
Goldman SachsShort-Term Conservative Income Fund — Class R6 Shares | | | — | | | | 166,050,461 | | | | — | | | | — | | | | 44,226 | | | | 166,094,687 | | | | 16,559,789 | | | | 1,750,462 | | | | 9,869 | |
Total | | $ | 232,398,847 | | | $ | 407,778,477 | | | $ | (413,948,575 | ) | | $ | (6,773,265 | ) | | $ | 5,937,973 | | | $ | 225,393,457 | | | | 75,858,559 | | | $ | 2,944,120 | | | $ | 9,869 | |
26
GOLDMAN SACHS TACTICAL EXPOSURE FUND
|
| 5. AGREEMENTS AND AFFILIATED TRANSACTIONS (continued) |
As of February 28, 2019, the following Fund of Funds Portfolios were the beneficial owners of 5% or more of total outstanding shares of the Fund:
| | | | | | | | | | |
Goldman Sachs
Balanced Strategy
Portfolio | | | Goldman Sachs
Growth Strategy
Portfolio | | | Goldman Sachs
Growth and Income
Strategy Portfolio | |
| | 15% | | | | 24% | | | | 28% | |
As of February 28, 2019, The Goldman Sachs Group, Inc. was the beneficial owner of 10% of Class P Shares of the Fund.
|
| 6. PORTFOLIO SECURITIES TRANSACTIONS |
The cost of purchases and proceeds from sales and maturities of long-term securities for the six months ended February 28, 2019, were $216,504,462 and $157,074,407, respectively.
As of the Fund’s most recent fiscal year end, August 31, 2018, the Fund had $(9,644,360) in timing differences due to qualified late year loss deferral and post October losses.
As of February 28, 2019, the Fund’ aggregate security unrealized gains and losses based on cost for U.S. federal income tax purposes were as follows:
| | | | |
Tax Cost | | $ | 224,944,565 | |
Gross unrealized gain | | | 448,892 | |
Gross unrealized loss | | | — | |
Net unrealized gains (losses) on securities | | $ | 448,892 | |
The difference between GAAP-basis and tax basis unrealized gains (losses) is attributable primarily to net mark to market gains/(losses) on regulated futures and foreign currency contracts, and differences in the tax treatment of swap transactions.
GSAM has reviewed the Fund’s tax positions for all open tax years (the current and prior year, as applicable) and has concluded that no provision for income tax is required in the Fund’s financial statements. Such open tax years remain subject to examination and adjustment by tax authorities.
The Fund’s risks include, but are not limited to, the following:
Derivatives Risk — The Fund’s use of derivatives may result in loss. Derivative instruments, which may pose risks in addition to and greater than those associated with investing directly in securities, currencies or other instruments, may be illiquid or less liquid, volatile, difficult to price and leveraged so that small changes in the value of the underlying instruments may produce disproportionate losses to the Fund. Derivatives are also subject to counterparty risk, which is the risk that the other party in the transaction will not fulfill its contractual obligation. The use of derivatives is a highly specialized activity that involves investment techniques and risks different from those associated with investments in more traditional securities and instruments. Losses from derivatives can also result from a lack of correlation between changes in the value of derivative instruments and the portfolio assets (if any) being hedged.
27
GOLDMAN SACHS TACTICAL EXPOSURE FUND
Consolidated Notes to Financial Statements(continued)
February 28, 2019 (Unaudited)
|
| 8. OTHER RISKS (continued) |
Foreign and Emerging Countries Risk — Investing in foreign markets may involve special risks and considerations not typically associated with investing in the United States. Foreign securities may be subject to risk of loss because of more or less foreign government regulation, less public information and less economic, political and social stability in the countries in which the Fund invests. The imposition of exchange controls (including repatriation restrictions), confiscations, trade restrictions (including tariffs) and other government restrictions by the United States or other governments, or from problems in share registration, settlement or custody, may also result in losses. Foreign risk also involves the risk of negative foreign currency rate fluctuations, which may cause the value of securities denominated in such foreign currency (or other instruments through which the Fund has exposure to foreign currencies) to decline in value. Currency exchange rates may fluctuate significantly over short periods of time. To the extent that the Fund also invests in securities of issuers located in emerging markets, these risks may be more pronounced.
Geographic Risk — If the Fund focuses its investments in securities of issuers located in a particular country or geographic region, the Fund may be subjected, to a greater extent than if its investments were less focused, to the risks of volatile economic cycles and/or conditions and developments that may be particular to that country or region, such as: adverse securities markets; adverse exchange rates; adverse social, political, regulatory, economic, business, environmental or other developments; or natural disasters.
Interest Rate Risk — When interest rates increase, fixed income securities or instruments held by the Fund will generally decline in value. Long-term fixed income securities or instruments will normally have more price volatility because of this risk than short-term fixed income securities or instruments. The risks associated with changing interest rates may have unpredictable effects on the markets and the Fund’s investments. Fluctuations in interest rates may also affect the liquidity of fixed income securities and instruments held by the Fund.
Investments in Other Investment Companies Risk — As a shareholder of another investment company, including an ETF, the Fund will indirectly bear its proportionate share of any net management fees and other expenses paid by such other investment companies, in addition to the fees and expenses regularly borne by the Fund. ETFs are subject to risks that do not apply to conventional mutual funds, including but not limited to the following: (i) the market price of the ETF’s shares may trade at a premium or a discount to their NAV; and (ii) an active trading market for an ETF’s shares may not develop or be maintained.
Large Shareholder Transactions Risk — The Fund may experience adverse effects when certain large shareholders, such as other funds, institutional investors (including those trading by use of non-discretionary mathematical formulas), financial intermediaries (who may make investment decisions on behalf of underlying clients and/or include the Fund in their investment model), individuals, accounts and Goldman Sachs affiliates, purchase or redeem large amounts of shares of a Fund. Such large shareholder redemptions, which may occur rapidly or unexpectedly, may cause the Fund to sell portfolio securities at times when it would not otherwise do so, which may negatively impact the Fund’s NAV and liquidity. These transactions may also accelerate the realization of taxable income to shareholders if such sales of investments resulted in gains, and may also increase transaction costs. In addition, a large redemption could result in the Fund’s current expenses being allocated over a smaller asset base, leading to an increase in the Fund’s expense ratio. Similarly, large Fund share purchases may adversely affect the Fund’s performance to the extent that the Fund is delayed in investing new cash or otherwise maintains a larger cash position than it ordinarily would.
Market and Credit Risks — In the normal course of business, the Fund trades financial instruments and enters into financial transactions where risk of potential loss exists due to changes in the market (market risk). Additionally, the Fund may also be exposed to credit risk in the event that an issuer or guarantor fails to perform or that an institution or entity with which the Fund has unsettled or open transactions defaults.
Sector Risk — To the extent the Fund focuses its investments in securities of issuers in one or more sectors (such as the financial services or telecommunications sectors), the Fund may be subjected, to a greater extent than if its investments were diversified across different sectors, to the risks of volatile economic cycles and/or conditions and developments that may be particular to that sector, such as: adverse economic, business, political, environmental or other developments.
28
GOLDMAN SACHS TACTICAL EXPOSURE FUND
|
| 8. OTHER RISKS (continued) |
Tax Risk — The Fund will seek to gain exposure to the commodity markets primarily through investments in the Subsidiary and/or commodity index-linked structured notes, as applicable. Historically, the Internal Revenue Service (“IRS”) issued private letter rulings (“PLRs”) in which the IRS specifically concluded that income and gains from investments in commodity index-linked structured notes or a wholly-owned foreign subsidiary that invests in commodity-linked instruments are “qualifying income” for purposes of compliance with Subchapter M of the Code. However, the Fund has not received a PLR, and is not able to rely on PLRs issued to other taxpayers. Additionally, the IRS has suspended the granting of such PLRs, pending review of its position on this matter. The IRS also recently issued proposed regulations that, if finalized, would generally treat the Fund’s income inclusion with respect to a subsidiary as qualifying income only if there is a distribution out of the earnings and profits of a subsidiary that are attributable to such income inclusion. The proposed regulations, if adopted, would apply to taxable years beginning on or after 90 days after the regulations are published as final.
The IRS also recently issued a revenue procedure, which states that the IRS will not in the future issue PLRs that would require a determination of whether an asset (such as a commodity index-linked note) is a “security” under the Investment Company Act of 1940. The Fund has obtained an opinion of counsel that the Fund’s income from such investments should constitute “qualifying income.” However, no assurances can be provided that the IRS would not be able to successfully assert that the Fund’s income from such investments was not “qualifying income,” in which case the Fund would fail to qualify as a regulated investment company (“RIC”) under Subchapter M of the Code if over 10% of its gross income were derived from these investments. If the Fund failed to qualify as a RIC, it would be subject to federal and state income tax on all of its taxable income at regular corporate tax rates. This would significantly adversely affect the returns to, and could cause substantial losses for Fund shareholders.
Under the Trust’s organizational documents, its Trustees, officers, employees and agents are indemnified, to the extent permitted by the Act and state law, against certain liabilities that may arise out of performance of their duties to the Fund. Additionally, in the course of business, the Fund enters into contracts that contain a variety of indemnification clauses. The Fund’s maximum exposure under these arrangements is unknown, as this would involve future claims that may be made against the Fund that have not yet occurred. However, GSAM believes the risk of loss under these arrangements to be remote.
Subsequent events after the Consolidated Statement of Assets and Liabilities date have been evaluated, and GSAM has concluded that there is no impact requiring adjustment or disclosure in the financial statements.
29
GOLDMAN SACHS TACTICAL EXPOSURE FUND
Consolidated Notes to Financial Statements(continued)
February 28, 2019 (Unaudited)
|
| 11. SUMMARY OF SHARE TRANSACTIONS |
Share activity is as follows:
| | | | | | | | | | | | | | | | |
| | | For the Six Months Ended
February 28, 2019
(Unaudited) | | | For the Period Ended
August 31, 2018
| |
| | | | |
| | | Shares | | | Dollars | | | Shares | | | Dollars | |
| | | | |
| Institutional Shares(a) | | | | | | | | | | | | | | | | |
Shares sold | | | 875 | | | $ | 8,472 | | | | 25,814,085 | | | $ | 258,050,037 | |
Reinvestment of distributions | | | 40 | | | | 372 | | | | 161,187 | | | | 1,600,152 | |
Shares redeemed | | | (5,341 | ) | | | (52,078 | ) | | | (25,964,890 | ) | | | (256,679,156 | ) |
| | | | (4,426 | ) | | | (43,234 | ) | | | 10,382 | | | | 2,971,033 | |
| Class P Shares(b) | | | | | | | | | | | | | | | | |
Shares sold | | | — | | | | — | | | | 10,095 | | | | 98,103 | |
Reinvestment of distributions | | | 209 | | | | 1,914 | | | | — | | | | — | |
Shares redeemed | | | — | | | | — | | | | (66 | ) | | | (633 | ) |
| | | | 209 | | | | 1,914 | | | | 10,029 | | | | 97,470 | |
| Class R6 Shares(a) | | | | | | | | | | | | | | | | |
Shares sold | | | 175,277 | | | | 1,599,000 | | | | 34,996,802 | | | | 344,852,855 | |
Reinvestment of distributions | | | 574,904 | | | | 5,278,574 | | | | 7 | | | | 69 | |
Shares redeemed | | | (7,975,001 | ) | | | (74,399,200 | ) | | | (1,976,060 | ) | | | (19,493,000 | ) |
| | | | (7,224,820 | ) | | | (67,521,626 | ) | | | 33,020,749 | | | | 325,359,924 | |
| | | | |
NET INCREASE (DECREASE) | | | (7,229,037 | ) | | $ | (67,562,946 | ) | | | 33,041,160 | | | $ | 328,428,427 | |
| (a) | | Commenced operations on September 6, 2017. |
| (b) | | Commenced operations on April 17, 2018. |
30
GOLDMAN SACHS TACTICAL EXPOSURE FUND
| | |
| | |
Fund Expenses — Six Month Period Ended February 28, 2019 (Unaudited) | | |
As a shareholder of Institutional, Class P or Class R6 Shares of the Fund, you incur two types of costs: (1) transaction costs, and (2) ongoing costs, including management fees and other Fund expenses. This Example is intended to help you understand your ongoing costs (in dollars) of investing in Institutional, Class P, and Class R6 Shares of the Fund and to compare these costs with the ongoing costs of investing in other mutual funds.
The Example is based on an investment of $1,000 invested at the beginning of the period and held for the entire period from September 1, 2018 through February 28, 2019, which represents a period of 181 days in a 365 day year.
Actual Expenses — The first line under each share class in the table below provides information about actual account values and actual expenses. You may use the information in this line, together with the amount you invested, to estimate the expenses that you paid over the period. Simply divide your account value by $1,000 (for example, an $8,600 account value divided by $1,000=8.6), then multiply the result by the number in the first line under the heading entitled “Expenses Paid” to estimate the expenses you paid on your account during this period.
Hypothetical Example for Comparison Purposes— The second line under each share class in the table below provides information about hypothetical account values and hypothetical expenses based on the Fund’s actual net expense ratio and an assumed rate of return of 5% per year before expenses, which is not the Fund’s actual return. The hypothetical account values and expenses may not be used to estimate the actual ending account balance or expenses you paid for the period. You may use this information to compare the ongoing costs of investing in the Fund and other funds. To do so, compare this 5% hypothetical example with the 5% hypothetical examples that appear in the shareholder reports of the other funds.
Please note that the expenses shown in the table are meant to highlight your ongoing costs only and do not reflect any transactional costs, such as sales charges, redemption fees, or exchange fees. Therefore, the second line of the table is useful in comparing ongoing costs only, and will not help you determine the relative total costs of owning different funds. In addition, if these transactional costs were included, your costs would have been higher.
| | | | | | | | | | | | |
| Share Class | | Beginning
Account Value
9/1/18 | | | Ending
Account Value
2/28/19 | | | Expenses Paid for the
6 months ended
2/28/19* | |
| Institutional | | | | | | | | | | | | |
Actual | | $ | 1,000.00 | | | $ | 1,003.70 | | | $ | 3.38 | |
Hypothetical 5% return | | | 1,000.00 | | | | 1,021.42 | + | | | 3.41 | |
| Class P | | | | | | | | | | | | |
Actual | | | 1,000.00 | | | | 1,003.80 | | | | 3.33 | |
Hypothetical 5% return | | | 1,000.00 | | | | 1,021.47 | + | | | 3.36 | |
| Class R6 | | | | | | | | | | | | |
Actual | | | 1,000.00 | | | | 1,004.70 | | | | 3.33 | |
Hypothetical 5% return | | | 1,000.00 | | | | 1,021.47 | + | | | 3.36 | |
| | + | | Hypothetical expenses are based on each Fund’s actual annualized net expense ratios and an assumed rate of return of 5% per year before expenses. | |
| | * | | Expenses are calculated using the Fund’s annualized net expense ratio for each class, which represents the ongoing expenses as a percentage of net assets for the six months ended February 28, 2019. Expenses are calculated by multiplying the annualized net expense ratio by the average account value for the period; then multiplying the result by the number of days in the most recent fiscal half year; and then dividing that result by the number of days in the fiscal year. The annualized net expense ratios for the period were as follows: | |
| | | | | | | | |
| Institutional | | Class P | | | Class R6 | |
| | |
0.68% | | | 0.67 | % | | | 0.67 | % |
31
FUNDS PROFILE
Goldman Sachs Funds
Goldman Sachs is a premier financial services firm, known since 1869 for creating thoughtful and customized investment solutions in complex global markets.
Today, theInvestment Management Division of Goldman Sachs serves a diverse set of clients worldwide, including private institutions, public entities and individuals. With approximately $1.34 trillion in assets under supervision as of December 31, 2018, Goldman Sachs Asset Management (“GSAM”) has portfolio management teams located around the world and our investment professionals bring firsthand knowledge of local markets to every investment decision. Assets under supervision includes assets under management and other client assets for which Goldman Sachs does not have full discretion. GSAM leverages the resources of Goldman Sachs & Co. LLC subject to legal, internal and regulatory restrictions.
Money Market
Financial Square FundsSM
| ∎ | | Financial Square Treasury Solutions Fund1 |
| ∎ | | Financial Square Government Fund1 |
| ∎ | | Financial Square Money Market Fund2 |
| ∎ | | Financial Square Prime Obligations Fund2 |
| ∎ | | Financial Square Treasury Instruments Fund1 |
| ∎ | | Financial Square Treasury Obligations Fund1 |
| ∎ | | Financial Square Federal Instruments Fund1 |
Investor FundsSM
| ∎ | | Investor Money Market Fund3 |
| ∎ | | Investor Tax-Exempt Money Market Fund3 |
Fixed Income
Short Duration and Government
| ∎ | | High Quality Floating Rate Fund |
| ∎ | | Short-Term Conservative Income Fund |
| ∎ | | Short Duration Government Fund |
| ∎ | | Short Duration Income Fund |
| ∎ | | Inflation Protected Securities Fund |
Multi-Sector
Municipal and Tax-Free
| ∎ | | High Yield Municipal Fund |
| ∎ | | Dynamic Municipal Income Fund |
| ∎ | | Short Duration Tax-Free Fund |
| ∎ | | Municipal Income Completion Fund |
Single Sector
| ∎ | | Investment Grade Credit Fund |
| ∎ | | High Yield Floating Rate Fund |
| ∎ | | Emerging Markets Debt Fund |
| ∎ | | Local Emerging Markets Debt Fund |
Fixed Income Alternatives
| ∎ | | Long Short Credit Strategies Fund |
Fundamental Equity
| ∎ | | Small/Mid Cap Value Fund |
| ∎ | | Small/Mid Cap Growth Fund |
| ∎ | | Concentrated Growth Fund |
| ∎ | | Technology Opportunities Fund |
| ∎ | | Growth Opportunities Fund |
| ∎ | | Rising Dividend Growth Fund |
Tax-Advantaged Equity
| ∎ | | U.S. Tax-Managed Equity Fund |
| ∎ | | International Tax-Managed Equity Fund |
| ∎ | | U.S. Equity Dividend and Premium Fund |
| ∎ | | International Equity Dividend and Premium Fund |
Equity Insights
| ∎ | | Small Cap Equity Insights Fund |
| ∎ | | U.S. Equity Insights Fund |
| ∎ | | Small Cap Growth Insights Fund |
| ∎ | | Large Cap Growth Insights Fund |
| ∎ | | Large Cap Value Insights Fund |
| ∎ | | Small Cap Value Insights Fund |
| ∎ | | International Small Cap Insights Fund |
| ∎ | | International Equity Insights Fund |
| ∎ | | Emerging Markets Equity Insights Fund |
Fundamental Equity International
| ∎ | | International Equity Income Fund |
| ∎ | | International Equity ESG Fund |
| ∎ | | Emerging Markets Equity Fund |
Select Satellite
| ∎ | | Real Estate Securities Fund |
| ∎ | | International Real Estate Securities Fund |
| ∎ | | Commodity Strategy Fund |
| ∎ | | Global Real Estate Securities Fund |
| ∎ | | Alternative Premia Fund |
| ∎ | | Absolute Return Tracker Fund |
| ∎ | | Managed Futures Strategy Fund |
| ∎ | | MLP Energy Infrastructure Fund |
| ∎ | | Multi-Manager Alternatives Fund |
| ∎ | | Absolute Return Multi-Asset Fund |
| ∎ | | Global Infrastructure Fund |
Total Portfolio Solutions
| ∎ | | Global Managed Beta Fund |
| ∎ | | Multi-Manager Non-Core Fixed Income Fund |
| ∎ | | Multi-Manager U.S. Dynamic Equity Fund |
| ∎ | | Multi-Manager Global Equity Fund |
| ∎ | | Multi-Manager International Equity Fund |
| ∎ | | Tactical Tilt Overlay Fund |
| ∎ | | Balanced Strategy Portfolio |
| ∎ | | Multi-Manager U.S. Small Cap Equity Fund |
| ∎ | | Multi-Manager Real Assets Strategy Fund |
| ∎ | | Growth and Income Strategy Portfolio |
| ∎ | | Growth Strategy Portfolio |
| ∎ | | Dynamic Global Equity Fund4 |
| ∎ | | Satellite Strategies Portfolio |
| ∎ | | Enhanced Dividend Global Equity Portfolio |
| ∎ | | Tax-Advantaged Global Equity Portfolio |
| ∎ | | Strategic Factor Allocation Fund |
| ∎ | | Target Date 2020 Portfolio |
| ∎ | | Target Date 2025 Portfolio |
| ∎ | | Target Date 2030 Portfolio |
| ∎ | | Target Date 2035 Portfolio |
| ∎ | | Target Date 2040 Portfolio |
| ∎ | | Target Date 2045 Portfolio |
| ∎ | | Target Date 2050 Portfolio |
| ∎ | | Target Date 2055 Portfolio |
| ∎ | | Target Date 2060 Portfolio |
| ∎ | | GQG Partners International Opportunities Fund |
| 1 | | You could lose money by investing in the Fund. Although the Fund seeks to preserve the value of your investment at $1.00 per share, it cannot guarantee it will do so. An investment in the Fund is not a deposit of a bank and is not insured or guaranteed by the Federal Deposit Insurance Corporation or any other government agency. The Fund’s sponsor has no legal obligation to provide financial support to the Fund, and you should not expect that the sponsor will provide financial support to the Fund at any time. |
| 2 | | You could lose money by investing in the Fund. Because the share price of the Fund will fluctuate, when you sell your shares they may be worth more or less than what you originally paid for them. The Fund may impose a fee upon sale of your shares or may temporarily suspend your ability to sell shares if the Fund’s liquidity falls below required minimums because of market conditions or other factors. An investment in the Fund is not a deposit of a bank and is not insured or guaranteed by the Federal Deposit Insurance Corporation or any other government agency. The Fund’s sponsor has no legal obligation to provide financial support to the Fund, and you should not expect that the sponsor will provide financial support to the Fund at any time. |
| 3 | | You could lose money by investing in the Fund. Although the Fund seeks to preserve the value of your investment at $1.00 per share, it cannot guarantee it will do so. The Fund may impose a fee upon sale of your shares or may temporarily suspend your ability to sell shares if the Fund’s liquidity falls below required minimums because of market conditions or other factors. An investment in the Fund is not a deposit of a bank and is not insured or guaranteed by the Federal Deposit Insurance Corporation or any other government agency. The Fund’s sponsor has no legal obligation to provide financial support to the Fund, and you should not expect that the sponsor will provide financial support to the Fund at any time. |
| 4 | | Effective after the close of business on February 28, 2019, the Goldman Sachs Equity Growth Strategy Portfolio was renamed the Goldman Sachs Dynamic Global Equity Fund. |
Financial Square FundsSM and Investor FundsSM are registered service marks of Goldman Sachs & Co. LLC.
| * | | This list covers open-end funds only. Please visit our website at www.GSAMFUNDS.com to learn about our closed-end funds and exchange-traded funds. |
| | |
TRUSTEES Jessica Palmer,Chair Kathryn A. Cassidy Diana M. Daniels James A. McNamara Roy W. Templin Gregory G. Weaver | | OFFICERS James A. McNamara,President Scott M. McHugh,Treasurer, Senior Vice President and Principal Financial Officer Joseph F. DiMaria,Assistant Treasurer and Principal Accounting Officer Caroline L. Kraus,Secretary |
| |
GOLDMAN SACHS & CO. LLC Distributor and Transfer Agent | | GOLDMAN SACHS ASSET MANAGEMENT, L.P. Investment Adviser |
Visit our web site atwww.GSAMFUNDS.com to obtain the most recent month-end returns.
Goldman Sachs Asset Management, L.P. 200 West Street, New York, New York 10282
The reports concerning the Fund included in this shareholder report may contain certain forward-looking statements about the factors that may affect the performance of the Fund in the future. These statements are based on Fund management’s predictions and expectations concerning certain future events and their expected impact on the Fund, such as performance of the economy as a whole and of specific industry sectors, changes in the levels of interest rates, the impact of developing world events, and other factors that may influence the future performance of the Fund. Management believes these forward-looking statements to be reasonable, although they are inherently uncertain and difficult to predict. Actual events may cause adjustments in portfolio management strategies from those currently expected to be employed.
A description of the policies and procedures that the Fund uses to determine how to vote proxies relating to portfolio securities and information regarding how the Fund voted proxies relating to portfolio securities for the most recent 12-month period ended June 30, are available (I) without charge, upon request by calling 1-800-526-7384; and (II) on the Securities and Exchange Commission (“SEC’’) web site at http://www.sec.gov.
Goldman Sachs does not provide legal, tax or accounting advice, unless explicitly agreed between you and Goldman Sachs (generally through certain services offered only to clients of Private Wealth Management). Any statement contained in this presentation concerning U.S. tax matters is not intended or written to be used and cannot be used for the purpose of avoiding penalties imposed on the relevant taxpayer. Notwithstanding anything in this document to the contrary, and except as required to enable compliance with applicable securities law, you may disclose to any person the US federal and state income tax treatment and tax structure of the transaction and all materials of any kind (including tax opinions and other tax analyses) that are provided to you relating to such tax treatment and tax structure, without Goldman Sachs imposing any limitation of any kind. Investors should be aware that a determination of the tax consequences to them should take into account their specific circumstances and that the tax law is subject to change in the future or retroactively and investors are strongly urged to consult with their own tax advisor regarding any potential strategy, investment or transaction.
The Fund will file portfolio holdings information for each month in a fiscal quarter within 60 days after the end of the relevant fiscal quarter on Form N-PORT. Portfolio holdings information for the third month of each fiscal quarter will be made available on the SEC’s web site at http://www.sec.gov. Portfolio holdings information may be obtained upon request and without charge by calling 1-800-621-2550 (for Institutional Shareholders).
Fund holdings and allocations shown are as of February 28, 2019 and may not be representative of future investments. Fund holdings should not be relied on in making investment decisions and should not be construed as research or investment advice regarding particular securities. Current and future holdings are subject to risk.
Economic and market forecasts presented herein reflect a series of assumptions and judgments as of the date of this presentation and are subject to change without notice. These forecasts do not take into account the specific investment objectives, restrictions, tax and financial situation or other needs of any specific client. Actual data will vary and may not be reflected here. These forecasts are subject to high levels of uncertainty that may affect actual performance. Accordingly, these forecasts should be viewed as merely representative of a broad range of possible outcomes. These forecasts are estimated, based on assumptions, and are subject to significant revision and may change materially as economic and market conditions change. Goldman Sachs has no obligation to provide updates or changes to these forecasts. Case studies and examples are for illustrative purposes only.
This material is not authorized for distribution to prospective investors unless preceded or accompanied by a current prospectus or summary prospectus, if applicable. Investors should consider the Fund’s objective, risks, and charges and expenses, and read the summary prospectus, if available, and/or the prospectus carefully before investing or sending money. The summary prospectus, if available, and the prospectus contain this and other information about the Fund and may be obtained from your authorized dealer or from Goldman Sachs & Co. LLC by calling 1-800-621-2550.
© 2019 Goldman Sachs. All rights reserved. 162457-OTU-961627 TACTEXPSAR-19/129
Goldman Sachs Funds

| | | | |
| | |
| Semi-Annual Report | | | | February 28, 2019 |
| | |
| | | | Tactical Tilt Overlay Fund |
It is our intention that beginning on January 1, 2021, paper copies of the Portfolio’s annual and semi-annual shareholder reports will no longer be sent by mail, unless you specifically request paper copies of the reports from the Portfolio or from your financial intermediary. Instead, the reports will be made available on a website, and you will be notified by mail each time a report is posted and provided with a website link to access the report.
If you already elected to receive shareholder reports electronically, you will not be affected by this change and you need not take any action. At any time, you may elect to receive reports and certain communications from the Portfolio electronically by calling the toll-free number below or by contacting your financial intermediary.
You may elect to receive all future shareholder reports in paper free of charge. If you hold shares of the Portfolio directly with the Portfolio’s transfer agent, you can inform the transfer agent that you wish to receive paper copies of reports by calling toll-free800-621-2550. If you hold shares of the Portfolio through a financial intermediary, please contact your financial intermediary to make this election. Your election to receive reports in paper will apply to all Goldman Sachs Funds held in your account if you invest through your financial intermediary or all Goldman Sachs Funds held with the Portfolio’s transfer agent if you invest directly with the transfer agent.

Goldman Sachs Tactical Tilt Overlay Fund
| | | | |
| | | |
| NOT FDIC-INSURED | | May Lose Value | | No Bank Guarantee |
PORTFOLIO RESULTS
Goldman Sachs Tactical Tilt Overlay Fund
Investment Objective
The Portfolio seeks long-term total return.
Portfolio Management Discussion and Analysis
Below, the Goldman Sachs Global Portfolio Solutions Team discusses the Goldman Sachs Tactical Tilt Overlay Fund’s (the “Portfolio”) performance and positioning for thesix-month period ended February 28, 2019 (the “Reporting Period”).
| Q | | How did the Portfolio perform during the Reporting Period? |
| A | | During the Reporting Period, the Portfolio’s Institutional, Class P and Class R6 Shares generated cumulative total returns of 1.72%, 1.63% and 1.62%, respectively. These returns compare to the 1.24% cumulative total return of the Portfolio’s benchmark, the ICE® BofAML® U.S. Dollar Three-Month LIBOR Constant Maturity Index (the “Index”), during the same time period. |
| | References to the Portfolio’s benchmark and to other indices, if any, mentioned herein are for informational purposes only, and unless otherwise noted, are not indications of how the Portfolio is managed. The use of the Index as the Portfolio’s benchmark does not imply the Portfolio is being managed like cash and does not imply low risk or low volatility. |
| Q | | What economic and market factors most influenced the Portfolio during the Reporting Period? |
| A | | When the Reporting Period began in September 2018, global economic growth moderated, but nevertheless remained healthy, especially in the U.S. China’s economic data was mixed, with retail sales slightly better than market anticipated and fixed asset investment, which is a measure of capital spending, missing market expectations. In terms of geopolitics, the U.S. Administration imposed tariffs on $200 billion of imports from China. However, the tariff rate was set at 10%, which was at the lower end of the market expected 10% to 25%, sparking a rally in emerging markets assets and helping them to recover some losses they had experienced earlier in the month. Major developed markets equity indices were up in September, outperforming emerging markets equities indices, such as the MSCI China Index(-1.70%) and the MSCI India Index(-9.10%), both of which declined. Within developed markets equities, Japanese stocks were the best performers, as a weaker Japanese yen supported export-oriented companies. Regarding fixed income, the10-year U.S. Treasury yield rose 20 basis points, and real yields (i.e., nominal yields adjusted for inflation) rose 15 basis points. (A basis point is 1/100th of a percentage point.) The increase in yields reflected strong U.S. economic activity, with ongoing fiscal stimulus boosting economic activity despite moderating growth outside the U.S. The Federal Reserve (“Fed”) raised short-term interest rates by 25 basis points, much as the markets expected, at its September policy meeting. Additionally, the Fed’s dot plot pointed to one more rate hike by the end of 2018, with its longer-term outlook essentially unchanged. (The “dot plot” shows rate projections of the members of the Fed’s Open Market Committee.) Among currencies, the U.S. dollar weakened slightly, while the Mexican peso and Canadian dollar strengthened. The Japanese yen was the worst performing major currency, largely due to higher U.S. interest rates and a reduction in global investor risk aversion. Within commodities, Iran sanctions and comments from the Organization of the Petroleum Exporting Countries (“OPEC”) fueled a rally in Brent and West Texas Intermediate (“WTI”) crude oil prices, respectively. |
| | Subsequently, a mix of slowing global economic growth, downward revisions in investors’ corporate earnings growth expectations, and a less accommodative Fed weighed on global equities, which experienced one of their worst fourth quarters and Decembers in history. Global equities, as represented by the MSCI All Country World Index Investable Market Index (“MSCI ACWI IMI”), were down more than 12% for the fourth calendar quarter, with major equity markets across the U.S., Eurozone and Japan all posting negative returns. Despite continued weakness in Chinese economic data, emerging market equities outperformed developed markets equities, thanks to the strong performance of Brazilian and Indian equities. Within fixed income, the10-year U.S. Treasury yield fell on signs of slowing U.S. economic growth. Investors revised downward |
1
PORTFOLIO RESULTS
| | their expectations for 2019 Fed monetary policy action from two interest rate hikes to no rate increases at all. The Fed, however, still projected two rate hikes during the 2019 calendar year. Within commodities, WTI crude oil prices declined on market concerns about global economic growth and oversupply. In December 2018, OPEC and Russia decided to cut crude oil production to support prices. |
| | Risk assets rebounded strongly in January 2019, supported by a decline in investor pessimism and a dovish Fed, which stressed “patience” about the pace of future monetary policy moves and the reduction of its balance sheet. (Dovish tends to suggest lower interest rates; opposite of hawkish. The Fed reduces its balance sheet by selling securities on its balance sheet and/or not reinvesting maturing securities.) As a result, global equities, as measured by the MSCI ACWI IMI, returned more than 8% during January. U.S. stocks outperformed other developed markets stocks, such as European and Japanese equities, on the back of comparatively stronger macro data. Within Europe, Italy performed strongly as fiscal concerns subsided. Emerging markets equities modestly outperformed developed markets equities, with Brazilian stocks, as represented by the MSCI Brazil Index, climbing 17.77% based on expectations of potential reforms by the country’s new government and relatively better macro data, and Russian stocks, as represented by the MSCI Russia Index, rising 13.60% based on a rebound in Brent crude oil prices, which rallied approximately 18% during January. Regarding fixed income, the Fed’s dovish tone drove a decline in the10-year U.S. Treasury yield. In currencies, the U.S. dollar weakened versus many major currencies. The Chinese renminbi strengthened on positive market expectations for a trade deal between the U.S. and China. |
| | Global equities maintained their positive momentum into February 2019. Developed markets equities across Europe, Japan and the U.S. posted positive returns despite weak global manufacturing and trade data. The performance of emerging markets equities was rather flat overall, with significant dispersion across regions. In the emerging markets, Chinese onshore equities posted double-digit gains, benefiting from a pickup in Chinese credit growth and positive developments in U.S.-China trade negotiations. Brazilian and South African equities both delivered negative returns, with the decline in Brazilian stocks driven by rumors of a delay in pension reform and the drop in South African stocks fueled by concerns around credit risk. In fixed income, the10-year U.S. Treasury yield was up modestly, driven solely by an increase in the breakeven inflation rate. (The breakeven inflation rate is a market-based measure of expected inflation.) Within commodities, crude oil prices rose as Saudi Arabia reduced its output. Meanwhile, copper prices rallied on positive news surrounding China. Within currencies, the U.S. dollar strengthened versus most major currencies, thanks to relatively better economic data from the U.S. |
| Q | | What key factors were responsible for the Portfolio’s performance during the Reporting Period? |
| A | | The Portfolio seeks to achieve its investment objective through the implementation of investment ideas that are generally derived from short-term or medium-term market views on a variety of asset classes and instruments. |
| | During the Reporting Period, the Portfolio benefited from its tactical long position in WTI crude oil, accomplished through an option call spread. (An option call spread is a strategy that involves purchasing call options at a specific strike price, while simultaneously selling call options on the same asset but at a higher strike price. A call option is an option that gives the holder the right to buy a certain quantity of an underlying security at an agreed-upon price at any time up to an agreed-upon date.) Most of this position’s outperformance occurred in January 2019 when crude oil prices rebounded from earlier declines and U.S.-China trade deal negotiations boosted investor sentiment. Within fixed income, the Portfolio was helped by its holdings of investment grade corporate bonds, which performed well in November 2018 on less hawkish comments by Fed Chair Jerome Powell and on investor caution amid ongoing equity market volatility and falling crude oil prices. Within currencies, the Portfolio’s tactical short position in the Japanese yen versus its long position in the U.S. dollar was advantageous, as the Fed’s September 2018 interest rate hike drove spread (i.e., yield differentials) widening between U.S. Treasury securities and Japanese government bonds, increasing the attractiveness of the U.S. dollar. |
| | Among detractors was the Portfolio’s tactical exposure to energy master limited partnerships (“MLPs”), as costs for completing projects and capital expenditures for new projects rose during the early part of the Reporting Period. The energy sector, as well as the broader equity market, had a weak October 2018, with concerns about global economic growth, rising interest rates and U.S.-China trade disputes weighing on investor sentiment. Falling crude oil prices also dampened the performance of energy MLPs during the month. Crude oil prices declined as markets priced in a |
2
PORTFOLIO RESULTS
| | possible drop in demand caused by slowing global economic growth. The Alerian MLP Index finished 2018 with a fourth consecutive month of negative performance, largely due to the decline in crude oil prices. Although the Portfolio’s tactical exposure to energy MLPs detracted for the Reporting Period overall, it contributed positively in the closing weeks of the Reporting Period when energy MLPs benefited from both a rebound in crude oil prices and market optimism about U.S.-China trade deal negotiations. Within equities, the Portfolio’s tactical long position in European bank stocks hurt its performance, as global economic growth, trade tensions, concerns over Brexit, flattening of the U.S. Treasury yield curve, and sluggish loan growth all contributed to poor performance in both the U.S. and European banking sectors. (Brexit refers to the U.K.’s efforts to exit the European Union. Yield curve is a spectrum of maturities of varying lengths. A flattening yield curve is one wherein the differential in yields between longer-term and shorter-term maturities narrows.) In fixed income, a tactical long position in energy-related high yield corporate bonds detracted from the Portfolio’s returns, as crude oil prices fell intoyear-end 2018. |
| Q | | How was the Portfolio positioned at the beginning of the Reporting Period? |
| A | At the beginning of the Reporting Period, the Portfolio had approximately 33.74% of its total net assets invested in long equity-related investments; approximately 35.58% of its total net assets invested in long fixed income-related investments; approximately 17.89% of its total net assets invested in long currency-related investments; and approximately 0.16% of its total net assets invested in long commodity-related investments. It had short positions of approximately-9.76% of its total net assets in a basket oflarge-cap equity-related investments that we believed might underperform the U.S. stock market and also short positions of approximately-3.22% of its total net assets in emerging markets equity-related investments. The Portfolio had no short positions in fixed income-related investments at the beginning of the Reporting Period. |
| | The above sector breakout is inclusive of derivative exposure across all asset classes, but it does not necessarily include the cash held to support those positions. Derivatives positions are mostly supported by cash held in the Portfolio specifically to cover its exposure and any potential margin calls or future losses experienced. Given theline-up of positions held, most of them were derivatives-based, so the Portfolio’s cash allocation at the beginning of the Reporting Period was high. |
| Q | | How did you tactically manage the Portfolio’s allocations during the Reporting Period? |
| A | During the Reporting Period, in response to shifting macroeconomic and market dynamics, we made a number of changes to the Portfolio’s exposures. |
| | In terms of equity-related exposures, we shifted a portion of the Portfolio’s tactical long position in Spanish equities to its existing tactical long position in European bank stocks during October 2018. In our view, the risk/reward profile of European bank stocks had improved relative to that of Spanish equities. Also during October, we added two tactical U.S. bank option tilts. The first was a longat-the-money call option position and the second was a shortat-the-money put option position.(“At-the-money” is a term used to describe a call option with a strike price that is the same as the market price of the underlying asset. A put option is an option contract giving the owner the right, but not the obligation, to sell a specified amount of an underlying asset at a specified price within a specified time.) Our rationale for both positions was the underperformance of European bank stocks, which were down more than 10% for 2018year-to-date near the end of October. In our opinion, the fundamentals did not justify the decline, given that 2019-2020 corporate earnings estimates fell only about 1% during the third quarter of 2018. In November 2018, the long U.S. bank equity call option position expired out of the money. (“Out of the money” is a term used to describe a call option with a strike price that is higher than the market price of the underlying asset, or a put option with a strike price that is lower than the market price of the underlying asset.) Nevertheless, we continued to believe that U.S. banks had an attractive risk/reward profile, which is why the Portfolio maintained exposure to them through a tactical long position in an exchanged traded fund and tactical short positions in put options. |
| | During November 2018, we increased the Portfolio’s systematic downside mitigation tactical tilt because of what we viewed as elevated equity valuations and the advanced stage of the U.S. economic cycle. (The systematic downside mitigation tactical tilt was designed to limit the Portfolio’s exposure to potential market declines through the shorting of U.S.large-cap stocks that we believed might underperform the broader U.S. stock market, while at the same time taking a long position in the broader U.S. stock market.) We believed the increase could add value; in our view, investors’ margin of safety was increasingly slim but we did not think a tactical short position was warranted yet. Also in November, |
3
PORTFOLIO RESULTS
| | we reduced the Portfolio’s tactical short position in emerging markets equities, which was part of its tactical tilt in South African stocks and emerging markets equities, by changing that tactical tilt to a long position in South African stocks and short positions in emerging markets equities and investment grade bonds. Rising U.S. interest rates and a stronger U.S. dollar, along with what appeared to be investors’ waning concerns about China, suggested to us the environment was becoming more favorable for emerging markets equities. |
| | During December 2018, the Portfolio took assignment of U.S. bank stocks after its put options expired in the money. (“In the money” is a term used to describe a call option with a strike price that is lower than the market price of the underlying asset, or a put option with a strike price that is higher than the market price of the underlying asset.) U.S. bank stocks had underperformed since the put options position was implemented, and valuations had become more attractive, in our view. Earnings estimates had been relatively flat, and we believed U.S. bank stocks offered a solid risk premium. Also in December 2018, we added a S&P 500® Index call option spread. In our view, equity market declines seemed to overstate the degree of potential U.S. economic weakening. We believed the option call spread could help mitigate unexpected downside because the Portfolio would keep the premium it earned from option writing. In January 2019, we reduced the size of the call option spread tilt because the S&P 500® Index had rallied more than 6% since we implemented the position. We eliminated the position entirely by the end of the month, as we believed it had realized most of its potential gains. In January and February 2019, we sold a portion of the Portfolio’s tactical long position in U.S. bank stocks to capture gains. In February 2019, we added a European bank call option to the Portfolio, as European bank stocks continued to perform poorly but had improving fundamentals, in our opinion. |
| | In terms of fixed income-related exposures, we eliminated a portion of our duration-neutral high yield corporate bond tactical tilt in September 2018. This positioning seeks to benefit from the spread offered as compensation for the risk of potential default. We exited the position entirely in February 2019, as it had nearly met our full calendar year return expectations, and high yield spreads were at levels we considered consistent with a low single-digit default rate. Additionally, we eliminated the Portfolio’s tactical long position in U.S. bank loans in October 2018 when the position had met our return expectations. Higher interest rates made investment grade corporate bonds more attractive, in our opinion, than bank loans. In addition, during January 2019, we removed the Portfolio’s tactical long position in energy-related high yield corporate bonds, as they had reached our expected return expectations and market prices presented what we felt was an attractive exit point. Finally, we increased the Portfolio’s tactical exposure to investment grade fixed income, using bond futures, as we considered a higher allocation to U.S. Treasuries to be a viable complement to the Portfolio’s already-large cash buffer. |
| | Regarding currency-related exposures, we trimmed the Portfolio’s tactical long position in the British pound versus its tactical short position in the U.S. dollar during September 2018, given that the British pound was up nearly 4% from its recent trough in August 2018. We further reduced the position in December 2018, as the British pound weakened and we anticipated market volatility due to Brexit negotiations. Also in December, we decreased the Portfolio’s tactical short position in the Japanese yen versus its tactical long position in the U.S. dollar. This move was predicated on our belief the Fed would pause its interest rate hiking cycle and adopt more dovish forward guidance, which could be a headwind for the U.S. dollar. In addition, the Japanese yen had significantly outperformed as compared to its historical correlation with risk assets during sell-offs, and we thought this atypical performance might change if market volatility persisted. |
| | Regarding commodities, we reduced the Portfolio’s WTI crude oil tactical tilt, which we had implemented through an option call spread, during September 2018 to capture gains. The position was eliminated near the beginning of October, as WTI crude oil prices had increased significantly, and we believed the position was vulnerable to short-term market risks. In December 2018, we reestablished a WTI crude oil tactical tilt through a call spread collar. (A call spread collar is an options trading strategy that is constructed by holding shares of the underlying stock while simultaneously selling call options against that holding.) We established the position due to what we considered to be attractive valuations, as potential supply disruptions could occur, in our opinion, if Iranian sanctions were tightened after waivers expire in April 2019. In February 2019, we added WTI crude oil puts to the Portfolio. The same month, we reduced by half the Portfolio’s WTI crude oil tactical tilt, retaining the rest of the position as potential upside emerged, including sanctions on Venezuela and strong OPEC production discipline. |
4
PORTFOLIO RESULTS
| | Separately, we increased the Portfolio’s tactical exposure to energy MLPs during October 2018. At the time, the Alerian MLP Index had declined almost 15% from its late August 2018 high. In addition, energy MLP valuations and distribution yields remained attractive, in our view. |
| Q | | How did the Portfolio use derivatives and similar instruments during the Reporting Period? |
| A | The Portfolio used derivatives and similar instruments as part of its investment strategy to express views implemented in the Portfolio. Positions were supported predominantly by cash held in the Portfolio specifically to cover its exposure to derivative instruments and any potential margin calls or future losses experienced. |
| | During the Reporting Period, the Portfolio employed equity and bond futures, equity swaps, total return swaps, options, options on commodity futures, currency forwards and index credit default swaps to express active investment views with greater versatility across regional equity markets, global market sectors, commodities markets and currency markets. The Portfolio’s use of equity futures to gain exposure to emerging markets equities, Spanish equities, European bank stocks, South African equities and U.S. stocks detracted from performance. Bond futures, which the Portfolio employed for its long position in investment grade fixed income, contributed positively. Collectively, the Portfolio’s use of equity swaps to obtain exposure to European bank stocks and its use of total return swaps within the systematic downside mitigation tactical tilt had a positive impact on performance. To afford greater risk management precision, options on equity indices were employed to tactically adjust the amount of equity risk and downside risk in the Portfolio. The Portfolio’s use of equity options, including call options on the S&P 500® Index as well as call options on European and U.S. bank stocks, added to performance. In addition, the Portfolio used options on commodity futures to express our views of WTI crude oil prices, which had a positive impact on performance. Currency forwards, which were used to express our views on developed and emerging markets currencies, added overall to the Portfolio’s performance. Finally, the use of index credit default swaps within the Portfolio’s duration-neutral high yield corporate bond tactical tilt had a slightly positive impact on returns during the Reporting Period. |
| Q | | How was the Portfolio positioned at the end of the Reporting Period? |
| A | At the end of the Reporting Period, the Portfolio had approximately 23.90% of its total net assets invested in long equity-related investments; approximately 39.91% of its total net assets invested in long fixed income-related investments; and none of its total net assets invested in long commodity-related investments. In terms of currency-related investments, the Portfolio had a long position in the British pound versus a short position in the U.S. dollar (representing 6.24% of its total net assets) and a short position in the Japanese yen versus a long position in the U.S. dollar (representing-6.23% of its total net assets). The Portfolio also had short positions of approximately-12.46% of its total net assets in a basket oflarge-cap equity-related investments that we believed might underperform the U.S. stock market and also short positions of approximately-1.83% of its total net assets in emerging markets equity-related investments. The Portfolio had no short positions in fixed income-related or commodity-related investments at the end of the Reporting Period. |
| | The above sector breakout is inclusive of derivative exposure across all asset classes, but it does not necessarily include the cash held to support those positions. Derivatives positions are mostly supported by cash held in the Portfolio specifically to cover its exposure and any potential margin calls or future losses experienced. Given theline-up of positions held, most of them were derivatives-based, so the cash allocation at the end of the Reporting Period was high. |
| Q | | What is the Portfolio’s tactical asset allocation view and strategy for the months ahead? |
| A | At the end of the Reporting Period, we anticipated a modest slowdown in economic activity across most countries and regions, including the U.S., in the near term. In the U.S., the impact of the fiscal stimulus from tax legislation, signed into law during December 2017, seemed likely to wane over the course of 2019, we believed. In Europe, Germany’s budget surplus had decreased, but we expected the German economy to continue expanding slightly. As for Japan, we believed an increase in the consumption tax would cause only a slight economic contraction due to certain offsetting measures. We expected China to pursue an expansionary policy to limit the slowdown in its economic growth. |
| | As for monetary policy, at the end of the Reporting Period, we believed the Fed was nearing the end of its current tightening cycle. And while the European Central Bank (“ECB”) left its monetary policy unchanged at its February 2019 meeting, we — like many market participants — anticipated an interest rate hike later in 2019.(On March 7th, after the end of the Reporting Period, the ECB extended its forward guidance to signal unchanged rates through 2019 |
5
PORTFOLIO RESULTS
| | and unveiled financing support for the banking sector.) In the U.K., uncertainty about Brexit led the Bank of England to adopt a slightly more dovish tone. Meanwhile, the Bank of Japan is likely to stay on hold, in our opinion, and we expected China’s central bank to pursue an accommodative monetary policy. |
| | In spite of the generally positive backdrop, we see no shortage of global risks, including the potential of excessive Fed monetary policy tightening, growing political tensions between the White House and a Democrat-controlled House of Representatives, and unknown outcomes with respect to Brexit. Additionally, U.S.-China trade tensions are high at a time of slowing Chinese economic growth and the country’s imbalanced economy overall. Although an agreement may be reached in early 2019 that addresses certain trade, cybersecurity and intellectual property theft issues, the U.S. Administration has raised other long-term concerns that will not be easily allayed, in our opinion. |
| | Looking ahead, we believed the global environment at the end of the Reporting Period was supportive of positive, though modest, equity market returns, which we expect to exceed those of cash and bonds. Thus, we planned to focus the Portfolio on opportunities in equities, including tactical tilts to certain U.S. equity sectors, including the energy sector through investments in energy MLPs, and Spanish, South African and European bank stocks. We also favored increased exposure to interest rates, which we planned to implement through U.S. Treasury futures. In addition, the Portfolio continued to hold positions related to our crude oil and individual currency views at the end of the Reporting Period. |
6
PORTFOLIO RESULTS
Index Definitions
MSCI China Index represents the performance of large- andmid-cap segments with H shares, B shares, red chips, P chips and foreign listings (e.g., ADRs) of Chinese stocks. China A shares are partially included in the index, making it the de facto index for all of China.
MSCI India Index is designed to measure the performance of the large and mid cap segments of the Indian market.
MSCI ACWI Investable Market Index captures large, mid and small cap representation across 23 developed markets and 24 emerging markets countries.
MSCI Brazil Index is designed to measure the performance of the large and mid cap segments of the Brazilian market.
MSCI Russia Index is designed to measure the performance of the large and mid cap segments of the Russian market.
Alerian MLP Index is a float-adjusted, capitalization-weighted index, whose constituents represent approximately 85% of total float-adjusted market capitalization. It is disseminated real-time on a price-return basis (AMZ) and on a total-return basis (AMZX).
S&P 500® Index is a U.S. stock market index based on the market capitalizations of 500 large companies having common stock listed on the New York Stock Exchange or NASDAQ. The S&P 500® Index components and their weightings are determined by S&P Dow Jones Indices.
It is not possible to invest directly in an unmanaged index.
7
PORTFOLIO BASICS
Tactical Tilt Overlay Fund
as of February 28, 2019
| | | | | | | | | | |
| | PERFORMANCE REVIEW | |
| | | |
| | | September 1, 2018–February 28, 2019 | | Portfolio Total Return (based on NAV)1 | | | ICE® BofAML® U.S. Dollar Three- Month LIBOR Constant Maturity Index2 | |
| | | |
| | Institutional | | | 1.72 | % | | | 1.24 | % |
| | Class P | | | 1.63 | | | | 1.24 | |
| | | Class R6 | | | 1.62 | | | | 1.24 | |
| | 1 | | The net asset value (“NAV”) represents the net assets of the class of the Portfolio(ex-dividend) divided by the total number of shares of the class outstanding. The Portfolio’s performance assumes the reinvestment of dividends and other distributions. The Portfolio’s performance does not reflect the deduction of any applicable sales charges. |
| | 2 | | The ICE® BofAML®U.S. Dollar Three-Month LIBOR Constant Maturity Index (the “Index”) tracks the performance of a synthetic asset paying LIBOR to a stated maturity. The Index is based on the assumed purchase at par of a synthetic instrument having exactly its stated maturity and with a coupon equal to that day’s fixing rate. That issue is assumed to be sold the following day (priced at a yield equal to the current day fixing rate) and rolled into a new instrument. The Index figure does not reflect any deductions for fees, expenses or taxes. It is not possible to invest directly in an index. |
| | | | | | | | | | | | |
| | STANDARDIZED TOTAL RETURNS3 |
| | | | |
| | | For the period ended 12/31/18 | | One Year | | | Since Inception | | | Inception Date |
| | | | |
| | Institutional | | | -2.45 | % | | | 0.95 | % | | 7/31/14 |
| | Class P | | | N/A | | | | -1.96 | | | 4/17/18 |
| | | Class R6 | | | -2.47 | | | | -2.45 | | | 12/29/17 |
| | 3 | | The Standardized Total Returns are average annual total returns or cumulative total returns (only if the performance period is one year or less) as of the most recent calendarquarter-end. They assume reinvestment of all distributions at NAV. Because Institutional, Class P and Class R6 Shares do not involve a sales charge, such a charge is not applied to their Standardized Total Returns. |
The returns set forth in the tables above represent past performance. Past performance does not guarantee future results. The Portfolio’s investment return and principal value will fluctuate so that an investor’s shares, when redeemed, may be worth more or less than their original cost. Current performance may be lower or higher than the performance quoted above. Please visit our web site at www.GSAMFUNDS.com to obtain the most recentmonth-end returns.Performance reflects applicable fee waivers and/or expense limitations in effect during the periods shown. In their absence, performance would be reduced. Returns do not reflect the deduction of taxes that a shareholder would pay on Portfolio distributions or the redemption of Portfolio shares.
8
PORTFOLIO BASICS
| | | | | | | | | | |
| | EXPENSE RATIOS4 | |
| | | |
| | | | | Net Expense Ratio (Current) | | | Gross Expense Ratio (Before Waivers) | |
| | | |
| | Institutional | | | 0.82 | % | | | 0.91 | % |
| | Class P | | | 0.81 | | | | 0.90 | |
| | | Class R6 | | | 0.81 | | | | 0.90 | |
| | 4 | | The expense ratios of the Portfolio, both current (net of applicable fee waivers and/or expense limitations) and before waivers (gross of applicable fee waivers and/or expense limitations) are as set forth above according to the most recent publicly available Prospectus for the Portfolio and may differ from the expense ratios disclosed in the Consolidated Financial Highlights in this report. Pursuant to a contractual arrangement, the Portfolio’s waivers and/or expense limitations will remain in place through at least December 28, 2019, and prior to such date the Investment Adviser may not terminate the arrangements without the approval of the Portfolio’s Board of Trustees. If these arrangements are discontinued in the future, the expense ratios may change without shareholder approval. |
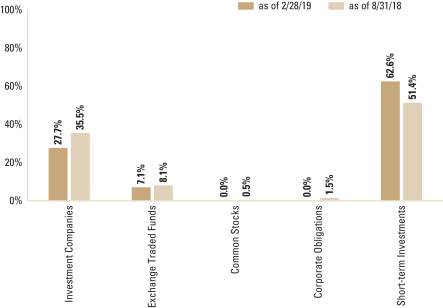
| | 5 | | The percentage shown for each investment category reflects the value of investments in that category as a percentage of net assets. Short-term investments represent certificates of deposit and commercial paper. Figures in the graph may not sum to 100% due to the exclusion of other assets and liabilities. The graph does not depict the investment in the securities lending reinvestment vehicle. The Investment in the securities lending reinvestment vehicle represented 3.0% of the Portfolio’s net assets as of February 28, 2019. The graph depicts the Portfolio’s investments but may not represent the Portfolio’s market exposure due to the exclusion of certain derivatives, if any, as listed in the Additional Investment Information section of the Consolidated Schedule of Investments. |
9
GOLDMAN SACHS TACTICAL TILT OVERLAY FUND
Consolidated Schedule of Investments
February 28, 2019 (Unaudited)
| | | | | | | | | | | | | | |
Principal
Amount | | | Interest
Rate | | | Maturity
Date | | | Value | |
|
| Corporate Obligations(a)(b)(c) – 0.0% | |
| Energy – Exploration & Production – 0.0% | |
| | Berry Petroleum Co. LLC | |
| $ | 1,200,000 | | | | 6.750 | % | | | 11/01/20 | | | $ | — | |
| | 18,124,000 | | | | 6.375 | | | | 09/15/22 | | | | — | |
| | |
| | TOTAL CORPORATE OBLIGATIONS | |
| | (Cost $—) | | | | | | | $ | — | |
| | |
| | | | | | | | |
| Shares | | | Description | | Value | |
|
| Common Stock(a)(d) – 0.0% | |
| Oil, Gas & Consumable Fuels – 0.0% | |
| | 176,413 | | | Blue Ridge Mountain Resources, Inc. | | $ | 786,255 | |
| | (Cost $1,759,790) | | | | |
| | |
| | | | | | | | |
|
| Exchange Traded Funds(e) – 7.1% | |
| | 23,899,877 | | | Alerian MLP ETF | | $ | 231,589,808 | |
| | 800,448 | | | SPDR S&P Bank ETF | | | 36,228,277 | |
| | |
| | TOTAL EXCHANGE TRADED FUNDS | | | | |
| | (Cost $253,950,684) | | $ | 267,818,085 | |
| | |
| | | | | | |
| Shares | | Dividend
Rate | | Value | |
|
| Investment Companies(f) – 27.7% | |
Goldman Sachs Financial Square Government Fund – Institutional Shares | |
| 934,204,613 | | 2.395% | | $ | 934,204,613 | |
Goldman Sachs MLP Energy Infrastructure Fund – Class R6 Shares | |
| 16,865,569 | | 21.195 | | | 111,312,757 | |
| |
| TOTAL INVESTMENT COMPANIES | |
| (Cost $1,049,896,353) | | $ | 1,045,517,370 | |
| |
| TOTAL INVESTMENTS BEFORESHORT-TERM INVESTMENT | |
| (Cost $1,305,606,827) | | $ | 1,314,121,710 | |
| |
| | | | | | | | | | | | | | |
Principal
Amount | | | Interest
Rate | | | Maturity
Date | | | Value | |
|
| Short-term Investments – 62.6% | |
| Certificates of Deposit – 58.9% | |
| | ABN AMRO Funding USA LLC(g)(h) | |
| $ | 13,950,000 | | | | 0.000 | % | | | 11/08/19 | | | $ | 13,677,358 | |
| | Albion Capital LLC(h) | |
| | 5,000,000 | | | | 0.000 | | | | 03/22/19 | | | | 4,992,517 | |
| | ASB Finance Ltd.(g)(i) (1M USD LIBOR + 0.310%) | |
| | 23,000,000 | | | | 2.812 | | | | 06/28/19 | | | | 23,015,326 | |
| | AT&T, Inc.(g)(h) | |
| | 4,750,000 | | | | 0.000 | | | | 03/27/19 | | | | 4,740,264 | |
| | 9,900,000 | | | | 0.000 | | | | 05/28/19 | | | | 9,828,362 | |
| | 10,000,000 | | | | 0.000 | | | | 06/05/19 | | | | 9,921,053 | |
| | |
|
| Short-term Investments – (continued) | |
| Certificates of Deposit – (continued) | |
| | Atlantic Asset Securitization LLC(g)(h) | |
| 20,000,000 | | | | 0.000 | | | | 05/14/19 | | | | 19,893,750 | |
| | AutoZone, Inc.(g)(h) | |
| | 3,000,000 | | | | 0.000 | | | | 03/11/19 | | | | 2,997,566 | |
| | Banco Del Estado De Chile(i) (3M USD LIBOR + 0.070%) | |
| | 20,000,000 | | | | 2.860 | | | | 03/21/19 | | | | 19,999,806 | |
| | Banco Santander SA | |
| | 25,000,000 | | | | 0.000 | (h) | | | 05/14/19 | | | | 24,855,990 | |
| | (3M USD LIBOR + 0.350%) | |
| | 15,000,000 | | | | 3.043 | (i) | | | 06/13/19 | | | | 14,999,936 | |
| | Bank of China Ltd.(g)(h) | |
| | 4,000,000 | | | | 0.000 | | | | 05/10/19 | | | | 3,979,363 | |
| | Bank of Montreal(i) | |
| | (1M USD LIBOR + 0.400%) | |
| | 11,000,000 | | | | 2.917 | | | | 12/10/19 | | | | 11,021,193 | |
| | (3M USD LIBOR + 0.210%) | |
| | 20,000,000 | | | | 2.946 | | | | 11/01/19 | | | | 20,024,724 | |
| | (SOFR + 0.440%) | |
| | 10,000,000 | | | | 2.820 | | | | 05/09/19 | | | | 10,004,644 | |
| | Bank of Nova Scotia(i) | |
| | (3M USD LIBOR + 0.200%) | |
| | 11,000,000 | | | | 2.939 | | | | 03/06/19 | | | | 11,000,283 | |
| | (3M USD LIBOR + 0.280%) | |
| | 23,000,000 | | | | 3.072 | | | | 03/20/19 | | | | 23,002,905 | |
| | Banque Et Caisse Epargen(h) | |
| | 10,250,000 | | | | 0.000 | | | | 07/01/19 | | | | 10,157,055 | |
| | BASF SE(g)(h) | |
| | 6,400,000 | | | | 0.000 | | | | 04/12/19 | | | | 6,380,912 | |
| | Bayerische Landesbank(h) | |
| | 17,350,000 | | | | 0.000 | | | | 04/10/19 | | | | 17,300,383 | |
| | 11,000,000 | | | | 0.000 | | | | 05/10/19 | | | | 10,944,874 | |
| | Bedford Row Funding Corp.(g) | |
| | 15,000,000 | | | | 0.000 | (h) | | | 04/25/19 | | | | 14,941,177 | |
| | 5,000,000 | | | | 0.000 | (h) | | | 10/16/19 | | | | 4,913,750 | |
| | 6,000,000 | | | | 0.000 | (h) | | | 10/18/19 | | | | 5,895,523 | |
| | (3M USD LIBOR + 0.100%) | |
| | 6,250,000 | | | | 2.526 | (i) | | | 07/15/19 | | | | 6,252,466 | |
| | Bell Canada, Inc.(g)(h) | |
| | 13,400,000 | | | | 0.000 | | | | 04/16/19 | | | | 13,351,995 | |
| | 5,000,000 | | | | 0.000 | | | | 04/22/19 | | | | 4,979,713 | |
| | BNP Paribas SA(i) (3M USD LIBOR + 0.140%) | |
| | 8,550,000 | | | | 2.918 | | | | 06/14/19 | | | | 8,554,754 | |
| | BNZ International Funding Ltd.(g)(i) | |
| | (1M USD LIBOR + 0.280%) | |
| | 9,750,000 | | | | 2.590 | | | | 05/15/19 | | | | 9,754,940 | |
| | (3M USD LIBOR + 0.200%) | |
| | 600,000 | | | | 2.636 | | | | 04/16/19 | | | | 600,093 | |
| | (3M USD LIBOR + 0.250%) | |
| | 20,651,000 | | | | 3.045 | | | | 04/05/19 | | | | 20,654,261 | |
| | Cafco LLC(g)(h) | |
| | 7,450,000 | | | | 0.000 | | | | 05/29/19 | | | | 7,402,693 | |
| | Canadian Imperial Bank of Commerce(i) | |
| | (1M USD LIBOR + 0.350%) | |
| | 9,700,000 | | | | 2.864 | | | | 11/05/19 | | | | 9,710,928 | |
| | (1M USD LIBOR + 0.400%) | |
| | 15,000,000 | | | | 2.917 | | | | 12/10/19 | | | | 15,028,546 | |
| | |
| | |
| 10 | | The accompanying notes are an integral part of these financial statements. |
GOLDMAN SACHS TACTICAL TILT OVERLAY FUND
| | | | | | | | | | | | | | |
Principal
Amount | | | Interest
Rate | | | Maturity
Date | | | Value | |
|
| Short-term Investments – (continued) | |
| Certificates of Deposit – (continued) | |
| | Canadian Imperial Bank of Commerce(i) – (continued) | |
| | (3M USD LIBOR + 0.320%) | |
| $ | 23,000,000 | | | | 3.115 | % | | | 07/05/19 | | | $ | 23,026,184 | |
| | Cancara Asset Securitisation LLC(h) | |
| | 7,000,000 | | | | 0.000 | | | | 04/30/19 | | | | 6,969,730 | |
| | 6,000,000 | | | | 0.000 | | | | 05/09/19 | | | | 5,970,052 | |
| | 3,377,000 | | | | 0.000 | | | | 05/28/19 | | | | 3,355,310 | |
| | 15,000,000 | | | | 0.000 | | | | 06/03/19 | | | | 14,896,806 | |
| | Chariot Funding LLC(g)(h) | |
| | 10,000,000 | | | | 0.000 | | | | 05/02/19 | | | | 9,955,410 | |
| | 11,500,000 | | | | 0.000 | | | | 07/08/19 | | | | 11,394,395 | |
| | 24,000,000 | | | | 0.000 | | | | 07/12/19 | | | | 23,772,647 | |
| | China Construction Banking Corp.(g)(h) | |
| | 10,000,000 | | | | 0.000 | | | | 03/20/19 | | | | 9,986,222 | |
| | 5,000,000 | | | | 0.000 | | | | 04/16/19 | | | | 4,983,106 | |
| | CNPC Finance HK Ltd.(g)(h) | |
| | 15,000,000 | | | | 0.000 | | | | 03/06/19 | | | | 14,993,610 | |
| | Collateralized Commercial Paper Co. LLC(g)(h) | |
| | 15,000,000 | | | | 0.000 | | | | 10/15/19 | | | | 14,741,993 | |
| | Collateralized Commercial Paper II Co. LLC(g)(h) | |
| | 4,000,000 | | | | 0.000 | | | | 07/08/19 | | | | 3,962,921 | |
| | 3,268,000 | | | | 0.000 | | | | 11/25/19 | | | | 3,200,352 | |
| | Cooperatieve Rabobank UA(i) | |
| | (1M USD LIBOR + 0.190%) | |
| | 14,800,000 | | | | 2.670 | | | | 04/18/19 | | | | 14,801,618 | |
| | (1M USD LIBOR + 0.280%) | |
| | 11,000,000 | | | | 2.773 | | | | 05/29/19 | | | | 11,004,354 | |
| | (3M USD LIBOR + 0.200%) | |
| | 15,000,000 | | | | 2.976 | | | | 03/12/19 | | | | 15,000,677 | |
| | CRC Funding LLC(g)(h) | |
| | 6,750,000 | | | | 0.000 | | | | 05/28/19 | | | | 6,707,464 | |
| Credit Agricole Corporate and Investment Bank(i) (3M USD
LIBOR + 0.030%) |
|
| | 12,000,000 | | | | 2.810 | | | | 07/18/19 | | | | 12,002,614 | |
| | Credit Industriel ET Commercial NY(i) | |
| | (3M USD LIBOR + 0.040%) | |
| | 25,000,000 | | | | 2.820 | | | | 07/18/19 | | | | 25,002,654 | |
| | (3M USD LIBOR + 0.040%) | |
| | 10,000,000 | | | | 2.832 | | | | 03/20/19 | | | | 10,000,167 | |
| | Credit Suisse AG(i) | |
| | (3M USD LIBOR + 0.320%) | |
| | 11,000,000 | | | | 3.087 | | | | 03/08/19 | | | | 11,000,308 | |
| | (3M USD LIBOR + 0.340%) | |
| | 18,000,000 | | | | 3.137 | | | | 04/09/19 | | | | 18,005,355 | |
| | Duke Energy Corp.(g)(h) | |
| | 11,000,000 | | | | 0.000 | | | | 06/21/19 | | | | 10,899,490 | |
| | Eastman Chemical Co.(g)(h) | |
| | 15,800,000 | | | | 0.000 | | | | 03/21/19 | | | | 15,774,949 | |
| | 7,000,000 | | | | 0.000 | | | | 03/26/19 | | | | 6,986,224 | |
| | Ei Dupont(g)(h) | |
| | 15,000,000 | | | | 0.000 | | | | 03/26/19 | | | | 14,970,739 | |
| | Eli Lilly & Co.(g)(h) | |
| | 25,000,000 | | | | 0.000 | | | | 10/31/19 | | | | 24,546,580 | |
| | Essilorluxottica(g)(h) | |
| | 10,000,000 | | | | 0.000 | | | | 06/19/19 | | | | 9,920,203 | |
| | 13,000,000 | | | | 0.000 | | | | 09/03/19 | | | | 12,822,604 | |
| | |
|
| Short-term Investments – (continued) | |
| Certificates of Deposit – (continued) | |
| | Fairway Finance Co. LLC(g)(h) | |
| 7,500,000 | | | | 0.000 | | | | 06/05/19 | | | | 7,447,115 | |
| | Federation des Caisses Desjardins du Quebec(g) | |
| | 20,000,000 | | | | 0.000 | (h) | | | 02/24/20 | | | | 19,454,890 | |
| | (1M USD LIBOR + 0.270%) | |
| | 20,550,000 | | | | 2.776 | (i) | | | 03/26/19 | | | | 20,554,489 | |
| | First Abu Dhabi Bank P.J.S.C.(g)(h) | |
| | 25,000,000 | | | | 0.000 | | | | 05/06/19 | | | | 24,874,421 | |
| | General Electric Co.(h) | |
| | 12,000,000 | | | | 0.000 | | | | 03/01/19 | | | | 11,999,109 | |
| | 5,000,000 | | | | 0.000 | | | | 04/25/19 | | | | 4,977,818 | |
| | Gotham Funding Corp.(g)(h) | |
| | 20,000,000 | | | | 0.000 | | | | 04/08/19 | | | | 19,945,812 | |
| | 8,200,000 | | | | 0.000 | | | | 04/22/19 | | | | 8,169,542 | |
| | HSBC Bank PLC(g)(i) (3M USD LIBOR + 0.230%) | |
| | 7,100,000 | | | | 2.644 | | | | 04/10/19 | | | | 7,101,740 | |
| | HSBC Bank USA NA(i) | |
| | (3M USD LIBOR + 0.080%) | |
| | 14,950,000 | | | | 2.877 | | | | 07/12/19 | | | | 14,954,709 | |
| | (3M USD LIBOR + 0.090%) | |
| | 25,000,000 | | | | 2.855 | | | | 04/26/19 | | | | 25,003,735 | |
| | Industrial & Commercial Bank of China Ltd.(g)(h) | |
| | 10,500,000 | | | | 0.000 | | | | 04/15/19 | | | | 10,465,479 | |
| | ING (U.S.) Funding LLC(i) | |
| | (1M USD LIBOR + 0.270%) | |
| | 11,000,000 | | | | 2.791 | | | | 03/08/19 | | | | 11,000,872 | |
| | (3M USD LIBOR + 0.110%) | |
| | 6,000,000 | | | | 2.807 | | | | 05/10/19 | | | | 6,001,069 | |
| | J.P. Morgan Securities LLC(h) | |
| | 11,500,000 | | | | 0.000 | | | | 08/01/19 | | | | 11,368,011 | |
| | Jupiter Securitization Co. LLC(g)(h) | |
| | 23,000,000 | | | | 0.000 | | | | 04/03/19 | | | | 22,945,933 | |
| | Keurig Dr Pepper, Inc.(g)(h) | |
| | 5,000,000 | | | | 0.000 | | | | 03/12/19 | | | | 4,995,582 | |
| | 8,150,000 | | | | 0.000 | | | | 03/21/19 | | | | 8,137,069 | |
| | 8,500,000 | | | | 0.000 | | | | 04/05/19 | | | | 8,477,101 | |
| | La Fayette Asset Securitiization(g)(h) | |
| | 15,000,000 | | | | 0.000 | | | | 05/16/19 | | | | 14,917,289 | |
| | 8,600,000 | | | | 0.000 | | | | 06/03/19 | | | | 8,540,836 | |
| | Landesbank Hessen-Thueringen Girozentrale(g)(h) | |
| | 21,590,000 | | | | 0.000 | | | | 04/01/19 | | | | 21,543,730 | |
| | Liberty Funding LLC(g)(h) | |
| | 23,000,000 | | | | 0.000 | | | | 05/28/19 | | | | 22,855,573 | |
| | Lloyds Bank Corp. (j) | |
| | 10,000,000 | | | | 3.000 | | | | 07/29/19 | | | | 10,013,360 | |
| | Longship Funding LLC(g)(h) | |
| | 25,000,000 | | | | 0.000 | | | | 04/24/19 | | | | 24,897,142 | |
| | Lowe’s Cos., Inc.(h) | �� |
| | 9,500,000 | | | | 0.000 | | | | 03/01/19 | | | | 9,499,307 | |
| | Macquarie Bank Ltd.(g) | |
| | 13,350,000 | | | | 0.000 | (h) | | | 04/10/19 | | | | 13,311,746 | |
| | 7,000,000 | | | | 0.000 | (h) | | | 04/15/19 | | | | 6,977,397 | |
| | 5,000,000 | | | | 0.000 | (h) | | | 08/16/19 | | | | 4,936,977 | |
| | (1M USD LIBOR + 0.180%) | |
| | 8,700,000 | | | | 2.560 | (i) | | | 03/06/19 | | | | 8,700,393 | |
| | |
| | |
| The accompanying notes are an integral part of these financial statements. | | 11 |
GOLDMAN SACHS TACTICAL TILT OVERLAY FUND
Consolidated Schedule of Investments(continued)
February 28, 2019 (Unaudited)
| | | | | | | | | | | | | | |
Principal
Amount | | | Interest
Rate | | | Maturity
Date | | | Value | |
|
| Short-term Investments – (continued) | |
| Certificates of Deposit – (continued) | |
| | Manhattan Asset Funding Co. LLC(g)(h) | |
| $ | 11,150,000 | | | | 0.000 | % | | | 03/21/19 | | | $ | 11,133,948 | |
| | 5,000,000 | | | | 0.000 | | | | 04/01/19 | | | | 4,988,956 | |
| | Marriott Internation, Inc.(g)(h) | |
| | 15,000,000 | | | | 0.000 | | | | 03/13/19 | | | | 14,985,581 | |
| | 15,000,000 | | | | 0.000 | | | | 04/30/19 | | | | 14,928,757 | |
| | Matchpoint Finance PLC(g)(h) | |
| | 15,000,000 | | | | 0.000 | | | | 03/06/19 | | | | 14,993,708 | |
| | 6,000,000 | | | | 0.000 | | | | 05/13/19 | | | | 5,967,280 | |
| | Metlife Short Term Funding(g)(h) | |
| | 15,000,000 | | | | 0.000 | | | | 07/23/19 | | | | 14,842,735 | |
| | 15,000,000 | | | | 0.000 | | | | 08/12/19 | | | | 14,820,563 | |
| | Mizuho Bank Ltd.(i) | |
| | (1M USD LIBOR + 0.190%) | |
| | 11,000,000 | | | | 2.680 | | | | 03/25/19 | | | | 11,001,756 | |
| | (1M USD LIBOR + 0.200%) | |
| | 2,700,000 | | | | 2.714 | | | | 03/05/19 | | | | 2,700,110 | |
| | (3M USD LIBOR + 0.100%) | |
| | 11,000,000 | | | | 2.908 | | | | 04/03/19 | | | | 11,000,715 | |
| | Mondelez International, Inc.(g)(h) | |
| | 400,000 | | | | 0.000 | | | | 03/12/19 | | | | 399,645 | |
| | 14,000,000 | | | | 0.000 | | | | 04/18/19 | | | | 13,947,197 | |
| | MUFG Bank Ltd.(j) | |
| | 25,000,000 | | | | 2.930 | | | | 01/28/20 | | | | 25,037,603 | |
| | National Bank of Canada(i) (3M USD LIBOR + 0.230%) | |
| | 22,000,000 | | | | 3.010 | | | | 04/18/19 | | | | 22,006,050 | |
| | National Bank of Kuwait SAKP(j) | |
| | 6,050,000 | | | | 2.580 | | | | 04/29/19 | | | | 6,051,844 | |
| | 11,000,000 | | | | 3.000 | | | | 04/01/19 | | | | 11,004,032 | |
| | 17,000,000 | | | | 3.000 | | | | 04/24/19 | | | | 17,008,540 | |
| | 5,000,000 | | | | 3.050 | | | | 04/23/19 | | | | 5,002,953 | |
| | National Securities Clearing Corp.(g)(h) | |
| | 10,500,000 | | | | 0.000 | | | | 12/13/19 | | | | 10,268,916 | |
| | Natixis SA(i) | |
| | (3M USD LIBOR + 0.160%) | |
| | 3,950,000 | | | | 2.804 | | | | 05/20/19 | | | | 3,951,492 | |
| | (3M USD LIBOR + 0.180%) | |
| | 11,000,000 | | | | 2.847 | | | | 06/06/19 | | | | 11,005,297 | |
| | (3M USD LIBOR + 0.230%) | |
| | 25,000,000 | | | | 3.029 | | | | 01/10/20 | | | | 25,027,328 | |
| | Nederlandse Waterschapsbank N.V.(g)(h) | |
| | 23,000,000 | | | | 0.000 | | | | 04/11/19 | | | | 22,932,648 | |
| | Nieuw Amsterdam Receivables Corp.(g)(h) | |
| | 4,250,000 | | | | 0.000 | | | | 03/12/19 | | | | 4,246,553 | |
| | 23,000,000 | | | | 0.000 | | | | 05/07/19 | | | | 22,891,259 | |
| | Nordea Bank AB(i) | |
| | (3M USD LIBOR + 0.200%) | |
| | 25,200,000 | | | | 2.988 | | | | 03/15/19 | | | | 25,201,495 | |
| | (3M USD LIBOR + 0.270%) | |
| | 11,000,000 | | | | 3.050 | | | | 10/18/19 | | | | 11,017,607 | |
| | Old Line Funding LLC(g)(h) | |
| | 23,000,000 | | | | 0.000 | | | | 06/17/19 | | | | 22,822,699 | |
| | Oversea-Chinese Banking Corp. Ltd. | |
| | 20,100,000 | | | | 0.000 | (g)(h) | | | 04/17/19 | | | | 20,032,678 | |
| | (1M USD LIBOR + 0.150%) | |
| | 11,000,000 | | | | 2.663 | (i) | | | 03/06/19 | | | | 11,000,451 | |
| | |
|
| Short-term Investments – (continued) | |
| Certificates of Deposit – (continued) | |
| | PPG Industries, Inc.(h) | |
| 4,000,000 | | | | 0.000 | | | | 03/27/19 | | | | 3,991,801 | |
| | Ridgefield Funding Co. LLC(g)(h) | |
| | 15,000,000 | | | | 0.000 | | | | 04/16/19 | | | | 14,950,650 | |
| | 5,000,000 | | | | 0.000 | | | | 06/03/19 | | | | 4,966,051 | |
| | 15,000,000 | | | | 0.000 | | | | 06/10/19 | | | | 14,890,435 | |
| | Schlumberger Holdings Corp.(g)(h) | |
| | 10,000,000 | | | | 0.000 | | | | 03/06/19 | | | | 9,995,573 | |
| | 11,000,000 | | | | 0.000 | | | | 03/07/19 | | | | 10,994,311 | |
| | Sempra Energy Holdings(g)(h) | |
| | 14,400,000 | | | | 0.000 | | | | 03/14/19 | | | | 14,385,960 | |
| | Skandinaviska Enskilda Banken AB | |
| | 20,000,000 | | | | 0.000 | (g)(h) | | | 11/13/19 | | | | 19,620,883 | |
| | (1M USD LIBOR + 0.210%) | |
| | 11,825,000 | | | | 2.691 | (i) | | | 08/22/19 | | | | 11,829,511 | |
| | Societe Generale SA | |
| | 15,000,000 | | | | 0.000 | (g)(h) | | | 08/02/19 | | | | 14,829,285 | |
| | (3M USD LIBOR + 0.200%) | |
| | 11,000,000 | | | | 2.863 | (i) | | | 08/21/19 | | | | 11,010,267 | |
| | (3M USD LIBOR + 0.410%) | |
| | 14,650,000 | | | | 3.211 | (g)(i) | | | 12/18/19 | | | | 14,682,996 | |
| | Spire, Inc.(g)(h) | |
| | 1,000,000 | | | | 0.000 | | | | 03/15/19 | | | | 998,888 | |
| | 5,000,000 | | | | 0.000 | | | | 03/19/19 | | | | 4,992,870 | |
| | 8,000,000 | | | | 0.000 | | | | 03/22/19 | | | | 7,986,707 | |
| | Standard Chartered Bank(i) | |
| | (3M USD LIBOR + 0.060%) | |
| | 25,000,000 | | | | 2.850 | | | | 03/21/19 | | | | 25,000,564 | |
| | (3M USD LIBOR + 0.150%) | |
| | 3,900,000 | | | | 2.958 | | | | 10/03/19 | | | | 3,901,555 | |
| | (3M USD LIBOR + 0.220%) | |
| | 13,500,000 | | | | 2.903 | | | | 05/16/19 | | | | 13,505,372 | |
| | (3M USD LIBOR + 0.310%) | |
| | 4,000,000 | | | | 3.046 | | | | 10/31/19 | | | | 4,006,011 | |
| | Starbird Funding. Corp.(g)(h) | |
| | 20,000,000 | | | | 0.000 | | | | 04/15/19 | | | | 19,935,677 | |
| | Sumitomo Mitsui Banking Corp.(i) (3M USD LIBOR + 0.100%) | |
| | 15,000,000 | | | | 2.897 | | | | 04/12/19 | | | | 15,001,464 | |
| | Sumitomo Mitsui Trust Bank Ltd.(i) | |
| | (3M USD LIBOR + 0.100%) | |
| | 15,000,000 | | | | 2.887 | | | | 04/15/19 | | | | 15,001,580 | |
| | (3M USD LIBOR + 0.200%) | |
| | 2,000,000 | | | | 2.883 | | | | 08/16/19 | | | | 2,001,342 | |
| | (3M USD LIBOR + 0.200%) | |
| | 22,000,000 | | | | 2.997 | | | | 07/09/19 | | | | 22,013,629 | |
| | Suncor Energy, Inc.(g)(h) | |
| | 9,300,000 | | | | 0.000 | | | | 03/04/19 | | | | 9,297,283 | |
| | 10,000,000 | | | | 0.000 | | | | 05/28/19 | | | | 9,928,874 | |
| | 5,250,000 | | | | 0.000 | | | | 05/30/19 | | | | 5,212,463 | |
| | Svenska Handelsbanken AB(i) (1M USD LIBOR + 0.150%) | |
| | 25,000,000 | | | | 2.664 | | | | 04/05/19 | | | | 25,003,013 | |
| | Swedbank AB(i) (1M USD LIBOR + 0.290%) | |
| | 15,000,000 | | | | 2.780 | | | | 07/25/19 | | | | 15,008,169 | |
| | TELUS Corp.(g)(h) | |
| | 6,250,000 | | | | 0.000 | | | | 05/30/19 | | | | 6,204,484 | |
| | |
| | |
| 12 | | The accompanying notes are an integral part of these financial statements. |
GOLDMAN SACHS TACTICAL TILT OVERLAY FUND
| | | | | | | | | | | | | | |
Principal
Amount | | | Interest
Rate | | | Maturity
Date | | | Value | |
|
| Short-term Investments – (continued) | |
| Certificates of Deposit – (continued) | |
| | TheCoca-Cola Co. | |
| $ | 30,450,000 | | | | 0.000 | % | | | 12/11/19 | | | $ | 29,790,800 | |
| | The Korea Development Bank of New York(h) | |
| | 15,000,000 | | | | 0.000 | | | | 04/16/19 | | | | 14,951,159 | |
| | The Toronto-Dominion Bank | |
| | 7,250,000 | | | | 0.000 | (g)(h) | | | 10/18/19 | | | | 7,128,662 | |
| | (3M USD LIBOR + 0.170%) | |
| | 30,000,000 | | | | 2.943 | (i) | | | 04/17/19 | | | | 30,005,873 | |
| | Thunder Bay Funding LLC(g)(h) | |
| | 5,000,000 | | | | 0.000 | | | | 06/26/19 | | | | 4,957,782 | |
| Toyota Motor Finance Netherlands BV(i) (3M USD LIBOR +
0.090%) |
|
| | 25,843,000 | | | | 2.880 | | | | 03/18/19 | | | | 25,844,062 | |
| | TransCanada Pipelines Ltd.(g)(h) | |
| | 10,000,000 | | | | 0.000 | | | | 03/08/19 | | | | 9,994,124 | |
| | UBS AG(g)(i) | |
| | (3M USD LIBOR + 0.210%) | |
| | 20,500,000 | | | | 2.946 | | | | 06/04/19 | | | | 20,507,805 | |
| | (3M USD LIBOR + 0.330%) | |
| | 10,000,000 | | | | 2.738 | | | | 04/04/19 | | | | 10,002,560 | |
| | United Overseas Bank Ltd.(g)(h) | |
| | 15,000,000 | | | | 0.000 | | | | 03/12/19 | | | | 14,987,855 | |
| | US Bank NA(j) | |
| | 11,000,000 | | | | 2.517 | | | | 05/24/19 | | | | 11,003,872 | |
| | Victory Receivables Corp.(g)(h) | |
| | 22,000,000 | | | | 0.000 | | | | 03/11/19 | | | | 21,983,531 | |
| | VW Credit, Inc.(g)(h) | |
| | 8,350,000 | | | | 0.000 | | | | 03/20/19 | | | | 8,337,429 | |
| | 5,000,000 | | | | 0.000 | | | | 07/02/19 | | | | 4,949,625 | |
| | 11,800,000 | | | | 0.000 | | | | 07/08/19 | | | | 11,675,022 | |
| | Walgreens Boots Alliance, Inc.(h) | |
| | 9,300,000 | | | | 0.000 | | | | 07/16/19 | | | | 9,195,046 | |
| | 3,531,000 | | | | 0.000 | | | | 08/12/19 | | | | 3,482,934 | |
| | 6,500,000 | | | | 0.000 | | | | 08/26/19 | | | | 6,403,720 | |
| | Wells Fargo Bank NA(i) | |
| | (1M USD LIBOR + 0.300%) | |
| | 15,000,000 | | | | 2.790 | | | | 07/23/19 | | | | 15,010,935 | |
| | (3M USD LIBOR + 0.250%) | |
| | 15,000,000 | | | | 3.047 | | | | 04/05/19 | | | | 15,004,245 | |
| | Westpac Banking Corp.(g)(i) (3M USD LIBOR + 0.180%) | |
| | 10,000,000 | | | | 2.762 | | | | 10/31/19 | | | | 10,009,707 | |
| | Whirlpool Corp.(g)(h) | |
| | 9,140,000 | | | | 0.000 | | | | 03/14/19 | | | | 9,130,545 | |
| | 11,000,000 | | | | 0.000 | | | | 03/29/19 | | | | 10,975,818 | |
| | | | | | | | | | | | | | |
| | | | | | | | | | | | | 2,228,203,262 | |
| | |
| Commercial Paper – 3.7% | |
| | Credit Agricole SA(j) | |
| | 15,000,000 | | | | 2.800 | | | | 05/09/19 | | | | 15,010,082 | |
| | 9,750,000 | | | | 3.070 | | | | 11/19/19 | | | | 9,778,779 | |
| | Dexia Credit Local SA(h) | |
| | 11,000,000 | | | | 0.000 | | | | 05/07/19 | | | | 10,948,617 | |
| | 15,000,000 | | | | 0.000 | | | | 10/10/19 | | | | 14,758,827 | |
| | Dominion Resources, Inc.(h) | |
| | 10,350,000 | | | | 0.000 | | | | 06/27/19 | | | | 10,250,134 | |
| | |
|
| Short-term Investments – (continued) | |
| Commercial Paper – (continued) | |
| | Kells Funding LLC(h) | |
| 10,000,000 | | | | 0.000 | | | | 05/20/19 | | | | 9,942,940 | |
| | Landesbank Hessen-Thueringen Girozentrale(j) | |
| | 3,850,000 | | | | 2.940 | | | | 01/17/20 | | | | 3,857,755 | |
| | LMA SA LMA Americas(h) | |
| | 17,100,000 | | | | 0.000 | | | | 03/22/19 | | | | 17,074,408 | |
| | 7,000,000 | | | | 0.000 | | | | 04/08/19 | | | | 6,981,186 | |
| | 11,000,000 | | | | 0.000 | | | | 06/10/19 | | | | 10,919,091 | |
| | Standard Chartered Bank(j) | |
| | 4,000,000 | | | | 3.190 | | | | 10/31/19 | | | | 4,011,579 | |
| | Sumitomo Mitsui Banking Corp.(j) | |
| | 15,000,000 | | | | 2.510 | | | | 03/01/19 | | | | 15,000,027 | |
| | Sumitomo Mitsui Trust Bank Ltd.(j) | |
| | 11,000,000 | | | | 2.820 | | | | 03/19/19 | | | | 11,002,160 | |
| | | | | | | | | | | | | | |
| | | | | | | | | | | | | 139,535,585 | |
| | |
| | TOTALSHORT-TERM INVESTMENTS | |
| | (Cost $2,366,829,205) | | | | | | | $ | 2,367,738,847 | |
| | |
| TOTAL INVESTMENTS BEFORE SECURITIES LENDING
REINVESTMENT |
|
| | (Cost $3,672,436,032) | | | | | | | $ | 3,681,860,557 | |
| | |
| | | | | | | | |
| Shares | | Dividend
Rate | | | Value | |
|
| Securities Lending Reinvestment Vehicle(f) – 3.0% | |
Goldman Sachs Financial Square Government Fund – Institutional Shares | |
| 111,866,493 | | | 2.395% | | | $ | 111,866,493 | |
| (Cost $111,866,493) | | | | | | | | |
| |
| TOTAL INVESTMENTS – 100.4% | |
| (Cost $3,784,302,525) | | | $ | 3,793,727,050 | |
| |
LIABILITIES IN EXCESS OF
OTHER ASSETS – (0.4)% | | | | (13,761,084 | ) |
| |
| NET ASSETS – 100.0% | | | $ | 3,779,965,966 | |
| |
| | |
|
| The percentage shown for each investment category reflects the value of investments in that category as a percentage of net assets. |
| |
(a) | | Security is currently in default and/or non-income producing. |
| |
(b) | | Significant unobservable inputs were used in the valuation of this portfolio security; i.e. Level 3. |
| |
(c) | | Security with “Call” features with resetting interest rates. Maturity dates disclosed are the final maturity dates. |
| |
(d) | | Restricted securities are not registered under the Securities Act of 1933 and are subject to legal restrictions on resale. These securities generally may be resold in transactions exempt from registration or to the public if the securities are subsequently registered and the registration statement is effective. Disposal of these securities may involve time consuming negotiations and prompt sale at an acceptable price may be difficult. Total market value of restricted securities |
| | |
| The accompanying notes are an integral part of these financial statements. | | 13 |
GOLDMAN SACHS TACTICAL TILT OVERLAY FUND
Consolidated Schedule of Investments(continued)
February 28, 2019 (Unaudited)
| | |
| | amounts to $786,255, which represents approximately 0.0% of net assets as of February 28, 2019. |
| | | | | | | | | | |
| | | Restricted Security | | Acquisition
Date | | | Cost | |
| | Blue Ridge Mountain Resources, Inc. | |
| 5/6/2016 –
3/14/2017 |
| | $ | 1,759,790 | |
| | |
| |
(e) | | All or a portion of security is on loan. |
| |
(f) | | Represents an affiliated fund. |
| |
(g) | | Exempt from registration under Rule 144A of the Securities Act of 1933. |
| |
(h) | | Issued with a zero coupon. Income is recognized through the accretion of discount. |
| |
(i) | | Variable rate security. Except for floating rate notes (for which final maturity is disclosed), maturity date disclosed is the next interest reset date. Interest rate disclosed is that which is in effect on February 28, 2019. |
| |
(j) | | Rate shown is that which is in effect on February 28, 2019. Certain variable rate securities are not based on a published reference rate and spread but are determined by the issuer or agent and are based on current market conditions. |
| | |
|
Currency Abbreviations: |
EUR | | —Euro |
GBP | | —British Pound |
JPY | | —Japanese Yen |
USD | | —U.S. Dollar |
ZAR | | —South African Rand |
| | |
Investment Abbreviations: |
ETF | | —Exchange Traded Fund |
LIBOR | | —London Interbank Offered Rate |
LLC | | —Limited Liability Company |
MLP | | —Master Limited Partnership |
PLC | | —Public Limited Company |
|
|
| ADDITIONAL INVESTMENT INFORMATION |
FORWARD FOREIGN CURRENCY EXCHANGE CONTRACTS — At February 28, 2019, the Portfolio had the following forward foreign currency exchange contracts:
FORWARD FOREIGN CURRENCY EXCHANGE CONTRACTS WITH UNREALIZED GAIN
| | | | | | | | | | | | | | | | | | | | |
| Counterparty | | Currency
Purchased | | | Currency
Sold | | | Settlement
Date | | | Unrealized
Gain | |
MS & Co. Int. PLC | | GBP | | | 230,395,000 | | | USD | | | 295,904,823 | | | | 03/20/19 | | | $ | 10,003,846 | |
| | JPY | | | 16,376,000,000 | | | USD | | | 145,877,376 | | | | 03/20/19 | | | | 1,278,335 | |
| | USD | | | 12,789,531 | | | JPY | | | 1,412,000,000 | | | | 03/20/19 | | | | 101,215 | |
| | | ZAR | | | 1,797,710,000 | | | USD | | | 125,391,301 | | | | 03/20/19 | | | | 1,855,618 | |
| | | |
| TOTAL | | | | | | | | $ | 13,239,014 | |
FORWARD FOREIGN CURRENCY EXCHANGE CONTRACTS WITH UNREALIZED LOSS
| | | | | | | | | | | | | | | | | | | | |
| Counterparty | | Currency
Purchased | | | Currency
Sold | | | Settlement
Date | | | Unrealized
Loss | |
MS & Co. Int. PLC | | JPY | | | 3,586,000,000 | | | USD | | | 32,780,781 | | | | 03/20/19 | | | $ | (556,772 | ) |
| | USD | | | 67,316,372 | | | GBP | | | 53,060,000 | | | | 03/20/19 | | | | (3,134,436 | ) |
| | USD | | | 402,405,450 | | | JPY | | | 44,800,000,000 | | | | 03/20/19 | | | | (170,017 | ) |
| | | USD | | | 12,362,862 | | | ZAR | | | 178,710,000 | | | | 03/20/19 | | | | (286,730 | ) |
| | | |
| TOTAL | | | | | | | | $ | (4,147,955 | ) |
FUTURES CONTRACTS — At February 28, 2019, the Portfolio had the following futures contracts:
| | | | | | | | | | | | | | | | |
| Description | | Number of
Contracts | | | Expiration
Date | | | Notional
Amount | | | Unrealized
Appreciation/
(Depreciation) | |
Long position contracts: | | | | | | | | | | | | | | | | |
FTSE/JSE Top 40 Index | | | 3,451 | | | | 03/20/19 | | | $ | 121,384,602 | | | $ | 9,905,669 | |
IBEX 35 Index | | | 1,530 | | | | 03/15/19 | | | | 161,710,189 | | | | 5,602,857 | |
S&P 500E-Mini Index | | | 3,382 | | | | 03/15/19 | | | | 470,892,770 | | | | 29,441,055 | |
STOXX 600 Banks Index | | | 3,088 | | | | 03/15/19 | | | | 25,430,092 | | | | 1,549,654 | |
| | |
| 14 | | The accompanying notes are an integral part of these financial statements. |
GOLDMAN SACHS TACTICAL TILT OVERLAY FUND
|
| ADDITIONAL INVESTMENT INFORMATION (continued) |
| | | | | | | | | | | | | | | | |
| Description | | Number of
Contracts | | | Expiration
Date | | | Notional
Amount | | | Unrealized
Appreciation/
(Depreciation) | |
Long position contracts (continued): | | | | | | | | | | | | | | | | |
2 Year U.S. Treasury Notes | | | 4,116 | | | | 06/28/19 | | | $ | 873,395,904 | | | $ | (425,035 | ) |
5 Year U.S. Treasury Notes | | | 1,799 | | | | 06/28/19 | | | | 206,097,938 | | | | (32,735 | ) |
10 Year U.S. Treasury Notes | | | 3,964 | | | | 06/19/19 | | | | 483,608,000 | | | | (745,632 | ) |
| |
| Total | | | $ | 45,295,833 | |
| | | | |
Short position contracts: | | | | | | | | | | | | | | | | |
MSCI Emerging Markets Index | | | (1,324 | ) | | | 03/15/19 | | | | (69,291,540 | ) | | | (4,803,458 | ) |
| |
| Total Futures Contracts | | | $ | 40,492,375 | |
SWAP CONTRACTS — At February 28, 2019, the Portfolio had the following swap contracts:
OVER THE COUNTER TOTAL RETURN SWAP CONTRACTS
| | | | | | | | | | | | | | |
| Reference Obligation/Index | | Financing Rate
Paid
by the Portfolio | | | Counterparty | | Termination
Date(c) | | Notional
Amount
(000s) | | Unrealized
Appreciation/
(Depreciation)* | |
SX7T Index | | | 0.020 | %(a) | | Citibank NA | | 04/02/19 | | $104,099 | | $ | 15,427,675 | |
SX7T Index | | | 0.100 | %(a) | | UBS AG (London) | | 04/02/19 | | 59,619 | | | 8,870,972 | |
JPGSVENK Index(d) | | | 0.070 | %(b) | | JPMorgan Securities, Inc. | | 04/03/19 | | 472,632 | | | 1,614,149 | |
| |
| TOTAL | | $ | 25,912,796 | |
| | * | | There are no upfront payments on the swap contracts, therefore the unrealized gain (loss) on the swap contracts is equal to their market value. |
| | (a) | | Payments made quarterly. |
| | (b) | | Payments made monthly. |
| | (c) | | The Portfolio pays/receives annual coupon payments in accordance with the swap contract(s). On the termination date of the swap contract(s), the Portfolio will either receive from or pay to the counterparty an amount equal to the net of the accrued financing fees and the value of the reference security subtracted from the original notional cost (notional multiplied by the price change of the reference security, converted to U.S. Dollars). |
| | (d) | | The top 50 components are shown below. |
A basket (JPGSVENK) of common stocks
| | | | | | | | | | | | | | |
| Common Stocks | | Sector | | Shares | | | Value | | | Weight | |
Align Technology Inc | | Consumer,Non-cyclical | | | 231 | | | $ | 54,292 | | | | 3.71 | % |
General Electric Co | | Industrial | | | 5,537 | | | | 52,212 | | | | 3.56 | |
Arconic Inc | | Industrial | | | 3,086 | | | | 51,781 | | | | 3.53 | |
CenturyLink Inc | | Communications | | | 3,721 | | | | 44,541 | | | | 3.04 | |
Coty Inc | | Consumer,Non-cyclical | | | 3,550 | | | | 35,437 | | | | 2.42 | |
Mattel Inc | | Consumer, Cyclical | | | 2,337 | | | | 30,591 | | | | 2.09 | |
Philip Morris International Inc | | Consumer,Non-cyclical | | | 371 | | | | 29,267 | | | | 2.00 | |
Conagra Brands Inc | | Consumer,Non-cyclical | | | 1,376 | | | | 29,188 | | | | 1.99 | |
Albemarle Corp | | Basic Materials | | | 352 | | | | 29,177 | | | | 1.99 | |
Campbell Soup Co | | Consumer,Non-cyclical | | | 883 | | | | 28,852 | | | | 1.97 | |
Vulcan Materials Co | | Industrial | | | 276 | | | | 27,919 | | | | 1.91 | |
United Parcel Service Inc | | Industrial | | | 273 | | | | 27,309 | | | | 1.86 | |
Aptiv PLC | | Consumer, Cyclical | | | 361 | | | | 27,238 | | | | 1.86 | |
NVIDIA Corp | | Technology | | | 193 | | | | 27,076 | | | | 1.85 | |
Equifax Inc | | Consumer,Non-cyclical | | | 265 | | | | 26,295 | | | | 1.79 | |
DowDuPont Inc | | Basic Materials | | | 538 | | | | 25,981 | | | | 1.77 | |
Wynn Resorts Ltd | | Consumer, Cyclical | | | 223 | | | | 25,639 | | | | 1.75 | |
Facebook Inc | | Communications | | | 171 | | | | 25,005 | | | | 1.71 | |
Advanced Micro Devices Inc | | Technology | | | 1,146 | | | | 24,473 | | | | 1.67 | |
International Flavors & Fragrances Inc | | Basic Materials | | | 203 | | | | 23,466 | | | | 1.60 | |
Concho Resources Inc | | Energy | | | 233 | | | | 23,236 | | | | 1.59 | |
| | |
| The accompanying notes are an integral part of these financial statements. | | 15 |
GOLDMAN SACHS TACTICAL TILT OVERLAY FUND
Consolidated Schedule of Investments(continued)
February 28, 2019 (Unaudited)
|
| ADDITIONAL INVESTMENT INFORMATION (continued) |
| | | | | | | | | | | | | | |
| Common Stocks | | Sector | | Shares | | | Value | | | Weight | |
Tapestry Inc | | Consumer, Cyclical | | | 727 | | | $ | 23,064 | | | | 1.57 | % |
Fluor Corp | | Industrial | | | 582 | | | | 19,858 | | | | 1.36 | |
Alliant Energy Corp | | Utilities | | | 449 | | | | 18,705 | | | | 1.28 | |
American Tower Corp | | Financial | | | 105 | | | | 16,806 | | | | 1.15 | |
Realty Income Corp | | Financial | | | 264 | | | | 16,548 | | | | 1.13 | |
IPG Photonics Corp | | Technology | | | 103 | | | | 14,523 | | | | 0.99 | |
Fortive Corp | | Industrial | | | 191 | | | | 14,112 | | | | 0.96 | |
Sealed Air Corp | | Industrial | | | 354 | | | | 14,030 | | | | 0.96 | |
Baker Hughes a GE Co | | Energy | | | 586 | | | | 14,020 | | | | 0.96 | |
General Mills Inc | | Consumer,Non-cyclical | | | 327 | | | | 13,979 | | | | 0.95 | |
CarMax Inc | | Consumer, Cyclical | | | 246 | | | | 13,839 | | | | 0.94 | |
Microchip Technology Inc | | Technology | | | 175 | | | | 13,767 | | | | 0.94 | |
Stryker Corp | | Consumer,Non-cyclical | | | 80 | | | | 13,721 | | | | 0.94 | |
Hess Corp | | Energy | | | 259 | | | | 13,614 | | | | 0.93 | |
LKQ Corp | | Consumer, Cyclical | | | 541 | | | | 13,609 | | | | 0.93 | |
FMC Corp | | Basic Materials | | | 166 | | | | 13,488 | | | | 0.92 | |
Brighthouse Financial Inc | | Financial | | | 383 | | | | 13,453 | | | | 0.92 | |
Netflix Inc | | Communications | | | 41 | | | | 13,450 | | | | 0.92 | |
PACCAR Inc | | Consumer, Cyclical | | | 218 | | | | 13,408 | | | | 0.92 | |
PerkinElmer Inc | | Industrial | | | 157 | | | | 13,396 | | | | 0.91 | |
Stanley Black & Decker Inc | | Industrial | | | 111 | | | | 13,318 | | | | 0.91 | |
Incyte Corp | | Consumer,Non-cyclical | | | 170 | | | | 13,307 | | | | 0.91 | |
Martin Marietta Materials Inc | | Industrial | | | 78 | | | | 13,289 | | | | 0.91 | |
Noble Energy Inc | | Energy | | | 658 | | | | 13,230 | | | | 0.90 | |
Flowserve Corp | | Industrial | | | 325 | | | | 13,086 | | | | 0.89 | |
Cooper Cos Inc/The | | Consumer,Non-cyclical | | | 50 | | | | 13,081 | | | | 0.89 | |
Royal Caribbean Cruises Ltd | | Consumer, Cyclical | | | 121 | | | | 13,003 | | | | 0.89 | |
Amazon.com Inc | | Communications | | | 9 | | | | 12,992 | | | | 0.89 | |
Becton Dickinson and Co | | Consumer,Non-cyclical | | | 57 | | | | 12,949 | | | | 0.88 | |
PURCHASED AND WRITTEN OPTIONS CONTRACTS — At February 28, 2019, the Portfolio had the following purchased and written options:
EXCHANGE TRADED OPTIONS ON COMMODITIES CONTRACTS
| | | | | | | | | | | | | | | | | | | | | | | | | | |
| Description | | Exercise
Price | | Expiration
Date | | | Number of
Contracts | | | Notional
Amount | | | Market
Value | | | Premiums Paid
(Received) by
Portfolio | | | Unrealized
Appreciation/
(Depreciation) | |
Purchased option contracts | | | | | | | | | | | | | | | | | | | | | |
Calls | | | | | | | | | | | | | | | | | | | | | |
Crude Oil Futures | | $50.00 | | | 05/16/2019 | | | | 2,032 | | | $ | 2,032,000 | | | $ | 17,678,400 | | | $ | 9,655,578 | | | $ | 8,022,822 | |
Written option contracts | | | | | | | | | | | | | | | | | | | | | |
Calls | | | | | | | | | | | | | | | | | | | | | |
Crude Oil Futures | | 55.00 | | | 05/16/2019 | | | | (2,032 | ) | | | (2,032,000 | ) | | | (9,875,520 | ) | | | (5,717,760 | ) | | | (4,157,760 | ) |
| | | | | | |
| TOTAL | | | | | | | — | | | $ | — | | | $ | 7,802,880 | | | $ | 3,937,818 | | | $ | 3,865,062 | |
| | |
| 16 | | The accompanying notes are an integral part of these financial statements. |
GOLDMAN SACHS TACTICAL TILT OVERLAY FUND
|
| ADDITIONAL INVESTMENT INFORMATION (continued) |
OVER-THE-COUNTER OPTIONS ON EQUITIES
| | | | | | | | | | | | | | | | | | | | | | | | | | | | | | |
| Description | | Counterparty | | Exercise
Price | | | Expiration
Date | | | Number of
Contracts | | | Notional
Amount | | | Market Value | | | Premiums Paid
(Received) by
Portfolio | | | Unrealized
Appreciation/
(Depreciation) | |
Purchased option contracts | | | | | | | | | | | | | | | | | | | | | | | | | |
Calls | | | | | | | | | | | | | | | | | | | | | | | | | |
KBE Index | | Citibank NA | | | 35.860 | | | | 03/14/2019 | | | | 826,769 | | | $ | 826,769 | | | $ | 7,792,815 | | | $ | 1,860,230 | | | $ | 5,932,585 | |
SX7E Index | | UBS AG (London) | | | 95.766 | | | | 12/20/2019 | | | | 685,996 | | | | 685,996 | | | | 5,108,513 | | | | 2,884,772 | | | | 2,223,741 | |
| | | | | | | |
| Total Purchased option contracts | | | | | | | | | | | 1,512,765 | | | $ | 1,512,765 | | | $ | 12,901,328 | | | $ | 4,745,002 | | | $ | 8,156,326 | |
Written option contracts | | | | | | | | | | | | | | | | | | | | | | | | | |
Puts | | | | | | | | | | | | | | | | | | | | | | | | | |
KBE Index | | Citibank NA | | | 35.860 | | | | 03/14/2019 | | | | (826,769 | ) | | | (826,769 | ) | | | (622 | ) | | | (1,653,538 | ) | | | 1,652,916 | |
| | | | | | | |
| TOTAL | | | | | | | | | | | 685,996 | | | $ | 685,996 | | | $ | 12,900,706 | | | $ | 3,091,464 | | | $ | 9,809,242 | |
| | |
|
Abbreviations: |
MS & Co. Int. PLC—Morgan Stanley & Co. International PLC |
|
| | |
| The accompanying notes are an integral part of these financial statements. | | 17 |
GOLDMAN SACHS TACTICAL TILT OVERLAY FUND
Consolidated Statement of Assets and Liabilities(a)
February 28, 2019 (Unaudited)
| | | | | | |
| | | | | | |
| | Assets: | | | | |
| | Investments of unaffiliated issuers, at value (cost 2,622,539,679)(b) | | $ | 2,636,343,187 | |
| | Investments of affiliated issuers, at value (cost $1,049,896,353) | | | 1,045,517,370 | |
| | Investments in securities lending reinvestment vehicle — affiliated issuer, at value (cost $111,866,493) | | | 111,866,493 | |
| | Purchased options, at value (cost $14,400,580) | | | 30,579,728 | |
| | Cash | | | 69,585,995 | |
| | Foreign currencies, at value (cost $1,120,031) | | | 820,903 | |
| | Unrealized gain on swap contracts | | | 25,912,796 | |
| | Unrealized gain on forward foreign currency exchange contracts | | | 13,239,014 | |
| | Receivables: | | | | |
| | Collateral on certain derivative contracts(c) | | | 57,550,001 | |
| | Dividends and interest | | | 5,726,084 | |
| | Fund shares sold | | | 4,604,979 | |
| | Securities lending income | | | 234,854 | |
| | Reimbursement from investment adviser | | | 3,334 | |
| | Foreign tax reclaims | | | 801 | |
| | Other assets | | | 266,625 | |
| | Total assets | | | 4,002,252,164 | |
| | | | | | |
| | Liabilities: | | | | |
| | Unrealized loss on forward foreign currency exchange contracts | | | 4,147,955 | |
| | Variation margin on futures contracts | | | 1,012,986 | |
| | Written option contracts, at value (premium received $7,371,298) | | | 9,876,142 | |
| | Payables: | | | | |
| | Payable upon return of securities loaned | | | 111,866,493 | |
| | Investments purchased | | | 47,910,297 | |
| | Collateral on certain derivative contracts(d) | | | 32,426,816 | |
| | Fund shares redeemed | | | 12,651,440 | |
| | Management fees | | | 1,919,205 | |
| | Transfer Agency fees | | | 86,689 | |
| | Accrued expenses | | | 388,175 | |
| | Total liabilities | | | 222,286,198 | |
| | | | | | |
| | Net Assets: | | | | |
| | Paid-in capital | | | 3,958,183,704 | |
| | Total distributable loss | | | (178,217,738 | ) |
| | | NET ASSETS | | $ | 3,779,965,966 | |
| | | Net Assets: | | | | |
| | | Institutional | | $ | 24,451,154 | |
| | | Class P | | | 3,435,605,465 | |
| | | Class R6 | | | 319,909,347 | |
| | | Total Net Assets | | $ | 3,779,965,966 | |
| | | Shares Outstanding $0.001 par value (unlimited number of shares authorized): | | | | |
| | | Institutional | | | 2,435,633 | |
| | | Class P | | | 352,022,095 | |
| | | Class R6 | | | 32,773,697 | |
| | | Net asset value, offering and redemption price per share: | | | | |
| | | Institutional | | | $10.04 | |
| | | Class P | | | 9.76 | |
| | | Class R6 | | | 9.76 | |
| | (a) | | Statement of Assets and Liabilities for the Portfolio is consolidated and includes the balances of a wholly owned subsidiary, Goldman Sachs Cayman Commodity — TTIF Ltd. Accordingly, all interfund balances and transactions have been eliminated. |
| | (b) | | Includes loaned securities having a market value of $109,184,354. |
| | (c) | | Includes amounts segregated for initial margin requirements and/or collateral on futures, swaps and forward foreign currency exchange contract transactions of $51,450,001, $1,130,000 and $4,970,000, respectively. |
| | (d) | | Includes amounts segregated for initial margin requirements and/or collateral on swaps contracts. |
| | |
| 18 | | The accompanying notes are an integral part of these financial statements. |
GOLDMAN SACHS TACTICAL TILT OVERLAY FUND
Consolidated Statement of Operations(a)
For the Six Months Ended February 28, 2019 (Unaudited)
| | | | | | |
| | | | | | |
| | Investment income: | | | | |
| | |
| | Interest — unaffiliated issuers | | $ | 32,447,403 | |
| | |
| | Dividends — affiliated issuers | | | 16,503,830 | |
| | |
| | Dividends — unaffiliated issuers | | | 10,972,319 | |
| | |
| | Securities lending income — affiliated issuer | | | 1,890,086 | |
| | |
| | Total investment income | | | 61,813,638 | |
| | | | | | |
| | Expenses: | | | | |
| | |
| | Management fees | | | 14,306,777 | |
| | |
| | Transfer Agency fees(b) | | | 601,735 | |
| | |
| | Custody, accounting and administrative services | | | 155,617 | |
| | |
| | Registration fees | | | 130,477 | |
| | |
| | Professional fees | | | 84,680 | |
| | |
| | Printing and mailing costs | | | 45,701 | |
| | |
| | Trustee fees | | | 11,814 | |
| | |
| | Prime Broker Fees | | | 10,966 | |
| | |
| | Other | | | 207,614 | |
| | |
| | Total expenses | | | 15,555,381 | |
| | |
| | Less — expense reductions | | | (1,189,390 | ) |
| | |
| | Net expenses | | | 14,365,991 | |
| | |
| | NET INVESTMENT INCOME | | | 47,447,647 | |
| | | | | | |
| | Realized and unrealized gain (loss): | | | | |
| | |
| | Net realized gain (loss) from: | | | | |
| | |
| | Investments — unaffiliated issuers | | | 2,582,596 | |
| | |
| | Investment — affiliated issuers | | | (4,506,330 | ) |
| | |
| | Purchased options | | | 46,240,320 | |
| | |
| | Futures contracts | | | (28,597,097 | ) |
| | |
| | Written options | | | (18,227,298 | ) |
| | |
| | Swap contracts | | | (22,368,582 | ) |
| | |
| | Forward foreign currency exchange contracts | | | (9,899,572 | ) |
| | |
| | Foreign currency transactions | | | (504,868 | ) |
| | |
| | Net change in unrealized gain (loss) on: | | | | |
| | |
| | Investments — unaffiliated issuers | | | (49,306,728 | ) |
| | |
| | Investments — affiliated issuers | | | (8,332,061 | ) |
| | |
| | Purchased options | | | 14,440,096 | |
| | |
| | Futures contracts | | | 16,400,957 | |
| | |
| | Written options | | | (6,030,374 | ) |
| | |
| | Swap contracts | | | 36,095,687 | |
| | |
| | Forward foreign currency exchange contracts | | | 29,144,995 | |
| | |
| | Foreign currency translation | | | (327,917 | ) |
| | |
| | Net realized and unrealized loss | | | (3,196,176 | ) |
| | |
| | NET INCREASE IN NET ASSETS RESULTING FROM OPERATIONS | | $ | 44,251,471 | |
| | (a) | | Statement of Operations for the Portfolio is consolidated and includes the balances of a wholly owned subsidiary, Goldman Sachs Cayman Commodity — TTIF Ltd. Accordingly, all interfund balances and transactions have been eliminated. |
| | (b) | | Class specific Transfer Agency fees were as follows: |
| | | | | | | | | | |
| Transfer Agency Fees | |
Institutional | | | Class P | | | Class R6 | |
| $ | 4,728 | | | $ | 547,074 | | | $ | 49,933 | |
| | |
| The accompanying notes are an integral part of these financial statements. | | 19 |
GOLDMAN SACHS TACTICAL TILT OVERLAY FUND
Consolidated Statements of Changes in Net Assets(a)
| | | | | | | | | | |
| | | | | For the
Six Months Ended
February 28, 2019
(Unaudited) | | | For the
Fiscal Year Ended
August 31, 2018 | |
| | From operations: | | | | | | | | |
| | | |
| | Net investment income | | $ | 47,447,647 | | | $ | 67,621,747 | |
| | | |
| | Net realized loss | | | (35,280,831 | ) | | | (21,067,284 | ) |
| | | |
| | Net change in unrealized gain | | | 32,084,655 | | | | 73,015,573 | |
| | | |
| | Net increase in net assets resulting from operations | | | 44,251,471 | | | | 119,570,036 | |
| | | | | | | | | | |
| | Distributions to shareholders: | | | | | | | | |
| | | |
| | From total distributable earnings: | | | | | | | | |
| | | |
| | Institutional Shares | | | — | | | | (45,296,029 | )(b) |
| | | |
| | Class P Shares(c) | | | (88,570,565 | ) | | | — | |
| | | |
| | Class R6 Shares(d) | | | (9,121,338 | ) | | | — | |
| | | |
| | Total distributions to shareholders | | | (97,691,903 | ) | | | (45,296,029 | ) |
| | | | | | | | | | |
| | From share transactions: | | | | | | | | |
| | | |
| | Proceeds from sales of shares | | | 368,328,867 | | | | 5,187,683,119 | |
| | | |
| | Reinvestment of distributions | | | 97,691,903 | | | | 45,296,029 | |
| | | |
| | Cost of shares redeemed | | | (1,044,813,040 | ) | | | (6,137,982,554 | ) |
| | | |
| | Net decrease in net assets resulting from share transactions | | | (578,792,270 | ) | | | (905,003,406 | ) |
| | | |
| | TOTAL DECREASE | | | (632,232,702 | ) | | | (830,729,399 | ) |
| | | | | | | | | | |
| | Net assets:(e) | | | | | | | | |
| | | |
| | Beginning of period | | | 4,412,198,668 | | | | 5,242,928,067 | |
| | | |
| | End of period | | $ | 3,779,965,966 | | | $ | 4,412,198,668 | |
| | (a) | | Statement of Changes in Net Assets for the Portfolio is consolidated and includes the balances of a wholly owned subsidiary, Cayman Commodity — TTIF, Ltd. Accordingly, all interfund balances and transactions have been eliminated. |
| | (b) | | Prior year information has been revised to conform to current year presentation. Distributions to shareholders consisted solely of net investment income for the fiscal year ended August 31, 2018. |
| | (c) | | Commenced operations on April 17, 2018. |
| | (d) | | Commenced operations on December 29, 2017. |
| | (e) | | Prior year information has been revised to conform with current year presentation. Undistributed net investment income was $53,093,613 as of August 31, 2018. |
| | |
| 20 | | The accompanying notes are an integral part of these financial statements. |
GOLDMAN SACHS TACTICAL TILT OVERLAY FUND
Consolidated Financial Highlights
Selected Share Data for a Share Outstanding Throughout Each Period
| | | | | | | | | | | | | | | | | | | | | | | | | | |
| | | | | Goldman Sachs Tactical Tilt Overlay Fund
| |
| | | | | Institutional Shares | |
| | | | | Six Months Ended
February 28, 2019
(Unaudited) | | | Year Ended August 31, 2018 | | | Period November 1, 2016 – August 31, 2017* | | | Year Ended October 31, | | | Period July 31, 2014 – October 31, 2014(a) | |
| | | | | 2016 | | | 2015 | |
| | Per Share Data | | | | | | | | | | | | | | | | | | | | | | | | |
| | | | | | | |
| | Net asset value, beginning of period | | $ | 9.87 | | | $ | 9.73 | | | $ | 9.83 | | | $ | 10.40 | | | $ | 9.87 | | | $ | 10.00 | |
| | | | | | | |
| | Net investment income(b) | | | 0.12 | | | | 0.12 | | | | 0.09 | | | | 0.11 | | | | 0.18 | | | | 0.04 | |
| | | | | | | |
| | Net realized and unrealized gain (loss) | | | 0.05 | | | | 0.11 | | | | (0.01 | ) | | | (0.22 | ) | | | 0.46 | | | | (0.17 | ) |
| | | | | | | |
| | Total from investment operations | | | 0.17 | | | | 0.23 | | | | 0.08 | | | | (0.11 | ) | | | 0.64 | | | | (0.13 | ) |
| | | | | | | |
| | Distributions to shareholders from net investment income | | | — | | | | (0.09 | ) | | | (0.18 | ) | | | (0.46 | ) | | | (0.11 | ) | | | — | |
| | | | | | | |
| | Net asset value, end of period | | $ | 10.04 | | | $ | 9.87 | | | $ | 9.73 | | | $ | 9.83 | | | $ | 10.40 | | | $ | 9.87 | |
| | | | | | | |
| | Total return(c) | | | 1.72 | % | | | 2.39 | % | | | 0.82 | % | | | (0.96 | )% | | | 6.57 | % | | | (1.30 | )% |
| | | | | | | |
| | Net assets, end of period (in 000s) | | $ | 24,451 | | | $ | 23,583 | | | $ | 5,242,928 | | | $ | 5,214,846 | | | $ | 4,664,660 | | | $ | 1,522,551 | |
| | | | | | | |
| | Ratio of net expenses to average net assets(d) | | | 0.73 | %(e) | | | 0.69 | % | | | 0.62 | %(e) | | | 0.59 | % | | | 0.52 | % | | | 0.63 | %(e) |
| | | | | | | |
| | Ratio of total expenses to average net assets(d) | | | 0.79 | %(e) | | | 0.76 | % | | | 0.75 | %(e) | | | 0.77 | % | | | 0.79 | % | | | 0.86 | %(e) |
| | | | | | | |
| | Ratio of net investment income to average net assets | | | 2.38 | %(e) | | | 1.20 | % | | | 1.10 | %(e) | | | 1.15 | % | | | 1.77 | % | | | 1.63 | %(e) |
| | | | | | | |
| | Portfolio turnover rate(f) | | | 24 | % | | | 41 | % | | | 28 | % | | | 48 | % | | | 81 | % | | | 45 | % |
| | * | | The Portfolio changed its fiscal year end from October 31 to August 31. |
| | (a) | | Commenced operations on July 31, 2014. |
| | (b) | | Calculated based on the average shares outstanding methodology. |
| | (c) | | Assumes investment at the NAV at the beginning of the period, reinvestment of all dividends and distributions, a complete redemption of the investment at the NAV at the end of the period and no sales or redemption charges. Total returns would be reduced if a sales or redemption charge was taken into account. Returns do not reflect the impact of taxes to shareholders relating to Portfolio distributions or the redemption of Portfolio shares. Total returns for periods less than one full year are not annualized. |
| | (d) | | Expense ratios exclude the expenses of the Underlying Funds in which the Portfolio invests. |
| | (f) | | The Portfolio’s portfolio turnover rate is calculated in accordance with regulatory requirements, without regard to transactions involving short term investments and certain derivatives. If such transactions were included, the Portfolio’s portfolio turnover rate may be higher. |
| | |
| The accompanying notes are an integral part of these financial statements. | | 21 |
GOLDMAN SACHS TACTICAL TILT OVERLAY FUND
Consolidated Financial Highlights(continued)
Selected Share Data for a Share Outstanding Throughout Each Period
| | | | | | | | | | |
| | | | | Goldman Sachs Tactical Tilt Overlay Fund
| |
| | | | | Class P Shares | |
| | | | | Six Months Ended
February 28, 2019
(Unaudited) | | | Period Ended
August 31, 2018(a) | |
| | Per Share Data | |
| | | |
| | Net asset value, beginning of period | | $ | 9.87 | | | $ | 9.76 | |
| | | |
| | Net investment income(b) | | | 0.11 | | | | 0.14 | |
| | | |
| | Net realized and unrealized gain (loss) | | | 0.04 | | | | (0.03 | ) |
| | | |
| | Total from investment operations | | | 0.15 | | | | 0.11 | |
| | | |
| | Distributions to shareholders from net investment income | | | (0.26 | ) | | | — | |
| | | |
| | Net asset value, end of period | | $ | 9.76 | | | $ | 9.87 | |
| | | |
| | Total return(c) | | | 1.63 | % | | | 1.13 | % |
| | | |
| | Net assets, end of period (in 000s) | | $ | 3,435,605 | | | $ | 4,045,246 | |
| | | |
| | Ratio of net expenses to average net assets(d)(e) | | | 0.72 | % | | | 0.71 | % |
| | | |
| | Ratio of total expenses to average net assets(d)(e) | | | 0.78 | % | | | 0.77 | % |
| | | |
| | Ratio of net investment income to average net assets(e) | | | 2.37 | % | | | 3.80 | % |
| | | |
| | Portfolio turnover rate(f) | | | 24 | % | | | 41 | % |
| | (a) | | Commenced operations on April 17, 2018. |
| | (b) | | Calculated based on the average shares outstanding methodology. |
| | (c) | | Assumes investment at the NAV at the beginning of the period, reinvestment of all dividends and distributions, a complete redemption of the investment at the NAV at the end of the period and no sales or redemption charges. Total returns would be reduced if a sales or redemption charge was taken into account. Returns do not reflect the impact of taxes to shareholders relating to Portfolio distributions or the redemption of Portfolio shares. Total returns for periods less than one full year are not annualized. |
| | (d) | | Expense ratios exclude the expenses of the Underlying Funds in which the Portfolio invests. |
| | (f) | | The Portfolio’s portfolio turnover rate is calculated in accordance with regulatory requirements, without regard to transactions involving short term investments and certain derivatives. If such transactions were included, the Portfolio’s portfolio turnover rate may be higher. |
| | |
| 22 | | The accompanying notes are an integral part of these financial statements. |
GOLDMAN SACHS TACTICAL TILT OVERLAY FUND
Consolidated Financial Highlights(continued)
Selected Share Data for a Share Outstanding Throughout Each Period
| | | | | | | | | | |
| | | | | Goldman Sachs Tactical Tilt Overlay Fund
| |
| | | | | Class R6 Shares | |
| | | | | Six Months Ended
February 28, 2019
(Unaudited) | | | Period Ended August 31, 2018(a) | |
| | Per Share Data | |
| | | |
| | Net asset value, beginning of period | | $ | 9.87 | | | $ | 9.81 | |
| | | |
| | Net investment income(b) | | | 0.11 | | | | 0.11 | |
| | | |
| | Net realized and unrealized gain (loss) | | | 0.04 | | | | (0.05 | ) |
| | | |
| | Total from investment operations | | | 0.15 | | | | 0.06 | |
| | | |
| | Distributions to shareholders from net investment income | | | (0.26 | ) | | | — | |
| | | |
| | Net asset value, end of period | | $ | 9.76 | | | $ | 9.87 | |
| | | |
| | Total return(c) | | | 1.62 | % | | | 0.61 | % |
| | | |
| | Net assets, end of period (in 000s) | | $ | 319,909 | | | $ | 343,370 | |
| | | |
| | Ratio of net expenses to average net assets(d)(e) | | | 0.72 | % | | | 0.69 | % |
| | | |
| | Ratio of total expenses to average net assets(d)(e) | | | 0.78 | % | | | 0.76 | % |
| | | |
| | Ratio of net investment income to average net assets(e) | | | 2.38 | % | | | 1.77 | % |
| | | |
| | Portfolio turnover rate(f) | | | 24 | % | | | 41 | % |
| | (a) | | Commenced operations on December 29, 2017. |
| | (b) | | Calculated based on the average shares outstanding methodology. |
| | (c) | | Assumes investment at the NAV at the beginning of the period, reinvestment of all dividends and distributions, a complete redemption of the investment at the NAV at the end of the period and no sales or redemption charges. Total returns would be reduced if a sales or redemption charge was taken into account. Returns do not reflect the impact of taxes to shareholders relating to Portfolio distributions or the redemption of Portfolio shares. Total returns for periods less than one full year are not annualized. |
| | (d) | | Expense ratios exclude the expenses of the Underlying Funds in which the Portfolio invests. |
| | (f) | | The Portfolio’s portfolio turnover rate is calculated in accordance with regulatory requirements, without regard to transactions involving short term investments and certain derivatives. If such transactions were included, the Portfolio’s portfolio turnover rate may be higher. |
| | |
| The accompanying notes are an integral part of these financial statements. | | 23 |
GOLDMAN SACHS TACTICAL TILT OVERLAY FUND
Notes to Consolidated Financial Statements
February 28, 2019 (Unaudited)
Goldman Sachs Trust (the “Trust”) is a Delaware statutory trust registered under the Investment Company Act of 1940, as amended (the “Act”), as anopen-end management investment company. Goldman Sachs Tactical Tilt Overlay Fund (the “Portfolio”) is a diversified portfolio and currently offers three classes of shares — Institutional, Class P and Class R6 Shares. Goldman Sachs Asset Management, L.P. (“GSAM”), an affiliate of Goldman Sachs & Co. LLC (“Goldman Sachs”), serves as investment adviser to the Portfolio pursuant to a management agreement (the “Agreement”) with the Trust.
|
| 2. SIGNIFICANT ACCOUNTING POLICIES |
The financial statements have been prepared in accordance with accounting principles generally accepted in the United States of America (“GAAP”) and require management to make estimates and assumptions that may affect the reported amounts and disclosures. Actual results may differ from those estimates and assumptions.
A. Basis of Consolidation for Goldman Sachs Tactical Tilt Overlay Fund— The Cayman Commodity — TTIF, Ltd. (the “Subsidiary”), a Cayman Islands exempted company, was incorporated on July 31, 2014 and is currently a wholly-owned subsidiary of the Portfolio. The Subsidiary acts as an investment vehicle for the Portfolio to enable the Portfolio to gain exposure to certain types of commodity-linked derivative instruments. The Portfolio is the sole shareholder of the Subsidiary pursuant to a subscription agreement dated as of July 31, 2014, and it is intended that the Portfolio will remain the sole shareholder and will continue to control the Subsidiary. Under the Memorandum and Articles of Association of the Subsidiary, shares issued by the Subsidiary confer upon a shareholder the right to vote at general meetings of the Subsidiary and certain rights in connection with anywinding-up or repayment of capital, as well as the right to participate in the profits or assets of the Subsidiary. All inter-fund balances and transactions have been eliminated in consolidation. As of February 28, 2019, the Portfolio’s net assets were $3,779,965,966, of which, $ 385,451,724, or 10.2%, represented the Subsidiary’s net assets.
B. Investment Valuation — The Portfolio’s valuation policy is to value investments at fair value.
C. Investment Income and Investments — Investment income includes interest income, dividend income and securities lending income, if any. Interest income is accrued daily and adjusted for amortization of premiums and accretion of discounts. Dividend income is recognized onex-dividend date or, for certain foreign securities, as soon as such information is obtained subsequent to theex-dividend date. Investment transactions are reflected on trade date. Realized gains and losses are calculated using identified cost. Investment transactions are recorded on the following business day for daily net asset value (“NAV”) calculations. Investment income is recorded net of any foreign withholding taxes, less any amounts reclaimable. The Portfolio may file withholding tax reclaims in certain jurisdictions to recover a portion of amounts previously withheld. Any foreign capital gains tax is accrued daily based upon net unrealized gains, and is payable upon sale of such investments.
Distributions from master limited partnerships (“MLPs”) are generally recorded based on the characterization reported on the MLP’s tax return. The Portfolio records itspro-rata share of the income/loss and capital gains/losses, allocated from the underlying partnerships and adjusts the cost basis of the underlying partnerships accordingly.
For derivative contracts, realized gains and losses are recorded upon settlement of the contract. Upfront payments, if any, are made or received upon entering into a swap agreement and are reflected in the Consolidated Statement of Assets and Liabilities. Upfront payments are recognized over the contract’s term/event as realized gains or losses, with the exception of forward starting swap contracts whose realized gains or losses are recognized from the effective start date. For securities with paydown provisions, principal payments received are treated as a proportionate reduction to the cost basis of the securities, and excess or shortfall amounts are recorded as income.
D. Class Allocations and Expenses — Investment income, realized and unrealized gain (loss), if any, andnon-class specific expenses of the Portfolio are allocated daily based upon the proportion of net assets of each class.Non-class specific expenses directly incurred by the Portfolio are charged to the Portfolio, while such expenses incurred by the Trust are allocated across the Portfolio on a straight-line and/orpro-rata basis depending upon the nature of the expenses. Class-specific expenses, where applicable, are borne by the respective share classes and include Transfer Agency fees.
24
GOLDMAN SACHS TACTICAL TILT OVERLAY FUND
|
| 2. SIGNIFICANT ACCOUNTING POLICIES (continued) |
E. Federal Taxes and Distributions to Shareholders — It is the Portfolio’s policy to comply with the requirements of the Internal Revenue Code of 1986, as amended (the “Code”), applicable to regulated investment companies and to distribute each year substantially all of its investment company taxable income and capital gains to its shareholders. Accordingly, the Portfolio is not required to make any provisions for the payment of federal income tax. Distributions to shareholders are recorded on theex-dividend date. Income and capital gains distributions, if any, are declared and paid according annually.
The Subsidiary is classified as a controlled foreign corporation under the Code. Therefore, the Portfolio is required to increase its taxable income by its share of the Subsidiary’s income. Net losses of the Subsidiary cannot be deducted by the Portfolio in the current period nor carried forward to offset taxable income in future periods.
Net capital losses, if any, are carried forward to future fiscal years and may be used to the extent allowed by the Code to offset any future capital gains. Losses that are carried forward will retain their character as either short-term or long-term capital losses. Utilization of capital loss carryforwards will reduce the requirement of future capital gains distributions.
The characterization of distributions to shareholders for financial reporting purposes is determined in accordance with federal income tax rules, which may differ from GAAP. The source of the Portfolio’s distributions may be shown in the accompanying financial statements as either from distributable earnings or capital. Certain components of the Portfolio’s net assets on the Consolidated Statement of Assets and Liabilities reflect permanent GAAP/tax differences based on the appropriate tax character.
F. Foreign Currency Translation — The accounting records and reporting currency of the Portfolio are maintained in U.S. dollars. Assets and liabilities denominated in foreign currencies are translated into U.S. dollars using the current exchange rates at the close of each business day. The effect of changes in foreign currency exchange rates on investments is included within net realized and unrealized gain (loss) on investments. Changes in the value of other assets and liabilities as a result of fluctuations in foreign exchange rates are included in the Consolidated Statement of Operations within net change in unrealized gain (loss) on foreign currency translation. Transactions denominated in foreign currencies are translated into U.S. dollars on the date the transaction occurred, the effects of which are included within net realized gain (loss) on foreign currency transactions.
| | |
| 3. INVESTMENTS AND FAIR VALUE MEASUREMENTS | | |
U.S. GAAP defines the fair value of a financial instrument as the amount that would be received to sell an asset or paid to transfer a liability in an orderly transaction between market participants at the measurement date (i.e., the exit price); the Portfolio’s policy is to use the market approach. GAAP establishes a fair value hierarchy that prioritizes the inputs to valuation techniques used to measure fair value. The hierarchy gives the highest priority to unadjusted quoted prices in active markets for identical assets or liabilities (Level 1 measurements) and the lowest priority to unobservable inputs (Level 3 measurements). The levels used for classifying investments are not necessarily an indication of the risk associated with investing in these investments. The three levels of the fair value hierarchy are described below:
Level 1 — Unadjusted quoted prices in active markets that are accessible at the measurement date for identical, unrestricted assets or liabilities;
Level 2 — Quoted prices in markets that are not active or financial instruments for which significant inputs are observable (including, but not limited to, quoted prices for similar investments, interest rates, foreign exchange rates, volatility and credit spreads), either directly or indirectly;
Level 3 — Prices or valuations that require significant unobservable inputs (including GSAM’s assumptions in determining fair value measurement).
The Board of Trustees (“Trustees”) has approved Valuation Procedures that govern the valuation of the portfolio investments held by the Portfolio, including investments for which market quotations are not readily available. The Trustees have delegated to GSAMday-to-day responsibility for implementing and maintaining internal controls and procedures related to the valuation of the Portfolio’s investments. To assess the continuing appropriateness of pricing sources and methodologies, GSAM regularly performs price verification procedures and issues challenges as necessary to third party pricing vendors or brokers, and any differences are reviewed in accordance with the Valuation Procedures.
25
GOLDMAN SACHS TACTICAL TILT OVERLAY FUND
Notes to Consolidated Financial Statements(continued)
February 28, 2019 (Unaudited)
|
| 3. INVESTMENTS AND FAIR VALUE MEASUREMENTS (continued) |
A. Level 1 and Level 2 Fair Value Investments — The valuation techniques and significant inputs used in determining the fair values for investments classified as Level 1 and Level 2 are as follows:
Equity Securities — Equity securities traded on a United States (“U.S.”) securities exchange or the NASDAQ system, or those located on certain foreign exchanges, including but not limited to the Americas, are valued daily at their last sale price or official closing price on the principal exchange or system on which they are traded. If there is no sale or official closing price or such price is believed by GSAM to not represent fair value, equity securities are valued at the last bid price for long positions and at the last ask price for short positions. To the extent these investments are actively traded, they are classified as Level 1 of the fair value hierarchy, otherwise they are generally classified as Level 2.
Unlisted equity securities for which market quotations are available are valued at the last sale price on the valuation date, or if no sale occurs, at the last bid price, and are generally classified as Level 2. Securities traded on certain foreign securities exchanges are valued daily at fair value determined by an independent fair value service (if available) under Valuation Procedures approved by the Trustees and consistent with applicable regulatory guidance. The independent fair value service takes into account multiple factors including, but not limited to, movements in the securities markets, certain depositary receipts, futures contracts and foreign currency exchange rates that have occurred subsequent to the close of the foreign securities exchange. These investments are generally classified as Level 2 of the fair value hierarchy.
Private investments — Private investments may include, but are not limited to, investments in private equity or debt instruments. The investment manager estimates the fair value of private investments based upon various factors, including, but not limited to, transactions in similar instruments, completed or pending third-party transactions in underlying investments or comparable entities, subsequent rounds of financing, recapitalizations, and other transactions across the capital structure, offerings in equity or debt capital markets, and changes in current and projected financial ratios or cash flows.
Underlying Funds (including Money Market Funds) — Underlying funds (“Underlying Funds”) include other investment companies and exchange-traded funds (“ETFs”). Investments in the Underlying Funds (except ETFs) are valued at the NAV per share on the day of valuation. ETFs are valued daily at the last sale price or official closing price on the principal exchange or system on which the investment is traded. Because the Portfolio invest in Underlying Funds that fluctuate in value, the Portfolio’s shares will correspondingly fluctuate in value. To the extent these investments are actively traded, they are classified as Level 1 of the fair value hierarchy, otherwise they are generally classified as Level 2. For information regarding an Underlying Fund’s accounting policies and investment holdings, please see the Underlying Fund’s shareholder report.
Debt Securities — Debt securities for which market quotations are readily available are valued daily on the basis of quotations supplied by dealers or an independent pricing service approved by the Trustees. The pricing services may use valuation models or matrix pricing, which consider: (i) yield or price with respect to bonds that are considered comparable in characteristics such as rating, interest rate and maturity date or (ii) quotations from securities dealers to determine current value. With the exception of treasury securities of G8 countries, which are generally classified as Level 1, these investments are generally classified as Level 2 of the fair value hierarchy.
Derivative Contracts — A derivative is an instrument whose value is derived from underlying assets, indices, reference rates or a combination of these factors. The Portfolio enters into derivative transactions to hedge against changes in interest rates, securities prices, and/or currency exchange rates, to increase total return, or to gain access to certain markets or attain exposure to other underliers.
Exchange-traded derivatives, including futures and options contracts, are generally valued at the last sale or settlement price on the exchange where they are principally traded. Exchange-traded options without settlement prices are generally valued at the midpoint of the bid and ask prices on the exchange where they are principally traded (or, in the absence of two-way trading, at the last bid price for long positions and the last ask price for short positions). Exchange-traded derivatives typically fall within Level 1 of the fair value hierarchy.Over-the-counter (“OTC”) and centrally cleared derivatives are valued using market transactions and other market evidence, including market-based inputs to models, calibration to market-clearing transactions, broker or dealer quotations, or other alternative pricing sources. Where models are used, the selection of a particular model to value OTC and
26
GOLDMAN SACHS TACTICAL TILT OVERLAY FUND
|
| 3. INVESTMENTS AND FAIR VALUE MEASUREMENTS (continued) |
centrally cleared derivatives depends upon the contractual terms of, and specific risks inherent in, the instrument, as well as the availability of pricing information in the market. Valuation models require a variety of inputs, including contractual terms, market prices, yield curves, credit curves, measures of volatility, voluntary and involuntary prepayment rates, loss severity rates and correlations of such inputs. For OTC and centrally cleared derivatives that trade in liquid markets, model inputs can generally be verified and model selection does not involve significant management judgment. OTC and centrally cleared derivatives are classified within Level 2 of the fair value hierarchy when significant inputs are corroborated by market evidence.
i. Forward Contracts — A forward contract is a contract between two parties to buy or sell an asset at a specified price on a future date. A forward contract settlement can occur on a cash or delivery basis. Forward contracts aremarked-to-market daily using independent vendor prices, and the change in value, if any, is recorded as an unrealized gain or loss. Cash and certain investments may be used to collateralize forward contracts.
Aforward foreign currency exchange contractis a forward contract in which the Portfolio agrees to receive or deliver a fixed quantity of one currency for another, at apre-determined price at a future date. All forward foreign currency exchange contracts aremarked-to-market daily at the applicable forward rate.Non-deliverable forward foreign currency exchange contracts are settled with the counterparty in cash without the delivery of foreign currency.
ii. Futures Contracts — Futures contracts are contracts to buy or sell a standardized quantity of a specified commodity or security. Upon entering into a futures contract, the Portfolio deposits cash or securities in an account on behalf of the broker in an amount sufficient to meet the initial margin requirement. Subsequent payments are made or received by the Portfolio equal to the daily change in the contract value and are recorded as variation margin receivable or payable with a corresponding offset to unrealized gains or losses. For financial reporting purposes, cash collateral that has been pledged to cover obligations of the Portfolio and cash collateral received, if any, is reported separately on the Consolidated Statement of Assets and Liabilities as receivables/payables for collateral on certain derivative contracts.Non-cash collateral pledged by the Portfolio, if any, is noted in the Consolidated Schedule of Investments.
iii. Options — When the Portfolio writes call or put options, an amount equal to the premium received is recorded as a liability and is subsequentlymarked-to-market to reflect the current value of the option written. Swaptions are options on interest rate swap contracts.
Upon the purchase of a call option or a put option by the Portfolio, the premium paid is recorded as an investment and subsequentlymarked-to-market to reflect the current value of the option. Certain options may be purchased with premiums to be determined on a future date. The premiums for these options are based upon implied volatility parameters at specified terms.
iv. Swap Contracts — Bilateral swap contracts are agreements in which the Portfolio and a counterparty agree to exchange periodic payments on a specified notional amount or make a net payment upon termination. Bilateral swap transactions are privately negotiated in the OTC market and payments are settled through direct payments between the Portfolio and the counterparty. By contrast, certain swap transactions are subject to mandatory central clearing. These swaps are executed through a derivatives clearing member (“DCM”), acting in an agency capacity, and submitted to a central counterparty (“CCP”) (“centrally cleared swaps”), in which case all payments are settled with the CCP through the DCM. Swaps aremarked-to-market daily using pricing vendor quotations, counterparty or clearinghouse prices or model prices, and the change in value, if any, is recorded as an unrealized gain or loss. Upon entering into a swap contract, the Portfolio is required to satisfy an initial margin requirement by delivering cash or securities to the counterparty (or in some cases, segregated in a triparty account on behalf of the counterparty), which can be adjusted by anymark-to-market gains or losses pursuant to bilateral or centrally cleared arrangements. For centrally cleared swaps the daily change in valuation, if any, is recorded as a receivable or payable for variation margin.
Aninterest rate swap is an agreement that obligates two parties to exchange a series of cash flows at specified intervals, based upon or calculated by reference to changes in interest rates on a specified notional principal amount. The payment flows are usually netted against each other, with the difference being paid by one party to the other.
27
GOLDMAN SACHS TACTICAL TILT OVERLAY FUND
Notes to Consolidated Financial Statements(continued)
February 28, 2019 (Unaudited)
|
| 3. INVESTMENTS AND FAIR VALUE MEASUREMENTS (continued) |
Acredit default swap is an agreement that involves one party (the buyer of protection) making a stream of payments to another party (the seller of protection) in exchange for the right to receive protection on a reference security or obligation, including a group of assets or exposure to the performance of an index. The Portfolio’s investment in credit default swaps may involve greater risks than if the Portfolio had invested in the referenced obligation directly. Credit events are contract specific but may include bankruptcy, failure to pay, restructuring and obligation acceleration. If the Portfolio buys protection through a credit default swap and no credit event occurs, its payments are limited to the periodic payments previously made to the counterparty. Upon the occurrence of a specified credit event, the Portfolio, as a buyer of credit protection, is entitled to receive an amount equal to the notional amount of the swap and deliver to the seller the defaulted reference obligation in a physically settled trade. The Portfolio may also receive a net settlement amount in the form of cash or securities equal to the notional amount of the swap reduced by the recovery value of the reference obligation in a cash settled trade.
As a seller of protection, the Portfolio generally receives a payment stream throughout the term of the swap, provided that there is no credit event. In addition, if the Portfolio sells protection through a credit default swap, the Portfolio could suffer a loss because the value of the referenced obligation and the premium payments received may be less than the notional amount of the swap paid to the buyer of protection. Upon the occurrence of a specified credit event, the Portfolio, as a seller of credit protection, may be required to take possession of the defaulted reference obligation and pay the buyer an amount equal to the notional amount of the swap in a physically settled trade. The Portfolio may also pay a net settlement amount in the form of cash or securities equal to the notional amount of the swap reduced by the recovery value of the reference obligation in a cash settled trade. Recovery values are at times established through the credit event auction process in which market participants are ensured that a transparent price has been set for the defaulted security or obligation. In addition, the Portfolio is entitled to a return of any assets, which have been pledged as collateral to the counterparty upon settlement.
The maximum potential amount of future payments (undiscounted) that the Portfolio as seller of protection could be required to make under a credit default swap would be an amount equal to the notional amount of the agreement. These potential amounts would be partially offset by any recovery values of the respective referenced obligations or net amounts received from a settlement of a credit default swap for the same reference security or obligation where the Portfolio bought credit protection.
Atotal return swap is an agreement that gives the Portfolio the right to receive the appreciation in value of a specified security, basket of investments or indices, index or other instrument in return for a fee paid to the counterparty, which will typically be an agreed upon interest rate. If the underlying asset declines in value over the term of the swap, the Portfolio may also be required to pay the dollar value of that decline to the counterparty.
B. Level 3 Fair Value Investments — To the extent that significant inputs to valuation models and other alternative pricing sources are unobservable, or if quotations are not readily available, or if GSAM believes that such quotations do not accurately reflect fair value, the fair value of the Portfolio’s investments may be determined under Valuation Procedures approved by the Trustees. GSAM, consistent with its procedures and applicable regulatory guidance, may make an adjustment to the most recent valuation prices of either domestic or foreign securities in light of significant events to reflect what it believes to be the fair value of the securities at the time of determining the Portfolio’s NAV.
28
GOLDMAN SACHS TACTICAL TILT OVERLAY FUND
|
| 3. INVESTMENTS AND FAIR VALUE MEASUREMENTS (continued) |
C. Fair Value Hierarchy — The following is a summary of the Portfolio’s investments and derivatives classified in the fair value hierarchy as of February 28, 2019:
| | | | | | | | | | | | |
| | | |
TACTICAL TILT OVERLAY
| | | | | | | | | | | | |
| | | |
| Investment Type | | Level 1 | | | Level 2 | | | Level 3 | |
| | | |
| Assets | | | | | | | | | | | | |
| | | |
Common Stock and/or Other Equity Investments(a) | | | | | | | | | | | | |
| | | |
North America | | $ | — | | | $ | 786,255 | | | $ | — | |
| | | |
Exchange Traded Funds | | | 267,818,085 | | | | — | | | | — | |
| | | |
Investment Companies | | | 1,045,517,370 | | | | — | | | | — | |
| | | |
Short-term Investments | | | — | | | | 2,367,738,847 | | | | — | |
| | | |
Securities Lending Reinvestment Vehicle | | | 111,866,493 | | | | — | | | | — | |
| | | |
| Total | | $ | 1,425,201,948 | | | $ | 2,368,525,102 | | | $ | — | |
| | | |
| Derivative Type | | | | | | | | | |
| | | |
| Assets | | | | | | | | | | | | |
| | | |
Forward Foreign Currency Exchange Contracts(b) | | $ | — | | | $ | 13,239,014 | | | $ | — | |
| | | |
Futures Contracts(b) | | | 46,499,235 | | | | — | | | | — | |
| | | |
Total Return Swap Contracts(b) | | | — | | | | 25,912,796 | | | | — | |
| | | |
Options Purchased | | | 17,678,400 | | | | 12,901,328 | | | | — | |
| | | |
| Total | | $ | 64,177,635 | | | $ | 52,053,138 | | | $ | — | |
| | | |
| Liabilities | | | | | | | | | | | | |
| | | |
Forward Foreign Currency Exchange Contracts(b) | | $ | — | | | $ | (4,147,955 | ) | | $ | — | |
| | | |
Futures Contracts(b) | | | (6,006,860 | ) | | | — | | | | — | |
| | | |
Written Options Contracts | | | (9,875,520 | ) | | | (622 | ) | | | — | |
| | | |
| Total | | $ | (15,882,380 | ) | | $ | (4,148,577 | ) | | $ | — | |
| (a) | | Amounts are disclosed by continent to highlight the impact of time zone differences between local market close and the calculation of net asset value. Security valuations are based on the principal exchange or system on which they are traded, which may differ from country of domicile. The Portfolio utilizes fair value model prices provided by an independent fair value service for international equities, resulting in a Level 2 classification. |
| (b) | | Amount shown represents unrealized gain (loss) at period end. |
For further information regarding security characteristics, see the Consolidated Schedule of Investments.
29
GOLDMAN SACHS TACTICAL TILT OVERLAY FUND
Notes to Consolidated Financial Statements(continued)
February 28, 2019 (Unaudited)
|
| 4. INVESTMENTS IN DERIVATIVES |
The following tables set forth, by certain risk types, the gross value of derivative contracts (not considered to be hedging instruments for accounting disclosure purposes) as of February 28, 2019. These instruments were used as part of the Portfolio’s investment strategies and to obtain and/or manage exposure related to the risks below. The values in the tables below exclude the effects of cash collateral received or posted pursuant to these derivative contracts, and therefore are not representative of the Portfolio’s net exposure.
| | | | | | | | | | | | |
| Risk | | Consolidated Statement of Assets
and Liabilities | | Assets | | | Consolidated Statement of Assets
and Liabilities | | Liabilities | |
Interest rate | | — | | $ | — | | | Variation margin on futures contracts | | $ | (1,203,402) | (a) |
Currency | | Receivable for unrealized gain on forward foreign currency exchange contracts | | | 13,239,014 | | | Payable for unrealized loss on forward foreign currency exchange contracts | | | (4,147,955) | |
Commodity | | Purchased Options, at value | | | 17,678,400 | | | Written Options, at Value | | | (9,875,520) | |
Equity | | Variation margin on futures contracts; Receivable for unrealized gain on swap contracts; Purchased options, at value | | | 85,313,359 | (a) | | Variation margin on futures contracts; Written options, at value | | | (4,804,080) | (a) |
| Total | | | | $ | 116,230,773 | | | | | $ | (20,030,957) | |
| (a) | | Includes unrealized gain (loss) on futures contracts described in the Additional Investment Information sections of the Consolidated Schedule of Investments. Only current day’s variation margin is reported within the Consolidated Statement of Assets and Liabilities. |
The following tables set forth, by certain risk types, the Portfolio’s gains (losses) related to these derivatives and their indicative volumes for the six months ended February 28, 2019. These gains (losses) should be considered in the context that these derivative contracts may have been executed to create investment opportunities and/or economically hedge certain investments, and accordingly, certain gains (losses) on such derivative contracts may offset certain (losses) gains attributable to investments. These gains (losses) are included in “Net realized gain (loss)” or “Net change in unrealized gain (loss)” on the Consolidated Statement of Operations:
| | | | | | | | | | | | | | |
| Risk | | Consolidated Statement of Operations | | Net Realized
Gain (Loss) | | | Net Change in
Unrealized
Gain (Loss) | | | Average
Number of
Contracts(a) | |
| Interest rate | | Net realized gain (loss) from futures contracts and swap contracts /Net change in unrealized gain (loss) on futures contracts and swap contracts | | $ | 19,195,185 | | | $ | (899,839 | ) | | | 11,289 | |
| Credit | | Net realized gain (loss) from swap contracts/Net change in unrealized gain (loss) on swap contracts | | | 9,603,607 | | | | (7,764,545 | ) | | | 1 | |
| Commodity | | Net realized gain (loss) from purchased options and written options /Net change in unrealized gain (loss) on purchased options and written options | | | 19,619,536 | | | | (1,399,520 | ) | | | 2 | |
| Currency | | Net realized gain (loss) from forward foreign currency exchange contracts/Net change in unrealized gain (loss) on forward foreign currency exchange contracts | | | (9,899,572 | ) | | | 29,144,995 | | | | 9 | |
| Equity | | Net realized gain (loss) from futures contracts, purchased options and written options/Net change in unrealized gain (loss) on swap contracts, futures contracts, purchased options and written options | | | (71,370,985 | ) | | | 70,970,270 | | | | 16,270 | |
| Total | | | | $ | (32,852,229 | ) | | $ | 90,051,361 | | | | 27,571 | |
| (a) | | Average number of contracts is based on the average of month end balances for the six months ended February 28, 2019. |
30
GOLDMAN SACHS TACTICAL TILT OVERLAY FUND
|
| 4. INVESTMENTS IN DERIVATIVES (continued) |
In order to better define its contractual rights and to secure rights that will help the Portfolio mitigate its counterparty risk, the Portfolio may enter into an International Swaps and Derivatives Association, Inc. Master Agreement (“ISDA Master Agreement”) or similar agreement with its derivatives counterparties. An ISDA Master Agreement is a bilateral agreement between the Portfolio and a counterparty that governs OTC derivatives (including forward foreign currency exchange contracts, and certain options and swaps), and typically contains, among other things, collateral posting terms and netting provisions in the event of a default and/or termination event. The provisions of the ISDA Master Agreement typically permit a single net payment in the event of a default(close-out netting) or similar event, including the bankruptcy or insolvency of the counterparty.
Collateral and margin requirements differ between exchange traded derivatives and OTC derivatives. Margin requirements are established by the broker or clearing house for exchange-traded and centrally cleared derivatives (financial futures contracts, options and centrally cleared swaps) pursuant to governing agreements for those instrument types. Brokers can ask for margin in excess of the minimum in certain circumstances. Collateral terms are contract-specific for OTC derivatives. For derivatives traded under an ISDA Master Agreement, the collateral requirements are typically calculated by netting the marked to market amount for each transaction under such agreement and comparing that amount to the value of any collateral currently pledged by the Portfolio and the counterparty. Additionally, the Portfolio may be required to post initial margin to the counterparty, the terms of which would be outlined in the confirmation of the OTC transaction.
For financial reporting purposes, cash collateral that has been pledged to cover obligations of the Portfolio and cash collateral received from the counterparty, if any, is reported separately on the Consolidated Statement of Assets and Liabilities as receivables/payables for collateral on certain derivative contracts.Non-cash collateral pledged by the Portfolio, if any, is noted in the Schedules of Investments. Generally, the amount of collateral due from or to a counterparty must exceed a minimum transfer amount threshold before a transfer is required to be made. To the extent amounts due to the Portfolio from its counterparties are not fully collateralized, contractually or otherwise, the Portfolio bears the risk of loss from counterparty nonperformance. The Portfolio attempts to mitigate counterparty risk by only entering into agreements with counterparties that the Investment Adviser believes to be of good standing and by monitoring the financial stability of those counterparties.
Additionally, the netting of assets and liabilities and the offsetting of collateral pledged or received are based on contractualnetting/set-off provisions in the ISDA Master Agreement or similar agreements. However, in the event of a default or insolvency of a counterparty, a court could determine that such rights are not enforceable due to the restrictions or prohibitions against the right of setoff that may be imposed in accordance with a particular jurisdiction’s bankruptcy or insolvency laws.
The following tables set forth the Portfolio’s net exposure for derivative instruments that are subject to enforceable master netting arrangements or similar agreements as of February 28, 2019:
| | | | | | | | | | | | | | | | | | | | | | | | | | | | | | | | | | | | | | | | |
| | | Derivative Assets(a) | | | Derivative Liabilities(a) | | | | | | | | | | |
| Counterparty | | Options
Purchased | | | Swaps | | | Forward
Currency
Contracts | | | Total | | | Forward
Currency
Contracts | | | Options
Written | | | Total | | | Net Derivative
Asset
(Liabilities) | | | Collateral
(Received)
Pledged(a) | | | Net
Amount(b) | |
Citibank NA | | $ | 7,792,815 | | | $ | 15,427,675 | | | $ | — | | | $ | 23,220,490 | | | $ | — | | | $ | (622 | ) | | $ | (622 | ) | | $ | 23,219,868 | | | $ | (20,700,000 | ) | | $ | 2,519,868 | |
JPMorgan Securities, Inc. | | | — | | | | 1,614,149 | | | | — | | | | 1,614,149 | | | | — | | | | — | | | | — | | | | 1,614,149 | | | | — | | | | 1,614,149 | |
MS & Co. Int. PLC | | | — | | | | — | | | | 13,239,014 | | | | 13,239,014 | | | | (4,147,955 | ) | | | — | | | | (4,147,955 | ) | | | 9,091,059 | | | | — | | | | 9,091,059 | |
UBS AG (London) | | | 5,108,513 | | | | 8,870,972 | | | | — | | | | 13,979,485 | | | | — | | | | — | | | | — | | | | 13,979,485 | | | | (11,690,000 | ) | | | 2,289,485 | |
| | | | | | | | | | |
Total | | $ | 12,901,328 | | | $ | 25,912,796 | | | $ | 13,239,014 | | | $ | 52,053,138 | | | $ | (4,147,955 | ) | | $ | (622 | ) | | $ | (4,148,577 | ) | | $ | 47,904,561 | | | $ | (32,390,000 | ) | | $ | 15,514,561 | |
| (a) | | Gross amounts available for offset but not netted in the Consolidated Statement of Assets and Liabilities. |
| (b) | | Net amount represents the net amount due (to) from counterparty in the event of a default based on the contractualset-off rights under the agreement. Net amount excludes any over-collateralized amounts. |
31
GOLDMAN SACHS TACTICAL TILT OVERLAY FUND
Notes to Consolidated Financial Statements(continued)
February 28, 2019 (Unaudited)
|
| 5. AGREEMENTS AND AFFILIATED TRANSACTIONS |
A. Management Agreement — Under the Agreement, GSAM manages the Portfolio, subject to the general supervision of the Trustees.
As compensation for the services rendered pursuant to the Agreement, the assumption of the expenses related thereto and administration of the Portfolio’s business affairs, including providing facilities, GSAM is entitled to a management fee, accrued daily and paid monthly, equal to an annual percentage rate of each Portfolio’s average daily net assets.
For the six months ended February 28, 2019, contractual and effective net management fees with GSAM were at the following rates:
| | | | | | | | | | | | | | | | | | | | | | |
| Contractual Management Rate | | | Effective
Management
Fee Rate | | | Effective Net
Management
Fee Rate*^(a) | |
First
$2 billion | | | Next
$3 billion | | | Next
$3 billion | | | Over
$8 billion | |
| | 0.75% | | | | 0.68% | | | | 0.64% | | | | 0.62% | | | | 0.71% | | | | 0.65% | |
| * | | GSAM has agreed to waive a portion of its management fee payable by the Portfolio in an amount equal to any management fee it earns as an investment adviser to any of the affiliated funds in which the Portfolio invests through at least December 28, 2019. Prior to such date GSAM may not terminate the arrangement without the approval of the Trustees. |
| ^ | | Effective Net Management Rate includes the impact of management fee waivers of affiliated underlying funds, if any. |
| (a) | | Reflects combined management fees paid to GSAM under the Agreement and the Subsidiary Agreement as defined below after waivers. |
The Portfolio invests in Institutional Shares of the Goldman Sachs Financial Square Government Fund (“Government Money Market Fund”), Class R6 Shares of the Goldman Sachs High Yield Floating Rate Fund and the Goldman Sachs MLP Energy Infrastructure Fund, which are affiliated Underlying Funds. GSAM has agreed to waive a portion of its management fee payable by the Portfolio in an amount equal to the management fee it earns as an investment adviser to the affiliated Underlying Funds in which the Portfolio invests, except those management fees it earns from the Portfolio’s investment of cash collateral received in connection with securities lending transactions in the Government Money Market Fund. For the six months ended February 28, 2019, GSAM waived $1,167,611 of the Portfolio’s management fee.
GSAM also provides management services to the Subsidiary pursuant to a Subsidiary Management Agreement (the “Subsidiary Agreement”) and is entitled to a management fee accrued daily and paid monthly, equal to an annual percentage rate of 0.42% of the Subsidiary’s average daily net assets. In consideration of the Subsidiary’s management fee, and for as long as the Subsidiary Agreement remains in effect, GSAM has contractually agreed to waive irrevocably a portion of the Portfolio’s management fee in an amount equal to the management fee accrued and paid to GSAM by the Subsidiary under the Subsidiary Agreement. For the six months ended February 28, 2019, GSAM waived $774,916 of the Portfolio’s management fee. This waiver represents an inter-fund transaction and, accordingly, has been eliminated in consolidation.
B. Transfer Agency Agreement — Goldman Sachs also serves as the transfer agent of the Portfolio for a fee pursuant to the Transfer Agency Agreement. The fees charged for such transfer agency services are accrued daily and paid monthly at annual rates of 0.04% of the average daily net assets of Institutional Shares and 0.03% of the average daily net assets of Class P Shares and Class R6 Shares.
C. Other Expense Agreements and Affiliated Transactions — GSAM has agreed to limit certain “Other Expenses” of the Portfolio (excluding acquired fund fees and expenses, transfer agency fees and expenses, taxes, interest, brokerage fees, expenses of shareholder meetings, litigation and indemnification, and extraordinary expenses) to the extent such expenses exceed, on an annual basis, a percentage rate of the average daily net assets of the Portfolio. Such Other Expense reimbursements, if any, are accrued daily and paid monthly. In addition, the Portfolio is not obligated to reimburse GSAM for prior fiscal year expense reimbursements, if any. The Other Expense limitations as an annual percentage rate of average daily net assets for the Portfolio are 0.164%. These Other Expense limitations will remain in place through at least December 28, 2019 and prior to such date GSAM may not terminate the arrangements without the approval of the Trustees. In addition, the Portfolio has entered into certain offset arrangements with the transfer agent, which may result in a reduction of the Portfolio’s expenses and are received irrespective of the application of the “Other Expense” limitations described above.
32
GOLDMAN SACHS TACTICAL TILT OVERLAY FUND
|
| 5. AGREEMENTS AND AFFILIATED TRANSACTIONS (continued) |
For the six months ended February 28, 2019, these expense reductions, including any fee waivers and Other Expense reimbursements, were as follows:
| | | | | | | | | | |
Management
Fee Waiver | | | Other Expense
Reimbursements | | | Total Expense
Reductions | |
| $ | 1,167,611 | | | $ | 21,779 | | | $ | 1,189,390 | |
D. Line of Credit Facility — As of February 28, 2019, the Portfolio participated in a $770,000,000 committed, unsecured revolving line of credit facility (the “facility”) together with other funds of the Trust and certain registered investment companies having management agreements with GSAM or its affiliates. This facility is to be used for temporary emergency purposes, or to allow for an orderly liquidation of securities to meet redemption requests. The interest rate on borrowings is based on the federal funds rate. The facility also requires a fee to be paid by the Portfolio based on the amount of the commitment that has not been utilized. For the six months ended February 28, 2019, the Portfolio did not have any borrowings under the facility
E. Other Transactions with Affiliates — For the six months ended February 28, 2019, Goldman Sachs earned $176,859 in brokerage commissions from portfolio transactions, including futures transactions executed with Goldman Sachs as the Futures Commission Merchant, on behalf of the Portfolio.
The table below shows the transactions in and earnings from investments in the Underlying Funds for the six months ended February 28, 2019:
| | | | | | | | | | | | | | | | | | | | | | | | | | | | | | | | |
Affiliated Investment
Companies | | Beginning Value
as of August 31,
2018 | | | Purchases
at Cost | | | Proceeds
from Sales | | | Net Realized
Gain (Loss) on
Sales of
Affiliated
Investment
Companies | | | Change in Unrealized
Appreciation/ (Depreciation) | | | Ending Value as
of February 28,
2019 | | | Shares as of
February 28,
2019 | | | Dividend
Income
from Affiliated
Investment
Companies | |
Goldman Sachs Financial Square Government Fund | | $ | 1,323,638,062 | | | $ | 1,701,296,037 | | | $ | (2,090,729,486 | ) | | $ | — | | | $ | — | | | $ | 934,204,613 | | | | 934,204,613 | | | $ | 10,963,522 | |
Goldman Sachs High Yield Floating Rate Fund | | | 149,250,733 | | | | — | | | | (149,932,602 | ) | | | 681,869 | | | | — | | | | — | | | | — | | | | 945,765 | |
Goldman Sachs MLP Energy Infrastructure Fund | | | 93,710,816 | | | | 50,594,543 | | | | (20,000,000 | ) | | | (3,985,962 | ) | | | (9,006,640 | ) | | | 111,312,757 | | | | 16,865,569 | | | | 4,594,543 | |
| | | | | | | | |
Total | | $ | 1,566,599,611 | | | $ | 1,751,890,580 | | | $ | (2,260,662,088 | ) | | $ | (3,304,093 | ) | | $ | (9,006,640 | ) | | $ | 1,045,517,370 | | | | 951,070,182 | | | $ | 16,503,830 | |
|
| 6. PORTFOLIO SECURITIES TRANSACTIONS |
The cost of purchases and proceeds from sales and maturities of long-term securities for the six months ended February 28, 2019, were $127,874,996 and $392,374,352, respectively.
The Portfolio may lend its securities through a securities lending agent, the Bank of New York Mellon (“BNYM”), to certain qualified borrowers. In accordance with the Portfolio’s securities lending procedures, the Portfolio receives cash collateral at least equal to the market value of the securities on loan. The market value of the loaned securities is determined at the close of business of the Portfolio, at their last sale price or official closing price on the principal exchange or system on which they are traded, and any additional required collateral is delivered to the Portfolio on the next business day. As with other extensions of credit, the
33
GOLDMAN SACHS TACTICAL TILT OVERLAY FUND
Notes to Consolidated Financial Statements(continued)
February 28, 2019 (Unaudited)
|
| 7. SECURITIES LENDING (continued) |
Portfolio may experience delay in the recovery of its securities or incur a loss should the borrower of the securities breach its agreement with the Portfolio or become insolvent at a time when the collateral is insufficient to cover the cost of repurchasing securities on loan. Dividend income received from securities on loan may not be subject to withholding taxes and therefore withholding taxes paid may differ from the amounts listed in the Consolidated Statement of Operations. Loans of securities are terminable at any time and as such 1) the remaining contractual maturities of the outstanding securities lending transactions are considered to be overnight and continuous and 2) the borrower, after notice, is required to return borrowed securities within the standard time period for settlement of securities transactions.
The Portfolio invests the cash collateral received in connection with securities lending transactions in the Government Money Market Fund, an affiliated series of the Goldman Sachs Trust. The Government Money Market Fund is registered under the Act as an open end investment company, is subject to Rule2a-7 under the Act, and is managed by GSAM, for which GSAM may receive a management fee of up to 0.16% on an annualized basis of the average daily net assets of the Government Money Market Fund.
In the event of a default by a borrower with respect to any loan, BNYM may exercise any and all remedies provided under the applicable borrower agreement to make the Portfolio whole. These remedies include purchasing replacement securities by applying the collateral held from the defaulting broker against the purchase cost of the replacement securities. If BNYM is unable to purchase replacement securities, BNYM will indemnify the Portfolio by paying the Portfolio an amount equal to the market value of the securities loaned minus the value of cash collateral received from the borrower for the loan, subject to an exclusion for any shortfalls resulting from a loss of value in such cash collateral due to reinvestment risk. The Funds may enter into master netting agreements with borrowers, which provide the right, in the event of a default (including bankruptcy or insolvency), for thenon-defaulting party to liquidate the collateral and calculate net exposure to the defaulting party or request additional collateral. However, in the event of a default by a borrower, a resolution authority could determine that such rights are not enforceable due to the restrictions or prohibitions against the right ofset-off that may be imposed in accordance with a particular jurisdiction’s bankruptcy or insolvency laws. The Portfolio’s loaned securities were all subject to enforceable Securities Lending Agreements and the value of the collateral was at least equal to the value of the cash received. The amounts of the Portfolio’s overnight and continuous agreements, which represent the gross amounts of recognized liabilities for securities lending transactions outstanding as of February 28, 2019, which are disclosed as “Payable upon return of securities loaned” on the Consolidated Statement of Assets and Liabilities, where applicable.
Both the Portfolio and BNYM received compensation relating to the lending of the Portfolio’s securities. The amounts earned, if any, by the Portfolio’s for the six months ended February 28, 2019, are reported under Investment Income on the Consolidated Statement of Operations.
The following table provides information about the Portfolio’s investment in the Government Money Market Fund for the six months ended February 28, 2019.
| | | | | | | | | | |
Beginning Value as of August 31, 2018 | | Purchases
at Cost | | Proceeds
from Sales | | | Ending Value as of February 28, 2019 | |
| $256,405,265 | | $536,734,194 | | $ | (681,272,966 | ) | | $ | 111,866,493 | |
34
GOLDMAN SACHS TACTICAL TILT OVERLAY FUND
As of the Portfolio’s most recent fiscal year end, August 31, 2018, the Portfolio’s capital loss carryforwards and certain timing differences on a tax basis were as follows:
| | | | |
Capital loss carryforwards: | | | | |
Perpetual Short-Term | | $ | (182,973,140 | ) |
Perpetual Long-Term | | | (35,900,828 | ) |
| |
Total capital loss carryforwards | | $ | (218,873,968 | ) |
| |
Timing differences (Qualified Late Year Loss Deferral/Post October Loss Deferral) | | | (38,910,791 | ) |
As of February 28, 2019, the Portfolio’s aggregate security unrealized gains and losses based on cost for U.S. federal income tax purposes were as follows:
| | | | |
Tax Cost | | $ | 3,770,820,321 | |
Gross unrealized gain | | | 44,223,547 | |
Gross unrealized loss | | | (21,316,818 | ) |
Net unrealized gains on investments | | $ | 22,906,729 | |
The difference between GAAP-basis and tax basis unrealized gains (losses) is attributable primarily to wash sales, net mark to market gains/(losses) on regulated futures and option contracts, net mark to market gains/(losses) on foreign currency contracts, and differences in the tax treatment of underlying fund investments, and swap transactions.
GSAM has reviewed the Portfolio’s tax positions for all open tax years (the current and prior three years, as applicable) and
has concluded that no provision for income tax is required in the Portfolio’s financial statements. Such open tax years remain subject to examination and adjustment by tax authorities.
The Portfolio’s risks include, but are not limited to, the following:
Derivatives Risk — The Portfolio’s use of derivatives may result in loss. Derivative instruments, which may pose risks in addition to and greater than those associated with investing directly in securities, currencies or other instruments, may be illiquid or less liquid, volatile, difficult to price and leveraged so that small changes in the value of the underlying instruments may produce disproportionate losses to the Portfolio. Derivatives are also subject to counterparty risk, which is the risk that the other party in the transaction will not fulfill its contractual obligation. The use of derivatives is a highly specialized activity that involves investment techniques and risks different from those associated with investments in more traditional securities and instruments. Losses from derivatives can also result from a lack of correlation between changes in the value of derivative instruments and the portfolio assets (if any) being hedged.
Foreign and Emerging Countries Risk — Investing in foreign markets may involve special risks and considerations not typically associated with investing in the United States. Foreign securities may be subject to risk of loss because of more or less foreign government regulation, less public information and less economic, political and social stability in the countries in which the Portfolio invests. The imposition of exchange controls (including repatriation restrictions), confiscations, trade restrictions (including tariffs) and other government restrictions by the United States or other governments, or from problems in share registration, settlement or custody, may also result in losses. Foreign risk also involves the risk of negative foreign currency rate fluctuations, which may cause the value of securities denominated in such foreign currency (or other instruments through which the Portfolio has exposure to foreign currencies) to decline in value. Currency exchange rates may fluctuate significantly over short periods of time. To the extent that the Portfolio also invests in securities of issuers located in emerging markets, these risks may be more pronounced.
35
GOLDMAN SACHS TACTICAL TILT OVERLAY FUND
Notes to Consolidated Financial Statements(continued)
February 28, 2019 (Unaudited)
|
| 9. OTHER RISKS (continued) |
Foreign Custody Risk — If the Portfolio invests in foreign securities, the Portfolio may hold such securities and cash with foreign banks, agents, and securities depositories appointed by the Portfolio’s custodian (each a “Foreign Custodian”). Some foreign custodians may be recently organized or new to the foreign custody business. In some countries, Foreign Custodians may be subject to little or no regulatory oversight over, or independent evaluation of, their operations. Further, the laws of certain countries may place limitations on the Portfolio’s ability to recover its assets if a Foreign Custodian enters bankruptcy. Investments in emerging markets may be subject to even greater custody risks than investments in more developed markets. Custody services in emerging market countries are very often undeveloped and may be considerably less well regulated than in more developed countries, and thus may not afford the same level of investor protection as would apply in developed countries.
Geographic Risk — If the Portfolio focuses its investments in securities of issuers located in a particular country or geographic region, the Portfolio may be subjected, to a greater extent than if its investments were less focused, to the risks of volatile economic cycles and/or conditions and developments that may be particular to that country or region, such as: adverse securities markets; adverse exchange rates; adverse social, political, regulatory, economic, business, environmental or other developments; or natural disasters.
Interest Rate Risk — When interest rates increase, fixed income securities or instruments held by the Portfolio will generally decline in value. Long-term fixed income securities or instruments will normally have more price volatility because of this risk than short-term fixed income securities or instruments. The risks associated with changing interest rates may have unpredictable effects on the markets and the Portfolio’s investments. Fluctuations in interest rates may also affect the liquidity of fixed income securities and instruments held by the Portfolio.
Investments in Other Investment Companies Risk — As a shareholder of another investment company, including an ETF, the Portfolio will indirectly bear its proportionate share of any net management fees and other expenses paid by such other investment companies, in addition to the fees and expenses regularly borne by the Portfolio. ETFs are subject to risks that do not apply to conventional mutual funds, including but not limited to the following: (i) the market price of the ETF’s shares may trade at a premium or a discount to their NAV; and (ii) an active trading market for an ETF’s shares may not develop or be maintained.
Investments in the Underlying Funds Risk — The investments of a Portfolio are concentrated in the Underlying Funds, and the Portfolio’s investment performance is directly related to the investment performance of the Underlying Funds it holds. A Portfolio is subject to the risk factors associated with the investments of the Underlying Funds in direct proportion to the amount of assets allocated to each. A Portfolio that has a relative concentration of its portfolio in a single Underlying Fund may be more susceptible to adverse developments affecting that Underlying Fund, and may be more susceptible to losses because of these developments.
Large Shareholder Transactions Risk — The Portfolio may experience adverse effects when certain large shareholders, such as other funds, institutional investors (including those trading by use ofnon-discretionary mathematical formulas), financial intermediaries (who may make investment decisions on behalf of underlying clients and/or include the Portfolio in their investment model), individuals, accounts and Goldman Sachs affiliates, purchase or redeem large amounts of shares of a Portfolio. Such large shareholder redemptions, which may occur rapidly or unexpectedly, may cause the Portfolio to sell portfolio securities at times when it would not otherwise do so, which may negatively impact the Portfolio’s NAV and liquidity. These transactions may also accelerate the realization of taxable income to shareholders if such sales of investments resulted in gains, and may also increase transaction costs. In addition, a large redemption could result in the Portfolio’s current expenses being allocated over a smaller asset base, leading to an increase in the Portfolio’s expense ratio. Similarly, large Portfolio share purchases may adversely affect the Portfolio’s performance to the extent that the Portfolio is delayed in investing new cash or otherwise maintains a larger cash position than it ordinarily would.
Liquidity Risk — The Portfolio may make investments that are illiquid or that may become less liquid in response to market developments or adverse investor perceptions. Illiquid investments may be more difficult to value. Liquidity risk may also refer to the risk that the Portfolio will not be able to pay redemption proceeds within the allowable time period or without significant dilution to remaining investors’ interests because of unusual market conditions, an unusually high volume of redemption requests,
36
GOLDMAN SACHS TACTICAL TILT OVERLAY FUND
|
| 9. OTHER RISKS (continued) |
or other reasons. To meet redemption requests, the Portfolio may be forced to sell investments at an unfavorable time and/or under unfavorable conditions. If the Portfolio is forced to sell securities at an unfavorable time and/or under unfavorable conditions, such sales may adversely affect the Portfolio’s NAV and dilute remaining investors’ interests. Liquidity risk may be the result of, among other things, the reduced number and capacity of traditional market participants to make a market in fixed income securities or the lack of an active market. The potential for liquidity risk may be magnified by a rising interest rate environment or other circumstances where investor redemptions from fixed income mutual funds may be higher than normal, potentially causing increased supply in the market due to selling activity.
Market and Credit Risks — In the normal course of business, the Portfolio trades financial instruments and enters into financial transactions where risk of potential loss exists due to changes in the market (market risk). Additionally, the Portfolio may also be exposed to credit risk in the event that an issuer or guarantor fails to perform or that an institution or entity with which the Portfolio has unsettled or open transactions defaults.
Sector Risk— To the extent the Portfolio focuses its investments in securities of issuers in one or more sectors (such as the financial services or telecommunications sectors), the Portfolio may be subjected, to a greater extent than if its investments were diversified across different sectors, to the risks of volatile economic cycles and/or conditions and developments that may be particular to that sector, such as: adverse economic, business, political, environmental or other developments.
Tax Risk — The Portfolio will seek to gain exposure to the commodity markets primarily through investments in the Subsidiary and/or commodity index-linked structured notes, as applicable. Historically, the Internal Revenue Service (“IRS”) issued private letter rulings (“PLRs”) in which the IRS specifically concluded that income and gains from investments in commodity index-linked structured notes or a wholly-owned foreign subsidiary that invests in commodity-linked instruments are “qualifying income” for purposes of compliance with Subchapter M of the Code. The Portfolio has not received a PLR, and is not able to rely on PLRs issued to other taxpayers. Additionally, the IRS has suspended the granting of such PLRs, pending review of its position on this matter. The IRS also recently issued proposed regulations that, if finalized, would generally treat the Portfolio’s income inclusion with respect to a subsidiary as qualifying income only if there is a distribution out of the earnings and profits of a subsidiary that are attributable to such income inclusion. The proposed regulations, if adopted, would apply to taxable years beginning on or after 90 days after the regulations are published as final.
The IRS also recently issued a revenue procedure, which states that the IRS will not in the future issue PLRs that would require a determination of whether an asset (such as a commodity index-linked note) is a “security” under the Investment Company Act of 1940. The Portfolio has obtained an opinion of counsel that the Portfolio’s income from such investments should constitute “qualifying income.” However, no assurances can be provided that the IRS would not be able to successfully assert that the Portfolio’s income from such investments was not “qualifying income,” in which case the Portfolio would fail to qualify as a regulated investment company (“RIC”) under Subchapter M of the Code if over 10% of its gross income were derived from these investments. If the Portfolio failed to qualify as a RIC, it would be subject to federal and state income tax on all of its taxable income at regular corporate tax rates. This would significantly adversely affect the returns to, and could cause substantial losses for, Portfolio shareholders.
Under the Trust’s organizational documents, its Trustees, officers, employees and agents are indemnified, to the extent permitted by the Act and state law, against certain liabilities that may arise out of performance of their duties to the Portfolio. Additionally, in the course of business, the Portfolio enters into contracts that contain a variety of indemnification clauses. The Portfolio’s maximum exposure under these arrangements is unknown, as this would involve future claims that may be made against the Portfolio that have not yet occurred. However, GSAM believes the risk of loss under these arrangements to be remote.
37
GOLDMAN SACHS TACTICAL TILT OVERLAY FUND
Notes to Consolidated Financial Statements(continued)
February 28, 2019 (Unaudited)
Subsequent events after the Consolidated Statement of Assets and Liabilities date have been evaluated, and GSAM has concluded that there is no impact requiring adjustment or disclosure in the financial statements.
|
| 12. SUMMARY OF SHARE TRANSACTIONS |
Share activity is as follows:
| | | | | | | | | | | | | | | | |
| | | For the Six Months Ended
February 28, 2019
(Unaudited) | | | For the Fiscal Year Ended
August 31, 2018
| |
| | | Shares | | | Dollars | | | Shares | | | Dollars | |
| | | | |
| Institutional Shares | | | | | | | | | | | | | | | | |
Shares sold | | | 67,551 | | | $ | 658,000 | | | | 64,892,471 | | | $ | 637,795,407 | |
Reinvestment of distributions | | | — | | | | — | | | | 4,617,332 | | | | 45,296,029 | |
Shares redeemed | | | (20,336 | ) | | | (202,299 | ) | | | (606,120,936 | ) | | | (5,988,362,486 | ) |
| | | | 47,215 | | | | 455,701 | | | | (536,611,133 | ) | | | (5,305,271,050 | ) |
| Class P Shares(a) | | | | | | | | | | | | | | | | |
Shares sold | | | 35,686,796 | | | | 345,879,503 | | | | 424,051,472 | | | | 4,196,560,752 | |
Reinvestment of distributions | | | 9,554,538 | | | | 88,570,565 | | | | — | | | | — | |
Shares redeemed | | | (103,250,152 | ) | | | (995,300,733 | ) | | | (14,020,559 | ) | | | (138,742,662 | ) |
| | | | (58,008,818 | ) | | | (560,850,665 | ) | | | 410,030,913 | | | | 4,057,818,090 | |
| Class R6 Shares(b) | | | | | | | | | | | | | | | | |
Shares sold | | | 2,231,619 | | | | 21,791,364 | | | | 35,922,228 | | | | 353,326,960 | |
Reinvestment of distributions | | | 983,963 | | | | 9,121,338 | | | | — | | | | — | |
Shares redeemed | | | (5,245,264 | ) | | | (49,310,008 | ) | | | (1,118,849 | ) | | | (10,877,406 | ) |
| | | | (2,029,682 | ) | | | (18,397,306 | ) | | | 34,803,379 | | | | 342,449,554 | |
| | | | |
NET DECREASE | | | (59,991,285 | ) | | $ | (578,792,270 | ) | | | (91,776,841 | ) | | $ | (905,003,406 | ) |
| (a) | | Commenced operations on April 17, 2018. |
| (b) | | Commenced operations on December 29, 2017. |
38
GOLDMAN SACHS TACTICAL TILT OVERLAY FUND
| | |
| | |
Portfolio Expenses — Six Month Period Ended February 28, 2019 (Unaudited) | | |
As a shareholder of Institutional, Class P and Class R6 Shares of the Portfolio, you incur two types of costs: (1) transaction costs and (2) ongoing costs, including management fees and other Portfolio expenses. This example is intended to help you understand your ongoing costs (in dollars) of investing in the Institutional, Class P and Class R6 Shares of the Portfolio and to compare these costs with the ongoing costs of investing in other mutual funds.
The example is based on an investment of $1,000 invested at the beginning of the period and held for the entire period from September 1, 2018 through February 28, 2019, which represents a period of 181 days in a365-day year.
Actual Expenses — The first line in the table below provides information about actual account values and actual expenses. You may use the information in this line, together with the amount you invested, to estimate the expenses that you paid over the period. Simply divide your account value by $1,000 (for example, an $8,600 account value divided by $1,000=8.6), then multiply the result by the number in the first line under the heading entitled “Expenses Paid” to estimate the expenses you paid on your account during this period.
Hypothetical Example for Comparison Purposes — The second line in the table below provides information about hypothetical account values and hypothetical expenses based on the Portfolio’s actual net expense ratios and an assumed rate of return of 5% per year before expenses, which is not the Portfolio’s actual return. The hypothetical account values and expenses may not be used to estimate the actual ending account balance or expenses you paid for the period. You may use this information to compare the ongoing costs of investing in the Portfolio and other funds. To do so, compare this 5% hypothetical example with the 5% hypothetical examples that appear in the shareholder reports of the other funds.
Please note that the expenses shown in the table are meant to highlight your ongoing costs only and do not reflect any transactional costs, such as sales charges, redemption fees, or exchange fees. Therefore, the second line of the table is useful in comparing ongoing costs only, and will not help you determine the relative total costs of owning different funds. In addition, if these transactional costs were included, your costs would have been higher:
| | | | | | | | | | | | |
| Share Class | | Beginning
Account Value
9/1/18 | | | Ending
Account Value
2/28/19 | | | Expenses Paid for the
6 months ended
2/28/19* | |
| Institutional | | | | | | | | | | | | |
Actual | | $ | 1,000.00 | | | $ | 1017.20 | | | $ | 3.65 | |
Hypothetical 5% return | | | 1,000.00 | | | | 1021.17 | + | | | 3.66 | |
| Class P | | | | | | | | | | | | |
Actual | | | 1,000.00 | | | | 1016.30 | | | | 3.60 | |
Hypothetical 5% return | | | 1,000.00 | | | | 1021.22 | + | | | 3.61 | |
| Class R6 | | | | | | | | | | | | |
Actual | | | 1,000.00 | | | | 1016.20 | | | | 3.60 | |
Hypothetical 5% return | | | 1,000.00 | | | | 1021.22 | + | | | 3.61 | |
| | + | | Hypothetical expenses are based on each Portfolio’s actual annualized net expense ratios and an assumed rate of return of 5% per year before expenses. | |
| | * | | Expenses are calculated using the Portfolio’s annualized net expense ratio for each class, which represents the ongoing expenses as a percentage of net assets for the six months ended February 28, 2019. Expenses are calculated by multiplying the annualized net expense ratio by the average account value for the period; then multiplying the result by the number of days in the most recent fiscal half year; and then dividing that result by the number of days in the fiscal year. The annualized net expense ratios for the period were as follows: 0.73% for Institutional Shares, 0.72% for Class P Shares and 0.72% for Class R6 Shares. | |
39
FUND PROFILE
Goldman Sachs Funds
Goldman Sachs is a premier financial services firm, known since 1869 for creating thoughtful and customized investment solutions in complex global markets.
Today, theInvestment Management Division of Goldman Sachs serves a diverse set of clients worldwide, including private institutions, public entities and individuals. With approximately $1.34 trillion in assets under supervision as of December 31, 2018, Goldman Sachs Asset Management (“GSAM”) has portfolio management teams located around the world and our investment professionals bring firsthand knowledge of local markets to every investment decision. Assets under supervision includes assets under management and other client assets for which Goldman Sachs does not have full discretion. GSAM leverages the resources of Goldman Sachs & Co. LLC subject to legal, internal and regulatory restrictions.
Money Market
Financial Square FundsSM
| ∎ | | Financial Square Treasury Solutions Fund1 |
| ∎ | | Financial Square Government Fund1 |
| ∎ | | Financial Square Money Market Fund2 |
| ∎ | | Financial Square Prime Obligations Fund2 |
| ∎ | | Financial Square Treasury Instruments Fund1 |
| ∎ | | Financial Square Treasury Obligations Fund1 |
| ∎ | | Financial Square Federal Instruments Fund1 |
Investor FundsSM
| ∎ | | Investor Money Market Fund3 |
| ∎ | | InvestorTax-Exempt Money Market Fund3 |
Fixed Income
Short Duration and Government
| ∎ | | High Quality Floating Rate Fund |
| ∎ | | Short-Term Conservative Income Fund |
| ∎ | | Short Duration Government Fund |
| ∎ | | Short Duration Income Fund |
| ∎ | | Inflation Protected Securities Fund |
Multi-Sector
Municipal andTax-Free
| ∎ | | High Yield Municipal Fund |
| ∎ | | Dynamic Municipal Income Fund |
| ∎ | | Short DurationTax-Free Fund |
| ∎ | | Municipal Income Completion Fund |
Single Sector
| ∎ | | Investment Grade Credit Fund |
| ∎ | | High Yield Floating Rate Fund |
| ∎ | | Emerging Markets Debt Fund |
| ∎ | | Local Emerging Markets Debt Fund |
Fixed Income Alternatives
| ∎ | | Long Short Credit Strategies Fund |
Fundamental Equity
| ∎ | | Small/Mid Cap Value Fund |
| ∎ | | Small/Mid Cap Growth Fund |
| ∎ | | Concentrated Growth Fund |
| ∎ | | Technology Opportunities Fund |
| ∎ | | Growth Opportunities Fund |
| ∎ | | Rising Dividend Growth Fund |
Tax-Advantaged Equity
| ∎ | | U.S.Tax-Managed Equity Fund |
| ∎ | | InternationalTax-Managed Equity Fund |
| ∎ | | U.S. Equity Dividend and Premium Fund |
| ∎ | | International Equity Dividend and Premium Fund |
Equity Insights
| ∎ | | Small Cap Equity Insights Fund |
| ∎ | | U.S. Equity Insights Fund |
| ∎ | | Small Cap Growth Insights Fund |
| ∎ | | Large Cap Growth Insights Fund |
| ∎ | | Large Cap Value Insights Fund |
| ∎ | | Small Cap Value Insights Fund |
| ∎ | | International Small Cap Insights Fund |
| ∎ | | International Equity Insights Fund |
| ∎ | | Emerging Markets Equity Insights Fund |
Fundamental Equity International
| ∎ | | International Equity Income Fund |
| ∎ | | International Equity ESG Fund |
| ∎ | | Emerging Markets Equity Fund |
| ∎ | | ESG Emerging Markets Equity Fund |
Select Satellite
| ∎ | | Real Estate Securities Fund |
| ∎ | | International Real Estate Securities Fund |
| ∎ | | Commodity Strategy Fund |
| ∎ | | Global Real Estate Securities Fund |
| ∎ | | Alternative Premia Fund |
| ∎ | | Absolute Return Tracker Fund |
| ∎ | | Managed Futures Strategy Fund |
| ∎ | | MLP Energy Infrastructure Fund |
| ∎ | | Multi-Manager Alternatives Fund |
| ∎ | | Absolute Return Multi-Asset Fund |
| ∎ | | Global Infrastructure Fund |
Total Portfolio Solutions
| ∎ | | Global Managed Beta Fund |
| ∎ | | Multi-ManagerNon-Core Fixed Income Fund |
| ∎ | | Multi-Manager U.S. Dynamic Equity Fund |
| ∎ | | Multi-Manager Global Equity Fund |
| ∎ | | Multi-Manager International Equity Fund |
| ∎ | | Tactical Tilt Overlay Fund |
| ∎ | | Balanced Strategy Portfolio |
| ∎ | | Multi-Manager U.S. Small Cap Equity Fund |
| ∎ | | Multi-Manager Real Assets Strategy Fund |
| ∎ | | Growth and Income Strategy Portfolio |
| ∎ | | Growth Strategy Portfolio |
| ∎ | | Dynamic Global Equity Fund4 |
| ∎ | | Satellite Strategies Portfolio |
| ∎ | | Enhanced Dividend Global Equity Portfolio |
| ∎ | | Tax-Advantaged Global Equity Portfolio |
| ∎ | | Strategic Factor Allocation Fund |
| ∎ | | Target Date 2020 Portfolio |
| ∎ | | Target Date 2025 Portfolio |
| ∎ | | Target Date 2030 Portfolio |
| ∎ | | Target Date 2035 Portfolio |
| ∎ | | Target Date 2040 Portfolio |
| ∎ | | Target Date 2045 Portfolio |
| ∎ | | Target Date 2050 Portfolio |
| ∎ | | Target Date 2055 Portfolio |
| ∎ | | Target Date 2060 Portfolio |
| ∎ | | GQG Partners International Opportunities Fund |
| 1 | | You could lose money by investing in the Fund. Although the Fund seeks to preserve the value of your investment at $1.00 per share, it cannot guarantee it will do so. An investment in the Fund is not a deposit of a bank and is not insured or guaranteed by the Federal Deposit Insurance Corporation or any other government agency. The Fund’s sponsor has no legal obligation to provide financial support to the Fund, and you should not expect that the sponsor will provide financial support to the Fund at any time. |
| 2 | | You could lose money by investing in the Fund. Because the share price of the Fund will fluctuate, when you sell your shares they may be worth more or less than what you originally paid for them. The Fund may impose a fee upon sale of your shares or may temporarily suspend your ability to sell shares if the Fund’s liquidity falls below required minimums because of market conditions or other factors. An investment in the Fund is not a deposit of a bank and is not insured or guaranteed by the Federal Deposit Insurance Corporation or any other government agency. The Fund’s sponsor has no legal obligation to provide financial support to the Fund, and you should not expect that the sponsor will provide financial support to the Fund at any time. |
| 3 | | You could lose money by investing in the Fund. Although the Fund seeks to preserve the value of your investment at $1.00 per share, it cannot guarantee it will do so. The Fund may impose a fee upon sale of your shares or may temporarily suspend your ability to sell shares if the Fund’s liquidity falls below required minimums because of market conditions or other factors. An investment in the Fund is not a deposit of a bank and is not insured or guaranteed by the Federal Deposit Insurance Corporation or any other government agency. The Fund’s sponsor has no legal obligation to provide financial support to the Fund, and you should not expect that the sponsor will provide financial support to the Fund at any time. |
| 4 | | Effective after the close of business on February 28, 2019, the Goldman Sachs Equity Growth Strategy Portfolio was renamed the Goldman Sachs Dynamic Global Equity Fund. |
| | | Financial Square FundsSM and Investor FundsSM are registered service marks of Goldman Sachs & Co. LLC. |
| * | | This list coversopen-end funds only. Please visit our website at www.GSAMFUNDS.com to learn about ourclosed-end funds and exchange-traded funds. |
| | |
| TRUSTEES | | OFFICERS |
Jessica Palmer,Chair Kathryn A. Cassidy Diana M. Daniels James A. McNamara Roy W. Templin Gregory G. Weaver | | James A. McNamara,President Scott M. McHugh,Treasurer, Senior Vice President and Principal Financial Officer Joseph F. DiMaria,Assistant Treasurer and Principal Accounting Officer Caroline L. Kraus,Secretary |
| |
GOLDMAN SACHS & CO. LLC Distributor and Transfer Agent | | GOLDMAN SACHS ASSET MANAGEMENT, L.P. Investment Adviser |
Visit our web site atwww.GSAMFUNDS.com to obtain the most recentmonth-end returns.
Goldman Sachs Asset Management, L.P. 200 West Street, New York, New York 10282
The reports concerning the Portfolio included in this shareholder report may contain certain forward-looking statements about the factors that may affect the performance of the Portfolio in the future. These statements are based on Portfolio management’s predictions and expectations concerning certain future events and their expected impact on the Portfolio, such as performance of the economy as a whole and of specific industry sectors, changes in the levels of interest rates, the impact of developing world events, and other factors that may influence the future performance of the Portfolio. Management believes these forward-looking statements to be reasonable, although they are inherently uncertain and difficult to predict. Actual events may cause adjustments in portfolio management strategies from those currently expected to be employed.
A description of the policies and procedures that the Portfolio uses to determine how to vote proxies relating to portfolio securities and information regarding how the Portfolio voted proxies relating to portfolio securities for the most recent12-month period ended June 30, are available (I) without charge, upon request by calling1-800-526-7384; and (II) on the Securities and Exchange Commission (“SEC’’) web site at http://www.sec.gov.
The Portfolio will file portfolio holdings information for each month in a fiscal quarter within 60 days after the end of the relevant fiscal quarter on Form N-PORT. Portfolio holdings information for the third month of each fiscal quarter will be made available on the SEC’s web site at http://www.sec.gov. Portfolio holdings information may be obtained upon request and without charge by calling1-800-621-2550 (for Institutional Shareholders).
Portfolio holdings and allocations shown are as of February 28, 2019 and may not be representative of future investments. Portfolio holdings should not be relied on in making investment decisions and should not be construed as research or investment advice regarding particular securities. Current and future holdings are subject to risk.
Economic and market forecasts presented herein reflect a series of assumptions and judgments as of the date of this presentation and are subject to change without notice. These forecasts do not take into account the specific investment objectives, restrictions, tax and financial situation or other needs of any specific client. Actual data will vary and may not be reflected here. These forecasts are subject to high levels of uncertainty that may affect actual performance. Accordingly, these forecasts should be viewed as merely representative of a broad range of possible outcomes. These forecasts are estimated, based on assumptions, and are subject to significant revision and may change materially as economic and market conditions change. Goldman Sachs has no obligation to provide updates or changes to these forecasts. Case studies and examples are for illustrative purposes only.
The portfolio risk management process includes an effort to monitor and manage risk, but does not imply low risk.
This material is not authorized for distribution to prospective investors unless preceded or accompanied by a current prospectus or summary prospectus, if applicable. Investors should consider the Portfolio’s objective, risks, and charges and expenses, and read the summary prospectus, if available, and/or the prospectus carefully before investing or sending money. The summary prospectus, if available, and the prospectus contain this and other information about the Portfolio and may be obtained from your authorized dealer or from Goldman Sachs & Co. LLC by calling1-800-621-2550.
© 2019 Goldman Sachs. All rights reserved. 162458-OTU-960992 TACTSAR-19/964
(a) As of the end of the period covered by this report, the registrant has adopted a code of ethics that applies to the registrant’s principal executive officer, principal financial officer, principal accounting officer or controller, or persons performing similar functions, regardless of whether these individuals are employed by the registrant or a third party (the “Code of Ethics”).
(b) During the period covered by this report, no amendments were made to the provisions of the Code of Ethics.
(c) During the period covered by this report, the registrant did not grant any waivers, including an implicit waiver, from any provision of the Code of Ethics.
(d) A copy of the Code of Ethics is available as provided in Item 13(a)(1) of this report.
| ITEM 3. | AUDIT COMMITTEE FINANCIAL EXPERT. |
The registrant’s board of trustees has determined that the registrant has at least one “audit committee financial expert” (as defined in Item 3 of Form N-CSR) serving on its audit committee. Gregory G. Weaver is the “audit committee financial expert” and is “independent” (as each term is defined in Item 3 of Form N-CSR).
| ITEM 4. | PRINCIPAL ACCOUNTANT FEES AND SERVICES. |
The information required by this Item is only required in an annual report on this Form N-CSR.
| ITEM 5. | AUDIT COMMITTEE OF LISTED REGISTRANTS. |
| ITEM 6. | SCHEDULE OF INVESTMENTS. |
| | Schedule of Investments is included as part of the Report to Shareholders filed under Item 1. |
| ITEM 7. | DISCLOSURE OF PROXY VOTING POLICIES AND PROCEDURES FORCLOSED-END MANAGEMENT INVESTMENT COMPANIES. |
| ITEM 8. | PORTFOLIO MANAGERS OFCLOSED-END MANAGEMENT INVESTMENT COMPANIES. |
| ITEM 9. | PURCHASES OF EQUITY SECURITIES BYCLOSED-END MANAGEMENT INVESTMENT COMPANY AND AFFILIATED PURCHASERS. |
| ITEM 10. | SUBMISSION OF MATTERS TO A VOTE OF SECURITY HOLDERS. |
| | There have been no material changes to the procedures by which shareholders may recommend nominees to the registrant’s board of trustees. |
| ITEM 11. | CONTROLS AND PROCEDURES. |
| | (a) | The registrant’s principal executive and principal financial officers, or persons performing similar functions have concluded that the registrant’s disclosure controls and procedures (as defined in Rule30a-3(c) under the Investment Company Act of 1940, as amended (the “1940 Act”)) are effective as of a date within 90 days of the filing of this report that includes the disclosure required by this paragraph, based on the evaluation of these controls and procedures required by Rule30a-3(b) under the 1940 Act and15d-15(b) under the Securities Exchange Act of 1934, as amended. |
| | (b) | There were no changes in the registrant’s internal control over financial reporting (as defined in Rule30a-3(d) under the 1940 Act) that occurred during the registrant’s last fiscal quarter that have materially affected, or are reasonably likely to materially affect, the registrant’s internal control over financial reporting. |
| ITEM 12. | DISCLOSURE OF SECURITIES LENDING ACTIVITIES FOR CLOSED-END MANAGEMENT INVESTMENT COMPANIES |
Not applicable.
| | | | |
| (a)(1) | | Goldman Sachs Trust’s Code of Ethics for Principal Executive and Senior Financial Officers is incorporated by reference to Exhibit 12(a)(1) of the registrant’s Form N-CSR filed on July 8, 2015 for its International Equity Insights Funds. |
| | |
| (a)(2) | | Exhibit 99.CERT | | Certifications pursuant to Section 302 of the Sarbanes-Oxley Act of 2002 filed herewith. |
| |
| (a)(3) | | Not applicable to open-end investment companies. |
| |
| (a)(4) | | There was no change in the registrant’s independent public accountant for the period covered by this report. |
| | |
| (b) | | Exhibit 99.906CERT | | Certifications pursuant to Section 906 of the Sarbanes-Oxley Act of 2002 filed herewith. |
SIGNATURES
Pursuant to the requirements of the Securities Exchange Act of 1934 and the Investment Company Act of 1940, the registrant has duly caused this report to be signed on its behalf by the undersigned, thereunto duly authorized.
| | |
| | | Goldman Sachs Trust |
| |
| By: | | /s/ James A. McNamara |
| |
| | |
| | James A. McNamara |
| | President/Chief Executive Officer |
| | Goldman Sachs Trust |
| |
| Date: | | April 26, 2019 |
Pursuant to the requirements of the Securities Exchange Act of 1934 and the Investment Company Act of 1940, this report has been signed below by the following persons on behalf of the registrant and in the capacities and on the dates indicated.
| | |
| By: | | /s/ James A. McNamara |
| |
| | |
| | James A. McNamara |
| | President/Chief Executive Officer |
| | Goldman Sachs Trust |
| |
| Date: | | April 26, 2019 |
| |
| By: | | /s/ Scott McHugh |
| |
| | |
| | Scott McHugh |
| | Principal Financial Officer |
| | Goldman Sachs Trust |
| |
| Date: | | April 26, 2019 |