UNITED STATES
SECURITIES AND EXCHANGE COMMISSION
Washington, D.C. 20549
FORMN-CSR
CERTIFIED SHAREHOLDER REPORT OF REGISTERED
MANAGEMENT INVESTMENT COMPANIES
Investment Company Act file number811-05349
Goldman Sachs Trust
(Exact name of registrant as specified in charter)
71 South Wacker Drive, Chicago, Illinois 60606
(Address of principal executive offices) (Zip code)
| | |
| Caroline Kraus, Esq. | | Copies to: |
| Goldman Sachs & Co. LLC | | Geoffrey R.T. Kenyon, Esq. |
| 200 West Street | | Dechert LLP |
| New York, New York 10282 | | 100 Oliver Street |
| | 40th Floor |
| | Boston, MA 02110-2605 |
(Name and address of agents for service)
Registrant’s telephone number, including area code:(312) 655-4400
Date of fiscal year end: December 31
Date of reporting period: June 30, 2019
| ITEM 1. | REPORTS TO STOCKHOLDERS. |
| | The Semi-Annual Report to Shareholders is filed herewith. |
Goldman Sachs Funds

| | | | |
| | |
| Semi-Annual Report | | | | June 30, 2019 |
| | |
| | | | Fund of Funds Portfolios |
| | | | Balanced Strategy |
| | | | Growth and Income Strategy |
| | | | Growth Strategy |
| | | | Satellite Strategies |
It is our intention that beginning on January 1, 2021, paper copies of the Portfolios’ annual and semi-annual shareholder reports will no longer be sent by mail, unless you specifically request paper copies of the reports from a Portfolio or from your financial intermediary. Instead, the reports will be made available on a website, and you will be notified by mail each time a report is posted and provided with a website link to access the report.
If you already elected to receive shareholder reports electronically, you will not be affected by this change and you need not take any action. At any time, you may elect to receive reports and certain communications from a Portfolio electronically by calling the applicable toll-free number below or by contacting your financial intermediary.
You may elect to receive all future shareholder reports in paper free of charge. If you hold shares of a Portfolio directly with the Portfolio’s transfer agent, you can inform the transfer agent that you wish to receive paper copies of reports by callingtoll-free 800-621-2550 for Institutional, Service, Class R6 and Class P shareholders or800-526-7384 for all other shareholders. If you hold shares of a Portfolio through a financial intermediary, please contact your financial intermediary to make this election. Your election to receive reports in paper will apply to all Goldman Sachs Funds held in your account if you invest through your financial intermediary or all Goldman Sachs Funds held with a Portfolio’s transfer agent if you invest directly with the transfer agent.

Goldman Sachs Fund of Funds Portfolios
| ∎ | | GROWTH AND INCOME STRATEGY |
| | | | |
| | | |
| NOT FDIC-INSURED | | May Lose Value | | No Bank Guarantee |
MARKET REVIEW
Goldman Sachs Fund of Funds Portfolios
Market Review
The capital markets were influenced most during the six months ended June 30, 2019 (the “Reporting Period”) by global economic data, central bank monetary policy and geopolitics.
During the first quarter of 2019, when the Reporting Period started, risk assets broadly rebounded from asell-off in the fourth quarter of 2018, as investor sentiment turned positive on a combination of dovish global central bank policy, tentative stabilization in Chinese economic growth and seemingly promising developments in U.S.-China trade talks. (Dovish tends to suggest lower interest rates; opposite of hawkish.) Although global economic growth continued to decelerate during the first calendar quarter, a few “green shoots” began to emerge. (Green shoots is a term used to describe signs of economic recovery or positive data during an economic downturn.) Indications of a bottoming in Chinese credit growth, a modestpick-up in fixed asset investment, and an uptick in March 2019 manufacturing data made investors hopeful for a recovery in Chinese and global economic growth. As inflationary pressures remained rather muted, the U.S. Federal Reserve (the “Fed”) and the European Central Bank (“ECB”) each made a dovish shift and then maintained monetary policy stances that were broadly supportive of economic growth. More specifically, the Fed signaled it would make no additional short-term interest rate hikes during 2019, and the ECB indicated it was reluctant to raise interest rates during the calendar year. Global equities, as measured by the MSCI ACWI Investable Market Index , were up 12.86% during the first calendar quarter, led by a rally in U.S. stocks. Emerging markets equities overall underperformed developed markets equities, but Chinese stocks, as represented by the MSCI China Index, rose more than 17%. In fixed income, the10-year U.S. Treasury yield fell during the first quarter of 2019.
In the second quarter of 2019, continued weakness in global economic growth and low levels of inflation led the Fed and ECB to indicate they might ease monetary policy. In June, the Fed signaled its next policy move was more likely to be an interest rate cut than an interest rate hike. The Fed’s dot plot, which shows interest rate projections of the members of the Federal Open Market Committee, revealed that policymakers expected to keep interest rates stable during 2019, followed by a 25 basis point cut in 2020. (A basis point is 1/100th of a percentage point.) Meanwhile, the ECB hinted that interest rate cuts and quantitative easing were on the table should economic data disappoint in the near term. Global equities were volatile during the second calendar quarter overall, though they rose 3.88%, as measured by the MSCI ACWI Investable Market Index. In May 2019, global equities had suffered a significant decline amid headwinds from U.S.-China trade negotiations. They then recovered in June, driven by dovish central bank actions and market expectations of a pause in U.S.-China trade tensions ahead of the G20 meeting at month end. (Also known as Group of 20 nations, the G20 is a forum attended by finance ministers and central bank governors from the world’s highly developed economies consisting of 19 countries and the European Union.) In fixed income, the10-year U.S. Treasury yield and the10-year German government bond yield fell during the second quarter of 2019 in response to global economic growth weakness and dovish central bank policies.
Looking Ahead
At the end of the Reporting Period, we emphasized three macro themes. First, we believed the U.S. economy was in “rollover,” meaning we expected increased economic weakness. The economic “green shoots” we had expected to grow during the Reporting Period had instead started to wither. Trade risks also remained elevated, in our view. Our research shows that
1
MARKET REVIEW
economic rollovers are characterized by high risks of recession and severe equity declines as well as by episodes of “false positives” and premature warning signals. Second, at the end of the Reporting Period, we believed global economic uncertainty had increased overall. Although we thought the risk of recession had risen, we did not think it was time to position the Portfolios for such a scenario. Third, we considered a dynamic investment approach particularly important, and we planned to address increased economic uncertainty through the Portfolios’ positioning and their levels of risk exposure.
At the asset class level at the end of the Reporting Period, we expected a continuation of the equity bull market, assuming the global economy continued to expand over the medium term. However, we thought the upside was likely to be limited by moderately elevated equity valuations and limitations to corporate earnings growth. In the near term, we considered equities less attractive than we did earlier in the economic cycle. As for fixed income, we believed yields reflected the market’s increased perception of recessionary risk. At the end of the Reporting Period,10-year U.S. Treasury yields were lower than we expected, and we thought there was potential for them to rise in the near term. Overall, we did not consider the risk/reward of fixed income particularly attractive, because there tends to be upward pressure on credit spreads in the late stage of an economic cycle; spreads were rather tight at the end of the Reporting Period; and we perceived risks to the macro outlook. (Credit spreads are yield differentials between corporate bonds and U.S. Treasury securities of comparable maturity.) Accordingly, we favored equities over fixed income at the end of the Reporting Period.
2
GOLDMAN SACHS FUND OF FUNDS PORTFOLIOS
What Differentiates Goldman Sachs’
Approach to Asset Allocation?
We believe that strong investment results through asset allocation are best achieved through teams of experts working together on a global scale:
| ∎ | | Goldman Sachs’ Global Portfolio Solutions Group determines the strategic and tactical asset allocations. The team is comprised of over 140* professionals with significant academic and practitioner experience. |
| ∎ | | Goldman Sachs’ Portfolio Management Teams offer expert management of the mutual funds that are contained within each Portfolio. These same teams manage portfolios for institutional and high net worth investors. |
Goldman Sachs Asset Allocation Investment Process

Global Portfolio Solutions Group
Each Portfolio represents a diversified global portfolio on the efficient frontier.† The Portfolios differ in their long-term objective, and therefore, their asset allocation mix. The long-term strategic asset allocation is the primary source of risk and the corresponding primary determinant of total return. It therefore represents an anchor, or neutral starting point, from which tactical asset allocation decisions are made.

Global Portfolio Solutions Group
For each Portfolio, the long-term strategic asset allocation is adjusted through a tactical investment process that seeks to react to and capitalize on changes in the market, the economic cycle, and macroeconomic environment. Within each strategy, we shift assets away from the strategic allocation by over and underweighting certain asset classes and by taking long or short positions in specific sectors, regions and countries. Using a proprietary fundamental analysis and portfolio construction process, the team develops views based on its current market and economic outlook across asset classes like global developed equity, emerging market equity, investment grade and non-investment grade fixed income, and currency markets.
| †Portfolios | | on the efficient frontier are optimal in both the sense that they offer maximal expected return for some given level of risk and minimal risk for some given level of expected return. The efficient frontier is the line created from the risk-reward graph, comprised of optimal portfolios. The optimal portfolios plotted along the curve have the highest expected return possible for the given amount of risk. |
3
PORTFOLIO RESULTS
Goldman Sachs Fund of Funds Portfolios – Asset Allocation
Investment Objectives
The Goldman Sachs Balanced Strategy Portfolio seeks current income and long-term capital appreciation. The Goldman Sachs Growth and Income Strategy Portfolio seeks long-term capital appreciation and current income. The Goldman Sachs Growth Strategy Portfolio seeks long-term capital appreciation and, secondarily, current income.
Portfolio Management Discussion and Analysis
Below, the Goldman Sachs Global Portfolio Solutions Team discusses the performance and positioning of the Goldman Sachs Fund of Funds Portfolios — Asset Allocation (the “Portfolios”) for thesix-month period ended June 30, 2019 (the “Reporting Period”).
| Q | | How did the Portfolios perform during the Reporting Period? |
| A | | Goldman Sachs Balanced Strategy Portfolio — During the Reporting Period, the Balanced Strategy Portfolio’s Class A, Class C, Institutional, Service, Investor, Class P, Class R and Class R6 Shares generated cumulative total returns of 10.22%, 9.79%, 10.43%, 10.04%, 10.29%, 10.43%, 10.13% and 10.43%, respectively. This compares to the 10.08% cumulative total return of the Portfolio’s blended benchmark, which is composed 60% of the Bloomberg Barclays Global Aggregate Bond Index (Gross, USD, Hedged) (“Bloomberg Barclays Global Index”) and 40% of the MSCI All Country World Index (Net, USD, Unhedged) (“MSCI ACWI Index”), during the same period. |
| | | The components of the Portfolio’s blended benchmark, the Bloomberg Barclays Global Index and the MSCI ACWI Index, generated cumulative total returns of 6.00% and 16.23%, respectively, during the Reporting Period. |
| | | Goldman Sachs Growth and Income Strategy Portfolio — During the Reporting Period, the Growth and Income Strategy Portfolio’s Class A, Class C, Institutional, Service, Investor, Class P, Class R and Class R6 Shares generated cumulative total returns of 11.74%, 11.37%, 12.08%, 11.71%, 11.94%, 12.01%, 11.62% and 12.01%, respectively. This compares to the 12.12% cumulative total return of the Portfolio’s blended benchmark, which is composed 40% of the Bloomberg Barclays Global Index and 60% of the MSCI ACWI Index, during the same period. |
| | | The components of the Portfolio’s blended benchmark, the Bloomberg Barclays Global Index and the MSCI ACWI Index, generated cumulative total returns of 6.00% and 16.23%, respectively, during the Reporting Period. |
| | | Goldman Sachs Growth Strategy Portfolio— During the Reporting Period, the Growth Strategy Portfolio’s Class A, Class C, Institutional, Service, Investor, Class P, Class R and Class R6 Shares generated cumulative total returns of 13.84%, 13.38%, 14.00%, 13.73%, 13.90%, 13.99%, 13.69% and 13.99%, respectively. This compares to the 14.17% cumulative total return of the Portfolio’s blended benchmark, which is composed 80% of the MSCI ACWI Index and 20% of the Bloomberg Barclays Global Index, during the same period. |
| | | The components of the Portfolio’s blended benchmark, the Bloomberg Barclays Global Index and the MSCI ACWI Index, generated cumulative total returns of 6.00% and 16.23%, respectively, during the Reporting Period. |
| Q | | What key factors were responsible for the Portfolios’ performance during the Reporting Period? |
| A | | The Portfolios seek to achieve their respective investment objectives by investing mainly in a combination of underlying funds and exchange-traded funds (“ETFs”) (collectively, the “Underlying Funds”). Some of the Portfolios’ Underlying Funds invest primarily in fixed income or money market instruments (the “Underlying Fixed Income Funds”); some of the Underlying Funds invest primarily in equity securities (the “Underlying Equity Funds”); and other Underlying Funds invest dynamically across equity, fixed income, commodity and other markets using various strategies including a managed-volatility or trend-following approach (the “Underlying Dynamic Funds”). |
| | | Performance is driven by four sources of return: long-term strategic asset allocation, medium-term cycle-aware allocation, short-term tactical allocation and excess returns |
4
PORTFOLIO RESULTS
| | from investments in Underlying Funds. Strategic asset allocation is the process by which we seek to budget or allocate portfolio risk, as opposed to capital, across a set of asset allocation risk factors, including but not limited to, equity, interest rate, emerging markets, credit, momentum and active risk. The resulting strategic asset allocations are implemented using a range ofbottom-up security selection strategies across equity, fixed income and dynamic asset classes, which may utilize fundamental or quantitative investment techniques. We then incorporate our medium-term cycle-aware views and short-term tactical views into the Portfolios in order to react to changes in the economic cycle and the markets, respectively. Each Portfolio’s positioning may therefore change over time based on medium- and short-term market views on dislocations and attractive investment opportunities. These views may impact the relative weighting across asset classes, the allocation to geographies, sectors and industries as well as the Portfolios’ duration and sensitivity to inflation. (Duration is a measure of a portfolio’s sensitivity to changes in interest rates.) |
| | | During the Reporting Period, the Portfolios generated strongly positive results on an absolute basis, with those having greater equity exposure posting higher positive returns. In relative terms, the Portfolios had mixed results, with one of the Portfolios outperforming its benchmark index and two of the Portfolios underperforming their respective benchmark indices.1 |
| | | Long-term strategic asset allocation added most to the performance of all three Portfolios during the Reporting Period. In addition, the contribution from our short-term tactical decisions was generally positive. Conversely, the Portfolios were hurt overall by our medium-term cycle-aware views. Security selection within the Underlying Funds detracted from the performance of the Goldman Sachs Growth and Income Strategy Portfolio and Goldman Sachs Growth Strategy Portfolio but contributed positively to the performance of the Goldman Sachs Balanced Strategy Portfolio. |
| | | During the Reporting Period, we shifted the Portfolios to new long-term strategic allocations, as we sought to enhance their diversification and sources of potential excess returns. The new strategic allocations enhanced the Portfolios’ absolute returns. |
| | | Our medium-term cycle-aware views detracted from the performance of all three Portfolios. Within fixed income, we held the view that the Goldman Sachs Balanced Strategy Portfolio, the Goldman Sachs Growth and Income Strategy Portfolio and the Goldman Sachs Growth Strategy Portfolio should each have a short duration bias, which was expressed through a short position in long-maturity German government bonds and short positions in the front, or short-term, end of the U.S. Treasury yield curve. (Yield curve is a spectrum of interest rates based on maturities of varying lengths.) The short position in long-maturity German government bonds hurt the Portfolios’ performance, as German yields fell during the Reporting Period due to slower European economic growth and subdued inflation. The Portfolios’ short position in thetwo-year segment of the U.S. Treasury yield curve also hurt performance, as U.S. interest rates dropped during the Reporting Period. Elsewhere within fixed income, the Portfolios were hampered by their exposure to local emerging markets debt versus U.S. high yield corporate bonds. This positioning was based on our view that credit spreads, which typically start to widen before an equity market peak, would be a headwind for U.S. high yield corporate bonds in the near term. (Credit spreads are yield differentials between corporate bonds and U.S. Treasury securities of comparable maturity.) However, high yield corporate bonds outperformed local emerging markets debt during the Reporting Period, and this medium-term cycle-aware view detracted marginally from the Portfolios’ performance. |
| | | Our short-term tactical views, which seek to take advantage of what we consider short-term market mispricing, contributed positively to the performance of all three Portfolios during the Reporting Period. |
| | | As mentioned earlier, security selection within the Underlying Funds detracted from the returns of the Goldman Sachs Growth and Income Strategy Portfolio and the Goldman Sachs Growth Strategy Portfolio. On the positive side, the Goldman Sachs Balanced Strategy Portfolio benefited from security selection within the Underlying Funds. |
| Q | | How did the Portfolios’ Underlying Funds perform relative to their respective benchmark indices during the Reporting Period? |
| A | | Among Underlying Fixed Income Funds, the Goldman Sachs Access Investment Grade Corporate Bond ETF, the Goldman Sachs High Yield Fund, the Goldman Sachs Global Income |
| | 1 | | As measured by Institutional Shares. |
5
PORTFOLIO RESULTS
| | Fund, the Goldman Sachs Emerging Markets Debt Fund and the Goldman Sachs Local Emerging Markets Debt Fund outperformed their respective benchmark indices. The Goldman Sachs High Yield Floating Rate Fund and the Goldman Sachs Access High Yield Corporate Bond ETF underperformed their respective benchmark indices. Among Underlying Equity Funds, the Goldman Sachs ActiveBeta® International Equity ETF and the Goldman Sachs International Small Cap Insights Funds outperformed their respective benchmark indices. The Goldman Sachs Dynamic Global Equity Fund outperformed its benchmark index between May 15, 2019, when it was added as an Underlying Equity Fund, and the end of the Reporting Period. The Underlying Equity Funds that underperformed their respective benchmark indices were the Goldman Sachs International Equity Insights Fund, the Goldman Sachs Large Cap Value Insights Fund, the Goldman Sachs Large Cap Growth Insights Fund, the Goldman Sachs Emerging Markets Equity Insights Fund, the Goldman Sachs Small Cap Equity Insights Fund, the Goldman Sachs ActiveBeta® U.S. Large Cap Equity ETF and the Goldman Sachs ActiveBeta® Emerging Markets Equity ETF. Among Underlying Funds that invest in real assets, both the Goldman Sachs Real Estate Securities Fund and the Goldman Sachs Global Infrastructure Fund outperformed their respective benchmark indices during the Reporting Period. |
| | | The Goldman Sachs Tactical Exposure Fund (the “Underlying Tactical Fund”), which we used to express our short-term tactical views during the Reporting Period, contributed positively to the to the Portfolios’ absolute performance, but underperformed relative to our expectations. The Underlying Tactical Fund was liquidated on June 24, 2019. |
| Q | | How did the Portfolios use derivatives and similar instruments during the Reporting Period? |
| A | | During the Reporting Period, all three Portfolios used derivatives for passive replication of asset classes. Specifically, each of the Portfolios held a strategic position in S&P 500® Index futures (positive impact on performance). They also employed put options on U.S. large cap equities (negative impact). (A put option is an option contract giving the owner the right, but not the obligation, to sell a specified amount of an underlying asset at a specified price within a specified time.) |
| | | Within fixed income, all three Portfolios used interest rate futures to express our medium-term cycle-aware views on the U.S. Treasury yield curve and on long-term German interest rates (both had a negative impact). In addition, the Portfolios invested in a strategy that utilized interest rates options to profit if interest rates fall, remain constant, or rise less than anticipated (positive impact). |
| | | The three Portfolios used forward foreign currency exchange contracts within a foreign currency hedging strategy (positive impact), which seeks to manage the risk associated with investing innon-U.S. currencies. Foreign currency exchange contracts were employed within our volatility selling strategy (negative impact). Our volatility selling strategy seeks to benefit from the difference between implied volatility (i.e., expectations of future volatility) and realized volatility (i.e., historical volatility) in equity markets. |
| | | During the Reporting Period overall, some of the Portfolios’ Underlying Funds, including the Underlying Tactical Fund, used derivatives to apply their active investment views with greater versatility and potentially to afford greater risk management precision. As market conditions warranted during the Reporting Period, some of these Underlying Funds engaged in forward foreign currency exchange contracts, financial futures contracts, options, swap contracts and structured securities to attempt to enhance portfolio return and for hedging purposes. |
| Q | | What changes did you make during the Reporting Period within the Portfolios? |
| A | | In January 2019, we started to implement new long-term strategic allocations that we believed would provide regional exposure, particularly to the U.S., that was more in line with our long-term views as well as the Portfolios’ respective benchmark indices. As we shifted to the new strategic allocations, we increased the Portfolios’ exposure to U.S.large-cap stocks and other developed marketslarge-cap stocks, while reducing their exposure to emerging markets stocks. We also decreased the Portfolios’ exposure tosmall-cap stocks overall. Within fixed income, we increased the Portfolios’ exposure to global investment-grade corporate bonds. By the end of May 2019, we had completed the implementation of the new long-term strategic allocations. |
| | | In May 2019, we added a strategic allocation to the Goldman Sachs Dynamic Global Equity Fund (“Dynamic Underlying Equity Fund”), a diversified equity portfolio that gives us access to equities as well as some options-based strategies in equities and fixed income. We funded the allocation to the Dynamic Underlying Equity Fund by reducing allocations to the Underlying Equity Funds overall, as the Portfolios would gain similar exposure through the Dynamic Underlying Equity Fund. |
6
PORTFOLIO RESULTS
| | | During the Reporting Period, we also made changes to our medium-term cycle aware views. In February 2019, we reduced the Portfolios’ short positions in long-maturity German government bonds and their short positions in the front end of the U.S. Treasury yield curve, as we sought to increase their exposure to global fixed income amid uncertainty about the global economic growth outlook. Between March and June 2019, we eliminated the Portfolios’ short positions in long-maturity German government bonds. Although we still believed the markets were underpricing the risk of future inflation, we did not see signs that inflation would break out of its range-bound levels in the near term. This, combined with dovish central bank policy, caused us to remove this view from all the Portfolios. (Dovish tends to suggest lower interest rates; opposite of hawkish.) In May 2019, we removed our view that the Portfolios have exposure to local emerging markets debt versus U.S. high yield corporate bonds, as this positioning was incorporated into the Portfolios’ new long-term strategic allocations. |
| | | Toward the end of the Reporting Period, we sought to reduce equity risk in the Portfolios through the purchase of put options on U.S.large-cap equities. These positions detracted marginally from performance beginning on June 18, 2019, when they were added to the Portfolios, through the end of the Reporting Period. |
| | | On June 24, 2019, we changed the Portfolios’ single implementation vehicle for expressing our short-term tactical views from the Goldman Sachs Tactical Exposure Fund to the Goldman Sachs Tactical Tilt Overlay Fund. |
| Q | | Were there any changes to the Portfolios’ portfolio management team during the Reporting Period? |
| A | | Effective February 19, 2019, Raymond Chan no longer served as a portfolio manager of the Portfolios. Additionally, Neill Nuttall began serving as a portfolio manager of the Portfolios on February 19, 2019. By design, all investment decisions for the Portfolios are performed within aco-lead or team structure, with multiple subject matter experts. This strategic decision making has been the cornerstone of our approach and ensures continuity in the Portfolios. At the end of the Reporting Period, the portfolio managers for the Portfolios were Neill Nuttall and Christopher Lvoff. |
7
FUND BASICS
Balanced Strategy
as of June 30, 2019
| | | | | | | | | | | | | | | | | | |
| | PERFORMANCE REVIEW | |
| | | | | |
| | | January 1, 2019–
June 30, 2019 | | Portfolio Total Return
(based on NAV)1 | | | Balanced Strategy
Composite Index2 | | | Bloomberg Barclays
Global Index | | | MSCI ACWI Index | |
| | | | | |
| | Class A | | | 10.22 | % | | | 10.08 | % | | | 6.00 | % | | | 16.23 | % |
| | Class C | | | 9.79 | | | | 10.08 | | | | 6.00 | | | | 16.23 | |
| | Institutional | | | 10.43 | | | | 10.08 | | | | 6.00 | | | | 16.23 | |
| | Service | | | 10.04 | | | | 10.08 | | | | 6.00 | | | | 16.23 | |
| | Investor | | | 10.29 | | | | 10.08 | | | | 6.00 | | | | 16.23 | |
| | Class P | | | 10.43 | | | | 10.08 | | | | 6.00 | | | | 16.23 | |
| | Class R | | | 10.13 | | | | 10.08 | | | | 6.00 | | | | 16.23 | |
| | | Class R6 | | | 10.43 | | | | 10.08 | | | | 6.00 | | | | 16.23 | |
| | 1 | | The net asset value (“NAV”) represents the net assets of the class of the Portfolio(ex-dividend) divided by the total number of shares of the class outstanding. The Portfolio’s performance assumes the reinvestment of dividends and other distributions. The Portfolio’s performance does not reflect the deduction of any applicable sales charges. |
| | 2 | | The Balanced Strategy Composite Index (“Balanced Composite”) is a composite representation prepared by the Investment Adviser of the performance of the Portfolio’s asset classes weighted according to their respective weightings in the Portfolio’s target range. The Balanced Composite is comprised of a blend of the Bloomberg Barclays Global Aggregate Bond Index (Gross, USD, Hedged) (“Bloomberg Barclays Global Index”) (60%) and the MSCI All Country World Index (Net, USD, Unhedged) (“MSCI® ACWI Index”) (40%). The Bloomberg Barclays Global Index is an unmanaged index, provides a broad-based measure of the global investment gradefixed-rate debt markets and covers the most liquid portion of the global investment gradefixed-rate bond market, including government, credit and collateralized securities. The index figures do not include any deduction for fees, expenses or taxes. It is not possible to invest directly in an unmanaged index. The MSCI® ACWI Index is a freefloat-adjusted market capitalization weighted index that is designed to measure the equity market performance of developed and emerging markets. The MSCI® ACWI Index consists of 47 country indices comprising 23 developed and 24 emerging market country indices. The developed market country indices included are: Australia, Austria, Belgium, Canada, Denmark, Finland, France, Germany, Hong Kong, Ireland, Israel, Italy, Japan, Netherlands, New Zealand, Norway, Portugal, Singapore, Spain, Sweden, Switzerland, the United Kingdom and the United States. The emerging market country indices are: Brazil, Chile, China, Colombia, Czech Republic, Egypt, Greece, Hungary, India, Indonesia, Korea, Malaysia, Mexico, Pakistan, Peru, Philippines, Poland, Russia, Qatar, South Africa, Taiwan, Thailand, Turkey and the United Arab Emirates. The index figures do not include any deduction for fees or expenses. It is not possible to invest directly in an unmanaged index. |
The returns set forth in the table above represent past performance. Past performance does not guarantee future results. The Portfolio’s investment return and principal value will fluctuate so that an investor’s shares, when redeemed, may be worth more or less than their original cost. Current performance may be lower or higher than the performance quoted above. Please visit our web site at www.gsamfunds.com to obtain the most recentmonth-end returns.Performance reflects applicable fee waivers and/or expense limitations in effect during the periods shown. In their absence, performance would be reduced. Returns do not reflect the deduction of taxes that a shareholder would pay on Portfolio distributions or the redemption of Portfolio shares.
8
FUND BASICS
| | | | | | | | | | | | | | | | | | |
| | STANDARDIZED TOTAL RETURNS3 |
| | | | | | |
| | | For the period ended 6/30/19 | | One Year | | Five Years | | | Ten Years | | | Since Inception | | | Inception Date |
| | | | | | |
| | Class A | | -0.74% | | | 1.96 | % | | | 5.23 | % | | | 4.15 | % | | 1/2/98 |
| | Class C | | 3.24 | | | 2.34 | | | | 5.03 | | | | 3.65 | | | 1/2/98 |
| | Institutional | | 5.40 | | | 3.51 | | | | 6.24 | | | | 4.84 | | | 1/2/98 |
| | Service | | 4.90 | | | 3.14 | | | | 5.80 | | | | 4.35 | | | 1/2/98 |
| | Investor | | 5.27 | | | 3.37 | | | | 6.08 | | | | 3.60 | | | 11/30/07 |
| | Class P | | 5.41 | | | N/A | | | | N/A | | | | 2.54 | | | 4/17/18 |
| | Class R | | 4.75 | | | 2.89 | | | | 5.59 | | | | 3.12 | | | 11/30/07 |
| | | Class R6 | | 5.42 | | | N/A | | | | N/A | | | | 4.54 | | | 7/31/15 |
| | 3 | | The Standardized Total Returns are average annual total returns or cumulative total returns (only if the performance period is one year or less) as of the most recent calendarquarter-end. They assume reinvestment of all distributions at NAV. These returns reflect a maximum initialsales charge of 5.5% for Class A Shares and the assumed contingent deferred sales charge for Class C Shares (1% if redeemed within 12 months of purchase). Because Institutional, Service, Investor, Class P, Class R and Class R6 Shares do not involve a sales charge, such a charge is not applied to their Standardized Total Returns. |
The returns set forth in the table above represent past performance. Past performance does not guarantee future results. The Portfolio’s investment return and principal value will fluctuate so that an investor’s shares, when redeemed, may be worth more or less than their original cost. Current performance may be lower or higher than the performance quoted above. Please visit our web site at www.gsamfunds.com to obtain the most recentmonth-end returns.Performance reflects applicable fee waivers and/or expense limitations in effect during the periods shown. In their absence, performance would be reduced. Returns do not reflect the deduction of taxes that a shareholder would pay on Portfolio distributions or the redemption of Portfolio shares.
| | | | | | | | | | |
| | EXPENSE RATIOS4 | |
| | | |
| | | | | Net Expense Ratio (Current) | | | Gross Expense Ratio (Before Waivers) | |
| | | |
| | Class A | | | 1.25 | % | | | 1.30 | % |
| | Class C | | | 2.00 | | | | 2.05 | |
| | Institutional | | | 0.86 | | | | 0.91 | |
| | Service | | | 1.36 | | | | 1.41 | |
| | Investor | | | 1.00 | | | | 1.05 | |
| | Class P | | | 0.85 | | | | 0.90 | |
| | Class R | | | 1.50 | | | | 1.55 | |
| | | Class R6 | | | 0.85 | | | | 0.90 | |
| | 4 | | The expense ratios of the Portfolio, both current (net of applicable fee waivers and/or expense limitations) and before waivers (gross of applicable fee waivers and/or expense limitations) are as set forth above according to the most recent publicly available Prospectus for the Portfolio and may differ from the expense ratios disclosed in the Financial Highlights in this report. Pursuant to contractual arrangements, the Portfolio’s waivers and/or expense limitations will remain in place through at least April 30, 2020, and prior to such date, the Investment Adviser may not terminate the arrangements without the approval of the Portfolio’s Board of Trustees. If these arrangements are discontinued in the future, the expense ratios may change without shareholder approval. |
9
FUND BASICS
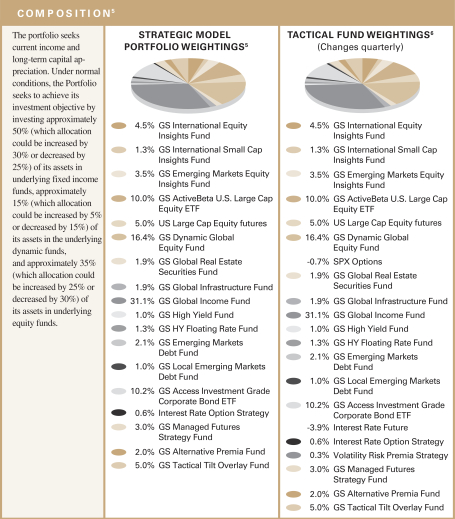
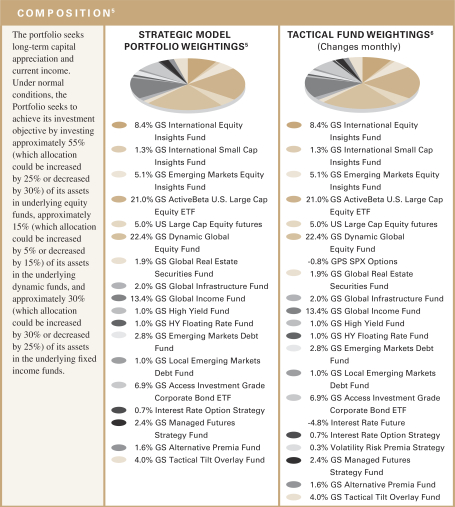
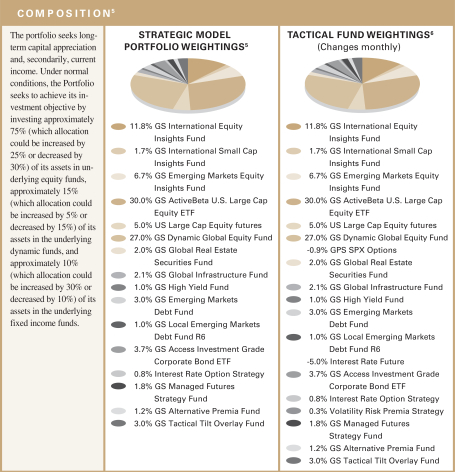
| | 5 | | Strategic allocation is the process of determining the areas of the global markets in which to invest, and in what long-term proportion, for each underlying fund. Our global approach attempts to generate strong long-term returns across geographies and asset classes, and is determined through a careful review of market opportunities and risk/return tradeoffs. On a monthly basis or as needed, we shift assets around the strategic allocation, over and under-weighting asset classes and countries relative to the neutral starting point, seeking to benefit from changing short-term conditions in global capital markets. This is called tactical asset allocation. |
| | 6 | | Generally, tactical fund weightings are rebalanced approximately monthly, but they may be rebalanced more or less frequently at the discretion of the Investment Adviser based on the market environment and its macro views. The weightings in the chart above reflect the allocations as of June 30, 2019. Actual Fund weighting in the Portfolio may differ from the figures shown above due to rounding, differences in returns of the Underlying Funds, or both. The above figures are not indicative of future allocations. |
10
FUND BASICS
|
| OVERALL UNDERLYING FUND WEIGHTINGS7 |
|
| Percentage of Net Assets |
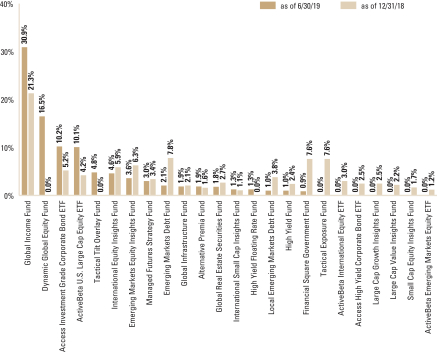
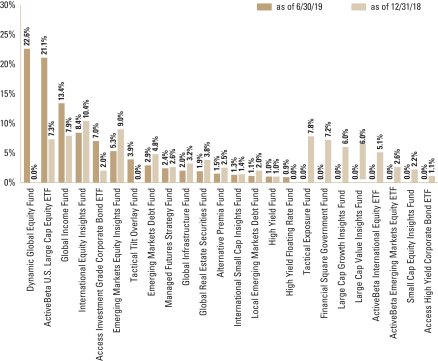
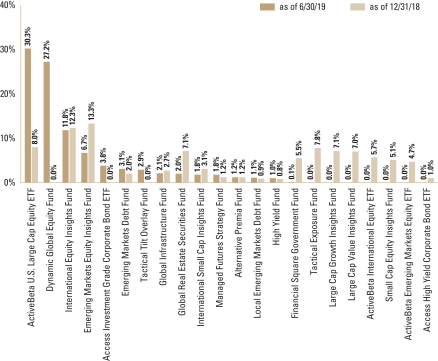
| | 7 | | The Portfolio is actively managed and, as such, its composition may differ over time. The percentage shown for each underlying fund reflects the value of that underlying fund as a percentage of net assets of the Portfolio. Figures in the above graph may not sum to 100% due to rounding and/or the exclusion of other assets and liabilities. The graph depicts the Portfolio’s investments but may not represent the Portfolio’s market exposure due to the exclusion of certain derivatives, if any, as listed in the Additional Investment Information section of the Schedule of Investments. |
11
FUND BASICS
Growth and Income Strategy
as of June 30, 2019
| | | | | | | | | | | | | | | | | | |
| | PERFORMANCE REVIEW | |
| | | | | |
| | | January 1, 2019–
June 30, 2019 | | Portfolio Total Return
(based on NAV)1 | | | Growth and Income
Strategy Composite Index2 | | | Bloomberg
Barclays Global
Index | | | MSCI ACWI Index | |
| | | | | |
| | Class A | | | 11.74 | % | | | 12.12 | % | | | 6.00 | % | | | 16.23 | % |
| | Class C | | | 11.37 | | | | 12.12 | | | | 6.00 | | | | 16.23 | |
| | Institutional | | | 12.08 | | | | 12.12 | | | | 6.00 | | | | 16.23 | |
| | Service | | | 11.71 | | | | 12.12 | | | | 6.00 | | | | 16.23 | |
| | Investor | | | 11.94 | | | | 12.12 | | | | 6.00 | | | | 16.23 | |
| | Class P | | | 12.01 | | | | 12.12 | | | | 6.00 | | | | 16.23 | |
| | Class R | | | 11.62 | | | | 12.12 | | | | 6.00 | | | | 16.23 | |
| | | Class R6 | | | 12.01 | | | | 12.12 | | | | 6.00 | | | | 16.23 | |
| | 1 | | The net asset value (“NAV”) represents the net assets of the class of the Portfolio(ex-dividend) divided by the total number of shares of the class outstanding. The Portfolio’s performance assumes the reinvestment of dividends and other distributions. The Portfolio’s performance does not reflect the deduction of any applicable sales charges. |
| | 2 | | The Growth and Income Strategy Composite Index (“Growth and Income Composite”) is a composite representation prepared by the Investment Adviser of the performance of the Portfolio’s asset classes weighted according to their respective weightings in the Portfolio’s target range. The Growth and Income Composite is comprised of a blend of the Bloomberg Barclays Global Aggregate Bond Index (Gross, USD, Hedged) (“Bloomberg Barclays Global Index”) (40%) and the MSCI All Country World Index (Net, USD, Unhedged) (“MSCI® ACWI Index”) (60%). The Growth and Income Composite figures do not reflect any deduction for fees, expenses or taxes. The Bloomberg Barclays Global Index is an unmanaged index, provides a broad-based measure of the global investment-gradefixed-rate debt markets and covers the most liquid portion of the global investment gradefixed-rate bond market, including government, credit and collateralized securities. The index figures do not include any deduction for fees, expenses or taxes. It is not possible to invest directly in an unmanaged index. The MSCI® ACWI Index is a freefloat-adjusted market capitalization weighted index that is designed to measure the equity market performance of developed and emerging markets. The MSCI® ACWI Index consists of 47 country indices comprising 23 developed and 24 emerging market country indices. The developed market country indices included are: Australia, Austria, Belgium, Canada, Denmark, Finland, France, Germany, Hong Kong, Ireland, Israel, Italy, Japan, Netherlands, New Zealand, Norway, Portugal, Singapore, Spain, Sweden, Switzerland, the United Kingdom and the United States. The emerging market country indices are: Brazil, Chile, China, Colombia, Czech Republic, Egypt, Greece, Hungary, India, Indonesia, Korea, Malaysia, Mexico, Pakistan, Peru, Philippines, Poland, Qatar, Russia, South Africa, Taiwan, Thailand, Turkey and the United Arab Emirates. The index figures do not include any deduction for fees or expenses. It is not possible to invest directly in an unmanaged index. |
The returns set forth in the table above represent past performance. Past performance does not guarantee future results. The Portfolio’s investment return and principal value will fluctuate so that an investor’s shares, when redeemed, may be worth more or less than their original cost. Current performance may be lower or higher than the performance quoted above. Please visit our web site at www.gsamfunds.com to obtain the most recentmonth-end returns.Performance reflects applicable fee waivers and/or expense limitations in effect during the periods shown. In their absence, performance would be reduced. Returns do not reflect the deduction of taxes that a shareholder would pay on Portfolio distributions or the redemption of Portfolio shares.
12
FUND BASICS
| | | | | | | | | | | | | | | | | | | | |
| | STANDARDIZED TOTAL RETURNS3 |
| | | | | | |
| | | For the period ended 6/30/19 | | One Year | | | Five Years | | | Ten Years | | | Since Inception | | | Inception Date |
| | | | | | |
| | Class A | | | -2.09 | % | | | 2.75 | % | | | 6.72 | % | | | 4.53 | % | | 1/2/98 |
| | Class C | | | 1.85 | | | | 3.15 | | | | 6.52 | | | | 4.02 | | | 1/2/98 |
| | Institutional | | | 4.10 | | | | 4.33 | | | | 7.76 | | | | 5.23 | | | 1/2/98 |
| | Service | | | 3.52 | | | | 3.82 | | | | 7.22 | | | | 4.71 | | | 1/2/98 |
| | Investor | | | 3.90 | | | | 4.20 | | | | 7.58 | | | | 3.55 | | | 11/30/07 |
| | Class P | | | 4.11 | | | | N/A | | | | N/A | | | | 1.33 | | | 4/17/18 |
| | Class R | | | 3.40 | | | | 3.67 | | | | 7.07 | | | | 3.06 | | | 11/30/07 |
| | | Class R6 | | | 4.04 | | | | N/A | | | | N/A | | | | 5.44 | | | 7/31/15 |
| | 3 | | The Standardized Total Returns are average annual total returns or cumulative total returns (only if the performance period is one year or less) as of the most recent calendarquarter-end. They assume reinvestment of all distributions at NAV. These returns reflect a maximum initial sales charge of 5.5% for Class A Shares and the assumed contingent deferred sales charge for Class C Shares (1% if redeemed within 12 months of purchase). Because Institutional, Service,Investor, Class P, Class R and Class R6 Shares do not involve a sales charge, such a charge is not applied to their Standardized Total Returns. |
The returns set forth in the table above represent past performance. Past performance does not guarantee future results. The Portfolio’s investment return and principal value will fluctuate so that an investor’s shares, when redeemed, may be worth more or less than their original cost. Current performance may be lower or higher than the performance quoted above. Please visit our web site at www.gsamfunds.com to obtain the most recentmonth-end returns.Performance reflects applicable fee waivers and/or expense limitations in effect during the periods shown. In their absence, performance would be reduced. Returns do not reflect the deduction of taxes that a shareholder would pay on Portfolio distributions or the redemption of Portfolio shares.
| | | | | | | | | | |
| | EXPENSE RATIOS4 | |
| | | |
| | | | | Net Expense Ratio (Current) | | | Gross Expense Ratio (Before Waivers) | |
| | | |
| | Class A | | | 1.23 | % | | | 1.26 | % |
| | Class C | | | 1.98 | | | | 2.01 | |
| | Institutional | | | 0.84 | | | | 0.87 | |
| | Service | | | 1.34 | | | | 1.37 | |
| | Investor | | | 0.98 | | | | 1.01 | |
| | Class P | | | 0.83 | | | | 0.86 | |
| | Class R | | | 1.48 | | | | 1.51 | |
| | | Class R6 | | | 0.83 | | | | 0.86 | |
| | 4 | | The expense ratios of the Portfolio, both current (net of applicable fee waivers and/or expense limitations) and before waivers (gross of applicable fee waivers and/or expense limitations) are as set forth above according to the most recent publicly available Prospectus for the Portfolio and may differ from the expense ratios disclosed in the Financial Highlights in this report. Pursuant to contractual arrangements, the Portfolio’s waivers and/or expense limitations will remain in place through at least April 30, 2020, and prior to such date, the Investment Adviser may not terminate the arrangements without the approval of the Portfolio’s Board of Trustees. If these arrangements are discontinued in the future, the expense ratios may change without shareholder approval. |
13
FUND BASICS
| | 5 | | Strategic allocation is the process of determining the areas of the global markets in which to invest, and in what long-term proportion, for each underlying fund. Our global approach attempts to generate strong long-term returns across geographies and asset classes, and is determined through a careful review of market opportunities and risk/return tradeoffs. On a monthly basis or as needed, we shift assets around the strategic allocation, over and under-weighting asset classes and countries relative to the neutral starting point, seeking to benefit from changing short-term conditions in global capital markets. This is called tactical asset allocation. |
| | 6 | | Generally, tactical fund weightings are rebalanced approximately monthly, but they may be rebalanced more or less frequently at the discretion of the Investment Adviser based on the market environment and its macro views. The weightings in the chart above reflect the allocations as of June 30, 2019. Actual underlying fund weighting in the Portfolio may differ from the figures shown above due to rounding, differences in returns of the underlying funds, or both. The above figures are not indicative of future allocations. |
14
FUND BASICS
|
| OVERALL UNDERLYING FUND WEIGHTINGS7 |
|
| Percentage of Net Assets |
| | 7 | | The Portfolio is actively managed and, as such, its composition may differ over time. The percentage shown for each underlying fund reflects the value of that underlying fund as a percentage of net assets of the Portfolio. Figures in the above graph may not sum to 100% due to rounding and/or the exclusion of other assets and liabilities. |
15
FUND BASICS
Growth Strategy
as of June 30, 2019
| | | | | | | | | | | | | | | | | | |
| | PERFORMANCE REVIEW | |
| | | | | |
| | | January 1, 2019–
June 30, 2019 | | Portfolio Total Return
(based on NAV)1 | | | Growth Strategy Composite Index2 | | | Bloomberg
Barclays Global
Index | | | MSCI ACWI Index | |
| | | | | |
| | Class A | | | 13.84 | % | | | 14.17 | % | | | 6.00 | % | | | 16.23 | % |
| | Class C | | | 13.38 | | | | 14.17 | | | | 6.00 | | | | 16.23 | |
| | Institutional | | | 14.00 | | | | 14.17 | | | | 6.00 | | | | 16.23 | |
| | Service | | | 13.73 | | | | 14.17 | | | | 6.00 | | | | 16.23 | |
| | Investor | | | 13.90 | | | | 14.17 | | | | 6.00 | | | | 16.23 | |
| | Class P | | | 13.99 | | | | 14.17 | | | | 6.00 | | | | 16.23 | |
| | Class R | | | 13.69 | | | | 14.17 | | | | 6.00 | | | | 16.23 | |
| | | Class R6 | | | 13.99 | | | | 14.17 | | | | 6.00 | | | | 16.23 | |
| | 1 | | The net asset value (“NAV”) represents the net assets of the class of the Portfolio(ex-dividend) divided by the total number of shares of the class outstanding. The Portfolio’s performance assumes the reinvestment of dividends and other distributions. The Portfolio’s performance does not reflect the deduction of any applicable sales charges. |
| | 2 | | The Growth Strategy Composite Index (“Growth Composite”) is a composite representation prepared by the Investment Advisor of the performance of the Portfolio’s asset classes weighted according to their respective weightings in the Portfolio’s target range. The Growth Composite is comprised of a blend of the Bloomberg Barclays Global Aggregate Bond Index (Gross, USD, Hedged) (“Bloomberg Barclays Global Index”) (20%) and the MSCI All Country World Index (Net, USD, Unhedged) (“MSCI® ACWI Index”) (80%). The Growth Strategy Composite figures do not reflect any deduction for fees, expenses or taxes. The Bloomberg Barclays Global Index is an unmanaged index, provides a broad-based measure of the global investment-gradefixed-rate debt markets and covers the most liquid portion of the global investment gradefixed-rate bond market, including government, credit and collateralized securities. The index figures do not include any deduction for fees, expenses or taxes. It is not possible to invest directly in an unmanaged index. The MSCI® ACWI Index is a freefloat-adjusted market capitalization weighted index that is designed to measure the equity market performance of developed and emerging markets. The MSCI® ACWI Index consists of 47 country indices comprising 23 developed and 24 emerging market country indices. The developed market country indices included are: Australia, Austria, Belgium, Canada, Denmark, Finland, France, Germany, Hong Kong, Ireland, Israel, Italy, Japan, Netherlands, New Zealand, Norway, Portugal, Singapore, Spain, Sweden, Switzerland, the United Kingdom and the United States. The emerging market country indices are: Brazil, Chile, China, Colombia, Czech Republic, Egypt, Greece, Hungary, India, Indonesia, Korea, Malaysia, Mexico, Pakistan, Peru, Philippines, Poland, Qatar, Russia, South Africa, Taiwan, Thailand, Turkey and the United Arab Emirates. The index figures do not include any deduction for fees or expenses. It is not possible to invest directly in an unmanaged index. |
The returns set forth in the table above represent past performance. Past performance does not guarantee future results. The Portfolio’s investment return and principal value will fluctuate so that an investor’s shares, when redeemed, may be worth more or less than their original cost. Current performance may be lower or higher than the performance quoted above. Please visit our web site at www.gsamfunds.com to obtain the most recentmonth-end returns.Performance reflects applicable fee waivers and/or expense limitations in effect during the periods shown. In their absence, performance would be reduced. Returns do not reflect the deduction of taxes that a shareholder would pay on Portfolio distributions or the redemption of Portfolio shares.
16
FUND BASICS
| | | | | | | | | | | | | | | | | | | | |
| | STANDARDIZED TOTAL RETURNS3 |
| | | | | | |
| | | For the period ended 6/30/19 | | One Year | | | Five Years | | | Ten Years | | | Since Inception | | | Inception Date |
| | | | | | |
| | Class A | | | -2.36 | % | | | 3.66 | % | | | 8.01 | % | | | 4.50 | % | | 1/2/98 |
| | Class C | | | 1.52 | | | | 4.05 | | | | 7.82 | | | | 4.00 | | | 1/2/98 |
| | Institutional | | | 3.63 | | | | 5.24 | | | | 9.05 | | | | 5.19 | | | 1/2/98 |
| | Service | | | 3.12 | | | | 4.72 | | | | 8.51 | | | | 4.67 | | | 1/2/98 |
| | Investor | | | 3.45 | | | | 5.09 | | | | 8.90 | | | | 3.56 | | | 11/30/07 |
| | Class P | | | 3.60 | | | | N/A | | | | N/A | | | | 0.83 | | | 4/17/18 |
| | Class R | | | 2.98 | | | | 4.57 | | | | 8.35 | | | | 3.05 | | | 11/30/07 |
| | | Class R6 | | | 3.67 | | | | N/A | | | | N/A | | | | 6.38 | | | 7/31/15 |
| | 3 | | The Standardized Total Returns are average annual total returns or cumulative total returns (only if the performance period is one year or less) as of the most recent calendarquarter-end. They assume reinvestment of all distributions at NAV. These returns reflect a maximum initial sales charge of 5.5% for Class A Shares and the assumed contingent deferred sales charge for Class C Shares (1% if redeemed within 12 months of purchase). Because Institutional, Service,Investor, Class P, Class R and Class R6 Shares do not involve a sales charge, such a charge is not applied to their Standardized Total Returns. |
The returns represent past performance. Past performance does not guarantee future results. The Portfolio’s investment return and principal value will fluctuate so that an investor’s shares, when redeemed, may be worth more or less than their original cost. Current performance may be lower or higher than the performance quoted above. Please visit our web site at www.GSAMFUNDS.com to obtain the most recentmonth-end returns.Performance reflects applicable fee waivers and/or expense limitations in effect during the periods shown. In their absence, performance would be reduced. Returns do not reflect the deduction of taxes that a shareholder would pay on Portfolio distributions or the redemption of Portfolio shares.
| | | | | | | | | | |
| | EXPENSE RATIOS4 | |
| | | |
| | | | | Net Expense Ratio (Current) | | | Gross Expense Ratio (Before Waivers) | |
| | | |
| | Class A | | | 1.27 | % | | | 1.30 | % |
| | Class C | | | 2.02 | | | | 2.05 | |
| | Institutional | | | 0.88 | | | | 0.91 | |
| | Service | | | 1.38 | | | | 1.41 | |
| | Investor | | | 1.02 | | | | 1.05 | |
| | Class P | | | 0.87 | | | | 0.90 | |
| | Class R | | | 1.52 | | | | 1.55 | |
| | | Class R6 | | | 0.87 | | | | 0.90 | |
| | 4 | | The expense ratios of the Portfolio, both current (net of applicable fee waivers and/or expense limitations) and before waivers (gross of applicable fee waivers and/or expense limitations) are as set forth above according to the most recent publicly available Prospectus for the Portfolio and may differ from the expense ratios disclosed in the Financial Highlights in this report. Pursuant to contractual arrangements, the Portfolio’s waivers and/or expense limitations will remain in place through at least April 30, 2020, and prior to such date, the Investment Adviser may not terminate the arrangements without the approval of the Portfolio’s Board of Trustees. If these arrangements are discontinued in the future, the expense ratios may change without shareholder approval. |
17
FUND BASICS
| | 5 | | Strategic allocation is the process of determining the areas of the global markets in which to invest, and in what long-term proportion, for each underlying fund. Our global approach attempts to generate strong long-term returns across geographies and asset classes, and is determined through a careful review of market opportunities and risk/return tradeoffs. On a monthly basis or as needed, we shift assets around the strategic allocation, over and under-weighting asset classes and countries relative to the neutral starting point, seeking to benefit from changing short-term conditions in global capital markets. This is called tactical asset allocation. |
| | 6 | | Generally, tactical fund weightings are rebalanced approximately monthly, but they may be rebalanced more or less frequently at the discretion of the Investment Adviser based on the market environment and its macro views. The weightings in the chart above reflect the allocations as of June 30, 2019. Actual underlying fund weighting in the Portfolio may differ from the figures shown above due to rounding, differences in returns of the underlying funds, or both. The above figures are not indicative of future allocations. |
18
FUND BASICS
|
| OVERALL UNDERLYING FUND WEIGHTINGS7 |
|
| Percentage of Net Assets |
| | 7 | | The Portfolio is actively managed and, as such, its composition may differ over time. The percentage shown for each underlying fund reflects the value of that underlying fund as a percentage of net assets of the Portfolio. Figures in the above graph may not sum to 100% due to rounding and/or the exclusion of other assets and liabilities. The graph depicts the Portfolio’s investments but may not represent the Portfolio’s market exposure due to the exclusion of certain derivatives, if any, as listed in the Additional Investment Information section of the Schedule of Investments. |
19
PORTFOLIO RESULTS
Goldman Sachs Satellite Strategies Portfolio
Investment Objective
The Portfolio seeks long-term capital appreciation.
Portfolio Management Discussion and Analysis
Below, the Goldman Sachs Global Portfolio Solutions Team discusses the performance and positioning of the Goldman Sachs Fund of Funds Portfolios — Satellite Strategies Portfolio (the “Portfolio”) for thesix-month period ended June 30, 2019 (the “Reporting Period”).
| Q | | How did the Portfolio perform during the Reporting Period? |
| A | | During the Reporting Period, the Portfolio’s Class A, Class C, Institutional, Service, Investor, Class P, Class R and Class R6 Shares generated cumulative total returns of 12.85%, 12.54%, 13.08%, 12.79%, 13.14%, 13.07%, 12.74% and 13.22%, respectively. This compares to the 12.28% cumulative total return of the Portfolio’s blended benchmark, which is composed 40% of the Bloomberg Barclays U.S. Aggregate Bond Index (the “Bloomberg Barclays U.S. Index”), 30% of the Standard & Poor’s 500 Index (the “S&P 500® Index”) and 30% of the MSCI EAFE Net Total Return Index (the “MSCI EAFE Index”), during the same period. |
| | | The components of the blended benchmark, the Bloomberg Barclays U.S. Index, the S&P 500® Index and the MSCI EAFE Index, generated cumulative total returns of 6.11%, 18.54% and 14.03%, respectively, during the same period. |
| Q | | How did various satellite asset classes perform during the Reporting Period? |
| A | | During the Reporting Period, satellite asset classes generated positive absolute returns. Relative to traditional equity and fixed income asset classes, performance across satellite asset classes was generally mixed. |
| | | Global infrastructure securities, as represented by the S&P Global Infrastructure Index (Net, Unhedged), performed best, generating a return of 19.45%, during the Reporting Period. It was one of only two equity satellite asset classes to outperform the equity component of the blended benchmark, which is an equal-weighted blend of U.S. and international stocks, as represented by the S&P 500® Index and the MSCI EAFE Index. These two indices were up 18.54% and 14.03%, respectively. Meanwhile, U.S. energy master limited partnerships (“MLPs”), as measured by the Alerian MLP Index, returned 16.96% during the Reporting Period and was the other equity satellite asset class to outperform the equity component of the blended benchmark. By contrast, emerging markets equities were the weakest performing equity satellite asset class, but still returned 10.58% as measured by the MSCI Emerging Markets Index (Net, Unhedged), during the Reporting Period. Internationalsmall-cap stocks also underperformed the equity component of the blended benchmark, returning 12.55%, as measured by the MSCI EAFE Small Cap Index (Net, Unhedged). Also underperforming the equity component of the blended benchmark was global real estate securities, as represented by the FTSE EPRA/Nareit Developed Index (Net, Unhedged), which returned 14.61% during the Reporting Period. |
| | | As for fixed income satellite asset classes, with the exception of leveraged loans, each outperformed the fixed income component of the blended benchmark, the Bloomberg Barclays U.S. Index. U.S. dollar-denominated emerging markets debt, as represented by the J.P. Morgan Emerging Market Bond Index Global Diversified Index, was the best-performing fixed income satellite asset class, up 10.60%. Next was U.S. high yield corporate bonds, which produced a gain of 9.94%, as measured by the Bloomberg Barclays U.S. Corporate High-Yield 2% Issuer Capped Bond Index. Local emerging markets debt, as represented by the J.P. Morgan Government Bond Index — Emerging Markets Global Diversified Index, generated 8.72%. Meanwhile, leveraged loans, as measured by the Credit Suisse Leveraged Loan Index, returned 5.42% compared to the fixed income component of the benchmark, which rose 6.11%. Leveraged loans tend to perform well in rising interest rate environments because they are floating-rate securities and their coupon rates reset regularly to reflect current interest rates. However, the Reporting Period was characterized by falling interest rates, as the Federal Reserve (the “Fed”) paused its short-term rate hikes, and the market anticipated a Fed rate cut some time in 2019. |
20
PORTFOLIO RESULTS
| Q | | What key factors were responsible for the Portfolio’s performance during the Reporting Period? |
| A | | The Portfolio seeks to achieve its investment objective by investing mainly in a combination of underlying funds and exchange-traded funds (“ETFs”) (collectively, the “Underlying Funds”). Some of the Portfolio’s Underlying Funds invest primarily in fixed income or money market instruments (the “Underlying Fixed Income Funds”), and some of the Underlying Funds invest primarily in equity securities (the “Underlying Equity Funds”). |
| | | The Portfolio’s performance is driven by four sources of return: long-term strategic asset allocation, medium-term cycle-aware allocation, short-term tactical allocation and excess returns from investments in Underlying Funds. Strategic asset allocation is the process by which we seek to budget or allocate portfolio risk, as opposed to capital, across a set of asset allocation risk factors, including but not limited to, equity, interest rate, emerging markets, credit, momentum and active risk. We apply a factor-based risk budgeting approach to develop a strategic allocation across the satellite asset classes included in the Portfolio. Our model focuses on broad asset classes, such as emerging markets, high yield credit and real assets. We then incorporate our medium-term cycle-aware views into the Portfolio in order to react to changes in the economic cycle. The Portfolio’s positioning may therefore change over time based on our medium-term cycle-aware views of attractive investment opportunities. These views may impact relative weighting across asset classes, the allocation to geographies, sectors and industries as well as the Portfolio’s duration and sensitivity to inflation. (Duration is a measure of a portfolio’s sensitivity to changes in interest rates.) |
| | | Overall, during the Reporting Period, our strategic asset allocation had a positive impact on the Portfolio’s results as did security selection within the Underlying Funds. Our medium-term cycle-aware allocation and our short-term tactical allocation detracted marginally from performance during the Reporting Period. |
| | | Strategic allocation added to the Portfolio’s returns during the Reporting Period. Among equity satellite asset classes, an allocation to global infrastructure securities contributed most positively, outpacing the equity component of the blended benchmark. Global infrastructure securities, which are interest-rate sensitive investments, benefited from the decline in U.S. interest rates during the Reporting Period. On the other hand, the Portfolio was hampered by its strategic allocation to emerging markets equities, which struggled versus developed markets equities amid renewed tensions in U.S.-China trade negotiations. Within fixed income asset classes, the Portfolio was helped by its strategic allocation to U.S. dollar-denominated emerging markets debt, which outpaced the fixed income component of the blended benchmark, as higher yielding fixed income generally outperformed investment grade fixed income during the Reporting Period. For the same reason, the Portfolio’s strategic allocations to high yield corporate bonds and local emerging markets debt added to results. Conversely, a strategic allocation to high yield floating rate bonds detracted from the Portfolio’s returns. Floating rate securities offer protection against rising interest rates, and by the end of the Reporting Period, the market was not expecting rates to go higher and was, in fact, anticipating a Fed interest rate cut. |
| | | Our medium-term cycle-aware allocation and short-term tactical allocation detracted slightly from the Portfolio’s performance during the Reporting Period. |
| | | Overall, security selection within the Underlying Funds contributed positively to Portfolio returns, with outperformance concentrated in the Underlying Fixed Income Funds. |
| Q | | How did the Portfolio’s Underlying Funds perform relative to their respective benchmark indices during the Reporting Period? |
| A | | During the Reporting Period, security selection within the Underlying Funds overall bolstered the Portfolio’s performance. All of the Underlying Fixed Income Funds outperformed their respective benchmark indices, including the Goldman Sachs Local Emerging Markets Debt Fund, the Goldman Sachs Emerging Markets Debt Fund, the Goldman Sachs High Yield Fund and the Goldman Sachs High Yield Floating Rate Fund. Performance among Underlying Equity Funds was mixed. The Goldman Sachs Emerging Markets Equity Fund, the Goldman Sachs Global Infrastructure Fund and the Goldman Sachs Global Real Estate Securities outperformed their respective benchmark indices. The Goldman Sachs Emerging Markets Equity Insights Fund and the Goldman Sachs MLP Energy Infrastructure Fund underperformed their respective benchmark indices during the Reporting Period. |
21
PORTFOLIO RESULTS
| Q | | How did the Portfolio use derivatives and similar instruments during the Reporting Period? |
| A | | During the Reporting Period, the Portfolio did not directly invest in derivatives. However, some of the Underlying Funds used derivatives to apply their active investment views with greater versatility and to potentially afford greater risk management precision. As market conditions warranted, some of these Underlying Funds engaged in forward foreign currency exchange contracts, financial futures contracts, options, swap contracts and structured securities to attempt to enhance portfolio return and for hedging purposes. |
| Q | | What changes did you make during the Reporting Period within the Portfolio? |
| A | | We made some adjustments to the Portfolio’s allocations during the Reporting Period. In March 2019, we added a small allocation to energy MLP infrastructure securities through an investment in the Goldman Sachs MLP Energy Infrastructure Fund. We believed energy MLP infrastructure securities offered attractive dividend yields, given our expectations for generally steady interest rates, benign inflation and fairly stable economic growth in the near term. To fund this allocation, we reduced the Portfolio’s exposure to internationalsmall-cap equities, preferring U.S. exposure over international exposure at that particular time. |
| | | Additionally, toward the end of the Reporting Period, we sought to reduce the Portfolio’s equity risk by reducing its allocation to emerging markets equities, which we accomplished by slightly reducing its allocation to the Goldman Sachs Emerging Markets Equity Insights Fund and increasing its cash position. |
| Q | | Were there any changes to the Portfolio’s portfolio management team during the Reporting Period? |
| A | | Effective February 19, 2019, Raymond Chan no longer served as a portfolio manager of the Portfolio. Additionally, Neill Nuttall began serving as a portfolio manager of the Portfolio on February 19, 2019. By design, all investment decisions for the Portfolio are performed within aco-lead or team structure, with multiple subject matter experts. This strategic decision making has been the cornerstone of our approach and ensures continuity in the Portfolio. At the end of the Reporting Period, the portfolio managers for the Portfolio were Neill Nuttall and Christopher Lvoff. |
22
FUND BASICS
Satellite Strategies Portfolio
as of June 30, 2019
| | | | | | | | | | | | | | | | | | | | | | |
| | PERFORMANCE REVIEW | |
| | | | | | |
| | | January 1, 2019– June 30, 2019 | | Fund Total
Return
(based on
NAV)1 | | | Satellite
Strategies
Composite Index2 | | | Bloomberg
Barclays U.S.
Aggregate Bond
Index | | | MSCI® EAFE®
Net Total
Return Index | | | S&P 500®
Index | |
| | | | | | |
| | Class A | | | 12.85 | % | | | 12.28 | % | | | 6.11 | % | | | 14.03 | % | | | 18.54 | % |
| | Class C | | | 12.54 | | | | 12.28 | | | | 6.11 | | | | 14.03 | | | | 18.54 | |
| | Institutional | | | 13.08 | | | | 12.28 | | | | 6.11 | | | | 14.03 | | | | 18.54 | |
| | Service | | | 12.79 | | | | 12.28 | | | | 6.11 | | | | 14.03 | | | | 18.54 | |
| | Investor | | | 13.14 | | | | 12.28 | | | | 6.11 | | | | 14.03 | | | | 18.54 | |
| | Class P | | | 13.07 | | | | 12.28 | | | | 6.11 | | | | 14.03 | | | | 18.54 | |
| | Class R | | | 12.74 | | | | 12.28 | | | | 6.11 | | | | 14.03 | | | | 18.54 | |
| | | Class R6 | | | 13.22 | | | | 12.28 | | | | 6.11 | | | | 14.03 | | | | 18.54 | |
| | 1 | | The net asset value (“NAV”) represents the net assets of the class of the Portfolio (ex-dividend) divided by the total number of shares of the class outstanding. The Portfolio’s performance reflects the reinvestment of dividends and other distributions. The Portfolio’s performance does not reflect the deduction of any applicable sales charges. |
| | 2 | | The Satellite Strategies Composite Index (“Satellite Composite”) is a composite representation prepared by the Investment Adviser of the performance of the Portfolio’s asset classes weighted according to their respective weightings in the Portfolio’s target range. The Satellite Composite is comprised of the Bloomberg Barclays U.S. Aggregate Bond Index (40%), the S&P 500® Index (30%), and the MSCI® EAFE® Net Total Return Index (30%). The Satellite Composite figures do not reflect any deduction for fees, expenses or taxes. The Bloomberg Barclays U.S. Aggregate Bond Index represents an unmanaged diversified portfolio of fixed income securities, including U.S. Treasuries, investment-grade corporate bonds, and mortgage-backed and asset-backed securities. The S&P 500® Index is the Standard & Poor’s 500 Composite Index of 500 stocks, an unmanaged index of common stock prices. The unmanaged MSCI® EAFE® Index is a market capitalization weighted composite of securities in 21 developed markets. The index figures do not include any deduction for fees, expenses or taxes. It is not possible to invest directly in an unmanaged index. The index figures do not include any deduction for fees, expenses or taxes. It is not possible to invest directly in an index. |
23
FUND BASICS
| | | | | | | | | | | | | | | | | | | | |
| | STANDARDIZED TOTAL RETURNS3 |
| | | | | | |
| | | For the period ended 6/30/19 | | One Year | | | Five Years | | | Ten Years | | | Since Inception | | | Inception Date |
| | | | | | |
| | Class A | | | -0.67 | % | | | 0.91 | % | | | 5.83 | % | | | 1.75 | % | | 3/30/07 |
| | Class C | | | 3.32 | | | | 1.31 | | | | 5.64 | | | | 1.46 | | | 3/30/07 |
| | Institutional | | | 5.55 | | | | 2.45 | | | | 6.84 | | | | 2.61 | | | 3/30/07 |
| | Service | | | 4.99 | | | | 1.97 | | | | 6.33 | | | | 2.66 | | | 8/29/08 |
| | Investor | | | 5.52 | | | | 2.35 | | | | 6.70 | | | | 2.09 | | | 11/30/07 |
| | Class P | | | 5.55 | | | | N/A | | | | N/A | | | | 1.69 | | | 4/17/18 |
| | Class R | | | 4.85 | | | | 1.83 | | | | 6.18 | | | | 1.58 | | | 11/30/07 |
| | | Class R6 | | | 5.56 | | | | N/A | | | | N/A | | | | 4.49 | | | 7/31/15 |
| | 3 | | The Standardized Total Returns are average annual total returns or cumulative total returns (only if the performance period is one year or less) as of the most recent calendar quarter-end. They assume reinvestment of all distributions at NAV. These returns reflect a maximum initial sales charge of 5.5% for Class A Shares and the assumed contingent deferred sales charge for Class C Shares (1% if redeemed within 12 months of purchase). Because Institutional, Service, Investor, Class P, Class R and Class R6 Shares do not involve a sales charge, such a charge is not applied to their Standardized Total Returns. |
The returns set forth in the tables above represent past performance. Past performance does not guarantee future results. The Portfolio’s investment returnand principal value will fluctuate so that an investor’s shares, when redeemed, may be worth more or less than their original cost. Current performance may be lower or higher than the performance quoted above. Please visit our web site at www.GSAMFUNDS.com to obtain the most recent month-end returns. Performance reflects applicable fee waivers and/or expense limitations in effect during the periods shown. In their absence, performance would be reduced. Returns do not reflect the deduction of taxes that a shareholder would pay on Portfolio distributions or the redemption of Portfolio shares.
| | | | | | | | | | |
| | EXPENSE RATIOS4 | |
| | | |
| | | | | Net Expense Ratio (Current) | | | Gross Expense Ratio (Before Waivers) | |
| | | |
| | Class A | | | 1.42 | % | | | 1.47 | % |
| | Class C | | | 2.17 | | | | 2.22 | |
| | Institutional | | | 1.03 | | | | 1.08 | |
| | Service | | | 1.53 | | | | 1.58 | |
| | Investor | | | 1.17 | | | | 1.22 | |
| | Class P | | | 1.02 | | | | 1.07 | |
| | Class R | | | 1.67 | | | | 1.72 | |
| | | Class R6 | | | 1.02 | | | | 1.07 | |
| | 4 | | The expense ratios of the Portfolio, both current (net of applicable fee waivers and/or expense limitations) and before waivers (gross of applicable fee waivers and/or expense limitations) are as set forth above according to the most recent publicly available Prospectus for the Portfolio and may differ from the expense ratios disclosed in the Financial Highlights in this report. Pursuant to contractual arrangements, the Portfolio’s waivers and/or expense limitations will remain in place through at least April 30, 2020, and prior to such date, the Investment Adviser may not terminate the arrangements without the approval of the Portfolio’s Board of Trustees. If these arrangements are discontinued in the future, the expense ratios may change without shareholder approval. |
24
FUND BASICS
| | | | | | |
| | TARGET RISK-CONTRIBUTION INVESTMENT PORTFOLIO5 AS OF 6/30/19 |
| |
| | | Percentage of Investment Portfolio |
| |
| | |  |
| | 5 | | Generally, tactical fund weightings are rebalanced approximately monthly, but they may be rebalanced more or less frequently at the discretion of the Investment Adviser based on the market environment and its macro views. The weightings in the chart above reflect the allocations as of June 30, 2019. Actual underlying fund weighting in the Portfolio may differ from the figures shown above due to rounding, differences in returns of the underlying funds, or both. The above figures are not indicative of future allocations. |
25
FUND BASICS
|
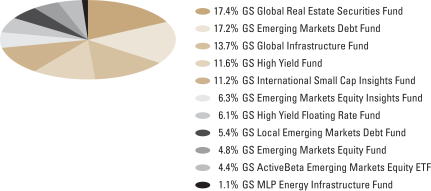
| OVERALL UNDERLYING FUND WEIGHTINGS6 |
|
| Percentage of Net Assets |

| | 6 | | The Portfolio is actively managed and, as such, its composition may differ over time. The percentage shown for each underlying fund reflects the value of that underlying fund as a percentage of net assets of the Portfolio. Figures in the above graph may not sum to 100% due to rounding and/or the exclusion of other assets and liabilities. The graph depicts the Portfolio’s investments but may not represent the Portfolio’s market exposure due to the exclusion of certain derivatives, if any, as listed in the Additional Investment Information section of the Schedule of Investments. |
26
GOLDMAN SACHS FUND OF FUNDS PORTFOLIOS
Index Definitions
Alerian MLP Index is the leading gauge of energy infrastructure master limited partnerships. The capped, float-adjusted, capitalization-weighted index, whose constituents earn the majority of their cash flow from midstream activities involving energy commodities, is disseminated real-time on a price-return basis (AMZ) and on a total-return basis (AMZX).
Bloomberg Barclays U.S. Corporate High-Yield 2% Issuer Capped Bond Index, an unmanaged index, covers the universe of U.S. dollar denominated,non-convertible, fixed rate, noninvestment grade debt. Index holdings must have at least one year to final maturity, at least $150 million par amount outstanding, and be publicly issued with a rating of Ba1 or lower.
Credit Suisse Leveraged Loan Index is designed to mirror the investable universe of the U.S. dollar-denominated leveraged loan market.
FTSE EPRA/NAREIT Developed Index is a free-float adjusted, market capitalization-weighted index designed to track the performance of listed real estate companies in developed countries worldwide. Constituents of the Index are screened on liquidity, size and revenue.
J.P. Morgan Emerging Market Bond Index – Global Diversified Index is an unmanaged index of external debt instruments of emerging countries. The index is positioned as the investable benchmark that includes only those countries that are accessible by most of the international investor base and is popular largely due to its diversification weighting scheme and country coverage.
J.P. Morgan Government Bond Index – Emerging Markets Global Diversified Index is an unmanaged index of debt instruments issued by emerging markets governments in local currency. As emerging markets look increasingly toward their domestic market for sources of finance, investors are looking more closely at local markets in search for higher yield and greater diversification.
MSCI ACWI Investable Market Index captures large, mid and small cap representation across 23 developed markets and 26 emerging markets countries.
MSCI China Index captures large and mid cap representation across China H shares, B shares, Red chips, P chips and foreign listings.
MSCI EAFE Small Cap Index is an equity index that capturessmall-cap representation across developed markets countries around the world, excluding the U.S. and Canada. The index covers approximately 14% of the free float-adjusted market capitalization in each country. Developed markets countries in the index include Australia, Austria, Belgium, Denmark, Finland, France, Germany, Hong Kong, Ireland, Israel, Italy, Japan, the Netherlands, New Zealand, Norway, Portugal, Singapore, Spain, Sweden, Switzerland and the U.K.
MSCI Emerging Markets Index captureslarge-cap andmid-cap representation across 24 emerging markets countries. The index covers approximately 85% of the free float-adjusted market capitalization in each country. Emerging markets countries in the index include Brazil, Chile, China, Colombia, Czech Republic, Egypt, Greece, Hungary, India, Indonesia, Korea, Malaysia, Mexico, Pakistan, Peru, Philippines, Poland, Qatar, Russia, South Africa, Taiwan, Thailand, Turkey and United Arab Emirates.
S&P 500® Index is a U.S. stock market index based on the market capitalizations of 500 large companies having common stock listed on the New York Stock Exchange or NASDAQ. The S&P 500® Index components and their weightings are determined by S&P Dow Jones Indices.
S&P Global Infrastructure Index is designed to track 75 companies from around the world chosen to represent the listed infrastructure industry while maintaining liquidity and tradability. To create diversified exposure, the index includes three distinct infrastructure clusters: energy, transportation, and utilities.
It is not possible to invest directly in an unmanaged index.
27
GOLDMAN SACHS BALANCED STRATEGY PORTFOLIO
Schedule of Investments
June 30, 2019 (Unaudited)
| | | | | | | | |
| Shares | | | Description | | Value | |
|
| Underlying Funds(a) – 95.9% | |
| Dynamic – 9.8% | |
| | 2,551,020 | | | Goldman Sachs Tactical Tilt Overlay Fund – Class R6 | | $ | 25,051,021 | |
| | 1,442,230 | | | Goldman Sachs Managed Futures Strategy Fund – Class R6 | | | 15,590,511 | |
| | 1,222,483 | | | Goldman Sachs Alternative Premia Fund – Class R6 | | | 9,951,014 | |
| | | | | | | | |
| | | | | | | 50,592,546 | |
| | |
| Equity – 29.6% | |
| | 4,474,555 | | | Goldman Sachs Dynamic Global Equity Fund – Class R6 | | | 85,329,759 | |
| | 1,884,686 | | | Goldman Sachs International Equity Insights Fund – Class R6 | | | 23,671,654 | |
| | 1,928,832 | | | Goldman Sachs Emerging Markets Equity Insights Fund – Class R6 | | | 18,458,919 | |
| | 852,755 | | | Goldman Sachs Global Infrastructure Fund – Class R6 | | | 9,960,174 | |
| | 823,291 | | | Goldman Sachs Global Real Estate Securities Fund – Class R6 | | | 9,237,322 | |
| | 580,971 | | | Goldman Sachs International Small Cap Insights Fund – Class R6 | | | 6,675,354 | |
| | | | | | | | |
| | | | | | | 153,333,182 | |
| | |
| Exchange Traded Funds – 20.3% | |
| | 1,024,880 | | | Goldman Sachs Access Investment Grade Corporate Bond ETF | | | 52,678,832 | |
| | 893,864 | | | Goldman Sachs ActiveBeta U.S. Large Cap Equity ETF | | | 52,532,387 | |
| | | | | | | | |
| | | | | | | 105,211,219 | |
| | |
| Fixed Income – 36.2% | |
| | 12,499,151 | | | Goldman Sachs Global Income Fund – Class R6 | | | 159,864,139 | |
| | 888,054 | | | Goldman Sachs Emerging Markets Debt Fund – Class R6 | | | 11,100,669 | |
| | 691,115 | | | Goldman Sachs High Yield Floating Rate Fund – Class R6 | | | 6,496,481 | |
| | 873,278 | | | Goldman Sachs Local Emerging Markets Debt Fund – Class R6 | | | 5,265,867 | |
| | 778,274 | | | Goldman Sachs High Yield Fund – Class R6 | | | 4,988,738 | |
| | | | | | | | |
| | | | | | | 187,715,894 | |
| | |
| | TOTAL UNDERLYING FUNDS – 95.9% | |
| | (Cost $488,793,571) | | $ | 496,852,841 | |
| | |
| | | | | | | | |
| Shares | | | Dividend
Rate | | Value | |
|
| Investment Company(a) – 0.9% | |
| Goldman Sachs Financial Square Government Fund –
Institutional Shares |
�� |
| | 4,408,283 | | | 2.308% | | $ | 4,408,283 | |
| | (Cost $4,408,283) | |
| | |
| | TOTAL INVESTMENTS – 96.8% | |
| | (Cost $493,201,854) | | $ | 501,261,124 | |
| | |
| OTHER ASSETS IN EXCESS OF
LIABILITIES – 3.2% | | | 16,560,578 | |
| | |
| | NET ASSETS – 100.0% | | $ | 517,821,702 | |
| | |
| | |
|
| The percentage shown for each investment category reflects the value of investments in that category as a percentage of net assets. |
| |
(a) | | Represents an Affiliated Issuer. |
| | |
|
Currency Abbreviations: |
AUD | | —Australian Dollar |
CHF | | —Swiss Franc |
DKK | | —Danish Krone |
EUR | | —Euro |
GBP | | —British Pound |
HKD | | —Hong Kong Dollar |
ILS | | —Israeli Shekel |
JPY | | —Japanese Yen |
NOK | | —Norwegian Krone |
NZD | | —New Zealand |
SEK | | —Swedish Krona |
SGD | | —Singapore Dollar |
USD | | —U.S. Dollar |
| | |
Investment Abbreviations: |
ETF | | —Exchange Traded Fund |
|
| | |
| 28 | | The accompanying notes are an integral part of these financial statements. |
GOLDMAN SACHS BALANCED STRATEGY PORTFOLIO
|
| ADDITIONAL INVESTMENT INFORMATION |
FORWARD FOREIGN CURRENCY EXCHANGE CONTRACTS — At June 30, 2019, the Portfolio had the following forward foreign currency exchange contracts:
FORWARD FOREIGN CURRENCY EXCHANGE CONTRACTS WITH UNREALIZED GAIN
| | | | | | | | | | | | | | | | | | | | |
| Counterparty | | Currency Purchased | | | Currency Sold | | | Settlement
Date | | | Unrealized
Gain | |
MS & Co. Int. PLC | | USD | | | 3,161,672 | | | GBP | | | 2,470,000 | | | | 09/18/19 | | | $ | 13,718 | |
| | | USD | | | 4,620,378 | | | JPY | | | 495,000,000 | | | | 09/18/19 | | | | 2,325 | |
| | | | | | |
| TOTAL | | | | | | | | | | | | | | | | | | $ | 16,043 | |
FORWARD FOREIGN CURRENCY EXCHANGE CONTRACTS WITH UNREALIZED LOSS
| | | | | | | | | | | | | | | | | | | | |
| Counterparty | | Currency Purchased | | | Currency Sold | | | Settlement
Date | | | Unrealized
Loss | |
MS & Co. Int. PLC | | USD | | | 714,157 | | | HKD | | | 5,590,000 | | | | 09/18/19 | | | $ | (1,690 | ) |
| | USD | | | 1,717,396 | | | CHF | | | 1,680,000 | | | | 09/18/19 | | | | (15,971 | ) |
| | USD | | | 46,728 | | | NZD | | | 70,000 | | | | 09/18/19 | | | | (368 | ) |
| | USD | | | 334,138 | | | DKK | | | 2,190,000 | | | | 09/18/19 | | | | (1,754 | ) |
| | USD | | | 55,925 | | | ILS | | | 200,000 | | | | 09/18/19 | | | | (391 | ) |
| | USD | | | 506,182 | | | SEK | | | 4,725,000 | | | | 09/18/19 | | | | (5,528 | ) |
| | USD | | | 6,034,066 | | | EUR | | | 5,300,000 | | | | 09/18/19 | | | | (30,506 | ) |
| | USD | | | 133,245 | | | NOK | | | 1,150,000 | | | | 09/18/19 | | | | (1,862 | ) |
| | USD | | | 257,243 | | | SGD | | | 350,000 | | | | 09/18/19 | | | | (1,753 | ) |
| | | USD | | | 1,340,834 | | | AUD | | | 1,910,000 | | | | 09/18/19 | | | | (3,294 | ) |
| | | | | | |
| TOTAL | | | | | | | | | | | | | | | | | | $ | (63,117 | ) |
FUTURES CONTRACTS — At June 30, 2019, the Portfolio had the following futures contracts:
| | | | | | | | | | | | | | | | |
| Description | | Number of
Contracts | | | Expiration
Date | | | Notional
Amount | | | Unrealized
Appreciation/
(Depreciation) | |
Long position contracts: | | | | | | | | | | | | | | | | |
S&P 500E-Mini Index | | | 177 | | | | 09/20/19 | | | $ | 26,056,170 | | | $ | 437,756 | |
Short position contracts: | | | | | | | | | | | | | | | | |
Eurodollars | | | (766 | ) | | | 09/14/20 | | | | (188,522,175 | ) | | | (1,890,666 | ) |
| |
| TOTAL FUTURES CONTRACTS | | | $ | (1,452,910 | ) |
| | |
| The accompanying notes are an integral part of these financial statements. | | 29 |
GOLDMAN SACHS BALANCED STRATEGY PORTFOLIO
Schedule of Investments(continued)
June 30, 2019 (Unaudited)
|
| ADDITIONAL INVESTMENT INFORMATION (continued) |
PURCHASED OPTIONS CONTRACTS — At June 30, 2019, the Portfolio had the following purchased options:
EXCHANGE TRADED OPTIONS ON FUTURES
| | | | | | | | | | | | | | | | | | | | | | | | | | | | |
| Description | | Exercise
Price | | | Expiration
Date | | | Number of
Contracts | | | Notional
Amount | | | Market
Value | | | Premiums
Paid (Received)
by Portfolio | | | Unrealized
Appreciation/
(Depreciation) | |
Purchased option contracts | | | | | | | | | | | | | | | | | | | | | | | | | | | | |
Calls | | | | | | | | | | | | | | | | | | | | | | | | | | | | |
Eurodollar Futures | | $ | 97.75 | | | | 09/16/2019 | | | | 89 | | | $ | 222,500 | | | $ | 58,962 | | | $ | 40,081 | | | $ | 18,881 | |
Eurodollar Futures | | | 98.50 | | | | 03/16/2020 | | | | 84 | | | | 210,000 | | | | 28,350 | | | | 28,545 | | | | (195 | ) |
Eurodollar Futures | | | 98.50 | | | | 06/15/2020 | | | | 55 | | | | 137,500 | | | | 30,250 | | | | 27,628 | | | | 2,622 | |
Eurodollar Futures | | | 97.50 | | | | 09/14/2020 | | | | 63 | | | | 157,500 | | | | 151,200 | | | | 48,904 | | | | 102,296 | |
Eurodollar Futures | | | 97.50 | | | | 12/14/2020 | | | | 59 | | | | 147,500 | | | | 143,075 | | | | 56,269 | | | | 86,806 | |
Eurodollar Futures | | | 97.00 | | | | 03/15/2021 | | | | 60 | | | | 150,000 | | | | 219,750 | | | | 107,389 | | | | 112,361 | |
Eurodollar Futures | | | 98.25 | | | | 03/15/2021 | | | | 512 | | | | 1,280,000 | | | | 595,200 | | | | 595,313 | | | | (113 | ) |
Eurodollar Futures | | | 97.00 | | | | 06/14/2021 | | | | 58 | | | | 145,000 | | | | 209,524 | | | | 107,434 | | | | 102,090 | |
Eurodollar Futures | | | 98.00 | | | | 06/14/2021 | | | | 223 | | | | 557,500 | | | | 348,438 | | | | 181,659 | | | | 166,779 | |
Eurodollar Futures | | | 98.25 | | | | 06/14/2021 | | | | 451 | | | | 1,127,500 | | | | 535,562 | | | | 554,796 | | | | (19,234 | ) |
Eurodollar Futures | | | 97.00 | | | | 09/13/2021 | | | | 31 | | | | 77,500 | | | | 110,438 | | | | 76,022 | | | | 34,416 | |
Eurodollar Futures | | | 98.25 | | | | 09/13/2021 | | | | 441 | | | | 1,102,500 | | | | 534,713 | | | | 527,911 | | | | 6,802 | |
Eurodollar Futures | | | 98.50 | | | | 12/13/2021 | | | | 299 | | | | 747,500 | | | | 276,575 | | | | 292,556 | | | | (15,981 | ) |
| | | | | | | |
| TOTAL | | | | | | | | | | | 2,425 | | | $ | 6,062,500 | | | $ | 3,242,037 | | | $ | 2,644,507 | | | $ | 597,530 | |
OVER-THE-COUNTER OPTIONS ON EQUITIES
| | | | | | | | | | | | | | | | | | | | | | | | | | | | | | |
| Description | | Counterparty | | Exercise
Price | | | Expiration
Date | | | Number of
Contracts | | | Notional
Amount | | | Market
Value | | | Premiums
Paid (Received)
by Portfolio | | | Unrealized
Appreciation/
(Depreciation) | |
Purchased option contracts | | | | | | | | | | | | | | | | | | | | | | | | | | | | | | |
Puts | | | | | | | | | | | | | | | | | | | | | | | | | | | | | | |
SPX Index | | Barclays Bank PLC | | $ | 2,801.58 | | | | 01/17/2020 | | | | 3,649 | | | $ | 3,649 | | | $ | 291,518 | | | $ | 323,739 | | | $ | (32,221 | ) |
| | |
|
Abbreviations: |
MS & Co. Int. PLC—Morgan Stanley & Co. International PLC |
|
| | |
| 30 | | The accompanying notes are an integral part of these financial statements. |
GOLDMAN SACHS GROWTH AND INCOME STRATEGY PORTFOLIO
Schedule of Investments
June 30, 2019 (Unaudited)
| | | | | | | | |
| Shares | | | Description | | Value | |
|
| Underlying Funds(a) – 96.6% | |
| Dynamic – 7.8% | |
| | 3,571,429 | | | Goldman Sachs Tactical Tilt Overlay Fund – Class R6 | | $ | 35,071,428 | |
| | 2,007,875 | | | Goldman Sachs Managed Futures Strategy Fund – Class R6 | | | 21,705,132 | |
| | 1,677,199 | | | Goldman Sachs Alternative Premia Fund – Class R6 | | | 13,652,404 | |
| | | | | | | | |
| | | | | | | 70,428,964 | |
| | |
| Equity – 41.4% | |
| | 10,626,703 | | | Goldman Sachs Dynamic Global Equity Fund – Class R6 | | | 202,651,226 | |
| | 5,999,780 | | | Goldman Sachs International Equity Insights Fund – Class R6 | | | 75,357,235 | |
| | 4,946,479 | | | Goldman Sachs Emerging Markets Equity Insights Fund – Class R6 | | | 47,337,801 | |
| | 1,569,998 | | | Goldman Sachs Global Infrastructure Fund – Class R6 | | | 18,337,574 | |
| | 1,492,445 | | | Goldman Sachs Global Real Estate Securities Fund – Class R6 | | | 16,745,238 | |
| | 1,019,255 | | | Goldman Sachs International Small Cap Insights Fund – Class R6 | | | 11,711,239 | |
| | | | | | | | |
| | | | | | | 372,140,313 | |
| | |
| Exchange Traded Funds – 28.1% | |
| | 3,219,888 | | | Goldman Sachs ActiveBeta U.S. Large Cap Equity ETF | | | 189,232,818 | |
| | 1,219,295 | | | Goldman Sachs Access Investment Grade Corporate Bond ETF | | | 62,671,763 | |
| | | | | | | | |
| | | | | | | 251,904,581 | |
| | |
| Fixed Income – 19.3% | |
| | 9,383,981 | | | Goldman Sachs Global Income Fund – Class R6 | | | 120,021,121 | |
| | 2,094,517 | | | Goldman Sachs Emerging Markets Debt Fund – Class R6 | | | 26,181,466 | |
| | 1,589,227 | | | Goldman Sachs Local Emerging Markets Debt Fund – Class R6 | | | 9,583,039 | |
| | |
| | 1,356,238 | | | Goldman Sachs High Yield Fund – Class R6 | | | 8,693,483 | |
| | 903,766 | | | Goldman Sachs High Yield Floating Rate Fund – Class R6 | | | 8,495,398 | |
| | | | | | | | |
| | | | | | | 172,974,507 | |
| | |
| | TOTAL UNDERLYING FUNDS – 96.6% | |
| | (Cost $838,089,142) | | $ | 867,448,365 | |
| | |
| OTHER ASSETS IN EXCESS OF
LIABILITIES – 3.4% | | | 30,740,147 | |
| | |
| | NET ASSETS – 100.0% | | $ | 898,188,512 | |
| | |
| | |
|
| The percentage shown for each investment category reflects the value of investments in that category as a percentage of net assets. |
| |
(a) | | Represents an Affiliated Issuer. |
| | |
|
Currency Abbreviations: |
AUD | | —Australian Dollar |
CHF | | —Swiss Franc |
DKK | | —Danish Krone |
EUR | | —Euro |
GBP | | —British Pound |
HKD | | —Hong Kong Dollar |
ILS | | —Israeli Shekel |
JPY | | —Japanese Yen |
NOK | | —Norwegian Krone |
NZD | | —New Zealand Dollar |
SEK | | —Swedish Krona |
SGD | | —Singapore Dollar |
USD | | —U.S. Dollar |
|
Investment Abbreviations: |
ETF | | —Exchange Traded Fund |
|
|
| ADDITIONAL INVESTMENT INFORMATION |
FORWARD FOREIGN CURRENCY EXCHANGE CONTRACTS — At June 30, 2019, the Portfolio had the following forward foreign currency exchange contracts:
FORWARD FOREIGN CURRENCY EXCHANGE CONTRACTS WITH UNREALIZED GAIN
| | | | | | | | | | | | | | | | | | | | |
| Counterparty | | Currency
Purchased | | | Currency
Sold | | | Settlement
Date | | | Unrealized
Gain | |
| | | | | | |
MS & Co. Int. PLC | | USD | | | 3,645,127 | | | GBP | | | 2,855,000 | | | | 09/18/19 | | | $ | 6,501 | |
| | |
| The accompanying notes are an integral part of these financial statements. | | 31 |
GOLDMAN SACHS GROWTH AND INCOME STRATEGY PORTFOLIO
Schedule of Investments(continued)
June 30, 2019 (Unaudited)
|
| ADDITIONAL INVESTMENT INFORMATION (continued) |
FORWARD FOREIGN CURRENCY EXCHANGE CONTRACTS WITH UNREALIZED LOSS
| | | | | | | | | | | | | | | | | | | | |
| Counterparty | | Currency
Purchased | | | Currency
Sold | | | Settlement
Date | | | Unrealized
Loss | |
MS & Co. Int. PLC | | USD | | | 6,954,185 | | | EUR | | | 6,130,000 | | | | 09/18/19 | | | $ | (60,122 | ) |
| | USD | | | 826,526 | | | HKD | | | 6,470,000 | | | | 09/18/19 | | | | (2,013 | ) |
| | USD | | | 67,034 | | | ILS | | | 240,000 | | | | 09/18/19 | | | | (544 | ) |
| | USD | | | 293,671 | | | SGD | | | 400,000 | | | | 09/18/19 | | | | (2,325 | ) |
| | USD | | | 53,148 | | | NZD | | | 80,000 | | | | 09/18/19 | | | | (676 | ) |
| | USD | | | 384,269 | | | DKK | | | 2,530,000 | | | | 09/18/19 | | | | (3,771 | ) |
| | USD | | | 5,335,575 | | | JPY | | | 573,000,000 | | | | 09/18/19 | | | | (10,171 | ) |
| | USD | | | 1,546,182 | | | AUD | | | 2,210,000 | | | | 09/18/19 | | | | (9,065 | ) |
| | USD | | | 1,983,213 | | | CHF | | | 1,950,000 | | | | 09/18/19 | | | | (28,731 | ) |
| | USD | | | 584,218 | | | SEK | | | 5,475,000 | | | | 09/18/19 | | | | (8,716 | ) |
| | | USD | | | 155,394 | | | NOK | | | 1,350,000 | | | | 09/18/19 | | | | (3,210 | ) |
| | | | | | |
| TOTAL | | | | | | | | | | | | | | | | | | $ | (129,344 | ) |
FUTURES CONTRACTS — At June 30, 2019, the Portfolio had the following futures contracts:
| | | | | | | | | | | | | | | | |
| Description | | Number of
Contracts | | | Expiration
Date | | | Notional
Amount | | | Unrealized
Appreciation/
(Depreciation) | |
Long position contracts: | | | | | | | | | | | | | | | | |
S&P 500E-Mini Index | | | 311 | | | | 09/20/19 | | | $ | 45,782,310 | | | $ | 769,165 | |
Short position contracts: | | | | | | | | | | | | | | | | |
Eurodollars | | | (1,679 | ) | | | 09/14/20 | | | | (413,222,888 | ) | | | (4,144,162 | ) |
| | | | |
| TOTAL FUTURES CONTRACTS | | | | | | | | | | | | | | $ | (3,374,997 | ) |
PURCHASED AND WRITTEN OPTIONS CONTRACTS — At June 30, 2019, the Portfolio had the following purchased and written options:
EXCHANGE TRADED OPTIONS ON FUTURES
| | | | | | | | | | | | | | | | | | | | | | | | | | | | |
| Description | | Exercise
Price | | | Expiration
Date | | | Number of
Contracts | | | Notional
Amount | | | Market
Value | | | Premiums
Paid (Received)
by Portfolio | | | Unrealized
Appreciation/
(Depreciation) | |
Purchased option contracts | | | | | | | | | | | | | | | | | | | | | | | | | | | | |
Calls | | | | | | | | | | | | | | | | | | | | | | | | | | | | |
Eurodollar Futures | | $ | 97.75 | | | | 09/16/2019 | | | | 105 | | | $ | 262,500 | | | $ | 69,563 | | | $ | 65,868 | | | $ | 3,695 | |
Eurodollar Futures | | | 98.50 | | | | 03/16/2020 | | | | 135 | | | | 337,500 | | | | 45,563 | | | | 45,876 | | | | (313 | ) |
Eurodollar Futures | | | 98.50 | | | | 06/15/2020 | | | | 88 | | | | 220,000 | | | | 48,400 | | | | 44,204 | | | | 4,196 | |
Eurodollar Futures | | | 97.50 | | | | 09/14/2020 | | | | 143 | | | | 357,500 | | | | 343,200 | | | | 111,005 | | | | 232,195 | |
Eurodollar Futures | | | 97.50 | | | | 12/14/2020 | | | | 135 | | | | 337,500 | | | | 327,375 | | | | 128,751 | | | | 198,624 | |
Eurodollar Futures | | | 97.00 | | | | 03/15/2021 | | | | 99 | | | | 247,500 | | | | 362,587 | | | | 177,192 | | | | 185,395 | |
Eurodollar Futures | | | 98.25 | | | | 03/15/2021 | | | | 1,051 | | | | 2,627,500 | | | | 1,221,788 | | | | 1,224,151 | | | | (2,363 | ) |
Eurodollar Futures | | | 97.00 | | | | 06/14/2021 | | | | 95 | | | | 237,500 | | | | 343,187 | | | | 175,970 | | | | 167,217 | |
Eurodollar Futures | | | 98.00 | | | | 06/14/2021 | | | | 413 | | | | 1,032,500 | | | | 645,312 | | | | 336,435 | | | | 308,877 | |
Eurodollar Futures | | | 98.25 | | | | 06/14/2021 | | | | 916 | | | | 2,290,000 | | | | 1,087,750 | | | | 1,131,050 | | | | (43,300 | ) |
Eurodollar Futures | | | 97.00 | | | | 09/13/2021 | | | | 75 | | | | 187,500 | | | | 267,187 | | | | 183,924 | | | | 83,263 | |
Eurodollar Futures | | | 98.25 | | | | 09/13/2021 | | | | 894 | | | | 2,235,000 | | | | 1,083,975 | | | | 1,071,174 | | | | 12,801 | |
Eurodollar Futures | | | 98.50 | | | | 12/13/2021 | | | | 597 | | | | 1,492,500 | | | | 552,225 | | | | 585,473 | | | | (33,248 | ) |
| | | | | | | |
| TOTAL | | | | | | | | | | | 4,746 | | | $ | 11,865,000 | | | $ | 6,398,112 | | | $ | 5,281,073 | | | $ | 1,117,039 | |
| | |
| 32 | | The accompanying notes are an integral part of these financial statements. |
GOLDMAN SACHS GROWTH AND INCOME STRATEGY PORTFOLIO
|
| ADDITIONAL INVESTMENT INFORMATION (continued) |
EXCHANGE TRADED OPTIONS ON EQUITIES
| | | | | | | | | | | | | | | | | | | | | | | | | | |
| Description | | Exercise
Price | | Expiration
Date | | | Number of
Contracts | | | Notional
Amount | | | Market
Value | | | Premiums
Paid (Received)
by Portfolio | | | Unrealized
Appreciation/
(Depreciation) | |
Written option contracts | | | | | | | | | | | | | | | | | | | | | | | | | | |
Calls | | | | | | | | | | | | | | | | | | | | | | | | | | |
S&P 500 Index | | $3,010.00 | | | 07/31/2019 | | | | (1 | ) | | $ | (100 | ) | | $ | (1,566 | ) | | $ | (2,394 | ) | | $ | 828 | |
Puts | | | | | | | | | | | | | | | | | | | | | | | | | | |
S&P 500 Index | | 2,790.00 | | | 07/31/2019 | | | | (1 | ) | | | (100 | ) | | | (1,329 | ) | | | (5,629 | ) | | | 4,300 | |
| | | | | | | |
| TOTAL | | | | | | | | | (2 | ) | | $ | (200 | ) | | $ | (2,895 | ) | | $ | (8,023 | ) | | $ | 5,128 | |
OVER-THE-COUNTER OPTIONS ON EQUITIES
| | | | | | | | | | | | | | | | | | | | | | | | | | | | | | |
| Description | | Counterparty | | Exercise
Price | | | Expiration
Date | | | Number of
Contracts | | | Notional
Amount | | | Market
Value | | | Premiums
Paid (Received)
by Portfolio | | | Unrealized
Appreciation/
(Depreciation) | |
Purchased option contracts | | | | | | | | | | | | | | | | | | | | | | | | | |
Puts | | | | | | | | | | | | | | | | | | | | | | | | | | | | | | |
SPX Index | | Barclays Bank PLC | | $ | 2,801.58 | | | | 01/17/2020 | | | | 7,350 | | | $ | 7,350 | | | $ | 587,190 | | | $ | 652,092 | | | $ | (64,902 | ) |
| | |
|
Abbreviations: |
MS & Co. Int. PLC—Morgan Stanley & Co. International PLC |
|
| | |
| The accompanying notes are an integral part of these financial statements. | | 33 |
GOLDMAN SACHS GROWTH STRATEGY PORTFOLIO
Schedule of Investments
June 30, 2019 (Unaudited)
| | | | | | | | |
| Shares | | | Description | |
Value | |
|
| Underlying Funds(a) – 96.8% | |
| Dynamic – 5.9% | |
| | 2,346,939 | | | Goldman Sachs Tactical Tilt Overlay Fund – Class R6 | | $ | 23,046,939 | |
| | 1,295,906 | | | Goldman Sachs Managed Futures Strategy Fund – Class R6 | | | 14,008,739 | |
| | 1,157,935 | | | Goldman Sachs Alternative Premia Fund – Class R6 | | | 9,425,593 | |
| | | | | | | | |
| | | | | | | 46,481,271 | |
| | |
| Equity – 51.6% | |
| | 11,206,111 | | | Goldman Sachs Dynamic Global Equity Fund – Class R6 | | | 213,700,545 | |
| | 7,386,018 | | | Goldman Sachs International Equity Insights Fund – Class R6 | | | 92,768,389 | |
| | 5,510,232 | | | Goldman Sachs Emerging Markets Equity Insights Fund – Class R6 | | | 52,732,917 | |
| | 1,424,823 | | | Goldman Sachs Global Infrastructure Fund – Class R6 | | | 16,641,936 | |
| | 1,374,622 | | | Goldman Sachs Global Real Estate Securities Fund – Class R6 | | | 15,423,255 | |
| | 1,231,317 | | | Goldman Sachs International Small Cap Insights Fund – Class R6 | | | 14,147,827 | |
| | | | | | | | |
| | | | | | | 405,414,869 | |
| | |
| Exchange Traded Funds – 34.1% | |
| | 4,053,975 | | | Goldman Sachs ActiveBeta U.S. Large Cap Equity ETF | | | 238,252,111 | |
| | 579,516 | | | Goldman Sachs Access Investment Grade Corporate Bond ETF | | | 29,787,122 | |
| | | | | | | | |
| | | | | | | 268,039,233 | |
| | |
| Fixed Income – 5.2% | |
| | 1,921,806 | | | Goldman Sachs Emerging Markets Debt Fund – Class R6 | | | 24,022,580 | |
| | 1,376,690 | | | Goldman Sachs Local Emerging Markets Debt Fund – Class R6 | | | 8,301,442 | |
| | 1,240,556 | | | Goldman Sachs High Yield Fund – Class R6 | | | 7,951,965 | |
| | | | | | | | |
| | | | | | | 40,275,987 | |
| | |
| | TOTAL UNDERLYING FUNDS – 96.8% | |
| | (Cost $724,355,382) | | $ | 760,211,360 | |
| | |
| | | | | | | | |
| Shares | | | Dividend
Rate | | Value | |
|
| Investment Company(a) – 0.1% | |
| Goldman Sachs Financial Square Government Fund –
Institutional Shares |
|
| | 1,102,513 | | | 2.308% | | $ | 1,102,513 | |
| | (Cost $1,102,513) | | | | |
| | |
| | TOTAL INVESTMENTS – 96.9% | | | | |
| | (Cost $725,457,895) | | $ | 761,313,873 | |
| | |
| OTHER ASSETS IN EXCESS OF
LIABILITIES –3.1% | | | 24,509,058 | |
| | |
| | NET ASSETS – 100.0% | | $ | 785,822,931 | |
| | |
| | |
|
| The percentage shown for each investment category reflects the value of investments in that category as a percentage of net assets. |
| |
(a) | | Represents an Affiliated Issuer. |
| | |
|
Currency Abbreviations; |
AUD | | —Australian Dollar |
CHF | | —Swiss Franc |
DKK | | —Danish Krone |
EUR | | —Euro |
GBP | | —British Pound |
HKD | | —Hong Kong Dollar |
ILS | | —Israeli Shekel |
JPY | | —Japanese Yen |
NOK | | —Norwegian Krone |
NZD | | —New Zealand Dollar |
SEK | | —Swedish Krona |
SGD | | —Singapore Dollar |
USD | | —U.S. Dollar |
|
Investment Abbreviations: |
ETF | | —Exchange Traded Fund |
|
|
| ADDITIONAL INVESTMENT INFORMATION |
FORWARD FOREIGN CURRENCY EXCHANGE CONTRACTS — At June 30, 2019, the Portfolio had the following forward foreign currency exchange contracts:
FORWARD FOREIGN CURRENCY EXCHANGE CONTRACTS WITH UNREALIZED GAIN
| | | | | | | | | | | | | | | | | | |
| Counterparty | | Currency Purchased | | Currency Sold | | | Settlement
Date | | | Unrealized
Gain | |
MS & Co. Int. PLC | | USD | | 2,584,850 | | GBP | | | 2,025,000 | | | | 09/18/19 | | | $ | 4,038 | |
| | |
| 34 | | The accompanying notes are an integral part of these financial statements. |
GOLDMAN SACHS GROWTH STRATEGY PORTFOLIO
|
| ADDITIONAL INVESTMENT INFORMATION (continued) |
FORWARD FOREIGN CURRENCY EXCHANGE CONTRACTS WITH UNREALIZED LOSS
| | | | | | | | | | | | | | | | | | | | |
| Counterparty | | Currency
Purchased | | | Currency
Sold | | | Settlement
Date | | | Unrealized
Loss | |
MS & Co. Int. PLC | | USD | | | 1,402,381 | | | CHF | | | 1,380,000 | | | | 09/18/19 | | | | (21,457 | ) |
| | USD | | | 586,361 | | | HKD | | | 4,590,000 | | | | 09/18/19 | | | | (1,428 | ) |
| | USD | | | 44,690 | | | ILS | | | 160,000 | | | | 09/18/19 | | | | (363 | ) |
| | USD | | | 212,911 | | | SGD | | | 290,000 | | | | 09/18/19 | | | | (1,686 | ) |
| | USD | | | 416,239 | | | SEK | | | 3,900,000 | | | | 09/18/19 | | | | (6,124 | ) |
| | USD | | | 3,780,985 | | | JPY | | | 406,000,000 | | | | 09/18/19 | | | | (6,751 | ) |
| | USD | | | 109,197 | | | NOK | | | 950,000 | | | | 09/18/19 | | | | (2,413 | ) |
| | USD | | | 273,275 | | | DKK | | | 1,800,000 | | | | 09/18/19 | | | | (2,800 | ) |
| | USD | | | 39,804 | | | NZD | | | 60,000 | | | | 09/18/19 | | | | (564 | ) |
| | USD | | | 1,097,669 | | | AUD | | | 1,570,000 | | | | 09/18/19 | | | | (7,190 | ) |
| | | USD | | | 4,927,328 | | | EUR | | | 4,350,000 | | | | 09/18/19 | | | | (50,198 | ) |
| | | | | | |
| TOTAL | | | | | | | | | | | | | | | | | | $ | (100,974 | ) |
FUTURES CONTRACTS — At June 30, 2019, the Portfolio had the following futures contracts:
| | | | | | | | | | | | | | | | |
| Description | | Number of
Contracts | | | Expiration
Date | | | Notional
Amount | | | Unrealized
Appreciation/
(Depreciation) | |
Long position contracts: | | | | | | | | | | | | | | | | |
S&P 500E-Mini Index | | | 276 | | | | 09/20/19 | | | $ | 40,629,960 | | | $ | 682,603 | |
| | | | |
Short position contracts: | | | | | | | | | | | | | | | | |
Eurodollars | | | (1,551 | ) | | | 09/14/20 | | | | (381,720,488 | ) | | | (3,804,519 | ) |
| |
| TOTAL FUTURES CONTRACTS | | | $ | (3,121,916 | ) |
PURCHASED OPTIONS CONTRACTS — At June 30, 2019, the Portfolio had the following purchased options:
EXCHANGE TRADED OPTIONS ON FUTURES
| | | | | | | | | | | | | | | | | | | | | | | | | | | | |
| Description | | | | Exercise
Price | | Expiration
Date | | | Number of
Contracts | | | Notional
Amount | | | Market
Value | | | Premiums
Paid (Received)
by Portfolio | | | Unrealized
Appreciation/
(Depreciation) | |
Purchased option contracts | | | | | | | | | | | | | | | | | | | | | | | | |
Calls | | | | | | | | | | | | | | | | | | | | | | | | |
Eurodollar Futures | | | | $97.75 | | | 09/16/2019 | | | | 114 | | | $ | 285,000 | | | $ | 75,525 | | | $ | 71,513 | | | $ | 4,012 | |
Eurodollar Futures | | | | 98.25 | | | 03/15/2021 | | | | 1,044 | | | | 2,610,000 | | | | 1,213,650 | | | | 1,217,422 | | | | (3,772 | ) |
Eurodollar Futures | | | | 98.25 | | | 06/14/2021 | | | | 901 | | | | 2,252,500 | | | | 1,069,937 | | | | 1,115,390 | | | | (45,453 | ) |
Eurodollar Futures | | | | 97.50 | | | 09/14/2020 | | | | 153 | | | | 382,500 | | | | 367,200 | | | | 118,767 | | | | 248,433 | |
Eurodollar Futures | | | | 98.50 | | | 03/16/2020 | | | | 105 | | | | 262,500 | | | | 35,437 | | | | 35,681 | | | | (244 | ) |
Eurodollar Futures | | | | 98.50 | | | 06/15/2020 | | | | 69 | | | | 172,500 | | | | 37,950 | | | | 34,660 | | | | 3,290 | |
Eurodollar Futures | | | | 98.50 | | | 12/13/2021 | | | | 578 | | | | 1,445,000 | | | | 534,650 | | | | 567,816 | | | | (33,166 | ) |
Eurodollar Futures | | | | 98.25 | | | 09/13/2021 | | | | 880 | | | | 2,200,000 | | | | 1,067,000 | | | | 1,055,079 | | | | 11,921 | |
Eurodollar Futures | | | | 97.50 | | | 12/14/2020 | | | | 144 | | | | 360,000 | | | | 349,200 | | | | 137,335 | | | | 211,865 | |
Eurodollar Futures | | | | 97.00 | | | 03/15/2021 | | | | 75 | | | | 187,500 | | | | 274,688 | | | | 134,237 | | | | 140,451 | |
Eurodollar Futures | | | | 97.00 | | | 06/14/2021 | | | | 73 | | | | 182,500 | | | | 263,713 | | | | 135,220 | | | | 128,493 | |
Eurodollar Futures | | | | 98.00 | | | 06/14/2021 | | | | 368 | | | | 920,000 | | | | 575,000 | | | | 299,778 | | | | 275,222 | |
Eurodollar Futures | | | | 97.00 | | | 09/13/2021 | | | | 132 | | | | 330,000 | | | | 470,250 | | | | 323,706 | | | | 146,544 | |
| | | | | | | |
| TOTAL | | | | | | | | | 4,636 | | | $ | 11,590,000 | | | $ | 6,334,200 | | | $ | 5,246,604 | | | $ | 1,087,596 | |
| | |
| The accompanying notes are an integral part of these financial statements. | | 35 |
GOLDMAN SACHS GROWTH STRATEGY PORTFOLIO
Schedule of Investments(continued)
June 30, 2019 (Unaudited)
|
| ADDITIONAL INVESTMENT INFORMATION (continued) |
OVER-THE-COUNTER OPTIONS ON EQUITIES
| | | | | | | | | | | | | | | | | | | | | | | | | | | | | | |
| Description | | Counterparty | | Exercise
Price | | | Expiration
Date | | | Number of
Contracts | | | Notional
Amount | | | Market
Value | | | Premiums
Paid (Received)
by Portfolio | | | Unrealized
Appreciation/
(Depreciation) | |
Purchased option contracts | | | | | | | | | | | | | | | | | | | | | | | | | | | | | | |
Puts | | | | | | | | | | | | | | | | | | | | | | | | | | | | | | |
| | | | | | | | |
SPX Index | | Barclays Bank PLC | | | $2,801.580 | | | | 01/17/2020 | | | | 7,350 | | | $ | 7,350 | | | $ | 587,190 | | | $ | 652,092 | | | $ | (64,902 | ) |
| | |
|
Abbreviations: | | |
MS & Co. Int. PLC | | —Morgan Stanley & Co. International PLC |
|
| | |
| 36 | | The accompanying notes are an integral part of these financial statements. |
GOLDMAN SACHS SATELLITE STRATEGIES PORTFOLIO
Schedule of Investments
June 30, 2019 (Unaudited)
| | | | | | | | |
| Shares | | | Description | |
Value | |
|
| Underlying Funds(a) – 99.1% | |
| Equity – 54.5% | |
| | 5,638,685 | | | Goldman Sachs Global Real Estate Securities Fund – Class R6 | | $ | 63,266,049 | |
| | 4,270,027 | | | Goldman Sachs Global Infrastructure Fund – Class R6 | | | 49,873,910 | |
| | 3,556,208 | | | Goldman Sachs International Small Cap Insights Fund – Class R6 | | | 40,860,831 | |
| | 2,401,943 | | | Goldman Sachs Emerging Markets Equity Insights Fund – Class R6 | | | 22,986,595 | |
| | 805,994 | | | Goldman Sachs Emerging Markets Equity Fund – Class R6 | | | 17,320,815 | |
| | 596,177 | | | Goldman Sachs MLP Energy Infrastructure Fund – Class R6 | | | 4,000,347 | |
| | | | | | | | |
| | | | | | | 198,308,547 | |
| | |
| Exchange Traded Funds – 4.4% | |
| | 487,221 | | | Goldman Sachs ActiveBeta Emerging Markets Equity ETF | | | 16,014,954 | |
| | |
| Fixed Income – 40.2% | |
| | 4,994,684 | | | Goldman Sachs Emerging Markets Debt Fund – Class R6 | | | 62,433,552 | |
| | 6,593,115 | | | Goldman Sachs High Yield Fund – Class R6 | | | 42,261,869 | |
| | 2,351,385 | | | Goldman Sachs High Yield Floating Rate Fund – Class R6 | | | 22,103,022 | |
| | 3,250,133 | | | Goldman Sachs Local Emerging Markets Debt Fund – Class R6 | | | 19,598,303 | |
| | | | | | | | |
| | | | | | | 146,396,746 | |
| | |
| | TOTAL UNDERLYING FUNDS – 99.1% | |
| | (Cost $313,688,297) | | $ | 360,720,247 | |
| | |
| OTHER ASSETS IN EXCESS OF
LIABILITIES – 0.9% | | | 3,206,112 | |
| | |
| | NET ASSETS – 100.0% | | $ | 363,926,359 | |
| | |
| | |
|
| The percentage shown for each investment category reflects the value of investments in that category as a percentage of net assets. |
| |
(a) | | Represents an Affiliated Issuer. |
| | |
|
Investment Abbreviations: |
ETF | | —Exchange Traded Fund |
|
| | |
| The accompanying notes are an integral part of these financial statements. | | 37 |
GOLDMAN SACHS FUND OF FUNDS PORTFOLIOS
Statements of Assets and Liabilities
June 30, 2019 (Unaudited)
| | | | | | | | | | |
| | | | | Balanced
Strategy Portfolio | | | Growth and Income
Strategy Portfolio | |
| | Assets: | |
| | Investments in Affiliated Funds, at value (cost $493,201,854 and $838,089,142, respectively) | | $ | 501,261,124 | | | $ | 867,448,365 | |
| | Purchased options, at value (cost $2,968,246 and $5,933,165, respectively) | | | 3,533,555 | | | | 6,985,302 | |
| | Cash | | | 8,024,613 | | | | 13,991,180 | |
| | Foreign currencies, at value (cost $21,629 and $57,722, respectively) | | | 24,309 | | | | 43,974 | |
| | Unrealized gain on forward foreign currency exchange contracts | | | 16,043 | | | | 6,501 | |
| | Variation margin on futures contracts | | | 162,854 | | | | 305,880 | |
| | Receivables: | | | | | | | | |
| | Investments sold | | | 4,398,561 | | | | 8,798,137 | |
| | Collateral on certain derivative contracts(a) | | | 474,669 | | | | 782,019 | |
| | Dividends | | | 367,197 | | | | 400,974 | |
| | Portfolio shares sold | | | 332,744 | | | | 424,902 | |
| | Reimbursement from investment adviser | | | 30,467 | | | | 33,127 | |
| | Other assets | | | 71,788 | | | | 81,470 | |
| | Total assets | | | 518,697,924 | | | | 899,301,831 | |
| | | | | | | | | | |
| | Liabilities: | | | | | | | | |
| | Unrealized loss on forward foreign currency exchange contracts | | | 63,117 | | | | 129,344 | |
| | Written option contracts, at value (premium received $0 and $8,023, respectively) | | | — | | | | 2,895 | |
| | Payables: | | | | | | | | |
| | Investments purchased | | | 367,197 | | | | 400,254 | |
| | Portfolio shares redeemed | | | 252,051 | | | | 267,011 | |
| | Distribution and Service fees and Transfer Agency fees | | | 67,929 | | | | 144,091 | |
| | Management fees | | | 63,213 | | | | 109,307 | |
| | Accrued expenses | | | 62,715 | | | | 60,417 | |
| | Total liabilities | | | 876,222 | | | | 1,113,319 | |
| | | | | | | | | | |
| | Net Assets: | |
| | Paid-in capital | | | 519,146,010 | | | | 876,308,679 | |
| | Total distributable earnings (loss) | | | (1,324,308 | ) | | | 21,879,833 | |
| | | NET ASSETS | | $ | 517,821,702 | | | $ | 898,188,512 | |
| | | Net Assets: | | | | | | | | |
| | | Class A | | $ | 109,081,177 | | | $ | 287,858,804 | |
| | | Class C | | | 12,669,541 | | | | 22,152,185 | |
| | | Institutional | | | 339,595,999 | | | | 367,696,748 | |
| | | Service | | | 750,210 | | | | 3,029,536 | |
| | | Investor | | | 3,570,118 | | | | 7,520,879 | |
| | | Class P | | | 40,895,114 | | | | 197,683,929 | |
| | | Class R | | | 8,936,065 | | | | 4,798,917 | |
| | | Class R6 | | | 2,323,478 | | | | 7,447,514 | |
| | | Total Net Assets | | $ | 517,821,702 | | | $ | 898,188,512 | |
| | | Shares Outstanding $0.001 par value (unlimited number of shares authorized): | | | | | | | | |
| | | Class A | | | 9,644,657 | | | | 21,081,830 | |
| | | Class C | | | 1,118,548 | | | | 1,661,263 | |
| | | Institutional | | | 30,028,502 | | | | 26,849,369 | |
| | | Service | | | 65,553 | | | | 222,416 | |
| | | Investor | | | 317,009 | | | | 553,429 | |
| | | Class P | | | 3,615,140 | | | | 14,442,015 | |
| | | Class R | | | 793,237 | | | | 354,138 | |
| | | Class R6 | | | 205,441 | | | | 544,079 | |
| | | Net asset value, offering and redemption price per share:(b) | | | | | | | | |
| | | Class A | | | $11.31 | | | | $13.65 | |
| | | Class C | | | 11.33 | | | | 13.33 | |
| | | Institutional | | | 11.31 | | | | 13.69 | |
| | | Service | | | 11.44 | | | | 13.62 | |
| | | Investor | | | 11.26 | | | | 13.59 | |
| | | Class P | | | 11.31 | | | | 13.69 | |
| | | Class R | | | 11.27 | | | | 13.55 | |
| | | Class R6 | | | 11.31 | | | | 13.69 | |
| | (a) | | Segregated for initial margin and/or collateral as follows: |
| | | | | | | | |
| Fund | | Forwards | | | Options | |
Balanced Strategy | | $ | 27 | | | $ | 474,642 | |
| | |
Growth and Income Strategy | | | — | | | | 782,019 | |
| | (b) | | Maximum public offering price per share for Class A Shares of the Balanced Strategy and Growth and Income Strategy Portfolios is $11.97 and $14.44, respectively. At redemption, Class C Shares may be subject to a contingent deferred sales charge, assessed on the amount equal to the lesser of the current net asset value (“NAV”) or the original purchase price of the shares. |
| | |
| 38 | | The accompanying notes are an integral part of these financial statements. |
GOLDMAN SACHS FUND OF FUNDS PORTFOLIOS
Statements of Assets and Liabilities(continued)
| | | | | | | | | | |
| | | |
| | | | | Growth
Strategy Portfolio | | | Satellite
Strategies Portfolio | |
| | Assets: | |
| | Investments in Affiliated Underlying Funds, at value (cost $725,457,895 and $313,688,297, respectively) | | $ | 761,313,873 | | | $ | 360,720,247 | |
| | Purchased options, at value (cost $5,898,696 and $0, respectively) | | | 6,921,390 | | | | — | |
| | Cash | | | 13,021,838 | | | | 4,080,862 | |
| | Foreign currencies, at value (cost $68,346 and $0, respectively) | | | 55,322 | | | | — | |
| | Unrealized gain on forward foreign currency exchange contracts | | | 4,038 | | | | — | |
| | Variation margin on futures contracts | | | 275,350 | | | | — | |
| | Receivables: | | | | | | | | |
| | Investments sold | | | 7,801,601 | | | | — | |
| | Collateral on certain derivative contracts(a) | | | 435,603 | | | | — | |
| | Dividends | | | 162,476 | | | | 609,397 | |
| | Portfolio shares sold | | | 196,613 | | | | 183,778 | |
| | Reimbursement from investment adviser | | | 34,539 | | | | 27,777 | |
| | Other assets | | | 84,977 | | | | 84,608 | |
| | Total assets | | | 790,307,620 | | | | 365,706,669 | |
| | | | | | | | | | |
| | Liabilities: | | | | | | | | |
| | Unrealized loss on forward foreign currency exchange contracts | | | 100,974 | | | | — | |
| | Payables: | | | | | | | | |
| | Investments purchased | | | 162,476 | | | | 609,244 | |
| | Portfolio shares redeemed | | | 3,853,300 | | | | 1,000,143 | |
| | Distribution and Service fees and Transfer Agency fees | | | 164,858 | | | | 51,445 | |
| | Management fees | | | 95,792 | | | | 37,464 | |
| | Collateral on certain derivative contracts(b) | | | 59,799 | | | | — | |
| | Accrued expenses | | | 47,490 | | | | 82,014 | |
| | Total liabilities | | | 4,484,689 | | | | 1,780,310 | |
| | | | | | | | | | |
| | Net Assets: | |
| | Paid-in capital | | | 740,862,563 | | | | 368,612,509 | |
| | Total distributable earnings (loss) | | | 44,960,368 | | | | (4,686,150 | ) |
| | | NET ASSETS | | $ | 785,822,931 | | | $ | 363,926,359 | |
| | | Net Assets: | | | | | | | | |
| | | Class A | | $ | 334,622,366 | | | $ | 47,568,376 | |
| | | Class C | | | 31,972,574 | | | | 21,071,965 | |
| | | Institutional | | | 229,165,634 | | | | 222,078,371 | |
| | | Service | | | 2,217,826 | | | | 251,524 | |
| | | Investor | | | 7,058,175 | | | | 20,203,295 | |
| | | Class P | | | 167,295,000 | | | | 3,267,598 | |
| | | Class R | | | 6,285,635 | | | | 1,118,261 | |
| | | Class R6 | | | 7,205,721 | | | | 48,366,969 | |
| | | Total Net Assets | | $ | 785,822,931 | | | $ | 363,926,359 | |
| | | Shares Outstanding $0.001 par value (unlimited number of shares authorized): | | | | | | | | |
| | | Class A | | | 21,414,883 | | | | 5,777,614 | |
| | | Class C | | | 2,017,695 | | | | 2,570,273 | |
| | | Institutional | | | 14,657,842 | | | | 27,037,225 | |
| | | Service | | | 142,454 | | | | 30,596 | |
| | | Investor | | | 457,945 | | | | 2,459,070 | |
| | | Class P | | | 10,693,947 | | | | 397,302 | |
| | | Class R | | | 413,623 | | | | 136,359 | |
| | | Class R6 | | | 460,714 | | | | 5,886,251 | |
| | | Net asset value, offering and redemption price per share:(c) | | | | | | | | |
| | | Class A | | | $15.63 | | | | $8.23 | |
| | | Class C | | | 15.85 | | | | 8.20 | |
| | | Institutional | | | 15.63 | | | | 8.21 | |
| | | Service | | | 15.57 | | | | 8.22 | |
| | | Investor | | | 15.41 | | | | 8.22 | |
| | | Class P | | | 15.64 | | | | 8.22 | |
| | | Class R | | | 15.20 | | | | 8.20 | |
| | | Class R6 | | | 15.64 | | | | 8.22 | |
| | (a) | | Segregated for initial margin and/or collateral as follows: |
| | | | |
| Fund | | Options | |
| |
Growth Strategy | | $ | 435,603 | |
| | (b) | | Segregated for initial margin and/or collateral as follows: |
| | | | |
| Fund | | Forwards | |
| |
Growth Strategy | | $ | 59,799 | |
| | (c) | | Maximum public offering price per share for Class A Shares of the Growth Strategy and Satellite Strategies Portfolios is $16.54 and $8.71, respectively. At redemption, Class C Shares may be subject to a contingent deferred sales charge, assessed on the amount equal to the lesser of the current net asset value (“NAV”) or the original purchase price of the shares. |
| | |
| The accompanying notes are an integral part of these financial statements. | | 39 |
GOLDMAN SACHS FUND OF FUNDS PORTFOLIOS
Statements of Operations
For the Six Months Ended June 30, 2019 (Unaudited)
| | | | | | | | | | |
| | | | | Balanced
Strategy Portfolio | | | Growth and Income
Strategy Portfolio | |
| | Investment income: | | | | | | | | |
| | | |
| | Dividends from Affiliated Funds | | $ | 4,370,281 | | | $ | 5,866,700 | |
| | | |
| | Interest | | | 4,179 | | | | 8,144 | |
| | | |
| | Total investment income | | | 4,374,460 | | | | 5,874,844 | |
| | | | | | | | | | |
| | Expenses: | | | | | | | | |
| | | |
| | Management fees | | | 372,317 | | | | 666,888 | |
| | | |
| | Distribution and Service fees(a) | | | 219,880 | | | | 495,644 | |
| | | |
| | Transfer Agency fees(a) | | | 189,555 | | | | 391,958 | |
| | | |
| | Registration fees | | | 58,688 | | | | 66,919 | |
| | | |
| | Professional fees | | | 41,727 | | | | 41,727 | |
| | | |
| | Custody, accounting and administrative services | | | 32,187 | | | | 31,666 | |
| | | |
| | Printing and mailing costs | | | 18,287 | | | | 31,399 | |
| | | |
| | Trustee fees | | | 8,350 | | | | 8,722 | |
| | | |
| | Service Share fees — Service Plan | | | 883 | | | | 3,657 | |
| | | |
| | Service Share fees — Shareholder Administration Plan | | | 883 | | | | 3,657 | |
| | | |
| | Other | | | 9,866 | | | | 13,249 | |
| | | |
| | Total expenses | | | 952,623 | | | | 1,755,486 | |
| | | |
| | Less — expense reductions | | | (158,253 | ) | | | (174,067 | ) |
| | | |
| | Net expenses | | | 794,370 | | | | 1,581,419 | |
| | | |
| | NET INVESTMENT INCOME | | | 3,580,090 | | | | 4,293,425 | |
| | | | | | | | | | |
| | Realized and unrealized gain (loss): | |
| | | |
| | Net realized gain (loss) from: | | | | | | | | |
| | | |
| | Affiliated Funds | | | (11,081,460 | ) | | | (7,093,213 | ) |
| | | |
| | Purchased options | | | 2,262,141 | | | | 5,685,562 | |
| | | |
| | Futures contracts | | | 2,491,922 | | | | 4,177,038 | |
| | | |
| | Written options | | | (650,239 | ) | | | (1,390,002 | ) |
| | | |
| | Forward foreign currency exchange contracts | | | 415,970 | | | | 967,369 | |
| | | |
| | Foreign currency transactions | | | (271 | ) | | | 4,951 | |
| | | |
| | Net change in unrealized gain (loss) on: | | | | | | | | |
| | | |
| | Affiliated Funds | | | 52,022,944 | | | | 95,944,707 | |
| | | |
| | Purchased options | | | 938,777 | | | | 1,261,339 | |
| | | |
| | Futures contracts | | | (1,304,417 | ) | | | (3,166,850 | ) |
| | | |
| | Written options | | | 45,318 | | | | 108,279 | |
| | | |
| | Forward foreign currency exchange contracts | | | 142,075 | | | | 244,670 | |
| | | |
| | Foreign currency translation | | | (11,416 | ) | | | (25,756 | ) |
| | | |
| | Net realized and unrealized gain | | | 45,271,344 | | | | 96,718,094 | |
| | | |
| | NET INCREASE IN NET ASSETS RESULTING FROM OPERATIONS | | $ | 48,851,434 | | | $ | 101,011,519 | |
| | (a) | | Class specific Distribution and/or Service and Transfer Agent fees were as follows: |
| | | | | | | | | | | | | | | | | | | | | | | | | | | | | | | | | | | | | | | | | | | | |
| | | Distribution and/or Service Fees | | | Transfer Agency Fees | |
Portfolio | | Class A | | | Class C | | | Class R | | | Class A | | | Class C | | | Institutional | | | Service | | | Investor | | | Class P | | | Class R | | | Class R6 | |
Balanced Strategy | | $ | 134,268 | | | $ | 63,715 | | | $ | 21,897 | | | $ | 96,672 | | | $ | 11,469 | | | $ | 63,724 | | | $ | 141 | | | $ | 2,926 | | | $ | 6,378 | | | $ | 7,883 | | | $ | 362 | |
Growth and Income Strategy | | | 352,009 | | | | 132,064 | | | | 11,571 | | | | 253,445 | | | | 23,772 | | | | 73,705 | | | | 585 | | | | 6,626 | | | | 28,635 | | | | 4,166 | | | | 1,024 | |
| | |
| 40 | | The accompanying notes are an integral part of these financial statements. |
GOLDMAN SACHS FUND OF FUNDS PORTFOLIOS
Statements of Operations(continued)
For the Six Months Ended June 30, 2019 (Unaudited)
| | | | | | | | | | |
| | | | | Growth
Strategy Portfolio | | | Satellite
Strategies Portfolio | |
| | Investment income: | | | | | | | | |
| | | |
| | Dividends from Affiliated Funds | | $ | 4,212,773 | | | $ | 5,726,893 | |
| | | |
| | Interest | | | 9,454 | | | | — | |
| | | |
| | Total investment income | | | 4,222,227 | | | | 5,726,893 | |
| | | | | | | | | | |
| | Expenses: | | | | | | | | |
| | | |
| | Distribution and Service fees(a) | | | 601,538 | | | | 192,489 | |
| | | |
| | Management fees | | | 590,916 | | | | 247,178 | |
| | | |
| | Transfer Agency fees(a) | | | 410,286 | | | | 144,418 | |
| | | |
| | Registration fees | | | 64,200 | | | | 47,701 | |
| | | |
| | Professional fees | | | 41,727 | | | | 39,199 | |
| | | |
| | Printing and mailing costs | | | 33,097 | | | | 23,240 | |
| | | |
| | Custody, accounting and administrative services | | | 29,720 | | | | 28,611 | |
| | | |
| | Trustee fees | | | 8,657 | | | | 8,353 | |
| | | |
| | Service Share fees — Service Plan | | | 2,943 | | | | 305 | |
| | | |
| | Service Share fees — Shareholder Administration Plan | | | 2,943 | | | | 305 | |
| | | |
| | Other | | | 17,851 | | | | 8,408 | |
| | | |
| | Total expenses | | | 1,803,878 | | | | 740,207 | |
| | | |
| | Less — expense reductions | | | (178,299 | ) | | | (135,899 | ) |
| | | |
| | Net expenses | | | 1,625,579 | | | | 604,308 | |
| | | |
| | NET INVESTMENT INCOME | | | 2,596,648 | | | | 5,122,585 | |
| | | | | | | | | | |
| | Realized and unrealized gain (loss): | | | | | | | | |
| | | |
| | Net realized gain (loss) from: | | | | | | | | |
| | | |
| | Affiliated Funds | | | 2,225,315 | | | | 1,517,974 | |
| | | |
| | Investments — unaffiliated issuers | | | 621 | | | | — | |
| | | |
| | Purchased options | | | 7,160,865 | | | | — | |
| | | |
| | Futures contracts | | | 4,530,771 | | | | — | |
| | | |
| | Written options | | | (350,351 | ) | | | — | |
| | | |
| | Forward foreign currency exchange contracts | | | 942,688 | | | | — | |
| | | |
| | Foreign currency transactions | | | (1,948 | ) | | | — | |
| | | |
| | Net change in unrealized gain (loss) on: | | | | | | | | |
| | | |
| | Affiliated Funds | | | 87,845,615 | | | | 43,673,621 | |
| | | |
| | Purchased options | | | 771,460 | | | | — | |
| | | |
| | Futures contracts | | | (3,726,572 | ) | | | — | |
| | | |
| | Written options | | | 27,329 | | | | — | |
| | | |
| | Forward foreign currency exchange contracts | | | 188,198 | | | | — | |
| | | |
| | Foreign currency translation | | | (25,544 | ) | | | — | |
| | | |
| | Net realized and unrealized gain | | | 99,588,447 | | | | 45,191,595 | |
| | | |
| | NET INCREASE IN NET ASSETS RESULTING FROM OPERATIONS | | $ | 102,185,095 | | | $ | 50,314,180 | |
| | (a) | | Class specific Distribution and/or Service and Transfer Agent fees were as follows: |
| | | | | | | | | | | | | | | | | | | | | | | | | | | | | | | | | | | | | | | | | | | | |
| | | Distribution and/or Service Fees | | | Transfer Agency Fees | |
Portfolio | | Class A | | | Class C | | | Class R | | | Class A | | | Class C | | | Institutional | | | Service | | | Investor | | | Class P | | | Class R | | | Class R6 | |
Growth Strategy | | $ | 404,783 | | | $ | 181,804 | | | $ | 14,951 | | | $ | 291,443 | | | $ | 32,725 | | | $ | 48,978 | | | $ | 471 | | | $ | 6,138 | | | $ | 24,094 | | | $ | 5,383 | | | $ | 1,054 | |
Satellite Strategies | | | 52,849 | | | | 136,525 | | | | 3,115 | | | | 38,051 | | | | 24,574 | | | | 50,392 | | | | 49 | | | | 22,661 | | | | 470 | | | | 1,121 | | | | 7,100 | |
| | |
| The accompanying notes are an integral part of these financial statements. | | 41 |
GOLDMAN SACHS FUND OF FUNDS PORTFOLIOS
Statements of Changes in Net Assets
| | | | | | | | | | | | | | | | | | | | | | |
| | | | | Balanced Strategy Portfolio | | | | | | Growth and Income Strategy Portfolio | |
| | | | | For the
Six Months Ended
June 30, 2019
(Unaudited) | | | For the Fiscal
Year Ended
December 31, 2018 | | | | | | For the
Six Months Ended
June 30, 2019
(Unaudited) | | | For the Fiscal
Year Ended
December 31, 2018 | |
| | From operations: | |
| | | | | | |
| | Net investment income | | $ | 3,580,090 | | | $ | 8,572,589 | | | | | | | $ | 4,293,425 | | | $ | 13,762,946 | |
| | | | | | |
| | Net realized gain (loss) | | | (6,561,937 | ) | | | 5,109,389 | | | | | | | | 2,351,705 | | | | 25,802,714 | |
| | | | | | |
| | Net change in unrealized gain (loss) | | | 51,833,281 | | | | (47,420,895 | ) | | | | | | | 94,366,389 | | | | (122,117,833 | ) |
| | Net increase (decrease) in net assets resulting from operations | | | 48,851,434 | | | | (33,738,917 | ) | | | | | | | 101,011,519 | | | | (82,552,173 | ) |
| | | | | | | | | | | | | | | | | | | | | | |
| | Distributions to shareholders: | |
| | | | | | |
| | From total distributable earnings: | | | | | | | | | | | | | | | | | | | | |
| | | | | | |
| | Class A Shares | | | (626,668 | ) | | | (4,408,193 | ) | | | | | | | (1,045,922 | ) | | | (7,092,517 | ) |
| | | | | | |
| | Class C Shares | | | (24,056 | ) | | | (429,922 | ) | | | | | | | (23,040 | ) | | | (514,723 | ) |
| | | | | | |
| | Institutional Shares | | | (2,502,544 | ) | | | (12,877,904 | ) | | | | | | | (2,016,823 | ) | | | (11,080,977 | ) |
| | | | | | |
| | Service Shares | | | (3,723 | ) | | | (27,283 | ) | | | | | | | (9,332 | ) | | | (70,425 | ) |
| | | | | | |
| | Investor Shares | | | (22,887 | ) | | | (135,812 | ) | | | | | | | (36,354 | ) | | | (225,243 | ) |
| | | | | | |
| | Class P Shares(a) | | | (318,542 | ) | | | (1,925,367 | ) | | | | | | | (1,080,922 | ) | | | (4,938,925 | ) |
| | | | | | |
| | Class R Shares | | | (40,367 | ) | | | (329,743 | ) | | | | | | | (11,959 | ) | | | (102,253 | ) |
| | | | | | |
| | Class R6 Shares | | | (18,137 | ) | | | (85,343 | ) | | | | | | | (39,099 | ) | | | (150,677 | ) |
| | | | | | |
| | Total distributions to shareholders | | | (3,556,924 | ) | | | (20,219,567 | ) | | | | | | | (4,263,451 | ) | | | (24,175,740 | ) |
| | | | | | | | | | | | | | | | | | | | | | |
| | From share transactions: | |
| | | | | | |
| | Proceeds from sales of shares | | | 65,900,673 | | | | 206,856,339 | | | | | | | | 50,288,050 | | | | 414,705,406 | |
| | | | | | |
| | Reinvestment of distributions | | | 3,500,079 | | | | 19,823,264 | | | | | | | | 4,153,234 | | | | 23,447,788 | |
| | | | | | |
| | Cost of shares redeemed | | | (65,552,340 | ) | | | (226,013,487 | ) | | | | | | | (118,519,248 | ) | | | (452,457,767 | ) |
| | Net increase (decrease) in net assets resulting from share transactions | | | 3,848,412 | | | | 666,116 | | | | | | | | (64,077,964 | ) | | | (14,304,573 | ) |
| | TOTAL INCREASE (DECREASE) | | | 49,142,922 | | | | (53,292,368 | ) | | | | | | | 32,670,104 | | | | (121,032,486 | ) |
| | | | | | | | | | | | | | | | | | | | | | |
| | Net assets: | |
| | Beginning of period | | | 468,678,780 | | | | 521,971,148 | | | | | | | | 865,518,408 | | | | 986,550,894 | |
| | | | | | |
| | End of period | | $ | 517,821,702 | | | $ | 468,678,780 | | | | | | | $ | 898,188,512 | | | $ | 865,518,408 | |
| | (a) | | Class P Shares commenced operations April 17, 2018. |
| | |
| 42 | | The accompanying notes are an integral part of these financial statements. |
GOLDMAN SACHS FUND OF FUNDS PORTFOLIOS
Statements of Changes in Net Assets(continued)
| | | | | | | | | | | | | | | | | | | | | | |
| | | | | Growth Strategy Portfolio | | | | | | Satellite Strategies Portfolio | |
| | | | | For the
Six Months Ended
June 30, 2019
(Unaudited) | | | For the Fiscal
Year Ended
December 31, 2018 | | | | | | For the
Six Months Ended
June 30, 2019
(Unaudited) | | | For the Fiscal
Year Ended
December 31, 2018 | |
| | From operations: | |
| | | | | | |
| | Net investment income | | $ | 2,596,648 | | | $ | 10,473,867 | | | | | | | $ | 5,122,585 | | | $ | 14,598,728 | |
| | | | | | |
| | Net realized gain (loss) | | | 14,507,961 | | | | 27,356,321 | | | | | | | | 1,517,974 | | | | 1,640,329 | |
| | | | | | |
| | Net change in unrealized gain (loss) | | | 85,080,486 | | | | (132,396,781 | ) | | | | | | | 43,673,621 | | | | (72,454,604 | ) |
| | Net increase (decrease) in net assets resulting from operations | | | 102,185,095 | | | | (94,566,593 | ) | | | | | | | 50,314,180 | | | | (56,215,547 | ) |
| | | | | | | | | | | | | | | | | | | | | | |
| | Distributions to shareholders: | |
| | | | | | |
| | From total distributable earnings: | | | | | | | | | | | | | | | | | | | | |
| | | | | | |
| | Class A Shares | | | — | | | | (7,924,550 | ) | | | | | | | (545,892 | ) | | | (1,151,877 | ) |
| | | | | | |
| | Class C Shares | | | — | | | | — | | | | | | | | (173,451 | ) | | | (592,136 | ) |
| | | | | | |
| | Institutional Shares | | | — | | | | (7,387,673 | ) | | | | | | | (3,314,980 | ) | | | (10,541,700 | ) |
| | | | | | |
| | Service Shares | | | — | | | | (54,633 | ) | | | | | | | (2,755 | ) | | | (7,103 | ) |
| | | | | | |
| | Investor Shares | | | — | | | | (177,616 | ) | | | | | | | (312,341 | ) | | | (982,010 | ) |
| | | | | | |
| | Class P Shares(a) | | | — | | | | (4,422,574 | ) | | | | | | | (43,954 | ) | | | (77,948 | ) |
| | | | | | |
| | Class R Shares | | | — | | | | (140,340 | ) | | | | | | | (12,466 | ) | | | (51,584 | ) |
| | | | | | |
| | Class R6 Shares | | | — | | | | (196,873 | ) | | | | | | | (659,914 | ) | | | (1,424,298 | ) |
| | | | | | |
| | Total distributions to shareholders | | | — | | | | (20,304,259 | ) | | | | | | | (5,065,753 | ) | | | (14,828,656 | ) |
| | | | | | | | | | | | | | | | | | | | | | |
| | From share transactions: | |
| | | | | | |
| | Proceeds from sales of shares | | | 52,763,175 | | | | 348,678,362 | | | | | | | | 29,849,056 | | | | 123,860,465 | |
| | | | | | |
| | Reinvestment of distributions | | | — | | | | 19,578,750 | | | | | | | | 4,161,010 | | | | 12,191,392 | |
| | | | | | |
| | Cost of shares redeemed | | | (131,337,577 | ) | | | (408,240,746 | ) | | | | | | | (120,670,696 | ) | | | (334,919,232 | ) |
| | Net increase (decrease) in net assets resulting from share transactions | | | (78,574,402 | ) | | | (39,983,634 | ) | | | | | | | (86,660,630 | ) | | | (198,867,375 | ) |
| | TOTAL INCREASE (DECREASE) | | | 23,610,693 | | | | (154,854,486 | ) | | | | | | | (41,412,203 | ) | | | (269,911,578 | ) |
| | | | | | | | | | | | | | | | | | | | | | |
| | Net assets: | |
| | Beginning of period | | | 762,212,238 | | | | 917,066,724 | | | | | | | | 405,338,562 | | �� | | 675,250,140 | |
| | | | | | |
| | End of period | | $ | 785,822,931 | | | $ | 762,212,238 | | | | | | | $ | 363,926,359 | | | $ | 405,338,562 | |
| | (a) | | Class P Shares commenced operations April 17, 2018. |
| | |
| The accompanying notes are an integral part of these financial statements. | | 43 |
GOLDMAN SACHS BALANCED STRATEGY PORTFOLIO
Financial Highlights
Selected Share Data for a Share Outstanding Throughout Each Period
| | | | | | | | | | | | | | | | | | | | | | | | | | |
| | | | | Goldman Sachs Balanced Strategy Portfolio | |
| | | | | Class A Shares | |
| | | | | Six Months Ended
June 30, 2019
(Unaudited) | | | Year Ended December 31, | |
| | | | | 2018 | | | 2017 | | | 2016 | | | 2015 | | | 2014 | |
| | Per Share Data | |
| | | | | | | |
| | Net asset value, beginning of period | | $ | 10.32 | | | $ | 11.55 | | | $ | 10.82 | | | $ | 10.41 | | | $ | 11.06 | | | $ | 11.13 | |
| | | | | | | |
| | Net investment income (loss)(a)(b) | | | 0.06 | | | | 0.16 | | | | 0.16 | | | | 0.11 | | | | 0.33 | | | | 0.21 | |
| | | | | | | |
| | Net realized and unrealized gain (loss) | | | 0.99 | | | | (0.95 | ) | | | 1.05 | | | | 0.41 | | | | (0.43 | ) | | | 0.06 | |
| | | | | | | |
| | Total from investment operations | | | 1.05 | | | | (0.79 | ) | | | 1.21 | | | | 0.52 | | | | (0.10 | ) | | | 0.27 | |
| | | | | | | |
| | Distributions to shareholders from net investment income | | | (0.06 | ) | | | (0.24 | ) | | | (0.27 | ) | | | (0.11 | ) | | | (0.38 | ) | | | (0.34 | ) |
| | | | | | | |
| | Distributions to shareholders from net realized gains | | | — | | | | (0.20 | ) | | | (0.21 | ) | | | — | | | | — | | | | — | |
| | | | | | | |
| | Distributions to shareholders from return of capital | | | — | | | | — | | | | — | | | | — | | | | (0.17 | ) | | | — | |
| | | | | | | |
| | Total distributions | | | (0.06 | ) | | | (0.44 | ) | | | (0.48 | ) | | | (0.11 | ) | | | (0.55 | ) | | | (0.34 | ) |
| | | | | | | |
| | Net asset value, end of period | | $ | 11.31 | | | $ | 10.32 | | | $ | 11.55 | | | $ | 10.82 | | | $ | 10.41 | | | $ | 11.06 | |
| | | | | | | |
| | Total return(c) | | | 10.22 | % | | | (6.90 | )% | | | 11.19 | % | | | 5.04 | % | | | (0.90 | ) % | | | 2.40 | % |
| | | | | | | |
| | Net assets, end of period (in 000s) | | $ | 109,081 | | | $ | 106,235 | | | $ | 119,662 | | | $ | 129,445 | | | $ | 146,047 | | | $ | 173,813 | |
| | | | | | | |
| | Ratio of net expenses to average net assets(d) | | | 0.58 | %(e) | | | 0.59 | % | | | 0.62 | % | | | 0.59 | % | | | 0.59 | % | | | 0.60 | % |
| | | | | | | |
| | Ratio of total expenses to average net assets(d) | | | 0.65 | %(e) | | | 0.63 | % | | | 0.68 | % | | | 0.67 | % | | | 0.65 | % | | | 0.66 | % |
| | | | | | | |
| | Ratio of net investment income to average net assets(b) | | | 1.18 | %(e) | | | 1.46 | % | | | 1.40 | % | | | 1.01 | % | | | 2.95 | % | | | 1.85 | % |
| | | | | | | |
| | Portfolio turnover rate(f) | | | 44 | % | | | 45 | % | | | 81 | % | | | 76 | % | | | 48 | % | | | 38 | % |
| | (a) | | Calculated based on the average shares outstanding methodology. |
| | (b) | | Recognition of net investment income by the Portfolio is affected by the timing of declaration of dividends by the Underlying Funds in which the Portfolio invests. |
| | (c) | | Assumes investment at the NAV at the beginning of the period, reinvestment of all dividends and distributions, a complete redemption of the investment at the NAV at the end of the period and no sales or redemption charges (if any). Total returns would be reduced if a sales or redemption charge was taken into account. Returns do not reflect the impact of taxes to shareholders relating to Portfolio distributions or the redemption of Portfolio shares. Total returns for periods less than one full year are not annualized. |
| | (d) | | Expense ratios exclude the expenses of the Underlying Funds in which the Portfolio invests. |
| | (f) | | The Portfolio’s portfolio turnover rate is calculated in accordance with regulatory requirements, without regard to transactions involving short term investments and certain derivatives. If such transactions were included, the Portfolio’s portfolio turnover rate may be higher. |
| | |
| 44 | | The accompanying notes are an integral part of these financial statements. |
GOLDMAN SACHS BALANCED STRATEGY PORTFOLIO
Financial Highlights(continued)
Selected Share Data for a Share Outstanding Throughout Each Period
| | | | | | | | | | | | | | | | | | | | | | | | | | |
| | | | | Goldman Sachs Balanced Strategy Portfolio | |
| | | | | Class C Shares | |
| | | | | Six Months Ended
June 30, 2019
(Unaudited) | | | Year Ended December 31, | |
| | | | | 2018 | | | 2017 | | | 2016 | | | 2015 | | | 2014 | |
| | Per Share Data | |
| | | | | | | |
| | Net asset value, beginning of period | | $ | 10.34 | | | $ | 11.55 | | | $ | 10.82 | | | $ | 10.41 | | | $ | 11.07 | | | $ | 11.13 | |
| | | | | | | |
| | Net investment income(a)(b) | | | 0.02 | | | | 0.05 | | | | 0.07 | | | | 0.03 | | | | 0.24 | | | | 0.12 | |
| | | | | | | |
| | Net realized and unrealized gain (loss) | | | 0.99 | | | | (0.92 | ) | | | 1.05 | | | | 0.42 | | | | (0.43 | ) | | | 0.07 | |
| | | | | | | |
| | Total from investment operations | | | 1.01 | | | | (0.87 | ) | | | 1.12 | | | | 0.45 | | | | (0.19 | ) | | | 0.19 | |
| | | | | | | |
| | Distributions to shareholders from net investment income | | | (0.02 | ) | | | (0.14 | ) | | | (0.18 | ) | | | (0.04 | ) | | | (0.32 | ) | | | (0.25 | ) |
| | | | | | | |
| | Distributions to shareholders from net realized gains | | | — | | | | (0.20 | ) | | | (0.21 | ) | | | — | | | | — | | | | — | |
| | | | | | | |
| | Distributions to shareholders from return of capital | | | — | | | | — | | | | — | | | | — | | | | (0.15 | ) | | | — | |
| | | | | | | |
| | Total distributions | | | (0.02 | ) | | | (0.34 | ) | | | (0.39 | ) | | | (0.04 | ) | | | (0.47 | ) | | | (0.25 | ) |
| | | | | | | |
| | Net asset value, end of period | | $ | 11.33 | | | $ | 10.34 | | | $ | 11.55 | | | $ | 10.82 | | | $ | 10.41 | | | $ | 11.07 | |
| | | | | | | |
| | Total return(c) | | | 9.79 | % | | | (7.58 | )% | | | 10.30 | % | | | 4.24 | % | | | (1.65 | )% | | | 1.71 | % |
| | | | | | | |
| | Net assets, end of period (in 000s) | | $ | 12,670 | | | $ | 12,807 | | | $ | 34,542 | | | $ | 47,217 | | | $ | 53,734 | | | $ | 63,726 | |
| | | | | | | |
| | Ratio of net expenses to average net assets(d) | | | 1.33 | %(e) | | | 1.33 | % | | | 1.37 | % | | | 1.34 | % | | | 1.34 | % | | | 1.35 | % |
| | | | | | | |
| | Ratio of total expenses to average net assets(d) | | | 1.40 | %(e) | | | 1.38 | % | | | 1.42 | % | | | 1.42 | % | | | 1.40 | % | | | 1.41 | % |
| | | | | | | |
| | Ratio of net investment income to average net assets(b) | | | 0.42 | %(e) | | | 0.43 | % | | | 0.58 | % | | | 0.27 | % | | | 2.20 | % | | | 1.05 | % |
| | | | | | | |
| | Portfolio turnover rate(f) | | | 44 | % | | | 45 | % | | | 81 | % | | | 76 | % | | | 48 | % | | | 38 | % |
| | (a) | | Calculated based on the average shares outstanding methodology. |
| | (b) | | Recognition of net investment income by the Portfolio is affected by the timing of declaration of dividends by the Underlying Funds in which the Portfolio invests. |
| | (c) | | Assumes investment at the NAV at the beginning of the period, reinvestment of all dividends and distributions, a complete redemption of the investment at the NAV at the end of the period and no sales or redemption charges (if any). Total returns would be reduced if a sales or redemption charge was taken into account. Returns do not reflect the impact of taxes to shareholders relating to Portfolio distributions or the redemption of Portfolio shares. Total returns for periods less than one full year are not annualized. |
| | (d) | | Expense ratios exclude the expenses of the Underlying Funds in which the Portfolio invests. |
| | (f) | | The Portfolio’s portfolio turnover rate is calculated in accordance with regulatory requirements, without regard to transactions involving short term investments and certain derivatives. If such transactions were included, the Portfolio’s portfolio turnover rate may be higher. |
| | |
| The accompanying notes are an integral part of these financial statements. | | 45 |
GOLDMAN SACHS BALANCED STRATEGY PORTFOLIO
Financial Highlights(continued)
Selected Share Data for a Share Outstanding Throughout Each Period
| | | | | | | | | | | | | | | | | | | | | | | | | | |
| | | | | Goldman Sachs Balanced Strategy Portfolio | |
| | | | | Institutional Shares | |
| | | | | Six Months Ended
June 30, 2019
(Unaudited) | | | Year Ended December 31, | |
| | | | | 2018 | | | 2017 | | | 2016 | | | 2015 | | | 2014 | |
| | Per Share Data | |
| | | | | | | |
| | Net asset value, beginning of period | | $ | 10.32 | | | $ | 11.55 | | | $ | 10.82 | | | $ | 10.42 | | | $ | 11.07 | | | $ | 11.13 | |
| | | | | | | |
| | Net investment income(a)(b) | | | 0.09 | | | | 0.20 | | | | 0.21 | | | | 0.16 | | | | 0.39 | | | | 0.25 | |
| | | | | | | |
| | Net realized and unrealized gain (loss) | | | 0.98 | | | | (0.95 | ) | | | 1.04 | | | | 0.40 | | | | (0.44 | ) | | | 0.07 | |
| | | | | | | |
| | Total from investment operations | | | 1.07 | | | | (0.75 | ) | | | 1.25 | | | | 0.56 | | | | (0.05 | ) | | | 0.32 | |
| | | | | | | |
| | Distributions to shareholders from net investment income | | | (0.08 | ) | | | (0.28 | ) | | | (0.31 | ) | | | (0.16 | ) | | | (0.40 | ) | | | (0.38 | ) |
| | | | | | | |
| | Distributions to shareholders from net realized gains | | | — | | | | (0.20 | ) | | | (0.21 | ) | | | — | | | | — | | | | — | |
| | | | | | | |
| | Distributions to shareholders from return of capital | | | — | | | | — | | | | — | | | | — | | | | (0.20 | ) | | | — | |
| | | | | | | |
| | Total distributions | | | (0.08 | ) | | | (0.48 | ) | | | (0.52 | ) | | | (0.16 | ) | | | (0.60 | ) | | | (0.38 | ) |
| | | | | | | |
| | Net asset value, end of period | | $ | 11.31 | | | $ | 10.32 | | | $ | 11.55 | | | $ | 10.82 | | | $ | 10.42 | | | $ | 11.07 | |
| | | | | | | |
| | Total return(c) | | | 10.43 | % | | | (6.53 | )% | | | 11.63 | % | | | 5.36 | % | | | (0.49 | )% | | | 2.90 | % |
| | | | | | | |
| | Net assets, end of period (in 000s) | | $ | 339,596 | | | $ | 292,183 | | | $ | 353,778 | | | $ | 285,795 | | | $ | 234,110 | | | $ | 254,620 | |
| | | | | | | |
| | Ratio of net expenses to average net assets(d) | | | 0.19 | %(e) | | | 0.20 | % | | | 0.22 | % | | | 0.19 | % | | | 0.19 | % | | | 0.20 | % |
| | | | | | | |
| | Ratio of total expenses to average net assets(d) | | | 0.26 | %(e) | | | 0.24 | % | | | 0.28 | % | | | 0.27 | % | | | 0.25 | % | | | 0.26 | % |
| | | | | | | |
| | Ratio of net investment income to average net assets(b) | | | 1.57 | %(e) | | | 1.76 | % | | | 1.85 | % | | | 1.46 | % | | | 3.48 | % | | | 2.22 | % |
| | | | | | | |
| | Portfolio turnover rate(f) | | | 44 | % | | | 45 | % | | | 81 | % | | | 76 | % | | | 48 | % | | | 38 | % |
| | (a) | | Calculated based on the average shares outstanding methodology. |
| | (b) | | Recognition of net investment income by the Portfolio is affected by the timing of declaration of dividends by the Underlying Funds in which the Portfolio invests. |
| | (c) | | Assumes investment at the NAV at the beginning of the period, reinvestment of all dividends and distributions, a complete redemption of the investment at the NAV at the end of the period and no sales or redemption charges (if any). Total returns would be reduced if a sales or redemption charge was taken into account. Returns do not reflect the impact of taxes to shareholders relating to Portfolio distributions or the redemption of Portfolio shares. Total returns for periods less than one full year are not annualized. |
| | (d) | | Expense ratios exclude the expenses of the Underlying Funds in which the Portfolio invests. |
| | (f) | | The Portfolio’s portfolio turnover rate is calculated in accordance with regulatory requirements, without regard to transactions involving short term investments and certain derivatives. If such transactions were included, the Portfolio’s portfolio turnover rate may be higher. |
| | |
| 46 | | The accompanying notes are an integral part of these financial statements. |
GOLDMAN SACHS BALANCED STRATEGY PORTFOLIO
Financial Highlights(continued)
Selected Share Data for a Share Outstanding Throughout Each Period
| | | | | | | | | | | | | | | | | | | | | | | | | | |
| | | | | Goldman Sachs Balanced Strategy Portfolio | |
| | | | | Service Shares | |
| | | | | Six Months Ended
June 30, 2019
(Unaudited) | | | Year Ended December 31, | |
| | | | | 2018 | | | 2017 | | | 2016 | | | 2015 | | | 2014 | |
| | Per Share Data | |
| | | | | | | |
| | Net asset value, beginning of period | | $ | 10.45 | | | $ | 11.68 | | | $ | 10.94 | | | $ | 10.45 | | | $ | 11.10 | | | $ | 11.16 | |
| | | | | | | |
| | Net investment income(a)(b) | | | 0.06 | | | | 0.15 | | | | 0.15 | | | | 0.10 | | | | 0.39 | | | | 0.19 | |
| | | | | | | |
| | Net realized and unrealized gain (loss) | | | 0.99 | | | | (0.95 | ) | | | 1.06 | | | | 0.49 | | | | (0.50 | ) | | | 0.08 | |
| | | | | | | |
| | Total from investment operations | | | 1.05 | | | | (0.80 | ) | | | 1.21 | | | | 0.59 | | | | (0.11 | ) | | | 0.27 | |
| | | | | | | |
| | Distributions to shareholders from net investment income | | | (0.06 | ) | | | (0.23 | ) | | | (0.26 | ) | | | (0.10 | ) | | | (0.36 | ) | | | (0.33 | ) |
| | | | | | | |
| | Distributions to shareholders from net realized gains | | | — | | | | (0.20 | ) | | | (0.21 | ) | | | — | | | | — | | | | — | |
| | | | | | | |
| | Distributions to shareholders from return of capital | | | — | | | | — | | | | — | | | | — | | | | (0.18 | ) | | | — | |
| | | | | | | |
| | Total distributions | | | (0.06 | ) | | | (0.43 | ) | | | (0.47 | ) | | | (0.10 | ) | | | (0.54 | ) | | | (0.33 | ) |
| | | | | | | |
| | Net asset value, end of period | | $ | 11.44 | | | $ | 10.45 | | | $ | 11.68 | | | $ | 10.94 | | | $ | 10.45 | | | $ | 11.10 | |
| | | | | | | |
| | Total return(c) | | | 10.04 | % | | | (6.93 | )% | | | 11.04 | % | | | 5.67 | % | | | (0.99 | )% | | | 2.38 | % |
| | | | | | | |
| | Net assets, end of period (in 000s) | | $ | 750 | | | $ | 667 | | | $ | 833 | | | $ | 831 | | | $ | 967 | | | $ | 1,391 | |
| | | | | | | |
| | Ratio of net expenses to average net assets(d) | | | 0.69 | %(e) | | | 0.70 | % | | | 0.72 | % | | | 0.69 | % | | | 0.69 | % | | | 0.70 | % |
| | | | | | | |
| | Ratio of total expenses to average net assets(d) | | | 0.76 | %(e) | | | 0.74 | % | | | 0.78 | % | | | 0.77 | % | | | 0.75 | % | | | 0.75 | % |
| | | | | | | |
| | Ratio of net investment income to average net assets(b) | | | 1.07 | %(e) | | | 1.31 | % | | | 1.31 | % | | | 0.93 | % | | | 3.47 | % | | | 1.65 | % |
| | | | | | | |
| | Portfolio turnover rate(f) | | | 44 | % | | | 45 | % | | | 81 | % | | | 76 | % | | | 48 | % | | | 38 | % |
| | (a) | | Calculated based on the average shares outstanding methodology. |
| | (b) | | Recognition of net investment income by the Portfolio is affected by the timing of declaration of dividends by the Underlying Funds in which the Portfolio invests. |
| | (c) | | Assumes investment at the NAV at the beginning of the period, reinvestment of all dividends and distributions, a complete redemption of the investment at the NAV at the end of the period and no sales or redemption charges (if any). Total returns would be reduced if a sales or redemption charge was taken into account. Returns do not reflect the impact of taxes to shareholders relating to Portfolio distributions or the redemption of Portfolio shares. Total returns for periods less than one full year are not annualized. |
| | (d) | | Expense ratios exclude the expenses of the Underlying Funds in which the Portfolio invests. |
| | (f) | | The Portfolio’s portfolio turnover rate is calculated in accordance with regulatory requirements, without regard to transactions involving short term investments and certain derivatives. If such transactions were included, the Portfolio’s portfolio turnover rate may be higher. |
| | |
| The accompanying notes are an integral part of these financial statements. | | 47 |
GOLDMAN SACHS BALANCED STRATEGY PORTFOLIO
Financial Highlights(continued)
Selected Share Data for a Share Outstanding Throughout Each Period
| | | | | | | | | | | | | | | | | | | | | | | | | | |
| | | | | Goldman Sachs Balanced Strategy Portfolio | |
| | | | | Investor Shares | |
| | | | | Six Months Ended
June 30, 2019
(Unaudited) | | | Year Ended December 31, | |
| | | | | 2018 | | | 2017 | | | 2016 | | | 2015 | | | 2014 | |
| | Per Share Data | | | | | | | | | | | | | | | | | | | | | | | | |
| | | | | | | |
| | Net asset value, beginning of period | | $ | 10.28 | | | $ | 11.50 | | | $ | 10.78 | | | $ | 10.37 | | | $ | 11.03 | | | $ | 11.09 | |
| | | | | | | |
| | Net investment income(a)(b) | | | 0.08 | | | | 0.18 | | | | 0.18 | | | | 0.14 | | | | 0.36 | | | | 0.25 | |
| | | | | | | |
| | Net realized and unrealized gain (loss) | | | 0.98 | | | | (0.93 | ) | | | 1.05 | | | | 0.41 | | | | (0.44 | ) | | | 0.06 | |
| | | | | | | |
| | Total from investment operations | | | 1.06 | | | | (0.75 | ) | | | 1.23 | | | | 0.55 | | | | (0.08 | ) | | | 0.31 | |
| | | | | | | |
| | Distributions to shareholders from net investment income | | | (0.08 | ) | | | (0.27 | ) | | | (0.30 | ) | | | (0.14 | ) | | | (0.39 | ) | | | (0.37 | ) |
| | | | | | | |
| | Distributions to shareholders from net realized gains | | | — | | | | (0.20 | ) | | | (0.21 | ) | | | — | | | | — | | | | — | |
| | | | | | | |
| | Distributions to shareholders from return of capital | | | — | | | | — | | | | — | | | | — | | | | (0.19 | ) | | | — | |
| | | | | | | |
| | Total distributions | | | (0.08 | ) | | | (0.47 | ) | | | (0.51 | ) | | | (0.14 | ) | | | (0.58 | ) | | | (0.37 | ) |
| | | | | | | |
| | Net asset value, end of period | | $ | 11.26 | | | $ | 10.28 | | | $ | 11.50 | | | $ | 10.78 | | | $ | 10.37 | | | $ | 11.03 | |
| | | | | | | |
| | Total return(c) | | | 10.29 | % | | | (6.61 | )% | | | 11.41 | % | | | 5.33 | % | | | (0.73 | )% | | | 2.76 | % |
| | | | | | | |
| | Net assets, end of period (in 000s) | | $ | 3,570 | | | $ | 2,937 | | | $ | 3,976 | | | $ | 4,810 | | | $ | 4,555 | | | $ | 4,980 | |
| | | | | | | |
| | Ratio of net expenses to average net assets(d) | | | 0.33 | %(e) | | | 0.34 | % | | | 0.37 | % | | | 0.34 | % | | | 0.34 | % | | | 0.35 | % |
| | | | | | | |
| | Ratio of total expenses to average net assets(d) | | | 0.40 | %(e) | | | 0.38 | % | | | 0.42 | % | | | 0.42 | % | | | 0.40 | % | | | 0.41 | % |
| | | | | | | |
| | Ratio of net investment income to average net assets(b) | | | 1.43 | %(e) | | | 1.64 | % | | | 1.60 | % | | | 1.30 | % | | | 3.29 | % | | | 2.23 | % |
| | | | | | | |
| | Portfolio turnover rate(f) | | | 44 | % | | | 45 | % | | | 81 | % | | | 76 | % | | | 48 | % | | | 38 | % |
| | (a) | | Calculated based on the average shares outstanding methodology. |
| | (b) | | Recognition of net investment income by the Portfolio is affected by the timing of declaration of dividends by the Underlying Funds in which the Portfolio invests. |
| | (c) | | Assumes investment at the NAV at the beginning of the period, reinvestment of all dividends and distributions, a complete redemption of the investment at the NAV at the end of the period and no sales or redemption charges (if any). Total returns would be reduced if a sales or redemption charge was taken into account. Returns do not reflect the impact of taxes to shareholders relating to Portfolio distributions or the redemption of Portfolio shares. Total returns for periods less than one full year are not annualized. |
| | (d) | | Expense ratios exclude the expenses of the Underlying Funds in which the Portfolio invests. |
| | (f) | | The Portfolio’s portfolio turnover rate is calculated in accordance with regulatory requirements, without regard to transactions involving short term investments and certain derivatives. If such transactions were included, the Portfolio’s portfolio turnover rate may be higher. |
| | |
| 48 | | The accompanying notes are an integral part of these financial statements. |
GOLDMAN SACHS BALANCED STRATEGY PORTFOLIO
Financial Highlights(continued)
Selected Share Data for a Share Outstanding Throughout Each Period
| | | | | | | | | | |
| | | | | Goldman Sachs Balanced Strategy Portfolio | |
| | | | | Class P Shares | |
| | | | | Six Months Ended
June 30, 2019
(Unaudited) | | | Period Ended
December 31, 2018(a) | |
| | Per Share Data | |
| | | |
| | Net asset value, beginning of period | | $ | 10.32 | | | $ | 11.54 | |
| | | |
| | Net investment income(b)(c) | | | 0.09 | | | | 0.20 | |
| | | |
| | Net realized and unrealized gain (loss) | | | 0.98 | | | | (0.96 | ) |
| | | |
| | Total from investment operations | | | 1.07 | | | | (0.76 | ) |
| | | |
| | Distributions to shareholders from net investment income | | | (0.08 | ) | | | (0.26 | ) |
| | | |
| | Distributions to shareholders from net realized gains | | | — | | | | (0.20 | ) |
| | | |
| | Total distributions | | | (0.08 | ) | | | (0.46 | ) |
| | | |
| | Net asset value, end of period | | $ | 11.31 | | | $ | 10.32 | |
| | | |
| | Total return(d) | | | 10.43 | % | | | (6.67 | )% |
| | | |
| | Net assets, end of period (in 000s) | | $ | 40,895 | | | $ | 43,098 | |
| | | |
| | Ratio of net expenses to average net assets(e)(f) | | | 0.18 | % | | | 0.19 | % |
| | | |
| | Ratio of total expenses to average net assets(e)(f) | | | 0.25 | % | | | 0.24 | % |
| | | |
| | Ratio of net investment income to average net assets(c)(f) | | | 1.57 | % | | | 2.48 | % |
| | | |
| | Portfolio turnover rate(g) | | | 44 | % | | | 45 | % |
| | (a) | | Class P Shares commenced operations on April 17, 2018. |
| | (b) | | Calculated based on the average shares outstanding methodology. |
| | (c) | | Recognition of net investment income by the Portfolio is affected by the timing of declaration of dividends by the Underlying Funds in which the Portfolio invests. |
| | (d) | | Assumes investment at the NAV at the beginning of the period, reinvestment of all dividends and distributions, a complete redemption of the investment at the NAV at the end of the period and no sales or redemption charges (if any). Total returns would be reduced if a sales or redemption charge was taken into account. Returns do not reflect the impact of taxes to shareholders relating to Portfolio distributions or the redemption of Portfolio shares. Total returns for periods less than one full year are not annualized. |
| | (e) | | Expense ratios exclude the expenses of the Underlying Funds in which the Portfolio invests. |
| | (g) | | The Portfolio’s portfolio turnover rate is calculated in accordance with regulatory requirements, without regard to transactions involving short term investments and certain derivatives. If such transactions were included, the Portfolio’s portfolio turnover rate may be higher. |
| | |
| The accompanying notes are an integral part of these financial statements. | | 49 |
GOLDMAN SACHS BALANCED STRATEGY PORTFOLIO
Financial Highlights(continued)
Selected Share Data for a Share Outstanding Throughout Each Period
| | | | | | | | | | | | | | | | | | | | | | | | | | |
| | | | | Goldman Sachs Balanced Strategy Portfolio | |
| | | | | Class R Shares | |
| | | | | Six Months Ended
June 30, 2019
(Unaudited) | | | Year Ended December 31, | |
| | | | | 2018 | | | 2017 | | | 2016 | | | 2015 | | | 2014 | |
| | Per Share Data | |
| | | | | | | |
| | Net asset value, beginning of period | | $ | 10.28 | | | $ | 11.50 | | | $ | 10.79 | | | $ | 10.36 | | | $ | 11.02 | | | $ | 11.08 | |
| | | | | | | |
| | Net investment income(a)(b) | | | 0.05 | | | | 0.14 | | | | 0.15 | | | | 0.09 | | | | 0.36 | | | | 0.18 | |
| | | | | | | |
| | Net realized and unrealized gain (loss) | | | 0.99 | | | | (0.95 | ) | | | 1.02 | | | | 0.43 | | | | (0.49 | ) | | | 0.07 | |
| | | | | | | |
| | Total from investment operations | | | 1.04 | | | | (0.81 | ) | | | 1.17 | | | | 0.52 | | | | (0.13 | ) | | | 0.25 | |
| | | | | | | |
| | Distributions to shareholders from net investment income | | | (0.05 | ) | | | (0.21 | ) | | | (0.25 | ) | | | (0.09 | ) | | | (0.34 | ) | | | (0.31 | ) |
| | | | | | | |
| | Distributions to shareholders from net realized gains | | | — | | | | (0.20 | ) | | | (0.21 | ) | | | — | | | | — | | | | — | |
| | | | | | | |
| | Distributions to shareholders from return of capital | | | — | | | | — | | | | — | | | | — | | | | (0.19 | ) | | | — | |
| | | | | | | |
| | Total distributions | | | (0.05 | ) | | | (0.41 | ) | | | (0.46 | ) | | | (0.09 | ) | | | (0.53 | ) | | | (0.31 | ) |
| | | | | | | |
| | Net asset value, end of period | | $ | 11.27 | | | $ | 10.28 | | | $ | 11.50 | | | $ | 10.79 | | | $ | 10.36 | | | $ | 11.02 | |
| | | | | | | |
| | Total return(c) | | | 10.13 | % | | | (7.07 | )% | | | 10.81 | % | | | 5.02 | % | | | (1.23 | )% | | | 2.25 | % |
| | | | | | | |
| | Net assets, end of period (in 000s) | | $ | 8,936 | | | $ | 8,443 | | | $ | 8,629 | | | $ | 6,110 | | | $ | 5,196 | | | $ | 5,436 | |
| | | | | | | |
| | Ratio of net expenses to average net assets(d) | | | 0.83 | %(e) | | | 0.84 | % | | | 0.87 | % | | | 0.84 | % | | | 0.84 | % | | | 0.85 | % |
| | | | | | | |
| | Ratio of total expenses to average net assets(d) | | | 0.90 | %(e) | | | 0.88 | % | | | 0.93 | % | | | 0.92 | % | | | 0.90 | % | | | 0.90 | % |
| | | | | | | |
| | Ratio of net investment income to average net assets(b) | | | 0.93 | %(e) | | | 1.23 | % | | | 1.30 | % | | | 0.85 | % | | | 3.22 | % | | | 1.61 | % |
| | | | | | | |
| | Portfolio turnover rate(f) | | | 44 | % | | | 45 | % | | | 81 | % | | | 76 | % | | | 48 | % | | | 38 | % |
| | (a) | | Calculated based on the average shares outstanding methodology. |
| | (b) | | Recognition of net investment income by the Portfolio is affected by the timing of declaration of dividends by the Underlying Funds in which the Portfolio invests. |
| | (c) | | Assumes investment at the NAV at the beginning of the period, reinvestment of all dividends and distributions, a complete redemption of the investment at the NAV at the end of the period and no sales or redemption charges (if any). Total returns would be reduced if a sales or redemption charge was taken into account. Returns do not reflect the impact of taxes to shareholders relating to Portfolio distributions or the redemption of Portfolio shares. Total returns for periods less than one full year are not annualized. |
| | (d) | | Expense ratios exclude the expenses of the Underlying Funds in which the Portfolio invests. |
| | (f) | | The Portfolio’s portfolio turnover rate is calculated in accordance with regulatory requirements, without regard to transactions involving short term investments and certain derivatives. If such transactions were included, the Portfolio’s portfolio turnover rate may be higher. |
| | |
| 50 | | The accompanying notes are an integral part of these financial statements. |
GOLDMAN SACHS BALANCED STRATEGY PORTFOLIO
Financial Highlights(continued)
Selected Share Data for a Share Outstanding Throughout Each Period
| | | | | | | | | | | | | | | | | | | | | | |
| | | | | Goldman Sachs Balanced Strategy Portfolio | |
| | | | | Class R6 Shares | |
| | | | | Six Months Ended
June 30, 2019 (Unaudited) | | | Year Ended December 31, | | | Period Ended
December 31, 2015(a) | |
| | | | | 2018 | | | 2017 | | | 2016 | |
| | Per Share Data | |
| | | | | | |
| | Net asset value, beginning of period | | $ | 10.32 | | | $ | 11.55 | | | $ | 10.83 | | | $ | 10.42 | | | $ | 11.16 | |
| | | | | | |
| | Net investment income(b)(c) | | | 0.08 | | | | 0.35 | | | | 0.54 | | | | 0.15 | | | | 0.30 | |
| | | | | | |
| | Net realized and unrealized gain (loss) | | | 0.99 | | | | (1.09 | ) | | | 0.71 | | | | 0.42 | | | | (0.52 | ) |
| | | | | | |
| | Total from investment operations | | | 1.07 | | | | (0.74 | ) | | | 1.25 | | | | 0.57 | | | | (0.22 | ) |
| | | | | | |
| | Distributions to shareholders from net investment income | | | (0.08 | ) | | | (0.29 | ) | | | (0.32 | ) | | | (0.16 | ) | | | (0.35 | ) |
| | | | | | |
| | Distributions to shareholders from net realized gains | | | — | | | | (0.20 | ) | | | (0.21 | ) | | | — | | | | — | |
| | | | | | |
| | Distributions to shareholders from return of capital | | | — | | | | — | | | | — | | | | — | | | | (0.17 | ) |
| | | | | | |
| | Total distributions | | | (0.08 | ) | | | (0.49 | ) | | | (0.53 | ) | | | (0.16 | ) | | | (0.52 | ) |
| | | | | | |
| | Net asset value, end of period | | $ | 11.31 | | | $ | 10.32 | | | $ | 11.55 | | | $ | 10.83 | | | $ | 10.42 | |
| | | | | | |
| | Total return(d) | | | 10.43 | % | | | (6.52 | )% | | | 11.54 | % | | | 5.46 | % | | | (2.01 | )% |
| | | | | | |
| | Net assets, end of period (in 000s) | | $ | 2,323 | | | $ | 2,308 | | | $ | 551 | | | $ | 10 | | | $ | 10 | |
| | | | | | |
| | Ratio of net expenses to average net assets(e) | | | 0.18 | %(f) | | | 0.19 | % | | | 0.31 | % | | | 0.19 | % | | | 0.19 | %(f) |
| | | | | | |
| | Ratio of total expenses to average net assets(e) | | | 0.25 | %(f) | | | 0.24 | % | | | 0.39 | % | | | 0.27 | % | | | 0.23 | %(f) |
| | | | | | |
| | Ratio of net investment income to average net assets(c) | | | 1.56 | %(f) | | | 3.10 | % | | | 4.64 | % | | | 1.45 | % | | | 6.52 | %(f) |
| | | | | | |
| | Portfolio turnover rate(g) | | | 44 | % | | | 45 | % | | | 81 | % | | | 76 | % | | | 48 | % |
| | (a) | | Commenced operations on July 31, 2015. |
| | (b) | | Calculated based on the average shares outstanding methodology. |
| | (c) | | Recognition of net investment income by the Portfolio is affected by the timing of declaration of dividends by the Underlying Funds in which the Portfolio invests. |
| | (d) | | Assumes investment at the NAV at the beginning of the period, reinvestment of all dividends and distributions, a complete redemption of the investment at the NAV at the end of the period and no sales or redemption charges (if any). Total returns would be reduced if a sales or redemption charge was taken into account. Returns do not reflect the impact of taxes to shareholders relating to Portfolio distributions or the redemption of Portfolio shares. Total returns for periods less than one full year are not annualized. |
| | (e) | | Expense ratios exclude the expenses of the Underlying Funds in which the Portfolio invests. |
| | (g) | | The Portfolio’s portfolio turnover rate is calculated in accordance with regulatory requirements, without regard to transactions involving short term investments and certain derivatives. If such transactions were included, the Portfolio’s portfolio turnover rate may be higher. |
| | |
| The accompanying notes are an integral part of these financial statements. | | 51 |
GOLDMAN SACHS GROWTH AND INCOME STRATEGY PORTFOLIO
Financial Highlights(continued)
Selected Share Data for a Share Outstanding Throughout Each Period
| | | | | | | | | | | | | | | | | | | | | | | | | | |
| | | | | Goldman Sachs Growth and Income Strategy Portfolio | |
| | | | | Class A Shares | |
| | | | | Six Months Ended
June 30, 2019 (Unaudited) | | | Year Ended December 31, | |
| | | | | 2018 | | | 2017 | | | 2016 | | | 2015 | | | 2014 | |
| | Per Share Data | |
| | | | | | | |
| | Net asset value, beginning of period | | $ | 12.26 | | | $ | 13.81 | | | $ | 12.17 | | | $ | 11.62 | | | $ | 12.10 | | | $ | 12.14 | |
| | | | | | | |
| | Net investment income (loss)(a)(b) | | | 0.05 | | | | 0.18 | | | | 0.18 | | | | 0.11 | | | | 0.25 | | | | 0.20 | |
| | | | | | | |
| | Net realized and unrealized gain (loss) | | | 1.39 | | | | (1.41 | ) | | | 1.79 | | | | 0.56 | | | | (0.31 | ) | | | 0.07 | |
| | | | | | | |
| | Total from investment operations | | | 1.44 | | | | (1.23 | ) | | | 1.97 | | | | 0.67 | | | | (0.06 | ) | | | 0.27 | |
| | | | | | | |
| | Distributions to shareholders from net investment income | | | (0.05 | ) | | | (0.32 | ) | | | (0.33 | ) | | | (0.12 | ) | | | (0.42 | ) | | | (0.31 | ) |
| | | | | | | |
| | Net asset value, end of period | | $ | 13.65 | | | $ | 12.26 | | | $ | 13.81 | | | $ | 12.17 | | | $ | 11.62 | | | $ | 12.10 | |
| | | | | | | |
| | Total return(c) | | | 11.74 | % | | | (8.94 | )% | | | 16.19 | % | | | 5.75 | % | | | (0.54 | )% | | | 2.22 | % |
| | | | | | | |
| | Net assets, end of period (in 000s) | | $ | 287,859 | | | $ | 272,658 | | | $ | 302,116 | | | $ | 302,858 | | | $ | 341,468 | | | $ | 408,488 | |
| | | | | | | |
| | Ratio of net expenses to average net assets(d) | | | 0.58 | %(e) | | | 0.59 | % | | | 0.59 | % | | | 0.59 | % | | | 0.59 | % | | | 0.60 | % |
| | | | | | | |
| | Ratio of total expenses to average net assets(d) | | | 0.62 | %(e) | | | 0.61 | % | | | 0.63 | % | | | 0.64 | % | | | 0.63 | % | | | 0.63 | % |
| | | | | | | |
| | Ratio of net investment income to average net assets(b) | | | 0.74 | %(e) | | | 1.29 | % | | | 1.35 | % | | | 0.95 | % | | | 2.08 | % | | | 1.64 | % |
| | | | | | | |
| | Portfolio turnover rate(f) | | | 58 | % | | | 32 | % | | | 81 | % | | | 67 | % | | | 40 | % | | | 35 | % |
| | (a) | | Calculated based on the average shares outstanding methodology. |
| | (b) | | Recognition of net investment income by the Portfolio is affected by the timing of declaration of dividends by the Underlying Funds in which the Portfolio invests. |
| | (c) | | Assumes investment at the NAV at the beginning of the period, reinvestment of all dividends and distributions, a complete redemption of the investment at the NAV at the end of the period and no sales or redemption charges (if any). Total returns would be reduced if a sales or redemption charge was taken into account. Returns do not reflect the impact of taxes to shareholders relating to Portfolio distributions or the redemption of Portfolio shares. Total returns for periods less than one full year are not annualized. |
| | (d) | | Expense ratios exclude the expenses of the Underlying Funds in which the Portfolio invests. |
| | (f) | | The Portfolio’s portfolio turnover rate is calculated in accordance with regulatory requirements, without regard to transactions involving short term investments and certain derivatives. If such transactions were included, the Portfolio’s portfolio turnover rate may be higher. |
| | |
| 52 | | The accompanying notes are an integral part of these financial statements. |
GOLDMAN SACHS GROWTH AND INCOME STRATEGY PORTFOLIO
Financial Highlights(continued)
Selected Share Data for a Share Outstanding Throughout Each Period
| | | | | | | | | | | | | | | | | | | | | | | | | | |
| | | | | Goldman Sachs Growth and Income Strategy Portfolio | |
| | | | | Class C Shares | |
| | | | | Six Months Ended
June 30, 2019 (Unaudited) | | | Year Ended December 31, | |
| | | | | 2018 | | | 2017 | | | 2016 | | | 2015 | | | 2014 | |
| | Per Share Data | |
| | | | | | | |
| | Net asset value, beginning of period | | $ | 11.98 | | | $ | 13.49 | | | $ | 11.90 | | | $ | 11.42 | | | $ | 11.91 | | | $ | 11.99 | |
| | | | | | | |
| | Net investment income(a)(b) | | | — | (c) | | | 0.01 | | | | 0.06 | | | | 0.02 | | | | 0.16 | | | | 0.10 | |
| | | | | | | |
| | Net realized and unrealized gain (loss) | | | 1.36 | | | | (1.31 | ) | | | 1.76 | | | | 0.54 | | | | (0.31 | ) | | | 0.08 | |
| | | | | | | |
| | Total from investment operations | | | 1.36 | | | | (1.30 | ) | | | 1.82 | | | | 0.56 | | | | (0.15 | ) | | | 0.18 | |
| | | | | | | |
| | Distributions to shareholders from net investment income | | | (0.01 | ) | | | (0.21 | ) | | | (0.23 | ) | | | (0.08 | ) | | | (0.34 | ) | | | (0.26 | ) |
| | | | | | | |
| | Net asset value, end of period | | $ | 13.33 | | | $ | 11.98 | | | $ | 13.49 | | | $ | 11.90 | | | $ | 11.42 | | | $ | 11.91 | |
| | | | | | | |
| | Total return(d) | | | 11.37 | % | | | (9.62 | )% | | | 15.31 | % | | | 4.86 | % | | | (1.24 | )% | | | 1.46 | % |
| | | | | | | |
| | Net assets, end of period (in 000s) | | $ | 22,152 | | | $ | 27,099 | | | $ | 94,118 | | | $ | 121,778 | | | $ | 143,257 | | | $ | 169,745 | |
| | | | | | | |
| | Ratio of net expenses to average net assets(e) | | | 1.33 | %(f) | | | 1.34 | % | | | 1.34 | % | | | 1.34 | % | | | 1.34 | % | | | 1.35 | % |
| | | | | | | |
| | Ratio of total expenses to average net assets(e) | | | 1.37 | %(f) | | | 1.36 | % | | | 1.38 | % | | | 1.39 | % | | | 1.38 | % | | | 1.38 | % |
| | | | | | | |
| | Ratio of net investment income (loss) to average net assets(b) | | | (0.06 | )%(f) | | | 0.11 | % | | | 0.50 | % | | | 0.18 | % | | | 1.30 | % | | | 0.80 | % |
| | | | | | | |
| | Portfolio turnover rate(g) | | | 58 | % | | | 32 | % | | | 81 | % | | | 67 | % | | | 40 | % | | | 35 | % |
| | (a) | | Calculated based on the average shares outstanding methodology. |
| | (b) | | Recognition of net investment income by the Portfolio is affected by the timing of declaration of dividends by the Underlying Funds in which the Portfolio invests. |
| | (c) | | Amount is less than $0.005 per share. |
| | (d) | | Assumes investment at the NAV at the beginning of the period, reinvestment of all dividends and distributions, a complete redemption of the investment at the NAV at the end of the period and no sales or redemption charges (if any). Total returns would be reduced if a sales or redemption charge was taken into account. Returns do not reflect the impact of taxes to shareholders relating to Portfolio distributions or the redemption of Portfolio shares. Total returns for periods less than one full year are not annualized. |
| | (e) | | Expense ratios exclude the expenses of the Underlying Funds in which the Portfolio invests. |
| | (g) | | The Portfolio’s portfolio turnover rate is calculated in accordance with regulatory requirements, without regard to transactions involving short term investments and certain derivatives. If such transactions were included, the Portfolio’s portfolio turnover rate may be higher. |
| | |
| The accompanying notes are an integral part of these financial statements. | | 53 |
GOLDMAN SACHS GROWTH AND INCOME STRATEGY PORTFOLIO
Financial Highlights(continued)
Selected Share Data for a Share Outstanding Throughout Each Period
| | | | | | | | | | | | | | | | | | | | | | | | | | |
| | | | | Goldman Sachs Growth and Income Strategy Portfolio | |
| | | | | Institutional Shares | |
| | | | | Six Months Ended
June 30, 2019 (Unaudited) | | | Year Ended December 31, | |
| | | | | 2018 | | | 2017 | | | 2016 | | | 2015 | | | 2014 | |
| | Per Share Data | |
| | | | | | | |
| | Net asset value, beginning of period | | $ | 12.29 | | | $ | 13.85 | | | $ | 12.21 | | | $ | 11.66 | | | $ | 12.14 | | | $ | 12.18 | |
| | | | | | | |
| | Net investment income(a)(b) | | | 0.07 | | | | 0.20 | | | | 0.24 | | | | 0.17 | | | | 0.32 | | | | 0.26 | |
| | | | | | | |
| | Net realized and unrealized gain (loss) | | | 1.40 | | | | (1.39 | ) | | | 1.78 | | | | 0.55 | | | | (0.33 | ) | | | 0.06 | |
| | | | | | | |
| | Total from investment operations | | | 1.47 | | | | (1.19 | ) | | | 2.02 | | | | 0.72 | | | | (0.01 | ) | | | 0.32 | |
| | | | | | | |
| | Distributions to shareholders from net investment income | | | (0.07 | ) | | | (0.37 | ) | | | (0.38 | ) | | | (0.17 | ) | | | (0.47 | ) | | | (0.36 | ) |
| | | | | | | |
| | Net asset value, end of period | | $ | 13.69 | | | $ | 12.29 | | | $ | 13.85 | | | $ | 12.21 | | | $ | 11.66 | | | $ | 12.14 | |
| | | | | | | |
| | Total return(c) | | | 12.08 | % | | | (8.63 | )% | | | 16.60 | % | | | 6.15 | % | | | (0.13 | )% | | | 2.62 | % |
| | | | | | | |
| | Net assets, end of period (in 000s) | | $ | 367,697 | | | $ | 360,006 | | | $ | 574,136 | | | $ | 455,273 | | | $ | 429,243 | | | $ | 421,720 | |
| | | | | | | |
| | Ratio of net expenses to average net assets(d) | | | 0.19 | %(e) | | | 0.20 | % | | | 0.19 | % | | | 0.19 | % | | | 0.19 | % | | | 0.20 | % |
| | | | | | | |
| | Ratio of total expenses to average net assets(d) | | | 0.23 | %(e) | | | 0.22 | % | | | 0.23 | % | | | 0.24 | % | | | 0.23 | % | | | 0.23 | % |
| | | | | | | |
| | Ratio of net investment income to average net assets(b) | | | 1.12 | %(e) | | | 1.48 | % | | | 1.80 | % | | | 1.42 | % | | | 2.59 | % | | | 2.11 | % |
| | | | | | | |
| | Portfolio turnover rate(f) | | | 58 | % | | | 32 | % | | | 81 | % | | | 67 | % | | | 40 | % | | | 35 | % |
| | (a) | | Calculated based on the average shares outstanding methodology. |
| | (b) | | Recognition of net investment income by the Portfolio is affected by the timing of declaration of dividends by the Underlying Funds in which the Portfolio invests. |
| | (c) | | Assumes investment at the NAV at the beginning of the period, reinvestment of all dividends and distributions, a complete redemption of the investment at the NAV at the end of the period and no sales or redemption charges (if any). Total returns would be reduced if a sales or redemption charge was taken into account. Returns do not reflect the impact of taxes to shareholders relating to Portfolio distributions or the redemption of Portfolio shares. Total returns for periods less than one full year are not annualized. |
| | (d) | | Expense ratios exclude the expenses of the Underlying Funds in which the Portfolio invests. |
| | (f) | | The Portfolio’s portfolio turnover rate is calculated in accordance with regulatory requirements, without regard to transactions involving short term investments and certain derivatives. If such transactions were included, the Portfolio’s portfolio turnover rate may be higher. |
| | |
| 54 | | The accompanying notes are an integral part of these financial statements. |
GOLDMAN SACHS GROWTH AND INCOME STRATEGY PORTFOLIO
Financial Highlights(continued)
Selected Share Data for a Share Outstanding Throughout Each Period
| | | | | | | | | | | | | | | | | | | | | | | | | | |
| | | | | Goldman Sachs Growth and Income Strategy Portfolio | |
| | | | | Service Shares | |
| | | | | Six Months Ended
June 30, 2019 (Unaudited) | | | Year Ended December 31, | |
| | | | | 2018 | | | 2017 | | | 2016 | | | 2015 | | | 2014 | |
| | Per Share Data | |
| | | | | | | |
| | Net asset value, beginning of period | | $ | 12.23 | | | $ | 13.77 | | | $ | 12.14 | | | $ | 11.60 | | | $ | 12.07 | | | $ | 12.11 | |
| | | | | | | |
| | Net investment income(a)(b) | | | 0.04 | | | | 0.15 | | | | 0.17 | | | | 0.11 | | | | 0.25 | | | | 0.20 | |
| | | | | | | |
| | Net realized and unrealized gain (loss) | | | 1.39 | | | | (1.38 | ) | | | 1.77 | | | | 0.54 | | | | (0.32 | ) | | | 0.06 | |
| | | | | | | |
| | Total from investment operations | | | 1.43 | | | | (1.23 | ) | | | 1.94 | | | | 0.65 | | | | (0.07 | ) | | | 0.26 | |
| | | | | | | |
| | Distributions to shareholders from net investment income | | | (0.04 | ) | | | (0.31 | ) | | | (0.31 | ) | | | (0.11 | ) | | | (0.40 | ) | | | (0.30 | ) |
| | | | | | | |
| | Net asset value, end of period | | $ | 13.62 | | | $ | 12.23 | | | $ | 13.77 | | | $ | 12.14 | | | $ | 11.60 | | | $ | 12.07 | |
| | | | | | | |
| | Total return(c) | | | 11.71 | % | | | (9.00 | )% | | | 16.03 | % | | | 5.58 | % | | | (0.56 | )% | | | 2.11 | % |
| | | | | | | |
| | Net assets, end of period (in 000s) | | $ | 3,030 | | | $ | 2,780 | | | $ | 3,414 | | | $ | 3,253 | | | $ | 3,246 | | | $ | 3,725 | |
| | | | | | | |
| | Ratio of net expenses to average net assets(d) | | | 0.69 | %(e) | | | 0.70 | % | | | 0.69 | % | | | 0.69 | % | | | 0.69 | % | | | 0.70 | % |
| | | | | | | |
| | Ratio of total expenses to average net assets(d) | | | 0.73 | %(e) | | | 0.72 | % | | | 0.73 | % | | | 0.74 | % | | | 0.73 | % | | | 0.73 | % |
| | | | | | | |
| | Ratio of net investment income to average net assets(b) | | | 0.63 | %(e) | | | 1.13 | % | | | 1.27 | % | | | 0.90 | % | | | 2.03 | % | | | 1.58 | % |
| | | | | | | |
| | Portfolio turnover rate(f) | | | 58 | % | | | 32 | % | | | 81 | % | | | 67 | % | | | 40 | % | | | 35 | % |
| | (a) | | Calculated based on the average shares outstanding methodology. |
| | (b) | | Recognition of net investment income by the Portfolio is affected by the timing of declaration of dividends by the Underlying Funds in which the Portfolio invests. |
| | (c) | | Assumes investment at the NAV at the beginning of the period, reinvestment of all dividends and distributions, a complete redemption of the investment at the NAV at the end of the period and no sales or redemption charges (if any). Total returns would be reduced if a sales or redemption charge was taken into account. Returns do not reflect the impact of taxes to shareholders relating to Portfolio distributions or the redemption of Portfolio shares. Total returns for periods less than one full year are not annualized. |
| | (d) | | Expense ratios exclude the expenses of the Underlying Funds in which the Portfolio invests. |
| | (f) | | The Portfolio’s portfolio turnover rate is calculated in accordance with regulatory requirements, without regard to transactions involving short term investments and certain derivatives. If such transactions were included, the Portfolio’s portfolio turnover rate may be higher. |
| | |
| The accompanying notes are an integral part of these financial statements. | | 55 |
GOLDMAN SACHS GROWTH AND INCOME STRATEGY PORTFOLIO
Financial Highlights(continued)
Selected Share Data for a Share Outstanding Throughout Each Period
| | | | | | | | | | | | | | | | | | | | | | | | | | |
| | | | | Goldman Sachs Growth and Income Strategy Portfolio | |
| | | | | Investor Shares | |
| | | | | Six Months Ended
June 30, 2019 (Unaudited) | | | Year Ended December 31, | |
| | | | | 2018 | | | 2017 | | | 2016 | | | 2015 | | | 2014 | |
| | Per Share Data | |
| | | | | | | |
| | Net asset value, beginning of period | | $ | 12.20 | | | $ | 13.74 | | | $ | 12.12 | | | $ | 11.57 | | | $ | 12.05 | | | $ | 12.09 | |
| | | | | | | |
| | Net investment income(a)(b) | | | 0.06 | | | | 0.20 | | | | 0.23 | | | | 0.16 | | | | 0.29 | | | | 0.25 | |
| | | | | | | |
| | Net realized and unrealized gain (loss) | | | 1.39 | | | | (1.38 | ) | | | 1.75 | | | | 0.54 | | | | (0.32 | ) | | | 0.05 | |
| | | | | | | |
| | Total from investment operations | | | 1.45 | | | | (1.18 | ) | | | 1.98 | | | | 0.70 | | | | (0.03 | ) | | | 0.30 | |
| | | | | | | |
| | Distributions to shareholders from net investment income | | | (0.06 | ) | | | (0.36 | ) | | | (0.36 | ) | | | (0.15 | ) | | | (0.45 | ) | | | (0.34 | ) |
| | | | | | | |
| | Net asset value, end of period | | $ | 13.59 | | | $ | 12.20 | | | $ | 13.74 | | | $ | 12.12 | | | $ | 11.57 | | | $ | 12.05 | |
| | | | | | | |
| | Total return(c) | | | 11.94 | % | | | (8.68 | )% | | | 16.39 | % | | | 6.04 | % | | | (0.29 | )% | | | 2.49 | % |
| | | | | | | |
| | Net assets, end of period (in 000s) | | $ | 7,521 | | | $ | 7,366 | | | $ | 7,241 | | | $ | 4,769 | | | $ | 3,085 | | | $ | 3,478 | |
| | | | | | | |
| | Ratio of net expenses to average net assets(d) | | | 0.33 | %(e) | | | 0.34 | % | | | 0.34 | % | | | 0.34 | % | | | 0.34 | % | | | 0.35 | % |
| | | | | | | |
| | Ratio of total expenses to average net assets(d) | | | 0.37 | %(e) | | | 0.36 | % | | | 0.38 | % | | | 0.39 | % | | | 0.38 | % | | | 0.38 | % |
| | | | | | | |
| | Ratio of net investment income to average net assets(b) | | | 0.99 | %(e) | | | 1.48 | % | | | 1.72 | % | | | 1.37 | % | | | 2.42 | % | | | 2.00 | % |
| | | | | | | |
| | Portfolio turnover rate(f) | | | 58 | % | | | 32 | % | | | 81 | % | | | 67 | % | | | 40 | % | | | 35 | % |
| | (a) | | Calculated based on the average shares outstanding methodology. |
| | (b) | | Recognition of net investment income by the Portfolio is affected by the timing of declaration of dividends by the Underlying Funds in which the Portfolio invests. |
| | (c) | | Assumes investment at the NAV at the beginning of the period, reinvestment of all dividends and distributions, a complete redemption of the investment at the NAV at the end of the period and no sales or redemption charges (if any). Total returns would be reduced if a sales or redemption charge was taken into account. Returns do not reflect the impact of taxes to shareholders relating to Portfolio distributions or the redemption of Portfolio shares. Total returns for periods less than one full year are not annualized. |
| | (d) | | Expense ratios exclude the expenses of the Underlying Funds in which the Portfolio invests. |
| | (f) | | The Portfolio’s portfolio turnover rate is calculated in accordance with regulatory requirements, without regard to transactions involving short term investments and certain derivatives. If such transactions were included, the Portfolio’s portfolio turnover rate may be higher. |
| | |
| 56 | | The accompanying notes are an integral part of these financial statements. |
GOLDMAN SACHS GROWTH AND INCOME STRATEGY PORTFOLIO
Financial Highlights(continued)
Selected Share Data for a Share Outstanding Throughout Each Period
| | | | | | | | | | |
| | | | | Goldman Sachs Growth and Income
Strategy Portfolio | |
| | | | | Class P Shares | |
| | | | | Six Months Ended
June 30, 2019 (Unaudited) | | | Period Ended
December 31, 2018(a) | |
| | Per Share Data | |
| | | |
| | Net asset value, beginning of period | | $ | 12.29 | | | $ | 13.91 | |
| | | |
| | Net investment income(b)(c) | | | 0.07 | | | | 0.23 | |
| | | |
| | Net realized and unrealized gain (loss) | | | 1.40 | | | | (1.52 | ) |
| | | |
| | Total from investment operations | | | 1.47 | | | | (1.29 | ) |
| | | |
| | Distributions to shareholders from net investment income | | | (0.07 | ) | | | (0.33 | ) |
| | | |
| | Net asset value, end of period | | $ | 13.69 | | | $ | 12.29 | |
| | | |
| | Total return(d) | | | 12.01 | % | | | (9.29 | )% |
| | | |
| | Net assets, end of period (in 000s) | | $ | 197,684 | | | $ | 185,028 | |
| | | |
| | Ratio of net expenses to average net assets(e)(f) | | | 0.18 | % | | | 0.19 | % |
| | | |
| | Ratio of total expenses to average net assets(e)(f) | | | 0.22 | % | | | 0.22 | % |
| | | |
| | Ratio of net investment income to average net assets(c)(f) | | | 1.14 | % | | | 2.48 | % |
| | | |
| | Portfolio turnover rate(g) | | | 58 | % | | | 32 | % |
| | (a) | | Class P Shares commenced operations on April 17, 2018. |
| | (b) | | Calculated based on the average shares outstanding methodology. |
| | (c) | | Recognition of net investment income by the Portfolio is affected by the timing of declaration of dividends by the Underlying Funds in which the Portfolio invests. |
| | (d) | | Assumes investment at the NAV at the beginning of the period, reinvestment of all dividends and distributions, a complete redemption of the investment at the NAV at the end of the period and no sales or redemption charges (if any). Total returns would be reduced if a sales or redemption charge was taken into account. Returns do not reflect the impact of taxes to shareholders relating to Portfolio distributions or the redemption of Portfolio shares. Total returns for periods less than one full year are not annualized. |
| | (e) | | Expense ratios exclude the expenses of the Underlying Funds in which the Portfolio invests. |
| | (g) | | The Portfolio’s portfolio turnover rate is calculated in accordance with regulatory requirements, without regard to transactions involving short term investments and certain derivatives. If such transactions were included, the Portfolio’s portfolio turnover rate may be higher. |
| | |
| The accompanying notes are an integral part of these financial statements. | | 57 |
GOLDMAN SACHS GROWTH AND INCOME STRATEGY PORTFOLIO
Financial Highlights(continued)
Selected Share Data for a Share Outstanding Throughout Each Period
| | | | | | | | | | | | | | | | | | | | | | | | | | |
| | | | | Goldman Sachs Growth and Income Strategy Portfolio | |
| | | | | Class R Shares | |
| | | | | Six Months Ended
June 30, 2019
(Unaudited) | | | Year Ended December 31, | |
| | | | | 2018 | | | 2017 | | | 2016 | | | 2015 | | | 2014 | |
| | Per Share Data | |
| | | | | | | |
| | Net asset value, beginning of period | | $ | 12.17 | | | $ | 13.70 | | | $ | 12.09 | | | $ | 11.56 | | | $ | 12.03 | | | $ | 12.08 | |
| | | | | | | |
| | Net investment income(a)(b) | | | 0.03 | | | | 0.13 | | | | 0.18 | | | | 0.09 | | | | 0.23 | | | | 0.16 | |
| | | | | | | |
| | Net realized and unrealized gain (loss) | | | 1.38 | | | | (1.37 | ) | | | 1.73 | | | | 0.54 | | | | (0.31 | ) | | | 0.07 | |
| | | | | | | |
| | Total from investment operations | | | 1.41 | | | | (1.24 | ) | | | 1.91 | | | | 0.63 | | | | (0.08 | ) | | | 0.23 | |
| | | | | | | |
| | Distributions to shareholders from net investment income | | | (0.03 | ) | | | (0.29 | ) | | | (0.30 | ) | | | (0.10 | ) | | | (0.39 | ) | | | (0.28 | ) |
| | | | | | | |
| | Net asset value, end of period | | $ | 13.55 | | | $ | 12.17 | | | $ | 13.70 | | | $ | 12.09 | | | $ | 11.56 | | | $ | 12.03 | |
| | | | | | | |
| | Total return(c) | | | 11.62 | % | | | (9.10 | )% | | | 15.83 | % | | | 5.40 | % | | | (0.69 | )% | | | 1.97 | % |
| | | | | | | |
| | Net assets, end of period (in 000s) | | $ | 4,799 | | | $ | 4,251 | | | $ | 5,441 | | | $ | 2,659 | | | $ | 2,330 | | | $ | 2,438 | |
| | | | | | | |
| | Ratio of net expenses to average net assets(d) | | | 0.83 | %(e) | | | 0.84 | % | | | 0.84 | % | | | 0.84 | % | | | 0.84 | % | | | 0.85 | % |
| | | | | | | |
| | Ratio of total expenses to average net assets(d) | | | 0.87 | %(e) | | | 0.86 | % | | | 0.88 | % | | | 0.89 | % | | | 0.88 | % | | | 0.88 | % |
| | | | | | | |
| | Ratio of net investment income to average net assets(b) | | | 0.49 | %(e) | | | 1.00 | % | | | 1.35 | % | | | 0.75 | % | | | 1.89 | % | | | 1.27 | % |
| | | | | | | |
| | Portfolio turnover rate(f) | | | 58 | % | | | 32 | % | | | 81 | % | | | 67 | % | | | 40 | % | | | 35 | % |
| | (a) | | Calculated based on the average shares outstanding methodology. |
| | (b) | | Recognition of net investment income by the Portfolio is affected by the timing of declaration of dividends by the Underlying Funds in which the Portfolio invests. |
| | (c) | | Assumes investment at the NAV at the beginning of the period, reinvestment of all dividends and distributions, a complete redemption of the investment at the NAV at the end of the period and no sales or redemption charges (if any). Total returns would be reduced if a sales or redemption charge was taken into account. Returns do not reflect the impact of taxes to shareholders relating to Portfolio distributions or the redemption of Portfolio shares. Total returns for periods less than one full year are not annualized. |
| | (d) | | Expense ratios exclude the expenses of the Underlying Funds in which the Portfolio invests. |
| | (f) | | The Portfolio’s portfolio turnover rate is calculated in accordance with regulatory requirements, without regard to transactions involving short term investments and certain derivatives. If such transactions were included, the Portfolio’s portfolio turnover rate may be higher. |
| | |
| 58 | | The accompanying notes are an integral part of these financial statements. |
GOLDMAN SACHS GROWTH AND INCOME STRATEGY PORTFOLIO
Financial Highlights(continued)
Selected Share Data for a Share Outstanding Throughout Each Period
| | | | | | | | | | | | | | | | | | | | | | |
| | | | | Goldman Sachs Growth and Income Strategy Portfolio | |
| | | | | Class R6 Shares | |
| | | | | Six Months Ended
June 30, 2019
(Unaudited) | | | Year Ended December 31, | | | Period Ended
December 31, 2015(a) | |
| | | | | 2018 | | | 2017 | | | 2016 | |
| | Per Share Data | |
| | | | | | |
| | Net asset value, beginning of period | | $ | 12.29 | | | $ | 13.85 | | | $ | 12.20 | | | $ | 11.66 | | | $ | 12.42 | |
| | | | | | |
| | Net investment income(b)(c) | | | 0.08 | | | | 0.36 | | | | 0.30 | | | | 0.17 | | | | 0.26 | |
| | | | | | |
| | Net realized and unrealized gain (loss) | | | 1.39 | | | | (1.54 | ) | | | 1.73 | | | | 0.54 | | | | (0.62 | ) |
| | | | | | |
| | Total from investment operations | | | 1.47 | | | | (1.18 | ) | | | 2.03 | | | | 0.71 | | | | (0.36 | ) |
| | | | | | |
| | Distributions to shareholders from net investment income | | | (0.07 | ) | | | (0.38 | ) | | | (0.38 | ) | | | (0.17 | ) | | | (0.40 | ) |
| | | | | | |
| | Net asset value, end of period | | $ | 13.69 | | | $ | 12.29 | | | $ | 13.85 | | | $ | 12.20 | | | $ | 11.66 | |
| | | | | | |
| | Total return(d) | | | 12.01 | % | | | (8.61 | )% | | | 16.71 | % | | | 6.07 | % | | | (2.87 | )% |
| | | | | | |
| | Net assets, end of period (in 000s) | | $ | 7,448 | | | $ | 6,331 | | | $ | 84 | | | $ | 10 | | | $ | 10 | |
| | | | | | |
| | Ratio of net expenses to average net assets(e) | | | 0.18 | %(f) | | | 0.19 | % | | | 0.18 | % | | | 0.19 | % | | | 0.19 | %(f) |
| | | | | | |
| | Ratio of total expenses to average net assets(e) | | | 0.22 | %(f) | | | 0.22 | % | | | 0.22 | % | | | 0.23 | % | | | 0.21 | %(f) |
| | | | | | |
| | Ratio of net investment income to average net assets(c) | | | 1.15 | %(f) | | | 2.67 | % | | | 2.21 | % | | | 1.43 | % | | | 5.04 | %(f) |
| | | | | | |
| | Portfolio turnover rate(g) | | | 58 | % | | | 32 | % | | | 81 | % | | | 67 | % | | | 40 | % |
| | (a) | | Commenced operations on July 31, 2015. |
| | (b) | | Calculated based on the average shares outstanding methodology. |
| | (c) | | Recognition of net investment income by the Portfolio is affected by the timing of declaration of dividends by the Underlying Funds in which the Portfolio invests. |
| | (d) | | Assumes investment at the NAV at the beginning of the period, reinvestment of all dividends and distributions, a complete redemption of the investment at the NAV at the end of the period and no sales or redemption charges (if any). Total returns would be reduced if a sales or redemption charge was taken into account. Returns do not reflect the impact of taxes to shareholders relating to Portfolio distributions or the redemption of Portfolio shares. Total returns for periods less than one full year are not annualized. |
| | (e) | | Expense ratios exclude the expenses of the Underlying Funds in which the Portfolio invests. |
| | (g) | | The Portfolio’s portfolio turnover rate is calculated in accordance with regulatory requirements, without regard to transactions involving short term investments and certain derivatives. If such transactions were included, the Portfolio’s portfolio turnover rate may be higher. |
| | |
| The accompanying notes are an integral part of these financial statements. | | 59 |
GOLDMAN SACHS GROWTH STRATEGY PORTFOLIO
Financial Highlights(continued)
Selected Share Data for a Share Outstanding Throughout Each Period
| | | | | | | | | | | | | | | | | | | | | | | | | | |
| | | | | Goldman Sachs Growth Strategy Portfolio | |
| | | | | Class A Shares | |
| | | | | Six Months Ended
June 30, 2019
(Unaudited) | | | Year Ended December 31, | |
| | | | | 2018 | | | 2017 | | | 2016 | | | 2015 | | | 2014 | |
| | Per Share Data | |
| | | | | | | |
| | Net asset value, beginning of period | | $ | 13.73 | | | $ | 15.83 | | | $ | 13.39 | | | $ | 12.70 | | | $ | 12.91 | | | $ | 12.89 | |
| | | | | | | |
| | Net investment income(a)(b) | | | 0.04 | | | | 0.19 | | | | 0.15 | | | | 0.11 | | | | 0.15 | | | | 0.19 | |
| | | | | | | |
| | Net realized and unrealized gain (loss) | | | 1.86 | | | | (1.93 | ) | | | 2.67 | | | | 0.70 | | | | (0.16 | ) | | | 0.12 | |
| | | | | | | |
| | Total from investment operations | | | 1.90 | | | | (1.74 | ) | | | 2.82 | | | | 0.81 | | | | (0.01 | ) | | | 0.31 | |
| | | | | | | |
| | Distributions to shareholders from net investment income | | | — | | | | (0.36 | ) | | | (0.38 | ) | | | (0.12 | ) | | | (0.20 | ) | | | (0.29 | ) |
| | | | | | | |
| | Net asset value, end of period | | $ | 15.63 | | | $ | 13.73 | | | $ | 15.83 | | | $ | 13.39 | | | $ | 12.70 | | | $ | 12.91 | |
| | | | | | | |
| | Total return(c) | | | 13.84 | % | | | (10.98 | )% | | | 21.02 | % | | | 6.38 | % | | | (0.08 | )% | | | 2.36 | % |
| | | | | | | |
| | Net assets, end of period (in 000s) | | $ | 334,622 | | | $ | 308,475 | | | $ | 316,078 | | | $ | 301,331 | | | $ | 336,880 | | | $ | 385,409 | |
| | | | | | | |
| | Ratio of net expenses to average net assets(d) | | | 0.58 | %(e) | | | 0.59 | % | | | 0.59 | % | | | 0.59 | % | | | 0.59 | % | | | 0.60 | % |
| | | | | | | |
| | Ratio of total expenses to average net assets(d) | | | 0.63 | %(e) | | | 0.62 | % | | | 0.63 | % | | | 0.65 | % | | | 0.64 | % | | | 0.64 | % |
| | | | | | | |
| | Ratio of net investment income to average net assets(b) | | | 0.49 | %(e) | | | 1.19 | % | | | 1.00 | % | | | 0.83 | % | | | 1.15 | % | | | 1.46 | % |
| | | | | | | |
| | Portfolio turnover rate(f) | | | 66 | % | | | 29 | % | | | 85 | % | | | 59 | % | | | 38 | % | | | 26 | % |
| | (a) | | Calculated based on the average shares outstanding methodology. |
| | (b) | | Recognition of net investment income by the Portfolio is affected by the timing of declaration of dividends by the Underlying Funds in which the Portfolio invests. |
| | (c) | | Assumes investment at the NAV at the beginning of the period, reinvestment of all dividends and distributions, a complete redemption of the investment at the NAV at the end of the period and no sales or redemption charges (if any). Total returns would be reduced if a sales or redemption charge was taken into account. Returns do not reflect the impact of taxes to shareholders relating to Portfolio distributions or the redemption of Portfolio shares. Total returns for periods less than one full year are not annualized. |
| | (d) | | Expense ratios exclude the expenses of the Underlying Funds in which the Portfolio invests. |
| | (f) | | The Portfolio’s portfolio turnover rate is calculated in accordance with regulatory requirements, without regard to transactions involving short term investments and certain derivatives. If such transactions were included, the Portfolio’s portfolio turnover rate may be higher. |
| | |
| 60 | | The accompanying notes are an integral part of these financial statements. |
GOLDMAN SACHS GROWTH STRATEGY PORTFOLIO
Financial Highlights(continued)
Selected Share Data for a Share Outstanding Throughout Each Period
| | | | | | | | | | | | | | | | | | | | | | | | | | |
| | | | | Goldman Sachs Growth Strategy Portfolio | |
| | | | | Class C Shares | |
| | | | | Six Months Ended
June 30, 2019
(Unaudited) | | | Year Ended December 31, | |
| | | | | 2018 | | | 2017 | | | 2016 | | | 2015 | | | 2014 | |
| | Per Share Data | |
| | | | | | | |
| | Net asset value, beginning of period | | $ | 13.98 | | | $ | 15.81 | | | $ | 13.37 | | | $ | 12.68 | | | $ | 12.88 | | | $ | 12.85 | |
| | | | | | | |
| | Net investment income (loss)(a)(b) | | | (0.02 | ) | | | (0.03 | ) | | | 0.03 | | | | 0.01 | | | | 0.05 | | | | 0.07 | |
| | | | | | | |
| | Net realized and unrealized gain (loss) | | | 1.89 | | | | (1.80 | ) | | | 2.66 | | | | 0.70 | | | | (0.15 | ) | | | 0.13 | |
| | | | | | | |
| | Total from investment operations | | | 1.87 | | | | (1.83 | ) | | | 2.69 | | | | 0.71 | | | | (0.10 | ) | | | 0.20 | |
| | | | | | | |
| | Distributions to shareholders from net investment income | | | — | | | | — | | | | (0.25 | ) | | | (0.02 | ) | | | (0.10 | ) | | | (0.17 | ) |
| | | | | | | |
| | Net asset value, end of period | | $ | 15.85 | | | $ | 13.98 | | | $ | 15.81 | | | $ | 13.37 | | | $ | 12.68 | | | $ | 12.88 | |
| | | | | | | |
| | Total return(c) | | | 13.38 | % | | | (11.58 | )% | | | 20.08 | % | | | 5.57 | % | | | (0.82 | )% | | | 1.59 | % |
| | | | | | | |
| | Net assets, end of period (in 000s) | | $ | 31,973 | | | $ | 36,201 | | | $ | 126,894 | | | $ | 144,292 | | | $ | 161,733 | | | $ | 190,125 | |
| | | | | | | |
| | Ratio of net expenses to average net assets(d) | | | 1.33 | %(e) | | | 1.34 | % | | | 1.34 | % | | | 1.34 | % | | | 1.34 | % | | | 1.35 | % |
| | | | | | | |
| | Ratio of total expenses to average net assets(d) | | | 1.38 | %(e) | | | 1.37 | % | | | 1.38 | % | | | 1.40 | % | | | 1.39 | % | | | 1.39 | % |
| | | | | | | |
| | Ratio of net investment income (loss) to average net assets(b) | | | (0.31 | )%(e) | | | (0.20 | )% | | | 0.18 | % | | | 0.08 | % | | | 0.39 | % | | | 0.57 | % |
| | | | | | | |
| | Portfolio turnover rate(f) | | | 66 | % | | | 29 | % | | | 85 | % | | | 59 | % | | | 38 | % | | | 26 | % |
| | (a) | | Calculated based on the average shares outstanding methodology. |
| | (b) | | Recognition of net investment income by the Portfolio is affected by the timing of declaration of dividends by the Underlying Funds in which the Portfolio invests. |
| | (c) | | Assumes investment at the NAV at the beginning of the period, reinvestment of all dividends and distributions, a complete redemption of the investment at the NAV at the end of the period and no sales or redemption charges (if any). Total returns would be reduced if a sales or redemption charge was taken into account. Returns do not reflect the impact of taxes to shareholders relating to Portfolio distributions or the redemption of Portfolio shares. Total returns for periods less than one full year are not annualized. |
| | (d) | | Expense ratios exclude the expenses of the Underlying Funds in which the Portfolio invests. |
| | (f) | | The Portfolio’s portfolio turnover rate is calculated in accordance with regulatory requirements, without regard to transactions involving short term investments and certain derivatives. If such transactions were included, the Portfolio’s portfolio turnover rate may be higher. |
| | |
| The accompanying notes are an integral part of these financial statements. | | 61 |
GOLDMAN SACHS GROWTH STRATEGY PORTFOLIO
Financial Highlights(continued)
Selected Share Data for a Share Outstanding Throughout Each Period
| | | | | | | | | | | | | | | | | | | | | | | | | | |
| | | | | Goldman Sachs Growth Strategy Portfolio | |
| | | | | Institutional Shares | |
| | | | | Six Months Ended
June 30, 2019 (Unaudited) | | | Year Ended December 31, | |
| | | | | 2018 | | | 2017 | | | 2016 | | | 2015 | | | 2014 | |
| | Per Share Data | |
| | | | | | | |
| | Net asset value, beginning of period | | $ | 13.72 | | | $ | 15.81 | | | $ | 13.37 | | | $ | 12.69 | | | $ | 12.90 | | | $ | 12.88 | |
| | | | | | | |
| | Net investment income(a)(b) | | | 0.06 | | | | 0.19 | | | | 0.22 | | | | 0.17 | | | | 0.22 | | | | 0.24 | |
| | | | | | | |
| | Net realized and unrealized gain (loss) | | | 1.85 | | | | (1.87 | ) | | | 2.66 | | | | 0.69 | | | | (0.17 | ) | | | 0.12 | |
| | | | | | | |
| | Total from investment operations | | | 1.91 | | | | (1.68 | ) | | | 2.88 | | | | 0.86 | | | | 0.05 | | | | 0.36 | |
| | | | | | | |
| | Distributions to shareholders from net investment income | | | — | | | | (0.41 | ) | | | (0.44 | ) | | | (0.18 | ) | | | (0.26 | ) | | | (0.34 | ) |
| | | | | | | |
| | Net asset value, end of period | | $ | 15.63 | | | $ | 13.72 | | | $ | 15.81 | | | $ | 13.37 | | | $ | 12.69 | | | $ | 12.90 | |
| | | | | | | |
| | Total return(c) | | | 14.00 | % | | | (10.65 | )% | | | 21.53 | % | | | 6.76 | % | | | 0.35 | % | | | 2.76 | % |
| | | | | | | |
| | Net assets, end of period (in 000s) | | $ | 229,166 | | | $ | 247,863 | | | $ | 455,902 | | | $ | 335,237 | | | $ | 303,237 | | | $ | 267,677 | |
| | | | | | | |
| | Ratio of net expenses to average net assets(d) | | | 0.19 | %(e) | | | 0.20 | % | | | 0.20 | % | | | 0.19 | % | | | 0.19 | % | | | 0.20 | % |
| | | | | | | |
| | Ratio of total expenses to average net assets(d) | | | 0.24 | %(e) | | | 0.23 | % | | | 0.24 | % | | | 0.25 | % | | | 0.23 | % | | | 0.24 | % |
| | | | | | | |
| | Ratio of net investment income to average net assets(b) | | | 0.87 | %(e) | | | 1.22 | % | | | 1.46 | % | | | 1.33 | % | | | 1.68 | % | | | 1.84 | % |
| | | | | | | |
| | Portfolio turnover rate(f) | | | 66 | % | | | 29 | % | | | 85 | % | | | 59 | % | | | 38 | % | | | 26 | % |
| | (a) | | Calculated based on the average shares outstanding methodology. |
| | (b) | | Recognition of net investment income by the Portfolio is affected by the timing of declaration of dividends by the Underlying Funds in which the Portfolio invests. |
| | (c) | | Assumes investment at the NAV at the beginning of the period, reinvestment of all dividends and distributions, a complete redemption of the investment at the NAV at the end of the period and no sales or redemption charges (if any). Total returns would be reduced if a sales or redemption charge was taken into account. Returns do not reflect the impact of taxes to shareholders relating to Portfolio distributions or the redemption of Portfolio shares. Total returns for periods less than one full year are not annualized. |
| | (d) | | Expense ratios exclude the expenses of the Underlying Funds in which the Portfolio invests. |
| | (f) | | The Portfolio’s portfolio turnover rate is calculated in accordance with regulatory requirements, without regard to transactions involving short term investments and certain derivatives. If such transactions were included, the Portfolio’s portfolio turnover rate may be higher. |
| | |
| 62 | | The accompanying notes are an integral part of these financial statements. |
GOLDMAN SACHS GROWTH STRATEGY PORTFOLIO
Financial Highlights(continued)
Selected Share Data for a Share Outstanding Throughout Each Period
| | | | | | | | | | | | | | | | | | | | | | | | | | |
| | | | | Goldman Sachs Growth Strategy Portfolio | |
| | | | | Service Shares | |
| | | | | Six Months Ended
June 30, 2019
(Unaudited) | | | Year Ended December 31, | |
| | | | | 2018 | | | 2017 | | | 2016 | | | 2015 | | | 2014 | |
| | Per Share Data | |
| | | | | | | |
| | Net asset value, beginning of period | | $ | 13.69 | | | $ | 15.77 | | | $ | 13.35 | | | $ | 12.67 | | | $ | 12.88 | | | $ | 12.84 | |
| | | | | | | |
| | Net investment income(a)(b) | | | 0.03 | | | | 0.15 | | | | 0.15 | | | | 0.10 | | | | 0.14 | | | | 0.15 | |
| | | | | | | |
| | Net realized and unrealized gain (loss) | | | 1.85 | | | | (1.90 | ) | | | 2.64 | | | | 0.69 | | | | (0.16 | ) | | | 0.15 | |
| | | | | | | |
| | Total from investment operations | | | 1.88 | | | | (1.75 | ) | | | 2.79 | | | | 0.79 | | | | (0.02 | ) | | | 0.30 | |
| | | | | | | |
| | Distributions to shareholders from net investment income | | | — | | | | (0.33 | ) | | | (0.37 | ) | | | (0.11 | ) | | | (0.19 | ) | | | (0.26 | ) |
| | | | | | | |
| | Net asset value, end of period | | $ | 15.57 | | | $ | 13.69 | | | $ | 15.77 | | | $ | 13.35 | | | $ | 12.67 | | | $ | 12.88 | |
| | | | | | | |
| | Total return(c) | | | 13.73 | % | | | (11.06 | )% | | | 20.88 | % | | | 6.26 | % | | | (0.17 | )% | | | 2.32 | % |
| | | | | | | |
| | Net assets, end of period (in 000s) | | $ | 2,218 | | | $ | 2,252 | | | $ | 2,888 | | | $ | 2,237 | | | $ | 2,135 | | | $ | 2,509 | |
| | | | | | | |
| | Ratio of net expenses to average net assets(d) | | | 0.69 | %(e) | | | 0.70 | % | | | 0.70 | % | | | 0.69 | % | | | 0.69 | % | | | 0.70 | % |
| | | | | | | |
| | Ratio of total expenses to average net assets(d) | | | 0.74 | %(e) | | | 0.73 | % | | | 0.74 | % | | | 0.75 | % | | | 0.74 | % | | | 0.74 | % |
| | | | | | | |
| | Ratio of net investment income to average net assets(b) | | | 0.36 | %(e) | | | 0.96 | % | | | 1.00 | % | | | 0.81 | % | | | 1.09 | % | | | 1.11 | % |
| | | | | | | |
| | Portfolio turnover rate(f) | | | 66 | % | | | 29 | % | | | 85 | % | | | 59 | % | | | 38 | % | | | 26 | % |
| | (a) | | Calculated based on the average shares outstanding methodology. |
| | (b) | | Recognition of net investment income by the Portfolio is affected by the timing of declaration of dividends by the Underlying Funds in which the Portfolio invests. |
| | (c) | | Assumes investment at the NAV at the beginning of the period, reinvestment of all dividends and distributions, a complete redemption of the investment at the NAV at the end of the period and no sales or redemption charges (if any). Total returns would be reduced if a sales or redemption charge was taken into account. Returns do not reflect the impact of taxes to shareholders relating to Portfolio distributions or the redemption of Portfolio shares. Total returns for periods less than one full year are not annualized. |
| | (d) | | Expense ratios exclude the expenses of the Underlying Funds in which the Portfolio invests. |
| | (f) | | The Portfolio’s portfolio turnover rate is calculated in accordance with regulatory requirements, without regard to transactions involving short term investments and certain derivatives. If such transactions were included, the Portfolio’s portfolio turnover rate may be higher. |
| | |
| The accompanying notes are an integral part of these financial statements. | | 63 |
GOLDMAN SACHS GROWTH STRATEGY PORTFOLIO
Financial Highlights(continued)
Selected Share Data for a Share Outstanding Throughout Each Period
| | | | | | | | | | | | | | | | | | | | | | | | | | |
| | | | | Goldman Sachs Growth Strategy Portfolio | |
| | | | | Investor Shares | |
| | | | | Six Months Ended
June 30, 2019
(Unaudited) | | | Year Ended December 31, | |
| | | | | 2018 | | | 2017 | | | 2016 | | | 2015 | | | 2014 | |
| | Per Share Data | |
| | | | | | | |
| | Net asset value, beginning of period | | $ | 13.53 | | | $ | 15.59 | | | $ | 13.20 | | | $ | 12.52 | | | $ | 12.73 | | | $ | 12.72 | |
| | | | | | | |
| | Net investment income(a)(b) | | | 0.05 | | | | 0.18 | | | | 0.23 | | | | 0.15 | | | | 0.19 | | | | 0.25 | |
| | | | | | | |
| | Net realized and unrealized gain (loss) | | | 1.83 | | | | (1.86 | ) | | | 2.58 | | | | 0.69 | | | | (0.16 | ) | | | 0.08 | |
| | | | | | | |
| | Total from investment operations | | | 1.88 | | | | (1.68 | ) | | | 2.81 | | | | 0.84 | | | | 0.03 | | | | 0.33 | |
| | | | | | | |
| | Distributions to shareholders from net investment income | | | — | | | | (0.38 | ) | | | (0.42 | ) | | | (0.16 | ) | | | (0.24 | ) | | | (0.32 | ) |
| | | | | | | |
| | Net asset value, end of period | | $ | 15.41 | | | $ | 13.53 | | | $ | 15.59 | | | $ | 13.20 | | | $ | 12.52 | | | $ | 12.73 | |
| | | | | | | |
| | Total return(c) | | | 13.90 | % | | | (10.74 | )% | | | 21.30 | % | | | 6.70 | % | | | 0.20 | % | | | 2.58 | % |
| | | | | | | |
| | Net assets, end of period (in 000s) | | $ | 7,058 | | | $ | 6,477 | | | $ | 8,008 | | | $ | 4,352 | | | $ | 4,114 | | | $ | 4,496 | |
| | | | | | | |
| | Ratio of net expenses to average net assets(d) | | | 0.33 | %(e) | | | 0.33 | % | | | 0.34 | % | | | 0.34 | % | | | 0.34 | % | | | 0.35 | % |
| | | | | | | |
| | Ratio of total expenses to average net assets(d) | | | 0.38 | %(e) | | | 0.37 | % | | | 0.39 | % | | | 0.40 | % | | | 0.39 | % | | | 0.39 | % |
| | | | | | | |
| | Ratio of net investment income to average net assets(b) | | | 0.75 | %(e) | | | 1.14 | % | | | 1.54 | % | | | 1.18 | % | | | 1.50 | % | | | 1.92 | % |
| | | | | | | |
| | Portfolio turnover rate(f) | | | 66 | % | | | 29 | % | | | 85 | % | | | 59 | % | | | 38 | % | | | 26 | % |
| | (a) | | Calculated based on the average shares outstanding methodology. |
| | (b) | | Recognition of net investment income by the Portfolio is affected by the timing of declaration of dividends by the Underlying Funds in which the Portfolio invests. |
| | (c) | | Assumes investment at the NAV at the beginning of the period, reinvestment of all dividends and distributions, a complete redemption of the investment at the NAV at the end of the period and no sales or redemption charges (if any). Total returns would be reduced if a sales or redemption charge was taken into account. Returns do not reflect the impact of taxes to shareholders relating to Portfolio distributions or the redemption of Portfolio shares. Total returns for periods less than one full year are not annualized. |
| | (d) | | Expense ratios exclude the expenses of the Underlying Funds in which the Portfolio invests. |
| | (f) | | The Portfolio’s portfolio turnover rate is calculated in accordance with regulatory requirements, without regard to transactions involving short term investments and certain derivatives. If such transactions were included, the Portfolio’s portfolio turnover rate may be higher. |
| | |
| 64 | | The accompanying notes are an integral part of these financial statements. |
GOLDMAN SACHS GROWTH STRATEGY PORTFOLIO
Financial Highlights(continued)
Selected Share Data for a Share Outstanding Throughout Each Period
| | | | | | | | | | |
| | | | | Goldman Sachs Growth Strategy Portfolio | |
| | | | | Class P Shares | |
| | | | | Six Months Ended
June 30, 2019 (Unaudited) | | | Period Ended
December 31, 2018(a) | |
| | Per Share Data | |
| | | |
| | Net asset value, beginning of period | | $ | 13.72 | | | $ | 15.96 | |
| | | |
| | Net investment income(b)(c) | | | 0.07 | | | | 0.28 | |
| | | |
| | Net realized and unrealized gain (loss) | | | 1.85 | | | | (2.10 | ) |
| | | |
| | Total from investment operations | | | 1.92 | | | | (1.82 | ) |
| | | |
| | Distributions to shareholders from net investment income | | | — | | | | (0.42 | ) |
| | | |
| | Net asset value, end of period | | $ | 15.64 | | | $ | 13.72 | |
| | | |
| | Total return(d) | | | 13.99 | % | | | (11.39 | )% |
| | | |
| | Net assets, end of period (in 000s) | | $ | 167,295 | | | $ | 148,866 | |
| | | |
| | Ratio of net expenses to average net assets(e)(f) | | | 0.18 | % | | | 0.19 | % |
| | | |
| | Ratio of total expenses to average net assets(e)(f) | | | 0.23 | % | | | 0.22 | % |
| | | |
| | Ratio of net investment income to average net assets(c)(f) | | | 0.90 | % | | | 2.56 | % |
| | | |
| | Portfolio turnover rate(g) | | | 66 | % | | | 29 | % |
| | (a) | | Class P Shares commenced operations on April 17, 2018. |
| | (b) | | Calculated based on the average shares outstanding methodology. |
| | (c) | | Recognition of net investment income by the Portfolio is affected by the timing of declaration of dividends by the Underlying Funds in which the Portfolio invests. |
| | (d) | | Assumes investment at the NAV at the beginning of the period, reinvestment of all dividends and distributions, a complete redemption of the investment at the NAV at the end of the period and no sales or redemption charges (if any). Total returns would be reduced if a sales or redemption charge was taken into account. Returns do not reflect the impact of taxes to shareholders relating to Portfolio distributions or the redemption of Portfolio shares. Total returns for periods less than one full year are not annualized. |
| | (e) | | Expense ratios exclude the expenses of the Underlying Funds in which the Portfolio invests. |
| | (g) | | The Portfolio’s portfolio turnover rate is calculated in accordance with regulatory requirements, without regard to transactions involving short term investments and certain derivatives. If such transactions were included, the Portfolio’s portfolio turnover rate may be higher. |
| | |
| The accompanying notes are an integral part of these financial statements. | | 65 |
GOLDMAN SACHS GROWTH STRATEGY PORTFOLIO
Financial Highlights(continued)
Selected Share Data for a Share Outstanding Throughout Each Period
| | | | | | | | | | | | | | | | | | | | | | | | | | |
| | | | | Goldman Sachs Growth Strategy Portfolio | |
| | | | | Class R Shares | |
| | | | | Six Months Ended
June 30, 2019
(Unaudited) | | | Year Ended December 31, | |
| | | | | 2018 | | | 2017 | | | 2016 | | | 2015 | | | 2014 | |
| | Per Share Data | |
| | | | | | | |
| | Net asset value, beginning of period | | $ | 13.37 | | | $ | 15.42 | | | $ | 13.08 | | | $ | 12.41 | | | $ | 12.62 | | | $ | 12.59 | |
| | | | | | | |
| | Net investment income(a)(b) | | | 0.02 | | | | 0.14 | | | | 0.16 | | | | 0.08 | | | | 0.12 | | | | 0.11 | |
| | | | | | | |
| | Net realized and unrealized gain (loss) | | | 1.81 | | | | (1.87 | ) | | | 2.54 | | | | 0.69 | | | | (0.16 | ) | | | 0.15 | |
| | | | | | | |
| | Total from investment operations | | | 1.83 | | | | (1.73 | ) | | | 2.70 | | | | 0.77 | | | | (0.04 | ) | | | 0.26 | |
| | | | | | | |
| | Distributions to shareholders from net investment income | | | — | | | | (0.32 | ) | | | (0.36 | ) | | | (0.10 | ) | | | (0.17 | ) | | | (0.23 | ) |
| | | | | | | |
| | Net asset value, end of period | | $ | 15.20 | | | $ | 13.37 | | | $ | 15.42 | | | $ | 13.08 | | | $ | 12.41 | | | $ | 12.62 | |
| | | | | | | |
| | Total return(c) | | | 13.69 | % | | | (11.18 | )% | | | 20.67 | % | | | 6.16 | % | | | (0.31 | )% | | | 2.06 | % |
| | | | | | | |
| | Net assets, end of period (in 000s) | | $ | 6,286 | | | $ | 5,475 | | | $ | 6,334 | | | $ | 2,548 | | | $ | 2,323 | | | $ | 2,461 | |
| | | | | | | |
| | Ratio of net expenses to average net assets(d) | | | 0.83 | %(e) | | | 0.84 | % | | | 0.84 | % | | | 0.84 | % | | | 0.84 | % | | | 0.85 | % |
| | | | | | | |
| | Ratio of total expenses to average net assets(d) | | | 0.88 | %(e) | | | 0.87 | % | | | 0.89 | % | | | 0.90 | % | | | 0.89 | % | | | 0.89 | % |
| | | | | | | |
| | Ratio of net investment income to average net assets(b) | | | 0.25 | %(e) | | | 0.90 | % | | | 1.06 | % | | | 0.65 | % | | | 0.95 | % | | | 0.84 | % |
| | | | | | | |
| | Portfolio turnover rate(f) | | | 66 | % | | | 29 | % | | | 85 | % | | | 59 | % | | | 38 | % | | | 26 | % |
| | (a) | | Calculated based on the average shares outstanding methodology. |
| | (b) | | Recognition of net investment income by the Portfolio is affected by the timing of declaration of dividends by the Underlying Funds in which the Portfolio invests. |
| | (c) | | Assumes investment at the NAV at the beginning of the period, reinvestment of all dividends and distributions, a complete redemption of the investment at the NAV at the end of the period and no sales or redemption charges (if any). Total returns would be reduced if a sales or redemption charge was taken into account. Returns do not reflect the impact of taxes to shareholders relating to Portfolio distributions or the redemption of Portfolio shares. Total returns for periods less than one full year are not annualized. |
| | (d) | | Expense ratios exclude the expenses of the Underlying Funds in which the Portfolio invests. |
| | (f) | | The Portfolio’s portfolio turnover rate is calculated in accordance with regulatory requirements, without regard to transactions involving short term investments and certain derivatives. If such transactions were included, the Portfolio’s portfolio turnover rate may be higher. |
| | |
| 66 | | The accompanying notes are an integral part of these financial statements. |
GOLDMAN SACHS GROWTH STRATEGY PORTFOLIO
Financial Highlights(continued)
Selected Share Data for a Share Outstanding Throughout Each Period
| | | | | | | | | | | | | | | | | | | | | | |
| | | | | Goldman Sachs Growth Strategy Portfolio | |
| | | | | Class R6 Shares | |
| | | | | Six Months Ended
June 30, 2019 (Unaudited) | | | Year Ended December 31, | | | Period Ended
December 31, 2015(a) | |
| | | | | 2018 | | | 2017 | | | 2016 | |
| | Per Share Data | |
| | | | | | |
| | Net asset value, beginning of period | | $ | 13.72 | | | $ | 15.81 | | | $ | 13.37 | | | $ | 12.68 | | | $ | 13.44 | |
| | | | | | |
| | Net investment income(b)(c) | | | 0.07 | | | | 0.39 | | | | 0.17 | | | | 0.17 | | | | 0.18 | |
| | | | | | |
| | Net realized and unrealized gain (loss) | | | 1.85 | | | | (2.06 | ) | | | 2.71 | | | | 0.70 | | | | (0.68 | ) |
| | | | | | |
| | Total from investment operations | | | 1.92 | | | | (1.67 | ) | | | 2.88 | | | | 0.87 | | | | (0.50 | ) |
| | | | | | |
| | Distributions to shareholders from net investment income | | | — | | | | (0.42 | ) | | | (0.44 | ) | | | (0.18 | ) | | | (0.26 | ) |
| | | | | | |
| | Net asset value, end of period | | $ | 15.64 | | | $ | 13.72 | | | $ | 15.81 | | | $ | 13.37 | | | $ | 12.68 | |
| | | | | | |
| | Total return(d) | | | 13.99 | % | | | (10.55 | )% | | | 21.51 | % | | | 6.76 | % | | | (3.66 | )% |
| | | | | | |
| | Net assets, end of period (in 000s) | | $ | 7,206 | | | $ | 6,603 | | | $ | 964 | | | $ | 10 | | | $ | 10 | |
| | | | | | |
| | Ratio of net expenses to average net assets(e) | | | 0.18 | %(f) | | | 0.19 | % | | | 0.18 | % | | | 0.19 | % | | | 0.21 | %(f) |
| | | | | | |
| | Ratio of total expenses to average net assets(e) | | | 0.23 | %(f) | | | 0.22 | % | | | 0.23 | % | | | 0.25 | % | | | 0.25 | %(f) |
| | | | | | |
| | Ratio of net investment income to average net assets(c) | | | 0.89 | %(f) | | | 2.54 | % | | | 1.12 | % | | | 1.33 | % | | | 3.22 | %(f) |
| | | | | | |
| | Portfolio turnover rate(g) | | | 66 | % | | | 29 | % | | | 85 | % | | | 59 | % | | | 38 | % |
| | (a) | | Commenced operations on July 31, 2015. |
| | (b) | | Calculated based on the average shares outstanding methodology. |
| | (c) | | Recognition of net investment income by the Portfolio is affected by the timing of declaration of dividends by the Underlying Funds in which the Portfolio invests. |
| | (d) | | Assumes investment at the NAV at the beginning of the period, reinvestment of all dividends and distributions, a complete redemption of the investment at the NAV at the end of the period and no sales or redemption charges (if any). Total returns would be reduced if a sales or redemption charge was taken into account. Returns do not reflect the impact of taxes to shareholders relating to Portfolio distributions or the redemption of Portfolio shares. Total returns for periods less than one full year are not annualized. |
| | (e) | | Expense ratios exclude the expenses of the Underlying Funds in which the Portfolio invests. |
| | (g) | | The Portfolio’s portfolio turnover rate is calculated in accordance with regulatory requirements, without regard to transactions involving short term investments and certain derivatives. If such transactions were included, the Portfolio’s portfolio turnover rate may be higher. |
| | |
| The accompanying notes are an integral part of these financial statements. | | 67 |
GOLDMAN SACHS SATELLITE STRATEGIES PORTFOLIO
Financial Highlights(continued)
Selected Share Data for a Share Outstanding Throughout Each Period
| | | | | | | | | | | | | | | | | | | | | | | | | | |
| | | | | Goldman Sachs Satellite Strategies Portfolio | |
| | | | | Class A Shares | |
| | | | | Six Months Ended
June 30, 2019 (Unaudited) | | | Year Ended December 31, | |
| | | | | 2018 | | | 2017 | | | 2016 | | | 2015 | | | 2014 | |
| | Per Share Data | |
| | | | | | | |
| | Net asset value, beginning of period | | $ | 7.38 | | | $ | 8.45 | | | $ | 7.64 | | | $ | 7.45 | | | $ | 7.89 | | | $ | 8.16 | |
| | | | | | | |
| | Net investment income(a)(b) | | | 0.10 | | | | 0.19 | | | | 0.20 | | | | 0.20 | | | | 0.19 | | | | 0.21 | |
| | | | | | | |
| | Net realized and unrealized gain (loss) | | | 0.85 | | | | (1.06 | ) | | | 0.88 | | | | 0.24 | | | | (0.44 | ) | | | (0.23 | ) |
| | | | | | | |
| | Total from investment operations | | | 0.95 | | | | (0.87 | ) | | | 1.08 | | | | 0.44 | | | | (0.25 | ) | | | (0.02 | ) |
| | | | | | | |
| | Distributions to shareholders from net investment income | | | (0.10 | ) | | | (0.20 | ) | | | (0.27 | ) | | | (0.25 | ) | | | (0.19 | ) | | | (0.21 | ) |
| | | | | | | |
| | Distributions to shareholders from net realized gains | | | — | | | | — | | | | — | | | | — | | | | — | | | | (0.04 | ) |
| | | | | | | |
| | Distributions to shareholders from return of capital | | | — | | | | — | | | | — | | | | 0.00 | (c) | | | — | | | | — | |
| | | | | | | |
| | Total distributions | | | (0.10 | ) | | | (0.20 | ) | | | (0.27 | ) | | | (0.25 | ) | | | (0.19 | ) | | | (0.25 | ) |
| | | | | | | |
| | Net asset value, end of period | | $ | 8.23 | | | $ | 7.38 | | | $ | 8.45 | | | $ | 7.64 | | | $ | 7.45 | | | $ | 7.89 | |
| | | | | | | |
| | Total return(d) | | | 12.85 | % | | | (10.39 | )% | | | 14.28 | % | | | 5.92 | % | | | (3.24 | )% | | | (0.28 | )% |
| | | | | | | |
| | Net assets, end of period (in 000s) | | $ | 47,568 | | | $ | 39,384 | | | $ | 53,090 | | | $ | 84,529 | | | $ | 118,345 | | | $ | 177,204 | |
| | | | | | | |
| | Ratio of net expenses to average net assets(e) | | | 0.56 | %(f) | | | 0.56 | % | | | 0.57 | % | | | 0.57 | % | | | 0.57 | % | | | 0.58 | % |
| | | | | | | |
| | Ratio of total expenses to average net assets(e) | | | 0.63 | %(f) | | | 0.61 | % | | | 0.61 | % | | | 0.61 | % | | | 0.60 | % | | | 0.60 | % |
| | | | | | | |
| | Ratio of net investment income to average net assets(b) | | | 2.42 | %(f) | | | 2.35 | % | | | 2.42 | % | | | 2.62 | % | | | 2.43 | % | | | 2.50 | % |
| | | | | | | |
| | Portfolio turnover rate(g) | | | 3 | % | | | 17 | % | | | 57 | % | | | 22 | % | | | 22 | % | | | 20 | % |
| | (a) | | Calculated based on the average shares outstanding methodology. |
| | (b) | | Recognition of net investment income by the Portfolio is affected by the timing of declaration of dividends by the Underlying Funds in which the Portfolio invests. |
| | (c) | | Amount is less than $0.005 per share. |
| | (d) | | Assumes investment at the NAV at the beginning of the period, reinvestment of all dividends and distributions, a complete redemption of the investment at the NAV at the end of the period and no sales or redemption charges (if any). Total returns would be reduced if a sales or redemption charge was taken into account. Returns do not reflect the impact of taxes to shareholders relating to Portfolio distributions or the redemption of Portfolio shares. Total returns for periods less than one full year are not annualized. |
| | (e) | | Expense ratios exclude the expenses of the Underlying Funds in which the Portfolio invests. |
| | (g) | | The Portfolio’s portfolio turnover rate is calculated in accordance with regulatory requirements, without regard to transactions involving short term investments. If such transactions were included, the Portfolio’s portfolio turnover rate may be higher. |
| | |
| 68 | | The accompanying notes are an integral part of these financial statements. |
GOLDMAN SACHS SATELLITE STRATEGIES PORTFOLIO
Financial Highlights(continued)
Selected Share Data for a Share Outstanding Throughout Each Period
| | | | | | | | | | | | | | | | | | | | | | | | | | |
| | | | | Goldman Sachs Satellite Strategies Portfolio | |
| | | | | Class C Shares | |
| | | | | Six Months Ended
June 30, 2019 (Unaudited) | | | Year Ended December 31, | |
| | | | | 2018 | | | 2017 | | | 2016 | | | 2015 | | | 2014 | |
| | Per Share Data | |
| | | | | | | |
| | Net asset value, beginning of period | | $ | 7.34 | | | $ | 8.40 | | | $ | 7.60 | | | $ | 7.41 | | | $ | 7.84 | | | $ | 8.12 | |
| | | | | | | |
| | Net investment income(a)(b) | | | 0.06 | | | | 0.12 | | | | 0.14 | | | | 0.15 | | | | 0.13 | | | | 0.15 | |
| | | | | | | |
| | Net realized and unrealized gain (loss) | | | 0.86 | | | | (1.04 | ) | | | 0.87 | | | | 0.23 | | | | (0.43 | ) | | | (0.24 | ) |
| | | | | | | |
| | Total from investment operations | | | 0.92 | | | | (0.92 | ) | | | 1.01 | | | | 0.38 | | | | (0.30 | ) | | | (0.09 | ) |
| | | | | | | |
| | Distributions to shareholders from net investment income | | | (0.06 | ) | | | (0.14 | ) | | | (0.21 | ) | | | (0.19 | ) | | | (0.13 | ) | | | (0.15 | ) |
| | | | | | | |
| | Distributions to shareholders from net realized gains | | | — | | | | — | | | | — | | | | — | | | | — | | | | (0.04 | ) |
| | | | | | | |
| | Distributions to shareholders from return of capital | | | — | | | | — | | | | — | | | | 0.00 | (c) | | | — | | | | — | |
| | | | | | | |
| | Total distributions | | | (0.06 | ) | | | (0.14 | ) | | | (0.21 | ) | | | (0.19 | ) | | | (0.13 | ) | | | (0.19 | ) |
| | | | | | | |
| | Net asset value, end of period | | $ | 8.20 | | | $ | 7.34 | | | $ | 8.40 | | | $ | 7.60 | | | $ | 7.41 | | | $ | 7.84 | |
| | | | | | | |
| | Total return(d) | | | 12.54 | % | | | (11.07 | )% | | | 13.37 | % | | | 5.17 | % | | | (3.89 | )% | | | (1.16 | )% |
| | | | | | | |
| | Net assets, end of period (in 000s) | | $ | 21,072 | | | $ | 28,041 | | | $ | 44,710 | | | $ | 53,575 | | | $ | 68,765 | | | $ | 102,605 | |
| | | | | | | |
| | Ratio of net expenses to average net assets(e) | | | 1.31 | %(f) | | | 1.31 | % | | | 1.32 | % | | | 1.32 | % | | | 1.32 | % | | | 1.33 | % |
| | | | | | | |
| | Ratio of total expenses to average net assets(e) | | | 1.38 | %(f) | | | 1.36 | % | | | 1.36 | % | | | 1.36 | % | | | 1.35 | % | | | 1.35 | % |
| | | | | | | |
| | Ratio of net investment income to average net assets(b) | | | 1.46 | %(f) | | | 1.53 | % | | | 1.78 | % | | | 1.94 | % | | | 1.66 | % | | | 1.79 | % |
| | | | | | | |
| | Portfolio turnover rate(g) | | | 3 | % | | | 17 | % | | | 57 | % | | | 22 | % | | | 22 | % | | | 20 | % |
| | (a) | | Calculated based on the average shares outstanding methodology. |
| | (b) | | Recognition of net investment income by the Portfolio is affected by the timing of declaration of dividends by the Underlying Funds in which the Portfolio invests. |
| | (c) | | Amount is less than $0.005 per share. |
| | (d) | | Assumes investment at the NAV at the beginning of the period, reinvestment of all dividends and distributions, a complete redemption of the investment at the NAV at the end of the period and no sales or redemption charges (if any). Total returns would be reduced if a sales or redemption charge was taken into account. Returns do not reflect the impact of taxes to shareholders relating to Portfolio distributions or the redemption of Portfolio shares. Total returns for periods less than one full year are not annualized. |
| | (e) | | Expense ratios exclude the expenses of the Underlying Funds in which the Portfolio invests. |
| | (g) | | The Portfolio’s portfolio turnover rate is calculated in accordance with regulatory requirements, without regard to transactions involving short term investments. If such transactions were included, the Portfolio’s portfolio turnover rate may be higher. |
| | |
| The accompanying notes are an integral part of these financial statements. | | 69 |
GOLDMAN SACHS SATELLITE STRATEGIES PORTFOLIO
Financial Highlights(continued)
Selected Share Data for a Share Outstanding Throughout Each Period
| | | | | | | | | | | | | | | | | | | | | | | | | | |
| | | | | Goldman Sachs Satellite Strategies Portfolio | |
| | | | | Institutional Shares | |
| | | | | Six Months Ended
June 30, 2019 (Unaudited) | | | Year Ended December 31, | |
| | | | | 2018 | | | 2017 | | | 2016 | | | 2015 | | | 2014 | |
| | Per Share Data | |
| | | | | | | |
| | Net asset value, beginning of period | | $ | 7.36 | | | $ | 8.43 | | | $ | 7.62 | | | $ | 7.43 | | | $ | 7.87 | | | $ | 8.15 | |
| | | | | | | |
| | Net investment income(a)(b) | | | 0.11 | | | | 0.21 | | | | 0.24 | | | | 0.23 | | | | 0.23 | | | | 0.25 | |
| | | | | | | |
| | Net realized and unrealized gain (loss) | | | 0.85 | | | | (1.05 | ) | | | 0.88 | | | | 0.24 | | | | (0.45 | ) | | | (0.24 | ) |
| | | | | | | |
| | Total from investment operations | | | 0.96 | | | | (0.84 | ) | | | 1.12 | | | | 0.47 | | | | (0.22 | ) | | | 0.01 | |
| | | | | | | |
| | Distributions to shareholders from net investment income | | | (0.11 | ) | | | (0.23 | ) | | | (0.31 | ) | | | (0.28 | ) | | | (0.22 | ) | | | (0.25 | ) |
| | | | | | | |
| | Distributions to shareholders from net realized gains | | | — | | | | — | | | | — | | | | — | | | | — | | | | (0.04 | ) |
| | | | | | | |
| | Distributions to shareholders from return of capital | | | — | | | | — | | | | — | | | | 0.00 | (c) | | | — | | | | — | |
| | | | | | | |
| | Total distributions | | | (0.11 | ) | | | (0.23 | ) | | | (0.31 | ) | | | (0.28 | ) | | | (0.22 | ) | | | (0.29 | ) |
| | | | | | | |
| | Net asset value, end of period | | $ | 8.21 | | | $ | 7.36 | | | $ | 8.43 | | | $ | 7.62 | | | $ | 7.43 | | | $ | 7.87 | |
| | | | | | | |
| | Total return(d) | | | 13.08 | % | | | (10.06 | )% | | | 14.80 | % | | | 6.38 | % | | | (2.84 | )% | | | — | %(c) |
| | | | | | | |
| | Net assets, end of period (in 000s) | | $ | 222,078 | | | $ | 260,987 | | | $ | 488,118 | | | $ | 509,681 | | | $ | 655,268 | | | $ | 833,657 | |
| | | | | | | |
| | Ratio of net expenses to average net assets(e) | | | 0.17 | %(f) | | | 0.17 | % | | | 0.17 | % | | | 0.17 | % | | | 0.17 | % | | | 0.18 | % |
| | | | | | | |
| | Ratio of total expenses to average net assets(e) | | | 0.24 | %(f) | | | 0.22 | % | | | 0.22 | % | | | 0.21 | % | | | 0.20 | % | | | 0.20 | % |
| | | | | | | |
| | Ratio of net investment income to average net assets(b) | | | 2.68 | %(f) | | | 2.62 | % | | | 2.96 | % | | | 3.08 | % | | | 2.85 | % | | | 2.97 | % |
| | | | | | | |
| | Portfolio turnover rate(g) | | | 3 | % | | | 17 | % | | | 57 | % | | | 22 | % | | | 22 | % | | | 20 | % |
| | (a) | | Calculated based on the average shares outstanding methodology. |
| | (b) | | Recognition of net investment income by the Portfolio is affected by the timing of declaration of dividends by the Underlying Funds in which the Portfolio invests. |
| | (c) | | Amount is less than $0.005 per share. |
| | (d) | | Assumes investment at the NAV at the beginning of the period, reinvestment of all dividends and distributions, a complete redemption of the investment at the NAV at the end of the period and no sales or redemption charges (if any). Total returns would be reduced if a sales or redemption charge was taken into account. Returns do not reflect the impact of taxes to shareholders relating to Portfolio distributions or the redemption of Portfolio shares. Total returns for periods less than one full year are not annualized. |
| | (e) | | Expense ratios exclude the expenses of the Underlying Funds in which the Portfolio invests. |
| | (g) | | The Portfolio’s portfolio turnover rate is calculated in accordance with regulatory requirements, without regard to transactions involving short term investments. If such transactions were included, the Portfolio’s portfolio turnover rate may be higher. |
| | |
| 70 | | The accompanying notes are an integral part of these financial statements. |
GOLDMAN SACHS SATELLITE STRATEGIES PORTFOLIO
Financial Highlights(continued)
Selected Share Data for a Share Outstanding Throughout Each Period
| | | | | | | | | | | | | | | | | | | | | | | | | | |
| | | | | Goldman Sachs Satellite Strategies Portfolio | |
| | | | | Service Shares | |
| | | | | Six Months Ended
June 30, 2019 (Unaudited) | | | Year Ended December 31, | |
| | | | | 2018 | | | 2017 | | | 2016 | | | 2015 | | | 2014 | |
| | Per Share Data | |
| | | | | | | |
| | Net asset value, beginning of period | | $ | 7.37 | | | $ | 8.43 | | | $ | 7.63 | | | $ | 7.43 | | | $ | 7.84 | | | $ | 8.12 | |
| | | | | | | |
| | Net investment income(a)(b) | | | 0.09 | | | | 0.18 | | | | 0.20 | | | | 0.18 | | | | 0.14 | | | | 0.19 | |
| | | | | | | |
| | Net realized and unrealized gain (loss) | | | 0.85 | | | | (1.05 | ) | | | 0.86 | | | | 0.26 | | | | (0.40 | ) | | | (0.22 | ) |
| | | | | | | |
| | Total from investment operations | | | 0.94 | | | | (0.87 | ) | | | 1.06 | | | | 0.44 | | | | (0.26 | ) | | | (0.03 | ) |
| | | | | | | |
| | Distributions to shareholders from net investment income | | | (0.09 | ) | | | (0.19 | ) | | | (0.26 | ) | | | (0.24 | ) | | | (0.15 | ) | | | (0.21 | ) |
| | | | | | | |
| | Distributions to shareholders from net realized gains | | | — | | | | — | | | | — | | | | — | | | | — | | | | (0.04 | ) |
| | | | | | | |
| | Distributions to shareholders from return of capital | | | — | | | | — | | | | — | | | | 0.00 | (c) | | | — | | | | — | |
| | | | | | | |
| | Total distributions | | | (0.09 | ) | | | (0.19 | ) | | | (0.26 | ) | | | (0.24 | ) | | | (0.15 | ) | | | (0.25 | ) |
| | | | | | | |
| | Net asset value, end of period | | $ | 8.22 | | | $ | 7.37 | | | $ | 8.43 | | | $ | 7.63 | | | $ | 7.43 | | | $ | 7.84 | |
| | | | | | | |
| | Total return(d) | | | 12.79 | % | | | (10.41 | )% | | | 14.06 | % | | | 5.92 | % | | | (3.32 | )% | | | (0.39 | )% |
| | | | | | | |
| | Net assets, end of period (in 000s) | | $ | 252 | | | $ | 243 | | | $ | 350 | | | $ | 408 | | | $ | 988 | | | $ | 14,085 | |
| | | | | | | |
| | Ratio of net expenses to average net assets(e) | | | 0.67 | %(f) | | | 0.67 | % | | | 0.67 | % | | | 0.67 | % | | | 0.67 | % | | | 0.68 | % |
| | | | | | | |
| | Ratio of total expenses to average net assets(e) | | | 0.74 | %(f) | | | 0.72 | % | | | 0.72 | % | | | 0.71 | % | | | 0.70 | % | | | 0.70 | % |
| | | | | | | |
| | Ratio of net investment income to average net assets(b) | | | 2.24 | %(f) | | | 2.20 | % | | | 2.41 | % | | | 2.40 | % | | | 1.81 | % | | | 2.30 | % |
| | | | | | | |
| | Portfolio turnover rate(g) | | | 3 | % | | | 17 | % | | | 57 | % | | | 22 | % | | | 22 | % | | | 20 | % |
| | (a) | | Calculated based on the average shares outstanding methodology. |
| | (b) | | Recognition of net investment income by the Portfolio is affected by the timing of declaration of dividends by the Underlying Funds in which the Portfolio invests. |
| | (c) | | Amount is less than $0.005 per share. |
| | (d) | | Assumes investment at the NAV at the beginning of the period, reinvestment of all dividends and distributions, a complete redemption of the investment at the NAV at the end of the period and no sales or redemption charges(if any). Total returns would be reduced if a sales or redemption charge was taken into account. Returns do not reflect the impact of taxes to shareholders relating to Portfolio distributions or the redemption of Portfolio shares. Total returns for periods less than one full year are not annualized. |
| | (e) | | Expense ratios exclude the expenses of the Underlying Funds in which the Portfolio invests. |
| | (g) | | The Portfolio’s portfolio turnover rate is calculated in accordance with regulatory requirements, without regard to transactions involving short term investments. If such transactions were included, the Portfolio’s portfolio turnover rate may be higher. |
| | |
| The accompanying notes are an integral part of these financial statements. | | 71 |
GOLDMAN SACHS SATELLITE STRATEGIES PORTFOLIO
Financial Highlights(continued)
Selected Share Data for a Share Outstanding Throughout Each Period
| | | | | | | | | | | | | | | | | | | | | | | | | | |
| | | | | Goldman Sachs Satellite Strategies Portfolio | |
| | | | | Investor Shares | |
| | | | | Six Months Ended
June 30, 2019 (Unaudited) | | | Year Ended December 31, | |
| | | | | 2018 | | | 2017 | | | 2016 | | | 2015 | | | 2014 | |
| | Per Share Data | |
| | | | | | | |
| | Net asset value, beginning of period | | $ | 7.36 | | | $ | 8.43 | | | $ | 7.62 | | | $ | 7.43 | | | $ | 7.87 | | | $ | 8.15 | |
| | | | | | | |
| | Net investment income(a)(b) | | | 0.10 | | | | 0.20 | | | | 0.22 | | | | 0.23 | | | | 0.21 | | | | 0.23 | |
| | | | | | | |
| | Net realized and unrealized gain (loss) | | | 0.87 | | | | (1.05 | ) | | | 0.88 | | | | 0.23 | | | | (0.44 | ) | | | (0.24 | ) |
| | | | | | | |
| | Total from investment operations | | | 0.97 | | | | (0.85 | ) | | | 1.10 | | | | 0.46 | | | | (0.23 | ) | | | (0.01 | ) |
| | | | | | | |
| | Distributions to shareholders from net investment income | | | (0.11 | ) | | | (0.22 | ) | | | (0.29 | ) | | | (0.27 | ) | | | (0.21 | ) | | | (0.23 | ) |
| | | | | | | |
| | Distributions to shareholders from net realized gains | | | — | | | | — | | | | — | | | | — | | | | — | | | | (0.04 | ) |
| | | | | | | |
| | Distributions to shareholders from return of capital | | | — | | | | — | | | | — | | | | 0.00 | (c) | | | — | | | | — | |
| | | | | | | |
| | Total distributions | | | (0.11 | ) | | | (0.22 | ) | | | (0.29 | ) | | | (0.27 | ) | | | (0.21 | ) | | | (0.27 | ) |
| | | | | | | |
| | Net asset value, end of period | | $ | 8.22 | | | $ | 7.36 | | | $ | 8.43 | | | $ | 7.62 | | | $ | 7.43 | | | $ | 7.87 | |
| | | | | | | |
| | Total return(d) | | | 13.14 | % | | | (10.19 | )% | | | 14.62 | % | | | 6.22 | % | | | (2.99 | )% | | | (0.15 | )% |
| | | | | | | |
| | Net assets, end of period (in 000s) | | $ | 20,203 | | | $ | 27,782 | | | $ | 46,011 | | | $ | 58,740 | | | $ | 67,547 | | | $ | 86,018 | |
| | | | | | | |
| | Ratio of net expenses to average net assets(e) | | | 0.31 | %(f) | | | 0.31 | % | | | 0.32 | % | | | 0.32 | % | | | 0.32 | % | | | 0.33 | % |
| | | | | | | |
| | Ratio of total expenses to average net assets(e) | | | 0.38 | %(f) | | | 0.36 | % | | | 0.36 | % | | | 0.36 | % | | | 0.35 | % | | | 0.35 | % |
| | | | | | | |
| | Ratio of net investment income to average net assets(b) | | | 2.52 | %(f) | | | 2.53 | % | | | 2.74 | % | | | 3.02 | % | | | 2.69 | % | | | 2.78 | % |
| | | | | | | |
| | Portfolio turnover rate(g) | | | 3 | % | | | 17 | % | | | 57 | % | | | 22 | % | | | 22 | % | | | 20 | % |
| | (a) | | Calculated based on the average shares outstanding methodology. |
| | (b) | | Recognition of net investment income by the Portfolio is affected by the timing of declaration of dividends by the Underlying Funds in which the Portfolio invests. |
| | (c) | | Amount is less than $0.005 per share. |
| | (d) | | Assumes investment at the NAV at the beginning of the period, reinvestment of all dividends and distributions, a complete redemption of the investment at the NAV at the end of the period and no sales or redemption charges (if any). Total returns would be reduced if a sales or redemption charge was taken into account. Returns do not reflect the impact of taxes to shareholders relating to Portfolio distributions or the redemption of Portfolio shares. Total returns for periods less than one full year are not annualized. |
| | (e) | | Expense ratios exclude the expenses of the Underlying Funds in which the Portfolio invests. |
| | (g) | | The Portfolio’s portfolio turnover rate is calculated in accordance with regulatory requirements, without regard to transactions involving short term investments. If such transactions were included, the Portfolio’s portfolio turnover rate may be higher. |
| | |
| 72 | | The accompanying notes are an integral part of these financial statements. |
GOLDMAN SACHS SATELLITE STRATEGIES PORTFOLIO
Financial Highlights(continued)
Selected Share Data for a Share Outstanding Throughout Each Period
| | | | | | | | | | |
| | | | | Goldman Sachs Satellite Strategies Portfolio | |
| | | | | Class P Shares | |
| | | | | Six Months Ended
June 30, 2019 (Unaudited) | | | Year Ended
December 31, 2018(a) | |
| | Per Share Data | |
| | | |
| | Net asset value, beginning of period | | $ | 7.37 | | | $ | 8.37 | |
| | | |
| | Net investment income(b)(c) | | | 0.11 | | | | 0.20 | |
| | | |
| | Net realized and unrealized gain (loss) | | | 0.85 | | | | (1.01 | ) |
| | | |
| | Total from investment operations | | | 0.96 | | | | (0.81 | ) |
| | | |
| | Distributions to shareholders from net investment income | | | (0.11 | ) | | | (0.19 | ) |
| | | |
| | Total distributions | | | (0.11 | ) | | | — | |
| | | |
| | Net asset value, end of period | | $ | 8.22 | | | $ | 7.37 | |
| | | |
| | Total return(d) | | | 13.07 | % | | | (9.76 | )% |
| | | |
| | Net assets, end of period (in 000s) | | $ | 3,268 | | | $ | 2,902 | |
| | | |
| | Ratio of net expenses to average net assets(e)(f) | | | 0.16 | % | | | 0.16 | % |
| | | |
| | Ratio of total expenses to average net assets(e)(f) | | | 0.23 | % | | | 0.22 | % |
| | | |
| | Ratio of net investment income to average net assets(c)(f) | | | 2.77 | % | | | 3.51 | % |
| | | |
| | Portfolio turnover rate(g) | | | 3 | % | | | 17 | % |
| | (a) | | Class P Shares commenced operations on April 17, 2018. |
| | (b) | | Calculated based on the average shares outstanding methodology. |
| | (c) | | Recognition of net investment income by the Portfolio is affected by the timing of declaration of dividends by the Underlying Funds in which the Portfolio invests. |
| | (d) | | Assumes investment at the NAV at the beginning of the period, reinvestment of all dividends and distributions, a complete redemption of the investment at the NAV at the end of the period and no sales or redemption charges (if any). Total returns would be reduced if a sales or redemption charge was taken into account. Returns do not reflect the impact of taxes to shareholders relating to Portfolio distributions or the redemption of Portfolio shares. Total returns for periods less than one full year are not annualized. |
| | (e) | | Expense ratios exclude the expenses of the Underlying Funds in which the Portfolio invests. |
| | (g) | | The Portfolio’s portfolio turnover rate is calculated in accordance with regulatory requirements, without regard to transactions involving short term investments. If such transactions were included, the Portfolio’s portfolio turnover rate may be higher. |
| | |
| The accompanying notes are an integral part of these financial statements. | | 73 |
GOLDMAN SACHS SATELLITE STRATEGIES PORTFOLIO
Financial Highlights(continued)
Selected Share Data for a Share Outstanding Throughout Each Period
| | | | | | | | | | | | | | | | | | | | | | | | | | |
| | | | | Goldman Sachs Satellite Strategies Portfolio | |
| | | | | Class R Shares | |
| | | | | Six Months Ended
June 30, 2019 (Unaudited) | | | Year Ended December 31, | |
| | | | | 2018 | | | 2017 | | | 2016 | | | 2015 | | | 2014 | |
| | Per Share Data | |
| | | | | | | |
| | Net asset value, beginning of period | | $ | 7.35 | | | $ | 8.41 | | | $ | 7.61 | | | $ | 7.42 | | | $ | 7.86 | | | $ | 8.13 | |
| | | | | | | |
| | Net investment income(a)(b) | | | 0.08 | | | | 0.17 | | | | 0.19 | | | | 0.19 | | | | 0.18 | | | | 0.18 | |
| | | | | | | |
| | Net realized and unrealized gain (loss) | | | 0.85 | | | | (1.05 | ) | | | 0.86 | | | | 0.23 | | | | (0.45 | ) | | | (0.22 | ) |
| | | | | | | |
| | Total from investment operations | | | 0.93 | | | | (0.88 | ) | | | 1.05 | | | | 0.42 | | | | (0.27 | ) | | | (0.04 | ) |
| | | | | | | |
| | Distributions to shareholders from net investment income | | | (0.08 | ) | | | (0.18 | ) | | | (0.25 | ) | | | (0.23 | ) | | | (0.17 | ) | | | (0.19 | ) |
| | | | | | | |
| | Distributions to shareholders from net realized gains | | | — | | | | — | | | | — | | | | — | | | | — | | | | (0.04 | ) |
| | | | | | | |
| | Distributions to shareholders from return of capital | | | — | | | | — | | | | — | | | | 0.00 | (c) | | | — | | | | — | |
| | | | | | | |
| | Total distributions | | | (0.08 | ) | | | (0.18 | ) | | | (0.25 | ) | | | (0.23 | ) | | | (0.17 | ) | | | (0.23 | ) |
| | | | | | | |
| | Net asset value, end of period | | $ | 8.20 | | | $ | 7.35 | | | $ | 8.41 | | | $ | 7.61 | | | $ | 7.42 | | | $ | 7.86 | |
| | | | | | | |
| | Total return(d) | | | 12.74 | % | | | (10.56 | )% | | | 13.94 | % | | | 5.71 | % | | | (3.49 | )% | | | (0.54 | )% |
| | | | | | | |
| | Net assets, end of period (in 000s) | | $ | 1,118 | | | $ | 1,955 | | | $ | 2,645 | | | $ | 2,788 | | | $ | 3,119 | | | $ | 3,495 | |
| | | | | | | |
| | Ratio of net expenses to average net assets(e) | | | 0.81 | %(f) | | | 0.81 | % | | | 0.82 | % | | | 0.82 | % | | | 0.82 | % | | | 0.83 | % |
| | | | | | | |
| | Ratio of total expenses to average net assets(e) | | | 0.88 | %(f) | | | 0.86 | % | | | 0.86 | % | | | 0.86 | % | | | 0.85 | % | | | 0.85 | % |
| | | | | | | |
| | Ratio of net investment income to average net assets(b) | | | 2.05 | %(f) | | | 2.09 | % | | | 2.33 | % | | | 2.49 | % | | | 2.24 | % | | | 2.23 | % |
| | | | | | | |
| | Portfolio turnover rate(g) | | | 3 | % | | | 17 | % | | | 57 | % | | | 22 | % | | | 22 | % | | | 20 | % |
| | (a) | | Calculated based on the average shares outstanding methodology. |
| | (b) | | Recognition of net investment income by the Portfolio is affected by the timing of declaration of dividends by the Underlying Funds in which the Portfolio invests. |
| | (c) | | Amount is less than $0.005 per share. |
| | (d) | | Assumes investment at the NAV at the beginning of the period, reinvestment of all dividends and distributions, a complete redemption of the investment at the NAV at the end of the period and no sales or redemption charges (if any). Total returns would be reduced if a sales or redemption charge was taken into account. Returns do not reflect the impact of taxes to shareholders relating to Portfolio distributions or the redemption of Portfolio shares. Total returns for periods less than one full year are not annualized. |
| | (e) | | Expense ratios exclude the expenses of the Underlying Funds in which the Portfolio invests. |
| | (g) | | The Portfolio’s portfolio turnover rate is calculated in accordance with regulatory requirements, without regard to transactions involving short term investments. If such transactions were included, the Portfolio’s portfolio turnover rate may be higher. |
| | |
| 74 | | The accompanying notes are an integral part of these financial statements. |
GOLDMAN SACHS SATELLITE STRATEGIES PORTFOLIO
Financial Highlights(continued)
Selected Share Data for a Share Outstanding Throughout Each Period
| | | | | | | | | | | | | | | | | | | | | | |
| | | | | Goldman Sachs Satellite Strategies Portfolio | |
| | | | | Class R6 Shares | |
| | | | | Six Months Ended
June 30, 2019 (Unaudited) | | | Year Ended December 31, | | | Period Ended
December 31, 2015(a) | |
| | | | | 2018 | | | 2017 | | | 2016 | |
| | Per Share Data | |
| | | | | | |
| | Net asset value, beginning of period | | $ | 7.36 | | | $ | 8.43 | | | $ | 7.63 | | | $ | 7.44 | | | $ | 7.91 | |
| | | | | | |
| | Net investment income(b)(c) | | | 0.11 | | | | 0.23 | | | | 0.25 | | | | 0.63 | | | | 0.11 | |
| | | | | | |
| | Net realized and unrealized gain (loss) | | | 0.86 | | | | (1.07 | ) | | | 0.86 | | | | (0.15 | ) | | | (0.46 | ) |
| | | | | | |
| | Total from investment operations | | | 0.97 | | | | (0.84 | ) | | | 1.11 | | | | 0.48 | | | | (0.35 | ) |
| | | | | | |
| | Distributions to shareholders from net investment income | | | (0.11 | ) | | | (0.23 | ) | | | (0.31 | ) | | | (0.28 | ) | | | (0.12 | ) |
| | | | | | |
| | Distributions to shareholders from return of capital | | | — | | | | — | | | | — | | | | (0.01 | ) | | | — | |
| | | | | | |
| | Total distributions | | | (0.11 | ) | | | (0.23 | ) | | | (0.31 | ) | | | (0.29 | ) | | | (0.12 | ) |
| | | | | | |
| | Net asset value, end of period | | $ | 8.22 | | | $ | 7.36 | | | $ | 8.43 | | | $ | 7.63 | | | $ | 7.44 | |
| | | | | | |
| | Total return(d) | | | 13.22 | % | | | (10.04 | )% | | | 14.66 | % | | | 6.40 | % | | | (4.43 | )% |
| | | | | | |
| | Net assets, end of period (in 000s) | | $ | 48,367 | | | $ | 44,046 | | | $ | 40,326 | | | $ | 33,805 | | | $ | 10 | |
| | | | | | |
| | Ratio of net expenses to average net assets(e) | | | 0.16 | %(f) | | | 0.16 | % | | | 0.16 | % | | | 0.15 | % | | | 0.15 | %(f) |
| | | | | | |
| | Ratio of total expenses to average net assets(e) | | | 0.23 | %(f) | | | 0.22 | % | | | 0.20 | % | | | 0.17 | % | | | 0.18 | %(f) |
| | | | | | |
| | Ratio of net investment income to average net assets(c) | | | 2.76 | %(f) | | | 2.88 | % | | | 3.09 | % | | | 8.15 | % | | | 3.58 | %(f) |
| | | | | | |
| | Portfolio turnover rate(g) | | | 3 | % | | | 17 | % | | | 57 | % | | | 22 | % | | | 22 | % |
| | (a) | | Commenced operations on July 31, 2015. |
| | (b) | | Calculated based on the average shares outstanding methodology. |
| | (c) | | Recognition of net investment income by the Portfolio is affected by the timing of declaration of dividends by the Underlying Funds in which the Portfolio invests. |
| | (d) | | Assumes investment at the NAV at the beginning of the period, reinvestment of all dividends and distributions, a complete redemption of the investment at the NAV at the end of the period and no sales or redemption charges (if any). Total returns would be reduced if a sales or redemption charge was taken into account. Returns do not reflect the impact of taxes to shareholders relating to Portfolio distributions or the redemption of Portfolio shares. Total returns for periods less than one full year are not annualized. |
| | (e) | | Expense ratios exclude the expenses of the Underlying Funds in which the Portfolio invests. |
| | (g) | | The Portfolio’s portfolio turnover rate is calculated in accordance with regulatory requirements, without regard to transactions involving short term investments. If such transactions were included, the Portfolio’s portfolio turnover rate may be higher. |
| | |
| The accompanying notes are an integral part of these financial statements. | | 75 |
GOLDMAN SACHS FUND OF FUNDS PORTFOLIOS
Notes to Financial Statements
June 30, 2019 (Unaudited)
Goldman Sachs Trust (the “Trust”) is a Delaware statutory trust registered under the Investment Company Act of 1940, as amended (the “Act”), as an open-end management investment company. The following table lists those series of the Trust that are included in this report (collectively, the “Portfolios” or individually a “Portfolio”), along with their corresponding share classes and respective diversification status under the Act:
| | | | |
| Portfolio | | Share Classes Offered | | Diversified/
Non-diversified |
All Portfolios | | A, C, Institutional, Service, Investor, P, R, R6 | | Diversified |
Class A Shares are sold with a front-end sales charge of up to 5.50%. Class C Shares are sold with a contingent deferred sales charge (“CDSC”) of 1.00%, which is imposed on redemptions made within 12 months of purchase. Institutional, Service, Investor, Class P, Class R and Class R6 Shares are not subject to a sales charge.
Goldman Sachs Asset Management, L.P. (“GSAM”), an affiliate of Goldman Sachs & Co. LLC (“Goldman Sachs”), serves as investment adviser to the Portfolios pursuant to a management agreement (the “Agreement”) with the Trust.
The Portfolios are expected to invest primarily in a combination of domestic and international equity and fixed income underlying funds (“Underlying Funds”) which are registered under the Act, for which GSAM or Goldman Sachs Asset Management International (“GSAMI”), also an affiliate of Goldman Sachs, act as investment advisers.
|
| 2. SIGNIFICANT ACCOUNTING POLICIES |
The financial statements have been prepared in accordance with accounting principles generally accepted in the United States of America (“GAAP”) and require management to make estimates and assumptions that may affect the reported amounts and disclosures. Actual results may differ from those estimates and assumptions.
A. Investment Valuation— The valuation policy of the Portfolios and Underlying Funds is to value investments at fair value.
B. Investment Income and Investments— Investment income includes interest income, dividend income, and securities lending income, if any. Interest income is accrued daily and adjusted for amortization of premiums and accretion of discounts. Dividend income is recognized on ex-dividend date or, for certain foreign securities, as soon as such information is obtained subsequent to the ex-dividend date. Investment transactions are reflected on trade date. Realized gains and losses are calculated using identified cost. Investment transactions are recorded on the following business day for daily net asset value (“NAV”) calculations. Investment income is recorded net of any foreign withholding taxes, less any amounts reclaimable. The Portfolios may file withholding tax reclaims in certain jurisdictions to recover a portion of amounts previously withheld. Any foreign capital gains tax is accrued daily based upon net unrealized gains, and is payable upon sale of such investments. Income distributions are recognized as capital gains or income in the financial statements in accordance with the character that is distributed.
For derivative contracts, realized gains and losses are recorded upon settlement of the contract.
C. Class Allocations and Expenses — Investment income, realized and unrealized gain (loss), if any, and non-class specific expenses of each Portfolio are allocated daily based upon the proportion of net assets of each class.Non-class specific expenses directly incurred by a Portfolio are charged to that Portfolio, while such expenses incurred by the Trust are allocated across the applicable Portfolios on a straight-line and/orpro-rata basis depending upon the nature of the expenses. Class specific expenses, where applicable, are borne by the respective share classes and include Distribution and Service, Transfer Agency and Service and Shareholder Administration fees. Expenses included in the accompanying financial statements reflect the expenses of each Portfolio and do not include any expenses associated with the Underlying Funds (“Underlying Funds”). Because the Underlying Funds have varied expense and fee levels and the Portfolios may own different proportions of the Underlying Funds at different times, the amount of fees and expenses incurred indirectly by each Portfolio will vary.
D. Federal Taxes and Distributions to Shareholders — It is each Portfolio’s policy to comply with the requirements of the Internal Revenue Code of 1986, as amended (the “Code”), applicable to regulated investment companies and to distribute each
76
GOLDMAN SACHS FUND OF FUNDS PORTFOLIOS
|
| 2. SIGNIFICANT ACCOUNTING POLICIES (continued) |
year substantially all of its investment company taxable income and capital gains to its shareholders. Accordingly, each Portfolio is not required to make any provisions for the payment of federal income tax. Distributions to shareholders are recorded on the ex-dividend date. Income and capital gains distributions, if any, are declared and paid according to the following schedule:
| | | | | | |
| Portfolio | | | | Income Distributions
Declared/Paid | | Capital Gains Distributions
Declared/Paid |
Balanced Strategy, Growth and Income Strategy and Satellite Strategies | | | | Quarterly | | Annually |
Growth Strategy | | | | Annually | | Annually |
Net capital losses, if any, are carried forward to future fiscal years and may be used to the extent allowed by the Code to offset any future capital gains. Losses that are carried forward will retain their character as eithershort-term orlong-term capital losses. Utilization of capital loss carryforwards will reduce the requirement of future capital gains distributions.
The characterization of distributions to shareholders for financial reporting purposes is determined in accordance with federal income tax rules, which may differ from GAAP. The source of each Portfolio’s distributions may be shown in the accompanying financial statements as either from distributable earnings or capital. Certain components of the Portfolios’ net assets on the Statements of Assets and Liabilities reflect permanent GAAP/tax differences based on the appropriate tax character.
E. Foreign Currency Translation — The accounting records and reporting currency of the Portfolios are maintained in U.S. dollars. Assets and liabilities denominated in foreign currencies are translated into U.S. dollars using the current exchange rates at the close of each business day. The effect of changes in foreign currency exchange rates on investments is included within net realized and unrealized gain (loss) on investments. Changes in the value of other assets and liabilities as a result of fluctuations in foreign exchange rates are included in the Statements of Operations within net change in unrealized gain (loss) on foreign currency translation. Transactions denominated in foreign currencies are translated into U.S. dollars on the date the transaction occurred, the effects of which are included within net realized gain (loss) on foreign currency transactions.
|
| 3. INVESTMENTS AND FAIR VALUE MEASUREMENTS |
U.S. GAAP defines the fair value of a financial instrument as the amount that would be received to sell an asset or paid to transfer a liability in an orderly transaction between market participants at the measurement date (i.e., the exit price); the Portfolios’ policy is to use the market approach. GAAP establishes a fair value hierarchy that prioritizes the inputs to valuation techniques used to measure fair value. The hierarchy gives the highest priority to unadjusted quoted prices in active markets for identical assets or liabilities (Level 1 measurements) and the lowest priority to unobservable inputs (Level 3 measurements). The levels used for classifying investments are not necessarily an indication of the risk associated with investing in these investments. The three levels of the fair value hierarchy are described below:
Level 1 — Unadjusted quoted prices in active markets that are accessible at the measurement date for identical, unrestricted assets or liabilities;
Level 2 — Quoted prices in markets that are not active or financial instruments for which significant inputs are observable (including, but not limited to, quoted prices for similar investments, interest rates, foreign exchange rates, volatility and credit spreads), either directly or indirectly;
Level 3 — Prices or valuations that require significant unobservable inputs (including GSAM’s assumptions in determining fair value measurement).
The Board of Trustees (“Trustees”) has approved Valuation Procedures that govern the valuation of the portfolio investments held by the Portfolios, including investments for which market quotations are not readily available. The Trustees have delegated to GSAMday-to-day responsibility for implementing and maintaining internal controls and procedures related to the valuation of the Portfolios’ investments. To assess the continuing appropriateness of pricing sources and methodologies, GSAM regularly performs price verification procedures and issues challenges as necessary to third party pricing vendors or brokers, and any differences are reviewed in accordance with the Valuation Procedures.
77
GOLDMAN SACHS FUND OF FUNDS PORTFOLIOS
Notes to Financial Statements(continued)
June 30, 2019 (Unaudited)
|
| 3. INVESTMENTS AND FAIR VALUE MEASUREMENTS (continued) |
A. Level 1 and Level 2 Fair Value Investments — The valuation techniques and significant inputs used in determining the fair values for investments classified as Level 1 and Level 2 are as follows:
Underlying Funds (including Money Market Funds) — Underlying funds (“Underlying Funds”) include other investment companies and exchange-traded funds (“ETFs”). Investments in the Underlying Funds (except ETFs) are valued at the NAV per share on the day of valuation. ETFs are valued daily at the last sale price or official closing price on the principal exchange or system on which the investment is traded. Because the Portfolios invest in Underlying Funds that fluctuate in value, the Portfolios’ shares will correspondingly fluctuate in value. To the extent these investments are actively traded, they are classified as Level 1 of the fair value hierarchy, otherwise they are generally classified as Level 2. For information regarding an Underlying Fund’s accounting policies and investment holdings, please see the Underlying Fund’s shareholder report.
Derivative Contracts — A derivative is an instrument whose value is derived from underlying assets, indices, reference rates or a combination of these factors. A Portfolio enters into derivative transactions to hedge against changes in interest rates, securities prices, and/or currency exchange rates, to increase total return, or to gain access to certain markets or attain exposure to other underliers. For financial reporting purposes, cash collateral that has been pledged to cover obligations of a Portfolio and cash collateral received, if any, is reported separately on the Statements of Assets and Liabilities as receivables/payables for collateral on certain derivatives contracts.Non-cash collateral pledged by a Portfolio, if any, is noted in the Schedules of Investments.
Exchange-traded derivatives, including futures and options contracts, are valued at the last sale or settlement price on the exchange where they are principally traded. Exchange-traded options without settlement prices are generally valued at the midpoint of the bid and ask prices on the exchange where they are principally traded (or, in the absence of two-way trading, at the last bid price for long positions and the last ask price for short positions). Exchange-traded derivatives typically fall within Level 1 of the fair value hierarchy.Over-the-counter (“OTC”) and centrally cleared derivatives are valued using market transactions and other market evidence, including market-based inputs to models, calibration to market-clearing transactions, broker or dealer quotations, or other alternative pricing sources. Where models are used, the selection of a particular model to value OTC and centrally cleared derivatives depends upon the contractual terms of, and specific risks inherent in, the instrument, as well as the availability of pricing information in the market. Valuation models require a variety of inputs, including contractual terms, market prices, yield curves, credit curves, measures of volatility, voluntary and involuntary prepayment rates, loss severity rates and correlations of such inputs. For OTC and centrally cleared derivatives that trade in liquid markets, model inputs can generally be verified and model selection does not involve significant management judgment. OTC and centrally cleared derivatives are classified within Level 2 of the fair value hierarchy when significant inputs are corroborated by market evidence.
i. Forward Contracts — A forward contract is a contract between two parties to buy or sell an asset at a specified price on a future date. A forward contract settlement can occur on a cash or delivery basis. Forward contracts aremarked-to-market daily using independent vendor prices, and the change in value, if any, is recorded as an unrealized gain or loss. Cash and certain investments may be used to collateralize forward contracts.
Aforward foreign currency exchange contract is a forward contract in which a Portfolio agrees to receive or deliver a fixed quantity of one currency for another, at a pre-determined price at a future date. All forward foreign currency exchange contracts aremarked-to-market daily at the applicable forward rate. Non-deliverable forward foreign currency exchange contracts are settled with the counterparty in cash without the delivery of foreign currency.
ii. Futures Contracts — Futures contracts are contracts to buy or sell a standardized quantity of a specified commodity or security. Upon entering into a futures contract, a Portfolio deposits cash or securities in an account on behalf of the broker in an amount sufficient to meet the initial margin requirement. Subsequent payments are made or received by a Portfolio equal to the daily change in the contract value and are recorded as variation margin receivable or payable with a corresponding offset to unrealized gains or losses.
iii. Options — When a Portfolio writes call or put options, an amount equal to the premium received is recorded as a liability and is subsequentlymarked-to-market to reflect the current value of the option written. Swaptions are options on interest rate and/or credit default swap contracts.
78
GOLDMAN SACHS FUND OF FUNDS PORTFOLIOS
|
| 3. INVESTMENTS AND FAIR VALUE MEASUREMENTS (continued) |
Upon the purchase of a call option or a put option by a Portfolio, the premium paid is recorded as an investment and subsequentlymarked-to-market to reflect the current value of the option. Certain options may be purchased with premiums to be determined on a future date. The premiums for these options are based upon implied volatility parameters at specified terms.
B. Level 3 Fair Value Investments — To the extent that significant inputs to valuation models and other alternative pricing sources are unobservable, or if quotations are not readily available, or if GSAM believes that such quotations do not accurately reflect fair value, the fair value of the Portfolios’ investments may be determined under Valuation Procedures approved by the Trustees. GSAM, consistent with its procedures and applicable regulatory guidance, may make an adjustment to the most recent valuation prices of either domestic or foreign securities in light of significant events to reflect what it believes to be the fair value of the securities at the time of determining a Portfolio’s NAV. To the extent investments are valued using single source broker quotations obtained directly from the broker or passed through from third party pricing vendors, such investments are classified as Level 3 investments. GSAM did not develop the unobservable inputs for valuation of Level 3 Assets and Liabilities.
C. Fair Value Hierarchy — The following is a summary of the Portfolios’ investments and derivatives classified in the fair value hierarchy as of June 30, 2019:
| | | | | | | | | | | | |
|
| BALANCED STRATEGY PORTFOLIO | |
| | | |
| Investment Type | | Level 1 | | | Level 2 | | | Level 3 | |
| | | |
| Assets | | | | | | | | | | | | |
| | | |
Underlying Funds | | | | | | | | | | | | |
| | | |
Dynamic | | $ | 50,592,546 | | | $ | — | | | $ | — | |
| | | |
Equity | | | 153,333,182 | | | | — | | | | — | |
| | | |
Exchange Traded Funds | | | 105,211,219 | | | | — | | | | — | |
| | | |
Fixed Income | | | 187,715,894 | | | | — | | | | — | |
| | | |
Investment Companies | | | 4,408,283 | | | | — | | | | — | |
| | | |
| Total | | $ | 501,261,124 | | | $ | — | | | $ | — | |
| | | |
| Derivative Type | | | | | | | | | |
| | | |
| Assets | | | | | | | | | | | | |
| | | |
Forward Foreign Currency Exchange Contracts(a) | | $ | — | | | $ | 16,043 | | | $ | — | |
| | | |
Futures Contracts(a) | | | 437,756 | | | | — | | | | — | |
| | | |
Options Purchased | | | 3,242,037 | | | | 291,518 | | | | — | |
| | | |
| Total | | $ | 3,679,793 | | | $ | 307,561 | | | $ | — | |
| | | |
| Liabilities(a) | | | | | | | | | | | | |
| | | |
Forward Foreign Currency Exchange Contracts | | $ | — | | | $ | (63,117 | ) | | $ | — | |
| | | |
Futures Contracts | | | (1,890,666 | ) | | | — | | | | — | |
| | | |
| Total | | $ | (1,890,666 | ) | | $ | (63,117 | ) | | $ | — | |
| (a) | | Amount shown represents unrealized gain (loss) at period end. |
79
GOLDMAN SACHS FUND OF FUNDS PORTFOLIOS
Notes to Financial Statements(continued)
June 30, 2019 (Unaudited)
|
| 3. INVESTMENTS AND FAIR VALUE MEASUREMENTS (continued) |
| | | | | | | | | | | | |
| | | |
| GROWTH AND INCOME STRATEGY PORTFOLIO | | | | | | | | | | | | |
| | | |
| Investment Type | | Level 1 | | | Level 2 | | | Level 3 | |
| | | |
| Assets | | | | | | | | | | | | |
| | | |
Underlying Funds | | | | | | | | | | | | |
| | | |
Dynamic | | $ | 70,428,964 | | | $ | — | | | $ | — | |
| | | |
Equity | | | 372,140,313 | | | | — | | | | — | |
| | | |
Exchange Traded Funds | | | 251,904,581 | | | | — | | | | — | |
| | | |
Fixed Income | | | 172,974,507 | | | | — | | | | — | |
| | | |
| Total | | $ | 867,448,365 | | | $ | — | | | $ | — | |
| | | |
| Derivative Type | | | | | | | | | |
| | | |
| Assets | | | | | | | | | | | | |
| | | |
Forward Foreign Currency Exchange Contracts(a) | | $ | — | | | $ | 6,501 | | | $ | — | |
| | | |
Futures Contracts(a) | | | 769,165 | | | | — | | | | — | |
| | | |
Options Purchased | | | 6,398,112 | | | | 587,190 | | | | — | |
| | | |
| Total | | $ | 7,167,277 | | | $ | 593,691 | | | $ | — | |
| | | |
| Liabilities | | | | | | | | | | | | |
| | | |
Forward Foreign Currency Exchange Contracts(a) | | $ | — | | | $ | (129,344 | ) | | $ | — | |
| | | |
Futures Contracts(a) | | | (4,144,162 | ) | | | — | | | | — | |
| | | |
Written Option Contracts | | | — | | | | (2,895 | ) | | | — | |
| | | |
| Total | | $ | (4,144,162 | ) | | $ | (132,239 | ) | | $ | — | |
| | | | | | | | | | | | |
| | | |
| GROWTH STRATEGY PORTFOLIO | | | | | | | | | | | | |
| | | |
| Investment Type | | Level 1 | | | Level 2 | | | Level 3 | |
| | | |
| Assets | | | | | | | | | | | | |
| | | |
Underlying Funds | | | | | | | | | | | | |
| | | |
Dynamic | | $ | 46,481,271 | | | $ | — | | | $ | — | |
| | | |
Equity | | | 405,414,869 | | | | — | | | | — | |
| | | |
Exchange Traded Funds | | | 268,039,233 | | | | — | | | | — | |
| | | |
Fixed Income | | | 40,275,987 | | | | — | | | | — | |
| | | |
Investment Companies | | | 1,102,513 | | | | — | | | | — | |
| | | |
| Total | | $ | 761,313,873 | | | $ | — | | | $ | — | |
| | | |
| Derivative Type | | | | | | | | | |
| | | |
| Assets | | | | | | | | | | | | |
| | | |
Forward Foreign Currency Exchange Contracts(a) | | $ | — | | | $ | 4,038 | | | $ | — | |
| | | |
Futures Contracts(a) | | | 682,603 | | | | — | | | | — | |
| | | |
Options Purchased | | | 6,334,200 | | | | 587,190 | | | | — | |
| | | |
| Total | | $ | 7,016,803 | | | $ | 591,228 | | | $ | — | |
| | | |
| Liabilities(a) | | | | | | | | | | | | |
| | | |
Forward Foreign Currency Exchange Contracts | | $ | — | | | $ | (100,974 | ) | | $ | — | |
| | | |
Futures Contracts | | | (3,804,519 | ) | | | — | | | | — | |
| | | |
| Total | | $ | (3,804,519 | ) | | $ | (100,974 | ) | | $ | — | |
| (a) | | Amount shown represents unrealized gain (loss) at period end. |
80
GOLDMAN SACHS FUND OF FUNDS PORTFOLIOS
|
| 3. INVESTMENTS AND FAIR VALUE MEASUREMENTS (continued) |
| | | | | | | | | | | | |
| | | |
| SATELLITE STRATEGIES PORTFOLIO | | | | | | | | | | | | |
| | | |
| Investment Type | | Level 1 | | | Level 2 | | | Level 3 | |
| | | |
| Assets | | | | | | | | | | | | |
| | | |
Underlying Funds | | | | | | | | | | | | |
Equity | | $ | 198,308,547 | | | $ | — | | | $ | — | |
| | | |
Exchange Traded Funds | | | 16,014,954 | | | | — | | | | — | |
| | | |
Fixed Income | | | 146,396,746 | | | | — | | | | — | |
| | | |
Total | | $ | 360,720,247 | | | $ | — | | | $ | — | |
For further information regarding security characteristics, see the Schedules of Investments.
|
| 4. INVESTMENTS IN DERIVATIVES |
The following tables set forth, by certain risk types, the gross value of derivative contracts (not considered to be hedging instruments for accounting disclosure purposes) as of June 30, 2019. These instruments were used as part of the Portfolios’ investment strategies and to obtain and/or manage exposure related to the risks below. The values in the tables below exclude the effects of cash collateral received or posted pursuant to these derivative contracts, and therefore are not representative of the Portfolios’ net exposure.
| | | | | | | | | | | | |
| | | |
| Balanced Strategy Portfolio | | | | | | | | | | |
| Risk | | Statement of Assets
and Liabilities | | Assets | | | Statement of Assets
and Liabilities | | Liabilities | |
Interest | | Purchased options, at value | | $ | 3,242,037 | | | Variation margin on future contracts | | $ | (1,890,666) | (a) |
Currency | | Receivable for unrealized gain on forward foreign currency exchange contracts | | | 16,043 | | | Payable for unrealized loss on forward foreign currency contracts | | | (63,117) | |
Equity | | Variation margin on future contracts; Purchased options, at value | | | 729,274 | (a) | | — | | | — | |
Total | | | | $ | 3,987,354 | | | | | $ | (1,953,783) | |
| | | |
| Growth and Income Strategy Portfolio | | | | | | | | | | |
| Risk | | Statement of Assets
and Liabilities | | Assets | | | Statement of Assets
and Liabilities | | Liabilities | |
Interest | | Purchased options, at value | | $ | 6,398,112 | | | Variation margin on future contracts | | $ | (4,144,162) | (a) |
Currency | | Receivable for unrealized gain on forward foreign currency exchange contracts | | | 6,501 | | | Payable for unrealized loss on forward foreign currency contracts | | | (129,344) | |
Equity | | Variation margin on future contracts; Purchased options, at value | | | 1,356,355 | (a) | | Written options, at value | | | (2,895) | |
Total | | | | $ | 7,760,968 | | | | | $ | (4,276,401) | |
| (a) | | Includes unrealized gain (loss) on futures contracts described in the Additional Investment Information sections of the Schedules of Investments. Only the variation margin as of June 30, 2019 is reported within the Statements of Assets and Liabilities. |
81
GOLDMAN SACHS FUND OF FUNDS PORTFOLIOS
Notes to Financial Statements(continued)
June 30, 2019 (Unaudited)
|
| 4. INVESTMENTS IN DERIVATIVES (continued) |
| | | | | | | | | | | | |
| | | |
| Growth Strategy Portfolio | | | | | | | | | | |
| Risk | | Statement of Assets
and Liabilities | | Assets | | | Statement of Assets
and Liabilities | | Liabilities | |
Interest | | Purchased options, at value | | $ | 6,334,200 | | | Variation margin on future contracts | | $ | (3,804,519) | (a) |
Currency | | Receivable for unrealized gain on forward foreign currency exchange contracts | | | 4,038 | | | Payable for unrealized loss on forward foreign currency contracts | | | (100,974) | |
Equity | | Variation margin on future contracts; Purchased options, at value | | | 1,269,793 | (a) | | — | | | — | |
Total | | | | $ | 7,608,031 | | | | | $ | (3,905,493) | |
| (a) | | Includes unrealized gain (loss) on futures contracts described in the Additional Investment Information sections of the Schedules of Investments. Only the variation margin as of June 30, 2019 is reported within the Statements of Assets and Liabilities. |
The following tables set forth, by certain risk types, the Portfolios’ gains (losses) related to these derivatives and their indicative volumes for the six months ended June 30, 2019. These gains (losses) should be considered in the context that these derivative contracts may have been executed to create investment opportunities and/or economically hedge certain investments, and accordingly, certain gains (losses) on such derivative contracts may offset certain (losses) gains attributable to investments. These gains (losses) are included in “Net realized gain (loss)” or “Net change in unrealized gain (loss)” on the Statements of Operations:
| | | | | | | | | | | | | | |
| | | |
| Balanced Strategy Portfolio | | | | | | | | | | | | |
| Risk | | Statement of Operations | | Net Realized
Gain (Loss) | | | Net Change in
Unrealized
Gain (Loss) | | | Average
Number of
Contracts(a) | |
| Interest | | Net realized gain (loss) from purchased options and futures contracts/Net change in unrealized gain (loss) on purchased options and futures contracts | | $ | 1,978,201 | | | $ | (1,507,368 | ) | | | 820 | |
| Equity | | Net realized gain (loss) from futures contracts and written options/Net change in unrealized gain (loss) on futures contracts and written options | | | 2,125,623 | | | | 1,187,046 | | | | 216 | |
| Currency | | Net realized gain (loss) from forward foreign currency exchange contracts/Net change in unrealized gain (loss) on forward foreign currency exchange contracts | | | 415,970 | | | | 142,075 | | | | 14 | |
| Total | | | | $ | 4,519,794 | | | $ | (178,247 | ) | | | 1,050 | |
| | | |
| Growth and Income Strategy Portfolio | | | | | | | | | | | | |
| Risk | | Statement of Operations | | Net Realized
Gain (Loss) | | | Net Change in
Unrealized
Gain (Loss) | | | Average
Number of
Contracts(a) | |
| Interest | | Net realized gain (loss) from purchased options and futures contracts/Net change in unrealized gain (loss) on purchased options and futures contracts | | $ | (1,704,082 | ) | | $ | (4,199,664 | ) | | | 1,819 | |
| Equity | | Net realized gain (loss) from futures contracts and written options/Net change in unrealized gain (loss) on futures contracts and written options | | | 10,176,679 | | | | 2,402,432 | | | | 357 | |
| Currency | | Net realized gain (loss) from forward foreign currency exchange contracts/Net change in unrealized gain (loss) on forward foreign currency exchange contracts | | | 967,369 | | | | 244,670 | | | | 14 | |
| Total | | | | $ | 9,439,966 | | | $ | (1,552,562 | ) | | | 2,190 | |
| (a) | | Average number of contracts is based on the average of month end balances for the six months period ended June 30, 2019. |
82
GOLDMAN SACHS FUND OF FUNDS PORTFOLIOS
|
| 4. INVESTMENTS IN DERIVATIVES (continued) |
| | | | | | | | | | | | | | |
| | | |
| Growth Strategy Portfolio | | | | | | | | | | | | |
| Risk | | Statement of Operations | | Net Realized
Gain (Loss) | | | Net Change in
Unrealized
Gain (Loss) | | | Average
Number of
Contracts(a) | |
| Interest | | Net realized gain (loss) from futures contracts and purchased options/Net change in unrealized gain (loss) on futures contracts and purchased options | | $ | 5,954,977 | | | $ | (4,670,970 | ) | | | 1,800 | |
| Equity | | Net realized gain (loss) from futures contracts and written options/Net change in unrealized gain (loss) on futures contracts and written options | | | 5,386,308 | | | | 1,743,187 | | | | 316 | |
| Currency | | Net realized gain (loss) from forward foreign currency exchange contracts/Net change in unrealized gain (loss) on forward foreign currency exchange contracts | | | 942,688 | | | | 188,198 | | | | 21 | |
| Total | | | | $ | 12,283,973 | | | $ | (2,739,585 | ) | | | 2,137 | |
| (a) | | Average number of contracts is based on the average of month end balances for the six months period ended June 30, 2019. |
|
| 5. AGREEMENTS AND AFFILIATED TRANSACTIONS |
A. Management Agreement — Under the Agreement, GSAM manages the Portfolios, subject to the general supervision of the Trustees.
As compensation for the services rendered pursuant to the Agreement, the assumption of the expenses related thereto and administration of the Portfolios’ business affairs, including providing facilities, GSAM is entitled to a management fee, accrued daily and paid monthly, equal to an annual percentage rate of the Portfolio’s average daily net assets of 0.124% for the Satellite Strategies Portfolio and 0.15% for each of the other Portfolios.
B. Distribution and/or Service (12b-1) Plans — The Trust, on behalf of Class A and Class R Shares of each Portfolio, has adopted Distribution and Service Plans subject to Rule 12b-1 under the Act. Under the Distribution and Service Plans, Goldman Sachs, which serves as distributor (the “Distributor”), is entitled to a fee accrued daily and paid monthly for distribution services and personal and account maintenance services, which may then be paid by Goldman Sachs to authorized dealers. These fees are equal to an annual percentage rate of the average daily net assets attributable to Class A or Class R Shares of the Portfolios, as applicable, as set forth below.
The Trust, on behalf of Class C Shares of each Portfolio, has adopted a Distribution Plan subject to Rule 12b-1 under the Act. Under the Distribution Plan, Goldman Sachs as Distributor is entitled to a fee accrued daily and paid monthly for distribution services, which may then be paid by Goldman Sachs to authorized dealers. These fees are equal to an annual percentage rate of the average daily net assets attributable to Class C Shares of the Portfolios, as set forth below.
The Trust, on behalf of Service Shares of each Portfolio, has adopted a Service Plan subject to Rule 12b-1 under the Act to allow Service Shares to compensate service organizations (including Goldman Sachs) for providing personal and account maintenance services to their customers who are beneficial owners of such shares. The Service Plan provides for compensation to the service organizations equal to an annual percentage rate of the average daily net assets attributable to Service Shares of the Portfolios, as set forth below.
| | | | | | | | | | | | | | | | |
| | | Distribution and/or Service Plans Rates | |
| | | Class A* | | | Class C | | | Class R* | | | Service | |
Distribution and/or Service Plans | | | 0.25 | % | | | 0.75 | % | | | 0.50 | % | | | 0.25 | % |
| * | | With respect to Class A and Class R Shares, the Distributor at its discretion may use compensation for distribution services paid under the Distribution and/or Service Plans to compensate service organizations for personal and account maintenance services and expenses as long as such total compensation does not exceed the maximum cap on “service fees” imposed by the Financial Industry Regulatory Authority. |
83
GOLDMAN SACHS FUND OF FUNDS PORTFOLIOS
Notes to Financial Statements(continued)
June 30, 2019 (Unaudited)
|
| 5. AGREEMENTS AND AFFILIATED TRANSACTIONS (continued) |
C. Distribution Agreement — Goldman Sachs, as Distributor of the shares of the Portfolios pursuant to a Distribution Agreement, may retain a portion of the Class A Shares’ front end sales charge and Class C Shares’ CDSC. During the six months ended June 30, 2019, Goldman Sachs retained the following amounts:
| | | | | | | | | | |
| | | | | Front End
Sales Charge | | | Contingent Deferred
Sales Charge | |
| Portfolio | | | | Class A | | | Class C | |
Balanced Strategy | | | | $ | 2,362 | | | $ | 164 | |
Growth and Income Strategy | | | | | 7,848 | | | | 393 | |
Growth Strategy | | | | | 9,094 | | | | 541 | |
Satellite Strategies | | | | | 413 | | | | 4 | |
D. Service and/or Shareholder Administration Plans — The Trust, on behalf of each Portfolio, has adopted Service and/or Shareholder Administration Plans to allow Class C and Service Shares, respectively, to compensate service organizations (including Goldman Sachs) for providing varying levels of personal and account maintenance and/or shareholder administration services to their customers who are beneficial owners of such shares. The Service and/or Shareholder Administration Plans each provide for compensation to the service organizations equal to an annual percentage rate of 0.25% of the average daily net assets attributable to Class C and/or Service Shares of the Portfolios, respectively.
E. Transfer Agency Agreement — Goldman Sachs also serves as the transfer agent of the Portfolios for a fee pursuant to the Transfer Agency Agreement. The fees charged for such transfer agency services are accrued daily and paid monthly at annual rates as follows: 0.18% of the average daily net assets of Class A, Class C, Investor and Class R Shares; 0.03% of the average daily net assets of Class P and Class R6 Shares; and 0.04% of the average daily net assets of Institutional and Service Shares.
F. Other Expense Agreements and Affiliated Transactions — GSAM has agreed to reduce or limit certain “Other Expenses” of the Portfolios (excluding acquired fund fees and expenses, transfer agency fees and expenses, service fees and shareholder administration fees (as applicable), taxes, interest, brokerage fees, expenses of shareholder meetings, litigation and indemnification, and extraordinary expenses) to the extent such expenses exceed, on an annual basis, a percentage rate of the average daily net assets of each Portfolio. Such Other Expense reimbursements, if any, are accrued daily and paid monthly. In addition, the Portfolios are not obligated to reimburse GSAM for prior fiscal year expense reimbursements, if any. The Other Expense limitations as an annual percentage rate of average daily net assets are 0.01% for the Satellite Strategies Portfolio and 0.004% for each other Portfolio. These Other Expense limitations will remain in place through at least April 30, 2020, and prior to such date GSAM may not terminate the arrangements without the approval of the Trustees. In addition, the Portfolios have entered into certain offset arrangements with the transfer agent, which may result in a reduction of the Portfolios’ expenses and are received irrespective of the application of the “Other Expense” limitations described above.
For the six months ended June 30, 2019, these expense reductions, including any fee waivers and Other Expense reimbursements, were as follows:
| | | | | | | | | | | | | | |
| Portfolio | | | | Transfer Agency
Waivers/Credits | | | Other
Expense
Reimbursements | | | Total
Expense
Reductions | |
Balanced Strategy | | | | $ | 511 | | | $ | 157,742 | | | $ | 158,253 | |
Growth and Income Strategy | | | | | 1,119 | | | | 172,948 | | | | 174,067 | |
Growth Strategy | | | | | 1,541 | | | | 176,758 | | | | 178,299 | |
Satellite Strategies | | | | | 317 | | | | 135,582 | | | | 135,899 | |
84
GOLDMAN SACHS FUND OF FUNDS PORTFOLIOS
|
| 5. AGREEMENTS AND AFFILIATED TRANSACTIONS (continued) |
F. Line of Credit Facility — As of June 30, 2019, the Portfolios participated in a $580,000,000 committed, unsecured revolving line of credit facility (the “facility”) together with other funds of the Trust and certain registered investment companies having management agreements with GSAM or its affiliates. This facility is to be used for temporary emergency purposes, or to allow for an orderly liquidation of securities to meet redemption requests. The interest rate on borrowings is based on the federal funds rate. The facility also requires a fee to be paid by the Portfolios based on the amount of the commitment that has not been utilized. For the six months ended June 30, 2019, the Portfolios did not have any borrowings under the facility. Prior to April 30, 2019 the facility was $770,000,000.
G. Other Transactions with Affiliates — The Portfolios invest primarily in Class R6 Shares of the Underlying Funds (except certain Underlying Funds that are ETFs). These Underlying Funds are considered to be affiliated with the Portfolios. The tables below show the transactions in and earnings from investments in these Underlying Funds for the six months ended June 30, 2019 (in thousands):
| | | | | | | | | | | | | | | | | | | | | | | | | | | | | | | | |
|
| Balanced Strategy Portfolio | |
| Underlying Funds | | Market
Value as of
12/31/2018 | | | Purchases
at Cost | | | Proceeds
from Sales | | | Realized
Gain (Loss) | | | Change in
Unrealized
Gain (Loss) | | | Market
Value as of
6/30/2019 | | | Shares as of
6/30/2019 | | | Dividend
Income | |
Goldman Sachs Access High Yield Corporate Bond ETF | | $ | 11,596 | | | $ | — | | | $ | (12,235 | ) | | $ | (11 | ) | | $ | 650 | | | $ | — | | | | — | | | $ | 266 | |
Goldman Sachs Access Investment Grade Corporate Bond ETF | | | 24,292 | | | | 25,300 | | | | — | | | | — | | | | 3,087 | | | | 52,679 | | | | 1,025 | | | | 452 | |
Goldman Sachs ActiveBeta Emerging Markets Equity ETF | | | 5,418 | | | | — | | | | (5,645 | ) | | | (38 | ) | | | 265 | | | | — | | | | — | | | | 34 | |
Goldman Sachs ActiveBeta International Equity ETF | | | 13,872 | | | | — | | | | (15,297 | ) | | | (1,438 | ) | | | 2,863 | | | | — | | | | — | | | | 65 | |
Goldman Sachs ActiveBeta U.S. Large Cap Equity ETF | | | 19,751 | | | | 28,914 | | | | (985 | ) | | | (23 | ) | | | 4,875 | | | | 52,532 | | | | 894 | | | | 358 | |
Goldman Sachs Alternative Premia Fund | | | 7,420 | | | | 2,500 | | | | — | | | | — | | | | 31 | | | | 9,951 | | | | 1,222 | | | | — | |
Goldman Sachs Dynamic Global Equity Fund | | | — | | | | 83,500 | | | | (1,500 | ) | | | 57 | | | | 3,273 | | | | 85,330 | | | | 4,475 | | | | — | |
Goldman Sachs Emerging Markets Debt Fund | | | 36,430 | | | | 2,138 | | | | (30,100 | ) | | | (1,675 | ) | | | 4,308 | | | | 11,101 | | | | 888 | | | | 637 | |
Goldman Sachs Emerging Markets Equity Insights Fund | | | 29,750 | | | | — | | | | (13,500 | ) | | | (1,535 | ) | | | 3,744 | | | | 18,459 | | | | 1,929 | | | | — | |
Goldman Sachs Global Income Fund | | | 99,691 | | | | 53,550 | | | | (1,000 | ) | | | (90 | ) | | | 7,713 | | | | 159,864 | | | | 12,499 | | | | 1,250 | |
Goldman Sachs Global Infrastructure Fund | | | 9,764 | | | | 145 | | | | (1,900 | ) | | | 58 | | | | 1,893 | | | | 9,960 | | | | 853 | | | | 146 | |
Goldman Sachs Global Real Estate Securities Fund | | | 12,472 | | | | 94 | | | | (5,000 | ) | | | 264 | | | | 1,407 | | | | 9,237 | | | | 823 | | | | 95 | |
Goldman Sachs High Yield Floating Rate Fund | | | — | | | | 6,544 | | | | — | | | | — | | | | (48 | ) | | | 6,496 | | | | 691 | | | | 45 | |
Goldman Sachs High Yield Fund | | | 11,425 | | | | 301 | | | | (7,500 | ) | | | (327 | ) | | | 1,090 | | | | 4,989 | | | | 778 | | | | 301 | |
Goldman Sachs International Equity Insights Fund | | | 27,456 | | | | 2,750 | | | | (9,750 | ) | | | (1,163 | ) | | | 4,379 | | | | 23,672 | | | | 1,885 | | | | — | |
85
GOLDMAN SACHS FUND OF FUNDS PORTFOLIOS
Notes to Financial Statements(continued)
June 30, 2019 (Unaudited)
|
| 5. AGREEMENTS AND AFFILIATED TRANSACTIONS (continued) |
| | | | | | | | | | | | | | | | | | | | | | | | | | | | | | | | |
| | | | | | | | |
| Balanced Strategy Portfolio (continued) | | | | | | | | | | | | | | | | | | | | | | | | | | | | | | | | |
| Underlying Funds | | Market
Value as of
12/31/2018 | | | Purchases
at Cost | | | Proceeds
from Sales | | | Realized
Gain (Loss) | | | Change in
Unrealized
Gain (Loss) | | | Market
Value as of
6/30/2019 | | | Shares as of
6/30/2019 | | | Dividend
Income | |
Goldman Sachs International Small Cap Insights Fund | | $ | 5,012 | | | $ | 1,000 | | | $ | — | | | $ | — | | | $ | 663 | | | $ | 6,675 | | | | 581 | | | $ | — | |
Goldman Sachs Large Cap Growth Insights Fund | | | 11,564 | | | | — | | | | (13,333 | ) | | | 712 | | | | 1,057 | | | | — | | | | — | | | | — | |
Goldman Sachs Large Cap Value Insights | | | 10,521 | | | | 1,058 | | | | (12,724 | ) | | | 271 | | | | 874 | | | | — | | | | — | | | | 58 | |
Goldman Sachs Local Emerging Markets Debt Fund | | | 17,850 | | | | 1,393 | | | | (14,500 | ) | | | (3,633 | ) | | | 4,156 | | | | 5,266 | | | | 873 | | | | 393 | |
Goldman Sachs Managed Futures Strategy Fund | | | 16,123 | | | | 1,501 | | | | (2,900 | ) | | | (106 | ) | | | 973 | | | | 15,591 | | | | 1,442 | | | | — | |
Goldman Sachs Small Cap Equity Insights Fund | | | 8,030 | | | | — | | | | (9,228 | ) | | | (110 | ) | | | 1,308 | | | | — | | | | — | | | | — | |
Goldman Sachs Tactical Exposure Fund | | | 35,782 | | | | 1,501 | | | | (38,399 | ) | | | (2,294 | ) | | | 3,410 | | | | — | | | | — | | | | — | |
Goldman Sachs Tactical Tilt Overlay Fund | | | — | | | | 25,000 | | | | — | | | | — | | | | 51 | | | | 25,051 | | | | 2,551 | | | | — | |
| | | | | | | | |
Total | | $ | 414,219 | | | $ | 237,189 | | | $ | (195,496 | ) | | $ | (11,081 | ) | | $ | 52,022 | | | $ | 496,853 | | | | | | | $ | 4,100 | |
| | | | | | | | |
| Growth and Income Strategy Portfolio | | | | | | | | | | | | | | | | | | | | | | | | | | | | | | | | |
| Underlying Funds | | Market
Value as of
12/31/2018 | | | Purchases
at Cost | | | Proceeds
from Sales | | | Net
Realized
Gain (Loss) | | | Change in
Unrealized
Gain (Loss) | | | Market
Value as of
6/30/2019 | | | Shares as of
06/30/2019 | | | Dividend
Income | |
Goldman Sachs Access High Yield Corporate Bond ETF | | $ | 9,530 | | | $ | — | | | $ | (10,055 | ) | | $ | (9 | ) | | $ | 534 | | | $ | — | | | | — | | | $ | 219 | |
Goldman Sachs Access Investment Grade Corporate Bond ETF | | | 17,107 | | | | 42,528 | | | | — | | | | — | | | | 3,037 | | | | 62,672 | | | | 1,219 | | | | 364 | |
Goldman Sachs ActiveBeta Emerging Markets Equity ETF | | | 22,611 | | | | — | | | | (23,557 | ) | | | 626 | | | | 320 | | | | — | | | | — | | | | 142 | |
Goldman Sachs ActiveBeta International Equity ETF | | | 43,942 | | | | — | | | | (48,507 | ) | | | (2,378 | ) | | | 6,943 | | | | — | | | | — | | | | 206 | |
Goldman Sachs ActiveBeta U.S. Large Cap Equity ETF | | | 63,566 | | | | 118,132 | | | | (8,039 | ) | | | 644 | | | | 14,930 | | | | 189,233 | | | | 3,220 | | | | 1,204 | |
Goldman Sachs Alternative Premia Fund | | | 21,471 | | | | — | | | | (8,000 | ) | | | (3,010 | ) | | | 3,191 | | | | 13,652 | | | | 1,677 | | | | — | |
Goldman Sachs Dynamic Global Equity Fund | | | — | | | | 195,000 | | | | — | | | | — | | | | 7,651 | | | | 202,651 | | | | 10,627 | | | | — | |
Goldman Sachs Emerging Markets Debt Fund | | | 41,867 | | | | 893 | | | | (20,000 | ) | | | (1,481 | ) | | | 4,903 | | | | 26,182 | | | | 2,095 | | | | 893 | |
Goldman Sachs Emerging Markets Equity Insights Fund | | | 77,521 | | | | — | | | | (36,300 | ) | | | (3,000 | ) | | | 9,117 | | | | 47,338 | | | | 4,946 | | | | — | |
86
GOLDMAN SACHS FUND OF FUNDS PORTFOLIOS
|
| 5. AGREEMENTS AND AFFILIATED TRANSACTIONS (continued) |
| | | | | | | | | | | | | | | | | | | | | | | | | | | | | | | | |
| | | | | | | |
| Growth and Income Strategy Portfolio (continued) | | | | | | | | | | | | | | | | | | | | | | | | | | | | | |
| Underlying Funds | | Market
Value as of
12/31/2018 | | | Purchases
at Cost | | | Proceeds
from Sales | | | Net
Realized
Gain (Loss) | | | Change in
Unrealized
Gain (Loss) | | | Market
Value as of
6/30/2019 | | | Shares as of
06/30/2019 | | | Dividend
Income | |
Goldman Sachs Global Income Fund | | $ | 68,630 | | | $ | 47,472 | | | $ | (1,500 | ) | | $ | 17 | | | $ | 5,402 | | | $ | 120,021 | | | | 9,384 | | | $ | 872 | |
Goldman Sachs Global Infrastructure Fund | | | 27,798 | | | | 306 | | | | (15,000 | ) | | | 855 | | | | 4,379 | | | | 18,338 | | | | 1,570 | | | | 306 | |
Goldman Sachs Global Real Estate Securities Fund | | | 32,903 | | | | 182 | | | | (20,500 | ) | | | 1,111 | | | | 3,049 | | | | 16,745 | | | | 1,492 | | | | 182 | |
Goldman Sachs High Yield Floating Rate Fund | | | — | | | | 8,558 | | | | — | | | | — | | | | (63 | ) | | | 8,495 | | | | 904 | | | | 58 | |
Goldman Sachs High Yield Fund | | | 8,787 | | | | 266 | | | | (1,000 | ) | | | (48 | ) | | | 689 | | | | 8,694 | | | | 1,356 | | | | 266 | |
Goldman Sachs International Equity Insights Fund | | | 90,373 | | | | 14,500 | | | | (39,500 | ) | | | (4,285 | ) | | | 14,269 | | | | 75,357 | | | | 6,000 | | | | — | |
Goldman Sachs International Small Cap Insights Fund | | | 11,716 | | | | 4,500 | | | | (6,100 | ) | | | (214 | ) | | | 1,809 | | | | 11,711 | | | | 1,019 | | | | — | |
Goldman Sachs Large Cap Growth Insights Fund | | | 52,189 | | | | — | | | | (60,170 | ) | | | 4,557 | | | | 3,424 | | | | — | | | | — | | | | — | |
Goldman Sachs Large Cap Value Insights Fund | | | 51,721 | | | | 259 | | | | (57,045 | ) | | | 4,013 | | | | 1,052 | | | | — | | | | — | | | | 259 | |
Goldman Sachs Local Emerging Markets Debt Fund | | | 17,429 | | | | 389 | | | | (9,000 | ) | | | (1,245 | ) | | | 2,010 | | | | 9,583 | | | | 1,589 | | | | 389 | |
Goldman Sachs Managed Futures Strategy Fund | | | 22,411 | | | | 2,100 | | | | (4,000 | ) | | | (150 | ) | | | 1,344 | | | | 21,705 | | | | 2,008 | | | | — | |
Goldman Sachs Small Cap Equity Insights Fund | | | 19,153 | | | | — | | | | (21,876 | ) | | | 1,241 | | | | 1,481 | | | | — | | | | — | | | | — | |
Goldman Sachs Tactical Exposure Fund | | | 67,205 | | | | — | | | | (69,270 | ) | | | (4,337 | ) | | | 6,402 | | | | — | | | | — | | | | — | |
Goldman Sachs Tactical Tilt Overlay Fund | | | — | | | | 35,000 | | | | — | | | | — | | | | 71 | | | | 35,071 | | | | 3,571 | | | | — | |
| | | | | | | | |
Total | | $ | 767,930 | | | $ | 470,087 | | | $ | (459,419 | ) | | $ | (7,093 | ) | | $ | 95,944 | | | $ | 867,448 | | | | | | | $ | 5,360 | |
| | | | | | | |
| Growth Strategy Portfolio | | | | | | | | | | | | | | | | | | | | | | | | | | | | | |
| Underlying Funds | | Market
Value as of
12/31/2018 | | | Purchases
at Cost | | | Proceeds
from Sales | | | Realized
Gain (Loss) | | | Change in
Unrealized
Gain (Loss) | | | Market
Value as of
6/30/2019 | | | Shares as of
6/30/2019 | | | Dividend
Income | |
Goldman Sachs Access High Yield Corporate Bond ETF | | $ | 7,593 | | | $ | — | | | $ | (8,012 | ) | | $ | (7 | ) | | $ | 426 | | | $ | — | | | | — | | | $ | 175 | |
Goldman Sachs ActiveBeta Emerging Markets Equity ETF | | | 35,887 | | | | — | | | | (37,520 | ) | | | 911 | | | | 722 | | | | — | | | | — | | | | 212 | |
87
GOLDMAN SACHS FUND OF FUNDS PORTFOLIOS
Notes to Financial Statements(continued)
June 30, 2019 (Unaudited)
|
| 5. AGREEMENTS AND AFFILIATED TRANSACTIONS (continued) |
| | | | | | | | | | | | | | | | | | | | | | | | | | | | | | | | |
| | | | | | | | |
| Growth Strategy Portfolio (continued) | | | | | | | | | | | | | | | | | | | | | | | | | | | | | | | | |
| Underlying Funds | | Market
Value as of
12/31/2018 | | | Purchases
at Cost | | | Proceeds
from Sales | | | Realized
Gain (Loss) | | | Change in
Unrealized
Gain (Loss) | | | Market
Value as of
6/30/2019 | | | Shares as of
6/30/2019 | | | Dividend
Income | |
Goldman Sachs ActiveBeta International Equity ETF | | $ | 43,181 | | | $ | — | | | $ | (47,671 | ) | | $ | (3,626 | ) | | $ | 8,116 | | | $ | — | | | | — | | | $ | 202 | |
Goldman Sachs ActiveBeta U.S. Large Cap Equity ETF | | | 61,147 | | | | 169,290 | | | | (10,805 | ) | | | (62 | ) | | | 18,682 | | | | 238,252 | | | | 4,054 | | | | 1,534 | |
Goldman Sachs Alternative Premia Fund | | | 9,368 | | | | — | | | | — | | | | — | | | | 58 | | | | 9,426 | | | | 1,158 | | | | — | |
Goldman Sachs Dynamic Global Equity Fund | | | — | | | | 209,001 | | | | (3,500 | ) | | | 132 | | | | 8,068 | | | | 213,701 | | | | 11,206 | | | | — | |
Goldman Sachs Emerging Markets Debt Fund | | | 15,408 | | | | 6,908 | | | | — | | | | — | | | | 1,706 | | | | 24,022 | | | | 1,922 | | | | 408 | |
Goldman Sachs Emerging Markets Equity Insights Fund | | | 101,548 | | | | — | | | | (57,001 | ) | | | (2,838 | ) | | | 11,024 | | | | 52,733 | | | | 5,510 | | | | — | |
Goldman Sachs Global Infrastructure Fund | | | 20,427 | | | | 260 | | | | (8,000 | ) | | | 465 | | | | 3,490 | | | | 16,642 | | | | 1,425 | | | | 260 | |
Goldman Sachs Global Real Estate Securities Fund | | | 54,001 | | | | 206 | | | | (45,500 | ) | | | 2,691 | | | | 4,025 | | | | 15,423 | | | | 1,375 | | | | 206 | |
Goldman Sachs High Yield Fund | | | 5,997 | | | | 1,496 | | | | — | | | | — | | | | 459 | | | | 7,952 | | | | 1,240 | | | | 196 | |
Goldman Sachs International Equity Insights Fund | | | 93,371 | | | | 25,300 | | | | (36,200 | ) | | | (3,318 | ) | | | 13,615 | | | | 92,768 | | | | 7,386 | | | | — | |
Goldman Sachs International Small Cap Insights Fund | | | 23,977 | | | | 3,000 | | | | (15,500 | ) | | | (1,104 | ) | | | 3,775 | | | | 14,148 | | | | 1,231 | | | | — | |
Goldman Sachs Large Cap Growth Insights Fund | | | 53,918 | | | | — | | | | (62,041 | ) | | | 5,204 | | | | 2,919 | | | | — | | | | — | | | | — | |
Goldman Sachs Access Investment Grade Corporate Bond ETF | | | — | | | | 28,579 | | | | — | | | | — | | | | 1,208 | | | | 29,787 | | | | 579 | | | | 133 | |
Goldman Sachs Large Cap Value Insights Fund | | | 53,247 | | | | 2,573 | | | | (60,924 | ) | | | 5,650 | | | | (546 | ) | | | — | | | | — | | | | 274 | |
Goldman Sachs Local Emerging Markets Debt Fund | | | 6,569 | | | | 1,173 | | | | — | | | | — | | | | 559 | | | | 8,301 | | | | 1,377 | | | | 173 | |
Goldman Sachs Managed Futures Strategy Fund | | | 9,411 | | | | 4,000 | | | | — | | | | — | | | | 598 | | | | 14,009 | | | | 1,296 | | | | — | |
Goldman Sachs Small Cap Equity Insights Fund | | | 39,242 | | | | — | | | | (44,424 | ) | | | 1,951 | | | | 3,231 | | | | — | | | | — | | | | — | |
Goldman Sachs Tactical Exposure Fund | | | 59,463 | | | | — | | | | (61,303 | ) | | | (3,824 | ) | | | 5,664 | | | | — | | | | — | | | | — | |
Goldman Sachs Tactical Tilt Overlay Fund | | | — | | | | 23,000 | | | | — | | | | — | | | | 47 | | | | 23,047 | | | | 2,347 | | | | — | |
| | | | | | | | |
Total | | $ | 693,755 | | | $ | 474,786 | | | $ | (498,401 | ) | | $ | 2,225 | | | $ | 87,846 | | | $ | 760,211 | | | | | | | $ | 3,773 | |
88
GOLDMAN SACHS FUND OF FUNDS PORTFOLIOS
|
| 5. AGREEMENTS AND AFFILIATED TRANSACTIONS (continued) |
| | | | | | | | | | | | | | | | | | | | | | | | | | | | | | | | |
| | | | | | | | |
| Satellite Strategies Portfolio | | | | | | | | | | | | | | | | | | | | | | | | | | | | | | | | |
| Underlying Funds | | Market
Value as of
12/31/2018 | | | Purchases
at Cost | | | Proceeds
from Sales | | | Realized
Gain (Loss) | | | Change in
Unrealized
Gain (Loss) | | | Market
Value as of
6/30/2019 | | | Shares as of
6/30/2019 | | | Dividend
Income | |
Goldman Sachs ActiveBeta Emerging Markets Equity ETF | | $ | 17,132 | | | $ | — | | | $ | (2,716 | ) | | $ | 150 | | | $ | 1,448 | | | $ | 16,015 | | | | 487 | | | $ | 210 | |
Goldman Sachs Emerging Markets Debt Fund | | | 69,814 | | | | 1,544 | | | | (15,250 | ) | | | (950 | ) | | | 7,275 | | | | 62,433 | | | | 4,995 | | | | 1,544 | |
Goldman Sachs Emerging Markets Equity Fund | | | 18,894 | | | | — | | | | (4,400 | ) | | | 1,013 | | | | 1,814 | | | | 17,321 | | | | 806 | | | | — | |
Goldman Sachs Emerging Markets Equity Insights Fund | | | 29,821 | | | | 1,000 | | | | (10,450 | ) | | | (1,197 | ) | | | 3,812 | | | | 22,987 | | | | 2,402 | | | | — | |
Goldman Sachs Global Infrastructure Fund | | | 54,718 | | | | 733 | | | | (16,100 | ) | | | 782 | | | | 9,737 | | | | 49,870 | | | | 4,270 | | | | 737 | |
Goldman Sachs Global Real Estate Securities Fund | | | 70,734 | | | | 652 | | | | (18,050 | ) | | | 1,145 | | | | 8,784 | | | | 63,266 | | | | 5,639 | | | | 652 | |
Goldman Sachs High Yield Floating Rate Fund | | | 24,447 | | | | 655 | | | | (3,750 | ) | | | (110 | ) | | | 861 | | | | 22,103 | | | | 2,351 | | | | 655 | |
Goldman Sachs High Yield Fund | | | 46,861 | | | | 1,350 | | | | (9,350 | ) | | | 70 | | | | 3,335 | | | | 42,266 | | | | 6,593 | | | | 1,349 | |
Goldman Sachs International Small Cap Insights Fund | | | 48,916 | | | | — | | | | (13,900 | ) | | | 834 | | | | 5,011 | | | | 40,861 | | | | 3,556 | | | | — | |
Goldman Sachs Local Emerging Markets Debt Fund | | | 20,840 | | | | 509 | | | | (3,200 | ) | | | (219 | ) | | | 1,671 | | | | 19,598 | | | | 3,250 | | | | 506 | |
Goldman Sachs MLP Energy Infrastructure Fund | | | — | | | | 4,074 | | | | — | | | | — | | | | (74 | ) | | | 4,000 | | | | 596 | | | | 74 | |
| | | | | | | | |
Total | | $ | 402,177 | | | $ | 10,517 | | | $ | (97,166 | ) | | $ | 1,518 | | | $ | 43,674 | | | $ | 360,720 | | | | | | | $ | 5,727 | |
The table below shows the transactions in and earnings from investments in the Goldman Sachs Financial Square Government Fund for the six months ended June 30, 2019 (in thousands):
| | | | | | | | | | | | | | | | | | | | | | | | | | |
| Fund | | | | Beginning
Value as of
12/31/2018 | | | Purchases
at Cost | | | Proceeds
from Sales | | | Ending Value
as of 06/30/2019 | | | Shares as of
06/30/2019 | | | Dividend
Income from
Affiliated
Investment
Companies | |
Balanced Strategy Portfolio | | | | $ | 35,521 | | | $ | 66,342 | | | $ | (97,454 | ) | | $ | 4,408 | | | | 4,408 | | | $ | 270 | |
Growth and Income Portfolio | | | | | 62,091 | | | | 100,473 | | | | (162,564 | ) | | | — | | | | — | | | | 507 | |
Growth Strategy Portfolio | | | | | 42,035 | | | | 151,189 | | | | (192,121 | ) | | | 1,103 | | | | 1,103 | | | | 440 | |
Satellite Strategies Portfolio | | | | | — | | | | 3,412 | | | | (3,412 | ) | | | — | | | | — | | | | — | |
89
GOLDMAN SACHS FUND OF FUNDS PORTFOLIOS
Notes to Financial Statements(continued)
June 30, 2019 (Unaudited)
|
| 6. PORTFOLIO SECURITIES TRANSACTIONS |
The cost of purchases and proceeds from sales and maturities oflong-term securities for the six months ended June 30, 2019, were:
| | | | | | | | | | |
| Portfolio | | | | Purchases | | | Sales | |
Balanced Strategy | | | | $ | 242,879,201 | | | $ | 203,829,301 | |
Growth and Income Strategy | | | | | 482,482,483 | | | | 479,526,088 | |
Growth Strategy | | | | | 489,026,129 | | | | 524,046,826 | |
Satellite Strategies | | | | | 10,517,331 | | | | 97,165,842 | |
As of the Portfolios’ most recent fiscal year end, December 31, 2018, the Portfolios’ capital loss carryforwards and certain timing differences on a tax basis were as follows:
| | | | | | | | | | | | | | | | |
| | | Balanced
Strategy | | | Growth and
Income Strategy | | | Growth
Strategy | | | Satellite
Strategies | |
Capital loss carryforwards: | | | | | | | | | | | | | | | | |
PerpetualLong-Term | | $ | — | | | $ | — | | | $ | — | | | $ | (31,506,778 | ) |
Total capital loss carryforwards | | | — | | | | — | | | | — | | | | (31,506,778 | ) |
Timing differences (Qualified Late Year Loss Deferral/Post October Loss Deferral) | | $ | (1,748,950 | ) | | $ | (2,758,751 | ) | | $ | (1,059,221 | ) | | $ | (11,684,932 | ) |
As of June 30, 2019, the Portfolios’ aggregate security unrealized gains and losses based on cost for U.S. federal income tax purposes were as follows:
| | | | | | | | | | | | | | | | |
| | | Balanced
Strategy | | | Growth and
Income Strategy | | | Growth Strategy | | | Satellite
Strategies | |
Tax Cost | | $ | 496,366,229 | | | $ | 848,670,303 | | | $ | 736,088,407 | | | $ | 323,836,460 | |
Gross unrealized gain | | | 13,989,121 | | | | 38,705,905 | | | | 544,099,493 | | | | 47,969,712 | |
Gross unrealized loss | | | (9,094,226 | ) | | | (19,927,843 | ) | | | (518,874,027 | ) | | | (11,085,925 | ) |
Net unrealized gains (losses) on securities | | $ | 4,894,895 | | | $ | 18,778,062 | | | $ | 25,225,466 | | | $ | 36,883,787 | |
The difference between GAAP-basis and tax basis unrealized gains (losses) is attributable primarily to wash sales, net mark to market gains/(losses) on regulated futures and options contracts, net mark to market gains/(losses) on foreign currency contracts and differences in the tax treatment of underlying fund investments.
GSAM has reviewed the Portfolios’ tax positions for all open tax years (the current and prior three years, as applicable) and has concluded that no provision for income tax is required in the Portfolios’ financial statements. Such open tax years remain subject to examination and adjustment by tax authorities.
90
GOLDMAN SACHS FUND OF FUNDS PORTFOLIOS
The Portfolios’ risks include, but are not limited to, the following:
Derivatives Risk— The Portfolios’ use of derivatives may result in loss. Derivative instruments, which may pose risks in addition to and greater than those associated with investing directly in securities, currencies or other instruments, may be illiquid or less liquid, volatile, difficult to price and leveraged so that small changes in the value of the underlying instruments may produce disproportionate losses to the Portfolios. Derivatives are also subject to counterparty risk, which is the risk that the other party in the transaction will not fulfill its contractual obligation. The use of derivatives is a highly specialized activity that involves investment techniques and risks different from those associated with investments in more traditional securities and instruments. Losses from derivatives can also result from a lack of correlation between changes in the value of derivative instruments and the portfolio assets (if any) being hedged.
Foreign and Emerging Countries Risk — Investing in foreign markets may involve special risks and considerations not typically associated with investing in the United States. Foreign securities may be subject to risk of loss because of more or less foreign government regulation, less public information and less economic, political and social stability in the countries in which the Portfolios invest. The imposition of exchange controls (including repatriation restrictions), confiscations, trade restrictions (including tariffs) and other government restrictions by the United States or other governments, or from problems in share registration, settlement or custody, may also result in losses. Foreign risk also involves the risk of negative foreign currency rate fluctuations, which may cause the value of securities denominated in such foreign currency (or other instruments through which the Portfolios have exposure to foreign currencies) to decline in value. Currency exchange rates may fluctuate significantly over short periods of time. To the extent that the Portfolios also invest in securities of issuers located in emerging markets, these risks may be more pronounced.
Investments in the Underlying Funds Risk— The investments of a Portfolio are concentrated in the Underlying Funds, and the Portfolio’s investment performance is directly related to the investment performance of the Underlying Funds it holds. A Portfolio is subject to the risk factors associated with the investments of the Underlying Funds in direct proportion to the amount of assets allocated to each. A Portfolio that has a relative concentration of its portfolio in a single Underlying Fund may be more susceptible to adverse developments affecting that Underlying Fund, and may be more susceptible to losses because of these developments.
Large Shareholder Transactions Risk — A Portfolio may experience adverse effects when certain large shareholders, such as other funds, institutional investors (including those trading by use of non-discretionary mathematical formulas), financial intermediaries (who may make investment decisions on behalf of underlying clients and/or include a Portfolio in their investment model), individuals, accounts and Goldman Sachs affiliates, purchase or redeem large amounts of shares of a Portfolio. Such large shareholder redemptions, which may occur rapidly or unexpectedly, may cause a Portfolio to sell portfolio securities at times when it would not otherwise do so, which may negatively impact the Portfolio’s NAV and liquidity. These transactions may also accelerate the realization of taxable income to shareholders if such sales of investments resulted in gains, and may also increase transaction costs. In addition, a large redemption could result in a Portfolio’s current expenses being allocated over a smaller asset base, leading to an increase in the Portfolio’s expense ratio. Similarly, large Portfolio share purchases may adversely affect a Portfolio’s performance to the extent that the Portfolio is delayed in investing new cash or otherwise maintains a larger cash position than it ordinarily would.
Liquidity Risk — A Portfolio may make investments that are illiquid or that may become less liquid in response to market developments or adverse investor perceptions. Illiquid investments may be more difficult to value. Liquidity risk may also refer to the risk that a Portfolio will not be able to pay redemption proceeds within the allowable time period or without significant dilution to remaining investors’ interests because of unusual market conditions, an unusually high volume of redemption requests, or other reasons. To meet redemption requests, a Portfolio may be forced to sell investments at an unfavorable time and/or under unfavorable conditions. If a Portfolio is forced to sell securities at an unfavorable time and/or under unfavorable conditions, such sales may adversely affect Portfolio’s NAV and dilute remaining investors’ interests. Liquidity risk may be the result of, among other things, the reduced number and capacity of traditional market participants to make a market in fixed income securities or the
91
GOLDMAN SACHS FUND OF FUNDS PORTFOLIOS
Notes to Financial Statements(continued)
June 30, 2019 (Unaudited)
|
| 8. OTHER RISKS (continued) |
lack of an active market. The potential for liquidity risk may be magnified by a rising interest rate environment or other circumstances where investor redemptions from fixed income mutual funds may be higher than normal, potentially causing increased supply in the market due to selling activity. These risks may be more pronounced in connection with a Portfolio’s investments in securities of issuers located in emerging market countries. Redemptions by large shareholders may have a negative impact on a Portfolio’s liquidity.
Market and Credit Risks— In the normal course of business, a Portfolio trades financial instruments and enters into financial transactions where risk of potential loss exists due to changes in the market (market risk). Additionally, a Portfolio may also be exposed to credit risk in the event that an issuer or guarantor fails to perform or that an institution or entity with which the Portfolio has unsettled or open transactions defaults.
Under the Trust’s organizational documents, its Trustees, officers, employees and agents are indemnified, to the extent permitted by the Act and state law, against certain liabilities that may arise out of performance of their duties to the Portfolios. Additionally, in the course of business, the Portfolios enter into contracts that contain a variety of indemnification clauses. The Portfolios’ maximum exposure under these arrangements is unknown, as this would involve future claims that may be made against the Portfolios that have not yet occurred. However, GSAM believes the risk of loss under these arrangements to be remote.
Subsequent events after the Statements of Assets and Liabilities date have been evaluated, and GSAM has concluded that there is no impact requiring adjustment or disclosure in the financial statements.
92
GOLDMAN SACHS FUND OF FUNDS PORTFOLIOS
|
| 11. SUMMARY OF SHARE TRANSACTIONS |
Share activity is as follows:
| | | | | | | | | | | | | | | | |
| | | Balanced Strategy Portfolio | |
| | | | |
| | | For the Six Months Ended
June 30, 2019
(Unaudited) | | | For the Fiscal Year Ended
December 31, 2018 | |
| | | | |
| | | Shares | | | Dollars | | | Shares | | | Dollars | |
| | | | |
| Class A Shares | | | | | | | | | | | | | | | | |
Shares sold | | | 404,838 | | | $ | 4,453,531 | | | | 2,197,646 | | | $ | 24,589,063 | |
Reinvestment of distributions | | | 52,917 | | | | 587,181 | | | | 386,939 | | | | 4,120,526 | |
Shares redeemed | | | (1,103,262 | ) | | | (12,078,539 | ) | | | (2,658,006 | ) | | | (29,846,449 | ) |
| | | | (645,507 | ) | | | (7,037,827 | ) | | | (73,421 | ) | | | (1,136,860 | ) |
| Class C Shares | | | | | | | | | | | | | | | | |
Shares sold | | | 254,870 | | | | 2,811,760 | | | | 240,462 | | | | 2,684,993 | |
Reinvestment of distributions | | | 2,059 | | | | 22,756 | | | | 38,251 | | | | 403,536 | |
Shares redeemed | | | (377,157 | ) | | | (4,145,389 | ) | | | (2,031,640 | ) | | | (22,933,030 | ) |
| | | | (120,228 | ) | | | (1,310,873 | ) | | | (1,752,927 | ) | | | (19,844,501 | ) |
| Institutional Shares | | | | | | | | | | | | | | | | |
Shares sold | | | 5,061,102 | | | | 54,901,414 | | | | 10,388,305 | | | | 116,418,374 | |
Reinvestment of distributions | | | 225,231 | | | | 2,502,139 | | | | 1,203,725 | | | | 12,872,471 | |
Shares redeemed | | | (3,564,038 | ) | | | (38,960,612 | ) | | | (13,926,817 | ) | | | (157,589,348 | ) |
| | | | 1,722,295 | | | | 18,442,941 | | | | (2,334,787 | ) | | | (28,298,503 | ) |
| Service Shares | | | | | | | | | | | | | | | | |
Shares sold | | | 2,125 | | | | 23,875 | | | | 2,645 | | | | 29,937 | |
Reinvestment of distributions | | | 58 | | | | 656 | | | | 457 | | | | 4,927 | |
Shares redeemed | | | (506 | ) | | | (5,569 | ) | | | (10,546 | ) | | | (121,653 | ) |
| | | | 1,677 | | | | 18,962 | | | | (7,444 | ) | | | (86,789 | ) |
| Investor Shares | | | | | | | | | | | | | | | | |
Shares sold | | | 97,886 | | | | 1,069,867 | | | | 65,196 | | | | 741,730 | |
Reinvestment of distributions | | | 2,070 | | | | 22,887 | | | | 12,756 | | | | 135,812 | |
Shares redeemed | | | (68,617 | ) | | | (749,953 | ) | | | (138,062 | ) | | | (1,547,523 | ) |
| | | | 31,339 | | | | 342,801 | | | | (60,110 | ) | | | (669,981 | ) |
| Class P Shares(a) | | | | | | | | | | | | | | | | |
Shares sold | | | 195,402 | | | | 2,111,345 | | | | 5,193,575 | | | | 59,522,441 | |
Reinvestment of distributions | | | 28,675 | | | | 318,542 | | | | 180,681 | | | | 1,925,367 | |
Shares redeemed | | | (783,184 | ) | | | (8,531,393 | ) | | | (1,200,009 | ) | | | (13,432,058 | ) |
| | | | (559,107 | ) | | | (6,101,506 | ) | | | 4,174,247 | | | | 48,015,750 | |
| Class R Shares | | | | | | | | | | | | | | | | |
Shares sold | | | 36,498 | | | | 400,102 | | | | 87,308 | | | | 984,981 | |
Reinvestment of distributions | | | 3,613 | | | | 39,905 | | | | 30,836 | | | | 326,107 | |
Shares redeemed | | | (67,882 | ) | | | (743,712 | ) | | | (47,212 | ) | | | (528,555 | ) |
| | | | (27,771 | ) | | | (303,705 | ) | | | 70,932 | | | | 782,533 | |
| Class R6 Shares | | | | | | | | | | | | | | | | |
Shares sold | | | 11,657 | | | | 128,779 | | | | 174,015 | | | | 1,884,820 | |
Reinvestment of distributions | | | 543 | | | | 6,013 | | | | 3,250 | | | | 34,518 | |
Shares redeemed | | | (30,344 | ) | | | (337,173 | ) | | | (1,401 | ) | | | (14,871 | ) |
| | | | (18,144 | ) | | | (202,381 | ) | | | 175,864 | | | | 1,904,467 | |
| | | | |
NET INCREASE | | | 384,554 | | | $ | 3,848,412 | | | | 192,354 | | | $ | 666,116 | |
| (a) Class | | P Shares commenced operations April 17, 2018. |
93
GOLDMAN SACHS FUND OF FUNDS PORTFOLIOS
Notes to Financial Statements(continued)
June 30, 2019 (Unaudited)
|
| 11. SUMMARY OF SHARE TRANSACTIONS (continued) |
| | | | | | | | | | | | | | | | |
| |
| | | Growth and Income Strategy Portfolio | |
| | | | |
| | | For the Six Months Ended
June 30, 2019
(Unaudited) | | | For the Fiscal Year Ended
December 31, 2018 | |
| | | | |
| | | Shares | | | Dollars | | | Shares | | | Dollars | |
| | | | |
| Class A Shares | | | | | | | | | | | | | | | | |
Shares sold | | | 789,818 | | | $ | 10,491,373 | | | | 5,497,598 | | | $ | 74,809,186 | |
Reinvestment of distributions | | | 73,265 | | | | 976,321 | | | | 522,904 | | | | 6,573,710 | |
Shares redeemed | | | (2,021,326 | ) | | | (26,679,640 | ) | | | (5,661,411 | ) | | | (76,161,885 | ) |
| | | | (1,158,243 | ) | | | (15,211,946 | ) | | | 359,091 | | | | 5,221,011 | |
| Class C Shares | | | | | | | | | | | | | | | | |
Shares sold | | | 74,191 | | | | 951,044 | | | | 250,795 | | | | 3,323,057 | |
Reinvestment of distributions | | | 1,656 | | | | 21,415 | | | | 39,846 | | | | 480,829 | |
Shares redeemed | �� | | (676,007 | ) | | | (8,775,096 | ) | | | (5,005,325 | ) | | | (66,486,344 | ) |
| | | | (600,160 | ) | | | (7,802,637 | ) | | | (4,714,684 | ) | | | (62,682,458 | ) |
| Institutional Shares | | | | | | | | | | | | | | | | |
Shares sold | | | 2,179,298 | | | | 28,072,799 | | | | 7,467,092 | | | | 100,009,197 | |
Reinvestment of distributions | | | 150,340 | | | | 2,013,941 | | | | 868,511 | | | | 11,056,181 | |
Shares redeemed | | | (4,761,922 | ) | | | (62,906,239 | ) | | | (20,518,480 | ) | | | (279,936,927 | ) |
| | | | (2,432,284 | ) | | | (32,819,499 | ) | | | (12,182,877 | ) | | | (168,871,549 | ) |
| Service Shares | | | | | | | | | | | | | | | | |
Shares sold | | | 18,153 | | | | 239,441 | | | | 5,243 | | | | 70,792 | |
Reinvestment of distributions | | | 158 | | | | 2,088 | | | | 1,372 | | | | 17,189 | |
Shares redeemed | | | (23,223 | ) | | | (302,273 | ) | | | (27,194 | ) | | | (363,601 | ) |
| | | | (4,912 | ) | | | (60,744 | ) | | | (20,579 | ) | | | (275,620 | ) |
| Investor Shares | | | | | | | | | | | | | | | | |
Shares sold | | | 37,256 | | | | 491,787 | | | | 446,230 | | | | 6,143,506 | |
Reinvestment of distributions | | | 2,735 | | | | 36,354 | | | | 17,862 | | | | 225,243 | |
Shares redeemed | | | (90,293 | ) | | | (1,181,541 | ) | | | (387,301 | ) | | | (5,243,481 | ) |
| | | | (50,302 | ) | | | (653,400 | ) | | | 76,791 | | | | 1,125,268 | |
| Class P Shares(a) | | | | | | | | | | | | | | | | |
Shares sold | | | 694,981 | | | | 9,226,048 | | | | 16,192,301 | | | | 220,431,246 | |
Reinvestment of distributions | | | 80,715 | | | | 1,080,922 | | | | 392,635 | | | | 4,938,925 | |
Shares redeemed | | | (1,390,146 | ) | | | (18,281,632 | ) | | | (1,528,471 | ) | | | (20,322,519 | ) |
| | | | (614,450 | ) | | | (7,974,662 | ) | | | 15,056,465 | | | | 205,047,652 | |
| Class R Shares | | | | | | | | | | | | | | | | |
Shares sold | | | 22,796 | | | | 294,943 | | | | 53,422 | | | | 720,704 | |
Reinvestment of distributions | | | 842 | | | | 11,103 | | | | 7,663 | | | | 95,113 | |
Shares redeemed | | | (18,820 | ) | | | (249,477 | ) | | | (108,804 | ) | | | (1,466,415 | ) |
| | | | 4,818 | | | | 56,569 | | | | (47,719 | ) | | | (650,598 | ) |
| Class R6 Shares | | | | | | | | | | | | | | | | |
Shares sold | | | 39,003 | | | | 520,615 | | | | 693,914 | | | | 9,197,718 | |
Reinvestment of distributions | | | 828 | | | | 11,090 | | | | 4,727 | | | | 60,598 | |
Shares redeemed | | | (10,915 | ) | | | (143,350 | ) | | | (189,580 | ) | | | (2,476,595 | ) |
| | | | 28,916 | | | | 388,355 | | | | 509,061 | | | | 6,781,721 | |
| | | | |
NET DECREASE | | | (4,826,617 | ) | | $ | (64,077,964 | ) | | | (964,451 | ) | | $ | (14,304,573 | ) |
| (a) Class | | P Shares commenced operations April 17, 2018. |
94
GOLDMAN SACHS FUND OF FUNDS PORTFOLIOS
|
| 11. SUMMARY OF SHARE TRANSACTIONS (continued) |
| | | | | | | | | | | | | | | | |
| |
| | | Growth Strategy Portfolio | |
| | | | |
| | | For the Six Months Ended
June 30, 2019
(Unaudited) | | | For the Fiscal Year Ended
December 31, 2018 | |
| | | | |
| | | Shares | | | Dollars | | | Shares | | | Dollars | |
| | | | |
| Class A Shares | | | | | | | | | | | | | | | | |
Shares sold | | | 804,283 | | | $ | 12,168,144 | | | | 5,457,108 | | | $ | 85,119,791 | |
Reinvestment of distributions | | | — | | | | 2 | | | | 536,108 | | | | 7,328,587 | |
Shares redeemed | | | (1,850,122 | ) | | | (27,757,101 | ) | | | (3,501,964 | ) | | | (54,176,334 | ) |
| | | | (1,045,839 | ) | | | (15,588,955 | ) | | | 2,491,252 | | | | 38,272,044 | |
| Class C Shares | | | | | | | | | | | | | | | | |
Shares sold | | | 76,678 | | | | 1,165,173 | | | | 315,405 | | | | 4,927,115 | |
Shares redeemed | | | (648,604 | ) | | | (9,974,869 | ) | | | (5,749,609 | ) | | | (89,435,265 | ) |
| | | | (571,926 | ) | | | (8,809,696 | ) | | | (5,434,204 | ) | | | (84,508,150 | ) |
| Institutional Shares | | | | | | | | | | | | | | | | |
Shares sold | | | 1,954,355 | | | | 28,412,702 | | | | 4,218,160 | | | | 65,347,505 | |
Reinvestment of distributions | | | — | | | | — | | | | 539,651 | | | | 7,366,237 | |
Shares redeemed | | | (5,368,646 | ) | | | (79,365,749 | ) | | | (15,525,679 | ) | | | (241,977,726 | ) |
| | | | (3,414,291 | ) | | | (50,953,047 | ) | | | (10,767,868 | ) | | | (169,263,984 | ) |
| Service Shares | | | | | | | | | | | | | | | | |
Shares sold | | | 2,751 | | | | 40,962 | | | | 4,603 | | | | 71,617 | |
Reinvestment of distributions | | | — | | | | — | | | | 1,152 | | | | 15,692 | |
Shares redeemed | | | (24,791 | ) | | | (368,664 | ) | | | (24,387 | ) | | | (388,577 | ) |
| | | | (22,040 | ) | | | (327,702 | ) | | | (18,632 | ) | | | (301,268 | ) |
| Investor Shares | | | | | | | | | | | | | | | | |
Shares sold | | | 66,519 | | | | 986,949 | | | | 468,179 | | | | 7,354,070 | |
Reinvestment of distributions | | | — | | | | — | | | | 13,196 | | | | 177,616 | |
Shares redeemed | | | (87,286 | ) | | | (1,292,372 | ) | | | (516,398 | ) | | | (7,976,243 | ) |
| | | | (20,767 | ) | | | (305,423 | ) | | | (35,023 | ) | | | (444,557 | ) |
| Class P Shares(a) | | | | | | | | | | | | | | | | |
Shares sold | | | 594,786 | | | | 8,952,811 | | | | 11,196,336 | | | | 175,619,095 | |
Reinvestment of distributions | | | — | | | | — | | | | 323,998 | | | | 4,422,574 | |
Shares redeemed | | | (748,919 | ) | | | (11,281,195 | ) | | | (672,254 | ) | | | (10,229,875 | ) |
| | | | (154,133 | ) | | | (2,328,384 | ) | | | 10,848,080 | | | | 169,811,794 | |
| Class R Shares | | | | | | | | | | | | | | | | |
Shares sold | | | 30,448 | | | | 445,583 | | | | 79,803 | | | | 1,202,162 | |
Reinvestment of distributions | | | — | | | | — | | | | 10,012 | | | | 133,255 | |
Shares redeemed | | | (26,239 | ) | | | (384,776 | ) | | | (91,115 | ) | | | (1,334,264 | ) |
| | | | 4,209 | | | | 60,807 | | | | (1,300 | ) | | | 1,153 | |
| Class R6 Shares | | | | | | | | | | | | | | | | |
Shares sold | | | 39,465 | | | | 590,849 | | | | 585,222 | | | | 9,037,007 | |
Reinvestment of distributions | | | — | | | | — | | | | 9,875 | | | | 134,789 | |
Shares redeemed | | | (59,996 | ) | | | (912,851 | ) | | | (174,788 | ) | | | (2,722,462 | ) |
| | | | (20,531 | ) | | | (322,002 | ) | | | 420,309 | | | | 6,449,334 | |
| | | | |
NET DECREASE | | | (5,245,318 | ) | | $ | (78,574,402 | ) | | | (2,497,386 | ) | | $ | (39,983,634 | ) |
| (a) Class | | P Shares commenced operations April 17, 2018. |
95
GOLDMAN SACHS FUND OF FUNDS PORTFOLIOS
Notes to Financial Statements(continued)
June 30, 2019 (Unaudited)
|
| 11. SUMMARY OF SHARE TRANSACTIONS (continued) |
| | | | | | | | | | | | | | | | |
| |
| | | Satellite Strategies Portfolio | |
| | | | |
| | | For the Six Months Ended
June 30, 2019
(Unaudited) | | | For the Fiscal Year Ended
December 31, 2018 | |
| | | | |
| | | Shares | | | Dollars | | | Shares | | | Dollars | |
| | | | |
| Class A Shares | | | | | | | | | | | | | | | | |
Shares sold | | | 1,046,718 | | | $ | 8,495,703 | | | | 775,316 | | | $ | 6,211,520 | |
Reinvestment of distributions | | | 62,477 | | | | 508,792 | | | | 136,536 | | | | 1,070,446 | |
Shares redeemed | | | (668,594 | ) | | | (5,382,101 | ) | | | (1,858,316 | ) | | | (14,871,825 | ) |
| | | | 440,601 | | | | 3,622,394 | | | | (946,464 | ) | | | (7,589,859 | ) |
| Class C Shares | | | | | | | | | | | | | | | | |
Shares sold | | | 56,856 | | | | 435,647 | | | | 108,732 | | | | 860,438 | |
Reinvestment of distributions | | | 18,209 | | | | 147,258 | | | | 66,306 | | | | 516,448 | |
Shares redeemed | | | (1,323,785 | ) | | | (10,656,027 | ) | | | (1,677,178 | ) | | | (13,397,814 | ) |
| | | | (1,248,720 | ) | | | (10,073,122 | ) | | | (1,502,140 | ) | | | (12,020,928 | ) |
| Institutional Shares | | | | | | | | | | | | | | | | |
Shares sold | | | 1,868,593 | | | | 14,911,586 | | | | 9,038,271 | | | | 73,191,893 | |
Reinvestment of distributions | | | 325,930 | | | | 2,645,748 | | | | 1,072,443 | | | | 8,450,493 | |
Shares redeemed | | | (10,614,832 | ) | | | (85,364,437 | ) | | | (32,559,328 | ) | | | (260,529,664 | ) |
| | | | (8,420,309 | ) | | | (67,807,103 | ) | | | (22,448,614 | ) | | | (178,887,278 | ) |
| Service Shares | | | | | | | | | | | | | | | | |
Shares sold | | | 936 | | | | 7,496 | | | | 2,000 | | | | 16,157 | |
Reinvestment of distributions | | | 235 | | | | 1,912 | | | | 589 | | | | 4,601 | |
Shares redeemed | | | (3,569 | ) | | | (28,340 | ) | | | (11,141 | ) | | | (88,919 | ) |
| | | | (2,398 | ) | | | (18,932 | ) | | | (8,552 | ) | | | (68,161 | ) |
| Investor Shares | | | | | | | | | | | | | | | | |
Shares sold | | | 216,015 | | | | 1,725,242 | | | | 693,460 | | | | 5,638,032 | |
Reinvestment of distributions | | | 39,767 | | | | 322,179 | | | | 125,164 | | | | 982,010 | |
Shares redeemed | | | (1,570,248 | ) | | | (12,663,221 | ) | | | (2,502,665 | ) | | | (20,029,009 | ) |
| | | | (1,314,466 | ) | | | (10,615,800 | ) | | | (1,684,041 | ) | | | (13,408,967 | ) |
| Class P Shares(a) | | | | | | | | | | | | | | | | |
Shares sold | | | 1,973 | | | | 16,000 | | | | 425,652 | | | | 3,516,016 | |
Reinvestment of distributions | | | 5,407 | | | | 43,953 | | | | 10,075 | | | | 77,948 | |
Shares redeemed | | | (3,824 | ) | | | (31,060 | ) | | | (41,981 | ) | | | (324,521 | ) |
| | | | 3,556 | | | | 28,893 | | | | 393,746 | | | | 3,269,443 | |
| Class R Shares | | | | | | | | | | | | | | | | |
Shares sold | | | 8,894 | | | | 70,496 | | | | 34,396 | | | | 275,361 | |
Reinvestment of distributions | | | 1,224 | | | | 9,917 | | | | 5,838 | | | | 45,567 | |
Shares redeemed | | | (139,869 | ) | | | (1,078,035 | ) | | | (88,613 | ) | | | (709,187 | ) |
| | | | (129,751 | ) | | | (997,622 | ) | | | (48,379 | ) | | | (388,259 | ) |
| Class R6 Shares | | | | | | | | | | | | | | | | |
Shares sold | | | 533,733 | | | | 4,186,886 | | | | 4,140,483 | | | | 34,151,048 | |
Reinvestment of distributions | | | 59,256 | | | | 481,251 | | | | 133,463 | | | | 1,043,879 | |
Shares redeemed | | | (688,621 | ) | | | (5,467,475 | ) | | | (3,073,250 | ) | | | (24,968,293 | ) |
| | | | (95,632 | ) | | | (799,338 | ) | | | 1,200,696 | | | | 10,226,634 | |
| | | | |
NET DECREASE | | | (10,767,119 | ) | | $ | (86,660,630 | ) | | | (25,043,748 | ) | | $ | (198,867,375 | ) |
| (a) Class | | P Shares commenced operations April 17, 2018. |
96
GOLDMAN SACHS FUND OF FUNDS PORTFOLIOS
Portfolio Expenses — Six Month Period Ended June 30, 2019 (Unaudited)
As a shareholder of Class A, Class C, Institutional, Service, Investor, Class P, Class R or Class R6 Shares of a Portfolio, you incur two types of costs: (1) transaction costs, including sales charges on purchase payments (with respect to Class A Shares), contingent deferred sales charges on redemptions (with respect to Class C Shares), and (2) ongoing costs, including management fees; distribution and/or service (12b-1) fees (with respect to Class A, Class C and Class R Shares); and other Portfolio expenses.
The Example is intended to help you understand your ongoing costs (in dollars) of investing in Class A, Class C, Institutional, Service, Investor, Class P, Class R or Class R6 Shares of the Portfolios and to compare these costs with the ongoing costs of investing in other mutual funds. The Example is based on an investment of $1,000 invested at the beginning of the period and held for the entire period from January 1, 2019 through June 30, 2019, which represents a period of 181 days of a 365 day year.
Actual Expenses — The first line under each share class in the table below provides information about actual account values and actual expenses. You may use the information in this line, together with the amount you invested, to estimate the expenses that you paid over the period. Simply divide your account value by $1,000 (for example, an $8,600 account value divided by $1,000=8.6), then multiply the result by the number in the first line under the heading entitled “Expenses Paid” to estimate the expenses you paid on your account during this period.
Hypothetical Example for Comparison Purposes — The second line under each share class in the table below provides information about hypothetical account values and hypothetical expenses based on the Portfolios’ actual net expense ratios and an assumed rate of return of 5% per year before expenses, which is not the Portfolios’ actual return. The hypothetical account values and expenses may not be used to estimate the actual ending account balance or expenses you paid for the period. You may use this information to compare the ongoing costs of investing in the Portfolios and other funds. To do so, compare this 5% hypothetical example with the 5% hypothetical examples that appear in the shareholder reports of the other funds.
Please note that the expenses shown in the table are meant to highlight your ongoing costs only and do not reflect any transactional costs, such as sales charges, redemption fees, or exchange fees and do not include expenses of Underlying Funds in which the Portfolios invest. Therefore, the second line of the table is useful in comparing ongoing costs only and will not help you determine the relative total costs of owning different funds. In addition, if these transactional costs were included, your costs would have been higher.
| | | | | | | | | | | | | | | | | | | | | | | | | | | | | | | | | | | | | | | | | | | | | | | | |
| | | Balanced Strategy Portfolio | | | Growth and Income Strategy Portfolio | | | Growth Strategy Portfolio | | | Satellite Strategies Portfolio | |
| Share Class | | Beginning
Account Value
1/1/19 | | | Ending
Account Value
6/30/19 | | | Expenses
Paid for the
6 months ended
6/30/19* | | | Beginning
Account Value
1/1/19 | | | Ending
Account Value
6/30/19 | | | Expenses
Paid for the
6 months ended
6/30/19* | | | Beginning
Account Value
1/1/19 | | | Ending
Account Value
6/30/19 | | | Expenses
Paid for the
6 months ended
6/30/19* | | | Beginning
Account Value
1/1/19 | | | Ending
Account Value
6/30/19 | | | Expenses
Paid for the
6 months ended
6/30/19* | |
| Class A | | | | | | | | | | | | | | | | | | | | | | | | | | | | | | | | | | | | | | | | | | | | | | | | |
Actual | | $ | 1,000.00 | | | $ | 1,102.20 | | | $ | 3.02 | | | $ | 1,000.00 | | | $ | 1,117.40 | | | $ | 3.04 | | | $ | 1,000.00 | | | $ | 1,138.40 | | | $ | 3.08 | | | $ | 1,000.00 | | | $ | 1,128.50 | | | $ | 2.96 | |
Hypothetical 5% return | | | 1,000.00 | | | | 1,021.92 | + | | | 2.91 | | | | 1,000.00 | | | | 1,021.92 | + | | | 2.91 | | | | 1,000.00 | | | | 1,021.92 | + | | | 2.91 | | | | 1,000.00 | | | | 1,022.02 | + | | | 2.81 | |
| Class C | | | | | | | | | | | | | | | | | | | | | | | | | | | | | | | | | | | | | | | | | | | | | | | | |
Actual | | | 1,000.00 | | | | 1,097.90 | | | | 6.92 | | | | 1,000.00 | | | | 1,113.70 | | | | 6.97 | | | | 1,000.00 | | | | 1,133.80 | | | | 7.04 | | | | 1,000.00 | | | | 1,125.40 | | | | 6.90 | |
Hypothetical 5% return | | | 1,000.00 | | | | 1,018.20 | + | | | 6.66 | | | | 1,000.00 | | | | 1,018.20 | + | | | 6.66 | | | | 1,000.00 | | | | 1,018.20 | + | | | 6.66 | | | | 1,000.00 | | | | 1,018.30 | + | | | 6.56 | |
| Institutional | | | | | | | | | | | | | | | | | | | | | | | | | | | | | | | | | | | | | | | | | | | | | | | | |
Actual | | | 1,000.00 | | | | 1,104.30 | | | | 0.99 | | | | 1,000.00 | | | | 1,120.80 | | | | 1.00 | | | | 1,000.00 | | | | 1,140.00 | | | | 1.01 | | | | 1,000.00 | | | | 1,130.80 | | | | 0.90 | |
Hypothetical 5% return | | | 1,000.00 | | | | 1,023.85 | + | | | 0.95 | | | | 1,000.00 | | | | 1,023.85 | + | | | 0.95 | | | | 1,000.00 | | | | 1,023.85 | + | | | 0.95 | | | | 1,000.00 | | | | 1,023.95 | + | | | 0.85 | |
| Service | | | | | | | | | | | | | | | | | | | | | | | | | | | | | | | | | | | | | | | | | | | | | | | | |
Actual | | | 1,000.00 | | | | 1,100.40 | | | | 3.59 | | | | 1,000.00 | | | | 1,117.10 | | | | 3.62 | | | | 1,000.00 | | | | 1,137.30 | | | | 3.66 | | | | 1,000.00 | | | | 1,127.90 | | | | 3.53 | |
Hypothetical 5% return | | | 1,000.00 | | | | 1,021.37 | + | | | 3.46 | | | | 1,000.00 | | | | 1,021.37 | + | | | 3.46 | | | | 1,000.00 | | | | 1,021.37 | + | | | 3.46 | | | | 1,000.00 | | | | 1,021.47 | + | | | 3.36 | |
| Investor | | | | | | | | | | | | | | | | | | | | | | | | | | | | | | | | | | | | | | | | | | | | | | | | |
Actual | | | 1,000.00 | | | | 1,102.90 | | | | 1.72 | | | | 1,000.00 | | | | 1,119.40 | | | | 1.73 | | | | 1,000.00 | | | | 1,139.00 | | | | 1.75 | | | | 1,000.00 | | | | 1,131.40 | | | | 1.64 | |
Hypothetical 5% return | | | 1,000.00 | | | | 1,023.16 | + | | | 1.66 | | | | 1,000.00 | | | | 1,023.16 | + | | | 1.66 | | | | 1,000.00 | | | | 1,023.16 | + | | | 1.66 | | | | 1,000.00 | | | | 1,023.26 | + | | | 1.56 | |
| Class P | | | | | | | | | | | | | | | | | | | | | | | | | | | | | | | | | | | | | | | | | | | | | | | | |
Actual | | | 1,000.00 | | | | 1,104.30 | | | | 0.94 | | | | 1,000.00 | | | | 1,120.10 | | | | 0.95 | | | | 1,000.00 | | | | 1,139.90 | | | | 0.96 | | | | 1,000.00 | | | | 1,130.70 | | | | 0.85 | |
Hypothetical 5% return | | | 1,000.00 | | | | 1,023.90 | + | | | 0.90 | | | | 1,000.00 | | | | 1,023.90 | + | | | 0.90 | | | | 1,000.00 | | | | 1,023.90 | + | | | 0.90 | | | | 1,000.00 | | | | 1,024.00 | + | | | 0.80 | |
| Class R | | | | | | | | | | | | | | | | | | | | | | | | | | | | | | | | | | | | | | | | | | | | | | | | |
Actual | | | 1,000.00 | | | | 1,101.30 | | | | 4.32 | | | | 1,000.00 | | | | 1,116.20 | | | | 4.36 | | | | 1,000.00 | | | | 1,136.90 | | | | 4.40 | | | | 1,000.00 | | | | 1,127.40 | | | | 4.27 | |
Hypothetical 5% return | | | 1,000.00 | | | | 1,020.68 | + | | | 4.16 | | | | 1,000.00 | | | | 1,020.68 | + | | | 4.16 | | | | 1,000.00 | | | | 1,020.68 | + | | | 4.16 | | | | 1,000.00 | | | | 1,020.78 | + | | | 4.06 | |
| Class R6 | | | | | | | | | | | | | | | | | | | | | | | | | | | | | | | | | | | | | | | | | | | | | | | | |
Actual | | | 1,000.00 | | | | 1,104.30 | | | | 0.94 | | | | 1,000.00 | | | | 1,120.10 | | | | 0.95 | | | | 1,000.00 | | | | 1,139.90 | | | | 0.96 | | | | 1,000.00 | | | | 1,132.20 | | | | 0.85 | |
Hypothetical 5% return | | | 1,000.00 | | | | 1,023.90 | + | | | 0.90 | | | | 1,000.00 | | | | 1,023.90 | + | | | 0.90 | | | | 1,000.00 | | | | 1,023.90 | + | | | 0.90 | | | | 1,000.00 | | | | 1,024.00 | + | | | 0.80 | |
| + | | Hypothetical expenses are based on each Portfolio’s actual annualized net expense ratios and an assumed rate of return of 5% per year before expenses. |
| * | | Expenses for each share class are calculated using each Portfolio’s annualized net expense ratio for each class, which represents the ongoing expenses as a percentage of net assets for the six months ended June 30, 2019. Expenses are calculated by multiplying the annualized net expense ratio by the average account value for the period; then multiplying the result by the number of days in the most recent fiscal half year; and then dividing that result by the number of days in the fiscal year. The annualized net expense ratios for the period were as follows: |
| | | | | | | | | | | | | | | | | | | | | | | | | | | | | | | | |
| Fund | | Class A | | | Class C | | | Institutional | | | Service | | | Investor | | | Class P | | | Class R | | | Class R6 | |
Balanced Strategy | | | 0.58 | % | | | 1.33 | % | | | 0.19 | % | | | 0.69 | % | | | 0.33 | % | | | 0.18 | % | | | 0.83 | % | | | 0.18 | % |
Growth and Income Strategy | | | 0.58 | | | | 1.33 | | | | 0.19 | | | | 0.69 | | | | 0.33 | | | | 0.18 | | | | 0.83 | | | | 0.18 | |
Growth Strategy | | | 0.58 | | | | 1.33 | | | | 0.19 | | | | 0.69 | | | | 0.33 | | | | 0.18 | | | | 0.83 | | | | 0.18 | |
Satellite Strategies | | | 0.56 | | | | 1.31 | | | | 0.17 | | | | 0.67 | | | | 0.31 | | | | 0.16 | | | | 0.81 | | | | 0.16 | |
97
GOLDMAN SACHS FUND OF FUNDS PORTFOLIOS
Statement Regarding Basis for Approval of Management Agreement (Unaudited)
Background
The Goldman Sachs Balanced Strategy Portfolio, Goldman Sachs Growth and Income Strategy Portfolio, Goldman Sachs Growth Strategy Portfolio, and Goldman Sachs Satellite Strategies Portfolio (the “Portfolios”) are investment portfolios of Goldman Sachs Trust (the “Trust”). The Board of Trustees oversees the management of the Trust and reviews the investment performance and expenses of the Portfolios at regularly scheduled meetings held throughout the year. In addition, the Board of Trustees determines annually whether to approve the continuance of the Trust’s investment management agreement (the “Management Agreement”) with Goldman Sachs Asset Management, L.P. (the “Investment Adviser”) on behalf of the Portfolios.
The Management Agreement was most recently approved for continuation until June 30, 2020 by the Board of Trustees, including those Trustees who are not parties to the Management Agreement or “interested persons” (as defined in the Investment Company Act of 1940, as amended) of any party thereto (the “Independent Trustees”), at a meeting held onJune 11-12, 2019 (the “Annual Meeting”).
The review process undertaken by the Trustees spans the course of the year and culminates with the Annual Meeting. To assist the Trustees in their deliberations, the Trustees have established a Contract Review Committee (the “Committee”), comprised of the Independent Trustees. The Committee held four meetings over the course of the year since the Management Agreement was last approved. At those Committee meetings, regularly scheduled Board or other committee meetings, and/or the Annual Meeting, matters relevant to the renewal of the Management Agreement were considered by the Board, or the Independent Trustees, as applicable. With respect to each Portfolio, such matters included:
| | (a) | | the nature and quality of the advisory, administrative, and other services provided to the Portfolio and the underlying funds in which it invests (the “Underlying Funds”) by the Investment Adviser and its affiliates, including information about: |
| | (i) | | the structure, staff, and capabilities of the Investment Adviser and its portfolio management teams; |
| | (ii) | | the groups within the Investment Adviser and its affiliates that support the portfolio management teams or provide other types of necessary services, including fund services groups (e.g., accounting and financial reporting, tax, shareholder services, and operations); controls and risk management groups (e.g., legal, compliance, valuation oversight, credit risk management, internal audit, compliance testing, market risk analysis, finance, and central funding); sales and distribution support groups, and others (e.g., information technology and training); |
| | (iii) | | trends in employee headcount; |
| | (iv) | | the Investment Adviser’s financial resources and ability to hire and retain talented personnel and strengthen its operations; and |
| | (v) | | the parent company’s support of the Investment Adviser and its mutual fund business, as expressed by the firm’s senior management; |
| | (b) | | information on the investment performance of the Portfolio and the Underlying Funds, including comparisons to the performance of similar mutual funds, as provided by a third-party mutual fund data provider engaged as part of the contract review process (the “Outside Data Provider”), and a benchmark performance index; and information on general investment outlooks in the markets in which the Underlying Funds invest; |
| | (c) | | information provided by the Investment Adviser indicating the Investment Adviser’s views on whether the Portfolio’s peer group and/or benchmark index had high, medium, or low relevance given the Portfolio’s particular investment strategy; |
| | (d) | | the terms of the Management Agreement and other agreements with affiliated service providers entered into by the Trust on behalf of the Portfolio; |
| | (e) | | fee and expense information for the Portfolio, including: |
| | (i) | | the relative management fee and expense levels of the Portfolio as compared to those of comparable funds managed by other advisers, as provided by the Outside Data Provider; |
| | (ii) | | the Portfolio’s expense trends over time; and |
| | (iii) | | to the extent the Investment Adviser manages other types of accounts (such as bank collective trusts, private wealth management accounts, institutional separate accounts,sub-advised mutual funds, andnon-U.S. funds) having investment objectives and policies similar to those of the Portfolio, comparative information on the advisory fees charged and services provided to those accounts by the Investment Adviser; |
| | (f) | | with respect to the extensive investment performance and expense comparison data provided by the Outside Data Provider, its processes in producing that data for the Portfolio; |
| | (g) | | the undertakings of the Investment Adviser and its affiliates to implement fee waivers and/or expense limitations with respect to the Portfolio and the Underlying Funds; |
98
GOLDMAN SACHS FUND OF FUNDS PORTFOLIOS
Statement Regarding Basis for Approval of Management Agreement (Unaudited) (continued)
| | (h) | | information relating to the profitability of the Management Agreement and the transfer agency and distribution and service arrangements of the Portfolio to the Investment Adviser and its affiliates; |
| | (i) | | whether the Portfolio’s existing management fee schedule, together with the management fee schedules of the Underlying Funds, adequately addressed any economies of scale; |
| | (j) | | a summary of the“fall-out” benefits derived by the Investment Adviser and its affiliates from their relationships with the Portfolio and/or the Underlying Funds, including the fees received by the Investment Adviser’s affiliates from the Portfolio and/or the Underlying Funds for transfer agency, securities lending, portfolio trading, distribution and other services; |
| | (k) | | a summary of potential benefits derived by the Portfolio and/or the Underlying Funds as a result of their relationship with the Investment Adviser; |
| | (l) | | with respect to the applicable Underlying Funds, information regarding commissions paid by the Underlying Equity Funds and broker oversight, an update on the Investment Adviser’s soft dollars practices, other information regarding portfolio trading, and how the Investment Adviser carries out its duty to seek best execution; |
| | (m) | | portfolio manager ownership of Portfolio shares; the manner in which portfolio manager compensation is determined; and the number and types of accounts managed by the portfolio managers; |
| | (n) | | the nature and quality of the services provided to the Portfolio and the Underlying Funds by their unaffiliated service providers, and the Investment Adviser’s general oversight and evaluation (including reports on due diligence) of those service providers as part of the administrative services provided under the Management Agreement; and |
| | (o) | | the Investment Adviser’s processes and policies addressing various types of potential conflicts of interest; its approach to risk management; the annual review of the effectiveness of the Portfolio’s compliance program; and periodic compliance reports. |
The Trustees also received an overview of the Portfolios’ distribution arrangements. They received information regarding the Portfolios’ assets, share purchase and redemption activity, and payment of distribution, service, and shareholder administration fees. Information was also provided to the Trustees relating to revenue sharing payments made by and services provided by the Investment Adviser and its affiliates to intermediaries that promote the sale, distribution, and/or servicing of Portfolio shares. The Independent Trustees also discussed the broad range of other investment choices that are available to Portfolio investors, including the availability of comparable funds managed by other advisers.
The presentations made at the Board and Committee meetings and at the Annual Meeting encompassed the Portfolios and other mutual funds for which the Board of Trustees has responsibility. In evaluating the Management Agreement at the Annual Meeting, the Trustees relied upon their knowledge, resulting from their meetings and other interactions throughout the year, of the Investment Adviser and its affiliates, their services, and the Portfolios. In conjunction with these meetings, the Trustees received written materials and oral presentations on the topics covered, and the Investment Adviser addressed the questions and concerns of the Trustees, including concerns regarding the investment performance of certain of the funds they oversee. The Independent Trustees were advised by their independent legal counsel regarding their responsibilities and other regulatory requirements related to the approval and continuation of mutual fund investment management agreements under applicable law. In addition, the Investment Adviser and its affiliates provided the Independent Trustees with a written response to a formal request for information sent on behalf of the Independent Trustees by their independent legal counsel. During the course of their deliberations, the Independent Trustees met in executive sessions with their independent legal counsel, without representatives of the Investment Adviser or its affiliates present.
Nature, Extent, and Quality of the Services Provided Under the Management Agreement
As part of their review, the Trustees considered the nature, extent, and quality of the services provided to the Portfolios and the Underlying Funds by the Investment Adviser. In this regard, the Trustees considered both the investment advisory services andnon-advisory services that are provided by the Investment Adviser and its affiliates. The Trustees noted the transition in the leadership and changes in personnel of various of the Investment Adviser’s portfolio management teams that had occurred in recent periods, and the ongoing recruitment efforts aimed at bringing high quality investment talent to the Investment Adviser. They also noted the Investment Adviser’s commitment to maintaining high quality systems and expending substantial resources to respond to ongoing changes to the regulatory and control environment in which the Portfolios and the Underlying Funds and their service providers operate, as well as the efforts of the Investment Adviser and its affiliates to combat cyber security risks. The Trustees concluded that the Investment Adviser continued to commit substantial financial and operational resources to the Portfolios and expressed confidence that the Investment Adviser would continue to do so in the future. The Trustees also recognized that the Investment Adviser had made significant commitments to address regulatory compliance requirements applicable to the Portfolios, the Underlying Funds, and the Investment Adviser and its affiliates.
99
GOLDMAN SACHS FUND OF FUNDS PORTFOLIOS
Statement Regarding Basis for Approval of Management Agreement (Unaudited) (continued)
Investment Performance
The Trustees also considered the investment performance of the Portfolios and the Underlying Funds. In this regard, they compared the investment performance of each Portfolio to its peers usingrankings and ratings compiled by the Outside Data Provider as of December 31, 2018, and updated performance information prepared by the Investment Adviser using the peer group identified by the Outside Data Provider as of March 31, 2019. The information on each Portfolio’s investment performance was provided for theone-, three-, five-, andten-year periods ending on the applicable dates. The Trustees also reviewed each Portfolio’s investment performance relative to its performance benchmark. As part of this review, they considered the investment performance trends of the Portfolios over time, and reviewed the investment performance of each Portfolio in light of its investment objective and policies and market conditions.
In addition, the Trustees considered materials prepared and presentations made by the Investment Adviser’s senior management and portfolio management personnel in which Portfolio performance was assessed. The Trustees also considered the Investment Adviser’s periodic reports with respect to the Underlying Funds’ risk profiles, and how the Investment Adviser’s approach to risk monitoring and management influences portfolio management. They noted the efforts of the portfolio management team of certain Underlying Funds to continue to enhance the investment models used in managing the Underlying Funds.
The Trustees observed that the Balanced Strategy Portfolio’s Institutional Shares had placed in the top half of the Portfolio’s peer group for theone- and five-year periods, in the third quartile for the three-year period, and the fourth quartile for theten-year period, and had underperformed the Portfolio’s benchmark index for theone-, three-,five-, andten-year periods ended March 31, 2019. They noted that the Growth and Income Strategy Portfolio’s Institutional Shares had placed in the top half of the Portfolio’s peer group for the three-, five-, andten-year periods and in the third quartile for theone-year period, and had underperformed the Portfolio’s benchmark index for theone-, three-, five-, andten-year periods ended March 31, 2019. The Trustees observed that the Growth Strategy Portfolio’s Institutional Shares had placed in the top half of the Portfolio’s peer group for the three-, five-, andten-year periods and in the third quartile for theone-year period, and had underperformed the Portfolio’s benchmark index for theone-, three-, five-, andten-year periods ended March 31, 2019. They noted that the Satellite Strategies Portfolio’s Institutional Shares had placed in the top half of the Portfolio’s peer group for theten-year period and in the third quartile for theone-, three-, and five-year periods, and had underperformed the Portfolio’s benchmark index for theone-, three-, five-, andten-year periods ended March 31, 2019.
Costs of Services Provided and Competitive Information
The Trustees considered the contractual terms of the Management Agreement and the fee rates payable by each Portfolio thereunder. In this regard, the Trustees considered information on the services rendered by the Investment Adviser to the Portfolios, which included both advisory and administrative services that were directed to the needs and operations of the Portfolios as registered mutual funds.
In particular, the Trustees reviewed analyses prepared by the Outside Data Provider regarding the expense rankings of the Portfolios. The analyses provided a comparison of each Portfolio’s management fee to those of a relevant peer group and category universe; an expense analysis which compared each Portfolio’s overall net and gross expenses to a peer group and a category universe; and data comparing each Portfolio’s net expenses to the peer and category medians. The analyses also compared each Portfolio’s other expenses and fee waivers/reimbursements to those of the peer group and category medians. The Trustees concluded that the comparisons provided by the Outside Data Provider were useful in evaluating the reasonableness of the management fees and total expenses paid by the Portfolios.
In addition, the Trustees considered the Investment Adviser’s undertakings to implement fee waivers and/or expense limitations with respect to the Portfolios and the Underlying Funds. They also considered, to the extent that the Investment Adviser manages other types of accounts having investment objectives and policies similar to those of the Portfolios, comparative fee information for services provided by the Investment Adviser to those accounts, and information that indicated that services provided to the Portfolios differed in various significant respects from the services provided to other types of accounts which, in many cases, operated under less stringent legal and regulatory structures, required fewer services from the Investment Adviser to a smaller number of client contact points, and were less time-intensive.
In addition, the Trustees noted that shareholders are able to redeem their Portfolio shares at any time if shareholders believe that the Portfolio fees and expenses are too high or if they are dissatisfied with the performance of the Portfolio.
Profitability
The Trustees reviewed each Portfolio’s contribution to the Investment Adviser’s revenues andpre-tax profit margins. In this regard the Trustees noted that they had received, among other things, profitability analyses and summaries, revenue and expense
100
GOLDMAN SACHS FUND OF FUNDS PORTFOLIOS
Statement Regarding Basis for Approval of Management Agreement (Unaudited) (continued)
schedules by Portfolio and by function (i.e., investment management, transfer agency and distribution and service), and information on the Investment Adviser’s expense allocation methodology. They observed that the profitability and expense figures are substantially similar to those used by the Investment Adviser for many internal purposes, including compensation decisions among various business groups, and are thus subject to a vigorous internal debate about how certain revenue and expenses should be allocated. The Trustees also noted that the internal audit group within the Goldman Sachs organization periodically audits the expense allocation methodology and that the internal audit group was satisfied with the reasonableness, consistency, and accuracy of the Investment Adviser’s expense allocation methodology. Profitability data for each Portfolio was provided for 2018 and 2017, and the Trustees considered this information in relation to the Investment Adviser’s overall profitability.
Economies of Scale
The Trustees considered the information that had been provided regarding whether there have been economies of scale with respect to the management of the Portfolios.
The Trustees noted that, although the Portfolios themselves do not have breakpoints in their management fee schedules, any benefits of the breakpoints in the management fee schedules of certain Underlying Funds, when reached, would pass through to the shareholders in the Portfolios at the specified asset levels. The Trustees considered the amounts of assets in the Portfolios; the Portfolios’ recent purchase and redemption activity; the information provided by the Investment Adviser relating to the costs of the services provided by the Investment Adviser and its affiliates and the profits realized by them; information comparing the fee rates charged by the Investment Adviser with fee rates charged to other funds in the peer groups; and the Investment Adviser’s undertaking to limit certain expenses of the Portfolios and Underlying Funds that exceed specified levels. They also considered the services provided to the Portfolios under the Management Agreement and the fees and expenses borne by the Underlying Funds, and determined that the management fees payable by the Portfolios were not duplicative of the management fees paid at the Underlying Fund level.
Other Benefits to the Investment Adviser and Its Affiliates
The Trustees also considered the other benefits derived by the Investment Adviser and its affiliates from their relationships with the Portfolios and/or the Underlying Funds as stated above, including: (a) transfer agency fees received by Goldman Sachs & Co. LLC (“Goldman Sachs”); (b) brokerage and futures commissions earned by Goldman Sachs for executing securities and futures transactions on behalf of certain Underlying Funds; (c) research received by the Investment Adviser from broker-dealers in exchange for executing certain transactions on behalf of certain Underlying Funds; (d) trading efficiencies resulting from aggregation of orders of the Underlying Funds with those for other funds or accounts managed by the Investment Adviser; (e) fees earned by Goldman Sachs Agency Lending (“GSAL”), an affiliate of the Investment Adviser, as securities lending agent for certain Underlying Funds (and fees earned by the Investment Adviser for managing the fund in which those Underlying Funds’ cash collateral is invested); (f) the Investment Adviser’s ability to leverage the infrastructure designed to service the Portfolios on behalf of its other clients; (g) the Investment Adviser’s ability to cross-market other products and services to Portfolio shareholders; (h) Goldman Sachs’ retention of certain fees as Portfolio Distributor; (i) the Investment Adviser’s ability to negotiate better pricing with custodians on behalf of its other clients, as a result of the relationship with the Portfolios and Underlying Funds; and (j) the possibility that the working relationship between the Investment Adviser and the Portfolios’ and Underlying Funds’ third-party service providers may cause those service providers to be more likely to do business with other areas of Goldman Sachs. In the course of considering the foregoing, the Independent Trustees requested and received further information quantifying certain of thesefall-out benefits.
Other Benefits to the Portfolios and Their Shareholders
The Trustees also noted that the Portfolios and/or the Underlying Funds receive certain other potential benefits as a result of their relationship with the Investment Adviser, including: (a) trading efficiencies resulting from aggregation of orders of the Underlying Funds with those of other funds or accounts managed by the Investment Adviser; (b) enhanced servicing from vendors due to the volume of business generated by the Investment Adviser and its affiliates; (c) with respect to the Underlying Funds, enhanced servicing from broker-dealers due to the volume of business generated by the Investment Adviser and its affiliates; (d) with respect to certain Underlying Funds, the Investment Adviser’s ability to negotiate favorable terms with derivatives counterparties as a result of the size and reputation of the Goldman Sachs organization; (e) the advantages received from the Investment Adviser’s knowledge and experience gained from managing other accounts and products; (f) the Investment Adviser’s ability to hire and retain qualified personnel to provide services to the Portfolios and the Underlying Funds because of the reputation of the Goldman Sachs organization; (g) the Portfolios’ and Underlying Funds’ access, through the Investment Adviser, to certain firm-wide resources (e.g., proprietary risk management systems and databases), subject to certain restrictions; (h) with
101
GOLDMAN SACHS FUND OF FUNDS PORTFOLIOS
Statement Regarding Basis for Approval of Management Agreement (Unaudited) (continued)
respect to certain Underlying Funds, the ability to participate in the securities lending program administered by GSAL, as measured by the revenue received by the Underlying Funds in connection with the program; and (i) the Portfolios’ access to certain affiliated distribution channels. In addition, the Trustees noted the competitive nature of the mutual fund marketplace, and considered that many of the Portfolios’ shareholders invested in the Portfolios in part because of the Portfolios’ relationship with the Investment Adviser and that those shareholders have a general expectation that the relationship will continue.
Conclusion
In connection with their consideration of the Management Agreement, the Trustees gave weight to each of the factors described above, but did not identify any particular factor as controlling their decision. After deliberation and consideration of all of the information provided, including the factors described above, the Trustees concluded, in the exercise of their business judgment, that the management fees paid by each of the Portfolios were reasonable in light of the services provided to it by the Investment Adviser, the Investment Adviser’s costs and each Portfolio’s current and reasonably foreseeable asset levels. The Trustees unanimously concluded that the Investment Adviser’s continued management likely would benefit each Portfolio and its shareholders and that the Management Agreement should be approved and continued with respect to each Portfolio until June 30, 2020.
102
FUNDS PROFILE
Goldman Sachs Funds
Goldman Sachs is a premier financial services firm, known since 1869 for creating thoughtful and customized investment solutions in complex global markets.
Today, theInvestment Management Division of Goldman Sachs serves a diverse set of clients worldwide, including private institutions, public entities and individuals. With approximately $1.44 trillion in assets under supervision as of June 30, 2019, Goldman Sachs Asset Management (“GSAM”) has portfolio management teams located around the world and our investment professionals bring firsthand knowledge of local markets to every investment decision. Assets under supervision includes assets under management and other client assets for which Goldman Sachs does not have full discretion. GSAM leverages the resources of Goldman Sachs & Co. LLC subject to legal, internal and regulatory restrictions.
Money Market
Financial Square FundsSM
| ∎ | | Financial Square Treasury Solutions Fund1 |
| ∎ | | Financial Square Government Fund1 |
| ∎ | | Financial Square Money Market Fund2 |
| ∎ | | Financial Square Prime Obligations Fund2 |
| ∎ | | Financial Square Treasury Instruments Fund1 |
| ∎ | | Financial Square Treasury Obligations Fund1 |
| ∎ | | Financial Square Federal Instruments Fund1 |
Investor FundsSM
| ∎ | | Investor Money Market Fund3 |
| ∎ | | Investor Tax-Exempt Money Market Fund3 |
Fixed Income
Short Duration and Government
| ∎ | | High Quality Floating Rate Fund |
| ∎ | | Short-Term Conservative Income Fund |
| ∎ | | Short Duration Government Fund |
| ∎ | | Short Duration Income Fund |
| ∎ | | Inflation Protected Securities Fund |
Multi-Sector
Municipal and Tax-Free
| ∎ | | High Yield Municipal Fund |
| ∎ | | Dynamic Municipal Income Fund |
| ∎ | | Short Duration Tax-Free Fund |
| ∎ | | Municipal Income Completion Fund |
Single Sector
| ∎ | | Investment Grade Credit Fund |
| ∎ | | High Yield Floating Rate Fund |
| ∎ | | Emerging Markets Debt Fund |
| ∎ | | Local Emerging Markets Debt Fund |
Fixed Income Alternatives
| ∎ | | Long Short Credit Strategies Fund |
Fundamental Equity
| ∎ | | Small/Mid Cap Value Fund |
| ∎ | | Small/Mid Cap Growth Fund |
| ∎ | | Concentrated Growth Fund |
| ∎ | | Technology Opportunities Fund |
| ∎ | | Growth Opportunities Fund |
| ∎ | | Rising Dividend Growth Fund |
Tax-Advantaged Equity
| ∎ | | U.S. Tax-Managed Equity Fund |
| ∎ | | International Tax-Managed Equity Fund |
| ∎ | | U.S. Equity Dividend and Premium Fund |
| ∎ | | International Equity Dividend and Premium Fund |
Equity Insights
| ∎ | | Small Cap Equity Insights Fund |
| ∎ | | U.S. Equity Insights Fund |
| ∎ | | Small Cap Growth Insights Fund |
| ∎ | | Large Cap Growth Insights Fund |
| ∎ | | Large Cap Value Insights Fund |
| ∎ | | Small Cap Value Insights Fund |
| ∎ | | International Small Cap Insights Fund |
| ∎ | | International Equity Insights Fund |
| ∎ | | Emerging Markets Equity Insights Fund |
Fundamental Equity International
| ∎ | | International Equity Income Fund |
| ∎ | | International Equity ESG Fund |
| ∎ | | Emerging Markets Equity Fund |
| ∎ | | Imprint Emerging Markets Opportunities Fund5 |
| ∎ | | ESG Emerging Markets Equity Fund |
Alternative
| ∎ | | Real Estate Securities Fund |
| ∎ | | International Real Estate Securities Fund |
| ∎ | | Commodity Strategy Fund |
| ∎ | | Global Real Estate Securities Fund |
| ∎ | | Alternative Premia Fund |
| ∎ | | Absolute Return Tracker Fund |
| ∎ | | Managed Futures Strategy Fund |
| ∎ | | MLP Energy Infrastructure Fund |
| ∎ | | Multi-Manager Alternatives Fund |
| ∎ | | Absolute Return Multi-Asset Fund |
| ∎ | | Global Infrastructure Fund |
Total Portfolio Solutions
| ∎ | | Global Managed Beta Fund |
| ∎ | | Multi-Manager Non-Core Fixed Income Fund |
| ∎ | | Multi-Manager U.S. Dynamic Equity Fund |
| ∎ | | Multi-Manager Global Equity Fund |
| ∎ | | Multi-Manager International Equity Fund |
| ∎ | | Tactical Tilt Overlay Fund |
| ∎ | | Balanced Strategy Portfolio |
| ∎ | | Multi-Manager U.S. Small Cap Equity Fund |
| ∎ | | Multi-Manager Real Assets Strategy Fund |
| ∎ | | Growth and Income Strategy Portfolio |
| ∎ | | Growth Strategy Portfolio |
| ∎ | | Dynamic Global Equity Fund4 |
| ∎ | | Satellite Strategies Portfolio |
| ∎ | | Enhanced Dividend Global Equity Portfolio |
| ∎ | | Tax-Advantaged Global Equity Portfolio |
| ∎ | | Strategic Factor Allocation Fund |
| ∎ | | Target Date 2020 Portfolio |
| ∎ | | Target Date 2025 Portfolio |
| ∎ | | Target Date 2030 Portfolio |
| ∎ | | Target Date 2035 Portfolio |
| ∎ | | Target Date 2040 Portfolio |
| ∎ | | Target Date 2045 Portfolio |
| ∎ | | Target Date 2050 Portfolio |
| ∎ | | Target Date 2055 Portfolio |
| ∎ | | Target Date 2060 Portfolio |
| ∎ | | GQG Partners International Opportunities Fund |
| 1 | | You could lose money by investing in the Fund. Although the Fund seeks to preserve the value of your investment at $1.00 per share, it cannot guarantee it will do so. An investment in the Fund is not a deposit of a bank and is not insured or guaranteed by the Federal Deposit Insurance Corporation or any other government agency. The Fund’s sponsor has no legal obligation to provide financial support to the Fund, and you should not expect that the sponsor will provide financial support to the Fund at any time. |
| 2 | | You could lose money by investing in the Fund. Because the share price of the Fund will fluctuate, when you sell your shares they may be worth more or less than what you originally paid for them. The Fund may impose a fee upon sale of your shares or may temporarily suspend your ability to sell shares if the Fund’s liquidity falls below required minimums because of market conditions or other factors. An investment in the Fund is not a deposit of a bank and is not insured or guaranteed by the Federal Deposit Insurance Corporation or any other government agency. The Fund’s sponsor has no legal obligation to provide financial support to the Fund, and you should not expect that the sponsor will provide financial support to the Fund at any time. |
| 3 | | You could lose money by investing in the Fund. Although the Fund seeks to preserve the value of your investment at $1.00 per share, it cannot guarantee it will do so. The Fund may impose a fee upon sale of your shares or may temporarily suspend your ability to sell shares if the Fund’s liquidity falls below required minimums because of market conditions or other factors. An investment in the Fund is not a deposit of a bank and is not insured or guaranteed by the Federal Deposit Insurance Corporation or any other government agency. The Fund’s sponsor has no legal obligation to provide financial support to the Fund, and you should not expect that the sponsor will provide financial support to the Fund at any time. |
| 4 | | Effective after the close of business on February 28, 2019, the Goldman Sachs Equity Growth Strategy Portfolio was renamed the Goldman Sachs Dynamic Global Equity Fund. |
| | | Financial Square FundsSM and Investor FundsSM are registered service marks of Goldman Sachs & Co. LLC. |
| 5 | | Effective after the close of business on August 30, 2019, the Goldman Sachs N-11 Equity Fund was renamed the Goldman Sachs Imprint Emerging Markets Opportunities Fund. |
| * | | This list covers open-end funds only. Please visit our website at www.GSAMFUNDS.com to learn about our closed-end funds and exchange-traded funds. |
| | |
TRUSTEES Jessica Palmer,Chair Kathryn A. Cassidy Diana M. Daniels James A. McNamara Roy W. Templin Gregory G. Weaver | | OFFICERS James A. McNamara,President Joseph F. DiMaria,Principal Financial Officer, Principal Accounting Officer and Treasurer Caroline L. Kraus,Secretary |
| |
GOLDMAN SACHS & CO. LLC Distributor and Transfer Agent | | GOLDMAN SACHS ASSET MANAGEMENT, L.P. Investment Adviser |
Visit our web site atwww.GSAMFUNDS.com to obtain the most recent month-end returns.
Goldman Sachs Asset Management, L.P. 200 West Street, New York, New York 10282
The portfolio risk management process includes an effort to monitor and manage risk, but does not imply low risk.
The reports concerning the Portfolios included in this shareholder report may contain certain forward-looking statements about the factors that may affect the performance of the Portfolios in the future. These statements are based on Portfolio management’s predictions and expectations concerning certain future events and their expected impact on the Portfolios, such as performance of the economy as a whole and of specific industry sectors, changes in the levels of interest rates, the impact of developing world events, and other factors that may influence the future performance of the Portfolios. Management believes these forward-looking statements to be reasonable, although they are inherently uncertain and difficult to predict. Actual events may cause adjustments in portfolio management strategies from those currently expected to be employed.
Diversification does not protect an investor from market risk and does not ensure a profit.
Views and opinions expressed are for informational purposes only and do not constitute a recommendation by GSAM to buy, sell, or hold any security. Views and opinions are current as of the date of this presentation and may be subject to change. They should not be construed as investment advice.
A description of the policies and procedures that the Portfolios use to determine how to vote proxies relating to portfolio securities and information regarding how a Portfolio voted proxies relating to portfolio securities during the most recent 12-month period ended June 30 is available (i) without charge, upon request by calling 1-800-526-7384 (for Retail Shareholders) or 1-800-621-2550 (for Institutional Shareholders); and (ii) on the Securities and Exchange Commission (“SEC”) web site at http://www.sec.gov.
References to indices, benchmarks or other measures of relative market performance over a specified period of time are provided for your information only and do not imply that the portfolio will achieve similar results. The index composition may not reflect the manner in which a portfolio is constructed. While an adviser seeks to design a portfolio which reflects appropriate risk and return features, portfolio characteristics may deviate from those of the benchmark.
The Portfolios will file portfolio holdings information for each month in a fiscal quarter within 60 days after the end of the relevant fiscal quarter on Form N-PORT. Portfolio holdings information for the third month of each fiscal quarter will be made available on the SEC’s web site at http://www.sec.gov. Portfolio holdings information may be obtained upon request and without charge by calling 1-800-526-7384 (for Retail Shareholders) or 1-800-621-2550 (for Institutional Shareholders).
Holdings and allocations shown are as of June 30, 2019 and may not be representative of future investments. Portfolio holdings should not be relied on in making investment decisions and should not be construed as research or investment advice regarding particular securities. Current and future holdings are subject to risk.
This material is not authorized for distribution to prospective investors unless preceded or accompanied by a current prospectus or summary prospectus, if applicable. Investors should consider a Portfolio’s objective, risks, and charges and expenses, and read the summary prospectus, if available, and/or the prospectus carefully before investing or sending money. The summary prospectus, if available, and the prospectus contain this and other information about a Portfolio and may be obtained from your authorized dealer or from Goldman Sachs & Co. LLC by calling (retail – 1-800-526-7384) (institutional – 1-800-621-2550).
© 2018 Goldman Sachs. All rights reserved. 174986-OTU-1031030 FFSAR-19
Goldman Sachs Funds

| | | | |
| | |
| Semi-Annual Report | | | | June 30, 2019 |
| | |
| | | | Global Infrastructure Fund |
It is our intention that beginning on January 1, 2021, paper copies of the Fund’s annual and semi-annual shareholder reports will no longer be sent by mail, unless you specifically request paper copies of the reports from the Fund or from your financial intermediary. Instead, the reports will be made available on a website, and you will be notified by mail each time a report is posted and provided with a website link to access the report.
If you already elected to receive shareholder reports electronically, you will not be affected by this change and you need not take any action. At any time, you may elect to receive reports and certain communications from the Fund electronically by calling the applicable toll-free number below or by contacting your financial intermediary.
You may elect to receive all future shareholder reports in paper free of charge. If you hold shares of the Fund directly with the Fund’s transfer agent, you can inform the transfer agent that you wish to receive paper copies of reports by calling toll-free 800-621-2550 for Institutional, Class R6 and Class P shareholders or 800-526-7384 for all other shareholders. If you hold shares of the Fund through a financial intermediary, please contact your financial intermediary to make this election. Your election to receive reports in paper will apply to all Goldman Sachs Funds held in your account if you invest through your financial intermediary or all Goldman Sachs Funds held with the Fund’s transfer agent if you invest directly with the transfer agent.

Goldman Sachs Global Infrastructure Fund
| | | | |
| | | |
| NOT FDIC-INSURED | | May Lose Value | | No Bank Guarantee |
PORTFOLIO RESULTS
Goldman Sachs Global Infrastructure Fund
Investment Objective
The Fund seeks total return comprised of long-term growth of capital and income.
Portfolio Management Discussion and Analysis
Below, the Goldman Sachs Global Infrastructure Team discusses the Goldman Sachs Global Infrastructure Fund’s (the “Fund”) performance and positioning for the six-month period ended June 30, 2019 (the “Reporting Period”).
| Q | | How did the Fund perform during the Reporting Period? |
| A | | During the Reporting Period, the Fund’s Class A, Class C, Institutional, Investor, Class P, Class R and Class R6 Shares generated cumulative total returns, without sales charges, of 22.16%, 21.65%, 22.30%, 22.18%, 22.38%, 21.90% and 22.25%, respectively. These returns compare to the 20.73% cumulative total return of the Dow Jones Brookfield Global Infrastructure Index (Net, USD, Unhedged) (the “Index”). The Index is intended to measure all sectors of the infrastructure market. |
| Q | | What economic and market factors most influenced global infrastructure companies during the Reporting Period? |
| A | | Global equities, including global infrastructure securities, posted double-digit gains during the first quarter of 2019 when the Reporting Period began. The Federal Reserve (“Fed”) commentary provided a supportive background, as Fed Chair Jerome Powell reiterated a “patient” approach to monetary policy that included a pause in interest rate hikes and a plan to end quantitative tightening, or the shrinking of the Fed’s balance sheet as securities mature, by the end of the 2019 calendar year. The U.S. unemployment rate remained below trend at 3.8% in February 2019, with a steady increase in wages of 3.4% year over year. Housing data showed strength in the first calendar quarter, with new home sales reaching 667,000 in February, bringing the three-month average up to 630,000. Strength in housing data could be partially attributed to a steep decline in mortgage rates resulting from a more cautious Fed. The University of Michigan Consumer Sentiment Index was also a point of significant strength in the U.S. economy, steadily climbing in each month of the first quarter of 2019 and eventually reaching 98.4 in March, its highest level in six months. However, the economic growth concerns that had dominated the fourth quarter of 2018 failed to completely disappear, as fourth quarter 2018 U.S. Gross Domestic Product (“GDP”) growth was revised down 0.4% in March 2019 to 2.2%. In Europe, uncertainty surrounding the U.K.’s plan to exit the European Union, also known as Brexit, and trade tensions with the U.S. were headwinds, as Brexit talks extended beyond the U.K.’s original departure date of March 29th and the U.S. Administration threatened import taxes on goods from the European Union. Signs of weakness in European data indicated the pace of economic expansion was slowing, and the 2019 European GDP growth forecast was reduced from 1.7% to 1.1%. The European Central Bank (“ECB”) announced it would hold its deposit rate steady at-0.4% and said it would delay interest rate hikes until 2020. Regarding Japan, slowing global demand and weakening domestic economic growth, coupled with declining inflation, pressured the Bank of Japan to maintain its accommodative monetary policy. As for China, seeming progress in trade discussions with the U.S. was positive for investor risk sentiment overall. In addition, the annual National People’s Congress and Chinese People’s Political Consultative Conference took centerstage, as China’s leaders announced key 2019 economic targets, such as GDP growth of between 6% and 6.5%, and introduced a series of tax cuts to support economic growth. In Australia, the central bank kept interest rates on hold in the face of slowing economic growth and increased downside risks to the global and domestic economic outlooks in spite of a tight labor market and gradually rising inflation. |
| | | In the second quarter of 2019, global equities posted a more modest gain. Trade tensions between the U.S. and China dominated headlines and broadly added noise to the markets. (Noise refers to market activity that can confuse or misrepresent genuine underlying trends.) In April 2019, investors grew optimistic about a possible U.S.-China trade deal, but this optimism faded in May when the U.S. President threatened to raise current tariffs and impose new duties on |
1
PORTFOLIO RESULTS
| | $300 billion of additional Chinese imports. Also, sanctions were temporarily placed on a Chinese telecommunications giant, until they were lifted in June 2019, when any additional tariffs or compromise were postponed. During the second calendar quarter, investors kept a close eye on the Fed, which said it might take a more accommodative approach to monetary policy. Following the Fed’s statement, the market consensus actually priced in at least one interest rate cut by the end of 2019. U.S. economic indicators were mixed during the second calendar quarter, with consumer sentiment remaining elevated but nonfarm payroll data and manufacturing indices falling short of consensus expectations. |
| | | For the Reporting Period overall, the global infrastructure market, as measured by the Index, generated a cumulative total return of 20.73%. Australia and Canada were the best performing markets, while Japan was the only market that recorded negative returns. Among market sectors, all four recorded gains, but energy infrastructure, communications infrastructure and transportation infrastructure each outpaced the Index, while utilities lagged the Index during the Reporting Period.1 |
| Q | | What key factors were responsible for the Fund’s performance during the Reporting Period? |
| A | | During the Reporting Period, the Fund benefited from its underweight position versus the Index in the utilities sector. In addition, a slight overweight in the energy infrastructure sector added to relative returns. The Fund was hampered by its small cash position. |
| | | As for security selection, the Fund’s investments in the communications infrastructure and transportation infrastructure sectors contributed positively. No sectors had a negative impact on the Fund’s returns as measured by security selection. Among countries, selection in the U.S. added significantly to the Fund’s relative performance. Its lack of exposure to Japan and its underweight in Hong Kong bolstered results. Conversely, the Fund’s positioning in Australia detracted slightly from relative performance during the Reporting Period. |
| Q | | What individual holdings added most to the Fund’s relative performance during the Reporting Period? |
| A | | An underweight position in PG&E and positions in China Gas and SBA Communications were leading positive contributors to the Fund’s relative returns during the Reporting Period. |
| | | The Fund’s underweight compared to the Index in PG&E added to its relative performance. Because of the catastrophic California wildfires at the end of 2018, PG&E announced its intent to file for bankruptcy protection, as liabilities, which are widely expected to exceed $30 billion, continued to mount. The company’s chief executive officer stepped down from her position following the announcement, while investigators continued to search for the cause of the destructive fires. By the end of the Reporting Period, we had eliminated the Fund’s position in PG&E stock and redeployed the capital to companies in which we have a greater degree of confidence. |
| | | Another notable positive contributor during the Reporting Period was China Gas, which manages city gas pipeline infrastructure and distribution of natural gas and liquefied petroleum gas. After the Fund purchased the stock at the beginning of March 2019, the company reported solid results for its fiscal year 2019. Its rural gas business performed well, and its management shared a strong growth outlook. At the end of the Reporting Period, we believed China Gas may benefit from deliveries of Russia’s natural gas, scheduled to start in the fourth quarter of 2019, which could fuel demand in China’s northeastern region. |
| | | The Fund was also helped by an investment in SBA Communications, which operates wireless communication infrastructure in North America, Central America and South America. The company reported strong fourth quarter 2018 and first quarter 2019 results, while modestly raising guidance for 2019. At the end of the Reporting Period, we believed SBA Communications may continue to benefit from improving U.S. site leasing activity and its strong backlog of business, which is driven by stable demand, in our opinion. At the end of the Reporting Period, we maintained a favorable view of the operating environment as well as its management’s commitment to growing the company’s portfolio of assets. |
| Q | | What individual holdings detracted most from the Fund’s relative performance during the Reporting Period? |
| A | | The top detractors from the Fund’s relative performance during the Reporting Period were Kinder Morgan, Aeroports de Paris and China Tower. |
| | | The Fund was hurt by its underweight in Kinder Morgan, the largest energy infrastructure company in North America. Its shares appreciated during the Reporting Period in line with |
| | 1 | | Sector and subsector allocations are defined by GSAM and may differ from sector allocations used by the Index. |
2
PORTFOLIO RESULTS
| | the broader crude oil market. The stock also benefited from the company’s 2019 Investor Day during which its management emphasized attractive growth opportunities and shared detailed plans about capital allocation. At the end of the Reporting Period, we maintained the Fund’s underweight position and continued to allocate capital to companies with what we viewed as stronger operating leverage to U.S. production growth. |
| | | Aeroports de Paris, an international airport operator headquartered in France, saw its stock price decline after the French government declared that a decision about the company’s potential privatization would be put on hold during a referendum process. At the end of the Reporting Period, we maintained a favorable view of the company given its increased 2019 traffic guidance, along with what we considered to be its solid dividend yield and its management’s continued focus on international growth. |
| | | Shares of China Tower, a provider of telecommunication tower infrastructure services, generated a positive return on an absolute basis for the Reporting Period as a whole, but the Fund missed some of the appreciation because it did not purchase shares until May 2019. That said, China Tower reported mixed first quarter 2019 earnings results, missing consensus expectations on revenue growth pressures and due to challenges with the growth of its 5G (fifth generation) network. However, the company’snon-telecommunication business grew. At the end of the Reporting Period, we had a positive view of the company because of its 5G initiatives and its faster than market expected rollout. |
| Q | | Were there any notable purchases or sales during the Reporting Period? |
| A | | In addition to China Tower, mentioned previously, we initiated a position in Infrastrutture Wireless Italiane (“Inwit”) during the Reporting Period. Inwit, a provider of electronic communication infrastructure services, made a deal with Vodafone to merge Italian telecommunications towers, which we expected to boost Inwit’s market position. We think the deal could lead to potential synergies in the 5G and 4G markets, possibly giving Inwit a cost advantage over its competitors. We also have a favorable view on the company’s near-term business plan and digitalization innovations, which could help improve its tenancy ratios, in our opinion. |
| | | Conversely, in addition to the sale of PG&E, already mentioned, we eliminated the Fund’s position in Tokyo Gas, a natural gas producer and supplier. The company’s shares were challenged during the Reporting Period, as investors grew concerned about the risk of higher costs in the company’s gas operations and also about the potential of accelerating retail gas switching. Consequently, we decided to exit the Fund’s position in the stock and reallocate the capital to investment ideas about which we had greater conviction and a more favorable outlook. |
| | | We sold the Fund’s position in Pinnacle West Capital, an electric utility company. Shares of the company appreciated during the Reporting Period as a result of strong fourth quarter 2018 earnings, positive 2019 guidance and favorable economic growth in the Phoenix, Arizona metropolitan area. When the stock reached our price target, we chose to sell the position and reallocate the proceeds to companies with what we considered higher risk/reward potential. |
| Q | | How did the Fund use derivatives and similar instruments during the Reporting Period? |
| A | | The Fund did not use derivatives or similar instruments within its investment process during the Reporting Period. |
| Q | | Were there any notable changes in the Fund’s weightings during the Reporting Period? |
| A | | In constructing the Fund’s portfolio, we focus on picking securities rather than on making sector, subsector or country bets. We seek to outpace the Index by overweighting securities we expect to outperform and underweighting those that we think may lag. Consequently, changes in the Fund’s sector or country weights are generally the direct result of individual security selection and/or the appreciation or depreciation of particular Fund holdings. That said, during the Reporting Period, the Fund’s exposure to the communications infrastructure sector increased from a relatively neutral position compared to the Index to a slight overweight, mainly because we added investments in telecommunications towers. In utilities, the Fund moved from a rather neutral position to an underweight position, largely due to a reduction in exposure to diversified utility companies and electric utility companies. From a country perspective, compared to the Index, the Fund’s overweight in the U.S. and its underweight in Hong Kong decreased. We increased the Fund’s Italian investments and, as a result, the Fund became overweight in Italy. In addition, during the Reporting Period, the Fund moved from an overweight in Australia to a relatively neutral position versus the Index. Finally, the Fund’s overweight in France increased during the Reporting Period. |
3
PORTFOLIO RESULTS
| Q | | How was the Fund positioned relative to the Index at the end of the Reporting Period? |
| A | | At the end of the Reporting Period, the Fund was overweight relative to the Index in the communications infrastructure and transportation infrastructure sectors. It was rather neutral compared to the Index in the energy infrastructure sector and underweight the utilities sector. In geographic terms, the Fund was overweight the U.S., France and Italy and underweight Hong Kong at the end of the Reporting Period. |
| Q | | What is the Fund’s tactical view and strategy for the months ahead? |
| A | | At the end of the Reporting Period, we believed relatively low interest rates and modest economic growth remained a supportive backdrop for global infrastructure securities. The financing environment remained accommodative in most regions, fundamentals with respect to supply and demand were healthy, and we believed the investment attributes of the asset class continued to be viewed favorably by investors, especially relative to fixed income. Consequently, investor demand for global infrastructure securities continued to increase, which, in our view, could be supportive of valuations going forward. |
| | | Despite the persistently uncertain and volatile global macro environment, we believe infrastructure companies hold key positions in the global economy and can potentially benefit from their strong business models, which typically feature stable demand, high barriers to entry and regulated or contract-based businesses. We believe the financing environment for global infrastructure companies will likely continue to be accommodative, which is particularly important given the capital-intensive nature of these businesses. As we look ahead, we believe diverging global central bank monetary policies and varying fundamentals at the subsector level may present compelling return opportunities for active managers. Overall, we believe global infrastructure securities may provide investors with possible diversification benefits given their attractive yields and lower volatility relative to the broader equity market and their potential long-term growth potential, inflation hedging opportunities and interest rate resiliency when compared to bonds. |
4
FUND BASICS
Global Infrastructure Fund
as of June 30, 2019
| | | | | | | | | | |
| | PERFORMANCE REVIEW | |
| | | |
| | | January 1, 2019– June 30, 2019 | | Fund Total Return
(based on NAV)1 | | | Dow Jones Brookfield Global
Infrastructure Index
(Net, USD, Unhedged)2 | |
| | Class A | | | 22.16 | % | | | 20.73 | % |
| | Class C | | | 21.65 | | | | 20.73 | |
| | Institutional | | | 22.30 | | | | 20.73 | |
| | Investor | | | 22.18 | | | | 20.73 | |
| | Class P | | | 22.38 | | | | 20.73 | |
| | Class R | | | 21.90 | | | | 20.73 | |
| | | Class R6 | | | 22.25 | | | | 20.73 | |
| | 1 | | The net asset value (“NAV”) represents the net assets of the class of the Fund(ex-dividend) divided by the total number of shares of the class outstanding. The Fund’s performance reflects the reinvestment of dividends and other distributions. The Fund’s performance does not reflect the deduction of any applicable sales charges. |
| | 2 | | The Dow Jones Brookfield Global Infrastructure Index (Net, USD, Unhedged) intends to measure the stock performance of pure-play infrastructure companies domiciled globally. The index covers all sectors of the infrastructure market. Components are required to have more than 70% of cash flows derived from infrastructure lines of business. It is not possible to invest directly in an index. |
| | | | | | | | | | | | |
| | STANDARDIZED TOTAL RETURNS3 | | | |
| | | | |
| | | For the period ended 6/30/19 | | One Year | | | Since Inception | | | Inception Date |
| | Class A | | | 6.89 | % | | | 5.77 | % | | 6/27/16 |
| | Class C | | | 11.24 | | | | 6.96 | | | 6/27/16 |
| | Institutional | | | 13.49 | | | | 8.19 | | | 6/27/16 |
| | Investor | | | 13.38 | | | | 8.03 | | | 6/27/16 |
| | Class P | | | 13.64 | | | | 12.41 | | | 4/17/18 |
| | Class R | | | 12.81 | | | | 7.48 | | | 6/27/16 |
| | | Class R6 | | | 13.53 | | | | 8.18 | | | 6/27/16 |
| | 3 | | The Standardized Total Returns are average annual total returns or cumulative total returns (only if the performance period is one year or less) as of the most recent calendarquarter-end. They assume reinvestment of all distributions at NAV. These returns reflect a maximum initial sales charge of 5.50% for Class A Shares and the assumed contingent deferred sales charge for Class C Shares (1.00% if redeemed within 12 months of purchase). Because Institutional, Investor, Class P, Class R and Class R6 Shares do not involve a sales charge, such a charge is not applied to their Standardized Total Returns. |
The returns set forth in the tables above represent past performance. Past performance does not guarantee future results. The Fund’s investment return and principal value will fluctuate so that an investor’s shares, when redeemed, may be worth more or less than their original cost. Current performance may be lower orhigher than the performance quoted above. Please visit our web site at www.GSAMFUNDS.com to obtain the most recentmonth-end returns. Performance reflects applicable fee waivers and/or expense limitations in effect during the periods shown. In their absence, performance would be reduced. Returns do not reflect the deduction of taxes that a shareholder would pay on Fund distributions or the redemption of Fund shares.
5
FUND BASICS
| | | | | | | | | | | | | | |
| | EXPENSE RATIOS4 | | | | | | | | | | | | |
| | | | |
| | | | | | | | Net Expense Ratio (Current) | | | Gross Expense Ratio (Before Waivers) | |
| | Class A | | | | | | | 1.35 | % | | | 1.49 | % |
| | Class C | | | | | | | 2.10 | | | | 2.24 | |
| | Institutional | | | | | | | 0.99 | | | | 1.10 | |
| | Investor | | | | | | | 1.10 | | | | 1.24 | |
| | Class P | | | | | | | 0.98 | | | | 1.09 | |
| | Class R | | | | | | | 1.60 | | | | 1.74 | |
| | | Class R6 | | | | | | | 0.98 | | | | 1.09 | |
| | 4 | | The expense ratios of the Fund, both current (net of applicable fee waivers and/or expense limitations) and before waivers (gross of applicable fee waivers and/or expense limitations) are as set forth above according to the most recent publicly available Prospectus for the Fund and may differ from the expense ratios disclosed in the Financial Highlights in this report. Pursuant to contractual arrangements, the Fund’s waivers and/or expense limitations will remain in place through at least April 30, 2020, and prior to such date, the Investment Adviser may not terminate the arrangements without the approval of the Fund’s Board of Trustees. If these arrangements are discontinued in the future, the expense ratios may change without shareholder approval. |
6
FUND BASICS
| | | | | | | | | | |
| | TOP TEN HOLDINGS AS OF 6/30/195 |
| | | | |
| | | Holding | | % of Net
Assets | | | Line of Business | | Country |
| | | | |
| | American Tower Corp. | | | 9.0 | % | | Equity Real Estate Investment
Trusts (REITs) | | United States |
| | Vinci SA | | | 6.3 | | | Construction & Engineering | | France |
| | Enbridge, Inc. | | | 5.9 | | | Oil, Gas & Consumable Fuels | | Canada |
| | Crown Castle International Corp. | | | 5.4 | | | Equity Real Estate Investment
Trusts (REITs) | | United States |
| | TC Energy Corp. | | | 4.9 | | | Oil, Gas & Consumable Fuels | | Canada |
| | National Grid PLC | | | 4.7 | | | Multi-Utilities | | United Kingdom |
| | Sempra Energy | | | 4.1 | | | Multi-Utilities | | United States |
| | The Williams Cos., Inc. | | | 3.7 | | | Oil, Gas & Consumable Fuels | | United States |
| | Transurban Group | | | 3.5 | | | Transportation Infrastructure | | Australia |
| | | Eversource Energy | | | 3.2 | | | Electric Utilities | | United States |
| | 5 | | The top 10 holdings may not be representative of the Fund’s future investments. |
7
FUND BASICS
| | | | |
| | FUND VS. BENCHMARK SECTOR ALLOCATION6 |
| | |
| | | As of June 30, 2019 | | |
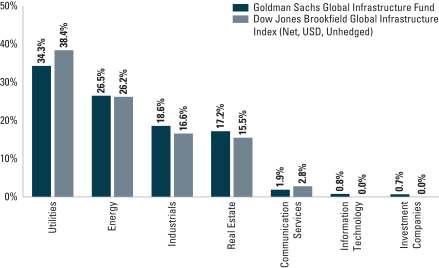
| | 6 | | The Fund is actively managed and, as such, its composition may differ over time. Consequently, the Fund’s overall sector allocations may differ from the percentages contained in the graph above. The graph categorizes investments using the Global Industry Classification Standard (“GICS”), however, the sector classifications used by the portfolio management team may differ from GICS. The percentage shown for each investment category reflects the value of investments in that category as a percentage of market value. The graph depicts the Fund’s investments but may not represent the Fund’s market exposure due to the exclusion of certain derivatives, if any, as listed in the Additional Investment Information section of the Schedule of Investments. |
8
GOLDMAN SACHS GLOBAL INFRASTRUCTURE FUND
Schedule of Investments
June 30, 2019 (Unaudited)
| | | | | | | | |
| Shares | | | Description | | Value | |
| |
| Common Stocks – 98.3% | | | |
| Australia – 4.6% | | | |
| | 383,510 | | | Sydney Airport (Transportation Infrastructure) | | $ | 2,166,633 | |
| | 667,190 | | | Transurban Group (Transportation Infrastructure) | | | 6,908,355 | |
| | | | | | | | |
| | | | | | | 9,074,988 | |
| | |
| Canada – 15.9% | |
| | 319,750 | | | Enbridge, Inc. (Oil, Gas & Consumable Fuels) | | | 11,549,139 | |
| | 110,474 | | | Fortis, Inc. (Electric Utilities) | | | 4,362,270 | |
| | 154,924 | | | Pembina Pipeline Corp. (Oil, Gas & Consumable Fuels) | | | 5,767,283 | |
| | 194,680 | | | TC Energy Corp. (Oil, Gas & Consumable Fuels) | | | 9,651,121 | |
| | | | | | | | |
| | | | | | | 31,329,813 | |
| | |
| China – 1.8% | |
| | 4,568,000 | | | China Tower Corp. Ltd. Class H(a) (Diversified Telecommunication Services) | | | 1,199,886 | |
| | 242,000 | | | ENN Energy Holdings Ltd. (Gas Utilities) | | | 2,355,046 | |
| | | | | | | | |
| | | | | | | 3,554,932 | |
| | |
| France – 7.8% | |
| | 17,470 | | | Aeroports de Paris (Transportation Infrastructure) | | | 3,082,283 | |
| | 120,337 | | | Vinci SA (Construction & Engineering) | | | 12,289,491 | |
| | | | | | | | |
| | | | | | | 15,371,774 | |
| | |
| Hong Kong – 3.7% | |
| | 2,718,000 | | | Beijing Enterprises Water Group Ltd. (Water Utilities) | | | 1,615,445 | |
| | 285,000 | | | China Gas Holdings Ltd. (Gas Utilities) | | | 1,059,061 | |
| | 2,027,011 | | | Hong Kong & China Gas Co. Ltd. (Gas Utilities) | | | 4,493,692 | |
| | | | | | | | |
| | | | | | | 7,168,198 | |
| | |
| Italy – 4.8% | |
| | 44,928 | | | Atlantia SpA (Transportation Infrastructure) | | | 1,171,558 | |
| | 400,274 | | | Enav SpA(a) (Transportation Infrastructure) | | | 2,271,935 | |
| | 254,621 | | | Infrastrutture Wireless Italiane SpA(a) (Diversified Telecommunication Services) | | | 2,496,409 | |
| | 555,349 | | | Terna Rete Elettrica Nazionale SpA (Electric Utilities) | | | 3,538,472 | |
| | | | | | | | |
| | | | | | | 9,478,374 | |
| | |
| Netherlands* – 0.8% | |
| | 20,549 | | | InterXion Holding NV (IT Services) | | | 1,563,573 | |
| | |
| |
| Common Stocks – (continued) | | | |
| Spain – 4.2% | |
| | 18,882 | | | Aena SME SA(a) (Transportation Infrastructure) | | | 3,742,467 | |
| | 174,977 | | | Ferrovial SA (Construction & Engineering) | | | 4,479,168 | |
| | | | | | | | |
| | | | | | | 8,221,635 | |
| | |
| United Kingdom – 6.2% | |
| | 865,366 | | | National Grid PLC (Multi-Utilities) | | | 9,203,046 | |
| | 112,885 | | | Severn Trent PLC (Water Utilities) | | | 2,936,678 | |
| | | | | | | | |
| | | | | | | 12,139,724 | |
| | |
| United States – 48.5% | |
| | 86,638 | | | American Tower Corp. (Equity Real Estate Investment Trusts (REITs)) | | | 17,713,139 | |
| | 53,752 | | | American Water Works Co., Inc. (Water Utilities) | | | 6,235,232 | |
| | 35,622 | | | Atmos Energy Corp. (Gas Utilities) | | | 3,760,258 | |
| | 80,336 | | | Cheniere Energy, Inc.* (Oil, Gas & Consumable Fuels) | | | 5,498,999 | |
| | 25,018 | | | CMS Energy Corp. (Multi-Utilities) | | | 1,448,792 | |
| | 44,120 | | | Consolidated Edison, Inc. (Multi-Utilities) | | | 3,868,442 | |
| | 80,745 | | | Crown Castle International Corp. (Equity Real Estate Investment Trusts (REITs)) | | | 10,525,111 | |
| | 28,772 | | | CyrusOne, Inc. (Equity Real Estate Investment Trusts (REITs)) | | | 1,660,720 | |
| | 46,165 | | | Edison International (Electric Utilities) | | | 3,111,983 | |
| | 83,958 | | | Eversource Energy (Electric Utilities) | | | 6,360,658 | |
| | 241,262 | | | Kinder Morgan, Inc. (Oil, Gas & Consumable Fuels) | | | 5,037,551 | |
| | 11,849 | | | NextEra Energy, Inc. (Electric Utilities) | | | 2,427,386 | |
| | 50,361 | | | ONEOK, Inc. (Oil, Gas & Consumable Fuels) | | | 3,465,340 | |
| | 16,211 | | | SBA Communications Corp.* (Equity Real Estate Investment Trusts (REITs)) | | | 3,644,881 | |
| | 8,198 | | | SemGroup Corp. Class A (Oil, Gas & Consumable Fuels) | | | 98,376 | |
| | 58,174 | | | Sempra Energy (Multi-Utilities) | | | 7,995,435 | |
| | 81,629 | | | Targa Resources Corp. (Oil, Gas & Consumable Fuels) | | | 3,204,755 | |
| | 260,198 | | | The Williams Cos., Inc. (Oil, Gas & Consumable Fuels) | | | 7,295,952 | |
| | 34,233 | | | Xcel Energy, Inc. (Electric Utilities) | | | 2,036,521 | |
| | | | | | | | |
| | | | | | | 95,389,531 | |
| | |
| | TOTAL COMMON STOCKS | | | | |
| | (Cost $162,444,000) | | $ | 193,292,542 | |
| | |
| | |
| The accompanying notes are an integral part of these financial statements. | | 9 |
GOLDMAN SACHS GLOBAL INFRASTRUCTURE FUND
Schedule of Investments(continued)
June 30, 2019 (Unaudited)
| | | | | | | | |
| Shares | | | Dividend
Rate | | Value | |
| |
| Investment Company(b) – 0.7% | | | |
| Goldman Sachs Financial Square Government Fund –
Institutional Shares |
|
| | 1,375,678 | | | 2.308% | | $ | 1,375,678 | |
| | (Cost $1,375,678) | | | | |
| | |
| | TOTAL INVESTMENTS – 99.0% | | | | |
| | (Cost $163,819,678) | | $ | 194,668,220 | |
| | |
| OTHER ASSETS IN EXCESS OF
LIABILITIES – 1.0% | | | 1,935,856 | |
| | |
| | NET ASSETS – 100.0% | | $ | 196,604,076 | |
| | |
| | |
|
| The percentage shown for each investment category reflects the value of investments in that category as a percentage of net assets. |
| |
* | | Non-income producing security. |
| |
(a) | | Exempt from registration under Rule 144A of the Securities Act of 1933. |
| |
(b) | | Represents an Affiliated fund. |
| | |
|
Investment Abbreviations: |
PLC | | —Public Limited Company |
REIT | | —Real Estate Investment Trust |
|
| | |
| 10 | | The accompanying notes are an integral part of these financial statements. |
GOLDMAN SACHS GLOBAL INFRASTRUCTURE FUND
Statement of Assets and Liabilities
June 30, 2019 (Unaudited)
| | | | | | |
| | | | | |
| | Assets: | |
| | Investments of unaffiliated issuers, at value (cost $162,444,000) | | $ | 193,292,542 | |
| | Investments of affiliated issuers, at value (cost $1,375,678) | | | 1,375,678 | |
| | Cash | | | 610,506 | |
| | Foreign currencies, at value (cost $154,512) | | | 154,931 | |
| | Receivables: | | | | |
| | Investments sold | | | 2,852,008 | |
| | Dividends | | | 799,122 | |
| | Reimbursement from investment adviser | | | 25,373 | |
| | Fund shares sold | | | 6,373 | |
| | Other assets | | | 47,187 | |
| | Total assets | | | 199,163,720 | |
| | | | | | |
| | Liabilities: | |
| | |
| | Payables: | | | | |
| | Fund shares redeemed | | | 2,285,982 | |
| | Management fees | | | 146,178 | |
| | Distribution and Service fees and Transfer Agency fees | | | 7,491 | |
| | Investments purchased | | | 4,070 | |
| | Accrued expenses | | | 115,923 | |
| | Total liabilities | | | 2,559,644 | |
| | | | | | |
| | Net Assets: | |
| | Paid-in capital | | | 178,364,792 | |
| | Total distributable earnings (loss) | | | 18,239,284 | |
| | | NET ASSETS | | $ | 196,604,076 | |
| | | Net Assets: | | | | |
| | | Class A | | $ | 1,432,211 | |
| | | Class C | | | 2,411,371 | |
| | | Institutional | | | 1,124,470 | |
| | | Investor | | | 637,414 | |
| | | Class P | | | 2,934,046 | |
| | | Class R | | | 31,075 | |
| | | Class R6 | | | 188,033,489 | |
| | | Total Net Assets | | $ | 196,604,076 | |
| | | Shares Outstanding $0.001 par value (unlimited number of shares authorized): | | | | |
| | | Class A | | | 122,657 | |
| | | Class C | | | 207,315 | |
| | | Institutional | | | 96,039 | |
| | | Investor | | | 54,583 | |
| | | Class P | | | 251,292 | |
| | | Class R | | | 2,660 | |
| | | Class R6 | | | 16,093,578 | |
| | | Net asset value, offering and redemption price per share:(a) | | | | |
| | | Class A | | | $11.68 | |
| | | Class C | | | 11.63 | |
| | | Institutional | | | 11.71 | |
| | | Investor | | | 11.68 | |
| | | Class P | | | 11.68 | |
| | | Class R | | | 11.68 | |
| | | Class R6 | | | 11.68 | |
| | (a) | | Maximum public offering price per share for Class A Shares is $12.36. At redemption, Class C shares may be subject to a contingent deferred sales charge, assessed on the amount equal to the lesser of the current net asset value ("NAV") or the original purchase price of the shares. |
| | |
| The accompanying notes are an integral part of these financial statements. | | 11 |
GOLDMAN SACHS GLOBAL INFRASTRUCTURE FUND
Statement of Operations
For the Six Months Ended June 30, 2019 (Unaudited)
| | | | | | |
| | | | | | |
| | Investment income: | |
| | |
| | Dividends — unaffiliated issuers (net of foreign withholding taxes of $242,556) | | $ | 3,404,838 | |
| | |
| | Non-cash dividends—unaffiliated issuers | | | 276,111 | |
| | |
| | Dividends — affiliated issuers | | | 11,013 | |
| | |
| | Total investment income | | | 3,691,962 | |
| | | | | | |
| | Expenses: | |
| | |
| | Management fees | | | 914,747 | |
| | |
| | Professional fees | | | 55,223 | |
| | |
| | Registration fees | | | 45,899 | |
| | |
| | Custody, accounting and administrative services | | | 40,781 | |
| | |
| | Transfer Agency fees(a) | | | 33,398 | |
| | |
| | Printing and mailing costs | | | 18,115 | |
| | |
| | Distribution and Service fees(a) | | | 11,484 | |
| | |
| | Trustee fees | | | 8,127 | |
| | |
| | Other | | | 10,379 | |
| | |
| | Total expenses | | | 1,138,153 | |
| | |
| | Less — expense reductions | | | (124,585 | ) |
| | |
| | Net expenses | | | 1,013,568 | |
| | |
| | NET INVESTMENT INCOME | | | 2,678,394 | |
| | | | | | |
| | Realized and unrealized gain (loss): | |
| | |
| | Net realized gain (loss) from: | | | | |
| | |
| | Investments — unaffiliated issuers | | | (725,752 | ) |
| | |
| | Foreign currency transactions | | | 1,240 | |
| |
| | Net change in unrealized gain on: | |
| | |
| | Investments — unaffiliated issuers | | | 38,988,979 | |
| | |
| | Foreign currency translation | | | 4,443 | |
| | |
| | Net realized and unrealized gain | | | 38,268,910 | |
| | |
| | NET INCREASE IN NET ASSETS RESULTING FROM OPERATIONS | | $ | 40,947,304 | |
| | (a) | | Class specific Distribution and/or Service and Transfer Agency fees were as follows: |
| | | | | | | | | | | | | | | | | | | | | | | | | | | | | | | | | | | | | | |
Distribution and/or Service Fees | | | Transfer Agency Fees | |
Class A | | | Class C | | | Class R | | | Class A | | | Class C | | | Institutional | | | Investor | | | Class P | | | Class R | | | Class R6 | |
| $ | 1,816 | | | $ | 9,596 | | | $ | 72 | | | $ | 1,308 | | | $ | 1,727 | | | $ | 146 | | | $ | 383 | | | $ | 394 | | | $ | 26 | | | $ | 29,414 | |
| | |
| 12 | | The accompanying notes are an integral part of these financial statements. |
GOLDMAN SACHS GLOBAL INFRASTRUCTURE FUND
Statements of Changes in Net Assets
| | | | | | | | | | |
| | | | | For the
Six Months Ended
June 30, 2019
(Unaudited) | | | For the Fiscal
Year Ended
December 31, 2018 | |
| | From operations: | |
| | | |
| | Net investment income | | $ | 2,678,394 | | | $ | 4,381,926 | |
| | | |
| | Net realized loss | | | (724,512 | ) | | | (8,741,573 | ) |
| | | |
| | Net change in unrealized gain (loss) | | | 38,993,422 | | | | (15,784,815 | ) |
| | | |
| | Net increase (decrease) in net assets resulting from operations | | | 40,947,304 | | | | (20,144,462 | ) |
| | | | | | | | | | |
| | Distributions to shareholders: | |
| | | |
| | From distributable earnings: | | | | | | | | |
| | | |
| | Class A Shares | | | (18,018 | ) | | | (20,304 | ) |
| | | |
| | Class C Shares | | | (20,913 | ) | | | (14,805 | ) |
| | | |
| | Institutional Shares | | | (12,606 | ) | | | (33,168 | ) |
| | | |
| | Investor Shares | | | (7,493 | ) | | | (5,228 | ) |
| | | |
| | Class P Shares(a) | | | (39,836 | ) | | | (69,243 | ) |
| | | |
| | Class R Shares | | | (342 | ) | | | (357 | ) |
| | | |
| | Class R6 Shares | | | (2,746,063 | ) | | | (4,232,791 | ) |
| | | |
| | Total distributions to shareholders | | | (2,845,271 | ) | | | (4,375,896 | ) |
| | | | | | | | | | |
| | From share transactions: | |
| | | |
| | Proceeds from sales of shares | | | 17,485,506 | | | | 270,954,734 | |
| | | |
| | Reinvestment of distributions | | | 2,845,066 | | | | 4,375,658 | |
| | | |
| | Cost of shares redeemed | | | (52,213,281 | ) | | | (283,152,789 | ) |
| | Net decrease in net assets resulting from share transactions | | | (31,882,709 | ) | | | (7,822,397 | ) |
| | TOTAL INCREASE (DECREASE) | | | 6,219,324 | | | | (32,342,755 | ) |
| | | | | | | | | | |
| | Net assets: | |
| | Beginning of period | | | 190,384,752 | | | | 222,727,507 | |
| | | |
| | End of period | | $ | 196,604,076 | | | $ | 190,384,752 | |
| | (a) | | Commenced operations on April 17, 2018. |
| | |
| The accompanying notes are an integral part of these financial statements. | | 13 |
GOLDMAN SACHS GLOBAL INFRASTRUCTURE FUND
Financial Highlights
Selected Share Data for a Share Outstanding Throughout Each Period
| | | | | | | | | | | | | | | | | | |
| | | | | Goldman Sachs Global Infrastructure Fund | |
| | | | | Class A Shares | |
| | | | | Six Months Ended
June 30, 2019 (Unaudited) | | | Year Ended December 31, | | | Period Ended
December 31, 2016(a) | |
| | | | | 2018 | | | 2017 | |
| | Per Share Data | |
| | | | | |
| | Net asset value, beginning of period | | $ | 9.68 | | | $ | 10.85 | | | $ | 9.89 | | | $ | 10.00 | |
| | | | | |
| | Net investment income(b) | | | 0.12 | | | | 0.19 | | | | 0.22 | (c) | | | 0.06 | |
| | | | | |
| | Net realized and unrealized gain (loss) | | | 2.02 | | | | (1.19 | ) | | | 0.99 | | | | 0.01 | |
| | | | | |
| | Total from investment operations | | | 2.14 | | | | (1.00 | ) | | | 1.21 | | | | 0.07 | |
| | | | | |
| | Distributions to shareholders from net investment income | | | (0.14 | ) | | | (0.17 | ) | | | (0.20 | ) | | | (0.05 | ) |
| | | | | |
| | Distributions to shareholders from net realized gains | | | — | | | | — | | | | (0.05 | ) | | | (0.12 | ) |
| | | | | |
| | Distributions to shareholders from return of capital | | | — | | | | — | | | | — | (d) | | | (0.01 | ) |
| | | | | |
| | Total distributions | | | (0.14 | ) | | | (0.17 | ) | | | (0.25 | ) | | | (0.18 | ) |
| | | | | |
| | Net asset value, end of period | | $ | 11.68 | | | $ | 9.68 | | | $ | 10.85 | | | $ | 9.89 | |
| | | | | |
| | Total return(e) | | | 22.16 | % | | | (9.31 | )% | | | 12.29 | % | | | 0.69 | % |
| | | | | |
| | Net assets, end of period (in 000s) | | $ | 1,432 | | | $ | 1,376 | | | $ | 40 | | | $ | 25 | |
| | | | | |
| | Ratio of net expenses to average net assets | | | 1.37 | %(f) | | | 1.38 | % | | | 1.38 | % | | | 1.40 | %(f) |
| | | | | |
| | Ratio of total expenses to average net assets | | | 1.51 | %(f) | | | 1.51 | % | | | 6.20 | % | | | 15.63 | %(f) |
| | | | | |
| | Ratio of net investment income to average net assets | | | 2.24 | %(f) | | | 1.83 | % | | | 2.04 | %(c) | | | 1.19 | %(f) |
| | | | | |
| | Portfolio turnover rate(g) | | | 21 | % | | | 67 | % | | | 103 | % | | | 59 | % |
| | (a) | | Commenced operations on June 27, 2016. |
| | (b) | | Calculated based on the average shares outstanding methodology. |
| | (c) | | Reflects income recognized from special dividends which amounted to $0.08 per share and 0.71% of average net assets. |
| | (d) | | Amount is less than $0.005 per share. |
| | (e) | | Assumes investment at the NAV at the beginning of the period, reinvestment of all dividends and distributions, a complete redemption of the investment at the NAV at the end of the period and no sales or redemption charges (if any). Total returns would be reduced if a sales or redemption charge was taken into account. Returns do not reflect the impact of taxes to shareholders relating to Fund distributions or the redemption of Fund shares. Total returns for periods less than one full year are not annualized. |
| | (g) | | The Fund’s portfolio turnover rate is calculated in accordance with regulatory requirements, without regard to transactions involving short term investments. If such transactions were included, the Fund’s portfolio turnover rate may be higher. |
| | |
| 14 | | The accompanying notes are an integral part of these financial statements. |
GOLDMAN SACHS GLOBAL INFRASTRUCTURE FUND
Financial Highlights(continued)
Selected Share Data for a Share Outstanding Throughout Each Period
| | | | | | | | | | | | | | | | | | |
| | | | | Goldman Sachs Global Infrastructure Fund | |
| | | | | Class C Shares | |
| | | | | Six Months Ended
June 30, 2019 (Unaudited) | | | Year Ended December 31, | | | Period Ended
December 31, 2016(a) | |
| | | | | 2018 | | | 2017 | |
| | Per Share Data | |
| | | | | |
| | Net asset value, beginning of period | | $ | 9.65 | | | $ | 10.84 | | | $ | 9.88 | | | $ | 10.00 | |
| | | | | |
| | Net investment income(b) | | | 0.10 | | | | 0.10 | | | | 0.13 | (c) | | | 0.02 | |
| | | | | |
| | Net realized and unrealized gain (loss) | | | 1.99 | | | | (1.17 | ) | | | 1.00 | | | | 0.01 | |
| | | | | |
| | Total from investment operations | | | 2.09 | | | | (1.07 | ) | | | 1.13 | | | | 0.03 | |
| | | | | |
| | Distributions to shareholders from net investment income | | | (0.11 | ) | | | (0.12 | ) | | | (0.14 | ) | | | (0.02 | ) |
| | | | | |
| | Distributions to shareholders from net realized gains | | | — | | | | — | | | | (0.03 | ) | | | (0.12 | ) |
| | | | | |
| | Distributions to shareholders from return of capital | | | — | | | | — | | | | — | (d) | | | (0.01 | ) |
| | | | | |
| | Total distributions | | | (0.11 | ) | | | (0.12 | ) | | | (0.17 | ) | | | (0.15 | ) |
| | | | | |
| | Net asset value, end of period | | $ | 11.63 | | | $ | 9.65 | | | $ | 10.84 | | | $ | 9.88 | |
| | | | | |
| | Total return(e) | | | 21.65 | % | | | (9.96 | )% | | | 11.46 | % | | | 0.30 | % |
| | | | | |
| | Net assets, end of period (in 000s) | | $ | 2,411 | | | $ | 1,383 | | | $ | 57 | | | $ | 51 | |
| | | | | |
| | Ratio of net expenses to average net assets | | | 2.12 | %(f) | | | 2.13 | % | | | 2.14 | % | | | 2.14 | %(f) |
| | | | | |
| | Ratio of total expenses to average net assets | | | 2.26 | %(f) | | | 2.26 | % | | | 7.06 | % | | | 16.73 | %(f) |
| | | | | |
| | Ratio of net investment income to average net assets | | | 1.78 | %(f) | | | 1.00 | % | | | 1.24 | %(c) | | | 0.46 | %(f) |
| | | | | |
| | Portfolio turnover rate(g) | | | 21 | % | | | 67 | % | | | 103 | % | | | 59 | % |
| | (a) | | Commenced operations on June 27, 2016. |
| | (b) | | Calculated based on the average shares outstanding methodology. |
| | (c) | | Reflects income recognized from special dividends which amounted to $0.08 per share and 0.71% of average net assets. |
| | (d) | | Amount is less than $0.005 per share. |
| | (e) | | Assumes investment at the NAV at the beginning of the period, reinvestment of all dividends and distributions, a complete redemption of the investment at the NAV at the end of the period and no sales or redemption charges (if any). Total returns would be reduced if a sales or redemption charge was taken into account. Returns do not reflect the impact of taxes to shareholders relating to Fund distributions or the redemption of Fund shares. Total returns for periods less than one full year are not annualized. |
| | (g) | | The Fund’s portfolio turnover rate is calculated in accordance with regulatory requirements, without regard to transactions involving short term investments. If such transactions were included, the Fund’s portfolio turnover rate may be higher. |
| | |
| The accompanying notes are an integral part of these financial statements. | | 15 |
GOLDMAN SACHS GLOBAL INFRASTRUCTURE FUND
Financial Highlights(continued)
Selected Share Data for a Share Outstanding Throughout Each Period
| | | | | | | | | | | | | | | | | | |
| | | | | Goldman Sachs Global Infrastructure Fund | |
| | | | | Institutional Shares | |
| | | | | Six Months Ended
June 30, 2019 (Unaudited) | | | Year Ended December 31, | | | Period Ended
December 31, 2016(a) | |
| | | | | 2018 | | | 2017 | |
| | Per Share Data | |
| | | | | |
| | Net asset value, beginning of period | | $ | 9.71 | | | $ | 10.85 | | | $ | 9.89 | | | $ | 10.00 | |
| | | | | |
| | Net investment income(b) | | | 0.16 | | | | 0.06 | | | | 0.29 | (c) | | | 0.08 | |
| | | | | |
| | Net realized and unrealized gain (loss) | | | 2.00 | | | | (1.02 | ) | | | 0.96 | | | | 0.01 | |
| | | | | |
| | Total from investment operations | | | 2.16 | | | | (0.96 | ) | | | 1.25 | | | | 0.09 | |
| | | | | |
| | Distributions to shareholders from net investment income | | | (0.16 | ) | | | (0.18 | ) | | | (0.20 | ) | | | (0.07 | ) |
| | | | | |
| | Distributions to shareholders from net realized gains | | | — | | | | — | | | | (0.08 | ) | | | (0.12 | ) |
| | | | | |
| | Distributions to shareholders from return of capital | | | — | | | | — | | | | (0.01 | ) | | | (0.01 | ) |
| | | | | |
| | Total distributions | | | (0.16 | ) | | | (0.18 | ) | | | (0.29 | ) | | | (0.20 | ) |
| | | | | |
| | Net asset value, end of period | | $ | 11.71 | | | $ | 9.71 | | | $ | 10.85 | | | $ | 9.89 | |
| | | | | |
| | Total return(d) | | | 22.30 | % | | | (8.89 | )% | | | 12.72 | % | | | 0.89 | % |
| | | | | |
| | Net assets, end of period (in 000s) | | $ | 1,124 | | | $ | 1,737 | | | $ | 222,546 | | | $ | 2,906 | |
| | | | | |
| | Ratio of net expenses to average net assets | | | 0.99 | %(e) | | | 0.99 | % | | | 0.99 | % | | | 0.99 | %(e) |
| | | | | |
| | Ratio of total expenses to average net assets | | | 1.12 | %(e) | | | 1.06 | % | | | 1.29 | % | | | 15.23 | %(e) |
| | | | | |
| | Ratio of net investment income to average net assets | | | 2.95 | %(e) | | | 0.54 | % | | | 2.65 | %(c) | | | 1.59 | %(e) |
| | | | | |
| | Portfolio turnover rate(f) | | | 21 | % | | | 67 | % | | | 103 | % | | | 59 | % |
| | (a) | | Commenced operations on June 27, 2016. |
| | (b) | | Calculated based on the average shares outstanding methodology. |
| | (c) | | Reflects income recognized from special dividends which amounted to $0.08 per share and 0.71% of average net assets. |
| | (d) | | Assumes investment at the NAV at the beginning of the period, reinvestment of all dividends and distributions, a complete redemption of the investment at the NAV at the end of the period and no sales or redemption charges (if any). Total returns would be reduced if a sales or redemption charge was taken into account. Returns do not reflect the impact of taxes to shareholders relating to Fund distributions or the redemption of Fund shares. Total returns for periods less than one full year are not annualized. |
| | (f) | | The Fund’s portfolio turnover rate is calculated in accordance with regulatory requirements, without regard to transactions involving short term investments. If such transactions were included, the Fund’s portfolio turnover rate may be higher. |
| | |
| 16 | | The accompanying notes are an integral part of these financial statements. |
GOLDMAN SACHS GLOBAL INFRASTRUCTURE FUND
Financial Highlights(continued)
Selected Share Data for a Share Outstanding Throughout Each Period
| | | | | | | | | | | | | | | | | | |
| | | | | Goldman Sachs Global Infrastructure Fund | |
| | | | | Investor Shares | |
| | | | | Six Months Ended
June 30, 2019 (Unaudited) | | | Year Ended December 31, | | | Period Ended
December 31, 2016(a) | |
| | | | | 2018 | | | 2017 | |
| | Per Share Data | |
| | | | | |
| | Net asset value, beginning of period | | $ | 9.68 | | | $ | 10.85 | | | $ | 9.89 | | | $ | 10.00 | |
| | | | | |
| | Net investment income(b) | | | 0.16 | | | | 0.20 | | | | 0.24 | (c) | | | 0.08 | |
| | | | | |
| | Net realized and unrealized gain (loss) | | | 2.00 | | | | (1.18 | ) | | | 0.99 | | | | — | (d) |
| | | | | |
| | Total from investment operations | | | 2.16 | | | | (0.98 | ) | | | 1.23 | | | | 0.08 | |
| | | | | |
| | Distributions to shareholders from net investment income | | | (0.16 | ) | | | (0.19 | ) | | | (0.21 | ) | | | (0.06 | ) |
| | | | | |
| | Distributions to shareholders from net realized gains | | | — | | | | — | | | | (0.05 | ) | | | (0.12 | ) |
| | | | | |
| | Distributions to shareholders from return of capital | | | — | | | | — | | | | (0.01 | ) | | | (0.01 | ) |
| | | | | |
| | Total distributions | | | (0.16 | ) | | | (0.19 | ) | | | (0.27 | ) | | | (0.19 | ) |
| | | | | |
| | Net asset value, end of period | | $ | 11.68 | | | $ | 9.68 | | | $ | 10.85 | | | $ | 9.89 | |
| | | | | |
| | Total return(e) | | | 22.18 | % | | | (9.00 | )% | | | 12.56 | % | | | 0.91 | % |
| | | | | |
| | Net assets, end of period (in 000s) | | $ | 637 | | | $ | 279 | | | $ | 28 | | | $ | 25 | |
| | | | | |
| | Ratio of net expenses to average net assets | | | 1.12 | %(f) | | | 1.13 | % | | | 1.14 | % | | | 0.95 | %(f) |
| | | | | |
| | Ratio of total expenses to average net assets | | | 1.27 | %(f) | | | 1.25 | % | | | 6.05 | % | | | 15.19 | %(f) |
| | | | | |
| | Ratio of net investment income to average net assets | | | 2.94 | %(f) | | | 1.95 | % | | | 2.23 | %(c) | | | 1.63 | %(f) |
| | | | | |
| | Portfolio turnover rate(g) | | | 21 | % | | | 67 | % | | | 103 | % | | | 59 | % |
| | (a) | | Commenced operations on June 27, 2016. |
| | (b) | | Calculated based on the average shares outstanding methodology. |
| | (c) | | Reflects income recognized from special dividends which amounted to $0.08 per share and 0.71% of average net assets. |
| | (d) | | Amount is less than $0.005 per share. |
| | (e) | | Assumes investment at the NAV at the beginning of the period, reinvestment of all dividends and distributions, a complete redemption of the investment at the NAV at the end of the period and no sales or redemption charges (if any). Total returns would be reduced if a sales or redemption charge was taken into account. Returns do not reflect the impact of taxes to shareholders relating to Fund distributions or the redemption of Fund shares. Total returns for periods less than one full year are not annualized. |
| | (g) | | The Fund’s portfolio turnover rate is calculated in accordance with regulatory requirements, without regard to transactions involving short term investments. If such transactions were included, the Fund’s portfolio turnover rate may be higher. |
| | |
| The accompanying notes are an integral part of these financial statements. | | 17 |
GOLDMAN SACHS GLOBAL INFRASTRUCTURE FUND
Financial Highlights(continued)
Selected Share Data for a Share Outstanding Throughout Each Period
| | | | | | | | | | |
| | | | | Goldman Sachs Global Infrastructure Fund | |
| | | | | Class P Shares | |
| | | | | Six Months Ended
June 30, 2019 (Unaudited) | | | Period Ended
December 31, 2018(a) | |
| | | |
| | Per Share Data | |
| | | |
| | Net asset value, beginning of period | | $ | 9.68 | | | $ | 10.47 | |
| | | |
| | Net investment income(b) | | | 0.15 | | | | 0.12 | |
| | | |
| | Net realized and unrealized gain (loss) | | | 2.01 | | | | (0.73 | ) |
| | | |
| | Total from investment operations | | | 2.16 | | | | (0.61 | ) |
| | | |
| | Distributions to shareholders from net investment income | | | (0.16 | ) | | | (0.18 | ) |
| | | |
| | Net asset value, end of period | | $ | 11.68 | | | $ | 9.68 | |
| | | |
| | Total return(c) | | | 22.38 | % | | | (5.91 | )% |
| | | |
| | Net assets, end of period (in 000s) | | $ | 2,934 | | | $ | 2,278 | |
| | | |
| | Ratio of net expenses to average net assets(d) | | | 0.98 | % | | | 0.98 | % |
| | | |
| | Ratio of total expenses to average net assets(d) | | | 1.11 | % | | | 1.14 | % |
| | | |
| | Ratio of net investment income to average net assets(d) | | | 2.77 | % | | | 1.68 | % |
| | | |
| | Portfolio turnover rate(e) | | | 21 | % | | | 67 | % |
| | (a) | | Commenced operations on April 17, 2018. |
| | (b) | | Calculated based on the average shares outstanding methodology. |
| | (c) | | Assumes investment at the NAV at the beginning of the period, reinvestment of all dividends and distributions, a complete redemption of the investment at the NAV at the end of the period and no sales or redemption charges (if any). Total returns would be reduced if a sales or redemption charge was taken into account. Returns do not reflect the impact of taxes to shareholders relating to Fund distributions or the redemption of Fund shares. Total returns for periods less than one full year are not annualized. |
| | (e) | | The Fund’s portfolio turnover rate is calculated in accordance with regulatory requirements, without regard to transactions involving short term investments. If such transactions were included, the Fund’s portfolio turnover rate may be higher. |
| | |
| 18 | | The accompanying notes are an integral part of these financial statements. |
GOLDMAN SACHS GLOBAL INFRASTRUCTURE FUND
Financial Highlights(continued)
Selected Share Data for a Share Outstanding Throughout Each Period
| | | | | | | | | | | | | | | | | | |
| | | | | Goldman Sachs Global Infrastructure Fund | |
| | | | | Class R Shares | |
| | | | | Six Months Ended
June 30, 2019 (Unaudited) | | | Year Ended December 31, | | | Period Ended
December 31, 2016(a) | |
| | | | | 2018 | | | 2017 | |
| | Per Share Data | |
| | | | | |
| | Net asset value, beginning of period | | $ | 9.69 | | | $ | 10.85 | | | $ | 9.89 | | | $ | 10.00 | |
| | | | | |
| | Net investment income(b) | | | 0.11 | | | | 0.14 | | | | 0.18 | (c) | | | 0.05 | |
| | | | | |
| | Net realized and unrealized gain (loss) | | | 2.01 | | | | (1.16 | ) | | | 1.00 | | | | 0.01 | |
| | | | | |
| | Total from investment operations | | | 2.12 | | | | (1.02 | ) | | | 1.18 | | | | 0.06 | |
| | | | | |
| | Distributions to shareholders from net investment income | | | (0.13 | ) | | | (0.14 | ) | | | (0.18 | ) | | | (0.04 | ) |
| | | | | |
| | Distributions to shareholders from net realized gains | | | — | | | | — | | | | (0.04 | ) | | | (0.12 | ) |
| | | | | |
| | Distributions to shareholders from return of capital | | | — | | | | — | | | | — | (d) | | | (0.01 | ) |
| | | | | |
| | Total distributions | | | (0.13 | ) | | | (0.14 | ) | | | (0.22 | ) | | | (0.17 | ) |
| | | | | |
| | Net asset value, end of period | | $ | 11.68 | | | $ | 9.69 | | | $ | 10.85 | | | $ | 9.89 | |
| | | | | |
| | Total return(e) | | | 21.90 | % | | | (9.49 | )% | | | 12.00 | % | | | 0.82 | % |
| | | | | |
| | Net assets, end of period (in 000s) | | $ | 31 | | | $ | 25 | | | $ | 28 | | | $ | 25 | |
| | | | | |
| | Ratio of net expenses to average net assets | | | 1.63 | %(f) | | | 1.63 | % | | | 1.64 | % | | | 1.15 | %(f) |
| | | | | |
| | Ratio of total expenses to average net assets | | | 1.76 | %(f) | | | 1.75 | % | | | 6.55 | % | | | 15.38 | %(f) |
| | | | | |
| | Ratio of net investment income to average net assets | | | 2.09 | %(f) | | | 1.30 | % | | | 1.74 | %(c) | | | 1.44 | %(f) |
| | | | | |
| | Portfolio turnover rate(g) | | | 21 | % | | | 67 | % | | | 103 | % | | | 59 | % |
| | (a) | | Commenced operations on June 27, 2016. |
| | (b) | | Calculated based on the average shares outstanding methodology. |
| | (c) | | Reflects income recognized from special dividends which amounted to $0.08 per share and 0.71% of average net assets. |
| | (d) | | Amount is less than $0.005 per share. |
| | (e) | | Assumes investment at the NAV at the beginning of the period, reinvestment of all dividends and distributions, a complete redemption of the investment at the NAV at the end of the period and no sales or redemption charges (if any). Total returns would be reduced if a sales or redemption charge was taken into account. Returns do not reflect the impact of taxes to shareholders relating to Fund distributions or the redemption of Fund shares. Total returns for periods less than one full year are not annualized. |
| | (g) | | The Fund’s portfolio turnover rate is calculated in accordance with regulatory requirements, without regard to transactions involving short term investments. If such transactions were included, the Fund’s portfolio turnover rate may be higher. |
| | |
| The accompanying notes are an integral part of these financial statements. | | 19 |
GOLDMAN SACHS GLOBAL INFRASTRUCTURE FUND
Financial Highlights(continued)
Selected Share Data for a Share Outstanding Throughout Each Period
| | | | | | | | | | | | | | | | | | |
| | | | | Goldman Sachs Global Infrastructure Fund | |
| | | | | Class R6 Shares | |
| | | | | Six Months Ended
June 30, 2019 (Unaudited) | | | Year Ended December 31, | | | Period Ended
December 31, 2016(a) | |
| | | | | 2018 | | | 2017 | |
| | Per Share Data | |
| | | | | |
| | Net asset value, beginning of period | | $ | 9.69 | | | $ | 10.85 | | | $ | 9.89 | | | $ | 10.00 | |
| | | | | |
| | Net investment income(b) | | | 0.14 | | | | 0.22 | | | | 0.26 | (c) | | | 0.09 | |
| | | | | |
| | Net realized and unrealized gain (loss) | | | 2.01 | | | | (1.18 | ) | | | 0.99 | | | | — | (d) |
| | | | | |
| | Total from investment operations | | | 2.15 | | | | (0.96 | ) | | | 1.25 | | | | 0.09 | |
| | | | | |
| | Distributions to shareholders from net investment income | | | (0.16 | ) | | | (0.20 | ) | | | (0.22 | ) | | | (0.07 | ) |
| | | | | |
| | Distributions to shareholders from net realized gains | | | — | | | | — | | | | (0.06 | ) | | | (0.12 | ) |
| | | | | |
| | Distributions to shareholders from return of capital | | | — | | | | — | | | | (0.01 | ) | | | (0.01 | ) |
| | | | | |
| | Total distributions | | | (0.16 | ) | | | (0.20 | ) | | | (0.29 | ) | | | (0.20 | ) |
| | | | | |
| | Net asset value, end of period | | $ | 11.68 | | | $ | 9.69 | | | $ | 10.85 | | | $ | 9.89 | |
| | | | | |
| | Total return(e) | | | 22.25 | % | | | (8.88 | )% | | | 12.74 | % | | | 0.56 | % |
| | | | | |
| | Net assets, end of period (in 000s) | | $ | 188,033 | | | $ | 183,306 | | | $ | 28 | | | $ | 25 | |
| | | | | |
| | Ratio of net expenses to average net assets | | | 0.98 | %(f) | | | 0.98 | % | | | 0.97 | % | | | 1.65 | %(f) |
| | | | | |
| | Ratio of total expenses to average net assets | | | 1.11 | %(f) | | | 1.10 | % | | | 5.88 | % | | | 15.88 | %(f) |
| | | | | |
| | Ratio of net investment income to average net assets | | | 2.64 | %(f) | | | 2.17 | % | | | 2.40 | %(c) | | | 0.93 | %(f) |
| | | | | |
| | Portfolio turnover rate(g) | | | 21 | % | | | 67 | % | | | 103 | % | | | 59 | % |
| | (a) | | Commenced operations on June 27, 2016. |
| | (b) | | Calculated based on the average shares outstanding methodology. |
| | (c) | | Reflects income recognized from special dividends which amounted to $0.08 per share and 0.71% of average net assets. |
| | (d) | | Amount is less than $0.005 per share. |
| | (e) | | Assumes investment at the NAV at the beginning of the period, reinvestment of all dividends and distributions, a complete redemption of the investment at the NAV at the end of the period and no sales or redemption charges (if any). Total returns would be reduced if a sales or redemption charge was taken into account. Returns do not reflect the impact of taxes to shareholders relating to Fund distributions or the redemption of Fund shares. Total returns for periods less than one full year are not annualized. |
| | (g) | | The Fund’s portfolio turnover rate is calculated in accordance with regulatory requirements, without regard to transactions involving short term investments. If such transactions were included, the Fund’s portfolio turnover rate may be higher. |
| | |
| 20 | | The accompanying notes are an integral part of these financial statements. |
GOLDMAN SACHS GLOBAL INFRASTRUCTURE FUND
Notes to Financial Statements
June 30, 2019 (Unaudited)
Goldman Sachs Trust (the “Trust”) is a Delaware statutory trust registered under the Investment Company Act of 1940, as amended (the “Act”), as an open-end management investment company. Goldman Sachs Global Infrastructure Fund (the “Fund”) is a non-diversified portfolio and currently offers seven classes of shares: Class A, Class C, Institutional, Investor, Class P, Class R, and Class R6 Shares.
Class A Shares are sold with a front-end sales charge of up to 5.50%. Class C Shares are sold with a contingent deferred sales charge (“CDSC”) of 1.00%, which is imposed on redemptions made within 12 months of purchase. Institutional, Investor, Class P, Class R and Class R6 shares are not subject to a sales charge.
Goldman Sachs Asset Management, L.P. (“GSAM”), an affiliate of Goldman Sachs & Co. LLC (“Goldman Sachs”), serves as investment adviser to the Fund pursuant to a management agreement (the “Agreement”) with the Trust.
|
| 2. SIGNIFICANT ACCOUNTING POLICIES |
The financial statements have been prepared in accordance with accounting principles generally accepted in the United States of America (“GAAP”) and require management to make estimates and assumptions that may affect the reported amounts and disclosures. Actual results may differ from those estimates and assumptions.
A. Investment Valuation— The Fund’s valuation policy is to value investments at fair value.
B. Investment Income and Investments— Investment income includes interest income, dividend income, and securities lending income, if any. Interest income is accrued daily and adjusted for amortization of premiums and accretion of discounts. Dividend income is recognized on ex-dividend date or, for certain foreign securities, as soon as such information is obtained subsequent to the ex-dividend date. Investment transactions are reflected on trade date. Realized gains and losses are calculated using identified cost. Investment transactions are recorded on the following business day for daily net asset value (“NAV”) calculations. Investment income is recorded net of any foreign withholding taxes, less any amounts reclaimable. The Fund may file withholding tax reclaims in certain jurisdictions to recover a portion of amounts previously withheld. Any foreign capital gains tax is accrued daily based upon net unrealized gains, and is payable upon sale of such investments. Distributions received from the Fund’s investments in U.S. real estate investment trusts (“REITs”) may be characterized as ordinary income, net capital gain or a return of capital. A return of capital is recorded by the Fund as a reduction to the cost basis of the REIT. Distributions from master limited partnerships (“MLPs”) are generally recorded based on the characterization reported on the MLP’s tax return. The Fund records itspro-rata share of the income/loss and capital gains/losses, allocated from the underlying partnerships and adjusts the cost basis of the underlying partnerships accordingly.
C. Class Allocations and Expenses — Investment income, realized and unrealized gain (loss), if any, and non-class specific expenses of the Fund are allocated daily based upon the proportion of net assets of each class.Non-class specific expenses directly incurred by the Fund are charged to the Fund, while such expenses incurred by the Trust are allocated across the Fund on a straight-line and/orpro-rata basis depending upon the nature of the expenses. Class-specific expenses, where applicable, are borne by the respective share classes and include Distribution and Service, Transfer Agency and Service fees.
D. Federal Taxes and Distributions to Shareholders — It is the Fund’s policy to comply with the requirements of the Internal Revenue Code of 1986, as amended (the “Code”), applicable to regulated investment companies and to distribute each year substantially all of its investment company taxable income and capital gains to its shareholders. Accordingly, the Fund is not required to make any provisions for the payment of federal income tax. Distributions to shareholders are recorded on the ex-dividend date. Distributions from net investment income are declared and paid quarterly, and distributions from net capital gains, if any, are declared and paid at least annually.
Net capital losses, if any, are carried forward to future fiscal years and may be used to the extent allowed by the Code to offset any future capital gains. Losses that are carried forward will retain their character as eithershort-term orlong-term capital losses. Utilization of capital loss carryforwards will reduce the requirement of future capital gains distributions.
21
GOLDMAN SACHS GLOBAL INFRASTRUCTURE FUND
Notes to Financial Statements(continued)
June 30, 2019 (Unaudited)
|
| 2. SIGNIFICANT ACCOUNTING POLICIES (continued) |
The characterization of distributions to shareholders for financial reporting purposes is determined in accordance with federal income tax rules, which may differ from GAAP. The source of the Fund’s distributions may be shown in the accompanying financial statements as either from distributable earnings or capital. Certain components of the Fund’s net assets on the Statement of Assets and Liabilities reflect permanent GAAP/tax differences based on the appropriate tax character.
E. Foreign Currency Translation — The accounting records and reporting currency of the Fund are maintained in U.S. dollars. Assets and liabilities denominated in foreign currencies are translated into U.S. dollars using the current exchange rates at the close of each business day. The effect of changes in foreign currency exchange rates on investments is included within net realized and unrealized gain (loss) on investments. Changes in the value of other assets and liabilities as a result of fluctuations in foreign exchange rates are included in the Statement of Operations within net change in unrealized gain (loss) on foreign currency translation. Transactions denominated in foreign currencies are translated into U.S. dollars on the date the transaction occurred, the effects of which are included within net realized gain (loss) on foreign currency transactions.
|
| 3. INVESTMENTS AND FAIR VALUE MEASUREMENTS |
U.S. GAAP defines the fair value of a financial instrument as the amount that would be received to sell an asset or paid to transfer a liability in an orderly transaction between market participants at the measurement date (i.e., the exit price); the Fund’s policy is to use the market approach. GAAP establishes a fair value hierarchy that prioritizes the inputs to valuation techniques used to measure fair value. The hierarchy gives the highest priority to unadjusted quoted prices in active markets for identical assets or liabilities (Level 1 measurements) and the lowest priority to unobservable inputs (Level 3 measurements). The levels used for classifying investments are not necessarily an indication of the risk associated with investing in these investments. The three levels of the fair value hierarchy are described below:
Level 1 — Unadjusted quoted prices in active markets that are accessible at the measurement date for identical, unrestricted assets or liabilities;
Level 2 — Quoted prices in markets that are not active or financial instruments for which significant inputs are observable (including, but not limited to, quoted prices for similar investments, interest rates, foreign exchange rates, volatility and credit spreads), either directly or indirectly;
Level 3 — Prices or valuations that require significant unobservable inputs (including GSAM’s assumptions in determining fair value measurement).
The Board of Trustees (“Trustees”) has approved Valuation Procedures that govern the valuation of the portfolio investments held by the Fund, including investments for which market quotations are not readily available. The Trustees have delegated to GSAMday-to-day responsibility for implementing and maintaining internal controls and procedures related to the valuation of the Fund’s investments. To assess the continuing appropriateness of pricing sources and methodologies, GSAM regularly performs price verification procedures and issues challenges as necessary to third party pricing vendors or brokers, and any differences are reviewed in accordance with the Valuation Procedures.
A. Level 1 and Level 2 Fair Value Investments — The valuation techniques and significant inputs used in determining the fair values for investments classified as Level 1 and Level 2 are as follows:
Equity Securities — Equity securities traded on a United States (“U.S.”) securities exchange or the NASDAQ system, or those located on certain foreign exchanges, including but not limited to the Americas, are valued daily at their last sale price or official closing price on the principal exchange or system on which they are traded. If there is no sale or official closing price or such price is believed by GSAM to not represent fair value, equity securities are valued at the last bid price for long positions and at the last ask price for short positions. To the extent these investments are actively traded, they are classified as Level 1 of the fair value hierarchy, otherwise they are generally classified as Level 2.
Unlisted equity securities for which market quotations are available are valued at the last sale price on the valuation date, or if no sale occurs, at the last bid price, and are generally classified as Level 2. Securities traded on certain foreign securities exchanges
22
GOLDMAN SACHS GLOBAL INFRASTRUCTURE FUND
|
| 3. INVESTMENTS AND FAIR VALUE MEASUREMENTS (continued) |
are valued daily at fair value determined by an independent fair value service (if available) under Valuation Procedures approved by the Trustees and consistent with applicable regulatory guidance. The independent fair value service takes into account multiple factors including, but not limited to, movements in the securities markets, certain depositary receipts, futures contracts and foreign currency exchange rates that have occurred subsequent to the close of the foreign securities exchange. These investments are generally classified as Level 2 of the fair value hierarchy.
Money Market Funds — Investments in the Goldman Sachs Financial Square Government Fund (“Underlying Fund”) are valued at the NAV of the Institutional Share class on the day of valuation. These investments are generally classified as Level 1 of the fair value hierarchy. For information regarding the Underlying Fund’s accounting policies and investment holdings, please see the Underlying Fund’s shareholder report.
B. Level 3 Fair Value Investments — To the extent that significant inputs to valuation models and other alternative pricing sources are unobservable, or if quotations are not readily available, or if GSAM believes that such quotations do not accurately reflect fair value, the fair value of the Fund’s investments may be determined under Valuation Procedures approved by the Trustees. GSAM, consistent with its procedures and applicable regulatory guidance, may make an adjustment to the most recent valuation prices of either domestic or foreign securities in light of significant events to reflect what it believes to be the fair value of the securities at the time of determining the Fund’s NAV. To the extent investments are valued using single source broker quotations obtained directly from the broker or passed through from third party pricing vendors, such investments are classified as Level 3 investments. GSAM did not develop the unobservable inputs for valuation of Level 3 Assets and Liabilities.
C. Fair Value Hierarchy — The following is a summary of the Fund’s investments classified in the fair value hierarchy as of June 30, 2019:
| | | | | | | | | | | | |
|
| GLOBAL INFRASTRUCTURE FUND | |
| | | |
| Investment Type | | Level 1 | | | Level 2 | | | Level 3 | |
| | | |
| Assets | | | | | | | | | | | | |
| | | |
Common Stock and/or Other Equity Investments(a) | | | | | | | | | | | | |
| | | |
Asia | | $ | — | | | $ | 10,723,130 | | | $ | — | |
| | | |
Australia and Oceania | | | — | | | | 9,074,988 | | | | — | |
| | | |
Europe | | | 1,563,573 | | | | 45,211,507 | | | | — | |
| | | |
North America | | | 126,719,344 | | | | — | | | | — | |
| | | |
Investment Company | | | 1,375,678 | | | | — | | | | — | |
| | | |
| Total | | $ | 129,658,595 | | | $ | 65,009,625 | | | $ | — | |
| (a) | | Amounts are disclosed by continent to highlight the impact of time zone differences between local market close and the calculation of net asset value. Security valuations are based on the principal exchange or system on which they are traded, which may differ from country of domicile. The Fund utilizes fair value model prices provided by an independent third-party (fair value) service for certain international equity securities, resulting in a Level 2 classification. |
For further information regarding security characteristics, see the Schedule of Investments.
|
| 4. AGREEMENTS AND AFFILIATED TRANSACTIONS |
A. Management Agreement — Under the Agreement, GSAM manages the Fund, subject to the general supervision of the Trustees.
As compensation for the services rendered pursuant to the Agreement, the assumption of the expenses related thereto and administration of the Fund’s business affairs, including providing facilities, GSAM is entitled to a management fee, accrued daily
23
GOLDMAN SACHS GLOBAL INFRASTRUCTURE FUND
Notes to Financial Statements(continued)
June 30, 2019 (Unaudited)
|
| 4. AGREEMENTS AND AFFILIATED TRANSACTIONS (continued) |
and paid monthly, equal to an annual percentage rate of the Fund’s average daily net assets. For the six months ended June 30, 2019, contractual and effective net management fees with GSAM were at the following rates:
| | | | | | | | | | | | | | | | | | | | | | | | | | |
| Contractual Management Rate | | | | | | Effective Net
Management
Rate* | |
First
$1 billion | | | Next
$1 billion | | | Next
$3 billion | | | Next
$3 billion | | | Over
$8 billion | | | Effective
Rate | |
| | 0.90% | | | | 0.81% | | | | 0.77% | | | | 0.75% | | | | 0.74% | | | | 0.90% | | | | 0.90% | |
| * | | Effective Net Management Rate includes the impact of management fee waivers of affiliated underlying funds, if any. |
The Fund invests in Institutional Shares of the Goldman Sachs Financial Square Government Fund, which is an affiliated Underlying Fund. GSAM has agreed to waive a portion of its management fee payable by the Fund in an amount equal to the management fee it earns as an investment adviser to the affiliated Underlying Fund in which the Fund invests. For the six months ended June 30, 2019, GSAM waived $712 of the Fund’s management fee.
B. Distribution and/or Service (12b-1) Plans — The Trust, on behalf of Class A and Class R Shares of the Fund, has adopted Distribution and Service Plans subject to Rule 12b-1 under the Act. Under the Distribution and Service Plans, Goldman Sachs, which serves as distributor (the “Distributor”), is entitled to a fee accrued daily and paid monthly for distribution services and personal and account maintenance services, which may then be paid by Goldman Sachs to authorized dealers. These fees are equal to an annual percentage rate of the average daily net assets attributable to Class A or Class R Shares of the Fund, as applicable, as set forth below.
The Trust, on behalf of Class C Shares of the Fund, has adopted a Distribution Plan subject to Rule 12b-1 under the Act. Under the Distribution Plan, Goldman Sachs as Distributor is entitled to a fee accrued daily and paid monthly for distribution services, which may then be paid by Goldman Sachs to authorized dealers. These fees are equal to an annual percentage rate of the average daily net assets attributable to Class C Shares of the Fund, as set forth below.
| | | | | | | | | | | | |
| | | Distribution and/or Service Plans Rates | |
| | | Class A* | | | Class C | | | Class R* | |
Distribution and/or Service Plans | | | 0.25 | % | | | 0.75 | % | | | 0.50 | % |
| * | | With respect to Class A and Class R Shares, the Distributor at its discretion may use compensation for distribution services paid under the Distribution Plans to compensate service organizations for personal and account maintenance services and expenses as long as such total compensation does not exceed the maximum cap on “service fees” imposed by the Financial Industry Regulatory Authority. |
C. Distribution Agreement — Goldman Sachs, as Distributor of the shares of the Fund pursuant to a Distribution Agreement, may retain a portion of the Class A Shares’ front end sales charge and Class C Shares’ CDSC. For the six months ended June 30, 2019, Goldman Sachs retained $566 for Class A Shares and did not retain any portion of the CDSC for Class C Shares for this Fund.
D. Service Plan — The Trust, on behalf of the Fund, has adopted a Service Plan to allow Class C Shares to compensate service organizations (including Goldman Sachs) for providing varying levels of personal and account maintenance services to their customers who are beneficial owners of such shares. The Service Plan provides for compensation to the service organizations equal to an annual percentage rate of 0.25% of the average daily net assets attributable to Class C Shares of the Fund.
E. Transfer Agency Agreement— Goldman Sachs also serves as the transfer agent of the Fund for a fee pursuant to the Transfer Agency Agreement. The fees charged for such transfer agency services are accrued daily and paid monthly at annual rates as follows: 0.18% of the average daily net assets of Class A, Class C, Investor and Class R Shares; 0.03% of the average daily net assets of Class P and Class R6 Shares; and 0.04% of the average daily net assets of Institutional Shares.
Effective April 30, 2019, Goldman Sachs has agreed to waive a portion of the transfer agency fees equal to 0.03% of the average daily net assets attributable to Class A, Class C, Investor and Class R Shares of the Fund through at least April 30, 2020. Prior to such date, Goldman Sachs may not terminate the arrangement without approval of the Board of Trustees.
24
GOLDMAN SACHS GLOBAL INFRASTRUCTURE FUND
|
| 4. AGREEMENTS AND AFFILIATED TRANSACTIONS (continued) |
F. Other Expense Agreements and Affiliated Transactions — GSAM has agreed to reduce or limit certain “Other Expenses” of the Fund (excluding acquired fund fees and expenses, transfer agency fees and expenses, service fees and shareholder administration fees (as applicable), taxes, interest, brokerage fees, expenses of shareholder meetings, litigation and indemnification, and extraordinary expenses) to the extent such expenses exceed, on an annual basis, a percentage rate of the average daily net assets of the Fund. Such Other Expense reimbursements, if any, are accrued daily and paid monthly. In addition, the Fund is not obligated to reimburse GSAM for prior fiscal year expense reimbursements, if any. The Other Expense limitation as an annual percentage rate of average daily net assets for the Fund is 0.054%. These Other Expense limitations will remain in place through at least April 30, 2020 and prior to such date GSAM may not terminate the arrangement without the approval of the Trustees. In addition, the Fund has entered into certain offset arrangements with the transfer agent, which may result in a reduction of the Fund’s expenses and are received irrespective of the application of the “Other Expense” limitations described above.
For the six months ended June 30, 2019, these expense reductions, including any fee waivers and Other Expense reimbursements, were as follows:
| | | | | | | | | | | | | | |
Management
Fee Waiver | | | Transfer Agency
Waivers/Credits | | | Other Expense
Reimbursements | | | Total Expense
Reductions | |
| $ | 712 | | | $ | 235 | | | $ | 123,638 | | | $ | 124,585 | |
G. Line of Credit Facility — As of June 30, 2019, the Fund participated in a $580,000,000 committed, unsecured revolving line of credit facility (the “facility”) together with other funds of the Trust and certain registered investment companies having management agreements with GSAM or its affiliates. This facility is to be used for temporary emergency purposes, or to allow for an orderly liquidation of securities to meet redemption requests. The interest rate on borrowings is based on the federal funds rate. The facility also requires a fee to be paid by the Fund based on the amount of the commitment that has not been utilized. For the six months ended June 30, 2019, the Fund did not have any borrowings under the facility. Prior to April 30, 2019 the facility was $770,000,000.
H. Other Transactions with Affiliates — For the six months ended June 30, 2019, Goldman Sachs earned $739 in brokerage commissions from portfolio transactions, on behalf of the Fund.
The following table provides information about the Fund’s investments in the Underlying Fund as of and for the six months ended June 30, 2019:
| | | | | | | | | | | | | | | | | | | | |
| Underlying Fund | | Beginning
Value as of
December 31,
2018 | | Purchases
at Cost | | Proceeds
from Sales | | | Ending
Value as of
June 30,
2019 | | | Shares
as of
June 30,
2019 | | | Dividend
Income | |
Goldman Sachs Financial Square Government Fund — Institutional Shares | | $ — | | $20,374,491 | | $ | (18,998,813 | ) | | $ | 1,375,678 | | | | 1,375,678 | | | $ | 11,013 | |
As of June 30, 2019, the following Goldman Sachs Fund of Funds and Goldman Sachs Global Tax-Aware Equity Portfolios were beneficial owners of 5% or more of total outstanding shares of the Fund. The beneficial owners were 7%, 34%, 25%, 6%, 8%, 9% and 5%, for the Goldman Sachs Enhanced Dividend Global Equity, Goldman Sachs Tax-Advantaged Global Equity, Goldman Sachs Satellite Strategies, Goldman Sachs Equity Strategy, Goldman Sachs Growth Strategy, Goldman Sachs Growth and Income Strategy and Goldman Sachs Balanced Strategy Portfolios, respectively.
As of June 30, 2019, The Goldman Sachs Group, Inc. was the beneficial owner of approximately 34% of Institutional Shares and 100% of Class R Shares of the Fund.
|
| 5. PORTFOLIO SECURITIES TRANSACTIONS |
The cost of purchases and proceeds from sales and maturities oflong-term securities for the six months ended June 30, 2019, were $41,469,312 and $77,352,141.
25
GOLDMAN SACHS GLOBAL INFRASTRUCTURE FUND
Notes to Financial Statements(continued)
June 30, 2019 (Unaudited)
As of the Fund’s most recent fiscal year end, December 31, 2018, the Fund’s capital loss carryforwards and certain timing differences, on a tax-basis were as follows:
| | | | |
Capital loss carryforwards: | | | | |
PerpetualShort-Term | | $ | (5,052,140 | ) |
PerpetualLong-Term | | | (1,127,482 | ) |
Total Capital loss carryforwards | | $ | (6,179,622 | ) |
Timing differences (Post October Loss Deferral) | | $ | (1,356,757 | ) |
As of June 30, 2019, the Fund’s aggregate security unrealized gains and losses based on cost for U.S. federal income tax purposes were as follows:
| | | | |
Tax Cost | | $ | 168,429,416 | |
Gross unrealized gain | | | 33,119,240 | |
Gross unrealized loss | | | (6,880,436 | ) |
Net unrealized gains (losses) on securities | | $ | 26,238,804 | |
The difference between GAAP-basis and tax basis unrealized gains (losses) is attributable primarily to wash sales.
GSAM has reviewed the Fund’s tax positions for all open tax years (the current and prior three years, as applicable) and has concluded that no provision for income tax is required in the Fund’s financial statements. Such open tax years remain subject to examination and adjustment by tax authorities.
The Fund’s risks include, but are not limited to, the following:
Foreign Countries Risk — Investing in foreign markets may involve special risks and considerations not typically associated with investing in the United States. Foreign securities may be subject to risk of loss because of more or less foreign government regulation, less public information and less economic, political and social stability in the countries in which the Fund invests. The imposition of exchange controls (including repatriation restrictions), confiscations, trade restrictions (including tariffs) and other government restrictions by the United States or other governments, or from problems in share registration, settlement or custody, may also result in losses. Foreign risk also involves the risk of negative foreign currency rate fluctuations, which may cause the value of securities denominated in such foreign currency (or other instruments through which the Fund has exposure to foreign currencies) to decline in value. Currency exchange rates may fluctuate significantly over short periods of time.
Foreign Custody Risk — If the Fund invests in foreign securities, the Fund may hold such securities and cash with foreign banks, agents, and securities depositories appointed by the Fund’s custodian (each a “Foreign Custodian”). Some foreign custodians may be recently organized or new to the foreign custody business. In some countries, Foreign Custodians may be subject to little or no regulatory oversight over, or independent evaluation of, their operations. Further, the laws of certain countries may place limitations on the Fund’s ability to recover its assets if a Foreign Custodian enters bankruptcy.
Geographic Risk— If the Fund focuses its investments in securities of issuers located in a particular country or geographic region, the Fund may be subjected, to a greater extent than if its investments were less focused, to the risks of volatile economic cycles and/or conditions and developments that may be particular to that country or region, such as: adverse securities markets; adverse exchange rates; adverse social, political, regulatory, economic, business, environmental or other developments; or natural disasters.
Industry Concentration Risk — Concentrating Fund investments in a limited number of issuers conducting business in the same industry or group of industries will subject the Fund to a greater risk of loss as a result of adverse economic, business, political, environmental or other developments than if its investments were diversified across different industries.
26
GOLDMAN SACHS GLOBAL INFRASTRUCTURE FUND
|
| 7. OTHER RISKS (continued) |
Investments in Other Investment Companies Risk— As a shareholder of another investment company, the Fund will indirectly bear its proportionate share of any net management fees and other expenses paid by such other investment companies, in addition to the fees and expenses regularly borne by the Fund.
Large Shareholder Transactions Risk — The Fund may experience adverse effects when certain large shareholders, such as other funds, institutional investors (including those trading by use of non-discretionary mathematical formulas), financial intermediaries (who may make investment decisions on behalf of underlying clients and/or include the Fund in their investment model), individuals, accounts and Goldman Sachs affiliates, purchase or redeem large amounts of shares of the Fund. Such large shareholder redemptions, which may occur rapidly or unexpectedly, may cause the Fund to sell portfolio securities at times when it would not otherwise do so, which may negatively impact the Fund’s NAV and liquidity. These transactions may also accelerate the realization of taxable income to shareholders if such sales of investments resulted in gains, and may also increase transaction costs. In addition, a large redemption could result in the Fund’s current expenses being allocated over a smaller asset base, leading to an increase in the Fund’s expense ratio. Similarly, large Fund share purchases may adversely affect the Fund’s performance to the extent that the Fund is delayed in investing new cash or otherwise maintains a larger cash position than it ordinarily would.
Liquidity Risk — The Fund may make investments that are illiquid or that may become less liquid in response to market developments or adverse investor perceptions. Illiquid investments may be more difficult to value. Liquidity risk may also refer to the risk that the Fund will not be able to pay redemption proceeds within the allowable time period or without significant dilution to remaining investors’ interests because of unusual market conditions, an unusually high volume of redemption requests, or other reasons. To meet redemption requests, the Fund may be forced to sell investments at an unfavorable time and/or under unfavorable conditions. If the Fund is forced to sell securities at an unfavorable time and/or under unfavorable conditions, such sales may adversely affect the Fund’s NAV and dilute remaining investors’ interests. These risks may be more pronounced in connection with the Fund’s investments in securities of issuers located in emerging market countries. Redemptions by large shareholders may have a negative impact on the Fund’s liquidity.
Market and Credit Risks— In the normal course of business, the Fund trades financial instruments and enters into financial transactions where risk of potential loss exists due to changes in the market (market risk). Additionally, the Fund may also be exposed to credit risk in the event that an issuer or guarantor fails to perform or that an institution or entity with which the Fund has unsettled or open transactions defaults.
Master Limited Partnership Risk — Investments in securities of MLPs involve risks that differ from investments in common stock, including risks related to limited control and limited rights to vote on matters affecting the MLP, risks related to potential conflicts of interest between the MLP and the MLP’s general partner, cash flow risks, dilution risks, limited liquidity and risks related to the general partner’s right to require unit-holders to sell their common units at an undesirable time or price.
Non-Diversification Risk — The Fund is non-diversified, meaning that it is permitted to invest a larger percentage of its assets in fewer issuers than diversified mutual funds. Thus, the Fund may be more susceptible to adverse developments affecting any single issuer held in its portfolio, and may be more susceptible to greater losses because of these developments.
Under the Trust’s organizational documents, its Trustees, officers, employees and agents are indemnified, to the extent permitted by the Act and state law, against certain liabilities that may arise out of performance of their duties to the Fund. Additionally, in the course of business, the Fund enters into contracts that contain a variety of indemnification clauses. The Fund’s maximum exposure under these arrangements is unknown, as this would involve future claims that may be made against the Fund that have not yet occurred. However, GSAM believes the risk of loss under these arrangements to be remote.
27
GOLDMAN SACHS GLOBAL INFRASTRUCTURE FUND
Notes to Financial Statements(continued)
June 30, 2019 (Unaudited)
Subsequent events after the Statement of Assets and Liabilities date have been evaluated, and GSAM has concluded that there is no impact requiring adjustment or disclosure in the financial statements.
|
| 10. SUMMARY OF SHARE TRANSACTIONS |
Share activity is as follows:
| | | | | | | | | | | | | | | | |
| | | For the Six Months Ended
June 30, 2019
(Unaudited) | | | For the Fiscal Year Ended
December 31, 2018 | |
| | | Shares | | | Dollars | | | Shares | | | Dollars | |
| | | | |
| Class A Shares | | | | | | | | | | | | | | | | |
Shares sold | | | 10,599 | | | $ | 115,867 | | | | 152,177 | | | $ | 1,589,200 | |
Reinvestment of distributions | | | 1,571 | | | | 18,018 | | | | 1,992 | | | | 20,288 | |
Shares redeemed | | | (31,663 | ) | | | (353,027 | ) | | | (15,661 | ) | | | (162,317 | ) |
| | | | (19,493 | ) | | | (219,142 | ) | | | 138,508 | | | | 1,447,171 | |
| Class C Shares | | | | | | | | | | | | | | | | |
Shares sold | | | 66,771 | | | | 735,781 | | | | 149,215 | | | | 1,561,262 | |
Reinvestment of distributions | | | 1,822 | | | | 20,913 | | | | 1,452 | | | | 14,805 | |
Shares redeemed | | | (4,628 | ) | | | (50,800 | ) | | | (12,536 | ) | | | (129,231 | ) |
| | | | 63,965 | | | | 705,894 | | | | 138,131 | | | | 1,446,836 | |
| Institutional Shares | | | | | | | | | | | | | | | | |
Shares sold | | | 57,561 | | | | 651,458 | | | | 1,137,450 | | | | 12,353,955 | |
Reinvestment of distributions | | | 1,072 | | | | 12,401 | | | | 3,227 | | | | 32,946 | |
Shares redeemed | | | (141,515 | ) | | | (1,410,969 | ) | | | (21,470,145 | ) | | | (217,379,579 | ) |
| | | | (82,882 | ) | | | (747,110 | ) | | | (20,329,468 | ) | | | (204,992,678 | ) |
| Investor Shares | | | | | | | | | | | | | | | | |
Shares sold | | | 25,158 | | | | 284,999 | | | | 25,959 | | | | 274,026 | |
Reinvestment of distributions | | | 651 | | | | 7,493 | | | | 513 | | | | 5,228 | |
Shares redeemed | | | — | | | | — | | | | (313 | ) | | | (3,100 | ) |
| | | | 25,809 | | | | 292,492 | | | | 26,159 | | | | 276,154 | |
| Class P Shares(a) | | | | | | | | | | | | | | | | |
Shares sold | | | 19,461 | | | | 217,500 | | | | 767,142 | | | | 7,855,477 | |
Reinvestment of distributions | | | 3,471 | | | | 39,836 | | | | 6,831 | | | | 69,243 | |
Shares redeemed | | | (7,045 | ) | | | (76,689 | ) | | | (538,568 | ) | | | (5,289,881 | ) |
| | | | 15,887 | | | | 180,647 | | | | 235,405 | | | | 2,634,839 | |
| Class R Shares | | | | | | | | | | | | | | | | |
Reinvestment of distributions | | | 30 | | | | 342 | | | | 35 | | | | 357 | |
| | | | 30 | | | | 342 | | | | 35 | | | | 357 | |
| Class R6 Shares | | | | | | | | | | | | | | | | |
Shares sold | | | 1,393,642 | | | | 15,479,901 | | | | 24,375,895 | | | | 247,320,814 | |
Reinvestment of distributions | | | 239,463 | | | | 2,746,063 | | | | 415,361 | | | | 4,232,791 | |
Shares redeemed | | | (4,466,040 | ) | | | (50,321,796 | ) | | | (5,867,364 | ) | | | (60,188,681 | ) |
| | | | (2,832,935 | ) | | | (32,095,832 | ) | | | 18,923,892 | | | | 191,364,924 | |
| | | | |
NET DECREASE | | | (2,829,619 | ) | | $ | (31,882,709 | ) | | | (867,338 | ) | | $ | (7,822,397 | ) |
| (a) | | Class P Shares commenced operations on April 17, 2018. |
28
GOLDMAN SACHS GLOBAL INFRASTRUCTURE FUND
| | |
| | |
Fund Expenses — Six Month Period Ended June 30, 2019 (Unaudited) | | |
As a shareholder of Class A, Class C, Institutional, Investor, Class P, Class R or Class R6 Shares of the Fund, you incur two types of costs: (1) transaction costs, including sales charges on purchase payments (with respect to Class A Shares) and contingent deferred sales charges on redemptions (with respect to Class C Shares); and (2) ongoing costs, including management fees; distribution and service (12b-1) fees (with respect to Class A, Class C and Class R Shares); and other Fund expenses. This Example is intended to help you understand your ongoing costs (in dollars) of investing in Class A, Class C, Institutional, Investor, Class P, Class R and Class R6 Shares of the Fund and to compare these costs with the ongoing costs of investing in other mutual funds.
The Example is based on an investment of $1,000 invested at the beginning of the period and held for the entire period from January 1, 2019 through June 30, 2019, which represents a period of 181 days in a 365 day year.
Actual Expenses — The first line under each share class in the table below provides information about actual account values and actual expenses. You may use the information in this line, together with the amount you invested, to estimate the expenses that you paid over the period. Simply divide your account value by $1,000 (for example, an $8,600 account value divided by $1,000=8.6), then multiply the result by the number in the first line under the heading entitled “Expenses Paid” to estimate the expenses you paid on your account during this period.
Hypothetical Example for Comparison Purposes — The second line under each share class in the table below provides information about hypothetical account values and hypothetical expenses based on the Fund’s actual net expense ratio and an assumed rate of return of 5% per year before expenses, which is not the Fund’s actual return. The hypothetical account values and expenses may not be used to estimate the actual ending account balance or expenses you paid for the period. You may use this information to compare the ongoing costs of investing in the Fund and other funds. To do so, compare this 5% hypothetical example with the 5% hypothetical examples that appear in the shareholder reports of the other funds.
Please note that the expenses shown in the table are meant to highlight your ongoing costs only and do not reflect any transactional costs, such as sales charges, redemption fees, or exchange fees. Therefore, the second line of the table is useful in comparing ongoing costs only, and will not help you determine the relative total costs of owning different funds. In addition, if these transactional costs were included, your costs would have been higher.
| | | | | | | | | | | | |
| | | Global Infrastructure Fund | |
| Share Class | | Beginning
Account Value
1/1/19 | | | Ending
Account Value
6/30/19 | | | Expenses
Paid for the
6 months
ended 6/30/19* | |
| Class A | | | | | | | | | | | | |
Actual | | $ | 1,000.00 | | | $ | 1,221.60 | | | $ | 7.55 | |
Hypothetical 5% return | | | 1,000.00 | | | | 1,018.00 | + | | | 6.85 | |
| Class C | | | | | | | | | | | | |
Actual | | | 1,000.00 | | | | 1,216.50 | | | | 11.65 | |
Hypothetical 5% return | | | 1,000.00 | | | | 1,014.28 | + | | | 10.59 | |
| Institutional | | | | | | | | | | | | |
Actual | | | 1,000.00 | | | | 1,223.00 | | | | 5.46 | |
Hypothetical 5% return | | | 1,000.00 | | | | 1,019.89 | + | | | 4.96 | |
| Investor | | | | | | | | | | | | |
Actual | | | 1,000.00 | | | | 1,221.80 | | | | 6.17 | |
Hypothetical 5% return | | | 1,000.00 | | | | 1,019.24 | + | | | 5.61 | |
| Class P | | | | | | | | | | | | |
Actual | | | 1,000.00 | | | | 1,223.80 | | | | 5.40 | |
Hypothethical 5% return | | | 1,000.00 | | | | 1,019.93 | + | | | 4.91 | |
| Class R | | | | | | | | | | | | |
Actual | | | 1,000.00 | | | | 1,219.00 | | | | 8.97 | |
Hypothetical 5% return | | | 1,000.00 | | | | 1,016.71 | + | | | 8.15 | |
| Class R6 | | | | | | | | | | | | |
Actual | | | 1,000.00 | | | | 1,222.50 | | | | 5.40 | |
Hypothetical 5% return | | | 1,000.00 | | | | 1,019.93 | + | | | 4.91 | |
| | + | | Hypothetical expenses are based on the Fund’s actual annualized net expense ratios and an assumed rate of return of 5% per year before expenses. | |
| | * | | Expenses for each share class are calculated using the Fund’s annualized net expense ratio for each class, which represents the ongoing expenses as a percentage of net assets for the six months ended June 30, 2019. Expenses are calculated by multiplying the annualized net expense ratio by the average account value for the period; then multiplying the result by the number of days in the most recent fiscal half year; and then dividing that result by the number of days in the fiscal year. The annualized net expense ratios for the period were as follows: | |
| | | | | | | | | | | | | | |
| Fund | | Class A | | Class C | | Institutional | | Investor | | Class P | | Class R | | Class R6 |
Global Infrastructure Fund | | 1.37% | | 2.12% | | 0.99% | | 1.12% | | 0.98% | | 1.63% | | 0.98% |
29
GOLDMAN SACHS GLOBAL INFRASTRUCTURE FUND
Statement Regarding Basis for Approval of Management Agreement (Unaudited)
Background
The Goldman Sachs Global Infrastructure Fund (the “Fund”) is an investment portfolio of Goldman Sachs Trust (the “Trust”). The Board of Trustees oversees the management of the Trust and reviews the investment performance and expenses of the Fund at regularly scheduled meetings held throughout the year. In addition, the Board of Trustees determines annually whether to approve the continuance of the Trust’s investment management agreement (the “Management Agreement”) with Goldman Sachs Asset Management, L.P. (the “Investment Adviser”) on behalf of the Fund.
The Management Agreement was most recently approved for continuation until June 30, 2020 by the Board of Trustees, including those Trustees who are not parties to the Management Agreement or “interested persons” (as defined in the Investment Company Act of 1940, as amended) of any party thereto (the “Independent Trustees”), at a meeting held onJune 11-12, 2019 (the “Annual Meeting”).
The review process undertaken by the Trustees spans the course of the year and culminates with the Annual Meeting. To assist the Trustees in their deliberations, the Trustees have established a Contract Review Committee (the “Committee”), comprised of the Independent Trustees. The Committee held four meetings over the course of the year since the Management Agreement was last approved. At those Committee meetings, regularly scheduled Board or other committee meetings, and/or the Annual Meeting, matters relevant to the renewal of the Management Agreement were considered by the Board, or the Independent Trustees, as applicable. With respect to the Fund, such matters included:
| | (a) | | the nature and quality of the advisory, administrative, and other services provided to the Fund by the Investment Adviser and its affiliates, including information about: |
| | (i) | | the structure, staff, and capabilities of the Investment Adviser and its portfolio management teams; |
| | (ii) | | the groups within the Investment Adviser and its affiliates that support the portfolio management teams or provide other types of necessary services, including fund services groups (e.g., accounting and financial reporting, tax, shareholder services, and operations); controls and risk management groups (e.g., legal, compliance, valuation oversight, credit risk management, internal audit, compliance testing, market risk analysis, finance, and central funding); sales and distribution support groups, and others (e.g., information technology and training); |
| | (iii) | | trends in employee headcount; |
| | (iv) | | the Investment Adviser’s financial resources and ability to hire and retain talented personnel and strengthen its operations; and |
| | (v) | | the parent company’s support of the Investment Adviser and its mutual fund business, as expressed by the firm’s senior management; |
| | (b) | | information on the investment performance of the Fund, including comparisons to the performance of similar mutual funds, as provided by a third-party mutual fund data provider engaged as part of the contract review process (the “Outside Data Provider”), and a benchmark performance index; and information on general investment outlooks in the markets in which the Fund invests; |
| | (c) | | information provided by the Investment Adviser indicating the Investment Adviser’s views on whether the Fund’s peer group and/or benchmark index had high, medium, or low relevance given the Fund’s particular investment strategy; |
| | (d) | | the terms of the Management Agreement and other agreements with affiliated service providers entered into by the Trust on behalf of the Fund; |
| | (e) | | fee and expense information for the Fund, including: |
| | (i) | | the relative management fee and expense levels of the Fund as compared to those of comparable funds managed by other advisers, as provided by the Outside Data Provider; |
| | (ii) | | the Fund’s expense trends over time; and |
| | (iii) | | to the extent the Investment Adviser manages other types of accounts (such as bank collective trusts, private wealth management accounts, institutional separate accounts,sub-advised mutual funds, andnon-U.S. funds) having investment objectives and policies similar to those of the Fund, comparative information on the advisory fees charged and services provided to those accounts by the Investment Adviser; |
| | (f) | | with respect to the extensive investment performance and expense comparison data provided by the Outside Data Provider, its processes in producing that data for the Fund; |
| | (g) | | the undertakings of the Investment Adviser and its affiliates to implement fee waivers and/or expense limitations; |
| | (h) | | information relating to the profitability of the Management Agreement and the transfer agency and distribution and service arrangements of the Fund to the Investment Adviser and its affiliates; |
| | (i) | | whether the Fund’s existing management fee schedule adequately addressed any economies of scale; |
30
GOLDMAN SACHS GLOBAL INFRASTRUCTURE FUND
Statement Regarding Basis for Approval of Management Agreement (Unaudited) (continued)
| | (j) | | a summary of the“fall-out” benefits derived by the Investment Adviser and its affiliates from their relationships with the Fund, including the fees received by the Investment Adviser’s affiliates from the Fund for transfer agency, portfolio trading, distribution and other services; |
| | (k) | | a summary of potential benefits derived by the Fund as a result of its relationship with the Investment Adviser; |
| | (l) | | information regarding commissions paid by the Fund and broker oversight, an update on the Investment Adviser’s soft dollars practices, other information regarding portfolio trading, and how the Investment Adviser carries out its duty to seek best execution; |
| | (m) | | portfolio manager ownership of Fund shares; the manner in which portfolio manager compensation is determined; and the number and types of accounts managed by the portfolio managers; |
| | (n) | | the nature and quality of the services provided to the Fund by its unaffiliated service providers, and the Investment Adviser’s general oversight and evaluation (including reports on due diligence) of those service providers as part of the administrative services provided under the Management Agreement; and |
| | (o) | | the Investment Adviser’s processes and policies addressing various types of potential conflicts of interest; its approach to risk management; the annual review of the effectiveness of the Fund’s compliance program; and periodic compliance reports. |
The Trustees also received an overview of the Fund’s distribution arrangements. They received information regarding the Fund’s assets, share purchase and redemption activity, and payment of distribution and service fees. Information was also provided to the Trustees relating to revenue sharing payments made by and services provided by the Investment Adviser and its affiliates to intermediaries that promote the sale, distribution, and/or servicing of Fund shares. The Independent Trustees also discussed the broad range of other investment choices that are available to Fund investors, including the availability of comparable funds managed by other advisers.
The presentations made at the Board and Committee meetings and at the Annual Meeting encompassed the Fund and other mutual funds for which the Board of Trustees has responsibility. In evaluating the Management Agreement at the Annual Meeting, the Trustees relied upon their knowledge, resulting from their meetings and other interactions throughout the year, of the Investment Adviser and its affiliates, their services, and the Fund. In conjunction with these meetings, the Trustees received written materials and oral presentations on the topics covered, and the Investment Adviser addressed the questions and concerns of the Trustees, including concerns regarding the investment performance of certain of the funds they oversee. The Independent Trustees were advised by their independent legal counsel regarding their responsibilities and other regulatory requirements related to the approval and continuation of mutual fund investment management agreements under applicable law. In addition, the Investment Adviser and its affiliates provided the Independent Trustees with a written response to a formal request for information sent on behalf of the Independent Trustees by their independent legal counsel. During the course of their deliberations, the Independent Trustees met in executive sessions with their independent legal counsel, without representatives of the Investment Adviser or its affiliates present.
Nature, Extent, and Quality of the Services Provided Under the Management Agreement
As part of their review, the Trustees considered the nature, extent, and quality of the services provided to the Fund by the Investment Adviser. In this regard, the Trustees considered both the investment advisory services andnon-advisory services that are provided by the Investment Adviser and its affiliates. The Trustees noted the transition in the leadership and changes in personnel of various of the Investment Adviser’s portfolio management teams that had occurred in recent periods, and the ongoing recruitment efforts aimed at bringing high quality investment talent to the Investment Adviser. They also noted the Investment Adviser’s commitment to maintaining high quality systems and expending substantial resources to respond to ongoing changes to the regulatory and control environment in which the Fund and its service providers operate, as well as the efforts of the Investment Adviser and its affiliates to combat cyber security risks. The Trustees concluded that the Investment Adviser continued to commit substantial financial and operational resources to the Fund and expressed confidence that the Investment Adviser would continue to do so in the future. The Trustees also recognized that the Investment Adviser had made significant commitments to address regulatory compliance requirements applicable to the Fund and the Investment Adviser and its affiliates.
Investment Performance
The Trustees also considered the investment performance of the Fund. In this regard, they compared the investment performance of the Fund to its peers usingrankings compiled by the Outside Data Provider as of December 31, 2018, and updated performance information prepared by the Investment Adviser using the peer group identified by the Outside DataProvider as of March 31, 2019. The information on the Fund’s investment performance was provided for theone-year period ending on the applicable dates. The Trustees also reviewed the Fund’s investment performance relative to its performance benchmark. As part of this review, they
31
GOLDMAN SACHS GLOBAL INFRASTRUCTURE FUND
Statement Regarding Basis for Approval of Management Agreement (Unaudited) (continued)
considered the investment performance trends of the Fund over time, and reviewed the investment performance of the Fund in light of its investment objective and policies and market conditions.
In addition, the Trustees considered materials prepared and presentations made by the Investment Adviser’s senior management and portfolio management personnel in which Fund performance was assessed. The Trustees also considered the Investment Adviser’s periodic reports with respect to the Fund’s risk profile, and how the Investment Adviser’s approach to risk monitoring and management influences portfolio management.
The Trustees noted that the Fund’s Institutional Shares had placed in the top half of the Fund’s peer group and had underperformed the Fund’s benchmark index for theone-year period ended March 31, 2019.
Costs of Services Provided and Competitive Information
The Trustees considered the contractual terms of the Management Agreement and the fee rates payable by the Fund thereunder. In this regard, the Trustees considered information on the services rendered by the Investment Adviser to the Fund, which included both advisory and administrative services that were directed to the needs and operations of the Fund as a registered mutual fund.
In particular, the Trustees reviewed analyses prepared by the Outside Data Provider regarding the expense rankings of the Fund. The analyses provided a comparison of the Fund’s management fee and breakpoints to those of a relevant peer group and category universe; an expense analysis which compared the Fund’s overall net and gross expenses to a peer group and a category universe; and data comparing the Fund’s net expenses to the peer and category medians. The analyses also compared the Fund’s other expenses and fee waivers/reimbursements to those of the peer group and category medians. The Trustees concluded that the comparisons provided by the Outside Data Provider were useful in evaluating the reasonableness of the management fees and total expenses paid by the Fund.
In addition, the Trustees considered the Investment Adviser’s undertakings to implement fee waivers and/or expense limitations. The Trustees also noted that certain changes were being made to existing fee waiver or expense limitation arrangements of the Fund that would have the effect of increasing expenses of Class A, Class C, Investor, and Class R Shares of the Fund, with such changes taking effect in connection with the Fund’s next annual registration statement update. They also considered, to the extent that the Investment Adviser manages other types of accounts having investment objectives and policies similar to those of the Fund, comparative fee information for services provided by the Investment Adviser to those accounts, and information that indicated that services provided to the Fund differed in various significant respects from the services provided to other types of accounts which, in many cases, operated under less stringent legal and regulatory structures, required fewer services from the Investment Adviser to a smaller number of client contact points, and were less time-intensive.
In addition, the Trustees noted that shareholders are able to redeem their Fund shares at any time if shareholders believe that the Fund fees and expenses are too high or if they are dissatisfied with the performance of the Fund.
Profitability
The Trustees reviewed the Fund’s contribution to the Investment Adviser’s revenues andpre-tax profit margins. In this regard the Trustees noted that they had received, among other things, profitability analyses and summaries, revenue and expense schedules by Fund and by function (i.e., investment management, transfer agency and distribution and service), and information on the Investment Adviser’s expense allocation methodology. They observed that the profitability and expense figures are substantially similar to those used by the Investment Adviser for many internal purposes, including compensation decisions among various business groups, and are thus subject to a vigorous internal debate about how certain revenue and expenses should be allocated. The Trustees also noted that the internal audit group within the Goldman Sachs organization periodically audits the expense allocation methodology and that the internal audit group was satisfied with the reasonableness, consistency, and accuracy of the Investment Adviser’s expense allocation methodology. Profitability data for the Fund was provided for 2018 and 2017, and the Trustees considered this information in relation to the Investment Adviser’s overall profitability.
32
GOLDMAN SACHS GLOBAL INFRASTRUCTURE FUND
Statement Regarding Basis for Approval of Management Agreement (Unaudited) (continued)
Economies of Scale
The Trustees considered the information that had been provided regarding whether there have been economies of scale with respect to the management of the Fund. The Trustees also considered the breakpoints in the fee rate payable under the Management Agreement for the Fund at the following annual percentage rates of the average daily net assets of the Fund:
| | | | |
| |
First $1 billion | | | 0.90 | % |
| |
Next $1 billion | | | 0.81 | |
| |
Next $3 billion | | | 0.77 | |
| |
Next $3 billion | | | 0.75 | |
| |
Over $8 billion | | | 0.74 | |
The Trustees noted that the breakpoints were designed to share potential economies of scale, if any, with the Fund and its shareholders as assets under management reach those asset levels. The Trustees considered the amounts of assets in the Fund; the Fund’s recent share purchase and redemption activity; the information provided by the Investment Adviser relating to the costs of the services provided by the Investment Adviser and its affiliates and their realized profits; information comparing fee rates charged by the Investment Adviser with fee rates charged to other funds in the peer group; the transfer agent’s undertaking to waive certain fees and the Investment Adviser’s undertaking to limit certain expenses of the Fund that exceed a specified level. Upon reviewing these matters at the Annual Meeting, the Trustees concluded that the fee breakpoints represented a means of assuring that benefits of scalability, if any, would be passed along to shareholders at the specified asset levels.
Other Benefits to the Investment Adviser and Its Affiliates
The Trustees also considered the other benefits derived by the Investment Adviser and its affiliates from their relationships with the Fund as stated above, including: (a) transfer agency fees received by Goldman Sachs & Co. LLC (“Goldman Sachs”); (b) brokerage and futures commissions earned by Goldman Sachs for executing securities and futures transactions on behalf of the Fund; (c) research received by the Investment Adviser from broker-dealers in exchange for executing certain transactions on behalf of the Fund; (d) trading efficiencies resulting from aggregation of orders of the Fund with those for other funds or accounts managed by the Investment Adviser; (e) the Investment Adviser’s ability to leverage the infrastructure designed to service the Fund on behalf of its other clients; (f) the Investment Adviser’s ability to cross-market other products and services to Fund shareholders; (g) Goldman Sachs’ retention of certain fees as Fund Distributor; (h) the Investment Adviser’s ability to negotiate better pricing with custodians on behalf of its other clients, as a result of the relationship with the Fund; and (i) the possibility that the working relationship between the Investment Adviser and the Fund’s third-party service providers may cause those service providers to be more likely to do business with other areas of Goldman Sachs. In the course of considering the foregoing, the Independent Trustees requested and received further information quantifying certain of thesefall-out benefits.
Other Benefits to the Fund and Its Shareholders
The Trustees also noted that the Fund receives certain other potential benefits as a result of its relationship with the Investment Adviser, including: (a) trading efficiencies resulting from aggregation of orders of the Fund with those of other funds or accounts managed by the Investment Adviser; (b) enhanced servicing from vendors due to the volume of business generated by the Investment Adviser and its affiliates; (c) enhanced servicing from broker-dealers due to the volume of business generated by the Investment Adviser and its affiliates; (d) the Investment Adviser’s ability to negotiate favorable terms with derivatives counterparties on behalf of the Fund as a result of the size and reputation of the Goldman Sachs organization; (e) the advantages received from the Investment Adviser’s knowledge and experience gained from managing other accounts and products; (f) the Investment Adviser’s ability to hire and retain qualified personnel to provide services to the Fund because of the reputation of the Goldman Sachs organization; (g) the Fund’s access, through the Investment Adviser, to certain firm-wide resources (e.g., proprietary risk management systems and databases), subject to certain restrictions; and (h) the Fund’s access to certain affiliated distribution channels. In addition, the Trustees noted the competitive nature of the mutual fund marketplace, and considered that many of the Fund’s shareholders invested in the Fund in part because of the Fund’s relationship with the Investment Adviser and that those shareholders have a general expectation that the relationship will continue.
Conclusion
In connection with their consideration of the Management Agreement, the Trustees gave weight to each of the factors described above, but did not identify any particular factor as controlling their decision. After deliberation and consideration of all of the information provided, including the factors described above, the Trustees concluded, in the exercise of their business judgment, that the management fees paid by the Fund were reasonable in light of the services provided to it by the Investment
33
GOLDMAN SACHS GLOBAL INFRASTRUCTURE FUND
Statement Regarding Basis for Approval of Management Agreement (Unaudited) (continued)
Adviser, the Investment Adviser’s costs and the Fund’s current and reasonably foreseeable asset levels. The Trustees unanimously concluded that the Investment Adviser’s continued management likely would benefit the Fund and its shareholders and that the Management Agreement should be approved and continued with respect to the Fund until June 30, 2020.
34
FUNDS PROFILE
Goldman Sachs Funds
Goldman Sachs is a premier financial services firm, known since 1869 for creating thoughtful and customized investment solutions in complex global markets.
Today, theInvestment Management Division of Goldman Sachs serves a diverse set of clients worldwide, including private institutions, public entities and individuals. With approximately $1.44 trillion in assets under supervision as of June 30, 2019, Goldman Sachs Asset Management (“GSAM”) has portfolio management teams located around the world and our investment professionals bring firsthand knowledge of local markets to every investment decision. Assets under supervision includes assets under management and other client assets for which Goldman Sachs does not have full discretion. GSAM leverages the resources of Goldman Sachs & Co. LLC subject to legal, internal and regulatory restrictions.
Money Market
Financial Square FundsSM
| ∎ | | Financial Square Treasury Solutions Fund1 |
| ∎ | | Financial Square Government Fund1 |
| ∎ | | Financial Square Money Market Fund2 |
| ∎ | | Financial Square Prime Obligations Fund2 |
| ∎ | | Financial Square Treasury Instruments Fund1 |
| ∎ | | Financial Square Treasury Obligations Fund1 |
| ∎ | | Financial Square Federal Instruments Fund1 |
Investor FundsSM
| ∎ | | Investor Money Market Fund3 |
| ∎ | | Investor Tax-Exempt Money Market Fund3 |
Fixed Income
Short Duration and Government
| ∎ | | High Quality Floating Rate Fund |
| ∎ | | Short-Term Conservative Income Fund |
| ∎ | | Short Duration Government Fund |
| ∎ | | Short Duration Income Fund |
| ∎ | | Inflation Protected Securities Fund |
Multi-Sector
Municipal and Tax-Free
| ∎ | | High Yield Municipal Fund |
| ∎ | | Dynamic Municipal Income Fund |
| ∎ | | Short Duration Tax-Free Fund |
| ∎ | | Municipal Income Completion Fund |
Single Sector
| ∎ | | Investment Grade Credit Fund |
| ∎ | | High Yield Floating Rate Fund |
| ∎ | | Emerging Markets Debt Fund |
| ∎ | | Local Emerging Markets Debt Fund |
Fixed Income Alternatives
| ∎ | | Long Short Credit Strategies Fund |
Fundamental Equity
| ∎ | | Small/Mid Cap Value Fund |
| ∎ | | Small/Mid Cap Growth Fund |
| ∎ | | Concentrated Growth Fund |
| ∎ | | Technology Opportunities Fund |
| ∎ | | Growth Opportunities Fund |
| ∎ | | Rising Dividend Growth Fund |
Tax-Advantaged Equity
| ∎ | | U.S. Tax-Managed Equity Fund |
| ∎ | | International Tax-Managed Equity Fund |
| ∎ | | U.S. Equity Dividend and Premium Fund |
| ∎ | | International Equity Dividend and Premium Fund |
Equity Insights
| ∎ | | Small Cap Equity Insights Fund |
| ∎ | | U.S. Equity Insights Fund |
| ∎ | | Small Cap Growth Insights Fund |
| ∎ | | Large Cap Growth Insights Fund |
| ∎ | | Large Cap Value Insights Fund |
| ∎ | | Small Cap Value Insights Fund |
| ∎ | | International Small Cap Insights Fund |
| ∎ | | International Equity Insights Fund |
| ∎ | | Emerging Markets Equity Insights Fund |
Fundamental Equity International
| ∎ | | International Equity Income Fund |
| ∎ | | International Equity ESG Fund |
| ∎ | | Emerging Markets Equity Fund |
| ∎ | | Imprint Emerging Markets Opportunities Fund5 |
| ∎ | | ESG Emerging Markets Equity Fund |
Alternative
| ∎ | | Real Estate Securities Fund |
| ∎ | | International Real Estate Securities Fund |
| ∎ | | Commodity Strategy Fund |
| ∎ | | Global Real Estate Securities Fund |
| ∎ | | Alternative Premia Fund |
| ∎ | | Absolute Return Tracker Fund |
| ∎ | | Managed Futures Strategy Fund |
| ∎ | | MLP Energy Infrastructure Fund |
| ∎ | | Multi-Manager Alternatives Fund |
| ∎ | | Absolute Return Multi-Asset Fund |
| ∎ | | Global Infrastructure Fund |
Total Portfolio Solutions
| ∎ | | Global Managed Beta Fund |
| ∎ | | Multi-Manager Non-Core Fixed Income Fund |
| ∎ | | Multi-Manager U.S. Dynamic Equity Fund |
| ∎ | | Multi-Manager Global Equity Fund |
| ∎ | | Multi-Manager International Equity Fund |
| ∎ | | Tactical Tilt Overlay Fund |
| ∎ | | Balanced Strategy Portfolio |
| ∎ | | Multi-Manager U.S. Small Cap Equity Fund |
| ∎ | | Multi-Manager Real Assets Strategy Fund |
| ∎ | | Growth and Income Strategy Portfolio |
| ∎ | | Growth Strategy Portfolio |
| ∎ | | Dynamic Global Equity Fund4 |
| ∎ | | Satellite Strategies Portfolio |
| ∎ | | Enhanced Dividend Global Equity Portfolio |
| ∎ | | Tax-Advantaged Global Equity Portfolio |
| ∎ | | Strategic Factor Allocation Fund |
| ∎ | | Target Date 2020 Portfolio |
| ∎ | | Target Date 2025 Portfolio |
| ∎ | | Target Date 2030 Portfolio |
| ∎ | | Target Date 2035 Portfolio |
| ∎ | | Target Date 2040 Portfolio |
| ∎ | | Target Date 2045 Portfolio |
| ∎ | | Target Date 2050 Portfolio |
| ∎ | | Target Date 2055 Portfolio |
| ∎ | | Target Date 2060 Portfolio |
| ∎ | | GQG Partners International Opportunities Fund |
| 1 | | You could lose money by investing in the Fund. Although the Fund seeks to preserve the value of your investment at $1.00 per share, it cannot guarantee it will do so. An investment in the Fund is not a deposit of a bank and is not insured or guaranteed by the Federal Deposit Insurance Corporation or any other government agency. The Fund’s sponsor has no legal obligation to provide financial support to the Fund, and you should not expect that the sponsor will provide financial support to the Fund at any time. |
| 2 | | You could lose money by investing in the Fund. Because the share price of the Fund will fluctuate, when you sell your shares they may be worth more or less than what you originally paid for them. The Fund may impose a fee upon sale of your shares or may temporarily suspend your ability to sell shares if the Fund’s liquidity falls below required minimums because of market conditions or other factors. An investment in the Fund is not a deposit of a bank and is not insured or guaranteed by the Federal Deposit Insurance Corporation or any other government agency. The Fund’s sponsor has no legal obligation to provide financial support to the Fund, and you should not expect that the sponsor will provide financial support to the Fund at any time. |
| 3 | | You could lose money by investing in the Fund. Although the Fund seeks to preserve the value of your investment at $1.00 per share, it cannot guarantee it will do so. The Fund may impose a fee upon sale of your shares or may temporarily suspend your ability to sell shares if the Fund’s liquidity falls below required minimums because of market conditions or other factors. An investment in the Fund is not a deposit of a bank and is not insured or guaranteed by the Federal Deposit Insurance Corporation or any other government agency. The Fund’s sponsor has no legal obligation to provide financial support to the Fund, and you should not expect that the sponsor will provide financial support to the Fund at any time. |
| 4 | | Effective after the close of business on February 28, 2019, the Goldman Sachs Equity Growth Strategy Portfolio was renamed the Goldman Sachs Dynamic Global Equity Fund. |
| | | Financial Square FundsSM and Investor FundsSM are registered service marks of Goldman Sachs & Co. LLC. |
| 5 | | Effective after the close of business on August 30, 2019, the Goldman Sachs N-11 Equity Fund was renamed the Goldman Sachs Imprint Emerging Markets Opportunities Fund. |
| * | | This list covers open-end funds only. Please visit our website at www.GSAMFUNDS.com to learn about our closed-end funds and exchange-traded funds. |
| | |
TRUSTEES Jessica Palmer,Chair Kathryn A. Cassidy Diana M. Daniels James A. McNamara Roy W. Templin Gregory G. Weaver | | OFFICERS James A. McNamara,President Joseph F. DiMaria,Principal Financial Officer, Principal Accounting Officer and Treasurer Caroline L. Kraus,Secretary |
| |
GOLDMAN SACHS & CO. LLC Distributor and Transfer Agent | | GOLDMAN SACHS ASSET MANAGEMENT, L.P. Investment Adviser |
Visit our web site atwww.GSAMFUNDS.com to obtain the most recentmonth-end returns.
Goldman Sachs Asset Management, L.P. 200 West Street, New York, New York 10282
The report concerning the Fund included in this shareholder report may contain certain forward-looking statements about the factors that may affect the performance of the Fund in the future. These statements are based on Fund management’s predictions and expectations concerning certain future events and their expected impact on the Fund, such as performance of the economy as a whole and of specific industry sectors, changes in the levels of interest rates, the impact of developing world events, and other factors that may influence the future performance of the Fund. Management believes these forward-looking statements to be reasonable, although they are inherently uncertain and difficult to predict. Actual events may cause adjustments in portfolio management strategies from those currently expected to be employed.
A description of the policies and procedures that the Fund uses to determine how to vote proxies relating to portfolio securities and information regarding how the Fund voted proxies relating to portfolio securities during the most recent12-month period ended June 30 is available (i) without charge, upon request by calling1-800-526-7384 (for Retail Shareholders) or1-800-621-2550 (for Institutional Shareholders); and (ii) on the Securities and Exchange Commission (“SEC”) web site at http://www.sec.gov.
The Global Industry Classification Standard (GICS) was developed by and is the exclusive property and a service mark of Morgan Stanley Capital International Inc. (MSCI) and Standard & Poor’s, a division of The McGraw-Hill Companies, Inc. (S&P) and is licensed for use by Goldman Sachs. Neither MSCI, S&P nor any other party involved in making or compiling the GICS or any GICS classifications makes any express or implied warranties or representations with respect to such standard or classification (or the results to be obtained by the use thereof), and all such parties hereby expressly disclaim all warranties of originality, accuracy, completeness, merchantability or fitness for a particular purpose with respect to any of such standard or classification. Without limiting any of the foregoing, in no event shall MSCI, S&P, any of their affiliates or any third party involved in making or compiling the GICS or any GICS classifications have any liability for any direct, indirect, special, punitive, consequential or any other damages (including lost profits) even if notified of the possibility of such damages.
The Fund will file portfolio holdings information for each month in a fiscal quarter within 60 days after the end of the relevant fiscal quarter on Form N-PORT. Portfolio holdings information for the third month of each fiscal quarter will be made available on the SEC’s web site at http://www.sec.gov. Portfolio holdings information may be obtained upon request and without charge by calling1-800-526-7384 (for Retail Shareholders) or1-800-621-2550 (for Institutional Shareholders).
Holdings and allocations shown are as of June 30, 2019 and may not be representative of future investments. Fund holdings should not be relied on in making investment decisions and should not be construed as research or investment advice regarding particular securities. Current and future holdings are subject to risk.
This material is not authorized for distribution to prospective investors unless preceded or accompanied by a current prospectus or summary prospectus, if applicable. Investors should consider the Fund’s objective, risks, and charges and expenses, and read the summary prospectus, if available, and/or the prospectus carefully before investing or sending money. The summary prospectus, if available, and the prospectus contain this and other information about the Fund and may be obtained from your authorized dealer or from Goldman Sachs & Co. LLC by calling (retail –1-800-526-7384) (institutional –1-800-621-2550).
© 2019 Goldman Sachs. All rights reserved. 174694-OTU-1031032 GBLINFRASAR-19
Goldman Sachs Funds

| | | | |
| | |
| Semi-Annual Report | | | | June 30, 2019 |
| | |
| | | | Real Estate Securities Funds |
| | | | Global Real Estate Securities |
| | | | International Real Estate Securities |
| | | | Real Estate Securities |
It is our intention that beginning on January 1, 2021, paper copies of the Funds’ annual and semi-annual shareholder reports will no longer be sent by mail, unless you specifically request paper copies of the reports from a Fund or from your financial intermediary. Instead, the reports will be made available on a website, and you will be notified by mail each time a report is posted and provided with a website link to access the report.
If you already elected to receive shareholder reports electronically, you will not be affected by this change and you need not take any action. At any time, you may elect to receive reports and certain communications from a Fund electronically by calling the applicable toll-free number below or by contacting your financial intermediary.
You may elect to receive all future shareholder reports in paper free of charge. If you hold shares of a Fund directly with the Fund’s transfer agent, you can inform the transfer agent that you wish to receive paper copies of reports by callingtoll-free 800-621-2550 for Institutional, Service, Class R6 and Class P shareholders or800-526-7384 for all other shareholders. If you hold shares of a Fund through a financial intermediary, please contact your financial intermediary to make this election. Your election to receive reports in paper will apply to all Goldman Sachs Funds held in your account if you invest through your financial intermediary or all Goldman Sachs Funds held with the Funds’ transfer agent if you invest directly with the transfer agent.

Goldman Sachs Real Estate Securities Funds
| ∎ | | GLOBAL REAL ESTATE SECURITIES |
| ∎ | | INTERNATIONAL REAL ESTATE SECURITIES |
| | | | |
| | | |
| NOT FDIC-INSURED | | May Lose Value | | No Bank Guarantee |
GOLDMAN SACHS REAL ESTATE SECURITIES FUNDS
What Differentiates the Goldman Sachs
Real Estate Securities Investment Process?
The Goldman Sachs Global Real Estate Securities, International Real Estate Securities and Real Estate Securities Funds seek to generate long-term growth of capital and dividend income by investing primarily in real estate industry companies on an international or domestic basis, including real estate investment trusts (“REITs”) that offer daily liquidity and have historically strong returns, low volatility and low correlation to traditional asset classes.
Goldman Sachs’ Real Estate Securities Investment Process

Buy high quality companies.
We seek to purchase those companies that combine strong market exposures, management teams, capital structures and growth prospects.
Buy at a reasonable price.
We seek to consistently select securities that are trading at discounts to their intrinsic value.
Diversification reduces risk.
We seek to diversify the portfolio holdings based on property type and geographic markets to manage risk without compromising returns.

Team Based:
Portfolio decisions are made by the entire team.
Continuous Scrutiny:
Market, industry and company developments are reviewed daily.
Fundamental Analysis:
Portfolio holdings are determined by the risk/reward characteristics of an issuer and the team’s conviction in the overall business and management’s ability to create value.

Real estate securities portfolio that:
| ∎ | | is ahigh quality portfolio that is strategically positioned forlong-term growth potential |
| ∎ | | is a result ofbottom-up stock selection with a focus onlong-term investing |
1
PORTFOLIO RESULTS
Goldman Sachs Global Real Estate Securities Fund
Investment Objective
The Fund seeks total return comprised of long-term growth of capital and dividend income.
Portfolio Management Discussion and Analysis
Below, the Goldman Sachs Real Estate Securities Investment Team discusses the Goldman Sachs Global Real Estate Securities Fund’s (the “Fund”) performance and positioning for thesix-month period ended June 30, 2019 (the “Reporting Period”).
| Q | | How did the Fund perform during the Reporting Period? |
| A | | During the Reporting Period, the Fund’s Class A, Class C, Institutional, Investor, Class P, Class R and Class R6 Shares generated cumulative total returns, without sales charges, of 15.31%, 14.90%, 15.59%, 15.55%, 15.53%, 15.19% and 15.63%, respectively. These returns compare to the 14.61% cumulative total return of the Fund’s benchmark, the FTSE EPRA Nareit Developed Index (Net, USD, Unhedged) (the “FTSE Index”) during the same period. |
| Q | | What economic and market factors most influenced the global real estate securities market as a whole during the Reporting Period? |
| A | | For the Reporting Period overall, the global real estate securities market, as measured by the FTSE Index, returned 14.61%. Singapore, Australia and Canada were the strongest performing markets, while continental Europe, the U.K. and Japan were the weakest performing markets though still posting solid positive absolute returns. The Singapore real estate market benefited from a decrease in the10-year Singapore government securities yield. The U.K. real estate market was challenged by poor performance in the retail subsector. |
| Q | | What key factors were responsible for the Fund’s performance during the Reporting Period? |
| A | | The Fund outperformed the FTSE Index during the Reporting Period. Stock selection contributed most positively, especially in continental Europe, the U.S. and the U.K. Such positive contributors were only partially offset by stock selection in Singapore and Hong Kong, which detracted modestly. |
| | Subsector* allocation decisions overall had a modestly positive effect on relative results during the Reporting Period, attributable primarily to an underweight in retail, the weakest performing subsector in the FTSE Index during the Reporting Period, and an overweight to industrial, the strongest performing subsector in the FTSE Index during the Reporting Period. Country allocation as a whole detracted from the Fund’s relative results. |
| Q | | What were some of the Fund’s best-performing individual holdings? |
| A | | Green REIT, a property investment company headquartered in Ireland, was the top positive contributor to the Fund’s returns during the Reporting Period. Its shares increased after the company announced that, following a strategic review of its business, it would be selling either the company or part of its assets due to what its management believes to be a disparity between the value of its portfolio and Green REIT’s share price. At the end of the Reporting Period, we remained positive on what we saw as the company’s high quality portfolio of assets, particularly its logistics properties, as well as the strong fundamentals supporting the Irish real estate market. |
| | Invincible Investment, a Japanese real estate investment trust(“J-REIT”) operating budget hotels and rental apartments, was another top contributor to the Fund’s relative results during the Reporting Period. TheJ-REIT has about 80% exposure in business hotels and 20% in rental apartments, mainly in the Tokyo area. Invincible Investment delivered solid December 2018 earnings and forecasted distribution per unit growth of 4.6% year over year in 2019, mainly driven by a hotel average daily rate recovery. Furthermore, the market reacted positively to the company’s release of the potential resolution of a taxation issue that had been concerning investors since the end of 2018. At the end of the Reporting Period, we remained positive on Invincible Investment’s |
2
PORTFOLIO RESULTS
| | outlook, given what we considered to be its inexpensive valuation, performance-focused management team and positive outlook on the two subsectors in which it operates. |
| | Prologis, a global leader in logistics real estate, was also a strong positive contributor to the Fund’s performance during the Reporting Period. Shares of the U.S. company appreciated during the Reporting Period, as Prologis continued to benefit from positive trends in the industrial subsector, as industries work toward supply-chain reconfiguration to limit transportation times. Investors also grew to appreciate its management’s comments that the subsector is only in the second inning of the supply-chain reconfiguration cycle and much more work is to be done. At the end of the Reporting Period, we believed Prologis may benefit ahead from the stabilization of its development pipeline, its existing land bank and what we view as its healthy balance sheet. |
| Q | | Which positions detracted significantly from the Fund’s performance during the Reporting Period? |
| A | | Sumitomo Realty & Development, a Japan-based diversified real estate landlord and developer, was the top detractor from the Fund’s results during the Reporting Period. While the company enjoyed strong momentum in presales among its central Tokyo apartment projects, its shares were impacted by its third fiscal quarter results, which showed slowing brokerage growth. Additionally, thebuild-for-sale condo market as a whole showed signs of slowing. At the end of the Reporting Period, it was our opinion that Sumitomo Realty offered solid office completion pipelines with stable progress on itspre-leases of tenants, which we believe could help to support its future earnings growth. |
| | Propertylink Group, a logistics warehouse real estate investment trust (“REIT”) in Australia, was also a top detractor from the Fund’s results during the Reporting Period. Another company, ESR Australia, initially picked up a 98% stake in Propertylink Group and then acquired all outstanding shares by the end of April 2019, after which the REIT was privatized. As such, we sold the Fund’s position in Propertylink Group during the Reporting Period. |
| | Simon Property Group, a U.S.-based owner and operator of retail real estate properties, detracted from the Fund’s relative performance as well. Despite leasing spreads accelerating during the first quarter of 2019, the market reacted to the company’s reported first quarter 2019 same-store net operating income, which was lower than it expected. Still, in our view, the company maintained atop-tier portfolio of assets at the end of the Reporting Period as well as one of the strongest balance sheets relative to its peers. We also believed its management team was a great capital allocator, had the potential to generate high cash flow growth and would likely be opportunistic during periods of distress as it seeks to create value. |
| Q | | How did the Fund use derivatives and similar instruments during the Reporting Period? |
| A | | The Fund did not use derivatives during the Reporting Period. |
| Q | | Did the Fund make any significant purchases or sales during the Reporting Period? |
| A | | During the Reporting Period, we established a Fund position in Invitation Homes, a U.S. owner and operator of single-family rental homes. We believe the company has created a well-located, high quality portfolio of assets and, in our view, has the potential to benefit from the recent supply/demand backdrop. In 2018, the company was challenged by volatile operating expenses due toone-time taxes and platform integration. However, we believe its expenses should be less volatile in the coming years due to merger synergies. Additionally, we are positive on Invitation Homes’ improved repair and maintenance system, which may lead to better returns. |
| | We initiated a Fund position in CapitaLand, a Singapore-listed developer with exposure to China residential properties, shopping malls in China and Singapore, the lodging subsector, and fund management. We were constructive at the time of purchase on the company’s then-recently announced proposed acquisition of Ascendas-Singbridge Group, which, in our view, positions the company well to recycle capital through listed REITs and private vehicles and sustain a stable return on earnings going forward. Furthermore, we believe CapitaLand’s share price mayre-rate with this deal, as the company has had a slow track record in deploying capital in the past. (When the market changes its view of a company sufficiently to make calculation ratios, such as its price/earnings ratio, substantially higher or lower, this is known asre-rating.) |
| | Conversely, in addition to the sale of Propertylink Group, already mentioned, we eliminated the Fund’s position in Vornado Realty Trust, a U.S. owner of office and retail properties. Its shares appreciated early in the Reporting Period in line with the broader real estate market, but then fell after the company reported soft fourth quarter 2018 results. Ultimately, we viewed this as an attractive exit point |
3
PORTFOLIO RESULTS
| | and decided to allocate capital to fund higher conviction ideas. |
| Q | | Were there any changes made in the Fund’s investment strategy during the Reporting Period? |
| A | | In constructing the Fund’s portfolio, we focus on picking securities rather than on making regional, country or subsector bets. We seek to outpace the benchmark index by overweighting stocks that we expect to outperform and underweighting those that we think may lag. Consequently, changes in its regional or subsector weights are generally the direct result of individual stock selection or of real estate securities’ appreciation or depreciation. That said, the Fund’s exposure to Asiaex-Japan and continental Europe increased relative to the FTSE Index during the Reporting Period. The Fund’s position in cash decreased. |
| Q | | How was the Fund positioned relative to its benchmark index at the end of the Reporting Period? |
| A | | From a region/country perspective, the Fund was overweighted relative to the FTSE Index in continental Europe, underweighted relative to the FTSE Index in North America, and rather neutrally weighted compared to the FTSE Index in the other constituent regions/countries of the FTSE Index at the end of June 2019. |
| Q | | What is the Fund’s tactical view and strategy for the months ahead? |
| A | | At the end of the Reporting Period, in terms of industry fundamentals, we believed tenant demand for international real estate remained robust across subsectors, especially in office, industrial, new industries and hospitality. Furthermore, in our view, the funding environment remained open and inexpensive for REITs, with most having locked inlow-cost, long-term debt financing. Balance sheets also remained strong, in our opinion, in particular those of property-operating companies that practice high earnings retention. Broadly speaking, international REITs sign an overwhelming majority of their leases with long-term commercial tenants, and tenancies have remained stable. In our view, the favorable environment seen at the end of the Reporting Period could allow international REITs to potentially deploy more capital toward high quality projects to drive opportunities for future growth. |
| | As for the U.S. real estate market, we maintained a constructive outlook for U.S. REITs overall at the end of the Reporting Period for several reasons. First, we felt the macro backdrop for REITs had improved with a moderating economic growth outlook and anticipation of lower interest rates. This improved backdrop may be, in our view, a positive for financing costs, which, in turn, may translate to increased flows from equity investors seeking defense, yield and potentially better returns. Second, despite being late in the real estate cycle, we believed fundamentals remained generally healthy, with limited new supply, which we expect to persist given rising construction costs and long development cycles across most subsectors, and stable or improving demand, which should support revenue growth stemming from rising occupancies and/or rents. Third, in our opinion, the dividend sustainability potential of REITs is high due to healthy fundamentals, improved balance sheets with meaningfully less leverage than at the peak in 2008/2009, and dividend payout ratios near record lows on a historical basis. Fourth, we believed the quality of REITs’ growth has improved given the increasing importance ofnon-core exposures, which currently represent about half of the U.S. REIT universe, a sharp increase from the approximately 20% representation ten years ago. Fifth, increased merger and acquisition activity should provide additional support to the sector, in our opinion, as record levels of private capital may translate to price discovery in listed markets. Finally, we believed valuations of most REITs remained attractive at the end of the Reporting Period. |
| | Against this backdrop, we believe U.S. REIT returns may fall somewhere between those of equities and fixed income over the long term given that U.S. REITs offer some equity-like attributes, such as the ability to grow, and some fixed income-like attributes, such as attractive yield. For the remainder of the calendar year, we believe U.S. REITs may offer attractive returns that outperform both fixed income and equities, especially cyclical equities, given moderating interest rate and economic growth market expectations. We believe such U.S. REIT returns will be comprised of dividend yield and growth (factoring in no multiple expansion), with the potential for upside from merger and acquisition activity. |
| | Overall, we believe global REITs can continue to offer attractive liquidity and risk-adjusted total returns given the yield, growth, diversification and inflation-hedging benefits the asset class has historically exhibited. On a stock level, we believe opportunities abound, as various property subsectors and geographies could offer wide dispersions in returns. As fundamental,bottom-up investors, we see opportunities beyond the headline risks associated with certain regions and |
4
PORTFOLIO RESULTS
| | intend to continue to focus our approach on those companies that have well-capitalized balance sheets and that possess quality attributes, such as a robust business model, a high quality asset exposure and a strong management team with a sound reinvestment strategy. |
5
| | *Sector | | and subsector allocations throughout this shareholder report are defined by GSAM and may differ from sector and subsector allocations used by the FTSE Index. |
FUND BASICS
Global Real Estate Securities Fund
as of June 30, 2019
| | | | | | | | | | |
| | PERFORMANCE REVIEW | |
| | | |
| | | January 1, 2019– June 30, 2019 | | Fund Total Return
(based on NAV)1 | | | FTSE EPRA Nareit
Developed Index
(Net, USD,
Unhedged)2 | |
| | | |
| | Class A | | | 15.31 | % | | | 14.61 | % |
| | Class C | | | 14.90 | | | | 14.61 | |
| | Institutional | | | 15.59 | | | | 14.61 | |
| | Investor | | | 15.55 | | | | 14.61 | |
| | Class P | | | 15.53 | | | | 14.61 | |
| | Class R | | | 15.19 | | | | 14.61 | |
| | | Class R6 | | | 15.63 | | | | 14.61 | |
| | 1 | | The net asset value (“NAV”) represents the net assets of the class of the Fund(ex-dividend) divided by the total number of shares of the class outstanding. The Fund’s performance reflects the reinvestment of dividends and other distributions. The Fund’s performance does not reflect the deduction of any applicable sales charges. |
| | 2 | | The FTSE EPRA Nareit Developed Index (Net, USD, Unhedged) is designed to track the performance of listed real estate companies and REITS worldwide. By making the index constituents free-float adjusted, liquidity, size and revenue screened, the series is suitable for use as the basis for investment products, such as derivatives and Exchange Traded Funds (ETFs). It is not possible to invest directly in an index. |
| | | | | | | | | | | | |
| | STANDARDIZED TOTAL RETURNS3 |
| | | | |
| | | For the period ended 6/30/19 | | One Year | | | Since Inception | | | Inception Date |
| | | | |
| | Class A | | | 2.37 | % | | | 4.58 | % | | 8/31/15 |
| | Class C | | | 6.46 | | | | 5.36 | | | 8/31/15 |
| | Institutional | | | 8.71 | | | | 6.58 | | | 8/31/15 |
| | Investor | | | 8.58 | | | | 6.43 | | | 8/31/15 |
| | Class P | | | 8.75 | | | | 10.20 | | | 4/17/18 |
| | Class R | | | 8.04 | | | | 5.90 | | | 8/31/15 |
| | | Class R6 | | | 8.74 | | | | 6.59 | | | 8/31/15 |
| | 3 | | The Standardized Total Returns are average annual total returns or cumulative total returns (only if the performance period is one year or less) as of the most recent calendarquarter-end. They assume reinvestment of all distributions at NAV. These returns reflect a maximum initial sales charge of 5.5% for Class A Shares, and the assumed contingent deferred sales charge for Class C Shares (1% if redeemed within 12 months of purchase). Because Institutional, Investor, Class P, Class R and Class R6 Shares do not involve a sales charge, such a charge is not applied to their Standardized Total Returns. |
The returns set forth in the tables above represent past performance. Past performance does not guarantee future results. The Fund’s investment return and principal value will fluctuate so that an investor’s shares, when redeemed, may beworth more or less than their original cost. Current performance may be lower or higher than the performance quoted above. Please visit our web site atwww.GSAMFUNDS.com to obtain the most recentmonth-end returns.Performance reflects applicable fee waivers and/or expense limitations in effect during the periods shown. In their absence, performance would be reduced. Returns do not reflect the deduction of taxes that a shareholder would pay on Fund distributions or the redemption of Fund shares.
6
FUND BASICS
| | | | | | | | | | |
| | EXPENSE RATIOS4 | |
| | | |
| | | | | Net Expense Ratio (Current) | | | Gross Expense Ratio (Before Waivers) | |
| | | |
| | Class A | | | 1.36 | % | | | 1.48 | % |
| | Class C | | | 2.11 | | | | 2.23 | |
| | Institutional | | | 0.97 | | | | 1.09 | |
| | Investor | | | 1.11 | | | | 1.23 | |
| | Class P | | | 0.96 | | | | 1.08 | |
| | Class R | | | 1.61 | | | | 1.73 | |
| | | Class R6 | | | 0.96 | | | | 1.08 | |
| | 4 | | The expense ratios of the Fund, both current (net of applicable fee waivers and/or expense limitations) and before waivers (gross of applicable fee waivers and/or expense limitations) are as set forth above according to the most recent publicly available Prospectus for the Fund and may differ from the expense ratios disclosed in the Financial Highlights in this report. Pursuant to contractual arrangements, the Fund’s waivers and/or expense limitations will remain in place through at least April 30, 2020, and prior to such date the Investment Adviser may not terminate the arrangements without the approval of the Fund’s Board of Trustees. If these arrangements are discontinued in the future, the expense ratios may change without shareholder approval. |
| | | | | | | | | | |
| | TOP TEN HOLDINGS AS OF 6/30/195 |
| | | | |
| | | Holding | | % of Net
Assets | | | Subsectors | | Country |
| | | | |
| | Prologis, Inc. (REIT) | | | 3.9 | % | | Industrial | | United States |
| | Simon Property Group, Inc. (REIT) | | | 3.9 | | | Retail | | United States |
| | AvalonBay Communities, Inc. (REIT) | | | 3.1 | | | Residential | | United States |
| | Mitsubishi Estate Co. Ltd. | | | 2.9 | | | Diversified | | Japan |
| | CK Asset Holdings Ltd. | | | 2.8 | | | Real Estate Development | | Hong Kong |
| | Equity Residential (REIT) | | | 2.8 | | | Residential | | United States |
| | Sun Hung Kai Properties Ltd. | | | 2.7 | | | Diversified | | Hong Kong |
| | Vonovia SE | | | 2.6 | | | Real Estate Operating Companies | | Germany |
| | HCP, Inc. (REIT) | | | 2.5 | | | Health Care | | United States |
| | | Ventas, Inc. (REIT) | | | 2.3 | | | Health Care | | United States |
| | 5 | | The top 10 holdings may not be representative of the Fund’s future investments. |
7
FUND BASICS
|
| FUND VS. BENCHMARK COUNTRY ALLOCATION6 |
|
| As of June 30, 2019 |
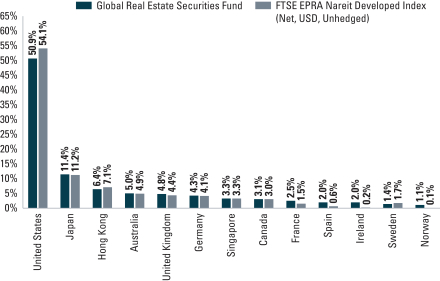
| | 6 | | The Fund is actively managed and, as such, its composition may differ over time. Consequently, the Fund’s overall country allocations may differ from percentages contained in the graph above. The percentage shown for each country reflects the value of investments in that country as a percentage of market value. Figures in the above graph may not sum to 100% due to the exclusion of other assets and liabilities. |
8
PORTFOLIO RESULTS
Goldman Sachs International Real Estate Securities Fund
Investment Objective
The Fund seeks total return comprised of long-term growth of capital and dividend income.
Portfolio Management Discussion and Analysis
Below, the Goldman Sachs Real Estate Securities Investment Team discusses the Goldman Sachs International Real Estate Securities Fund’s (the “Fund”) performance and positioning for thesix-month period ended June 30, 2019 (the “Reporting Period”).
| Q | | How did the Fund perform during the Reporting Period? |
| A | | During the Reporting Period, the Fund’s Class A, Class C, Institutional, Investor, Class P and Class R6 Shares generated cumulative total returns, without sales charges, of 13.19%, 12.74%, 13.32%, 13.45%, 13.35% and 13.52%, respectively. These returns compare to the 12.89% cumulative total return of the Fund’s benchmark, the FTSE EPRA Nareit Developed Ex US Real Estate Index (Net, USD, Unhedged) (the “Real Estate Index”) during the same period. |
| Q | | What economic and market factors most influenced the international real estate securities market as a whole during the Reporting Period? |
| A | | For the Reporting Period overall, the international real estate securities market, as measured by the Real Estate Index, underperformed the U.S. real estate securities market, as measured by the Wilshire U.S. Real Estate Securities Index (with dividends reinvested), by approximately five percentage points, and underperformed the broad international equity market, as measured by the MSCI EAFE® Index (net), by just more than one percentage point. |
| | | The Real Estate Index returned a robust 13.54% in the first quarter of 2019. Hong Kong and Canada were the top performing countries during the quarter, and no countries posted negative returns. The Hong Kong property market, inclusive of housing andnon-housing sectors, saw positive purchase and rental transactions during the quarter. |
| | | The Real Estate Index returned-0.58% during the second quarter of 2019. Singapore and Australia were the best performing markets, while the U.K. and Hong Kong generated negative returns. The Singapore real estate market benefited from a decrease in the10-year Singapore government securities yield. The U.K. real estate market was challenged by poor performance in the retail subsector. |
| | | For the Reporting Period overall, Singapore and Australia were the best performing markets. Continental Europe and the U.K. were the weakest performing markets during the Reporting Period, but still generated solid positive absolute returns. |
| Q | | What key factors were responsible for the Fund’s performance during the Reporting Period? |
| A | | Most share classes of the Fund outperformed the Real Estate Index on a relative basis during the Reporting Period. |
| | | Stock selection contributed most positively to the Fund’s relative results, especially in continental Europe and the U.S. Only partially offsetting these positive contributors was stock selection in Singapore and Hong Kong, which modestly detracted from the Fund’s relative results. |
| | | From a subsector* perspective, both stock selection and allocation decisions overall contributed positively. Stock selection in the office and residential subsectors contributed most positively. Having an underweighted allocation to retail, which was the second-weakest subsector in the Real Estate Index during the Reporting Period, also added value. Only partially offsetting these positive contributors was stock selection in the industrial, hotel and self-storage subsectors, which detracted. Having a position in cash during a Reporting Period when the Real Estate Index rallied also dampened results. |
| | | Country allocation overall detracted. Havingout-of-benchmark exposure to India, which outperformed the Real Estate Index during the Reporting Period, helped. However, having underweights to Singapore and Australia, which each outperformed the Real Estate Index during the Reporting Period, hurt. |
9
PORTFOLIO RESULTS
| Q | | What were some of the Fund’s best-performing individual holdings? |
| A | | Invincible Investment, a Japanese real estate investment trust(“J-REIT”) operating budget hotels and rental apartments, was the top contributor to the Fund’s relative results during the Reporting Period. TheJ-REIT has about 80% exposure in business hotels and 20% in rental apartments, mainly in the Tokyo area. Invincible Investment delivered solid December 2018 earnings and forecasted distribution per unit growth of 4.6% year over year in 2019, mainly driven by a hotel average daily rate recovery. Furthermore, the market reacted positively to the company’s release of the potential resolution of a taxation issue that had been concerning investors since the end of 2018. At the end of the Reporting Period, we remained positive on Invincible Investment’s outlook, given what we considered to be its inexpensive valuation, performance-focused management team and positive outlook on the two subsectors in which it operates. |
| | | Mirvac Group, a diversified Australian real estate investment trust (“REIT”) with exposure to retail, office and residential properties, also contributed positively to the Fund’s relative results during the Reporting Period. Its positive performance was driven by the company tightening its guidance to the upper end of the range it had set during its half-yearly results report. Such improved guidance was driven, in turn, by a favorable office outlook in Sydney and Melbourne and stable residential settlement guidance despite weakness in the residential market overall. At the end of the Reporting Period, we believed Mirvac Group’s strategy to drive income growth through passive earnings in a weak residential market bode well for its stock. |
| | | Green REIT, a property investment company headquartered in Ireland, was another top positive contributor to the Fund’s returns during the Reporting Period. Its shares increased after the company announced that, following a strategic review of its business, it would be selling either the company or part of its assets due to what its management believes to be a disparity between the value of its portfolio and Green REIT’s share price. At the end of the Reporting Period, we remained positive on what we saw as the company’s high quality portfolio of assets, particularly its logistics properties, as well as the strong fundamentals supporting the Irish real estate market. |
| Q | | Which positions detracted significantly from the Fund’s performance during the Reporting Period? |
| A | | Sumitomo Realty & Development, a Japan-based diversified real estate landlord and developer, was the top detractor from the Fund’s results during the Reporting Period. While the company enjoyed strong momentum in presales among its central Tokyo apartment projects, its shares were impacted by its third fiscal quarter results, which showed slowing brokerage growth. Additionally, thebuild-for-sale condo market as a whole showed signs of slowing. At the end of the Reporting Period, it was our opinion that Sumitomo Realty offered solid office completion pipelines with stable progress on itspre-leases of tenants, which we believe could help to support future earnings growth. |
| | | Goodman Group, an Australia-based owner of industrial properties and business space and a new purchase for the Fund during the Reporting Period, detracted from the Fund’s results during the Reporting Period as well but did so given the Fund’s underweighted position in the strongly performing stock. Its share price appreciated on reports of favorable quarterly results given ongoing strong demand for new logistics assets as a result of trends ine-commerce. Goodman Group also offers a solid development pipeline, in our view. At the end of the Reporting Period, we maintained the Fund’s position in Goodman Group given our view that the company is well positioned to continue to benefit frome-commerce trends and developments in Asia. |
| | | Propertylink Group, a logistics warehouse REIT in Australia, was also a top detractor from the Fund’s results during the Reporting Period. Another company, ESR Australia, initially picked up a 98% stake in Propertylink Group and then acquired all outstanding shares by the end of April 2019, after which the REIT was privatized. As such, we sold the Fund’s position in Propertylink Group during the Reporting Period. |
| Q | | How did the Fund use derivatives and similar instruments during the Reporting Period? |
| A | | The Fund did not use derivatives during the Reporting Period. |
| Q | | Did the Fund make any significant purchases or sales during the Reporting Period? |
| A | | In addition to the purchase of Goodman Group, already mentioned, we established a Fund position in Mitsui Fudosan Logistics Park, a logisticsJ-REIT sponsored by Japan’s largest diversified real estate developer, Mitsui Fudosan. We |
10
PORTFOLIO RESULTS
| | believe its recent property acquisition deal was accretive to its net asset value. We also believe that with its low leverage of less than 30%, the REIT can continue to acquiretop-class modern logistics facilities from its sponsor. We expect its distribution per unit growth to continue, driven by further property acquisitions, and believe its shares were trading at a reasonable valuation at the end of the Reporting Period. |
| | | We initiated a Fund position in CapitaLand, a Singapore-listed developer with exposure to China residential properties, shopping malls in China and Singapore, the lodging subsector, and fund management. We were constructive at the time of purchase on the company’s then-recently announced proposed acquisition of Ascendas-Singbridge Group, which, in our view, positions the company well to recycle capital through listed REITs and private vehicles and sustain a stable return on earnings going forward. Furthermore, we believed CapitaLand’s share price mayre-rate with this deal, as the company has had a slow track record in deploying capital in the past. (When the market changes its view of a company sufficiently to make calculation ratios, such as its price/earnings ratio, substantially higher or lower, this is known asre-rating.) |
| | | Conversely, in addition to the sale of Propertylink Group, mentioned earlier, we exited the Fund’s position in Covivio, a France-based owner of diversified real estate across Europe. Its shares appreciated during the Reporting Period and eventually reached our price target. We ultimately decided to sell the position and allocate capital to ideas we felt had higher risk/reward potential. |
| Q | | Were there any changes made in the Fund’s investment strategy during the Reporting Period? |
| A | | In constructing the Fund’s portfolio, we focus on picking securities rather than on making regional, country or subsector bets. We seek to outpace the benchmark index by overweighting stocks that we expect to outperform and underweighting those that we think may lag. Consequently, changes in its regional or subsector weights are generally the direct result of individual stock selection or of real estate securities’ appreciation or depreciation. That said, during the Reporting Period, the Fund’s exposure to Singapore increased relative to the Real Estate Index. The Fund’s position in cash decreased. |
| Q | | How was the Fund positioned relative to its benchmark index at the end of the Reporting Period? |
| A | | From a region/country perspective, the Fund was underweighted relative to the Real Estate Index in Singapore and Australia. The Fund was overweighted relative to the Real Estate Index in France, Spain, Ireland and the U.S. and was rather neutrally weighted to the remaining regions/countries of the Real Estate Index at the end of June 2019. The Fund also had anout-of-benchmark exposure to India at the end of the Reporting Period. |
| Q | | What is the Fund’s tactical view and strategy for the months ahead? |
| A | | At the end of the Reporting Period, in terms of industry fundamentals, we believed tenant demand for international real estate remained robust across subsectors, especially in office, industrial, new industries and hospitality. Furthermore, in our view, the funding environment remained open and inexpensive for REITs, with most having locked inlow-cost, long-term debt financing. Balance sheets also remained strong, in our opinion, in particular those of property-operating companies that practice high earnings retention. Broadly speaking, international REITs sign an overwhelming majority of their leases with long-term commercial tenants, and tenancies have remained stable. In our view, the favorable environment seen at the end of the Reporting Period could allow international REITs to potentially deploy more capital toward high quality projects to drive opportunities for future growth. |
| | | Overall, we believe international REITs can continue to offer attractive liquidity and risk-adjusted total returns given the yield, growth, diversification and inflation-hedging benefits the asset class has historically exhibited. On a stock level, we believe opportunities abound, as various property subsectors and geographies could offer wide dispersions in returns. As fundamental,bottom-up investors, we see opportunities beyond the headline risks associated with certain regions and intend to continue to focus our approach on those companies that have well-capitalized balance sheets and that possess quality attributes, such as a robust business model, a high quality asset exposure and a strong management team with a sound reinvestment strategy. |
| | * | | Sector and subsector allocations are defined by GSAM and may differ from sector and subsector allocations used by the Real Estate Index. |
11
FUND BASICS
International Real Estate Securities Fund
as of June 30, 2019
| | | | | | | | | | |
| | PERFORMANCE REVIEW | |
| | | |
| | | January 1, 2019 – June 30, 2019 | | Fund Total Return
(based on NAV)1 | | | FTSE EPRA Nareit Developed
Ex US Real Estate Index
(Net, USD, Unhedged)2 | |
| | | |
| | Class A | | | 13.19 | % | | | 12.89 | % |
| | Class C | | | 12.74 | | | | 12.89 | |
| | Institutional | | | 13.32 | | | | 12.89 | |
| | Investor | | | 13.45 | | | | 12.89 | |
| | Class P | | | 13.35 | | | | 12.89 | |
| | | Class R6 | | | 13.52 | | | | 12.89 | |
| | 1 | | The net asset value (“NAV”) represents the net assets of the class of the Fund (ex-dividend) divided by the total number of shares of the class outstanding. The Fund’s performance reflects the reinvestment of dividends and other distributions. The Fund’s performance does not reflect the deduction of any applicable sales charges. |
| | 2 | | The FTSE EPRA Nareit Developed Ex US Real Estate Index (Net, USD, Unhedged) is a subset of the FTSE EPRA Nareit Developed Index and is designed to track the performance of listed real estate companies and REITS. By making the index constituents free-float adjusted, liquidity, size and revenue screened, the series is suitable for use as the basis for investment products, such as derivatives and Exchange Traded Funds (ETFs). It is not possible to invest directly in an index. |
| | | | | | | | | | | | | | | | | | | | |
| | STANDARDIZED TOTAL RETURNS3 |
| | | | | | |
| | | For the period ended 6/30/19 | | One Year | | | Five Years | | | Ten Years | | | Since Inception | | | Inception Date |
| | | | | | |
| | Class A | | | -0.58 | % | | | 1.48 | % | | | 6.60 | % | | | 1.23 | % | | 7/31/06 |
| | Class C | | | 3.31 | | | | 1.88 | | | | 6.41 | | | | 0.94 | | | 7/31/06 |
| | Institutional | | | 5.47 | | | | 3.05 | | | | 7.59 | | | | 1.97 | | | 7/31/06 |
| | Investor | | | 5.50 | | | | 2.93 | | | | 7.49 | | | | 0.16 | | | 11/30/07 |
| | Class P | | | 5.49 | | | | N/A | | | | N/A | | | | 3.12 | | | 4/17/18 |
| | | Class R6 | | | 5.64 | | | | N/A | | | | N/A | | | | 4.14 | | | 7/31/15 |
| | 3 | | The Standardized Total Returns are average annual total returns or cumulative total returns (only if the performance period is one year or less) as of the most recent calendar quarter-end. They assume reinvestment of all distributions at NAV. These returns reflect a maximum initial sales charge of 5.5% for Class A Shares and the assumed contingent deferred sales charge for Class C Shares (1% if redeemed within 12 months of purchase). Effective July 30, 2018, Class C Shares convert automatically to Class A Shares on or about the fifteenth day of the last month of the calendar quarter that is ten years after the purchase date. The Since Inception returns for Class C Shares do not reflect the conversion to Class A Shares after the first ten years of performance. Because Institutional, Investor, Class P and Class R6 Shares do not involve a sales charge, such a charge is not applied to their Standardized Total Returns. |
The returns set forth in the tables above represent past performance. Past performance does not guarantee future results. The Fund’s investment return andprincipal value will fluctuate so that an investor’s shares, when redeemed, may be worth more or less than their original cost. Current performance may be lower or higher than the performance quoted above. Please visit our web site at www.GSAMFUNDS.com to obtain the most recent month-end returns. Performance reflects applicable fee waivers and/or expense limitations in effect during the periods shown. In their absence, performance would be reduced. Returns do not reflect the deduction of taxes that a shareholder would pay on Fund distributions or the redemption of Fund shares.
12
FUND BASICS
| | | | | | | | | | |
| | EXPENSE RATIOS4 | |
| | | |
| | | | | Net Expense Ratio (Current) | | | Gross Expense Ratio (Before Waivers) | |
| | | |
| | Class A | | | 1.38 | % | | | 1.73 | % |
| | Class C | | | 2.13 | | | | 2.48 | |
| | Institutional | | | 0.99 | | | | 1.34 | |
| | Investor | | | 1.13 | | | | 1.48 | |
| | Class P | | | 0.98 | | | | 1.33 | |
| | | Class R6 | | | 0.98 | | | | 1.33 | |
| | 4 | | The expense ratios of the Fund, both current (net of applicable fee waivers and/or expense limitations) and before waivers (gross of applicable fee waivers and/or expense limitations) are as set forth above according to the most recent publicly available Prospectus for the Fund and may differ from the expense ratios disclosed in the Financial Highlights in this report. Pursuant to contractual arrangements, the Fund’s waivers and/or expense limitations will remain in place through at least April 30, 2020, and prior to such date the Investment Adviser may not terminate the arrangements without the approval of the Fund’s Board of Trustees. If these arrangements are discontinued in the future, the expense ratios may change without shareholder approval. |
| | | | | | | | |
| | TOP TEN HOLDINGS AS OF6/30/195 |
| | | | |
| | | Holding | | % of Net Assets | | Line of Business | | Country |
| | | | |
| | Vonovia SE | | 7.6% | | Real Estate Operating Companies | | Germany |
| | Sun Hung Kai Properties Ltd. | | 6.1 | | Diversified | | Hong Kong |
| | Mitsubishi Estate Co. Ltd. | | 5.9 | | Diversified | | Japan |
| | CK Asset Holdings Ltd. | | 5.7 | | Real Estate Development | | Hong Kong |
| | Sumitomo Realty & Development Co. Ltd. | | 4.6 | | Diversified | | Japan |
| | Mitsui Fudosan Co. Ltd. | | 3.1 | | Diversified | | Japan |
| | GLP J-REIT (REIT) | | 3.0 | | Industrial | | Japan |
| | Link REIT (REIT) | | 2.7 | | Retail | | Hong Kong |
| | GPT Group (The) (REIT) | | 2.7 | | Diversified | | Australia |
| | | UNITE Group plc (The) (REIT) | | 2.6 | | Residential | | United Kingdom |
| | 5 | | The top 10 holdings may not be representative of the Fund’s future investments. |
13
FUND BASICS
|
| FUND VS. BENCHMARK COUNTRY ALLOCATION6 |
|
| As of June 30, 2019 |
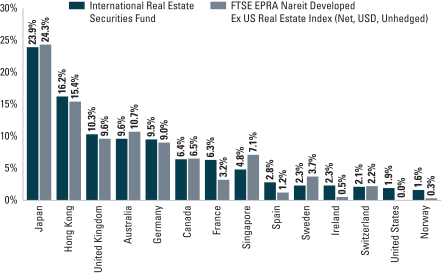
| | 6 | | The Fund is actively managed and, as such, its composition may differ over time. Consequently, the Fund’s overall country allocations may differ from percentages contained in the graph above. The graph categorizes investments’ country of domicile as reported by Bloomberg; however, the country classifications used by the portfolio management team may differ from Bloomberg. The percentage shown for each country reflects the value of investments in that category as a percentage of market value. Figures in the above graph may not sum to 100% due to the exclusion of other assets and liabilities. |
14
PORTFOLIO RESULTS
Goldman Sachs Real Estate Securities Fund
Investment Objective
The Fund seeks total return comprised of long-term growth of capital and dividend income.
Portfolio Management Discussion and Analysis
Below, the Goldman Sachs Real Estate Securities Investment Team discusses the Goldman Sachs Real Estate Securities Fund’s (the “Fund”) performance and positioning for the six-month period ended June 30, 2019 (the “Reporting Period”).
| Q | | How did the Fund perform during the Reporting Period? |
| A | | During the Reporting Period, the Fund’s Class A, Class C, Institutional, Service, Investor, Class P, Class R and Class R6 Shares generated cumulative total returns, without sales charges, of 17.81%, 17.36%, 18.02%, 17.77%, 17.92%, 18.04%, 17.64% and 18.03%, respectively. These returns compare to the 17.90% cumulative total return of the Fund’s benchmark, the Wilshire U.S. Real Estate Securities Index (with dividends reinvested) (the “Wilshire Index”) during the same period. |
| Q | | What economic and market factors most influenced the U.S. real estate securities market as a whole during the Reporting Period? |
| A | | The U.S. real estate securities market, as represented by the Wilshire Index, posted double-digit positive absolute returns during the Reporting Period that only modestly lagged the broad U.S. equity market, as represented by the S&P 500® Index, which returned 18.54% for the same period. |
| | For the first quarter of 2019, the Wilshire Index increased a robust 16.06%. Real estate investment trusts (“REITs”) benefited, as investors largely accepted a modest slowdown in global economic growth as well as lowered consensus expectations of a recession in the near term. While all REIT subsectors in the Wilshire Index posted positive returns in the first calendar quarter, industrial and technology REITs were the top performers, while self storage and health care were the weakest subsectors. Industrial REITs appreciated due to strong fourth quarter 2018 earnings results and favorable 2019 guidance, while health care REITs underperformed the Wilshire Index due to the subsector’s defensive nature during a period when the broad U.S. equity market rallied as well as on concerns around a supply/demand imbalance in senior housing. |
| | The Wilshire Index increased a more modest 1.62% during the second quarter of 2019. The single family, industrial and data center subsectors led the way, while malls, lodging and office subsectors proved laggards. Industrial REITs benefited from a solid first quarter 2019 earnings season and from secular demand trends to improve logistic facilities as a result of ongoing e-commerce trends. On the other hand, malls struggled as a result of store closures and bankruptcy announcements. |
| | For the Reporting Period overall, the strongest subsectors in the Wilshire Index were industrial, technology and triple net. Conversely, retail, hotel and office subsectors were the weakest performers within the Wilshire Index during the Reporting Period but still posted solid positive absolute gains. (Triple net properties are typically single-tenant retail properties leased to tenants with high credit ratings on “net, net, net” terms, meaning the tenant is responsible for real estate taxes, insurance, and all maintenance.) |
| Q | | What key factors were responsible for the Fund’s performance during the Reporting Period? |
| A | | Most share classes of the Fund either outperformed or only slightly underperformed the Wilshire Index during the Reporting Period, as both stock selection and allocation decisions overall added value. Contributing most positively to the Fund’s relative results was effective individual stock selection in the office, hotel and health care subsectors.* Having underweights relative to the Wilshire Index in the office and retail subsectors, which each underperformed the Wilshire Index during the Reporting Period, also boosted the Fund’s relative performance. Partially offsetting these |
| | positive contributors was weak stock selection in the self storage and retail subsectors, which detracted. Both stock selection and having an underweighted allocation to the strongly performing triple net subsector also hurt. Having a position in cash during a period when the Wilshire Index rallied dampened the Fund’s relative results as well. |
15
PORTFOLIO RESULTS
| Q | | What were some of the Fund’s best-performing individual holdings? |
| A | | Prologis, a global leader in logistics real estate, was the strongest positive contributor to the Fund’s performance during the Reporting Period. Shares of the U.S. company appreciated during the Reporting Period, as Prologis continued to benefit from positive trends in the industrial subsector, as industries work toward supply-chain reconfiguration to limit transportation times. Investors also grew to appreciate its management’s comments that the subsector is only in the second inning of the supply-chain reconfiguration cycle and much more work is to be done. At the end of the Reporting Period, we believed Prologis may benefit ahead from the stabilization of its development pipeline, its existing land bank and what we view as its healthy balance sheet. |
| | Vornado Realty Trust, an owner of office and retail properties, was also a top contributor to Fund returns during the Reporting Period. Shares of Vornado Realty Trust underperformed the Wilshire Index during the Reporting Period, which benefited the Fund given its underweight position in the REIT. Its shares had appreciated early in the Reporting Period in line with the broader real estate market, but then fell after the company reported soft fourth quarter 2018 results. Ultimately, we viewed this as an attractive exit point and decided to sell the Fund’s position in Vornado Realty Trust and allocate capital to names with what we felt had greater risk/reward potential. |
| | Interxion Holding, a cloud-neutral colocation data center, was a new purchase for the Fund during the Reporting Period and a strong positive contributor to the Fund’s results. Its shares benefited during the Reporting Period from strong demand for its services in Europe, largely driven by Frankfurt, Amsterdam, Paris and Marseilles. The market also reacted favorably to the company’s first quarter 2019 results that were released in May 2019 and to the announcement that Prologis will increase its presence in the African market, opening a door for Interxion Holding as well. At the end of the Reporting Period, we believed the company may benefit from ongoing secular demand trends from cloud platforms, digital content and enterprises in its core markets. Furthermore, we were positive on Interxion Holding’s expanding footprint and strong bookings reported in the fourth quarter of 2018, which we expect may continue as 2019 progresses. |
| Q | | What were some of the Fund’s weakest-performing individual holdings? |
| A | | Equinix, a data center provider, was the top detractor from the Fund’s relative results during the Reporting Period. While its stock price appreciated, Equinix detracted given the Fund’s underweight position in the company. The company reported solid fourth quarter 2018 results and 2019 guidance, as operational momentum built and global bookings reached record levels. The company also benefited from the ongoing demand for data storage. In our view, Equinix is an asset with compelling upside potential to revenues and free cash flow as it capitalizes on secular trends in technology. |
| | Simon Property Group, a U.S.-based owner and operator of retail real estate properties, detracted from the Fund’s relative performance as well. Despite leasing spreads accelerating during the first quarter of 2019, the market reacted to the company’s reported first quarter 2019 same-store net operating income, which was lower than it expected. Still, in our view, the company maintained a top-tier portfolio of assets at the end of the Reporting Period as well as one of the strongest balance sheets relative to its peers. We also believed its management team was a great capital allocator, had the potential to generate high cash flow growth and would likely be opportunistic during periods of distress as it seeks to create value. |
| | Urban Edge Properties, a retail real estate manager in urban communities and a new purchase for the Fund during the Reporting Period, also detracted from the Fund’s returns during the Reporting Period. Its shares were challenged as many of the company’s large anchor tenants declared bankruptcy, and Urban Edge Properties reported weak first quarter 2019 results. Despite what we see as these short-term headwinds, we remained favorable on the company at the end of the Reporting Period and on its management’s strategic plan to redevelop specific properties and transition them into more vibrant retailers. |
| Q | | How did the Fund use derivatives and similar instruments during the Reporting Period? |
| A | | During the Reporting Period, the Fund used forward contracts to reduce currency risk. This had a modestly positive effect on the Fund’s performance. |
| Q | | Did the Fund make any significant purchases or sales during the Reporting Period? |
| A | | During the Reporting Period, we established a Fund position in Invitation Homes, a U.S. owner and operator of single-family |
16
PORTFOLIO RESULTS
| | rental homes. We believe the company has created a well-located, high quality portfolio of assets and, in our view, has the potential to benefit from the recent supply/demand backdrop. In 2018, the company was challenged by volatile operating expenses due to one-time taxes and platform integration. However, we believe its expenses should be less volatile in the coming years due to merger synergies. Additionally, we are positive on Invitation Homes’ improved repair and maintenance system, which may lead to better returns. |
| | We initiated a Fund position in Crown Castle International, a U.S.-based provider of wireless communications infrastructure. Crown Castle International continues to benefit from secular data consumption trends in the tower space, which we expect may continue. Looking ahead, we remain positive on the company’s ability to grow its dividend over the long term and encouraged by growth in its fiber/small cell business. |
| | Conversely, in addition to the sale of Vornado Realty Trust, already mentioned, we exited the Fund’s position in JBG SMITH Properties, an owner of office, multi-family and retail properties in the Washington, DC metro area. Although we were supportive of the company due to what we consider to be its high quality management team and development pipeline, its stock reached our price target. Thus, we viewed this as an attractive exit point and decided to use the capital to fund higher conviction ideas. |
| Q | | Were there any changes made in the Fund’s investment strategy during the Reporting Period? |
| A | | In constructing the Fund’s portfolio, we focus on picking securities rather than on making real estate subsector bets. We seek to outpace the benchmark index by overweighting stocks that we expect to outperform and underweighting those that we think may lag. Consequently, changes in its real estate subsector weights are generally the direct result of individual stock selection or of real estate securities’ appreciation or depreciation. That said, during the Reporting Period, the Fund’s exposure to the industrial, residential, self storage and technology subsectors increased relative to the Wilshire Index and its exposure to the office and retail subsectors decreased relative to the Wilshire Index. We also established a position in the triple net subsector during the Reporting Period. |
| Q | | How was the Fund positioned relative to its benchmark index at the end of the Reporting Period? |
| A | | From a subsector perspective, the Fund had an underweighted exposure compared to the Wilshire Index in the retail subsector and was rather neutrally weighted in the remaining subsectors of the Wilshire Index at the end of the Reporting Period. |
| Q | | What is the Fund’s tactical view and strategy for the months ahead? |
| A | | At the end of the Reporting Period, we maintained a constructive outlook for U.S. REITs overall for several reasons. First, we felt the macro backdrop for REITs had improved with a moderating economic growth outlook and anticipation of lower interest rates. This improved backdrop may be, in our view, a positive for financing costs, which, in turn, may translate to increased flows from equity investors seeking defense, yield and potentially better returns. Second, despite being late in the real estate cycle, we believed fundamentals remained generally healthy, with limited new supply, which we expect to persist given rising construction costs and long development cycles across most subsectors, and stable or improving demand, which should support revenue growth stemming from rising occupancies and/or rents. Third, in our opinion, the dividend sustainability potential of REITs is high due to healthy fundamentals, improved balance sheets with meaningfully less leverage than at the peak in 2008/2009, and dividend payout ratios near record lows on a historical basis. Fourth, we believed the quality of REITs’ growth has improved given the increasing importance of non-core exposures, which currently represent about half of the U.S. REIT universe, a sharp increase from the approximately 20% representation ten years ago. Fifth, increased merger and acquisition activity should provide additional support to the sector, as record levels of private capital may translate to price discovery in listed markets. Finally, we believed valuations of most REITs remained attractive. |
| | Against this backdrop, we believe U.S. REIT returns may fall somewhere between those of equities and fixed income over the long term given that U.S. REITs offer some equity-like attributes, such as the ability to grow, and some fixed income-like attributes, such as attractive yield. For the remainder of the calendar year, we believe U.S. REITs may offer attractive returns that outperform both fixed income and equities, especially cyclical equities, given moderating interest rate and economic growth market expectations. We believe such U.S. REIT returns will be comprised of dividend yield and growth (factoring in no multiple expansion), with the potential for upside from merger and acquisition activity. |
| | * | | Sector and subsector allocations are defined by GSAM and may differ from sector and subsector allocations used by the Wilshire Index. |
17
FUND BASICS
Real Estate Securities Fund
as of June 30, 2019
| | | | | | | | | | |
| | PERFORMANCE REVIEW | |
| | | |
| | | January 1, 2019–June 30, 2019 | | Fund Total Return
(based on NAV)1 | | | Wilshire U.S. Real Estate
Securities Index2 | |
| | | |
| | Class A | | | 17.81 | % | | | 17.90 | % |
| | Class C | | | 17.36 | | | | 17.90 | |
| | Institutional | | | 18.02 | | | | 17.90 | |
| | Service | | | 17.77 | | | | 17.90 | |
| | Investor | | | 17.92 | | | | 17.90 | |
| | Class P | | | 18.04 | | | | 17.90 | |
| | Class R | | | 17.64 | | | | 17.90 | |
| | | Class R6 | | | 18.03 | | | | 17.90 | |
| | 1 | | The net asset value (“NAV”) represents the net assets of the class of the Fund (ex-dividend) divided by the total number of shares of the class outstanding. The Fund’s performance reflects the reinvestment of dividends and other distributions. The Fund’s performance does not reflect the deduction of any applicable sales charges. |
| | 2 | | The Wilshire U.S. Real Estate Securities Index is an unmanaged market capitalization-weighted index comprised of publicly traded REITs and real estate operating companies. The figures do not reflect any fees or expenses. It is not possible to invest directly in an index. |
| | | | | | | | | | | | | | | | | | | | | | |
| | STANDARDIZED TOTAL RETURNS3 | |
| | | | | | |
| | | For the period ended 6/30/19 | | One Year | | | Five Years | | | Ten Years | | | Since Inception | | | Inception Date | |
| | | | | | |
| | Class A | | | 3.98 | % | | | 5.22 | % | | | 13.82 | % | | | 8.86 | % | | | 7/27/98 | |
| | Class C | | | 8.07 | | | | 5.62 | | | | 13.60 | | | | 8.35 | | | | 7/27/98 | |
| | Institutional | | | 10.50 | | | | 6.85 | | | | 14.93 | | | | 9.60 | | | | 7/27/98 | |
| | Service | | | 9.88 | | | | 6.30 | | | | 14.33 | | | | 9.06 | | | | 7/27/98 | |
| | Investor | | | 10.36 | | | | 6.69 | | | | 14.74 | | | | 5.81 | | | | 11/30/07 | |
| | Class P | | | 10.45 | | | | N/A | | | | N/A | | | | 16.05 | | | | 4/17/18 | |
| | Class R | | | 9.81 | | | | 6.16 | | | | 14.18 | | | | 5.30 | | | | 11/30/07 | |
| | | Class R6 | | | 10.44 | | | | N/A | | | | N/A | | | | 6.09 | | | | 7/31/15 | |
| | 3 | | The Standardized Total Returns are average annual total returns or cumulative total returns (only if the performance period is one year or less) as of the most recent calendar quarter-end or cumulative total returns for periods of 1 year or less. They assume reinvestment of all distributions at NAV. These returns reflect a maximum initial sales charge of 5.5% for Class A Shares and the assumed contingent deferred sales charge for Class C Shares (1% if redeemed within 12 months of purchase). Effective July 30, 2018, Class C Shares convert automatically to Class A Shares on or about the fifteenth day of the last month of the calendar quarter that is ten years after the purchase date. The Since Inception returns for Class C Shares do not reflect the conversion to Class A Shares after the first ten years of performance. Because Institutional, Service, Investor, Class P, Class R and Class R6 Shares do not involve a sales charge, such a charge is not applied to their Standardized Total Returns. |
The returns set forth in the tables above represent past performance. Past performance does not guarantee future results. The Fund’s investment return and principal value will fluctuate so that an investor’s shares, when redeemed, may be worth more or less than their original cost. Current performance may be lower or higher than the performance quoted above. Please visit our web site at www.GSAMFUNDS.com to obtain the most recent month-end returns.
18
FUND BASICS
Performance reflects applicable fee waivers and/or expense limitations in effect during the periods shown. In their absence, performance would be reduced. Returns do not reflect the deduction of taxes that a shareholder would pay on Fund distributions or the redemption of Fund shares.
| | | | | | | | | | |
| | EXPENSE RATIOS4 | |
| | | |
| | | | | Net Expense Ratio (Current) | | | Gross Expense Ratio (Before Waivers) | |
| | | |
| | Class A | | | 1.30 | % | | | 1.45 | % |
| | Class C | | | 2.05 | | | | 2.20 | |
| | Institutional | | | 0.91 | | | | 1.06 | |
| | Service | | | 1.41 | | | | 1.56 | |
| | Investor | | | 1.05 | | | | 1.20 | |
| | Class P | | | 0.90 | | | | 1.05 | |
| | Class R | | | 1.55 | | | | 1.70 | |
| | | Class R6 | | | 0.90 | | | | 1.05 | |
| | 4 | | The expense ratios of the Fund, both current (net of applicable fee waivers and/or expense limitations) and before waivers (gross of applicable fee waivers and/or expense limitations) are as set forth above according to the most recent publicly available Prospectus for the Fund and may differ from the expense ratios disclosed in the Financial Highlights in this report. Pursuant to contractual arrangements, the Fund’s waivers and/or expense limitations will remain in place through at least April 30, 2020, and prior to such date the Investment Adviser may not terminate the arrangements without the approval of the Fund’s Board of Trustees. If these arrangements are discontinued in the future, the expense ratios may change without shareholder approval. |
| | | | | | | | |
| | TOP TEN HOLDINGS AS OF 6/30/195 |
| | | |
| | | Holding | | % of Net Assets | | | Subsectors |
| | | |
| | Prologis, Inc. (REIT) | | | 8.1 | % | | Industrial |
| | Simon Property Group, Inc. (REIT) | | | 7.4 | | | Retail |
| | AvalonBay Communities, Inc. (REIT) | | | 5.7 | | | Residential |
| | Equity Residential (REIT) | | | 5.2 | | | Residential |
| | Ventas, Inc. (REIT) | | | 4.4 | | | Health Care |
| | Public Storage (REIT) | | | 4.0 | | | Specialized |
| | Alexandria Real Estate Equities, Inc. (REIT) | | | 3.8 | | | Office |
| | HCP, Inc. (REIT) | | | 3.5 | | | Health Care |
| | Equinix, Inc. (REIT) | | | 3.4 | | | Specialized |
| | | Boston Properties, Inc. (REIT) | | | 3.1 | | | Office |
| | 5 | | The top 10 holdings may not be representative of the Fund’s future investments. |
19
FUND BASICS
|
| FUND VS. BENCHMARK SECTOR ALLOCATION6 |
|
| As of June 30, 2019 |
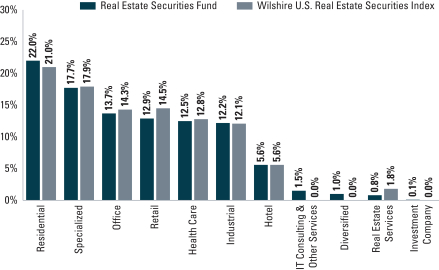
| | 6 | | The Fund is actively managed and, as such, its composition may differ over time. Consequently, the Fund’s overall sector allocations may differ from percentages contained in the graph above. The graph categorizes investments using Global Industry Classification Standard (“GICS”); however, the sector classifications used by the portfolio management team may differ from GICS. The percentage shown for each investment category reflects the value of investments in that category as a percentage of market value. Underlying sector allocations of exchange traded funds and investment companies held by the Fund are not reflected in the graph above. Figures in the above graph may not sum to 100% due to the exclusion of other assets and liabilities. The graph depicts the Fund’s investments but may not represent the Fund’s market exposure due to the exclusion of certain derivatives, if any, as listed in the Additional Investment Information section of the Schedule of Investments. |
20
FUND BASICS
Index Definitions:
S&P 500® Index is a U.S. stock market index based on the market capitalizations of 500 large companies having common stock listed on the New York Stock Exchange or NASDAQ. The S&P 500® Index components and their weightings are determined by S&P Dow Jones Indices.
TheMSCI® EAFE Index is a market capitalization-weighted composite of securities in 21 developed markets. The MSCI® EAFE Index approximates the minimum possible dividend reinvestment. The dividend is reinvested after deduction for withholding tax, applying the rate to non-resident individuals who do not benefit from double taxation treaties. MSCI® Inc. uses withholding tax rates applicable to Luxembourg holding companies, as Luxembourg applies the highest rates. The MSCI® EAFE Index is unmanaged and the figures for the MSCI® EAFE Index do not include any deduction for fees or expenses. It is not possible to invest directly in an index.
21
GOLDMAN SACHS GLOBAL REAL ESTATE SECURITIES FUND
Schedule of Investments
June 30, 2019 (Unaudited)
| | | | | | | | |
| Shares | | | Description | |
Value | |
|
| Common Stocks – 98.3% | |
| Australia – 5.0% | |
| | 839,810 | | | Centuria Industrial REIT (REIT) (Industrial) | | $ | 1,806,189 | |
| | 1,444,235 | | | Cromwell Property Group (REIT) (Office) | | | 1,171,083 | |
| | 257,093 | | | Goodman Group (REIT) (Industrial) | | | 2,717,417 | |
| | 936,582 | | | GPT Group (The) (REIT) (Diversified) | | | 4,046,831 | |
| | 571,454 | | | Mirvac Group (REIT) (Diversified) | | | 1,257,962 | |
| | 353,611 | | | Scentre Group (REIT) (Retail) | | | 954,318 | |
| | | | | | | | |
| | | | | | | 11,953,800 | |
| | |
| Canada – 3.1% | |
| | 47,937 | | | Allied Properties REIT (REIT) (Office) | | | 1,734,012 | |
| | 39,313 | | | Canadian Apartment Properties REIT (REIT) (Residential) | | | 1,451,779 | |
| | 203,248 | | | Chartwell Retirement Residences (Health Care) | | | 2,362,212 | |
| | 183,301 | | | Summit Industrial Income REIT (REIT) (Industrial) | | | 1,802,846 | |
| | | | | | | | |
| | | | | | | 7,350,849 | |
| | |
| France – 2.5% | |
| | 26,120 | | | Gecina SA (REIT) (Diversified) | | | 3,908,658 | |
| | 65,761 | | | Klepierre SA (REIT) (Retail) | | | 2,203,184 | |
| | | | | | | | |
| | | | | | | 6,111,842 | |
| | |
| Germany – 4.3% | |
| | 171,239 | | | alstria office REIT-AG (REIT) (Office) | | | 2,772,754 | |
| | 50,443 | | | Instone Real Estate Group AG (Real Estate Development)*(a) | | | 1,133,408 | |
| | 132,225 | | | Vonovia SE (Real Estate Operating Companies) | | | 6,316,364 | |
| | | | | | | | |
| | | | | | | 10,222,526 | |
| | |
| Hong Kong – 6.4% | |
| | 871,000 | | | CK Asset Holdings Ltd. (Real Estate Development) | | | 6,823,482 | |
| | 164,500 | | | Link REIT (REIT) (Retail) | | | 2,024,241 | |
| | 382,000 | | | Sun Hung Kai Properties Ltd. (Diversified) | | | 6,480,655 | |
| | | | | | | | |
| | | | | | | 15,328,378 | |
| | |
| Ireland – 1.9% | |
| | 186,956 | | | Dalata Hotel Group plc (Hotel) | | | 1,000,225 | |
| | 1,789,221 | | | Green REIT plc (REIT) (Office) | | | 3,682,672 | |
| | | | | | | | |
| | | | | | | 4,682,897 | |
| | |
| Japan – 11.5% | |
| | 702 | | | Activia Properties, Inc. (REIT) (Diversified) | | | 3,055,491 | |
| | 3,217 | | | GLP J-REIT (REIT) (Industrial) | | | 3,664,125 | |
| | 7,071 | | | Invincible Investment Corp. (REIT) (Hotel) | | | 3,662,620 | |
| | |
|
| Common Stocks – (continued) | |
| Japan – (continued) | |
| | 2,100 | | | Japan Rental Housing Investments, Inc. (REIT) (Residential) | | | 1,632,686 | |
| | 371,500 | | | Mitsubishi Estate Co. Ltd. (Diversified) | | | 6,923,815 | |
| | 742 | | | Mitsui Fudosan Logistics Park, Inc. (REIT) (Industrial) | | | 2,523,410 | |
| | 701 | | | Sankei Real Estate, Inc. (REIT) (Office)* | | | 773,963 | |
| | 145,400 | | | Sumitomo Realty & Development Co. Ltd. (Diversified) | | | 5,201,649 | |
| | | | | | | | |
| | | | | | | 27,437,759 | |
| | |
| Norway – 1.1% | |
| | 172,088 | | | Entra ASA (Real Estate Operating Companies)(a) | | | 2,644,934 | |
| | |
| Singapore – 3.3% | |
| | 2,867,400 | | | Ascendas India Trust (Real Estate Operating Companies) | | | 2,882,235 | |
| | 982,900 | | | CapitaLand Ltd. (Diversified) | | | 2,566,577 | |
| | 205,300 | | | City Developments Ltd. (Diversified) | | | 1,438,113 | |
| | 627,400 | | | Mapletree Industrial Trust (REIT) (Industrial) | | | 1,039,080 | |
| | | | | | | | |
| | | | | | | 7,926,005 | |
| | |
| Spain – 2.0% | |
| | 40,107 | | | Aedas Homes SAU (Real Estate Development)*(a) | | | 953,158 | |
| | 269,240 | | | Merlin Properties Socimi SA (REIT) (Diversified) | | | 3,732,070 | |
| | | | | | | | |
| | | | | | | 4,685,228 | |
| | |
| Sweden – 1.4% | |
| | 176,521 | | | Castellum AB (Real Estate Operating Companies) | | | 3,377,681 | |
| | |
| United Kingdom – 4.8% | |
| | 205,840 | | | Big Yellow Group plc (REIT) (Specialized) | | | 2,588,915 | |
| | 1,894,499 | | | Tritax Big Box REIT plc (REIT) (Industrial) | | | 3,715,143 | |
| | 1,951,408 | | | Tritax EuroBox plc (REIT) (Diversified)(a) | | | 2,374,272 | |
| | 237,378 | | | UNITE Group plc (The) (REIT) (Residential) | | | 2,937,270 | |
| | | | | | | | |
| | | | | | | 11,615,600 | |
| | |
| United States – 51.0% | |
| | 31,436 | | | Alexandria Real Estate Equities, Inc. (REIT) (Office) | | | 4,435,305 | |
| | 36,815 | | | AvalonBay Communities, Inc. (REIT) (Residential) | | | 7,480,072 | |
| | 30,741 | | | Boston Properties, Inc. (REIT) (Office) | | | 3,965,589 | |
| | 45,099 | | | Camden Property Trust (REIT) (Residential) | | | 4,707,885 | |
| | |
| | |
| 22 | | The accompanying notes are an integral part of these financial statements. |
GOLDMAN SACHS GLOBAL REAL ESTATE SECURITIES FUND
Schedule of Investments(continued)
June 30, 2019 (Unaudited)
| | | | | | | | |
| Shares | | | Description | |
Value | |
|
| Common Stocks – (continued) | |
| United States – (continued) | |
| | 85,699 | | | Chesapeake Lodging Trust (REIT) (Hotel) | | $ | 2,435,566 | |
| | 16,285 | | | Crown Castle International Corp. (REIT) (Specialized) | | | 2,122,750 | |
| | 71,315 | | | Cushman & Wakefield plc (Real Estate Services)* | | | 1,275,112 | |
| | 66,140 | | | CyrusOne, Inc. (REIT) (Specialized) | | | 3,817,601 | |
| | 40,110 | | | Douglas Emmett, Inc. (REIT) (Office) | | | 1,597,982 | |
| | 113,981 | | | Duke Realty Corp. (REIT) (Industrial) | | | 3,602,939 | |
| | 23,219 | | | Equity LifeStyle Properties, Inc. (REIT) (Residential) | | | 2,817,393 | |
| | 87,240 | | | Equity Residential (REIT) (Residential) | | | 6,623,261 | |
| | 14,438 | | | Essex Property Trust, Inc. (REIT) (Residential) | | | 4,214,885 | |
| | 30,314 | | | Extra Space Storage, Inc. (REIT) (Specialized) | | | 3,216,315 | |
| | 21,999 | | | Federal Realty Investment Trust (REIT) (Retail) | | | 2,832,591 | |
| | 189,809 | | | HCP, Inc. (REIT) (Health Care) | | | 6,070,092 | |
| | 88,908 | | | Healthcare Realty Trust, Inc. (REIT) (Health Care) | | | 2,784,599 | |
| | 57,779 | | | Hudson Pacific Properties, Inc. (REIT) (Office) | | | 1,922,307 | |
| | 151,241 | | | Invitation Homes, Inc. (REIT) (Residential) | | | 4,042,672 | |
| | 30,630 | | | Kilroy Realty Corp. (REIT) (Office) | | | 2,260,800 | |
| | 22,781 | | | Life Storage, Inc. (REIT) (Specialized) | | | 2,166,017 | |
| | 53,919 | | | Pebblebrook Hotel Trust (REIT) (Hotel) | | | 1,519,437 | |
| | 116,477 | | | Prologis, Inc. (REIT) (Industrial) | | | 9,329,808 | |
| | 17,068 | | | Public Storage (REIT) (Specialized) | | | 4,065,086 | |
| | 33,624 | | | Realty Income Corp. (REIT) (Retail) | | | 2,319,047 | |
| | 168,780 | | | RLJ Lodging Trust (REIT) (Hotel) | | | 2,994,157 | |
| | 19,330 | | | Ryman Hospitality Properties, Inc. (REIT) (Hotel) | | | 1,567,470 | |
| | 57,960 | | | Simon Property Group, Inc. (REIT) (Retail) | | | 9,259,690 | |
| | 127,070 | | | SITE Centers Corp. (REIT) (Retail) | | | 1,682,407 | |
| | 25,777 | | | SL Green Realty Corp. (REIT) (Office) | | | 2,071,698 | |
| | 48,910 | | | STAG Industrial, Inc. (REIT) (Industrial) | | | 1,479,038 | |
| | 91,674 | | | STORE Capital Corp. (REIT) (Diversified) | | | 3,042,660 | |
| | 93,238 | | | Urban Edge Properties (REIT) (Retail) | | | 1,615,815 | |
| | 81,492 | | | Ventas, Inc. (REIT) (Health Care) | | | 5,569,978 | |
| | 15,653 | | | WP Carey, Inc. (REIT) (Diversified) | | | 1,270,711 | |
| | | | | | | | |
| | | | | | | 122,178,735 | |
| | |
| | TOTAL COMMON STOCKS | |
| | (Cost $209,332,224) | | $ | 235,516,234 | |
| | |
| Shares | | | Dividend
Rate | | Value | |
|
| Investment Company(b) – 1.9% | |
| Goldman Sachs Financial Square Government Fund –
Institutional Shares |
|
| | 4,520,531 | | | 2.308% | | $ | 4,520,531 | |
| (Cost $4,520,531) | |
| | |
| | TOTAL INVESTMENTS – 100.2% | |
| | (Cost $213,852,755) | | $ | 240,036,765 | |
| | |
| LIABILITIES IN EXCESS OF
OTHER ASSETS – (0.2)% | | | (583,887 | ) |
| | |
| | NET ASSETS –100.0% | | $ | 239,452,878 | |
| | |
| | |
|
| The percentage shown for each investment category reflects the value of investments in that category as a percentage of net assets. |
| |
* | | Non-income producing security. |
| |
(a) | | Exempt from registration under Rule 144A of the Securities Act of 1933. |
| |
(b) | | Represents an Affiliated Issuer. |
| | | | |
|
Investment Abbreviation: |
REIT | | —Real Estate Investment Trust |
|
| | |
| The accompanying notes are an integral part of these financial statements. | | 23 |
GOLDMAN SACHS INTERNATIONAL REAL ESTATE SECURITIES FUND
Schedule of Investments
June 30, 2019 (Unaudited)
| | | | | | | | |
| Shares | | | Description | |
Value | |
|
| Common Stocks – 98.3% | |
| Australia – 9.6% | |
| | 337,383 | | | Centuria Industrial REIT (REIT) (Industrial) | | $ | 725,614 | |
| | 722,809 | | | Cromwell Property Group (REIT) (Office) | | | 586,102 | |
| | 138,906 | | | Goodman Group (REIT) (Industrial) | | | 1,468,206 | |
| | 527,416 | | | GPT Group (The) (REIT) (Diversified) | | | 2,278,886 | |
| | 549,775 | | | Mirvac Group (REIT) (Diversified) | | | 1,210,239 | |
| | 683,813 | | | Scentre Group (REIT) (Retail) | | | 1,845,460 | |
| | | | | | | | |
| | | | | | | 8,114,507 | |
| | |
| Canada – 6.5% | |
| | 36,115 | | | Allied Properties REIT (REIT) (Office) | | | 1,306,378 | |
| | 33,577 | | | Canadian Apartment Properties REIT (REIT) (Residential) | | | 1,239,955 | |
| | 176,758 | | | Chartwell Retirement Residences (Health Care) | | | 2,054,337 | |
| | 86,395 | | | Summit Industrial Income REIT (REIT) (Industrial) | | | 849,733 | |
| | | | | | | | |
| | | | | | | 5,450,403 | |
| | |
| France – 6.3% | |
| | 14,827 | | | Gecina SA (REIT) (Diversified) | | | 2,218,747 | |
| | 60,251 | | | Klepierre SA (REIT) (Retail) | | | 2,018,583 | |
| | 7,394 | | | Unibail-Rodamco-Westfield (REIT) (Retail) | | | 1,107,717 | |
| | | | | | | | |
| | | | | | | 5,345,047 | |
| | |
| Germany – 9.5% | |
| | 73,778 | | | alstria office REIT-AG (REIT) (Office) | | | 1,194,636 | |
| | 19,618 | | | Instone Real Estate Group AG (Real Estate Development)*(a) | | | 440,798 | |
| | 134,146 | | | Vonovia SE (Real Estate Operating Companies) | | | 6,408,130 | |
| | | | | | | | |
| | | | | | | 8,043,564 | |
| | |
| Hong Kong – 16.3% | |
| | 611,000 | | | CK Asset Holdings Ltd. (Real Estate Development) | | | 4,786,622 | |
| | 128,400 | | | Hongkong Land Holdings Ltd. (Real Estate Operating Companies) | | | 827,631 | |
| | 188,500 | | | Link REIT (REIT) (Retail) | | | 2,319,571 | |
| | 302,975 | | | Sun Hung Kai Properties Ltd. (Diversified) | | | 5,139,991 | |
| | 95,000 | | | Wharf Real Estate Investment Co. Ltd. (Real Estate Operating Companies) | | | 669,505 | |
| | | | | | | | |
| | | | | | | 13,743,320 | |
| | |
| Ireland – 2.2% | |
| | 76,146 | | | Dalata Hotel Group plc (Hotel) | | | 407,385 | |
| | 711,200 | | | Green REIT plc (REIT) (Office) | | | 1,463,831 | |
| | | | | | | | |
| | | | | | | 1,871,216 | |
| | |
| Japan – 24.0% | |
| | 409 | | | Activia Properties, Inc. (REIT) (Diversified) | | | 1,780,193 | |
| | 2,204 | | | GLP J-REIT (REIT) (Industrial) | | | 2,510,330 | |
| | |
|
| Common Stocks – (continued) | |
| Japan – (continued) | |
| | 3,883 | | | Invincible Investment Corp. (REIT) (Hotel) | | | 2,011,307 | |
| | 1,104 | | | Japan Rental Housing Investments, Inc. (REIT) (Residential) | | | 858,327 | |
| | 268,600 | | | Mitsubishi Estate Co. Ltd. (Diversified) | | | 5,006,021 | |
| | 108,100 | | | Mitsui Fudosan Co. Ltd. (Diversified) | | | 2,627,283 | |
| | 294 | | | Mitsui Fudosan Logistics Park, Inc. (REIT) (Industrial) | | | 999,842 | |
| | 487 | | | Sankei Real Estate, Inc. (REIT) (Office)* | | | 537,689 | |
| | 109,700 | | | Sumitomo Realty & Development Co. Ltd. (Diversified) | | | 3,924,490 | |
| | | | | | | | |
| | | | | | | 20,255,482 | |
| | |
| Norway – 1.6% | |
| | 85,660 | | | Entra ASA (Real Estate Operating Companies)(a) | | | 1,316,565 | |
| | |
| Singapore – 4.8% | |
| | 1,443,600 | | | Ascendas India Trust (Real Estate Operating Companies) | | | 1,451,069 | |
| | 501,700 | | | CapitaLand Ltd. (Diversified) | | | 1,310,054 | |
| | 97,500 | | | City Developments Ltd. (Diversified) | | | 682,981 | |
| | 384,900 | | | Mapletree Industrial Trust (REIT) (Industrial) | | | 637,459 | |
| | | | | | | | |
| | | | | | | 4,081,563 | |
| | |
| Spain – 2.8% | |
| | 20,048 | | | Aedas Homes SAU (Real Estate Development)*(a) | | | 476,448 | |
| | 136,406 | | | Merlin Properties Socimi SA (REIT) (Diversified) | | | 1,890,792 | |
| | | | | | | | |
| | | | | | | 2,367,240 | |
| | |
| Sweden – 2.3% | |
| | 101,794 | | | Castellum AB (Real Estate Operating Companies) | | | 1,947,800 | |
| | |
| Switzerland – 2.1% | |
| | 15,385 | | | PSP Swiss Property AG (Registered) (Real Estate Operating Companies) | | | 1,798,047 | |
| | |
| United Kingdom – 10.3% | |
| | 144,169 | | | Big Yellow Group plc (REIT) (Specialized) | | | 1,813,259 | |
| | 46,137 | | | Derwent London plc (REIT) (Office) | | | 1,827,061 | |
| | 1,008,118 | | | Tritax Big Box REIT plc (REIT) (Industrial) | | | 1,976,935 | |
| | 735,842 | | | Tritax EuroBox plc (REIT) (Diversified)(a) | | | 895,297 | |
| | 179,523 | | | UNITE Group plc (The) (REIT) (Residential) | | | 2,221,383 | |
| | | | | | | | |
| | | | | | | 8,733,935 | |
| | |
| | TOTAL COMMON STOCKS | |
| | (Cost $79,635,661) | | $ | 83,068,689 | |
| | |
| | |
| 24 | | The accompanying notes are an integral part of these financial statements. |
GOLDMAN SACHS INTERNATIONAL REAL ESTATE SECURITIES FUND
Schedule of Investments(continued)
June 30, 2019 (Unaudited)
| | | | | | |
| Shares | | Dividend
Rate | | Value | |
|
| Investment Company(b) – 1.9% | |
Goldman Sachs Financial Square Government Fund – Institutional Shares | |
| 1,621,300 | | 2.308% | | $ | 1,621,300 | |
| (Cost $1,621,300) | |
| |
| TOTAL INVESTMENTS – 100.2% | |
| (Cost $81,256,961) | | $ | 84,689,989 | |
| |
LIABILITIES IN EXCESS OF
OTHER ASSETS – (0.2)% | | | (129,304 | ) |
| |
| NET ASSETS –100.0% | | $ | 84,560,685 | |
| |
| | |
|
| The percentage shown for each investment category reflects the value of investments in that category as a percentage of net assets. |
| |
* | | Non-income producing security. |
| |
(a) | | Exempt from registration under Rule 144A of the Securities Act of 1933. |
| |
(b) | | Represents an Affiliated Issuer. |
| | | | |
|
Investment Abbreviation: |
REIT | | —Real Estate Investment Trust |
|
| | |
| The accompanying notes are an integral part of these financial statements. | | 25 |
GOLDMAN SACHS REAL ESTATE SECURITIES FUND
Schedule of Investments
June 30, 2019 (Unaudited)
| | | | | | | | |
| Shares | | | Description | |
Value | |
|
| Common Stocks – 99.4% | |
| Diversified – 1.0% | |
| | 52,887 | | | STORE Capital Corp. (REIT) | | $ | 1,755,320 | |
| | |
| Health Care – 12.4% | |
| | 186,475 | | | HCP, Inc. (REIT) | | | 5,963,471 | |
| | 107,968 | | | Healthcare Realty Trust, Inc. (REIT) | | | 3,381,558 | |
| | 108,796 | | | Ventas, Inc. (REIT) | | | 7,436,207 | |
| | 49,619 | | | Welltower, Inc. (REIT) | | | 4,045,437 | |
| | | | | | | | |
| | | | | | | 20,826,673 | |
| | |
| Hotel – 5.5% | |
| | 30,146 | | | Chesapeake Lodging Trust (REIT) | | | 856,749 | |
| | 133,133 | | | Host Hotels & Resorts, Inc. (REIT) | | | 2,425,683 | |
| | 174,436 | | | RLJ Lodging Trust (REIT) | | | 3,094,495 | |
| | 36,681 | | | Ryman Hospitality Properties, Inc. (REIT) | | | 2,974,462 | |
| | | | | | | | |
| | | | | | | 9,351,389 | |
| | |
| Industrial – 12.2% | |
| | 158,792 | | | Duke Realty Corp. (REIT) | | | 5,019,415 | |
| | 168,969 | | | Prologis, Inc. (REIT) | | | 13,534,417 | |
| | 60,194 | | | STAG Industrial, Inc. (REIT) | | | 1,820,267 | |
| | | | | | | | |
| | | | | | | 20,374,099 | |
| | |
| IT Consulting & Other Services – 1.5% | |
| | 31,877 | | | InterXion Holding NV* | | | 2,425,521 | |
| | |
| Office – 13.7% | |
| | 45,165 | | | Alexandria Real Estate Equities, Inc. (REIT) | | | 6,372,330 | |
| | 40,506 | | | Boston Properties, Inc. (REIT) | | | 5,225,274 | |
| | 59,384 | | | Douglas Emmett, Inc. (REIT) | | | 2,365,859 | |
| | 84,009 | | | Hudson Pacific Properties, Inc. (REIT) | | | 2,794,979 | |
| | 42,202 | | | Kilroy Realty Corp. (REIT) | | | 3,114,930 | |
| | 38,217 | | | SL Green Realty Corp. (REIT) | | | 3,071,500 | |
| | | | | | | | |
| | | | | | | 22,944,872 | |
| | |
| Real Estate Services – 0.8% | |
| | 78,528 | | | Cushman & Wakefield plc* | | | 1,404,081 | |
| | |
| Residential – 21.9% | |
| | 47,433 | | | AvalonBay Communities, Inc. (REIT) | | | 9,637,437 | |
| | 46,701 | | | Camden Property Trust (REIT) | | | 4,875,117 | |
| | 32,014 | | | Equity LifeStyle Properties, Inc. (REIT) | | | 3,884,579 | |
| | 116,222 | | | Equity Residential (REIT) | | | 8,823,574 | |
| | 15,779 | | | Essex Property Trust, Inc. (REIT) | | | 4,606,363 | |
| | 186,213 | | | Invitation Homes, Inc. (REIT) | | | 4,977,473 | |
| | | | | | | | |
| | | | | | | 36,804,543 | |
| | |
| Retail – 12.8% | |
| | 30,817 | | | Acadia Realty Trust (REIT) | | | 843,461 | |
| | 28,173 | | | Federal Realty Investment Trust (REIT) | | | 3,627,555 | |
| | 78,092 | | | Simon Property Group, Inc. (REIT) | | | 12,475,978 | |
| | 167,489 | | | SITE Centers Corp. (REIT) | | | 2,217,554 | |
| | 135,312 | | | Urban Edge Properties (REIT) | | | 2,344,957 | |
| | | | | | | | |
| | | | | | | 21,509,505 | |
| | |
|
| Common Stocks – (continued) | |
| Specialized – 17.6% | |
| | 15,394 | | | Crown Castle International Corp. (REIT) | | | 2,006,608 | |
| | 64,840 | | | CyrusOne, Inc. (REIT) | | | 3,742,565 | |
| | 32,028 | | | Digital Realty Trust, Inc. (REIT) | | | 3,772,578 | |
| | 11,258 | | | Equinix, Inc. (REIT) | | | 5,677,297 | |
| | 44,702 | | | Extra Space Storage, Inc. (REIT) | | | 4,742,882 | |
| | 30,241 | | | Life Storage, Inc. (REIT) | | | 2,875,314 | |
| | 28,569 | | | Public Storage (REIT) | | | 6,804,279 | |
| | | | | | | | |
| | | | | | | 29,621,523 | |
| | |
| | TOTAL COMMON STOCKS | |
| | (Cost $111,488,147) | | $ | 167,017,526 | |
| | |
| | | | | | |
| Shares | | Dividend
Rate | | Value | |
|
| Investment Company(a)– 0.1% | |
Goldman Sachs Financial Square Government Fund – Institutional Shares | |
| 166,590 | | 2.308% | | $ | 166,590 | |
| (Cost $166,590) | |
| |
| TOTAL INVESTMENTS – 99.5% | |
| (Cost $111,654,737) | | $ | 167,184,116 | |
| |
OTHER ASSETS IN EXCESS OF
LIABILITIES – 0.5% | | | 923,574 | |
| |
| NET ASSETS – 100.0% | | $ | 168,107,690 | |
| |
| | |
|
| The percentage shown for each investment category reflects the value of investments in that category as a percentage of net assets. |
| |
* | | Non-income producing security. |
| |
(a) | | Represents an Affiliated Issuer. |
| | |
|
Investment Abbreviation: |
REIT | | —Real Estate Investment Trust |
| | |
Currency Abbreviations: |
EUR | | —Euro |
USD | | —United States Dollar |
|
| | |
| 26 | | The accompanying notes are an integral part of these financial statements. |
GOLDMAN SACHS REAL ESTATE SECURITIES FUND
Schedule of Investments(continued)
June 30, 2019 (Unaudited)
|
| ADDITIONAL INVESTMENT INFORMATION |
FORWARD FOREIGN CURRENCY EXCHANGE CONTRACT — At June 30, 2019, the Fund had the following forward foreign currency exchange contracts:
FORWARD FOREIGN CURRENCY EXCHANGE CONTRACT WITH UNREALIZED LOSS
| | | | | | | | | | | | | | | | | | | | |
| Counterparty | | Currency
Purchased | | | Currency
Sold | | | Settlement
Date | | | Unrealized
Loss | |
| | | | | | |
Bank of America NA | | USD | | | 1,724,813 | | | EUR | | | 1,532,000 | | | | 07/10/2019 | | | $ | (18,408 | ) |
| | |
| The accompanying notes are an integral part of these financial statements. | | 27 |
GOLDMAN SACHS REAL ESTATE SECURITIES FUNDS
Statements of Assets and Liabilities
June 30, 2019 (Unaudited)
| | | | | | | | | | | | | | |
| | | | | Global Real Estate
Securities Fund | | | International Real
Estate Securities
Fund | | | Real Estate
Securities Fund | |
| | Assets: | |
| | Investments in unaffiliated issuers, at value (cost $209,332,224, $79,635,661 and $111,488,147) | | $ | 235,516,234 | | | $ | 83,068,689 | | | $ | 167,017,526 | |
| | Investments in affiliated issuers, at value (cost $4,520,531, $1,621,300 and $166,590) | | | 4,520,531 | | | | 1,621,300 | | | | 166,590 | |
| | Cash | | | 740,175 | | | | 45,716 | | | | 579,937 | |
| | Foreign currencies, at value (cost $95,357, $108,340 and $0) | | | 95,373 | | | | 108,717 | | | | — | |
| | Receivables: | | | | | | | | | | | | |
| | Dividends | | | 1,010,277 | | | | 253,282 | | | | 720,345 | |
| | Foreign tax reclaims | | | 166,358 | | | | 275,491 | | | | — | |
| | Reimbursement from investment adviser | | | 33,833 | | | | 32,468 | | | | 36,864 | |
| | Fund shares sold | | | 4,990 | | | | 40,250 | | | | 33,443 | |
| | Investments sold | | | 4,353 | | | | 437,519 | | | | — | |
| | Other assets | | | 42,637 | | | | 60,108 | | | | 53,886 | |
| | Total assets | | | 242,134,761 | | | | 85,943,540 | | | | 168,608,591 | |
| | | | | | | | | | | | | | |
| | Liabilities: | |
| | Unrealized loss on forward foreign currency exchange contracts | | | — | | | | — | | | | 18,408 | |
| | Payables: | | | | | | | | | | | | |
| | Investments purchased | | | 2,337,980 | | | | 1,129,505 | | | | — | |
| | Management fees | | | 185,176 | | | | 66,283 | | | | 122,009 | |
| | Fund shares redeemed | | | 25,982 | | | | 47,158 | | | | 226,186 | |
| | Distribution and Service fees and Transfer Agency fees | | | 6,280 | | | | 3,361 | | | | 20,096 | |
| | Accrued expenses | | | 126,465 | | | | 136,548 | | | | 114,202 | |
| | Total liabilities | | | 2,681,883 | | | | 1,382,855 | | | | 500,901 | |
| | | | | | | | | | | | | | |
| | Net Assets: | |
| | Paid-in capital | | | 210,469,821 | | | | 89,860,257 | | | | 98,169,806 | |
| | Total distributable earnings (loss) | | | 28,983,057 | | | | (5,299,572 | ) | | | 69,937,884 | |
| | | NET ASSETS | | $ | 239,452,878 | | | $ | 84,560,685 | | | $ | 168,107,690 | |
| | | Net Assets: | | | | | | | | | | | | |
| | | Class A | | $ | 581,149 | | | $ | 3,108,450 | | | $ | 28,457,076 | |
| | | Class C | | | 62,144 | | | | 141,949 | | | | 3,125,171 | |
| | | Institutional | | | 2,055,314 | | | | 6,555,349 | | | | 31,227,981 | |
| | | Service | | | — | | | | — | | | | 1,749,761 | |
| | | Investor | | | 31,742 | | | | 109,795 | | | | 8,322,238 | |
| | | Class P | | | 40,288,356 | | | | 74,581,634 | | | | 92,575,328 | |
| | | Class R | | | 31,139 | | | | — | | | | 1,845,769 | |
| | | Class R6 | | | 196,403,034 | | | | 63,508 | | | | 804,366 | |
| | | Total Net Assets | | $ | 239,452,878 | | | $ | 84,560,685 | | | $ | 168,107,690 | |
| | | Shares outstanding $0.001 par value (unlimited shares authorized): | | | | | | | | | | | | |
| | | Class A | | | 51,863 | | | | 469,268 | | | | 1,930,863 | |
| | | Class C | | | 5,553 | | | | 21,249 | | | | 223,012 | |
| | | Institutional | | | 182,899 | | | | 1,023,476 | | | | 2,046,731 | |
| | | Service | | | — | | | | — | | | | 117,744 | |
| | | Investor | | | 2,830 | | | | 16,719 | | | | 559,352 | |
| | | Class P | | | 3,594,123 | | | | 11,670,369 | | | | 6,070,531 | |
| | | Class R | | | 2,778 | | | | — | | | | 126,712 | |
| | | Class R6 | | | 17,509,966 | | | | 9,922 | | | | 52,721 | |
| | | Net asset value, offering and redemption price per share:(a) | | | | | | | | | | | | |
| | | Class A | | | $11.21 | | | | $6.62 | | | | $14.74 | |
| | | Class C | | | 11.19 | | | | 6.68 | | | | 14.01 | |
| | | Institutional | | | 11.24 | | | | 6.40 | | | | 15.26 | |
| | | Service | | | — | | | | — | | | | 14.86 | |
| | | Investor | | | 11.22 | | | | 6.57 | | | | 14.88 | |
| | | Class P | | | 11.21 | | | | 6.39 | | | | 15.25 | |
| | | Class R | | | 11.21 | | | | — | | | | 14.57 | |
| | | Class R6 | | | 11.22 | | | | 6.40 | | | | 15.26 | |
| | (a) | | Maximum public offering price per share for Class A Shares of the Global Real Estate Securities, International Real Estate Securities and Real Estate Securities Funds is $11.85, $7.01 and $15.60, respectively. At redemption, Class C Shares may be subject to a contingent deferred sales charge assessed on the amount equal to the lesser of the current NAV or the original purchase price of the shares. |
| | |
| 28 | | The accompanying notes are an integral part of these financial statements. |
GOLDMAN SACHS REAL ESTATE SECURITIES FUNDS
Statements of Operations
For the Six Months Ended June 30, 2019 (Unaudited)
| | | | | | | | | | | | | | |
| | | | | Global Real Estate
Securities Fund | | | International Real
Estate Securities
Fund | | | Real Estate
Securities Fund | |
| | Investment income: | |
| | | | |
| | Dividends — unaffiliated issuers (net of foreign taxes withheld of $228,454, $170,244 and $0) | | $ | 4,064,382 | | | $ | 1,541,723 | | | $ | 2,346,305 | |
| | | | |
| | Dividends — affiliated issuers | | | 47,578 | | | | 16,521 | | | | 22,106 | |
| | | | |
| | Securities lending income — affiliated issuer | | | 10,049 | | | | — | | | | — | |
| | | | |
| | Total investment income | | | 4,122,009 | | | | 1,558,244 | | | | 2,368,411 | |
| | | | | | | | | | | | | | |
| | Expenses: | |
| | | | |
| | Management fees | | | 1,252,343 | | | | 418,395 | | | | 727,963 | |
| | | | |
| | Custody, accounting and administrative services | | | 62,757 | | | | 53,214 | | | | 54,857 | |
| | | | |
| | Professional fees | | | 54,620 | | | | 54,189 | | | | 51,771 | |
| | | | |
| | Registration fees | | | 52,299 | | | | 51,021 | | | | 66,152 | |
| | | | |
| | Transfer Agency fees(a) | | | 41,142 | | | | 16,230 | | | | 59,237 | |
| | | | |
| | Printing and mailing costs | | | 22,096 | | | | 15,297 | | | | 20,690 | |
| | | | |
| | Trustee fees | | | 8,213 | | | | 8,018 | | | | 8,109 | |
| | | | |
| | Distribution and Service fees(a) | | | 1,246 | | | | 5,042 | | | | 58,038 | |
| | | | |
| | Service share fees — Service and Shareholder Administration Plan | | | — | | | | — | | | | 4,098 | |
| | | | |
| | Other | | | 14,689 | | | | 29,338 | | | | 19,380 | |
| | | | |
| | Total expenses | | | 1,509,405 | | | | 650,744 | | | | 1,070,295 | |
| | | | |
| | Less — expense reductions | | | (212,514 | ) | | | (212,215 | ) | | | (220,308 | ) |
| | | | |
| | Net expenses | | | 1,296,891 | | | | 438,529 | | | | 849,987 | |
| | | | |
| | NET INVESTMENT INCOME | | | 2,825,118 | | | | 1,119,715 | | | | 1,518,424 | |
| | | | | | | | | | | | | | |
| | Realized and unrealized gain: | |
| | | | |
| | Net realized gain from: | | | | | | | | | | | | |
| | | | |
| | Investments — unaffiliated issuers | | | 5,349,699 | | | | 1,385,349 | | | | 9,995,870 | |
| | | | |
| | Forward foreign currency exchange contracts | | | — | | | | — | | | | 25,328 | |
| | | | |
| | Foreign currency transactions | | | 14,939 | | | | 763 | | | | 3,175 | |
| |
| | Net change in unrealized gain (loss) on: | |
| | | | |
| | Investments — unaffiliated issuers | | | 34,919,304 | | | | 9,218,762 | | | | 15,998,533 | |
| | | | |
| | Forward foreign currency exchange contracts | | | — | | | | — | | | | (22,979 | ) |
| | | | |
| | Foreign currency translation | | | 8,062 | | | | 6,093 | | | | — | |
| | | | |
| | Net realized and unrealized gain | | | 40,292,004 | | | | 10,610,967 | | | | 25,999,927 | |
| | | | |
| | NET INCREASE IN NET ASSETS RESULTING FROM OPERATIONS | | $ | 43,117,122 | | | $ | 11,730,682 | | | $ | 27,518,351 | |
| | (a) | | Class specific Distribution and/or Service, and Transfer Agency fees were as follows: |
| | | | | | | | | | | | | | | | | | | | | | | | | | | | | | | | | | | | | | | | | | | | |
| | | Distribution and/or Service Fees | | | Transfer Agency Fees | |
Fund | | Class A | | | Class C | | | Class R | | | Class A | | | Class C | | | Institutional | | | Service | | | Investor | | | Class P | | | Class R | | | Class R6 | |
Global Real Estate Securities | | $ | 939 | | | $ | 232 | | | $ | 75 | | | $ | 676 | | | $ | 42 | | | $ | 403 | | | | N/A | | | $ | 27 | | | $ | 6,195 | | | $ | 27 | | | $ | 33,772 | |
International Real Estate Securities | | | 3,949 | | | | 1,093 | | | | N/A | | | | 2,843 | | | | 197 | | | | 1,612 | | | | N/A | | | | 98 | | | | 11,463 | | | | N/A | | | | 17 | |
Real Estate Securities | | | 35,736 | | | | 17,697 | | | | 4,605 | | | | 25,729 | | | | 3,185 | | | | 6,193 | | | $ | 328 | | | | 8,433 | | | | 13,592 | | | | 1,658 | | | | 119 | |
| | |
| The accompanying notes are an integral part of these financial statements. | | 29 |
GOLDMAN SACHS REAL ESTATE SECURITIES FUNDS
Statements of Changes in Net Assets
| | | | | | | | | | | | | | | | | | | | | | |
| | | | | Global Real Estate Securities Fund | | | | | | International Real Estate Securities Fund | |
| | | | | For the
Six Months Ended
June 30, 2019
(Unaudited) | | | For the Fiscal
Year Ended
December 31, 2018 | | | | | | For the
Six Months Ended
June 30, 2019
(Unaudited) | | | For the Fiscal
Year Ended
December 31, 2018 | |
| | From operations: | |
| | | | | | |
| | Net investment income | | $ | 2,825,118 | | | $ | 7,694,004 | | | | | | | $ | 1,119,715 | | | $ | 2,589,738 | |
| | | | | | |
| | Net realized gain (loss) | | | 5,364,638 | | | | (513,957 | ) | | | | | | | 1,386,112 | | | | 1,093,599 | |
| | | | | | |
| | Net change in unrealized gain (loss) | | | 34,927,366 | | | | (24,402,772 | ) | | | | | | | 9,224,855 | | | | (10,549,283 | ) |
| | | | | | |
| | Net increase (decrease) in net assets resulting from operations | | | 43,117,122 | | | | (17,222,725 | ) | | | | | | | 11,730,682 | | | | (6,865,946 | ) |
| | | | | | | | | | | | | | | | | | | | | | |
| | Distributions to shareholders: | |
| | | | | | |
| | From distributable earnings: | | | | | | | | | | | | | | | | | | | | |
| | | | | | |
| | Class A Shares | | | (5,035 | ) | | | (21,735 | ) | | | | | | | (27,290 | ) | | | (72,733 | ) |
| | | | | | |
| | Class C Shares | | | (319 | ) | | | (315 | ) | | | | | | | (378 | ) | | | (4,862 | ) |
| | | | | | |
| | Institutional Shares | | | (20,120 | ) | | | (114,092 | ) | | | | | | | (71,511 | ) | | | (227,990 | ) |
| | | | | | |
| | Investor Shares | | | (290 | ) | | | (609 | ) | | | | | | | (1,100 | ) | | | (2,509 | ) |
| | | | | | |
| | Class P Shares(a) | | | (402,523 | ) | | | (359,656 | ) | | | | | | | (822,303 | ) | | | (2,124,941 | ) |
| | | | | | |
| | Class R Shares | | | (215 | ) | | | (459 | ) | | | | | | | — | | | | — | |
| | | | | | |
| | Class R6 Shares | | | (2,022,140 | ) | | | (6,882,760 | ) | | | | | | | (693 | ) | | | (11,771 | ) |
| |
| | Return of capital | |
| | | | | | |
| | Class A Shares | | | — | | | | (6,159 | ) | | | | | | | — | | | | — | |
| | | | | | |
| | Class C Shares | | | — | | | | (145 | ) | | | | | | | — | | | | — | |
| | | | | | |
| | Institutional Shares | | | — | | | | (36,030 | ) | | | | | | | — | | | | — | |
| | | | | | |
| | Investor Shares | | | — | | | | (148 | ) | | | | | | | — | | | | — | |
| | | | | | |
| | Class P Shares(a) | | | — | | | | (79,238 | ) | | | | | | | — | | | | — | |
| | | | | | |
| | Class R Shares | | | — | | | | (147 | ) | | | | | | | — | | | | — | |
| | | | | | |
| | Class R6 Shares | | | — | | | | (1,558,561 | ) | | | | | | | — | | | | — | |
| | | | | | |
| | Total distributions to shareholders | | | (2,450,642 | ) | | | (9,060,054 | ) | | | | | | | (923,275 | ) | | | (2,444,806 | ) |
| | | | | | | | | | | | | | | | | | | | | | |
| | From share transactions: | |
| | | | | | |
| | Proceeds from sales of shares | | | 12,469,548 | | | | 388,120,447 | | | | | | | | 2,083,488 | | | | 117,088,263 | |
| | | | | | |
| | Reinvestment of distributions | | | 2,450,480 | | | | 9,059,523 | | | | | | | | 922,945 | | | | 2,441,899 | |
| | | | | | |
| | Cost of shares redeemed | | | (118,041,544 | ) | | | (409,399,836 | ) | | | | | | | (25,021,842 | ) | | | (137,525,695 | ) |
| | | | | | |
| | Net decrease in net assets resulting from share transactions | | | (103,121,516 | ) | | | (12,219,866 | ) | | | | | | | (22,015,409 | ) | | | (17,995,533 | ) |
| | | | | | |
| | TOTAL DECREASE | | | (62,455,036 | ) | | | (38,502,645 | ) | | | | | | | (11,208,002 | ) | | | (27,306,285 | ) |
| | | | | | | | | | | | | | | | | | | | | | |
| | Net Assets: | |
| | | | | | |
| | Beginning of period | | | 301,907,914 | | | | 340,410,559 | | | | | | | | 95,768,687 | | | | 123,074,972 | |
| | End of period | | $ | 239,452,878 | | | $ | 301,907,914 | | | | | | | $ | 84,560,685 | | | $ | 95,768,687 | |
| | (a) | | Commenced operations on April 17, 2018. |
| | |
| 30 | | The accompanying notes are an integral part of these financial statements. |
GOLDMAN SACHS REAL ESTATE SECURITIES FUNDS
Statements of Changes in Net Assets(continued)
| | | | | | | | | | |
| | | | | Real Estate Securities Fund | |
| | | | | For the
Six Months Ended
June 30, 2019
(Unaudited) | | | For the Fiscal
Year Ended
December 31, 2018 | |
| | From operations: | |
| | | |
| | Net investment income | | $ | 1,518,424 | | | $ | 4,751,873 | |
| | | |
| | Net realized gain | | | 10,024,373 | | | | 24,114,327 | |
| | | |
| | Net change in unrealized gain (loss) | | | 15,975,554 | | | | (38,901,542 | ) |
| | | |
| | Net increase (decrease) in net assets resulting from operations | | | 27,518,351 | | | | (10,035,342 | ) |
| | | | | | | | | | |
| | Distributions to shareholders: | |
| | | |
| | From distributable earnings: | | | | | | | | |
| | | |
| | Class A Shares | | | (223,836 | ) | | | (4,351,150 | ) |
| | | |
| | Class C Shares | | | (14,005 | ) | | | (645,744 | ) |
| | | |
| | Institutional Shares | | | (287,442 | ) | | | (6,004,021 | ) |
| | | |
| | Service Shares | | | (12,513 | ) | | | (233,397 | ) |
| | | |
| | Investor Shares | | | (78,017 | ) | | | (1,352,024 | ) |
| | | |
| | Class P Shares(a) | | | (860,426 | ) | | | (15,469,785 | ) |
| | | |
| | Class R Shares | | | (12,547 | ) | | | (288,384 | ) |
| | | |
| | Class R6 Shares | | | (7,455 | ) | | | (130,756 | ) |
| | | |
| | Total distributions to shareholders | | | (1,496,241 | ) | | | (28,475,261 | ) |
| | | | | | | | | | |
| | From share transactions: | |
| | | |
| | Proceeds from sales of shares | | | 10,296,592 | | | | 173,737,317 | |
| | | |
| | Reinvestment of distributions | | | 1,457,000 | | | | 27,655,532 | |
| | | |
| | Cost of shares redeemed | | | (32,019,146 | ) | | | (273,708,249 | ) |
| | | |
| | Net decrease in net assets resulting from share transactions | | | (20,265,554 | ) | | | (72,315,400 | ) |
| | | |
| | TOTAL INCREASE (DECREASE) | | | 5,756,556 | | | | (110,826,003 | ) |
| | | | | | | | | | |
| | Net Assets: | |
| | | |
| | Beginning of period | | | 162,351,134 | | | | 273,177,137 | |
| | | |
| | End of period | | $ | 168,107,690 | | | $ | 162,351,134 | |
| | (a) | | Commenced operations on April 17, 2018. |
| | |
| The accompanying notes are an integral part of these financial statements. | | 31 |
GOLDMAN SACHS GLOBAL REAL ESTATE SECURITIES FUND
Financial Highlights
Selected Data for a Share Outstanding Throughout Each Period
| | | | | | | | | | | | | | | | | | | | | | |
| | | | | Goldman Sachs Global Real Estate Securities Fund | |
| | | | | Class A Shares | |
| | | | | Six Months Ended
June 30, 2019
(Unaudited) | | | Year Ended December 31, | | | For the period
August 31, 2015* to
December 31, 2015 | |
| | | | | 2018 | | | 2017 | | | 2016 | |
| | Per Share Data | |
| | | | | | |
| | Net asset value, beginning of period | | $ | 9.79 | | | $ | 10.64 | | | $ | 10.05 | | | $ | 10.44 | | | $ | 10.00 | |
| | | | | | |
| | Net investment income(a) | | | 0.09 | | | | 0.19 | | | | 0.21 | | | | 0.17 | | | | 0.05 | |
| | | | | | |
| | Net realized and unrealized gain (loss) | | | 1.42 | | | | (0.79 | ) | | | 0.63 | | | | (0.08 | ) | | | 0.52 | |
| | | | | | |
| | Total from investment operations | | | 1.51 | | | | (0.60 | ) | | | 0.84 | | | | 0.09 | | | | 0.57 | |
| | | | | | |
| | Distributions to shareholders from net investment income | | | (0.09 | ) | | | (0.20 | ) | | | (0.25 | ) | | | (0.29 | ) | | | (0.12 | ) |
| | | | | | |
| | Distributions to shareholders from net realized gains | | | — | | | | — | | | | — | (b) | | | (0.17 | ) | | | (0.01 | ) |
| | | | | | |
| | Distributions to shareholders from return of capital | | | — | | | | (0.05 | ) | | | — | | | | (0.02 | ) | | | — | |
| | | | | | |
| | Total distributions | | | (0.09 | ) | | | (0.25 | ) | | | (0.25 | ) | | | (0.48 | ) | | | (0.13 | ) |
| | | | | | |
| | Net asset value, end of period | | $ | 11.21 | | | $ | 9.79 | | | $ | 10.64 | | | $ | 10.05 | | | $ | 10.44 | |
| | | | | | |
| | Total return(c) | | | 15.31 | % | | | (5.77 | )% | | | 8.50 | % | | | 0.82 | % | | | 5.71 | % |
| | | | | | |
| | Net assets, end of period (in 000s) | | $ | 581 | | | $ | 905 | | | $ | 1,768 | | | $ | 32 | | | $ | 26 | |
| | | | | | |
| | Ratio of net expenses to average net assets | | | 1.36 | %(d) | | | 1.37 | % | | | 1.39 | % | | | 1.44 | % | | | 1.40 | %(d) |
| | | | | | |
| | Ratio of total expenses to average net assets | | | 1.52 | %(d) | | | 1.52 | % | | | 1.59 | % | | | 4.34 | % | | | 15.24 | %(d) |
| | | | | | |
| | Ratio of net investment income to average net assets | | | 1.67 | %(d) | | | 1.85 | % | | | 2.03 | % | | | 1.57 | % | | | 1.43 | %(d) |
| | | | | | |
| | Portfolio turnover rate(e) | | | 24 | % | | | 67 | % | | | 58 | % | | | 60 | % | | | 14 | % |
| | * | | Commencement of Operations. |
| | (a) | | Calculated based on the average shares outstanding methodology. |
| | (b) | | Amount is less than $0.005 per share. |
| | (c) | | Assumes investment at the net asset value at the beginning of the period, reinvestment of all distributions, a complete redemption of the investment at the net asset value at the end of the period and no sales or redemption charges (if any). Total returns would be reduced if a sales or redemption charge was taken into account. Returns do not reflect the impact of taxes to shareholders relating to Fund distributions or the redemption of Fund shares. Total returns for periods less than one full year are not annualized. |
| | (e) | | The Fund’s portfolio turnover rate is calculated in accordance with regulatory requirements, without regard to transactions involving short term investments. If such transactions were included, the Fund’s portfolio turnover rate may be higher. |
| | |
| 32 | | The accompanying notes are an integral part of these financial statements. |
GOLDMAN SACHS GLOBAL REAL ESTATE SECURITIES FUND
Financial Highlights(continued)
Selected Data for a Share Outstanding Throughout Each Period
| | | | | | | | | | | | | | | | | | | | | | |
| | | | | Goldman Sachs Global Real Estate Securities Fund | |
| | | | | Class C Shares | |
| | | | | Six Months Ended
June 30, 2019
(Unaudited) | | | Year Ended December 31, | | | For the period
August 31, 2015* to
December 31, 2015 | |
| | | | | 2018 | | | 2017 | | | 2016 | |
| | Per Share Data | |
| | | | | | |
| | Net asset value, beginning of period | | $ | 9.79 | | | $ | 10.64 | | | $ | 10.04 | | | $ | 10.43 | | | $ | 10.00 | |
| | | | | | |
| | Net investment income(a) | | | 0.08 | | | | 0.12 | | | | 0.12 | | | | 0.10 | | | | 0.02 | |
| | | | | | |
| | Net realized and unrealized gain (loss) | | | 1.38 | | | | (0.80 | ) | | | 0.65 | | | | (0.09 | ) | | | 0.52 | |
| | | | | | |
| | Total from investment operations | | | 1.46 | | | | (0.68 | ) | | | 0.77 | | | | 0.01 | | | | 0.54 | |
| | | | | | |
| | Distributions to shareholders from net investment income | | | (0.06 | ) | | | (0.12 | ) | | | (0.17 | ) | | | (0.21 | ) | | | (0.10 | ) |
| | | | | | |
| | Distributions to shareholders from net realized gains | | | — | | | | — | | | | — | (b) | | | (0.17 | ) | | | (0.01 | ) |
| | | | | | |
| | Distributions to shareholders from return of capital | | | — | | | | (0.05 | ) | | | — | | | | (0.02 | ) | | | — | |
| | | | | | |
| | Total distributions | | | (0.06 | ) | | | (0.17 | ) | | | (0.17 | ) | | | (0.40 | ) | | | (0.11 | ) |
| | | | | | |
| | Net asset value, end of period | | $ | 11.19 | | | $ | 9.79 | | | $ | 10.64 | | | $ | 10.04 | | | $ | 10.43 | |
| | | | | | |
| | Total return(c) | | | 14.90 | % | | | (6.45 | )% | | | 7.72 | % | | | 0.11 | % | | | 5.41 | % |
| | | | | | |
| | Net assets, end of period (in 000s) | | $ | 62 | | | $ | 27 | | | $ | 28 | | | $ | 36 | | | $ | 26 | |
| | | | | | |
| | Ratio of net expenses to average net assets | | | 2.11 | %(d) | | | 2.12 | % | | | 2.15 | % | | | 2.15 | % | | | 2.15 | %(d) |
| | | | | | |
| | Ratio of total expenses to average net assets | | | 2.27 | %(d) | | | 2.27 | % | | | 2.79 | % | | | 5.31 | % | | | 16.01 | %(d) |
| | | | | | |
| | Ratio of net investment income to average net assets | | | 1.49 | %(d) | | | 1.20 | % | | | 1.15 | % | | | 0.93 | % | | | 0.68 | %(d) |
| | | | | | |
| | Portfolio turnover rate(e) | | | 24 | % | | | 67 | % | | | 58 | % | | | 60 | % | | | 14 | % |
| | * | | Commencement of Operations. |
| | (a) | | Calculated based on the average shares outstanding methodology. |
| | (b) | | Amount is less than $0.005 per share. |
| | (c) | | Assumes investment at the net asset value at the beginning of the period, reinvestment of all distributions, a complete redemption of the investment at the net asset value at the end of the period and no sales or redemption charges (if any). Total returns would be reduced if a sales or redemption charge was taken into account. Returns do not reflect the impact of taxes to shareholders relating to Fund distributions or the redemption of Fund shares. Total returns for periods less than one full year are not annualized. |
| | (e) | | The Fund’s portfolio turnover rate is calculated in accordance with regulatory requirements, without regard to transactions involving short term investments. If such transactions were included, the Fund’s portfolio turnover rate may be higher. |
| | |
| The accompanying notes are an integral part of these financial statements. | | 33 |
GOLDMAN SACHS GLOBAL REAL ESTATE SECURITIES FUND
Financial Highlights(continued)
Selected Data for a Share Outstanding Throughout Each Period
| | | | | | | | | | | | | | | | | | | | | | |
| | | | | Goldman Sachs Global Real Estate Securities Fund | |
| | | | | Institutional Shares | |
| | | | | Six Months Ended
June 30, 2019
(Unaudited) | | | Year Ended December 31, | | | For the period
August 31, 2015* to
December 31, 2015 | |
| | | | | 2018 | | | 2017 | | | 2016 | |
| | Per Share Data | |
| | | | | | |
| | Net asset value, beginning of period | | $ | 9.82 | | | $ | 10.66 | | | $ | 10.06 | | | $ | 10.44 | | | $ | 10.00 | |
| | | | | | |
| | Net investment income (loss)(a) | | | 0.12 | | | | (0.03 | ) | | | 0.24 | | | | 0.24 | | | | 0.06 | |
| | | | | | |
| | Net realized and unrealized gain (loss) | | | 1.41 | | | | (0.54 | ) | | | 0.65 | | | | (0.10 | ) | | | 0.52 | |
| | | | | | |
| | Total from investment operations | | | 1.53 | | | | (0.57 | ) | | | 0.89 | | | | 0.14 | | | | 0.58 | |
| | | | | | |
| | Distributions to shareholders from net investment income | | | (0.11 | ) | | | (0.22 | ) | | | (0.29 | ) | | | (0.32 | ) | | | (0.13 | ) |
| | | | | | |
| | Distributions to shareholders from net realized gains | | | — | | | | — | | | | — | (b) | | | (0.17 | ) | | | (0.01 | ) |
| | | | | | |
| | Distributions to shareholders from return of capital | | | — | | | | (0.05 | ) | | | — | | | | (0.03 | ) | | | — | |
| | | | | | |
| | Total distributions | | | (0.11 | ) | | | (0.27 | ) | | | (0.29 | ) | | | (0.52 | ) | | | (0.14 | ) |
| | | | | | |
| | Net asset value, end of period | | $ | 11.24 | | | $ | 9.82 | | | $ | 10.66 | | | $ | 10.06 | | | $ | 10.44 | |
| | | | | | |
| | Total return(c) | | | 15.59 | % | | | (5.41 | )% | | | 8.96 | % | | | 1.30 | % | | | 5.81 | % |
| | | | | | |
| | Net assets, end of period (in 000s) | | $ | 2,055 | | | $ | 1,855 | | | $ | 338,527 | | | $ | 27,663 | | | $ | 3,043 | |
| | | | | | |
| | Ratio of net expenses to average net assets | | | 0.97 | %(d) | | | 1.00 | % | | | 1.00 | % | | | 1.00 | % | | | 1.00 | %(d) |
| | | | | | |
| | Ratio of total expenses to average net assets | | | 1.13 | %(d) | | | 1.18 | % | | | 1.24 | % | | | 2.82 | % | | | 14.86 | %(d) |
| | | | | | |
| | Ratio of net investment income (loss) to average net assets | | | 2.27 | %(d) | | | (0.26 | )% | | | 2.31 | % | | | 2.23 | % | | | 1.83 | %(d) |
| | | | | | |
| | Portfolio turnover rate(e) | | | 24 | % | | | 67 | % | | | 58 | % | | | 60 | % | | | 14 | % |
| | * | | Commencement of Operations. |
| | (a) | | Calculated based on the average shares outstanding methodology. |
| | (b) | | Amount is less than $0.005 per share. |
| | (c) | | Assumes investment at the net asset value at the beginning of the period, reinvestment of all distributions, a complete redemption of the investment at the net asset value at the end of the period and no sales or redemption charges (if any). Total returns would be reduced if a sales or redemption charge was taken into account. Returns do not reflect the impact of taxes to shareholders relating to Fund distributions or the redemption of Fund shares. Total returns for periods less than one full year are not annualized. |
| | (e) | | The Fund’s portfolio turnover rate is calculated in accordance with regulatory requirements, without regard to transactions involving short term investments. If such transactions were included, the Fund’s portfolio turnover rate may be higher. |
| | |
| 34 | | The accompanying notes are an integral part of these financial statements. |
GOLDMAN SACHS GLOBAL REAL ESTATE SECURITIES FUND
Financial Highlights(continued)
Selected Data for a Share Outstanding Throughout Each Period
| | | | | | | | | | | | | | | | | | | | | | |
| | | | | Goldman Sachs Global Real Estate Securities Fund | |
| | | | | Investor Shares(a) | |
| | | | | Six Months Ended
June 30, 2019
(Unaudited) | | | Year Ended December 31, | | | For the period
August 31, 2015* to
December 31, 2015 | |
| | | | | 2018 | | | 2017 | | | 2016 | |
| | Per Share Data | |
| | | | | | |
| | Net asset value, beginning of period | | $ | 9.80 | | | $ | 10.65 | | | $ | 10.05 | | | $ | 10.44 | | | $ | 10.00 | |
| | | | | | |
| | Net investment income(b) | | | 0.12 | | | | 0.23 | | | | 0.22 | | | | 0.20 | | | | 0.06 | |
| | | | | | |
| | Net realized and unrealized gain (loss) | | | 1.40 | | | | (0.81 | ) | | | 0.65 | | | | (0.09 | ) | | | 0.51 | |
| | | | | | |
| | Total from investment operations | | | 1.52 | | | | (0.58 | ) | | | 0.87 | | | | 0.11 | | | | 0.57 | |
| | | | | | |
| | Distributions to shareholders from net investment income | | | (0.10 | ) | | | (0.22 | ) | | | (0.27 | ) | | | (0.31 | ) | | | (0.12 | ) |
| | | | | | |
| | Distributions to shareholders from net realized gains | | | — | | | | — | | | | — | (c) | | | (0.17 | ) | | | (0.01 | ) |
| | | | | | |
| | Distributions to shareholders from return of capital | | | — | | | | (0.05 | ) | | | — | | | | (0.02 | ) | | | — | |
| | | | | | |
| | Total distributions | | | (0.10 | ) | | | (0.27 | ) | | | (0.27 | ) | | | (0.50 | ) | | | (0.13 | ) |
| | | | | | |
| | Net asset value, end of period | | $ | 11.22 | | | $ | 9.80 | | | $ | 10.65 | | | $ | 10.05 | | | $ | 10.44 | |
| | | | | | |
| | Total return(d) | | | 15.55 | % | | | (5.50 | )% | | | 8.80 | % | | | 1.05 | % | | | 5.78 | % |
| | | | | | |
| | Net assets, end of period (in 000s) | | $ | 32 | | | $ | 27 | | | $ | 29 | | | $ | 27 | | | $ | 26 | |
| | | | | | |
| | Ratio of net expenses to average net assets | | | 1.11 | %(e) | | | 1.12 | % | | | 1.15 | % | | | 1.15 | % | | | 1.15 | %(e) |
| | | | | | |
| | Ratio of total expenses to average net assets | | | 1.27 | %(e) | | | 1.27 | % | | | 1.75 | % | | | 4.22 | % | | | 15.02 | %(e) |
| | | | | | |
| | Ratio of net investment income to average net assets | | | 2.15 | %(e) | | | 2.20 | % | | | 2.13 | % | | | 1.85 | % | | | 1.68 | %(e) |
| | | | | | |
| | Portfolio turnover rate(f) | | | 24 | % | | | 67 | % | | | 58 | % | | | 60 | % | | | 14 | % |
| | * | | Commencement of Operations. |
| | (a) | | Effective August 15, 2017, Class IR changed its name to Investor Shares. |
| | (b) | | Calculated based on the average shares outstanding methodology. |
| | (c) | | Amount is less than $0.005 per share. |
| | (d) | | Assumes investment at the net asset value at the beginning of the period, reinvestment of all distributions, a complete redemption of the investment at the net asset value at the end of the period and no sales or redemption charges (if any). Total returns would be reduced if a sales or redemption charge was taken into account. Returns do not reflect the impact of taxes to shareholders relating to Fund distributions or the redemption of Fund shares. Total returns for periods less than one full year are not annualized. |
| | (f) | | The Fund’s portfolio turnover rate is calculated in accordance with regulatory requirements, without regard to transactions involving short term investments. If such transactions were included, the Fund’s portfolio turnover rate may be higher. |
| | |
| The accompanying notes are an integral part of these financial statements. | | 35 |
GOLDMAN SACHS GLOBAL REAL ESTATE SECURITIES FUND
Financial Highlights(continued)
Selected Data for a Share Outstanding Throughout Each Period
| | | | | | | | | | |
| | | | | Goldman Sachs Global Real Estate
Securities Fund | |
| | | | | Class P Shares | |
| | | | | Six Months Ended
June 30, 2019
(Unaudited) | | | For the period
April 17, 2018* to
December 31, 2018 | |
| | Per Share Data | |
| | | |
| | Net asset value, beginning of period | | $ | 9.80 | | | $ | 10.30 | |
| | | |
| | Net investment income(a) | | | 0.12 | | | | 0.23 | |
| | | |
| | Net realized and unrealized gain (loss) | | | 1.40 | | | | (0.50 | ) |
| | | |
| | Total from investment operations | | | 1.52 | | | | (0.27 | ) |
| | | |
| | Distributions to shareholders from net investment income | | | (0.11 | ) | | | (0.18 | ) |
| | | |
| | Distributions to shareholders from return of capital | | | — | | | | (0.05 | ) |
| | | |
| | Total distributions | | | (0.11 | ) | | | (0.23 | ) |
| | | |
| | Net asset value, end of period | | $ | 11.21 | | | $ | 9.80 | |
| | | |
| | Total return(b) | | | 15.53 | % | | | (2.69 | )% |
| | | |
| | Net assets, end of period (in 000s) | | $ | 40,288 | | | $ | 39,405 | |
| | | |
| | Ratio of net expenses to average net assets | | | 0.96 | %(c) | | | 0.96 | %(c) |
| | | |
| | Ratio of total expenses to average net assets | | | 1.12 | %(c) | | | 1.11 | %(c) |
| | | |
| | Ratio of net investment income to average net assets | | | 2.25 | %(c) | | | 3.15 | %(c) |
| | | |
| | Portfolio turnover rate(d) | | | 24 | % | | | 67 | % |
| | * | | Commencement of Operations. |
| | (a) | | Calculated based on the average shares outstanding methodology. |
| | (b) | | Assumes investment at the net asset value at the beginning of the period, reinvestment of all distributions, a complete redemption of the investment at the net asset value at the end of the period and no sales or redemption charges (if any). Total returns would be reduced if a sales or redemption charge was taken into account. Returns do not reflect the impact of taxes to shareholders relating to Fund distributions or the redemption of Fund shares. Total returns for periods less than one full year are not annualized. |
| | (d) | | The Fund’s portfolio turnover rate is calculated in accordance with regulatory requirements, without regard to transactions involving short term investments. If such transactions were included, the Fund’s portfolio turnover rate may be higher. |
| | |
| 36 | | The accompanying notes are an integral part of these financial statements. |
GOLDMAN SACHS GLOBAL REAL ESTATE SECURITIES FUND
Financial Highlights(continued)
Selected Data for a Share Outstanding Throughout Each Period
| | | | | | | | | | | | | | | | | | | | | | |
| | | | | Goldman Sachs Global Real Estate Securities Fund | |
| | | | | Class R Shares | |
| | | | | Six Months Ended
June 30, 2019
(Unaudited) | | | Year Ended December 31, | | | For the period
August 31, 2015* to
December 31, 2015 | |
| | | | | 2018 | | | 2017 | | | 2016 | |
| | Per Share Data | |
| | | | | | |
| | Net asset value, beginning of period | | $ | 9.80 | | | $ | 10.65 | | | $ | 10.05 | | | $ | 10.44 | | | $ | 10.00 | |
| | | | | | |
| | Net investment income(a) | | | 0.09 | | | | 0.18 | | | | 0.17 | | | | 0.14 | | | | 0.04 | |
| | | | | | |
| | Net realized and unrealized gain (loss) | | | 1.40 | | | | (0.81 | ) | | | 0.65 | | | | (0.08 | ) | | | 0.52 | |
| | | | | | |
| | Total from investment operations | | | 1.49 | | | | (0.63 | ) | | | 0.82 | | | | 0.06 | | | | 0.56 | |
| | | | | | |
| | Distributions to shareholders from net investment income | | | (0.08 | ) | | | (0.17 | ) | | | (0.22 | ) | | | (0.26 | ) | | | (0.11 | ) |
| | | | | | |
| | Distributions to shareholders from net realized gains | | | — | | | | — | | | | — | (b) | | | (0.17 | ) | | | (0.01 | ) |
| | | | | | |
| | Distributions to shareholders from return of capital | | | — | | | | (0.05 | ) | | | — | | | | (0.02 | ) | | | — | |
| | | | | | |
| | Total distributions | | | (0.08 | ) | | | (0.22 | ) | | | (0.22 | ) | | | (0.45 | ) | | | (0.12 | ) |
| | | | | | |
| | Net asset value, end of period | | $ | 11.21 | | | $ | 9.80 | | | $ | 10.65 | | | $ | 10.05 | | | $ | 10.44 | |
| | | | | | |
| | Total return(c) | | | 15.19 | % | | | (5.97 | )% | | | 8.26 | % | | | 0.57 | % | | | 5.65 | % |
| | | | | | |
| | Net assets, end of period (in 000s) | | $ | 31 | | | $ | 27 | | | $ | 29 | | | $ | 27 | | | $ | 26 | |
| | | | | | |
| | Ratio of net expenses to average net assets | | | 1.61 | %(d) | | | 1.62 | % | | | 1.65 | % | | | 1.65 | % | | | 1.65 | %(d) |
| | | | | | |
| | Ratio of total expenses to average net assets | | | 1.77 | %(d) | | | 1.77 | % | | | 2.25 | % | | | 4.73 | % | | | 15.51 | %(d) |
| | | | | | |
| | Ratio of net investment income to average net assets | | | 1.65 | %(d) | | | 1.70 | % | | | 1.63 | % | | | 1.35 | % | | | 1.18 | %(d) |
| | | | | | |
| | Portfolio turnover rate(e) | | | 24 | % | | | 67 | % | | | 58 | % | | | 60 | % | | | 14 | % |
| | * | | Commencement of Operations. |
| | (a) | | Calculated based on the average shares outstanding methodology. |
| | (b) | | Amount is less than $0.005 per share. |
| | (c) | | Assumes investment at the net asset value at the beginning of the period, reinvestment of all distributions, a complete redemption of the investment at the net asset value at the end of the period and no sales or redemption charges (if any). Total returns would be reduced if a sales or redemption charge was taken into account. Returns do not reflect the impact of taxes to shareholders relating to Fund distributions or the redemption of Fund shares. Total returns for periods less than one full year are not annualized. |
| | (e) | | The Fund’s portfolio turnover rate is calculated in accordance with regulatory requirements, without regard to transactions involving short term investments. If such transactions were included, the Fund’s portfolio turnover rate may be higher. |
| | |
| The accompanying notes are an integral part of these financial statements. | | 37 |
GOLDMAN SACHS GLOBAL REAL ESTATE SECURITIES FUND
Financial Highlights(continued)
Selected Data for a Share Outstanding Throughout Each Period
| | | | | | | | | | | | | | | | | | | | | | |
| | | | | Goldman Sachs Global Real Estate Securities Fund | |
| | | | | Class R6 Shares | |
| | | | | Six Months Ended
June 30, 2019
(Unaudited) | | | Year Ended December 31, | | | For the period
August 31, 2015* to
December 31, 2015 | |
| | | | | 2018 | | | 2017 | | | 2016 | |
| | Per Share Data | |
| | | | | | |
| | Net asset value, beginning of period | | $ | 9.80 | | | $ | 10.66 | | | $ | 10.06 | | | $ | 10.44 | | | $ | 10.00 | |
| | | | | | |
| | Net investment income(a) | | | 0.11 | | | | 0.29 | | | | 0.24 | | | | 0.21 | | | | 0.06 | |
| | | | | | |
| | Net realized and unrealized gain (loss) | | | 1.42 | | | | (0.86 | ) | | | 0.65 | | | | (0.07 | ) | | | 0.52 | |
| | | | | | |
| | Total from investment operations | | | 1.53 | | | | (0.57 | ) | | | 0.89 | | | | 0.14 | | | | 0.58 | |
| | | | | | |
| | Distributions to shareholders from net investment income | | | (0.11 | ) | | | (0.24 | ) | | | (0.29 | ) | | | (0.33 | ) | | | (0.13 | ) |
| | | | | | |
| | Distributions to shareholders from net realized gains | | | — | | | | — | | | | — | (b) | | | (0.17 | ) | | | (0.01 | ) |
| | | | | | |
| | Distributions to shareholders from return of capital | | | — | | | | (0.05 | ) | | | — | | | | (0.02 | ) | | | — | |
| | | | | | |
| | Total distributions | | | (0.11 | ) | | | (0.29 | ) | | | (0.29 | ) | | | (0.52 | ) | | | (0.14 | ) |
| | | | | | |
| | Net asset value, end of period | | $ | 11.22 | | | $ | 9.80 | | | $ | 10.66 | | | $ | 10.06 | | | $ | 10.44 | |
| | | | | | |
| | Total return(c) | | | 15.63 | % | | | (5.44 | )% | | | 8.97 | % | | | 1.31 | % | | | 5.82 | % |
| | | | | | |
| | Net assets, end of period (in 000s) | | $ | 196,403 | | | $ | 259,662 | | | $ | 29 | | | $ | 27 | | | $ | 26 | |
| | | | | | |
| | Ratio of net expenses to average net assets | | | 0.96 | %(d) | | | 0.97 | % | | | 0.99 | % | | | 0.98 | % | | | 0.97 | %(d) |
| | | | | | |
| | Ratio of total expenses to average net assets | | | 1.12 | %(d) | | | 1.11 | % | | | 1.59 | % | | | 4.05 | % | | | 14.85 | %(d) |
| | | | | | |
| | Ratio of net investment income to average net assets | | | 2.07 | %(d) | | | 2.76 | % | | | 2.29 | % | | | 2.02 | % | | | 1.85 | %(d) |
| | | | | | |
| | Portfolio turnover rate(e) | | | 24 | % | | | 67 | % | | | 58 | % | | | 60 | % | | | 14 | % |
| | * | | Commencement of Operations. |
| | (a) | | Calculated based on the average shares outstanding methodology. |
| | (b) | | Amount is less than $0.005 per share. |
| | (c) | | Assumes investment at the net asset value at the beginning of the period, reinvestment of all distributions, a complete redemption of the investment at the net asset value at the end of the period and no sales or redemption charges (if any). Total returns would be reduced if a sales or redemption charge was taken into account. Returns do not reflect the impact of taxes to shareholders relating to Fund distributions or the redemption of Fund shares. Total returns for periods less than one full year are not annualized. |
| | (e) | | The Fund’s portfolio turnover rate is calculated in accordance with regulatory requirements, without regard to transactions involving short term investments. If such transactions were included, the Fund’s portfolio turnover rate may be higher. |
| | |
| 38 | | The accompanying notes are an integral part of these financial statements. |
GOLDMAN SACHS INTERNATIONAL REAL ESTATE SECURITIES FUND
Financial Highlights(continued)
Selected Data for a Share Outstanding Throughout Each Period
| | | | | | | | | | | | | | | | | | | | | | | | | | |
| | | | | Goldman Sachs International Real Estate Securities Fund | |
| | | | | Class A Shares | |
| | | | | Six Months Ended
June 30, 2019
(Unaudited) | | | Year Ended December 31, | |
| | | | | 2018 | | | 2017 | | | 2016 | | | 2015 | | | 2014 | |
| | Per Share Data | |
| | | | | | | |
| | Net asset value, beginning of period | | $ | 5.90 | | | $ | 6.48 | | | $ | 5.73 | | | $ | 6.09 | | | $ | 6.38 | | | $ | 6.54 | |
| | | | | | | |
| | Net investment income(a) | | | 0.07 | | | | 0.13 | | | | 0.12 | | | | 0.12 | | | | 0.10 | | | | 0.21 | (b) |
| | | | | | | |
| | Net realized and unrealized gain (loss) | | | 0.71 | | | | (0.59 | ) | | | 0.89 | | | | (0.23 | ) | | | (0.24 | ) | | | (0.14 | ) |
| | | | | | | |
| | Total from investment operations | | | 0.78 | | | | (0.46 | ) | | | 1.01 | | | | (0.11 | ) | | | (0.14 | ) | | | 0.07 | |
| | | | | | | |
| | Distributions to shareholders from net investment income | | | (0.06 | ) | | | (0.12 | ) | | | (0.26 | ) | | | (0.25 | ) | | | (0.15 | ) | | | (0.23 | ) |
| | | | | | | |
| | Net asset value, end of period | | $ | 6.62 | | | $ | 5.90 | | | $ | 6.48 | | | $ | 5.73 | | | $ | 6.09 | | | $ | 6.38 | |
| | | | | | | |
| | Total return(c) | | | 13.19 | % | | | (7.19 | )% | | | 17.89 | % | | | (1.84 | )% | | | (2.25 | )% | | | 1.05 | % |
| | | | | | | |
| | Net assets, end of period (in 000s) | | $ | 3,108 | | | $ | 3,081 | | | $ | 4,377 | | | $ | 5,400 | | | $ | 7,702 | | | $ | 10,017 | |
| | | | | | | |
| | Ratio of net expenses to average net assets | | | 1.38 | %(d) | | | 1.38 | % | | | 1.39 | % | | | 1.39 | % | | | 1.41 | % | | | 1.46 | % |
| | | | | | | |
| | Ratio of total expenses to average net assets | | | 1.86 | %(d) | | | 1.76 | % | | | 1.70 | % | | | 1.62 | % | | | 1.62 | % | | | 1.61 | % |
| | | | | | | |
| | Ratio of net investment income to average net assets | | | 2.21 | %(d) | | | 2.04 | % | | | 2.02 | % | | | 1.90 | % | | | 1.50 | % | | | 3.13 | %(b) |
| | | | | | | |
| | Portfolio turnover rate(e) | | | 14 | % | | | 43 | % | | | 38 | % | | | 41 | % | | | 45 | % | | | 50 | % |
| | (a) | | Calculated based on the average shares outstanding methodology. |
| | (b) | | Reflects income recognized from a corporate action which amounted to $0.10 per share and 1.50% of average net assets. |
| | (c) | | Assumes investment at the net asset value at the beginning of the period, reinvestment of all distributions, a complete redemption of the investment at the net asset value at the end of the period and no sales or redemption charges (if any). Total returns would be reduced if a sales or redemption charge was taken into account. Returns do not reflect the impact of taxes to shareholders relating to Fund distributions or the redemption of Fund shares. Total returns for periods less than one full year are not annualized. |
| | (e) | | The Fund’s portfolio turnover rate is calculated in accordance with regulatory requirements, without regard to transactions involving short term investments. If such transactions were included, the Fund’s portfolio turnover rate may be higher. |
| | |
| The accompanying notes are an integral part of these financial statements. | | 39 |
GOLDMAN SACHS INTERNATIONAL REAL ESTATE SECURITIES FUND
Financial Highlights(continued)
Selected Data for a Share Outstanding Throughout Each Period
| | | | | | | | | | | | | | | | | | | | | | | | | | |
| | | | | Goldman Sachs International Real Estate Securities Fund | |
| | | | | Class C Shares | |
| | | | | Six Months Ended
June 30, 2019
(Unaudited) | | | Year Ended December 31, | |
| | | | | 2018 | | | 2017 | | | 2016 | | | 2015 | | | 2014 | |
| | Per Share Data | |
| | | | | | | |
| | Net asset value, beginning of period | | $ | 5.94 | | | $ | 6.50 | | | $ | 5.73 | | | $ | 6.09 | | | $ | 6.38 | | | $ | 6.53 | |
| | | | | | | |
| | Net investment income(a) | | | 0.04 | | | | 0.09 | | | | 0.08 | | | | 0.07 | | | | 0.05 | | | | 0.16 | (b) |
| | | | | | | |
| | Net realized and unrealized gain (loss) | | | 0.72 | | | | (0.60 | ) | | | 0.90 | | | | (0.23 | ) | | | (0.24 | ) | | | (0.13 | ) |
| | | | | | | |
| | Total from investment operations | | | 0.76 | | | | (0.51 | ) | | | 0.98 | | | | (0.16 | ) | | | (0.19 | ) | | | 0.03 | |
| | | | | | | |
| | Distributions to shareholders from net investment income | | | (0.02 | ) | | | (0.05 | ) | | | (0.21 | ) | | | (0.20 | ) | | | (0.10 | ) | | | (0.18 | ) |
| | | | | | | |
| | Net asset value, end of period | | $ | 6.68 | | | $ | 5.94 | | | $ | 6.50 | | | $ | 5.73 | | | $ | 6.09 | | | $ | 6.38 | |
| | | | | | | |
| | Total return(c) | | | 12.74 | % | | | (7.89 | )% | | | 17.23 | % | | | (2.65 | )% | | | (3.03 | )% | | | 0.44 | % |
| | | | | | | |
| | Net assets, end of period (in 000s) | | $ | 142 | | | $ | 231 | | | $ | 810 | | | $ | 1,148 | | | $ | 1,622 | | | $ | 1,962 | |
| | | | | | | |
| | Ratio of net expenses to average net assets | | | 2.13 | %(d) | | | 2.13 | % | | | 2.14 | % | | | 2.14 | % | | | 2.16 | % | | | 2.21 | % |
| | | | | | | |
| | Ratio of total expenses to average net assets | | | 2.61 | %(d) | | | 2.49 | % | | | 2.44 | % | | | 2.37 | % | | | 2.37 | % | | | 2.36 | % |
| | | | | | | |
| | Ratio of net investment income to average net assets | | | 1.35 | %(d) | | | 1.38 | % | | | 1.26 | % | | | 1.12 | % | | | 0.76 | % | | | 2.42 | %(b) |
| | | | | | | |
| | Portfolio turnover rate(e) | | | 14 | % | | | 43 | % | | | 38 | % | | | 41 | % | | | 45 | % | | | 50 | % |
| | (a) | | Calculated based on the average shares outstanding methodology. |
| | (b) | | Reflects income recognized from a corporate action which amounted to $0.10 per share and 1.50% of average net assets. |
| | (c) | | Assumes investment at the net asset value at the beginning of the period, reinvestment of all distributions, a complete redemption of the investment at the net asset value at the end of the period and no sales or redemption charges (if any). Total returns would be reduced if a sales or redemption charge was taken into account. Returns do not reflect the impact of taxes to shareholders relating to Fund distributions or the redemption of Fund shares. Total returns for periods less than one full year are not annualized. |
| | (e) | | The Fund’s portfolio turnover rate is calculated in accordance with regulatory requirements, without regard to transactions involving short term investments. If such transactions were included, the Fund’s portfolio turnover rate may be higher. |
| | |
| 40 | | The accompanying notes are an integral part of these financial statements. |
GOLDMAN SACHS INTERNATIONAL REAL ESTATE SECURITIES FUND
Financial Highlights(continued)
Selected Data for a Share Outstanding Throughout Each Period
| | | | | | | | | | | | | | | | | | | | | | | | | | |
| | | | | Goldman Sachs International Real Estate Securities Fund | |
| | | | | Institutional Shares | |
| | | | | Six Months Ended
June 30, 2019
(Unaudited) | | | Year Ended December 31, | |
| | | | | 2018 | | | 2017 | | | 2016 | | | 2015 | | | 2014 | |
| | Per Share Data | |
| | | | | | | |
| | Net asset value, beginning of period | | $ | 5.71 | | | $ | 6.26 | | | $ | 5.54 | | | $ | 5.91 | | | $ | 6.19 | | | $ | 6.35 | |
| | | | | | | |
| | Net investment income(a) | | | 0.07 | | | | 0.18 | | | | 0.14 | | | | 0.14 | | | | 0.12 | | | | 0.22 | (b) |
| | | | | | | |
| | Net realized and unrealized gain (loss) | | | 0.69 | | | | (0.60 | ) | | | 0.87 | | | | (0.24 | ) | | | (0.22 | ) | | | (0.12 | ) |
| | | | | | | |
| | Total from investment operations | | | 0.76 | | | | (0.42 | ) | | | 1.01 | | | | (0.10 | ) | | | (0.10 | ) | | | 0.10 | |
| | | | | | | |
| | Distributions to shareholders from net investment income | | | (0.07 | ) | | | (0.13 | ) | | | (0.29 | ) | | | (0.27 | ) | | | (0.18 | ) | | | (0.26 | ) |
| | | | | | | |
| | Net asset value, end of period | | $ | 6.40 | | | $ | 5.71 | | | $ | 6.26 | | | $ | 5.54 | | | $ | 5.91 | | | $ | 6.19 | |
| | | | | | | |
| | Total return(c) | | | 13.32 | % | | | (6.72 | )% | | | 18.45 | % | | | (1.63 | )% | | | (1.73 | )% | | | 1.53 | % |
| | | | | | | |
| | Net assets, end of period (in 000s) | | $ | 6,555 | | | $ | 10,138 | | | $ | 117,768 | | | $ | 297,473 | | | $ | 333,601 | | | $ | 379,651 | |
| | | | | | | |
| | Ratio of net expenses to average net assets | | | 0.99 | %(d) | | | 0.99 | % | | | 0.99 | % | | | 0.99 | % | | | 1.01 | % | | | 1.05 | % |
| | | | | | | |
| | Ratio of total expenses to average net assets | | | 1.46 | %(d) | | | 1.35 | % | | | 1.28 | % | | | 1.22 | % | | | 1.22 | % | | | 1.21 | % |
| | | | | | | |
| | Ratio of net investment income to average net assets | | | 2.28 | %(d) | | | 2.90 | % | | | 2.44 | % | | | 2.28 | % | | | 1.92 | % | | | 3.42 | %(b) |
| | | | | | | |
| | Portfolio turnover rate(e) | | | 14 | % | | | 43 | % | | | 38 | % | | | 41 | % | | | 45 | % | | | 50 | % |
| | (a) | | Calculated based on the average shares outstanding methodology. |
| | (b) | | Reflects income recognized from a corporate action which amounted to $0.10 per share and 1.50% of average net assets. |
| | (c) | | Assumes investment at the net asset value at the beginning of the period, reinvestment of all distributions, a complete redemption of the investment at the net asset value at the end of the period and no sales or redemption charges (if any). Total returns would be reduced if a sales or redemption charge was taken into account. Returns do not reflect the impact of taxes to shareholders relating to Fund distributions or the redemption of Fund shares. Total returns for periods less than one full year are not annualized. |
| | (e) | | The Fund’s portfolio turnover rate is calculated in accordance with regulatory requirements, without regard to transactions involving short term investments. If such transactions were included, the Fund’s portfolio turnover rate may be higher. |
| | |
| The accompanying notes are an integral part of these financial statements. | | 41 |
GOLDMAN SACHS INTERNATIONAL REAL ESTATE SECURITIES FUND
Financial Highlights(continued)
Selected Data for a Share Outstanding Throughout Each Period
| | | | | | | | | | | | | | | | | | | | | | | | | | |
| | | | | Goldman Sachs International Real Estate Securities Fund | |
| | | | | Investor Shares(a) | |
| | | | | Six Months Ended
June 30, 2019
(Unaudited) | | | Year Ended December 31, | |
| | | | | 2018 | | | 2017 | | | 2016 | | | 2015 | | | 2014 | |
| | Per Share Data | |
| | | | | | | |
| | Net asset value, beginning of period | | $ | 5.85 | | | $ | 6.43 | | | $ | 5.68 | | | $ | 6.04 | | | $ | 6.33 | | | $ | 6.48 | |
| | | | | | | |
| | Net investment income(b) | | | 0.08 | | | | 0.14 | | | | 0.16 | | | | 0.12 | | | | 0.11 | | | | 0.20 | (c) |
| | | | | | | |
| | Net realized and unrealized gain (loss) | | | 0.71 | | | | (0.58 | ) | | | 0.87 | | | | (0.22 | ) | | | (0.24 | ) | | | (0.11 | ) |
| | | | | | | |
| | Total from investment operations | | | 0.79 | | | | (0.44 | ) | | | 1.03 | | | | (0.10 | ) | | | (0.13 | ) | | | 0.09 | |
| | | | | | | |
| | Distributions to shareholders from net investment income | | | (0.07 | ) | | | (0.14 | ) | | | (0.28 | ) | | | (0.26 | ) | | | (0.16 | ) | | | (0.24 | ) |
| | | | | | | |
| | Net asset value, end of period | | $ | 6.57 | | | $ | 5.85 | | | $ | 6.43 | | | $ | 5.68 | | | $ | 6.04 | | | $ | 6.33 | |
| | | | | | | |
| | Total return(d) | | | 13.45 | % | | | (7.00 | )% | | | 18.29 | % | | | (1.57 | )% | | | (2.04 | )% | | | 1.38 | % |
| | | | | | | |
| | Net assets, end of period (in 000s) | | $ | 110 | | | $ | 103 | | | $ | 109 | | | $ | 107 | | | $ | 88 | | | $ | 193 | |
| | | | | | | |
| | Ratio of net expenses to average net assets | | | 1.13 | %(e) | | | 1.13 | % | | | 1.14 | % | | | 1.14 | % | | | 1.17 | % | | | 1.21 | % |
| | | | | | | |
| | Ratio of total expenses to average net assets | | | 1.61 | %(e) | | | 1.52 | % | | | 1.45 | % | | | 1.37 | % | | | 1.37 | % | | | 1.35 | % |
| | | | | | | |
| | Ratio of net investment income to average net assets | | | 2.43 | %(e) | | | 2.24 | % | | | 2.54 | % | | | 2.05 | % | | | 1.64 | % | | | 2.98 | %(c) |
| | | | | | | |
| | Portfolio turnover rate(f) | | | 14 | % | | | 43 | % | | | 38 | % | | | 41 | % | | | 45 | % | | | 50 | % |
| | (a) | | Effective August 15, 2017, Class IR changed its name to Investor Shares. |
| | (b) | | Calculated based on the average shares outstanding methodology. |
| | (c) | | Reflects income recognized from a corporate action which amounted to $0.10 per share and 1.50% of average net assets. |
| | (d) | | Assumes investment at the net asset value at the beginning of the period, reinvestment of all distributions, a complete redemption of the investment at the net asset value at the end of the period and no sales or redemption charges (if any). Total returns would be reduced if a sales or redemption charge was taken into account. Returns do not reflect the impact of taxes to shareholders relating to Fund distributions or the redemption of Fund shares. Total returns for periods less than one full year are not annualized. |
| | (f) | | The Fund’s portfolio turnover rate is calculated in accordance with regulatory requirements, without regard to transactions involving short term investments. If such transactions were included, the Fund’s portfolio turnover rate may be higher. |
| | |
| 42 | | The accompanying notes are an integral part of these financial statements. |
GOLDMAN SACHS INTERNATIONAL REAL ESTATE SECURITIES FUND
Financial Highlights(continued)
Selected Data for a Share Outstanding Throughout Each Period
| | | | | | | | | | |
| | | | | Goldman Sachs International Real Estate
Securities Fund | |
| | | | | Class P Shares | |
| | | | | Six Months Ended
June 30, 2019
(Unaudited) | | | For the period
April 17, 2018* to
December 31, 2018 | |
| | Per Share Data | |
| | | |
| | Net asset value, beginning of period | | $ | 5.70 | | | $ | 6.38 | |
| | | |
| | Net investment income(a) | | | 0.08 | | | | 0.08 | |
| | | |
| | Net realized and unrealized gain (loss) | | | 0.68 | | | | (0.61 | ) |
| | | |
| | Total from investment operations | | | 0.76 | | | | (0.53 | ) |
| | | |
| | Distributions to shareholders from net investment income | | | (0.07 | ) | | | (0.15 | ) |
| | | |
| | Net asset value, end of period | | $ | 6.39 | | | $ | 5.70 | |
| | | |
| | Total return(b) | | | 13.35 | % | | | (8.45 | )% |
| | | |
| | Net assets, end of period (in 000s) | | $ | 74,582 | | | $ | 82,014 | |
| | | |
| | Ratio of net expenses to average net assets | | | 0.98 | %(c) | | | 0.98 | %(c) |
| | | |
| | Ratio of total expenses to average net assets | | | 1.46 | %(c) | | | 1.39 | %(c) |
| | | |
| | Ratio of net investment income to average net assets | | | 2.59 | %(c) | | | 1.85 | %(c) |
| | | |
| | Portfolio turnover rate(d) | | | 14 | % | | | 43 | % |
| | * | | Commencement of Operations. |
| | (a) | | Calculated based on the average shares outstanding methodology. |
| | (b) | | Assumes investment at the net asset value at the beginning of the period, reinvestment of all distributions, a complete redemption of the investment at the net asset value at the end of the period and no sales or redemption charges (if any). Total returns would be reduced if a sales or redemption charge was taken into account. Returns do not reflect the impact of taxes to shareholders relating to Fund distributions or the redemption of Fund shares. Total returns for periods less than one full year are not annualized. |
| | (d) | | The Fund’s portfolio turnover rate is calculated in accordance with regulatory requirements, without regard to transactions involving short term investments. If such transactions were included, the Fund’s portfolio turnover rate may be higher. |
| | |
| The accompanying notes are an integral part of these financial statements. | | 43 |
GOLDMAN SACHS INTERNATIONAL REAL ESTATE SECURITIES FUND
Financial Highlights(continued)
Selected Data for a Share Outstanding Throughout Each Period
| | | | | | | | | | | | | | | | | | | | | | |
| | | | | Goldman Sachs International Real Estate Securities Fund | |
| | | | | Class R6 Shares | |
| | | | | Six Months Ended
June 30, 2019
(Unaudited) | | | Year Ended December 31, | | | For the period
July 31, 2015* to
December 31, 2015 | |
| | | | | 2018 | | | 2017 | | | 2016 | |
| | Per Share Data | |
| | | | | | |
| | Net asset value, beginning of period | | $ | 5.70 | | | $ | 6.26 | | | $ | 5.54 | | | $ | 5.91 | | | $ | 6.33 | |
| | | | | | |
| | Net investment income(a) | | | 0.06 | | | | 0.24 | | | | 0.14 | | | | 0.13 | | | | 0.05 | |
| | | | | | |
| | Net realized and unrealized gain (loss) | | | 0.71 | | | | (0.65 | ) | | | 0.87 | | | | (0.23 | ) | | | (0.37 | ) |
| | | | | | |
| | Total from investment operations | | | 0.77 | | | | (0.41 | ) | | | 1.01 | | | | (0.10 | ) | | | (0.32 | ) |
| | | | | | |
| | Distributions to shareholders from net investment income | | | (0.07 | ) | | | (0.15 | ) | | | (0.29 | ) | | | (0.27 | ) | | | (0.10 | ) |
| | | | | | |
| | Net asset value, end of period | | $ | 6.40 | | | $ | 5.70 | | | $ | 6.26 | | | $ | 5.54 | | | $ | 5.91 | |
| | | | | | |
| | Total return(b) | | | 13.52 | % | | | (6.71 | )% | | | 18.48 | % | | | (1.61 | )% | | | (5.03 | )% |
| | | | | | |
| | Net assets, end of period (in 000s) | | $ | 64 | | | $ | 202 | | | $ | 11 | | | $ | 9 | | | $ | 9 | |
| | | | | | |
| | Ratio of net expenses to average net assets | | | 0.98 | %(c) | | | 0.98 | % | | | 0.99 | % | | | 1.02 | % | | | 0.99 | %(c) |
| | | | | | |
| | Ratio of total expenses to average net assets | | | 1.45 | %(c) | | | 1.29 | % | | | 1.29 | % | | | 1.18 | % | | | 1.15 | %(c) |
| | | | | | |
| | Ratio of net investment income to average net assets | | | 1.84 | %(c) | | | 3.86 | % | | | 2.41 | % | | | 2.26 | % | | | 1.91 | %(c) |
| | | | | | |
| | Portfolio turnover rate(d) | | | 14 | % | | | 43 | % | | | 38 | % | | | 41 | % | | | 45 | % |
| | * | | Commencement of Operations. |
| | (a) | | Calculated based on the average shares outstanding methodology. |
| | (b) | | Assumes investment at the net asset value at the beginning of the period, reinvestment of all distributions, a complete redemption of the investment at the net asset value at the end of the period and no sales or redemption charges (if any). Total returns would be reduced if a sales or redemption charge was taken into account. Returns do not reflect the impact of taxes to shareholders relating to Fund distributions or the redemption of Fund shares. Total returns for periods less than one full year are not annualized. |
| | (d) | | The Fund’s portfolio turnover rate is calculated in accordance with regulatory requirements, without regard to transactions involving short term investments. If such transactions were included, the Fund’s portfolio turnover rate may be higher. |
| | |
| 44 | | The accompanying notes are an integral part of these financial statements. |
GOLDMAN SACHS REAL ESTATE SECURITIES FUND
Financial Highlights(continued)
Selected Data for a Share Outstanding Throughout Each Period
| | | | | | | | | | | | | | | | | | | | | | | | | | |
| | | | | Goldman Sachs Real Estate Securities Fund | |
| | | | | Class A Shares | |
| | | | | Six Months Ended
June 30, 2019
(Unaudited) | | | Year Ended December 31, | |
| | | | | 2018 | | | 2017 | | | 2016 | | | 2015 | | | 2014 | |
| | Per Share Data | |
| | | | | | | |
| | Net asset value, beginning of period | | $ | 12.61 | | | $ | 15.53 | | | $ | 18.40 | | | $ | 19.59 | | | $ | 19.83 | | | $ | 15.54 | |
| | | | | | | |
| | Net investment income(a) | | | 0.11 | | | | 0.28 | | | | 0.30 | | | | 0.33 | | | | 0.29 | | | | 0.21 | (b) |
| | | | | | | |
| | Net realized and unrealized gain (loss) | | | 2.13 | | | | (0.94 | ) | | | 0.06 | | | | 0.71 | | | | 0.30 | | | | 4.36 | |
| | | | | | | |
| | Total from investment operations | | | 2.24 | | | | (0.66 | ) | | | 0.36 | | | | 1.04 | | | | 0.59 | | | | 4.57 | |
| | | | | | | |
| | Distributions to shareholders from net investment income | | | (0.11 | ) | | | (0.37 | ) | | | (0.29 | ) | | | (0.32 | ) | | | (0.31 | ) | | | (0.28 | ) |
| | | | | | | |
| | Distributions to shareholders from net realized gains | | | — | | | | (1.89 | ) | | | (2.94 | ) | | | (1.91 | ) | | | (0.52 | ) | | | — | |
| | | | | | | |
| | Total distributions | | | (0.11 | ) | | | (2.26 | ) | | | (3.23 | ) | | | (2.23 | ) | | | (0.83 | ) | | | (0.28 | ) |
| | | | | | | |
| | Net asset value, end of period | | $ | 14.74 | | | $ | 12.61 | | | $ | 15.53 | | | $ | 18.40 | | | $ | 19.59 | | | $ | 19.83 | |
| | | | | | | |
| | Total return(c) | | | 17.81 | % | | | (5.39 | )% | | | 2.11 | % | | | 5.38 | % | | | 3.14 | % | | | 29.63 | % |
| | | | | | | |
| | Net assets, end of period (in 000s) | | $ | 28,457 | | | $ | 26,002 | | | $ | 38,120 | | | $ | 54,869 | | | $ | 57,936 | | | $ | 73,103 | |
| | | | | | | |
| | Ratio of net expenses to average net assets | | | 1.30 | %(d) | | | 1.30 | % | | | 1.31 | % | | | 1.31 | % | | | 1.26 | % | | | 1.39 | % |
| | | | | | | |
| | Ratio of total expenses to average net assets | | | 1.56 | %(d) | | | 1.50 | % | | | 1.54 | % | | | 1.52 | % | | | 1.51 | % | | | 1.52 | % |
| | | | | | | |
| | Ratio of net investment income to average net assets | | | 1.54 | %(d) | | | 1.88 | % | | | 1.65 | % | | | 1.62 | % | | | 1.44 | % | | | 1.15 | %(b) |
| | | | | | | |
| | Portfolio turnover rate(e) | | | 25 | % | | | 43 | % | | | 35 | % | | | 31 | % | | | 41 | % | | | 52 | % |
| | (a) | | Calculated based on the average shares outstanding methodology. |
| | (b) | | Reflects income recognized from special dividends which amounted to $0.07 per share and 0.37% of average net assets. |
| | (c) | | Assumes investment at the net asset value at the beginning of the period, reinvestment of all distributions, a complete redemption of the investment at the net asset value at the end of the period and no sales or redemption charges (if any). Total returns would be reduced if a sales or redemption charge was taken into account. Returns do not reflect the impact of taxes to shareholders relating to Fund distributions or the redemption of Fund shares. Total returns for periods less than one full year are not annualized. |
| | (e) | | The Fund’s portfolio turnover rate is calculated in accordance with regulatory requirements, without regard to transactions involving short term investments and certain derivatives. If such transactions were included, the Fund’s portfolio turnover rate may be higher. |
| | |
| The accompanying notes are an integral part of these financial statements. | | 45 |
GOLDMAN SACHS REAL ESTATE SECURITIES FUND
Financial Highlights(continued)
Selected Data for a Share Outstanding Throughout Each Period
| | | | | | | | | | | | | | | | | | | | | | | | | | |
| | | | | Goldman Sachs Real Estate Securities Fund | |
| | | | | Class C Shares | |
| | | | | Six Months Ended
June 30, 2019
(Unaudited) | | | Year Ended December 31, | |
| | | | | 2018 | | | 2017 | | | 2016 | | | 2015 | | | 2014 | |
| | Per Share Data | |
| | | | | | | |
| | Net asset value, beginning of period | | $ | 11.99 | | | $ | 14.88 | | | $ | 17.79 | | | $ | 19.03 | | | $ | 19.32 | | | $ | 15.18 | |
| | | | | | | |
| | Net investment income(a) | | | 0.05 | | | | 0.12 | | | | 0.16 | | | | 0.18 | | | | 0.14 | | | | 0.07 | (b) |
| | | | | | | |
| | Net realized and unrealized gain (loss) | | | 2.03 | | | | (0.85 | ) | | | 0.06 | | | | 0.68 | | | | 0.30 | | | | 4.25 | |
| | | | | | | |
| | Total from investment operations | | | 2.08 | | | | (0.73 | ) | | | 0.22 | | | | 0.86 | | | | 0.44 | | | | 4.32 | |
| | | | | | | |
| | Distributions to shareholders from net investment income | | | (0.06 | ) | | | (0.27 | ) | | | (0.19 | ) | | | (0.19 | ) | | | (0.21 | ) | | | (0.18 | ) |
| | | | | | | |
| | Distributions to shareholders from net realized gains | | | — | | | | (1.89 | ) | | | (2.94 | ) | | | (1.91 | ) | | | (0.52 | ) | | | — | |
| | | | | | | |
| | Total distributions | | | (0.06 | ) | | | (2.16 | ) | | | (3.13 | ) | | | (2.10 | ) | | | (0.73 | ) | | | (0.18 | ) |
| | | | | | | |
| | Net asset value, end of period | | $ | 14.01 | | | $ | 11.99 | | | $ | 14.88 | | | $ | 17.79 | | | $ | 19.03 | | | $ | 19.32 | |
| | | | | | | |
| | Total return(c) | | | 17.36 | % | | | (6.12 | )% | | | 1.38 | % | | | 4.56 | % | | | 2.39 | % | | | 28.64 | % |
| | | | | | | |
| | Net assets, end of period (in 000s) | | $ | 3,125 | | | $ | 3,568 | | | $ | 12,421 | | | $ | 15,578 | | | $ | 15,056 | | | $ | 16,497 | |
| | | | | | | |
| | Ratio of net expenses to average net assets | | | 2.05 | %(d) | | | 2.05 | % | | | 2.06 | % | | | 2.06 | % | | | 2.01 | % | | | 2.14 | % |
| | | | | | | |
| | Ratio of total expenses to average net assets | | | 2.31 | %(d) | | | 2.25 | % | | | 2.29 | % | | | 2.27 | % | | | 2.26 | % | | | 2.26 | % |
| | | | | | | |
| | Ratio of net investment income to average net assets | | | 0.68 | %(d) | | | 0.83 | % | | | 0.92 | % | | | 0.91 | % | | | 0.73 | % | | | 0.39 | %(b) |
| | | | | | | |
| | Portfolio turnover rate(e) | | | 25 | % | | | 43 | % | | | 35 | % | | | 31 | % | | | 41 | % | | | 52 | % |
| | (a) | | Calculated based on the average shares outstanding methodology. |
| | (b) | | Reflects income recognized from special dividends which amounted to $0.07 per share and 0.37% of average net assets. |
| | (c) | | Assumes investment at the net asset value at the beginning of the period, reinvestment of all distributions, a complete redemption of the investment at the net asset value at the end of the period and no sales or redemption charges (if any). Total returns would be reduced if a sales or redemption charge was taken into account. Returns do not reflect the impact of taxes to shareholders relating to Fund distributions or the redemption of Fund shares. Total returns for periods less than one full year are not annualized. |
| | (e) | | The Fund’s portfolio turnover rate is calculated in accordance with regulatory requirements, without regard to transactions involving short term investments and certain derivatives. If such transactions were included, the Fund’s portfolio turnover rate may be higher. |
| | |
| 46 | | The accompanying notes are an integral part of these financial statements. |
GOLDMAN SACHS REAL ESTATE SECURITIES FUND
Financial Highlights(continued)
Selected Data for a Share Outstanding Throughout Each Period
| | | | | | | | | | | | | | | | | | | | | | | | | | |
| | | | | Goldman Sachs Real Estate Securities Fund | |
| | | | | Institutional Shares | |
| | | | | Six Months Ended
June 30, 2019
(Unaudited) | | | Year Ended December 31, | |
| | | | | 2018 | | | 2017 | | | 2016 | | | 2015 | | | 2014 | |
| | Per Share Data | |
| | | | | | | |
| | Net asset value, beginning of period | | $ | 13.05 | | | $ | 15.98 | | | $ | 18.81 | | | $ | 19.97 | | | $ | 20.18 | | | $ | 15.80 | |
| | | | | | | |
| | Net investment income(a) | | | 0.14 | | | | 0.23 | | | | 0.37 | | | | 0.41 | | | | 0.38 | | | | 0.27 | (b) |
| | | | | | | |
| | Net realized and unrealized gain (loss) | | | 2.21 | | | | (0.86 | ) | | | 0.08 | | | | 0.74 | | | | 0.30 | | | | 4.44 | |
| | | | | | | |
| | Total from investment operations | | | 2.35 | | | | (0.63 | ) | | | 0.45 | | | | 1.15 | | | | 0.68 | | | | 4.71 | |
| | | | | | | |
| | Distributions to shareholders from net investment income | | | (0.14 | ) | | | (0.41 | ) | | | (0.34 | ) | | | (0.40 | ) | | | (0.37 | ) | | | (0.33 | ) |
| | | | | | | |
| | Distributions to shareholders from net realized gains | | | — | | | | (1.89 | ) | | | (2.94 | ) | | | (1.91 | ) | | | (0.52 | ) | | | — | |
| | | | | | | |
| | Total distributions | | | (0.14 | ) | | | (2.30 | ) | | | (3.28 | ) | | | (2.31 | ) | | | (0.89 | ) | | | (0.33 | ) |
| | | | | | | |
| | Net asset value, end of period | | $ | 15.26 | | | $ | 13.05 | | | $ | 15.98 | | | $ | 18.81 | | | $ | 19.97 | | | $ | 20.18 | |
| | | | | | | |
| | Total return(c) | | | 18.02 | % | | | (5.04 | )% | | | 2.58 | % | | | 5.81 | % | | | 3.56 | % | | | 30.10 | % |
| | | | | | | |
| | Net assets, end of period (in 000s) | | $ | 31,228 | | | $ | 31,337 | | | $ | 206,095 | | | $ | 397,211 | | | $ | 463,105 | | | $ | 502,407 | |
| | | | | | | |
| | Ratio of net expenses to average net assets | | | 0.91 | %(d) | | | 0.91 | % | | | 0.91 | % | | | 0.91 | % | | | 0.86 | % | | | 0.99 | % |
| | | | | | | |
| | Ratio of total expenses to average net assets | | | 1.17 | %(d) | | | 1.12 | % | | | 1.14 | % | | | 1.12 | % | | | 1.11 | % | | | 1.11 | % |
| | | | | | | |
| | Ratio of net investment income to average net assets | | | 1.88 | %(d) | | | 1.50 | % | | | 1.98 | % | | | 2.03 | % | | | 1.88 | % | | | 1.49 | %(b) |
| | | | | | | |
| | Portfolio turnover rate(e) | | | 25 | % | | | 43 | % | | | 35 | % | | | 31 | % | | | 41 | % | | | 52 | % |
| | (a) | | Calculated based on the average shares outstanding methodology. |
| | (b) | | Reflects income recognized from special dividends which amounted to $0.07 per share and 0.37% of average net assets. |
| | (c) | | Assumes investment at the net asset value at the beginning of the period, reinvestment of all distributions, a complete redemption of the investment at the net asset value at the end of the period and no sales or redemption charges (if any). Total returns would be reduced if a sales or redemption charge was taken into account. Returns do not reflect the impact of taxes to shareholders relating to Fund distributions or the redemption of Fund shares. Total returns for periods less than one full year are not annualized. |
| | (e) | | The Fund’s portfolio turnover rate is calculated in accordance with regulatory requirements, without regard to transactions involving short term investments and certain derivatives. If such transactions were included, the Fund’s portfolio turnover rate may be higher. |
| | |
| The accompanying notes are an integral part of these financial statements. | | 47 |
GOLDMAN SACHS REAL ESTATE SECURITIES FUND
Financial Highlights(continued)
Selected Data for a Share Outstanding Throughout Each Period
| | | | | | | | | | | | | | | | | | | | | | | | | | |
| | | | | Goldman Sachs Real Estate Securities Fund | |
| | | | | Service Shares | |
| | | | | Six Months Ended
June 30, 2019
(Unaudited) | | | Year Ended December 31, | |
| | | | | 2018 | | | 2017 | | | 2016 | | | 2015 | | | 2014 | |
| | Per Share Data | |
| | | | | | | |
| | Net asset value, beginning of period | | $ | 12.71 | | | $ | 15.65 | | | $ | 18.52 | | | $ | 19.71 | | | $ | 19.94 | | | $ | 15.63 | |
| | | | | | | |
| | Net investment income(a) | | | 0.11 | | | | 0.26 | | | | 0.29 | | | | 0.31 | | | | 0.27 | | | | 0.18 | (b) |
| | | | | | | |
| | Net realized and unrealized gain (loss) | | | 2.15 | | | | (0.95 | ) | | | 0.06 | | | | 0.72 | | | | 0.32 | | | | 4.39 | |
| | | | | | | |
| | Total from investment operations | | | 2.26 | | | | (0.69 | ) | | | 0.35 | | | | 1.03 | | | | 0.59 | | | | 4.57 | |
| | | | | | | |
| | Distributions to shareholders from net investment income | | | (0.11 | ) | | | (0.36 | ) | | | (0.28 | ) | | | (0.31 | ) | | | (0.30 | ) | | | (0.26 | ) |
| | | | | | | |
| | Distributions to shareholders from net realized gains | | | — | | | | (1.89 | ) | | | (2.94 | ) | | | (1.91 | ) | | | (0.52 | ) | | | — | |
| | | | | | | |
| | Total distributions | | | (0.11 | ) | | | (2.25 | ) | | | (3.22 | ) | | | (2.22 | ) | | | (0.82 | ) | | | (0.26 | ) |
| | | | | | | |
| | Net asset value, end of period | | $ | 14.86 | | | $ | 12.71 | | | $ | 15.65 | | | $ | 18.52 | | | $ | 19.71 | | | $ | 19.94 | |
| | | | | | | |
| | Total return(c) | | | 17.77 | % | | | (5.56 | )% | | | 2.07 | % | | | 5.20 | % | | | 3.09 | % | | | 29.49 | % |
| | | | | | | |
| | Net assets, end of period (in 000s) | | $ | 1,750 | | | $ | 1,429 | | | $ | 2,446 | | | $ | 2,951 | | | $ | 2,744 | | | $ | 3,527 | |
| | | | | | | |
| | Ratio of net expenses to average net assets | | | 1.41 | %(d) | | | 1.41 | % | | | 1.41 | % | | | 1.41 | % | | | 1.36 | % | | | 1.49 | % |
| | | | | | | |
| | Ratio of total expenses to average net assets | | | 1.67 | %(d) | | | 1.61 | % | | | 1.64 | % | | | 1.62 | % | | | 1.61 | % | | | 1.61 | % |
| | | | | | | |
| | Ratio of net investment income to average net assets | | | 1.49 | %(d) | | | 1.73 | % | | | 1.60 | % | | | 1.55 | % | | | 1.35 | % | | | 0.98 | %(b) |
| | | | | | | |
| | Portfolio turnover rate(e) | | | 25 | % | | | 43 | % | | | 35 | % | | | 31 | % | | | 41 | % | | | 52 | % |
| | (a) | | Calculated based on the average shares outstanding methodology. |
| | (b) | | Reflects income recognized from special dividends which amounted to $0.07 per share and 0.37% of average net assets. |
| | (c) | | Assumes investment at the net asset value at the beginning of the period, reinvestment of all distributions, a complete redemption of the investment at the net asset value at the end of the period and no sales or redemption charges (if any). Total returns would be reduced if a sales or redemption charge was taken into account. Returns do not reflect the impact of taxes to shareholders relating to Fund distributions or the redemption of Fund shares. Total returns for periods less than one full year are not annualized. |
| | (e) | | The Fund’s portfolio turnover rate is calculated in accordance with regulatory requirements, without regard to transactions involving short term investments and certain derivatives. If such transactions were included, the Fund’s portfolio turnover rate may be higher. |
| | |
| 48 | | The accompanying notes are an integral part of these financial statements. |
GOLDMAN SACHS REAL ESTATE SECURITIES FUND
Financial Highlights(continued)
Selected Data for a Share Outstanding Throughout Each Period
| | | | | | | | | | | | | | | | | | | | | | | | | | |
| | | | | Goldman Sachs Real Estate Securities Fund | |
| | | | | Investor Shares(a) | |
| | | | | Six Months Ended
June 30, 2019
(Unaudited) | | | Year Ended December 31, | |
| | | | | 2018 | | | 2017 | | | 2016 | | | 2015 | | | 2014 | |
| | Per Share Data | |
| | | | | | | |
| | Net asset value, beginning of period | | $ | 12.73 | | | $ | 15.65 | | | $ | 18.50 | | | $ | 19.68 | | | $ | 19.90 | | | $ | 15.59 | |
| | | | | | | |
| | Net investment income(b) | | | 0.12 | | | | 0.31 | | | | 0.36 | | | | 0.39 | | | | 0.35 | | | | 0.31 | (c) |
| | | | | | | |
| | Net realized and unrealized gain (loss) | | | 2.16 | | | | (0.94 | ) | | | 0.06 | | | | 0.71 | | | | 0.30 | | | | 4.31 | |
| | | | | | | |
| | Total from investment operations | | | 2.28 | | | | (0.63 | ) | | | 0.42 | | | | 1.10 | | | | 0.65 | | | | 4.62 | |
| | | | | | | |
| | Distributions to shareholders from net investment income | | | (0.13 | ) | | | (0.40 | ) | | | (0.33 | ) | | | (0.37 | ) | | | (0.35 | ) | | | (0.31 | ) |
| | | | | | | |
| | Distributions to shareholders from net realized gains | | | — | | | | (1.89 | ) | | | (2.94 | ) | | | (1.91 | ) | | | (0.52 | ) | | | — | |
| | | | | | | |
| | Total distributions | | | (0.13 | ) | | | (2.29 | ) | | | (3.27 | ) | | | (2.28 | ) | | | (0.87 | ) | | | (0.31 | ) |
| | | | | | | |
| | Net asset value, end of period | | $ | 14.88 | | | $ | 12.73 | | | $ | 15.65 | | | $ | 18.50 | | | $ | 19.68 | | | $ | 19.90 | |
| | | | | | | |
| | Total return(d) | | | 17.92 | % | | | (5.18 | )% | | | 2.42 | % | | | 5.65 | % | | | 3.44 | % | | | 29.94 | % |
| | | | | | | |
| | Net assets, end of period (in 000s) | | $ | 8,322 | | | $ | 7,969 | | | $ | 10,776 | | | $ | 8,467 | | | $ | 7,283 | | | $ | 6,900 | |
| | | | | | | |
| | Ratio of net expenses to average net assets | | | 1.05 | %(e) | | | 1.05 | % | | | 1.06 | % | | | 1.06 | % | | | 1.01 | % | | | 1.14 | % |
| | | | | | | |
| | Ratio of total expenses to average net assets | | | 1.31 | %(e) | | | 1.25 | % | | | 1.29 | % | | | 1.27 | % | | | 1.26 | % | | | 1.27 | % |
| | | | | | | |
| | Ratio of net investment income to average net assets | | | 1.70 | %(e) | | | 2.10 | % | | | 1.99 | % | | | 1.92 | % | | | 1.77 | % | | | 1.70 | %(c) |
| | | | | | | |
| | Portfolio turnover rate(f) | | | 25 | % | | | 43 | % | | | 35 | % | | | 31 | % | | | 41 | % | | | 52 | % |
| | (a) | | Effective August 15, 2017, Class IR changed its name to Investor Shares. |
| | (b) | | Calculated based on the average shares outstanding methodology. |
| | (c) | | Reflects income recognized from special dividends which amounted to $0.07 per share and 0.37% of average net assets. |
| | (d) | | Assumes investment at the net asset value at the beginning of the period, reinvestment of all distributions, a complete redemption of the investment at the net asset value at the end of the period and no sales or redemption charges (if any). Total returns would be reduced if a sales or redemption charge was taken into account. Returns do not reflect the impact of taxes to shareholders relating to Fund distributions or the redemption of Fund shares. Total returns for periods less than one full year are not annualized. |
| | (f) | | The Fund’s portfolio turnover rate is calculated in accordance with regulatory requirements, without regard to transactions involving short term investments and certain derivatives. If such transactions were included, the Fund’s portfolio turnover rate may be higher. |
| | |
| The accompanying notes are an integral part of these financial statements. | | 49 |
GOLDMAN SACHS REAL ESTATE SECURITIES FUND
Financial Highlights(continued)
Selected Data for a Share Outstanding Throughout Each Period
| | | | | | | | | | |
| | | | | Goldman Sachs Real Estate Securities Fund | |
| | | | | Class P Shares | |
| | | | | Six Months Ended
June 30, 2019
(Unaudited) | | | For the period
April 17, 2018* to
December 31, 2018 | |
| | Per Share Data | |
| | | |
| | Net asset value, beginning of period | | $ | 13.04 | | | $ | 14.90 | |
| | | |
| | Net investment income(a) | | | 0.14 | | | | 0.39 | |
| | | |
| | Net realized and unrealized gain (loss) | | | 2.21 | | | | (0.01 | ) |
| | | |
| | Total from investment operations | | | 2.35 | | | | 0.38 | |
| | | |
| | Distributions to shareholders from net investment income | | | (0.14 | ) | | | (0.35 | ) |
| | | |
| | Distributions to shareholders from net realized gains | | | — | | | | (1.89 | ) |
| | | |
| | Total distributions | | | (0.14 | ) | | | (2.24 | ) |
| | | |
| | Net asset value, end of period | | $ | 15.25 | | | $ | 13.04 | |
| | | |
| | Total return(b) | | | 18.04 | % | | | 1.36 | % |
| | | |
| | Net assets, end of period (in 000s) | | $ | 92,575 | | | $ | 89,479 | |
| | | |
| | Ratio of net expenses to average net assets | | | 0.90 | %(c) | | | 0.90 | %(c) |
| | | |
| | Ratio of total expenses to average net assets | | | 1.16 | %(c) | | | 1.07 | %(c) |
| | | |
| | Ratio of net investment income to average net assets | | | 1.95 | %(c) | | | 3.56 | %(c) |
| | | |
| | Portfolio turnover rate(d) | | | 25 | % | | | 43 | % |
| | * | | Commencement of Operations. |
| | (a) | | Calculated based on the average shares outstanding methodology. |
| | (b) | | Assumes investment at the net asset value at the beginning of the period, reinvestment of all distributions, a complete redemption of the investment at the net asset value at the end of the period and no sales or redemption charges (if any). Total returns would be reduced if a sales or redemption charge was taken into account. Returns do not reflect the impact of taxes to shareholders relating to Fund distributions or the redemption of Fund shares. Total returns for periods less than one full year are not annualized. |
| | (d) | | The Fund’s portfolio turnover rate is calculated in accordance with regulatory requirements, without regard to transactions involving short term investments and certain derivatives. If such transactions were included, the Fund’s portfolio turnover rate may be higher. |
| | |
| 50 | | The accompanying notes are an integral part of these financial statements. |
GOLDMAN SACHS REAL ESTATE SECURITIES FUND
Financial Highlights(continued)
Selected Data for a Share Outstanding Throughout Each Period
| | | | | | | | | | | | | | | | | | | | | | | | | | |
| | | | | Goldman Sachs Real Estate Securities Fund | |
| | | | | Class R Shares | |
| | | | | Six Months Ended
June 30, 2019
(Unaudited) | | | Year Ended December 31, | |
| | | | | 2018 | | | 2017 | | | 2016 | | | 2015 | | | 2014 | |
| | Per Share Data | |
| | | | | | | |
| | Net asset value, beginning of period | | $ | 12.47 | | | $ | 15.39 | | | $ | 18.27 | | | $ | 19.47 | | | $ | 19.73 | | | $ | 15.48 | |
| | | | | | | |
| | Net investment income(a) | | | 0.09 | | | | 0.24 | | | | 0.26 | | | | 0.29 | | | | 0.27 | | | | 0.19 | (b) |
| | | | | | | |
| | Net realized and unrealized gain (loss) | | | 2.11 | | | | (0.93 | ) | | | 0.05 | | | | 0.70 | | | | 0.27 | | | | 4.31 | |
| | | | | | | |
| | Total from investment operations | | | 2.20 | | | | (0.69 | ) | | | 0.31 | | | | 0.99 | | | | 0.54 | | | | 4.50 | |
| | | | | | | |
| | Distributions to shareholders from net investment income | | | (0.10 | ) | | | (0.34 | ) | | | (0.25 | ) | | | (0.28 | ) | | | (0.28 | ) | | | (0.25 | ) |
| | | | | | | |
| | Distributions to shareholders from net realized gains | | | — | | | | (1.89 | ) | | | (2.94 | ) | | | (1.91 | ) | | | (0.52 | ) | | | — | |
| | | | | | | |
| | Total distributions | | | (0.10 | ) | | | (2.23 | ) | | | (3.19 | ) | | | (2.19 | ) | | | (0.80 | ) | | | (0.25 | ) |
| | | | | | | |
| | Net asset value, end of period | | $ | 14.57 | | | $ | 12.47 | | | $ | 15.39 | | | $ | 18.27 | | | $ | 19.47 | | | $ | 19.73 | |
| | | | | | | |
| | Total return(c) | | | 17.64 | % | | | (5.62 | )% | | | 1.92 | % | | | 5.08 | % | | | 2.89 | % | | | 29.29 | % |
| | | | | | | |
| | Net assets, end of period (in 000s) | | $ | 1,846 | | | $ | 1,770 | | | $ | 3,092 | | | $ | 4,156 | | | $ | 3,149 | | | $ | 1,877 | |
| | | | | | | |
| | Ratio of net expenses to average net assets | | | 1.55 | %(d) | | | 1.55 | % | | | 1.56 | % | | | 1.56 | % | | | 1.50 | % | | | 1.64 | % |
| | | | | | | |
| | Ratio of total expenses to average net assets | | | 1.81 | %(d) | | | 1.75 | % | | | 1.79 | % | | | 1.77 | % | | | 1.77 | % | | | 1.77 | % |
| | | | | | | |
| | Ratio of net investment income to average net assets | | | 1.28 | %(d) | | | 1.60 | % | | | 1.45 | % | | | 1.44 | % | | | 1.38 | % | | | 1.05 | %(b) |
| | | | | | | |
| | Portfolio turnover rate(e) | | | 25 | % | | | 43 | % | | | 35 | % | | | 31 | % | | | 41 | % | | | 52 | % |
| | (a) | | Calculated based on the average shares outstanding methodology. |
| | (b) | | Reflects income recognized from special dividends which amounted to $0.07 per share and 0.37% of average net assets. |
| | (c) | | Assumes investment at the net asset value at the beginning of the period, reinvestment of all distributions, a complete redemption of the investment at the net asset value at the end of the period and no sales or redemption charges (if any). Total returns would be reduced if a sales or redemption charge was taken into account. Returns do not reflect the impact of taxes to shareholders relating to Fund distributions or the redemption of Fund shares. Total returns for periods less than one full year are not annualized. |
| | (e) | | The Fund’s portfolio turnover rate is calculated in accordance with regulatory requirements, without regard to transactions involving short term investments and certain derivatives. If such transactions were included, the Fund’s portfolio turnover rate may be higher. |
| | |
| The accompanying notes are an integral part of these financial statements. | | 51 |
GOLDMAN SACHS REAL ESTATE SECURITIES FUND
Financial Highlights(continued)
Selected Data for a Share Outstanding Throughout Each Period
| | | | | | | | | | | | | | | | | | | | | | |
| | | | | Goldman Sachs Real Estate Securities Fund | |
| | | | | Class R6 Shares | |
| | | | | Six Months Ended
June 30, 2019
(Unaudited) | | | Year Ended December 31, | | | For the period
July 31, 2015* to
December 31, 2015 | |
| | | | | 2018 | | | 2017 | | | 2016 | |
| | Per Share Data | |
| | | | | | |
| | Net asset value, beginning of period | | $ | 13.05 | | | $ | 15.98 | | | $ | 18.81 | | | $ | 19.98 | | | $ | 19.93 | |
| | | | | | |
| | Net investment income(a) | | | 0.14 | | | | 0.16 | | | | 0.41 | | | | 0.46 | | | | 0.22 | |
| | | | | | |
| | Net realized and unrealized gain (loss) | | | 2.21 | | | | (0.79 | ) | | | 0.05 | | | | 0.68 | | | | 0.48 | |
| | | | | | |
| | Total from investment operations | | | 2.35 | | | | (0.63 | ) | | | 0.46 | | | | 1.14 | | | | 0.70 | |
| | | | | | |
| | Distributions to shareholders from net investment income | | | (0.14 | ) | | | (0.41 | ) | | | (0.35 | ) | | | (0.40 | ) | | | (0.13 | ) |
| | | | | | |
| | Distributions to shareholders from net realized gains | | | — | | | | (1.89 | ) | | | (2.94 | ) | | | (1.91 | ) | | | (0.52 | ) |
| | | | | | |
| | Total distributions | | | (0.14 | ) | | | (2.30 | ) | | | (3.29 | ) | | | (2.31 | ) | | | (0.65 | ) |
| | | | | | |
| | Net asset value, end of period | | $ | 15.26 | | | $ | 13.05 | | | $ | 15.98 | | | $ | 18.81 | | | $ | 19.98 | |
| | | | | | |
| | Total return(b) | | | 18.03 | % | | | (5.03 | )% | | | 2.60 | % | | | 5.77 | % | | | 3.64 | % |
| | | | | | |
| | Net assets, end of period (in 000s) | | $ | 804 | | | $ | 797 | | | $ | 227 | | | $ | 42 | | | $ | 10 | |
| | | | | | |
| | Ratio of net expenses to average net assets | | | 0.90 | %(c) | | | 0.90 | % | | | 0.90 | % | | | 0.90 | % | | | 0.91 | %(c) |
| | | | | | |
| | Ratio of total expenses to average net assets | | | 1.16 | %(c) | | | 1.08 | % | | | 1.14 | % | | | 1.09 | % | | | 1.07 | %(c) |
| | | | | | |
| | Ratio of net investment income to average net assets | | | 1.92 | %(c) | | | 1.02 | % | | | 2.23 | % | | | 2.25 | % | | | 2.65 | %(c) |
| | | | | | |
| | Portfolio turnover rate(d) | | | 25 | % | | | 43 | % | | | 35 | % | | | 31 | % | | | 41 | % |
| | * | | Commencement of Operations. |
| | (a) | | Calculated based on the average shares outstanding methodology. |
| | (b) | | Assumes investment at the net asset value at the beginning of the period, reinvestment of all distributions, a complete redemption of the investment at the net asset value at the end of the period and no sales or redemption charges (if any). Total returns would be reduced if a sales or redemption charge was taken into account. Returns do not reflect the impact of taxes to shareholders relating to Fund distributions or the redemption of Fund shares. Total returns for periods less than one full year are not annualized. |
| | (d) | | The Fund’s portfolio turnover rate is calculated in accordance with regulatory requirements, without regard to transactions involving short term investments and certain derivatives. If such transactions were included, the Fund’s portfolio turnover rate may be higher. |
| | |
| 52 | | The accompanying notes are an integral part of these financial statements. |
GOLDMAN SACHS REAL ESTATE SECURITIES FUNDS
Notes to Financial Statements
June 30, 2019 (Unaudited)
Goldman Sachs Trust (the “Trust”) is a Delaware statutory trust registered under the Investment Company Act of 1940, as amended (the “Act”), as an open-end management investment company. The following table lists those series of the Trust that are included in this report (collectively, the “Funds” or individually a “Fund”), along with their corresponding share classes and respective diversification status under the Act:
| | | | |
| Fund | | Share Classes Offered | | Diversified/
Non-diversified |
Global Real Estate Securities | | A, C, Institutional, Investor, P, R and R6 | | Diversified |
International Real Estate Securities | | A, C, Institutional, Investor, P and R6 | | Non-diversified |
Real Estate Securities | | A, C, Institutional, Service, Investor, P, R and R6 | | Non-diversified |
Class A Shares of the Global Real Estate Securities, International Real Estate Securities, and Real Estate Securities Funds are sold with a front-end sales charge of up to 5.50%. Class C Shares are sold with a contingent deferred sales charge (“CDSC”) of 1.00%, which is imposed on redemptions made within 12 months of purchase. Institutional, Service, Investor, Class P, Class R and Class R6 Shares are not subject to a sales charge.
Goldman Sachs Asset Management, L.P. (“GSAM”), an affiliate of Goldman Sachs & Co. LLC (“Goldman Sachs”), serves as investment adviser to the Funds pursuant to a management agreement (the “Agreement”) with the Trust.
|
| 2. SIGNIFICANT ACCOUNTING POLICIES |
The financial statements have been prepared in accordance with accounting principles generally accepted in the United States of America (“GAAP”) and require management to make estimates and assumptions that may affect the reported amounts and disclosures. Actual results may differ from those estimates and assumptions.
A. Investment Valuation— The Funds’ valuation policy is to value investments at fair value.
B. Investment Income and Investments— Investment income includes interest income, dividend income, and securities lending income, if any. Interest income is accrued daily and adjusted for amortization of premiums and accretion of discounts. Dividend income is recognized on ex-dividend date or, for certain foreign securities, as soon as such information is obtained subsequent to the ex-dividend date. Investment transactions are reflected on trade date. Realized gains and losses are calculated using identified cost. Investment transactions are recorded on the following business day for daily net asset value (“NAV”) calculations. Investment income is recorded net of any foreign withholding taxes, less any amounts reclaimable. The Funds may file withholding tax reclaims in certain jurisdictions to recover a portion of amounts previously withheld. Any foreign capital gains tax is accrued daily based upon net unrealized gains, and is payable upon sale of such investments. Distributions received from the Funds’ investments in United States (“U.S.”) real estate investment trusts (“REITs”) may be characterized as ordinary income, net capital gain or a return of capital. A return of capital is recorded by the Funds as a reduction to the cost basis of the REIT.
For derivative contracts, realized gains and losses are recorded upon settlement of the contract.
C. Class Allocations and Expenses— Investment income, realized and unrealized gain (loss), if any, and non-class specific expenses of each Fund are allocated daily based upon the proportion of net assets of each class.Non-class specific expenses directly incurred by a Fund are charged to that Fund, while such expenses incurred by the Trust are allocated across the applicable Funds on a straight-line and/orpro-rata basis depending upon the nature of the expenses.Class-specific expenses, where applicable, are borne by the respective share classes and include Distribution and Service, Transfer Agency and Service and Shareholder Administration fees.
D. Federal Taxes and Distributions to Shareholders— It is each Fund’s policy to comply with the requirements of the Internal Revenue Code of 1986, as amended (the “Code”), applicable to regulated investment companies and to distribute each year substantially all of its investment company taxable income and capital gains to its shareholders. Accordingly, each Fund is not
53
GOLDMAN SACHS REAL ESTATE SECURITIES FUNDS
Notes to Financial Statements(continued)
June 30, 2019 (Unaudited)
|
| 2. SIGNIFICANT ACCOUNTING POLICIES (continued) |
required to make any provisions for the payment of federal income tax. Distributions to shareholders are recorded on the ex-dividend date. Income and capital gains distributions, if any, are declared and paid according to the following schedule:
| | | | | | |
| Fund | | | | Income Distributions
Declared/Paid | | Capital Gains Distributions
Declared/Paid |
Global Real Estate Securities and Real Estate Securities | | | | Quarterly | | Annually |
International Real Estate Securities | | | | Semi-Annually | | Annually |
Net capital losses, if any, are carried forward to future fiscal years and may be used to the extent allowed by the Code to offset any future capital gains. Losses that are carried forward will retain their character as eithershort-term orlong-term capital losses. Utilization of capital loss carryforwards will reduce the requirement of future capital gains distributions.
The characterization of distributions to shareholders for financial reporting purposes is determined in accordance with federal income tax rules, which may differ from GAAP. The source of each Fund’s distributions may be shown in the accompanying financial statements as either from distributable earnings or capital. Certain components of the Funds’ net assets on the Statements of Assets and Liabilities reflect permanent GAAP/tax differences based on the appropriate tax character.
E. Foreign Currency Translation— The accounting records and reporting currency of a Fund are maintained in U.S. dollars. Assets and liabilities denominated in foreign currencies are translated into U.S. dollars using the current exchange rates at the close of each business day. The effect of changes in foreign currency exchange rates on investments is included within net realized and unrealized gain (loss) on investments. Changes in the value of other assets and liabilities as a result of fluctuations in foreign exchange rates are included in the Statements of Operations within net change in unrealized gain (loss) on foreign currency translation. Transactions denominated in foreign currencies are translated into U.S. dollars on the date the transaction occurred, the effects of which are included within net realized gain (loss) on foreign currency transactions.
|
| 3. INVESTMENTS AND FAIR VALUE MEASUREMENTS |
U.S. GAAP defines the fair value of a financial instrument as the amount that would be received to sell an asset or paid to transfer a liability in an orderly transaction between market participants at the measurement date (i.e., the exit price); the Funds’ policy is to use the market approach. GAAP establishes a fair value hierarchy that prioritizes the inputs to valuation techniques used to measure fair value. The hierarchy gives the highest priority to unadjusted quoted prices in active markets for identical assets or liabilities (Level 1 measurements) and the lowest priority to unobservable inputs (Level 3 measurements). The levels used for classifying investments are not necessarily an indication of the risk associated with investing in these investments. The three levels of the fair value hierarchy are described below:
Level 1 — Unadjusted quoted prices in active markets that are accessible at the measurement date for identical, unrestricted assets or liabilities;
Level 2 — Quoted prices in markets that are not active or financial instruments for which significant inputs are observable (including, but not limited to, quoted prices for similar investments, interest rates, foreign exchange rates, volatility and credit spreads), either directly or indirectly;
Level 3 — Prices or valuations that require significant unobservable inputs (including GSAM’s assumptions in determining fair value measurement).
The Board of Trustees (“Trustees”) has approved Valuation Procedures that govern the valuation of the portfolio investments held by the Funds, including investments for which market quotations are not readily available. The Trustees have delegated to GSAMday-to-day responsibility for implementing and maintaining internal controls and procedures related to the valuation of the Funds’ investments. To assess the continuing appropriateness of pricing sources and methodologies, GSAM regularly performs price verification procedures and issues challenges as necessary to third party pricing vendors or brokers, and any differences are reviewed in accordance with the Valuation Procedures.
54
GOLDMAN SACHS REAL ESTATE SECURITIES FUNDS
|
| 3. INVESTMENTS AND FAIR VALUE MEASUREMENTS (continued) |
A. Level 1 and Level 2 Fair Value Investments— The valuation techniques and significant inputs used in determining the fair values for investments classified as Level 1 and Level 2 are as follows:
Equity Securities — Equity securities traded on a U.S. securities exchange or the NASDAQ system, or those located on certain foreign exchanges, including but not limited to the Americas, are valued daily at their last sale price or official closing price on the principal exchange or system on which they are traded. If there is no sale or official closing price or such price is believed by GSAM to not represent fair value, equity securities are valued at the last bid price for long positions and at the last ask price for short positions. To the extent these investments are actively traded, they are classified as Level 1 of the fair value hierarchy, otherwise they are generally classified as Level 2.
Unlisted equity securities for which market quotations are available are valued at the last sale price on the valuation date, or if no sale occurs, at the last bid price, and are generally classified as Level 2. Securities traded on certain foreign securities exchanges are valued daily at fair value determined by an independent fair value service (if available) under Valuation Procedures approved by the Trustees and consistent with applicable regulatory guidance. The independent fair value service takes into account multiple factors including, but not limited to, movements in the securities markets, certain depositary receipts, futures contracts and foreign currency exchange rates that have occurred subsequent to the close of the foreign securities exchange. These investments are generally classified as Level 2 of the fair value hierarchy.
Money Market Funds — Investments in the Goldman Sachs Financial Square Government Fund (“Underlying Fund”) are valued at the NAV of the Institutional Share class on the day of valuation. These investments are generally classified as Level 1 of the fair value hierarchy. For information regarding the Underlying Fund’s accounting policies and investment holdings, please see the Underlying Fund’s shareholder report.
Derivative Contracts — A derivative is an instrument whose value is derived from underlying assets, indices, reference rates or a combination of these factors. A Fund enters into derivative transactions to hedge against changes in interest rates, securities prices, and/or currency exchange rates, to increase total return, or to gain access to certain markets or attain exposure to other underliers. For financial reporting purposes, cash collateral that has been pledged to cover obligations of a Fund and cash collateral received, if any, is reported separately on the Statements of Assets and Liabilities as receivables/payables for collateral on certain derivatives contracts.Non-cash collateral pledged by a Fund, if any, is noted in the Schedules of Investments.
Exchange-traded derivatives, including futures and options contracts, are generally valued at the last sale or settlement price on the exchange where they are principally traded. Exchange-traded options without settlement prices are generally valued at the midpoint of the bid and ask prices on the exchange where they are principally traded (or, in the absence of two-way trading, at the last bid price for long positions and the last ask price for short positions). Exchange-traded derivatives typically fall within Level 1 of the fair value hierarchy.Over-the-counter (“OTC”) and centrally cleared derivatives are valued using market transactions and other market evidence, including market-based inputs to models, calibration to market-clearing transactions, broker or dealer quotations, or other alternative pricing sources. Where models are used, the selection of a particular model to value OTC and centrally cleared derivatives depends upon the contractual terms of, and specific risks inherent in, the instrument, as well as the availability of pricing information in the market. Valuation models require a variety of inputs, including contractual terms, market prices, yield curves, credit curves, measures of volatility, voluntary and involuntary prepayment rates, loss severity rates and correlations of such inputs. For OTC and centrally cleared derivatives that trade in liquid markets, model inputs can generally be verified and model selection does not involve significant management judgment. OTC and centrally cleared derivatives are classified within Level 2 of the fair value hierarchy when significant inputs are corroborated by market evidence.
i. Forward Contracts— A forward contract is a contract between two parties to buy or sell an asset at a specified price on a future date. A forward contract settlement can occur on a cash or delivery basis. Forward contracts aremarked-to-market daily using independent vendor prices, and the change in value, if any, is recorded as an unrealized gain or loss. Cash and certain investments may be used to collateralize forward contracts.
Aforward foreign currency exchange contract is a forward contract in which a Fund agrees to receive or deliver a fixed quantity of one currency for another, at a pre-determined price at a future date. All forward foreign currency exchange
55
GOLDMAN SACHS REAL ESTATE SECURITIES FUNDS
Notes to Financial Statements(continued)
June 30, 2019 (Unaudited)
|
| 3. INVESTMENTS AND FAIR VALUE MEASUREMENTS (continued) |
contracts aremarked-to-market daily at the applicable forward rate. Non-deliverable forward foreign currency exchange contracts are settled with the counterparty in cash without the delivery of foreign currency.
B. Level 3 Fair Value Investments — To the extent that significant inputs to valuation models and other alternative pricing sources are unobservable, or if quotations are not readily available, or if GSAM believes that such quotations do not accurately reflect fair value, the fair value of a Fund’s investments may be determined under Valuation Procedures approved by the Trustees. GSAM, consistent with its procedures and applicable regulatory guidance, may make an adjustment to the most recent valuation prices of either domestic or foreign securities in light of significant events to reflect what it believes to be the fair value of the securities at the time of determining a Fund’s NAV. To the extent investments are valued using single source broker quotations obtained directly from the broker or passed through from third party pricing vendors, such investments are classified as Level 3 investments. GSAM did not develop the unobservable inputs for valuation of Level 3 Assets and Liabilities.
C. Fair Value Hierarchy — The following is a summary of the Funds’ investments and derivatives classified in the fair value hierarchy as of June 30, 2019:
| | | | | | | | | | | | |
|
| GLOBAL REAL ESTATE SECURITIES | |
| | | |
| Investment Type | | Level 1 | | | Level 2 | | | Level 3 | |
| | | |
| Assets | | | | | | | | | | | | |
| | | |
Common Stock and/or Other Equity Investments(a) | | | | | | | | | | | | |
| | | |
Asia | | $ | — | | | $ | 50,692,142 | | | $ | — | |
| | | |
Australia and Oceania | | | — | | | | 11,953,800 | | | | — | |
| | | |
Europe | | | — | | | | 43,340,708 | | | | — | |
| | | |
North America | | | 129,529,584 | | | | — | | | | — | |
| | | |
Investment Company | | | 4,520,531 | | | | — | | | | — | |
| | | |
| Total | | $ | 134,050,115 | | | $ | 105,986,650 | | | $ | — | |
|
| INTERNATIONAL REAL ESTATE SECURITIES | |
| | | |
| Investment Type | | Level 1 | | | Level 2 | | | Level 3 | |
| | | |
| Assets | | | | | | | | | | | | |
| | | |
Common Stock and/or Other Equity Investments(a) | | | | | | | | | | | | |
| | | |
Asia | | $ | — | | | $ | 38,080,365 | | | $ | — | |
| | | |
Australia and Oceania | | | — | | | | 8,114,507 | | | | — | |
| | | |
Europe | | | — | | | | 31,423,414 | | | | — | |
| | | |
North America | | | 5,450,403 | | | | — | | | | — | |
| | | |
Investment Company | | | 1,621,300 | | | | — | | | | — | |
| | | |
| Total | | $ | 7,071,703 | | | $ | 77,618,286 | | | $ | — | |
| (a) | | Amounts are disclosed by continent to highlight the impact of time zone differences between local market close and the calculation of NAV. Security valuations are based on the principal exchange or system on which they are traded, which may differ from country of domicile. The Funds utilize fair value model prices provided by an independent third party (fair value) service for certain international equity securities, resulting in a Level 2 classification. |
56
GOLDMAN SACHS REAL ESTATE SECURITIES FUNDS
|
| 3. INVESTMENTS AND FAIR VALUE MEASUREMENTS (continued) |
| | | | | | | | | | | | |
|
| REAL ESTATE SECURITIES | |
| | | |
| Investment Type | | Level 1 | | | Level 2 | | | Level 3 | |
| | | |
| Assets | | | | | | | | | | | | |
| | | |
Common Stock and/or Other Equity Investments(a) | | | | | | | | | | | | |
| | | |
Europe | | $ | 2,425,521 | | | $ | — | | | $ | — | |
| | | |
North America | | | 164,592,005 | | | | | | | | | |
| | | |
Investment Company | | | 166,590 | | | | — | | | | — | |
| | | |
| Total | | $ | 167,184,116 | | | $ | — | | | $ | — | |
| | | |
| Derivative Type | | | | | | | | | |
| | | |
| Liabilities(b) | | | | | | | | | | | | |
| | | |
Forward Foreign Currency Exchange Contracts | | $ | — | | | $ | (18,408 | ) | | $ | — | |
| (a) | | Amounts are disclosed by continent to highlight the impact of time zone differences between local market close and the calculation of NAV. Security valuations are based on the principal exchange or system on which they are traded, which may differ from country of domicile. The Funds utilize fair value model prices provided by an independent third party (fair value) service for certain international equity securities, resulting in a Level 2 classification. |
| (b) | | Amount shown represents unrealized gain (loss) at period end. |
For further information regarding security characteristics, see the Schedules of Investments.
|
| 4. INVESTMENTS IN DERIVATIVES |
The following table sets forth, by certain risk types, the gross value of derivative contracts (not considered to be hedging instruments for accounting disclosure purposes) as of June 30, 2019. These instruments were used as part of the Fund’s investment strategies and to obtain and/or manage exposure related to the risks below. The values in the table below exclude the effects of cash collateral received or posted pursuant to these derivative contracts, and therefore are not representative of the Fund’s net exposure.
| | | | | | | | | | | | | | |
| Fund | | Risk | | Statements of Assets
and Liabilities | | Assets | | | Statements of Assets
and Liabilities | | Liabilities | |
Real Estate Securities | | Currency | | — | | $ | — | | | Payable for unrealized loss on forward foreign currency exchange contracts | | $ | (18,408) | |
The following table sets forth, by certain risk types, the Fund’s gains (losses) related to these derivatives and their indicative volumes for the six months ended June 30, 2019. These gains (losses) should be considered in the context that these derivative contracts may have been executed to create investment opportunities and/or economically hedge certain investments, and accordingly, certain gains (losses) on such derivative contracts may offset certain (losses) gains attributable to investments. These gains (losses) are included in “Net realized gain (loss)” or “Net change in unrealized gain (loss)” on the Statement of Operations:
| | | | | | | | | | | | | | | | |
| Fund | | Risk | | Statements of Operations | | Net Realized
Gain (Loss) | | | Net Change in
Unrealized
Gain (Loss) | | | Average
Number of
Contracts(a) | |
Real Estate Securities | | Currency | | Net realized gain (loss) from forward foreign currency exchange contracts/Net change in unrealized gain (loss) on forward foreign currency exchange contracts | | $ | 25,328 | | | $ | (22,979 | ) | | | 2 | |
| (a) | | Average number of contracts is based on the average of month end balances for the six months ended June 30, 2019. |
57
GOLDMAN SACHS REAL ESTATE SECURITIES FUNDS
Notes to Financial Statements(continued)
June 30, 2019 (Unaudited)
|
| 5. AGREEMENTS AND AFFILIATED TRANSACTIONS |
A. Management Agreement — Under the Agreement, GSAM manages the Funds, subject to the general supervision of the Trustees.
As compensation for the services rendered pursuant to the Agreement, the assumption of the expenses related thereto and administration of the Funds’ business affairs, including providing facilities, GSAM is entitled to a management fee, accrued daily and paid monthly, equal to an annual percentage rate of each Fund’s average daily net assets.
For the six months ended June 30, 2019, contractual and effective net management fees with GSAM were at the following rates:
| | | | | | | | | | | | | | | | | | | | | | | | | | | | | | |
| | | | | Contractual Management Rate | | | Effective
Rate | | | Effective Net
Management
Rate^ | |
| Fund | | | | First
$1 billion | | | Next
$1 billion | | | Next
$3 billion | | | Next
$3 billion | | | Over
$8 billion | |
Global Real Estate Securities | | | | | 0.93 | % | | | 0.84 | % | | | 0.80 | % | | | 0.78 | % | | | 0.76 | % | | | 0.93 | % | | | 0.93 | % |
International Real Estate Securities | | | | | 0.95 | | | | 0.95 | | | | 0.86 | | | | 0.81 | | | | 0.80 | | | | 0.95 | | | | 0.95 | |
Real Estate Securities | | | | | 0.87 | | | | 0.78 | | | | 0.74 | | | | 0.73 | | | | 0.71 | | | | 0.87 | | | | 0.87 | |
| ^ | | Effective Net Management Rate includes the impact of management fee waivers of affiliated Underlying Funds, if any. The Effective Net Management Rate may not correlate to the Contractual Management Rate as a result of management fee waivers that may be in effect from time to time. |
The Global Real Estate Securities, International Real Estate Securities and Real Estate Securities Funds invest in Institutional Shares of the Goldman Sachs Financial Square Government Fund, which is an affiliated Underlying Fund. GSAM has agreed to waive a portion of its management fee payable by the Funds in an amount equal to the management fee it earns as an investment adviser to the affiliated Underlying Fund in which the Funds invest, except those management fees it earns from the Funds’ investments of cash collateral received in connection with securities lending transactions in the Goldman Sachs Financial Square Government Fund. For the six months ended June 30, 2019, GSAM waived $3,230, $1,128 and $1,514 of the Global Real Estate Securities Fund, International Real Estate Securities Fund and Real Estate Securities Fund management fees, respectively.
B. Distribution and/or Service (12b-1) Plans— The Trust, on behalf of Class A and Class R Shares of each applicable Fund, has adopted Distribution and Service Plans subject to Rule 12b-1 under the Act. Under the Distribution and Service Plans, Goldman Sachs, which serves as distributor (the “Distributor”), is entitled to a fee accrued daily and paid monthly for distribution services and personal and account maintenance services, which may then be paid by Goldman Sachs to authorized dealers. These fees are equal to an annual percentage rate of the average daily net assets attributable to Class A or Class R Shares of the Funds, as applicable, as set forth below.
The Trust, on behalf of Class C Shares of each applicable Fund, has adopted a Distribution Plan subject to Rule 12b-1 under the Act. Under the Distribution Plan, Goldman Sachs as Distributor is entitled to a fee accrued daily and paid monthly for distribution services, which may then be paid by Goldman Sachs to authorized dealers. These fees are equal to an annual percentage rate of the average daily net assets attributable to Class C Shares of the Funds, as set forth below.
The Trust, on behalf of Service Shares of each applicable Fund, has adopted a Service Plan subject to Rule 12b-1 under the Act to allow Service Shares to compensate service organizations (including Goldman Sachs) for providing personal and account maintenance services to their customers who are beneficial owners of such shares. The Service Plan provides for compensation to the service organizations equal to an annual percentage rate of the average daily net assets attributable to Service Shares of the Funds, as set forth below.
| | | | | | | | | | | | | | | | |
| | | Distribution and/or Service Plan Rates | |
| | | Class A* | | | Class C | | | Class R* | | | Service | |
Distribution and/or Service Plans | | | 0.25 | % | | | 0.75 | % | | | 0.50 | % | | | 0.25 | % |
| * | | With respect to Class A and Class R Shares, the Distributor at its discretion may use compensation for distribution services paid under the Distribution and/or Service Plans to compensate service organizations for personal and account maintenance services and expenses as long as such total compensation does not exceed the maximum cap on “service fees” imposed by the Financial Industry Regulatory Authority. |
58
GOLDMAN SACHS REAL ESTATE SECURITIES FUNDS
|
| 5. AGREEMENTS AND AFFILIATED TRANSACTIONS (continued) |
C. Distribution Agreement— Goldman Sachs, as Distributor of the shares of the Funds pursuant to a Distribution Agreement, may retain a portion of the Class A Shares’ front end sales charge and Class C Shares’ CDSC. During the six months ended June 30, 2019, Goldman Sachs retained the following amounts:
| | | | | | | | | | |
| | | | | Front End
Sales Charge | | | Contingent Deferred
Sales Charge | |
| Fund | | | | Class A | | | Class C | |
International Real Estate Securities | | | | $ | 6 | | | $ | 3 | |
Real Estate Securities | | | | | 689 | | | | 3 | |
D. Service and/or Shareholder Administration Plans — The Trust, on behalf of each applicable Fund, has adopted Service and/or Shareholder Administration Plans to allow Class C and Service Shares, respectively, to compensate service organizations (including Goldman Sachs) for providing varying levels of personal and account maintenance and/or shareholder administration services to their customers who are beneficial owners of such shares. The Service and/or Shareholder Administration Plans each provide for compensation to the service organizations equal to an annual percentage rate of 0.25% of the average daily net assets attributable to Class C and/or Service Shares of the Funds, respectively.
E. Transfer Agency Agreement — Goldman Sachs also serves as the transfer agent of the Funds for a fee pursuant to the Transfer Agency Agreement. The fees charged for such transfer agency services are accrued daily and paid monthly at annual rates as follows: 0.18% of the average daily net assets of Class A, Class C, Investor and Class R Shares; 0.03% of the average daily net assets of Class P and Class R6 Shares; and 0.04% of the average daily net assets of Institutional and Service Shares.
F. Other Expense Agreements and Affiliated Transactions— GSAM has agreed to reduce or limit certain “Other Expenses” of the Funds (excluding acquired fund fees and expenses, transfer agency fees and expenses, service fees and shareholder administration fees (as applicable), taxes, interest, brokerage fees, expenses of shareholder meetings, litigation and indemnification, and extraordinary expenses) to the extent such expenses exceed, on an annual basis, a percentage rate of the average daily net assets of each Fund. Such Other Expense reimbursements, if any, are accrued daily and paid monthly. In addition, the Funds are not obligated to reimburse GSAM for prior fiscal year expense reimbursements, if any. The Other Expense limitation as an annual percentage rate of average daily net assets for each Fund is 0.004%. These Other Expense limitations will remain in place through at least April 30, 2020, and prior to such date GSAM may not terminate the arrangements without the approval of the Trustees. In addition, the Funds have entered into certain offset arrangements with the custodian and the transfer agent, which may result in a reduction of the Funds’ expenses and are received irrespective of the application of the “Other Expense” limitations described above.
For the six months ended June 30, 2019, these expense reductions, including any fee waivers and Other Expense reimbursements, were as follows:
| | | | | | | | | | | | | | | | | | |
| Fund | | | | Management
Fee Waiver | | | Other
Expense
Reimbursement | | | Custody Fee
Credits | | | Total
Expense
Reductions | |
Global Real Estate Securities | | | | $ | 3,230 | | | $ | 209,284 | | | $ | — | | | $ | 212,514 | |
International Real Estate Securities | | | | | 1,128 | | | | 209,314 | | | | 1,773 | | | | 212,215 | |
Real Estate Securities | | | | | 1,514 | | | | 217,608 | | | | 1,186 | | | | 220,308 | |
G. Line of Credit Facility— As of June 30, 2019, the Funds participated in a $580,000,000 committed, unsecured revolving line of credit facility (the “facility”) together with other funds of the Trust and certain registered investment companies having management agreements with GSAM or its affiliates. This facility is to be used for temporary emergency purposes, or to allow for an orderly liquidation of securities to meet redemption requests. The interest rate on borrowings is based on the federal funds rate.
59
GOLDMAN SACHS REAL ESTATE SECURITIES FUNDS
Notes to Financial Statements(continued)
June 30, 2019 (Unaudited)
|
| 5. AGREEMENTS AND AFFILIATED TRANSACTIONS (continued) |
The facility also requires a fee to be paid by the Funds based on the amount of the commitment that has not been utilized. For the six months ended June 30, 2019, the Funds did not have any borrowings under the facility. Prior to April 30, 2019 the facility was $770,000,000.
H. Other Transactions with Affiliates— For the six months ended June 30, 2019, Goldman Sachs earned $16 in brokerage commissions from portfolio transactions on behalf of the Real Estate Securities Fund.
The following table provides information about the Funds’ investment in the Goldman Sachs Financial Square Government Fund as of and for the six months ended June 30, 2019:
| | | | | | | | | | | | | | | | | | | | | | | | |
| Fund | | Beginning
Value as of
December 31, 2018 | | | Purchases
at Cost | | | Proceeds from Sales | | | Ending
Value as of
June 30, 2019 | | | Shares as of
June 30, 2019 | | | Dividend Income
from Affiliated
Investment
Company | |
Global Real Estate Securities | | $ | 19,490,688 | | | $ | 55,677,113 | | | $ | (70,647,270 | ) | | $ | 4,520,531 | | | | 4,520,531 | | | $ | 47,578 | |
International Real Estate Securities | | | 2,155,823 | | | | 16,921,939 | | | | (17,456,462 | ) | | | 1,621,300 | | | | 1,621,300 | | | | 16,521 | |
Real Estate Securities | | | — | | | | 17,439,112 | | | | (17,272,522 | ) | | | 166,590 | | | | 166,590 | | | | 22,106 | |
As of June 30, 2019, The Goldman Sachs Group, Inc. was the beneficial owner of the following Funds:
| | | | | | | | | | | | | | | | | | | | | | | | |
| | | Percent of Share Class owned by Goldman Sachs Group, Inc. | |
| Fund | | Class A | | | Class C | | | Institutional | | | Investor | | | Class R | | | Class R6 | |
Global Real Estate Securities | | | 5 | % | | | 49 | % | | | 95 | % | | | 100 | % | | | 100 | % | | | — | % |
International Real Estate Securities | | | — | | | | 8 | | | | — | | | | 9 | | | | — | | | | 18 | |
As of June 30, 2019, the following Goldman Sachs Fund of Funds and Global Tax-Aware Equity Portfolios were beneficial owners of 5% or more of total outstanding shares of the following Fund:
| | | | | | | | | | | | | | | | | | | | | | | | |
| Fund | | Goldman Sachs
Dynamic Global Equity
Fund | | | Goldman Sachs
Enhanced Dividend
Global Equity Portfolio | | | Goldman Sachs
Growth and Income
Strategy Portfolio | | | Goldman Sachs
Growth Strategy
Portfolio | | | Goldman Sachs
Satellite Strategies
Portfolio | | | Goldman Sachs
Tax-Advantaged
Global Equity Portfolio | |
Global Real Estate Securities | | | 5 | % | | | 6 | % | | | 7 | % | | | 6 | % | | | 26 | % | | | 27 | % |
|
| 6. PORTFOLIO SECURITIES TRANSACTIONS |
The cost of purchases and proceeds from sales and maturities oflong-term securities for the six months ended June 30, 2019, were as follows:
| | | | | | | | | | |
| Fund | | | | Purchases | | | Sales | |
Global Real Estate Securities | | | | $ | 62,185,359 | | | $ | 153,897,133 | |
International Real Estate Securities | | | | | 12,385,119 | | | | 32,163,372 | |
Real Estate Securities | | | | | 41,101,006 | | | | 60,579,063 | |
Pursuant to exemptive relief granted by the Securities and Exchange Commission (“SEC”) and the terms and conditions contained therein, the Global Real Estate Securities Fund may lend its securities through a securities lending agent, Goldman Sachs Agency Lending (“GSAL”), awholly-owned subsidiary of Goldman Sachs, to certain qualified borrowers including Goldman Sachs and affiliates. In accordance with the Fund’s securities lending procedures, the Fund receives cash collateral at least equal to the market
60
GOLDMAN SACHS REAL ESTATE SECURITIES FUNDS
|
| 7. SECURITIES LENDING (continued) |
value of the securities on loan. The market value of the loaned securities is determined at the close of business of the Fund, at their last sale price or official closing price on the principal exchange or system on which they are traded, and any additional required collateral is delivered to the Fund on the next business day. As with other extensions of credit, the Fund may experience delay in the recovery of its securities or incur a loss should the borrower of the securities breach its agreement with the Fund or become insolvent at a time when the collateral is insufficient to cover the cost of repurchasing securities on loan. Dividend income received from securities on loan may not be subject to withholding taxes and therefore withholding taxes paid may differ from the amounts listed in the Statements of Operations. Loans of securities are terminable at any time and as such 1) the remaining contractual maturities of the outstanding securities lending transactions are considered to be overnight and continuous and 2) the borrower, after notice, is required to return borrowed securities within the standard time period for settlement of securities transactions.
The Global Real Estate Securities Fund invests the cash collateral received in connection with securities lending transactions in the Goldman Sachs Financial Square Government Fund (“Government Money Market Fund”), an affiliated series of the Goldman Sachs Trust. The Government Money Market Fund is registered under the Act as an open end investment company, is subject to Rule 2a-7 under the Act, and is managed by GSAM, for which GSAM may receive a management fee of up to 0.16% on an annualized basis of the average daily net assets of the Government Money Market Fund.
In the event of a default by a borrower with respect to any loan, GSAL will exercise any and all remedies provided under the applicable borrower agreement to make the Fund whole. These remedies include purchasing replacement securities by applying the collateral held from the defaulting broker against the purchase cost of the replacement securities. If GSAL is unable to purchase replacement securities, GSAL will indemnify the Fund by paying the Fund an amount equal to the market value of the securities loaned minus the value of cash collateral received from the borrower for the loan, subject to an exclusion for any shortfalls resulting from a loss of value in such cash collateral due to reinvestment risk. The Funds may enter into master netting agreements with borrowers, which provide the right, in the event of a default (including bankruptcy or insolvency), for the non-defaulting party to liquidate the collateral and calculate net exposure to the defaulting party or request additional collateral. However, in the event of a default by a borrower, a resolution authority could determine that such rights are not enforceable due to the restrictions or prohibitions against the right of set-off that may be imposed in accordance with a particular jurisdiction’s bankruptcy or insolvency laws. The Fund’s loaned securities were all subject to enforceable Securities Lending Agreements and the value of the collateral was at least equal to the value of the cash received. The amounts of the Fund’s overnight and continuous agreements, which represent the gross amounts of recognized liabilities for securities lending transactions outstanding as of June 30, 2019, are disclosed as “Payable upon return of securities loaned” on the Statements of Assets and Liabilities, where applicable. The Global Real Estate Fund did not have securities on loan as of June 30, 2019.
Both the Global Real Estate Securities Fund and GSAL received compensation relating to the lending of the Fund’s securities. The amounts earned, if any, by the Fund for the six months ended June 30, 2019, are reported under Investment Income on the Statements of Operations.
The table below details securities lending activity with affiliates of Goldman Sachs:
| | | | | | | | | | |
| | | | | For the six months ended June 30, 2019 | |
| Fund | | | | Earnings of GSAL
Relating to
Securities
Loaned | | | Amount Received
by the Fund
from Lending to
Goldman Sachs | |
Global Real Estate Securities | | | | $ | 1,117 | | | $ | — | |
The following table provides information about the Funds’ investment in the Government Money Market Fund for the six months ended June 30, 2019:
| | | | | | | | | | | | | | | | | | |
| Fund | | | | Beginning
Value as of
December 31, 2018 | | | Purchases
at Cost | | | Proceeds
from Sales | | | Ending
Value as of
June 30, 2019 | |
Global Real Estate Securities | | | | $ | — | | | $ | 11,864,148 | | | $ | (11,864,148 | ) | | $ | — | |
61
GOLDMAN SACHS REAL ESTATE SECURITIES FUNDS
Notes to Financial Statements(continued)
June 30, 2019 (Unaudited)
As of the Funds’ most recent fiscal year end, December 31, 2018, the Funds’ capital loss carryforwards and certain timing differences, on a tax-basis were as follows:
| | | | | | | | | | | | |
| | | Global
Real Estate
Securities | | | International
Real Estate
Securities | | | Real Estate
Securities | |
Capital loss carryforwards: | | | | | | | | | | | | |
PerpetualShort-term | | $ | (181,633 | ) | | $ | (299,100 | ) | | $ | — | |
PerpetualLong-term | | | (308,098 | ) | | | (9,461,007 | ) | | | — | |
Total capital loss carryforwards | | $ | (489,731 | ) | | $ | (9,760,107 | ) | | $ | — | |
Timing differences (Qualified Late Year Loss Deferral/§857 (b) (9) Deferred Dividend/Post October Loss Deferral/Disallowed Passive Activity Loss) | | $ | 283,962 | | | $ | (169,270 | ) | | $ | (260,957 | ) |
As of June 30, 2019, the Funds’ aggregate security unrealized gains and losses based on cost for U.S. federal income tax purposes were as follows:
| | | | | | | | | | | | |
| | | Global Real
Estate
Securities | | | International
Real Estate
Securities | | | Real Estate
Securities | |
Tax cost | | $ | 216,422,173 | | | $ | 81,840,681 | | | $ | 113,016,385 | |
Gross unrealized gain | | | 29,419,942 | | | | 8,065,056 | | | | 57,072,757 | |
Gross unrealized loss | | | (5,805,350 | ) | | | (5,215,748 | ) | | | (2,905,026 | ) |
Net unrealized gain (loss) | | $ | 23,614,592 | | | $ | 2,849,308 | | | $ | 54,167,731 | |
The difference between GAAP-basis and tax-basis unrealized gains (losses) is attributable primarily to wash sales, net mark to market gains/(losses) on foreign currency contracts, differences related to the tax treatment of underlying fund investments, partnership investments and passive foreign investment companies.
GSAM has reviewed the Funds’ tax positions for all open tax years (the current and prior three years, as applicable) and has concluded that no provision for income tax is required in the Funds’ financial statements. Such open tax years remain subject to examination and adjustment by tax authorities.
The Funds’ risks include, but are not limited to, the following:
Derivatives Risk — The Fund’s use of derivatives may result in loss. Derivative instruments, which may pose risks in addition to and greater than those associated with investing directly in securities, currencies or other instruments, may be illiquid or less liquid, volatile, difficult to price and leveraged so that small changes in the value of the underlying instruments may produce disproportionate losses to the Fund. Derivatives are also subject to counterparty risk, which is the risk that the other party in the transaction will not fulfill its contractual obligation. The use of derivatives is a highly specialized activity that involves investment techniques and risks different from those associated with investments in more traditional securities and instruments. Losses from derivatives can also result from a lack of correlation between changes in the value of derivative instruments and the portfolio assets (if any) being hedged.
Foreign and Emerging Countries Risk — Investing in foreign markets may involve special risks and considerations not typically associated with investing in the U.S. Foreign securities may be subject to risk of loss because of more or less foreign government regulation, less public information and less economic, political and social stability in the countries in which a Fund
62
GOLDMAN SACHS REAL ESTATE SECURITIES FUNDS
|
| 9. OTHER RISKS (continued) |
invests. The imposition of exchange controls (including repatriation restrictions), confiscations, trade restrictions (including tariffs) and other government restrictions by the U.S. or other governments, or from problems in share registration, settlement or custody, may also result in losses. Foreign risk also involves the risk of negative foreign currency rate fluctuations, which may cause the value of securities denominated in such foreign currency (or other instruments through which a Fund has exposure to foreign currencies) to decline in value. Currency exchange rates may fluctuate significantly over short periods of time. To the extent that a Fund also invests in securities of issuers located in emerging markets, these risks may be more pronounced.
Foreign Custody Risk — If a Fund invests in foreign securities, the Fund may hold such securities and cash with foreign banks, agents, and securities depositories appointed by the Fund’s custodian (each a “Foreign Custodian”). Some foreign custodians may be recently organized or new to the foreign custody business. In some countries, Foreign Custodians may be subject to little or no regulatory oversight over, or independent evaluation of, their operations. Further, the laws of certain countries may place limitations on a Fund’s ability to recover its assets if a Foreign Custodian enters bankruptcy. Investments in emerging markets may be subject to even greater custody risks than investments in more developed markets. Custody services in emerging market countries are very often undeveloped and may be considerably less well regulated than in more developed countries, and thus may not afford the same level of investor protection as would apply in developed countries.
Geographic Risk — If a Fund focuses its investments in securities of issuers located in a particular country or geographic region, the Fund may be subjected, to a greater extent than if its investments were less focused, to the risks of volatile economic cycles and/or conditions and developments that may be particular to that country or region, such as: adverse securities markets; adverse exchange rates; adverse social, political, regulatory, economic, business, environmental or other developments; or natural disasters.
Industry Concentration Risk — Concentrating Fund investments in a limited number of issuers conducting business in the same industry or group of industries will subject a Fund to a greater risk of loss as a result of adverse economic, business, political, environmental or other developments than if its investments were diversified across different industries.
Investments in Other Investment Companies Risk — As a shareholder of another investment company, a Fund will indirectly bear its proportionate share of any net management fees and other expenses paid by such other investment companies, in addition to the fees and expenses regularly borne by the Fund.
Large Shareholder Transactions Risk — A Fund may experience adverse effects when certain large shareholders, such as other funds, institutional investors (including those trading by use of non-discretionary mathematical formulas), financial intermediaries (who may make investment decisions on behalf of underlying clients and/or include a Fund in their investment model), individuals, accounts and Goldman Sachs affiliates, purchase or redeem large amounts of shares of a Fund. Such large shareholder redemptions, which may occur rapidly or unexpectedly, may cause a Fund to sell portfolio securities at times when it would not otherwise do so, which may negatively impact a Fund’s NAV and liquidity. These transactions may also accelerate the realization of taxable income to shareholders if such sales of investments resulted in gains, and may also increase transaction costs. In addition, a large redemption could result in a Fund’s current expenses being allocated over a smaller asset base, leading to an increase in the Fund’s expense ratio. Similarly, large Fund share purchases may adversely affect a Fund’s performance to the extent that the Fund is delayed in investing new cash or otherwise maintains a larger cash position than it ordinarily would.
Liquidity Risk — A Fund may make investments that are illiquid or that may become less liquid in response to market developments or adverse investor perceptions. Illiquid investments may be more difficult to value. Liquidity risk may also refer to the risk that a Fund will not be able to pay redemption proceeds within the allowable time period or without significant dilution to remaining investors’ interests because of unusual market conditions, an unusually high volume of redemption requests, or other reasons. To meet redemption requests, a Fund may be forced to sell investments at an unfavorable time and/or under unfavorable conditions. If a Fund is forced to sell securities at an unfavorable time and/or under unfavorable conditions, such sales may adversely affect the Fund’s NAV and dilute remaining investors’ interests. These risks may be more pronounced in connection with the Funds’ investments in securities of issuers located in emerging market countries. Redemptions by large shareholders may have a negative impact on a Fund’s liquidity.
63
GOLDMAN SACHS REAL ESTATE SECURITIES FUNDS
Notes to Financial Statements(continued)
June 30, 2019 (Unaudited)
|
| 9. OTHER RISKS (continued) |
Market and Credit Risks — In the normal course of business, a Fund trades financial instruments and enters into financial transactions where risk of potential loss exists due to changes in the market (market risk). Additionally, a Fund may also be exposed to credit risk in the event that an issuer or guarantor fails to perform or that an institution or entity with which the Fund has unsettled or open transactions defaults.
Non-Diversification Risk — The International Real Estate Securities and Real Estate Securities Funds are non-diversified, meaning that they are permitted to invest a larger percentage of their assets in fewer issuers than diversified mutual funds. Thus, a Fund may be more susceptible to adverse developments affecting any single issuer held in its portfolio, and may be more susceptible to greater losses because of these developments.
Under the Trust’s organizational documents, its Trustees, officers, employees and agents are indemnified, to the extent permitted by the Act and state law, against certain liabilities that may arise out of performance of their duties to the Funds. Additionally, in the course of business, the Funds enter into contracts that contain a variety of indemnification clauses. The Funds’ maximum exposure under these arrangements is unknown, as this would involve future claims that may be made against the Funds that have not yet occurred. However, GSAM believes the risk of loss under these arrangements to be remote.
Subsequent events after the Statements of Assets and Liabilities date have been evaluated, and GSAM has concluded that there is no impact requiring adjustment or disclosure in the financial statements.
64
GOLDMAN SACHS REAL ESTATE SECURITIES FUNDS
|
| 12. SUMMARY OF SHARE TRANSACTIONS |
Share activity is as follows:
| | | | | | | | | | | | | | | | |
| | | Global Real Estate Securities Fund | |
| | | | |
| | | For the Six Months Ended
June 30, 2019
(Unaudited) | | | For the Fiscal Year Ended
December 31, 2018 | |
| | | | |
| | | Shares | | | Dollars | | | Shares | | | Dollars | |
| | | | |
| Class A Shares | | | | | | | | | | | | | | | | |
Shares sold | | | 23 | | | $ | 256 | | | | 11,051 | | | $ | 110,508 | |
Reinvestment of distributions | | | 451 | | | | 5,035 | | | | 2,711 | | | | 27,874 | |
Shares redeemed | | | (41,043 | ) | | | (443,255 | ) | | | (87,523 | ) | | | (895,560 | ) |
| | | | (40,569 | ) | | | (437,964 | ) | | | (73,761 | ) | | | (757,178 | ) |
| Class C Shares | | | | | | | | | | | | | | | | |
Shares sold | | | 2,808 | | | | 30,000 | | | | — | | | | — | |
Reinvestment of distributions | | | 29 | | | | 319 | | | | 45 | | | | 460 | |
Shares redeemed | | | — | | | | — | | | | — | | | | 5 | |
| | | | 2,837 | | | | 30,319 | | | | 45 | | | | 465 | |
| Institutional Shares | | | | | | | | | | | | | | | | |
Shares sold | | | — | | | | — | | | | 1,222,030 | | | | 12,873,264 | |
Reinvestment of distributions | | | 1,784 | | | | 19,958 | | | | 14,648 | | | | 149,611 | |
Shares redeemed | | | (7,771 | ) | | | (85,473 | ) | | | (32,816,684 | ) | | | (326,905,045 | ) |
| | | | (5,987 | ) | | | (65,515 | ) | | | (31,580,006 | ) | | | (313,882,170 | ) |
| Investor Shares | | | | | | | | | | | | | | | | |
Reinvestment of distributions | | | 26 | | | | 290 | | | | 74 | | | | 757 | |
Shares redeemed | | | — | | | | — | | | | — | | | | 5 | |
| | | | 26 | | | | 290 | | | | 74 | | | | 762 | |
| Class P Shares(a) | | | | | | | | | | | | | | | | |
Shares sold | | | 175,248 | | | | 1,867,391 | | | | 4,428,967 | | | | 45,383,426 | |
Reinvestment of distributions | | | 36,036 | | | | 402,523 | | | | 42,829 | | | | 438,894 | |
Shares redeemed | | | (639,663 | ) | | | (6,909,665 | ) | | | (449,294 | ) | | | (4,591,608 | ) |
| | | | (428,379 | ) | | | (4,639,751 | ) | | | 4,022,502 | | | | 41,230,712 | |
| Class R Shares | | | | | | | | | | | | | | | | |
Reinvestment of distributions | | | 19 | | | | 215 | | | | 59 | | | | 606 | |
Shares redeemed | | | — | | | | — | | | | — | | | | 5 | |
| | | | 19 | | | | 215 | | | | 59 | | | | 611 | |
| Class R6 Shares | | | | | | | | | | | | | | | | |
Shares sold | | | 952,036 | | | | 10,571,901 | | | | 33,154,492 | | | | 329,753,249 | |
Reinvestment of distributions | | | 181,033 | | | | 2,022,140 | | | | 821,046 | | | | 8,441,321 | |
Shares redeemed | | | (10,114,586 | ) | | | (110,603,151 | ) | | | (7,486,795 | ) | | | (77,007,638 | ) |
| | | | (8,981,517 | ) | | | (98,009,110 | ) | | | 26,488,743 | | | | 261,186,932 | |
| | | | |
NET DECREASE | | | (9,453,570 | ) | | $ | (103,121,516 | ) | | | (1,142,344 | ) | | $ | (12,219,866 | ) |
| (a) | | Commenced operations on April 17, 2018. |
65
GOLDMAN SACHS REAL ESTATE SECURITIES FUNDS
Notes to Financial Statements(continued)
June 30, 2019 (Unaudited)
|
| 12. SUMMARY OF SHARE TRANSACTIONS (continued) |
| | | | | | | | | | | | | | | | |
| | | International Real Estate Securities Fund | |
| | | | |
| | | For the Six Months Ended
June 30, 2019
(Unaudited) | | | For the Fiscal Year Ended
December 31, 2018 | |
| | | | |
| | | Shares | | | Dollars | | | Shares | | | Dollars | |
| | | | |
| Class A Shares | | | | | | | | | | | | | | | | |
Shares sold | | | 7,263 | | | $ | 47,778 | | | | 102,801 | | | $ | 658,762 | |
Reinvestment of distributions | | | 4,088 | | | | 27,023 | | | | 11,578 | | | | 72,106 | |
Shares redeemed | | | (64,046 | ) | | | (414,196 | ) | | | (267,656 | ) | | | (1,706,515 | ) |
| | | | (52,695 | ) | | | (339,395 | ) | | | (153,277 | ) | | | (975,647 | ) |
| Class C Shares | | | | | | | | | | | | | | | | |
Shares sold | | | 3,980 | | | | 25,800 | | | | 1,347 | | | | 9,031 | |
Reinvestment of distributions | | | 57 | | | | 378 | | | | 761 | | | | 4,862 | |
Shares redeemed | | | (21,661 | ) | | | (142,334 | ) | | | (87,925 | ) | | | (563,412 | ) |
| | | | (17,624 | ) | | | (116,156 | ) | | | (85,817 | ) | | | (549,519 | ) |
| Institutional Shares | | | | | | | | | | | | | | | | |
Shares sold | | | 3,312 | | | | 20,746 | | | | 428,434 | | | | 2,715,056 | |
Reinvestment of distributions | | | 11,164 | | | | 71,448 | | | | 37,833 | | | | 225,710 | |
Shares redeemed | | | (766,612 | ) | | | (4,865,392 | ) | | | (17,488,827 | ) | | | (111,884,808 | ) |
| | | | (752,136 | ) | | | (4,773,198 | ) | | | (17,022,560 | ) | | | (108,944,042 | ) |
| Investor Shares | | | | | | | | | | | | | | | | |
Shares sold | | | 4,116 | | | | 26,102 | | | | 13,116 | | | | 81,200 | |
Reinvestment of distributions | | | 168 | | | | 1,100 | | | | 408 | | | | 2,509 | |
Shares redeemed | | | (5,163 | ) | | | (33,288 | ) | | | (12,924 | ) | | | (78,892 | ) |
| | | | (879 | ) | | | (6,086 | ) | | | 600 | | | | 4,817 | |
| Class P Shares(a) | | | | | | | | | | | | | | | | |
Shares sold | | | 325,539 | | | | 1,945,562 | | | | 17,791,513 | | | | 112,301,001 | |
Reinvestment of distributions | | | 128,887 | | | | 822,303 | | | | 355,249 | | | | 2,124,941 | |
Shares redeemed | | | (3,180,636 | ) | | | (19,387,632 | ) | | | (3,750,183 | ) | | | (22,161,241 | ) |
| | | | (2,726,210 | ) | | | (16,619,767 | ) | | | 14,396,579 | | | | 92,264,701 | |
| Class R6 Shares | | | | | | | | | | | | | | | | |
Shares sold | | | 2,985 | | | | 17,500 | | | | 211,882 | | | | 1,323,213 | |
Reinvestment of distributions | | | 108 | | | | 693 | | | | 1,936 | | | | 11,771 | |
Shares redeemed | | | (28,525 | ) | | | (179,000 | ) | | | (180,233 | ) | | | (1,130,827 | ) |
| | | | (25,432 | ) | | | (160,807 | ) | | | 33,585 | | | | 204,157 | |
| | | | |
NET DECREASE | | | (3,574,976 | ) | | $ | (22,015,409 | ) | | | (2,830,890 | ) | | $ | (17,995,533 | ) |
| (a) | | Commenced operations on April 17, 2018. |
66
GOLDMAN SACHS REAL ESTATE SECURITIES FUNDS
|
| 12. SUMMARY OF SHARE TRANSACTIONS (continued) |
| | | | | | | | | | | | | | | | |
| | | Real Estate Securities Fund | |
| | | | |
| | | For the Six Months Ended
June 30, 2019
(Unaudited) | | | For the Fiscal Year Ended
December 31, 2018 | |
| | | | |
| | | Shares | | | Dollars | | | Shares | | | Dollars | |
| | | | |
| Class A Shares | | | | | | | | | | | | | | | | |
Shares sold | | | 96,170 | | | $ | 1,370,053 | | | | 428,269 | | | $ | 6,523,130 | |
Reinvestment of distributions | | | 13,630 | | | | 199,367 | | | | 277,579 | | | | 3,883,857 | |
Shares redeemed | | | (241,153 | ) | | | (3,488,494 | ) | | | (1,097,552 | ) | | | (16,145,265 | ) |
| | | | (131,353 | ) | | | (1,919,074 | ) | | | (391,704 | ) | | | (5,738,278 | ) |
| Class C Shares | | | | | | | | | | | | | | | | |
Shares sold | | | 8,655 | | | | 118,253 | | | | 44,579 | | | | 636,170 | |
Reinvestment of distributions | | | 842 | | | | 11,725 | | | | 42,238 | | | | 564,452 | |
Shares redeemed | | | (83,997 | ) | | | (1,151,614 | ) | | | (623,794 | ) | | | (9,023,570 | ) |
| | | | (74,500 | ) | | | (1,021,636 | ) | | | (536,977 | ) | | | (7,822,948 | ) |
| Institutional Shares | | | | | | | | | | | | | | | | |
Shares sold | | | 71,986 | | | | 1,055,342 | | | | 1,817,851 | | | | 26,624,360 | |
Reinvestment of distributions | | | 18,929 | | | | 286,508 | | | | 409,345 | | | | 5,974,354 | |
Shares redeemed | | | (446,061 | ) | | | (6,440,979 | ) | | | (12,723,463 | ) | | | (198,938,100 | ) |
| | | | (355,146 | ) | | | (5,099,129 | ) | | | (10,496,267 | ) | | | (166,339,386 | ) |
| Service Shares | | | | | | | | | | | | | | | | |
Shares sold | | | 10,487 | | | | 151,034 | | | | 30,587 | | | | 443,406 | |
Reinvestment of distributions | | | 413 | | | | 6,090 | | | | 8,223 | | | | 116,078 | |
Shares redeemed | | | (5,538 | ) | | | (80,606 | ) | | | (82,746 | ) | | | (1,260,718 | ) |
| | | | 5,362 | | | | 76,518 | | | | (43,936 | ) | | | (701,234 | ) |
| Investor Shares | | | | | | | | | | | | | | | | |
Shares sold | | | 216,625 | | | | 3,093,562 | | | | 323,155 | | | | 4,905,020 | |
Reinvestment of distributions | | | 5,284 | | | | 78,017 | | | | 95,922 | | | | 1,352,025 | |
Shares redeemed | | | (288,769 | ) | | | (4,204,624 | ) | | | (481,591 | ) | | | (7,130,821 | ) |
| | | | (66,860 | ) | | | (1,033,045 | ) | | | (62,514 | ) | | | (873,776 | ) |
| Class P Shares(a) | | | | | | | | | | | | | | | | |
Shares sold | | | 300,560 | | | | 4,327,415 | | | | 7,730,538 | | | | 122,203,459 | |
Reinvestment of distributions | | | 56,843 | | | | 860,384 | | | | 1,069,090 | | | | 15,469,785 | |
Shares redeemed | | | (1,148,306 | ) | | | (16,129,798 | ) | | | (1,938,194 | ) | | | (28,227,623 | ) |
| | | | (790,903 | ) | | | (10,941,999 | ) | | | 6,861,434 | | | | 109,445,621 | |
| Class R Shares | | | | | | | | | | | | | | | | |
Shares sold | | | 11,952 | | | | 168,251 | | | | 61,635 | | | | 897,688 | |
Reinvestment of distributions | | | 515 | | | | 7,454 | | | | 11,828 | | | | 164,225 | |
Shares redeemed | | | (27,738 | ) | | | (384,652 | ) | | | (132,383 | ) | | | (1,966,764 | ) |
| | | | (15,271 | ) | | | (208,947 | ) | | | (58,920 | ) | | | (904,851 | ) |
| Class R6 Shares | | | | | | | | | | | | | | | | |
Shares sold | | | 849 | | | | 12,682 | | | | 750,418 | | | | 11,504,084 | |
Reinvestment of distributions | | | 493 | | | | 7,455 | | | | 9,014 | | | | 130,756 | |
Shares redeemed | | | (9,694 | ) | | | (138,379 | ) | | | (712,548 | ) | | | (11,015,388 | ) |
| | | | (8,352 | ) | | | (118,242 | ) | | | 46,884 | | | | 619,452 | |
| | | | |
NET DECREASE | | | (1,437,023 | ) | | $ | (20,265,554 | ) | | | (4,682,000 | ) | | $ | (72,315,400 | ) |
| (a) | | Commenced operations on April 17, 2018. |
67
GOLDMAN SACHS REAL ESTATE SECURITIES FUNDS
Fund Expenses — Six Month Period Ended June 30, 2019 (Unaudited)
As a shareholder of Class A, Class C, Institutional, Service, Investor, Class P, Class R or Class R6 Shares of a Fund you incur two types of costs: (1) transaction costs, including sales charges on purchase payments (with respect to Class A Shares) and contingent deferred sales charges on redemptions (with respect to Class C Shares); and (2) ongoing costs, including management fees; distribution and/or service(12b-1) fees (with respect to Class A, Class C, Service and Class R Shares); and other Fund expenses. This example is intended to help you understand your ongoing costs (in dollars) of investing in Class A, Class C, Institutional, Service, Investor, Class P, Class R and Class R6 Shares of the Funds and to compare these costs with the ongoing costs of investing in other mutual funds.
The example is based on an investment of $1,000 invested at the beginning of the period and held for the entire period from January 1, 2019 through June 30, 2019, which represents a period of 181 days of a 365 day year.
Actual Expenses— The first line under each share class in the table below provides information about actual account values and actual expenses. You may use the information in this line, together with the amount you invested, to estimate the expenses that you paid over the period. Simply divide your account value by $1,000 (for example, an $8,600 account value divided by $1,000=8.6), then multiply the result by the number in the first line under the heading entitled “Expenses Paid” to estimate the expenses you paid on your account during this period.
Hypothetical Example for Comparison Purposes— The second line under each share class in the table below provides information about hypothetical account values and hypothetical expenses based on the Funds’ actual net expense ratio and an assumed rate of return of 5% per year before expenses, which is not the Funds’ actual return. The hypothetical account values and expenses may not be used to estimate the actual ending account balance or expenses you paid for the period. You may use this information to compare the ongoing costs of investing in the Funds and other funds. To do so, compare this 5% hypothetical example with the 5% hypothetical examples that appear in the shareholder reports of the other funds.
Please note that the expenses shown in the table are meant to highlight your ongoing costs only and do not reflect any transactional costs, such as sales charges, redemption fees, or exchange fees. Therefore, the second line of the table is useful in comparing ongoing costs only and will not help you determine the relative total costs of owning different funds. In addition, if these transactional costs were included, your costs would have been higher.
| | | | | | | | | | | | | | | | | | | | | | | | | | | | | | | | | | | | |
| | | Global Real Estate Securities Fund | | | International Real Estate Securities Fund | | | Real Estate Securities Fund | |
| Share Class | | Beginning
Account
Value
01/01/19 | | | Ending
Account
Value
06/30/19 | | | Expenses
Paid for the
6 Months Ended
06/30/19* | | | Beginning
Account
Value
01/01/19 | | | Ending
Account
Value
06/30/19 | | | Expenses
Paid for the
6 Months Ended
06/30/19* | | | Beginning
Account
Value
01/01/19 | | | Ending
Account
Value
06/30/19 | | | Expenses
Paid for the
6 Months Ended
06/30/19* | |
| Class A | | | | | | | | | | | | | | | | | | | | | | | | | | | | | | | | | | | | |
Actual | | $ | 1,000 | | | $ | 1,153.10 | | | $ | 7.26 | | | $ | 1,000 | | | $ | 1,131.90 | | | $ | 7.29 | | | $ | 1,000 | | | $ | 1,178.10 | | | $ | 7.02 | |
Hypothetical 5% return | | | 1,000 | | | | 1,018.05 | + | | | 6.81 | | | | 1,000 | | | | 1,017.95 | + | | | 6.90 | | | | 1,000 | | | | 1,018.35 | + | | | 6.51 | |
| Class C | | | | | | | | | | | | | | | | | | | | | | | | | | | | | | | | | | | | |
Actual | | | 1,000 | | | | 1,149.00 | | | | 11.24 | | | | 1,000 | | | | 1,127.40 | | | | 11.24 | | | | 1,000 | | | | 1,173.60 | | | | 11.05 | |
Hypothetical 5% return | | | 1,000 | | | | 1,014.33 | + | | | 10.54 | | | | 1,000 | | | | 1,014.23 | + | | | 10.64 | | | | 1,000 | | | | 1,014.63 | + | | | 10.24 | |
| Institutional | | | | | | | | | | | | | | | | | | | | | | | | | | | | | | | | | | | | |
Actual | | | 1,000 | | | | 1,155.90 | | | | 5.19 | | | | 1,000 | | | | 1,133.20 | | | | 5.24 | | | | 1,000 | | | | 1,180.20 | | | | 4.92 | |
Hypothetical 5% return | | | 1,000 | | | | 1,019.98 | + | | | 4.86 | | | | 1,000 | | | | 1,019.89 | + | | | 4.96 | | | | 1,000 | | | | 1,020.28 | + | | | 4.56 | |
| Service | | | | | | | | | | | | | | | | | | | | | | | | | | | | | | | | | | | | |
Actual | | | N/A | | | | N/A | | | | N/A | | | | N/A | | | | N/A | | | | N/A | | | | 1,000 | | | | 1,177.70 | | | | 7.61 | |
Hypothetical 5% return | | | N/A | | | | N/A | | | | N/A | | | | N/A | | | | N/A | | | | N/A | | | | 1,000 | | | | 1,017.80 | + | | | 7.05 | |
| Investor | | | | | | | | | | | | | | | | | | | | | | | | | | | | | | | | | | | | |
Actual | | | 1,000 | | | | 1,155.50 | | | | 5.93 | | | | 1,000 | | | | 1,134.50 | | | | 5.98 | | | | 1,000 | | | | 1,179.20 | | | | 5.67 | |
Hypothetical 5% return | | | 1,000 | | | | 1,019.29 | + | | | 5.56 | | | | 1,000 | | | | 1,019.19 | + | | | 5.66 | | | | 1,000 | | | | 1,019.59 | + | | | 5.26 | |
| Class P | | | | | | | | | | | | | | | | | | | | | | | | | | | | | | | | | | | | |
Actual | | | 1,000 | | | | 1,155.30 | | | | 5.13 | | | | 1,000 | | | | 1,133.50 | | | | 5.18 | | | | 1,000 | | | | 1,180.40 | | | | 4.87 | |
Hypothetical 5% return | | | 1,000 | | | | 1,020.03 | + | | | 4.81 | | | | 1,000 | | | | 1,019.93 | + | | | 4.91 | | | | 1,000 | | | | 1,020.33 | + | | | 4.51 | |
| Class R | | | | | | | | | | | | | | | | | | | | | | | | | | | | | | | | | | | | |
Actual | | | 1,000 | | | | 1,151.90 | | | | 8.59 | | | | N/A | | | | N/A | | | | N/A | | | | 1,000 | | | | 1,176.40 | | | | 8.36 | |
Hypothetical 5% return | | | 1,000 | | | | 1,016.81 | + | | | 8.05 | | | | N/A | | | | N/A | | | | N/A | | | | 1,000 | | | | 1,017.11 | + | | | 7.75 | |
| Class R6 | | | | | | | | | | | | | | | | | | | | | | | | | | | | | | | | | | | | |
Actual | | | 1,000 | | | | 1,156.30 | | | | 5.13 | | | | 1,000 | | | | 1,135.20 | | | | 5.19 | | | | 1,000 | | | | 1,180.30 | | | | 4.87 | |
Hypothetical 5% return | | | 1,000 | | | | 1,020.03 | + | | | 4.81 | | | | 1,000 | | | | 1,019.93 | + | | | 4.91 | | | | 1,000 | | | | 1,020.33 | + | | | 4.51 | |
| + | | Hypothetical expenses are based on each Fund’s actual annualized net expense ratios and an assumed rate of return of 5% per year before expenses. |
| * | | Expenses are calculated using each Fund’s annualized net expense ratio for each class, which represents the ongoing expenses as a percentage of net assets for the six months ended June 30, 2019. Expenses are calculated by multiplying the annualized net expense ratio by the average account value for the period; then multiplying the result by the number of days in the most recent fiscal half year; and then dividing that result by the number of days in the fiscal year. The annualized net expense ratios for the period were as follows: |
| | | | | | | | | | | | | | | | | | | | | | | | | | | | | | | | |
| Fund | | Class A | | | Class C | | | Institutional | | | Service | | | Investor | | | Class P | | | Class R | | | Class R6 | |
Global Real Estate Securities | | | 1.36 | % | | | 2.11 | % | | | 0.97 | % | | | N/A | | | | 1.11 | % | | | 0.96 | % | | | 1.61 | % | | | 0.96 | % |
International Real Estate Securities | | | 1.38 | | | | 2.13 | | | | 0.99 | | | | N/A | | | | 1.13 | | | | 0.98 | | | | N/A | | | | 0.98 | |
Real Estate Securities | | | 1.30 | | | | 2.05 | | | | 0.91 | | | | 1.41 | % | | | 1.05 | | | | 0.90 | | | | 1.55 | | | | 0.90 | |
68
GOLDMAN SACHS REAL ESTATE SECURITIES FUNDS
Statement Regarding Basis for Approval of Management Agreement (Unaudited)
Background
The Goldman Sachs Global Real Estate Securities Fund, Goldman Sachs International Real Estate Securities Fund, and Goldman Sachs Real Estate Securities Fund (the “Funds”) are investment portfolios of Goldman Sachs Trust (the “Trust”). The Board of Trustees oversees the management of the Trust and reviews the investment performance and expenses of the Funds at regularly scheduled meetings held throughout the year. In addition, the Board of Trustees determines annually whether to approve the continuance of the Trust’s investment management agreement (the “Management Agreement”) with Goldman Sachs Asset Management, L.P. (the “Investment Adviser”) on behalf of the Funds.
The Management Agreement was most recently approved for continuation until June 30, 2020 by the Board of Trustees, including those Trustees who are not parties to the Management Agreement or “interested persons” (as defined in the Investment Company Act of 1940, as amended) of any party thereto (the “Independent Trustees”), at a meeting held onJune 11-12, 2019 (the “Annual Meeting”).
The review process undertaken by the Trustees spans the course of the year and culminates with the Annual Meeting. To assist the Trustees in their deliberations, the Trustees have established a Contract Review Committee (the “Committee”), comprised of the Independent Trustees. The Committee held four meetings over the course of the year since the Management Agreement was last approved. At those Committee meetings, regularly scheduled Board or other committee meetings, and/or the Annual Meeting, matters relevant to the renewal of the Management Agreement were considered by the Board, or the Independent Trustees, as applicable. With respect to each Fund, such matters included:
| | (a) | | the nature and quality of the advisory, administrative, and other services provided to the Fund by the Investment Adviser and its affiliates, including information about: |
| | (i) | | the structure, staff, and capabilities of the Investment Adviser and its portfolio management teams; |
| | (ii) | | the groups within the Investment Adviser and its affiliates that support the portfolio management teams or provide other types of necessary services, including fund services groups (e.g., accounting and financial reporting, tax, shareholder services, and operations); controls and risk management groups (e.g., legal, compliance, valuation oversight, credit risk management, internal audit, compliance testing, market risk analysis, finance, and central funding); sales and distribution support groups, and others (e.g., information technology and training); |
| | (iii) | | trends in employee headcount; |
| | (iv) | | the Investment Adviser’s financial resources and ability to hire and retain talented personnel and strengthen its operations; and |
| | (v) | | the parent company’s support of the Investment Adviser and its mutual fund business, as expressed by the firm’s senior management; |
| | (b) | | information on the investment performance of the Fund, including comparisons to the performance of similar mutual funds, as provided by a third-party mutual fund data provider engaged as part of the contract review process (the “Outside Data Provider”), and a benchmark performance index; and information on general investment outlooks in the markets in which the Fund invests; |
| | (c) | | information provided by the Investment Adviser indicating the Investment Adviser’s views on whether the Fund’s peer group and/or benchmark index had high, medium, or low relevance given the Fund’s particular investment strategy; |
| | (d) | | the terms of the Management Agreement and other agreements with affiliated service providers entered into by the Trust on behalf of the Fund; |
| | (e) | | fee and expense information for the Fund, including: |
| | (i) | | the relative management fee and expense levels of the Fund as compared to those of comparable funds managed by other advisers, as provided by the Outside Data Provider; |
| | (ii) | | the Fund’s expense trends over time; and |
| | (iii) | | to the extent the Investment Adviser manages other types of accounts (such as bank collective trusts, private wealth management accounts, institutional separate accounts,sub-advised mutual funds, andnon-U.S. funds) having investment objectives and policies similar to those of the Fund, comparative information on the advisory fees charged and services provided to those accounts by the Investment Adviser; |
| | (f) | | with respect to the extensive investment performance and expense comparison data provided by the Outside Data Provider, its processes in producing that data for the Fund; |
| | (g) | | the undertakings of the Investment Adviser and its affiliates to implement fee waivers and/or expense limitations; |
| | (h) | | information relating to the profitability of the Management Agreement and the transfer agency and distribution and service arrangements of the Fund to the Investment Adviser and its affiliates; |
| | (i) | | whether the Fund’s existing management fee schedule adequately addressed any economies of scale; |
69
GOLDMAN SACHS REAL ESTATE SECURITIES FUNDS
Statement Regarding Basis for Approval of Management Agreement (Unaudited) (continued)
| | (j) | | a summary of the“fall-out” benefits derived by the Investment Adviser and its affiliates from their relationships with the Fund, including the fees received by the Investment Adviser’s affiliates from the Fund for transfer agency, (in the case of the Global Real Estate Securities Fund and International Real Estate Securities Fund) securities lending, portfolio trading, distribution and other services; |
| | (k) | | a summary of potential benefits derived by the Fund as a result of its relationship with the Investment Adviser; |
| | (l) | | information regarding commissions paid by the Fund and broker oversight, an update on the Investment Adviser’s soft dollars practices, other information regarding portfolio trading, and how the Investment Adviser carries out its duty to seek best execution; |
| | (m) | | portfolio manager ownership of Fund shares; the manner in which portfolio manager compensation is determined; and the number and types of accounts managed by the portfolio managers; |
| | (n) | | the nature and quality of the services provided to the Fund by its unaffiliated service providers, and the Investment Adviser’s general oversight and evaluation (including reports on due diligence) of those service providers as part of the administrative services provided under the Management Agreement; and |
| | (o) | | the Investment Adviser’s processes and policies addressing various types of potential conflicts of interest; its approach to risk management; the annual review of the effectiveness of the Fund’s compliance program; and periodic compliance reports. |
The Trustees also received an overview of the Funds’ distribution arrangements. They received information regarding the Funds’ assets, share purchase and redemption activity, and payment of distribution, service, and shareholder administration fees, as applicable. Information was also provided to the Trustees relating to revenue sharing payments made by and services provided by the Investment Adviser and its affiliates to intermediaries that promote the sale, distribution, and/or servicing of Fund shares. The Independent Trustees also discussed the broad range of other investment choices that are available to Fund investors, including the availability of comparable funds managed by other advisers.
The presentations made at the Board and Committee meetings and at the Annual Meeting encompassed the Funds and other mutual funds for which the Board of Trustees has responsibility. In evaluating the Management Agreement at the Annual Meeting, the Trustees relied upon their knowledge, resulting from their meetings and other interactions throughout the year, of the Investment Adviser and its affiliates, their services, and the Funds. In conjunction with these meetings, the Trustees received written materials and oral presentations on the topics covered, and the Investment Adviser addressed the questions and concerns of the Trustees, including concerns regarding the investment performance of certain of the funds they oversee. The Independent Trustees were advised by their independent legal counsel regarding their responsibilities and other regulatory requirements related to the approval and continuation of mutual fund investment management agreements under applicable law. In addition, the Investment Adviser and its affiliates provided the Independent Trustees with a written response to a formal request for information sent on behalf of the Independent Trustees by their independent legal counsel. During the course of their deliberations, the Independent Trustees met in executive sessions with their independent legal counsel, without representatives of the Investment Adviser or its affiliates present.
Nature, Extent, and Quality of the Services Provided Under the Management Agreement
As part of their review, the Trustees considered the nature, extent, and quality of the services provided to the Funds by the Investment Adviser. In this regard, the Trustees considered both the investment advisory services andnon-advisory services that are provided by the Investment Adviser and its affiliates. The Trustees noted the transition in the leadership and changes in personnel of various of the Investment Adviser’s portfolio management teams that had occurred in recent periods, and the ongoing recruitment efforts aimed at bringing high quality investment talent to the Investment Adviser. They also noted the Investment Adviser’s commitment to maintaining high quality systems and expending substantial resources to respond to ongoing changes to the regulatory and control environment in which the Funds and their service providers operate, as well as the efforts of the Investment Adviser and its affiliates to combat cyber security risks. The Trustees concluded that the Investment Adviser continued to commit substantial financial and operational resources to the Funds and expressed confidence that the Investment Adviser would continue to do so in the future. The Trustees also recognized that the Investment Adviser had made significant commitments to address regulatory compliance requirements applicable to the Funds and the Investment Adviser and its affiliates.
Investment Performance
The Trustees also considered the investment performance of the Funds. In this regard, they compared the investment performance of each Fund to its peers usingrankings and ratings compiled by the Outside Data Provider as of December 31, 2018, and updated performance information prepared by the Investment Adviser using the peer group identified by the Outside Data
70
GOLDMAN SACHS REAL ESTATE SECURITIES FUNDS
Statement Regarding Basis for Approval of Management Agreement (Unaudited) (continued)
Provider as of March 31, 2019. The information on each Fund’s investment performance was provided for theone-, three-, five-, andten-year periods ending on the applicable dates, to the extent that each Fund had been in existence for those periods. The Trustees also reviewed each Fund’s investment performance relative to its performance benchmark. As part of this review, they considered the investment performance trends of the Funds over time, and reviewed the investment performance of each Fund in light of its investment objective and policies and market conditions.
In addition, the Trustees considered materials prepared and presentations made by the Investment Adviser’s senior management and portfolio management personnel in which Fund performance was assessed. The Trustees also considered the Investment Adviser’s periodic reports with respect to the Funds’ risk profiles, and how the Investment Adviser’s approach to risk monitoring and management influences portfolio management.
The Trustees noted that the Global Real Estate Securities Fund’s Institutional Shares had placed in the top half of the Fund’s peer group for theone-year period and fourth quartile for the three-year period, and had underperformed the Fund’s benchmark index for theone- and three-year periods ended March 31, 2019. They observed that the International Real Estate Securities Fund had placed in the third quartile of the Fund’s peer group for the three-year period and in the fourth quartile for theone-, five- andten-year periods, and had underperformed the Fund’s benchmark index for theone-, three-, five-, andten-year periods ended March 31, 2019. The Trustees considered that the International Real Estate Securities Fund has a “global” peer group and benchmark that contemplates investments in U.S. andnon-U.S. securities, whereas the Fund invests only innon-U.S. securities. They also noted that the International Real Estate Securities Fund had experienced certain portfolio management changes in 2018. The Trustees observed that the Real Estate Securities Fund had placed in the third quartile of the Fund’s peer group for theone-year, five-year, andten-year periods, and in the fourth quartile for the three-year period, and had underperformed the Fund’s benchmark index for theone-, three-, five-, andten-year periods ended March 31, 2019.
Costs of Services Provided and Competitive Information
The Trustees considered the contractual terms of the Management Agreement and the fee rates payable by each Fund thereunder. In this regard, the Trustees considered information on the services rendered by the Investment Adviser to the Funds, which included both advisory and administrative services that were directed to the needs and operations of the Funds as registered mutual funds.
In particular, the Trustees reviewed analyses prepared by the Outside Data Provider regarding the expense rankings of the Funds. The analyses provided a comparison of each Fund’s management fee and breakpoints to those of a relevant peer group and category universe; an expense analysis which compared each Fund’s overall net and gross expenses to a peer group and a category universe; and data comparing each Fund’s net expenses to the peer and category medians. The analyses also compared each Fund’s other expenses and fee waivers/reimbursements to those of the peer group and category medians. The Trustees concluded that the comparisons provided by the Outside Data Provider were useful in evaluating the reasonableness of the management fees and total expenses paid by the Funds.
In addition, the Trustees considered the Investment Adviser’s undertakings to implement fee waivers and/or expense limitations. They also considered, to the extent that the Investment Adviser manages other types of accounts having investment objectives and policies similar to those of the Funds, comparative fee information for services provided by the Investment Adviser to those accounts, and information that indicated that services provided to the Funds differed in various significant respects from the services provided to other types of accounts which, in many cases, operated under less stringent legal and regulatory structures, required fewer services from the Investment Adviser to a smaller number of client contact points, and were less time-intensive.
In addition, the Trustees noted that shareholders are able to redeem their Fund shares at any time if shareholders believe that the Fund fees and expenses are too high or if they are dissatisfied with the performance of the Fund.
Profitability
The Trustees reviewed each Fund’s contribution to the Investment Adviser’s revenues andpre-tax profit margins. In this regard the Trustees noted that they had received, among other things, profitability analyses and summaries, revenue and expense schedules by Fund and by function (i.e., investment management, transfer agency and distribution and service), and information on the Investment Adviser’s expense allocation methodology. They observed that the profitability and expense figures are substantially similar to those used by the Investment Adviser for many internal purposes, including compensation decisions among various business groups, and are thus subject to a vigorous internal debate about how certain revenue and expenses should be allocated. The Trustees also noted that the internal audit group within the Goldman Sachs organization periodically audits the expense allocation methodology and that the internal audit group was satisfied with the reasonableness, consistency, and accuracy of the Investment Adviser’s expense allocation methodology. Profitability data for each Fund was provided for 2018 and 2017, and the Trustees considered this information in relation to the Investment Adviser’s overall profitability.
71
GOLDMAN SACHS REAL ESTATE SECURITIES FUNDS
Statement Regarding Basis for Approval of Management Agreement (Unaudited) (continued)
Economies of Scale
The Trustees considered the information that had been provided regarding whether there have been economies of scale with respect to the management of the Funds. The Trustees also considered the breakpoints in the fee rate payable under the Management Agreement for each of the Funds at the following annual percentage rates of the average daily net assets of the Funds:
| | | | | | | | | | | | |
| | | Global
Real Estate
Securities Fund | | | International
Real Estate
Securities
Fund | | | Real Estate
Securities Fund | |
| | | |
| First $1 billion | | | 0.93 | % | | | 0.95 | % | | | 0.87 | % |
| | | |
| Next $1 billion | | | 0.84 | | | | 0.95 | | | | 0.78 | |
| | | |
| Next $3 billion | | | 0.80 | | | | 0.86 | | | | 0.74 | |
| | | |
| Next $3 billion | | | 0.78 | | | | 0.81 | | | | 0.73 | |
| | | |
| Over $8 billion | | | 0.76 | | | | 0.80 | | | | 0.71 | |
The Trustees noted that the breakpoints were designed to share potential economies of scale, if any, with the Funds and their shareholders as assets under management reach those asset levels. The Trustees considered the amounts of assets in the Funds; the Funds’ recent share purchase and redemption activity; the information provided by the Investment Adviser relating to the costs of the services provided by the Investment Adviser and its affiliates and their realized profits; information comparing fee rates charged by the Investment Adviser with fee rates charged to other funds in the peer groups; and the Investment Adviser’s undertaking to limit certain expenses of the Funds that exceed specified levels. Upon reviewing these matters at the Annual Meeting, the Trustees concluded that the fee breakpoints represented a means of assuring that benefits of scalability, if any, would be passed along to shareholders at the specified asset levels.
Other Benefits to the Investment Adviser and Its Affiliates
The Trustees also considered the other benefits derived by the Investment Adviser and its affiliates from their relationships with the Funds as stated above, including: (a) transfer agency fees received by Goldman Sachs & Co. LLC (“Goldman Sachs”); (b) brokerage commissions earned by Goldman Sachs for executing securities transactions on behalf of the Funds; (c) research received by the Investment Adviser from broker-dealers in exchange for executing certain transactions on behalf of the Funds; (d) trading efficiencies resulting from aggregation of orders of the Funds with those for other funds or accounts managed by the Investment Adviser; (e) (in the case of the Global Real Estate Securities Fund and International Real Estate Securities Fund) fees earned by Goldman Sachs Agency Lending (“GSAL”), an affiliate of the Investment Adviser, as securities lending agent (and fees earned by the Investment Adviser for managing the fund in which the Funds’ cash collateral is invested); (f) the Investment Adviser’s ability to leverage the infrastructure designed to service the Funds on behalf of its other clients; (g) the Investment Adviser’s ability to cross-market other products and services to Fund shareholders; (h) Goldman Sachs’ retention of certain fees as Fund Distributor; (i) the Investment Adviser’s ability to negotiate better pricing with custodians on behalf of its other clients, as a result of the relationship with the Funds; and (j) the possibility that the working relationship between the Investment Adviser and the Funds’ third-party service providers may cause those service providers to be more likely to do business with other areas of Goldman Sachs. In the course of considering the foregoing, the Independent Trustees requested and received further information quantifying certain of thesefall-out benefits.
Other Benefits to the Funds and Their Shareholders
The Trustees also noted that the Funds receive certain other potential benefits as a result of their relationship with the Investment Adviser, including: (a) trading efficiencies resulting from aggregation of orders of the Funds with those of other funds or accounts managed by the Investment Adviser; (b) enhanced servicing from vendors due to the volume of business generated by the Investment Adviser and its affiliates; (c) enhanced servicing from broker-dealers due to the volume of business generated by the Investment Adviser and its affiliates; (d) the advantages received from the Investment Adviser’s knowledge and experience gained from managing other accounts and products; (e) the Investment Adviser’s ability to hire and retain qualified personnel to provide services to the Funds because of the reputation of the Goldman Sachs organization; (f) the Funds’ access, through the Investment Adviser, to certain firm-wide resources (e.g., proprietary risk management systems and databases), subject to certain restrictions; (g) (in the case of the Global Real Estate Securities Fund and International Real Estate Securities Fund) the Funds’ ability to participate in the securities lending program administered by GSAL, as measured by the revenue received by the Funds in connection with the program; and (h) the Funds’ access to certain affiliated distribution channels. In addition, the Trustees noted the competitive nature of the mutual fund marketplace, and considered that many of the Funds’ shareholders invested in the Funds
72
GOLDMAN SACHS REAL ESTATE SECURITIES FUNDS
Statement Regarding Basis for Approval of Management Agreement (Unaudited) (continued)
in part because of the Funds’ relationship with the Investment Adviser and that those shareholders have a general expectation that the relationship will continue.
Conclusion
In connection with their consideration of the Management Agreement, the Trustees gave weight to each of the factors described above, but did not identify any particular factor as controlling their decision. After deliberation and consideration of all of the information provided, including the factors described above, the Trustees concluded, in the exercise of their business judgment, that the management fees paid by each of the Funds were reasonable in light of the services provided to it by the Investment Adviser, the Investment Adviser’s costs and each Fund’s current and reasonably foreseeable asset levels. The Trustees unanimously concluded that the Investment Adviser’s continued management likely would benefit each Fund and its shareholders and that the Management Agreement should be approved and continued with respect to each Fund until June 30, 2020.
73
FUNDS PROFILE
Goldman Sachs Funds
Goldman Sachs is a premier financial services firm, known since 1869 for creating thoughtful and customized investment solutions in complex global markets.
Today, theInvestment Management Division of Goldman Sachs serves a diverse set of clients worldwide, including private institutions, public entities and individuals. With approximately $1.44 trillion in assets under supervision as of June 30, 2019, Goldman Sachs Asset Management (“GSAM”) has portfolio management teams located around the world and our investment professionals bring firsthand knowledge of local markets to every investment decision. Assets under supervision includes assets under management and other client assets for which Goldman Sachs does not have full discretion. GSAM leverages the resources of Goldman Sachs & Co. LLC subject to legal, internal and regulatory restrictions.
Money Market
Financial Square FundsSM
| ∎ | | Financial Square Treasury Solutions Fund1 |
| ∎ | | Financial Square Government Fund1 |
| ∎ | | Financial Square Money Market Fund2 |
| ∎ | | Financial Square Prime Obligations Fund2 |
| ∎ | | Financial Square Treasury Instruments Fund1 |
| ∎ | | Financial Square Treasury Obligations Fund1 |
| ∎ | | Financial Square Federal Instruments Fund1 |
Investor FundsSM
| ∎ | | Investor Money Market Fund3 |
| ∎ | | Investor Tax-Exempt Money Market Fund3 |
Fixed Income
Short Duration and Government
| ∎ | | High Quality Floating Rate Fund |
| ∎ | | Short-Term Conservative Income Fund |
| ∎ | | Short Duration Government Fund |
| ∎ | | Short Duration Income Fund |
| ∎ | | Inflation Protected Securities Fund |
Multi-Sector
Municipal and Tax-Free
| ∎ | | High Yield Municipal Fund |
| ∎ | | Dynamic Municipal Income Fund |
| ∎ | | Short Duration Tax-Free Fund |
| ∎ | | Municipal Income Completion Fund |
Single Sector
| ∎ | | Investment Grade Credit Fund |
| ∎ | | High Yield Floating Rate Fund |
| ∎ | | Emerging Markets Debt Fund |
| ∎ | | Local Emerging Markets Debt Fund |
Fixed Income Alternatives
| ∎ | | Long Short Credit Strategies Fund |
Fundamental Equity
| ∎ | | Small/Mid Cap Value Fund |
| ∎ | | Small/Mid Cap Growth Fund |
| ∎ | | Concentrated Growth Fund |
| ∎ | | Technology Opportunities Fund |
| ∎ | | Growth Opportunities Fund |
| ∎ | | Rising Dividend Growth Fund |
Tax-Advantaged Equity
| ∎ | | U.S. Tax-Managed Equity Fund |
| ∎ | | International Tax-Managed Equity Fund |
| ∎ | | U.S. Equity Dividend and Premium Fund |
| ∎ | | International Equity Dividend and Premium Fund |
Equity Insights
| ∎ | | Small Cap Equity Insights Fund |
| ∎ | | U.S. Equity Insights Fund |
| ∎ | | Small Cap Growth Insights Fund |
| ∎ | | Large Cap Growth Insights Fund |
| ∎ | | Large Cap Value Insights Fund |
| ∎ | | Small Cap Value Insights Fund |
| ∎ | | International Small Cap Insights Fund |
| ∎ | | International Equity Insights Fund |
| ∎ | | Emerging Markets Equity Insights Fund |
Fundamental Equity International
| ∎ | | International Equity Income Fund |
| ∎ | | International Equity ESG Fund |
| ∎ | | Emerging Markets Equity Fund |
| ∎ | | ESG Emerging Markets Equity Fund |
Alternative
| ∎ | | Real Estate Securities Fund |
| ∎ | | International Real Estate Securities Fund |
| ∎ | | Commodity Strategy Fund |
| ∎ | | Global Real Estate Securities Fund |
| ∎ | | Alternative Premia Fund |
| ∎ | | Absolute Return Tracker Fund |
| ∎ | | Managed Futures Strategy Fund |
| ∎ | | MLP Energy Infrastructure Fund |
| ∎ | | Multi-Manager Alternatives Fund |
| ∎ | | Absolute Return Multi-Asset Fund |
| ∎ | | Global Infrastructure Fund |
Total Portfolio Solutions
| ∎ | | Global Managed Beta Fund |
| ∎ | | Multi-Manager Non-Core Fixed Income Fund |
| ∎ | | Multi-Manager U.S. Dynamic Equity Fund |
| ∎ | | Multi-Manager Global Equity Fund |
| ∎ | | Multi-Manager International Equity Fund |
| ∎ | | Tactical Tilt Overlay Fund |
| ∎ | | Balanced Strategy Portfolio |
| ∎ | | Multi-Manager U.S. Small Cap Equity Fund |
| ∎ | | Multi-Manager Real Assets Strategy Fund |
| ∎ | | Growth and Income Strategy Portfolio |
| ∎ | | Growth Strategy Portfolio |
| ∎ | | Dynamic Global Equity Fund4 |
| ∎ | | Satellite Strategies Portfolio |
| ∎ | | Enhanced Dividend Global Equity Portfolio |
| ∎ | | Tax-Advantaged Global Equity Portfolio |
| ∎ | | Strategic Factor Allocation Fund |
| ∎ | | Target Date 2020 Portfolio |
| ∎ | | Target Date 2025 Portfolio |
| ∎ | | Target Date 2030 Portfolio |
| ∎ | | Target Date 2035 Portfolio |
| ∎ | | Target Date 2040 Portfolio |
| ∎ | | Target Date 2045 Portfolio |
| ∎ | | Target Date 2050 Portfolio |
| ∎ | | Target Date 2055 Portfolio |
| ∎ | | Target Date 2060 Portfolio |
| ∎ | | GQG Partners International Opportunities Fund |
| 1 | | You could lose money by investing in the Fund. Although the Fund seeks to preserve the value of your investment at $1.00 per share, it cannot guarantee it will do so. An investment in the Fund is not a deposit of a bank and is not insured or guaranteed by the Federal Deposit Insurance Corporation or any other government agency. The Fund’s sponsor has no legal obligation to provide financial support to the Fund, and you should not expect that the sponsor will provide financial support to the Fund at any time. |
| 2 | | You could lose money by investing in the Fund. Because the share price of the Fund will fluctuate, when you sell your shares they may be worth more or less than what you originally paid for them. The Fund may impose a fee upon sale of your shares or may temporarily suspend your ability to sell shares if the Fund’s liquidity falls below required minimums because of market conditions or other factors. An investment in the Fund is not a deposit of a bank and is not insured or guaranteed by the Federal Deposit Insurance Corporation or any other government agency. The Fund’s sponsor has no legal obligation to provide financial support to the Fund, and you should not expect that the sponsor will provide financial support to the Fund at any time. |
| 3 | | You could lose money by investing in the Fund. Although the Fund seeks to preserve the value of your investment at $1.00 per share, it cannot guarantee it will do so. The Fund may impose a fee upon sale of your shares or may temporarily suspend your ability to sell shares if the Fund’s liquidity falls below required minimums because of market conditions or other factors. An investment in the Fund is not a deposit of a bank and is not insured or guaranteed by the Federal Deposit Insurance Corporation or any other government agency. The Fund’s sponsor has no legal obligation to provide financial support to the Fund, and you should not expect that the sponsor will provide financial support to the Fund at any time. |
| 4 | | Effective after the close of business on February 28, 2019, the Goldman Sachs Equity Growth Strategy Portfolio was renamed the Goldman Sachs Dynamic Global Equity Fund. |
| | | Financial Square FundsSM and Investor FundsSM are registered service marks of Goldman Sachs & Co. LLC. |
| 5 | | Effective after the close of business on August 30, 2019, the Goldman Sachs N-11 Equity Fund was renamed the Goldman Sachs Imprint Emerging Markets Opportunities Fund. |
| * | | This list covers open-end funds only. Please visit our website at www.GSAMFUNDS.com to learn about our closed-end funds and exchange-traded funds. |
| | |
TRUSTEES Jessica Palmer,Chair Kathryn A. Cassidy Diana M. Daniels James A. McNamara Roy W. Templin Gregory G. Weaver | | OFFICERS James A. McNamara,President Joseph F. DiMaria,Principal Financial Officer,
Principal Accounting Officer and Treasurer Caroline L. Kraus,Secretary |
| |
GOLDMAN SACHS & CO. LLC Distributor and Transfer Agent | | GOLDMAN SACHS ASSET MANAGEMENT, L.P. Investment Adviser |
Visit our web site atwww.GSAMFUNDS.com to obtain the most recentmonth-end returns.
Goldman Sachs Asset Management, L.P. 200 West Street, New York, New York 10282
Economic and market forecasts presented herein reflect our judgment as of the date of this presentation and are subject to change without notice. These forecasts do not take into account the specific investment objectives, restrictions, tax and financial situation or other needs of any specific client. Actual data will vary and may not be reflected here. These forecasts are subject to high levels of uncertainty that may affect actual performance. Accordingly, these forecasts should be viewed as merely representative of a broad range of possible outcomes. These forecasts are estimated, based on assumptions, and are subject to significant revision and may change materially as economic and market conditions change. Goldman Sachs has no obligation to provide updates or changes to these forecasts. Case studies and examples are for illustrative purposes only.
The portfolio risk management process includes an effort to monitor and manage risk, but does not imply low risk.
The reports concerning the Funds included in this shareholder report may contain certain forward-looking statements about the factors that may affect the performance of the Funds in the future. These statements are based on Fund management’s predictions and expectations concerning certain future events and their expected impact on the Funds, such as performance of the economy as a whole and of specific industry sectors, changes in the levels of interest rates, the impact of developing world events, and other factors that may influence the future performance of the Funds. Management believes these forward-looking statements to be reasonable, although they are inherently uncertain and difficult to predict. Actual events may cause adjustments in portfolio management strategies from those currently expected to be employed.
A description of the policies and procedures that the Funds use to determine how to vote proxies relating to portfolio securities and information regarding how a Fund voted proxies relating to portfolio securities during the most recent12-month period ended June 30 is available (i) without charge, upon request by calling1-800-526-7384 (for Retail Shareholders) or1-800-621-2550 (for Institutional Shareholders); and (ii) on the Securities and Exchange Commission (“SEC”) web site at http://www.sec.gov.
The Global Industry Classification Standard (GICS) was developed by and is the exclusive property and a service mark of Morgan Stanley Capital International Inc. (MSCI) and Standard & Poor’s, a division of The McGraw-Hill Companies, Inc. (S&P) and is licensed for use by Goldman Sachs. Neither MSCI, S&P nor any other party involved in making or compiling the GICS or any GICS classifications makes any express or implied warranties or representations with respect to such standard or classification (or the results to be obtained by the use thereof), and all such parties hereby expressly disclaim all warranties of originality, accuracy, completeness, merchantability or fitness for a particular purpose with respect to any of such standard or classification. Without limiting any of the foregoing, in no event shall MSCI, S&P, any of their affiliates or any third party involved in making or compiling the GICS or any GICS classifications have any liability for any direct, indirect, special, punitive, consequential or any other damages (including lost profits) even if notified of the possibility of such damages.
The Funds will file portfolio holdings information for each month in a fiscal quarter within 60 days after the end of the relevant fiscal quarter on Form N-PORT. Portfolio holdings information for the third month of each fiscal quarter will be made available on the SEC’s web site at http://www.sec.gov. Portfolio holdings information may be obtained upon request and without charge by calling1-800-526-7384 (for Retail Shareholders) or1-800-621-2550 (for Institutional Shareholders).
Holdings and allocations shown are as of June 30, 2019 and may not be representative of future investments. Fund holdings should not be relied on in making investment decisions and should not be construed as research or investment advice regarding particular securities. Current and future holdings are subject to risk.
This material is not authorized for distribution to prospective investors unless preceded or accompanied by a current prospectus or summary prospectus, if applicable. Investors should consider a Fund’s objective, risks, and charges and expenses, and read the summary prospectus, if available, and/or the prospectus carefully before investing or sending money. The summary prospectus, if available, and the prospectus contain this and other information about a Fund and may be obtained from your authorized dealer or from Goldman Sachs & Co. LLC by calling (retail –1-800-526-7384) (institutional –1-800-621-2550).
© 2019 Goldman Sachs. All rights reserved. 174943-OTU-1029967 RESSAR-19
Goldman Sachs Funds

| | | | |
| | |
| Semi-Annual Report | | | | June 30, 2019 |
| | |
| | | | Alternative Funds |
| | | | Absolute Return Tracker |
| | | | Alternative Premia |
| | | | Commodity Strategy |
| | | | Managed Futures Strategy |
It is our intention that beginning on January 1, 2021, paper copies of the Funds’ annual and semi-annual shareholder reports will no longer be sent by mail, unless you specifically request paper copies of the reports from a Fund or from your financial intermediary. Instead, the reports will be made available on a website, and you will be notified by mail each time a report is posted and provided with a website link to access the report.
If you already elected to receive shareholder reports electronically, you will not be affected by this change and you need not take any action. At any time, you may elect to receive reports and certain communications from the Fund electronically by calling the applicable toll-free number below or by contacting your financial intermediary.
You may elect to receive all future shareholder reports in paper free of charge. If you hold shares of a Fund directly with the Fund’s transfer agent, you can inform the transfer agent that you wish to receive paper copies of reports by calling toll-free 800-621-2550 for Institutional, Class R6 and Class P shareholders or800-526-7384 for all other shareholders. If you hold shares of a Fund through a financial intermediary, please contact your financial intermediary to make this election. Your election to receive reports in paper will apply to all Goldman Sachs Funds held in your account if you invest through your financial intermediary or all Goldman Sachs Funds held with the Funds’ transfer agent if you invest directly with the transfer agent.

Goldman Sachs Alternative Funds
| ∎ | | ABSOLUTE RETURN TRACKER |
| ∎ | | MANAGED FUTURES STRATEGY |
| | | | |
| | | |
| NOT FDIC-INSURED | | May Lose Value | | No Bank Guarantee |
PORTFOLIO RESULTS
Goldman Sachs Absolute Return Tracker Fund
Investment Objective
The Fund’s investment objective is to seek to deliver long-term total return consistent with investment results that approximate the return and risk patterns of a diversified universe of hedge funds.
Portfolio Management Discussion and Analysis
Below, the Goldman Sachs Quantitative Investment Strategies (“QIS”) Team discusses the Goldman Sachs Absolute Return Tracker Fund’s (the “Fund”) performance and positioning for thesix-month period ended June 30, 2019 (“the Reporting Period”).
| Q | | How did the Fund perform during the Reporting Period? |
| A | | During the Reporting Period, the Fund’s Class A, Class C, Institutional, Investor, Class P, Class R and Class R6 Shares generated cumulative total returns, without sales charges, of 7.13%, 6.76%, 7.36%, 7.21%, 7.37%, 6.97% and 7.37%, respectively. These returns compare to the 4.22% cumulative total return of the Fund’s benchmark, the HFRX Global Hedge Fund Index (net of management, administrative and performance/incentive fees) (the “HFRX Global Hedge Fund Index”)1, during the same time period. |
| Q | | What economic and market factors most influenced the hedge fund asset class as a whole during the Reporting Period? |
| A | | Hedge funds, as measured by the HFRX Global Hedge Fund Index, overall posted solid gains during the Reporting Period, following losses in calendar year 2018. Equity long/short hedge funds, as measured by the HFRX Equity Hedge Index, were strongest, returning 5.97%. Relative value hedge funds, as measured by the HFRX Relative Value Arbitrage Index, generated a return of 4.19%. Global macro hedge funds followed, with the HFRX Macro/CTA Index returning 2.58% for the Reporting Period. Event driven hedge funds were weakest, but posted similar returns to global macro hedge funds, with the HFRX Event Driven Index returning 2.50%. |
| | | As the Reporting Period began, hedge funds were up overall, with the HFRX Global Hedge Fund Index gaining 2.13% in the first month of 2019. Global equities posted gains across geographies for the month, rebounding from a challenging end to 2018. In January 2019, global government bond yields declined modestly; the U.S. dollar weakened overall relative to global currencies; and commodities posted gains for the month, led by energy. Hedge funds were mixed across styles for the month, as the HFRX Equity Hedge, Event Driven and Relative Value Arbitrage indices posted gains, while the HFRX Macro/CTA Index declined for the month. Hedge funds were again up overall in February 2019, with the HFRX Global Hedge Fund Index gaining 0.63% for the month. Equities continued to rally into February across geographies and regions amid recovering commodity prices and continued accommodative posturing from the U.S. Federal Reserve (the “Fed”). In February 2019, global government bond yields rose modestly, and the U.S. dollar strengthened slightly overall relative to global currencies. Hedge funds were mixed across styles for the month, as the HFRX Equity Hedge, Macro/CTA and Relative Value Arbitrage indices posted gains, while the HFRX Event Driven Index declined for the month. Hedge funds were slightly down overall in March 2019, with the HFRX Global Hedge Fund Index declining 0.17% for the month. Equities posted another month of gains in March across geographies and regions, while global government bond yields declined. The U.S. dollar strengthened slightly overall relative to global currencies. Hedge funds were mixed across styles in March, as the HFRX Equity Hedge and Macro/CTA indices posted gains, while the HFRX Event Driven and Relative Value Arbitrage indices declined for the month. |
| | | Hedge funds were up overall in April 2019, with the HFRX Global Hedge Fund Index gaining 0.66% for the month. Global equity markets continued their 2019 rally globally in April, gaining against a backdrop of strong economic growth |
1
| | 1 | | The HFRX Global Hedge Fund Index is a trademark of Hedge Fund Research, Inc. (“HFR”). HFR has not participated in the formation of the Fund. HFR does not endorse or approve the Fund or make any recommendation with respect to investing in the Fund. |
PORTFOLIO RESULTS
| | and robust merger and acquisition and Initial Public Offering activity, particularly in the U.S. Global government bond yields generally increased in April 2019, while the U.S. dollar was largely flat versus developed market currencies. Commodities were mixed during the month, with energy posting gains, led by a rally in oil, while agricultural commodities had weak performance, led by declines in wheat. Hedge funds were up across all four major styles for the month. Hedge funds declined overall in May 2019, with the HFRX Global Hedge Fund Index returning-0.68% for the month. Global equity markets reversed sharply, declining against a backdrop of heightened trade tensions. Global government bond yields generally declined in May 2019, while the U.S. dollar strengthened versus most global currencies. Commodities were mixed during the month, with energy declining, while agricultural commodities gained. Hedge funds were mixed across styles for the month, as the HFRX Equity Hedge, Event Drive and Macro/CTA indices posted declines, while the HFRX Relative Value Arbitrage Index was slightly up. Hedge funds were then up overall in June 2019, with the HFRX Global Hedge Fund Index returning 1.61% for the month. Global equity markets and risk assets broadly rallied in June against a backdrop of accommodative central bank commentary and increased optimism regarding trade negotiations. Global government bond yields generally declined during June 2019, while the U.S. dollar weakened versus most global currencies. Commodities were generally up for the month, with energy leading gains. Hedge funds were up across all four major styles for the month, led by the HFRX Macro/CTA Index. |
| Q | | What key factors were responsible for the Fund’s performance during the Reporting Period? |
| A | | We believe hedge funds derive a large portion of their returns from exposure to sources of market risk. The Fund uses a quantitative methodology in combination with a qualitative overlay to seek to identify the Market Exposures, or sources of market risk, that approximate the return and risk patterns of specific hedge fund indices. The Fund’s quantitative methodology seeks to allocate the Fund’s exposure to each Hedge FundSub-Strategy such that the Fund’s investment results approximate the return and risk patterns of a diversified universe of hedge funds. During the Reporting Period, the Fund posted positive absolute returns that significantly outperformed the HFRX Global Hedge Fund Index on a relative basis. On an absolute basis, all four of the Fund’sSub-Strategies contributed positively to performance during the Reporting Period. |
| | | Among the fourSub-Strategies, the Fund’s Equity Long/Short Hedge FundSub-Strategy contributed most positively to the Fund’s absolute return during the Reporting Period. Long exposure to single-name stocks to which hedge funds had large investments (based on 13F filings with the Securities & Exchange Commission (“SEC”)) and European equities contributed the most. Conversely, exposure to the Fund’s market neutral global long/short value strategy detracted from results. |
| | | The Fund’s Macro Hedge FundSub-Strategy contributed positively to the Fund’s return on an absolute basis during the Reporting Period, with its trend-following strategy adding most. Conversely, the Fund’s currency positioning, specifically its U.S. dollar/euro trade, and its commodities cross-sectional momentum strategy detracted most. |
| | | Within the Fund’s Relative Value Hedge FundSub-Strategy, long exposure to global high yield credit and its Relative Value S&P 500 put writing strategy contributed most positively to results. There were no significant detractors from the Fund’s performance within thisSub-Strategy during the Reporting Period. |
| | | Within the Fund’s Event Driven Hedge FundSub-Strategy, the Event Driven S&P 500 put writing strategy and exposure to U.S.small-cap equities contributed most positively to results. (Put options are most commonly used in the stock market to protect against the decline of the price of a stock below a specified price. If the price of the stock declines below the specified price of the put option, the owner/buyer of the put has the right, but not the obligation, to sell the asset at the specified price, while the seller of the put has the obligation to purchase the asset at the strike price if the owner uses the right to do so (the owner/buyer is said to exercise the put or put option)). Conversely, short exposure to North American high yield credit detracted from results. |
| | | In addition to the asset classes mentioned above, the Fund was invested in a variety of developed and emerging market equities, short-term interest rates, government bonds, currencies, credit, real estate and commodities during the Reporting Period. |
| Q | | How did the Fund use derivatives and similar instruments during the Reporting Period? |
| A | | The Fund used exchange-traded index futures contracts to gain exposure to U.S.large-cap andsmall-cap equities,non-U.S. developed market equities including those in Europe, the U.K. and Japan, emerging markets equities, commodities, government bonds and short-term interest |
2
PORTFOLIO RESULTS
| | rates. The Fund used currency forward contracts to gain exposure to select developed and emerging market currencies ofnon-U.S. developed markets. The Fund used total return swaps to gain exposure to a broad commodity index, Master Limited Partnerships, and developed market equity indices and developed market growth equity indices. The Fund also used listed put options on the S&P 500 Index within the put writing strategies to gain exposure to U.S. large cap equities. Lastly, the Fund used exchange-traded credit default swaps to gain exposure to high yield and investment grade credit markets across the U.S. and Europe. The use of these instruments is integral to the Fund’s investment strategy, which, overall, realized positive absolute returns during the Reporting Period. |
| Q | | Were there any changes made in the Fund’s investment strategy during the Reporting Period? |
| A | | There were no changes made in the Fund’s investment strategy during the Reporting Period. |
| Q | | How was the Fund positioned at the end of the Reporting Period? |
| A | | At the end of the Reporting Period, the Fund had a 46% allocation to the Equity Long/Short Hedge FundSub-Strategy, 27% to the Macro Hedge FundSub-Strategy, 20% to the Relative Value Hedge FundSub-Strategy and 7% to the Event Driven Hedge FundSub-Strategy, quite similar to theSub-Strategy allocations at the start of the Reporting Period. |
| Q | | Were there any changes to the Fund’s portfolio management team during the Reporting Period? |
| A | | There were no changes to the Fund’s portfolio management team during the Reporting Period. |
| Q | | What is the Fund’s strategy going forward? |
| A | | In the coming months, we intend to remain focused on the Fund’s investment objective of seeking to deliver long-term total return consistent with investment results that approximate the return and risk patterns of a diversified universe of hedge funds. We understand that the hedge fund industry is dynamic, and to keep pace, we seek to understand trends in the hedge fund industry by digesting information from a number of sources, including hedge fund return databases, prime brokerage reports, hedge fund consultants, regulatory filings and other public sources. Additionally, we emphasize ongoing research and continued process and model enhancement, which we can implement through our scalable, robust technological platform. |
3
FUND BASICS
Absolute Return Tracker Fund
as of June 30, 2019
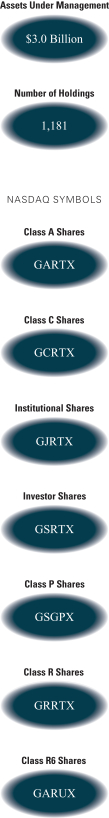
| | | | | | | | | | |
| | PERFORMANCE REVIEW | |
| | | |
| | | January 1, 2019—June 30, 2019 | | Fund Total Return
(based on NAV)1 | | | HFRX Global Hedge
Fund Index2 | |
| | | |
| | Class A | | | 7.13 | % | | | 4.22 | % |
| | Class C | | | 6.76 | | | | 4.22 | |
| | Institutional | | | 7.36 | | | | 4.22 | |
| | Investor | | | 7.21 | | | | 4.22 | |
| | Class P | | | 7.37 | | | | 4.22 | |
| | Class R | | | 6.97 | | | | 4.22 | |
| | | Class R6 | | | 7.37 | | | | 4.22 | |
| | 1 | | The net asset value (“NAV”) represents the net assets of the class of the Fund(ex-dividend) divided by the total number of shares of the class outstanding. The Fund’s performance reflects the reinvestment of dividends and other distributions. The Fund’s performance does not reflect the deduction of any applicable sales charges. |
| | 2 | | The HFRX Global Hedge Fund Index is designed to be representative of the overall composition of the hedge fund universe. It is comprised of all eligible hedge fund strategies, including but not limited to convertible arbitrage, distressed securities, equity hedge, equity market neutral, event driven, macro, merger arbitrage, and relative value arbitrage. The strategies are asset weighted based on the distribution of assets in the hedge fund industry. The index is investable through products managed by HFR Asset Management, LLC that track HFRX Indices. The HFRX Global Hedge Fund Index is a trademark of HFR. HFR has not participated in the formation of the Fund. HFR does not endorse or approve the Fund or make any recommendation with respect to investing in the Fund. It is not possible to invest directly in an index. |
| | | | | | | | | | | | | | | | | | | | |
| | STANDARDIZED TOTAL RETURNS3 |
| | | | | | |
| | | For the period ended 6/30/19 | | One Year | | | Five Years | | | Ten Year | | | Since Inception | | | Inception Date |
| | | | | | |
| | Class A | | | -2.08 | % | | | 1.55 | % | | | 2.13 | % | | | 0.78 | % | | 5/30/08 |
| | Class C | | | 1.65 | | | | 1.92 | | | | 1.92 | | | | 0.53 | | | 5/30/08 |
| | Institutional | | | 3.95 | | | | 3.11 | | | | 3.10 | | | | 1.69 | | | 5/30/08 |
| | Investor | | | 3.79 | | | | 2.95 | | | | 2.95 | | | | 1.54 | | | 5/30/08 |
| | Class P | | | 3.86 | | | | N/A | | | | N/A | | | | 3.28 | | | 4/17/18 |
| | Class R | | | 3.28 | | | | 2.44 | | | | 2.43 | | | | 1.03 | | | 5/30/08 |
| | | Class R6 | | | 3.96 | | | | N/A | | | | N/A | | | | 3.49 | | | 7/31/15 |
| | 3 | | The Standardized Total Returns are average annual total returns or cumulative total returns (only if the performance period is one year or less) as of the most recent calendarquarter-end. They assume reinvestment of all distributions at NAV. These returns reflect a maximum initial sales charge of 5.5% for Class A Shares, and the assumed contingent deferred sales charge for Class C Shares (1% if redeemed within 12 months of purchase). Effective July 30, 2018, Class C Shares convert automatically to Class A Shares on or about the fifteenth day of the last month of the calendar quarter that is ten years after the purchase date. The Since Inception returns for Class C Shares do not reflect the conversion to Class A Shares after the first ten years of performance. Because Institutional, Investor, Class P, Class R and Class R6 Shares do not involve a sales charge, such a charge is not applied to their Standardized Total Returns. |
The returns set forth in the tables above represent past performance. Past performance does not guarantee future results. The Fund’s investment return and principal value will fluctuate so that an investor’s shares, when redeemed, may be worth more or less than their original cost. Current performance may be lower or higher than the performance quoted above. Please visit our web site at www.GSAMFUNDS.com to obtain the most recentmonth-end returns. Performance reflects applicable fee waivers and/or expense limitations in effect during the periods shown. In their absence, performance would be reduced. Returns do not reflect the deduction of taxes that a shareholder would pay on Fund distributions or the redemption of Fund shares.
4
FUND BASICS
| | | | | | | | | | |
| | EXPENSE RATIOS4 | |
| | | |
| | | | | Net Expense Ratio (Current) | | | Gross Expense Ratio (Before Waivers) | |
| | Class A | | | 1.12 | % | | | 1.27 | % |
| | Class C | | | 1.87 | | | | 2.02 | |
| | Institutional | | | 0.73 | | | | 0.88 | |
| | Investor | | | 0.87 | | | | 1.02 | |
| | Class P | | | 0.72 | | | | 0.87 | |
| | Class R | | | 1.37 | | | | 1.52 | |
| | | Class R6 | | | 0.72 | | | | 0.87 | |
| | 4 | | The expense ratios of the Fund, both current (net of applicable fee waivers and/or expense limitations) and before waivers (gross of applicable fee waivers and/or expense limitations) are as set forth above according to the most recent publicly available Prospectus for the Fund and may differ from the expense ratios disclosed in the Financial Highlights in this report. Pursuant to contractual arrangements, the Fund’s waivers and/or expense limitations will remain in place through at least April 30, 2020, and prior to such date the Investment Adviser may not terminate the arrangements without the approval of the Fund’s Board of Trustees. If these arrangements are discontinued in the future, the expense ratios may change without shareholder approval. |
| | 5 | | The percentage shown for each investment category reflects the value of investments in that category as a percentage of net assets. Figures in the above graph may not sum to 100% due to the exclusion of other assets and liabilities. Certain of the Fund’s investments reflected in the table above may be held for the purpose of covering derivative positions as required under the Investment Company Act of 1940, as amended, or for satisfying certain margin requirements related to such positions. The above graph depicts the Fund’s investments but may not represent the Fund’s market exposure due to the exclusion of certain derivatives, if any, as listed in the Additional Investment Information section of the Schedule of Investments. |
5
PORTFOLIO RESULTS
Goldman Sachs Alternative Premia Fund
Investment Objective
The Fund seeks long-term absolute return.
Portfolio Management Discussion and Analysis
Below, the Goldman Sachs Quantitative Investment Strategies (“QIS”) Team discusses the Goldman Sachs Alternative Premia Fund’s (the “Fund”) performance and positioning for thesix-month period ended June 30, 2019 (the “Reporting Period”).
| Q | | How did the Fund perform during the Reporting Period? |
| A | | During the Reporting Period, the Fund’s Class A, Class C, Institutional, Investor, Class P, Class R and Class R6 Shares generated cumulative total returns, without sales charges, of 0.38%, 0.00%, 0.62%, 0.62%, 0.62%, 0.39% and 0.62%, respectively. These returns compare to the 1.43% cumulative total return of the Fund’s benchmark, the ICE® BofAML® USD LIBORThree-Month Constant Maturity Index (the “LIBOR Three-Month Index”). |
| | | We note that the Fund’s benchmark being the LIBOR Three-Month Index is a means of emphasizing that the Fund has an unconstrained strategy. That said, this Fund employs a benchmark agnostic strategy and thus comparisons to a benchmark index are not particularly relevant. |
| Q | | What were the primary contributors to and detractors from the Fund’s performance based on your team’s asset allocation decisions during the Reporting Period? |
| A | | Overall, the Fund realized positive, albeit modest, absolute returns during the Reporting Period. From an asset class perspective, alternative risk premia in currencies and fixed income contributed positively to performance. On the downside, allocations to equities premia detracted most, followed by commodities premia, which also detracted. |
| | | Alternative risk premia in currencies contributed the most to performance, specifically carry-typed premia that seek to capitalize on the difference between yields in different currencies. Indeed, carry-typed premia was the best performing style across all asset classes during the Reporting Period, with carry-typed fixed income and volatility premia also contributing positively. Structural-typed premia also added value, especially structural-based commodities premia. Momentum-based premia also contributed positively, albeit more modestly, during the Reporting Period. Conversely, value-typed premia detracted across asset classes during the Reporting Period. Carry styles seek to capitalize on the tendency for higher yielding assets to outperform lower yielding assets. Structural styles seek to profit from anomalies or mispricing present in the market. Momentum styles seek to exploit the tendency for recent relative price movements to continue in the near future. Value styles seek to take advantage of the tendency for assets with low or high market prices to revert to their fundamental valuation. |
| Q | | How did the Fund use derivatives and similar instruments during the Reporting Period? |
| A | | During the Reporting Period, the Fund allocated to alternative risk premia across a range of asset classes, which included equities, fixed income, credit, currencies and commodities. The Fund used derivative instruments to gain exposure to these asset classes. Instruments traded included credit swaps, total return swaps, equity-linked derivative instruments, forward foreign currency exchange contracts, futures contracts and written and purchased options. The use of these instruments is integral to the Fund’s current investment strategy, which realized positive absolute returns during the Reporting Period. |
| Q | | Did you make any changes in the Fund’s strategy or allocations during the Reporting Period? |
| A | | During the Reporting Period, we modestly increased the Fund’s allocations to commodities, volatility and trend premia, and we modestly reduced the Fund’s allocations to fixed income, equities and currency premia. |
| Q | | How was the Fund positioned at the end of the Reporting Period? |
| A | | At the end of the Reporting Period, the Fund’s risk premia budget was 26% to equities, 25% to commodities, 18% to currencies, 6% to fixed income, 12% to trend and 12% to volatility. |
6
PORTFOLIO RESULTS
| Q | | Were there any changes to the Fund’s portfolio management team during the Reporting Period? |
| A | | During the Reporting Period, Fund portfolio manager Evgeny Gladchenko left the firm. Evgeny’s portfolio management responsibilities for the Fund were assumed by Federico Gilly and Matthew Schwab, both managing directors andco-heads of research, portfolio management and portfolio construction for the Alternative Investment Strategies team within the QIS Team. Both Federico and Matthew have been portfolio managers of the Fund since 2017. Federico and Matthew joined the firm in 2000 and 2007, respectively, and each has 26 years of industry experience. Armen Avanessians and Gary Chropuvka continue as globalco-heads of the QIS Team, which represents more than 160 professionals. |
| Q | | What is the Fund’s asset allocation view and strategy for the months ahead? |
| A | | The Fund is a multi-alternative solution that seeks to deliver long-term absolute return differentiated from those returns of core equities and fixed income markets. The Fund maintains a diversified set of exposures across equities, fixed income, currencies, commodities and credit. At the end of the Reporting Period, we maintained conviction in our diversified approach and intended to continue to manage the Fund consistent with stated objectives. There is no guarantee that the Fund’s diversified alternative investment strategies will cause it to achieve its investment objective. |
7
FUND BASICS
Alternative Premia Fund
as of June 30, 2019
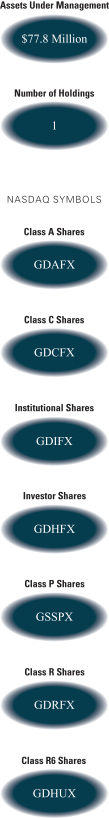
| | | | | | | | | | |
| | PERFORMANCE REVIEW | |
| | | |
| | | January 1, 2019—June 30, 2019 | | Fund Total
Return (based on NAV)1 | | | ICE BofAML
USD LIBOR
Three-Month
Constant
Maturity
Index2 | |
| | | |
| | Class A | | | 0.38 | % | | | 1.43 | % |
| | Class C | | | 0.00 | | | | 1.43 | |
| | Institutional | | | 0.62 | | | | 1.43 | |
| | Investor | | | 0.62 | | | | 1.43 | |
| | Class P | | | 0.62 | | | | 1.43 | |
| | Class R | | | 0.39 | | | | 1.43 | |
| | | Class R6 | | | 0.62 | | | | 1.43 | |
| | 1 | | The net asset value (“NAV”) represents the net assets of the class of the Fund (ex-dividend) divided by the total number of shares of the class outstanding. The Fund’s performance reflects the reinvestment of dividends and other distributions. The Fund’s performance does not reflect the deduction of any applicable sales charges. |
| | 2 | | The ICE BofAML USD LIBOR Three-Month Constant Maturity Index (the “Index”) tracks the performance of a synthetic asset paying LIBOR to a stated maturity. The Index is based on the assumed purchase at par of a synthetic instrument having exactly its stated maturity and with a coupon equal to that day’s fixing rate. That issue is assumed to be sold the following day (priced at a yield equal to the current day fixing rate) and rolled into a new instrument. The Index figure does not reflect any deductions for fees, expenses or taxes. It is not possible to invest directly in an index. |
The returns set forth in the table above represent past performance. Past performance does not guarantee future results. The Fund’s investment return and principal valuewill fluctuate so that an investor’s shares, when redeemed, may be worth more or less than their original cost. Current performance may be lower or higher than the performance quoted above. Please visit our web site at www.GSAMFUNDS.com toobtain the most recent month-end returns. Performance reflects applicable fee waivers and/or expense limitations in effect during the periods shown. In their absence, performance would be reduced. Returns do not reflect the deduction of taxes that a shareholder would pay on Fund distributions or the redemption of Fund shares
| | | | | | | | | | | | | | | | |
| | STANDARDIZED TOTAL RETURNS3 |
| | | | | |
| | | For the period ended 6/30/19 | | One Year | | | Five Years | | | Since Inception | | | Inception Date |
| | | | | |
| | Class A | | | -9.58 | % | | | -0.31 | % | | | 2.12 | % | | 1/5/10 |
| | Class C | | | -6.07 | | | | 0.08 | | | | 1.97 | | | 1/5/10 |
| | Institutional | | | -3.88 | | | | 1.24 | | | | 3.15 | | | 1/5/10 |
| | Investor | | | -4.02 | | | | 1.10 | | | | 2.99 | | | 1/5/10 |
| | Class P | | | -3.89 | | | | N/A | | | | -2.42 | | | 4/17/18 |
| | Class R | | | -4.51 | | | | 0.61 | | | | 2.49 | | | 1/5/10 |
| | | Class R6 | | | -3.89 | | | | N/A | | | | 2.27 | | | 7/31/15 |
| | 3 | | The Standardized Total Returns are average annual total returns or cumulative total returns (only if the performance period is one year or less) as of the most recent calendar quarter-end. They assume reinvestment of all distributions at NAV. These returns reflect a maximum initial sales charge of 5.5% for Class A Shares and the assumed contingent deferred sales charge for Class C Shares (1% if redeemed within 12 months of purchase). Because Institutional, Investor, Class P, Class R and Class R6 Shares do not involve a sales charge, such a charge is not applied to their Standardized Total Returns. |
8
FUND BASICS
The returns set forth in the table above represent past performance. Past performance does not guarantee future results. The Fund’s investment return and principal value will fluctuate so that an investor’s shares, when redeemed, may be worth more or less than their original cost. Current performance may be lower or higher than the performance quoted above. Please visit our web site at www.GSAMFUNDS.com to obtain the most recent month-end returns. Performance reflects applicable fee waivers and/or expense limitations in effect during the periods shown. In their absence, performance would be reduced. Returns do not reflect the deduction of taxes that a shareholder would pay on Fund distributions or the redemption of Fund shares.
| | | | | | | | | | |
| | EXPENSE RATIOS4 | |
| | | |
| | | | | Net Expense Ratio (Current) | | | Gross Expense Ratio (Before Waivers) | |
| | | |
| | Class A | | | 1.33 | % | | | 1.77 | % |
| | Class C | | | 2.08 | | | | 2.52 | |
| | Institutional | | | 0.94 | | | | 1.38 | |
| | Investor | | | 1.08 | | | | 1.52 | |
| | Class P | | | 0.93 | | | | 1.37 | |
| | Class R | | | 1.58 | | | | 2.02 | |
| | | Class R6 | | | 0.93 | | | | 1.37 | |
| | 4 | | The expense ratios of the Fund, both current (net of applicable fee waivers and/or expense limitations) and before waivers (gross of applicable fee waivers and/or expense limitations) are as set forth above according to the most recent publicly available Prospectus for the Fund and may differ from the expense ratios disclosed in the Financial Highlights in this report. Pursuant to contractual arrangements, the Fund’s waivers and/or expense limitations will remain in place through at least April 30, 2020, and prior to such date the Investment Adviser may not terminate the arrangements without the approval of the Fund’s Board of Trustees. If these arrangements are discontinued in the future, the expense ratios may change without shareholder approval. |
9
FUND BASICS
| | 5 | | The percentage shown for each investment category reflects the value of investments in that category as a percentage of net assets. Figures in the above graph may not sum to 100% due to the exclusion of other assets and liabilities. Certain of the Fund’s investments reflected in the table above may be held for the purpose of covering derivative positions as required under the Investment Company Act of 1940, as amended, or for satisfying certain margin requirements related to such positions. The above graph may not represent the Fund’s market exposure due to the exclusion of certain derivatives, if any, as listed in the Additional Investment Information section of the Schedule of Investments. |
10
GOLDMAN SACHS COMMODITY STRATEGY FUND
What Differentiates the Goldman Sachs Commodity Investment Process?
At Goldman Sachs Asset Management, L.P. (“GSAM”), the goal of our commodity investment process is to provide consistent, strong performance by actively managing our portfolios within a research-intensive, risk-managed framework.
Goldman Sachs’ Commodity Investment Process
Our commodity investment process emphasizes the importance of both short-term, tactical opportunities and long-term investment views. Our team-based approach to managing the Goldman Sachs Commodity Strategy Fund ensures continuity and idea sharing among some of the industry’s most experienced fixed income specialists. We pursue strong, consistent performance across commodity markets through:

The Goldman Sachs Commodity Strategy Fund primarily gains exposure to the performance of the commodity markets through investment in a wholly-owned subsidiary of the Fund organized as a company under the laws of the Cayman Islands (the “Subsidiary”). The Subsidiary invests primarily in commodity-linked swaps (which may include total return swaps), as well as other commodity-linked securities and derivative instruments that provide exposure to the performance of the commodities markets, and in fixed income and debt instruments. The Fund’s portfolio is designed to provide exposure that corresponds to the investment return of assets that trade in the commodity markets without direct investment in physical commodities.
The Fund implements enhanced cash strategies that capitalize on GSAM’s global fixed income expertise. The Fixed Income Team will employ the full spectrum of capabilities offered, including bottom-up strategies (credit, mortgages, governments /municipals, high yield, and emerging markets debt) and top-down strategies (duration, cross-sector, currency and country) in an attempt to enhance the return of the Fund.

A commodity Fund that seeks to:
| ∎ | | Provides exposure to the commodity markets without direct investment in physical commodities |
| ∎ | | Utilizes commodity-linked swaps that provide economic exposure to movements in commodity prices |
11
PORTFOLIO RESULTS
Goldman Sachs Commodity Strategy Fund
Investment Objective
The Fund seeks long-term total return.
Portfolio Management Discussion and Analysis
Below, the Goldman Sachs Commodities Team discusses the Goldman Sachs Commodity Strategy Fund’s (the “Fund”) performance and positioning for thesix-month period ended June 30, 2019 (the “Reporting Period”).
| Q | | How did the Fund perform during the Reporting Period? |
| A | | During the Reporting Period, the Fund’s Class A, Class C, Institutional, Investor, Class P, Class R and Class R6 Shares generated cumulative total returns, without sales charges, of 12.76%, 12.38%, 12.92%, 12.95%, 12.92%, 12.63% and 13.02%, respectively. These returns compare to the 13.34% cumulative total return of the Fund’s benchmark, the S&P GSCI® Total Return Index (Gross, USD, Unhedged) (the “S&P GSCI®”), during the same period. |
| Q | | What economic and market factors most influenced the commodities markets as a whole during the Reporting Period? |
| A | | Commodities markets overall, as measured by the S&P GSCI®, posted double-digit positive returns during the Reporting Period, despite a weak second calendar quarter. Such gains for the Reporting Period as a whole were driven primarily by a recovery in petroleum prices and a rally in gold. By comparison to the S&P GSCI® return of 13.34% for the Reporting Period, the S&P 500® Index and the ICE U.S. Dollar Index (“DXY”) returned 18.54% and-0.06%, respectively.1 Overall, commodities during the first half of 2019 were boosted by the U.S. Federal Reserve’s (the “Fed”) dovish turn in its monetary policy, a slightly weaker U.S. dollar and a rallying U.S. equity market that more than offset the headwinds of trade tensions and numerous geopolitical flashpoints. (Dovish tends to suggest lower interest rates; opposite of hawkish.) |
| Q | | Which commodity subsectors were strongest during the Reporting Period? |
| A | | While four of the five major commodity subsectors posted positive absolute returns during the Reporting Period, the energy subsector of the S&P GSCI® was strongest on a relative basis, posting a return of 22.80% for the six months ended June 30, 2019. Crude oil was the strongest individual commodity both within the subsector and within the S&P GSCI® overall. Crude oil prices were on an upward trend during the first quarter of 2019, as robust demand in emerging markets and in China outpaced market expectations. Supply-side dynamics also played a part. Saudi Arabia followed through with its promise to cut exports as part of the broader Organization of Petroleum Exporting Countries (“OPEC”) agreement made in December 2018 and also increased its expectations of price increases with respect to its forward-looking production view. Also, one of Libya’s largest oil fields endured ongoing conflict after being captured by an armed militia in December 2018. In the second quarter of 2019, crude oil sold off somewhat amidst renewed U.S.-China trade tensions, and growth-sensitive assets were broadly hit as the two countries traded tariff escalations and sanction measures. Later in June, Middle East tensions between the U.S. and Iran eventually drove gains in crude oil prices as well as energy subsector stocks. Gasoline, gasoil and heating oil also rose, albeit more modestly, during the Reporting Period, but natural gas declined. |
| | 1 | | The S&P 500® Index is the Standard & Poor’s 500 Composite Index of 500 stocks, an unmanaged index of common stock prices. The DXY is a measure of the general international value of the U.S. dollar as calculated by averaging the exchange rates between the U.S. dollar and six major world currencies. |
12
PORTFOLIO RESULTS
| | The precious metals subsector of the S&P GSCI® was second-strongest on a relative basis with a return of 8.86% for the Reporting Period. Gold was in marginally positive territory during the first quarter of 2019 after the Fed signaled a slowdown in its monetary tightening cycle. In the second quarter of 2019, gold gained ground more significantly, as the Fed exceeded market expectations for a dovish turn at its June meeting. The Fed kept interest rates unchanged, removed language about remaining “patient” and added language about uncertainties in its outlook and its willingness to act to sustain the expansion. The rally in gold accelerated on the news, surging more than 8% in June 2019 alone. Also supporting the precious metal’s strength was growing financial market turbulence, a number of geopolitical trouble spots and a string of economic releases that fell short of consensus expectations. The other precious metal to perform strongly during the Reporting Period was palladium, which jumped to nearall-time highs at the end of June 2019 due largely to investor demand. Silver, on the other hand, declined modestly during the Reporting Period. |
| Q | | Which commodity subsectors were weakest during the Reporting Period? |
| A | | The livestock component of the S&P GSCI® was weakest on a relative basis, posting a return of-7.69% for the six months ended June 30, 2019. Within the subsector, both cattle and lean hogs were down. The latest U.S. hogs and pigs report indicated that pig and pork supplies in 2019 would be well above 2018 levels. At the same time, U.S. pork exports to China have been lackluster due to the ongoing trade tensions between the two nations, and despite the devastation caused to the Chinese domestic industry by African swine flu. |
| | | The industrial metals subsector was the second-weakest performer during the Reporting Period. The industrial metals subsector, as measured by the S&P GSCI® Industrial Metals Index, returned 0.99% for the Reporting Period overall. Heading into 2019, industrial metals’ performance was broadly positive as fears about trade tensions eased somewhat. Increased optimism about Chinese economic growth was also positive for the subsector after Chinese manufacturing purchasing managers’ indices indicated an upward trend. However, renewed trade tensions between the U.S. and China created uncertainty during the second quarter of 2019, bringing industrial metals to range-bound, marginally positive performance for the Reporting Period. Nickel was an outperformer during the Reporting Period on expectations of further demand from battery production and electrical vehicle producers. Yet nickel remained a small component of the S&P GSCI®. Zinc and copper also eked out positive returns, though lead and aluminum declined. |
| | | The agriculture component of the S&P GSCI® also underperformed the broad S&P GSCI®, returning 1.61% during the Reporting Period. Resumption of Chinese soybean purchases as well as a thawing of trade tensions drove soybean prices marginally higher in January 2019. However, global grain inventories stayed at record high levels and uncertainty surrounding further Chinese purchases persisted. Thus the grains complex experienced mixed performance during the first calendar quarter. Heading into the second quarter of 2019, an unusually wet spring in the U.S. and a demand-driven rally were supportive. Yet, the grains complex was ultimately down on a rumored halt in Chinese soybean purchases and ongoing trade pressures. For the Reporting Period overall, corn was strongest, followed by wheat and then sugar. Coffee enjoyed a solid gain in June, with returns buoyed by the threat of a cold snap in Brazil, which could pose a threat to crops. However, for the Reporting Period overall, coffee was virtually flat as was cocoa. Soybeans, Kansas wheat and cotton were down for the Reporting Period. |
| Q | | What key factors were responsible for the Fund’s performance during the Reporting Period? |
| A | | The Fund generated double-digit positive absolute returns but modestly underperformed the S&P GSCI® during the Reporting Period. The Fund generally matched the exposures of the S&P GSCI® with no material deviations via commodity index-linked swaps. Given our moderately bullish view on the commodity complex, we primarily held the prompt-month, or near-month, contracts, matching the S&P GSCI®. (Prompt-month, also called near-month, refers to the futures contract that is closest to expiration and is usually for delivery in the next calendar month (e.g., prompt-month contracts traded in February are typically for delivery in March)). Our enhanced cash management strategy contributed positively to the Fund’s results during the Reporting Period. |
| Q | | How did the Fund’s roll-timing strategies impact performance during the Reporting Period? |
| A | | As we virtually matched the S&P GSCI®’s front-month contract exposures during the Reporting Period, our roll-timing strategies, implemented via exposure to commodity index-linked swaps, did not have a material effect on the Fund’s relative returns for the Reporting Period overall. We employ an approach whereby we do not take active views on |
13
PORTFOLIO RESULTS
| | individual commodities but rather gain Fund exposure to commodities through investments whose performance is linked to commodity indices. |
| | | We often implement commodity roll-timing strategies by deviating from the S&P GSCI® roll convention, which typically calls for rolling forward exposure at the front, or near-month, end of the futures curve on a monthly basis. The roll occurs during business days 5 through 9. To the extent our team believes fundamental or technical developments will impact the futures roll-timing decision, we will incorporate those views into the portfolio by electing to roll positions earlier, later, forward or in different weights versus the S&P GSCI® roll. However, through most of the Reporting Period, we maintained the Fund’s position along with the S&P GSCI® in the front month across the stack of commodities curves, a position implemented toward the end of 2016. Since the front month contracts are more sensitive to market dynamics, the Fund’s positions reflected our bullish view on commodity markets. |
| Q | | How did you implement the Fund’s enhanced cash management strategy? |
| A | | In addition to seeking value through management of the commodities portion of the Fund’s portfolio, we also attempt to add a modest amount of excess return through thoughtful management of collateral held in the Fund. The cash portion of the Fund’s portfolio is typically allocated to high-grade collateral that includes U.S. Treasury securities, agency debentures, mortgage-backed securities and short-term fixed income instruments. During the Reporting Period, we favored high quality government and agency securities for the Fund’s collateral allocation. Overall, fixed income securities used for the Fund’s collateral allocation contributed positively to returns. |
| Q | | How did the Fund use derivatives and similar instruments during the Reporting Period? |
| A | | As mentioned earlier in some detail, the Fund used commodity index-linked total return swaps in implementing our roll-timing strategies in order to gain exposure to the commodities markets. In implementing our enhanced cash management strategy, the Fund used futures, interest rate swaps, agency collateralized mortgage obligations, currency swaps and forward sales contracts, which are agency mortgage-backed derivatives used in purchasing a future issuance of agency mortgage-backed securities. The Fund used U.S. Treasury futures contracts and interest rate swaps for duration management purposes. The use of these instruments is integral to the Fund’s investment strategy, which, overall, realized strong positive absolute returns during the Reporting Period. |
| Q | | Did you make any changes in the Fund’s strategy or allocations during the Reporting Period? |
| A | | We did not make any significant changes in the Fund’s strategy or allocations during the Reporting Period, although we did eliminate the Fund’s deferred exposure to West Texas Intermediate (“WTI”) crude oil held at the end of 2018, and we shifted the Fund’s positions to front month exposure to match the S&P GSCI®. Since the front month contracts are more sensitive to market dynamics, we moved the Fund’s positions to reflect our bullish view on commodity markets. The Fund continued to hold exposure to the commodities markets primarily in the form of swaps linked to the S&P GSCI®. |
| Q | | How was the Fund positioned at the end of the Reporting Period? |
| A | | At the end of the Reporting Period, the Fund was, for the most part, positioned along with the S&P GSCI® in the front month across the stack of commodities curves. The Fund held exposure to the commodities underlying the S&P GSCI® through customized swaps in the Subsidiary. (The Subsidiary has the same objective as the Fund but unlike the Fund may invest without limitation in commodity index-linked securities, such as swaps and futures that provide exposure to the performance of the commodity markets.) |
| | | The cash portion of the Fund’s portfolio was allocated across various fixed income sectors, with an emphasis on the higher quality, lower volatility segments of the market, such as U.S. government and government-sponsored bonds. |
| | | At the end of the Reporting Period, the Fund’s net assets were allocated approximately 20.3% to commodity-linked securities, 24.0% to fixed income securities and 55.7% to cash. |
| Q | | Were there any changes to the Fund’s portfolio management team during the Reporting Period? |
| A | | Michael Johnson, head of the commodities team within Global Fixed Income, left the firm at the end of March 2019. Mark Van Wyk, head of the government swaps strategy and a portfolio manager for our inflation-linked strategies, has assumed responsibility for the commodities strategy. Mark also assumed Michael’s portfolio management responsibilities for the Fund. Mark helped launch the commodities enhanced index strategy in 1995 and has |
14
PORTFOLIO RESULTS
| | continued to trade commodities within our inflation strategy. Mark joined GSAM in 1994 and has 25 years of investment experience. Sam Finkelstein remains a portfolio manager of the Fund, along with Mark. We remain focused on our goal of delivering strong returns for our Fund shareholders, primarily through commodity roll-timing strategies. |
| Q | | What is the Fund’s view and strategy going forward? |
| A | | The U.S. produced 12.2 million barrels of oil per day as of April 2019, according to the U.S. Energy Information Administration (“EIA”). The EIA expects strong growth in natural gas production to put downward pressure on natural gas prices in 2019. At the same time, the EIA expects natural gas inventories to remain 14% lower than levels from one year prior, potentially exposing the natural gas market to increased volatility. Outside of the energy subsector, renewed trade tensions have created uncertainty for the industrial metals subsector, while potential U.S. Fed interest rate cuts may be supportive for gold prices going forward, in our view. At the end of the Reporting Period, we maintained the Fund’s positioning along with the S&P GSCI® in the front month across the stack of commodities curves. Irrespective of directionality, we believe the market will continue to hold opportunities for the active, relative value investor. |
15
FUND BASICS
Commodity Strategy Fund
as of June 30, 2019
| | | | | | | | |
| | PERFORMANCE REVIEW |
| | | |
| | | January 1, 2019—June 30, 2019 | | Fund Total Return
(based on NAV)1 | | | S&P GSCI®2 |
| | Class A | | | 12.76 | % | | 13.34% |
| | Class C | | | 12.38 | | | 13.34 |
| | Institutional | | | 12.92 | | | 13.34 |
| | Investor | | | 12.95 | | | 13.34 |
| | Class P | | | 12.92 | | | 13.34 |
| | Class R | | | 12.63 | | | 13.34 |
| | | Class R6 | | | 13.02 | | | 13.34 |
| | 1 | | The net asset value (“NAV”) represents the net assets of the class of the Fund (ex-dividend) divided by the total number of shares of the class outstanding. The Fund’s performance reflects the reinvestment of dividends and other distributions. The Fund’s performance does not reflect the deduction of any applicable sales charges. |
| | 2 | | The S&P GSCI® is an unmanaged composite index of commodity sector returns, representing an unleveraged, long-only investment in commodity futures that is broadly diversified across the spectrum of commodities. Individual components qualify for inclusion in the S&P GSCI® on the basis of liquidity and are weighted by their respective world production quantities. The figures for the S&P GSCI® do not include any deduction for fees, expenses or taxes. It is not possible to invest directly in an index. |
| | | | | | | | | | | | | | | | | | | | |
| | STANDARDIZED TOTAL RETURNS3 |
| | | | | | |
| | | For the period ended 6/30/19 | | One Year | | | Five Years | | | Ten Years | | | Since Inception | | | Inception Date |
| | Class A | | | -16.10 | % | | | -13.97 | % | | | -5.68 | % | | | -7.58 | % | | 3/30/07 |
| | Class C | | | -13.66 | | | | -13.81 | | | | -5.93 | | | | -7.92 | | | 3/30/07 |
| | Institutional | | | -11.84 | | | | -12.89 | | | | -5.00 | | | | -6.95 | | | 3/30/07 |
| | Investor | | | -11.87 | | | | -12.93 | | | | -4.99 | | | | -8.66 | | | 11/30/07 |
| | Class P | | | -11.83 | | | | N/A | | | | N/A | | | | -6.48 | | | 4/17/18 |
| | Class R | | | -12.33 | | | | -13.43 | | | | -5.50 | | | | -9.16 | | | 11/30/07 |
| | | Class R6 | | | -11.83 | | | | N/A | | | | N/A | | | | -3.02 | | | 7/31/15 |
| | 3 | | The Standardized Total Returns are average annual total returns or cumulative total returns (only if the performance period is one year or less) as of the most recent calendar quarter-end. They assume reinvestment of all distributions at NAV. These returns reflect a maximum initial sales charge of 4.5% for Class A Shares and the assumed contingent deferred sales charge for Class C Shares (1% if redeemed within 12 months of purchase). Effective July 30, 2018, Class C Shares convert automatically to Class A Shares on or about the fifteenth day of the last month of the calendar quarter that is ten years after the purchase date. The Since Inception returns for Class C Shares do not reflect the conversion to Class A Shares after the first ten years of performance. Because Institutional, Investor, Class P, Class R and Class R6 Shares do not involve a sales charge, such a charge is not applied to their Standardized Total Returns. |
The returns set forth in the tables above represent past performance. Past performance does not guarantee future results. The Fund’s investment return and principal value will fluctuate so that an investor’s shares, when redeemed, may be worth more or less than their original cost. Current performance may be lower or higher than the performance quoted above. Please visit our web site at www.GSAMFUNDS.com to obtain the most recent month-end returns. Performance reflects applicable fee waivers and/or expense limitations in effect during the periods shown. In their absence, performance would be reduced. Returns do not reflect the deduction of taxes that a shareholder would pay on Fund distributions or the redemption of Fund shares.
16
FUND BASICS
| | | | | | | | | | |
| | EXPENSE RATIOS4 | | | | | | | | |
| | | |
| | | | | Net Expense Ratio (Current) | | | Gross Expense Ratio (Before Waivers) | |
| | Class A | | | 0.95 | % | | | 1.16 | % |
| | Class C | | | 1.70 | | | | 1.91 | |
| | Institutional | | | 0.61 | | | | 0.82 | |
| | Investor | | | 0.70 | | | | 0.91 | |
| | Class P | | | 0.60 | | | | 0.81 | |
| | Class R | | | 1.20 | | | | 1.41 | |
| | | Class R6 | | | 0.60 | | | | 0.81 | |
| | 4The | | expense ratios of the Fund, both current (net of applicable fee waivers and/or expense limitations) and before waivers (gross of applicable fee waivers and/or expense limitations) are as set forth above according to the most recent publicly available Prospectus for the Fund and may differ from the expense ratios disclosed in the Financial Highlights in this report. Pursuant to contractual arrangements, the Fund’s waivers and/or expense limitations will remain in place through at least April 30, 2020, and prior to such date the Investment Adviser may not terminate the arrangements without the approval of the Fund’s Board of Trustees. If these arrangements are discontinued in the future, the expense ratios may change without shareholder approval. |
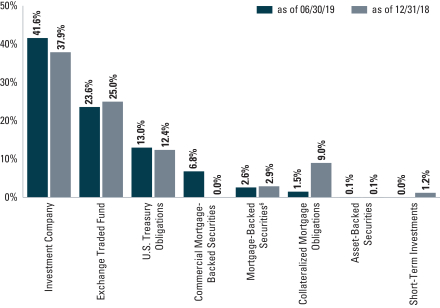
| | 5The | | percentage shown for each investment category reflects the value of investments in that category as a percentage of net assets. Figures in the graph may not sum to 100% due to the exclusion of other assets and liabilities. Certain of the Fund’s investments reflected in the table above may be held for the purpose of covering derivative positions as required under the Investment Company Act of 1940, as amended, or for satisfying certain margin requirements related to such positions. The above graph depicts the Fund’s investments but may not represent the Fund’s market exposure due to the exclusion of certain derivatives, if any, as listed in the Additional Investment Information section of the Schedule of Investments. |
| | 6Mortgage-backed | | securities issued by the Government National Mortgage Association (“GNMA”), Federal National Mortgage Association (“FNMA”) or Federal Home Loan Mortgage Corp. (“FHLMC”) are guaranteed by the issuing entity. GNMA instruments are also backed by the full faith and credit of the United States Government. Mortgage-backed securities issued by private issuers may not be guaranteed. |
17
PORTFOLIO RESULTS
Goldman Sachs Managed Futures Strategy Fund
Investment Objective
The Fund seeks to generate long-term absolute return.
Portfolio Management Discussion and Analysis
Below, the Goldman Sachs Quantitative Investment Strategies Team discusses the Goldman Sachs Managed Futures Strategy Fund’s (the “Fund”) performance and positioning for thesix-month period ended June 30, 2019 (the “Reporting Period”).
| Q | | How did the Fund perform during the Reporting Period? |
| A | | During the Reporting Period, the Fund’s Class A, Class C, Institutional, Investor, Class P, Class R and Class R6 Shares generated cumulative total returns, without sales charges, of 4.78%, 4.39%, 5.06%, 5.00%, 5.06%, 4.76% and 5.05%, respectively. These returns compare to the 1.25% cumulative total return of the Fund’s benchmark, the ICE® BofAML® USD LIBOROne-Month Constant Maturity Index (the “LIBOROne-Month Index”), during the same time period. |
| | | We note that the Fund’s benchmark being the LIBOROne-Month Index is a means of emphasizing that the Fund has an unconstrained strategy. That said, this Fund employs a benchmark agnostic strategy and thus comparisons to a benchmark index are not particularly relevant. |
| Q | | What were the primary contributors to and detractors from the Fund’s performance during the Reporting Period? |
| A | | The Fund implements a trend-following strategy that takes long and/or short positions in a wide range of asset classes, including equities, fixed income and currencies, among others, to seek long-term absolute return. The Fund seeks to achieve its investment objective by investing primarily in a portfolio of equities, equity index futures, bonds, bond futures, equity swaps, interest rate swaps, currency forwards andnon-deliverable forwards, options, exchange-traded funds (“ETFs”) and structured securities. As a result of the Fund’s use of derivatives, the Fund may also hold significant amounts of U.S. Treasuries or short-term investments. The Fund’s investments are made without restriction as to issuer capitalization, country, currency, maturity or credit rating. |
| | During the Reporting Period, the Fund generated solid positive performance. Exposures to short-term interest rates and developed fixed income contributed the most to the Fund’s performance. Conversely, exposures to commodities and emerging markets equities detracted the most. |
| | | More specifically, long positioning in short-term interest rates across regions was the largest positive contributor to returns during the Reporting Period. Short-term interest rates in the U.S., Australia and the U.K. were the best contributors by geography. In terms of developed fixed income, European, Swedish and U.S. fixed income were the best contributors. The Fund benefited from an ongoing rally in fixed income around the globe and maintained its long developed fixed income exposure at the end of the Reporting Period. |
| | | Conversely, the Fund maintained mixed views across different emerging markets equity markets that were on average long. South Korean equities and Chinese H shares detracted the most during the Reporting Period, while China A shares were the only positive contributor among the Fund’s investments in emerging markets equity markets. Within commodities, exposures to lean hogs, West Texas Intermediate crude oil and nickel detracted the most during the Reporting Period. The Fund ended the Reporting Period with mixed exposures across commodities that were on average short. |
| Q | | How did the Fund use derivatives and similar instruments during the Reporting Period? |
| A | | The Fund used derivatives, including futures, swaps and forwards, to implement long and short positions. The Fund invested in equity index futures, forward foreign currency exchange contracts and currency forwards to achieve exposure to equities (both in U.S. andnon-U.S. companies) and currencies (U.S. andnon-U.S. currencies), respectively. The Fund used interest rate swaps, credit swaps, total return swaps and currency forwards to achieve exposure to fixed income. We used sector-based commodity-linked structured notes and commodity futures as a means of expressing |
18
PORTFOLIO RESULTS
| | momentum/trend views on various commodity assets. The use of these instruments is integral to the Fund’s investment strategy, which, overall, realized positive absolute returns during the Reporting Period. |
| Q | | What positioning changes did you make within the Fund during the Reporting Period? |
| A | | The Fund transitioned from being short to long developed and emerging markets equities during the first quarter 2019 global rebound in equities. The Fund remained short developed and emerging markets currencies. The Fund remained long developed and emerging markets fixed income and short-term interest rates. The Fund moved from being on average short commodities to being modestly long on average. |
| | | During the second quarter of 2019, the Fund maintained its long positioning in developed and emerging markets equities. The Fund remained modestly short developed markets currencies and moved from being short to long emerging markets currencies. The Fund remained long both developed and emerging markets fixed income, as upward trends continued. The Fund also remained long short-term interest rates. The Fund held mixed positions across the 24 commodities it trades, having moved to start the quarter modestly short on average and then becoming long as the quarter progressed. |
| Q | | How was the Fund positioned at the end of the Reporting Period? |
| A | | At the end of the Reporting Period, the Fund was long both developed and emerging markets equities given their rally during the first half of 2019. The Fund was largely short developed market currencies given the U.S. dollar’s appreciation during the Reporting Period and held mixed exposures across emerging markets currencies. The Fund was long both developed and emerging markets fixed income at the end of the Reporting Period amid a sustained fixed income rally. The Fund was also long short-term interest rates at the end of the Reporting Period. |
| Q | | Were there any changes to the Fund’s portfolio management team during the Reporting Period? |
| A | | There were no changes to the Fund’s portfolio management team during the Reporting Period. |
| Q | | What is the Fund’s tactical asset allocation view and strategy for the months ahead? |
| A | | Going into the second half of 2019, we intend to continue to seek to identify price trends in various asset classes over short-, medium- and long-term horizons via a proprietary investment model. Upon identifying a trend in a given instrument or asset, the Fund will take a long or short position in the instrument or asset. Long positions benefit from an increase in price of the underlying instrument or asset, while short positions benefit from a decrease in price of the underlying instrument or asset. The size of the Fund’s position in an instrument or asset is primarily related to the strength of the overall trend identified by the investment model. |
| | | Going forward, the Fund seeks to maintain economic exposure to commodities markets by investing in a wholly-owned subsidiary of the Fund organized as a company under the laws of the Cayman Islands (the “Subsidiary”) and in commodity index-linked notes. The Subsidiary primarily obtains its commodity exposure investing in futures and swaps instruments. The Subsidiary may also hold bonds or other instruments, including fixed income securities, either as investments or to serve as margin or collateral for its swap positions. |
| | | We continue to believe that the Fund’s trend-following strategy is important because it attempts to adapt to changing markets, seeking what we believe are the best opportunities for investment and attempting to manage risk when the markets become unstable. There is no guarantee that the Fund’s trend-following strategy will cause it to achieve its investment objective. |
19
FUND BASICS
Managed Futures Strategy Fund
as of June 30, 2019
| | | | | | | | | | |
| | PERFORMANCE REVIEW | |
| | | |
| | | January 1, 2019—June 30, 2019 | | Fund Total Return
(based on NAV)1 | | | ICE BofAML USD LIBOR
One-Month Constant Maturity Index2 | |
| | | |
| | Class A | | | 4.78 | % | | | 1.25 | % |
| | Class C | | | 4.39 | | | | 1.25 | |
| | Institutional | | | 5.06 | | | | 1.25 | |
| | Investor | | | 5.00 | | | | 1.25 | |
| | Class P | | | 5.06 | | | | 1.25 | |
| | Class R | | | 4.76 | | | | 1.25 | |
| | | Class R6 | | | 5.05 | | | | 1.25 | |
| | 1 | | The net asset value (“NAV”) represents the net assets of the class of the Fund(ex-dividend) divided by the total number of shares of the class outstanding. The Fund’s performance reflects the reinvestment of dividends and other distributions. The Fund’s performance does not reflect the deduction of any applicable sales charges. |
| | 2 | | The ICE BofAML USD LIBOROne-Month Constant Maturity Index tracks the performance of a synthetic asset paying LIBOR to a stated maturity. The Index is based on the assumed purchase at par of a synthetic instrument having exactly its stated maturity and with a coupon equal to that day’s fixing rate. That issue is assumed to be sold the following business day (priced at a yield equal to the current day fixing rate) and rolled into a new instrument. The Index figures do not reflect any deduction for fees, expenses or taxes. It is not possible to invest directly in an index. |
| | | | | | | | | | | | | | | | | | |
| | STANDARDIZED TOTAL RETURNS3 | |
| | | | | |
| | | For the period ended 6/30/19 | | One Year | | | Five Years | | | Since Inception | | | Inception Date | |
| | | | | |
| | Class A | | | -0.13 | % | | | 1.68 | % | | | 0.67 | % | | | 2/29/12 | |
| | Class C | | | 3.89 | | | | 2.06 | | | | 0.67 | | | | 2/29/12 | |
| | Institutional | | | 6.15 | | | | 3.24 | | | | 1.83 | | | | 2/29/12 | |
| | Investor | | | 6.00 | | | | 3.09 | | | | 1.69 | | | | 2/29/12 | |
| | Class P | | | 6.15 | | | | N/A | | | | 2.01 | | | | 4/17/18 | |
| | Class R | | | 5.46 | | | | 2.60 | | | | 1.19 | | | | 2/29/12 | |
| | | Class R6 | | | 6.14 | | | | N/A | | | | 3.84 | | | | 4/30/18 | |
| | 3 | | The Standardized Total Returns are average annual total returns or cumulative total returns (only if the performance period is one year or less) as of the most recent calendar quarter-end. They assume reinvestment of all distributions at NAV. These returns reflect a maximum initial sales charge of 5.5% for Class A Shares and the assumed contingent deferred sales charge for Class C Shares (1% if redeemed within 12 months of purchase). Because Institutional, Investor, Class P, Class R and Class R6 Shares do not involve a sales charge, such a charge is not applied to their Standardized Total Returns. |
The returns set forth in the tables above represent past performance. Past performance does not guarantee future results. The Fund’s investment return and principal value will fluctuate so that an investor’s shares, when redeemed, may be worth more or less than their original cost. Current performance may be lower or higher than the performance quoted above. Please visit our web site at www.GSAMFUNDS.com to obtain the most recentmonth-end returns. Performance reflects applicable fee waivers and/or expense limitations in effect during the periods shown. In their absence, performance would be reduced. Returns do not reflect the deduction of taxes that a shareholder would pay on Fund distributions or the redemption of Fund shares.
20
FUND BASICS
| | | | | | | | | | |
| | EXPENSE RATIOS4 | |
| | | |
| | | | | Net Expense Ratio (Current) | | | Gross Expense Ratio (Before Waivers) | |
| | | |
| | Class A | | | 1.59 | % | | | 1.79 | % |
| | Class C | | | 2.34 | | | | 2.54 | |
| | Institutional | | | 1.20 | | | | 1.40 | |
| | Investor | | | 1.34 | | | | 1.54 | |
| | Class P | | | 1.19 | | | | 1.39 | |
| | Class R | | | 1.84 | | | | 2.04 | |
| | | Class R6 | | | 1.19 | | | | 1.39 | |
| | 4 | | The expense ratios of the Fund, both current (net of applicable fee waivers and/or expense limitations) and before waivers (gross of applicable fee waivers and/or expense limitations) are as set forth above according to the most recent publicly available Prospectus for the Fund and may differ from the expense ratios disclosed in the Financial Highlights in this report. Pursuant to contractual arrangements, the Fund’s waivers and/or expense limitations will remain in place through at least April 30, 2020, and prior to such date the Investment Adviser may not terminate the arrangements without the approval of the Fund’s Board of Trustees. If these arrangements are discontinued in the future, the expense ratios may change without shareholder approval. |
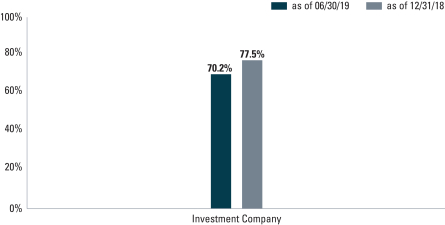
| | 5 | | The Fund is actively managed and, as such, its composition may differ over time. The percentage shown for each investment category reflects the value of investments in that category as a percentage of net assets. Figures in the above graph may not sum to 100% due to the exclusion of other assets and liabilities. Certain of the Fund’s investments reflected in the table above may be held for the purpose of covering derivative positions as required under the Investment Company Act of 1940, as amended, or for satisfying certain margin requirements related to such positions. The graph depicts the Fund’s investments but may not represent the Fund’s market exposure due to the exclusion of certain derivatives, if any, as listed in the Additional Investment Information section of the Schedule of Investments. |
21
GOLDMAN SACHS ABSOLUTE RETURN TRACKER FUND
Consolidated Schedule of Investments
June 30, 2019 (Unaudited)
| | | | | | | | |
Shares | | | Description | | Value | |
|
| Common Stocks – 29.6% | |
| Automobiles & Components – 0.5% | |
| | 3,400 | | | Aptiv plc | | $ | 274,822 | |
| | 2,300 | | | Aston Martin Lagonda Global Holdings plc* | | | 29,355 | |
| | 3,500 | | | Bayerische Motoren Werke AG | | | 258,711 | |
| | 19,200 | | | BorgWarner, Inc. | | | 806,016 | |
| | 1,400 | | | Bridgestone Corp. | | | 55,228 | |
| | 4,100 | | | Cie Generale des Etablissements Michelin SCA | | | 518,410 | |
| | 3,000 | | | Continental AG | | | 436,857 | |
| | 12,000 | | | Faurecia SA | | | 556,582 | |
| | 700 | | | Ferrari NV | | | 113,498 | |
| | 49,700 | | | Fiat Chrysler Automobiles NV | | | 689,758 | |
| | 104,900 | | | Ford Motor Co. | | | 1,073,127 | |
| | 77,800 | | | Garrett Motion, Inc.*(a) | | | 1,194,230 | |
| | 134,702 | | | General Motors Co. | | | 5,190,068 | |
| | 20,300 | | | Harley-Davidson, Inc. | | | 727,349 | |
| | 2,900 | | | Hella GmbH & Co. KGaA | | | 142,893 | |
| | 9,300 | | | Honda Motor Co. Ltd. | | | 240,487 | |
| | 8,800 | | | Isuzu Motors Ltd. | | | 100,505 | |
| | 300 | | | Koito Manufacturing Co. Ltd. | | | 16,055 | |
| | 11,100 | | | Mazda Motor Corp. | | | 114,901 | |
| | 2,700 | | | Mitsubishi Motors Corp. | | | 12,968 | |
| | 200 | | | Nifco, Inc. | | | 4,966 | |
| | 5,900 | | | Nissan Motor Co. Ltd. | | | 42,259 | |
| | 300 | | | NOK Corp. | | | 4,507 | |
| | 31,500 | | | Peugeot SA | | | 775,293 | |
| | 20,800 | | | Pirelli & C SpA | | | 122,780 | |
| | 3,100 | | | Renault SA(a) | | | 194,898 | |
| | 1,900 | | | Stanley Electric Co. Ltd. | | | 46,848 | |
| | 1,700 | | | Sumitomo Rubber Industries Ltd. | | | 19,690 | |
| | 2,000 | | | Suzuki Motor Corp. | | | 94,092 | |
| | 3,000 | | | TI Fluid Systems plc | | | 7,498 | |
| | 6,700 | | | Tokai Rika Co. Ltd. | | | 110,743 | |
| | 600 | | | TS Tech Co. Ltd. | | | 16,389 | |
| | 17,400 | | | Valeo SA | | | 566,473 | |
| | 2,000 | | | Yokohama Rubber Co. Ltd. (The) | | | 36,824 | |
| | | | | | | | |
| | | | | | | 14,595,080 | |
| | |
| Banks – 1.8% | |
| | 3,400 | | | 77 Bank Ltd. (The) | | | 50,125 | |
| | 181,000 | | | Banco Bilbao Vizcaya Argentaria SA | | | 1,009,560 | |
| | 165,600 | | | Banco Santander SA | | | 767,499 | |
| | 266,289 | | | Bank of America Corp. | | | 7,722,381 | |
| | 1,000 | | | Bank of Georgia Group plc | | | 19,024 | |
| | 6,900 | | | Bankinter SA | | | 47,562 | |
| | 315,400 | | | Barclays plc | | | 599,907 | |
| | 20,600 | | | BNP Paribas SA | | | 976,549 | |
| | 35,798 | | | CIT Group, Inc. | | | 1,880,827 | |
| | 43,100 | | | Citigroup, Inc. | | | 3,018,293 | |
| | 99,662 | | | Citizens Financial Group, Inc. | | | 3,524,048 | |
| | 34,000 | | | Comerica, Inc. | | | 2,469,760 | |
| | 90,300 | | | Credit Agricole SA | | | 1,077,525 | |
| | 13,300 | | | Cullen/Frost Bankers, Inc. | | | 1,245,678 | |
| | 200 | | | Daishi Hokuetsu Financial Group, Inc. | | | 5,131 | |
| | |
|
| Common Stocks – (continued) | |
| Banks – (continued) | |
| | 2,900 | | | Erste Group Bank AG | | | 107,544 | |
| | 29,700 | | | Fifth Third Bancorp | | | 828,630 | |
| | 35,200 | | | FinecoBank Banca Fineco SpA | | | 392,673 | |
| | 8,400 | | | Gunma Bank Ltd. (The) | | | 29,467 | |
| | 3,500 | | | Hiroshima Bank Ltd. (The) | | | 16,897 | |
| | 10,300 | | | Hokuhoku Financial Group, Inc. | | | 107,323 | |
| | 184,200 | | | HSBC Holdings plc | | | 1,537,382 | |
| | 43,300 | | | Huntington Bancshares, Inc. | | | 598,406 | |
| | 53,300 | | | ING Groep NV | | | 617,413 | |
| | 102,800 | | | JPMorgan Chase & Co. | | | 11,493,040 | |
| | 3,100 | | | KBC Group NV | | | 203,438 | |
| | 42,300 | | | KeyCorp | | | 750,825 | |
| | 1,014,300 | | | Lloyds Banking Group plc | | | 728,491 | |
| | 600 | | | M&T Bank Corp. | | | 102,042 | |
| | 25,800 | | | Mebuki Financial Group, Inc. | | | 67,419 | |
| | 58,800 | | | Mitsubishi UFJ Financial Group, Inc. | | | 280,063 | |
| | 13,600 | | | Nishi-Nippon Financial Holdings, Inc. | | | 98,073 | |
| | 33,700 | | | North Pacific Bank Ltd. | | | 80,267 | |
| | 3,300 | | | OneSavings Bank plc | | | 15,196 | |
| | 2,800 | | | Paragon Banking Group plc | | | 15,603 | |
| | 11,400 | | | PNC Financial Services Group, Inc. (The) | | | 1,564,992 | |
| | 24,900 | | | Raiffeisen Bank International AG | | | 584,669 | |
| | 62,600 | | | Regions Financial Corp. | | | 935,244 | |
| | 24,200 | | | Resona Holdings, Inc. | | | 100,952 | |
| | 63,500 | | | Royal Bank of Scotland Group plc | | | 177,109 | |
| | 2,700 | | | Shinsei Bank Ltd. | | | 42,018 | |
| | 1,400 | | | SVB Financial Group* | | | 314,426 | |
| | 300 | | | TBC Bank Group plc | | | 6,035 | |
| | 25,900 | | | Texas Capital Bancshares, Inc.* | | | 1,589,483 | |
| | 86,200 | | | UniCredit SpA | | | 1,061,021 | |
| | 333,800 | | | Unione di Banche Italiane SpA | | | 911,357 | |
| | 4,700 | | | US Bancorp | | | 246,280 | |
| | 96,430 | | | Wells Fargo & Co. | | | 4,563,068 | |
| | | | | | | | |
| | | | | | | 54,580,715 | |
| | |
| Capital Goods – 2.0% | |
| | 15,189 | | | 3M Co. | | | 2,632,861 | |
| | 3,800 | | | Aalberts NV | | | 149,159 | |
| | 12,200 | | | ACS Actividades de Construccion y Servicios SA | | | 488,110 | |
| | 300 | | | Aica Kogyo Co. Ltd. | | | 10,056 | |
| | 4,900 | | | Airbus SE | | | 693,456 | |
| | 4,277 | | | Allegion plc | | | 472,822 | |
| | 2,300 | | | Amada Holdings Co. Ltd. | | | 25,997 | |
| | 1,600 | | | AMETEK, Inc. | | | 145,344 | |
| | 1,100 | | | ANDRITZ AG | | | 41,414 | |
| | 34,600 | | | AO Smith Corp. | | | 1,631,736 | |
| | 900 | | | Bodycote plc | | | 9,459 | |
| | 16,654 | | | Boeing Co. (The) | | | 6,062,223 | |
| | 900 | | | Boskalis Westminster | | | 20,762 | |
| | 7,300 | | | Brenntag AG | | | 358,193 | |
| | 8,200 | | | Bunzl plc | | | 216,365 | |
| | 7,000 | | | Caterpillar, Inc. | | | 954,030 | |
| | |
| | |
| 22 | | The accompanying notes are an integral part of these financial statements. |
GOLDMAN SACHS ABSOLUTE RETURN TRACKER FUND
| | | | | | | | |
Shares | | | Description | | Value | |
|
| Common Stocks – (continued) | |
| Capital Goods – (continued) | |
| | 7,400 | | | Cie de Saint-Gobain | | $ | 288,968 | |
| | 34,400 | | | CNH Industrial NV | | | 353,400 | |
| | 10,700 | | | Cobham plc* | | | 14,482 | |
| | 1,400 | | | COMSYS Holdings Corp. | | | 35,576 | |
| | 7,100 | | | Cummins, Inc. | | | 1,216,514 | |
| | 500 | | | Daifuku Co. Ltd. | | | 28,242 | |
| | 700 | | | Daikin Industries Ltd. | | | 91,657 | |
| | 100 | | | Dassault Aviation SA | | | 143,729 | |
| | 2,100 | | | DCC plc | | | 187,344 | |
| | 600 | | | Diploma plc | | | 11,667 | |
| | 2,800 | | | DMG Mori Co. Ltd. | | | 45,107 | |
| | 10,500 | | | Eaton Corp. plc | | | 874,440 | |
| | 300 | | | Ebara Corp. | | | 8,178 | |
| | 3,800 | | | Eiffage SA | | | 375,552 | |
| | 4,600 | | | Emerson Electric Co. | | | 306,912 | |
| | 400 | | | FANUC Corp. | | | 74,325 | |
| | 8,900 | | | Fastenal Co. | | | 290,051 | |
| | 9,800 | | | Ferrovial SA | | | 250,866 | |
| | 4,400 | | | Fluor Corp. | | | 148,236 | |
| | 11,500 | | | Fortune Brands Home & Security, Inc. | | | 656,995 | |
| | 1,700 | | | Fuji Electric Co. Ltd. | | | 58,916 | |
| | 1,900 | | | Fujikura Ltd. | | | 7,172 | |
| | 800 | | | Furukawa Electric Co. Ltd. | | | 23,538 | |
| | 2,000 | | | Galliford Try plc | | | 16,023 | |
| | 500 | | | Glory Ltd. | | | 13,232 | |
| | 900 | | | GS Yuasa Corp. | | | 17,401 | |
| | 2,100 | | | Hanwa Co. Ltd. | | | 56,351 | |
| | 57,935 | | | HD Supply Holdings, Inc.* | | | 2,333,622 | |
| | 1,900 | | | HOCHTIEF AG | | | 231,388 | |
| | 25,500 | | | Honeywell International, Inc. | | | 4,452,045 | |
| | 100 | | | Hoshizaki Corp. | | | 7,457 | |
| | 1,500 | | | Huntington Ingalls Industries, Inc. | | | 337,110 | |
| | 800 | | | IHI Corp. | | | 19,340 | |
| | 2,300 | | | Illinois Tool Works, Inc. | | | 346,863 | |
| | 3,200 | | | IMCD NV | | | 293,539 | |
| | 2,900 | | | Ingersoll-Rand plc | | | 367,343 | |
| | 1,600 | | | Interpump Group SpA | | | 49,233 | |
| | 9,000 | | | ITOCHU Corp. | | | 172,413 | |
| | 2,000 | | | John Laing Group plc | | | 9,997 | |
| | 65,100 | | | Johnson Controls International plc | | | 2,689,281 | |
| | 3,700 | | | JTEKT Corp. | | | 44,989 | |
| | 3,300 | | | Kawasaki Heavy Industries Ltd. | | | 77,828 | |
| | 600 | | | Keihan Holdings Co. Ltd. | | | 26,178 | |
| | 2,300 | | | Kier Group plc | | | 3,106 | |
| | 2,000 | | | Kinden Corp. | | | 30,697 | |
| | 900 | | | Kingspan Group plc | | | 48,877 | |
| | 4,300 | | | KION Group AG | | | 271,936 | |
| | 700 | | | Knorr-Bremse AG | | | 78,005 | |
| | 2,800 | | | Kone OYJ Class B | | | 165,349 | |
| | 3,400 | | | Kyowa Exeo Corp. | | | 84,845 | |
| | 1,600 | | | Kyudenko Corp. | | | 48,179 | |
| | 1,000 | | | Legrand SA | | | 73,109 | |
| | 1,700 | | | LIXIL Group Corp. | | | 26,967 | |
| | 23,900 | | | Marubeni Corp. | | | 158,643 | |
| | 23,000 | | | Masco Corp. | | | 902,520 | |
| | |
|
| Common Stocks – (continued) | |
| Capital Goods – (continued) | |
| | 19,500 | | | Meggitt plc | | | 129,917 | |
| | 46,900 | | | Melrose Industries plc | | | 107,812 | |
| | 800 | | | Metso OYJ | | | 31,485 | |
| | 3,800 | | | MINEBEA MITSUMI, Inc. | | | 64,743 | |
| | 600 | | | MISUMI Group, Inc. | | | 15,124 | |
| | 7,000 | | | Mitsubishi Corp. | | | 184,978 | |
| | 2,500 | | | Mitsubishi Electric Corp. | | | 33,050 | |
| | 3,800 | | | Mitsubishi Heavy Industries Ltd. | | | 165,726 | |
| | 6,800 | | | Mitsui & Co. Ltd. | | | 110,996 | |
| | 5,600 | | | Mitsui E&S Holdings Co. Ltd. | | | 51,804 | |
| | 100 | | | Miura Co. Ltd. | | | 3,100 | |
| | 1,900 | | | MonotaRO Co. Ltd. | | | 46,543 | |
| | 7,100 | | | Morgan Advanced Materials plc | | | 25,066 | |
| | 1,200 | | | MTU Aero Engines AG | | | 286,213 | |
| | 2,600 | | | Nagase & Co. Ltd. | | | 39,086 | |
| | 400 | | | Nidec Corp. | | | 54,934 | |
| | 1,700 | | | NSK Ltd. | | | 15,195 | |
| | 100 | | | Okumura Corp. | | | 3,065 | |
| | 200 | | | OSG Corp. | | | 3,955 | |
| | 7,192 | | | Parker-Hannifin Corp. | | | 1,222,712 | |
| | 2,600 | | | Pentair plc | | | 96,720 | |
| | 1,200 | | | Polypipe Group plc | | | 6,740 | |
| | 4,800 | | | Prysmian SpA | | | 99,176 | |
| | 2,800 | | | QinetiQ Group plc | | | 9,949 | |
| | 147,013 | | | Quanta Services, Inc. | | | 5,614,426 | |
| | 11,400 | | | Rexel SA | | | 144,693 | |
| | 500 | | | Rheinmetall AG | | | 61,281 | |
| | 19,600 | | | Rolls-Royce Holdings plc* | | | 209,386 | |
| | 1,625,900 | | | Rolls-Royce Holdings plc (Preference)*,(b) | | | 2,065 | |
| | 455,400 | | | Rolls-Royce Holdings plc (Preference) Class C*,(b) | | | 578 | |
| | 1,000 | | | Roper Technologies, Inc. | | | 366,260 | |
| | 2,500 | | | Safran SA | | | 365,729 | |
| | 700 | | | Sanwa Holdings Corp. | | | 7,545 | |
| | 5,100 | | | Schneider Electric SE | | | 461,463 | |
| | 13,100 | | | Senior plc | | | 35,901 | |
| | 1,400 | | | Siemens Gamesa Renewable Energy SA | | | 23,269 | |
| | 4,800 | | | SIG plc | | | 7,901 | |
| | 10,500 | | | Signify NV | | | 310,428 | |
| | 100 | | | SMC Corp. | | | 37,488 | |
| | 4,500 | | | Snap-on, Inc. | | | 745,380 | |
| | 29,400 | | | Sojitz Corp. | | | 94,615 | |
| | 1,500 | | | Spirax-Sarco Engineering plc | | | 175,110 | |
| | 25,651 | | | Spirit AeroSystems Holdings, Inc. Class A | | | 2,087,222 | |
| | 9,900 | | | Sumitomo Corp. | | | 150,362 | |
| | 1,500 | | | Sumitomo Heavy Industries Ltd. | | | 51,822 | |
| | 3,800 | | | Sumitomo Mitsui Construction Co. Ltd. | | | 21,099 | |
| | 600 | | | Thales SA | | | 74,113 | |
| | 2,100 | | | THK Co. Ltd. | | | 50,512 | |
| | 3,500 | | | Toyota Tsusho Corp. | | | 106,319 | |
| | 5,100 | | | TransDigm Group, Inc.* | | | 2,467,380 | |
| | 5,200 | | | Travis Perkins plc | | | 84,103 | |
| | |
| | |
| The accompanying notes are an integral part of these financial statements. | | 23 |
GOLDMAN SACHS ABSOLUTE RETURN TRACKER FUND
Consolidated Schedule of Investments(continued)
June 30, 2019 (Unaudited)
| | | | | | | | |
Shares | | | Description | | Value | |
|
| Common Stocks – (continued) | |
| Capital Goods – (continued) | |
| | 700 | | | Ultra Electronics Holdings plc | | $ | 14,671 | |
| | 19,260 | | | United Rentals, Inc.* | | | 2,554,454 | |
| | 25,800 | | | United Technologies Corp. | | | 3,359,160 | |
| | 12,400 | | | Valmet OYJ | | | 309,347 | |
| | 15,500 | | | Valmont Industries, Inc. | | | 1,965,555 | |
| | 6,200 | | | Vesuvius plc | | | 43,148 | |
| | 5,600 | | | Vinci SA | | | 571,904 | |
| | 500 | | | WW Grainger, Inc. | | | 134,115 | |
| | | | | | | | |
| | | | | | | 58,374,613 | |
| | |
| Commercial & Professional Services – 0.5% | |
| | 4,500 | | | Aggreko plc | | | 45,178 | |
| | 7,200 | | | Cintas Corp. | | | 1,708,488 | |
| | 4,935 | | | Copart, Inc.* | | | 368,842 | |
| | 3,400 | | | Dai Nippon Printing Co. Ltd. | | | 72,614 | |
| | 500 | | | Duskin Co. Ltd. | | | 13,174 | |
| | 6,048 | | | Edenred | | | 308,233 | |
| | 9,000 | | | Elis SA | | | 163,231 | |
| | 600 | | | Equifax, Inc. | | | 81,144 | |
| | 8,700 | | | Experian plc | | | 263,519 | |
| | 16,300 | | | Hays plc | | | 32,566 | |
| | 1,700 | | | HomeServe plc | | | 25,617 | |
| | 8,100 | | | IHS Markit Ltd.* | | | 516,132 | |
| | 1,400 | | | Intertek Group plc | | | 97,874 | |
| | 7,900 | | | IWG plc | | | 34,161 | |
| | 2,700 | | | Kokuyo Co. Ltd. | | | 37,875 | |
| | 100 | | | Meitec Corp. | | | 5,146 | |
| | 41,300 | | | Nielsen Holdings plc | | | 933,380 | |
| | 200 | | | Nihon M&A Center, Inc. | | | 4,818 | |
| | 400 | | | Park24 Co. Ltd. | | | 9,339 | |
| | 1,900 | | | Persol Holdings Co. Ltd. | | | 44,794 | |
| | 4,200 | | | Randstad NV | | | 230,508 | |
| | 3,700 | | | Recruit Holdings Co. Ltd. | | | 123,883 | |
| | 9,600 | | | RELX plc | | | 232,843 | |
| | 22,200 | | | Rentokil Initial plc | | | 112,081 | |
| | 5,000 | | | Republic Services, Inc. | | | 433,200 | |
| | 16,225 | | | Robert Half International, Inc. | | | 924,987 | |
| | 14,550 | | | Rollins, Inc. | | | 521,908 | |
| | 500 | | | Secom Co. Ltd. | | | 43,085 | |
| | 6,500 | | | Serco Group plc* | | | 11,887 | |
| | 300 | | | Societe BIC SA | | | 22,852 | |
| | 7,300 | | | SPIE SA | | | 135,438 | |
| | 79,739 | | | Stericycle, Inc.* | | | 3,807,537 | |
| | 1,000 | | | Teleperformance | | | 200,357 | |
| | 2,700 | | | Toppan Printing Co. Ltd. | | | 41,057 | |
| | 5,484 | | | Verisk Analytics, Inc. | | | 803,187 | |
| | 8,900 | | | Waste Management, Inc. | | | 1,026,793 | |
| | 6,000 | | | Wolters Kluwer NV | | | 436,508 | |
| | | | | | | | |
| | | | | | | 13,874,236 | |
| | |
| Consumer Durables & Apparel – 0.5% | |
| | 3,200 | | | adidas AG | | | 989,984 | |
| | 800 | | | Asics Corp. | | | 8,688 | |
| | 700 | | | Bandai Namco Holdings, Inc. | | | 33,967 | |
| | 27,900 | | | Barratt Developments plc | | | 203,028 | |
| | 1,500 | | | Bellway plc | | | 53,053 | |
| | |
|
| Common Stocks – (continued) | |
| Consumer Durables & Apparel – (continued) | |
| | 2,500 | | | Berkeley Group Holdings plc | | | 118,484 | |
| | 3,900 | | | Burberry Group plc | | | 92,439 | |
| | 15,600 | | | Capri Holdings Ltd.* | | | 541,008 | |
| | 700 | | | Casio Computer Co. Ltd. | | | 8,728 | |
| | 700 | | | Coats Group plc | | | 728 | |
| | 12,200 | | | Countryside Properties plc | | | 46,273 | |
| | 300 | | | Games Workshop Group plc | | | 18,904 | |
| | 8,000 | | | Garmin Ltd. | | | 638,400 | |
| | 25,362 | | | Hanesbrands, Inc. | | | 436,734 | |
| | 2,600 | | | Hasbro, Inc. | | | 274,768 | |
| | 4,200 | | | Iida Group Holdings Co. Ltd. | | | 67,997 | |
| | 500 | | | Kering SA | | | 295,111 | |
| | 52,767 | | | Lennar Corp. Class A | | | 2,557,089 | |
| | 12,700 | | | Lululemon Athletica, Inc.* | | | 2,288,667 | |
| | 1,100 | | | LVMH Moet Hennessy Louis Vuitton SE | | | 467,638 | |
| | 13,401 | | | Mattel, Inc.*(a) | | | 150,225 | |
| | 6,500 | | | McCarthy & Stone plc | | | 11,276 | |
| | 4,100 | | | Mohawk Industries, Inc.* | | | 604,627 | |
| | 32,978 | | | Newell Brands, Inc. | | | 508,521 | |
| | 6,000 | | | Nikon Corp. | | | 85,318 | |
| | 4,200 | | | Panasonic Corp. | | | 35,083 | |
| | 22,830 | | | PulteGroup, Inc. | | | 721,885 | |
| | 6,200 | | | PVH Corp. | | | 586,768 | |
| | 4,000 | | | Ralph Lauren Corp. | | | 454,360 | |
| | 6,942 | | | Redrow plc | | | 48,074 | |
| | 100 | | | Rinnai Corp. | | | 6,370 | |
| | 200 | | | Sangetsu Corp. | | | 3,685 | |
| | 100 | | | Sankyo Co. Ltd. | | | 3,626 | |
| | 1,200 | | | SEB SA | | | 215,883 | |
| | 1,600 | | | Sekisui Chemical Co. Ltd. | | | 24,092 | |
| | 2,800 | | | Sekisui House Ltd. | | | 46,134 | |
| | 200 | | | Shimano, Inc. | | | 29,802 | |
| | 9,400 | | | Sony Corp. | | | 493,970 | |
| | 19,500 | | | Tapestry, Inc. | | | 618,735 | |
| | 30,700 | | | Taylor Wimpey plc | | | 61,604 | |
| | 200 | | | Ted Baker plc | | | 2,061 | |
| | 20,070 | | | Under Armour, Inc. Class A* | | | 508,774 | |
| | 22,261 | | | Under Armour, Inc. Class C* | | | 494,194 | |
| | 1,900 | | | VF Corp. | | | 165,965 | |
| | 200 | | | Wacoal Holdings Corp. | | | 5,197 | |
| | 1,300 | | | Whirlpool Corp. | | | 185,068 | |
| | 300 | | | Yamaha Corp. | | | 14,279 | |
| | | | | | | | |
| | | | | | | 15,227,264 | |
| | |
| Consumer Services – 0.8% | |
| | 1,600 | | | Accor SA | | | 68,681 | |
| | 48,300 | | | Aramark | | | 1,741,698 | |
| | 225,100 | | | Caesars Entertainment Corp.* | | | 2,660,682 | |
| | 1,300 | | | Chipotle Mexican Grill, Inc.* | | | 952,744 | |
| | 200 | | | Colowide Co. Ltd. | | | 3,835 | |
| | 16,300 | | | Compass Group plc | | | 390,740 | |
| | 3,701 | | | Darden Restaurants, Inc. | | | 450,523 | |
| | 2,500 | | | Domino’s Pizza Group plc | | | 8,844 | |
| | 7,000 | | | EI Group plc* | | | 17,477 | |
| | 111,700 | | | Extended Stay America, Inc. | | | 1,886,613 | |
| | |
| | |
| 24 | | The accompanying notes are an integral part of these financial statements. |
GOLDMAN SACHS ABSOLUTE RETURN TRACKER FUND
| | | | | | | | |
Shares | | | Description | | Value | |
|
| Common Stocks – (continued) | |
| Consumer Services – (continued) | |
| | 4,200 | | | Flutter Entertainment plc | | $ | 315,968 | |
| | 55,600 | | | frontdoor, Inc.* | | | 2,421,380 | |
| | 4,600 | | | Greene King plc | | | 36,080 | |
| | 700 | | | Greggs plc | | | 20,403 | |
| | 6,200 | | | GVC Holdings plc | | | 51,394 | |
| | 20,598 | | | H&R Block, Inc. | | | 603,521 | |
| | 400 | | | J D Wetherspoon plc | | | 7,254 | |
| | 10,500 | | | McDonald’s Corp. | | | 2,180,430 | |
| | 2,200 | | | Merlin Entertainments plc | | | 12,576 | |
| | 5,000 | | | Mitchells & Butlers plc* | | | 18,192 | |
| | 6,600 | | | Norwegian Cruise Line Holdings Ltd.* | | | 353,958 | |
| | 400 | | | Oriental Land Co. Ltd. | | | 49,623 | |
| | 9,400 | | | Playtech plc | | | 50,977 | |
| | 100 | | | Rank Group plc | | | 202 | |
| | 200 | | | Resorttrust, Inc. | | | 3,068 | |
| | 2,300 | | | Royal Caribbean Cruises Ltd. | | | 278,783 | |
| | 36,774 | | | Service Corp. International | | | 1,720,288 | |
| | 3,900 | | | Skylark Holdings Co. Ltd. | | | 68,158 | |
| | 3,400 | | | Sodexo SA | | | 397,439 | |
| | 5,842 | | | SSP Group plc | | | 50,916 | |
| | 55,800 | | | Starbucks Corp. | | | 4,677,714 | |
| | 13,400 | | | William Hill plc | | | 26,300 | |
| | 1,000 | | | Wynn Resorts Ltd. | | | 123,990 | |
| | 8,200 | | | Yum! Brands, Inc. | | | 907,494 | |
| | | | | | | | |
| | | | | | | 22,557,945 | |
| | |
| Diversified Financials – 0.9% | |
| | 8,600 | | | 3i Group plc | | | 121,672 | |
| | 900 | | | Acom Co. Ltd. | | | 3,248 | |
| | 300 | | | AEON Financial Service Co. Ltd. | | | 4,842 | |
| | 2,300 | | | AJ Bell plc | | | 11,713 | |
| | 72,144 | | | Ally Financial, Inc. | | | 2,235,743 | |
| | 4,200 | | | American Express Co. | | | 518,448 | |
| | 2,600 | | | Ameriprise Financial, Inc. | | | 377,416 | |
| | 200 | | | Amigo Holdings plc | | | 505 | |
| | 6,200 | | | Ashmore Group plc | | | 40,110 | |
| | 15,700 | | | Bank of New York Mellon Corp. (The) | | | 693,155 | |
| | 17,633 | | | Berkshire Hathaway, Inc. Class B* | | | 3,758,827 | |
| | 1,000 | | | Brewin Dolphin Holdings plc | | | 3,889 | |
| | 41,900 | | | Capital One Financial Corp. | | | 3,802,006 | |
| | 5,900 | | | Charles Schwab Corp. (The) | | | 237,121 | |
| | 800 | | | Close Brothers Group plc | | | 14,358 | |
| | 2,948 | | | Credit Acceptance Corp.* | | | 1,426,331 | |
| | 11,500 | | | Credit Saison Co. Ltd. | | | 134,967 | |
| | 1,500 | | | Deutsche Boerse AG | | | 211,755 | |
| | 10,700 | | | Discover Financial Services | | | 830,213 | |
| | 2,400 | | | E*TRADE Financial Corp. | | | 107,040 | |
| | 300 | | | Euronext NV | | | 22,698 | |
| | 5,600 | | | EXOR NV | | | 392,327 | |
| | 100 | | | GRENKE AG | | | 10,751 | |
| | 3,400 | | | Hargreaves Lansdown plc | | | 83,073 | |
| | 1,000 | | | Hitachi Capital Corp. | | | 22,282 | |
| | 1,100 | | | IG Group Holdings plc | | | 8,155 | |
| | 1,000 | | | IntegraFin Holdings plc | | | 4,826 | |
| | |
|
| Common Stocks – (continued) | |
| Diversified Financials – (continued) | |
| | 40,836 | | | Interactive Brokers Group, Inc. Class A | | | 2,213,311 | |
| | 1,600 | | | Intermediate Capital Group plc | | | 28,065 | |
| | 50,665 | | | Invesco Ltd. | | | 1,036,606 | |
| | 22,100 | | | Investec plc | | | 143,664 | |
| | 800 | | | Japan Exchange Group, Inc. | | | 12,741 | |
| | 4,800 | | | Jupiter Fund Management plc | | | 25,762 | |
| | 14,400 | | | Man Group plc | | | 28,472 | |
| | 1,000 | | | Matsui Securities Co. Ltd. | | | 9,446 | |
| | 15,900 | | | Mitsubishi UFJ Lease & Finance Co. Ltd. | | | 84,492 | |
| | 15,385 | | | Moody’s Corp. | | | 3,004,844 | |
| | 3,500 | | | MSCI, Inc. | | | 835,765 | |
| | 10,700 | | | ORIX Corp. | | | 159,910 | |
| | 3,900 | | | Plus500 Ltd. | | | 25,808 | |
| | 2,800 | | | Raymond James Financial, Inc. | | | 236,740 | |
| | 2,200 | | | S&P Global, Inc. | | | 501,138 | |
| | 600 | | | Sanne Group plc | | | 5,357 | |
| | 1,000 | | | SBI Holdings, Inc. | | | 24,838 | |
| | 1,500 | | | Schroders plc | | | 58,190 | |
| | 100 | | | Sofina SA | | | 19,082 | |
| | 7,100 | | | St James’s Place plc | | | 99,133 | |
| | 93,812 | | | Standard Life Aberdeen plc | | | 351,003 | |
| | 23,200 | | | State Street Corp. | | | 1,300,592 | |
| | 49,126 | | | Synchrony Financial | | | 1,703,198 | |
| | 3,400 | | | T. Rowe Price Group, Inc. | | | 373,014 | |
| | 100 | | | Tokyo Century Corp. | | | 4,232 | |
| | 100 | | | Zenkoku Hosho Co. Ltd. | | | 3,846 | |
| | | | | | | | |
| | | | | | | 27,366,720 | |
| | |
| Energy – 1.2% | |
| | 17,000 | | | Apache Corp. | | | 492,490 | |
| | 30,600 | | | Cairn Energy plc* | | | 67,496 | |
| | 26,530 | | | Cheniere Energy, Inc.* | | | 1,815,978 | |
| | 22,300 | | | Chevron Corp. | | | 2,775,012 | |
| | 2,600 | | | Cimarex Energy Co. | | | 154,258 | |
| | 26,200 | | | ConocoPhillips | | | 1,598,200 | |
| | 1,000 | | | Cosmo Energy Holdings Co. Ltd. | | | 22,663 | |
| | 49,700 | | | Devon Energy Corp. | | | 1,417,444 | |
| | 2,100 | | | Enagas SA | | | 56,042 | |
| | 400 | | | Energean Oil & Gas plc* | | | 4,221 | |
| | 37,900 | | | Eni SpA | | | 630,176 | |
| | 3,871 | | | EOG Resources, Inc. | | | 360,622 | |
| | 56,600 | | | HollyFrontier Corp. | | | 2,619,448 | |
| | 1,200 | | | Idemitsu Kosan Co. Ltd. | | | 36,294 | |
| | 100 | | | Iwatani Corp. | | | 3,475 | |
| | 50,700 | | | John Wood Group plc | | | 291,929 | |
| | 15,200 | | | JXTG Holdings, Inc. | | | 75,755 | |
| | 125,797 | | | Kinder Morgan, Inc. | | | 2,626,641 | |
| | 45,500 | | | Marathon Petroleum Corp. | | | 2,542,540 | |
| | 9,900 | | | Neste OYJ | | | 336,575 | |
| | 24,700 | | | ONEOK, Inc. | | | 1,699,607 | |
| | 8,700 | | | Petrofac Ltd. | | | 47,592 | |
| | 20,400 | | | Phillips 66 | | | 1,908,216 | |
| | 2,900 | | | Pioneer Natural Resources Co. | | | 446,194 | |
| | 186,800 | | | Premier Oil plc* | | | 183,262 | |
| | |
| | |
| The accompanying notes are an integral part of these financial statements. | | 25 |
GOLDMAN SACHS ABSOLUTE RETURN TRACKER FUND
Consolidated Schedule of Investments(continued)
June 30, 2019 (Unaudited)
| | | | | | | | |
Shares | | | Description | | Value | |
|
| Common Stocks – (continued) | |
| Energy – (continued) | |
| | 401,001 | | | Range Resources Corp. | | $ | 2,798,987 | |
| | 31,200 | | | Repsol SA | | | 489,617 | |
| | 56,300 | | | Royal Dutch Shell plc Class A | | | 1,837,497 | |
| | 60,300 | | | Saipem SpA* | | | 300,919 | |
| | 4,300 | | | SBM Offshore NV | | | 83,009 | |
| | 52,000 | | | Snam SpA | | | 258,691 | |
| | 42,600 | | | Targa Resources Corp. | | | 1,672,476 | |
| | 30,600 | | | TOTAL SA | | | 1,716,470 | |
| | 81,300 | | | Tullow Oil plc | | | 217,490 | |
| | 16,200 | | | Valero Energy Corp. | | | 1,386,882 | |
| | 86,947 | | | Williams Cos., Inc. (The) | | | 2,437,994 | |
| | | | | | | | |
| | | | | | | 35,412,162 | |
| | |
| Food & Staples Retailing – 0.6% | |
| | 1,000 | | | Aeon Co. Ltd. | | | 17,209 | |
| | 500 | | | Ain Holdings, Inc. | | | 29,111 | |
| | 25,600 | | | Carrefour SA(a) | | | 494,284 | |
| | 6,300 | | | Casino Guichard Perrachon SA(a) | | | 214,912 | |
| | 2,900 | | | Colruyt SA | | | 168,356 | |
| | 9,600 | | | Costco Wholesale Corp. | | | 2,536,896 | |
| | 77,200 | | | J Sainsbury plc | | | 191,842 | |
| | 32,200 | | | Jeronimo Martins SGPS SA | | | 519,037 | |
| | 41,300 | | | Koninklijke Ahold Delhaize NV | | | 927,172 | |
| | 63,000 | | | Kroger Co. (The) | | | 1,367,730 | |
| | 1,400 | | | Lawson, Inc. | | | 67,259 | |
| | 43,900 | | | METRO AG(a) | | | 802,174 | |
| | 4,400 | | | Seven & i Holdings Co. Ltd. | | | 149,078 | |
| | 2,000 | | | Sundrug Co. Ltd. | | | 54,241 | |
| | 20,600 | | | Sysco Corp. | | | 1,456,832 | |
| | 268,000 | | | Tesco plc | | | 772,557 | |
| | 800 | | | Tsuruha Holdings, Inc. | | | 74,195 | |
| | 110,464 | | | US Foods Holding Corp.* | | | 3,950,193 | |
| | 500 | | | Valor Holdings Co. Ltd. | | | 10,406 | |
| | 28,100 | | | Walgreens Boots Alliance, Inc. | | | 1,536,227 | |
| | 24,100 | | | Walmart, Inc. | | | 2,662,809 | |
| | 1,600 | | | Welcia Holdings Co. Ltd. | | | 65,279 | |
| | 121,900 | | | Wm Morrison Supermarkets plc | | | 312,023 | |
| | | | | | | | |
| | | | | | | 18,379,822 | |
| | |
| Food, Beverage & Tobacco – 0.8% | |
| | 600 | | | AG Barr plc | | | 7,064 | |
| | 3,100 | | | Ajinomoto Co., Inc. | | | 53,781 | |
| | 16,000 | | | Archer-Daniels-Midland Co. | | | 652,800 | |
| | 2,200 | | | Asahi Group Holdings Ltd. | | | 99,041 | |
| | 3,500 | | | Associated British Foods plc | | | 109,569 | |
| | 300 | | | Bakkavor Group plc | | | 456 | |
| | 40,100 | | | British American Tobacco plc | | | 1,400,130 | |
| | 2,400 | | | Britvic plc | | | 27,078 | |
| | 6,400 | | | Brown-Forman Corp. Class B | | | 354,752 | |
| | 200 | | | Calbee, Inc. | | | 5,402 | |
| | 31,100 | | | Campbell Soup Co. | | | 1,246,177 | |
| | 200 | | | Coca-Cola Bottlers Japan Holdings, Inc. | | | 5,073 | |
| | 23,300 | | | Coca-Cola Co. (The) | | | 1,186,436 | |
| | 2,600 | | | Coca-Cola HBC AG* | | | 98,215 | |
| | 24,212 | | | Conagra Brands, Inc. | | | 642,102 | |
| | |
|
| Common Stocks – (continued) | |
| Food, Beverage & Tobacco – (continued) | |
| | 1,400 | | | Constellation Brands, Inc. Class A | | | 275,716 | |
| | 300 | | | Cranswick plc | | | 9,845 | |
| | 12,800 | | | Danone SA | | | 1,083,804 | |
| | 25,300 | | | Davide Campari-Milano SpA | | | 247,855 | |
| | 11,000 | | | Diageo plc | | | 473,443 | |
| | 100 | | | Ezaki Glico Co. Ltd. | | | 4,458 | |
| | 61,455 | | | General Mills, Inc. | | | 3,227,617 | |
| | 6,900 | | | Glanbia plc | | | 112,198 | |
| | 32,300 | | | Greencore Group plc | | | 89,832 | |
| | 3,800 | | | Heineken NV | | | 423,519 | |
| | 5,100 | | | Hershey Co. (The) | | | 683,553 | |
| | 4,170 | | | Hormel Foods Corp. | | | 169,052 | |
| | 200 | | | Ito En Ltd. | | | 9,334 | |
| | 7,700 | | | JM Smucker Co. (The) | | | 886,963 | |
| | 3,100 | | | Kellogg Co. | | | 166,067 | |
| | 400 | | | Kewpie Corp. | | | 8,842 | |
| | 600 | | | Kikkoman Corp. | | | 26,164 | |
| | 3,300 | | | Kirin Holdings Co. Ltd. | | | 71,255 | |
| | 12,300 | | | Kraft Heinz Co. (The) | | | 381,792 | |
| | 6,845 | | | McCormick & Co., Inc.(Non-Voting) | | | 1,061,043 | |
| | 1,400 | | | Megmilk Snow Brand Co. Ltd. | | | 30,743 | |
| | 400 | | | MEIJI Holdings Co. Ltd. | | | 28,600 | |
| | 21,132 | | | Molson Coors Brewing Co. Class B | | | 1,183,392 | |
| | 31,614 | | | Mondelez International, Inc. Class A | | | 1,703,995 | |
| | 5,900 | | | Monster Beverage Corp.* | | | 376,597 | |
| | 200 | | | Morinaga & Co. Ltd. | | | 9,754 | |
| | 700 | | | Nichirei Corp. | | | 16,619 | |
| | 8,600 | | | Nippon Suisan Kaisha Ltd. | | | 53,376 | |
| | 1,300 | | | Nisshin Seifun Group, Inc. | | | 29,690 | |
| | 100 | | | Nissin Foods Holdings Co. Ltd. | | | 6,450 | |
| | 11,900 | | | PepsiCo, Inc. | | | 1,560,447 | |
| | 1,000 | | | Pernod Ricard SA | | | 184,176 | |
| | 1,700 | | | Sapporo Holdings Ltd. | | | 35,834 | |
| | 700 | | | Suntory Beverage & Food Ltd. | | | 30,437 | |
| | 4,600 | | | Tate & Lyle plc | | | 43,123 | |
| | 300 | | | Toyo Suisan Kaisha Ltd. | | | 12,366 | |
| | 36,700 | | | Tyson Foods, Inc. Class A | | | 2,963,158 | |
| | 700 | | | Viscofan SA | | | 36,693 | |
| | 300 | | | Yakult Honsha Co. Ltd. | | | 17,706 | |
| | 400 | | | Yamazaki Baking Co. Ltd. | | | 6,056 | |
| | | | | | | | |
| | | | | | | 23,629,640 | |
| | |
| Health Care Equipment & Services – 1.8% | |
| | 60,200 | | | Abbott Laboratories | | | 5,062,820 | |
| | 3,700 | | | Alfresa Holdings Corp. | | | 91,505 | |
| | 14,453 | | | AmerisourceBergen Corp. | | | 1,232,263 | |
| | 14,707 | | | Anthem, Inc. | | | 4,150,462 | |
| | 1,200 | | | Asahi Intecc Co. Ltd. | | | 29,663 | |
| | 8,078 | | | Becton Dickinson and Co. | | | 2,035,737 | |
| | 38,490 | | | Boston Scientific Corp.* | | | 1,654,300 | |
| | 31,800 | | | Cardinal Health, Inc. | | | 1,497,780 | |
| | 2,100 | | | Carl Zeiss Meditec AG | | | 207,124 | |
| | 7,800 | | | Centene Corp.* | | | 409,032 | |
| | |
| | |
| 26 | | The accompanying notes are an integral part of these financial statements. |
GOLDMAN SACHS ABSOLUTE RETURN TRACKER FUND
| | | | | | | | |
Shares | | | Description | | Value | |
|
| Common Stocks – (continued) | |
| Health Care Equipment & Services – (continued) | |
| | 10,100 | | | Cerner Corp. | | $ | 740,330 | |
| | 11,700 | | | Cigna Corp. | | | 1,843,335 | |
| | 114,000 | | | ConvaTec Group plc | | | 211,228 | |
| | 3,200 | | | Cooper Cos., Inc. (The) | | | 1,078,048 | |
| | 70,700 | | | CVS Health Corp. | | | 3,852,443 | |
| | 27,721 | | | Danaher Corp. | | | 3,961,885 | |
| | 16,200 | | | DaVita, Inc.* | | | 911,412 | |
| | 5,100 | | | DENTSPLY SIRONA, Inc. | | | 297,636 | |
| | 1,100 | | | Edwards Lifesciences Corp.* | | | 203,214 | |
| | 4,000 | | | Fresenius Medical Care AG & Co. KGaA | | | 314,133 | |
| | 12,600 | | | Fresenius SE & Co. KGaA | | | 684,180 | |
| | 18,100 | | | HCA Healthcare, Inc. | | | 2,446,577 | |
| | 25,200 | | | Henry Schein, Inc.* | | | 1,761,480 | |
| | 9,900 | | | Hologic, Inc.* | | | 475,398 | |
| | 1,300 | | | Hoya Corp. | | | 99,910 | |
| | 10,800 | | | Koninklijke Philips NV | | | 469,540 | |
| | 6,187 | | | Laboratory Corp. of America Holdings* | | | 1,069,732 | |
| | 14,600 | | | McKesson Corp. | | | 1,962,094 | |
| | 19,800 | | | Mediclinic International plc | | | 76,659 | |
| | 3,600 | | | Medipal Holdings Corp. | | | 79,627 | |
| | 41,700 | | | Medtronic plc | | | 4,061,163 | |
| | 200 | | | Nihon Kohden Corp. | | | 5,434 | |
| | 4,000 | | | Olympus Corp. | | | 44,516 | |
| | 15,100 | | | Quest Diagnostics, Inc. | | | 1,537,331 | |
| | 600 | | | Siemens Healthineers AG | | | 25,283 | |
| | 3,700 | | | Smith & Nephew plc | | | 80,344 | |
| | 1,600 | | | Suzuken Co. Ltd. | | | 94,022 | |
| | 800 | | | Terumo Corp. | | | 23,899 | |
| | 1,800 | | | Toho Holdings Co. Ltd. | | | 40,389 | |
| | 19,900 | | | UnitedHealth Group, Inc. | | | 4,855,799 | |
| | 9,800 | | | Universal Health Services, Inc. Class B | | | 1,277,822 | |
| | 18,900 | | | Zimmer Biomet Holdings, Inc. | | | 2,225,286 | |
| | | | | | | | |
| | | | | | | 53,180,835 | |
| | |
| Household & Personal Products – 0.2% | |
| | 1,300 | | | Beiersdorf AG | | | 155,878 | |
| | 11,200 | | | Church & Dwight Co., Inc. | | | 818,272 | |
| | 2,900 | | | Clorox Co. (The) | | | 444,019 | |
| | 4,000 | | | Colgate-Palmolive Co. | | | 286,680 | |
| | 30,595 | | | Coty, Inc. Class A | | | 409,973 | |
| | 1,100 | | | Fancl Corp. | | | 27,209 | |
| | 600 | | | Kao Corp. | | | 45,783 | |
| | 4,900 | | | Kimberly-Clark Corp. | | | 653,072 | |
| | 400 | | | Lion Corp. | | | 7,462 | |
| | 2,600 | | | L’Oreal SA | | | 739,253 | |
| | 100 | | | Pola Orbis Holdings, Inc. | | | 2,802 | |
| | 15,600 | | | Procter & Gamble Co. (The) | | | 1,710,540 | |
| | 1,700 | | | PZ Cussons plc | | | 4,620 | |
| | 2,400 | | | Reckitt Benckiser Group plc | | | 189,491 | |
| | 500 | | | Shiseido Co. Ltd. | | | 37,819 | |
| | 1,500 | | | Unicharm Corp. | | | 45,223 | |
| | 5,300 | | | Unilever plc | | | 328,999 | |
| | | | | | | | |
| | | | | | | 5,907,095 | |
| | |
|
| Common Stocks – (continued) | |
| Insurance – 0.7% | |
| | 2,400 | | | Admiral Group plc | | | 67,299 | |
| | 857 | | | Aegon NV | | | 4,257 | |
| | 2,200 | | | Ageas | | | 114,489 | |
| | 3,300 | | | Allianz SE (Registered) | | | 795,882 | |
| | 10,100 | | | Allstate Corp. (The) | | | 1,027,069 | |
| | 5,712 | | | Aon plc | | | 1,102,302 | |
| | 5,600 | | | Arthur J Gallagher & Co. | | | 490,504 | |
| | 1,300 | | | ASR Nederland NV | | | 52,821 | |
| | 18,300 | | | Assicurazioni Generali SpA | | | 344,545 | |
| | 1,200 | | | Assurant, Inc. | | | 127,656 | |
| | 89,600 | | | Aviva plc | | | 474,572 | |
| | 50,855 | | | Brighthouse Financial, Inc.* | | | 1,865,870 | |
| | 2,900 | | | Cincinnati Financial Corp. | | | 300,643 | |
| | 18,500 | | | CNP Assurances | | | 419,920 | |
| | 6,800 | | | Dai-ichi Life Holdings, Inc. | | | 102,882 | |
| | 16,300 | | | Direct Line Insurance Group plc | | | 68,709 | |
| | 1,900 | | | Hannover Rueck SE | | | 307,217 | |
| | 18,500 | | | Hartford Financial Services Group, Inc. (The) | | | 1,030,820 | |
| | 600 | | | Hiscox Ltd. | | | 12,891 | |
| | 6,400 | | | Japan Post Holdings Co. Ltd. | | | 72,480 | |
| | 4,700 | | | Japan Post Insurance Co. Ltd. | | | 87,195 | |
| | 600 | | | Lancashire Holdings Ltd. | | | 5,253 | |
| | 68,900 | | | Legal & General Group plc | | | 236,052 | |
| | 27,000 | | | Lincoln National Corp. | | | 1,740,150 | |
| | 5,100 | | | Marsh & McLennan Cos., Inc. | | | 508,725 | |
| | 43,300 | | | MetLife, Inc. | | | 2,150,711 | |
| | 600 | | | MS&AD Insurance Group Holdings, Inc. | | | 19,072 | |
| | 1,300 | | | Muenchener Rueckversicherungs-Gesellschaft AG in Muenchen (Registered) | | | 325,855 | |
| | 8,216 | | | NN Group NV | | | 330,274 | |
| | 23,000 | | | Phoenix Group Holdings plc | | | 207,422 | |
| | 30,300 | | | Poste Italiane SpA | | | 319,292 | |
| | 26,500 | | | Principal Financial Group, Inc. | | | 1,534,880 | |
| | 12,400 | | | Progressive Corp. (The) | | | 991,132 | |
| | 18,500 | | | Prudential Financial, Inc. | | | 1,868,500 | |
| | 17,900 | | | Prudential plc | | | 390,774 | |
| | 1,100 | | | Sabre Insurance Group plc | | | 3,814 | |
| | 3,200 | | | Sampo OYJ Class A | | | 151,054 | |
| | 4,900 | | | SCOR SE | | | 214,810 | |
| | 600 | | | Sompo Holdings, Inc. | | | 23,209 | |
| | 1,000 | | | Sony Financial Holdings, Inc. | | | 24,065 | |
| | 2,100 | | | Tokio Marine Holdings, Inc. | | | 105,368 | |
| | 28,500 | | | Unum Group | | | 956,175 | |
| | 1,600 | | | Willis Towers Watson plc | | | 306,464 | |
| | | | | | | | |
| | | | | | | 21,283,074 | |
| | |
| Materials – 1.3% | |
| | 3,900 | | | Acacia Mining plc* | | | 8,781 | |
| | 2,800 | | | Air Liquide SA | | | 391,631 | |
| | 1,700 | | | Air Products & Chemicals, Inc. | | | 384,829 | |
| | 200 | | | Air Water, Inc. | | | 3,434 | |
| | 5,677 | | | Akzo Nobel NV | | | 533,469 | |
| | 34,000 | | | Anglo American plc | | | 971,327 | |
| | |
| | |
| The accompanying notes are an integral part of these financial statements. | | 27 |
GOLDMAN SACHS ABSOLUTE RETURN TRACKER FUND
Consolidated Schedule of Investments(continued)
June 30, 2019 (Unaudited)
| | | | | | | | |
Shares | | | Description | | Value | |
|
| Common Stocks – (continued) | |
| Materials – (continued) | |
| | 26,500 | | | ArcelorMittal | | $ | 474,031 | |
| | 4,500 | | | Arkema SA | | | 418,340 | |
| | 4,700 | | | Asahi Kasei Corp. | | | 50,246 | |
| | 900 | | | Aurubis AG | | | 43,957 | |
| | 16,300 | | | Ball Corp. | | | 1,140,837 | |
| | 33,900 | | | BHP Group plc | | | 866,971 | |
| | 28,800 | | | Celanese Corp. | | | 3,104,640 | |
| | 10,300 | | | CF Industries Holdings, Inc. | | | 481,113 | |
| | 29,166 | | | Corteva, Inc.* | | | 862,439 | |
| | 10,700 | | | Covestro AG | | | 544,732 | |
| | 19,900 | | | CRH plc | | | 650,435 | |
| | 1,261 | | | Croda International plc | | | 82,023 | |
| | 1,500 | | | Daicel Corp. | | | 13,368 | |
| | 1,000 | | | DIC Corp. | | | 26,479 | |
| | 1,300 | | | Dowa Holdings Co. Ltd. | | | 41,788 | |
| | 29,166 | | | DuPont de Nemours, Inc. | | | 2,189,492 | |
| | 7,385 | | | Eastman Chemical Co. | | | 574,774 | |
| | 4,300 | | | Ecolab, Inc. | | | 848,992 | |
| | 1,900 | | | Essentra plc | | | 10,325 | |
| | 5,800 | | | Evonik Industries AG | | | 169,000 | |
| | 25,000 | | | Evraz plc | | | 211,684 | |
| | 25,200 | | | Ferrexpo plc | | | 89,067 | |
| | 20,600 | | | FMC Corp. | | | 1,708,770 | |
| | 49,200 | | | Freeport-McMoRan, Inc. | | | 571,212 | |
| | 203,900 | | | Glencore plc* | | | 705,683 | |
| | 116,100 | | | Graphic Packaging Holding Co. | | | 1,623,078 | |
| | 5,500 | | | HeidelbergCement AG | | | 445,090 | |
| | 100 | | | Hill & Smith Holdings plc | | | 1,487 | |
| | 1,000 | | | Hitachi Chemical Co. Ltd. | | | 27,256 | |
| | 1,700 | | | Hitachi Metals Ltd. | | | 19,277 | |
| | 16,600 | | | Hochschild Mining plc | | | 40,350 | |
| | 5,500 | | | Imerys SA | | | 291,564 | |
| | 12,200 | | | International Paper Co. | | | 528,504 | |
| | 3,000 | | | Koninklijke DSM NV | | | 370,153 | |
| | 500 | | | Kuraray Co. Ltd. | | | 5,990 | |
| | 9,147 | | | Linde plc | | | 1,836,718 | |
| | 200 | | | Lintec Corp. | | | 4,175 | |
| | 7,800 | | | LyondellBasell Industries NV Class A | | | 671,814 | |
| | 1,900 | | | Marshalls plc | | | 16,468 | |
| | 16,200 | | | Martin Marietta Materials, Inc. | | | 3,727,782 | |
| | 11,600 | | | Mitsubishi Chemical Holdings Corp. | | | 81,215 | |
| | 2,700 | | | Mitsubishi Gas Chemical Co., Inc. | | | 36,113 | |
| | 2,400 | | | Mitsubishi Materials Corp. | | | 68,373 | |
| | 2,000 | | | Mitsui Chemicals, Inc. | | | 49,689 | |
| | 1,400 | | | Mitsui Mining & Smelting Co. Ltd. | | | 33,653 | |
| | 11,000 | | | Mosaic Co. (The) | | | 275,330 | |
| | 100 | | | Nihon Parkerizing Co. Ltd. | | | 1,112 | |
| | 10,400 | | | Nippon Light Metal Holdings Co. Ltd. | | | 22,546 | |
| | 300 | | | Nippon Paint Holdings Co. Ltd. | | | 11,679 | |
| | 1,100 | | | Nippon Paper Industries Co. Ltd. | | | 19,507 | |
| | 300 | | | Nippon Shokubai Co. Ltd. | | | 19,887 | |
| | 400 | | | Nissan Chemical Corp. | | | 18,071 | |
| | 500 | | | Nitto Denko Corp. | | | 24,748 | |
| | |
|
| Common Stocks – (continued) | |
| Materials – (continued) | |
| | 800 | | | NOF Corp. | | | 29,893 | |
| | 11,700 | | | Nucor Corp. | | | 644,670 | |
| | 9,400 | | | Oji Holdings Corp. | | | 54,450 | |
| | 134,974 | | | Owens-Illinois, Inc. | | | 2,331,001 | |
| | 2,200 | | | Packaging Corp. of America | | | 209,704 | |
| | 2,000 | | | Polymetal International plc | | | 25,359 | |
| | 4,100 | | | PPG Industries, Inc. | | | 478,511 | |
| | 2,700 | | | Rengo Co. Ltd. | | | 21,738 | |
| | 1,300 | | | Rhi Magnesita NV | | | 79,794 | |
| | 6,300 | | | Rio Tinto plc | | | 389,927 | |
| | 6,800 | | | Sealed Air Corp. | | | 290,904 | |
| | 4,000 | | | Sherwin-Williams Co. (The) | | | 1,833,160 | |
| | 1,800 | | | Showa Denko KK | | | 53,268 | |
| | 17,200 | | | Smurfit Kappa Group plc | | | 520,880 | |
| | 2,100 | | | Solvay SA | | | 218,086 | |
| | 5,400 | | | Stora Enso OYJ Class R | | | 63,545 | |
| | 320 | | | Sumitomo Bakelite Co. Ltd. | | | 11,456 | |
| | 1,700 | | | Sumitomo Metal Mining Co. Ltd. | | | 50,960 | |
| | 100 | | | Sumitomo Osaka Cement Co. Ltd. | | | 3,981 | |
| | 1,800 | | | Symrise AG | | | 173,322 | |
| | 1,300 | | | Taiheiyo Cement Corp. | | | 39,469 | |
| | 800 | | | Taiyo Nippon Sanso Corp. | | | 17,033 | |
| | 1,800 | | | Teijin Ltd. | | | 30,752 | |
| | 800 | | | Toagosei Co. Ltd. | | | 8,428 | |
| | 1,600 | | | Tokai Carbon Co. Ltd. | | | 16,797 | |
| | 1,400 | | | Tokuyama Corp. | | | 37,975 | |
| | 300 | | | Tokyo Ohka Kogyo Co. Ltd. | | | 9,404 | |
| | 2,600 | | | Toray Industries, Inc. | | | 19,753 | |
| | 1,800 | | | Toyo Seikan Group Holdings Ltd. | | | 35,789 | |
| | 11,600 | | | UPM-Kymmene OYJ | | | 308,642 | |
| | 1,200 | | | voestalpine AG | | | 37,098 | |
| | 900 | | | Vulcan Materials Co. | | | 123,579 | |
| | 17,300 | | | Westrock Co. | | | 630,931 | |
| | 3,700 | | | Wienerberger AG | | | 91,298 | |
| | 800 | | | Yamato Kogyo Co. Ltd. | | | 23,405 | |
| | 3,000 | | | Zeon Corp. | | | 33,471 | |
| | | | | | | | |
| | | | | | | 37,393,931 | |
| | |
| Media & Entertainment – 2.8% | |
| | 71,312 | | | Activision Blizzard, Inc. | | | 3,365,926 | |
| | 9,836 | | | Alphabet, Inc. Class A* | | | 10,650,421 | |
| | 7,135 | | | Alphabet, Inc. Class C* | | | 7,712,293 | |
| | 13,400 | | | Auto Trader Group plc | | | 93,328 | |
| | 600 | | | Axel Springer SE | | | 42,266 | |
| | 300 | | | Capcom Co. Ltd. | | | 6,039 | |
| | 11,500 | | | CBS Corp.(Non-Voting) Class B | | | 573,850 | |
| | 3,000 | | | Charter Communications, Inc. Class A* | | | 1,185,540 | |
| | 17,100 | | | Cineworld Group plc | | | 55,015 | |
| | 187,460 | | | Comcast Corp. Class A | | | 7,925,809 | |
| | 600 | | | CyberAgent, Inc. | | | 21,865 | |
| | 100 | | | Daiichikosho Co. Ltd. | | | 4,665 | |
| | 62,190 | | | Discovery, Inc. Class A* | | | 1,909,233 | |
| | 67,900 | | | Discovery, Inc. Class C* | | | 1,931,755 | |
| | 50,800 | | | Electronic Arts, Inc.* | | | 5,144,008 | |
| | 5,500 | | | Entertainment One Ltd. | | | 27,780 | |
| | |
| | |
| 28 | | The accompanying notes are an integral part of these financial statements. |
GOLDMAN SACHS ABSOLUTE RETURN TRACKER FUND
| | | | | | | | |
Shares | | | Description | | Value | |
|
| Common Stocks – (continued) | |
| Media & Entertainment – (continued) | |
| | 300 | | | Euromoney Institutional Investor plc | | $ | 4,960 | |
| | 1,000 | | | Eutelsat Communications SA | | | 18,676 | |
| | 71,181 | | | Facebook, Inc. Class A* | | | 13,737,933 | |
| | 18,300 | | | Fox Corp. Class A | | | 670,512 | |
| | 16,800 | | | Fox Corp. Class B | | | 613,704 | |
| | 10,900 | | | Fuji Media Holdings, Inc. | | | 152,248 | |
| | 770 | | | GungHo Online Entertainment, Inc. | | | 21,384 | |
| | 5,400 | | | Hakuhodo DY Holdings, Inc. | | | 91,210 | |
| | 48,000 | | | Interpublic Group of Cos., Inc. (The) | | | 1,084,320 | |
| | 1,000 | | | Kakaku.com, Inc. | | | 19,340 | |
| | 13,800 | | | Liberty Broadband Corp. Class C* | | | 1,438,236 | |
| | 9,100 | | | Liberty Media Corp-Liberty Formula One Class A* | | | 326,326 | |
| | 400 | | | LINE Corp.* | | | 11,250 | |
| | 55,138 | | | Live Nation Entertainment, Inc.* | | | 3,652,892 | |
| | 14,100 | | | Netflix, Inc.* | | | 5,179,212 | |
| | 199,700 | | | News Corp. Class A | | | 2,693,953 | |
| | 18,809 | | | News Corp. Class B | | | 262,574 | |
| | 600 | | | Nexon Co. Ltd.* | | | 8,766 | |
| | 10,600 | | | Nippon Television Holdings, Inc. | | | 157,271 | |
| | 14,400 | | | Omnicom Group, Inc. | | | 1,180,080 | |
| | 8,800 | | | Pearson plc | | | 91,556 | |
| | 8,900 | | | ProSiebenSat.1 Media SE | | | 139,423 | |
| | 6,400 | | | Publicis Groupe SA(a) | | | 337,797 | |
| | 6,700 | | | Rightmove plc | | | 45,580 | |
| | 900 | | | Scout24 AG | | | 47,813 | |
| | 1,900 | | | Take-Two Interactive Software, Inc.* | | | 215,707 | |
| | 600 | | | Telenet Group Holding NV | | | 33,434 | |
| | 600 | | | Toho Co. Ltd. | | | 25,562 | |
| | 18,595 | | | TripAdvisor, Inc.* | | | 860,763 | |
| | 6,300 | | | TV Asahi Holdings Corp. | | | 101,810 | |
| | 700 | | | Ubisoft Entertainment SA* | | | 54,746 | |
| | 64,101 | | | Viacom, Inc. Class B | | | 1,914,697 | |
| | 41,945 | | | Walt Disney Co. (The) | | | 5,857,200 | |
| | 8,100 | | | WPP plc | | | 102,031 | |
| | 32,400 | | | Zillow Group, Inc. Class A* | | | 1,482,624 | |
| | 231,300 | | | Zynga, Inc. Class A* | | | 1,417,869 | |
| | | | | | | | |
| | | | | | | 84,703,252 | |
| | |
| Pharmaceuticals, Biotechnology & Life Sciences – 1.6% | |
| | 14,500 | | | AbbVie, Inc. | | | 1,054,440 | |
| | 8,400 | | | Amgen, Inc. | | | 1,547,952 | |
| | 9,100 | | | Astellas Pharma, Inc. | | | 129,682 | |
| | 5,700 | | | AstraZeneca plc | | | 465,985 | |
| | 23,400 | | | Bayer AG (Registered) | | | 1,623,031 | |
| | 15,300 | | | Biogen, Inc.* | | | 3,578,211 | |
| | 5,500 | | | Bio-Rad Laboratories, Inc. Class A* | | | 1,719,245 | |
| | 4,400 | | | BTG plc* | | | 46,686 | |
| | 800 | | | Chugai Pharmaceutical Co. Ltd. | | | 52,394 | |
| | 900 | | | Daiichi Sankyo Co. Ltd. | | | 47,201 | |
| | 200 | | | Dechra Pharmaceuticals plc | | | 6,980 | |
| | 700 | | | Eisai Co. Ltd. | | | 39,673 | |
| | |
|
| Common Stocks – (continued) | |
| Pharmaceuticals, Biotechnology & Life Sciences – (continued) | |
| | 43,700 | | | Elanco Animal Health, Inc.* | | | 1,477,060 | |
| | 8,600 | | | Eli Lilly & Co. | | | 952,794 | |
| | 8,800 | | | Evotec SE* | | | 246,380 | |
| | 69,032 | | | Gilead Sciences, Inc. | | | 4,663,802 | |
| | 43,500 | | | GlaxoSmithKline plc | | | 871,951 | |
| | 4,700 | | | Hikma Pharmaceuticals plc | | | 102,859 | |
| | 6,150 | | | Illumina, Inc.* | | | 2,264,122 | |
| | 2,200 | | | Incyte Corp.* | | | 186,912 | |
| | 42,000 | | | Indivior plc* | | | 22,783 | |
| | 500 | | | Ipsen SA | | | 68,198 | |
| | 12,800 | | | IQVIA Holdings, Inc.* | | | 2,059,520 | |
| | 31,949 | | | Johnson & Johnson | | | 4,449,857 | |
| | 200 | | | Kaken Pharmaceutical Co. Ltd. | | | 9,380 | |
| | 1,800 | | | Kissei Pharmaceutical Co. Ltd. | | | 45,054 | |
| | 34,752 | | | Merck & Co., Inc. | | | 2,913,955 | |
| | 1,000 | | | Merck KGaA | | | 104,451 | |
| | 400 | | | Mettler-Toledo International, Inc.* | | | 336,000 | |
| | 1,800 | | | Mitsubishi Tanabe Pharma Corp. | | | 20,032 | |
| | 200 | | | Mochida Pharmaceutical Co. Ltd. | | | 8,527 | |
| | 77,166 | | | Mylan NV* | | | 1,469,241 | |
| | 21,657 | | | Nektar Therapeutics* | | | 770,556 | |
| | 21,995 | | | Neurocrine Biosciences, Inc.* | | | 1,857,038 | |
| | 2,600 | | | Ono Pharmaceutical Co. Ltd. | | | 46,747 | |
| | 2,800 | | | Orion OYJ Class B | | | 102,679 | |
| | 1,500 | | | Otsuka Holdings Co. Ltd. | | | 49,015 | |
| | 1,200 | | | PeptiDream, Inc.* | | | 61,634 | |
| | 22,100 | | | Perrigo Co. plc | | | 1,052,402 | |
| | 2,300 | | | Regeneron Pharmaceuticals, Inc.* | | | 719,900 | |
| | 600 | | | Rohto Pharmaceutical Co. Ltd. | | | 16,336 | |
| | 8,000 | | | Sage Therapeutics, Inc.* | | | 1,464,720 | |
| | 4,000 | | | Sanofi | | | 345,689 | |
| | 1,600 | | | Santen Pharmaceutical Co. Ltd. | | | 26,600 | |
| | 900 | | | Sartorius Stedim Biotech | | | 141,915 | |
| | 1,000 | | | Sawai Pharmaceutical Co. Ltd. | | | 54,126 | |
| | 1,800 | | | Shionogi & Co. Ltd. | | | 104,009 | |
| | 2,500 | | | Sumitomo Dainippon Pharma Co. Ltd. | | | 47,594 | |
| | 600 | | | Taisho Pharmaceutical Holdings Co. Ltd. | | | 46,216 | |
| | 5,600 | | | Takeda Pharmaceutical Co. Ltd. | | | 199,208 | |
| | 16,550 | | | Thermo Fisher Scientific, Inc. | | | 4,860,404 | |
| | 3,400 | | | UCB SA | | | 282,165 | |
| | 23,927 | | | Zoetis, Inc. | | | 2,715,475 | |
| | | | | | | | |
| | | | | | | 47,548,786 | |
| | |
| Real Estate – 0.8% | |
| | 30,847 | | | American Tower Corp. (REIT) | | | 6,306,669 | |
| | 10,700 | | | Apartment Investment & Management Co. Class A (REIT) | | | 536,284 | |
| | 5,600 | | | Aroundtown SA | | | 46,201 | |
| | 1,130 | | | Assura plc (REIT) | | | 916 | |
| | 3,200 | | | AvalonBay Communities, Inc. (REIT) | | | 650,176 | |
| | 400 | | | Big Yellow Group plc (REIT) | | | 5,031 | |
| | 4,000 | | | Civitas Social Housing plc (REIT) | | | 4,277 | |
| | 100 | | | CLS Holdings plc | | | 272 | |
| | |
| | |
| The accompanying notes are an integral part of these financial statements. | | 29 |
GOLDMAN SACHS ABSOLUTE RETURN TRACKER FUND
Consolidated Schedule of Investments(continued)
June 30, 2019 (Unaudited)
| | | | | | | | |
Shares | | | Description | | Value | |
|
| Common Stocks – (continued) | |
| Real Estate – (continued) | |
| | 300 | | | Cofinimmo SA (REIT) | | $ | 38,957 | |
| | 20,500 | | | Crown Castle International Corp. (REIT) | | | 2,672,175 | |
| | 4,400 | | | Digital Realty Trust, Inc. (REIT) | | | 518,276 | |
| | 6,590 | | | Equinix, Inc. (REIT) | | | 3,323,271 | |
| | 8,600 | | | Equity Residential (REIT) | | | 652,912 | |
| | 1,100 | | | Essex Property Trust, Inc. (REIT) | | | 321,123 | |
| | 200 | | | Gecina SA (REIT) | | | 29,929 | |
| | 1,800 | | | Grainger plc | | | 5,614 | |
| | 5,700 | | | Great Portland Estates plc (REIT) | | | 49,540 | |
| | 15,900 | | | HCP, Inc. (REIT) | | | 508,482 | |
| | 800 | | | Hulic Co. Ltd. | | | 6,441 | |
| | 4,800 | | | Iron Mountain, Inc. (REIT) | | | 150,240 | |
| | 7,588 | | | Kimco Realty Corp. (REIT) | | | 140,226 | |
| | 4,900 | | | Land Securities Group plc (REIT) | | | 51,904 | |
| | 800 | | | LEG Immobilien AG | | | 90,226 | |
| | 1,604 | | | LondonMetric Property plc (REIT) | | | 4,298 | |
| | 4,300 | | | Merlin Properties Socimi SA (REIT) | | | 59,605 | |
| | 4,000 | | | Mid-America Apartment Communities, Inc. (REIT) | | | 471,040 | |
| | 1,900 | | | Mitsubishi Estate Co. Ltd. | | | 35,411 | |
| | 3,600 | | | Nomura Real Estate Holdings, Inc. | | | 77,540 | |
| | 6,910 | | | Primary Health Properties plc (REIT) | | | 11,707 | |
| | 3,900 | | | Prologis, Inc. (REIT) | | | 312,390 | |
| | 11,300 | | | Realty Income Corp. (REIT) | | | 779,361 | |
| | 1,900 | | | Regency Centers Corp. (REIT) | | | 126,806 | |
| | 600 | | | Relo Group, Inc. | | | 15,153 | |
| | 800 | | | Safestore Holdings plc (REIT) | | | 6,233 | |
| | 1,100 | | | Savills plc | | | 12,509 | |
| | 11,856 | | | SBA Communications Corp. (REIT)* | | | 2,665,703 | |
| | 5,695 | | | Segro plc (REIT) | | | 52,875 | |
| | 900 | | | Simon Property Group, Inc. (REIT) | | | 143,784 | |
| | 42,200 | | | Spirit Realty Capital, Inc. (REIT) | | | 1,800,252 | |
| | 4,700 | | | TAG Immobilien AG | | | 108,561 | |
| | 14,400 | | | UDR, Inc. (REIT) | | | 646,416 | |
| | 1,500 | | | UNITE Group plc (The) (REIT) | | | 18,561 | |
| | 1,800 | | | Ventas, Inc. (REIT) | | | 123,030 | |
| | 2,600 | | | Vonovia SE | | | 124,202 | |
| | 500 | | | Warehouses De Pauw CVA (REIT) | | | 84,145 | |
| | 8,300 | | | Welltower, Inc. (REIT) | | | 676,699 | |
| | 8,500 | | | Weyerhaeuser Co. (REIT) | | | 223,890 | |
| | 400 | | | Workspace Group plc (REIT) | | | 4,440 | |
| | | | | | | | |
| | | | | | | 24,693,753 | |
| | |
| Retailing – 1.8% | |
| | 100 | | | ABC-Mart, Inc. | | | 6,522 | |
| | 4,500 | | | Advance Auto Parts, Inc. | | | 693,630 | |
| | 9,376 | | | Amazon.com, Inc.* | | | 17,754,675 | |
| | 700 | | | Aoyama Trading Co. Ltd. | | | 13,742 | |
| | 1,200 | | | AutoZone, Inc.* | | | 1,319,364 | |
| | 4,200 | | | B&M European Value Retail SA | | | 17,789 | |
| | 10,500 | | | Best Buy Co., Inc. | | | 732,165 | |
| | 2,000 | | | Booking Holdings, Inc.* | | | 3,749,420 | |
| | |
|
| Common Stocks – (continued) | |
| Retailing – (continued) | |
| | 1,600 | | | Canon Marketing Japan, Inc. | | | 35,003 | |
| | 400 | | | Card Factory plc | | | 894 | |
| | 21,613 | | | CarMax, Inc.* | | | 1,876,657 | |
| | 10,700 | | | Dollar General Corp. | | | 1,446,212 | |
| | 41,960 | | | Dollar Tree, Inc.* | | | 4,506,084 | |
| | 1,700 | | | Dunelm Group plc | | | 19,862 | |
| | 14,438 | | | eBay, Inc. | | | 570,301 | |
| | 4,800 | | | Expedia Group, Inc. | | | 638,544 | |
| | 100 | | | Fast Retailing Co. Ltd. | | | 60,530 | |
| | 59,400 | | | Floor & Decor Holdings, Inc. Class A* | | | 2,488,860 | |
| | 12,178 | | | Foot Locker, Inc. | | | 510,502 | |
| | 25,930 | | | Gap, Inc. (The) | | | 465,962 | |
| | 4,000 | | | Genuine Parts Co. | | | 414,320 | |
| | 200 | | | H2O Retailing Corp. | | | 2,311 | |
| | 17,750 | | | Home Depot, Inc. (The) | | | 3,691,467 | |
| | 9,000 | | | Inchcape plc | | | 70,530 | |
| | 1,000 | | | Izumi Co. Ltd. | | | 40,494 | |
| | 8,800 | | | JD Sports Fashion plc | | | 65,559 | |
| | 35,400 | | | Kingfisher plc | | | 96,489 | |
| | 14,800 | | | Kohl’s Corp. | | | 703,740 | |
| | 4,200 | | | K’s Holdings Corp. | | | 39,658 | |
| | 96,772 | | | LKQ Corp.* | | | 2,575,103 | |
| | 31,500 | | | Lowe’s Cos., Inc. | | | 3,178,665 | |
| | 25,000 | | | Macy’s, Inc. | | | 536,500 | |
| | 25,700 | | | Marks & Spencer Group plc | | | 68,715 | |
| | 300 | | | Marui Group Co. Ltd. | | | 6,118 | |
| | 1,800 | | | Moneysupermarket.com Group plc | | | 9,429 | |
| | 100 | | | Nitori Holdings Co. Ltd. | | | 13,270 | |
| | 15,600 | | | Nordstrom, Inc. | | | 497,016 | |
| | 11,300 | | | Ocado Group plc* | | | 167,511 | |
| | 2,700 | | | O’Reilly Automotive, Inc.* | | | 997,164 | |
| | 900 | | | Pan Pacific International Holdings Corp. | | | 57,222 | |
| | 21,500 | | | Pets at Home Group plc | | | 50,868 | |
| | 11,700 | | | Rakuten, Inc. | | | 139,875 | |
| | 8,477 | | | Ross Stores, Inc. | | | 840,240 | |
| | 300 | | | Sanrio Co. Ltd. | | | 6,671 | |
| | 700 | | | Shimachu Co. Ltd. | | | 16,310 | |
| | 100 | | | Shimamura Co. Ltd. | | | 7,487 | |
| | 5,600 | | | Sports Direct International plc* | | | 19,643 | |
| | 600 | | | Takashimaya Co. Ltd. | | | 6,585 | |
| | 900 | | | Takeaway.com NV* | | | 84,203 | |
| | 7,900 | | | Target Corp. | | | 684,219 | |
| | 22,100 | | | TJX Cos., Inc. (The) | | | 1,168,648 | |
| | 4,700 | | | Tractor Supply Co. | | | 511,360 | |
| | 1,200 | | | Ulta Beauty, Inc.* | | | 416,268 | |
| | 2,800 | | | Vivo Energy plc | | | 4,715 | |
| | 400 | | | WH Smith plc | | | 10,019 | |
| | 11,400 | | | Yamada Denki Co. Ltd. | | | 50,453 | |
| | 3,000 | | | Zalando SE* | | | 133,109 | |
| | | | | | | | |
| | | | | | | 54,288,672 | |
| | |
| Semiconductors & Semiconductor Equipment – 1.3% | |
| | 17,200 | | | Advanced Micro Devices, Inc.* | | | 522,364 | |
| | 2,600 | | | Advantest Corp. | | | 71,580 | |
| | |
| | |
| 30 | | The accompanying notes are an integral part of these financial statements. |
GOLDMAN SACHS ABSOLUTE RETURN TRACKER FUND
| | | | | | | | |
Shares | | | Description | | Value | |
|
| Common Stocks – (continued) | |
| Semiconductors & Semiconductor Equipment – (continued) | |
| | 18,500 | | | Analog Devices, Inc. | | $ | 2,088,095 | |
| | 74,400 | | | Applied Materials, Inc. | | | 3,341,304 | |
| | 2,900 | | | ASM International NV | | | 188,217 | |
| | 7,201 | | | Broadcom, Inc. | | | 2,072,880 | |
| | 300 | | | Disco Corp. | | | 49,505 | |
| | 53,700 | | | Intel Corp. | | | 2,570,619 | |
| | 23,447 | | | Lam Research Corp. | | | 4,404,284 | |
| | 63,900 | | | Marvell Technology Group Ltd. | | | 1,525,293 | |
| | 15,700 | | | Maxim Integrated Products, Inc. | | | 939,174 | |
| | 31,900 | | | Microchip Technology, Inc. | | | 2,765,730 | |
| | 141,518 | | | Micron Technology, Inc.* | | | 5,461,180 | |
| | 11,990 | | | NVIDIA Corp. | | | 1,969,118 | |
| | 15,100 | | | NXP Semiconductors NV | | | 1,473,911 | |
| | 95,800 | | | ON Semiconductor Corp.* | | | 1,936,118 | |
| | 30,700 | | | Qorvo, Inc.* | | | 2,044,927 | |
| | 15,759 | | | QUALCOMM, Inc. | | | 1,198,787 | |
| | 2,700 | | | Siltronic AG | | | 196,202 | |
| | 10,300 | | | Skyworks Solutions, Inc. | | | 795,881 | |
| | 20,500 | | | STMicroelectronics NV | | | 363,055 | |
| | 6,800 | | | SUMCO Corp. | | | 81,056 | |
| | 2,600 | | | Texas Instruments, Inc. | | | 298,376 | |
| | 400 | | | Tokyo Electron Ltd. | | | 56,222 | |
| | 32,600 | | | Xilinx, Inc. | | | 3,844,192 | |
| | | | | | | | |
| | | | | | | 40,258,070 | |
| | |
| Software & Services – 3.8% | |
| | 7,700 | | | Adobe, Inc.* | | | 2,268,805 | |
| | 4,700 | | | Akamai Technologies, Inc.* | | | 376,658 | |
| | 13,700 | | | Alliance Data Systems Corp. | | | 1,919,781 | |
| | 1,100 | | | Alten SA | | | 131,881 | |
| | 16,700 | | | Altran Technologies SA | | | 265,025 | |
| | 7,300 | | | Amadeus IT Group SA | | | 578,492 | |
| | 5,904 | | | Atos SE(a) | | | 493,262 | |
| | 4,800 | | | Automatic Data Processing, Inc. | | | 793,584 | |
| | 8,300 | | | Avast plc | | | 31,668 | |
| | 900 | | | AVEVA Group plc | | | 46,184 | |
| | 2,000 | | | Bechtle AG | | | 230,171 | |
| | 11,600 | | | Cadence Design Systems, Inc.* | | | 821,396 | |
| | 3,600 | | | Capgemini SE | | | 447,599 | |
| | 2,000 | | | Citrix Systems, Inc. | | | 196,280 | |
| | 61,100 | | | Cognizant Technology Solutions Corp. Class A | | | 3,873,129 | |
| | 700 | | | Computacenter plc | | | 11,820 | |
| | 2,500 | | | Dassault Systemes SE | | | 398,763 | |
| | 42,000 | | | DXC Technology Co. | | | 2,316,300 | |
| | 5,100 | | | Equiniti Group plc | | | 14,254 | |
| | 12,400 | | | Euronet Worldwide, Inc.* | | | 2,086,176 | |
| | 145,100 | | | FireEye, Inc.* | | | 2,148,931 | |
| | 6,600 | | | Fortinet, Inc.* | | | 507,078 | |
| | 640 | | | Fujitsu Ltd. | | | 44,727 | |
| | 300 | | | Gartner, Inc.* | | | 48,282 | |
| | 50,976 | | | Genpact Ltd. | | | 1,941,676 | |
| | 500 | | | GMO Payment Gateway, Inc. | | | 34,554 | |
| | 17,600 | | | International Business Machines Corp. | | | 2,427,040 | |
| | 7,607 | | | Intuit, Inc. | | | 1,987,937 | |
| | |
|
| Common Stocks – (continued) | |
| Software & Services – (continued) | |
| | 1,200 | | | Itochu Techno-Solutions Corp. | | | 30,850 | |
| | 1,803 | | | Jack Henry & Associates, Inc. | | | 241,458 | |
| | 33,252 | | | Mastercard, Inc. Class A | | | 8,796,152 | |
| | 9,596 | | | Micro Focus International plc | | | 252,375 | |
| | 158,321 | | | Microsoft Corp. | | | 21,208,681 | |
| | 3,600 | | | Nemetschek SE | | | 216,874 | |
| | 1,000 | | | NET One Systems Co. Ltd. | | | 27,654 | |
| | 600 | | | Nomura Research Institute Ltd. | | | 9,649 | |
| | 8,000 | | | NTT Data Corp. | | | 106,817 | |
| | 114,124 | | | Nuance Communications, Inc.* | | | 1,822,560 | |
| | 300 | | | Obic Co. Ltd. | | | 34,094 | |
| | 13,800 | | | Okta, Inc.* | | | 1,704,438 | |
| | 35,062 | | | Oracle Corp. | | | 1,997,482 | |
| | 100 | | | Oracle Corp. Japan | | | 7,322 | |
| | 600 | | | Otsuka Corp. | | | 24,196 | |
| | 22,544 | | | Palo Alto Networks, Inc.* | | | 4,593,565 | |
| | 9,300 | | | Paychex, Inc. | | | 765,297 | |
| | 106,263 | | | PayPal Holdings, Inc.* | | | 12,162,863 | |
| | 20,400 | | | Pegasystems, Inc. | | | 1,452,684 | |
| | 21,300 | | | Proofpoint, Inc.* | | | 2,561,325 | |
| | 7,900 | | | Sage Group plc (The) | | | 80,569 | |
| | 18,698 | | | salesforce.com, Inc.* | | | 2,837,048 | |
| | 6,500 | | | SAP SE | | | 891,097 | |
| | 300 | | | SCSK Corp. | | | 14,788 | |
| | 12,876 | | | ServiceNow, Inc.* | | | 3,535,363 | |
| | 1,400 | | | Softcat plc | | | 17,289 | |
| | 7,300 | | | Sophos Group plc | | | 36,646 | |
| | 2,700 | | | Sopra Steria Group(a) | | | 314,607 | |
| | 87,127 | | | Symantec Corp. | | | 1,895,883 | |
| | 15,100 | | | Synopsys, Inc.* | | | 1,943,219 | |
| | 21,734 | | | Tableau Software, Inc. Class A* | | | 3,608,279 | |
| | 800 | | | TIS, Inc. | | | 40,883 | |
| | 400 | | | Trend Micro, Inc. | | | 17,874 | |
| | 13,500 | | | Twilio, Inc. Class A* | | | 1,840,725 | |
| | 5,634 | | | VeriSign, Inc.* | | | 1,178,407 | |
| | 45,694 | | | Visa, Inc. Class A | | | 7,930,194 | |
| | 43,300 | | | Western Union Co. (The) | | | 861,237 | |
| | 2,320 | | | Worldline SA* | | | 168,558 | |
| | 26,000 | | | Zendesk, Inc.* | | | 2,314,780 | |
| | | | | | | | |
| | | | | | | 113,985,235 | |
| | |
| Technology Hardware & Equipment – 1.5% | |
| | 4,100 | | | Alps Alpine Co. Ltd. | | | 69,436 | |
| | 600 | | | Amano Corp. | | | 16,605 | |
| | 2,800 | | | Amphenol Corp. Class A | | | 268,632 | |
| | 3,500 | | | Anritsu Corp.(a) | | | 61,031 | |
| | 95,019 | | | Apple, Inc. | | | 18,806,161 | |
| | 900 | | | Azbil Corp. | | | 22,038 | |
| | 5,600 | | | Brother Industries Ltd. | | | 106,072 | |
| | 1,300 | | | Canon, Inc. | | | 38,068 | |
| | 59,926 | | | Cisco Systems, Inc. | | | 3,279,750 | |
| | 4,200 | | | Citizen Watch Co. Ltd. | | | 21,612 | |
| | 5,000 | | | Electrocomponents plc | | | 40,169 | |
| | 11,502 | | | F5 Networks, Inc.* | | | 1,675,036 | |
| | 11,592 | | | FLIR Systems, Inc. | | | 627,127 | |
| | 4,000 | | | FUJIFILM Holdings Corp. | | | 203,079 | |
| | |
| | |
| The accompanying notes are an integral part of these financial statements. | | 31 |
GOLDMAN SACHS ABSOLUTE RETURN TRACKER FUND
Consolidated Schedule of Investments(continued)
June 30, 2019 (Unaudited)
| | | | | | | | |
Shares | | | Description | | Value | |
|
| Common Stocks – (continued) | |
| Technology Hardware & Equipment – (continued) | |
| | 9,000 | | | Halma plc | | $ | 231,144 | |
| | 100 | | | Hirose Electric Co. Ltd. | | | 11,190 | |
| | 1,200 | | | Hitachi High-Technologies Corp. | | | 61,691 | |
| | 5,520 | | | Hitachi Ltd. | | | 203,096 | |
| | 600 | | | Horiba Ltd. | | | 31,129 | |
| | 123,700 | | | HP, Inc. | | | 2,571,723 | |
| | 1,000 | | | Ibiden Co. Ltd. | | | 17,570 | |
| | 3,000 | | | Ingenico Group SA(a) | | | 265,504 | |
| | 86,587 | | | Juniper Networks, Inc. | | | 2,305,812 | |
| | 100 | | | Keyence Corp. | | | 61,672 | |
| | 10,800 | | | Keysight Technologies, Inc.* | | | 969,948 | |
| | 10,300 | | | Konica Minolta, Inc. | | | 100,359 | |
| | 2,500 | | | Kyocera Corp. | | | 163,809 | |
| | 5,914 | | | Motorola Solutions, Inc. | | | 986,041 | |
| | 1,100 | | | Murata Manufacturing Co. Ltd. | | | 49,523 | |
| | 76,200 | | | NCR Corp.* | | | 2,369,820 | |
| | 7,921 | | | NetApp, Inc. | | | 488,726 | |
| | 3,700 | | | Nippon Electric Glass Co. Ltd. | | | 94,040 | |
| | 51,000 | | | Nokia OYJ | | | 254,020 | |
| | 1,200 | | | Oki Electric Industry Co. Ltd. | | | 14,990 | |
| | 700 | | | Omron Corp. | | | 36,712 | |
| | 9,300 | | | Ricoh Co. Ltd. | | | 93,039 | |
| | 23,800 | | | Seagate Technology plc | | | 1,121,456 | |
| | 500 | | | Shimadzu Corp. | | | 12,309 | |
| | 2,400 | | | Spirent Communications plc | | | 4,657 | |
| | 300 | | | Taiyo Yuden Co. Ltd. | | | 5,631 | |
| | 12,900 | | | TE Connectivity Ltd. | | | 1,235,562 | |
| | 1,200 | | | Topcon Corp. | | | 15,075 | |
| | 50,000 | | | Western Digital Corp. | | | 2,377,500 | |
| | 200 | | | Yaskawa Electric Corp. | | | 6,839 | |
| | 1,300 | | | Yokogawa Electric Corp. | | | 25,587 | |
| | 14,489 | | | Zebra Technologies Corp. Class A* | | | 3,035,301 | |
| | | | | | | | |
| | | | | | | 44,456,291 | |
| | |
| Telecommunication Services – 0.6% | |
| | 94,800 | | | AT&T, Inc. | | | 3,176,748 | |
| | 72,900 | | | BT Group plc | | | 182,274 | |
| | 4,300 | | | Cellnex Telecom SA* | | | 159,072 | |
| | 307,709 | | | CenturyLink, Inc. | | | 3,618,658 | |
| | 53,200 | | | Deutsche Telekom AG (Registered) | | | 921,671 | |
| | 1,200 | | | Elisa OYJ | | | 58,552 | |
| | 5,400 | | | KDDI Corp. | | | 137,412 | |
| | 31,300 | | | Koninklijke KPN NV | | | 96,116 | |
| | 7,300 | | | Nippon Telegraph & Telephone Corp. | | | 340,105 | |
| | 2,700 | | | NTT DOCOMO, Inc. | | | 62,996 | |
| �� | 7,500 | | | Orange SA | | | 118,298 | |
| | 2,300 | | | Proximus SADP | | | 67,976 | |
| | 2,000 | | | SoftBank Group Corp. | | | 96,331 | |
| | 912,300 | | | Telecom Italia SpA* | | | 498,075 | |
| | 13,900 | | | Telefonica Deutschland Holding AG | | | 38,835 | |
| | 82,600 | | | Telefonica SA | | | 679,245 | |
| | 20,900 | | | T-Mobile US, Inc.* | | | 1,549,526 | |
| | 81,625 | | | Verizon Communications, Inc. | | | 4,663,236 | |
| | |
|
| Common Stocks – (continued) | |
| Telecommunication Services – (continued) | |
| | 773,600 | | | Vodafone Group plc | | | 1,267,979 | |
| | | | | | | | |
| | | | | | | 17,733,105 | |
| | |
| Transportation – 0.6% | |
| | 2,100 | | | Abertis Infraestructuras SA*(c) | | | 41,550 | |
| | 200 | | | Aena SME SA | | | 39,641 | |
| | 66,100 | | | Air France-KLM* | | | 635,272 | |
| | 16,300 | | | Alaska Air Group, Inc. | | | 1,041,733 | |
| | 11,500 | | | Atlantia SpA | | | 299,878 | |
| | 23,400 | | | BBA Aviation plc | | | 83,893 | |
| | 89,427 | | | Bollore SA | | | 394,590 | |
| | 800 | | | Central Japan Railway Co. | | | 160,406 | |
| | 10,700 | | | CH Robinson Worldwide, Inc. | | | 902,545 | |
| | 5,000 | | | CSX Corp. | | | 386,850 | |
| | 58,453 | | | Delta Air Lines, Inc. | | | 3,317,208 | |
| | 3,800 | | | Deutsche Lufthansa AG (Registered) | | | 65,154 | |
| | 16,800 | | | Deutsche Post AG (Registered) | | | 552,666 | |
| | 7,700 | | | easyJet plc | | | 93,228 | |
| | 3,600 | | | Expeditors International of Washington, Inc. | | | 273,096 | |
| | 13,000 | | | FedEx Corp. | | | 2,134,470 | |
| | 18,300 | | | Firstgroup plc* | | | 22,717 | |
| | 600 | | | Fraport AG Frankfurt Airport Services Worldwide | | | 51,645 | |
| | 12,200 | | | Getlink SE | | | 195,426 | |
| | 300 | | | Go-Ahead Group plc (The) | | | 7,513 | |
| | 27,200 | | | International Consolidated Airlines Group SA | | | 164,905 | |
| | 2,000 | | | Japan Airlines Co. Ltd. | | | 63,831 | |
| | 200 | | | Japan Airport Terminal Co. Ltd. | | | 8,554 | |
| | 2,200 | | | JB Hunt Transport Services, Inc. | | | 201,102 | |
| | 3,200 | | | Kamigumi Co. Ltd. | | | 75,884 | |
| | 500 | | | Keikyu Corp. | | | 8,621 | |
| | 600 | | | Keio Corp. | | | 39,542 | |
| | 600 | | | Keisei Electric Railway Co. Ltd. | | | 21,885 | |
| | 600 | | | Kintetsu Group Holdings Co. Ltd. | | | 28,765 | |
| | 700 | | | Kyushu Railway Co. | | | 20,421 | |
| | 1,200 | | | Mitsubishi Logistics Corp. | | | 33,049 | |
| | 400 | | | Nagoya Railroad Co. Ltd. | | | 11,078 | |
| | 3,000 | | | National Express Group plc | | | 15,297 | |
| | 400 | | | Nikkon Holdings Co. Ltd. | | | 9,197 | |
| | 2,800 | | | Norfolk Southern Corp. | | | 558,124 | |
| | 1,000 | | | Odakyu Electric Railway Co. Ltd. | | | 24,505 | |
| | 40,700 | | | Royal Mail plc | | | 109,525 | |
| | 1,000 | | | Sankyu, Inc. | | | 52,651 | |
| | 3,300 | | | Seino Holdings Co. Ltd. | | | 44,074 | |
| | 1,100 | | | SG Holdings Co. Ltd. | | | 31,278 | |
| | 100 | | | Sotetsu Holdings, Inc. | | | 2,759 | |
| | 29,300 | | | Southwest Airlines Co. | | | 1,487,854 | |
| | 15,300 | | | Union Pacific Corp. | | | 2,587,383 | |
| | 16,700 | | | United Continental Holdings, Inc.* | | | 1,462,085 | |
| | 3,000 | | | United Parcel Service, Inc. Class B | | | 309,810 | |
| | 500 | | | West Japan Railway Co. | | | 40,468 | |
| | 1,100 | | | Wizz Air Holdings plc* | | | 47,640 | |
| | 3,800 | | | Yamato Holdings Co. Ltd. | | | 77,457 | |
| | | | | | | | |
| | | | | | | 18,237,225 | |
| | |
| | |
| 32 | | The accompanying notes are an integral part of these financial statements. |
GOLDMAN SACHS ABSOLUTE RETURN TRACKER FUND
| | | | | | | | |
Shares | | | Description | | Value | |
|
| Common Stocks – (continued) | |
| Utilities – 1.2% | |
| | 208,600 | | | A2A SpA | | $ | 362,113 | |
| | 88,213 | | | AES Corp. | | | 1,478,450 | |
| | 6,100 | | | Alliant Energy Corp. | | | 299,388 | |
| | 12,400 | | | Ameren Corp. | | | 931,364 | |
| | 11,700 | | | American Electric Power Co., Inc. | | | 1,029,717 | |
| | 28,952 | | | American Water Works Co., Inc. | | | 3,358,432 | |
| | 3,400 | | | Atmos Energy Corp. | | | 358,904 | |
| | 38,400 | | | CenterPoint Energy, Inc. | | | 1,099,392 | |
| | 163,500 | | | Centrica plc | | | 182,264 | |
| | 1,900 | | | Chubu Electric Power Co., Inc. | | | 26,690 | |
| | 11,840 | | | CMS Energy Corp. | | | 685,654 | |
| | 10,400 | | | Consolidated Edison, Inc. | | | 911,872 | |
| | 900 | | | ContourGlobal plc | | | 2,172 | |
| | 9,500 | | | Dominion Energy, Inc. | | | 734,540 | |
| | 8,900 | | | Drax Group plc | | | 29,397 | |
| | 10,900 | | | DTE Energy Co. | | | 1,393,892 | |
| | 18,200 | | | Duke Energy Corp. | | | 1,605,968 | |
| | 6,200 | | | E.ON SE | | | 67,271 | |
| | 8,100 | | | Edison International | | | 546,021 | |
| | 95,200 | | | EDP – Energias de Portugal SA | | | 361,802 | |
| | 2,300 | | | Electric Power Development Co. Ltd. | | | 52,339 | |
| | 47 | | | Electricite de France SA | | | 593 | |
| | 8,900 | | | Endesa SA | | | 228,913 | |
| | 159,700 | | | Enel SpA | | | 1,114,027 | |
| | 11,145 | | | Entergy Corp. | | | 1,147,155 | |
| | 14,200 | | | Evergy, Inc. | | | 854,130 | |
| | 12,600 | | | Eversource Energy | | | 954,576 | |
| | 39,200 | | | Exelon Corp. | | | 1,879,248 | |
| | 11,712 | | | FirstEnergy Corp. | | | 501,391 | |
| | 38,000 | | | Hera SpA | | | 145,351 | |
| | 300 | | | Hokkaido Electric Power Co., Inc. | | | 1,683 | |
| | 103,800 | | | Iberdrola SA | | | 1,033,451 | |
| | 5,900 | | | Innogy SE | | | 279,761 | |
| | 22,300 | | | Italgas SpA | | | 149,877 | |
| | 7,900 | | | Naturgy Energy Group SA | | | 217,715 | |
| | 3,800 | | | NextEra Energy, Inc. | | | 778,468 | |
| | 23,000 | | | NiSource, Inc. | | | 662,400 | |
| | 23,998 | | | NRG Energy, Inc. | | | 842,810 | |
| | 10,800 | | | Pinnacle West Capital Corp. | | | 1,016,172 | |
| | 25,800 | | | PPL Corp. | | | 800,058 | |
| | 8,600 | | | Public Service Enterprise Group, Inc. | | | 505,852 | |
| | 11,000 | | | Renewables Infrastructure Group Ltd. (The) | | | 17,924 | |
| | 16,300 | | | RWE AG | | | 402,212 | |
| | 13,600 | | | Southern Co. (The) | | | 751,808 | |
| | 17,700 | | | SSE plc | | | 252,284 | |
| | 5,900 | | | Suez | | | 85,136 | |
| | 400 | | | Telecom Plus plc | | | 7,162 | |
| | 39,200 | | | Terna Rete Elettrica Nazionale SpA | | | 249,767 | |
| | 400 | | | Toho Gas Co. Ltd. | | | 14,749 | |
| | 3,500 | | | Tohoku Electric Power Co., Inc. | | | 35,416 | |
| | 19,500 | | | Tokyo Electric Power Co. Holdings, Inc.* | | | 101,850 | |
| | 400 | | | Tokyo Gas Co. Ltd. | | | 9,429 | |
| | |
|
| Common Stocks – (continued) | |
| Utilities – (continued) | |
| | 4,600 | | | United Utilities Group plc | | | 45,788 | |
| | 2,000 | | | Verbund AG Class A | | | 104,771 | |
| | 127,048 | | | Vistra Energy Corp. | | | 2,876,367 | |
| | 11,800 | | | WEC Energy Group, Inc. | | | 983,766 | |
| | 13,407 | | | Xcel Energy, Inc. | | | 797,582 | |
| | | | | | | | |
| | | | | | | 35,367,284 | |
| | |
| | TOTAL COMMON STOCKS | |
| | (Cost $784,704,758) | | $ | 883,034,805 | |
| | |
| | | | | | | | |
|
| Exchange Traded Funds – 5.8% | |
| | 60,856 | | | Energy Select Sector SPDR Fund | | $ | 3,877,136 | |
| | 157,483 | | | Health Care Select Sector SPDR Fund | | | 14,589,225 | |
| | 199,286 | | | Invesco Emerging Markets Sovereign Debt ETF | | | 5,787,265 | |
| | 719,342 | | | Invesco Senior Loan ETF(a) | | | 16,300,290 | |
| | 251,017 | | | SPDR Bloomberg Barclays Convertible Securities ETF | | | 13,271,269 | |
| | 123,389 | | | SPDR Dow Jones International Real Estate ETF | | | 4,781,324 | |
| | 54,112 | | | SPDR Dow Jones REIT ETF | | | 5,346,265 | |
| | 2,552,421 | | | Vanguard FTSE Emerging Markets ETF | | | 108,554,466 | |
| | |
| | TOTAL EXCHANGE TRADED FUNDS | |
| | (Cost $161,134,781) | | $ | 172,507,240 | |
| | |
| | | | | | | | |
| Shares | | | Dividend
Rate | | Value | |
|
| Investment Company(d)– 59.0% | |
| Goldman Sachs Financial Square Government Fund –
Institutional Shares |
|
| | 1,758,798,801 | | | 2.308% | | $ | 1,758,798,801 | |
| | (Cost $1,758,798,801) | | | | |
| | |
| | | | | | | | | | |
| Units | | Description | | Expiration
Month | | | Value | |
|
| Rights* – 0.0% | |
| Capital Goods – 0.0% | |
| 12,200 | | ACS Actividades de
Construccion
y Servicios SA | | | 07/2019 | | | $ | 19,144 | |
| |
| Energy – 0.0% | |
| 31,200 | | Repsol SA | | | 07/2019 | | | | 17,306 | |
| |
| TOTAL RIGHTS | |
| (Cost $37,613) | | | | | | $ | 36,450 | |
| |
| TOTAL INVESTMENTS BEFORE SECURITIES LENDING REINVESTMENT VEHICLE | |
| (Cost $2,704,675,953) | | | $ | 2,814,377,296 | |
| |
| | |
| The accompanying notes are an integral part of these financial statements. | | 33 |
GOLDMAN SACHS ABSOLUTE RETURN TRACKER FUND
Consolidated Schedule of Investments(continued)
June 30, 2019 (Unaudited)
| | | | | | | | |
| Shares | | | Dividend
Rate | | Value | |
|
| Securities Lending Reinvestment Vehicle(d)– 0.6% | |
| Goldman Sachs Financial Square Government Fund –
Institutional Shares |
|
| | 18,086,061 | | | 2.308% | | $ | 18,086,061 | |
| | (Cost $18,086,061) | | | | |
| | |
| | TOTAL INVESTMENTS – 95.0% | |
| | (Cost $2,722,762,014) | | $ | 2,832,463,357 | |
| | |
| OTHER ASSETS IN EXCESS OF
LIABILITIES – 5.0% | | | 148,774,735 | |
| | |
| | NET ASSETS – 100.0% | | $ | 2,981,238,092 | |
| | |
| | |
|
| The percentage shown for each investment category reflects the value of investments in that category as a percentage of net assets. |
| |
* | | Non-income producing security. |
| |
(a) | | All or a portion of security is on loan. |
| |
(b) | | Preference Shares are a special type of equity investment that shares in the earnings of the company, has limited voting rights, and receives a greater dividend than applicable Common Shares. |
| |
(c) | | Significant unobservable inputs were used in the valuation of this portfolio security; i.e. Level 3. |
| |
(d) | | Represents an Affiliated Issuer. |
| | |
|
Investment Abbreviations: |
CVA | | —Dutch Certification |
REIT | | —Real Estate Investment Trust |
SPDR | | —Standard and Poor’s Depositary Receipts |
|
Currency Abbreviations: |
AUD | | —Australian Dollar |
CAD | | —Canadian Dollar |
CHF | | —Swiss Franc |
CLP | | —Chilean Peso |
EUR | | —Euro |
GBP | | —British Pound |
HUF | | —Hungarian Forint |
IDR | | —Indonesian Rupiah |
INR | | —Indian Rupee |
JPY | | —Japanese Yen |
KRW | | —South Korean Won |
MXN | | —Mexican Peso |
NOK | | —Norwegian Krone |
NZD | | —New Zealand Dollar |
PHP | | —Philippines Peso |
RUB | | —Russian Ruble |
SEK | | —Swedish Krona |
TWD | | —Taiwan Dollar |
USD | | —United States Dollar |
|
|
| ADDITIONAL INVESTMENT INFORMATION |
FORWARD FOREIGN CURRENCY EXCHANGE CONTRACTS — At June 30, 2019, the Fund had the following forward foreign currency exchange contracts:
FORWARD FOREIGN CURRENCY EXCHANGE CONTRACTS WITH UNREALIZED GAIN
| | | | | | | | | | | | | | | | | | | | |
| Counterparty | | Currency
Purchased | | | Currency
Sold | | | Settlement
Date | | | Unrealized
Gain | |
JPMorgan Chase Bank NA | | CLP | | | 3,727,030,000 | | | USD | | | 5,469,218 | | | | 07/01/2019 | | | $ | 30,918 | |
| | IDR | | | 46,677,260,000 | | | USD | | | 3,260,040 | | | | 07/01/2019 | | | | 43,960 | |
| | IDR | | | 112,134,730,000 | | | USD | | | 7,905,211 | | | | 07/29/2019 | | | | 8,361 | |
| | INR | | | 336,700,000 | | | USD | | | 4,801,426 | | | | 07/01/2019 | | | | 76,340 | |
| | INR | | | 595,400,000 | | | USD | | | 8,511,451 | | | | 07/29/2019 | | | | 90,715 | |
| | KRW | | | 9,158,660,000 | | | USD | | | 7,889,841 | | | | 07/01/2019 | | | | 42,139 | |
| | PHP | | | 380,350,000 | | | USD | | | 7,207,694 | | | | 07/01/2019 | | | | 215,942 | |
| | PHP | | | 564,440,000 | | | USD | | | 10,947,961 | | | | 07/29/2019 | | | | 57,706 | |
| | RUB | | | 198,320,000 | | | USD | | | 3,020,204 | | | | 07/01/2019 | | | | 115,972 | |
| | RUB | | | 308,190,000 | | | USD | | | 4,850,072 | | | | 07/29/2019 | | | | 6,950 | |
| | USD | | | 40,475,250 | | | GBP | | | 31,820,000 | | | | 07/23/2019 | | | | 65,442 | |
| | USD | | | 10,205,870 | | | JPY | | | 1,095,000,000 | | | | 07/23/2019 | | | | 49,583 | |
| | | USD | | | 9,755,267 | | | TWD | | | 300,950,000 | | | | 07/29/2019 | | | | 25,094 | |
| | | | | | |
| TOTAL | | | | | | | | | | | | | | | | | | $ | 829,122 | |
| | |
| 34 | | The accompanying notes are an integral part of these financial statements. |
GOLDMAN SACHS ABSOLUTE RETURN TRACKER FUND
|
| ADDITIONAL INVESTMENT INFORMATION (continued) |
FORWARD FOREIGN CURRENCY EXCHANGE CONTRACTS WITH UNREALIZED LOSS
| | | | | | | | | | | | | | | | | | | | |
| Counterparty | | Currency
Purchased | | | Currency
Sold | | | Settlement
Date | | | Unrealized
Loss | |
JPMorgan Chase Bank NA | | MXN | | | 87,790,000 | | | USD | | | 4,583,170 | | | | 07/23/2019 | | | $ | (9,285 | ) |
| | TWD | | | 338,260,000 | | | USD | | | 10,946,144 | | | | 07/01/2019 | | | | (55,435 | ) |
| | USD | | | 16,774,619 | | | AUD | | | 24,220,000 | | | | 07/23/2019 | | | | (229,032 | ) |
| | USD | | | 7,888,507 | | | CAD | | | 10,420,000 | | | | 07/23/2019 | | | | (68,425 | ) |
| | USD | | | 10,374,362 | | | CHF | | | 10,130,000 | | | | 07/23/2019 | | | | (2,610 | ) |
| | USD | | | 5,348,396 | | | CLP | | | 3,727,030,000 | | | | 07/01/2019 | | | | (151,740 | ) |
| | USD | | | 4,870,999 | | | CLP | | | 3,316,550,000 | | | | 07/29/2019 | | | | (25,469 | ) |
| | USD | | | 64,182,951 | | | EUR | | | 56,520,000 | | | | 07/23/2019 | | | | (85,936 | ) |
| | USD | | | 5,379,084 | | | HUF | | | 1,536,920,000 | | | | 07/23/2019 | | | | (30,535 | ) |
| | USD | | | 3,301,079 | | | IDR | | | 46,677,260,000 | | | | 07/01/2019 | | | | (2,921 | ) |
| | USD | | | 4,832,090 | | | INR | | | 336,700,000 | | | | 07/01/2019 | | | | (45,677 | ) |
| | USD | | | 7,683,298 | | | KRW | | | 9,158,660,000 | | | | 07/01/2019 | | | | (248,681 | ) |
| | USD | | | 6,569,815 | | | KRW | | | 7,619,080,000 | | | | 07/29/2019 | | | | (18,541 | ) |
| | USD | | | 5,070,662 | | | NOK | | | 43,320,000 | | | | 07/23/2019 | | | | (7,616 | ) |
| | USD | | | 12,992,917 | | | NZD | | | 19,770,000 | | | | 07/23/2019 | | | | (288,568 | ) |
| | USD | | | 7,386,871 | | | PHP | | | 380,350,000 | | | | 07/01/2019 | | | | (36,765 | ) |
| | USD | | | 3,131,781 | | | RUB | | | 198,320,000 | | | | 07/01/2019 | | | | (4,395 | ) |
| | USD | | | 6,597,143 | | | SEK | | | 61,850,000 | | | | 07/23/2019 | | | | (63,313 | ) |
| | | USD | | | 10,725,552 | | | TWD | | | 338,260,000 | | | | 07/01/2019 | | | | (165,158 | ) |
| | | | | | |
| TOTAL | | | | | | | | | | | | | | | | | | $ | (1,540,102 | ) |
FUTURES CONTRACTS — At June 30, 2019, the Fund had the following futures contracts:
| | | | | | | | | | | | | | | | |
| Description | | Number of
Contracts | | | Expiration
Date | | | Notional
Amount | | | Unrealized
Appreciation/
(Depreciation) | |
Long position contracts: | | | | | | | | | | | | | | | | |
100 oz Gold | | | 92 | | | | 08/28/2019 | | | $ | 13,012,480 | | | $ | 705,486 | |
3 Month Canadian Bankers Acceptance | | | 99 | | | | 09/16/2019 | | | | 18,531,079 | | | | 51,436 | |
3 Month Canadian Bankers Acceptance | | | 108 | | | | 12/16/2019 | | | | 20,223,970 | | | | 54,986 | |
3 Month Canadian Bankers Acceptance | | | 111 | | | | 03/16/2020 | | | | 20,807,997 | | | | 4,744 | |
3 Month Eurodollar | | | 163 | | | | 09/16/2019 | | | | 39,930,925 | | | | 295,559 | |
3 Month Eurodollar | | | 166 | | | | 12/16/2019 | | | | 40,705,275 | | | | 345,207 | |
3 Month Eurodollar | | | 182 | | | | 03/16/2020 | | | | 44,717,400 | | | | 436,528 | |
3 Month Eurodollar | | | 196 | | | | 06/15/2020 | | | | 48,203,750 | | | | 494,135 | |
3 Month Eurodollar | | | 230 | | | | 09/14/2020 | | | | 56,603,000 | | | | 543,280 | |
3 Month Eurodollar | | | 204 | | | | 12/14/2020 | | | | 50,204,400 | | | | 498,334 | |
3 Month Eurodollar | | | 198 | | | | 03/15/2021 | | | | 48,740,175 | | | | 416,212 | |
3 Month Eurodollar | | | 191 | | | | 06/14/2021 | | | | 47,002,712 | | | | 276,507 | |
3 Month Sterling | | | 143 | | | | 09/18/2019 | | | | 22,522,158 | | | | 44,287 | |
3 Month Sterling | | | 156 | | | | 12/18/2019 | | | | 24,562,197 | | | | 45,819 | |
3 Month Sterling | | | 164 | | | | 03/18/2020 | | | | 25,833,513 | | | | 62,725 | |
3 Month Sterling | | | 155 | | | | 06/17/2020 | | | | 24,420,741 | | | | 75,045 | |
3 Month Sterling | | | 172 | | | | 09/16/2020 | | | | 27,101,875 | | | | 78,972 | |
3 Month Sterling | | | 167 | | | | 12/16/2020 | | | | 26,306,077 | | | | 74,960 | |
3 Month Sterling | | | 162 | | | | 03/17/2021 | | | | 25,521,041 | | | | 69,261 | |
3 Month Sterling | | | 155 | | | | 06/16/2021 | | | | 24,414,590 | | | | 56,676 | |
Amsterdam Exchange Index | | | 50 | | | | 07/19/2019 | | | | 6,378,335 | | | | 11,415 | |
ASX 90 Day Bank Accepted Bill | | | 67 | | | | 09/12/2019 | | | | 46,908,959 | | | | 101,359 | |
ASX 90 Day Bank Accepted Bill | | | 72 | | | | 12/12/2019 | | | | 50,420,786 | | | | 85,704 | |
ASX 90 Day Bank Accepted Bill | | | 59 | | | | 03/12/2020 | | | | 41,324,148 | | | | 36,701 | |
| | |
| The accompanying notes are an integral part of these financial statements. | | 35 |
GOLDMAN SACHS ABSOLUTE RETURN TRACKER FUND
Consolidated Schedule of Investments(continued)
June 30, 2019 (Unaudited)
|
| ADDITIONAL INVESTMENT INFORMATION (continued) |
FUTURES CONTRACTS (continued)
| | | | | | | | | | | | | | | | |
| Description | | Number of
Contracts | | | Expiration
Date | | | Notional
Amount | | | Unrealized
Appreciation/
(Depreciation) | |
Long position contracts: (continued) | | | | | | | | | | | | | | | | |
Australia 10 Year Bond | | | 243 | | | | 09/16/2019 | | | $ | 24,447,337 | | | $ | 113,274 | |
CAC 40 10 Euro Index | | | 101 | | | | 07/19/2019 | | | | 6,354,490 | | | | 29,517 | |
Canada 10 Year Bond | | | 221 | | | | 09/19/2019 | | | | 24,129,342 | | | | 215,345 | |
DAX Index | | | 30 | | | | 09/20/2019 | | | | 10,564,795 | | | | 81,092 | |
EURO STOXX 50 Index | | | 2,651 | | | | 09/20/2019 | | | | 104,480,903 | | | | 722,273 | |
Euro-Bobl | | | 380 | | | | 09/06/2019 | | | | 58,091,251 | | | | 228,861 | |
Euro-BTP | | | 112 | | | | 09/06/2019 | | | | 17,083,425 | | | | 644,910 | |
Euro-Bund | | | 437 | | | | 09/06/2019 | | | | 85,826,756 | | | | 905,110 | |
Euro-Buxl | | | 45 | | | | 09/06/2019 | | | | 10,377,174 | | | | 292,765 | |
Euro-OAT | | | 130 | | | | 09/06/2019 | | | | 24,383,402 | | | | 409,580 | |
Euro-Schatz | | | 316 | | | | 09/06/2019 | | | | 40,346,648 | | | | 73,951 | |
FTSE 100 Index | | | 454 | | | | 09/20/2019 | | | | 42,486,506 | | | | (58,318 | ) |
FTSE/JSE Top 40 Index | | | 100 | | | | 09/19/2019 | | | | 3,722,542 | | | | 3,550 | |
FTSE/MIB Index | | | 35 | | | | 09/20/2019 | | | | 4,209,885 | | | | 18,244 | |
Hang Seng Index | | | 21 | | | | 07/30/2019 | | | | 3,831,464 | | | | 49,144 | |
IBEX 35 Index | | | 35 | | | | 07/19/2019 | | | | 3,650,716 | | | | 5,300 | |
Japan 10 Year Bond | | | 12 | | | | 09/12/2019 | | | | 17,128,229 | | | | 54,343 | |
LME Aluminum Base Metal | | | 85 | | | | 07/17/2019 | | | | 3,787,281 | | | | 72,049 | |
Long Gilt | | | 235 | | | | 09/26/2019 | | | | 38,904,409 | | | | 317,586 | |
MSCI Taiwan Index | | | 101 | | | | 07/30/2019 | | | | 3,903,650 | | | | (19,978 | ) |
NASDAQ 100E-Mini Index | | | 366 | | | | 09/20/2019 | | | | 56,318,250 | | | | 938,621 | |
OMXS30 Index | | | 236 | | | | 07/19/2019 | | | | 4,119,005 | | | | 85,111 | |
Russell 2000E-Mini Index | | | 44 | | | | 09/20/2019 | | | | 3,447,620 | | | | 29,096 | |
S&P Midcap 400E-Mini Index | | | 18 | | | | 09/20/2019 | | | | 3,510,000 | | | | 82,068 | |
S&P/TSX 60 Index | | | 46 | | | | 09/19/2019 | | | | 6,868,650 | | | | (51,148 | ) |
SET50 Index | | | 700 | | | | 09/27/2019 | | | | 5,241,640 | | | | 30,502 | |
TOPIX Index | | | 24 | | | | 09/12/2019 | | | | 3,452,581 | | | | 39,167 | |
U.S. Treasury 2 Year Note | | | 394 | | | | 09/30/2019 | | | | 84,765,406 | | | | 462,588 | |
U.S. Treasury 5 Year Note | | | 592 | | | | 09/30/2019 | | | | 69,925,375 | | | | 993,381 | |
U.S. Treasury 10 Year Note | | | 796 | | | | 09/19/2019 | | | | 101,813,375 | | | | 1,758,434 | |
U.S. Treasury Long Bond | | | 265 | | | | 09/19/2019 | | | | 41,207,500 | | | | 1,085,012 | |
| | | | |
| Total | | | | | | | | | | | | | | $ | 14,476,768 | |
| | | | |
Short position contracts: | | | | | | | | | | | | | | | | |
Copper | | | (63 | ) | | | 09/26/2019 | | | $ | (4,273,762 | ) | | $ | (135,849 | ) |
LME Aluminum Base Metal | | | (85 | ) | | | 07/17/2019 | | | | (3,787,281 | ) | | | 50,375 | |
LME Aluminum Base Metal | | | (90 | ) | | | 08/21/2019 | | | | (4,033,688 | ) | | | (78,325 | ) |
S&P 500E-Mini Index | | | (2,182 | ) | | | 09/20/2019 | | | | (321,212,220 | ) | | | (4,831,930 | ) |
Silver | | | (27 | ) | | | 09/26/2019 | | | | (2,072,250 | ) | | | (33,534 | ) |
WTI Crude Oil | | | (70 | ) | | | 07/22/2019 | | | | (4,059,300 | ) | | | (463,593 | ) |
| | | | |
| Total | | | | | | | | | | | | | | $ | (5,492,856 | ) |
| | | | |
| Total Futures Contracts | | | | | | | | | | | | | | $ | 8,983,912 | |
| | |
| 36 | | The accompanying notes are an integral part of these financial statements. |
GOLDMAN SACHS ABSOLUTE RETURN TRACKER FUND
|
| ADDITIONAL INVESTMENT INFORMATION (continued) |
SWAP CONTRACTS — At June 30, 2019, the Fund had the following swap contracts:
CENTRALLY CLEARED CREDIT DEFAULT SWAP CONTRACTS
| | | | | | | | | | | | | | | | | | | | | | | | | | |
| Reference Obligation/Index(a) | | Financing Rate
Received (Paid)
by the Fund | | | Credit
Spread at
June 30,
2019(b) | | Termination
Date | | | Notional
Amount
(000’s) | | | Value | | | Upfront
Premium
(Received)
Paid | | | Unrealized
Appreciation/
(Depreciation) | |
Protection Sold: | | | | | | | | | | | | | | | | | | | | | | | | | | |
iTraxx Europe Crossover Index | | | 5.000% | | | 2.540% | | | 06/20/2024 | | | EUR | 103,350 | | | $ | 13,404,049 | | | $ | 12,282,898 | | | $ | 1,121,151 | |
iTraxx Europe Index | | | 1.000 | | | 0.523 | | | 06/20/2024 | | | EUR | 13,850 | | | | 378,740 | | | | 262,877 | | | | 115,863 | |
Markit CDX North America High Yield Index | | | 5.000 | | | 3.248 | | | 06/20/2024 | | | USD | 112,400 | | | | 8,626,700 | | | | 6,654,211 | | | | 1,972,489 | |
Markit CDX North America Investment Grade Index | | | 1.000 | | | 0.545 | | | 06/20/2024 | | | USD | 16,100 | | | | 349,633 | | | | 261,783 | | | | 87,850 | |
| | | | | | | |
| TOTAL | | | | | | | | | | | | | | | | $ | 22,759,122 | | | $ | 19,461,769 | | | $ | 3,297,353 | |
| | (a) | | Payments received quarterly. |
| | (b) | | Credit spread on the referenced obligation, together with the period of expiration, are indicators of payment/performance risk. The likelihood of a credit event occurring which would require a fund or its counterparty to make a payment or otherwise be required to perform under the swap contract is generally greater as the credit spread and term of the swap contract increase. |
OVER THE COUNTER TOTAL RETURN SWAP CONTRACTS
| | | | | | | | | | | | | | | | | | |
| Referenced Obligation/Index | | Financing Rate
Received (Paid)
by the Fund | | | Counterparty | | Termination
Date | | | Notional
Amount
(000’s) | | | Unrealized
Appreciation/
(Depreciation)(a) | |
MSCI The World Growth Net Return Index(b) | | | (2.412 | )% | | Bank of America | | | 08/12/2019 | | | | USD 32,160 | | | $ | 694,922 | |
MSCI The World Net Return Index(c) | | | 2.412 | | | | | | 08/12/2019 | | | | USD 35,817 | | | | (716,001 | ) |
Alerian MLP Index Total Return(b) | | | (2.404 | ) | | Deutsche Bank AG | | | 10/25/2019 | | | | USD 14,309 | | | | 117,339 | |
Bloomberg Roll Select Commodity Index Total Return(d) | | | (0.000 | ) | | JPMorgan Chase Bank NA | | | 08/28/2019 | | | | USD 49,375 | | | | (135,024 | ) |
Euro Stoxx Gross Total Return Index(c) | | | 0.389 | | | | | | 12/16/2019 | | | | EUR 46,752 | | | | (480,581 | ) |
FTSE 100 Total Return Index(c) | | | 0.725 | | | | | | 09/13/2019 | | | | GBP 20,298 | | | | (240,270 | ) |
| | | | | |
| TOTAL | | | | | | | | | | | | | | | | $ | (759,615 | ) |
| | (a) | | There are no upfront payments on the swap contracts listed above; therefore the unrealized gains (losses) on the swap contracts are equal to their value. |
| | (b) | | Payments made monthly. |
| | (c) | | Payments received monthly. |
| | (d) | | Payments made weekly. |
WRITTEN OPTIONS CONTRACTS — At June 30, 2019, the Fund had the following written options contracts:
| | | | | | | | | | | | | | | | | | | | | | | | | | | | |
| Description | | Counterparty | | Exercise
Price | | Expiration Date | | | Number of
Contracts | | | Notional
Amount | | | Value | | | Premiums Paid
(Received) by
the Fund | | | Unrealized
Appreciation/
Depreciation | |
Written options contracts: | | | | | | | | | | | | | | | | | | | | | |
Puts | | | | | | | | | | | | | | | | | | | | | | | | | | | | |
S&P 500 Index | | Morgan Stanley Co., Inc. | | 2,600 USD | | | 07/19/2019 | | | | 54 | | | $ | (15,885,504 | ) | | $ | (8,235 | ) | | $ | (80,929 | ) | | $ | 72,694 | |
| | | | 2,625 USD | | | 07/19/2019 | | | | 53 | | | | (15,591,328 | ) | | | (9,672 | ) | | | (89,250 | ) | | | 79,578 | |
| | | | 2,650 USD | | | 07/19/2019 | | | | 52 | | | | (15,297,152 | ) | | | (11,310 | ) | | | (98,371 | ) | | | 87,061 | |
| | | | 2,675 USD | | | 07/19/2019 | | | | 51 | | | | (15,002,976 | ) | | | (13,515 | ) | | | (108,542 | ) | | | 95,027 | |
| | | | 2,700 USD | | | 07/19/2019 | | | | 50 | | | | (14,708,800 | ) | | | (16,500 | ) | | | (119,567 | ) | | | 103,067 | |
| | | | 2,725 USD | | | 07/19/2019 | | | | 49 | | | | (14,414,624 | ) | | | (20,090 | ) | | | (134,009 | ) | | | 113,919 | |
| | | | 2,750 USD | | | 07/19/2019 | | | | 48 | | | | (14,120,448 | ) | | | (24,480 | ) | | | (145,843 | ) | | | 121,363 | |
| | | | 2,825 USD | | | 07/19/2019 | | | | 46 | | | | (13,532,096 | ) | | | (47,840 | ) | | | (203,806 | ) | | | 155,966 | |
| | | | 2,850 USD | | | 07/19/2019 | | | | 45 | | | | (13,237,920 | ) | | | (60,300 | ) | | | (225,683 | ) | | | 165,383 | |
| | |
| The accompanying notes are an integral part of these financial statements. | | 37 |
GOLDMAN SACHS ABSOLUTE RETURN TRACKER FUND
Consolidated Schedule of Investments(continued)
June 30, 2019 (Unaudited)
|
| ADDITIONAL INVESTMENT INFORMATION (continued) |
WRITTEN OPTIONS CONTRACTS (continued)
| | | | | | | | | | | | | | | | | | | | | | | | | | | | |
| Description | | Counterparty | | Exercise
Price | | Expiration Date | | | Number of
Contracts | | | Notional
Amount | | | Value | | | Premiums Paid
(Received) by
the Fund | | | Unrealized
Appreciation/
Depreciation | |
Written options contracts: (continued) | | | | | | | | | | | | | | | | | | | | | |
Puts (continued) | | | | | | | | | | | | | | | | | | | | | | | | | | | | |
| | | | 2,875 USD | | | 07/19/2019 | | | | 44 | | | $ | (12,943,744 | ) | | $ | (76,560 | ) | | $ | (255,546 | ) | | $ | 178,986 | |
| | | | 2,900 USD | | | 07/19/2019 | | | | 43 | | | | (12,649,568 | ) | | | (97,825 | ) | | | (288,678 | ) | | | 190,853 | |
| | | | 2,600 USD | | | 08/16/2019 | | | | 45 | | | | (13,237,920 | ) | | | (28,575 | ) | | | (94,782 | ) | | | 66,207 | |
| | | | 2,625 USD | | | 08/16/2019 | | | | 44 | | | | (12,943,744 | ) | | | (32,340 | ) | | | (103,375 | ) | | | 71,035 | |
| | | | 2,650 USD | | | 08/16/2019 | | | | 43 | | | | (12,649,568 | ) | | | (36,550 | ) | | | (115,654 | ) | | | 79,104 | |
| | | | 2,675 USD | | | 08/16/2019 | | | | 42 | | | | (12,355,392 | ) | | | (41,580 | ) | | | (128,354 | ) | | | 86,774 | |
| | | | 2,700 USD | | | 08/16/2019 | | | | 41 | | | | (12,061,216 | ) | | | (47,355 | ) | | | (141,829 | ) | | | 94,474 | |
| | | | 2,725 USD | | | 08/16/2019 | | | | 41 | | | | (12,061,216 | ) | | | (55,350 | ) | | | (156,657 | ) | | | 101,307 | |
| | | | 2,750 USD | | | 08/16/2019 | | | | 40 | | | | (11,767,040 | ) | | | (63,600 | ) | | | (170,950 | ) | | | 107,350 | |
| | | | 2,775 USD | | | 08/16/2019 | | | | 39 | | | | (11,472,864 | ) | | | (72,735 | ) | | | (186,582 | ) | | | 113,847 | |
| | | | 2,800 USD | | | 08/16/2019 | | | | 39 | | | | (11,472,864 | ) | | | (85,410 | ) | | | (209,214 | ) | | | 123,804 | |
| | | | 2,825 USD | | | 08/16/2019 | | | | 38 | | | | (11,178,688 | ) | | | (98,040 | ) | | | (231,066 | ) | | | 133,026 | |
| | | | 2,850 USD | | | 08/16/2019 | | | | 37 | | | | (10,884,512 | ) | | | (112,480 | ) | | | (250,887 | ) | | | 138,407 | |
| | | | 2,875 USD | | | 08/16/2019 | | | | 37 | | | | (10,884,512 | ) | | | (132,645 | ) | | | (282,817 | ) | | | 150,172 | |
| | | | 2,650 USD | | | 09/20/2019 | | | | 46 | | | | (13,532,096 | ) | | | (85,100 | ) | | | (88,027 | ) | | | 2,927 | |
| | | | 2,675 USD | | | 09/20/2019 | | | | 45 | | | | (13,237,920 | ) | | | (94,050 | ) | | | (95,061 | ) | | | 1,011 | |
| | | | 2,700 USD | | | 09/20/2019 | | | | 44 | | | | (12,943,744 | ) | | | (103,400 | ) | | | (104,247 | ) | | | 847 | |
| | | | 2,725 USD | | | 09/20/2019 | | | | 44 | | | | (12,943,744 | ) | | | (116,820 | ) | | | (116,567 | ) | | | (253 | ) |
| | | | 2,750 USD | | | 09/20/2019 | | | | 43 | | | | (12,649,568 | ) | | | (128,785 | ) | | | (129,851 | ) | | | 1,066 | |
| | | | 2,775 USD | | | 09/20/2019 | | | | 42 | | | | (12,355,392 | ) | | | (141,750 | ) | | | (140,248 | ) | | | (1,502 | ) |
| | | | 2,800 USD | | | 09/20/2019 | | | | 41 | | | | (12,061,216 | ) | | | (156,005 | ) | | | (154,475 | ) | | | (1,530 | ) |
| | | | 2,825 USD | | | 09/20/2019 | | | | 41 | | | | (12,061,216 | ) | | | (175,685 | ) | | | (173,399 | ) | | | (2,286 | ) |
| | | | 2,850 USD | | | 09/20/2019 | | | | 40 | | | | (11,767,040 | ) | | | (193,400 | ) | | | (192,033 | ) | | | (1,367 | ) |
| | | | 2,875 USD | | | 09/20/2019 | | | | 39 | | | | (11,472,864 | ) | | | (212,550 | ) | | | (210,836 | ) | | | (1,714 | ) |
| | | | 2,900 USD | | | 09/20/2019 | | | | 39 | | | | (11,472,864 | ) | | | (239,850 | ) | | | (236,408 | ) | | | (3,442 | ) |
| | | | 2,925 USD | | | 09/20/2019 | | | | 38 | | | | (11,178,688 | ) | | | (264,100 | ) | | | (259,350 | ) | | | (4,750 | ) |
| | | | 2,950 USD | | | 09/20/2019 | | | | 37 | | | | (10,884,512 | ) | | | (291,005 | ) | | | (283,392 | ) | | | (7,613 | ) |
| | | | 2,775 USD | | | 07/19/2019 | | | | 47 | | | | (13,826,272 | ) | | | (30,315 | ) | | | (160,705 | ) | | | 130,390 | |
| | | | | 2,800 USD | | | 07/19/2019 | | | | 47 | | | | (13,826,272 | ) | | | (38,305 | ) | | | (182,415 | ) | | | 144,110 | |
| | | | | | |
| Total written options contracts | | | | | | | 1,654 | | | | | | | $ | (3,464,107 | ) | | $ | (6,349,405 | ) | | $ | 2,885,298 | |
| | |
| 38 | | The accompanying notes are an integral part of these financial statements. |
GOLDMAN SACHS ALTERNATIVE PREMIA FUND
Consolidated Schedule of Investments
June 30, 2019 (Unaudited)
| | | | | | | | |
| Shares | | | Dividend
Rate | | Value | |
|
| Investment Company(a) – 83.1% | |
| Goldman Sachs Financial Square Government Fund —
Institutional Shares |
|
| | 64,724,963 | | | 2.308% | | $ | 64,724,963 | |
| | |
| | TOTAL INVESTMENTS – 83.1% | |
| | (Cost $64,724,963) | | $ | 64,724,963 | |
| | |
| OTHER ASSETS IN EXCESS OF
LIABILITIES – 16.9% | | | 13,118,796 | |
| | |
| | NET ASSETS – 100.0% | | $ | 77,843,759 | |
| | |
| | |
|
| The percentage shown for each investment category reflects the value of investments in that category as a percentage of net assets. |
| |
(a) | | Represents an Affiliated Issuer. |
| | |
|
Currency Abbreviations: |
AUD | | —Australian Dollar |
BRL | | —Brazilian Real |
CAD | | —Canadian Dollar |
CHF | | —Swiss Franc |
CLP | | —Chilean Peso |
COP | | —Colombian Peso |
CZK | | —Czech Koruna |
EUR | | —Euro |
GBP | | —British Pound |
HUF | | —Hungarian Forint |
IDR | | —Indonesian Rupiah |
ILS | | —Israel New Shekel |
INR | | —Indian Rupee |
JPY | | —Japanese Yen |
KRW | | —South Korean Won |
MXN | | —Mexican Peso |
NOK | | —Norwegian Krone |
NZD | | —New Zealand Dollar |
PEN | | —Peru Nuevo Sol |
PHP | | —Philippines Peso |
PLN | | —Polish Zloty |
RUB | | —Russian Ruble |
SEK | | —Swedish Krona |
THB | | —Thailand Baht |
TWD | | —Taiwan Dollar |
USD | | —United States Dollar |
ZAR | | —South African Rand |
|
|
| ADDITIONAL INVESTMENT INFORMATION |
FORWARD FOREIGN CURRENCY EXCHANGE CONTRACTS — At June 30, 2019, the Fund had the following forward foreign currency exchange contracts:
FORWARD FOREIGN CURRENCY EXCHANGE CONTRACTS WITH UNREALIZED GAIN
| | | | | | | | | | | | | | | | | | | | |
| Counterparty | | Currency Purchased | | | Currency Sold | | | Settlement
Date | | | Unrealized
Gain | |
Morgan Stanley Co., Inc. | | BRL | | | 34,860,000 | | | USD | | | 8,537,590 | | | | 07/01/2019 | | | $ | 540,653 | |
| | CLP | | | 5,759,060,000 | | | USD | | | 8,418,119 | | | | 07/01/2019 | | | | 80,770 | |
| | CLP | | | 110,730,000 | | | USD | | | 163,006 | | | | 07/29/2019 | | | | 473 | |
| | COP | | | 18,962,960,000 | | | USD | | | 5,649,763 | | | | 07/03/2019 | | | | 251,017 | |
| | IDR | | | 96,519,640,000 | | | USD | | | 6,635,975 | | | | 07/01/2019 | | | | 196,065 | |
| | IDR | | | 103,362,170,000 | | | USD | | | 7,285,716 | | | | 07/29/2019 | | | | 8,760 | |
| | INR | | | 415,190,000 | | | USD | | | 5,933,152 | | | | 07/01/2019 | | | | 81,694 | |
| | INR | | | 377,780,000 | | | USD | | | 5,401,101 | | | | 07/29/2019 | | | | 56,955 | |
| | KRW | | | 14,590,930,000 | | | USD | | | 12,459,606 | | | | 07/01/2019 | | | | 177,064 | |
| | PEN | | | 1,130,000 | | | USD | | | 334,904 | | | | 07/01/2019 | | | | 8,269 | |
| | PEN | | | 2,000,000 | | | USD | | | 605,089 | | | | 07/31/2019 | | | | 1,497 | |
| | PHP | | | 263,840,000 | | | USD | | | 5,012,927 | | | | 07/01/2019 | | | | 136,677 | |
| | PHP | | | 284,490,000 | | | USD | | | 5,518,048 | | | | 07/29/2019 | | | | 29,047 | |
| | PLN | | | 350,000 | | | USD | | | 93,564 | | | | 07/23/2019 | | | | 179 | |
| | RUB | | | 640,360,000 | | | USD | | | 9,845,134 | | | | 07/01/2019 | | | | 281,336 | |
| | RUB | | | 554,450,000 | | | USD | | | 8,723,622 | | | | 07/29/2019 | | | | 14,415 | |
| | SEK | | | 980,000 | | | USD | | | 104,541 | | | | 07/23/2019 | | | | 1,166 | |
| | TWD | | | 117,260,000 | | | USD | | | 3,713,409 | | | | 07/01/2019 | | | | 61,926 | |
| | TWD | | | 9,800,000 | | | USD | | | 316,391 | | | | 07/29/2019 | | | | 458 | |
| | USD | | | 5,079,780 | | | BRL | | | 19,420,000 | | | | 07/01/2019 | | | | 22,423 | |
| | USD | | | 1,752,151 | | | COP | | | 5,592,180,000 | | | | 07/03/2019 | | | | 12,010 | |
| | USD | | | 271,359 | | | CZK | | | 6,060,000 | | | | 07/23/2019 | | | | 349 | |
| | |
| The accompanying notes are an integral part of these financial statements. | | 39 |
GOLDMAN SACHS ALTERNATIVE PREMIA FUND
Consolidated Schedule of Investments(continued)
June 30, 2019 (Unaudited)
|
| ADDITIONAL INVESTMENT INFORMATION (continued) |
FORWARD FOREIGN CURRENCY EXCHANGE CONTRACTS WITH UNREALIZED GAIN (continued)
| | | | | | | | | | | | | | | | | | | | |
| Counterparty | | Currency Purchased | | | Currency Sold | | | Settlement
Date | | | Unrealized
Gain | |
Morgan Stanley Co., Inc. (continued) | | | | | | | | | | | | | | | | | | | | |
| | USD | | | 1,562,013 | | | MXN | | | 29,940,000 | | | | 07/23/2019 | | | $ | 7,605 | |
| | USD | | | 4,615,883 | | | TWD | | | 142,400,000 | | | | 07/29/2019 | | | | 11,875 | |
| | | ZAR | | | 41,660,000 | | | USD | | | 2,906,706 | | | | 07/23/2019 | | | | 43,158 | |
| | | | | | |
| TOTAL | | | | | | | | | | | | | | | | | | $ | 2,025,841 | |
FORWARD FOREIGN CURRENCY EXCHANGE CONTRACTS WITH UNREALIZED LOSS
| | | | | | | | | | | | | | | | | | | | |
| Counterparty | | Currency Purchased | | | Currency Sold | | | Settlement
Date | | | Unrealized
Loss | |
Morgan Stanley Co., Inc. | | BRL | | | 36,270,000 | | | USD | | | 9,466,670 | | | | 07/29/2019 | | | $ | (45,376 | ) |
| | COP | | | 6,189,190,000 | | | USD | | | 1,933,779 | | | | 07/29/2019 | | | | (11,887 | ) |
| | CZK | | | 2,400,000 | | | USD | | | 107,457 | | | | 07/23/2019 | | | | (127 | ) |
| | IDR | | | 20,961,160,000 | | | USD | | | 1,479,305 | | | | 07/29/2019 | | | | (34 | ) |
| | INR | | | 78,720,000 | | | USD | | | 1,137,572 | | | | 07/29/2019 | | | | (249 | ) |
| | KRW | | | 180,480,000 | | | USD | | | 156,271 | | | | 07/29/2019 | | | | (207 | ) |
| | NOK | | | 1,390,000 | | | USD | | | 163,850 | | | | 07/23/2019 | | | | (786 | ) |
| | PHP | | | 54,520,000 | | | USD | | | 1,063,349 | | | | 07/29/2019 | | | | (297 | ) |
| | RUB | | | 103,480,000 | | | USD | | | 1,637,308 | | | | 07/29/2019 | | | | (6,481 | ) |
| | SEK | | | 930,000 | | | USD | | | 100,588 | | | | 07/23/2019 | | | | (273 | ) |
| | TWD | | | 173,470,000 | | | USD | | | 5,613,265 | | | | 07/01/2019 | | | | (28,179 | ) |
| | USD | | | 3,923,009 | | | BRL | | | 15,440,000 | | | | 07/01/2019 | | | | (97,877 | ) |
| | USD | | | 8,229,976 | | | CLP | | | 5,759,060,000 | | | | 07/01/2019 | | | | (268,914 | ) |
| | USD | | | 7,033,269 | | | CLP | | | 4,790,460,000 | | | | 07/29/2019 | | | | (39,242 | ) |
| | USD | | | 3,954,372 | | | COP | | | 13,370,780,000 | | | | 07/03/2019 | | | | (206,267 | ) |
| | USD | | | 2,234,378 | | | CZK | | | 50,500,000 | | | | 07/23/2019 | | | | (24,034 | ) |
| | USD | | | 163,855 | | | HUF | | | 46,810,000 | | | | 07/23/2019 | | | | (906 | ) |
| | USD | | | 6,800,816 | | | IDR | | | 96,519,640,000 | | | | 07/01/2019 | | | | (31,224 | ) |
| | USD | | | 4,395,745 | | | ILS | | | 15,830,000 | | | | 07/23/2019 | | | | (45,774 | ) |
| | USD | | | 5,959,611 | | | INR | | | 415,190,000 | | | | 07/01/2019 | | | | (55,237 | ) |
| | USD | | | 12,252,958 | | | KRW | | | 14,590,930,000 | | | | 07/01/2019 | | | | (383,711 | ) |
| | USD | | | 6,068,418 | | | KRW | | | 7,035,280,000 | | | | 07/29/2019 | | | | (15,116 | ) |
| | USD | | | 3,380,618 | | | NOK | | | 28,880,000 | | | | 07/23/2019 | | | | (7,365 | ) |
| | USD | | | 934,887 | | | PEN | | | 3,130,000 | | | | 07/01/2019 | | | | (15,672 | ) |
| | USD | | | 5,108,524 | | | PHP | | | 263,840,000 | | | | 07/01/2019 | | | | (41,081 | ) |
| | USD | | | 287,609 | | | PLN | | | 1,080,000 | | | | 07/23/2019 | | | | (1,652 | ) |
| | USD | | | 10,000,923 | | | RUB | | | 640,360,000 | | | | 07/01/2019 | | | | (125,548 | ) |
| | USD | | | 402,248 | | | THB | | | 12,380,000 | | | | 07/23/2019 | | | | (1,436 | ) |
| | USD | | | 9,223,733 | | | TWD | | | 290,730,000 | | | | 07/01/2019 | | | | (136,687 | ) |
| | | USD | | | 718,252 | | | TWD | | | 22,220,000 | | | | 07/29/2019 | | | | (154 | ) |
| | | | | | |
| TOTAL | | | | | | | | | | | | | | | | | | $ | (1,591,793 | ) |
FUTURES CONTRACTS — At June 30, 2019, the Fund had the following futures contracts:
| | | | | | | | | | | | | | | | |
| Description | | Number of
Contracts | | | Expiration
Date | | | Notional
Amount | | | Unrealized
Appreciation/
(Depreciation) | |
Long position contracts: | | | | | | | | | | | | | | | | |
3 Month Canadian Bankers Acceptance | | | 6 | | | | 09/16/2019 | | | $ | 1,123,096 | | | $ | 3,630 | |
3 Month Canadian Bankers Acceptance | | | 6 | | | | 12/16/2019 | | | | 1,123,554 | | | | 3,364 | |
| | |
| 40 | | The accompanying notes are an integral part of these financial statements. |
GOLDMAN SACHS ALTERNATIVE PREMIA FUND
|
| ADDITIONAL INVESTMENT INFORMATION (continued) |
FUTURES CONTRACTS (continued)
| | | | | | | | | | | | | | | | |
| Description | | Number of
Contracts | | | Expiration
Date | | | Notional
Amount | | | Unrealized
Appreciation/
(Depreciation) | |
Long position contracts: (continued) | | | | | | | | | | | | | | | | |
3 Month Canadian Bankers Acceptance | | | 6 | | | | 03/16/2020 | | | $ | 1,124,757 | | | $ | 729 | |
3 Month Eurodollar | | | 10 | | | | 09/16/2019 | | | | 2,449,750 | | | | 17,839 | |
3 Month Eurodollar | | | 11 | | | | 12/16/2019 | | | | 2,697,338 | | | | 20,825 | |
3 Month Eurodollar | | | 11 | | | | 03/16/2020 | | | | 2,702,700 | | | | 24,562 | |
3 Month Eurodollar | | | 13 | | | | 06/15/2020 | | | | 3,197,187 | | | | 31,320 | |
3 Month Eurodollar | | | 14 | | | | 09/14/2020 | | | | 3,445,400 | | | | 35,568 | |
3 Month Eurodollar | | | 13 | | | | 12/14/2020 | | | | 3,199,300 | | | | 33,195 | |
3 Month Eurodollar | | | 12 | | | | 03/15/2021 | | | | 2,953,950 | | | | 24,554 | |
3 Month Eurodollar | | | 12 | | | | 06/14/2021 | | | | 2,953,050 | | | | 13,509 | |
3 Month Sterling | | | 10 | | | | 09/18/2019 | | | | 1,574,976 | | | | 3,189 | |
3 Month Sterling | | | 10 | | | | 12/18/2019 | | | | 1,574,500 | | | | 3,369 | |
3 Month Sterling | | | 11 | | | | 03/18/2020 | | | | 1,732,736 | | | | 4,293 | |
3 Month Sterling | | | 11 | | | | 06/17/2020 | | | | 1,733,085 | | | | 5,557 | |
3 Month Sterling | | | 10 | | | | 09/16/2020 | | | | 1,575,690 | | | | 5,833 | |
3 Month Sterling | | | 10 | | | | 12/16/2020 | | | | 1,575,214 | | | | 5,467 | |
3 Month Sterling | | | 10 | | | | 03/17/2021 | | | | 1,575,373 | | | | 4,584 | |
3 Month Sterling | | | 9 | | | | 06/16/2021 | | | | 1,417,621 | | | | 3,501 | |
Amsterdam Exchange Index | | | 3 | | | | 07/19/2019 | | | | 382,700 | | | | 1,023 | |
ASX 90 Day Bank Accepted Bill | | | 4 | | | | 09/12/2019 | | | | 2,800,535 | | | | 4,727 | |
ASX 90 Day Bank Accepted Bill | | | 4 | | | | 12/12/2019 | | | | 2,801,155 | | | | 4,254 | |
ASX 90 Day Bank Accepted Bill | | | 4 | | | | 03/12/2020 | | | | 2,801,637 | | | | 1,847 | |
Australia 10 Year Bond | | | 114 | | | | 09/16/2019 | | | | 11,469,121 | | | | 50,576 | |
Brent Crude Oil | | | 52 | | | | 10/31/2019 | | | | 3,292,120 | | | | 129,482 | |
CAC 40 10 Euro Index | | | 7 | | | | 07/19/2019 | | | | 440,410 | | | | 1,323 | |
Cocoa | | | 132 | | | | 12/13/2019 | | | | 3,260,400 | | | | 139,274 | |
Coffee ’C’ | | | 83 | | | | 12/18/2019 | | | | 3,528,019 | | | | 405,357 | |
Copper | | | 7 | | | | 09/26/2019 | | | | 474,863 | | | | 6,901 | |
Copper | | | 49 | | | | 12/27/2019 | | | | 3,332,612 | | | | (57,675 | ) |
Corn | | | 145 | | | | 12/13/2019 | | | | 3,153,750 | | | | 272,924 | |
Cotton No. 2 | | | 24 | | | | 12/06/2019 | | | | 792,480 | | | | (835 | ) |
DAX Index | | | 2 | | | | 09/20/2019 | | | | 704,320 | | | | 3,108 | |
EURO STOXX 50 Index | | | 29 | | | | 09/20/2019 | | | | 1,142,945 | | | | 7,078 | |
Euro-Bobl | | | 14 | | | | 09/06/2019 | | | | 2,140,204 | | | | 7,100 | |
Euro-BTP | | | 6 | | | | 09/06/2019 | | | | 915,183 | | | | 23,364 | |
Euro-Bund | | | 69 | | | | 09/06/2019 | | | | 13,551,593 | | | | 119,877 | |
Euro-Buxl | | | 2 | | | | 09/06/2019 | | | | 461,208 | | | | 5,910 | |
Euro-OAT | | | 5 | | | | 09/06/2019 | | | | 937,823 | | | | 12,624 | |
Euro-Schatz | | | 11 | | | | 09/06/2019 | | | | 1,404,472 | | | | 2,114 | |
Foreign Exchange AUD/USD | | | 51 | | | | 09/16/2019 | | | | 3,588,870 | | | | 42,852 | |
Foreign Exchange CHF/USD | | | 21 | | | | 09/16/2019 | | | | 2,707,950 | | | | 28,331 | |
FTSE 100 Index | | | 5 | | | | 09/20/2019 | | | | 467,913 | | | | (240 | ) |
FTSE/JSE Top 40 Index | | | 6 | | | | 09/19/2019 | | | | 223,352 | | | | (74 | ) |
FTSE/MIB Index | | | 2 | | | | 09/20/2019 | | | | 240,565 | | | | 984 | |
Hang Seng Index | | | 1 | | | | 07/30/2019 | | | | 182,451 | | | | (176 | ) |
IBEX 35 Index | | | 1 | | | | 07/19/2019 | | | | 104,306 | | | | 157 | |
Japan 10 Year Bond | | | 7 | | | | 09/12/2019 | | | | 9,991,467 | | | | 2,386 | |
KC HRW Wheat | | | 133 | | | | 12/13/2019 | | | | 3,226,912 | | | | 241,522 | |
Lean Hogs | | | 120 | | | | 12/13/2019 | | | | 3,426,000 | | | | (222,248 | ) |
Live Cattle | | | 76 | | | | 12/31/2019 | | | | 3,357,680 | | | | (4,879 | ) |
LME Aluminum Base Metal | | | 270 | | | | 07/17/2019 | | | | 12,030,187 | | | | (368,293 | ) |
| | |
| The accompanying notes are an integral part of these financial statements. | | 41 |
GOLDMAN SACHS ALTERNATIVE PREMIA FUND
Consolidated Schedule of Investments(continued)
June 30, 2019 (Unaudited)
|
| ADDITIONAL INVESTMENT INFORMATION (continued) |
FUTURES CONTRACTS (continued)
| | | | | | | | | | | | | | | | |
| Description | | Number of
Contracts | | | Expiration
Date | | | Notional
Amount | | | Unrealized
Appreciation/
(Depreciation) | |
Long position contracts: (continued) | | | | | | | | | | | | | | | | |
LME Aluminum Base Metal | | | 125 | | | | 08/21/2019 | | | $ | 5,602,344 | | | $ | (294,671 | ) |
LME Aluminum Base Metal | | | 103 | | | | 09/18/2019 | | | | 4,635,644 | | | | (248,009 | ) |
LME Aluminum Base Metal | | | 98 | | | | 10/16/2019 | | | | 4,424,087 | | | | (105,010 | ) |
LME Aluminum Base Metal | | | 73 | | | | 11/20/2019 | | | | 3,313,744 | | | | 29,560 | |
LME Lead Base Metal | | | 46 | | | | 07/17/2019 | | | | 2,214,325 | | | | 112,983 | |
LME Lead Base Metal | | | 32 | | | | 08/21/2019 | | | | 1,544,800 | | | | 24,093 | |
LME Nickel Base Metal | | | 53 | | | | 07/17/2019 | | | | 4,019,520 | | | | 203,839 | |
LME Nickel Base Metal | | | 24 | | | | 08/21/2019 | | | | 1,825,344 | | | | 212,655 | |
LME Nickel Base Metal | | | 21 | | | | 09/18/2019 | | | | 1,600,830 | | | | 171,688 | |
LME Nickel Base Metal | | | 14 | | | | 10/16/2019 | | | | 1,066,884 | | | | (35,439 | ) |
LME Zinc Base Metal | | | 164 | | | | 07/17/2019 | | | | 10,434,500 | | | | (359,091 | ) |
LME Zinc Base Metal | | | 112 | | | | 08/21/2019 | | | | 7,019,600 | | | | (223,663 | ) |
LME Zinc Base Metal | | | 72 | | | | 09/18/2019 | | | | 4,501,800 | | | | (409,875 | ) |
LME Zinc Base Metal | | | 68 | | | | 10/16/2019 | | | | 4,238,100 | | | | (290,272 | ) |
LME Zinc Base Metal | | | 53 | | | | 11/20/2019 | | | | 3,297,925 | | | | 29,037 | |
Long Gilt | | | 53 | | | | 09/26/2019 | | | | 8,774,186 | | | | 26,416 | |
Low Sulphur Gasoil | | | 56 | | | | 11/12/2019 | | | | 3,322,200 | | | | 121,029 | |
MSCI Taiwan Index | | | 6 | | | | 07/30/2019 | | | | 231,900 | | | | (540 | ) |
NASDAQ 100E-Mini Index | | | 4 | | | | 09/20/2019 | | | | 615,500 | | | | 4,401 | |
Natural Gas | | | 139 | | | | 10/29/2019 | | | | 3,344,340 | | | | (66,911 | ) |
NY Harbor ULSD | | | 41 | | | | 10/31/2019 | | | | 3,357,728 | | | | 136,894 | |
OMXS30 Index | | | 14 | | | | 07/19/2019 | | | | 244,348 | | | | 4,044 | |
RBOB Gasoline | | | 49 | | | | 10/31/2019 | | | | 3,387,262 | | | | 227,628 | |
S&P 500E-Mini Index | | | 56 | | | | 09/20/2019 | | | | 8,243,760 | | | | 92,959 | |
S&P/TSX 60 Index | | | 3 | | | | 09/19/2019 | | | | 447,955 | | | | 533 | |
SET50 Index | | | 42 | | | | 09/27/2019 | | | | 314,498 | | | | 1,157 | |
Sugar No. 11 | | | 220 | | | | 02/28/2020 | | | | 3,326,400 | | | | (16,003 | ) |
U.S. Treasury 2 Year Note | | | 18 | | | | 09/30/2019 | | | | 3,872,531 | | | | 17,487 | |
U.S. Treasury 5 Year Note | | | 28 | | | | 09/30/2019 | | | | 3,307,281 | | | | 38,568 | |
U.S. Treasury Long Bond | | | 12 | | | | 09/19/2019 | | | | 1,866,000 | | | | 37,626 | |
Wheat | | | 120 | | | | 12/13/2019 | | | | 3,223,500 | | | | 342,659 | |
WTI Crude Oil | | | 57 | | | | 10/22/2019 | | | | 3,292,320 | | | | 195,502 | |
| | | | |
| Total | | | | | | | | | | | | | | $ | 1,086,837 | |
| | | | |
Short position contracts: | | | | | | | | | | | | | | | | |
100 oz Gold | | | (9 | ) | | | 08/28/2019 | | | | (1,272,960 | ) | | | (48,575 | ) |
Brent Crude Oil | | | (27 | ) | | | 07/31/2019 | | | | (1,733,670 | ) | | | (69,744 | ) |
Canada 10 Year Bond | | | (97 | ) | | | 09/19/2019 | | | | (10,590,707 | ) | | | (8,607 | ) |
CBOE Volatility Index | | | (56 | ) | | | 07/17/2019 | | | | (869,400 | ) | | | 34,513 | |
CBOE Volatility Index | | | (54 | ) | | | 08/21/2019 | | | | (895,050 | ) | | | 19,048 | |
CBOE Volatility Index | | | (53 | ) | | | 09/18/2019 | | | | (897,025 | ) | | | 10,989 | |
Cocoa | | | (182 | ) | | | 09/13/2019 | | | | (4,431,700 | ) | | | 58,427 | |
Coffee ’C’ | | | (99 | ) | | | 09/18/2019 | | | | (4,074,469 | ) | | | (247,493 | ) |
Corn | | | (330 | ) | | | 09/13/2019 | | | | (7,045,500 | ) | | | 7,649 | |
Feeder Cattle | | | (21 | ) | | | 08/29/2019 | | | | (1,435,350 | ) | | | 12,621 | |
Foreign Exchange CAD/USD | | | (45 | ) | | | 09/17/2019 | | | | (3,440,925 | ) | | | (25,200 | ) |
Foreign Exchange EUR/USD | | | (32 | ) | | | 09/16/2019 | | | | (4,576,600 | ) | | | (26,192 | ) |
Foreign Exchange GBP/USD | | | (19 | ) | | | 09/16/2019 | | | | (1,513,231 | ) | | | (237 | ) |
Foreign Exchange JPY/USD | | | (61 | ) | | | 09/16/2019 | | | | (7,112,219 | ) | | | (16,026 | ) |
Foreign Exchange NZD/USD | | | (11 | ) | | | 09/16/2019 | | | | (739,970 | ) | | | (16,475 | ) |
HSCEI | | | (2 | ) | | | 07/30/2019 | | | | (138,702 | ) | | | (54 | ) |
KC HRW Wheat | | | (157 | ) | | | 09/13/2019 | | | | (3,630,625 | ) | | | 15,584 | |
KOSPI 200 Index | | | (4 | ) | | | 09/11/2019 | | | | (241,112 | ) | | | (4,538 | ) |
| | |
| 42 | | The accompanying notes are an integral part of these financial statements. |
GOLDMAN SACHS ALTERNATIVE PREMIA FUND
|
| ADDITIONAL INVESTMENT INFORMATION (continued) |
FUTURES CONTRACTS (continued)
| | | | | | | | | | | | | | | | |
| Description | | Number of
Contracts | | | Expiration
Date | | | Notional
Amount | | | Unrealized
Appreciation/
(Depreciation) | |
Short position contracts: (continued) | | | | | | | | | | | | | | | | |
Lean Hogs | | | (172 | ) | | | 08/14/2019 | | | $ | (5,252,880 | ) | | $ | 384,568 | |
Live Cattle | | | (119 | ) | | | 08/30/2019 | | | | (4,961,110 | ) | | | 61,307 | |
LME Aluminum Base Metal | | | (270 | ) | | | 07/17/2019 | | | | (12,030,188 | ) | | | 386,077 | |
LME Aluminum Base Metal | | | (217 | ) | | | 08/21/2019 | | | | (9,725,669 | ) | | | 209,062 | |
LME Aluminum Base Metal | | | (103 | ) | | | 09/18/2019 | | | | (4,635,644 | ) | | | 118,123 | |
LME Aluminum Base Metal | | | (98 | ) | | | 10/16/2019 | | | | (4,424,087 | ) | | | 55,860 | |
LME Lead Base Metal | | | (46 | ) | | | 07/17/2019 | | | | (2,214,325 | ) | | | (90,150 | ) |
LME Lead Base Metal | | | (32 | ) | | | 08/21/2019 | | | | (1,544,800 | ) | | | (78,412 | ) |
LME Nickel Base Metal | | | (53 | ) | | | 07/17/2019 | | | | (4,019,520 | ) | | | (259,884 | ) |
LME Nickel Base Metal | | | (35 | ) | | | 08/21/2019 | | | | (2,661,960 | ) | | | (257,225 | ) |
LME Nickel Base Metal | | | (21 | ) | | | 09/18/2019 | | | | (1,600,830 | ) | | | 40,384 | |
LME Nickel Base Metal | | | (14 | ) | | | 10/16/2019 | | | | (1,066,884 | ) | | | 33,525 | |
LME Zinc Base Metal | | | (164 | ) | | | 07/17/2019 | | | | (10,434,500 | ) | | | 339,614 | |
LME Zinc Base Metal | | | (112 | ) | | | 08/21/2019 | | | | (7,019,600 | ) | | | 400,292 | |
LME Zinc Base Metal | | | (72 | ) | | | 09/18/2019 | | | | (4,501,800 | ) | | | 322,075 | |
LME Zinc Base Metal | | | (68 | ) | | | 10/16/2019 | | | | (4,238,100 | ) | | | 55,206 | |
Low Sulphur Gasoil | | | (57 | ) | | | 08/12/2019 | | | | (3,355,875 | ) | | | (105,740 | ) |
Natural Gas | | | (67 | ) | | | 07/29/2019 | | | | (1,549,710 | ) | | | 10,245 | |
NY Harbor ULSD | | | (27 | ) | | | 07/31/2019 | | | | (2,187,826 | ) | | | (57,139 | ) |
RBOB Gasoline | | | (2 | ) | | | 07/31/2019 | | | | (158,298 | ) | | | 980 | |
Silver | | | (19 | ) | | | 09/26/2019 | | | | (1,458,250 | ) | | | (42,839 | ) |
Soybean | | | (93 | ) | | | 11/14/2019 | | | | (4,291,950 | ) | | | (123,798 | ) |
Sugar No. 11 | | | (335 | ) | | | 09/30/2019 | | | | (4,723,768 | ) | | | 1,577 | |
TOPIX Index | | | (2 | ) | | | 09/12/2019 | | | | (287,715 | ) | | | 225 | |
U.S. Treasury 10 Year Note | | | (101 | ) | | | 09/19/2019 | | | | (12,918,531 | ) | | | (67,156 | ) |
Wheat | | | (93 | ) | | | 09/13/2019 | | | | (2,436,600 | ) | | | (28,443 | ) |
WTI Crude Oil | | | (62 | ) | | | 07/22/2019 | | | | (3,595,380 | ) | | | (199,905 | ) |
| |
| Total | | | $ | 804,119 | |
| |
| Total Futures Contracts | | | $ | 1,890,956 | |
SWAP CONTRACTS — At June 30, 2019, the Fund had the following swap contracts:
CENTRALLY CLEARED CREDIT DEFAULT SWAP CONTRACTS
| | | | | | | | | | | | | | | | | | | | | | | | | | |
| Reference Obligation/Index(a) | | Financing Rate
Received (Paid)
by the Fund | | | Credit
Spread at
June 30,
2019(b) | | Termination
Date | | | Notional
Amount
(000’s) | | | Value | | | Upfront
Premium
(Received)
Paid | | | Unrealized
Appreciation/
(Depreciation) | |
Protection Sold: | | | | | | | | | | | | | | | | | | | | | | | | | | |
iTraxx Europe Crossover Index | | | 5.000% | | | 2.540% | | | 06/20/2024 | | | EUR | 450 | | | $ | 58,364 | | | $ | 51,924 | | | $ | 6,440 | |
iTraxx Europe Index | | | 1.000 | | | 0.523 | | | 06/20/2024 | | | | 1,500 | | | | 41,018 | | | | 30,248 | | | | 10,770 | |
Markit CDX North America High Yield Index | | | 5.000 | | | 3.248 | | | 06/20/2024 | | | USD | 650 | | | | 49,888 | | | | 41,165 | | | | 8,723 | |
Markit CDX North America Investment Grade Index | | | 1.000 | | | 0.545 | | | 06/20/2024 | | | | 1650 | | | | 35,832 | | | | 29,004 | | | | 6,828 | |
| | | | | | | |
| TOTAL | | | | | | | | | | | | | | | | $ | 185,102 | | | $ | 152,341 | | | $ | 32,761 | |
| | (a) | | Payments received quarterly. |
| | (b) | | Credit spread on the referenced obligation, together with the period of expiration, are indicators of payment/performance risk. The likelihood of a credit event occurring which would require a fund or its counterparty to make a payment or otherwise be required to perform under the swap contract is generally greater as the credit spread and term of the swap contract increase. |
| | |
| The accompanying notes are an integral part of these financial statements. | | 43 |
GOLDMAN SACHS ALTERNATIVE PREMIA FUND
Consolidated Schedule of Investments(continued)
June 30, 2019 (Unaudited)
|
| ADDITIONAL INVESTMENT INFORMATION (continued) |
OVER THE COUNTER TOTAL RETURN SWAP CONTRACTS
| | | | | | | | | | | | | | | | | | |
| Referenced Obligation/ Index | | Financing
Rate Received
(Paid) by the
Fund | | | Counterparty | | Termination
Date | | | Notional
Amount
(000’s) | | | Unrealized
Appreciation/
(Depreciation)(a) | |
A basket (DBGSFDJP) of common stocks(b)* | | | (0.064)% | | | Deutsche Bank AG | | | 09/17/2019 | | | JPY | 7,733,107 | | | $ | 19,419 | |
TOPIX Total Retun Index(c) | | | 0.064 | | | | | | 09/17/2019 | | | JPY | 7,585,399 | | | | 96,728 | |
A basket (JPGSFDUK) of common stocks(b)* | | | (0.722) | | | JPMorgan Chase Bank NA | | | 08/05/2019 | | | GBP | 13,498 | | | | 74,104 | |
A basket (JPGSFDUS) of common stocks(b)* | | | (2.404) | | | | | | 08/30/2019 | | | USD | 57,563 | | | | 581,807 | |
Euro Stoxx Gross Total Return Index(c) | | | (0.396) | | | | | | 12/16/2019 | | | EUR | 4,776 | | | | 9,616 | |
Euro Stoxx Gross Total Return Index(c) | | | 0.396 | | | | | | 12/16/2019 | | | EUR | 35,263 | | | | (20,119 | ) |
A basket (JPGSFDEU) of common stocks(b)* | | | (0.396) | | | | | | 12/16/2019 | | | EUR | 36,814 | | | | 37,833 | |
A basket (JPGSFDEU) of common stocks(b)* | | | 0.396 | | | | | | 12/16/2019 | | | EUR | 5,624 | | | | (18,391 | ) |
FTSE 100 Total Return Index(c) | | | 0.722 | | | | | | 08/05/2019 | | | GBP | 12,305 | | | | (18,497 | ) |
S&P 500 Total Return Index(c) | | | 2.404 | | | | | | 08/30/2019 | | | USD | 49,961 | | | | (486,088 | ) |
| | | | | |
| TOTAL | | | | | | | | | | | | | | | | $ | 276,412 | |
| | (a) | | There are no upfront payments on the swap contracts listed above; therefore the unrealized gains (losses) on the swap contracts are equal to their value. |
| | (b) | | Payments made weekly. |
| | (c) | | Payments received weekly. |
| | * | | The components of the basket shown below. |
A basket (DBGSFDJP) of common stocks
| | | | | | | | | | | | | | |
| Common Stocks | | Sector | | Shares | | | Value | | | Weight | |
Sony Corp | | Consumer Discretionary | | | 38,122 | | | $ | 1,995,863 | | | | 2.78 | % |
Nippon Telegraph & Telephone Corp | | Communication Services | | | 39,875 | | | | 1,854,419 | | | | 2.59 | |
NTT DOCOMO Inc | | Communication Services | | | 71,395 | | | | 1,662,772 | | | | 2.32 | |
FANUC Corp | | Industrials | | | 7,599 | | | | 1,403,904 | | | | 1.96 | |
Recruit Holdings Co Ltd | | Industrials | | | 41,723 | | | | 1,389,993 | | | | 1.94 | |
Seven & i Holdings Co Ltd | | Consumer Staples | | | 34,887 | | | | 1,179,723 | | | | 1.64 | |
Tokio Marine Holdings Inc | | Financials | | | 23,165 | | | | 1,159,300 | | | | 1.62 | |
Nidec Corp | | Industrials | | | 8,319 | | | | 1,135,492 | | | | 1.58 | |
Canon Inc | | Information Technology | | | 36,446 | | | | 1,062,827 | | | | 1.48 | |
Hoya Corp | | Health Care | | | 13,561 | | | | 1,037,573 | | | | 1.45 | |
Astellas Pharma Inc | | Health Care | | | 66,734 | | | | 949,538 | | | | 1.32 | |
Tokyo Electron Ltd | | Information Technology | | | 6,752 | | | | 946,355 | | | | 1.32 | |
Daikin Industries Ltd | | Industrials | | | 6,946 | | | | 905,532 | | | | 1.26 | |
Dai-ichi Life Holdings Inc | | Financials | | | 55,617 | | | | 837,762 | | | | 1.17 | |
Nissan Motor Co Ltd | | Consumer Discretionary | | | 115,285 | | | | 824,567 | | | | 1.15 | |
FUJIFILM Holdings Corp | | Information Technology | | | 15,492 | | | | 784,489 | | | | 1.09 | |
Eisai Co Ltd | | Health Care | | | 13,612 | | | | 768,531 | | | | 1.07 | |
ORIX Corp | | Financials | | | 48,368 | | | | 720,955 | | | | 1.01 | |
Panasonic Corp | | Consumer Discretionary | | | 84,558 | | | | 703,557 | | | | 0.98 | |
Mitsubishi Estate Co Ltd | | Real Estate | | | 37,251 | | | | 692,331 | | | | 0.97 | |
Omron Corp | | Information Technology | | | 13,279 | | | | 691,755 | | | | 0.96 | |
Kyocera Corp | | Information Technology | | | 10,381 | | | | 676,988 | | | | 0.94 | |
Resona Holdings Inc | | Financials | | | 151,032 | | | | 628,038 | | | | 0.88 | |
Mitsubishi Heavy Industries Ltd | | Industrials | | | 14,256 | | | | 619,913 | | | | 0.86 | |
Bridgestone Corp | | Consumer Discretionary | | | 15,729 | | | | 618,506 | | | | 0.86 | |
Disco Corp | | Information Technology | | | 3,630 | | | | 594,915 | | | | 0.83 | |
Nitori Holdings Co Ltd | | Consumer Discretionary | | | 4,331 | | | | 573,339 | | | | 0.80 | |
PeptiDream Inc | | Health Care | | | 11,090 | | | | 566,407 | | | | 0.79 | |
Japan Airlines Co Ltd | | Industrials | | | 17,246 | | | | 550,397 | | | | 0.77 | |
Takeda Pharmaceutical Co Ltd | | Health Care | | | 15,505 | | | | 549,447 | | | | 0.77 | |
Sumitomo Corp | | Industrials | | | 34,589 | | | | 523,427 | | | | 0.73 | |
Toray Industries Inc | | Materials | | | 68,193 | | | | 517,832 | | | | 0.72 | |
Nitto Denko Corp | | Materials | | | 10,375 | | | | 511,361 | | | | 0.71 | |
Unicharm Corp | | Consumer Staples | | | 16,836 | | | | 506,264 | | | | 0.71 | |
| | |
| 44 | | The accompanying notes are an integral part of these financial statements. |
GOLDMAN SACHS ALTERNATIVE PREMIA FUND
|
| ADDITIONAL INVESTMENT INFORMATION (continued) |
OVER THE COUNTER TOTAL RETURN SWAP CONTRACTS (continued)
| | | | | | | | | | | | | | |
| Common Stocks | | Sector | | Shares | | | Value | | | Weight | |
Olympus Corp | | Health Care | | | 45,295 | | | $ | 502,155 | | | | 0.70 | % |
West Japan Railway Co | | Industrials | | | 6,207 | | | | 501,516 | | | | 0.70 | |
Tokyo Electric Power Co Holdings Inc | | Utilities | | | 96,117 | | | | 500,721 | | | | 0.70 | |
SBI Holdings Inc/Japan | | Financials | | | 19,716 | | | | 487,425 | | | | 0.68 | |
Chugai Pharmaceutical Co Ltd | | Health Care | | | 7,445 | | | | 485,845 | | | | 0.68 | |
MINEBEA MITSUMI Inc | | Industrials | | | 28,694 | | | | 485,408 | | | | 0.68 | |
KDDI Corp | | Communication Services | | | 18,196 | | | | 462,732 | | | | 0.65 | |
Mazda Motor Corp | | Consumer Discretionary | | | 44,275 | | | | 461,506 | | | | 0.64 | |
Pan Pacific International Holdings Corp | | Consumer Discretionary | | | 7,254 | | | | 459,929 | | | | 0.64 | |
Sompo Holdings Inc | | Financials | | | 11,821 | | | | 455,939 | | | | 0.64 | |
MonotaRO Co Ltd | | Industrials | | | 18,245 | | | | 444,128 | | | | 0.62 | |
Yamato Holdings Co Ltd | | Industrials | | | 21,642 | | | | 439,545 | | | | 0.61 | |
Kao Corp | | Consumer Staples | | | 5,687 | | | | 432,811 | | | | 0.60 | |
IHI Corp | | Industrials | | | 17,147 | | | | 412,773 | | | | 0.58 | |
CyberAgent Inc | | Communication Services | | | 11,384 | | | | 412,085 | | | | 0.57 | |
JXTG Holdings Inc | | Energy | | | 80,773 | | | | 400,124 | | | | 0.56 | |
Ono Pharmaceutical Co Ltd | | Health Care | | | 21,577 | | | | 386,418 | | | | 0.54 | |
NTT Data Corp | | Information Technology | | | 28,936 | | | | 384,903 | | | | 0.54 | |
Oriental Land Co Ltd/Japan | | Consumer Discretionary | | | 3,061 | | | | 378,571 | | | | 0.53 | |
GungHo Online Entertainment Inc | | Communication Services | | | 13,173 | | | | 363,878 | | | | 0.51 | |
Trend Micro Inc/Japan | | Information Technology | | | 8,150 | | | | 363,010 | | | | 0.51 | |
MS&AD Insurance Group Holdings Inc | | Financials | | | 11,062 | | | | 350,688 | | | | 0.49 | |
Hitachi Chemical Co Ltd | | Materials | | | 12,809 | | | | 347,419 | | | | 0.48 | |
Alps Alpine Co Ltd | | Information Technology | | | 20,102 | | | | 338,392 | | | | 0.47 | |
Park24 Co Ltd | | Industrials | | | 14,339 | | | | 333,490 | | | | 0.46 | |
Tokyo Gas Co Ltd | | Utilities | | | 14,175 | | | | 333,416 | | | | 0.46 | |
Central Japan Railway Co | | Industrials | | | 1,664 | | | | 332,913 | | | | 0.46 | |
Bandai Namco Holdings Inc | | Consumer Discretionary | | | 6,754 | | | | 327,418 | | | | 0.46 | |
Yamaha Corp | | Consumer Discretionary | | | 6,747 | | | | 320,204 | | | | 0.45 | |
LIXIL Group Corp | | Industrials | | | 20,041 | | | | 316,553 | | | | 0.44 | |
MEIJI Holdings Co Ltd | | Consumer Staples | | | 4,422 | | | | 315,616 | | | | 0.44 | |
Lawson Inc | | Consumer Staples | | | 6,586 | | | | 315,608 | | | | 0.44 | |
MISUMI Group Inc | | Industrials | | | 12,175 | | | | 304,949 | | | | 0.43 | |
NSK Ltd | | Industrials | | | 34,150 | | | | 303,892 | | | | 0.42 | |
Konica Minolta Inc | | Information Technology | | | 30,679 | | | | 298,319 | | | | 0.42 | |
Mitsui Mining & Smelting Co Ltd | | Materials | | | 12,290 | | | | 293,458 | | | | 0.41 | |
Koito Manufacturing Co Ltd | | Consumer Discretionary | | | 5,489 | | | | 292,575 | | | | 0.41 | |
Yakult Honsha Co Ltd | | Consumer Staples | | | 4,847 | | | | 285,301 | | | | 0.40 | |
Ajinomoto Co Inc | | Consumer Staples | | | 16,102 | | | | 278,808 | | | | 0.39 | |
Kirin Holdings Co Ltd | | Consumer Staples | | | 12,821 | | | | 276,146 | | | | 0.38 | |
Japan Tobacco Inc | | Consumer Staples | | | 12,506 | | | | 275,846 | | | | 0.38 | |
Asahi Group Holdings Ltd | | Consumer Staples | | | 5,974 | | | | 268,304 | | | | 0.37 | |
Kawasaki Heavy Industries Ltd | | Industrials | | | 11,270 | | | | 264,617 | | | | 0.37 | |
Welcia Holdings Co Ltd | | Consumer Staples | | | 6,485 | | | | 263,602 | | | | 0.37 | |
Shiseido Co Ltd | | Consumer Staples | | | 3,498 | | | | 263,329 | | | | 0.37 | |
Japan Exchange Group Inc | | Financials | | | 16,480 | | | | 261,527 | | | | 0.36 | |
East Japan Railway Co | | Industrials | | | 2,775 | | | | 259,315 | | | | 0.36 | |
Secom Co Ltd | | Industrials | | | 2,996 | | | | 257,577 | | | | 0.36 | |
DMG Mori Co Ltd | | Industrials | | | 16,080 | | | | 257,121 | | | | 0.36 | |
Mitsubishi Motors Corp | | Consumer Discretionary | | | 53,685 | | | | 256,781 | | | | 0.36 | |
Amada Holdings Co Ltd | | Industrials | | | 22,272 | | | | 250,427 | | | | 0.35 | |
Mitsubishi Chemical Holdings Corp | | Materials | | | 35,430 | | | | 247,173 | | | | 0.34 | |
NET One Systems Co Ltd | | Information Technology | | | 8,988 | | | | 247,030 | | | | 0.34 | |
Sumitomo Metal Mining Co Ltd | | Materials | | | 8,257 | | | | 246,373 | | | | 0.34 | |
Nomura Real Estate Holdings Inc | | Real Estate | | | 11,265 | | | | 241,832 | | | | 0.34 | |
Skylark Holdings Co Ltd | | Consumer Discretionary | | | 12,986 | | | | 226,418 | | | | 0.32 | |
Suntory Beverage & Food Ltd | | Consumer Staples | | | 5,176 | | | | 224,790 | | | | 0.31 | |
Yamada Denki Co Ltd | | Consumer Discretionary | | | 49,773 | | | | 220,077 | | | | 0.31 | |
Furukawa Electric Co Ltd | | Industrials | | | 7,491 | | | | 219,080 | | | | 0.31 | |
| | |
| The accompanying notes are an integral part of these financial statements. | | 45 |
GOLDMAN SACHS ALTERNATIVE PREMIA FUND
Consolidated Schedule of Investments(continued)
June 30, 2019 (Unaudited)
|
| ADDITIONAL INVESTMENT INFORMATION (continued) |
OVER THE COUNTER TOTAL RETURN SWAP CONTRACTS (continued)
| | | | | | | | | | | | | | |
| Common Stocks | | Sector | | Shares | | | Value | | | Weight | |
Mitsubishi Materials Corp | | Materials | | | 7,641 | | | $ | 217,103 | | | | 0.30 | % |
ANA Holdings Inc | | Industrials | | | 6,285 | | | | 207,865 | | | | 0.29 | |
Taiheiyo Cement Corp | | Materials | | | 6,720 | | | | 203,068 | | | | 0.28 | |
Terumo Corp | | Health Care | | | 6,732 | | | | 200,319 | | | | 0.28 | |
LINE Corp | | Communication Services | | | 7,160 | | | | 200,116 | | | | 0.28 | |
Nippon Paint Holdings Co Ltd | | Materials | | | 5,077 | | | | 196,724 | | | | 0.27 | |
Keio Corp | | Industrials | | | 2,965 | | | | 194,851 | | | | 0.27 | |
Daito Trust Construction Co Ltd | | Real Estate | | | 1,530 | | | | 194,793 | | | | 0.27 | |
Hoshizaki Corp | | Industrials | | | 2,596 | | | | 192,973 | | | | 0.27 | |
NH Foods Ltd | | Consumer Staples | | | 4,488 | | | | 191,987 | | | | 0.27 | |
Nissin Foods Holdings Co Ltd | | Consumer Staples | | | 2,984 | | | | 191,963 | | | | 0.27 | |
Sekisui Chemical Co Ltd | | Consumer Discretionary | | | 12,597 | | | | 188,926 | | | | 0.26 | |
Kintetsu Group Holdings Co Ltd | | Industrials | | | 3,922 | | | | 187,575 | | | | 0.26 | |
Nippon Suisan Kaisha Ltd | | Consumer Staples | | | 30,171 | | | | 186,824 | | | | 0.26 | |
Coca-Cola Bottlers Japan Holdings Inc | | Consumer Staples | | | 7,350 | | | | 185,927 | | | | 0.26 | |
Pola Orbis Holdings Inc | | Consumer Staples | | | 6,639 | | | | 185,226 | | | | 0.26 | |
Takashimaya Co Ltd | | Consumer Discretionary | | | 16,667 | | | | 182,461 | | | | 0.25 | |
Lion Corp | | Consumer Staples | | | 9,773 | | | | 181,817 | | | | 0.25 | |
TIS Inc | | Information Technology | | | 3,525 | | | | 179,384 | | | | 0.25 | |
JTEKT Corp | | Industrials | | | 14,661 | | | | 177,482 | | | | 0.25 | |
ABC-Mart Inc | | Consumer Discretionary | | | 2,719 | | | | 176,900 | | | | 0.25 | |
Asics Corp | | Consumer Discretionary | | | 16,066 | | | | 173,799 | | | | 0.24 | |
Tokuyama Corp | | Materials | | | 6,262 | | | | 169,026 | | | | 0.24 | |
Tsuruha Holdings Inc | | Consumer Staples | | | 1,819 | | | | 167,961 | | | | 0.23 | |
Kakaku.com Inc | | Communication Services | | | 8,617 | | | | 166,136 | | | | 0.23 | |
Toho Co Ltd/Tokyo | | Communication Services | | | 3,891 | | | | 165,188 | | | | 0.23 | |
Casio Computer Co Ltd | | Consumer Discretionary | | | 13,296 | | | | 164,901 | | | | 0.23 | |
Nexon Co Ltd | | Communication Services | | | 11,261 | | | | 163,056 | | | | 0.23 | |
Shionogi & Co Ltd | | Health Care | | | 2,831 | | | | 162,910 | | | | 0.23 | |
Itochu Techno-Solutions Corp | | Information Technology | | | 6,218 | | | | 159,200 | | | | 0.22 | |
Electric Power Development Co Ltd | | Utilities | | | 6,988 | | | | 158,582 | | | | 0.22 | |
Fast Retailing Co Ltd | | Consumer Discretionary | | | 262 | | | | 158,426 | | | | 0.22 | |
Suzuki Motor Corp | | Consumer Discretionary | | | 3,347 | | | | 157,108 | | | | 0.22 | |
Sundrug Co Ltd | | Consumer Staples | | | 5,729 | | | | 154,844 | | | | 0.22 | |
Konami Holdings Corp | | Communication Services | | | 3,260 | | | | 152,615 | | | | 0.21 | |
Shimamura Co Ltd | | Consumer Discretionary | | | 2,011 | | | | 150,066 | | | | 0.21 | |
Ryohin Keikaku Co Ltd | | Consumer Discretionary | | | 827 | | | | 149,204 | | | | 0.21 | |
Toyo Suisan Kaisha Ltd | | Consumer Staples | | | 3,543 | | | | 145,801 | | | | 0.20 | |
Kyushu Electric Power Co Inc | | Utilities | | | 14,763 | | | | 144,788 | | | | 0.20 | |
Chugoku Electric Power Co Inc/The | | Utilities | | | 11,335 | | | | 142,688 | | | | 0.20 | |
Otsuka Corp | | Information Technology | | | 3,492 | | | | 140,318 | | | | 0.20 | |
Mitsubishi Tanabe Pharma Corp | | Health Care | | | 12,552 | | | | 139,623 | | | | 0.19 | |
Cosmo Energy Holdings Co Ltd | | Energy | | | 6,191 | | | | 139,286 | | | | 0.19 | |
Nichirei Corp | | Consumer Staples | | | 5,787 | | | | 137,163 | | | | 0.19 | |
Fujikura Ltd | | Industrials | | | 36,183 | | | | 135,838 | | | | 0.19 | |
Capcom Co Ltd | | Communication Services | | | 6,777 | | | | 135,826 | | | | 0.19 | |
Calbee Inc | | Consumer Staples | | | 4,894 | | | | 131,916 | | | | 0.18 | |
Odakyu Electric Railway Co Ltd | | Industrials | | | 5,380 | | | | 131,514 | | | | 0.18 | |
DIC Corp | | Materials | | | 4,917 | | | | 129,620 | | | | 0.18 | |
Sawai Pharmaceutical Co Ltd | | Health Care | | | 2,399 | | | | 129,399 | | | | 0.18 | |
Osaka Gas Co Ltd | | Utilities | | | 7,420 | | | | 129,108 | | | | 0.18 | |
Nisshin Seifun Group Inc | | Consumer Staples | | | 5,637 | | | | 128,478 | | | | 0.18 | |
Japan Airport Terminal Co Ltd | | Industrials | | | 2,992 | | | | 127,426 | | | | 0.18 | |
Otsuka Holdings Co Ltd | | Health Care | | | 3,909 | | | | 127,387 | | | | 0.18 | |
Aeon Co Ltd | | Consumer Staples | | | 7,400 | | | | 126,978 | | | | 0.18 | |
Tokyu Corp | | Industrials | | | 7,141 | | | | 126,500 | | | | 0.18 | |
Kyowa Exeo Corp | | Industrials | | | 5,068 | | | | 125,994 | | | | 0.18 | |
Asahi Intecc Co Ltd | | Health Care | | | 5,066 | | | | 124,623 | | | | 0.17 | |
Hulic Co Ltd | | Real Estate | | | 15,139 | | | | 121,525 | | | | 0.17 | |
| | |
| 46 | | The accompanying notes are an integral part of these financial statements. |
GOLDMAN SACHS ALTERNATIVE PREMIA FUND
|
| ADDITIONAL INVESTMENT INFORMATION (continued) |
OVER THE COUNTER TOTAL RETURN SWAP CONTRACTS (continued)
| | | | | | | | | | | | | | |
| Common Stocks | | Sector | | Shares | | | Value | | | Weight | |
Fuji Media Holdings Inc | | Communication Services | | | 8,703 | | | $ | 121,166 | | | | 0.17 | % |
Keihan Holdings Co Ltd | | Industrials | | | 2,781 | | | | 121,049 | | | | 0.17 | |
Tohoku Electric Power Co Inc | | Utilities | | | 11,887 | | | | 119,993 | | | | 0.17 | |
Hankyu Hanshin Holdings Inc | | Industrials | | | 3,348 | | | | 119,782 | | | | 0.17 | |
Keikyu Corp | | Industrials | | | 6,883 | | | | 118,360 | | | | 0.16 | |
COMSYS Holdings Corp | | Industrials | | | 4,645 | | | | 117,637 | | | | 0.16 | |
SoftBank Group Corp | | Communication Services | | | 2,446 | | | | 117,114 | | | | 0.16 | |
Taiyo Nippon Sanso Corp | | Materials | | | 5,503 | | | | 116,712 | | | | 0.16 | |
Rohto Pharmaceutical Co Ltd | | Health Care | | | 4,247 | | | | 115,110 | | | | 0.16 | |
Chubu Electric Power Co Inc | | Utilities | | | 8,183 | | | | 114,654 | | | | 0.16 | |
Tobu Railway Co Ltd | | Industrials | | | 3,927 | | | | 114,301 | | | | 0.16 | |
Kuraray Co Ltd | | Materials | | | 9,580 | | | | 114,293 | | | | 0.16 | |
Toho Gas Co Ltd | | Utilities | | | 3,074 | | | | 112,973 | | | | 0.16 | |
Mitsui E&S Holdings Co Ltd | | Industrials | | | 12,252 | | | | 112,777 | | | | 0.16 | |
Oracle Corp Japan | | Information Technology | | | 1,541 | | | | 112,454 | | | | 0.16 | |
Nagoya Railroad Co Ltd | | Industrials | | | 4,042 | | | | 111,694 | | | | 0.16 | |
Nippon Paper Industries Co Ltd | | Materials | | | 6,263 | | | | 110,777 | | | | 0.15 | |
Cosmos Pharmaceutical Corp | | Consumer Staples | | | 652 | | | | 110,574 | | | | 0.15 | |
SCSK Corp | | Information Technology | | | 2,232 | | | | 109,658 | | | | 0.15 | |
Yokohama Rubber Co Ltd/The | | Consumer Discretionary | | | 5,921 | | | | 108,676 | | | | 0.15 | |
AEON Financial Service Co Ltd | | Financials | | | 6,619 | | | | 106,446 | | | | 0.15 | |
Hikari Tsushin Inc | | Consumer Discretionary | | | 480 | | | | 104,587 | | | | 0.15 | |
Suzuken Co Ltd/Aichi Japan | | Health Care | | | 1,771 | | | | 103,747 | | | | 0.14 | |
Kansai Electric Power Co Inc/The | | Utilities | | | 9,020 | | | | 103,213 | | | | 0.14 | |
Benesse Holdings Inc | | Consumer Discretionary | | | 4,433 | | | | 103,068 | | | | 0.14 | |
Seino Holdings Co Ltd | | Industrials | | | 7,710 | | | | 102,554 | | | | 0.14 | |
Sugi Holdings Co Ltd | | Consumer Staples | | | 2,168 | | | | 102,308 | | | | 0.14 | |
Morinaga Milk Industry Co Ltd | | Consumer Staples | | | 2,547 | | | | 100,681 | | | | 0.14 | |
Azbil Corp | | Information Technology | | | 4,041 | | | | 98,579 | | | | 0.14 | |
Ito En Ltd | | Consumer Staples | | | 2,108 | | | | 98,080 | | | | 0.14 | |
Square Enix Holdings Co Ltd | | Communication Services | | | 3,061 | | | | 97,907 | | | | 0.14 | |
Topcon Corp | | Information Technology | | | 7,743 | | | | 96,749 | | | | 0.13 | |
Ricoh Co Ltd | | Information Technology | | | 9,588 | | | | 95,632 | | | | 0.13 | |
Mitsubishi UFJ Financial Group Inc | | Financials | | | 19,954 | | | | 94,703 | | | | 0.13 | |
Fuji Oil Holdings Inc | | Consumer Staples | | | 3,098 | | | | 93,340 | | | | 0.13 | |
Morinaga & Co Ltd/Japan | | Consumer Staples | | | 1,875 | | | | 91,260 | | | | 0.13 | |
Yamazaki Baking Co Ltd | | Consumer Staples | | | 6,040 | | | | 91,206 | | | | 0.13 | |
Yamato Kogyo Co Ltd | | Materials | | | 3,102 | | | | 90,292 | | | | 0.13 | |
Nippon Television Holdings Inc | | Communication Services | | | 6,045 | | | | 89,427 | | | | 0.12 | |
Aoyama Trading Co Ltd | | Consumer Discretionary | | | 4,549 | | | | 89,048 | | | | 0.12 | |
Rakuten Inc | | Consumer Discretionary | | | 7,464 | | | | 88,563 | | | | 0.12 | |
Rengo Co Ltd | | Materials | | | 10,894 | | | | 87,350 | | | | 0.12 | |
Taisei Corp | | Industrials | | | 2,393 | | | | 86,849 | | | | 0.12 | |
NOK Corp | | Consumer Discretionary | | | 5,743 | | | | 85,924 | | | | 0.12 | |
Nihon Kohden Corp | | Health Care | | | 3,159 | | | | 85,444 | | | | 0.12 | |
Ain Holdings Inc | | Consumer Staples | | | 1,468 | | | | 85,310 | | | | 0.12 | |
Sankyo Co Ltd | | Consumer Discretionary | | | 2,334 | | | | 84,381 | | | | 0.12 | |
Sumitomo Bakelite Co Ltd | | Materials | | | 2,361 | | | | 84,148 | | | | 0.12 | |
Miura Co Ltd | | Industrials | | | 2,722 | | | | 83,906 | | | | 0.12 | |
Keyence Corp | | Information Technology | | | 136 | | | | 83,251 | | | | 0.12 | |
GS Yuasa Corp | | Industrials | | | 4,307 | | | | 82,958 | | | | 0.12 | |
Zenkoku Hosho Co Ltd | | Financials | | | 2,159 | | | | 82,759 | | | | 0.12 | |
Kyudenko Corp | | Industrials | | | 2,735 | | | | 82,003 | | | | 0.11 | |
K’s Holdings Corp | | Consumer Discretionary | | | 8,695 | | | | 81,969 | | | | 0.11 | |
Sumitomo Dainippon Pharma Co Ltd | | Health Care | | | 4,321 | | | | 81,837 | | | | 0.11 | |
Honda Motor Co Ltd | | Consumer Discretionary | | | 3,140 | | | | 81,055 | | | | 0.11 | |
Nifco Inc/Japan | | Consumer Discretionary | | | 3,275 | | | | 81,020 | | | | 0.11 | |
Obayashi Corp | | Industrials | | | 8,165 | | | | 80,300 | | | | 0.11 | |
Kamigumi Co Ltd | | Industrials | | | 3,339 | | | | 78,931 | | | | 0.11 | |
| | |
| The accompanying notes are an integral part of these financial statements. | | 47 |
GOLDMAN SACHS ALTERNATIVE PREMIA FUND
Consolidated Schedule of Investments(continued)
June 30, 2019 (Unaudited)
|
| ADDITIONAL INVESTMENT INFORMATION (continued) |
OVER THE COUNTER TOTAL RETURN SWAP CONTRACTS (continued)
| | | | | | | | | | | | | | |
| Common Stocks | | Sector | | Shares | | | Value | | | Weight | |
Sumitomo Osaka Cement Co Ltd | | Materials | | | 1,951 | | | $ | 77,412 | | | | 0.11 | % |
Ezaki Glico Co Ltd | | Consumer Staples | | | 1,733 | | | | 77,122 | | | | 0.11 | |
Marubeni Corp | | Industrials | | | 11,497 | | | | 75,987 | | | | 0.11 | |
Glory Ltd | | Industrials | | | 2,864 | | | | 75,510 | | | | 0.11 | |
House Foods Group Inc | | Consumer Staples | | | 1,973 | | | | 73,967 | | | | 0.10 | |
Amano Corp | | Information Technology | | | 2,673 | | | | 73,670 | | | | 0.10 | |
Izumi Co Ltd | | Consumer Discretionary | | | 1,819 | | | | 73,441 | | | | 0.10 | |
Yoshinoya Holdings Co Ltd | | Consumer Discretionary | | | 4,249 | | | | 73,250 | | | | 0.10 | |
Tokyo Ohka Kogyo Co Ltd | | Materials | | | 2,310 | | | | 72,063 | | | | 0.10 | |
Sapporo Holdings Ltd | | Consumer Staples | | | 3,425 | | | | 72,041 | | | | 0.10 | |
Hokkaido Electric Power Co Inc | | Utilities | | | 12,866 | | | | 71,915 | | | | 0.10 | |
Zensho Holdings Co Ltd | | Consumer Discretionary | | | 3,503 | | | | 71,106 | | | | 0.10 | |
Hokuriku Electric Power Co | | Utilities | | | 9,699 | | | | 70,218 | | | | 0.10 | |
Sanwa Holdings Corp | | Industrials | | | 6,456 | | | | 69,299 | | | | 0.10 | |
Sohgo Security Services Co Ltd | | Industrials | | | 1,499 | | | | 69,072 | | | | 0.10 | |
Keisei Electric Railway Co Ltd | | Industrials | | | 1,881 | | | | 68,451 | | | | 0.10 | |
Kokuyo Co Ltd | | Industrials | | | 4,823 | | | | 67,421 | | | | 0.09 | |
Nipro Corp | | Health Care | | | 6,073 | | | | 67,273 | | | | 0.09 | |
Kewpie Corp | | Consumer Staples | | | 3,035 | | | | 66,994 | | | | 0.09 | |
Megmilk Snow Brand Co Ltd | | Consumer Staples | | | 3,055 | | | | 66,879 | | | | 0.09 | |
Hitachi Ltd | | Information Technology | | | 1,814 | | | | 66,398 | | | | 0.09 | |
OSG Corp | | Industrials | | | 3,369 | | | | 66,334 | | | | 0.09 | |
Rinnai Corp | | Consumer Discretionary | | | 1,029 | | | | 65,334 | | | | 0.09 | |
Nippon Light Metal Holdings Co Ltd | | Materials | | | 30,231 | | | | 65,294 | | | | 0.09 | |
Maruha Nichiro Corp | | Consumer Staples | | | 2,207 | | | | 64,764 | | | | 0.09 | |
Kajima Corp | | Industrials | | | 4,629 | | | | 63,420 | | | | 0.09 | |
Air Water Inc | | Materials | | | 3,699 | | | | 63,229 | | | | 0.09 | |
Fancl Corp | | Consumer Staples | | | 2,504 | | | | 61,501 | | | | 0.09 | |
Daiichi Sankyo Co Ltd | | Health Care | | | 1,175 | | | | 61,360 | | | | 0.09 | |
Mitsubishi Corp | | Industrials | | | 2,300 | | | | 60,538 | | | | 0.08 | |
Acom Co Ltd | | Financials | | | 16,732 | | | | 60,180 | | | | 0.08 | |
Pigeon Corp | | Consumer Staples | | | 1,469 | | | | 59,013 | | | | 0.08 | |
ITOCHU Corp | | Industrials | | | 3,013 | | | | 57,551 | | | | 0.08 | |
Murata Manufacturing Co Ltd | | Information Technology | | | 1,269 | | | | 56,938 | | | | 0.08 | |
Okumura Corp | | Industrials | | | 1,856 | | | | 56,690 | | | | 0.08 | |
Hakuhodo DY Holdings Inc | | Communication Services | | | 3,349 | | | | 56,317 | | | | 0.08 | |
Tokyo Century Corp | | Financials | | | 1,337 | | | | 56,312 | | | | 0.08 | |
H2O Retailing Corp | | Consumer Discretionary | | | 4,887 | | | | 56,261 | | | | 0.08 | |
Sanrio Co Ltd | | Consumer Discretionary | | | 2,518 | | | | 55,860 | | | | 0.08 | |
Relo Group Inc | | Real Estate | | | 2,218 | | | | 55,785 | | | | 0.08 | |
Tsumura & Co | | Health Care | | | 1,998 | | | | 55,655 | | | | 0.08 | |
Nankai Electric Railway Co Ltd | | Industrials | | | 2,286 | | | | 55,512 | | | | 0.08 | |
Anritsu Corp | | Information Technology | | | 3,160 | | | | 54,872 | | | | 0.08 | |
Nishimatsu Construction Co Ltd | | Industrials | | | 2,809 | | | | 54,082 | | | | 0.08 | |
Dai Nippon Printing Co Ltd | | Industrials | | | 2,499 | | | | 53,188 | | | | 0.07 | |
Kaken Pharmaceutical Co Ltd | | Health Care | | | 1,136 | | | | 53,053 | | | | 0.07 | |
Toppan Printing Co Ltd | | Industrials | | | 3,470 | | | | 52,586 | | | | 0.07 | |
Maruichi Steel Tube Ltd | | Materials | | | 1,881 | | | | 52,197 | | | | 0.07 | |
Alfresa Holdings Corp | | Health Care | | | 2,099 | | | | 51,705 | | | | 0.07 | |
Sega Sammy Holdings Inc | | Consumer Discretionary | | | 4,212 | | | | 51,104 | | | | 0.07 | |
Kinden Corp | | Industrials | | | 3,325 | | | | 50,893 | | | | 0.07 | |
Resorttrust Inc | | Consumer Discretionary | | | 3,325 | | | | 50,831 | | | | 0.07 | |
Shikoku Electric Power Co Inc | | Utilities | | | 5,489 | | | | 50,679 | | | | 0.07 | |
Fujitsu Ltd | | Information Technology | | | 715 | | | | 49,796 | | | | 0.07 | |
Meitec Corp | | Industrials | | | 963 | | | | 49,362 | | | | 0.07 | |
TS Tech Co Ltd | | Consumer Discretionary | | | 1,809 | | | | 49,190 | | | | 0.07 | |
Advantest Corp | | Information Technology | | | 1,763 | | | | 48,462 | | | | 0.07 | |
Shochiku Co Ltd | | Communication Services | | | 430 | | | | 48,433 | | | | 0.07 | |
Shimachu Co Ltd | | Consumer Discretionary | | | 2,053 | | | | 47,659 | | | | 0.07 | |
| | |
| 48 | | The accompanying notes are an integral part of these financial statements. |
GOLDMAN SACHS ALTERNATIVE PREMIA FUND
|
| ADDITIONAL INVESTMENT INFORMATION (continued) |
OVER THE COUNTER TOTAL RETURN SWAP CONTRACTS (continued)
| | | | | | | | | | | | | | |
| Common Stocks | | Sector | | Shares | | | Value | | | Weight | |
Autobacs Seven Co Ltd | | Consumer Discretionary | | | 2,811 | | | $ | 46,322 | | | | 0.06 | % |
Shimano Inc | | Consumer Discretionary | | | 298 | | | | 44,237 | | | | 0.06 | |
Daiichikosho Co Ltd | | Communication Services | | | 949 | | | | 44,078 | | | | 0.06 | |
Valor Holdings Co Ltd | | Consumer Staples | | | 2,110 | | | | 43,735 | | | | 0.06 | |
Brother Industries Ltd | | Information Technology | | | 2,300 | | | | 43,393 | | | | 0.06 | |
Toho Holdings Co Ltd | | Health Care | | | 1,936 | | | | 43,319 | | | | 0.06 | |
Toyo Seikan Group Holdings Ltd | | Materials | | | 2,161 | | | | 42,837 | | | | 0.06 | |
Taisho Pharmaceutical Holdings Co Ltd | | Health Care | | | 557 | | | | 42,703 | | | | 0.06 | |
Credit Saison Co Ltd | | Financials | | | 3,636 | | | | 42,503 | | | | 0.06 | |
Iwatani Corp | | Energy | | | 1,222 | | | | 42,348 | | | | 0.06 | |
Oki Electric Industry Co Ltd | | Information Technology | | | 3,385 | | | | 42,206 | | | | 0.06 | |
Obic Co Ltd | | Information Technology | | | 369 | | | | 41,738 | | | | 0.06 | |
Kobayashi Pharmaceutical Co Ltd | | Consumer Staples | | | 548 | | | | 39,154 | | | | 0.05 | |
Sotetsu Holdings Inc | | Industrials | | | 1,413 | | | | 38,876 | | | | 0.05 | |
Colowide Co Ltd | | Consumer Discretionary | | | 2,013 | | | | 38,469 | | | | 0.05 | |
GMO Payment Gateway Inc | | Information Technology | | | 559 | | | | 38,368 | | | | 0.05 | |
Mitsubishi Logistics Corp | | Industrials | | | 1,390 | | | | 38,178 | | | | 0.05 | |
Mitsubishi Electric Corp | | Industrials | | | 2,883 | | | | 37,918 | | | | 0.05 | |
Duskin Co Ltd | | Industrials | | | 1,435 | | | | 37,653 | | | | 0.05 | |
KYORIN Holdings Inc | | Health Care | | | 2,114 | | | | 37,387 | | | | 0.05 | |
Mitsui & Co Ltd | | Industrials | | | 2,269 | | | | 36,889 | | | | 0.05 | |
Tokai Rika Co Ltd | | Consumer Discretionary | | | 2,227 | | | | 36,678 | | | | 0.05 | |
Medipal Holdings Corp | | Health Care | | | 1,632 | | | | 35,990 | | | | 0.05 | |
Toyota Tsusho Corp | | Industrials | | | 1,185 | | | | 35,878 | | | | 0.05 | |
Hokuhoku Financial Group Inc | | Financials | | | 3,454 | | | | 35,862 | | | | 0.05 | |
Kagome Co Ltd | | Consumer Staples | | | 1,510 | | | | 35,063 | | | | 0.05 | |
Wacoal Holdings Corp | | Consumer Discretionary | | | 1,346 | | | | 34,893 | | | | 0.05 | |
Daifuku Co Ltd | | Industrials | | | 621 | | | | 34,812 | | | | 0.05 | |
NOF Corp | | Materials | | | 933 | | | | 34,725 | | | | 0.05 | |
TV Asahi Holdings Corp | | Communication Services | | | 2,142 | | | | 34,501 | | | | 0.05 | |
Nippon Shinyaku Co Ltd | | Health Care | | | 490 | | | | 34,487 | | | | 0.05 | |
Toyobo Co Ltd | | Materials | | | 2,887 | | | | 34,418 | | | | 0.05 | |
Nippon Electric Glass Co Ltd | | Information Technology | | | 1,358 | | | | 34,355 | | | | 0.05 | |
Isuzu Motors Ltd | | Consumer Discretionary | | | 2,999 | | | | 34,114 | | | | 0.05 | |
Fujitsu General Ltd | | Consumer Discretionary | | | 2,143 | | | | 34,009 | | | | 0.05 | |
SG Holdings Co Ltd | | Industrials | | | 1,201 | | | | 34,005 | | | | 0.05 | |
Nishi-Nippon Financial Holdings Inc | | Financials | | | 4,617 | | | | 33,167 | | | | 0.05 | |
SMC Corp/Japan | | Industrials | | | 87 | | | | 32,570 | | | | 0.05 | |
Sojitz Corp | | Industrials | | | 10,031 | | | | 32,172 | | | | 0.04 | |
DeNA Co Ltd | | Communication Services | | | 1,678 | | | | 32,121 | | | | 0.04 | |
Yokogawa Electric Corp | | Information Technology | | | 1,623 | | | | 31,771 | | | | 0.04 | |
Lintec Corp | | Materials | | | 1,518 | | | | 31,583 | | | | 0.04 | |
Nikon Corp | | Consumer Discretionary | | | 2,080 | | | | 29,385 | | | | 0.04 | |
Mochida Pharmaceutical Co Ltd | | Health Care | | | 690 | | | | 29,317 | | | | 0.04 | |
Japan Post Insurance Co Ltd | | Financials | | | 1,572 | | | | 29,103 | | | | 0.04 | |
Mitsubishi UFJ Lease & Finance Co Ltd | | Financials | | | 5,409 | | | | 28,631 | | | | 0.04 | |
Kikkoman Corp | | Consumer Staples | | | 654 | | | | 28,421 | | | | 0.04 | |
Sony Financial Holdings Inc | | Financials | | | 1,183 | | | | 28,384 | | | | 0.04 | |
SUMCO Corp | | Information Technology | | | 2,277 | | | | 27,063 | | | | 0.04 | |
North Pacific Bank Ltd | | Financials | | | 11,371 | | | | 26,982 | | | | 0.04 | |
Toagosei Co Ltd | | Materials | | | 2,560 | | | | 26,859 | | | | 0.04 | |
Dowa Holdings Co Ltd | | Materials | | | 829 | | | | 26,540 | | | | 0.04 | |
Japan Post Holdings Co Ltd | | Financials | | | 2,178 | | | | 24,634 | | | | 0.03 | |
Sumitomo Mitsui Construction Co Ltd | | Industrials | | | 4,430 | | | | 24,513 | | | | 0.03 | |
Mebuki Financial Group Inc | | Financials | | | 8,950 | | | | 23,311 | | | | 0.03 | |
Sumitomo Heavy Industries Ltd | | Industrials | | | 672 | | | | 23,084 | | | | 0.03 | |
Nippon Shokubai Co Ltd | | Materials | | | 345 | | | | 22,788 | | | | 0.03 | |
Kyushu Railway Co | | Industrials | | | 780 | | | | 22,712 | | | | 0.03 | |
Hitachi Metals Ltd | | Materials | | | 2,005 | | | | 22,618 | | | | 0.03 | |
| | |
| The accompanying notes are an integral part of these financial statements. | | 49 |
GOLDMAN SACHS ALTERNATIVE PREMIA FUND
Consolidated Schedule of Investments(continued)
June 30, 2019 (Unaudited)
|
| ADDITIONAL INVESTMENT INFORMATION (continued) |
OVER THE COUNTER TOTAL RETURN SWAP CONTRACTS (continued)
| | | | | | | | | | | | | | |
| Common Stocks | | Sector | | Shares | | | Value | | | Weight | |
Iida Group Holdings Co Ltd | | Consumer Discretionary | | | 1,390 | | | $ | 22,413 | | | | 0.03 | % |
Nishi-Nippon Railroad Co Ltd | | Industrials | | | 1,024 | | | | 21,822 | | | | 0.03 | |
Daishi Hokuetsu Financial Group Inc | | Financials | | | 823 | | | | 21,048 | | | | 0.03 | |
Ibiden Co Ltd | | Information Technology | | | 1,199 | | | | 20,966 | | | | 0.03 | |
Showa Denko KK | | Materials | | | 707 | | | | 20,766 | | | | 0.03 | |
Nihon Parkerizing Co Ltd | | Materials | | | 1,838 | | | | 20,339 | | | | 0.03 | |
Hitachi High-Technologies Corp | | Information Technology | | | 389 | | | | 19,977 | | | | 0.03 | |
Fuji Electric Co Ltd | | Industrials | | | 564 | | | | 19,420 | | | | 0.03 | |
Nissan Chemical Corp | | Materials | | | 421 | | | | 18,958 | | | | 0.03 | |
Hanwa Co Ltd | | Industrials | | | 706 | | | | 18,852 | | | | 0.03 | |
Sangetsu Corp | | Consumer Discretionary | | | 1,008 | | | | 18,514 | | | | 0.03 | |
Oji Holdings Corp | | Materials | | | 3,107 | | | | 17,917 | | | | 0.02 | |
77 Bank Ltd/The | | Financials | | | 1,212 | | | | 17,811 | | | | 0.02 | |
Sankyu Inc | | Industrials | | | 337 | | | | 17,672 | | | | 0.02 | |
Asahi Kasei Corp | | Materials | | | 1,610 | | | | 17,138 | | | | 0.02 | |
THK Co Ltd | | Industrials | | | 690 | | | | 16,465 | | | | 0.02 | |
Mitsui Chemicals Inc | | Materials | | | 665 | | | | 16,446 | | | | 0.02 | |
Sekisui House Ltd | | Consumer Discretionary | | | 946 | | | | 15,570 | | | | 0.02 | |
Persol Holdings Co Ltd | | Industrials | | | 660 | | | | 15,481 | | | | 0.02 | |
Stanley Electric Co Ltd | | Consumer Discretionary | | | 622 | | | | 15,274 | | | | 0.02 | |
Kissei Pharmaceutical Co Ltd | | Health Care | | | 610 | | | | 15,210 | | | | 0.02 | |
Shinsei Bank Ltd | | Financials | | | 920 | | | | 14,267 | | | | 0.02 | |
Shimadzu Corp | | Information Technology | | | 582 | | | | 14,244 | | | | 0.02 | |
Aica Kogyo Co Ltd | | Industrials | | | 398 | | | | 13,289 | | | | 0.02 | |
Nagase & Co Ltd | | Industrials | | | 849 | | | | 12,716 | | | | 0.02 | |
Mitsubishi Gas Chemical Co Inc | | Materials | | | 902 | | | | 12,001 | | | | 0.02 | |
Canon Marketing Japan Inc | | Information Technology | | | 542 | | | | 11,812 | | | | 0.02 | |
Nomura Research Institute Ltd | | Information Technology | | | 716 | | | | 11,460 | | | | 0.02 | |
Zeon Corp | | Materials | | | 1,008 | | | | 11,187 | | | | 0.02 | |
Matsui Securities Co Ltd | | Financials | | | 1,174 | | | | 11,056 | | | | 0.02 | |
Idemitsu Kosan Co Ltd | | Energy | | | 365 | | | | 10,969 | | | | 0.02 | |
Hirose Electric Co Ltd | | Information Technology | | | 95 | | | | 10,601 | | | | 0.01 | |
Maeda Road Construction Co Ltd | | Industrials | | | 498 | | | | 10,464 | | | | 0.01 | |
Teijin Ltd | | Materials | | | 598 | | | | 10,178 | | | | 0.01 | |
Gunma Bank Ltd/The | | Financials | | | 2,870 | | | | 10,031 | | | | 0.01 | |
Horiba Ltd | | Information Technology | | | 187 | | | | 9,649 | | | | 0.01 | |
Yaskawa Electric Corp | | Information Technology | | | 282 | | | | 9,554 | | | | 0.01 | |
Santen Pharmaceutical Co Ltd | | Health Care | | | 539 | | | | 8,925 | | | | 0.01 | |
Hitachi Capital Corp | | Financials | | | 348 | | | | 7,734 | | | | 0.01 | |
Citizen Watch Co Ltd | | Information Technology | | | 1,434 | | | | 7,351 | | | | 0.01 | |
Marui Group Co Ltd | | Consumer Discretionary | | | 354 | | | | 7,194 | | | | 0.01 | |
Sumitomo Rubber Industries Ltd | | Consumer Discretionary | | | 592 | | | | 6,833 | | | | 0.01 | |
Kose Corp | | Consumer Staples | | | 40 | | | | 6,683 | | | | 0.01 | |
Taiyo Yuden Co Ltd | | Information Technology | | | 337 | | | | 6,260 | | | | 0.01 | |
Nihon M&A Center Inc | | Industrials | | | 247 | | | | 5,918 | | | | 0.01 | |
Hiroshima Bank Ltd/The | | Financials | | | 1,184 | | | | 5,696 | | | | 0.01 | |
Tokai Carbon Co Ltd | | Materials | | | 514 | | | | 5,357 | | | | 0.01 | |
Daicel Corp | | Materials | | | 513 | | | | 4,552 | | | | 0.01 | |
Nikkon Holdings Co Ltd | | Industrials | | | 130 | | | | 2,989 | | | | 0.00 | |
Ebara Corp | | Industrials | | | 94 | | | | 2,558 | | | | 0.00 | |
A basket (JPGSFDUK) of common stocks
| | | | | | | | | | | | | | |
| Common Stocks | | Sector | | Shares | | | Value | | | Weight | |
Royal Dutch Shell PLC | | Energy | | | 26,022 | | | $ | 849,819 | | | | 4.95 | % |
AstraZeneca PLC | | Health Care | | | 10,377 | | | | 848,107 | | | | 4.94 | |
Diageo PLC | | Consumer Staples | | | 17,403 | | | | 747,611 | | | | 4.36 | |
GlaxoSmithKline PLC | | Health Care | | | 30,114 | | | | 602,735 | | | | 3.51 | |
British American Tobacco PLC | | Consumer Staples | | | 16,003 | | | | 558,494 | | | | 3.25 | |
| | |
| 50 | | The accompanying notes are an integral part of these financial statements. |
GOLDMAN SACHS ALTERNATIVE PREMIA FUND
|
| ADDITIONAL INVESTMENT INFORMATION (continued) |
OVER THE COUNTER TOTAL RETURN SWAP CONTRACTS (continued)
| | | | | | | | | | | | | | |
| Common Stocks | | Sector | | Shares | | | Value | | | Weight | |
BHP Group PLC | | Materials | | | 21,704 | | | $ | 555,194 | | | | 3.24 | % |
Anglo American PLC | | Materials | | | 18,008 | | | | 513,120 | | | | 2.99 | |
Unilever PLC | | Consumer Staples | | | 7,714 | | | | 479,303 | | | | 2.79 | |
Prudential PLC | | Financials | | | 19,313 | | | | 420,730 | | | | 2.45 | |
Reckitt Benckiser Group PLC | | Consumer Staples | | | 5,026 | | | | 396,445 | | | | 2.31 | |
HSBC Holdings PLC | | Financials | | | 45,186 | | | | 376,819 | | | | 2.20 | |
RELX PLC | | Industrials | | | 14,625 | | | | 354,530 | | | | 2.07 | |
Compass Group PLC | | Consumer Discretionary | | | 14,107 | | | | 337,949 | | | | 1.97 | |
Rio Tinto PLC | | Materials | | | 5,344 | | | | 331,113 | | | | 1.93 | |
Vodafone Group PLC | | Communication Services | | | 182,510 | | | | 299,627 | | | | 1.75 | |
BT Group PLC | | Communication Services | | | 98,235 | | | | 245,009 | | | | 1.43 | |
CRH PLC | | Materials | | | 7,248 | | | | 235,739 | | | | 1.37 | |
Experian PLC | | Industrials | | | 7,692 | | | | 232,800 | | | | 1.36 | |
Legal & General Group PLC | | Financials | | | 67,008 | | | | 229,253 | | | | 1.34 | |
Halma PLC | | Information Technology | | | 7,874 | | | | 201,913 | | | | 1.18 | |
Smith & Nephew PLC | | Health Care | | | 8,559 | | | | 185,253 | | | | 1.08 | |
Tesco PLC | | Consumer Staples | | | 63,461 | | | | 182,640 | | | | 1.06 | |
Lloyds Banking Group PLC | | Financials | | | 238,493 | | | | 171,333 | | | | 1.00 | |
SSE PLC | | Utilities | | | 11,763 | | | | 167,552 | | | | 0.98 | |
Micro Focus International PLC | | Information Technology | | | 6,323 | | | | 165,679 | | | | 0.97 | |
Glencore PLC | | Materials | | | 46,888 | | | | 162,710 | | | | 0.95 | |
Spirax-Sarco Engineering PLC | | Industrials | | | 1,336 | | | | 155,831 | | | | 0.91 | |
Bunzl PLC | | Industrials | | | 5,567 | | | | 146,798 | | | | 0.86 | |
Evraz PLC | | Materials | | | 17,066 | | | | 144,119 | | | | 0.84 | |
Ocado Group PLC | | Consumer Discretionary | | | 9,568 | | | | 141,746 | | | | 0.83 | |
Barclays PLC | | Financials | | | 72,937 | | | | 138,704 | | | | 0.81 | |
Rentokil Initial PLC | | Industrials | | | 26,360 | | | | 133,023 | | | | 0.78 | |
Imperial Brands PLC | | Consumer Staples | | | 5,589 | | | | 131,029 | | | | 0.76 | |
Standard Life Aberdeen PLC | | Financials | | | 34,299 | | | | 128,274 | | | | 0.75 | |
Centrica PLC | | Utilities | | | 110,260 | | | | 122,873 | | | | 0.72 | |
Barratt Developments PLC | | Consumer Discretionary | | | 15,887 | | | | 115,483 | | | | 0.67 | |
3i Group PLC | | Financials | | | 8,047 | | | | 113,753 | | | | 0.66 | |
International Consolidated Airlines Grou | | Industrials | | | 18,657 | | | | 112,951 | | | | 0.66 | |
WPP PLC | | Communication Services | | | 8,979 | | | | 112,865 | | | | 0.66 | |
Aviva PLC | | Financials | | | 20,920 | | | | 110,616 | | | | 0.64 | |
St James’s Place PLC | | Financials | | | 7,679 | | | | 107,033 | | | | 0.62 | |
Coca-Cola HBC AG | | Consumer Staples | | | 2,823 | | | | 106,517 | | | | 0.62 | |
United Utilities Group PLC | | Utilities | | | 10,407 | | | | 103,425 | | | | 0.60 | |
Pearson PLC | | Communication Services | | | 9,904 | | | | 103,024 | | | | 0.60 | |
Burberry Group PLC | | Consumer Discretionary | | | 4,351 | | | | 102,841 | | | | 0.60 | |
Sage Group PLC/The | | Information Technology | | | 9,978 | | | | 101,636 | | | | 0.59 | |
easyJet PLC | | Industrials | | | 8,323 | | | | 100,712 | | | | 0.59 | |
Intertek Group PLC | | Industrials | | | 1,413 | | | | 98,696 | | | | 0.58 | |
Next PLC | | Consumer Discretionary | | | 1,367 | | | | 95,902 | | | | 0.56 | |
Croda International PLC | | Materials | | | 1,456 | | | | 94,644 | | | | 0.55 | |
Admiral Group PLC | | Financials | | | 3,311 | | | | 92,800 | | | | 0.54 | |
Kingfisher PLC | | Consumer Discretionary | | | 33,709 | | | | 91,964 | | | | 0.54 | |
Auto Trader Group PLC | | Communication Services | | | 12,896 | | | | 89,684 | | | | 0.52 | |
BAE Systems PLC | | Industrials | | | 13,742 | | | | 86,424 | | | | 0.50 | |
DCC PLC | | Industrials | | | 966 | | | | 86,111 | | | | 0.50 | |
Land Securities Group PLC | | Real Estate | | | 8,109 | | | | 85,770 | | | | 0.50 | |
Severn Trent PLC | | Utilities | | | 3,277 | | | | 85,213 | | | | 0.50 | |
Direct Line Insurance Group PLC | | Financials | | | 19,817 | | | | 83,471 | | | | 0.49 | |
Segro PLC | | Real Estate | | | 8,853 | | | | 82,067 | | | | 0.48 | |
Informa PLC | | Communication Services | | | 7,593 | | | | 80,493 | | | | 0.47 | |
GVC Holdings PLC | | Consumer Discretionary | | | 9,666 | | | | 79,982 | | | | 0.47 | |
Hargreaves Lansdown PLC | | Financials | | | 3,111 | | | | 75,781 | | | | 0.44 | |
Whitbread PLC | | Consumer Discretionary | | | 1,242 | | | | 72,985 | | | | 0.43 | |
Wm Morrison Supermarkets PLC | | Consumer Staples | | | 27,757 | | | | 70,969 | | | | 0.41 | |
| | |
| The accompanying notes are an integral part of these financial statements. | | 51 |
GOLDMAN SACHS ALTERNATIVE PREMIA FUND
Consolidated Schedule of Investments(continued)
June 30, 2019 (Unaudited)
|
| ADDITIONAL INVESTMENT INFORMATION (continued) |
OVER THE COUNTER TOTAL RETURN SWAP CONTRACTS (continued)
| | | | | | | | | | | | | | |
| Common Stocks | | Sector | | Shares | | | Value | | | Weight | |
Berkeley Group Holdings PLC | | Consumer Discretionary | | | 1,486 | | | $ | 70,404 | | | | 0.41 | % |
J Sainsbury PLC | | Consumer Staples | | | 27,826 | | | | 69,221 | | | | 0.40 | |
John Wood Group PLC | | Energy | | | 11,377 | | | | 65,284 | | | | 0.38 | |
Royal Mail PLC | | Industrials | | | 23,504 | | | | 63,228 | | | | 0.37 | |
Tate & Lyle PLC | | Consumer Staples | | | 6,635 | | | | 62,201 | | | | 0.36 | |
Schroders PLC | | Financials | | | 1,591 | | | | 61,607 | | | | 0.36 | |
Polymetal International PLC | | Materials | | | 4,827 | | | | 61,081 | | | | 0.36 | |
Smurfit Kappa Group PLC | | Materials | | | 2,003 | | | | 60,560 | | | | 0.35 | |
Fresnillo PLC | | Materials | | | 5,290 | | | | 58,445 | | | | 0.34 | |
Rightmove PLC | | Communication Services | | | 8,416 | | | | 57,130 | | | | 0.33 | |
JD Sports Fashion PLC | | Consumer Discretionary | | | 7,424 | | | | 55,266 | | | | 0.32 | |
Hikma Pharmaceuticals PLC | | Health Care | | | 2,520 | | | | 55,085 | | | | 0.32 | |
Carnival PLC | | Consumer Discretionary | | | 1,209 | | | | 53,403 | | | | 0.31 | |
Meggitt PLC | | Industrials | | | 7,879 | | | | 52,412 | | | | 0.31 | |
ConvaTec Group PLC | | Health Care | | | 27,849 | | | | 51,547 | | | | 0.30 | |
Cineworld Group PLC | | Communication Services | | | 15,135 | | | | 48,688 | | | | 0.28 | |
Phoenix Group Holdings PLC | | Financials | | | 5,399 | | | | 48,591 | | | | 0.28 | |
Rolls-Royce Holdings PLC | | Industrials | | | 4,486 | | | | 47,862 | | | | 0.28 | |
Tullow Oil PLC | | Energy | | | 17,906 | | | | 47,623 | | | | 0.28 | |
Hiscox Ltd | | Financials | | | 2,184 | | | | 46,919 | | | | 0.27 | |
Ferrexpo PLC | | Materials | | | 12,920 | | | | 45,481 | | | | 0.27 | |
Investec PLC | | Financials | | | 6,774 | | | | 43,941 | | | | 0.26 | |
SSP Group Plc | | Consumer Discretionary | | | 4,936 | | | | 42,989 | | | | 0.25 | |
Greene King PLC | | Consumer Discretionary | | | 5,400 | | | | 42,366 | | | | 0.25 | |
Royal Bank of Scotland Group PLC | | Financials | | | 15,026 | | | | 41,929 | | | | 0.24 | |
Travis Perkins PLC | | Industrials | | | 2,557 | | | | 41,369 | | | | 0.24 | |
AVEVA Group PLC | | Information Technology | | | 801 | | | | 41,090 | | | | 0.24 | |
Centamin PLC | | Materials | | | 26,121 | | | | 37,935 | | | | 0.22 | |
Premier Oil PLC | | Energy | | | 38,196 | | | | 37,286 | | | | 0.22 | |
Ashmore Group PLC | | Financials | | | 5,750 | | | | 37,194 | | | | 0.22 | |
Greencore Group PLC | | Consumer Staples | | | 13,246 | | | | 36,828 | | | | 0.21 | |
Playtech Plc | | Consumer Discretionary | | | 6,266 | | | | 33,933 | | | | 0.20 | |
Britvic PLC | | Consumer Staples | | | 3,003 | | | | 33,874 | | | | 0.20 | |
WH Smith PLC | | Consumer Discretionary | | | 1,352 | | | | 33,823 | | | | 0.20 | |
Pennon Group PLC | | Utilities | | | 3,542 | | | | 33,402 | | | | 0.19 | |
IWG PLC | | Industrials | | | 7,709 | | | | 33,324 | | | | 0.19 | |
Petrofac Ltd | | Energy | | | 6,092 | | | | 33,255 | | | | 0.19 | |
Intermediate Capital Group PLC | | Financials | | | 1,871 | | | | 32,800 | | | | 0.19 | |
Merlin Entertainments PLC | | Consumer Discretionary | | | 5,699 | | | | 32,493 | | | | 0.19 | |
Man Group PLC/Jersey | | Financials | | | 15,986 | | | | 31,619 | | | | 0.18 | |
Tritax Big Box REIT PLC | | Real Estate | | | 16,030 | | | | 31,399 | | | | 0.18 | |
William Hill PLC | | Consumer Discretionary | | | 15,836 | | | | 31,070 | | | | 0.18 | |
Games Workshop Group PLC | | Consumer Discretionary | | | 472 | | | | 29,779 | | | | 0.17 | |
UNITE Group PLC/The | | Real Estate | | | 2,386 | | | | 29,520 | | | | 0.17 | |
HomeServe PLC | | Industrials | | | 1,947 | | | | 29,344 | | | | 0.17 | |
Jupiter Fund Management PLC | | Financials | | | 5,368 | | | | 28,794 | | | | 0.17 | |
Electrocomponents PLC | | Information Technology | | | 3,525 | | | | 28,315 | | | | 0.16 | |
IG Group Holdings PLC | | Financials | | | 3,764 | | | | 27,918 | | | | 0.16 | |
Domino’s Pizza Group PLC | | Consumer Discretionary | | | 7,605 | | | | 26,841 | | | | 0.16 | |
Associated British Foods PLC | | Consumer Staples | | | 836 | | | | 26,133 | | | | 0.15 | |
Great Portland Estates PLC | | Real Estate | | | 2,985 | | | | 25,924 | | | | 0.15 | |
Sophos Group PLC | | Information Technology | | | 5,008 | | | | 25,095 | | | | 0.15 | |
Melrose Industries PLC | | Industrials | | | 10,819 | | | | 24,839 | | | | 0.14 | |
Avast PLC | | Information Technology | | | 6,366 | | | | 24,247 | | | | 0.14 | |
Dechra Pharmaceuticals PLC | | Health Care | | | 693 | | | | 24,148 | | | | 0.14 | |
Aggreko PLC | | Industrials | | | 2,400 | | | | 24,069 | | | | 0.14 | |
Aston Martin Lagonda Global Holdings PLC | | Consumer Discretionary | | | 1,756 | | | | 22,398 | | | | 0.13 | |
Greggs PLC | | Consumer Discretionary | | | 763 | | | | 22,261 | | | | 0.13 | |
Moneysupermarket.com Group PLC | | Consumer Discretionary | | | 4,223 | | | | 22,101 | | | | 0.13 | |
| | |
| 52 | | The accompanying notes are an integral part of these financial statements. |
GOLDMAN SACHS ALTERNATIVE PREMIA FUND
|
| ADDITIONAL INVESTMENT INFORMATION (continued) |
OVER THE COUNTER TOTAL RETURN SWAP CONTRACTS (continued)
| | | | | | | | | | | | | | |
| Common Stocks | | Sector | | Shares | | | Value | | | Weight | |
Entertainment One Ltd | | Communication Services | | | 4,301 | | | $ | 21,677 | | | | 0.13 | % |
Mediclinic International PLC | | Health Care | | | 5,548 | | | | 21,473 | | | | 0.13 | |
Renewables Infrastructure Group Ltd/The | | Utilities | | | 12,700 | | | | 20,670 | | | | 0.12 | |
Dunelm Group PLC | | Consumer Discretionary | | | 1,757 | | | | 20,524 | | | | 0.12 | |
Plus500 Ltd | | Financials | | | 3,064 | | | | 20,301 | | | | 0.12 | |
BBA Aviation PLC | | Industrials | | | 5,579 | | | | 19,988 | | | | 0.12 | |
Rhi Magnesita NV | | Materials | | | 325 | | | | 19,925 | | | | 0.12 | |
Wizz Air Holdings Plc | | Industrials | | | 438 | | | | 18,934 | | | | 0.11 | |
UDG Healthcare PLC | | Health Care | | | 1,814 | | | | 18,403 | | | | 0.11 | |
Marks & Spencer Group PLC | | Consumer Discretionary | | | 6,837 | | | | 18,287 | | | | 0.11 | |
Inchcape PLC | | Consumer Discretionary | | | 2,234 | | | | 17,469 | | | | 0.10 | |
Primary Health Properties PLC | | Real Estate | | | 10,238 | | | | 17,338 | | | | 0.10 | |
Cairn Energy PLC | | Energy | | | 7,336 | | | | 16,120 | | | | 0.09 | |
Close Brothers Group PLC | | Financials | | | 883 | | | | 15,852 | | | | 0.09 | |
Indivior PLC | | Health Care | | | 28,809 | | | | 15,606 | | �� | | 0.09 | |
Softcat PLC | | Information Technology | | | 1,249 | | | | 15,407 | | | | 0.09 | |
Marshalls PLC | | Materials | | | 1,736 | | | | 15,039 | | | | 0.09 | |
Pets at Home Group Plc | | Consumer Discretionary | | | 6,183 | | | | 14,686 | | | | 0.09 | |
B&M European Value Retail SA | | Consumer Discretionary | | | 3,457 | | | | 14,626 | | | | 0.09 | |
Intu Properties PLC | | Real Estate | | | 14,947 | | | | 14,475 | | | | 0.08 | |
Taylor Wimpey PLC | | Consumer Discretionary | | | 7,171 | | | | 14,360 | | | | 0.08 | |
Euromoney Institutional Investor PLC | | Communication Services | | | 830 | | | | 13,717 | | | | 0.08 | |
Drax Group PLC | | Utilities | | | 4,120 | | | | 13,610 | | | | 0.08 | |
Assura PLC | | Real Estate | | | 16,541 | | | | 13,396 | | | | 0.08 | |
Cobham PLC | | Industrials | | | 9,885 | | | | 13,371 | | | | 0.08 | |
Computacenter PLC | | Information Technology | | | 784 | | | | 13,256 | | | | 0.08 | |
AJ Bell PLC | | Financials | | | 2,537 | | | | 12,918 | | | | 0.08 | |
Bellway PLC | | Consumer Discretionary | | | 358 | | | | 12,641 | | | | 0.07 | |
Flutter Entertainment PLC | | Consumer Discretionary | | | 165 | | | | 12,453 | | | | 0.07 | |
Lancashire Holdings Ltd | | Financials | | | 1,404 | | | | 12,272 | | | | 0.07 | |
National Express Group PLC | | Industrials | | | 2,331 | | | | 11,880 | | | | 0.07 | |
EI Group PLC | | Consumer Discretionary | | | 4,710 | | | | 11,756 | | | | 0.07 | |
Serco Group PLC | | Industrials | | | 6,363 | | | | 11,633 | | | | 0.07 | |
Cranswick PLC | | Consumer Staples | | | 349 | | | | 11,456 | | | | 0.07 | |
Diploma PLC | | Industrials | | | 589 | | | | 11,455 | | | | 0.07 | |
QinetiQ Group PLC | | Industrials | | | 3,183 | | | | 11,291 | | | | 0.07 | |
Redrow PLC | | Consumer Discretionary | | | 1,634 | | | | 11,287 | | | | 0.07 | |
Essentra PLC | | Materials | | | 2,069 | | | | 11,270 | | | | 0.07 | |
Big Yellow Group PLC | | Real Estate | | | 872 | | | | 10,958 | | | | 0.06 | |
Countryside Properties PLC | | Consumer Discretionary | | | 2,883 | | | | 10,921 | | | | 0.06 | |
Shaftesbury PLC | | Real Estate | | | 1,059 | | | | 10,806 | | | | 0.06 | |
Bodycote PLC | | Industrials | | | 1,010 | | | | 10,592 | | | | 0.06 | |
LondonMetric Property PLC | | Real Estate | | | 3,949 | | | | 10,577 | | | | 0.06 | |
Ultra Electronics Holdings PLC | | Industrials | | | 500 | | | | 10,469 | | | | 0.06 | |
Vesuvius PLC | | Industrials | | | 1,474 | | | | 10,257 | | | | 0.06 | |
AG Barr PLC | | Consumer Staples | | | 853 | | | | 10,040 | | | | 0.06 | |
Hochschild Mining PLC | | Materials | | | 3,865 | | | | 9,391 | | | | 0.05 | |
Grainger PLC | | Real Estate | | | 2,967 | | | | 9,250 | | | | 0.05 | |
John Laing Group PLC | | Industrials | | | 1,829 | | | | 9,144 | | | | 0.05 | |
Senior PLC | | Industrials | | | 3,196 | | | | 8,755 | | | | 0.05 | |
J D Wetherspoon PLC | | Consumer Discretionary | | | 468 | | | | 8,493 | | | | 0.05 | |
OneSavings Bank PLC | | Financials | | | 1,811 | | | | 8,338 | | | | 0.05 | |
Safestore Holdings PLC | | Real Estate | | | 1,070 | | | | 8,337 | | | | 0.05 | |
Firstgroup PLC | | Industrials | | | 6,493 | | | | 8,058 | | | | 0.05 | |
Hays PLC | | Industrials | | | 3,965 | | | | 7,908 | | | | 0.05 | |
Spirent Communications PLC | | Information Technology | | | 3,942 | | | | 7,647 | | | | 0.04 | |
Savills PLC | | Real Estate | | | 651 | | | | 7,418 | | | | 0.04 | |
Bank of Georgia Group PLC | | Financials | | | 377 | | | | 7,174 | | | | 0.04 | |
Telecom Plus PLC | | Utilities | | | 400 | | | | 7,159 | | | | 0.04 | |
| | |
| The accompanying notes are an integral part of these financial statements. | | 53 |
GOLDMAN SACHS ALTERNATIVE PREMIA FUND
Consolidated Schedule of Investments(continued)
June 30, 2019 (Unaudited)
|
| ADDITIONAL INVESTMENT INFORMATION (continued) |
OVER THE COUNTER TOTAL RETURN SWAP CONTRACTS (continued)
| | | | | | | | | | | | | | |
| Common Stocks | | Sector | | Shares | | | Value | | | Weight | |
Acacia Mining PLC | | Materials | | | 3,099 | | | $ | 6,975 | | | | 0.04 | % |
Go-Ahead Group PLC/The | | Industrials | | | 274 | | | | 6,857 | | | | 0.04 | |
Stagecoach Group PLC | | Industrials | | | 4,189 | | | | 6,748 | | | | 0.04 | |
Coats Group PLC | | Consumer Discretionary | | | 6,037 | | | | 6,281 | | | | 0.04 | |
888 Holdings PLC | | Consumer Discretionary | | | 2,976 | | | | 6,158 | | | | 0.04 | |
UK Commercial Property REIT Ltd | | Real Estate | | | 5,457 | | | | 6,117 | | | | 0.04 | |
TalkTalk Telecom Group PLC | | Communication Services | | | 4,241 | | | | 6,004 | | | | 0.03 | |
Equiniti Group PLC | | Information Technology | | | 2,127 | | | | 5,936 | | | | 0.03 | |
Morgan Advanced Materials PLC | | Industrials | | | 1,681 | | | | 5,933 | | | | 0.03 | |
Sports Direct International PLC | | Consumer Discretionary | | | 1,609 | | | | 5,640 | | | | 0.03 | |
Sanne Group PLC | | Financials | | | 621 | | | | 5,539 | | | | 0.03 | |
Paragon Banking Group PLC | | Financials | | | 975 | | | | 5,429 | | | | 0.03 | |
IntegraFin Holdings PLC | | Financials | | | 1,124 | | | | 5,423 | | | | 0.03 | |
Polypipe Group plc | | Industrials | | | 956 | | | | 5,391 | | | | 0.03 | |
McCarthy & Stone PLC | | Consumer Discretionary | | | 3,072 | | | | 5,328 | | | | 0.03 | |
Workspace Group PLC | | Real Estate | | | 468 | | | | 5,189 | | | | 0.03 | |
Hill & Smith Holdings PLC | | Materials | | | 330 | | | | 4,907 | | | | 0.03 | |
Mitchells & Butlers PLC | | Consumer Discretionary | | | 1,324 | | | | 4,817 | | | | 0.03 | |
Civitas Social Housing PLC | | Real Estate | | | 4,418 | | | | 4,723 | | | | 0.03 | |
Brewin Dolphin Holdings PLC | | Financials | | | 1,145 | | | | 4,445 | | | | 0.03 | |
Sabre Insurance Group PLC | | Financials | | | 1,206 | | | | 4,178 | | | | 0.02 | |
SIG PLC | | Industrials | | | 2,407 | | | | 3,963 | | | | 0.02 | |
Galliford Try PLC | | Industrials | | | 480 | | | | 3,845 | | | | 0.02 | |
Rathbone Brothers PLC | | Financials | | | 132 | | | | 3,724 | | | | 0.02 | |
Card Factory PLC | | Consumer Discretionary | | | 1,657 | | | | 3,700 | | | | 0.02 | |
St Modwen Properties PLC | | Real Estate | | | 652 | | | | 3,625 | | | | 0.02 | |
Energean Oil & Gas PLC | | Energy | | | 308 | | | | 3,252 | | | | 0.02 | |
Clarkson PLC | | Industrials | | | 98 | | | | 3,111 | | | | 0.02 | |
Stobart Group Ltd | | Industrials | | | 2,189 | | | | 3,080 | | | | 0.02 | |
PZ Cussons PLC | | Consumer Staples | | | 888 | | | | 2,413 | | | | 0.01 | |
TBC Bank Group PLC | | Financials | | | 99 | | | | 2,006 | | | | 0.01 | |
Ted Baker PLC | | Consumer Discretionary | | | 165 | | | | 1,694 | | | | 0.01 | |
TI Fluid Systems PLC | | Consumer Discretionary | | | 669 | | | | 1,671 | | | | 0.01 | |
Millennium & Copthorne Hotels PLC | | Consumer Discretionary | | | 190 | | | | 1,648 | | | | 0.01 | |
James Fisher & Sons PLC | | Industrials | | | 66 | | | | 1,615 | | | | 0.01 | |
CLS Holdings PLC | | Real Estate | | | 409 | | | | 1,113 | | | | 0.01 | |
Vivo Energy PLC | | Consumer Discretionary | | | 653 | | | | 1,099 | | | | 0.01 | |
Hilton Food Group PLC | | Consumer Staples | | | 71 | | | | 871 | | | | 0.01 | |
Kier Group PLC | | Industrials | | | 523 | | | | 706 | | | | 0.00 | |
Daejan Holdings PLC | | Real Estate | | | 9 | | | | 642 | | | | 0.00 | |
ContourGlobal PLC | | Utilities | | | 215 | | | | 520 | | | | 0.00 | |
Amigo Holdings PLC | | Financials | | | 195 | | | | 492 | | | | 0.00 | |
Bakkavor Group PLC | | Consumer Staples | | | 315 | | | | 478 | | | | 0.00 | |
Rank Group PLC | | Consumer Discretionary | | | 212 | | | | 427 | | | | 0.00 | |
A basket (JPGSFDUS) of common stocks
| | | | | | | | | | | | | | |
| Common Stocks | | Sector | | Shares | | | Value | | | Weight | |
Apple Inc | | Information Technology | | | 6,999 | | | $ | 1,385,309 | | | | 2.41 | % |
Johnson & Johnson | | Health Care | | | 9,614 | | | | 1,338,991 | | | | 2.33 | |
Amazon.com Inc | | Consumer Discretionary | | | 593 | | | | 1,123,644 | | | | 1.95 | |
Intuit Inc | | Information Technology | | | 3,281 | | | | 857,308 | | | | 1.49 | |
QUALCOMM Inc | | Information Technology | | | 9,906 | | | | 753,521 | | | | 1.31 | |
Facebook Inc | | Communication Services | | | 3,901 | | | | 752,822 | | | | 1.31 | |
Mastercard Inc | | Information Technology | | | 2,707 | | | | 716,135 | | | | 1.24 | |
Xilinx Inc | | Information Technology | | | 5,803 | | | | 684,239 | | | | 1.19 | |
Maxim Integrated Products Inc | | Information Technology | | | 11,266 | | | | 673,926 | | | | 1.17 | |
JPMorgan Chase & Co | | Financials | | | 5,459 | | | | 610,303 | | | | 1.06 | |
Cooper Cos Inc/The | | Health Care | | | 1,692 | | | | 569,924 | | | | 0.99 | |
| | |
| 54 | | The accompanying notes are an integral part of these financial statements. |
GOLDMAN SACHS ALTERNATIVE PREMIA FUND
|
| ADDITIONAL INVESTMENT INFORMATION (continued) |
OVER THE COUNTER TOTAL RETURN SWAP CONTRACTS (continued)
| | | | | | | | | | | | | | |
| Common Stocks | | Sector | | Shares | | | Value | | | Weight | |
Motorola Solutions Inc | | Information Technology | | | 3,377 | | | $ | 563,101 | | | | 0.98 | % |
VeriSign Inc | | Information Technology | | | 2,646 | | | | 553,442 | | | | 0.96 | |
Henry Schein Inc | | Health Care | | | 7,846 | | | | 548,457 | | | | 0.95 | |
Walmart Inc | | Consumer Staples | | | 4,894 | | | | 540,785 | | | | 0.94 | |
Starbucks Corp | | Consumer Discretionary | | | 6,396 | | | | 536,173 | | | | 0.93 | |
PepsiCo Inc | | Consumer Staples | | | 4,007 | | | | 525,492 | | | | 0.91 | |
Cisco Systems Inc | | Information Technology | | | 9,284 | | | | 508,107 | | | | 0.88 | |
Costco Wholesale Corp | | Consumer Staples | | | 1,833 | | | | 484,382 | | | | 0.84 | |
American Tower Corp | | Real Estate | | | 2,351 | | | | 480,719 | | | | 0.84 | |
HP Inc | | Information Technology | | | 22,524 | | | | 468,274 | | | | 0.81 | |
Alphabet Inc | | Communication Services | | | 432 | | | | 467,885 | | | | 0.81 | |
Aon PLC | | Financials | | | 2,376 | | | | 458,472 | | | | 0.80 | |
Progressive Corp/The | | Financials | | | 5,704 | | | | 455,887 | | | | 0.79 | |
Quest Diagnostics Inc | | Health Care | | | 4,387 | | | | 446,665 | | | | 0.78 | |
TripAdvisor Inc | | Communication Services | | | 9,501 | | | | 439,791 | | | | 0.76 | |
Marsh & McLennan Cos Inc | | Financials | | | 4,328 | | | | 431,692 | | | | 0.75 | |
UnitedHealth Group Inc | | Health Care | | | 1,692 | | | | 412,796 | | | | 0.72 | |
Electronic Arts Inc | | Communication Services | | | 3,916 | | | | 396,499 | | | | 0.69 | |
Honeywell International Inc | | Industrials | | | 2,266 | | | | 395,557 | | | | 0.69 | |
Chevron Corp | | Energy | | | 3,132 | | | | 389,755 | | | | 0.68 | |
McKesson Corp | | Health Care | | | 2,890 | | | | 388,409 | | | | 0.67 | |
Gilead Sciences Inc | | Health Care | | | 5,294 | | | | 357,681 | | | | 0.62 | |
American Express Co | | Financials | | | 2,896 | | | | 357,448 | | | | 0.62 | |
S&P Global Inc | | Financials | | | 1,565 | | | | 356,474 | | | | 0.62 | |
Procter & Gamble Co/The | | Consumer Staples | | | 3,231 | | | | 354,225 | | | | 0.62 | |
Sysco Corp | | Consumer Staples | | | 5,000 | | | | 353,606 | | | | 0.61 | |
Zoetis Inc | | Health Care | | | 3,103 | | | | 352,114 | | | | 0.61 | |
3M Co | | Industrials | | | 1,985 | | | | 344,141 | | | | 0.60 | |
Equinix Inc | | Real Estate | | | 675 | | | | 340,462 | | | | 0.59 | |
Cerner Corp | | Health Care | | | 4,529 | | | | 331,979 | | | | 0.58 | |
ConocoPhillips | | Energy | | | 5,295 | | | | 322,984 | | | | 0.56 | |
Verizon Communications Inc | | Communication Services | | | 5,647 | | | | 322,637 | | | | 0.56 | |
Apache Corp | | Energy | | | 11,037 | | | | 319,736 | | | | 0.56 | |
Brown-Forman Corp | | Consumer Staples | | | 5,763 | | | | 319,448 | | | | 0.55 | |
Moody’s Corp | | Financials | | | 1,612 | | | | 314,878 | | | | 0.55 | |
Duke Energy Corp | | Utilities | | | 3,541 | | | | 312,442 | | | | 0.54 | |
Becton Dickinson and Co | | Health Care | | | 1,228 | | | | 309,587 | | | | 0.54 | |
Juniper Networks Inc | | Information Technology | | | 11,556 | | | | 307,742 | | | | 0.53 | |
PPL Corp | | Utilities | | | 9,912 | | | | 307,363 | | | | 0.53 | |
Pioneer Natural Resources Co | | Energy | | | 1,951 | | | | 300,161 | | | | 0.52 | |
American Electric Power Co Inc | | Utilities | | | 3,405 | | | | 299,637 | | | | 0.52 | |
Campbell Soup Co | | Consumer Staples | | | 7,431 | | | | 297,778 | | | | 0.52 | |
Discovery Inc | | Communication Services | | | 10,187 | | | | 289,821 | | | | 0.50 | |
Discovery Inc | | Communication Services | | | 9,380 | | | | 287,952 | | | | 0.50 | |
NiSource Inc | | Utilities | | | 9,945 | | | | 286,404 | | | | 0.50 | |
WEC Energy Group Inc | | Utilities | | | 3,359 | | | | 280,038 | | | | 0.49 | |
Coca-Cola Co/The | | Consumer Staples | | | 5,498 | | | | 279,977 | | | | 0.49 | |
Ameren Corp | | Utilities | | | 3,727 | | | | 279,902 | | | | 0.49 | |
SBA Communications Corp | | Real Estate | | | 1,241 | | | | 279,085 | | | | 0.48 | |
Kroger Co/The | | Consumer Staples | | | 12,803 | | | | 277,954 | | | | 0.48 | |
AT&T Inc | | Communication Services | | | 8,271 | | | | 277,167 | | | | 0.48 | |
Omnicom Group Inc | | Communication Services | | | 3,376 | | | | 276,635 | | | | 0.48 | |
DENTSPLY SIRONA Inc | | Health Care | | | 4,736 | | | | 276,389 | | | | 0.48 | |
Waste Management Inc | | Industrials | | | 2,368 | | | | 273,192 | | | | 0.47 | |
Entergy Corp | | Utilities | | | 2,652 | | | | 272,928 | | | | 0.47 | |
McCormick & Co Inc/MD | | Consumer Staples | | | 1,746 | | | | 270,595 | | | | 0.47 | |
Yum! Brands Inc | | Consumer Discretionary | | | 2,437 | | | | 269,694 | | | | 0.47 | |
Darden Restaurants Inc | | Consumer Discretionary | | | 2,192 | | | | 266,792 | | | | 0.46 | |
Ameriprise Financial Inc | | Financials | | | 1,802 | | | | 261,554 | | | | 0.45 | |
| | |
| The accompanying notes are an integral part of these financial statements. | | 55 |
GOLDMAN SACHS ALTERNATIVE PREMIA FUND
Consolidated Schedule of Investments(continued)
June 30, 2019 (Unaudited)
|
| ADDITIONAL INVESTMENT INFORMATION (continued) |
OVER THE COUNTER TOTAL RETURN SWAP CONTRACTS (continued)
| | | | | | | | | | | | | | |
| Common Stocks | | Sector | | Shares | | | Value | | | Weight | |
Monster Beverage Corp | | Consumer Staples | | | 4,090 | | | $ | 261,046 | | | | 0.45 | % |
T Rowe Price Group Inc | | Financials | | | 2,360 | | | | 258,935 | | | | 0.45 | |
Hasbro Inc | | Consumer Discretionary | | | 2,386 | | | | 252,186 | | | | 0.44 | |
Merck & Co Inc | | Health Care | | | 2,987 | | | | 250,453 | | | | 0.44 | |
Walt Disney Co/The | | Communication Services | | | 1,775 | | | | 247,803 | | | | 0.43 | |
F5 Networks Inc | | Information Technology | | | 1,682 | | | | 244,988 | | | | 0.43 | |
Comcast Corp | | Communication Services | | | 5,740 | | | | 242,676 | | | | 0.42 | |
Illinois Tool Works Inc | | Industrials | | | 1,598 | | | | 241,038 | | | | 0.42 | |
Kimberly-Clark Corp | | Consumer Staples | | | 1,800 | | | | 239,926 | | | | 0.42 | |
EOG Resources Inc | | Energy | | | 2,565 | | | | 238,940 | | | | 0.42 | |
US Bancorp | | Financials | | | 4,492 | | | | 235,399 | | | | 0.41 | |
News Corp | | Communication Services | | | 17,209 | | | | 232,152 | | | | 0.40 | |
Chipotle Mexican Grill Inc | | Consumer Discretionary | | | 316 | | | | 231,907 | | | | 0.40 | |
Discover Financial Services | | Financials | | | 2,937 | | | | 227,872 | | | | 0.40 | |
Hershey Co/The | | Consumer Staples | | | 1,697 | | | | 227,412 | | | | 0.40 | |
DTE Energy Co | | Utilities | | | 1,776 | | | | 227,147 | | | | 0.39 | |
Allegion PLC | | Industrials | | | 2,054 | | | | 227,042 | | | | 0.39 | |
Masco Corp | | Industrials | | | 5,779 | | | | 226,776 | | | | 0.39 | |
H&R Block Inc | | Consumer Discretionary | | | 7,647 | | | | 224,064 | | | | 0.39 | |
Exxon Mobil Corp | | Energy | | | 2,920 | | | | 223,774 | | | | 0.39 | |
McDonald’s Corp | | Consumer Discretionary | | | 1,069 | | | | 222,076 | | | | 0.39 | |
Pfizer Inc | | Health Care | | | 5,036 | | | | 218,170 | | | | 0.38 | |
Digital Realty Trust Inc | | Real Estate | | | 1,849 | | | | 217,740 | | | | 0.38 | |
Jack Henry & Associates Inc | | Information Technology | | | 1,620 | | | | 216,948 | | | | 0.38 | |
Texas Instruments Inc | | Information Technology | | | 1,862 | | | | 213,735 | | | | 0.37 | |
NextEra Energy Inc | | Utilities | | | 1,043 | | | | 213,727 | | | | 0.37 | |
Kellogg Co | | Consumer Staples | | | 3,989 | | | | 213,664 | | | | 0.37 | |
United Parcel Service Inc | | Industrials | | | 2,063 | | | | 213,010 | | | | 0.37 | |
Simon Property Group Inc | | Real Estate | | | 1,329 | | | | 212,253 | | | | 0.37 | |
Emerson Electric Co | | Industrials | | | 3,158 | | | | 210,679 | | | | 0.37 | |
Synchrony Financial | | Financials | | | 6,018 | | | | 208,656 | | | | 0.36 | |
SVB Financial Group | | Financials | | | 921 | | | | 206,958 | | | | 0.36 | |
Ball Corp | | Materials | | | 2,950 | | | | 206,447 | | | | 0.36 | |
General Mills Inc | | Consumer Staples | | | 3,840 | | | | 201,678 | | | | 0.35 | |
Pinnacle West Capital Corp | | Utilities | | | 2,139 | | | | 201,244 | | | | 0.35 | |
Under Armour Inc | | Consumer Discretionary | | | 7,925 | | | | 200,906 | | | | 0.35 | |
Under Armour Inc | | Consumer Discretionary | | | 8,987 | | | | 199,509 | | | | 0.35 | |
Southwest Airlines Co | | Industrials | | | 3,911 | | | | 198,583 | | | | 0.34 | |
CH Robinson Worldwide Inc | | Industrials | | | 2,316 | | | | 195,375 | | | | 0.34 | |
Arthur J Gallagher & Co | | Financials | | | 2,181 | | | | 190,995 | | | | 0.33 | |
American Water Works Co Inc | | Utilities | | | 1,643 | | | | 190,563 | | | | 0.33 | |
Dominion Energy Inc | | Utilities | | | 2,460 | | | | 190,229 | | | | 0.33 | |
Amgen Inc | | Health Care | | | 1,024 | | | | 188,772 | | | | 0.33 | |
Southern Co/The | | Utilities | | | 3,406 | | | | 188,297 | | | | 0.33 | |
Exelon Corp | | Utilities | | | 3,822 | | | �� | 183,210 | | | | 0.32 | |
Sherwin-Williams Co/The | | Materials | | | 390 | | | | 178,915 | | | | 0.31 | |
Xcel Energy Inc | | Utilities | | | 2,910 | | | | 173,094 | | | | 0.30 | |
AutoZone Inc | | Consumer Discretionary | | | 157 | | | | 173,037 | | | | 0.30 | |
Air Products & Chemicals Inc | | Materials | | | 747 | | | | 169,195 | | | | 0.29 | |
Eli Lilly & Co | | Health Care | | | 1,521 | | | | 168,510 | | | | 0.29 | |
Viacom Inc | | Communication Services | | | 5,542 | | | | 165,549 | | | | 0.29 | |
JB Hunt Transport Services Inc | | Industrials | | | 1,804 | | | | 164,909 | | | | 0.29 | |
Charles Schwab Corp/The | | Financials | | | 4,062 | | | | 163,248 | | | | 0.28 | |
Eversource Energy | | Utilities | | | 2,134 | | | | 161,660 | | | | 0.28 | |
Consolidated Edison Inc | | Utilities | | | 1,832 | | | | 160,667 | | | | 0.28 | |
Microsoft Corp | | Information Technology | | | 1,187 | | | | 159,053 | | | | 0.28 | |
Welltower Inc | | Real Estate | | | 1,934 | | | | 157,694 | | | | 0.27 | |
CMS Energy Corp | | Utilities | | | 2,692 | | | | 155,905 | | | | 0.27 | |
LyondellBasell Industries NV | | Materials | | | 1,789 | | | | 154,090 | | | | 0.27 | |
| | |
| 56 | | The accompanying notes are an integral part of these financial statements. |
GOLDMAN SACHS ALTERNATIVE PREMIA FUND
|
| ADDITIONAL INVESTMENT INFORMATION (continued) |
OVER THE COUNTER TOTAL RETURN SWAP CONTRACTS (continued)
| | | | | | | | | | | | | | |
| Common Stocks | | Sector | | Shares | | | Value | | | Weight | |
Comerica Inc | | Financials | | | 2,119 | | | $ | 153,951 | | | | 0.27 | % |
Biogen Inc | | Health Care | | | 658 | | | | 153,861 | | | | 0.27 | |
Weyerhaeuser Co | | Real Estate | | | 5,839 | | | | 153,792 | | | | 0.27 | |
Parker-Hannifin Corp | | Industrials | | | 898 | | | | 152,692 | | | | 0.27 | |
Lowe’s Cos Inc | | Consumer Discretionary | | | 1,513 | | | | 152,641 | | | | 0.27 | |
Realty Income Corp | | Real Estate | | | 2,209 | | | | 152,387 | | | | 0.26 | |
Sealed Air Corp | | Materials | | | 3,485 | | | | 149,097 | | | | 0.26 | |
Crown Castle International Corp | | Real Estate | | | 1,133 | | | | 147,663 | | | | 0.26 | |
AvalonBay Communities Inc | | Real Estate | | | 721 | | | | 146,552 | | | | 0.25 | |
Philip Morris International Inc | | Consumer Staples | | | 1,847 | | | | 145,035 | | | | 0.25 | |
Mondelez International Inc | | Consumer Staples | | | 2,670 | | | | 143,909 | | | | 0.25 | |
Public Service Enterprise Group Inc | | Utilities | | | 2,444 | | | | 143,765 | | | | 0.25 | |
Dollar General Corp | | Consumer Discretionary | | | 1,059 | | | | 143,190 | | | | 0.25 | |
Medtronic PLC | | Health Care | | | 1,463 | | | | 142,442 | | | | 0.25 | |
Evergy Inc | | Utilities | | | 2,364 | | | | 142,165 | | | | 0.25 | |
Robert Half International Inc | | Industrials | | | 2,487 | | | | 141,783 | | | | 0.25 | |
Marathon Petroleum Corp | | Energy | | | 2,511 | | | | 140,308 | | | | 0.24 | |
Newmont Goldcorp Corp | | Materials | | | 3,628 | | | | 139,574 | | | | 0.24 | |
Incyte Corp | | Health Care | | | 1,625 | | | | 138,059 | | | | 0.24 | |
FirstEnergy Corp | | Utilities | | | 3,218 | | | | 137,774 | | | | 0.24 | |
Public Storage | | Real Estate | | | 576 | | | | 137,087 | | | | 0.24 | |
Equity Residential | | Real Estate | | | 1,798 | | | | 136,499 | | | | 0.24 | |
United Airlines Holdings Inc | | Industrials | | | 1,545 | | | | 135,305 | | | | 0.24 | |
Ross Stores Inc | | Consumer Discretionary | | | 1,359 | | | | 134,665 | | | | 0.23 | |
Atmos Energy Corp | | Utilities | | | 1,273 | | | | 134,374 | | | | 0.23 | |
Ventas Inc | | Real Estate | | | 1,963 | | | | 134,178 | | | | 0.23 | |
CME Group Inc | | Financials | | | 686 | | | | 133,101 | | | | 0.23 | |
Mid-America Apartment Communities Inc | | Real Estate | | | 1,126 | | | | 132,549 | | | | 0.23 | |
UDR Inc | | Real Estate | | | 2,945 | | | | 132,186 | | | | 0.23 | |
Alliant Energy Corp | | Utilities | | | 2,672 | | | | 131,149 | | | | 0.23 | |
Altria Group Inc | | Consumer Staples | | | 2,740 | | | | 129,739 | | | | 0.23 | |
Essex Property Trust Inc | | Real Estate | | | 443 | | | | 129,229 | | | | 0.22 | |
HCP Inc | | Real Estate | | | 4,006 | | | | 128,122 | | | | 0.22 | |
Colgate-Palmolive Co | | Consumer Staples | | | 1,780 | | | | 127,543 | | | | 0.22 | |
WW Grainger Inc | | Industrials | | | 465 | | | | 124,854 | | | | 0.22 | |
Clorox Co/The | | Consumer Staples | | | 812 | | | | 124,401 | | | | 0.22 | |
Sempra Energy | | Utilities | | | 903 | | | | 124,051 | | | | 0.22 | |
Newell Brands Inc | | Consumer Discretionary | | | 7,906 | | | | 121,916 | | | | 0.21 | |
Church & Dwight Co Inc | | Consumer Staples | | | 1,663 | | | | 121,525 | | | | 0.21 | |
TJX Cos Inc/The | | Consumer Discretionary | | | 2,284 | | | | 120,777 | | | | 0.21 | |
CenterPoint Energy Inc | | Utilities | | | 4,209 | | | | 120,512 | | | | 0.21 | |
Edison International | | Utilities | | | 1,785 | | | | 120,299 | | | | 0.21 | |
International Business Machines Corp | | Information Technology | | | 869 | | | | 119,865 | | | | 0.21 | |
Republic Services Inc | | Industrials | | | 1,376 | | | | 119,251 | | | | 0.21 | |
Dollar Tree Inc | | Consumer Discretionary | | | 1,074 | | | | 115,383 | | | | 0.20 | |
Verisk Analytics Inc | | Industrials | | | 771 | | | | 112,889 | | | | 0.20 | |
O’Reilly Automotive Inc | | Consumer Discretionary | | | 305 | | | | 112,757 | | | | 0.20 | |
Apartment Investment & Management Co | | Real Estate | | | 2,196 | | | | 110,070 | | | | 0.19 | |
Extra Space Storage Inc | | Real Estate | | | 1,032 | | | | 109,513 | | | | 0.19 | |
Chubb Ltd | | Financials | | | 740 | | | | 108,941 | | | | 0.19 | |
Tapestry Inc | | Consumer Discretionary | | | 3,416 | | | | 108,380 | | | | 0.19 | |
Hormel Foods Corp | | Consumer Staples | | | 2,625 | | | | 106,436 | | | | 0.18 | |
United Technologies Corp | | Industrials | | | 815 | | | | 106,076 | | | | 0.18 | |
Mattel Inc | | Consumer Discretionary | | | 9,423 | | | | 105,637 | | | | 0.18 | |
Regency Centers Corp | | Real Estate | | | 1,575 | | | | 105,111 | | | | 0.18 | |
JM Smucker Co/The | | Consumer Staples | | | 902 | | | | 103,905 | | | | 0.18 | |
Tyson Foods Inc | | Consumer Staples | | | 1,284 | | | | 103,677 | | | | 0.18 | |
M&T Bank Corp | | Financials | | | 610 | | | | 103,659 | | | | 0.18 | |
AMETEK Inc | | Industrials | | | 1,125 | | | | 102,198 | | | | 0.18 | |
| | |
| The accompanying notes are an integral part of these financial statements. | | 57 |
GOLDMAN SACHS ALTERNATIVE PREMIA FUND
Consolidated Schedule of Investments(continued)
June 30, 2019 (Unaudited)
|
| ADDITIONAL INVESTMENT INFORMATION (continued) |
OVER THE COUNTER TOTAL RETURN SWAP CONTRACTS (continued)
| | | | | | | | | | | | | | |
| Common Stocks | | Sector | | Shares | | | Value | | | Weight | |
Bristol-Myers Squibb Co | | Health Care | | | 2,253 | | | $ | 102,167 | | | | 0.18 | % |
Allstate Corp/The | | Financials | | | 1,003 | | | | 101,963 | | | | 0.18 | |
Intercontinental Exchange Inc | | Financials | | | 1,177 | | | | 101,130 | | | | 0.18 | |
Prologis Inc | | Real Estate | | | 1,262 | | | | 101,073 | | | | 0.18 | |
Roper Technologies Inc | | Industrials | | | 275 | | | | 100,824 | | | | 0.18 | |
Linde PLC | | Materials | | | 500 | | | | 100,390 | | | | 0.17 | |
Cimarex Energy Co | | Energy | | | 1,676 | | | | 99,413 | | | | 0.17 | |
Celanese Corp | | Materials | | | 873 | | | | 94,121 | | | | 0.16 | |
Harley-Davidson Inc | | Consumer Discretionary | | | 2,607 | | | | 93,392 | | | | 0.16 | |
Constellation Brands Inc | | Consumer Staples | | | 467 | | | | 91,890 | | | | 0.16 | |
Cummins Inc | | Industrials | | | 536 | | | | 91,856 | | | | 0.16 | |
Cboe Global Markets Inc | | Financials | | | 882 | | | | 91,403 | | | | 0.16 | |
NIKE Inc | | Consumer Discretionary | | | 1,067 | | | | 89,591 | | | | 0.16 | |
Federal Realty Investment Trust | | Real Estate | | | 692 | | | | 89,078 | | | | 0.15 | |
Gap Inc/The | | Consumer Discretionary | | | 4,755 | | | | 85,444 | | | | 0.15 | |
Wynn Resorts Ltd | | Consumer Discretionary | | | 687 | | | | 85,227 | | | | 0.15 | |
Duke Realty Corp | | Real Estate | | | 2,688 | | | | 84,977 | | | | 0.15 | |
Ecolab Inc | | Materials | | | 426 | | | | 84,107 | | | | 0.15 | |
Everest Re Group Ltd | | Financials | | | 339 | | | | 83,852 | | | | 0.15 | |
Alexandria Real Estate Equities Inc | | Real Estate | | | 583 | | | | 82,308 | | | | 0.14 | |
Kimco Realty Corp | | Real Estate | | | 4,446 | | | | 82,165 | | | | 0.14 | |
Cincinnati Financial Corp | | Financials | | | 787 | | | | 81,579 | | | | 0.14 | |
Travelers Cos Inc/The | | Financials | | | 542 | | | | 81,072 | | | | 0.14 | |
Vulcan Materials Co | | Materials | | | 586 | | | | 80,408 | | | | 0.14 | |
Target Corp | | Consumer Discretionary | | | 910 | | | | 78,799 | | | | 0.14 | |
Advance Auto Parts Inc | | Consumer Discretionary | | | 511 | | | | 78,691 | | | | 0.14 | |
Ulta Beauty Inc | | Consumer Discretionary | | | 226 | | | | 78,515 | | | | 0.14 | |
Anthem Inc | | Health Care | | | 276 | | | | 77,843 | | | | 0.14 | |
Danaher Corp | | Health Care | | | 531 | | | | 75,825 | | | | 0.13 | |
Best Buy Co Inc | | Consumer Discretionary | | | 1,068 | | | | 74,493 | | | | 0.13 | |
Foot Locker Inc | | Consumer Discretionary | | | 1,759 | | | | 73,737 | | | | 0.13 | |
E*TRADE Financial Corp | | Financials | | | 1,647 | | | | 73,466 | | | | 0.13 | |
International Flavors & Fragrances Inc | | Materials | | | 504 | | | | 73,184 | | | | 0.13 | |
Iron Mountain Inc | | Real Estate | | | 2,278 | | | | 71,315 | | | | 0.12 | |
AES Corp/VA | | Utilities | | | 4,252 | | | | 71,256 | | | | 0.12 | |
Pentair PLC | | Industrials | | | 1,803 | | | | 67,069 | | | | 0.12 | |
Interpublic Group of Cos Inc/The | | Communication Services | | | 2,950 | | | | 66,633 | | | | 0.12 | |
Genuine Parts Co | | Consumer Discretionary | | | 632 | | | | 65,494 | | | | 0.11 | |
Conagra Brands Inc | | Consumer Staples | | | 2,430 | | | | 64,450 | | | | 0.11 | |
Vornado Realty Trust | | Real Estate | | | 978 | | | | 62,668 | | | | 0.11 | |
PPG Industries Inc | | Materials | | | 530 | | | | 61,854 | | | | 0.11 | |
Baxter International Inc | | Health Care | | | 751 | | | | 61,533 | | | | 0.11 | |
Laboratory Corp of America Holdings | | Health Care | | | 355 | | | | 61,442 | | | | 0.11 | |
Nasdaq Inc | | Financials | | | 623 | | | | 59,900 | | | | 0.10 | |
Freeport-McMoRan Inc | | Materials | | | 5,090 | | | | 59,090 | | | | 0.10 | |
Estee Lauder Cos Inc/The | | Consumer Staples | | | 321 | | | | 58,859 | | | | 0.10 | |
Macerich Co/The | | Real Estate | | | 1,733 | | | | 58,053 | | | | 0.10 | |
Hartford Financial Services Group Inc/Th | | Financials | | | 1,038 | | | | 57,822 | | | | 0.10 | |
Boston Properties Inc | | Real Estate | | | 439 | | | | 56,603 | | | | 0.10 | |
Cabot Oil & Gas Corp | | Energy | | | 2,459 | | | | 56,449 | | | | 0.10 | |
Paychex Inc | | Information Technology | | | 685 | | | | 56,380 | | | | 0.10 | |
Assurant Inc | | Financials | | | 494 | | | | 52,593 | | | | 0.09 | |
News Corp | | Communication Services | | | 3,749 | | | | 52,341 | | | | 0.09 | |
Willis Towers Watson PLC | | Financials | | | 273 | | | | 52,194 | | | | 0.09 | |
Archer-Daniels-Midland Co | | Consumer Staples | | | 1,224 | | | | 49,940 | | | | 0.09 | |
Fiserv Inc | | Information Technology | | | 533 | | | | 48,567 | | | | 0.08 | |
Nielsen Holdings PLC | | Industrials | | | 2,128 | | | | 48,099 | | | | 0.08 | |
Broadcom Inc | | Information Technology | | | 166 | | | | 47,706 | | | | 0.08 | |
PulteGroup Inc | | Consumer Discretionary | | | 1,497 | | | | 47,320 | | | | 0.08 | |
| | |
| 58 | | The accompanying notes are an integral part of these financial statements. |
GOLDMAN SACHS ALTERNATIVE PREMIA FUND
|
| ADDITIONAL INVESTMENT INFORMATION (continued) |
OVER THE COUNTER TOTAL RETURN SWAP CONTRACTS (continued)
| | | | | | | | | | | | | | |
| Common Stocks | | Sector | | Shares | | | Value | | | Weight | |
Visa Inc | | Information Technology | | | 269 | | | $ | 46,617 | | | | 0.08 | % |
Oracle Corp | | Information Technology | | | 791 | | | | 45,084 | | | | 0.08 | |
Fidelity National Information Services I | | Information Technology | | | 346 | | | | 42,436 | | | | 0.07 | |
Kohl’s Corp | | Consumer Discretionary | | | 880 | | | | 41,860 | | | | 0.07 | |
Keysight Technologies Inc | | Information Technology | | | 458 | | | | 41,105 | | | | 0.07 | |
Western Union Co/The | | Information Technology | | | 2,033 | | | | 40,429 | | | | 0.07 | |
Nordstrom Inc | | Consumer Discretionary | | | 1,222 | | | | 38,944 | | | | 0.07 | |
People’s United Financial Inc | | Financials | | | 2,309 | | | | 38,745 | | | | 0.07 | |
Macy’s Inc | | Consumer Discretionary | | | 1,796 | | | | 38,536 | | | | 0.07 | |
Universal Health Services Inc | | Health Care | | | 294 | | | | 38,359 | | | | 0.07 | |
Copart Inc | | Industrials | | | 509 | | | | 38,032 | | | | 0.07 | |
Tractor Supply Co | | Consumer Discretionary | | | 337 | | | | 36,667 | | | | 0.06 | |
MSCI Inc | | Financials | | | 146 | | | | 34,792 | | | | 0.06 | |
Cadence Design Systems Inc | | Information Technology | | | 491 | | | | 34,732 | | | | 0.06 | |
Citigroup Inc | | Financials | | | 490 | | | | 34,311 | | | | 0.06 | |
Automatic Data Processing Inc | | Information Technology | | | 207 | | | | 34,203 | | | | 0.06 | |
Bank of America Corp | | Financials | | | 1,143 | | | | 33,142 | | | | 0.06 | |
Capri Holdings Ltd | | Consumer Discretionary | | | 953 | | | | 33,037 | | | | 0.06 | |
Wells Fargo & Co | | Financials | | | 691 | | | | 32,710 | | | | 0.06 | |
Loews Corp | | Financials | | | 593 | | | | 32,440 | | | | 0.06 | |
Micron Technology Inc | | Information Technology | | | 828 | | | | 31,933 | | | | 0.06 | |
Zimmer Biomet Holdings Inc | | Health Care | | | 261 | | | | 30,775 | | | | 0.05 | |
Intel Corp | | Information Technology | | | 635 | | | | 30,375 | | | | 0.05 | |
Broadridge Financial Solutions Inc | | Information Technology | | | 236 | | | | 30,106 | | | | 0.05 | |
BB&T Corp | | Financials | | | 592 | | | | 29,071 | | | | 0.05 | |
HollyFrontier Corp | | Energy | | | 618 | | | | 28,594 | | | | 0.05 | |
Huntington Bancshares Inc/OH | | Financials | | | 2,063 | | | | 28,506 | | | | 0.05 | |
Garmin Ltd | | Consumer Discretionary | | | 342 | | | | 27,293 | | | | 0.05 | |
Western Digital Corp | | Information Technology | | | 572 | | | | 27,184 | | | | 0.05 | |
Alaska Air Group Inc | | Industrials | | | 415 | | | | 26,549 | | | | 0.05 | |
Abbott Laboratories | | Health Care | | | 305 | | | | 25,677 | | | | 0.04 | |
DXC Technology Co | | Information Technology | | | 461 | | | | 25,426 | | | | 0.04 | |
TransDigm Group Inc | | Industrials | | | 51 | | | | 24,753 | | | | 0.04 | |
MetLife Inc | | Financials | | | 497 | | | | 24,667 | | | | 0.04 | |
Torchmark Corp | | Financials | | | 264 | | | | 23,631 | | | | 0.04 | |
Qorvo Inc | | Information Technology | | | 351 | | | | 23,412 | | | | 0.04 | |
Norfolk Southern Corp | | Industrials | | | 116 | | | | 23,057 | | | | 0.04 | |
CenturyLink Inc | | Communication Services | | | 1,954 | | | | 22,982 | | | | 0.04 | |
CVS Health Corp | | Health Care | | | 414 | | | | 22,576 | | | | 0.04 | |
Rollins Inc | | Industrials | | | 617 | | | | 22,142 | | | | 0.04 | |
Advanced Micro Devices Inc | | Information Technology | | | 729 | | | | 22,125 | | | | 0.04 | |
Charter Communications Inc | | Communication Services | | | 56 | | | | 21,977 | | | | 0.04 | |
Alliance Data Systems Corp | | Information Technology | | | 156 | | | | 21,898 | | | | 0.04 | |
Symantec Corp | | Information Technology | | | 1,002 | | | | 21,806 | | | | 0.04 | |
Capital One Financial Corp | | Financials | | | 238 | | | | 21,598 | | | | 0.04 | |
Phillips 66 | | Energy | | | 230 | | | | 21,484 | | | | 0.04 | |
FLIR Systems Inc | | Information Technology | | | 397 | | | | 21,481 | | | | 0.04 | |
Boeing Co/The | | Industrials | | | 59 | | | | 21,458 | | | | 0.04 | |
Prudential Financial Inc | | Financials | | | 209 | | | | 21,063 | | | | 0.04 | |
Cigna Corp | | Health Care | | | 131 | | | | 20,677 | | | | 0.04 | |
Fortinet Inc | | Information Technology | | | 268 | | | | 20,552 | | | | 0.04 | |
Cognizant Technology Solutions Corp | | Information Technology | | | 323 | | | | 20,447 | | | | 0.04 | |
Westrock Co | | Materials | | | 559 | | | | 20,383 | | | | 0.04 | |
Lennar Corp | | Consumer Discretionary | | | 416 | | | | 20,158 | | | | 0.04 | |
Lam Research Corp | | Information Technology | | | 107 | | | | 20,057 | | | | 0.03 | |
Lincoln National Corp | | Financials | | | 303 | | | | 19,498 | | | | 0.03 | |
Synopsys Inc | | Information Technology | | | 146 | | | | 18,751 | | | | 0.03 | |
Applied Materials Inc | | Information Technology | | | 414 | | | | 18,607 | | | | 0.03 | |
Union Pacific Corp | | Industrials | | | 108 | | | | 18,245 | | | | 0.03 | |
| | |
| The accompanying notes are an integral part of these financial statements. | | 59 |
GOLDMAN SACHS ALTERNATIVE PREMIA FUND
Consolidated Schedule of Investments(continued)
June 30, 2019 (Unaudited)
|
| ADDITIONAL INVESTMENT INFORMATION (continued) |
OVER THE COUNTER TOTAL RETURN SWAP CONTRACTS (continued)
| | | | | | | | | | | | | | |
| Common Stocks | | Sector | | Shares | | | Value | | | Weight | |
Kinder Morgan Inc/DE | | Energy | | | 874 | | | $ | 18,242 | | | | 0.03 | % |
Teleflex Inc | | Health Care | | | 53 | | | | 17,679 | | | | 0.03 | |
Walgreens Boots Alliance Inc | | Consumer Staples | | | 320 | | | | 17,512 | | | | 0.03 | |
Principal Financial Group Inc | | Financials | | | 299 | | | | 17,297 | | | | 0.03 | |
Cardinal Health Inc | | Health Care | | | 366 | | | | 17,235 | | | | 0.03 | |
Mylan NV | | Health Care | | | 881 | | | | 16,772 | | | | 0.03 | |
CSX Corp | | Industrials | | | 207 | | | | 16,049 | | | | 0.03 | |
Ingersoll-Rand PLC | | Industrials | | | 123 | | | | 15,639 | | | | 0.03 | |
Microchip Technology Inc | | Information Technology | | | 173 | | | | 14,995 | | | | 0.03 | |
State Street Corp | | Financials | | | 262 | | | | 14,715 | | | | 0.03 | |
Valero Energy Corp | | Energy | | | 171 | | | | 14,664 | | | | 0.03 | |
AmerisourceBergen Corp | | Health Care | | | 170 | | | | 14,509 | | | | 0.03 | |
Citizens Financial Group Inc | | Financials | | | 408 | | | | 14,433 | | | | 0.03 | |
Thermo Fisher Scientific Inc | | Health Care | | | 49 | | | | 14,372 | | | | 0.02 | |
Mettler-Toledo International Inc | | Health Care | | | 17 | | | | 14,014 | | | | 0.02 | |
TE Connectivity Ltd | | Information Technology | | | 146 | | | | 14,009 | | | | 0.02 | |
Molson Coors Brewing Co | | Consumer Staples | | | 250 | | | | 13,983 | | | | 0.02 | |
IQVIA Holdings Inc | | Health Care | | | 82 | | | | 13,243 | | | | 0.02 | |
Seagate Technology PLC | | Information Technology | | | 269 | | | | 12,683 | | | | 0.02 | |
Delta Air Lines Inc | | Industrials | | | 220 | | | | 12,466 | | | | 0.02 | |
AbbVie Inc | | Health Care | | | 170 | | | | 12,375 | | | | 0.02 | |
United Rentals Inc | | Industrials | | | 91 | | | | 12,023 | | | | 0.02 | |
Ford Motor Co | | Consumer Discretionary | | | 1,161 | | | | 11,879 | | | | 0.02 | |
Invesco Ltd | | Financials | | | 573 | | | | 11,719 | | | | 0.02 | |
Perrigo Co PLC | | Health Care | | | 246 | | | | 11,706 | | | | 0.02 | |
Amphenol Corp | | Information Technology | | | 118 | | | | 11,311 | | | | 0.02 | |
Caterpillar Inc | | Industrials | | | 81 | | | | 11,066 | | | | 0.02 | |
AO Smith Corp | | Industrials | | | 230 | | | | 10,832 | | | | 0.02 | |
DR Horton Inc | | Consumer Discretionary | | | 249 | | | | 10,722 | | | | 0.02 | |
HCA Healthcare Inc | | Health Care | | | 79 | | | | 10,675 | | | | 0.02 | |
NRG Energy Inc | | Utilities | | | 303 | | | | 10,645 | | | | 0.02 | |
Unum Group | | Financials | | | 315 | | | | 10,579 | | | | 0.02 | |
Regions Financial Corp | | Financials | | | 703 | | | | 10,502 | | | | 0.02 | |
DaVita Inc | | Health Care | | | 184 | | | | 10,356 | | | | 0.02 | |
Eaton Corp PLC | | Industrials | | | 119 | | | | 9,911 | | | | 0.02 | |
Fifth Third Bancorp | | Financials | | | 339 | | | | 9,449 | | | | 0.02 | |
Skyworks Solutions Inc | | Information Technology | | | 119 | | | | 9,196 | | | | 0.02 | |
BorgWarner Inc | | Consumer Discretionary | | | 219 | | | | 9,175 | | | | 0.02 | |
Nektar Therapeutics | | Health Care | | | 257 | | | | 9,161 | | | | 0.02 | |
Johnson Controls International plc | | Industrials | | | 220 | | | | 9,074 | | | | 0.02 | |
Edwards Lifesciences Corp | | Health Care | | | 47 | | | | 8,733 | | | | 0.02 | |
Snap-on Inc | | Industrials | | | 52 | | | | 8,567 | | | | 0.01 | |
Regeneron Pharmaceuticals Inc | | Health Care | | | 27 | | | | 8,529 | | | | 0.01 | |
KeyCorp | | Financials | | | 478 | | | | 8,489 | | | | 0.01 | |
FedEx Corp | | Industrials | | | 51 | | | | 8,400 | | | | 0.01 | |
Booking Holdings Inc | | Consumer Discretionary | | | 4 | | | | 8,340 | | | | 0.01 | |
Bank of New York Mellon Corp/The | | Financials | | | 178 | | | | 7,857 | | | | 0.01 | |
Fox Corp | | Communication Services | | | 209 | | | | 7,662 | | | | 0.01 | |
Fortune Brands Home & Security Inc | | Industrials | | | 132 | | | | 7,562 | | | | 0.01 | |
LKQ Corp | | Consumer Discretionary | | | 281 | | | | 7,473 | | | | 0.01 | |
Expedia Group Inc | | Consumer Discretionary | | | 55 | | | | 7,324 | | | | 0.01 | |
Nucor Corp | | Materials | | | 132 | | | | 7,262 | | | | 0.01 | |
Mohawk Industries Inc | | Consumer Discretionary | | | 49 | | | | 7,217 | | | | 0.01 | |
Fox Corp | | Communication Services | | | 192 | | | | 7,029 | | | | 0.01 | |
PVH Corp | | Consumer Discretionary | | | 72 | | | | 6,842 | | | | 0.01 | |
CBS Corp | | Communication Services | | | 132 | | | | 6,577 | | | | 0.01 | |
Eastman Chemical Co | | Materials | | | 83 | | | | 6,493 | | | | 0.01 | |
VF Corp | | Consumer Discretionary | | | 74 | | | | 6,461 | | | | 0.01 | |
eBay Inc | | Consumer Discretionary | | | 163 | | | | 6,458 | | | | 0.01 | |
| | |
| 60 | | The accompanying notes are an integral part of these financial statements. |
GOLDMAN SACHS ALTERNATIVE PREMIA FUND
|
| ADDITIONAL INVESTMENT INFORMATION (continued) |
OVER THE COUNTER TOTAL RETURN SWAP CONTRACTS (continued)
| | | | | | | | | | | | | | |
| Common Stocks | | Sector | | Shares | | | Value | | | Weight | |
International Paper Co | | Materials | | | 141 | | | $ | 6,119 | | | | 0.01 | % |
Fastenal Co | | Industrials | | | 186 | | | | 6,053 | | | | 0.01 | |
IHS Markit Ltd | | Industrials | | | 94 | | | | 5,989 | | | | 0.01 | |
DuPont de Nemours Inc | | Materials | | | 75 | | | | 5,608 | | | | 0.01 | |
Hologic Inc | | Health Care | | | 114 | | | | 5,474 | | | | 0.01 | |
CF Industries Holdings Inc | | Materials | | | 116 | | | | 5,429 | | | | 0.01 | |
Ralph Lauren Corp | | Consumer Discretionary | | | 45 | | | | 5,117 | | | | 0.01 | |
NetApp Inc | | Information Technology | | | 83 | | | | 5,113 | | | | 0.01 | |
Cintas Corp | | Industrials | | | 21 | | | | 5,014 | | | | 0.01 | |
Hanesbrands Inc | | Consumer Discretionary | | | 281 | | | | 4,846 | | | | 0.01 | |
Leggett & Platt Inc | | Consumer Discretionary | | | 124 | | | | 4,758 | | | | 0.01 | |
Centene Corp | | Health Care | | | 89 | | | | 4,666 | | | | 0.01 | |
Coty Inc | | Consumer Staples | | | 340 | | | | 4,561 | | | | 0.01 | |
Akamai Technologies Inc | | Information Technology | | | 55 | | | | 4,368 | | | | 0.01 | |
Kraft Heinz Co/The | | Consumer Staples | | | 141 | | | | 4,367 | | | | 0.01 | |
Norwegian Cruise Line Holdings Ltd | | Consumer Discretionary | | | 76 | | | | 4,086 | | | | 0.01 | |
Huntington Ingalls Industries Inc | | Industrials | | | 17 | | | | 3,750 | | | | 0.01 | |
Equifax Inc | | Industrials | | | 27 | | | | 3,685 | | | | 0.01 | |
Royal Caribbean Cruises Ltd | | Consumer Discretionary | | | 27 | | | | 3,236 | | | | 0.01 | |
Mosaic Co/The | | Materials | | | 122 | | | | 3,049 | | | | 0.01 | |
Expeditors International of Washington I | | Industrials | | | 39 | | | | 2,995 | | | | 0.01 | |
Aptiv PLC | | Consumer Discretionary | | | 37 | | | | 2,967 | | | | 0.01 | |
Raymond James Financial Inc | | Financials | | | 32 | | | | 2,680 | | | | 0.00 | |
Take-Two Interactive Software Inc | | Communication Services | | | 22 | | | | 2,525 | | | | 0.00 | |
Packaging Corp of America | | Materials | | | 25 | | | | 2,385 | | | | 0.00 | |
Gartner Inc | | Information Technology | | | 14 | | | | 2,327 | | | | 0.00 | |
Citrix Systems Inc | | Information Technology | | | 23 | | | | 2,237 | | | | 0.00 | |
Corteva Inc | | Materials | | | 75 | | | | 2,209 | | | | 0.00 | |
Whirlpool Corp | | Consumer Discretionary | | | 14 | | | | 1,979 | | | | 0.00 | |
Fluor Corp | | Industrials | | | 50 | | | | 1,686 | | | | 0.00 | |
Quanta Services Inc | | Industrials | | | 30 | | | | 1,147 | | | | 0.00 | |
A basket (JPGSFDEU) of common stocks
| | | | | | | | | | | | | | |
| Common Stocks | | Sector | | Shares | | | Value | | | Weight | |
SAP SE | | Information Technology | | | 13,314 | | | $ | 1,826,286 | | | | 3.78 | % |
L’Oreal SA | | Consumer Staples | | | 5,346 | | | | 1,521,059 | | | | 3.15 | |
TOTAL SA | | Energy | | | 23,263 | | | | 1,302,088 | | | | 2.70 | |
adidas AG | | Consumer Discretionary | | | 3,715 | | | | 1,145,749 | | | | 2.37 | |
Enel SpA | | Utilities | | | 162,337 | | | | 1,132,201 | | | | 2.34 | |
Allianz SE | | Financials | | | 4,436 | | | | 1,068,266 | | | | 2.21 | |
Bayer AG | | Health Care | | | 14,857 | | | | 1,028,460 | | | | 2.13 | |
Danone SA | | Consumer Staples | | | 11,386 | | | | 963,561 | | | | 1.99 | |
Deutsche Boerse AG | | Financials | | | 5,941 | | | | 839,545 | | | | 1.74 | |
Amadeus IT Group SA | | Information Technology | | | 9,868 | | | | 780,800 | | | | 1.62 | |
Airbus SE | | Industrials | | | 5,394 | | | | 763,941 | | | | 1.58 | |
Air Liquide SA | | Materials | | | 5,412 | | | | 756,408 | | | | 1.57 | |
Heineken NV | | Consumer Staples | | | 6,682 | | | | 744,907 | | | | 1.54 | |
Atos SE | | Information Technology | | | 8,088 | | | | 675,477 | | | | 1.40 | |
Peugeot SA | | Consumer Discretionary | | | 26,341 | | | | 648,378 | | | | 1.34 | |
KBC Group NV | | Financials | | | 9,591 | | | | 627,946 | | | | 1.30 | |
Beiersdorf AG | | Consumer Staples | | | 5,091 | | | | 610,435 | | | | 1.26 | |
Wolters Kluwer NV | | Industrials | | | 7,664 | | | | 557,343 | | | | 1.15 | |
Sampo Oyj | | Financials | | | 11,512 | | | | 542,675 | | | | 1.12 | |
FinecoBank Banca Fineco SpA | | Financials | | | 48,562 | | | | 541,141 | | | | 1.12 | |
Orange SA | | Communication Services | | | 31,080 | | | | 489,489 | | | | 1.01 | |
Eni SpA | | Energy | | | 29,243 | | | | 485,179 | | | | 1.00 | |
Terna Rete Elettrica Nazionale SpA | | Utilities | | | 76,132 | | | | 484,274 | | | | 1.00 | |
CRH PLC | | Materials | | | 14,820 | | | | 482,955 | | | | 1.00 | |
| | |
| The accompanying notes are an integral part of these financial statements. | | 61 |
GOLDMAN SACHS ALTERNATIVE PREMIA FUND
Consolidated Schedule of Investments(continued)
June 30, 2019 (Unaudited)
|
| ADDITIONAL INVESTMENT INFORMATION (continued) |
OVER THE COUNTER TOTAL RETURN SWAP CONTRACTS (continued)
| | | | | | | | | | | | | | |
| Common Stocks | | Sector | | Shares | | | Value | | | Weight | |
Neste Oyj | | Energy | | | 14,106 | | | $ | 478,127 | | | | 0.99 | % |
Sanofi | | Health Care | | | 5,269 | | | | 454,357 | | | | 0.94 | |
ING Groep NV | | Financials | | | 37,991 | | | | 439,993 | | | | 0.91 | |
Kering SA | | Consumer Discretionary | | | 728 | | | | 430,017 | | | | 0.89 | |
Covestro AG | | Materials | | | 8,276 | | | | 420,286 | | | | 0.87 | |
Iberdrola SA | | Utilities | | | 42,174 | | | | 419,943 | | | | 0.87 | |
HeidelbergCement AG | | Materials | | | 5,148 | | | | 416,102 | | | | 0.86 | |
Akzo Nobel NV | | Materials | | | 4,402 | | | | 413,255 | | | | 0.86 | |
Poste Italiane SpA | | Financials | | | 38,883 | | | | 408,983 | | | | 0.85 | |
Zalando SE | | Consumer Discretionary | | | 9,211 | | | | 408,257 | | | | 0.85 | |
Thales SA | | Industrials | | | 3,215 | | | | 396,741 | | | | 0.82 | |
Deutsche Post AG | | Industrials | | | 12,025 | | | | 394,766 | | | | 0.82 | |
Faurecia SA | | Consumer Discretionary | | | 8,453 | | | | 391,830 | | | | 0.81 | |
Assicurazioni Generali SpA | | Financials | | | 20,423 | | | | 384,168 | | | | 0.80 | |
Koninklijke Philips NV | | Health Care | | | 8,424 | | | | 365,404 | | | | 0.76 | |
Ferrari NV | | Consumer Discretionary | | | 2,235 | | | | 362,595 | | | | 0.75 | |
Continental AG | | Consumer Discretionary | | | 2,479 | | | | 361,113 | | | | 0.75 | |
Valeo SA | | Consumer Discretionary | | | 10,878 | | | | 353,404 | | | | 0.73 | |
UCB SA | | Health Care | | | 4,096 | | | | 339,231 | | | | 0.70 | |
Erste Group Bank AG | | Financials | | | 8,984 | | | | 333,092 | | | | 0.69 | |
Hannover Rueck SE | | Financials | | | 2,036 | | | | 328,824 | | | | 0.68 | |
Cie de Saint-Gobain | | Industrials | | | 8,353 | | | | 325,199 | | | | 0.67 | |
Endesa SA | | Utilities | | | 12,452 | | | | 319,813 | | | | 0.66 | |
Deutsche Telekom AG | | Communication Services | | | 18,374 | | | | 317,497 | | | | 0.66 | |
Arkema SA | | Materials | | | 3,330 | | | | 309,313 | | | | 0.64 | |
Suez | | Utilities | | | 20,431 | | | | 294,510 | | | | 0.61 | |
Prysmian SpA | | Industrials | | | 14,184 | | | | 292,419 | | | | 0.61 | |
Enagas SA | | Utilities | | | 10,604 | | | | 282,696 | | | | 0.59 | |
Pernod Ricard SA | | Consumer Staples | | | 1,477 | | | | 271,963 | | | | 0.56 | |
Koninklijke Ahold Delhaize NV | | Consumer Staples | | | 11,818 | | | | 265,490 | | | | 0.55 | |
Anheuser-Busch InBev SA/NV | | Consumer Staples | | | 2,802 | | | | 247,747 | | | | 0.51 | |
Symrise AG | | Materials | | | 2,537 | | | | 243,930 | | | | 0.50 | |
Knorr-Bremse AG | | Industrials | | | 2,175 | | | | 242,100 | | | | 0.50 | |
Munich Re | | Financials | | | 963 | | | | 241,445 | | | | 0.50 | |
Legrand SA | | Industrials | | | 3,218 | | | | 235,065 | | | | 0.49 | |
Siltronic AG | | Information Technology | | | 3,168 | | | | 231,136 | | | | 0.48 | |
Vonovia SE | | Real Estate | | | 4,771 | | | | 227,622 | | | | 0.47 | |
Ipsen SA | | Health Care | | | 1,606 | | | | 218,904 | | | | 0.45 | |
Deutsche Lufthansa AG | | Industrials | | | 12,623 | | | | 216,089 | | | | 0.45 | |
Smurfit Kappa Group PLC | | Materials | | | 7,050 | | | | 213,082 | | | | 0.44 | |
E.ON SE | | Utilities | | | 19,527 | | | | 211,848 | | | | 0.44 | |
Fiat Chrysler Automobiles NV | | Consumer Discretionary | | | 15,159 | | | | 211,206 | | | | 0.44 | |
Snam SpA | | Utilities | | | 42,242 | | | | 209,734 | | | | 0.43 | |
Accor SA | | Consumer Discretionary | | | 4,888 | | | | 209,583 | | | | 0.43 | |
Elisa OYJ | | Communication Services | | | 4,189 | | | | 204,172 | | | | 0.42 | |
Air France-KLM | | Industrials | | | 20,632 | | | | 198,075 | | | | 0.41 | |
Publicis Groupe SA | | Communication Services | | | 3,747 | | | | 197,595 | | | | 0.41 | |
Proximus SADP | | Communication Services | | | 6,670 | | | | 196,372 | | | | 0.41 | |
Kerry Group PLC | | Consumer Staples | | | 1,641 | | | | 195,675 | | | | 0.41 | |
Stora Enso OYJ | | Materials | | | 16,555 | | | | 194,342 | | | | 0.40 | |
Dassault Systemes SE | | Information Technology | | | 1,219 | | | | 194,216 | | | | 0.40 | |
EssilorLuxottica SA | | Consumer Discretionary | | | 1,475 | | | | 192,219 | | | | 0.40 | |
Hermes International | | Consumer Discretionary | | | 265 | | | | 191,098 | | | | 0.40 | |
Davide Campari-Milano SpA | | Consumer Staples | | | 19,348 | | | | 189,332 | | | | 0.39 | |
Brenntag AG | | Industrials | | | 3,779 | | | | 185,909 | | | | 0.38 | |
Merlin Properties Socimi SA | | Real Estate | | | 13,388 | | | | 185,528 | | | | 0.38 | |
Aalberts NV | | Industrials | | | 4,663 | | | | 183,090 | | | | 0.38 | |
Rheinmetall AG | | Industrials | | | 1,497 | | | | 183,039 | | | | 0.38 | |
Signify NV | | Industrials | | | 6,031 | | | | 178,129 | | | | 0.37 | |
| | |
| 62 | | The accompanying notes are an integral part of these financial statements. |
GOLDMAN SACHS ALTERNATIVE PREMIA FUND
|
| ADDITIONAL INVESTMENT INFORMATION (continued) |
OVER THE COUNTER TOTAL RETURN SWAP CONTRACTS (continued)
| | | | | | | | | | | | | | |
| Common Stocks | | Sector | | Shares | | | Value | | | Weight | |
Axel Springer SE | | Communication Services | | | 2,513 | | | $ | 176,815 | | | | 0.37 | % |
Valmet OYJ | | Industrials | | | 7,048 | | | | 175,480 | | | | 0.36 | |
HOCHTIEF AG | | Industrials | | | 1,428 | | | | 173,670 | | | | 0.36 | |
Ubisoft Entertainment SA | | Communication Services | | | 2,202 | | | | 172,159 | | | | 0.36 | |
Sodexo SA | | Consumer Discretionary | | | 1,466 | | | | 171,231 | | | | 0.35 | |
Koninklijke KPN NV | | Communication Services | | | 55,134 | | | | 169,091 | | | | 0.35 | |
Merck KGaA | | Health Care | | | 1,599 | | | | 167,078 | | | | 0.35 | |
Carl Zeiss Meditec AG | | Health Care | | | 1,695 | | | | 167,038 | | | | 0.35 | |
LEG Immobilien AG | | Real Estate | | | 1,468 | | | | 165,442 | | | | 0.34 | |
ASR Nederland NV | | Financials | | | 4,040 | | | | 164,088 | | | | 0.34 | |
Orion Oyj | | Health Care | | | 4,460 | | | | 163,286 | | | | 0.34 | |
Bankinter SA | | Financials | | | 22,687 | | | | 156,117 | | | | 0.32 | |
Deutsche Wohnen SE | | Real Estate | | | 4,245 | | | | 155,612 | | | | 0.32 | |
Gecina SA | | Real Estate | | | 1,028 | | | | 153,711 | | | | 0.32 | |
Evonik Industries AG | | Materials | | | 5,237 | | | | 152,360 | | | | 0.32 | |
Randstad NV | | Industrials | | | 2,765 | | | | 151,725 | | | | 0.31 | |
Italgas SpA | | Utilities | | | 22,460 | | | | 150,725 | | | | 0.31 | |
Scout24 AG | | Communication Services | | | 2,837 | | | | 150,563 | | | | 0.31 | |
Telefonica Deutschland Holding AG | | Communication Services | | | 53,677 | | | | 149,808 | | | | 0.31 | |
Eutelsat Communications SA | | Communication Services | | | 7,830 | | | | 146,221 | | | | 0.30 | |
Kingspan Group PLC | | Industrials | | | 2,689 | | | | 145,892 | | | | 0.30 | |
Aroundtown SA | | Real Estate | | | 17,330 | | | | 142,642 | | | | 0.30 | |
Aena SME SA | | Industrials | | | 718 | | | | 142,189 | | | | 0.29 | |
Telenet Group Holding NV | | Communication Services | | | 2,504 | | | | 139,390 | | | | 0.29 | |
Orpea | | Health Care | | | 1,136 | | | | 136,959 | | | | 0.28 | |
Teleperformance | | Industrials | | | 683 | | | | 136,617 | | | | 0.28 | |
TAG Immobilien AG | | Real Estate | | | 5,860 | | | | 135,268 | | | | 0.28 | |
Takeaway.com NV | | Consumer Discretionary | | | 1,427 | | | | 133,531 | | | | 0.28 | |
Colruyt SA | | Consumer Staples | | | 2,271 | | | | 131,533 | | | | 0.27 | |
Solvay SA | | Materials | | | 1,261 | | | | 130,509 | | | | 0.27 | |
ANDRITZ AG | | Industrials | | | 3,418 | | | | 128,494 | | | | 0.27 | |
Kesko OYJ | | Consumer Staples | | | 2,287 | | | | 127,067 | | | | 0.26 | |
Naturgy Energy Group SA | | Utilities | | | 4,562 | | | | 125,567 | | | | 0.26 | |
Aeroports de Paris | | Industrials | | | 702 | | | | 123,838 | | | | 0.26 | |
DiaSorin SpA | | Health Care | | | 1,035 | | | | 120,058 | | | | 0.25 | |
Societe BIC SA | | Industrials | | | 1,575 | | | | 119,919 | | | | 0.25 | |
Covivio | | Real Estate | | | 1,137 | | | | 118,919 | | | | 0.25 | |
Fraport AG Frankfurt Airport Services Wo | | Industrials | | | 1,371 | | | | 117,709 | | | | 0.24 | |
Puma SE | | Consumer Discretionary | | | 1,738 | | | | 115,764 | | | | 0.24 | |
Hera SpA | | Utilities | | | 29,918 | | | | 114,324 | | | | 0.24 | |
voestalpine AG | | Materials | | | 3,672 | | | | 113,319 | | | | 0.23 | |
Ryanair Holdings PLC | | Industrials | | | 9,738 | | | | 111,890 | | | | 0.23 | |
Industria de Diseno Textil SA | | Consumer Discretionary | | | 3,659 | | | | 109,941 | | | | 0.23 | |
BioMerieux | | Health Care | | | 1,283 | | | | 106,161 | | | | 0.22 | |
SEB SA | | Consumer Discretionary | | | 589 | | | | 105,735 | | | | 0.22 | |
A2A SpA | | Utilities | | | 60,060 | | | | 104,107 | | | | 0.22 | |
Verbund AG | | Utilities | | | 1,919 | | | | 100,285 | | | | 0.21 | |
Fresenius Medical Care AG & Co KGaA | | Health Care | | | 1,276 | | | | 100,029 | | | | 0.21 | |
Hella GmbH & Co KGaA | | Consumer Discretionary | | | 2,002 | | | | 98,854 | | | | 0.20 | |
Jeronimo Martins SGPS SA | | Consumer Staples | | | 6,083 | | | | 97,879 | | | | 0.20 | |
RTL Group SA | | Communication Services | | | 1,909 | | | | 97,649 | | | | 0.20 | |
EDP – Energias de Portugal SA | | Utilities | | | 25,586 | | | | 97,131 | | | | 0.20 | |
Sartorius Stedim Biotech | | Health Care | | | 615 | | | | 96,911 | | | | 0.20 | |
Bureau Veritas SA | | Industrials | | | 3,769 | | | | 92,982 | | | | 0.19 | |
Klepierre SA | | Real Estate | | | 2,747 | | | | 92,002 | | | | 0.19 | |
Alstom SA | | Industrials | | | 1,968 | | | | 91,219 | | | | 0.19 | |
LVMH Moet Hennessy Louis Vuitton SE | | Consumer Discretionary | | | 208 | | | | 88,420 | | | | 0.18 | |
Getlink SE | | Industrials | | | 5,386 | | | | 86,199 | | | | 0.18 | |
Bechtle AG | | Information Technology | | | 722 | | | | 82,817 | | | | 0.17 | |
| | |
| The accompanying notes are an integral part of these financial statements. | | 63 |
GOLDMAN SACHS ALTERNATIVE PREMIA FUND
Consolidated Schedule of Investments(continued)
June 30, 2019 (Unaudited)
|
| ADDITIONAL INVESTMENT INFORMATION (continued) |
OVER THE COUNTER TOTAL RETURN SWAP CONTRACTS (continued)
| | | | | | | | | | | | | | |
| Common Stocks | | Sector | | Shares | | | Value | | | Weight | |
QIAGEN NV | | Health Care | | | 1,988 | | | $ | 80,600 | | | | 0.17 | % |
Ageas | | Financials | | | 1,479 | | | | 76,785 | | | | 0.16 | |
Euronext NV | | Financials | | | 1,007 | | | | 76,124 | | | | 0.16 | |
Elis SA | | Industrials | | | 4,154 | | | | 75,264 | | | | 0.16 | |
Gerresheimer AG | | Health Care | | | 1,013 | | | | 74,507 | | | | 0.15 | |
Fortum OYJ | | Utilities | | | 3,348 | | | | 73,917 | | | | 0.15 | |
Inmobiliaria Colonial Socimi SA | | Real Estate | | | 6,611 | | | | 73,560 | | | | 0.15 | |
Siemens Gamesa Renewable Energy SA | | Industrials | | | 4,289 | | | | 71,222 | | | | 0.15 | |
ProSiebenSat.1 Media SE | | Communication Services | | | 4,394 | | | | 68,954 | | | | 0.14 | |
ICADE | | Real Estate | | | 749 | | | | 68,586 | | | | 0.14 | |
Safran SA | | Industrials | | | 452 | | | | 66,152 | | | | 0.14 | |
Warehouses De Pauw CVA | | Real Estate | | | 384 | | | | 64,562 | | | | 0.13 | |
Alten SA | | Information Technology | | | 523 | | | | 62,633 | | | | 0.13 | |
Glanbia PLC | | Consumer Staples | | | 3,852 | | | | 62,569 | | | | 0.13 | |
Boskalis Westminster | | Industrials | | | 2,702 | | | | 62,339 | | | | 0.13 | |
Veolia Environnement SA | | Utilities | | | 2,549 | | | | 62,013 | | | | 0.13 | |
Dassault Aviation SA | | Industrials | | | 43 | | | | 61,709 | | | | 0.13 | |
Atlantia SpA | | Industrials | | | 2,364 | | | | 61,516 | | | | 0.13 | |
Rubis SCA | | Utilities | | | 1,063 | | | | 59,790 | | | | 0.12 | |
METRO AG | | Consumer Staples | | | 3,263 | | | | 59,576 | | | | 0.12 | |
Lagardere SCA | | Communication Services | | | 2,283 | | | | 59,385 | | | | 0.12 | |
Cofinimmo SA | | Real Estate | | | 455 | | | | 59,050 | | | | 0.12 | |
SPIE SA | | Industrials | | | 3,117 | | | | 57,812 | | | | 0.12 | |
KION Group AG | | Industrials | | | 916 | | | | 57,682 | | | | 0.12 | |
Viscofan SA | | Consumer Staples | | | 1,079 | | | | 56,434 | | | | 0.12 | |
Edenred | | Industrials | | | 1,107 | | | | 56,400 | | | | 0.12 | |
Credit Agricole SA | | Financials | | | 4,595 | | | | 55,041 | | | | 0.11 | |
IMCD NV | | Industrials | | | 597 | | | | 54,666 | | | | 0.11 | |
UniCredit SpA | | Financials | | | 4,440 | | | | 54,598 | | | | 0.11 | |
Innogy SE | | Utilities | | | 1,122 | | | | 53,128 | | | | 0.11 | |
GRENKE AG | | Financials | | | 494 | | | | 52,925 | | | | 0.11 | |
Wienerberger AG | | Materials | | | 2,124 | | | | 52,366 | | | | 0.11 | |
Banco Bilbao Vizcaya Argentaria SA | | Financials | | | 9,364 | | | | 52,300 | | | | 0.11 | |
BNP Paribas SA | | Financials | | | 1,062 | | | | 50,383 | | | | 0.10 | |
MTU Aero Engines AG | | Industrials | | | 211 | | | | 50,149 | | | | 0.10 | |
Remy Cointreau SA | | Consumer Staples | | | 344 | | | | 49,523 | | | | 0.10 | |
Ferrovial SA | | Industrials | | | 1,887 | | | | 48,259 | | | | 0.10 | |
Ingenico Group SA | | Information Technology | | | 542 | | | | 47,894 | | | | 0.10 | |
Evotec SE | | Health Care | | | 1,684 | | | | 47,020 | | | | 0.10 | |
Ackermans & van Haaren NV | | Financials | | | 308 | | | | 46,183 | | | | 0.10 | |
Groupe Bruxelles Lambert SA | | Financials | | | 465 | | | | 45,565 | | | | 0.09 | |
Unione di Banche Italiane SpA | | Financials | | | 16,649 | | | | 45,390 | | | | 0.09 | |
Flutter Entertainment PLC | | Consumer Discretionary | | | 586 | | | | 44,025 | | | | 0.09 | |
ACS Actividades de Construccion y Servic | | Industrials | | | 1,072 | | | | 42,760 | | | | 0.09 | |
Koninklijke DSM NV | | Materials | | | 344 | | | | 42,454 | | | | 0.09 | |
Nemetschek SE | | Information Technology | | | 700 | | | | 42,111 | | | | 0.09 | |
SCOR SE | | Financials | | | 912 | | | | 39,958 | | | | 0.08 | |
Banco Santander SA | | Financials | | | 8,553 | | | | 39,643 | | | | 0.08 | |
RWE AG | | Utilities | | | 1,544 | | | | 37,995 | | | | 0.08 | |
Fresenius SE & Co KGaA | | Health Care | | | 667 | | | | 36,118 | | | | 0.07 | |
Telefonica SA | | Communication Services | | | 4,364 | | | | 35,795 | | | | 0.07 | |
Grifols SA | | Health Care | | | 1,099 | | | | 32,470 | | | | 0.07 | |
Kone OYJ | | Industrials | | | 527 | | | | 31,059 | | | | 0.06 | |
Raiffeisen Bank International AG | | Financials | | | 1,294 | | | | 30,334 | | | | 0.06 | |
Sofina SA | | Financials | | | 159 | | | | 30,266 | | | | 0.06 | |
Cellnex Telecom SA | | Communication Services | | | 814 | | | | 30,098 | | | | 0.06 | |
Vinci SA | | Industrials | | | 294 | | | | 30,068 | | | | 0.06 | |
Michelin | | Consumer Discretionary | | | 214 | | | | 27,112 | | | | 0.06 | |
Carrefour SA | | Consumer Staples | | | 1,334 | | | | 25,725 | | | | 0.05 | |
| | |
| 64 | | The accompanying notes are an integral part of these financial statements. |
GOLDMAN SACHS ALTERNATIVE PREMIA FUND
|
| ADDITIONAL INVESTMENT INFORMATION (continued) |
OVER THE COUNTER TOTAL RETURN SWAP CONTRACTS (continued)
| | | | | | | | | | | | | | |
| Common Stocks | | Sector | | Shares | | | Value | | | Weight | |
Telecom Italia SpA/Milano | | Communication Services | | | 46,524 | | | $ | 25,379 | | | | 0.05 | % |
Repsol SA | | Energy | | | 1,597 | | | | 25,002 | | | | 0.05 | |
Schneider Electric SE | | Industrials | | | 268 | | | | 24,284 | | | | 0.05 | |
ArcelorMittal | | Materials | | | 1,357 | | | | 24,261 | | | | 0.05 | |
Capgemini SE | | Information Technology | | | 190 | | | | 23,650 | | | | 0.05 | |
CNP Assurances | | Financials | | | 955 | | | | 21,647 | | | | 0.04 | |
Saipem SpA | | Energy | | | 4,338 | | | | 21,557 | | | | 0.04 | |
Bollore SA | | Industrials | | | 4,575 | | | | 20,162 | | | | 0.04 | |
EXOR NV | | Financials | | | 287 | | | | 20,081 | | | | 0.04 | |
Eiffage SA | | Industrials | | | 198 | | | | 19,579 | | | | 0.04 | |
STMicroelectronics NV | | Information Technology | | | 1,049 | | | | 18,581 | | | | 0.04 | |
CNH Industrial NV | | Industrials | | | 1,764 | | | | 18,065 | | | | 0.04 | |
Sopra Steria Group | | Information Technology | | | 142 | | | | 16,573 | | | | 0.03 | |
NN Group NV | | Financials | | | 409 | | | | 16,428 | | | | 0.03 | |
UPM-Kymmene OYJ | | Materials | | | 598 | | | | 15,875 | | | | 0.03 | |
Imerys SA | | Materials | | | 284 | | | | 15,051 | | | | 0.03 | |
SBM Offshore NV | | Energy | | | 760 | | | | 14,654 | | | | 0.03 | |
Altran Technologies SA | | Information Technology | | | 875 | | | | 13,875 | | | | 0.03 | |
Bayerische Motoren Werke AG | | Consumer Discretionary | | | 180 | | | | 13,292 | | | | 0.03 | |
Nokia OYJ | | Information Technology | | | 2,642 | | | | 13,103 | | | | 0.03 | |
Iliad SA | | Communication Services | | | 96 | | | | 10,732 | | | | 0.02 | |
Casino Guichard Perrachon SA | | Consumer Staples | | | 302 | | | | 10,284 | | | | 0.02 | |
Renault SA | | Consumer Discretionary | | | 164 | | | | 10,274 | | | | 0.02 | |
Interpump Group SpA | | Industrials | | | 314 | | | | 9,659 | | | | 0.02 | |
ASM International NV | | Information Technology | | | 147 | | | | 9,559 | | | | 0.02 | |
1&1 Drillisch AG | | Communication Services | | | 283 | | | | 9,435 | | | | 0.02 | |
Worldline SA/France | | Information Technology | | | 117 | | | | 8,500 | | | | 0.02 | |
Rexel SA | | Industrials | | | 590 | | | | 7,479 | | | | 0.02 | |
Pirelli & C SpA | | Consumer Discretionary | | | 1,069 | | | | 6,311 | | | | 0.01 | |
Metso OYJ | | Industrials | | | 157 | | | | 6,149 | | | | 0.01 | |
Siemens Healthineers AG | | Health Care | | | 110 | | | | 4,637 | | | | 0.01 | |
Aurubis AG | | Materials | | | 45 | | | | 2,203 | | | | 0.00 | |
PURCHASED & WRITTEN OPTIONS CONTRACTS — At June 30, 2019, the Fund had the following purchased and written options contracts:
| | | | | | | | | | | | | | | | | | | | | | | | | | | | | | |
| Description | | Counterparty | | Exercise
Price | | | Expiration
Date | | | Number of
Contracts | | | Notional
Amount | | | Value | | | Premiums
Paid (Received)
by the Fund | | | Unrealized
Appreciation/
Depreciation | |
Purchased options contracts: | | | | | | | | | | | | | | | | | | | | | | | | | |
Calls | | | | | | | | | | | | | | | | | | | | | | | | | | | | | | |
CBOE Volatility Index | | Morgan Stanely Co., Inc. | | | 18 USD | | | | 07/17/2019 | | | | 560 | | | $ | 844,480 | | | $ | 37,800 | | | $ | 80,214 | | | $ | (42,414 | ) |
CBOE Volatility Index | | | | | 19 USD | | | | 08/21/2019 | | | | 540 | | | | 814,320 | | | | 64,800 | | | | 86,220 | | | | (21,420 | ) |
CBOE Volatility Index | | | | | 19 USD | | | | 09/18/2019 | | | | 530 | | | | 799,240 | | | | 80,825 | | | | 88,090 | | | | (7,265 | ) |
| | | | | | | | |
| Total calls | | | | | | | | | | | | | 1,630 | | | | | | | $ | 183,425 | | | $ | 254,524 | | | $ | (71,099 | ) |
Puts | | | | | | | | | | | | | | | | | | | | | | | | | | | | | | |
S&P 500 Index | | Morgan Stanely Co., Inc. | | | 2,350 USD | | | | 07/19/2019 | | | | 12 | | | $ | 3,530,112 | | | $ | 420 | | | $ | 7,007 | | | $ | (6,587 | ) |
S&P 500 Index | | | | | 2,450 USD | | | | 07/19/2019 | | | | 6 | | | | 1,765,056 | | | | 360 | | | | 3,889 | | | | (3,529 | ) |
S&P 500 Index | | | | | 2,475 USD | | | | 07/19/2019 | | | | 7 | | | | 2,059,232 | | | | 490 | | | | 4,077 | | | | (3,587 | ) |
S&P 500 Index | | | | | 2,500 USD | | | | 07/19/2019 | | | | 5 | | | | 1,470,880 | | | | 400 | | | | 2,970 | | | | (2,570 | ) |
S&P 500 Index | | | | | 2,250 USD | | | | 08/16/2019 | | | | 5 | | | | 1,470,880 | | | | 563 | | | | 2,836 | | | | (2,273 | ) |
S&P 500 Index | | | | | 2,300 USD | | | | 08/16/2019 | | | | 8 | | | | 2,353,408 | | | | 1,100 | | | | 4,717 | | | | (3,617 | ) |
S&P 500 Index | | | | | 2,350 USD | | | | 08/16/2019 | | | | 5 | | | | 1,470,880 | | | | 863 | | | | 4,292 | | | | (3,429 | ) |
S&P 500 Index | | | | | 2,375 USD | | | | 08/16/2019 | | | | 3 | | | | 882,528 | | | | 578 | | | | 1,982 | | | | (1,404 | ) |
S&P 500 Index | | | | | 2,400 USD | | | | 08/16/2019 | | | | 10 | | | | 2,941,760 | | | | 2,150 | | | | 7,043 | | | | (4,893 | ) |
S&P 500 Index | | | | | 2,450 USD | | | | 08/16/2019 | | | | 2 | | | | 588,352 | | | | 550 | | | | 1,302 | | | | (752 | ) |
S&P 500 Index | | | | | 2,525 USD | | | | 08/16/2019 | | | | 1 | | | | 294,176 | | | | 355 | | | | 451 | | | | (96 | ) |
| | |
| The accompanying notes are an integral part of these financial statements. | | 65 |
GOLDMAN SACHS ALTERNATIVE PREMIA FUND
Consolidated Schedule of Investments(continued)
June 30, 2019 (Unaudited)
|
| ADDITIONAL INVESTMENT INFORMATION (continued) |
PURCHASED & WRITTEN OPTIONS CONTRACTS (continued)
| | | | | | | | | | | | | | | | | | | | | | | | | | | | | | |
| Description | | Counterparty | | Exercise
Price | | | Expiration
Date | | | Number of
Contracts | | | Notional
Amount | | | Value | | | Premiums
Paid (Received)
by the Fund | | | Unrealized
Appreciation/
Depreciation | |
Purchased options contracts: (continued) | | | | | | | | | | | | | | | | | | | | | | | | | |
Puts (continued) | | | | | | | | | | | | | | | | | | | | | | | | | | | | | | |
S&P 500 Index | | | | | 2,250 USD | | | | 09/20/2019 | | | | 5 | | | $ | 1,470,880 | | | $ | 1,500 | | | $ | 4,484 | | | $ | (2,984 | ) |
S&P 500 Index | | | | | 2,300 USD | | | | 09/20/2019 | | | | 1 | | | | 294,176 | | | | 370 | | | | 941 | | | | (571 | ) |
S&P 500 Index | | | | | 2,350 USD | | | | 09/20/2019 | | | | 5 | | | | 1,470,880 | | | | 2,300 | | | | 4,071 | | | | (1,771 | ) |
S&P 500 Index | | | | | 2,400 USD | | | | 09/20/2019 | | | | 13 | | | | 3,824,288 | | | | 7,474 | | | | 9,425 | | | | (1,951 | ) |
S&P 500 Index | | | | | 2,350 USD | | | | 10/18/2019 | | | | 1 | | | | 294,176 | | | | 764 | | | | 921 | | | | (157 | ) |
S&P 500 Index | | | | | 2,300 USD | | | | 07/19/2019 | | | | 3 | | | | 882,528 | | | | 83 | | | | 1,338 | | | | (1,255 | ) |
| | | | | | | | |
| Total puts | | | | | | | | | | | | | 92 | | | | | | | $ | 20,320 | | | $ | 61,746 | | | $ | (41,426 | ) |
| | | | | | |
| Total purchased options contracts | | | | | | | | 1,722 | | | | | | | $ | 203,745 | | | $ | 316,270 | | | $ | (112,525 | ) |
Written options contracts: | | | | | | | | | | | | | | | | | | | | | | | | | |
Calls | | | | | | | | | | | | | | | | | | | | | | | | | | | | | | |
S&P 500 Index | | Morgan Stanely Co., Inc. | | | 2,925 USD | | | | 07/19/2019 | | | | 8 | | | $ | (2,353,408 | ) | | $ | (37,400 | ) | | $ | (45,743 | ) | | $ | 8,343 | |
S&P 500 Index | | | | | 2,950 USD | | | | 07/19/2019 | | | | 9 | | | | (2,647,584 | ) | | | (28,395 | ) | | | (38,024 | ) | | | 9,629 | |
S&P 500 Index | | | | | 2,975 USD | | | | 07/19/2019 | | | | 7 | | | | (2,059,232 | ) | | | (13,685 | ) | | | (24,057 | ) | | | 10,372 | |
S&P 500 Index | | | | | 3,000 USD | | | | 07/19/2019 | | | | 5 | | | | (1,470,880 | ) | | | (5,525 | ) | | | (16,061 | ) | | | 10,536 | |
S&P 500 Index | | | | | 2,850 USD | | | | 08/16/2019 | | | | 8 | | | | (2,353,408 | ) | | | (98,160 | ) | | | (46,159 | ) | | | (52,001 | ) |
S&P 500 Index | | | | | 2,900 USD | | | | 08/16/2019 | | | | 8 | | | | (2,353,408 | ) | | | (67,920 | ) | | | (50,006 | ) | | | (17,914 | ) |
S&P 500 Index | | | | | 2,925 USD | | | | 08/16/2019 | | | | 8 | | | | (2,353,408 | ) | | | (54,280 | ) | | | (36,686 | ) | | | (17,594 | ) |
S&P 500 Index | | | | | 2,950 USD | | | | 08/16/2019 | | | | 6 | | | | (1,765,056 | ) | | | (31,410 | ) | | | (30,308 | ) | | | (1,102 | ) |
S&P 500 Index | | | | | 3,000 USD | | | | 08/16/2019 | | | | 4 | | | | (1,176,704 | ) | | | (10,960 | ) | | | (20,137 | ) | | | 9,177 | |
S&P 500 Index | | | | | 2,875 USD | | | | 09/20/2019 | | | | 5 | | | | (1,470,880 | ) | | | (61,675 | ) | | | (27,871 | ) | | | (33,804 | ) |
S&P 500 Index | | | | | 2,925 USD | | | | 09/20/2019 | | | | 1 | | | | (294,176 | ) | | | (8,860 | ) | | | (5,659 | ) | | | (3,201 | ) |
S&P 500 Index | | | | | 2,950 USD | | | | 09/20/2019 | | | | 5 | | | | (1,470,880 | ) | | | (36,450 | ) | | | (27,126 | ) | | | (9,324 | ) |
S&P 500 Index | | | | | 2,975 USD | | | | 09/20/2019 | | | | 13 | | | | (3,824,288 | ) | | | (76,050 | ) | | | (70,684 | ) | | | (5,366 | ) |
S&P 500 Index | | | | | 2,975 USD | | | | 10/18/2019 | | | | 1 | | | | (294,176 | ) | | | (7,245 | ) | | | (6,799 | ) | | | (446 | ) |
S&P 500 Index | | | | | 2,875 USD | | | | 07/19/2019 | | | | 3 | | | | (882,528 | ) | | | (25,260 | ) | | | (21,888 | ) | | | (3,372 | ) |
S&P 500 Index | | | | | 2,900 USD | | | | 07/19/2019 | | | | 1 | | | | (294,176 | ) | | | (6,460 | ) | | | (5,094 | ) | | | (1,366 | ) |
| | | | | | | | |
| Total calls | | | | | | | | | | | | | 92 | | | | | | | $ | (569,735 | ) | | $ | (472,302 | ) | | $ | (97,433 | ) |
Puts | | | | | | | | | | | | | | | | | | | | | | | | | | | | | | |
S&P 500 Index | | Morgan Stanely Co., Inc. | | | 2,825 USD | | | | 07/19/2019 | | | | 4 | | | $ | (1,176,704 | ) | | $ | (4,160 | ) | | $ | (18,752 | ) | | $ | 14,592 | |
S&P 500 Index | | | | | 2,850 USD | | | | 07/19/2019 | | | | 8 | | | | (2,353,408 | ) | | | (10,720 | ) | | | (42,577 | ) | | | 31,857 | |
S&P 500 Index | | | | | 2,875 USD | | | | 07/19/2019 | | | | 6 | | | | (1,765,056 | ) | | | (10,440 | ) | | | (30,688 | ) | | | 20,248 | |
S&P 500 Index | | | | | 2,900 USD | | | | 07/19/2019 | | | | 7 | | | | (2,059,232 | ) | | | (15,925 | ) | | | (35,331 | ) | | | 19,406 | |
S&P 500 Index | | | | | 2,925 USD | | | | 07/19/2019 | | | | 5 | | | | (1,470,880 | ) | | | (14,950 | ) | | | (24,288 | ) | | | 9,338 | |
S&P 500 Index | | | | | 2,750 USD | | | | 08/16/2019 | | | | 8 | | | | (2,353,408 | ) | | | (12,720 | ) | | | (49,008 | ) | | | 36,288 | |
S&P 500 Index | | | | | 2,800 USD | | | | 08/16/2019 | | | | 8 | | | | (2,353,408 | ) | | | (17,520 | ) | | | (47,204 | ) | | | 29,684 | |
S&P 500 Index | | | | | 2,825 USD | | | | 08/16/2019 | | | | 11 | | | | (3,235,936 | ) | | | (28,380 | ) | | | (66,615 | ) | | | 38,235 | |
S&P 500 Index | | | | | 2,850 USD | | | | 08/16/2019 | | | | 2 | | | | (588,352 | ) | | | (6,080 | ) | | | (11,589 | ) | | | 5,509 | |
S&P 500 Index | | Morgan Stanely Co., Inc. | | | 2,875 USD | | | | 08/16/2019 | | | | 1 | | | | (294,176 | ) | | | (3,585 | ) | | | (3,849 | ) | | | 264 | |
S&P 500 Index | | | | | 2,900 USD | | | | 08/16/2019 | | | | 4 | | | | (1,176,704 | ) | | | (17,000 | ) | | | (24,381 | ) | | | 7,381 | |
S&P 500 Index | | | | | 2,750 USD | | | | 09/20/2019 | | | | 5 | | | | (1,470,880 | ) | | | (14,975 | ) | | | (39,601 | ) | | | 24,626 | |
S&P 500 Index | | | | | 2,825 USD | | | | 09/20/2019 | | | | 1 | | | | (294,176 | ) | | | (4,285 | ) | | | (7,739 | ) | | | 3,454 | |
S&P 500 Index | | | | | 2,850 USD | | | | 09/20/2019 | | | | 5 | | | | (1,470,880 | ) | | | (24,175 | ) | | | (35,949 | ) | | | 11,774 | |
S&P 500 Index | | | | | 2,875 USD | | | | 09/20/2019 | | | | 13 | | | | (3,824,288 | ) | | | (70,850 | ) | | | (82,855 | ) | | | 12,005 | |
S&P 500 Index | | | | | 2,875 USD | | | | 10/18/2019 | | | | 1 | | | | (294,176 | ) | | | (6,730 | ) | | | (7,719 | ) | | | 989 | |
S&P 500 Index | | | | | 2,775 USD | | | | 07/19/2019 | | | | 2 | | | | (588,352 | ) | | | (1,290 | ) | | | (15,439 | ) | | | 14,149 | |
S&P 500 Index | | | | | 2,800 USD | | | | 07/19/2019 | | | | 2 | | | | (588,352 | ) | | | (1,630 | ) | | | (7,969 | ) | | | 6,339 | |
| | | | | | | | |
| Total puts | | | | | | | | | | | | | 93 | | | | | | | $ | (265,415 | ) | | $ | (551,553 | ) | | $ | 286,138 | |
| | | | | | |
| Total written options contracts | | | | | | | | 185 | | | | | | | $ | (835,150 | ) | | $ | (1,023,855 | ) | | $ | 188,705 | |
| | |
| 66 | | The accompanying notes are an integral part of these financial statements. |
GOLDMAN SACHS COMMODITY STRATEGY FUND
Consolidated Schedule of Investments
June 30, 2019 (Unaudited)
| | | | | | | | | | | | | | |
Principal
Amount | | | Interest
Rate | | | Maturity
Date | | | Value | |
|
| Mortgage-Backed Securities – 2.6% | |
| FHLMC – 1.4% | |
| $ | 829 | | | | 5.500 | % | | | 01/01/2020 | | | $ | 829 | |
| | 35,359 | | | | 5.000 | | | | 11/01/2025 | | | | 37,392 | |
| | 70,483 | | | | 5.000 | | | | 08/01/2028 | | | | 74,969 | |
| | 11,115 | | | | 5.000 | | | | 01/01/2033 | | | | 11,945 | |
| | 1,176 | | | | 5.000 | | | | 03/01/2033 | | | | 1,273 | |
| | 6,252 | | | | 5.000 | | | | 04/01/2033 | | | | 6,764 | |
| | 927 | | | | 5.000 | | | | 05/01/2033 | | | | 1,003 | |
| | 3,127 | | | | 5.000 | | | | 06/01/2033 | | | | 3,383 | |
| | 20,611 | | | | 5.000 | | | | 07/01/2033 | | | | 22,299 | |
| | 28,703 | | | | 5.000 | | | | 08/01/2033 | | | | 31,066 | |
| | 2,594 | | | | 5.000 | | | | 09/01/2033 | | | | 2,807 | |
| | 6,065 | | | | 5.000 | | | | 10/01/2033 | | | | 6,562 | |
| | 12,485 | | | | 5.000 | | | | 11/01/2033 | | | | 13,508 | |
| | 7,291 | | | | 5.000 | | | | 12/01/2033 | | | | 7,888 | |
| | 6,672 | | | | 5.000 | | | | 01/01/2034 | | | | 7,219 | |
| | 21,655 | | | | 5.000 | | | | 02/01/2034 | | | | 23,430 | |
| | 9,139 | | | | 5.000 | | | | 03/01/2034 | | | | 9,889 | |
| | 15,147 | | | | 5.000 | | | | 04/01/2034 | | | | 16,391 | |
| | 22,842 | | | | 5.000 | | | | 05/01/2034 | | | | 24,714 | |
| | 304,214 | | | | 5.000 | | | | 06/01/2034 | | | | 329,145 | |
| | 4,287 | | | | 5.000 | | | | 11/01/2034 | | | | 4,639 | |
| | 84,552 | | | | 5.000 | | | | 04/01/2035 | | | | 91,480 | |
| | 1,459,811 | | | | 5.000 | | | | 07/01/2035 | | | | 1,579,626 | |
| | 4,077 | | | | 5.000 | | | | 11/01/2035 | | | | 4,411 | |
| | 67,976 | | | | 5.000 | | | | 03/01/2036 | | | | 74,349 | |
| | 25,778 | | | | 5.000 | | | | 03/01/2037 | | | | 27,817 | |
| | 72,334 | | | | 5.000 | | | | 12/01/2037 | | | | 78,056 | |
| | 124,669 | | | | 5.000 | | | | 02/01/2038 | | | | 134,528 | |
| | 313,405 | | | | 5.000 | | | | 03/01/2038 | | | | 338,107 | |
| | 157,661 | | | | 5.000 | | | | 07/01/2038 | | | | 170,088 | |
| | 138,703 | | | | 5.000 | | | | 11/01/2038 | | | | 149,635 | |
| | 347,484 | | | | 5.000 | | | | 12/01/2038 | | | | 374,971 | |
| | 194,836 | | | | 5.000 | | | | 01/01/2039 | | | | 210,193 | |
| | 46,235 | | | | 5.000 | | | | 02/01/2039 | | | | 49,880 | |
| | 315,987 | | | | 5.000 | (b) | | | 06/01/2041 | | | | 340,983 | |
| | | | | | | | | | | | | | |
| | | | | | | | | | | | | 4,261,239 | |
| | |
| UMBS – 1.2% | |
| | 463 | | | | 5.500 | | | | 07/01/2019 | | | | 463 | |
| | 933 | | | | 5.500 | | | | 08/01/2019 | | | | 932 | |
| | 1,845 | | | | 5.500 | | | | 09/01/2019 | | | | 1,845 | |
| | 594 | | | | 5.500 | | | | 10/01/2019 | | | | 594 | |
| | 1,597 | | | | 5.500 | | | | 11/01/2019 | | | | 1,599 | |
| | 2,984 | | | | 5.500 | | | | 12/01/2019 | | | | 2,989 | |
| | 173 | | | | 5.500 | | | | 01/01/2020 | | | | 174 | |
| | 12 | | | | 5.500 | | | | 06/01/2020 | | | | 12 | |
| | 20,656 | | | | 5.500 | | | | 07/01/2020 | | | | 20,692 | |
| | 4,859 | | | | 6.000 | | | | 03/01/2034 | | | | 5,491 | |
| | 17,908 | | | | 6.000 | | | | 08/01/2034 | | | | 20,299 | |
| | 67,357 | | | | 6.000 | | | | 08/01/2035 | | | | 76,982 | |
| | 107,639 | | | | 6.000 | | | | 09/01/2035 | | | | 123,305 | |
| | 25,652 | | | | 6.000 | | | | 10/01/2035 | | | | 29,372 | |
| | 191,199 | | | | 6.000 | | | | 11/01/2035 | | | | 218,957 | |
| | 469,403 | | | | 6.000 | | | | 03/01/2036 | | | | 536,447 | |
| | 4,001 | | | | 6.000 | | | | 06/01/2036 | | | | 4,573 | |
| | 898,810 | | | | 6.000 | | | | 09/01/2036 | | | | 1,000,576 | |
| | |
|
| Mortgage-Backed Securities – (continued) | |
| UMBS – (continued) | |
| 148,815 | | | | 6.000 | | | | 12/01/2036 | | | | 170,941 | |
| | 13,217 | | | | 6.000 | | | | 02/01/2037 | | | | 15,130 | |
| | 1,991 | | | | 6.000 | | | | 04/01/2037 | | | | 2,261 | |
| | 3,587 | | | | 6.000 | | | | 05/01/2037 | | | | 4,107 | |
| | 91,609 | | | | 6.000 | | | | 06/01/2037 | | | | 105,403 | |
| | 59,401 | | | | 6.000 | | | | 07/01/2037 | | | | 68,344 | |
| | 220,293 | | | | 6.000 | | | | 08/01/2037 | | | | 250,088 | |
| | 56,908 | | | | 6.000 | | | | 09/01/2037 | | | | 65,449 | |
| | 11,473 | | | | 6.000 | | | | 10/01/2037 | | | | 13,186 | |
| | 32,048 | | | | 6.000 | | | | 11/01/2037 | | | | 36,750 | |
| | 2,624 | | | | 6.000 | | | | 12/01/2037 | | | | 3,008 | |
| | 296,542 | | | | 6.000 | | | | 01/01/2038 | | | | 340,722 | |
| | 40,580 | | | | 6.000 | | | | 03/01/2038 | | | | 46,586 | |
| | 2,313 | | | | 6.000 | | | | 04/01/2038 | | | | 2,664 | |
| | 12,879 | | | | 6.000 | | | | 05/01/2038 | | | | 14,745 | |
| | 951 | | | | 6.000 | | | | 09/01/2038 | | | | 1,091 | |
| | 66,672 | | | | 6.000 | | | | 10/01/2038 | | | | 76,712 | |
| | 2,640 | | | | 6.000 | | | | 12/01/2038 | | | | 3,018 | |
| | 2,250 | | | | 6.000 | | | | 01/01/2039 | | | | 2,588 | |
| | 9,398 | | | | 4.000 | | | | 08/01/2039 | | | | 9,919 | |
| | 26,359 | | | | 4.500 | | | | 02/01/2040 | | | | 27,856 | |
| | 2,751 | | | | 6.000 | | | | 04/01/2040 | | | | 3,163 | |
| | 112,497 | | | | 6.000 | | | | 06/01/2040 | | | | 129,387 | |
| | 267,232 | | | | 6.000 | | | | 05/01/2041 | | | | 306,532 | |
| | 112,374 | | | | 4.500 | | | | 08/01/2041 | | | | 119,920 | |
| | | | | | | | | | | | | | |
| | | | | | | | | | | | | 3,864,872 | |
| | |
| | TOTAL MORTGAGE-BACKED SECURITIES | |
| | (Cost $8,049,499) | | | $ | 8,126,111 | |
| | |
| | | | | | | | | | | | | | |
|
| Collateralized Mortgage Obligations – 1.5% | |
| Regular Floater(a)(b) – 0.5% | |
| | FHLMC REMIC Series 3371, Class FA | |
| $ | 176,159 | | | | 2.994 | % | | | 09/15/2037 | | | $ | 177,571 | |
| | NCUA Guaranteed Notes Trust Series2010-R1, Class 1A | |
| | 203,674 | | | | 2.869 | | | | 10/07/2020 | | | | 203,810 | |
| | NCUA Guaranteed Notes Trust Series2011-R2, Class 1A | |
| | 741,123 | | | | 2.819 | | | | 02/06/2020 | | | | 741,243 | |
| | NCUA Guaranteed Notes Trust Series2011-R3, Class 1A | |
| | 388,906 | | | | 2.813 | | | | 03/11/2020 | | | | 388,976 | |
| | | | | | | | | | | | | | |
| | | | | | | | | | | | | 1,511,600 | |
| | |
| Sequential Fixed Rate – 1.0% | |
| | FHLMC REMIC Series 2755, Class ZA | |
| | 408,969 | | | | 5.000 | | | | 02/15/2034 | | | | 449,958 | |
| | FHLMC REMIC Series 4273, Class PD | |
| | 1,072,521 | | | | 6.500 | | | | 11/15/2043 | | | | 1,254,590 | |
| | FNMA REMIC Series2012-111, Class B | |
| | 311,974 | | | | 7.000 | | | | 10/25/2042 | | | | 362,376 | |
| | FNMA REMIC Series2012-153, Class B | |
| | 1,111,307 | | | | 7.000 | | | | 07/25/2042 | | | | 1,297,966 | |
| | | | | | | | | | | | | | |
| | | | | | | | | | | | | 3,364,890 | |
| | |
| | TOTAL COLLATERALIZED MORTGAGE OBLIGATIONS | |
| | (Cost $4,748,605) | | | $ | 4,876,490 | |
| | |
| | |
| The accompanying notes are an integral part of these financial statements. | | 67 |
GOLDMAN SACHS COMMODITY STRATEGY FUND
Consolidated Schedule of Investments(continued)
June 30, 2019 (Unaudited)
| | | | | | | | | | | | |
Principal
Amount | | | Interest
Rate | | Maturity
Date | | | Value | |
|
| Commercial Mortgage-Backed Securities(a) – 6.8% | |
| Agency Multi-Family – 6.8% | |
| FHLMC Multifamily Structured Pass-Through Certificates
REMIC Series K011, Class A2 |
|
| $ | 5,289,924 | | | 4.084% | | | 11/25/2020 | | | $ | 5,391,860 | |
| FHLMC Multifamily Structured Pass-Through Certificates
REMIC Series K714, Class A2(b) |
|
| | 16,114,427 | | | 3.034 | | | 10/25/2020 | | | | 16,218,312 | |
| | |
| TOTAL COMMERCIAL MORTGAGE-BACKED
SECURITIES |
|
| | (Cost $22,503,414) | | | $ | 21,610,172 | |
| | |
| | | | | | | | | | | | |
|
| Asset-Backed Securities(a) – 0.1% | |
| Home Equity – 0.1% | |
| GMACM Home Equity Loan Trust Series2007-HE3,
Class 1A1(b) |
|
| $ | 8,050 | | | 7.000% | | | 09/25/2037 | | | $ | 8,107 | |
| GMACM Home Equity Loan Trust Series2007-HE3,
Class 2A1(b) |
|
| | 62,236 | | | 7.000 | | | 09/25/2037 | | | | 64,651 | |
| | NCUA Guaranteed Notes Trust Series2010-A1, Class A | |
| | 211,921 | | | 2.769 | | | 12/07/2020 | | | | 211,948 | |
| | |
| | TOTAL ASSET-BACKED SECURITIES | | | | | |
| | (Cost $282,208) | | | $ | 284,706 | |
| | |
| | | | | | | | | | | | |
|
| U.S. Treasury Obligations – 13.0% | |
| | U.S. Treasury Bonds | |
| $ | 1,100,000 | | | 2.750% | | | 11/15/2042 | | | $ | 1,151,906 | |
| | 1,990,000 | | | 3.750 | | | 11/15/2043 | | | | 2,448,011 | |
| | 7,400,000 | | | 2.875 | | | 11/15/2046 | | | | 7,908,750 | |
| | 4,780,000 | | | 3.000 | | | 05/15/2047 | | | | 5,228,872 | |
| | U.S. Treasury Notes | |
| | 6,620,000 | | | 1.125 | | | 07/31/2021 | | | | 6,533,112 | |
| | 4,610,000 | | | 1.875 | | | 01/31/2022 | | | | 4,624,766 | |
| | 7,070,000 | | | 2.125(c) | | | 07/31/2024 | | | | 7,186,545 | |
| | 900,000 | | | 2.750 | | | 06/30/2025 | | | | 946,758 | |
| | 2,490,000 | | | 2.625 | | | 12/31/2025 | | | | 2,605,941 | |
| | 2,500,000 | | | 1.875 | | | 06/30/2026 | | | | 2,499,875 | |
| | 410,000 | | | 2.250 | | | 02/15/2027 | | | | 419,930 | |
| | |
| | TOTAL U.S. TREASURY OBLIGATIONS | | | | | |
| | (Cost $40,268,119) | | | $ | 41,554,466 | |
| | |
| | | | | | | | |
| Shares | | Description | | | Value | |
|
| Exchange Traded Fund(d) – 23.6% | |
| 750,000 | |
| Goldman Sachs Access
Treasury0-1 Year ETF |
| | $ | 75,270,000 | |
| (Cost $75,030,000) | | | | | |
| |
| | | | | | | | |
| Shares | | Dividend
Rate | | | Value | |
|
| Investment Company(d) – 41.6% | |
Goldman Sachs Financial Square Government Fund – Institutional Shares | |
| 132,944,770 | | | 2.308 | % | | $ | 132,944,770 | |
| (Cost $132,944,770) | | | | | |
| |
| TOTAL INVESTMENTS – 89.2% | |
| (Cost $283,826,615) | | | $ | 284,666,715 | |
| |
| OTHER ASSETS IN EXCESS OF LIABILITIES – 10.8% | | | | 34,573,777 | |
| |
| NET ASSETS – 100.0% | | | $ | 319,240,492 | |
| |
| | |
|
| The percentage shown for each investment category reflects the value of investments in that category as a percentage of net assets. |
| |
(a) | | Variable rate security. Except for floating rate notes (for which final maturity is disclosed), maturity date disclosed is the next interest reset date. Interest rate disclosed is that which is in effect on June 30, 2019. |
| |
(b) | | Securities with “Call” features. Maturity dates disclosed are the final maturity dates. |
| |
(c) | | All or a portion of security is segregated as collateral for initial margin requirements on futures transactions. |
| |
(d) | | Represents an Affiliated Issuer. |
| | |
|
Investment Abbreviations: |
FHLMC | | —Federal Home Loan Mortgage Corp. |
FNMA | | —Federal National Mortgage Association |
REMIC | | —Real Estate Mortgage Investment Conduit |
UMBS | | —Uniform Mortgage-Backed Securities |
| | |
Currency Abbreviation: |
USD | | —United States Dollar |
|
| | |
| 68 | | The accompanying notes are an integral part of these financial statements. |
GOLDMAN SACHS COMMODITY STRATEGY FUND
|
| ADDITIONAL INVESTMENT INFORMATION |
FUTURES CONTRACTS— At June 30, 2019, the Fund had the following futures contracts:
| | | | | | | | | | | | | | | | |
| Description | | Number of
Contracts | | | Expiration
Date | | | Notional
Amount | | | Unrealized
Appreciation/
(Depreciation) | |
Long position contracts: | | | | | | | | | | | | | | | | |
3 Month Eurodollar | | | 1 | | | | 12/14/2020 | | | $ | 246,100 | | | $ | 1,018 | |
U.S. Treasury Long Bond | | | 23 | | | | 09/19/2019 | | | | 3,576,500 | | | | 82,926 | |
| |
| Total | | | $ | 83,944 | |
| | | | |
Short position contracts: | | | | | | | | | | | | | | | | |
U.S. Treasury 2 Year Note | | | (32 | ) | | | 09/30/2019 | | | $ | (6,884,500 | ) | | $ | (28,121 | ) |
U.S. Treasury 5 Year Note | | | (90 | ) | | | 09/30/2019 | | | | (10,630,547 | ) | | | (87,074 | ) |
U.S. Treasury 10 Year Note | | | (99 | ) | | | 09/19/2019 | | | | (12,662,719 | ) | | | (168,788 | ) |
U.S. Treasury Ultra Bond | | | (113 | ) | | | 09/19/2019 | | | | (20,046,906 | ) | | | (672,977 | ) |
| | | | |
| Total | | | | | | | | | | | | | | $ | (956,960 | ) |
| | | | |
| Total Futures Contracts | | | | | | | | | | | | | | $ | (873,016 | ) |
SWAP CONTRACTS — At June 30, 2019, the Fund had the following swap contracts:
CENTRALLY CLEARED INTEREST RATE SWAP CONTRACTS
| | | | | | | | | | | | | | | | | | |
Payments
Made by
the Fund(a) | | Payments
Received
by the Fund | | Termination
Date | | Notional
Amount
(000’s)(b) | | Value | | | Upfront
Premium
(Received) Paid | | | Unrealized
Appreciation/
(Depreciation) | |
| 1.390% | | 1 Day Federal Funds | | 11/30/2023 | | USD 2,200 | | $ | 7,079 | | | $ | 5,469 | | | $ | 1,610 | |
| | (a) | | Payments made annually. |
| | (b) | | Represents forward starting interest rate swaps whose effective dates of commencement of accruals and cash flows occur subsequent to June 30, 2019. |
OVER THE COUNTER TOTAL RETURN SWAP CONTRACTS
| | | | | | | | | | | | | | |
| Referenced Obligation/Index(a) | | Financing Rate
Received
(Paid)
by the Fund | | Counterparty | | Termination
Date | | Notional
Amount
(000’s) | | | Unrealized
Appreciation/
(Depreciation)(b) | |
S&P GSCI Energy 1 Month Forward Index | | (0.130)% | | BNP Paribas SA | | 04/08/2020 | | USD | 112,770 | | | $ | — | |
Macquarie Investor Product 645E Index(*) | | (0.000) | | Macquarie Bank Ltd. | | 04/16/2020 | | USD | 81,457 | | | | (68,563 | ) |
BAML Commodity Excess Return Strategy Index(*) | | (0.000) | | Merrill Lynch International | | 11/14/2019 | | USD | 114,382 | | | | — | |
| | | | |
| TOTAL | | | | | | | | | $ | (68,563 | ) |
| | * | | The components of the basket shown below. |
| | (a) | | Payments made monthly. |
| | (b) | | There are no upfront payments on the swap contracts listed above; therefore the unrealized gains (losses) on the swap contracts are equal to their value. |
| | |
| The accompanying notes are an integral part of these financial statements. | | 69 |
GOLDMAN SACHS COMMODITY STRATEGY FUND
Consolidated Schedule of Investments(continued)
June 30, 2019 (Unaudited)
|
| ADDITIONAL INVESTMENT INFORMATION (continued) |
A basket (Macquarie Investor Product 645E Index) of commodities
| | | | | | | | | | | | | | |
| Description | | Sector | | Number of
Contracts | | | Value | | | Weight | |
WTI | | Energy | | | 1,000 | | | $ | 58,470 | | | | 25.69 | % |
Brent | | Energy | | | 1,000 | | | | 64,740 | | | | 18.35 | |
Gasoil | | Grains | | | 100 | | | | 59,750 | | | | 5.68 | |
Corn | | Energy | | | 5,000 | | | | 21,575 | | | | 5.39 | |
Gasoline RBOB | | Metals | | | 42,000 | | | | 79,657 | | | | 4.65 | |
Heating Oil | | Meats | | | 42,000 | | | | 81,455 | | | | 4.45 | |
Gold | | Precious | | | 100 | | | | 141,370 | | | | 4.33 | |
Copper | | Energy | | | 25 | | | | 149,850 | | | | 4.20 | |
Aluminum | | Energy | | | 25 | | | | 44,819 | | | | 3.43 | |
Live Cattle | | Energy | | | 40,000 | | | | 41,740 | | | | 3.36 | |
Wheat | | Metals | | | 5,000 | | | | 26,363 | | | | 3.22 | |
Soybeans | | Grains | | | 5,000 | | | | 46,150 | | | | 3.15 | |
Natural Gas | | Grains | | | 10,000 | | | | 23,080 | | | | 2.63 | |
Lean Hogs | | Meats | | | 40,000 | | | | 30,400 | | | | 2.26 | |
Sugar | | Softs | | | 112,000 | | | | 14,134 | | | | 1.59 | |
Feeder Cattle | | Textiles | | | 50,000 | | | | 68,425 | | | | 1.24 | |
Cotton | | Meats | | | 50,000 | | | | 33,040 | | | | 1.23 | |
Kansas Wheat | | Grains | | | 5,000 | | | | 23,075 | | | | 1.15 | |
Zinc | | Metals | | | 25 | | | | 62,675 | | | | 1.09 | |
Nickel | | Metals | | | 6 | | | | 76,056 | | | | 0.78 | |
Coffee | | Softs | | | 37,500 | | | | 41,044 | | | | 0.70 | |
Lead | | Metals | | | 25 | | | | 48,275 | | | | 0.67 | |
Silver | | Precious | | | 5,000 | | | | 76,705 | | | | 0.42 | |
Cocoa | | Softs | | | 10 | | | | 24,250 | | | | 0.36 | |
A basket (BAML Commodity Excess Return Strategy Index) of commodities
| | | | | | | | | | | | | | |
| Description | | Sector | | Number of
Contracts | | | Value | | | Weight | |
WTI | | Energy | | | 1,000 | | | $ | 58,470 | | | | 25.69 | % |
Brent | | Energy | | | 1,000 | | | | 64,740 | | | | 18.35 | |
Corn | | Grains | | | 100 | | | | 59,750 | | | | 5.68 | |
GasOil | | Energy | | | 5,000 | | | | 21,575 | | | | 5.39 | |
Copper | | Metals | | | 42,000 | | | | 79,657 | | | | 4.65 | |
Live Cattle | | Meats | | | 42,000 | | | | 81,455 | | | | 4.45 | |
Gold | | Precious | | | 100 | | | | 141,370 | | | | 4.33 | |
Heating Oil | | Energy | | | 25 | | | | 149,850 | | | | 4.20 | |
Gasoline RBOB | | Energy | | | 25 | | | | 44,819 | | | | 3.43 | |
Natural Gas | | Energy | | | 40,000 | | | | 41,740 | | | | 3.36 | |
Aluminum | | Metals | | | 5,000 | | | | 26,363 | | | | 3.22 | |
Wheat | | Grains | | | 5,000 | | | | 46,150 | | | | 3.15 | |
Soybeans | | Grains | | | 10,000 | | | | 23,080 | | | | 2.63 | |
Lean Hogs | | Meats | | | 40,000 | | | | 30,400 | | | | 2.26 | |
Sugar | | Softs | | | 112,000 | | | | 14,134 | | | | 1.59 | |
Cotton | | Textiles | | | 50,000 | | | | 68,425 | | | | 1.24 | |
Feeder Cattle | | Meats | | | 50,000 | | | | 33,040 | | | | 1.23 | |
Winter Wheat | | Grains | | | 5,000 | | | | 23,075 | | | | 1.15 | |
Zinc | | Metals | | | 25 | | | | 62,675 | | | | 1.09 | |
Lead | | Metals | | | 6 | | | | 76,056 | | | | 0.78 | |
Coffee | | Softs | | | 37,500 | | | | 41,044 | | | | 0.70 | |
Nickel | | Metals | | | 25 | | | | 48,275 | | | | 0.67 | |
Silver | | Precious | | | 5,000 | | | | 76,705 | | | | 0.42 | |
Cocoa | | Softs | | | 10 | | | | 24,250 | | | | 0.36 | |
| | |
| 70 | | The accompanying notes are an integral part of these financial statements. |
GOLDMAN SACHS MANAGED FUTURES STRATEGY FUND
Consolidated Schedule of Investments
June 30, 2019 (Unaudited)
| | | | | | | | |
| Shares | | | Dividend
Rate | | Value | |
|
| Investment Companies(a) – 70.2% | |
| Goldman Sachs Financial Square Government Fund –
Institutional Shares |
|
| | 165,995,774 | | | 2.308% | | $ | 165,995,774 | |
| | |
| | TOTAL INVESTMENTS – 70.2% | |
| | (Cost $165,995,774) | | $ | 165,995,774 | |
| | |
| OTHER ASSETS IN EXCESS OF
LIABILITIES – 29.8% | | | 70,559,192 | |
| | |
| | NET ASSETS – 100.0% | | $ | 236,554,966 | |
| | |
| | |
|
| The percentage shown for each investment category reflects the value of investments in that category as a percentage of net assets. |
| |
(a) | | Represents an Affiliated Issuer. |
| | |
|
Investment Abbreviations: |
BA | | —Banker Acceptance Rate |
BBR | | —Bank Bill Reference Rate |
BUBOR | | —Budapest Interbank Offered Rate |
EURIBOR | | —Euro Interbank Offered Rate |
JIBAR | | —Johannesburg Interbank Agreed Rate |
LIBOR | | —London Interbank Offered Rate |
PRIBOR | | —Prague Interbank Offered Rate |
STIBOR | | —Stockholm Interbank Offered Rate |
TIIE | | —Interbank Equilibrium Interest Rate |
WIBOR | | —Warsaw Interbank Offered Rate |
| | |
Currency Abbreviations: |
AUD | | —Australian Dollar |
BRL | | —Brazilian Real |
CAD | | —Canadian Dollar |
CHF | | —Swiss Franc |
CLP | | —Chilean Peso |
COP | | —Colombian Peso |
CZK | | —Czech Koruna |
EUR | | —Euro |
GBP | | —British Pound |
HUF | | —Hungarian Forint |
IDR | | —Indonesian Rupiah |
INR | | —Indian Rupee |
JPY | | —Japanese Yen |
KRW | | —South Korean Won |
MXN | | —Mexican Peso |
MYR | | —Malaysian Ringgit |
NOK | | —Norwegian Krone |
NZD | | —New Zealand Dollar |
PLN | | —Polish Zloty |
RUB | | —Russian Ruble |
SEK | | —Swedish Krona |
TRY | | —Turkish Lira |
USD | | —United States Dollar |
ZAR | | —South African Rand |
|
|
| ADDITIONAL INVESTMENT INFORMATION |
FORWARD FOREIGN CURRENCY EXCHANGE CONTRACTS — At June 30, 2019, the Fund had the following forward foreign currency exchange contracts:
FORWARD FOREIGN CURRENCY EXCHANGE CONTRACTS WITH UNREALIZED GAIN
| | | | | | | | | | | | | | | | | | | | |
| Counterparty | | Currency
Purchased | | | Currency
Sold | | | Settlement
Date | | | Unrealized
Gain | |
Morgan Stanley Co., Inc. | | AUD | | | 2,852,000 | | | USD | | | 1,964,358 | | | | 09/18/2019 | | | $ | 42,677 | |
| | BRL | | | 10,080,000 | | | USD | | | 2,623,121 | | | | 07/02/2019 | | | | 1,913 | |
| | CAD | | | 12,219,000 | | | USD | | | 9,240,790 | | | | 09/18/2019 | | | | 91,836 | |
| | CHF | | | 683,000 | | | USD | | | 696,573 | | | | 09/18/2019 | | | | 8,123 | |
| | CLP | | | 530,000,000 | | | USD | | | 762,436 | | | | 09/23/2019 | | | | 20,048 | |
| | COP | | | 2,508,000,000 | | | USD | | | 763,010 | | | | 09/18/2019 | | | | 13,690 | |
| | CZK | | | 76,800,000 | | | USD | | | 3,395,358 | | | | 09/18/2019 | | | | 39,217 | |
| | EUR | | | 10,754,000 | | | USD | | | 12,229,904 | | | | 09/18/2019 | | | | 74,834 | |
| | GBP | | | 11,000 | | | USD | | | 13,958 | | | | 09/18/2019 | | | | 12 | |
| | IDR | | | 187,020,000,000 | | | USD | | | 12,920,219 | | | | 09/18/2019 | | | | 185,394 | |
| | INR | | | 971,000,000 | | | USD | | | 13,862,913 | | | | 09/18/2019 | | | | 70,869 | |
| | JPY | | | 3,102,276,000 | | | USD | | | 28,888,749 | | | | 09/18/2019 | | | | 53,657 | |
| | MXN | | | 218,481,000 | | | USD | | | 11,034,242 | | | | 09/18/2019 | | | | 238,227 | |
| | |
| The accompanying notes are an integral part of these financial statements. | | 71 |
GOLDMAN SACHS MANAGED FUTURES STRATEGY FUND
Consolidated Schedule of Investments(continued)
June 30, 2019 (Unaudited)
|
| ADDITIONAL INVESTMENT INFORMATION (continued) |
FORWARD FOREIGN CURRENCY EXCHANGE CONTRACTS WITH UNREALIZED GAIN (continued)
| | | | | | | | | | | | | | | | | | | | |
| Counterparty | | Currency
Purchased | | | Currency
Sold | | | Settlement
Date | | | Unrealized
Gain | |
Morgan Stanley Co., Inc. (continued) | | NOK | | | 5,600,000 | | | USD | | | 648,580 | | | | 09/18/2019 | | | $ | 7,892 | |
| | NZD | | | 840,000 | | | USD | | | 553,853 | | | | 09/18/2019 | | | | 10,459 | |
| | PLN | | | 14,520,000 | | | USD | | | 3,865,621 | | | | 09/18/2019 | | | | 23,335 | |
| | RUB | | | 611,000,000 | | | USD | | | 9,231,699 | | | | 09/18/2019 | | | | 324,751 | |
| | SEK | | | 21,239,400 | | | USD | | | 2,266,593 | | | | 09/18/2019 | | | | 26,139 | |
| | TRY | | | 50,500,000 | | | USD | | | 8,207,208 | | | | 09/18/2019 | | | | 513,972 | |
| | USD | | | 3,605,244 | | | BRL | | | 13,860,000 | | | | 08/02/2019 | | | | 6,435 | |
| | USD | | | 3,254,351 | | | EUR | | | 2,846,000 | | | | 09/18/2019 | | | | 18,164 | |
| | USD | | | 31,324,762 | | | GBP | | | 24,540,250 | | | | 09/18/2019 | | | | 94,640 | |
| | USD | | | 834,773 | | | HUF | | | 236,000,000 | | | | 09/18/2019 | | | | 4,105 | |
| | USD | | | 1,899,482 | | | SEK | | | 17,531,000 | | | | 09/18/2019 | | | | 11,616 | |
| | | ZAR | | | 27,000 | | | USD | | | 1,800 | | | | 09/18/2019 | | | | 98 | |
| | | | | | |
| TOTAL | | | | | | | | | | | | | | | | | | $ | 1,882,103 | |
FORWARD FOREIGN CURRENCY EXCHANGE CONTRACTS WITH UNREALIZED LOSS
| | | | | | | | | | | | | | | | | | | | |
| Counterparty | | Currency
Purchased | | | Currency
Sold | | | Settlement
Date | | | Unrealized
Loss | |
Morgan Stanley Co., Inc. | | BRL | | | 13,860,000 | | | USD | | | 3,615,967 | | | | 07/02/2019 | | | $ | (6,545 | ) |
| | BRL | | | 12,760,000 | | | USD | | | 3,323,869 | | | | 08/02/2019 | | | | (10,679 | ) |
| | COP | | | 7,700,000,000 | | | USD | | | 2,398,806 | | | | 09/18/2019 | | | | (14,200 | ) |
| | EUR | | | 10,663,000 | | | USD | | | 12,164,719 | | | | 09/18/2019 | | | | (39,823 | ) |
| | GBP | | | 6,108,000 | | | USD | | | 7,801,764 | | | | 09/18/2019 | | | | (17,499 | ) |
| | HUF | | | 228,000,000 | | | USD | | | 803,893 | | | | 09/18/2019 | | | | (1,383 | ) |
| | JPY | | | 1,474,000,000 | | | USD | | | 13,731,453 | | | | 09/18/2019 | | | | (59,886 | ) |
| | PLN | | | 12,960,000 | | | USD | | | 3,481,498 | | | | 09/18/2019 | | | | (10,364 | ) |
| | RUB | | | 67,000,000 | | | USD | | | 1,055,897 | | | | 09/18/2019 | | | | (7,972 | ) |
| | USD | | | 18,005,015 | | | AUD | | | 25,753,000 | | | | 09/18/2019 | | | | (118,050 | ) |
| | USD | | | 5,925,009 | | | BRL | | | 23,940,000 | | | | 07/02/2019 | | | | (309,447 | ) |
| | USD | | | 13,701,136 | | | CAD | | | 18,332,000 | | | | 09/18/2019 | | | | (317,780 | ) |
| | USD | | | 2,524,424 | | | CHF | | | 2,485,000 | | | | 09/18/2019 | | | | (33,088 | ) |
| | USD | | | 7,543,438 | | | CLP | | | 5,340,000,000 | | | | 09/23/2019 | | | | (340,458 | ) |
| | USD | | | 6,966,754 | | | COP | | | 23,386,000,000 | | | | 09/18/2019 | | | | (275,633 | ) |
| | USD | | | 11,764,081 | | | CZK | | | 267,233,000 | | | | 09/18/2019 | | | | (200,180 | ) |
| | USD | | | 35,677,755 | | | EUR | | | 31,465,000 | | | | 09/18/2019 | | | | (321,404 | ) |
| | USD | | | 275,345 | | | GBP | | | 217,000 | | | | 09/18/2019 | | | | (234 | ) |
| | USD | | | 10,047,052 | | | HUF | | | 2,844,046,000 | | | | 09/18/2019 | | | | (12,601 | ) |
| | USD | | | 418,570 | | | JPY | | | 44,949,000 | | | | 09/18/2019 | | | | (777 | ) |
| | USD | | | 14,214,146 | | | KRW | | | 16,740,000,000 | | | | 09/18/2019 | | | | (282,376 | ) |
| | USD | | | 3,712,468 | | | MXN | | | 72,250,000 | | | | 09/18/2019 | | | | (51,778 | ) |
| | USD | | | 12,991,617 | | | MYR | | | 54,240,000 | | | | 09/18/2019 | | | | (116,166 | ) |
| | USD | | | 8,804,766 | | | NOK | | | 76,600,000 | | | | 09/18/2019 | | | | (194,544 | ) |
| | USD | | | 8,040,596 | | | NZD | | | 12,120,000 | | | | 09/18/2019 | | | | (112,829 | ) |
| | USD | | | 11,134,247 | | | PLN | | | 42,126,000 | | | | 09/18/2019 | | | | (168,764 | ) |
| | USD | | | 9,641,053 | | | SEK | | | 90,365,000 | | | | 09/18/2019 | | | | (141,812 | ) |
| | USD | | | 4,479,786 | | | TRY | | | 27,120,000 | | | | 09/18/2019 | | | | (9,510 | ) |
| | | USD | | | 5,902,422 | | | ZAR | | | 88,620,000 | | | | 09/18/2019 | | | | (345,186 | ) |
| | | | | | |
| TOTAL | | | | | | | | | | | | | | | | | | $ | (3,520,968 | ) |
| | |
| 72 | | The accompanying notes are an integral part of these financial statements. |
GOLDMAN SACHS MANAGED FUTURES STRATEGY FUND
|
| ADDITIONAL INVESTMENT INFORMATION (continued) |
FUTURES CONTRACTS — At June 30, 2019, the Fund had the following futures contracts:
| | | | | | | | | | | | | | | | |
| Description | | Number of
Contracts | | | Expiration
Date | | | Notional Amount | | | Unrealized
Appreciation/
(Depreciation) | |
Long position contracts: | | | | | | | | | | | | | | | | |
100 oz Gold | | | 30 | | | | 08/28/2019 | | | $ | 4,243,200 | | | $ | 221,755 | |
Amsterdam Exchange Index | | | 66 | | | | 07/19/2019 | | | | 8,419,402 | | | | 58,576 | |
CAC 40 10 Euro Index | | | 127 | | | | 07/19/2019 | | | | 7,990,299 | | | | 127,760 | |
CBOE Volatility Index | | | 50 | | | | 07/17/2019 | | | | 776,250 | | | | (87,706 | ) |
Corn | | | 51 | | | | 09/13/2019 | | | | 1,088,850 | | | | (57,459 | ) |
DAX Index | | | 23 | | | | 09/20/2019 | | | | 8,099,676 | | | | 112,609 | |
DJIA CBOTE-Mini Index | | | 35 | | | | 09/20/2019 | | | | 4,653,775 | | | | 37,728 | |
EURO STOXX 50 Index | | | 167 | | | | 09/20/2019 | | | | 6,581,785 | | | | 185,278 | |
FTSE 100 Index | | | 89 | | | | 09/20/2019 | | | | 8,328,853 | | | | 50,257 | |
FTSE/JSE Top 40 Index | | | 238 | | | | 09/19/2019 | | | | 8,859,649 | | | | (95,247 | ) |
FTSE/MIB Index | | | 69 | | | | 09/20/2019 | | | | 8,299,488 | | | | 75,810 | |
Hang Seng Index | | | 23 | | | | 07/30/2019 | | | | 4,196,366 | | | | 5,181 | |
IBEX 35 Index | | | 88 | | | | 07/19/2019 | | | | 9,178,943 | | | | 45,376 | |
LME Aluminum Base Metal | | | 93 | | | | 07/17/2019 | | | | 4,143,731 | | | | 67,412 | |
LME Copper Base Metal | | | 52 | | | | 07/17/2019 | | | | 7,789,600 | | | | 45,427 | |
LME Lead Base Metal | | | 72 | | | | 07/17/2019 | | | | 3,465,900 | | | | 159,880 | |
LME Nickel Base Metal | | | 53 | | | | 07/17/2019 | | | | 4,019,520 | | | | 269,191 | |
LME Zinc Base Metal | | | 41 | | | | 07/17/2019 | | | | 2,608,625 | | | | (179,859 | ) |
LME Zinc Base Metal | | | 2 | | | | 08/21/2019 | | | | 125,350 | | | | 1,195 | |
MSCI Taiwan Index | | | 125 | | | | 07/30/2019 | | | | 4,831,250 | | | | (19,595 | ) |
NASDAQ 100E-Mini Index | | | 23 | | | | 09/20/2019 | | | | 3,539,125 | | | | 29,933 | |
OMXS30 Index | | | 430 | | | | 07/19/2019 | | | | 7,504,967 | | | | 57,566 | |
RBOB Gasoline | | | 1 | | | | 07/31/2019 | | | | 79,149 | | | | 8,232 | |
S&P 500E-Mini Index | | | 335 | | | | 09/20/2019 | | | | 49,315,350 | | | | 341,182 | |
S&P/TSX 60 Index | | | 98 | | | | 09/19/2019 | | | | 14,633,210 | | | | 100,867 | |
SET50 Index | | | 1,241 | | | | 09/27/2019 | | | | 9,292,679 | | | | 43,945 | |
SGX FTSE China A50 Index | | | 325 | | | | 07/30/2019 | | | | 4,389,125 | | | | (8,876 | ) |
SPI 200 Index | | | 123 | | | | 09/19/2019 | | | | 14,159,593 | | | | 114,738 | |
Wheat | | | 16 | | | | 09/13/2019 | | | | 419,200 | | | | (20,050 | ) |
| | | | |
| Total | | | | | | | | | | | | | | $ | 1,691,106 | |
| | | | |
Short position contracts: | | | | | | | | | | | | | | | | |
BIST 30 Index | | | (2,732 | ) | | | 08/29/2019 | | | | (5,903,488 | ) | | | (54,055 | ) |
Brent Crude Oil | | | (9 | ) | | | 07/31/2019 | | | | (577,890 | ) | | | (3,798 | ) |
Coffee ‘C’ | | | (37 | ) | | | 09/18/2019 | | | | (1,522,781 | ) | | | (90,304 | ) |
Cotton No. 2 | | | (98 | ) | | | 12/06/2019 | | | | (3,235,960 | ) | | | (7,369 | ) |
Feeder Cattle | | | (28 | ) | | | 08/29/2019 | | | | (1,913,800 | ) | | | 89,486 | |
HSCEI | | | (55 | ) | | | 07/30/2019 | | | | (3,814,311 | ) | | | (2,292 | ) |
KC HRW Wheat | | | (15 | ) | | | 09/13/2019 | | | | (346,875 | ) | | | 6,320 | |
KOSPI 200 Index | | | (86 | ) | | | 09/11/2019 | | | | (5,183,909 | ) | | | (144,566 | ) |
Lean Hogs | | | (10 | ) | | | 08/14/2019 | | | | (305,400 | ) | | | (7,895 | ) |
Live Cattle | | | (48 | ) | | | 08/30/2019 | | | | (2,001,120 | ) | | | 21,505 | |
LME Aluminum Base Metal | | | (93 | ) | | | 07/17/2019 | | | | (4,143,731 | ) | | | 25,749 | |
LME Aluminum Base Metal | | | (93 | ) | | | 08/21/2019 | | | | (4,168,144 | ) | | | (69,688 | ) |
LME Copper Base Metal | | | (52 | ) | | | 07/17/2019 | | | | (7,789,600 | ) | | | (25,348 | ) |
LME Copper Base Metal | | | (27 | ) | | | 08/21/2019 | | | | (4,045,950 | ) | | | (158,689 | ) |
LME Lead Base Metal | | | (72 | ) | | | 07/17/2019 | | | | (3,465,900 | ) | | | (97,820 | ) |
LME Lead Base Metal | | | (66 | ) | | | 08/21/2019 | | | | (3,186,150 | ) | | | (150,306 | ) |
LME Nickel Base Metal | | | (53 | ) | | | 07/17/2019 | | | | (4,019,520 | ) | | | (241,367 | ) |
LME Nickel Base Metal | | | (42 | ) | | | 08/21/2019 | | | | (3,194,352 | ) | | | (235,971 | ) |
| | |
| The accompanying notes are an integral part of these financial statements. | | 73 |
GOLDMAN SACHS MANAGED FUTURES STRATEGY FUND
Consolidated Schedule of Investments(continued)
June 30, 2019 (Unaudited)
|
| ADDITIONAL INVESTMENT INFORMATION (continued) |
FUTURES CONTRACTS (continued)
| | | | | | | | | | | | | | | | |
| Description | | Number of
Contracts | | | Expiration
Date | | | Notional
Amount | | | Unrealized
Appreciation/
(Depreciation) | |
| | | | |
Short position contracts: (continued) | | | | | | | | | | | | | | | | |
LME Zinc Base Metal | | | (41 | ) | | | 07/17/2019 | | | $ | (2,608,625 | ) | | $ | 12,641 | |
LME Zinc Base Metal | | | (33 | ) | | | 08/21/2019 | | | | (2,068,275 | ) | | | 15,072 | |
Low Sulphur Gasoil | | | (21 | ) | | | 08/12/2019 | | | | (1,236,375 | ) | | | (31,526 | ) |
MSCI EAFEE-Mini Index | | | (87 | ) | | | 09/20/2019 | | | | (8,366,355 | ) | | | (246,823 | ) |
MSCI Emerging MarketsE-Mini Index | | | (163 | ) | | | 09/20/2019 | | | | (8,585,210 | ) | | | (375,499 | ) |
Natural Gas | | | (154 | ) | | | 07/29/2019 | | | | (3,562,020 | ) | | | (1,605 | ) |
Nikkei 225 Index | | | (4 | ) | | | 09/12/2019 | | | | (788,758 | ) | | | (2,066 | ) |
NY Harbor ULSD | | | (17 | ) | | | 07/31/2019 | | | | (1,377,520 | ) | | | (53,060 | ) |
Russell 2000E-Mini Index | | | (196 | ) | | | 09/20/2019 | | | | (15,357,580 | ) | | | (234,883 | ) |
Silver | | | (33 | ) | | | 09/26/2019 | | | | (2,532,750 | ) | | | (61,636 | ) |
Soybean | | | (27 | ) | | | 11/14/2019 | | | | (1,246,050 | ) | | | (32,047 | ) |
Sugar No. 11 | | | (131 | ) | | | 09/30/2019 | | | | (1,847,205 | ) | | | 18,638 | |
TOPIX Index | | | (3 | ) | | | 09/12/2019 | | | | (431,573 | ) | | | (2,693 | ) |
VSTOXX | | | (701 | ) | | | 07/17/2019 | | | | (1,139,863 | ) | | | 91,228 | |
WTI Crude Oil | | | (24 | ) | | | 07/22/2019 | | | | (1,391,760 | ) | | | (70,700 | ) |
| | | | |
| Total | | | | | | | | | | | | | | $ | (2,121,367 | ) |
| | | | |
| Total Futures Contracts | | | | | | | | | | | | | | $ | (430,261 | ) |
SWAP CONTRACTS — At June 30, 2019, the Fund had the following swap contracts:
CENTRALLY CLEARED INTEREST RATE SWAP CONTRACTS
| | | | | | | | | | | | | | | | | | | | | | |
| Payments Made by the Fund | | Payments Received by
the Fund | | Termination
Date | | | Notional
Amount
(000’s)(a) | | | Value | | | Upfront
Premium
(Received)
Paid | | | Unrealized
Appreciation/
(Depreciation) | |
| 3 Month BBR(b) | | 1.000% | | | 09/18/2020 | | | AUD | 365,650 | | | $ | 21,713 | | | $ | (1,701,679 | ) | | $ | 1,723,392 | |
| 3 Month BA(c) | | 1.750 | | | 09/18/2020 | | | CAD | 268,560 | | | | (195,202 | ) | | | (282,658 | ) | | | 87,456 | |
| 6 Month LIBOR(d) | | 0.000 | | | 09/18/2020 | | | CHF | 439,880 | | | | 3,647,710 | | | | 947,781 | | | | 2,699,929 | |
| 6 Month EURIBOR(c) | | 0.000 | | | 09/18/2020 | | | EUR | 605,910 | | | | 2,752,584 | | | | 2,063,955 | | | | 688,629 | |
| 6 Month LIBOR(c) | | 1.000 | | | 09/18/2020 | | | GBP | 522,140 | | | | 1,014,325 | | | | 971,693 | | | | 42,632 | |
| 3 Month STIBOR(b) | | 0.000 | | | 09/18/2020 | | | SEK | 262,740 | | | | 26,119 | | | | 27,951 | | | | (1,832 | ) |
| 3 Month LIBOR(b) | | 1.750 | | | 09/18/2020 | | | USD | 962,980 | | | | (931,982 | ) | | | (1,173,535 | ) | | | 241,553 | |
| 0.000%(d) | | 6 Month EURIBOR | | | 09/18/2021 | | | EUR | 177,050 | | | | (1,593,144 | ) | | | (1,134,497 | ) | | | (458,647 | ) |
| 1.000(c) | | 6 Month LIBOR | | | 09/18/2021 | | | GBP | 157,850 | | | | (654,408 | ) | | | (654,003 | ) | | | (405 | ) |
| 3 Month LIBOR(b) | | 1.750 | | | 09/18/2021 | | | USD | 201,140 | | | | 151,992 | | | | 476,258 | | | | (324,266 | ) |
| 6 Month PRIBOR(c) | | 2.000 | | | 09/18/2024 | | | CZK | 640,870 | | | | 509,359 | | | | 137,392 | | | | 371,967 | |
| 6 Month BUBOR(c) | | 2.000 | | | 09/18/2024 | | | HUF | 5,487,960 | | | | 708,964 | | | | (280,986 | ) | | | 989,950 | |
| 1 Month TIIE(e) | | 8.000 | | | 09/18/2024 | | | MXN | 356,350 | | | | 597,530 | | | | 62,927 | | | | 534,603 | |
| 6 Month WIBOR(c) | | 2.250 | | | 09/18/2024 | | | PLN | 119,180 | | | | 558,635 | | | | (471,131 | ) | | | 1,029,766 | |
| 3 Month JIBAR(b) | | 7.750 | | | 09/18/2024 | | | ZAR | 456,860 | | | | 921,985 | | | | (670,777 | ) | | | 1,592,762 | |
| 3 Month BA(c) | | 2.000 | | | 09/18/2029 | | | CAD | 24,790 | | | | 263,638 | | | | (843,828 | ) | | | 1,107,466 | |
| 6 Month LIBOR(c) | | 0.000 | | | 09/18/2029 | | | CHF | 22,500 | | | | 470,843 | | | | (642,921 | ) | | | 1,113,764 | |
| 6 Month EURIBOR(c) | | 0.500 | | | 09/18/2029 | | | EUR | 80,400 | | | | 2,763,983 | | | | 1,548,221 | | | | 1,215,762 | |
| 6 Month LIBOR(c) | | 1.000 | | | 09/18/2029 | | | GBP | 103,800 | | | | (761,125 | ) | | | (1,052,442 | ) | | | 291,317 | |
| 3 Month STIBOR(b) | | 0.750 | | | 09/18/2029 | | | SEK | 218,270 | | | | 427,388 | | | | (644,360 | ) | | | 1,071,748 | |
| 3 Month LIBOR(b) | | 2.000 | | | 09/18/2029 | | | USD | 79,580 | | | | 293,680 | | | | (380,485 | ) | | | 674,165 | |
| 1.000(d) | | 6 Month EURIBOR | | | 09/18/2049 | | | EUR | 8,900 | | | | (769,506 | ) | | | (372,525 | ) | | | (396,981 | ) |
| | |
| 74 | | The accompanying notes are an integral part of these financial statements. |
GOLDMAN SACHS MANAGED FUTURES STRATEGY FUND
|
| ADDITIONAL INVESTMENT INFORMATION (continued) |
CENTRALLY CLEARED INTEREST RATE SWAP CONTRACTS (continued)
| | | | | | | | | | | | | | | | | | | | | | | | |
| Payments Made by the Fund | | Payments Received by
the Fund | | | Termination
Date | | | Notional
Amount
(000’s)(a) | | | Value | | | Upfront
Premium
(Received)
Paid | | | Unrealized
Appreciation/
(Depreciation) | |
| 1.250(c) | | | 6 Month LIBOR | | | | 09/18/2049 | | | GBP | 19,610 | | | $ | (38,263 | ) | | $ | 1,023 | | | $ | (39,286 | ) |
| 2.250(c) | | | 3 Month LIBOR | | | | 09/18/2049 | | | USD | 44,360 | | | | (356,963 | ) | | | (412,394 | ) | | | 55,431 | |
| | | | | | |
| TOTAL | | | | | | | | | | | | | | $ | 9,829,855 | | | $ | (4,481,020 | ) | | $ | 14,310,875 | |
| | (a) | | Represents forward starting interest rate swaps whose effective dates of commencement of accruals and cash flows occur subsequent on June 30, 2019. |
| | (b) | | Payments made quarterly. |
| | (c) | | Payments made semi-annually. |
| | (d) | | Payments made annually. |
| | (e) | | Payments made monthly. |
| | |
| The accompanying notes are an integral part of these financial statements. | | 75 |
GOLDMAN SACHS ALTERNATIVE FUNDS
Consolidated Statements of Assets and Liabilities(a)
June 30, 2019 (Unaudited)
| | | | | | | | | | | | | | | | | | |
| | | | | Absolute Return
Tracker Fund | | | Alternative
Premia Fund | | | Commodity
Strategy Fund | | | Managed Futures
Strategy Fund | |
| | Assets: | |
| | Investments in unaffiliated issuers, at value (cost $945,877,152, $0, $75,851,845 and $0)(b) | | $ | 1,055,578,495 | | | $ | — | | | $ | 76,451,945 | | | $ | — | |
| | Investments in affiliated issuers, at value (cost $1,758,798,801, $64,724,963, $207,974,770 and $165,995,774) | | | 1,758,798,801 | | | | 64,724,963 | | | | 208,214,770 | | | | 165,995,774 | |
| | Investments in affiliated securities lending reinvestment vehicle, at value (cost $18,086,061, $0, $0 and $0) | | | 18,086,061 | | | | — | | | | — | | | | — | |
| | Purchased Options, at value (premiums paid $0, $316,270, $0 and $0) | | | — | | | | 203,745 | | | | — | | | | — | |
| | Cash | | | 47,334,543 | | | | 1,357,521 | | | | 18,984,547 | | | | 13,376,426 | |
| | Foreign currencies, at value (cost $8,836,475, $564,606, $0 and $16,195,000) | | | 8,857,898 | | | | 572,758 | | | | — | | | | 16,507,565 | |
| | Receivables: | | | | | | | | | | | | | | | | |
| | Collateral on certain derivative contracts(c) | | | 106,388,590 | | | | 10,658,862 | | | | 8,402,416 | | | | 43,740,721 | |
| | Fund shares sold | | | 6,972,341 | | | | 60,000 | | | | 358,479 | | | | 436,388 | |
| | Dividends and interest | | | 4,184,424 | | | | 120,923 | | | | 538,198 | | | | 312,569 | |
| | Investments sold | | | 3,271,746 | | | | 113,521 | | | | 2,408,109 | | | | — | |
| | Foreign tax reclaims | | | 69,232 | | | | 244,896 | | | | — | | | | — | |
| | Reimbursement from investment adviser | | | 59,349 | | | | 36,624 | | | | 25,142 | | | | 1,125 | |
| | Securities lending income | | | 23,518 | | | | — | | | | — | | | | — | |
| | Due from broker | | | — | | | | 1,208,316 | | | | 13,092,394 | | | | — | |
| | Variation margin on swaps | | | 1,189,313 | | | | 11,374 | | | | — | | | | 35,189 | |
| | Unrealized gain on forward foreign currency exchange contracts | | | 829,122 | | | | 2,025,841 | | | | — | | | | 1,882,103 | |
| | Unrealized gain on swap contracts | | | 812,261 | | | | 819,507 | | | | — | | | | — | |
| | Variation margin on futures | | | 55,760 | | | | — | | | | 42,205 | | | | — | |
| | Other assets | | | 123,834 | | | | 38,975 | | | | 62,513 | | | | 67,433 | |
| | Total assets | | | 3,012,635,288 | | | | 82,197,826 | | | | 328,580,718 | | | | 242,355,293 | |
| | | | | | | | | | | | | | | | | | |
| | Liabilities: | |
| | Written options, at value (premiums received $6,349,405, $1,023,855, $0 and $0) | | | 3,464,107 | | | | 835,150 | | | | — | | | | — | |
| | Unrealized loss on swap contracts | | | 1,571,876 | | | | 543,095 | | | | 68,563 | | | | — | |
| | Unrealized loss on forward foreign currency exchange contracts | | | 1,540,102 | | | | 1,591,793 | | | | — | | | | 3,520,968 | |
| | Variation margin on futures | | | — | | | | 457,591 | | | | — | | | | 1,453,669 | |
| | Variation margin on swaps | | | — | | | | — | | | | 954 | | | | — | |
| | Payables: | | | | | | | | | | | | | | | | |
| | Payable upon return of securities loaned | | | 18,086,061 | | | | — | | | | — | | | | — | |
| | Fund shares redeemed | | | 3,856,548 | | | | 162,429 | | | | 981,385 | | | | 146,347 | |
| | Management fees | | | 1,372,375 | | | | 42,898 | | | | 109,563 | | | | 172,794 | |
| | Collateral on certain derivative contracts(c) | | | 870,000 | | | | 300,000 | | | | 2,670,000 | | | | — | |
| | Distribution and Service fees and Transfer Agency fees | | | 177,839 | | | | 11,836 | | | | 20,778 | | | | 25,238 | |
| | Investments purchased | | | 69,199 | | | | 124,837 | | | | 5,224,503 | | | | 236,661 | |
| | Accrued expenses | | | 389,089 | | | | 284,438 | | | | 264,480 | | | | 244,650 | |
| | Total liabilities | | | 31,397,196 | | | | 4,354,067 | | | | 9,340,226 | | | | 5,800,327 | |
| | | | | | | | | | | | | | | | | | |
| | Net Assets: | |
| | Paid-in capital | | | 2,870,396,479 | | | | 78,596,358 | | | | 330,927,140 | | | | 218,591,916 | |
| | Total distributable earnings (loss) | | | 110,841,613 | | | | (752,599 | ) | | | (11,686,648 | ) | | | 17,963,050 | |
| | | NET ASSETS | | $ | 2,981,238,092 | | | $ | 77,843,759 | | | $ | 319,240,492 | | | $ | 236,554,966 | |
| | | Net Assets: | | | | | | | | | | | | | | | | |
| | | Class A | | $ | 89,021,072 | | | $ | 8,618,651 | | | $ | 25,313,172 | | | $ | 9,310,149 | |
| | | Class C | | | 17,426,743 | | | | 5,751,256 | | | | 2,541,289 | | | | 3,164,386 | |
| | | Institutional | | | 2,374,317,330 | | | | 9,488,517 | | | | 194,398,311 | | | | 64,600,633 | |
| | | Investor | | | 299,767,551 | | | | 8,913,499 | | | | 7,813,888 | | | | 104,574,015 | |
| | | Class P | | | 191,646,067 | | | | 13,350 | | | | 3,559,782 | | | | 273,373 | |
| | | Class R | | | 2,280,893 | | | | 174,152 | | | | 2,346,542 | | | | 567,057 | |
| | | Class R6 | | | 6,778,436 | | | | 44,884,334 | | | | 83,267,508 | | | | 54,065,353 | |
| | | Total Net Assets | | $ | 2,981,238,092 | | | $ | 77,843,759 | | | $ | 319,240,492 | | | $ | 236,554,966 | |
| | | Shares outstanding $0.001 par value (unlimited shares authorized): | | | | | | | | | | | | | | | | |
| | | Class A | | | 9,404,091 | | | | 1,083,513 | | | | 2,340,463 | | | | 884,465 | |
| | | Class C | | | 2,004,896 | | | | 782,062 | | | | 247,502 | | | | 316,857 | |
| | | Institutional | | | 243,101,710 | | | | 1,162,498 | | | | 17,804,941 | | | | 5,976,382 | |
| | | Investor | | | 30,998,413 | | | | 1,102,313 | | | | 714,962 | | | | 9,769,791 | |
| | | Class P | | | 19,632,124 | | | | 1,637 | | | | 325,658 | | | | 25,303 | |
| | | Class R | | | 247,736 | | | | 22,391 | | | | 220,498 | | | | 54,834 | |
| | | Class R6 | | | 694,783 | | | | 5,514,125 | | | | 7,611,501 | | | | 4,999,352 | |
| | | Net asset value, offering and redemption price per share:(d) | | | | | | | | | | | | | | | | |
| | | Class A | | | $9.47 | | | | $7.95 | | | | $10.82 | | | | $10.53 | |
| | | Class C | | | 8.69 | | | | 7.35 | | | | 10.27 | | | | 9.99 | |
| | | Institutional | | | 9.77 | | | | 8.16 | | | | 10.92 | | | | 10.81 | |
| | | Investor | | | 9.67 | | | | 8.09 | | | | 10.93 | | | | 10.70 | |
| | | Class P | | | 9.76 | | | | 8.15 | | | | 10.93 | | | | 10.80 | |
| | | Class R | | | 9.21 | | | | 7.78 | | | | 10.64 | | | | 10.34 | |
| | | Class R6 | | | 9.76 | | | | 8.14 | | | | 10.94 | | | | 10.81 | |
| | (a) | | Statements of Assets and Liabilities for Absolute Return Tracker, Alternative Premia, Commodity Strategy and Managed Futures Strategy Funds are consolidated and include the balances of Cayman Commodity-ART, Ltd., Cayman Commodity-AP, Ltd., Cayman Commodity-CSF, Ltd. and Cayman Commodity-MFS, Ltd. (wholly-owned subsidiaries), respectively. Accordingly, all interfund balances and transactions have been eliminated. |
| | (b) | | Includes loaned securities having a market value of $17,610,378 for the Absolute Return Tracker Fund. |
| | (c) | | Segregated for initial margin and/or collateral on transactions as follows: |
| | | | | | | | | | | | | | | | |
| Fund | | Forwards | | | Futures | | | Options | | | Swaps | |
Absolute Return Tracker | | $ | — | | | $ | 33,154,534 | | | $ | 53,703,385 | | | $ | 18,660,671 | |
Alternative Premia | | | (300,000 | ) | | | 5,552,813 | | | | 4,278,720 | | | | 827,329 | |
Commodity Strategy | | | — | | | | — | | | | — | | | | 5,732,416 | |
Managed Futures Strategy | | | 10,540,000 | | | | 14,900,042 | | | | — | | | | 18,300,679 | |
| | (d) | | Maximum public offering price per share for Class A Shares of the Absolute Return Tracker, Alternative Premia, Commodity Strategy and Managed Futures Strategy Funds is $10.02, $8.41, $11.33 and $11.14, respectively. At redemption, Class C Shares may be subject to a contingent deferred sales charge assessed on the amount equal to the lesser of the current NAV or the original purchase price of the shares. |
| | |
| 76 | | The accompanying notes are an integral part of these financial statements. |
GOLDMAN SACHS ALTERNATIVE FUNDS
Consolidated Statements of Operations(a)
For the Six Months Ended June 30, 2019 (Unaudited)
| | | | | | | | | | | | | | | | | | |
| | | | | Absolute Return
Tracker Fund | | | Alternative
Premia Fund | | | Commodity
Strategy Fund | | | Managed Futures
Strategy Fund | |
| | Investment income: | | | | | | | | | | | | | | | | |
| | | | | |
| | Dividends — affiliated issuers | | $ | 20,920,412 | | | $ | 861,001 | | | $ | 2,556,773 | | | $ | 2,024,677 | |
| | | | | |
| | Dividends — unaffiliated issuers (net of foreign taxes withheld of $230,208, $0, $0 and $0) | | | 9,584,350 | | | | 42,789 | | | | — | | | | — | |
| | | | | |
| | Securities lending income — affiliated issuer | | | 117,290 | | | | — | | | | — | | | | — | |
| | | | | |
| | Interest | | | — | | | | — | | | | 1,035,066 | | | | 26,801 | |
| | Total investment income | | | 30,622,052 | | | | 903,790 | | | | 3,591,839 | | | | 2,051,478 | |
| | | | | | | | | | | | | | | | | | |
| | Expenses: | | | | | | | | | | | | | | | | |
| | | | | |
| | Management fees | | | 9,140,486 | | | | 360,953 | | | | 870,206 | | | | 1,157,080 | |
| | | | | |
| | Transfer Agency fees(b) | | | 820,589 | | | | 33,654 | | | | 85,313 | | | | 123,083 | |
| | | | | |
| | Distribution and Service fees(b) | | | 198,583 | | | | 48,695 | | | | 53,320 | | | | 27,536 | |
| | | | | |
| | Custody, accounting and administrative services | | | 192,841 | | | | 73,468 | | | | 69,678 | | | | 52,690 | |
| | | | | |
| | Registration fees | | | 128,178 | | | | 58,883 | | | | 58,308 | | | | 58,641 | |
| | | | | |
| | Printing and mailing costs | | | 116,711 | | | | 19,738 | | | | 63,064 | | | | 34,782 | |
| | | | | |
| | Professional fees | | | 78,728 | | | | 105,689 | | | | 73,886 | | | | 76,132 | |
| | | | | |
| | Trustee fees | | | 10,272 | | | | 8,017 | | | | 8,262 | | | | 8,157 | |
| | | | | |
| | Other | | | 27,176 | | | | 7,261 | | | | 10,655 | | | | 8,642 | |
| | Total expenses | | | 10,713,564 | | | | 716,358 | | | | 1,292,692 | | | | 1,546,743 | |
| | Less — expense reductions | | | (1,887,126 | ) | | | (296,744 | ) | | | (373,606 | ) | | | (167,953 | ) |
| | Net expenses | | | 8,826,438 | | | | 419,614 | | | | 919,086 | | | | 1,378,790 | |
| | NET INVESTMENT INCOME | | | 21,795,614 | | | | 484,176 | | | | 2,672,753 | | | | 672,688 | |
| | | | | | | | | | | | | | | | | | |
| | Realized and unrealized gain (loss): | | | | | | | | | | | | | | | | |
| | | | | |
| | Net realized gain (loss) from: | | | | | | | | | | | | | | | | |
| | | | | |
| | Investments — unaffiliated issuers | | | (6,951,794 | ) | | | — | | | | 424,406 | | | | — | |
| | | | | |
| | Futures contracts | | | 12,829,321 | | | | (509,599 | ) | | | (2,690,940 | ) | | | (9,924,603 | ) |
| | | | | |
| | Purchased options | | | — | | | | (928,918 | ) | | | (12,174 | ) | | | — | |
| | | | | |
| | Swap contracts | | | 6,208,205 | | | | (2,109,923 | ) | | | 36,521,051 | | | | 13,325,580 | |
| | | | | |
| | Forward foreign currency exchange contracts | | | (1,521,062 | ) | | | 1,051,403 | | | | — | | | | (140,887 | ) |
| | | | | |
| | Foreign currency transactions | | | 1,851,016 | | | | 138,270 | | | | — | | | | 259,557 | |
| | | | | |
| | Written options | | | 8,781,913 | | | | 540,990 | | | | — | | | | — | |
| | | | | |
| | Net change in unrealized gain (loss) on: | | | | | | | | | | | | | | | | |
| | | | | |
| | Investments — unaffiliated issuers | | | 141,772,573 | | | | — | | | | 2,123,308 | | | | — | |
| | | | | |
| | Investments — affiliated issuers | | | — | | | | — | | | | 232,500 | | | | — | |
| | | | | |
| | Futures contracts | | | (1,241,136 | ) | | | 1,130,243 | | | | 700,709 | | | | (1,637,344 | ) |
| | | | | |
| | Purchased options | | | — | | | | (232,586 | ) | | | — | | | | — | |
| | | | | |
| | Swap contracts | | | 7,569,047 | | | | 230,767 | | | | (66,953 | ) | | | 10,273,935 | |
| | | | | |
| | Forward foreign currency exchange contracts | | | 107,486 | | | | 812,465 | | | | — | | | | (1,949,320 | ) |
| | | | | |
| | Foreign currency translation | | | (370,732 | ) | | | (18,063 | ) | | | — | | | | (234,418 | ) |
| | | | | |
| | Written options | | | 6,867,927 | | | | 815,746 | | | | — | | | | — | |
| | Net realized and unrealized gain | | | 175,902,764 | | | | 920,795 | | | | 37,231,907 | | | | 9,972,500 | |
| | | | | |
| | NET INCREASE IN NET ASSETS RESULTING FROM OPERATIONS | | $ | 197,698,378 | | | $ | 1,404,971 | | | $ | 39,904,660 | | | $ | 10,645,188 | |
| | (a) | | Statements of Operations for Absolute Return Tracker, Alternative Premia, Commodity Strategy and Managed Futures Strategy Funds are consolidated and include the balances of Cayman Commodity-ART, Ltd., Cayman Commodity-AP, Ltd., Cayman Commodity-CSF, Ltd. and Cayman Commodity-MFS, Ltd.(wholly-owned subsidiaries), respectively. Accordingly, all interfund balances and transactions have been eliminated. |
| | (b) | | Class specific Distribution and/or Service, and Transfer Agency fees were as follows: |
| | | | | | | | | | | | | | | | | | | | | | | | | | | | | | | | | | | | | | | | |
| | | Distribution and/or Service Fees | | | Transfer Agency Fees | |
Fund | | Class A | | | Class C | | | Class R | | | Class A | | | Class C | | | Institutional | | | Investor | | | Class P | | | Class R | | | Class R6 | |
Absolute Return Tracker | | $ | 97,545 | | | $ | 95,678 | | | $ | 5,360 | | | $ | 70,232 | | | $ | 17,222 | | | $ | 454,177 | | | $ | 249,335 | | | $ | 26,721 | | | $ | 1,930 | | | $ | 972 | |
Alternative Premia | | | 10,867 | | | | 37,521 | | | | 307 | | | | 7,824 | | | | 6,754 | | | | 3,312 | | | | 8,266 | | | | 2 | | | | 111 | | | | 7,385 | |
Commodity Strategy | | | 33,652 | | | | 13,532 | | | | 6,136 | | | | 17,499 | | | | 1,759 | | | | 45,051 | | | | 7,653 | | | | 530 | | | | 1,596 | | | | 11,225 | |
Managed Futures Strategy | | | 10,911 | | | | 15,187 | | | | 1,438 | | | | 7,855 | | | | 2,734 | | | | 12,949 | | | | 91,092 | | | | 62 | | | | 518 | | | | 7,873 | |
| | |
| The accompanying notes are an integral part of these financial statements. | | 77 |
GOLDMAN SACHS ALTERNATIVE FUNDS
Consolidated Statements of Changes in Net Assets(a)
| | | | | | | | | | | | | | | | | | | | | | |
| | | | | Absolute Return Tracker Fund | | | | | | Alternative Premia Fund | |
| | | | | For the
Six Months Ended
June 30, 2019
(Unaudited) | | | For the Fiscal
Year Ended
December 31, 2018 | | | | | | For the
Six Months Ended
June 30, 2019
(Unaudited) | | | For the Fiscal
Year Ended
December 31, 2018 | |
| | From operations: | | | | | | | | | | | | | |
| | Net investment income | | $ | 21,795,614 | | | $ | 25,409,863 | | | | | | | $ | 484,176 | | | $ | 664,878 | |
| | Net realized gain (loss) | | | 21,197,599 | | | | (12,106,374 | ) | | | | | | | (1,817,777 | ) | | | (8,127,438 | ) |
| | Net change in unrealized gain (loss) | | | 154,705,165 | | | | (96,453,469 | ) | | | | | | | 2,738,572 | | | | (749,479 | ) |
| | | | | | |
| | Net increase (decrease) in net assets resulting from operations | | | 197,698,378 | | | | (83,149,980 | ) | | | | | | | 1,404,971 | | | | (8,212,039 | ) |
| | | | | | | | | | | | | | | | | | | | | | |
| | Distributions to shareholders: | | | | | | | | | | | | | |
| | From distributable earnings: | | | | | | | | | | | | | | | | | | | | |
| | Class A Shares | | | — | | | | (1,511,937 | ) | | | | | | | — | | | | (478,739 | ) |
| | Class C Shares | | | — | | | | (365,221 | ) | | | | | | | — | | | | (503,059 | ) |
| | Institutional Shares | | | — | | | | (57,165,461 | ) | | | | | | | — | | | | (601,357 | ) |
| | Investor Shares | | | — | | | | (6,496,428 | ) | | | | | | | — | | | | (488,889 | ) |
| | Class P Shares(b) | | | — | | | | (4,257,351 | ) | | | | | | | — | | | | (685 | ) |
| | Class R Shares | | | — | | | | (44,609 | ) | | | | | | | — | | | | (677 | ) |
| | Class R6 Shares | | | — | | | | (164,520 | ) | | | | | | | — | | | | (2,753,859 | ) |
| | | | | | |
| | Total distributions to shareholders | | | — | | | | (70,005,527 | ) | | | | | | | — | | | | (4,827,265 | ) |
| | | | | | | | | | | | | | | | | | | | | | |
| | From share transactions: | | | | | | | | | | | | | |
| | Proceeds from sales of shares | | | 880,746,530 | | | | 2,260,230,175 | | | | | | | | 6,950,195 | | | | 151,588,154 | |
| | Reinvestment of distributions | | | — | | | | 54,104,738 | | | | | | | | — | | | | 4,797,057 | |
| | Cost of shares redeemed | | | (726,338,130 | ) | | | (1,206,677,070 | ) | | | | | | | (40,464,629 | ) | | | (189,468,347 | ) |
| | | | | | |
| | Net increase (decrease) in net assets resulting from share transactions | | | 154,408,400 | | | | 1,107,657,843 | | | | | | | | (33,514,434 | ) | | | (33,083,136 | ) |
| | | | | | |
| | TOTAL INCREASE (DECREASE) | | | 352,106,778 | | | | 954,502,336 | | | | | | | | (32,109,463 | ) | | | (46,122,440 | ) |
| | | | | | | | | | | | | | | | | | | | | | |
| | Net Assets: | | | | | | | | | | | | | |
| | Beginning of period | | | 2,629,131,314 | | | | 1,674,628,978 | | | | | | | | 109,953,222 | | | | 156,075,662 | |
| | End of period | | $ | 2,981,238,092 | | | $ | 2,629,131,314 | | | | | | | $ | 77,843,759 | | | $ | 109,953,222 | |
| | (a) | | Statements of Changes in Net Assets for the Absolute Return Tracker and Alternative Premia Funds are consolidated and include the balances of Cayman Commodity-ART, Ltd. and Cayman Commodity-AP, Ltd. (wholly-owned subsidiaries), respectively. Accordingly, all interfund balances and transactions have been eliminated. |
| | (b) | | Commenced operations on April 17, 2018. |
| | |
| 78 | | The accompanying notes are an integral part of these financial statements. |
GOLDMAN SACHS ALTERNATIVE FUNDS
Consolidated Statements of Changes in Net Assets(a)(continued)
| | | | | | | | | | | | | | | | | | | | | | |
| | | | | Commodity Strategy Fund | | | | | | Managed Futures Strategy Fund | |
| | | | | For the
Six Months Ended
June 30, 2019
(Unaudited) | | | For the Fiscal
Year Ended
December 31, 2018 | | | | | | For the
Six Months Ended
June 30, 2019
(Unaudited) | | | For the Fiscal
Year Ended
December 31, 2018 | |
| | From operations: | | | | | | | | | | | | | |
| | Net investment income | | $ | 2,672,753 | | | $ | 4,659,489 | | | | | | | $ | 672,688 | | | $ | 293,847 | |
| | Net realized gain (loss) | | | 34,242,343 | | | | (60,883,660 | ) | | | | | | | 3,519,647 | | | | (2,406,572 | ) |
| | Net change in unrealized gain (loss) | | | 2,989,564 | | | | (2,958,090 | ) | | | | | | | 6,452,853 | | | | (4,658,647 | ) |
| | | | | | |
| | Net increase (decrease) in net assets resulting from operations | | | 39,904,660 | | | | (59,182,261 | ) | | | | | | | 10,645,188 | | | | (6,771,372 | ) |
| | | | | | | | | | | | | | | | | | | | | | |
| | Distributions to shareholders: | | | | | | | | | | | | | |
| | From distributable earnings: | | | | | | | | | | | | | | | | | | | | |
| | Class A Shares | | | (146,965 | ) | | | (304,997 | ) | | | | | | | — | | | | (11,658 | ) |
| | Class C Shares | | | (6,266 | ) | | | (5,522 | ) | | | | | | | — | | | | (5,457 | ) |
| | Institutional Shares | | | (1,436,282 | ) | | | (3,852,136 | ) | | | | | | | — | | | | (120,745 | ) |
| | Investor Shares | | | (52,109 | ) | | | (103,250 | ) | | | | | | | — | | | | (159,539 | ) |
| | Class P Shares(b) | | | (26,429 | ) | | | (66,814 | ) | | | | | | | — | | | | (662 | ) |
| | Class R Shares | | | (11,381 | ) | | | (17,262 | ) | | | | | | | — | | | | (935 | ) |
| | Class R6 Shares(c) | | | (619,063 | ) | | | (15,225 | ) | | | | | | | — | | | | (83,342 | ) |
| | | | | | |
| | Total distributions to shareholders | | | (2,298,495 | ) | | | (4,365,206 | ) | | | | | | | — | | | | (382,338 | ) |
| | | | | | | | | | | | | | | | | | | | | | |
| | From share transactions: | | | | | | | | | | | | | |
| | Proceeds from sales of shares | | | 148,407,199 | | | | 199,564,222 | | | | | | | | 58,840,905 | | | | 184,855,172 | |
| | Reinvestment of distributions | | | 1,732,849 | | | | 3,162,715 | | | | | | | | — | | | | 381,904 | |
| | Cost of shares redeemed | | | (169,421,903 | ) | | | (214,478,490 | ) | | | | | | | (85,314,604 | ) | | | (207,886,873 | ) |
| | | | | | |
| | Net decrease in net assets resulting from share transactions | | | (19,281,855 | ) | | | (11,751,553 | ) | | | | | | | (26,473,699 | ) | | | (22,649,797 | ) |
| | | | | | |
| | TOTAL INCREASE (DECREASE) | | | 18,324,310 | | | | (75,299,020 | ) | | | | | | | (15,828,511 | ) | | | (29,803,507 | ) |
| | | | | | | | | | | | | | | | | | | | | | |
| | Net Assets: | |
| | Beginning of period | | | 300,916,182 | | | | 376,215,202 | | | | | | | | 252,383,477 | | | | 282,186,984 | |
| | | | | | |
| | End of period | �� | $ | 319,240,492 | | | $ | 300,916,182 | | | | | | | $ | 236,554,966 | | | $ | 252,383,477 | |
| | (a) | | Statements of Changes in Net Assets for the Commodity Strategy and Managed Futures Strategy Funds are consolidated and include the balances of Cayman Commodity-CSF, Ltd. and Cayman Commodity-MFS, Ltd. (wholly-owned subsidiaries), respectively. Accordingly, all interfund balances and transactions have been eliminated. |
| | (b) | | Commenced operations on April 17, 2018. |
| | (c) | | Commenced operations on April 30, 2018 for Managed Futures Strategy Fund. |
| | |
| The accompanying notes are an integral part of these financial statements. | | 79 |
GOLDMAN SACHS ABSOLUTE RETURN TRACKER FUND
Consolidated Financial Highlights
Selected Data for a Share Outstanding Throughout Each Period
| | | | | | | | | | | | | | | | | | | | | | | | | | |
| | | | | Goldman Sachs Absolute Return Tracker Fund | |
| | | | | Class A Shares | |
| | | | | Six Months Ended
June 30, 2019
(Unaudited) | | | Year Ended December 31, | |
| | | | | 2018 | | | 2017 | | | 2016 | | | 2015 | | | 2014 | |
| | Per Share Data | | | | | | | | | | | | | | | | | | | | | | | | |
| | | | | | | |
| | Net asset value, beginning of period | | $ | 8.84 | | | $ | 9.31 | | | $ | 9.02 | | | $ | 8.67 | | | $ | 9.01 | | | $ | 9.12 | |
| | | | | | | |
| | Net investment income (loss)(a) | | | 0.05 | | | | 0.07 | | | | — | (b) | | | (0.04 | ) | | | (0.07 | ) | | | (0.09 | ) |
| | | | | | | |
| | Net realized and unrealized gain (loss) | | | 0.58 | | | | (0.33 | ) | | | 0.62 | | | | 0.43 | | | | (0.15 | ) | | | 0.33 | |
| | | | | | | |
| | Total from investment operations | | | 0.63 | | | | (0.26 | ) | | | 0.62 | | | | 0.39 | | | | (0.22 | ) | | | 0.24 | |
| | | | | | | |
| | Distributions to shareholders from net investment income | | | — | | | | (0.07 | ) | | | — | | | | — | | | | (0.02 | ) | | | — | |
| | | | | | | |
| | Distributions to shareholders from net realized gains | | | — | | | | (0.14 | ) | | | (0.33 | ) | | | (0.04 | ) | | | (0.10 | ) | | | (0.35 | ) |
| | | | | | | |
| | Total distributions | | | — | | | | (0.21 | ) | | | (0.33 | ) | | | (0.04 | ) | | | (0.12 | ) | | | (0.35 | ) |
| | | | | | | |
| | Net asset value, end of period | | $ | 9.47 | | | $ | 8.84 | | | $ | 9.31 | | | $ | 9.02 | | | $ | 8.67 | | | $ | 9.01 | |
| | | | | | | |
| | Total return(c) | | | 7.13 | % | | | (2.80 | )% | | | 6.93 | % | | | 4.45 | % | | | (2.45 | )% | | | 2.61 | % |
| | | | | | | |
| | Net assets, end of period (in 000s) | | $ | 89,021 | | | $ | 65,635 | | | $ | 52,427 | | | $ | 38,886 | | | $ | 45,207 | | | $ | 64,120 | |
| | | | | | | |
| | Ratio of net expenses to average net assets | | | 0.98 | %(d) | | | 1.00 | % | | | 1.03 | % | | | 1.03 | % | | | 1.04 | % | | | 1.05 | % |
| | | | | | | |
| | Ratio of total expenses to average net assets | | | 1.11 | %(d) | | | 1.26 | % | | | 1.61 | % | | | 1.66 | % | | | 1.60 | % | | | 1.59 | % |
| | | | | | | |
| | Ratio of net investment income (loss) to average net assets | | | 1.18 | %(d) | | | 0.73 | % | | | (0.04 | )% | | | (0.43 | )% | | | (0.74 | )% | | | (0.96 | )% |
| | | | | | | |
| | Portfolio turnover rate(e) | | | 66 | % | | | 137 | % | | | 76 | % | | | 130 | % | | | 213 | % | | | 134 | % |
| | (a) | | Calculated based on the average shares outstanding methodology. |
| | (b) | | Amount is less than $0.005 per share. |
| | (c) | | Assumes investment at the net asset value at the beginning of the period, reinvestment of all distributions, a complete redemption of the investment at the net asset value at the end of the period and no sales or redemption charges (if any). Total returns would be reduced if a sales or redemption charge was taken into account. Returns do not reflect the impact of taxes to shareholders relating to Fund distributions or the redemption of Fund shares. Total returns for periods less than one full year are not annualized. |
| | (e) | | The Fund’s portfolio turnover rate is calculated in accordance with regulatory requirements, without regard to transactions involving short term investments and certain derivatives. If such transactions were included, the Fund’s portfolio turnover rate may be higher. |
| | |
| 80 | | The accompanying notes are an integral part of these financial statements. |
GOLDMAN SACHS ABSOLUTE RETURN TRACKER FUND
Consolidated Financial Highlights(continued)
Selected Data for a Share Outstanding Throughout Each Period
| | | | | | | | | | | | | | | | | | | | | | | | | | |
| | | | | Goldman Sachs Absolute Return Tracker Fund | |
| | | | | Class C Shares | |
| | | | | Six Months Ended
June 30, 2019
(Unaudited) | | | Year Ended December 31, | |
| | | | | 2018 | | | 2017 | | | 2016 | | | 2015 | | | 2014 | |
| | Per Share Data | |
| | | | | | | |
| | Net asset value, beginning of period | | $ | 8.14 | | | $ | 8.61 | | | $ | 8.43 | | | $ | 8.17 | | | $ | 8.54 | | | $ | 8.72 | |
| | | | | | | |
| | Net investment income (loss)(a) | | | 0.02 | | | | — | (b) | | | (0.07 | ) | | | (0.10 | ) | | | (0.13 | ) | | | (0.15 | ) |
| | | | | | | |
| | Net realized and unrealized gain (loss) | | | 0.53 | | | | (0.31 | ) | | | 0.58 | | | | 0.40 | | | | (0.14 | ) | | | 0.32 | |
| | | | | | | |
| | Total from investment operations | | | 0.55 | | | | (0.31 | ) | | | 0.51 | | | | 0.30 | | | | (0.27 | ) | | | 0.17 | |
| | | | | | | |
| | Distributions to shareholders from net investment income | | | — | | | | (0.02 | ) | | | — | | | | — | | | | — | | | | — | |
| | | | | | | |
| | Distributions to shareholders from net realized gains | | | — | | | | (0.14 | ) | | | (0.33 | ) | | | (0.04 | ) | | | (0.10 | ) | | | (0.35 | ) |
| | | | | | | |
| | Total distributions | | | — | | | | (0.16 | ) | | | (0.33 | ) | | | (0.04 | ) | | | (0.10 | ) | | | (0.35 | ) |
| | | | | | | |
| | Net asset value, end of period | | $ | 8.69 | | | $ | 8.14 | | | $ | 8.61 | | | $ | 8.43 | | | $ | 8.17 | | | $ | 8.54 | |
| | | | | | | |
| | Total return(c) | | | 6.76 | % | | | (3.60 | )% | | | 6.10 | % | | | 3.62 | % | | | (3.20 | )% | | | 1.92 | % |
| | | | | | | |
| | Net assets, end of period (in 000s) | | $ | 17,427 | | | $ | 18,985 | | | $ | 13,718 | | | $ | 13,490 | | | $ | 18,329 | | | $ | 28,736 | |
| | | | | | | |
| | Ratio of net expenses to average net assets | | | 1.73 | %(d) | | | 1.75 | % | | | 1.78 | % | | | 1.78 | % | | | 1.79 | % | | | 1.80 | % |
| | | | | | | |
| | Ratio of total expenses to average net assets | | | 1.86 | %(d) | | | 2.00 | % | | | 2.36 | % | | | 2.41 | % | | | 2.35 | % | | | 2.34 | % |
| | | | | | | |
| | Ratio of net investment income (loss) to average net assets | | | 0.42 | %(d) | | | — | %(e) | | | (0.81 | )% | | | (1.18 | )% | | | (1.51 | )% | | | (1.69 | )% |
| | | | | | | |
| | Portfolio turnover rate(f) | | | 66 | % | | | 137 | % | | | 76 | % | | | 130 | % | | | 213 | % | | | 134 | % |
| | (a) | | Calculated based on the average shares outstanding methodology. |
| | (b) | | Amount is less than $0.005 per share. |
| | (c) | | Assumes investment at the net asset value at the beginning of the period, reinvestment of all distributions, a complete redemption of the investment at the net asset value at the end of the period and no sales or redemption charges (if any). Total returns would be reduced if a sales or redemption charge was taken into account. Returns do not reflect the impact of taxes to shareholders relating to Fund distributions or the redemption of Fund shares. Total returns for periods less than one full year are not annualized. |
| | (e) | | Amount is less than 0.005%. |
| | (f) | | The Fund’s portfolio turnover rate is calculated in accordance with regulatory requirements, without regard to transactions involving short term investments and certain derivatives. If such transactions were included, the Fund’s portfolio turnover rate may be higher. |
| | |
| The accompanying notes are an integral part of these financial statements. | | 81 |
GOLDMAN SACHS ABSOLUTE RETURN TRACKER FUND
Consolidated Financial Highlights(continued)
Selected Data for a Share Outstanding Throughout Each Period
| | | | | | | | | | | | | | | | | | | | | | | | | | |
| | | | | Goldman Sachs Absolute Return Tracker Fund | |
| | | | | Institutional Shares | |
| | | | | Six Months Ended
June 30, 2019
(Unaudited) | | | Year Ended December 31, | |
| | | | | 2018 | | | 2017 | | | 2016 | | | 2015 | | | 2014 | |
| | Per Share Data | |
| | | | | | | |
| | Net asset value, beginning of period | | $ | 9.10 | | | $ | 9.58 | | | $ | 9.23 | | | $ | 8.86 | | | $ | 9.22 | | | $ | 9.32 | |
| | | | | | | |
| | Net investment income (loss)(a) | | | 0.07 | | | | 0.11 | | | | 0.03 | | | | — | (b) | | | (0.03 | ) | | | (0.05 | ) |
| | | | | | | |
| | Net realized and unrealized gain (loss) | | | 0.60 | | | | (0.35 | ) | | | 0.65 | | | | 0.43 | | | | (0.17 | ) | | | 0.34 | |
| | | | | | | |
| | Total from investment operations | | | 0.67 | | | | (0.24 | ) | | | 0.68 | | | | 0.43 | | | | (0.20 | ) | | | 0.29 | |
| | | | | | | |
| | Distributions to shareholders from net investment income | | | — | | | | (0.10 | ) | | | — | (b) | | | (0.02 | ) | | | (0.06 | ) | | | (0.04 | ) |
| | | | | | | |
| | Distributions to shareholders from net realized gains | | | — | | | | (0.14 | ) | | | (0.33 | ) | | | (0.04 | ) | | | (0.10 | ) | | | (0.35 | ) |
| | | | | | | |
| | Total distributions | | | — | | | | (0.24 | ) | | | (0.33 | ) | | | (0.06 | ) | | | (0.16 | ) | | | (0.39 | ) |
| | | | | | | |
| | Net asset value, end of period | | $ | 9.77 | | | $ | 9.10 | | | $ | 9.58 | | | $ | 9.23 | | | $ | 8.86 | | | $ | 9.22 | |
| | | | | | | |
| | Total return(c) | | | 7.36 | % | | | (2.47 | )% | | | 7.46 | % | | | 4.82 | % | | | (2.18 | )% | | | 3.09 | % |
| | | | | | | |
| | Net assets, end of period (in 000s) | | $ | 2,374,315 | | | $ | 2,129,116 | | | $ | 1,510,457 | | | $ | 970,838 | | | $ | 1,111,353 | | | $ | 1,874,703 | |
| | | | | | | |
| | Ratio of net expenses to average net assets | | | 0.59 | %(d) | | | 0.61 | % | | | 0.64 | % | | | 0.62 | % | | | 0.64 | % | | | 0.65 | % |
| | | | | | | |
| | Ratio of total expenses to average net assets | | | 0.72 | %(d) | | | 0.88 | % | | | 1.21 | % | | | 1.24 | % | | | 1.20 | % | | | 1.19 | % |
| | | | | | | |
| | Ratio of net investment income (loss) to average net assets | | | 1.52 | %(d) | | | 1.13 | % | | | 0.36 | % | | | (0.02 | )% | | | (0.36 | )% | | | (0.54 | )% |
| | | | | | | |
| | Portfolio turnover rate(e) | | | 66 | % | | | 137 | % | | | 76 | % | | | 130 | % | | | 213 | % | | | 134 | % |
| | (a) | | Calculated based on the average shares outstanding methodology. |
| | (b) | | Amount is less than $0.005 per share. |
| | (c) | | Assumes investment at the net asset value at the beginning of the period, reinvestment of all distributions, a complete redemption of the investment at the net asset value at the end of the period and no sales or redemption charges (if any). Total returns would be reduced if a sales or redemption charge was taken into account. Returns do not reflect the impact of taxes to shareholders relating to Fund distributions or the redemption of Fund shares. Total returns for periods less than one full year are not annualized. |
| | (e) | | The Fund’s portfolio turnover rate is calculated in accordance with regulatory requirements, without regard to transactions involving short term investments and certain derivatives. If such transactions were included, the Fund’s portfolio turnover rate may be higher. |
| | |
| 82 | | The accompanying notes are an integral part of these financial statements. |
GOLDMAN SACHS ABSOLUTE RETURN TRACKER FUND
Consolidated Financial Highlights(continued)
Selected Data for a Share Outstanding Throughout Each Period
| | | | | | | | | | | | | | | | | | | | | | | | | | |
| | | | | Goldman Sachs Absolute Return Tracker Fund | |
| | | | | Investor Shares(a) | |
| | | | | Six Months Ended
June 30, 2019
(Unaudited) | | | Year Ended December 31, | |
| | | | | 2018 | | | 2017 | | | 2016 | | | 2015 | | | 2014 | |
| | Per Share Data | | | | | | | | | | | | | | | | | | | | | | | | |
| | | | | | | |
| | Net asset value, beginning of period | | $ | 9.02 | | | $ | 9.50 | | | $ | 9.17 | | | $ | 8.80 | | | $ | 9.15 | | | $ | 9.24 | |
| | | | | | | |
| | Net investment income (loss)(b) | | | 0.08 | | | | 0.10 | | | | 0.03 | | | | (0.01 | ) | | | (0.04 | ) | | | (0.07 | ) |
| | | | | | | |
| | Net realized and unrealized gain (loss) | | | 0.57 | | | | (0.35 | ) | | | 0.63 | | | | 0.43 | | | | (0.16 | ) | | | 0.34 | |
| | | | | | | |
| | Total from investment operations | | | 0.65 | | | | (0.25 | ) | | | 0.66 | | | | 0.42 | | | | (0.20 | ) | | | 0.27 | |
| | | | | | | |
| | Distributions to shareholders from net investment income | | | — | | | | (0.09 | ) | | | — | | | | (0.01 | ) | | | (0.05 | ) | | | (0.01 | ) |
| | | | | | | |
| | Distributions to shareholders from net realized gains | | | — | | | | (0.14 | ) | | | (0.33 | ) | | | (0.04 | ) | | | (0.10 | ) | | | (0.35 | ) |
| | | | | | | |
| | Total distributions | | | — | | | | (0.23 | ) | | | (0.33 | ) | | | (0.05 | ) | | | (0.15 | ) | | | (0.36 | ) |
| | | | | | | |
| | Net asset value, end of period | | $ | 9.67 | | | $ | 9.02 | | | $ | 9.50 | | | $ | 9.17 | | | $ | 8.80 | | | $ | 9.15 | |
| | | | | | | |
| | Total return(c) | | | 7.21 | % | | | (2.58 | )% | | | 7.25 | % | | | 4.75 | % | | | (2.23 | )% | | | 2.85 | % |
| | | | | | | |
| | Net assets, end of period (in 000s) | | $ | 299,767 | | | $ | 254,436 | | | $ | 93,650 | | | $ | 13,245 | | | $ | 6,755 | | | $ | 8,046 | |
| | | | | | | |
| | Ratio of net expenses to average net assets | | | 0.73 | %(d) | | | 0.75 | % | | | 0.78 | % | | | 0.78 | % | | | 0.79 | % | | | 0.81 | % |
| | | | | | | |
| | Ratio of total expenses to average net assets | | | 0.86 | %(d) | | | 0.98 | % | | | 1.35 | % | | | 1.42 | % | | | 1.35 | % | | | 1.34 | % |
| | | | | | | |
| | Ratio of net investment income (loss) to average net assets | | | 1.81 | %(d) | | | 1.08 | % | | | 0.28 | % | | | (0.13 | )% | | | (0.49 | )% | | | (0.73 | )% |
| | | | | | | |
| | Portfolio turnover rate(e) | | | 66 | % | | | 137 | % | | | 76 | % | | | 130 | % | | | 213 | % | | | 134 | % |
| | (a) | | Effective August 15, 2017, Class IR changed its name to Investor Shares. |
| | (b) | | Calculated based on the average shares outstanding methodology. |
| | (c) | | Assumes investment at the net asset value at the beginning of the period, reinvestment of all distributions, a complete redemption of the investment at the net asset value at the end of the period and no sales or redemption charges (if any). Total returns would be reduced if a sales or redemption charge was taken into account. Returns do not reflect the impact of taxes to shareholders relating to Fund distributions or the redemption of Fund shares. Total returns for periods less than one full year are not annualized. |
| | (e) | | The Fund’s portfolio turnover rate is calculated in accordance with regulatory requirements, without regard to transactions involving short term investments and certain derivatives. If such transactions were included, the Fund’s portfolio turnover rate may be higher. |
| | |
| The accompanying notes are an integral part of these financial statements. | | 83 |
GOLDMAN SACHS ABSOLUTE RETURN TRACKER FUND
Consolidated Financial Highlights(continued)
Selected Data for a Share Outstanding Throughout Each Period
| | | | | | | | | | |
| | | | | Goldman Sachs Absolute Return Tracker Fund | |
| | | | | Class P Shares | |
| | | | | Six Months Ended
June 30, 2019
(Unaudited) | | | April 17, 2018* to December 31, 2018 | |
| | Per Share Data | |
| | | |
| | Net asset value, beginning of period | | $ | 9.09 | | | $ | 9.64 | |
| | | |
| | Net investment income(a) | | | 0.07 | | | | 0.10 | |
| | | |
| | Net realized and unrealized gain (loss) | | | 0.60 | | | | (0.41 | ) |
| | | |
| | Total from investment operations | | | 0.67 | | | | (0.31 | ) |
| | | |
| | Distributions to shareholders from net investment income | | | — | | | | (0.10 | ) |
| | | |
| | Distributions to shareholders from net realized gains | | | — | | | | (0.14 | ) |
| | | |
| | Total distributions | | | — | | | | (0.24 | ) |
| | | |
| | Net asset value, end of period | | $ | 9.76 | | | $ | 9.09 | |
| | | |
| | Total return(b) | | | 7.37 | % | | | (3.17 | )% |
| | | |
| | Net assets, end of period (in 000s) | | $ | 191,646 | | | $ | 152,975 | |
| | | |
| | Ratio of net expenses to average net assets | | | 0.58 | %(c) | | | 0.59 | %(c) |
| | | |
| | Ratio of total expenses to average net assets | | | 0.71 | %(c) | | | 0.74 | %(c) |
| | | |
| | Ratio of net investment income to average net assets | | | 1.58 | %(c) | | | 1.41 | %(c) |
| | | |
| | Portfolio turnover rate(d) | | | 66 | % | | | 137 | % |
| | * | | Commencement of operations. |
| | (a) | | Calculated based on the average shares outstanding methodology. |
| | (b) | | Assumes investment at the net asset value at the beginning of the period, reinvestment of all distributions, a complete redemption of the investment at the net asset value at the end of the period and no sales or redemption charges (if any). Total returns would be reduced if a sales or redemption charge was taken into account. Returns do not reflect the impact of taxes to shareholders relating to Fund distributions or the redemption of Fund shares. Total returns for periods less than one full year are not annualized. |
| | (d) | | The Fund’s portfolio turnover rate is calculated in accordance with regulatory requirements, without regard to transactions involving short term investments and certain derivatives. If such transactions were included, the Fund’s portfolio turnover rate may be higher. |
| | |
| 84 | | The accompanying notes are an integral part of these financial statements. |
GOLDMAN SACHS ABSOLUTE RETURN TRACKER FUND
Consolidated Financial Highlights(continued)
Selected Data for a Share Outstanding Throughout Each Period
| | | | | | | | | | | | | | | | | | | | | | | | | | |
| | | | | Goldman Sachs Absolute Return Tracker Fund | |
| | | | | Class R Shares | |
| | | | | Six Months Ended
June 30, 2019
(Unaudited) | | | Year Ended December 31, | |
| | | | | 2018 | | | 2017 | | | 2016 | | | 2015 | | | 2014 | |
| | Per Share Data | |
| | | | | | | |
| | Net asset value, beginning of period | | $ | 8.61 | | | $ | 9.08 | | | $ | 8.82 | | | $ | 8.50 | | | $ | 8.85 | | | $ | 8.98 | |
| | | | | | | |
| | Net investment income (loss)(a) | | | 0.04 | | | | 0.04 | | | | (0.03 | ) | | | (0.06 | ) | | | (0.09 | ) | | | (0.11 | ) |
| | | | | | | |
| | Net realized and unrealized gain (loss) | | | 0.56 | | | | (0.33 | ) | | | 0.62 | | | | 0.42 | | | | (0.15 | ) | | | 0.33 | |
| | | | | | | |
| | Total from investment operations | | | 0.60 | | | | (0.29 | ) | | | 0.59 | | | | 0.36 | | | | (0.24 | ) | | | 0.22 | |
| | | | | | | |
| | Distributions to shareholders from net investment income | | | — | | | | (0.04 | ) | | | — | | | | — | | | | (0.01 | ) | | | — | |
| | | | | | | |
| | Distributions to shareholders from net realized gains | | | — | | | | (0.14 | ) | | | (0.33 | ) | | | (0.04 | ) | | | (0.10 | ) | | | (0.35 | ) |
| | | | | | | |
| | Total distributions | | | — | | | | (0.18 | ) | | | (0.33 | ) | | | (0.04 | ) | | | (0.11 | ) | | | (0.35 | ) |
| | | | | | | |
| | Net asset value, end of period | | $ | 9.21 | | | $ | 8.61 | | | $ | 9.08 | | | $ | 8.82 | | | $ | 8.50 | | | $ | 8.85 | |
| | | | | | | |
| | Total return(b) | | | 6.97 | % | | | (3.13 | )% | | | 6.74 | % | | | 4.19 | % | | | (2.71 | )% | | | 2.42 | % |
| | | | | | | |
| | Net assets, end of period (in 000s) | | $ | 2,281 | | | $ | 1,954 | | | $ | 2,150 | | | $ | 2,197 | | | $ | 2,019 | | | $ | 2,299 | |
| | | | | | | |
| | Ratio of net expenses to average net assets | | | 1.23 | %(c) | | | 1.25 | % | | | 1.28 | % | | | 1.28 | % | | | 1.29 | % | | | 1.30 | % |
| | | | | | | |
| | Ratio of total expenses to average net assets | | | 1.36 | %(c) | | | 1.53 | % | | | 1.86 | % | | | 1.91 | % | | | 1.85 | % | | | 1.84 | % |
| | | | | | | |
| | Ratio of net investment income (loss) to average net assets | | | 0.93 | %(c) | | | 0.45 | % | | | (0.31 | )% | | | (0.66 | )% | | | (0.97 | )% | | | (1.19 | )% |
| | | | | | | |
| | Portfolio turnover rate(d) | | | 66 | % | | | 137 | % | | | 76 | % | | | 130 | % | | | 213 | % | | | 134 | % |
| | (a) | | Calculated based on the average shares outstanding methodology. |
| | (b) | | Assumes investment at the net asset value at the beginning of the period, reinvestment of all distributions, a complete redemption of the investment at the net asset value at the end of the period and no sales or redemption charges (if any). Total returns would be reduced if a sales or redemption charge was taken into account. Returns do not reflect the impact of taxes to shareholders relating to Fund distributions or the redemption of Fund shares. Total returns for periods less than one full year are not annualized. |
| | (d) | | The Fund’s portfolio turnover rate is calculated in accordance with regulatory requirements, without regard to transactions involving short term investments and certain derivatives. If such transactions were included, the Fund’s portfolio turnover rate may be higher. |
| | |
| The accompanying notes are an integral part of these financial statements. | | 85 |
GOLDMAN SACHS ABSOLUTE RETURN TRACKER FUND
Consolidated Financial Highlights(continued)
Selected Data for a Share Outstanding Throughout Each Period
| | | | | | | | | | | | | | | | | | | | | | |
| | | | | Goldman Sachs Absolute Return Tracker Fund | |
| | | | | Class R6 Shares | |
| | | | | Six Months Ended
June 30, 2019
(Unaudited) | | | Year Ended December 31, | | | For the Period
July 31, 2015* to December 31, 2015 | |
| | | | | 2018 | | | 2017 | | | 2016 | |
| | Per Share Data | |
| | | | | | |
| | Net asset value, beginning of period | | $ | 9.09 | | | $ | 9.57 | | | $ | 9.23 | | | $ | 8.86 | | | $ | 9.30 | |
| | | | | | |
| | Net investment income (loss)(a) | | | 0.07 | | | | 0.12 | | | | 0.04 | | | | — | (b) | | | (0.01 | ) |
| | | | | | |
| | Net realized and unrealized gain (loss) | | | 0.60 | | | | (0.36 | ) | | | 0.63 | | | | 0.43 | | | | (0.26 | ) |
| | | | | | |
| | Total from investment operations | | | 0.67 | | | | (0.24 | ) | | | 0.67 | | | | 0.43 | | | | (0.27 | ) |
| | | | | | |
| | Distributions to shareholders from net investment income | | | — | | | | (0.10 | ) | | | — | (b) | | | (0.02 | ) | | | (0.07 | ) |
| | | | | | |
| | Distributions to shareholders from net realized gains | | | — | | | | (0.14 | ) | | | (0.33 | ) | | | (0.04 | ) | | | (0.10 | ) |
| | | | | | |
| | Total distributions | | | — | | | | (0.24 | ) | | | (0.33 | ) | | | (0.06 | ) | | | (0.17 | ) |
| | | | | | |
| | Net asset value, end of period | | $ | 9.76 | | | $ | 9.09 | | | $ | 9.57 | | | $ | 9.23 | | | $ | 8.86 | |
| | | | | | |
| | Total return(c) | | | 7.37 | % | | | (2.46 | )% | | | 7.36 | % | | | 4.85 | % | | | (2.98 | )% |
| | | | | | |
| | Net assets, end of period (in 000s) | | $ | 6,778 | | | $ | 6,030 | | | $ | 2,226 | | | $ | 27 | | | $ | 10 | |
| | | | | | |
| | Ratio of net expenses to average net assets | | | 0.58 | %(d) | | | 0.60 | % | | | 0.62 | % | | | 0.64 | % | | | 0.64 | %(d) |
| | | | | | |
| | Ratio of total expenses to average net assets | | | 0.71 | %(d) | | | 0.84 | % | | | 1.19 | % | | | 1.24 | % | | | 1.21 | %(d) |
| | | | | | |
| | Ratio of net investment income (loss) to average net assets | | | 1.58 | %(d) | | | 1.20 | % | | | 0.39 | % | | | 0.01 | % | | | (0.22 | )%(d) |
| | | | | | |
| | Portfolio turnover rate(e) | | | 66 | % | | | 137 | % | | | 76 | % | | | 130 | % | | | 213 | % |
| | * | | Commencement of operations. |
| | (a) | | Calculated based on the average shares outstanding methodology. |
| | (b) | | Amount is less than $0.005 per share. |
| | (c) | | Assumes investment at the net asset value at the beginning of the period, reinvestment of all distributions, a complete redemption of the investment at the net asset value at the end of the period and no sales or redemption charges (if any). Total returns would be reduced if a sales or redemption charge was taken into account. Returns do not reflect the impact of taxes to shareholders relating to Fund distributions or the redemption of Fund shares. Total returns for periods less than one full year are not annualized. |
| | (e) | | The Fund’s portfolio turnover rate is calculated in accordance with regulatory requirements, without regard to transactions involving short term investments and certain derivatives. If such transactions were included, the Fund’s portfolio turnover rate may be higher. |
| | |
| 86 | | The accompanying notes are an integral part of these financial statements. |
GOLDMAN SACHS ALTERNATIVE PREMIA FUND
Consolidated Financial Highlights(continued)
Selected Data for a Share Outstanding Throughout Each Period
| | | | | | | | | | | | | | | | | | | | | | | | | | |
| | | | | Goldman Sachs Alternative Premia Fund | |
| | | | | Class A Shares | |
| | | | | Six Months Ended
June 30, 2019
(Unaudited) | | | Year Ended December 31, | |
| | | | | 2018 | | | 2017 | | | 2016 | | | 2015 | | | 2014 | |
| | Per Share Data | |
| | | | | | | |
| | Net asset value, beginning of period | | $ | 7.92 | | | $ | 8.91 | | | $ | 10.01 | | | $ | 9.45 | | | $ | 10.49 | | | $ | 10.89 | |
| | | | | | | |
| | Net investment income (loss)(a) | | | 0.03 | | | | 0.03 | | | | (0.01 | ) | | | (0.01 | ) | | | (0.04 | ) | | | (0.08 | ) |
| | | | | | | |
| | Net realized and unrealized gain (loss) | | | — | | | | (0.58 | ) | | | 1.40 | | | | 0.57 | | | | (0.71 | ) | | | 0.32 | |
| | | | | | | |
| | Total from investment operations | | | 0.03 | | | | (0.55 | ) | | | 1.39 | | | | 0.56 | | | | (0.75 | ) | | | 0.24 | |
| | | | | | | |
| | Distributions to shareholders from net investment income | | | — | | | | — | | | | (0.17 | ) | | | — | | | | (0.01 | ) | | | (0.05 | ) |
| | | | | | | |
| | Distributions to shareholders from net realized gains | | | — | | | | (0.44 | ) | | | (2.32 | ) | | | — | | | | (0.28 | ) | | | (0.59 | ) |
| | | | | | | |
| | Total distributions | | | — | | | | (0.44 | ) | | | (2.49 | ) | | | — | | | | (0.29 | ) | | | (0.64 | ) |
| | | | | | | |
| | Net asset value, end of period | | $ | 7.95 | | | $ | 7.92 | | | $ | 8.91 | | | $ | 10.01 | | | $ | 9.45 | | | $ | 10.49 | |
| | | | | | | |
| | Total return(b) | | | 0.38 | % | | | (6.18 | )% | | | 14.17 | % | | | 5.91 | % | | | (7.17 | )% | | | 2.19 | % |
| | | | | | | |
| | Net assets, end of period (in 000s) | | $ | 8,619 | | | $ | 9,166 | | | $ | 13,886 | | | $ | 27,566 | | | $ | 43,167 | | | $ | 78,100 | |
| | | | | | | |
| | Ratio of net expenses to average net assets | | | 1.16 | %(c) | | | 1.13 | % | | | 1.12 | % | | | 1.15 | % | | | 1.13 | % | | | 1.23 | % |
| | | | | | | |
| | Ratio of total expenses to average net assets | | | 1.83 | %(c) | | | 1.64 | % | | | 1.51 | % | | | 1.45 | % | | | 1.43 | % | | | 1.42 | % |
| | | | | | | |
| | Ratio of net investment income (loss) to average net assets | | | 0.81 | %(c) | | | 0.34 | % | | | (0.10 | )% | | | (0.13 | )% | | | (0.39 | )% | | | (0.70 | )% |
| | | | | | | |
| | Portfolio turnover rate(d) | | | — | % | | | — | % | | | 349 | % | | | 272 | % | | | 241 | % | | | 211 | % |
| | (a) | | Calculated based on the average shares outstanding methodology. |
| | (b) | | Assumes investment at the net asset value at the beginning of the period, reinvestment of all distributions, a complete redemption of the investment at the net asset value at the end of the period and no sales or redemption charges (if any). Total returns would be reduced if a sales or redemption charge was taken into account. Returns do not reflect the impact of taxes to shareholders relating to Fund distributions or the redemption of Fund shares. Total returns for periods less than one full year are not annualized. |
| | (d) | | The Fund’s portfolio turnover rate is calculated in accordance with regulatory requirements, without regard to transactions involving short term investments and certain derivatives. If such transactions were included, the Fund’s portfolio turnover rate may be higher. |
| | |
| The accompanying notes are an integral part of these financial statements. | | 87 |
GOLDMAN SACHS ALTERNATIVE PREMIA FUND
Consolidated Financial Highlights(continued)
Selected Data for a Share Outstanding Throughout Each Period
| | | | | | | | | | | | | | | | | | | | | | | | | | |
| | | | | Goldman Sachs Alternative Premia Fund | |
| | | | | Class C Shares | |
| | | | | Six Months Ended
June 30, 2019
(Unaudited) | | | Year Ended December 31, | |
| | | | | 2018 | | | 2017 | | | 2016 | | | 2015 | | | 2014 | |
| | Per Share Data | |
| | | | | | | |
| | Net asset value, beginning of period | | $ | 7.35 | | | $ | 8.36 | | | $ | 9.55 | | | $ | 9.08 | | | $ | 10.15 | | | $ | 10.60 | |
| | | | | | | |
| | Net investment income (loss)(a) | | | — | (b) | | | (0.03 | ) | | | (0.08 | ) | | | (0.08 | ) | | | (0.11 | ) | | | (0.15 | ) |
| | | | | | | |
| | Net realized and unrealized gain (loss) | | | — | | | | (0.54 | ) | | | 1.32 | | | | 0.55 | | | | (0.68 | ) | | | 0.29 | |
| | | | | | | |
| | Total from investment operations | | | — | (b) | | | (0.57 | ) | | | 1.24 | | | | 0.47 | | | | (0.79 | ) | | | 0.14 | |
| | | | | | | |
| | Distributions to shareholders from net investment income | | | — | | | | — | | | | (0.11 | ) | | | — | | | | — | | | | — | |
| | | | | | | |
| | Distributions to shareholders from net realized gains | | | — | | | | (0.44 | ) | | | (2.32 | ) | | | — | | | | (0.28 | ) | | | (0.59 | ) |
| | | | | | | |
| | Total distributions | | | — | | | | (0.44 | ) | | | (2.43 | ) | | | — | | | | (0.28 | ) | | | (0.59 | ) |
| | | | | | | |
| | Net asset value, end of period | | $ | 7.35 | | | $ | 7.35 | | | $ | 8.36 | | | $ | 9.55 | | | $ | 9.08 | | | $ | 10.15 | |
| | | | | | | |
| | Total return(c) | | | 0.00 | % | | | (6.93 | )% | | | 13.37 | % | | | 5.16 | % | | | (7.82 | )% | | | 1.29 | % |
| | | | | | | |
| | Net assets, end of period (in 000s) | | $ | 5,751 | | | $ | 8,547 | | | $ | 15,239 | | | $ | 20,123 | | | $ | 27,914 | | | $ | 41,299 | |
| | | | | | | |
| | Ratio of net expenses to average net assets | | | 1.92 | %(d) | | | 1.88 | % | | | 1.87 | % | | | 1.90 | % | | | 1.88 | % | | | 1.97 | % |
| | | | | | | |
| | Ratio of total expenses to average net assets | | | 2.57 | %(d) | | | 2.39 | % | | | 2.27 | % | | | 2.20 | % | | | 2.18 | % | | | 2.17 | % |
| | | | | | | |
| | Ratio of net investment income (loss) to average net assets | | | 0.05 | %(d) | | | (0.41 | )% | | | (0.84 | )% | | | (0.88 | )% | | | (1.14 | )% | | | (1.42 | )% |
| | | | | | | |
| | Portfolio turnover rate(e) | | | — | % | | | — | % | | | 349 | % | | | 272 | % | | | 241 | % | | | 211 | % |
| | (a) | | Calculated based on the average shares outstanding methodology. |
| | (b) | | Amount is less than $0.005 per share. |
| | (c) | | Assumes investment at the net asset value at the beginning of the period, reinvestment of all distributions, a complete redemption of the investment at the net asset value at the end of the period and no sales or redemption charges (if any). Total returns would be reduced if a sales or redemption charge was taken into account. Returns do not reflect the impact of taxes to shareholders relating to Fund distributions or the redemption of Fund shares. Total returns for periods less than one full year are not annualized. |
| | (e) | | The Fund’s portfolio turnover rate is calculated in accordance with regulatory requirements, without regard to transactions involving short term investments and certain derivatives. If such transactions were included, the Fund’s portfolio turnover rate may be higher. |
| | |
| 88 | | The accompanying notes are an integral part of these financial statements. |
GOLDMAN SACHS ALTERNATIVE PREMIA FUND
Consolidated Financial Highlights(continued)
Selected Data for a Share Outstanding Throughout Each Period
| | | | | | | | | | | | | | | | | | | | | | | | | | |
| | | | | Goldman Sachs Alternative Premia Fund | |
| | | | | Institutional Shares | |
| | | | | Six Months Ended
June 30, 2019
(Unaudited) | | | Year Ended December 31, | |
| | | | | 2018 | | | 2017 | | | 2016 | | | 2015 | | | 2014 | |
| | Per Share Data | | | | | | | | | | | | | | | | | | | | | | | | |
| | | | | | | |
| | Net asset value, beginning of period | | $ | 8.11 | | | $ | 9.07 | | | $ | 10.15 | | | $ | 9.54 | | | $ | 10.61 | | | $ | 11.02 | |
| | | | | | | |
| | Net investment income (loss)(a) | | | 0.05 | | | | 0.05 | | | | 0.04 | | | | 0.03 | | | | — | (b) | | | (0.03 | ) |
| | | | | | | |
| | Net realized and unrealized gain (loss) | | | — | | | | (0.57 | ) | | | 1.41 | | | | 0.58 | | | | (0.72 | ) | | | 0.32 | |
| | | | | | | |
| | Total from investment operations | | | 0.05 | | | | (0.52 | ) | | | 1.45 | | | | 0.61 | | | | (0.72 | ) | | | 0.29 | |
| | | | | | | |
| | Distributions to shareholders from net investment income | | | — | | | | — | | | | (0.21 | ) | | | — | | | | (0.07 | ) | | | (0.11 | ) |
| | | | | | | |
| | Distributions to shareholders from net realized gains | | | — | | | | (0.44 | ) | | | (2.32 | ) | | | — | | | | (0.28 | ) | | | (0.59 | ) |
| | | | | | | |
| | Total distributions | | | — | | | | (0.44 | ) | | | (2.53 | ) | | | — | | | | (0.35 | ) | | | (0.70 | ) |
| | | | | | | |
| | Net asset value, end of period | | $ | 8.16 | | | $ | 8.11 | | | $ | 9.07 | | | $ | 10.15 | | | $ | 9.54 | | | $ | 10.61 | |
| | | | | | | |
| | Total return(c) | | | 0.62 | % | | | (5.74 | )% | | | 14.59 | % | | | 6.38 | % | | | (6.84 | )% | | | 2.61 | % |
| | | | | | | |
| | Net assets, end of period (in 000s) | | $ | 9,489 | | | $ | 32,924 | | | $ | 114,953 | | | $ | 468,924 | | | $ | 510,789 | | | $ | 645,286 | |
| | | | | | | |
| | Ratio of net expenses to average net assets | | | 0.79 | %(d) | | | 0.73 | % | | | 0.73 | % | | | 0.75 | % | | | 0.73 | % | | | 0.81 | % |
| | | | | | | |
| | Ratio of total expenses to average net assets | | | 1.39 | %(d) | | | 1.27 | % | | | 1.09 | % | | | 1.05 | % | | | 1.03 | % | | | 1.02 | % |
| | | | | | | |
| | Ratio of net investment income (loss) to average net assets | | | 1.22 | %(d) | | | 0.52 | % | | | 0.36 | % | | | 0.27 | % | | | — | %(e) | | | (0.25 | )% |
| | | | | | | |
| | Portfolio turnover rate(f) | | | — | % | | | — | % | | | 349 | % | | | 272 | % | | | 241 | % | | | 211 | % |
| | (a) | | Calculated based on the average shares outstanding methodology. |
| | (b) | | Amount is less than $0.005 per share. |
| | (c) | | Assumes investment at the net asset value at the beginning of the period, reinvestment of all distributions, a complete redemption of the investment at the net asset value at the end of the period and no sales or redemption charges (if any). Total returns would be reduced if a sales or redemption charge was taken into account. Returns do not reflect the impact of taxes to shareholders relating to Fund distributions or the redemption of Fund shares. Total returns for periods less than one full year are not annualized. |
| | (e) | | Amount is less than 0.005%. |
| | (f) | | The Fund’s portfolio turnover rate is calculated in accordance with regulatory requirements, without regard to transactions involving short term investments and certain derivatives. If such transactions were included, the Fund’s portfolio turnover rate may be higher. |
| | |
| The accompanying notes are an integral part of these financial statements. | | 89 |
GOLDMAN SACHS ALTERNATIVE PREMIA FUND
Consolidated Financial Highlights(continued)
Selected Data for a Share Outstanding Throughout Each Period
| | | | | | | | | | | | | | | | | | | | | | | | | | |
| | | | | Goldman Sachs Alternative Premia Fund | |
| | | | | Investor Shares(a) | |
| | | | | Six Months Ended
June 30, 2019
(Unaudited) | | | Year Ended December 31, | |
| | | | | 2018 | | | 2017 | | | 2016 | | | 2015 | | | 2014 | |
| | Per Share Data | |
| | | | | | | |
| | Net asset value, beginning of period | | $ | 8.04 | | | $ | 9.02 | | | $ | 10.11 | | | $ | 9.52 | | | $ | 10.57 | | | $ | 10.99 | |
| | | | | | | |
| | Net investment income (loss)(b) | | | 0.04 | | | | 0.05 | | | | 0.02 | | | | 0.01 | | | | (0.01 | ) | | | (0.05 | ) |
| | | | | | | |
| | Net realized and unrealized gain (loss) | | | 0.01 | | | | (0.59 | ) | | | 1.41 | | | | 0.58 | | | | (0.72 | ) | | | 0.31 | |
| | | | | | | |
| | Total from investment operations | | | 0.05 | | | | (0.54 | ) | | | 1.43 | | | | 0.59 | | | | (0.73 | ) | | | 0.26 | |
| | | | | | | |
| | Distributions to shareholders from net investment income | | | — | | | | — | | | | (0.20 | ) | | | — | | | | (0.04 | ) | | | (0.09 | ) |
| | | | | | | |
| | Distributions to shareholders from net realized gains | | | — | | | | (0.44 | ) | | | (2.32 | ) | | | — | | | | (0.28 | ) | | | (0.59 | ) |
| | | | | | | |
| | Total distributions | | | — | | | | (0.44 | ) | | | (2.52 | ) | | | — | | | | (0.32 | ) | | | (0.68 | ) |
| | | | | | | |
| | Net asset value, end of period | | $ | 8.09 | | | $ | 8.04 | | | $ | 9.02 | | | $ | 10.11 | | | $ | 9.52 | | | $ | 10.57 | |
| | | | | | | |
| | Total return(c) | | | 0.62 | % | | | (5.99 | )% | | | 14.47 | % | | | 6.18 | % | | | (6.90 | )% | | | 2.33 | % |
| | | | | | | |
| | Net assets, end of period (in 000s) | | $ | 8,913 | | | $ | 9,092 | | | $ | 8,910 | | | $ | 5,733 | | | $ | 9,933 | | | $ | 26,862 | |
| | | | | | | |
| | Ratio of net expenses to average net assets | | | 0.91 | %(d) | | | 0.88 | % | | | 0.86 | % | | | 0.90 | % | | | 0.88 | % | | | 0.97 | % |
| | | | | | | |
| | Ratio of total expenses to average net assets | | | 1.58 | %(d) | | | 1.39 | % | | | 1.28 | % | | | 1.20 | % | | | 1.18 | % | | | 1.17 | % |
| | | | | | | |
| | Ratio of net investment income (loss) to average net assets | | | 1.06 | %(d) | | | 0.61 | % | | | 0.20 | % | | | 0.10 | % | | | (0.14 | )% | | | (0.43 | )% |
| | | | | | | |
| | Portfolio turnover rate(e) | | | — | % | | | — | % | | | 349 | % | | | 272 | % | | | 241 | % | | | 211 | % |
| | (a) | | Effective August 15, 2017, Class IR changed its name to Investor Shares. |
| | (b) | | Calculated based on the average shares outstanding methodology. |
| | (c) | | Assumes investment at the net asset value at the beginning of the period, reinvestment of all distributions, a complete redemption of the investment at the net asset value at the end of the period and no sales or redemption charges (if any). Total returns would be reduced if a sales or redemption charge was taken into account. Returns do not reflect the impact of taxes to shareholders relating to Fund distributions or the redemption of Fund shares. Total returns for periods less than one full year are not annualized. |
| | (e) | | The Fund’s portfolio turnover rate is calculated in accordance with regulatory requirements, without regard to transactions involving short term investments and certain derivatives. If such transactions were included, the Fund’s portfolio turnover rate may be higher. |
| | |
| 90 | | The accompanying notes are an integral part of these financial statements. |
GOLDMAN SACHS ALTERNATIVE PREMIA FUND
Consolidated Financial Highlights(continued)
Selected Data for a Share Outstanding Throughout Each Period
| | | | | | | | | | |
| | | | | Goldman Sachs Alternative Premia Fund | |
| | | | | Class P Shares | |
| | | | | Six Months Ended
June 30, 2019
(Unaudited) | | | April 17, 2018* to December 31, 2018 | |
| | Per Share Data | |
| | | |
| | Net asset value, beginning of period | | $ | 8.10 | | | $ | 8.85 | |
| | | |
| | Net investment income(a) | | | 0.05 | | | | 0.05 | |
| | | |
| | Net realized and unrealized loss | | | — | | | | (0.36 | ) |
| | | |
| | Total from investment operations | | | 0.05 | | | | (0.31 | ) |
| | | |
| | Distributions to shareholders from net realized gains | | | — | | | | (0.44 | ) |
| | | |
| | Net asset value, end of period | | $ | 8.15 | | | $ | 8.10 | |
| | | |
| | Total return(b) | | | 0.62 | % | | | (3.51 | )% |
| | | |
| | Net assets, end of period (in 000s) | | $ | 13 | | | $ | 13 | |
| | | |
| | Ratio of net expenses to average net assets | | | 0.76 | %(c) | | | 0.77 | %(c) |
| | | |
| | Ratio of total expenses to average net assets | | | 1.42 | %(c) | | | 1.36 | %(c) |
| | | |
| | Ratio of net investment income to average net assets | | | 1.21 | %(c) | | | 0.83 | %(c) |
| | | |
| | Portfolio turnover rate(d) | | | — | % | | | — | % |
| | * | | Commencement of operations. |
| | (a) | | Calculated based on the average shares outstanding methodology. |
| | (b) | | Assumes investment at the net asset value at the beginning of the period, reinvestment of all distributions, a complete redemption of the investment at the net asset value at the end of the period and no sales or redemption charges (if any). Total returns would be reduced if a sales or redemption charge was taken into account. Returns do not reflect the impact of taxes to shareholders relating to Fund distributions or the redemption of Fund shares. Total returns for periods less than one full year are not annualized. |
| | (d) | | The Fund’s portfolio turnover rate is calculated in accordance with regulatory requirements, without regard to transactions involving short term investments and certain derivatives. If such transactions were included, the Fund’s portfolio turnover rate may be higher. |
| | |
| The accompanying notes are an integral part of these financial statements. | | 91 |
GOLDMAN SACHS ALTERNATIVE PREMIA FUND
Consolidated Financial Highlights(continued)
Selected Data for a Share Outstanding Throughout Each Period
| | | | | | | | | | | | | | | | | | | | | | | | | | |
| | | | | Goldman Sachs Alternative Premia Fund | |
| | | | | Class R Shares | |
| | | | | Six Months Ended
June 30, 2019
(Unaudited) | | | Year Ended December 31, | |
| | | | | 2018 | | | 2017 | | | 2016 | | | 2015 | | | 2014 | |
| | Per Share Data | |
| | | | | | | |
| | Net asset value, beginning of period | | $ | 7.75 | | | $ | 8.75 | | | $ | 9.89 | | | $ | 9.36 | | | $ | 10.40 | | | $ | 10.83 | |
| | | | | | | |
| | Net investment income (loss)(a) | | | 0.02 | | | | 0.01 | | | | (0.03 | ) | | | (0.04 | ) | | | (0.05 | ) | | | (0.10 | ) |
| | | | | | | |
| | Net realized and unrealized gain (loss) | | | 0.01 | | | | (0.57 | ) | | | 1.37 | | | | 0.57 | | | | (0.71 | ) | | | 0.30 | |
| | | | | | | |
| | Total from investment operations | | | 0.03 | | | | (0.56 | ) | | | 1.34 | | | | 0.53 | | | | (0.76 | ) | | | 0.20 | |
| | | | | | | |
| | Distributions to shareholders from net investment income | | | — | | | | — | | | | (0.16 | ) | | | — | | | | — | | | | (0.04 | ) |
| | | | | | | |
| | Distributions to shareholders from net realized gains | | | — | | | | (0.44 | ) | | | (2.32 | ) | | | — | | | | (0.28 | ) | | | (0.59 | ) |
| | | | | | | |
| | Total distributions | | | — | | | | (0.44 | ) | | | (2.48 | ) | | | — | | | | (0.28 | ) | | | (0.63 | ) |
| | | | | | | |
| | Net asset value, end of period | | $ | 7.78 | | | $ | 7.75 | | | $ | 8.75 | | | $ | 9.89 | | | $ | 9.36 | | | $ | 10.40 | |
| | | | | | | |
| | Total return(b) | | | 0.39 | % | | | (6.40 | )% | | | 13.89 | % | | | 5.65 | % | | | (7.35 | )% | | | 1.85 | % |
| | | | | | | |
| | Net assets, end of period (in 000s) | | $ | 174 | | | $ | 13 | | | $ | 13 | | | $ | 12 | | | $ | 11 | | | $ | 12 | |
| | | | | | | |
| | Ratio of net expenses to average net assets | | | 1.40 | %(c) | | | 1.38 | % | | | 1.36 | % | | | 1.40 | % | | | 1.33 | % | | | 1.49 | % |
| | | | | | | |
| | Ratio of total expenses to average net assets | | | 2.11 | %(c) | | | 1.88 | % | | | 1.77 | % | | | 1.71 | % | | | 1.65 | % | | | 1.62 | % |
| | | | | | | |
| | Ratio of net investment income (loss) to average net assets | | | 0.54 | %(c) | | | 0.11 | % | | | (0.33 | )% | | | (0.39 | )% | | | (0.49 | )% | | | (0.92 | )% |
| | | | | | | |
| | Portfolio turnover rate(d) | | | — | % | | | — | % | | | 349 | % | | | 272 | % | | | 241 | % | | | 211 | % |
| | (a) | | Calculated based on the average shares outstanding methodology. |
| | (b) | | Assumes investment at the net asset value at the beginning of the period, reinvestment of all distributions, a complete redemption of the investment at the net asset value at the end of the period and no sales or redemption charges (if any). Total returns would be reduced if a sales or redemption charge was taken into account. Returns do not reflect the impact of taxes to shareholders relating to Fund distributions or the redemption of Fund shares. Total returns for periods less than one full year are not annualized. |
| | (d) | | The Fund’s portfolio turnover rate is calculated in accordance with regulatory requirements, without regard to transactions involving short term investments and certain derivatives. If such transactions were included, the Fund’s portfolio turnover rate may be higher. |
| | |
| 92 | | The accompanying notes are an integral part of these financial statements. |
GOLDMAN SACHS ALTERNATIVE PREMIA FUND
Consolidated Financial Highlights(continued)
Selected Data for a Share Outstanding Throughout Each Period
| | | | | | | | | | | | | | | | | | | | | | |
| | | | | Goldman Sachs Alternative Premia Fund | |
| | | | | Class R6 Shares | |
| | | | | Six Months Ended
June 30, 2019
(Unaudited) | | | Year Ended December 31, | | | For the Period
July 31, 2015* to December 31, 2015 | |
| | | | | 2018 | | | 2017 | | | 2016 | |
| | Per Share Data | |
| | | | | | |
| | Net asset value, beginning of period | | $ | 8.09 | | | $ | 9.05 | | | $ | 10.15 | | | $ | 9.54 | | | $ | 10.46 | |
| | | | | | |
| | Net investment income (loss)(a) | | | 0.05 | | | | 0.07 | | | | 0.02 | | | | 0.02 | | | | (0.01 | ) |
| | | | | | |
| | Net realized and unrealized gain (loss) | | | — | | | | (0.59 | ) | | | 1.42 | | | | 0.59 | | | | (0.56 | ) |
| | | | | | |
| | Total from investment operations | | | 0.05 | | | | (0.52 | ) | | | 1.44 | | | | 0.61 | | | | (0.57 | ) |
| | | | | | |
| | Distributions to shareholders from net investment income | | | — | | | | — | | | | (0.22 | ) | | | — | | | | (0.07 | ) |
| | | | | | |
| | Distributions to shareholders from net realized gains | | | — | | | | (0.44 | ) | | | (2.32 | ) | | | — | | | | (0.28 | ) |
| | | | | | |
| | Total distributions | | | — | | | | (0.44 | ) | | | (2.54 | ) | | | — | | | | (0.35 | ) |
| | | | | | |
| | Net asset value, end of period | | $ | 8.14 | | | $ | 8.09 | | | $ | 9.05 | | | $ | 10.15 | | | $ | 9.54 | |
| | | | | | |
| | Total return(b) | | | 0.62 | % | | | (5.75 | )% | | | 14.48 | % | | | 6.38 | % | | | (5.48 | )% |
| | | | | | |
| | Net assets, end of period (in 000s) | | $ | 44,884 | | | $ | 50,199 | | | $ | 3,074 | | | $ | 10 | | | $ | 9 | |
| | | | | | |
| | Ratio of net expenses to average net assets | | | 0.77 | %(c) | | | 0.72 | % | | | 0.72 | % | | | 0.77 | % | | | 0.77 | %(c) |
| | | | | | |
| | Ratio of total expenses to average net assets | | | 1.43 | %(c) | | | 1.24 | % | | | 1.27 | % | | | 1.02 | % | | | 0.97 | %(c) |
| | | | | | |
| | Ratio of net investment income (loss) to average net assets | | | 1.21 | %(c) | | | 0.82 | % | | | 0.22 | % | | | 0.24 | % | | | (0.21 | )%(c) |
| | | | | | |
| | Portfolio turnover rate(d) | | | — | % | | | — | % | | | 349 | % | | | 272 | % | | | 241 | % |
| | * | | Commencement of operations. |
| | (a) | | Calculated based on the average shares outstanding methodology. |
| | (b) | | Assumes investment at the net asset value at the beginning of the period, reinvestment of all distributions, a complete redemption of the investment at the net asset value at the end of the period and no sales or redemption charges (if any). Total returns would be reduced if a sales or redemption charge was taken into account. Returns do not reflect the impact of taxes to shareholders relating to Fund distributions or the redemption of Fund shares. Total returns for periods less than one full year are not annualized. |
| | (d) | | The Fund’s portfolio turnover rate is calculated in accordance with regulatory requirements, without regard to transactions involving short term investments and certain derivatives. If such transactions were included, the Fund’s portfolio turnover rate may be higher. |
| | |
| The accompanying notes are an integral part of these financial statements. | | 93 |
GOLDMAN SACHS COMMODITY STRATEGY FUND
Consolidated Financial Highlights(continued)
Selected Data for a Share Outstanding Throughout Each Period
| | | | | | | | | | | | | | | | | | | | | | | | | | |
| | | | | Goldman Sachs Commodity Strategy Fund | |
| | | | | Class A Shares | |
| | | | | Six Months Ended
June 30, 2019
(Unaudited) | | | Year Ended December 31, | |
| | | | | 2018 | | | 2017 | | | 2016 | | | 2015 | | | 2014 | |
| | Per Share Data | | | | | | | | | | | | | | | | | | | | | | | | |
| | | | | | | |
| | Net asset value, beginning of period | | $ | 9.66 | | | $ | 11.49 | | | $ | 11.68 | | | $ | 10.49 | | | $ | 15.58 | | | $ | 22.54 | |
| | | | | | | |
| | Net investment income (loss)(a) | | | 0.07 | | | | 0.10 | | | | 0.02 | | | | 0.02 | | | | (0.03 | ) | | | (0.13 | ) |
| | | | | | | |
| | Net realized and unrealized gain (loss) | | | 1.15 | | | | (1.84 | ) | | | 0.43 | | | | 1.23 | | | | (5.04 | ) | | | (6.83 | ) |
| | | | | | | |
| | Total from investment operations | | | 1.22 | | | | (1.74 | ) | | | 0.45 | | | | 1.25 | | | | (5.07 | ) | | | (6.96 | ) |
| | | | | | | |
| | Distributions to shareholders from net investment income | | | (0.06 | ) | | | (0.09 | ) | | | (0.52 | ) | | | (0.06 | ) | | | (0.02 | ) | | | — | |
| | | | | | | |
| | Distributions to shareholders from return of capital | | | — | | | | — | | | | (0.12 | ) | | | — | | | | — | | | | — | |
| | | | | | | |
| | Total distributions | | | (0.06 | ) | | | (0.09 | ) | | | (0.64 | ) | | | (0.06 | ) | | | (0.02 | ) | | | — | |
| | | | | | | |
| | Net asset value, end of period | | $ | 10.82 | | | $ | 9.66 | | | $ | 11.49 | | | $ | 11.68 | | | $ | 10.49 | | | $ | 15.58 | |
| | | | | | | |
| | Total return(b) | | | 12.76 | % | | | (15.17 | )% | | | 3.95 | % | | | 11.91 | % | | | (32.43 | )% | | | (31.03 | )% |
| | | | | | | |
| | Net assets, end of period (in 000s) | | $ | 25,313 | | | $ | 25,351 | | | $ | 46,809 | | | $ | 60,944 | | | $ | 58,901 | | | $ | 85,200 | |
| | | | | | | |
| | Ratio of net expenses to average net assets | | | 0.83 | %(c) | | | 0.84 | % | | | 0.86 | % | | | 0.90 | % | | | 0.85 | % | | | 0.88 | % |
| | | | | | | |
| | Ratio of total expenses to average net assets | | | 1.04 | %(c) | | | 1.01 | % | | | 1.01 | % | | | 1.07 | % | | | 0.97 | % | | | 0.95 | % |
| | | | | | | |
| | Ratio of net investment income (loss) to average net assets | | | 1.23 | %(c) | | | 0.88 | % | | | 0.16 | % | | | 0.19 | % | | | (0.21 | )% | | | (0.59 | )% |
| | | | | | | |
| | Portfolio turnover rate(d) | | | 28 | % | | | 46 | % | | | 89 | % | | | 145 | % | | | 506 | % | | | 234 | % |
| | (a) | | Calculated based on the average shares outstanding methodology. |
| | (b) | | Assumes investment at the net asset value at the beginning of the period, reinvestment of all distributions, a complete redemption of the investment at the net asset value at the end of the period and no sales or redemption charges (if any). Total returns would be reduced if a sales or redemption charge was taken into account. Returns do not reflect the impact of taxes to shareholders relating to Fund distributions or the redemption of Fund shares. Total returns for periods less than one full year are not annualized. |
| | (d) | | The Fund’s portfolio turnover rate is calculated in accordance with regulatory requirements, without regard to transactions involving short term investments and certain derivatives. If such transactions were included, the Fund’s portfolio turnover rate may be higher. |
| | |
| 94 | | The accompanying notes are an integral part of these financial statements. |
GOLDMAN SACHS COMMODITY STRATEGY FUND
Consolidated Financial Highlights(continued)
Selected Data for a Share Outstanding Throughout Each Period
| | | | | | | | | | | | | | | | | | | | | | | | | | |
| | | | | Goldman Sachs Commodity Strategy Fund | |
| | | | | Class C Shares | |
| | | | | Six Months Ended
June 30, 2019
(Unaudited) | | | Year Ended December 31, | |
| | | | | 2018 | | | 2017 | | | 2016 | | | 2015 | | | 2014 | |
| | Per Share Data | | | | | | | | | | | | | | | | | | | | | | | | |
| | | | | | | |
| | Net asset value, beginning of period | | $ | 9.17 | | | $ | 10.92 | | | $ | 11.15 | | | $ | 10.04 | | | $ | 14.99 | | | $ | 21.85 | |
| | | | | | | |
| | Net investment income (loss)(a) | | | 0.02 | | | | 0.02 | | | | (0.07 | ) | | | (0.06 | ) | | | (0.13 | ) | | | (0.26 | ) |
| | | | | | | |
| | Net realized and unrealized gain (loss) | | | 1.11 | | | | (1.75 | ) | | | 0.42 | | | | 1.17 | | | | (4.82 | ) | | | (6.60 | ) |
| | | | | | | |
| | Total from investment operations | | | 1.13 | | | | (1.73 | ) | | | 0.35 | | | | 1.11 | | | | (4.95 | ) | | | (6.86 | ) |
| | | | | | | |
| | Distributions to shareholders from net investment income | | | (0.03 | ) | | | (0.02 | ) | | | (0.46 | ) | | | — | | | | — | | | | — | |
| | | | | | | |
| | Distributions to shareholders from return of capital | | | — | | | | — | | | | (0.12 | ) | | | — | | | | — | | | | — | |
| | | | | | | |
| | Total distributions | | | (0.03 | ) | | | (0.02 | ) | | | (0.58 | ) | | | — | | | | — | | | | — | |
| | | | | | | |
| | Net asset value, end of period | | $ | 10.27 | | | $ | 9.17 | | | $ | 10.92 | | | $ | 11.15 | | | $ | 10.04 | | | $ | 14.99 | |
| | | | | | | |
| | Total return(b) | | | 12.38 | % | | | (15.84 | )% | | | 3.16 | % | | | 11.02 | % | | | (32.95 | )% | | | (31.32 | )% |
| | | | | | | |
| | Net assets, end of period (in 000s) | | $ | 2,541 | | | $ | 2,472 | | | $ | 2,949 | | | $ | 3,858 | | | $ | 4,578 | | | $ | 8,149 | |
| | | | | | | |
| | Ratio of net expenses to average net assets | | | 1.58 | %(c) | | | 1.59 | % | | | 1.61 | % | | | 1.65 | % | | | 1.60 | % | | | 1.62 | % |
| | | | | | | |
| | Ratio of total expenses to average net assets | | | 1.79 | %(c) | | | 1.76 | % | | | 1.76 | % | | | 1.82 | % | | | 1.72 | % | | | 1.71 | % |
| | | | | | | |
| | Ratio of net investment income (loss) to average net assets | | | 0.49 | %(c) | | | 0.14 | % | | | (0.68 | )% | | | (0.56 | )% | | | (0.97 | )% | | | (1.27 | )% |
| | | | | | | |
| | Portfolio turnover rate(d) | | | 28 | % | | | 46 | % | | | 89 | % | | | 145 | % | | | 506 | % | | | 234 | % |
| | (a) | | Calculated based on the average shares outstanding methodology. |
| | (b) | | Assumes investment at the net asset value at the beginning of the period, reinvestment of all distributions, a complete redemption of the investment at the net asset value at the end of the period and no sales or redemption charges (if any). Total returns would be reduced if a sales or redemption charge was taken into account. Returns do not reflect the impact of taxes to shareholders relating to Fund distributions or the redemption of Fund shares. Total returns for periods less than one full year are not annualized. |
| | (d) | | The Fund’s portfolio turnover rate is calculated in accordance with regulatory requirements, without regard to transactions involving short term investments and certain derivatives. If such transactions were included, the Fund’s portfolio turnover rate may be higher. |
| | |
| The accompanying notes are an integral part of these financial statements. | | 95 |
GOLDMAN SACHS COMMODITY STRATEGY FUND
Consolidated Financial Highlights(continued)
Selected Data for a Share Outstanding Throughout Each Period
| | | | | | | | | | | | | | | | | | | | | | | | | | |
| | | | | Goldman Sachs Commodity Strategy Fund | |
| | | | | Institutional Shares | |
| | | | | Six Months Ended
June 30, 2019
(Unaudited) | | | Year Ended December 31, | |
| | | | | 2018 | | | 2017 | | | 2016 | | | 2015 | | | 2014 | |
| | Per Share Data | | | | | | | | | | | | | | | | | | | | | | | | |
| | | | | | | |
| | Net asset value, beginning of period | | $ | 9.74 | | | $ | 11.61 | | | $ | 11.80 | | | $ | 10.59 | | | $ | 15.72 | | | $ | 22.69 | |
| | | | | | | |
| | Net investment income (loss)(a) | | | 0.09 | | | | 0.15 | | | | 0.09 | | | | 0.06 | | | | 0.02 | | | | (0.04 | ) |
| | | | | | | |
| | Net realized and unrealized gain (loss) | | | 1.17 | | | | (1.88 | ) | | | 0.40 | | | | 1.25 | | | | (5.10 | ) | | | (6.91 | ) |
| | | | | | | |
| | Total from investment operations | | | 1.26 | | | | (1.73 | ) | | | 0.49 | | | | 1.31 | | | | (5.08 | ) | | | (6.95 | ) |
| | | | | | | |
| | Distributions to shareholders from net investment income | | | (0.08 | ) | | | (0.14 | ) | | | (0.56 | ) | | | (0.10 | ) | | | (0.05 | ) | | | (0.02 | ) |
| | | | | | | |
| | Distributions to shareholders from return of capital | | | — | | | | — | | | | (0.12 | ) | | | — | | | | — | | | | — | |
| | | | | | | |
| | Total distributions | | | (0.08 | ) | | | (0.14 | ) | | | (0.68 | ) | | | (0.10 | ) | | | (0.05 | ) | | | (0.02 | ) |
| | | | | | | |
| | Net asset value, end of period | | $ | 10.92 | | | $ | 9.74 | | | $ | 11.61 | | | $ | 11.80 | | | $ | 10.59 | | | $ | 15.72 | |
| | | | | | | |
| | Total return(b) | | | 12.92 | % | | | (14.89 | )% | | | 4.28 | % | | | 12.32 | % | | | (32.38 | )% | | | (30.62 | )% |
| | | | | | | |
| | Net assets, end of period (in 000s) | | $ | 194,398 | | | $ | 259,239 | | | $ | 314,888 | | | $ | 326,270 | | | $ | 544,699 | | | $ | 764,809 | |
| | | | | | | |
| | Ratio of net expenses to average net assets | | | 0.49 | %(c) | | | 0.50 | % | | | 0.52 | % | | | 0.56 | % | | | 0.51 | % | | | 0.53 | % |
| | | | | | | |
| | Ratio of total expenses to average net assets | | | 0.70 | %(c) | | | 0.66 | % | | | 0.66 | % | | | 0.72 | % | | | 0.63 | % | | | 0.62 | % |
| | | | | | | |
| | Ratio of net investment income (loss) to average net assets | | | 1.56 | %(c) | | | 1.23 | % | | | 0.78 | % | | | 0.53 | % | | | 0.12 | % | | | (0.17 | )% |
| | | | | | | |
| | Portfolio turnover rate(d) | | | 28 | % | | | 46 | % | | | 89 | % | | | 145 | % | | | 506 | % | | | 234 | % |
| | (a) | | Calculated based on the average shares outstanding methodology. |
| | (b) | | Assumes investment at the net asset value at the beginning of the period, reinvestment of all distributions, a complete redemption of the investment at the net asset value at the end of the period and no sales or redemption charges (if any). Total returns would be reduced if a sales or redemption charge was taken into account. Returns do not reflect the impact of taxes to shareholders relating to Fund distributions or the redemption of Fund shares. Total returns for periods less than one full year are not annualized. |
| | (d) | | The Fund’s portfolio turnover rate is calculated in accordance with regulatory requirements, without regard to transactions involving short term investments and certain derivatives. If such transactions were included, the Fund’s portfolio turnover rate may be higher. |
| | |
| 96 | | The accompanying notes are an integral part of these financial statements. |
GOLDMAN SACHS COMMODITY STRATEGY FUND
Consolidated Financial Highlights(continued)
Selected Data for a Share Outstanding Throughout Each Period
| | | | | | | | | | | | | | | | | | | | | | | | | | |
| | | | | Goldman Sachs Commodity Strategy Fund | |
| | | | | Investor Shares(a) | |
| | | | | Six Months Ended
June 30, 2019
(Unaudited) | | | Year Ended December 31, | |
| | | | | 2018 | | | 2017 | | | 2016 | | | 2015 | | | 2014 | |
| | Per Share Data | | | | | | | | | | | | | | | | | | | | | | | | |
| | | | | | | |
| | Net asset value, beginning of period | | $ | 9.75 | | | $ | 11.61 | | | $ | 11.81 | | | $ | 10.60 | | | $ | 15.74 | | | $ | 22.72 | |
| | | | | | | |
| | Net investment income (loss)(b) | | | 0.08 | | | | 0.14 | | | | (0.02 | ) | | | 0.05 | | | | — | (c) | | | (0.05 | ) |
| | | | | | | |
| | Net realized and unrealized gain (loss) | | | 1.17 | | | | (1.87 | ) | | | 0.49 | | | | 1.25 | | | | (5.08 | ) | | | (6.93 | ) |
| | | | | | | |
| | Total from investment operations | | | 1.25 | | | | (1.73 | ) | | | 0.47 | | | | 1.30 | | | | (5.08 | ) | | | (6.98 | ) |
| | | | | | | |
| | Distributions to shareholders from net investment income | | | (0.07 | ) | | | (0.13 | ) | | | (0.55 | ) | | | (0.09 | ) | | | (0.06 | ) | | | — | (c) |
| | | | | | | |
| | Distributions to shareholders from return of capital | | | — | | | | — | | | | (0.12 | ) | | | — | | | | — | | | | — | |
| | | | | | | |
| | Total distributions | | | (0.07 | ) | | | (0.13 | ) | | | (0.67 | ) | | | (0.09 | ) | | | (0.06 | ) | | | — | (c) |
| | | | | | | |
| | Net asset value, end of period | | $ | 10.93 | | | $ | 9.75 | | | $ | 11.61 | | | $ | 11.81 | | | $ | 10.60 | | | $ | 15.74 | |
| | | | | | | |
| | Total return(d) | | | 12.95 | % | | | (14.97 | )% | | | 4.08 | % | | | 12.21 | % | | | (32.15 | )% | | | (30.80 | )% |
| | | | | | | |
| | Net assets, end of period (in 000s) | | $ | 7,814 | | | $ | 8,272 | | | $ | 8,586 | | | $ | 5,265 | | | $ | 6,699 | | | $ | 7,740 | |
| | | | | | | |
| | Ratio of net expenses to average net assets | | | 0.58 | %(e) | | | 0.59 | % | | | 0.61 | % | | | 0.65 | % | | | 0.60 | % | | | 0.61 | % |
| | | | | | | |
| | Ratio of total expenses to average net assets | | | 0.79 | %(e) | | | 0.75 | % | | | 0.75 | % | | | 0.82 | % | | | 0.72 | % | | | 0.71 | % |
| | | | | | | |
| | Ratio of net investment income (loss) to average net assets | | | 1.51 | %(e) | | | 1.15 | % | | | (0.18 | )% | | | 0.44 | % | | | 0.03 | % | | | (0.24 | )% |
| | | | | | | |
| | Portfolio turnover rate(f) | | | 28 | % | | | 46 | % | | | 89 | % | | | 145 | % | | | 506 | % | | | 234 | % |
| | (a) | | Effective August 15, 2017, Class IR changed its name to Investor Shares. |
| | (b) | | Calculated based on the average shares outstanding methodology. |
| | (c) | | Amount is less than $0.005 per share. |
| | (d) | | Assumes investment at the net asset value at the beginning of the period, reinvestment of all distributions, a complete redemption of the investment at the net asset value at the end of the period and no sales or redemption charges (if any). Total returns would be reduced if a sales or redemption charge was taken into account. Returns do not reflect the impact of taxes to shareholders relating to Fund distributions or the redemption of Fund shares. Total returns for periods less than one full year are not annualized. |
| | (f) | | The Fund’s portfolio turnover rate is calculated in accordance with regulatory requirements, without regard to transactions involving short term investments and certain derivatives. If such transactions were included, the Fund’s portfolio turnover rate may be higher. |
| | |
| The accompanying notes are an integral part of these financial statements. | | 97 |
GOLDMAN SACHS COMMODITY STRATEGY FUND
Consolidated Financial Highlights(continued)
Selected Data for a Share Outstanding Throughout Each Period
| | | | | | | | | | |
| | | | | Goldman Sachs Commodity Strategy Fund | |
| | | | | Class P Shares | |
| | | | | Six Months Ended
June 30, 2019
(Unaudited) | | | April 17, 2018* to December 31, 2018 | |
| | Per Share Data | |
| | | |
| | Net asset value, beginning of period | | $ | 9.76 | | | $ | 12.11 | |
| | | |
| | Net investment income(a) | | | 0.09 | | | | 0.12 | |
| | | |
| | Net realized and unrealized gain (loss) | | | 1.16 | | | | (2.33 | ) |
| | | |
| | Total from investment operations | | | 1.25 | | | | (2.21 | ) |
| | | |
| | Distributions to shareholders from net investment income | | | (0.08 | ) | | | (0.14 | ) |
| | | |
| | Net asset value, end of period | | $ | 10.93 | | | $ | 9.76 | |
| | | |
| | Total return(b) | | | 12.92 | % | | | (18.31 | )% |
| | | |
| | Net assets, end of period (in 000s) | | $ | 3,560 | | | $ | 3,167 | |
| | | |
| | Ratio of net expenses to average net assets | | | 0.48 | %(c) | | | 0.45 | %(c) |
| | | |
| | Ratio of total expenses to average net assets | | | 0.69 | %(c) | | | 0.65 | %(c) |
| | | |
| | Ratio of net investment income to average net assets | | | 1.58 | %(c) | | | 1.43 | %(c) |
| | | |
| | Portfolio turnover rate(d) | | | 28 | % | | | 46 | % |
| | * | | Commencement of operations. |
| | (a) | | Calculated based on the average shares outstanding methodology. |
| | (b) | | Assumes investment at the net asset value at the beginning of the period, reinvestment of all distributions, a complete redemption of the investment at the net asset value at the end of the period and no sales or redemption charges (if any). Total returns would be reduced if a sales or redemption charge was taken into account. Returns do not reflect the impact of taxes to shareholders relating to Fund distributions or the redemption of Fund shares. Total returns for periods less than one full year are not annualized. |
| | (d) | | The Fund’s portfolio turnover rate is calculated in accordance with regulatory requirements, without regard to transactions involving short term investments and certain derivatives. If such transactions were included, the Fund’s portfolio turnover rate may be higher. |
| | |
| 98 | | The accompanying notes are an integral part of these financial statements. |
GOLDMAN SACHS COMMODITY STRATEGY FUND
Consolidated Financial Highlights(continued)
Selected Data for a Share Outstanding Throughout Each Period
| | | | | | | | | | | | | | | | | | | | | | | | | | |
| | | | | Goldman Sachs Commodity Strategy Fund | |
| | | | | Class R Shares | |
| | | | | Six Months Ended
June 30, 2019
(Unaudited) | | | Year Ended December 31, | |
| | | | | 2018 | | | 2017 | | | 2016 | | | 2015 | | | 2014 | |
| | Per Share Data | |
| | | | | | | |
| | Net asset value, beginning of period | | $ | 9.50 | | | $ | 11.31 | | | $ | 11.51 | | | $ | 10.35 | | | $ | 15.38 | | | $ | 22.31 | |
| | | | | | | |
| | Net investment income (loss)(a) | | | 0.05 | | | | 0.07 | | | | (0.04 | ) | | | (0.01 | ) | | | (0.06 | ) | | | (0.16 | ) |
| | | | | | | |
| | Net realized and unrealized gain (loss) | | | 1.14 | | | | (1.81 | ) | | | 0.45 | | | | 1.21 | | | | (4.97 | ) | | | (6.77 | ) |
| | | | | | | |
| | Total from investment operations | | | 1.19 | | | | (1.74 | ) | | | 0.41 | | | | 1.20 | | | | (5.03 | ) | | | (6.93 | ) |
| | | | | | | |
| | Distributions to shareholders from net investment income | | | (0.05 | ) | | | (0.07 | ) | | | (0.49 | ) | | | (0.04 | ) | | | — | (b) | | | — | |
| | | | | | | |
| | Distributions to shareholders from return of capital | | | — | | | | — | | | | (0.12 | ) | | | — | | | | — | | | | — | |
| | | | | | | |
| | Total distributions | | | (0.05 | ) | | | (0.07 | ) | | | (0.61 | ) | | | (0.04 | ) | | | — | (b) | | | — | |
| | | | | | | |
| | Net asset value, end of period | | $ | 10.64 | | | $ | 9.50 | | | $ | 11.31 | | | $ | 11.51 | | | $ | 10.35 | | | $ | 15.38 | |
| | | | | | | |
| | Total return(c) | | | 12.63 | % | | | (15.40 | )% | | | 3.60 | % | | | 11.60 | % | | | (32.88 | )% | | | (31.00 | )% |
| | | | | | | |
| | Net assets, end of period (in 000s) | | $ | 2,347 | | | $ | 2,233 | | | $ | 2,892 | | | $ | 4,419 | | | $ | 1,963 | | | $ | 1,542 | |
| | | | | | | |
| | Ratio of net expenses to average net assets | | | 1.08 | %(d) | | | 1.09 | % | | | 1.11 | % | | | 1.14 | % | | | 1.10 | % | | | 1.12 | % |
| | | | | | | |
| | Ratio of total expenses to average net assets | | | 1.29 | %(d) | | | 1.25 | % | | | 1.26 | % | | | 1.34 | % | | | 1.23 | % | | | 1.21 | % |
| | | | | | | |
| | Ratio of net investment income (loss) to average net assets | | | 0.99 | %(d) | | | 0.64 | % | | | (0.40 | )% | | | (0.07 | )% | | | (0.44 | )% | | | (0.77 | )% |
| | | | | | | |
| | Portfolio turnover rate(e) | | | 28 | % | | | 46 | % | | | 89 | % | | | 145 | % | | | 506 | % | | | 234 | % |
| | (a) | | Calculated based on the average shares outstanding methodology. |
| | (b) | | Amount is less than $0.005 per share. |
| | (c) | | Assumes investment at the net asset value at the beginning of the period, reinvestment of all distributions, a complete redemption of the investment at the net asset value at the end of the period and no sales or redemption charges (if any). Total returns would be reduced if a sales or redemption charge was taken into account. Returns do not reflect the impact of taxes to shareholders relating to Fund distributions or the redemption of Fund shares. Total returns for periods less than one full year are not annualized. |
| | (e) | | The Fund’s portfolio turnover rate is calculated in accordance with regulatory requirements, without regard to transactions involving short term investments and certain derivatives. If such transactions were included, the Fund’s portfolio turnover rate may be higher. |
| | |
| The accompanying notes are an integral part of these financial statements. | | 99 |
GOLDMAN SACHS COMMODITY STRATEGY FUND
Consolidated Financial Highlights(continued)
Selected Data for a Share Outstanding Throughout Each Period
| | | | | | | | | | | | | | | | | | | | | | |
| | | | | Goldman Sachs Commodity Strategy Fund | |
| | | | | Class R6 Shares | |
| | | | | Six Months Ended
June 30, 2019
(Unaudited) | | | Year Ended December 31, | | | For the Period
July 31, 2015* to December 31, 2015 | |
| | | | | 2018 | | | 2017 | | | 2016 | |
| | Per Share Data | |
| | | | | | |
| | Net asset value, beginning of period | | $ | 9.76 | | | $ | 11.62 | | | $ | 11.80 | | | $ | 10.60 | | | $ | 13.48 | |
| | | | | | |
| | Net investment income (loss)(a) | | | 0.09 | | | | 0.14 | | | | (0.45 | ) | | | 0.06 | | | | 0.02 | |
| | | | | | |
| | Net realized and unrealized gain (loss) | | | 1.17 | | | | (1.87 | ) | | | 0.95 | | | | 1.24 | | | | (2.86 | ) |
| | | | | | |
| | Total from investment operations | | | 1.26 | | | | (1.73 | ) | | | 0.50 | | | | 1.30 | | | | (2.84 | ) |
| | | | | | |
| | Distributions to shareholders from net investment income | | | (0.08 | ) | | | (0.13 | ) | | | (0.56 | ) | | | (0.10 | ) | | | (0.04 | ) |
| | | | | | |
| | Distributions to shareholders from return of capital | | | — | | | | — | | | | (0.12 | ) | | | — | | | | — | |
| | | | | | |
| | Total distributions | | | (0.08 | ) | | | (0.13 | ) | | | (0.68 | ) | | | (0.10 | ) | | | (0.04 | ) |
| | | | | | |
| | Net asset value, end of period | | $ | 10.94 | | | $ | 9.76 | | | $ | 11.62 | | | $ | 11.80 | | | $ | 10.60 | |
| | | | | | |
| | Total return(b) | | | 13.02 | % | | | (14.96 | )% | | | 4.29 | % | | | 12.25 | % | | | (21.23 | )% |
| | | | | | |
| | Net assets, end of period (in 000s) | | $ | 83,268 | | | $ | 182 | | | $ | 90 | | | $ | 1,907 | | | $ | 1,336 | |
| | | | | | |
| | Ratio of net expenses to average net assets | | | 0.47 | %(c) | | | 0.49 | % | | | 0.50 | % | | | 0.54 | % | | | 0.51 | %(c) |
| | | | | | |
| | Ratio of total expenses to average net assets | | | 0.69 | %(c) | | | 0.68 | % | | | 0.66 | % | | | 0.72 | % | | | 0.64 | %(c) |
| | | | | | |
| | Ratio of net investment income (loss) to average net assets | | | 1.63 | %(c) | | | 1.15 | % | | | (4.04 | )% | | | 0.54 | % | | | 0.35 | %(c) |
| | | | | | |
| | Portfolio turnover rate(d) | | | 28 | % | | | 46 | % | | | 89 | % | | | 145 | % | | | 506 | % |
| | * | | Commencement of operations. |
| | (a) | | Calculated based on the average shares outstanding methodology. |
| | (b) | | Assumes investment at the net asset value at the beginning of the period, reinvestment of all distributions, a complete redemption of the investment at the net asset value at the end of the period and no sales or redemption charges (if any). Total returns would be reduced if a sales or redemption charge was taken into account. Returns do not reflect the impact of taxes to shareholders relating to Fund distributions or the redemption of Fund shares. Total returns for periods less than one full year are not annualized. |
| | (d) | | The Fund’s portfolio turnover rate is calculated in accordance with regulatory requirements, without regard to transactions involving short term investments and certain derivatives. If such transactions were included, the Fund’s portfolio turnover rate may be higher. |
| | |
| 100 | | The accompanying notes are an integral part of these financial statements. |
GOLDMAN SACHS MANAGED FUTURES STRATEGY FUND
Consolidated Financial Highlights(continued)
Selected Data for a Share Outstanding Throughout Each Period
| | | | | | | | | | | | | | | | | | | | | | | | | | |
| | | | | Goldman Sachs Managed Futures Strategy Fund | |
| | | | | Class A Shares | |
| | | | | Six Months Ended
June 30, 2019
(Unaudited) | | | Year Ended December 31, | |
| | | | | 2018 | | | 2017 | | | 2016 | | | 2015 | | | 2014 | |
| | Per Share Data | |
| | | | | | | |
| | Net asset value, beginning of period | | $ | 10.03 | | | $ | 10.30 | | | $ | 10.12 | | | $ | 10.21 | | | $ | 9.67 | | | $ | 10.04 | |
| | | | | | | |
| | Net investment income (loss)(a) | | | 0.01 | | | | (0.02 | ) | | | (0.10 | ) | | | (0.14 | ) | | | (0.16 | ) | | | (0.14 | ) |
| | | | | | | |
| | Net realized and unrealized gain (loss) | | | 0.49 | | | | (0.23 | ) | | | 0.33 | | | | 0.05 | | | | 1.10 | | | | (0.14 | ) |
| | | | | | | |
| | Total from investment operations | | | 0.50 | | | | (0.25 | ) | | | 0.23 | | | | (0.09 | ) | | | 0.94 | | | | (0.28 | ) |
| | | | | | | |
| | Distributions to shareholders from net investment income | | | — | | | | — | | | | — | | | | — | | | | (0.40 | ) | | | — | |
| | | | | | | |
| | Distributions to shareholders from net realized gains | | | — | | | | (0.02 | ) | | | (0.05 | ) | | | — | | | | — | | | | (0.09 | ) |
| | | | | | | |
| | Total distributions | | | — | | | | (0.02 | ) | | | (0.05 | ) | | | — | | | | (0.40 | ) | | | (0.09 | ) |
| | | | | | | |
| | Net asset value, end of period | | $ | 10.53 | | | $ | 10.03 | | | $ | 10.30 | | | $ | 10.12 | | | $ | 10.21 | | | $ | 9.67 | |
| | | | | | | |
| | Total return(b) | | | 4.78 | % | | | (2.37 | )% | | | 2.29 | % | | | (0.88 | )% | | | 9.69 | % | | | (2.75 | )% |
| | | | | | | |
| | Net assets, end of period (in 000s) | | $ | 9,310 | | | $ | 8,622 | | | $ | 7,711 | | | $ | 23,174 | | | $ | 24,000 | | | $ | 2,698 | |
| | | | | | | |
| | Ratio of net expenses to average net assets | | | 1.49 | %(c) | | | 1.47 | % | | | 1.55 | % | | | 1.55 | % | | | 1.56 | % | | | 1.51 | % |
| | | | | | | |
| | Ratio of total expenses to average net assets | | | 1.64 | %(c) | | | 1.62 | % | | | 1.75 | % | | | 1.74 | % | | | 1.84 | % | | | 1.96 | % |
| | | | | | | |
| | Ratio of net investment income (loss) to average net assets | | | 0.28 | %(c) | | | (0.19 | )% | | | (1.02 | )% | | | (1.33 | )% | | | (1.53 | )% | | | (1.50 | )% |
| | | | | | | |
| | Portfolio turnover rate(d) | | | — | % | | | — | % | | | — | % | | | 529 | % | | | 196 | % | | | 343 | % |
| | (a) | | Calculated based on the average shares outstanding methodology. |
| | (b) | | Assumes investment at the net asset value at the beginning of the period, reinvestment of all distributions, a complete redemption of the investment at the net asset value at the end of the period and no sales or redemption charges (if any). Total returns would be reduced if a sales or redemption charge was taken into account. Returns do not reflect the impact of taxes to shareholders relating to Fund distributions or the redemption of Fund shares. Total returns for periods less than one full year are not annualized. |
| | (d) | | The Fund’s portfolio turnover rate is calculated in accordance with regulatory requirements, without regard to transactions involving short term investments and certain derivatives. If such transactions were included, the Fund’s portfolio turnover rate may be higher. |
| | |
| The accompanying notes are an integral part of these financial statements. | | 101 |
GOLDMAN SACHS MANAGED FUTURES STRATEGY FUND
Consolidated Financial Highlights(continued)
Selected Data for a Share Outstanding Throughout Each Period
| | | | | | | | | | | | | | | | | | | | | | | | | | |
| | | | | Goldman Sachs Managed Futures Strategy Fund | |
| | | | | Class C Shares | |
| | | | | Six Months Ended
June 30, 2019
(Unaudited) | | | Year Ended December 31, | |
| | | | | 2018 | | | 2017 | | | 2016 | | | 2015 | | | 2014 | |
| | Per Share Data | |
| | | | | | | |
| | Net asset value, beginning of period | | $ | 9.56 | | | $ | 9.88 | | | $ | 9.79 | | | $ | 9.95 | | | $ | 9.45 | | | $ | 9.89 | |
| | | | | | | |
| | Net investment loss(a) | | | (0.02 | ) | | | (0.09 | ) | | | (0.17 | ) | | | (0.21 | ) | | | (0.23 | ) | | | (0.21 | ) |
| | | | | | | |
| | Net realized and unrealized gain (loss) | | | 0.45 | | | | (0.21 | ) | | | 0.31 | | | | 0.05 | | | | 1.07 | | | | (0.14 | ) |
| | | | | | | |
| | Total from investment operations | | | 0.43 | | | | (0.30 | ) | | | 0.14 | | | | (0.16 | ) | | | 0.84 | | | | (0.35 | ) |
| | | | | | | |
| | Distributions to shareholders from net investment income | | | — | | | | — | | | | — | | | | — | | | | (0.34 | ) | | | — | |
| | | | | | | |
| | Distributions to shareholders from net realized gains | | | — | | | | (0.02 | ) | | | (0.05 | ) | | | — | | | | — | | | | (0.09 | ) |
| | | | | | | |
| | Total distributions | | | — | | | | (0.02 | ) | | | (0.05 | ) | | | — | | | | (0.34 | ) | | | (0.09 | ) |
| | | | | | | |
| | Net asset value, end of period | | $ | 9.99 | | | $ | 9.56 | | | $ | 9.88 | | | $ | 9.79 | | | $ | 9.95 | | | $ | 9.45 | |
| | | | | | | |
| | Total return(b) | | | 4.39 | % | | | (3.08 | )% | | | 1.44 | % | | | (1.60 | )% | | | 8.93 | % | | | (3.50 | )% |
| | | | | | | |
| | Net assets, end of period (in 000s) | | $ | 3,164 | | | $ | 3,281 | | | $ | 3,480 | | | $ | 4,054 | | | $ | 3,056 | | | $ | 897 | |
| | | | | | | |
| | Ratio of net expenses to average net assets | | | 2.24 | %(c) | | | 2.22 | % | | | 2.29 | % | | | 2.31 | % | | | 2.30 | % | | | 2.26 | % |
| | | | | | | |
| | Ratio of total expenses to average net assets | | | 2.39 | %(c) | | | 2.37 | % | | | 2.48 | % | | | 2.49 | % | | | 2.60 | % | | | 2.69 | % |
| | | | | | | |
| | Ratio of net investment loss to average net assets | | | (0.47 | )%(c) | | | (0.95 | )% | | | (1.72 | )% | | | (2.09 | )% | | | (2.28 | )% | | | (2.26 | )% |
| | | | | | | |
| | Portfolio turnover rate(d) | | | — | % | | | — | % | | | — | % | | | 529 | % | | | 196 | % | | | 343 | % |
| | (a) | | Calculated based on the average shares outstanding methodology. |
| | (b) | | Assumes investment at the net asset value at the beginning of the period, reinvestment of all distributions, a complete redemption of the investment at the net asset value at the end of the period and no sales or redemption charges (if any). Total returns would be reduced if a sales or redemption charge was taken into account. Returns do not reflect the impact of taxes to shareholders relating to Fund distributions or the redemption of Fund shares. Total returns for periods less than one full year are not annualized. |
| | (d) | | The Fund’s portfolio turnover rate is calculated in accordance with regulatory requirements, without regard to transactions involving short term investments and certain derivatives. If such transactions were included, the Fund’s portfolio turnover rate may be higher. |
| | |
| 102 | | The accompanying notes are an integral part of these financial statements. |
GOLDMAN SACHS MANAGED FUTURES STRATEGY FUND
Consolidated Financial Highlights(continued)
Selected Data for a Share Outstanding Throughout Each Period
| | | | | | | | | | | | | | | | | | | | | | | | | | |
| | | | | Goldman Sachs Managed Futures Strategy Fund | |
| | | | | Institutional Shares | |
| | | | | Six Months Ended
June 30, 2019
(Unaudited) | | | Year Ended December 31, | |
| | | | | 2018 | | | 2017 | | | 2016 | | | 2015 | | | 2014 | |
| | Per Share Data | | | | | | | | | | | | | | | | | | | | | | | | |
| | | | | | | |
| | Net asset value, beginning of period | | $ | 10.28 | | | $ | 10.52 | | | $ | 10.29 | | | $ | 10.36 | | | $ | 9.77 | | | $ | 10.11 | |
| | | | | | | |
| | Net investment income (loss)(a) | | | 0.03 | | | | 0.02 | | | | (0.06 | ) | | | (0.10 | ) | | | (0.12 | ) | | | (0.11 | ) |
| | | | | | | |
| | Net realized and unrealized gain (loss) | | | 0.50 | | | | (0.24 | ) | | | 0.34 | | | | 0.04 | | | | 1.12 | | | | (0.14 | ) |
| | | | | | | |
| | Total from investment operations | | | 0.53 | | | | (0.22 | ) | | | 0.28 | | | | (0.06 | ) | | | 1.00 | | | | (0.25 | ) |
| | | | | | | |
| | Distributions to shareholders from net investment income | | | — | | | | — | | | | — | | | | (0.01 | ) | | | (0.41 | ) | | | — | |
| | | | | | | |
| | Distributions to shareholders from net realized gains | | | — | | | | (0.02 | ) | | | (0.05 | ) | | | — | | | | — | | | | (0.09 | ) |
| | | | | | | |
| | Total distributions | | | — | | | | (0.02 | ) | | | (0.05 | ) | | | (0.01 | ) | | | (0.41 | ) | | | (0.09 | ) |
| | | | | | | |
| | Net asset value, end of period | | $ | 10.81 | | | $ | 10.28 | | | $ | 10.52 | | | $ | 10.29 | | | $ | 10.36 | | | $ | 9.77 | |
| | | | | | | |
| | Total return(b) | | | 5.06 | % | | | (2.13 | )% | | | 2.73 | % | | | (0.57 | )% | | | 10.24 | % | | | (2.43 | )% |
| | | | | | | |
| | Net assets, end of period (in 000s) | | $ | 64,601 | | | $ | 83,425 | | | $ | 163,971 | | | $ | 110,763 | | | $ | 87,820 | | | $ | 88,381 | |
| | | | | | | |
| | Ratio of net expenses to average net assets | | | 1.10 | %(c) | | | 1.07 | % | | | 1.14 | % | | | 1.16 | % | | | 1.14 | % | | | 1.11 | % |
| | | | | | | |
| | Ratio of total expenses to average net assets | | | 1.25 | %(c) | | | 1.22 | % | | | 1.33 | % | | | 1.34 | % | | | 1.46 | % | | | 1.54 | % |
| | | | | | | |
| | Ratio of net investment income (loss) to average net assets | | | 0.68 | %(c) | | | 0.16 | % | | | (0.54 | )% | | | (0.94 | )% | | | (1.12 | )% | | | (1.10 | )% |
| | | | | | | |
| | Portfolio turnover rate(d) | | | — | % | | | — | % | | | — | % | | | 529 | % | | | 196 | % | | | 343 | % |
| | (a) | | Calculated based on the average shares outstanding methodology. |
| | (b) | | Assumes investment at the net asset value at the beginning of the period, reinvestment of all distributions, a complete redemption of the investment at the net asset value at the end of the period and no sales or redemption charges (if any). Total returns would be reduced if a sales or redemption charge was taken into account. Returns do not reflect the impact of taxes to shareholders relating to Fund distributions or the redemption of Fund shares. Total returns for periods less than one full year are not annualized. |
| | (d) | | The Fund’s portfolio turnover rate is calculated in accordance with regulatory requirements, without regard to transactions involving short term investments and certain derivatives. If such transactions were included, the Fund’s portfolio turnover rate may be higher. |
| | |
| The accompanying notes are an integral part of these financial statements. | | 103 |
GOLDMAN SACHS MANAGED FUTURES STRATEGY FUND
Consolidated Financial Highlights(continued)
Selected Data for a Share Outstanding Throughout Each Period
| | | | | | | | | | | | | | | | | | | | | | | | | | |
| | | | | Goldman Sachs Managed Futures Strategy Fund | |
| | | | | Investor Shares(a) | |
| | | | | Six Months Ended
June 30, 2019
(Unaudited) | | | Year Ended December 31, | |
| | | | | 2018 | | | 2017 | | | 2016 | | | 2015 | | | 2014 | |
| | Per Share Data | | | | | | | | | | | | | | | | | | | | | | | | |
| | | | | | | |
| | Net asset value, beginning of period | | $ | 10.19 | | | $ | 10.44 | | | $ | 10.23 | | | $ | 10.30 | | | $ | 9.73 | | | $ | 10.08 | |
| | | | | | | |
| | Net investment income (loss)(b) | | | 0.03 | | | | 0.01 | | | | (0.06 | ) | | | (0.11 | ) | | | (0.13 | ) | | | (0.12 | ) |
| | | | | | | |
| | Net realized and unrealized gain (loss) | | | 0.48 | | | | (0.24 | ) | | | 0.32 | | | | 0.04 | | | | 1.11 | | | | (0.14 | ) |
| | | | | | | |
| | Total from investment operations | | | 0.51 | | | | (0.23 | ) | | | 0.26 | | | | (0.07 | ) | | | 0.98 | | | | (0.26 | ) |
| | | | | | | |
| | Distributions to shareholders from net investment income | | | — | | | | — | | | | — | | | | — | | | | (0.41 | ) | | | — | |
| | | | | | | |
| | Distributions to shareholders from net realized gains | | | — | | | | (0.02 | ) | | | (0.05 | ) | | | — | | | | — | | | | (0.09 | ) |
| | | | | | | |
| | Total distributions | | | — | | | | (0.02 | ) | | | (0.05 | ) | | | — | | | | (0.41 | ) | | | (0.09 | ) |
| | | | | | | |
| | Net asset value, end of period | | $ | 10.70 | | | $ | 10.19 | | | $ | 10.44 | | | $ | 10.23 | | | $ | 10.30 | | | $ | 9.73 | |
| | | | | | | |
| | Total return(c) | | | 5.00 | % | | | (2.24 | )% | | | 2.55 | % | | | (0.68 | )% | | | 10.08 | % | | | (2.54 | )% |
| | | | | | | |
| | Net assets, end of period (in 000s) | | $ | 104,574 | | | $ | 105,393 | | | $ | 106,431 | | | $ | 20,181 | | | $ | 6,489 | | | $ | 391 | |
| | | | | | | |
| | Ratio of net expenses to average net assets | | | 1.24 | %(d) | | | 1.22 | % | | | 1.26 | % | | | 1.31 | % | | | 1.31 | % | | | 1.26 | % |
| | | | | | | |
| | Ratio of total expenses to average net assets | | | 1.39 | %(d) | | | 1.37 | % | | | 1.45 | % | | | 1.49 | % | | | 1.60 | % | | | 1.69 | % |
| | | | | | | |
| | Ratio of net investment income (loss) to average net assets | | | 0.53 | %(d) | | | 0.06 | % | | | (0.60 | )% | | | (1.09 | )% | | | (1.26 | )% | | | (1.25 | )% |
| | | | | | | |
| | Portfolio turnover rate(e) | | | — | % | | | — | % | | | — | % | | | 529 | % | | | 196 | % | | | 343 | % |
| | (a) | | Effective August 15, 2017, Class IR changed its name to Investor Shares. |
| | (b) | | Calculated based on the average shares outstanding methodology. |
| | (c) | | Assumes investment at the net asset value at the beginning of the period, reinvestment of all distributions, a complete redemption of the investment at the net asset value at the end of the period and no sales or redemption charges (if any). Total returns would be reduced if a sales or redemption charge was taken into account. Returns do not reflect the impact of taxes to shareholders relating to Fund distributions or the redemption of Fund shares. Total returns for periods less than one full year are not annualized. |
| | (e) | | The Fund’s portfolio turnover rate is calculated in accordance with regulatory requirements, without regard to transactions involving short term investments and certain derivatives. If such transactions were included, the Fund’s portfolio turnover rate may be higher. |
| | |
| 104 | | The accompanying notes are an integral part of these financial statements. |
GOLDMAN SACHS MANAGED FUTURES STRATEGY FUND
Consolidated Financial Highlights(continued)
Selected Data for a Share Outstanding Throughout Each Period
| | | | | | | | | | |
| | | | | Goldman Sachs Managed Futures Strategy Fund | |
| | | | | Class P Shares | |
| | | | | Six Months Ended
June 30, 2019
(Unaudited) | | | April 17, 2018* to
December 31, 2018 | |
| | Per Share Data | |
| | | |
| | Net asset value, beginning of period | | $ | 10.28 | | | $ | 10.56 | |
| | | |
| | Net investment income(a) | | | 0.03 | | | | 0.02 | |
| | | |
| | Net realized and unrealized gain (loss) | | | 0.49 | | | | (0.28 | ) |
| | | |
| | Total from investment operations | | | 0.52 | | | | (0.26 | ) |
| | | |
| | Distributions to shareholders from net realized gains | | | — | | | | (0.02 | ) |
| | | |
| | Net asset value, end of period | | $ | 10.80 | | | $ | 10.28 | |
| | | |
| | Total return(b) | | | 5.06 | % | | | (2.50 | )% |
| | | |
| | Net assets, end of period (in 000s) | | $ | 273 | | | $ | 429 | |
| | | |
| | Ratio of net expenses to average net assets | | | 1.10 | %(c) | | | 1.12 | %(c) |
| | | |
| | Ratio of total expenses to average net assets | | | 1.24 | %(c) | | | 1.27 | %(c) |
| | | |
| | Ratio of net investment income to average net assets | | | .68 | %(c) | | | 0.32 | %(c) |
| | | |
| | Portfolio turnover rate(d) | | | — | % | | | — | % |
| | * | | Commencement of operations. |
| | (a) | | Calculated based on the average shares outstanding methodology. |
| | (b) | | Assumes investment at the net asset value at the beginning of the period, reinvestment of all distributions, a complete redemption of the investment at the net asset value at the end of the period and no sales or redemption charges (if any). Total returns would be reduced if a sales or redemption charge was taken into account. Returns do not reflect the impact of taxes to shareholders relating to Fund distributions or the redemption of Fund shares. Total returns for periods less than one full year are not annualized. |
| | (d) | | The Fund’s portfolio turnover rate is calculated in accordance with regulatory requirements, without regard to transactions involving short term investments and certain derivatives. If such transactions were included, the Fund’s portfolio turnover rate may be higher. |
| | |
| The accompanying notes are an integral part of these financial statements. | | 105 |
GOLDMAN SACHS MANAGED FUTURES STRATEGY FUND
Consolidated Financial Highlights(continued)
Selected Data for a Share Outstanding Throughout Each Period
| | | | | | | | | | | | | | | | | | | | | | | | | | |
| | | | | Goldman Sachs Managed Futures Strategy Fund | |
| | | | | Class R Shares | |
| | | | | Six Months Ended
June 30, 2019
(Unaudited) | | | Year Ended December 31, | |
| | | | | 2018 | | | 2017 | | | 2016 | | | 2015 | | | 2014 | |
| | Per Share Data | |
| | | | | | | |
| | Net asset value, beginning of period | | $ | 9.87 | | | $ | 10.16 | | | $ | 10.00 | | | $ | 10.12 | | | $ | 9.59 | | | $ | 9.99 | |
| | | | | | | |
| | Net investment income (loss)(a) | | | — | (b) | | | (0.04 | ) | | | (0.12 | ) | | | (0.16 | ) | | | (0.18 | ) | | | (0.17 | ) |
| | | | | | | |
| | Net realized and unrealized gain (loss) | | | 0.47 | | | | (0.23 | ) | | | 0.33 | | | | 0.04 | | | | 1.09 | | | | (0.14 | ) |
| | | | | | | |
| | Total from investment operations | | | 0.47 | | | | (0.27 | ) | | | 0.21 | | | | (0.12 | ) | | | 0.91 | | | | (0.31 | ) |
| | | | | | | |
| | Distributions to shareholders from net investment income | | | — | | | | — | | | | — | | | | — | | | | (0.38 | ) | | | — | |
| | | | | | | |
| | Distributions to shareholders from net realized gains | | | — | | | | (0.02 | ) | | | (0.05 | ) | | | — | | | | — | | | | (0.09 | ) |
| | | | | | | |
| | Total distributions | | | — | | | | (0.02 | ) | | | (0.05 | ) | | | — | | | | (0.38 | ) | | | (0.09 | ) |
| | | | | | | |
| | Net asset value, end of period | | $ | 10.34 | | | $ | 9.87 | | | $ | 10.16 | | | $ | 10.00 | | | $ | 10.12 | | | $ | 9.59 | |
| | | | | | | |
| | Total return(c) | | | 4.76 | % | | | (2.70 | )% | | | 2.11 | % | | | (1.18 | )% | | | 9.47 | % | | | (3.06 | )% |
| | | | | | | |
| | Net assets, end of period (in 000s) | | $ | 567 | | | $ | 584 | | | $ | 595 | | | $ | 309 | | | $ | 197 | | | $ | 85 | |
| | | | | | | |
| | Ratio of net expenses to average net assets | | | 1.74 | %(d) | | | 1.72 | % | | | 1.79 | % | | | 1.81 | % | | | 1.79 | % | | | 1.76 | % |
| | | | | | | |
| | Ratio of total expenses to average net assets | | | 1.89 | %(d) | | | 1.87 | % | | | 1.98 | % | | | 1.99 | % | | | 2.11 | % | | | 2.20 | % |
| | | | | | | |
| | Ratio of net investment income (loss) to average net assets | | | 0.03 | %(d) | | | (0.44 | )% | | | (1.19 | )% | | | (1.59 | )% | | | (1.77 | )% | | | (1.75 | )% |
| | | | | | | |
| | Portfolio turnover rate(e) | | | — | % | | | — | % | | | — | % | | | 529 | % | | | 196 | % | | | 343 | % |
| | (a) | | Calculated based on the average shares outstanding methodology. |
| | (b) | | Amount is less than $0.005 per share. |
| | (c) | | Assumes investment at the net asset value at the beginning of the period, reinvestment of all distributions, a complete redemption of the investment at the net asset value at the end of the period and no sales or redemption charges (if any). Total returns would be reduced if a sales or redemption charge was taken into account. Returns do not reflect the impact of taxes to shareholders relating to Fund distributions or the redemption of Fund shares. Total returns for periods less than one full year are not annualized. |
| | (e) | | The Fund’s portfolio turnover rate is calculated in accordance with regulatory requirements, without regard to transactions involving short term investments and certain derivatives. If such transactions were included, the Fund’s portfolio turnover rate may be higher. |
| | |
| 106 | | The accompanying notes are an integral part of these financial statements. |
GOLDMAN SACHS MANAGED FUTURES STRATEGY FUND
Consolidated Financial Highlights(continued)
Selected Data for a Share Outstanding Throughout Each Period
| | | | | | | | | | |
| | | | | Goldman Sachs Managed Futures Strategy Fund | |
| | | | | Class R6 Shares | |
| | | | | Six Months Ended
June 30, 2019
(Unaudited) | | | April 30, 2018* to December 31, 2018 | |
| | Per Share Data | |
| | | |
| | Net asset value, beginning of period | | $ | 10.29 | | | $ | 10.36 | |
| | | |
| | Net investment income(a) | | | 0.03 | | | | 0.02 | |
| | | |
| | Net realized and unrealized gain (loss) | | | 0.49 | | | | (0.07 | ) |
| | | |
| | Total from investment operations | | | 0.52 | | | | (0.05 | ) |
| | | |
| | Distributions to shareholders from net realized gains | | | — | | | | (0.02 | ) |
| | | |
| | Net asset value, end of period | | $ | 10.81 | | | $ | 10.29 | |
| | | |
| | Total return(b) | | | 5.05 | % | | | (0.52 | )% |
| | | |
| | Net assets, end of period (in 000s) | | $ | 54,065 | | | $ | 50,649 | |
| | | |
| | Ratio of net expenses to average net assets | | | 1.09 | %(c) | | | 1.12 | %(c) |
| | | |
| | Ratio of total expenses to average net assets | | | 1.24 | %(c) | | | 1.27 | %(c) |
| | | |
| | Ratio of net investment income to average net assets | | | 0.68 | %(c) | | | 0.31 | %(c) |
| | | |
| | Portfolio turnover rate(d) | | | — | % | | | — | % |
| | * | | Commencement of operations. |
| | (a) | | Calculated based on the average shares outstanding methodology. |
| | (b) | | Assumes investment at the net asset value at the beginning of the period, reinvestment of all distributions, a complete redemption of the investment at the net asset value at the end of the period and no sales or redemption charges (if any). Total returns would be reduced if a sales or redemption charge was taken into account. Returns do not reflect the impact of taxes to shareholders relating to Fund distributions or the redemption of Fund shares. Total returns for periods less than one full year are not annualized. |
| | (d) | | The Fund’s portfolio turnover rate is calculated in accordance with regulatory requirements, without regard to transactions involving short term investments and certain derivatives. If such transactions were included, the Fund’s portfolio turnover rate may be higher. |
| | |
| The accompanying notes are an integral part of these financial statements. | | 107 |
GOLDMAN SACHS ALTERNATIVE FUNDS
Notes to Financial Statements
June 30, 2019 (Unaudited)
Goldman Sachs Trust (the “Trust”) is a Delaware statutory trust registered under the Investment Company Act of 1940, as amended (the “Act”), as an open-end management investment company. The following table lists those series of the Trust that are included in this report (collectively, the “Funds” or individually a “Fund”), along with their corresponding share classes and respective diversification status under the Act:
| | | | |
| Fund | | Share Classes Offered | | Diversified/
Non-diversified |
Absolute Return Tracker, Alternative Premia, Commodity Strategy and Managed Futures Strategy | | A, C, Institutional, Investor, P, R and R6 | | Diversified |
Class A Shares of the Absolute Return Tracker, Alternative Premia and Managed Futures Strategy Funds are sold with a front-end sales charge of up to 5.50%. Class A Shares of the Commodity Strategy Fund are sold with a front-end sales charge of up to 4.50%. Class C Shares are sold with a contingent deferred sales charge (“CDSC”) of 1.00%, which is imposed on redemptions made within 12 months of purchase. Institutional, Investor, Class P, Class R and Class R6 Shares are not subject to a sales charge.
Goldman Sachs Asset Management, L.P. (“GSAM”), an affiliate of Goldman Sachs & Co. LLC (“Goldman Sachs”), serves as Investment Adviser to the Funds pursuant to management agreements (the “Agreements”) with the Trust.
|
| 2. SIGNIFICANT ACCOUNTING POLICIES |
The financial statements have been prepared in accordance with accounting principles generally accepted in the United States of America (“GAAP”) and require management to make estimates and assumptions that may affect the reported amounts and disclosures. Actual results may differ from those estimates and assumptions.
A. Basis of Consolidation for Absolute Return Tracker, Alternative Premia, Commodity Strategy and Managed Futures Strategy Funds — Cayman Commodity-ART, Ltd., Cayman Commodity-AP, Ltd., Cayman Commodity-CSF, Ltd. and Cayman Commodity-MFS, Ltd. (each a “Subsidiary” and collectively, the “Subsidiaries”), Cayman Islands exempted companies, were incorporated on September 11, 2013, September 11, 2014, April 2, 2009 and June 16, 2016, respectively, and are currentlywholly-owned subsidiaries of the Absolute Return Tracker, Alternative Premia, Commodity Strategy and Managed Futures Strategy Funds, respectively. The Subsidiaries act as an investment vehicle for the Funds to enable the Funds to gain exposure to certain types of commodity-linked derivative instruments. The Funds are the sole shareholders of the Subsidiaries pursuant to subscription agreements dated as of June 20, 2014, November 17, 2014, June 17, 2009 and July 18, 2016, respectively, and it is intended that each Fund will remain the sole shareholder and will continue to control its respective Subsidiary. Under the Memorandum and Articles of Association of each Subsidiary, shares issued by the Subsidiary confer upon a shareholder the right to vote at general meetings of the Subsidiary and certain rights in connection with anywinding-up or repayment of capital, as well as the right to participate in the profits or assets of the Subsidiary. All inter-fund balances and transactions have been eliminated in consolidation.
As of June 30, 2019, the Fund and Subsidiary net assets were as follows:
| | | | | | | | | | | | | | |
| Fund | | | | Fund Net Assets | | | Subsidiary Net Assets | | | % Represented by
Subsidiary’s Net Assets | |
Absolute Return Tracker | | | | $ | 2,981,238,092 | | | $ | 12,338,167 | | | | 1 | % |
Alternative Premia | | | | | 77,843,759 | | | | 11,190,579 | | | | 14 | |
Commodity Strategy | | | | | 319,240,492 | | | | 64,932,443 | | | | 20 | |
Managed Futures Strategy | | | | | 236,554,966 | | | | 46,694,650 | | | | 20 | |
B. Investment Valuation — The Funds’ valuation policy is to value investments at fair value.
108
GOLDMAN SACHS ALTERNATIVE FUNDS
|
| 2. SIGNIFICANT ACCOUNTING POLICIES (continued) |
C. Investment Income and Investments— Investment income includes interest income, dividend income, and securities lending income, if any. Interest income is accrued daily and adjusted for amortization of premiums and accretion of discounts. Dividend income is recognized on ex-dividend date or, for certain foreign securities, as soon as such information is obtained subsequent to the ex-dividend date. Investment transactions are reflected on trade date. Realized gains and losses are calculated using identified cost. Investment transactions are recorded on the following business day for daily net asset value (“NAV”) calculations. Investment income is recorded net of any foreign withholding taxes, less any amounts reclaimable. The Funds may file withholding tax reclaims in certain jurisdictions to recover a portion of amounts previously withheld. Any foreign capital gains tax is accrued daily based upon net unrealized gains, and is payable upon sale of such investments. Distributions received from the Funds’ investments in United States (“U.S.”) real estate investment trusts (“REITs”) may be characterized as ordinary income, net capital gain or a return of capital. A return of capital is recorded by the Funds as a reduction to the cost basis of the REIT.
For derivative contracts, realized gains and losses are recorded upon settlement of the contract. Upfront payments, if any, are made or received upon entering into a swap agreement and are reflected in the Consolidated Statements of Assets and Liabilities. Upfront payments are recognized over the contract’s term/event as realized gains or losses, with the exception of forward starting swap contracts whose realized gains or losses are recognized from the effective start date. For securities with paydown provisions, principal payments received are treated as a proportionate reduction to the cost basis of the securities, and excess or shortfall amounts are recorded as income. For treasury inflation protected securities (“TIPS”), adjustments to principal due to inflation/deflation are reflected as increases/decreases to interest income with a corresponding adjustment to cost.
D. Class Allocations and Expenses — Investment income, realized and unrealized gain (loss), if any, and non-class specific expenses of each Fund are allocated daily based upon the proportion of net assets of each class.Non-class specific expenses directly incurred by a Fund are charged to that Fund, while such expenses incurred by the Trust are allocated across the applicable Funds on a straight-line and/orpro-rata basis depending upon the nature of the expenses. Class specific expenses, where applicable, are borne by the respective share classes and include Distribution and Service, Transfer Agency and Service fees.
E. Federal Taxes and Distributions to Shareholders — It is each Fund’s policy to comply with the requirements of the Internal Revenue Code of 1986, as amended (the “Code”), applicable to regulated investment companies and to distribute each year substantially all of its investment company taxable income and capital gains to its shareholders. Accordingly, each Fund is not required to make any provisions for the payment of federal income tax. Distributions to shareholders are recorded on theex-dividend date. Income and capital gains distributions, if any, are declared and paid according to the following schedule:
| | | | | | |
| Fund | | | | Income Distributions Declared/Paid | | Capital Gains Distributions
Declared/Paid |
Absolute Return Tracker, Alternative Premia and
Managed Futures Strategy | | | | Annually | | Annually |
Commodity Strategy | | | | Semi-Annually | | Annually |
The Subsidiaries are classified as controlled foreign corporations under the Code. Therefore, the Funds are required to increase their taxable income by their share of their respective Subsidiary’s income. Net losses of a Subsidiary cannot be deducted by the Funds in the current period nor carried forward to offset taxable income in future periods. Net capital losses, if any, are carried forward to future fiscal years and may be used to the extent allowed by the Code to offset any future capital gains. Losses that are carried forward will retain their character as eithershort-term orlong-term capital losses. Utilization of capital loss carryforwards will reduce the requirement of future capital gains distributions.
The characterization of distributions to shareholders for financial reporting purposes is determined in accordance with federal income tax rules, which may differ from GAAP. The source of each Fund’s distributions may be shown in the accompanying financial statements as either from distributable earnings or capital. Certain components of the Funds’ net assets on the Consolidated Statements of Assets and Liabilities reflect permanent GAAP/tax differences based on the appropriate tax character.
109
GOLDMAN SACHS ALTERNATIVE FUNDS
Notes to Financial Statements(continued)
June 30, 2019 (Unaudited)
|
| 2. SIGNIFICANT ACCOUNTING POLICIES (continued) |
F. Foreign Currency Translation— The accounting records and reporting currency of a Fund are maintained in U.S. dollars. Assets and liabilities denominated in foreign currencies are translated into U.S. dollars using the current exchange rates at the close of each business day. The effect of changes in foreign currency exchange rates on investments is included within net realized and unrealized gain (loss) on investments. Changes in the value of other assets and liabilities as a result of fluctuations in foreign exchange rates are included in the Consolidated Statements of Operations within net change in unrealized gain (loss) on foreign currency translation. Transactions denominated in foreign currencies are translated into U.S. dollars on the date the transaction occurred, the effects of which are included within net realized gain (loss) on foreign currency transactions.
|
| 3. INVESTMENTS AND FAIR VALUE MEASUREMENTS |
U.S. GAAP defines the fair value of a financial instrument as the amount that would be received to sell an asset or paid to transfer a liability in an orderly transaction between market participants at the measurement date (i.e., the exit price); the Funds’ policy is to use the market approach. GAAP establishes a fair value hierarchy that prioritizes the inputs to valuation techniques used to measure fair value. The hierarchy gives the highest priority to unadjusted quoted prices in active markets for identical assets or liabilities (Level 1 measurements) and the lowest priority to unobservable inputs (Level 3 measurements). The levels used for classifying investments are not necessarily an indication of the risk associated with investing in these investments. The three levels of the fair value hierarchy are described below:
Level 1 — Unadjusted quoted prices in active markets that are accessible at the measurement date for identical, unrestricted assets or liabilities;
Level 2 — Quoted prices in markets that are not active or financial instruments for which significant inputs are observable (including, but not limited to, quoted prices for similar investments, interest rates, foreign exchange rates, volatility and credit spreads), either directly or indirectly;
Level 3 — Prices or valuations that require significant unobservable inputs (including GSAM’s assumptions in determining fair value measurement).
The Board of Trustees (“Trustees”) has approved Valuation Procedures that govern the valuation of the portfolio investments held by the Funds, including investments for which market quotations are not readily available. The Trustees have delegated to GSAMday-to-day responsibility for implementing and maintaining internal controls and procedures related to the valuation of the Funds’ investments. To assess the continuing appropriateness of pricing sources and methodologies, GSAM regularly performs price verification procedures and issues challenges as necessary to third party pricing vendors or brokers, and any differences are reviewed in accordance with the Valuation Procedures.
A. Level 1 and Level 2 Fair Value Investments— The valuation techniques and significant inputs used in determining the fair values for investments classified as Level 1 and Level 2 are as follows:
Equity Securities — Equity securities traded on a U.S. securities exchange or the NASDAQ system, or those located on certain foreign exchanges, including but not limited to the Americas, are valued daily at their last sale price or official closing price on the principal exchange or system on which they are traded. If there is no sale or official closing price or such price is believed by GSAM to not represent fair value, equity securities are valued at the last bid price for long positions and at the last ask price for short positions. To the extent these investments are actively traded, they are classified as Level 1 of the fair value hierarchy, otherwise they are generally classified as Level 2.
Unlisted equity securities for which market quotations are available are valued at the last sale price on the valuation date, or if no sale occurs, at the last bid price, and are generally classified as Level 2. Securities traded on certain foreign securities exchanges are valued daily at fair value determined by an independent fair value service (if available) under Valuation Procedures approved by the Trustees and consistent with applicable regulatory guidance. The independent fair value service takes into account multiple factors including, but not limited to, movements in the securities markets, certain depositary receipts, futures contracts and foreign currency exchange rates that have occurred subsequent to the close of the foreign securities exchange. These investments are generally classified as Level 2 of the fair value hierarchy.
110
GOLDMAN SACHS ALTERNATIVE FUNDS
|
| 3. INVESTMENTS AND FAIR VALUE MEASUREMENTS (continued) |
Underlying Funds (including Money Market Funds) — Underlying funds (“Underlying Funds”) include other investment companies and exchange-traded funds (“ETFs”). Investments in the Underlying Funds (except ETFs) are valued at the NAV per share on the day of valuation. ETFs are valued daily at the last sale price or official closing price on the principal exchange or system on which the investment is traded. Because the Funds invest in Underlying Funds that fluctuate in value, the Funds’ shares will correspondingly fluctuate in value. To the extent these investments are actively traded, they are classified as Level 1 of the fair value hierarchy, otherwise they are generally classified as Level 2. For information regarding an Underlying Fund’s accounting policies and investment holdings, please see the Underlying Fund’s shareholder report.
Debt Securities — Debt securities for which market quotations are readily available are valued daily on the basis of quotations supplied by dealers or an independent pricing service approved by the Trustees. The pricing services may use valuation models or matrix pricing, which consider: (i) yield or price with respect to bonds that are considered comparable in characteristics such as rating, interest rate and maturity date or (ii) quotations from securities dealers to determine current value. With the exception of treasury securities of G8 countries, which are generally classified as Level 1, these investments are generally classified as Level 2 of the fair value hierarchy.
i. Commercial Paper— Commercial paper normally representsshort-term unsecured promissory notes issued in bearer form by banks or bank holding companies, corporations, finance companies and other issuers. Commercial paper consists of direct U.S. dollar-denominated obligations of domestic or foreign issuers. Asset-backed commercial paper is issued by a special purpose entity that is organized to issue the commercial paper and to purchase trade receivables or other financial assets.
ii. Mortgage-Backed and Asset-Backed Securities — Mortgage-backed securities represent direct or indirect participations in, or are collateralized by and payable from, mortgage loans secured by residential and/or commercial real estate property. Asset-backed securities include securities whose principal and interest payments are collateralized by pools of other assets or receivables. The value of certain mortgage-backed and asset-backed securities (including adjustable rate mortgage loans) may be particularly sensitive to changes in prevailing interest rates. The value of these securities may also fluctuate in response to the market’s perception of the creditworthiness of the issuers.
Asset-backed securities may present credit risks that are not presented by mortgage-backed securities because they generally do not have the benefit of a security interest in collateral that is comparable to mortgage assets. Some asset-backed securities may only have a subordinated claim on collateral.
Stripped mortgage-backed securities are usually structured with two different classes: one that receives substantially all interest payments (interest-only, or “IO” and/or high coupon rate with relatively low principal amount, or “IOette”), and the other that receives substantially all principal payments (principal-only, or “PO”) from a pool of mortgage loans. Little to no principal will be received at the maturity of an IO; as a result, periodic adjustments are recorded to reduce the cost of the security until maturity. These adjustments are included in interest income.
iii. Mortgage Dollar Rolls— Mortgage dollar rolls are transactions whereby a Fund sells mortgage-backed-securities and simultaneously contracts with the same counterparty to repurchase similar securities on a specified future date. During the settlement period, a Fund will not be entitled to accrue interest and receive principal payments on the securities sold. The Funds account for mortgage dollar roll transactions as purchases and sales and realize gains and losses on these transactions.
iv. Treasury Inflation Protected Securities — TIPS are treasury securities in which the principal amount is adjusted daily to keep pace with inflation, as measured by the U.S. Consumer Pricing Index for Urban Consumers. The repayment of the original bond principal upon maturity is guaranteed by the full faith and credit of the U.S. Government.
v. When-Issued Securities and Forward Commitments — When-issued securities, including TBA (“To Be Announced”) securities, are securities that are authorized but not yet issued in the market and purchased in order to secure what is considered to be an advantageous price or yield to a Fund. A forward commitment involves entering into a contract to purchase or sell securities, typically on an extended settlement basis, for a fixed price at a future date. The purchase of securities on a when-issued or forward commitment basis involves a risk of loss if the value of the security to be purchased
111
GOLDMAN SACHS ALTERNATIVE FUNDS
Notes to Financial Statements(continued)
June 30, 2019 (Unaudited)
|
| 3. INVESTMENTS AND FAIR VALUE MEASUREMENTS (continued) |
declines before the settlement date. Conversely, the sale of securities on a forward commitment basis involves the risk that the value of the securities sold may increase before the settlement date. Although a Fund will generally purchase securities on a when-issued or forward commitment basis with the intention of acquiring the securities for its portfolio, the Fund may dispose of when-issued securities or forward commitments prior to settlement, which may result in a realized gain or loss. For financial reporting purposes, cash collateral that has been pledged to cover obligations of a Fund and cash collateral received, if any, is reported separately on the Consolidated Statements of Assets and Liabilities as receivables/payables for collateral on other investments.Non-cash collateral pledged by a Fund, if any, is noted in the Consolidated Schedules of Investments.
Derivative Contracts — A derivative is an instrument whose value is derived from underlying assets, indices, reference rates or a combination of these factors. A Fund enters into derivative transactions to hedge against changes in interest rates, securities prices, and/or currency exchange rates, to increase total return, or to gain access to certain markets or attain exposure to other underliers. For financial reporting purposes, cash collateral that has been pledged to cover obligations of a Fund and cash collateral received, if any, is reported separately on the Consolidated Statements of Assets and Liabilities as receivables/payables for collateral on certain derivatives contracts.Non-cash collateral pledged by a Fund, if any, is noted in the Consolidated Schedules of Investments.
Exchange-traded derivatives, including futures and options contracts, are generally valued at the last sale or settlement price on the exchange where they are principally traded. Exchange-traded options without settlement prices are generally valued at the midpoint of the bid and ask prices on the exchange where they are principally traded (or, in the absence of two-way trading, at the last bid price for long positions and the last ask price for short positions). Exchange-traded derivatives typically fall within Level 1 of the fair value hierarchy.Over-the-counter (“OTC”) and centrally cleared derivatives are valued using market transactions and other market evidence, including market-based inputs to models, calibration to market-clearing transactions, broker or dealer quotations, or other alternative pricing sources. Where models are used, the selection of a particular model to value OTC and centrally cleared derivatives depends upon the contractual terms of, and specific risks inherent in, the instrument, as well as the availability of pricing information in the market. Valuation models require a variety of inputs, including contractual terms, market prices, yield curves, credit curves, measures of volatility, voluntary and involuntary prepayment rates, loss severity rates and correlations of such inputs. For OTC and centrally cleared derivatives that trade in liquid markets, model inputs can generally be verified and model selection does not involve significant management judgment. OTC and centrally cleared derivatives are classified within Level 2 of the fair value hierarchy when significant inputs are corroborated by market evidence.
i. Forward Contracts — A forward contract is a contract between two parties to buy or sell an asset at a specified price on a future date. A forward contract settlement can occur on a cash or delivery basis. Forward contracts aremarked-to-market daily using independent vendor prices, and the change in value, if any, is recorded as an unrealized gain or loss. Cash and certain investments may be used to collateralize forward contracts.
Aforward foreign currency exchange contract is a forward contract in which a Fund agrees to receive or deliver a fixed quantity of one currency for another, at a pre-determined price at a future date. All forward foreign currency exchange contracts aremarked-to-market daily at the applicable forward rate. Non-deliverable forward foreign currency exchange contracts are settled with the counterparty in cash without the delivery of foreign currency.
ii. Futures Contracts— Futures contracts are contracts to buy or sell a standardized quantity of a specified commodity or security. Upon entering into a futures contract, a Fund deposits cash or securities in an account on behalf of the broker in an amount sufficient to meet the initial margin requirement. Subsequent payments are made or received by a Fund equal to the daily change in the contract value and are recorded as variation margin receivable or payable with a corresponding offset to unrealized gains or losses.
iii. Options — When a Fund writes call or put options, an amount equal to the premium received is recorded as a liability and is subsequentlymarked-to-market to reflect the current value of the option written. Swaptions are options on interest rate and or credit default, swap contracts.
Upon the purchase of a call option or a put option by a Fund, the premium paid is recorded as an investment and subsequentlymarked-to-market to reflect the current value of the option. Certain options may be purchased with premiums to
112
GOLDMAN SACHS ALTERNATIVE FUNDS
|
| 3. INVESTMENTS AND FAIR VALUE MEASUREMENTS (continued) |
be determined on a future date. The premiums for these options are based upon implied volatility parameters at specified terms.
iv. Swap Contracts — Bilateral swap contracts are agreements in which a Fund and a counterparty agree to exchange periodic payments on a specified notional amount or make a net payment upon termination. Bilateral swap transactions are privately negotiated in the OTC market and payments are settled through direct payments between a Fund and the counterparty. By contrast, certain swap transactions are subject to mandatory central clearing. These swaps are executed through a derivatives clearing member (“DCM”), acting in an agency capacity, and submitted to a central counterparty (“CCP”) (“centrally cleared swaps”), in which case all payments are settled with the CCP through the DCM. Swaps aremarked-to-market daily using pricing vendor quotations, counterparty or clearinghouse prices or model prices, and the change in value, if any, is recorded as an unrealized gain or loss. Upon entering into a swap contract, a Fund is required to satisfy an initial margin requirement by delivering cash or securities to the counterparty (or in some cases, segregated in a triparty account on behalf of the counterparty), which can be adjusted by anymark-to-market gains or losses pursuant to bilateral or centrally cleared arrangements. For centrally cleared swaps the daily change in valuation, if any, is recorded as a receivable or payable for variation margin.
Aninterest rate swap is an agreement that obligates two parties to exchange a series of cash flows at specified intervals, based upon or calculated by reference to changes in interest rates on a specified notional principal amount. The payment flows are usually netted against each other, with the difference being paid by one party to the other.
Acredit default swap is an agreement that involves one party (the buyer of protection) making a stream of payments to another party (the seller of protection) in exchange for the right to receive protection on a reference security or obligation, including a group of assets or exposure to the performance of an index. A Fund’s investment in credit default swaps may involve greater risks than if the Fund had invested in the referenced obligation directly. Credit events are contract specific but may include bankruptcy, failure to pay, restructuring and obligation acceleration. If a Fund buys protection through a credit default swap and no credit event occurs, its payments are limited to the periodic payments previously made to the counterparty. Upon the occurrence of a specified credit event, a Fund, as a buyer of credit protection, is entitled to receive an amount equal to the notional amount of the swap and deliver to the seller the defaulted reference obligation in a physically settled trade. A Fund may also receive a net settlement amount in the form of cash or securities equal to the notional amount of the swap reduced by the recovery value of the reference obligation in a cash settled trade.
As a seller of protection, a Fund generally receives a payment stream throughout the term of the swap, provided that there is no credit event. In addition, if a Fund sells protection through a credit default swap, a Fund could suffer a loss because the value of the referenced obligation and the premium payments received may be less than the notional amount of the swap paid to the buyer of protection. Upon the occurrence of a specified credit event, a Fund, as a seller of credit protection, may be required to take possession of the defaulted reference obligation and pay the buyer an amount equal to the notional amount of the swap in a physically settled trade. A Fund may also pay a net settlement amount in the form of cash or securities equal to the notional amount of the swap reduced by the recovery value of the reference obligation in a cash settled trade. Recovery values are at times established through the credit event auction process in which market participants are ensured that a transparent price has been set for the defaulted security or obligation. In addition, a Fund is entitled to a return of any assets, which have been pledged as collateral to the counterparty upon settlement.
The maximum potential amount of future payments (undiscounted) that a Fund as seller of protection could be required to make under a credit default swap would be an amount equal to the notional amount of the agreement. These potential amounts would be partially offset by any recovery values of the respective referenced obligations or net amounts received from a settlement of a credit default swap for the same reference security or obligation where a Fund bought credit protection.
Atotal return swap is an agreement that gives a Fund the right to receive the appreciation in the value of a specified security, basket of investments or indices, index or other instrument in return for a fee paid to the counterparty, which will typically be an agreed upon interest rate. If the underlying asset declines in value over the term of the swap, a Fund may also be required to pay the dollar value of that decline to the counterparty.
113
GOLDMAN SACHS ALTERNATIVE FUNDS
Notes to Financial Statements(continued)
June 30, 2019 (Unaudited)
|
| 3. INVESTMENTS AND FAIR VALUE MEASUREMENTS (continued) |
B. Level 3 Fair Value Investments — To the extent that significant inputs to valuation models and other alternative pricing sources are unobservable, or if quotations are not readily available, or if GSAM believes that such quotations do not accurately reflect fair value, the fair value of a Fund’s investments may be determined under Valuation Procedures approved by the Trustees. GSAM, consistent with its procedures and applicable regulatory guidance, may make an adjustment to the most recent valuation prices of either domestic or foreign securities in light of significant events to reflect what it believes to be the fair value of the securities at the time of determining a Fund’s NAV. To the extent investments are valued using single source broker quotations obtained directly from the broker or passed through from third party pricing vendors, such investments are classified as Level 3 investments. GSAM did not develop the unobservable inputs for valuation of Level 3 Assets and Liabilities.
C. Fair Value Hierarchy — The following is a summary of the Funds’ investments and derivatives classified in the fair value hierarchy as of June 30, 2019:
| | | | | | | | | | | | |
| | | |
| ABSOLUTE RETURN TRACKER | | | | | | | | | | | | |
| | | |
| Investment Type | | Level 1 | | | Level 2 | | | Level 3 | |
| | | |
| Assets | | | | | | | | | | | | |
| | | |
Common Stock and/or Other Equity Investments(a) | | | | | | | | | | | | |
| | | |
Africa | | $ | — | | | $ | 1,345,977 | | | $ | — | |
| | | |
Asia | | | — | | | | 16,038,435 | | | | — | |
| | | |
Australia and Oceania | | | — | | | | 1,256,898 | | | | — | |
| | | |
Europe | | | 4,504,859 | | | | 87,158,373 | | | | 41,550 | |
| | | |
North America | | | 772,649,535 | | | | 35,278 | | | | — | |
| | | |
South America | | | — | | | | 40,350 | | | | — | |
| | | |
Exchange Traded Funds | | | 172,507,240 | | | | — | | | | — | |
| | | |
Investment Company | | | 1,758,798,801 | | | | — | | | | — | |
| | | |
Securities Lending Reinvestment Vehicle | | | 18,086,061 | | | | — | | | | — | |
| | | |
| Total | | $ | 2,726,546,496 | | | $ | 105,875,311 | | | $ | 41,550 | |
| | | |
| Derivative Type | | | | | | | | | |
| | | |
| Assets(b) | | | | | | | | | | | | |
| | | |
Forward Foreign Currency Exchange Contracts | | $ | — | | | $ | 829,122 | | | $ | — | |
| | | |
Futures Contracts | | | 14,656,587 | | | | — | | | | — | |
| | | |
Credit Default Swap Contracts | | | — | | | | 3,297,353 | | | | — | |
| | | |
Total Return Swap Contracts | | | — | | | | 812,261 | | | | — | |
| | | |
| Total | | $ | 14,656,587 | | | $ | 4,938,736 | | | $ | — | |
| | | |
| Liabilities | | | | | | | | | | | | |
| | | |
Forward Foreign Currency Exchange Contracts(b) | | $ | — | | | $ | (1,540,102 | ) | | $ | — | |
| | | |
Futures Contracts(b) | | | (5,672,675 | ) | | | — | | | | — | |
| | | |
Total Return Swap Contracts(b) | | | — | | | | (1,571,876 | ) | | | — | |
| | | |
Written Options Contracts | | | (3,464,107 | ) | | | — | | | | — | |
| | | |
| Total | | $ | (9,136,782 | ) | | $ | (3,111,978 | ) | | $ | — | |
| (a) | | Amounts are disclosed by continent to highlight the impact of time zone differences between local market close and the calculation of NAV. Security valuations are based on the principal exchange or system on which they are traded, which may differ from country of domicile. The Funds utilize fair value model prices provided by an independent third party (fair value) service for certain international equity securities, resulting in a Level 2 classification. |
| (b) | | Amount shown represents unrealized gain (loss) at period end. |
114
GOLDMAN SACHS ALTERNATIVE FUNDS
|
| 3. INVESTMENTS AND FAIR VALUE MEASUREMENTS (continued) |
| | | | | | | | | | | | |
| | | |
| ALTERNATIVE PREMIA | | | | | | | | | | | | |
| | | |
| Investment Type | | Level 1 | | | Level 2 | | | Level 3 | |
| | | |
| Assets | | | | | | | | | | | | |
| | | |
Investment Company | | $ | 64,724,963 | | | $ | — | | | $ | — | |
| | | |
| Derivative Type | | | | | | | | | |
| | | |
| Assets | | | | | | | | | | | | |
| | | |
Forward Foreign Currency Exchange Contracts(a) | | $ | — | | | $ | 2,025,841 | | | $ | — | |
| | | |
Futures Contracts(a) | | | 6,368,692 | | | | — | | | | — | |
| | | |
Credit Default Swap Contracts(a) | | | — | | | | 32,761 | | | | — | |
| | | |
Total Return Swap Contracts(a) | | | — | | | | 819,507 | | | | — | |
| | | |
Purchased Options Contracts | | | 203,745 | | | | — | | | | — | |
| | | |
| Total | | $ | 6,572,437 | | | $ | 2,878,109 | | | $ | — | |
| | | |
| Liabilities | | | | | | | | | | | | |
| | | |
Forward Foreign Currency Exchange Contracts(a) | | $ | — | | | $ | (1,591,793 | ) | | $ | — | |
| | | |
Futures Contracts(a) | | | (4,477,736 | ) | | | — | | | | — | |
| | | |
Total Return Swap Contracts(a) | | | — | | | | (543,095 | ) | | | — | |
| | | |
Written Options Contracts | | | (835,150 | ) | | | — | | | | — | |
| | | |
| Total | | $ | (5,312,886 | ) | | $ | (2,134,888 | ) | | $ | — | |
| | | |
| COMMODITY STRATEGY | | | | | | | | | | | | |
| | | |
| Investment Type | | Level 1 | | | Level 2 | | | Level 3 | |
| | | |
| Assets | | | | | | | | | | | | |
| | | |
Fixed Income | | | | | | | | | | | | |
| | | |
Mortgage-Backed Securities | | $ | — | | | $ | 8,126,111 | | | $ | — | |
| | | |
Collateralized Mortgage Obligations | | | — | | | | 4,876,490 | | | | — | |
| | | |
Commercial Mortgage-Backed Securities | | | — | | | | 21,610,172 | | | | — | |
| | | |
Asset-Backed Securities | | | — | | | | 284,706 | | | | — | |
| | | |
U.S. Treasury Obligations and/or Other U.S. Government Agencies | | | 41,554,466 | | | | — | | | | — | |
| | | |
Exchange Traded Fund | | | 75,270,000 | | | | — | | | | — | |
| | | |
Investment Company | | | 132,944,770 | | | | — | | | | — | |
| | | |
| Total | | $ | 249,769,236 | | | $ | 34,897,479 | | | $ | — | |
| (a) | | Amount shown represents unrealized gain (loss) at period end. |
115
GOLDMAN SACHS ALTERNATIVE FUNDS
Notes to Financial Statements(continued)
June 30, 2019 (Unaudited)
|
| 3. INVESTMENTS AND FAIR VALUE MEASUREMENTS (continued) |
| | | | | | | | | | | | |
| | | |
| COMMODITY STRATEGY (continued) | | | | | | | | | | | | |
| | | |
| Derivative Type | | Level 1 | | | Level 2 | | | Level 3 | |
| | | |
| Assets(a) | | | | | | | | | | | | |
| | | |
Futures Contracts | | $ | 83,944 | | | $ | — | | | $ | — | |
| | | |
Interest Rate Swap Contracts | | | — | | | | 1,610 | | | | — | |
| | | |
| Total | | $ | 83,944 | | | $ | 1,610 | | | $ | — | |
| | | |
| Liabilities(a) | | | | | | | | | | | | |
| | | |
Futures Contracts | | $ | (956,960 | ) | | $ | — | | | $ | — | |
| | | |
Total Return Swap Contracts | | | — | | | | (68,563 | ) | | | — | |
| | | |
| Total | | $ | (956,960 | ) | | $ | (68,563 | ) | | $ | — | |
| | | |
| MANAGED FUTURES STRATEGY | | | | | | | | | | | | |
| | | |
| Investment Type | | Level 1 | | | Level 2 | | | Level 3 | |
| | | |
| Assets | | | | | | | | | | | | |
| | | |
Investment Company | | $ | 165,995,774 | | | $ | — | | | $ | — | |
| | | |
| Derivative Type | | | | | | | | | |
| | | |
| Assets(a) | | | | | | | | | | | | |
| | | |
Forward Foreign Currency Exchange Contracts | | $ | — | | | $ | 1,882,103 | | | $ | — | |
| | | |
Futures Contracts | | | 2,440,537 | | | | — | | | | — | |
| | | |
Interest Rate Swap Contracts | | | — | | | | 15,532,292 | | | | — | |
| | | |
| Total | | $ | 2,440,537 | | | $ | 17,414,395 | | | $ | — | |
| | | |
| Liabilities(a) | | | | | | | | | | | | |
| | | |
Forward Foreign Currency Exchange Contracts | | $ | — | | | $ | (3,520,968 | ) | | $ | — | |
| | | |
Futures Contracts | | | (2,870,798 | ) | | | — | | | | — | |
| | | |
Interest Rate Swap Contracts | | | — | | | | (1,221,417 | ) | | | — | |
| | | |
| Total | | $ | (2,870,798 | ) | | $ | (4,742,385 | ) | | $ | — | |
| (a) | | Amount shown represents unrealized gain (loss) at period end. |
For further information regarding security characteristics, see the Consolidated Schedules of Investments.
|
| 4. INVESTMENTS IN DERIVATIVES |
The following tables set forth, by certain risk types, the gross value of derivative contracts (not considered to be hedging instruments for accounting disclosure purposes) as of June 30, 2019. These instruments were used as part of the Funds’ investment strategies and to obtain and/or manage exposure related to the risks below. The values in the tables below exclude the effects of
116
GOLDMAN SACHS ALTERNATIVE FUNDS
|
| 4. INVESTMENTS IN DERIVATIVES (continued) |
cash collateral received or posted pursuant to these derivative contracts, and therefore are not representative of the Funds’ net exposure.
| | | | | | | | | | | | |
| | | |
| ABSOLUTE RETURN TRACKER | | | | | | | | | | |
| Risk | | Consolidated Statements of Assets
and Liabilities | | Assets | | | Consolidated Statements of Assets
and Liabilities | | Liabilities | |
Commodity | | Variation margin on futures contracts | | $ | 827,910 | (a) | | Payable for unrealized loss on swap contracts and Variation margin on futures contracts | | $ | (846,325) | (a)(b) |
Credit | | Variation margin on swap contracts | | | 3,297,353 | (a) | | — | | | — | |
Currency | | Receivable for unrealized gain on forward foreign currency exchange contracts | | | 829,122 | | | Payable for unrealized loss on forward foreign currency exchange contracts | | | (1,540,102) | |
Equity | | Receivable for unrealized gain on swap contracts and variation margin on futures contracts | | | 2,937,361 | (a) | | Written options, at value and variation margin on futures contracts | | | (9,862,333) | (a)(b) |
Interest Rate | | Variation margin on futures contracts | | | 11,703,577 | (a) | | — | | | — | |
| Total | | | | $ | 19,595,323 | | | | | $ | (12,248,760) | |
| | | |
| ALTERNATIVE PREMIA | | | | | | | | | | |
| Risk | | Consolidated Statements of Assets
and Liabilities | | Assets | | | Consolidated Statements of Assets
and Liabilities | | Liabilities | |
Commodity | | Variation margin on futures contracts | | $ | 5,516,203 | (a) | | Variation margin on futures contracts | | $ | (4,312,221) | (a) |
Credit | | Variation margin on swap contracts | | | 32,761 | (a) | | — | | | — | |
Currency | | Receivable for unrealized gain on forward foreign currency exchange contracts and variation margin on futures contracts | | | 2,097,024 | (a) | | Payable for unrealized loss on forward foreign currency exchange contracts and variation margin on futures contracts | | | (1,675,923) | (a) |
Equity | | Receivable for unrealized gain on swap contracts, Purchased options at value and variation margin on futures contracts | | | 1,204,794 | (a) | | Payable for unrealized loss on swap contracts, Written options, at value and variation margin on futures contracts | | | (1,383,867) | (a)(b) |
Interest Rate | | Variation margin on futures contracts | | | 599,764 | (a) | | Variation margin on futures contracts | | | (75,763) | (a) |
| Total | | | | $ | 9,450,546 | | | | | $ | (7,447,774) | |
| (a) | | Includes unrealized gain (loss) on futures contracts and centrally cleared swap contracts described in the Additional Investment Information sections of the Consolidated Schedules of Investments. Only the variation margin as of June 30, 2019 is reported within the Consolidated Statements of Assets and Liabilities. |
| (b) | | Aggregate of amounts include $1,571,876, $543,095 and $68,563 for the Absolute Return Tracker, Alternative Premia and Commodity Strategy Funds, respectively, which represent the payments to be made pursuant to bilateral agreements should counterparties exercise their “right to terminate” provisions based on, among others, the Fund’s performance, their failure to pay on their obligations or failure to pledge collateral. Such amounts do not include incremental charges directly associated with the close-out of the agreements. They also do not reflect the fair value of any assets pledged as collateral which, through the daily margining process, substantially offsets the aforementioned amounts and for which the Funds are entitled to a full return. |
117
GOLDMAN SACHS ALTERNATIVE FUNDS
Notes to Financial Statements(continued)
June 30, 2019 (Unaudited)
|
| 4. INVESTMENTS IN DERIVATIVES (continued) |
| | | | | | | | | | | | |
| | | |
| COMMODITY STRATEGY | | | | | | | | | | |
| Risk | | Consolidated Statements of Assets
and Liabilities | | Assets | | | Consolidated Statements of Assets
and Liabilities | | Liabilities | |
Commodity | | — | | $ | — | | | Payable for unrealized loss on swap contracts | | $ | (68,563) | |
Interest Rate | | Variation margin on futures and swaps contracts | | | 85,554 | (a) | | Variation margin on futures contracts | | | (956,960) | (a) |
| Total | | | | $ | 85,554 | | | | | $ | (1,025,523) | |
| | | |
| MANAGED FUTURES STRATEGY | | | | | | | | | | |
| Risk | | Consolidated Statements of Assets
and Liabilities | | Assets | | | Consolidated Statements of Assets
and Liabilities | | Liabilities | |
Commodity | | Variation margin on futures contracts | | $ | 962,503 | (a) | | Variation margin on futures contracts | | $ | (1,596,497) | (a) |
Currency | | Receivable for unrealized gain on forward foreign currency exchange contracts | | | 1,882,103 | | | Payable for unrealized loss on forward foreign currency exchange contracts | | | (3,520,968) | |
Equity | | Variation margin on futures contracts | | | 1,478,034 | (a) | | Variation margin on futures contracts | | | (1,274,301) | (a) |
Interest Rate | | Variation margin on swap contracts | | | 15,532,292 | (a) | | Variation margin on swap contracts | | | (1,221,417) | (a) |
| Total | | | | $ | 19,854,932 | | | | | $ | (7,613,183) | |
| (a) | | Includes unrealized gain (loss) on futures contracts and centrally cleared swap contracts described in the Additional Investment Information sections of the Consolidated Schedules of Investments. Only the variation margin as of June 30, 2019 is reported within the Consolidated Statements of Assets and Liabilities. |
| (b) | | Aggregate of amounts include $1,571,876, $543,095 and $68,563 for the Absolute Return Tracker, Alternative Premia and Commodity Strategy Funds, respectively, which represent the payments to be made pursuant to bilateral agreements should counterparties exercise their "right to terminate" provisions based on, among others, the Fund’s performance, their failure to pay on their obligations or failure to pledge collateral. Such amounts do not include incremental charges directly associated with the close-out of the agreements. They also do not reflect the fair value of any assets pledged as collateral which, through the daily margining process, substantially offsets the aforementioned amounts and for which the Funds are entitled to a full return. |
The following tables set forth, by certain risk types, the Funds’ gains (losses) related to these derivatives and their indicative volumes for the six months ended June 30, 2019. These gains (losses) should be considered in the context that these derivative contracts may have been executed to create investment opportunities and/or economically hedge certain investments, and accordingly, certain gains (losses) on such derivative contracts may offset certain (losses) gains attributable to investments. These
118
GOLDMAN SACHS ALTERNATIVE FUNDS
|
| 4. INVESTMENTS IN DERIVATIVES (continued) |
gains (losses) are included in “Net realized gain (loss)” or “Net change in unrealized gain (loss)” on the Consolidated Statements of Operations:
| | | | | | | | | | | | | | |
| | | |
| ABSOLUTE RETURN TRACKER | | | | | | | | | | | | |
| Risk | | Consolidated Statements of Operations | | Net Realized
Gain (Loss) | | | Net Change in
Unrealized
Gain (Loss) | | | Average
Number of
Contracts(a) | |
| Commodity | | Net realized gain (loss) from futures contracts and swap contracts/Net change in unrealized gain (loss) on futures contracts and swap contracts | | $ | (378,445 | ) | | $ | (764,444 | ) | | | 363 | |
| Credit | | Net realized gain (loss) from swap contracts/Net change in unrealized gain (loss) on swap contracts | | | 2,977,108 | | | | 8,080,478 | | | | 4 | |
| Currency | | Net realized gain (loss) from forward foreign currency exchange contracts/Net change in unrealized gain (loss) on forward foreign currency exchange contracts | | | (1,521,062 | ) | | | 107,486 | | | | 26 | |
| Equity | | Net realized gain (loss) from futures contracts, swap contracts and written options/Net change in unrealized gain (loss) on futures contracts, swap contracts and written options | | | (978,039 | ) | | | 999,763 | | | | 7,006 | |
| Interest rate | | Net realized gain (loss) from futures contracts/Net change in unrealized gain (loss) on futures contracts | | | 26,198,815 | | | | 4,880,041 | | | | 8,059 | |
| Total | | | | $ | 26,298,377 | | | $ | 13,303,324 | | | | 15,458 | |
| | | |
| ALTERNATIVE PREMIA | | | | | | | | | | | | |
| Risk | | Consolidated Statements of Operations | | Net Realized
Gain (Loss) | | | Net Change in
Unrealized
Gain (Loss) | | | Average
Number of
Contracts(a) | |
| Commodity | | Net realized gain (loss) from futures contracts/Net change in unrealized gain (loss) on futures contracts | | $ | (2,008,957 | ) | | $ | 722,785 | | | | 5,824 | |
| Credit | | Net realized gain (loss) from swap contracts/Net change in unrealized gain (loss) on swap contracts | | | 6,236 | | | | 25,539 | | | | 4 | |
| Currency | | Net realized gain (loss) from futures contracts and forward foreign currency exchange contracts/Net change in unrealized gain (loss) on futures contracts and forward foreign currency exchange contracts | | | 1,043,256 | | | | 1,018,818 | | | | 331 | |
| Equity | | Net realized gain (loss) from futures contracts, purchased options, swap contracts and written option/Net change in unrealized gain (loss) on futures contracts, purchased options, swap contracts and written options | | | (2,029,296 | ) | | | 971,883 | | | | 2,500 | |
| Interest rate | | Net realized gain (loss) from futures contracts/Net change in unrealized gain (loss) on futures contracts | | | 1,032,714 | | | | 17,610 | | | | 866 | |
| Total | | | | $ | (1,956,047 | ) | | $ | 2,756,635 | | | | 9,525 | |
| (a) | | Average number of contracts is based on the average of month end balances for the six months ended June 30, 2019. |
119
GOLDMAN SACHS ALTERNATIVE FUNDS
Notes to Financial Statements(continued)
June 30, 2019 (Unaudited)
|
| 4. INVESTMENTS IN DERIVATIVES (continued) |
| | | | | | | | | | | | | | |
| | | |
| COMMODITY STRATEGY | | | | | | | | | | | | |
| Risk | | Consolidated Statements of Operations | | Net Realized
Gain (Loss) | | | Net Change in
Unrealized
Gain (Loss) | | | Average
Number of
Contracts(a) | |
| Commodity | | Net realized gain (loss) from swap contracts/Net change in unrealized gain (loss) on swap contracts | | $ | 36,696,134 | | | $ | (68,563 | ) | | | 5 | |
| Interest rate | | Net realized gain (loss) from futures contracts, purchased options and swap contracts/Net change in unrealized gain (loss) on futures contracts and swap contracts | | | (2,878,197 | ) | | | 702,319 | | | | 420 | |
| Total | | | | $ | 33,817,937 | | | $ | 633,756 | | | | 425 | |
| | | |
| MANAGED FUTURES STRATEGY | | | | | | | | | | | | |
| Risk | | Consolidated Statements of Operations | | Net Realized
Gain (Loss) | | | Net Change in
Unrealized
Gain (Loss) | | | Average
Number of
Contracts(a) | |
| Commodity | | Net realized gain (loss) from futures contracts/Net change in unrealized gain (loss) on futures contracts | | $ | (4,926,154 | ) | | $ | (480,160 | ) | | | 1,537 | |
| Currency | | Net realized gain (loss) from forward foreign currency exchange contracts/Net change in unrealized gain (loss) on forward foreign currency exchange contracts | | | (140,887 | ) | | | (1,949,320 | ) | | | 181 | |
| Equity | | Net realized gain (loss) from futures contracts/Net change in unrealized gain (loss) on futures contracts | | | (4,830,821 | ) | | | (1,157,184 | ) | | | 5,591 | |
| Interest rate | | Net realized gain (loss) from futures contracts and swap contracts/Net change in unrealized gain (loss) on swap contracts | | | 13,157,952 | | | | 10,273,935 | | | | 300 | |
| Total | | | | $ | 3,260,090 | | | $ | 6,687,271 | | | | 7,609 | |
| (a) | | Average number of contracts is based on the average of month end balances for the six months ended June 30, 2019. |
In order to better define its contractual rights and to secure rights that will help a Fund mitigate its counterparty risk, a Fund may enter into an International Swaps and Derivatives Association, Inc. Master Agreement (“ISDA Master Agreement”) or similar agreement with its derivatives counterparties. An ISDA Master Agreement is a bilateral agreement between a Fund and a counterparty that governs OTC derivatives (including forward foreign currency exchange contracts, and certain options and swaps), and typically contains, among other things, collateral posting terms and netting provisions in the event of a default and/or termination event. The provisions of the ISDA Master Agreement typically permit a single net payment in the event of a default (close-out netting) or similar event, including the bankruptcy or insolvency of the counterparty.
Collateral and margin requirements differ between exchange traded derivatives and OTC derivatives. Margin requirements are established by the broker or clearing house for exchange-traded and centrally cleared derivatives (financial futures contracts, options and centrally cleared swaps) pursuant to governing agreements for those instrument types. Brokers can ask for margin in excess of the minimum in certain circumstances. Collateral terms are contract-specific for OTC derivatives. For derivatives traded under an ISDA Master Agreement, the collateral requirements are typically calculated by netting the marked to market amount for each transaction under such agreement and comparing that amount to the value of any collateral currently pledged by a Fund and the counterparty. Additionally, a Fund may be required to post initial margin to the counterparty, the terms of which would be outlined in the confirmation of the OTC transaction.
For financial reporting purposes, cash collateral that has been pledged to cover obligations of a Fund and cash collateral received from the counterparty, if any, is reported separately on the Consolidated Statements of Assets and Liabilities as receivables/payables for collateral on certain derivative contracts.Non-cash collateral pledged by a Fund, if any, is noted in the Consolidated Schedules of Investments. Generally, the amount of collateral due from or to a counterparty must exceed a minimum
120
GOLDMAN SACHS ALTERNATIVE FUNDS
|
| 4. INVESTMENTS IN DERIVATIVES (continued) |
transfer amount threshold before a transfer is required to be made. To the extent amounts due to a Fund from its counterparties are not fully collateralized, contractually or otherwise, the Fund bears the risk of loss from counterparty nonperformance. A Fund attempts to mitigate counterparty risk by only entering into agreements with counterparties that the Investment Adviser believes to be of good standing and by monitoring the financial stability of those counterparties.
Additionally, the netting of assets and liabilities and the offsetting of collateral pledged or received are based on contractual netting/set-off provisions in the ISDA Master Agreement or similar agreements. However, in the event of a default or insolvency of a counterparty, a court could determine that such rights are not enforceable due to the restrictions or prohibitions against the right of setoff that may be imposed in accordance with a particular jurisdiction’s bankruptcy or insolvency laws.
The following tables set forth the Funds’ net exposure for derivative instruments that are subject to enforceable master netting arrangements or similar agreements as of June 30, 2019:
| | | | | | | | | | | | | | | | | | | | | | | | | | | | |
| | | |
| ALTERNATIVE PREMIA | | | | | | | | | | | | | |
| | | Derivative Assets(1) | | | Derivative Liabilities(1) | | | Net Derivative
Assets
(Liabilities) | | | Collateral
(Received)
Pledged (1) | | | Net
Amount(2) | |
| Counterparty | | Forwards | | | Swaps | | | Forwards | | | Swaps | |
Morgan Stanley Co., Inc. | | $ | 2,025,841 | | | $ | — | | | $ | (1,591,793 | ) | | $ | — | | | $ | 434,048 | | | $ | — | | | $ | 434,048 | |
Deutsche Bank AG | | | — | | | | 116,147 | | | | — | | | | — | | | | 116,147 | | | | — | | | | 116,147 | |
JPMorgan Chase Bank NA | | | — | | | | 703,360 | | | | — | | | | (543,095 | ) | | | 160,265 | | | | — | | | | 160,265 | |
| | | | | | | |
Total | | $ | 2,025,841 | | | $ | 819,507 | | | $ | (1,591,793 | ) | | $ | (543,095 | ) | | $ | 710,460 | | | $ | — | | | $ | 710,460 | |
| (1) | | Gross amounts available for offset but not netted in the Consolidated Statements of Assets and Liabilities. |
| (2) | | Net amount represents the net amount due (to) from counterparty in the event of a default based on the contractual set-off rights under the agreement. |
| | | | | | | | | | | | | | | | | | | | | | |
| | | |
| MANAGED FUTURES STRATEGY | | | | | | | | | | | | | |
| | | | | Derivative
Assets(1) | | | Derivative
Liabilities(1) | | | Net Derivative
Assets
(Liabilities) | | | Collateral
(Received)
Pledged(1) | | | Net
Amount(2) | |
| Counterparty | | | | Forwards | | | Forwards | |
Morgan Stanley Co., Inc. | | | | $ | 1,882,103 | | | $ | (3,520,968 | ) | | $ | (1,638,865 | ) | | $ | 1,638,865 | | | $ | — | |
| (1) | | Gross amounts available for offset but not netted in the Consolidated Statements of Assets and Liabilities. |
| (2) | | Net amount represents the net amount due (to) from counterparty in the event of a default based on the contractual set-off rights under the agreement. |
|
| 5. AGREEMENTS AND AFFILIATED TRANSACTIONS |
A. Management Agreement — Under the Agreement, GSAM manages the Funds, subject to the general supervision of the Trustees.
As compensation for the services rendered pursuant to the Agreement, the assumption of the expenses related thereto and administration of the Funds’ business affairs, including providing facilities, GSAM is entitled to a management fee, accrued daily and paid monthly, equal to an annual percentage rate of each Fund’s average daily net assets.
121
GOLDMAN SACHS ALTERNATIVE FUNDS
Notes to Financial Statements(continued)
June 30, 2019 (Unaudited)
|
| 5. AGREEMENTS AND AFFILIATED TRANSACTIONS (continued) |
For the six months ended June 30, 2019, contractual and effective net management fees with GSAM were at the following rates:
| | | | | | | | | | | | | | | | | | | | | | | | | | | | | | |
| | | | | Contractual Management Rate | | | | | | Effective Net
Management
Rate^(1) | |
| Fund | | | | First
$1 billion | | | Next
$1 billion | | | Next
$3 billion | | | Next
$3 billion | | | Over
$8 billion | | | Effective
Rate | |
Absolute Return Tracker | | | | | 0.70 | % | | | 0.63 | % | | | 0.60 | % | | | 0.59 | % | | | 0.53 | % | | | 0.65 | % | | | 0.54 | % |
Alternative Premia | | | | | 0.79 | | | | 0.71 | | | | 0.68 | | | | 0.66 | | | | 0.65 | | | | 0.79 | | | | 0.66 | |
Commodity Strategy | | | | | 0.50 | | | | 0.50 | | | | 0.45 | | | | 0.43 | | | | 0.42 | | | | 0.50 | | | | 0.41 | |
Managed Futures Strategy | | | | | 1.00 | | | | 0.90 | | | | 0.86 | | | | 0.84 | | | | 0.82 | | | | 1.00 | | | | 0.89 | |
| ^ | | Effective Net Management Rate includes the impact of management fee waivers of affiliated underlying funds, if any. The Effective Net Management Rate may not correlate to the Contractual Management Rate as a result of management fee waivers that may be in effect from time to time. |
| (1) | | Reflects combined management fees paid to GSAM under the Agreement and the Funds’ Subsidiary Agreements (as defined below) after the waivers. |
GSAM also provides management services to the Subsidiaries pursuant to a Subsidiary Management Agreement (the “Subsidiary Agreement”) and is entitled to a management fee accrued daily and paid monthly, equal to an annual percentage rate of 0.42% of each Subsidiary’s average daily net assets. In consideration of the Subsidiary’s management fee, and for as long as the Subsidiary Agreement remains in effect, GSAM has contractually agreed to waive irrevocably a portion of each Fund’s management fee in an amount equal to the management fee accrued and paid to GSAM by the Subsidiary under the Subsidiary Agreement. For the six months ended June 30, 2019, GSAM waived $27,032, $24,641, $135,092 and $95,286 of each Fund’s management fee for Absolute Return Tracker, Alternative Premia, Commodity Strategy and Managed Futures Strategy Funds, respectively. This waiver represents an inter-fund transaction and, accordingly, has been eliminated in consolidation.
The Funds invest in Institutional Shares of the Goldman Sachs Financial Square Government Fund, which is an affiliated Underlying Fund. GSAM has agreed to waive a portion of its management fee payable by the Funds in an amount equal to the management fee it earns as an investment adviser to the affiliated Underlying Fund in which the Funds invest, except those management fees it earns from the Funds’ investments of cash collateral received in connection with securities lending transactions in the Goldman Sachs Financial Square Government Fund. For the six months ended June 30, 2019, GSAM waived $1,426,294, $57,643, $164,985 and $131,826 of the Absolute Return Tracker, Alternative Premia, Commodity Strategy and Managed Futures Strategy Funds’ management fees, respectively.
B. Distribution and/or Service (12b-1) Plans — The Trust, on behalf of Class A and Class R Shares of each applicable Fund, has adopted Distribution and Service Plans subject to Rule 12b-1 under the Act. Under the Distribution and Service Plans, Goldman Sachs, which serves as distributor (the “Distributor”), is entitled to a fee accrued daily and paid monthly for distribution services and personal and account maintenance services, which may then be paid by Goldman Sachs to authorized dealers. These fees are equal to an annual percentage rate of the average daily net assets attributable to Class A or Class R Shares of the Funds, as set forth below.
The Trust, on behalf of Class C Shares of each applicable Fund, has adopted a Distribution Plan subject to Rule 12b-1 under the Act. Under the Distribution Plan, Goldman Sachs as Distributor is entitled to a fee accrued daily and paid monthly for distribution services, which may then be paid by Goldman Sachs to authorized dealers. These fees are equal to an annual percentage rate of the average daily net assets attributable to Class C Shares of the Funds, as set forth below.
| | | | | | | | | | | | |
| | | Distribution and/or Service Plan Rates | |
| | | Class A* | | | Class C | | | Class R* | |
Distribution and/or Service Plan | | | 0.25 | % | | | 0.75 | % | | | 0.50 | % |
| * | | With respect to Class A and Class R Shares, the Distributor at its discretion may use compensation for distribution services paid under the Distribution Plan to compensate service organizations for personal and account maintenance services and expenses as long as such total compensation does not exceed the maximum cap on “service fees” imposed by the Financial Industry Regulatory Authority. |
122
GOLDMAN SACHS ALTERNATIVE FUNDS
|
| 5. AGREEMENTS AND AFFILIATED TRANSACTIONS (continued) |
C. Distribution Agreement— Goldman Sachs, as Distributor of the shares of the Funds pursuant to a Distribution Agreement, may retain a portion of the Class A Shares’ front end sales charge and Class C Shares’ CDSC. During the six months ended June 30, 2019, Goldman Sachs retained the following amounts:
| | | | | | | | | | |
| | | | | Front End
Sales Charge | | | Contingent Deferred
Sales Charge | |
| Fund | | | | Class A | | | Class C | |
Absolute Return Tracker | | | | $ | 4,662 | | | $ | — | |
Alternative Premia | | | | | 52 | | | | 6 | |
Commodity Strategy | | | | | 1,965 | | | | — | |
Managed Futures Strategy | | | | | 585 | | | | — | |
D. Service Plan— The Trust, on behalf of each applicable Fund, has adopted a Service Plan to allow Class C Shares to compensate service organizations (including Goldman Sachs) for providing varying levels of personal and account maintenance services to their customers who are beneficial owners of such shares. The Service Plan provides for compensation to the service organizations equal to an annual percentage rate of 0.25% of the average daily net assets attributable to Class C Shares of the Funds.
E. Transfer Agency Agreement — Goldman Sachs also serves as the transfer agent of the Funds for a fee pursuant to the Transfer Agency Agreement. The fees charged for such transfer agency services are accrued daily and paid monthly at annual rates as follows: 0.18% (except for the Commodity Strategy Fund, which charges an annual rate of 0.13%) of the average daily net assets of Class A, Class C, Investor and Class R Shares; 0.03% of the average daily net assets of Class P and Class R6 Shares; and 0.04% of the average daily net assets of Institutional Shares.
F. Other Expense Agreements and Affiliated Transactions— GSAM has agreed to reduce or limit certain “Other Expenses” of the Funds (excluding acquired fund fees and expenses, transfer agency fees and expenses, service fees and shareholder administration fees (as applicable), taxes, interest, brokerage fees, expenses of shareholder meetings, litigation and indemnification, and extraordinary expenses) to the extent such expenses exceed, on an annual basis, a percentage rate of the average daily net assets of each Fund. Such Other Expense reimbursements, if any, are accrued daily and paid monthly. In addition, the Funds are not obligated to reimburse GSAM for prior fiscal year expense reimbursements, if any. The Other Expense limitations as an annual percentage rate of average daily net assets for the Absolute Return Tracker, Alternative Premia, Commodity Strategy and Managed Futures Strategy Funds are 0.014%, 0.114%, 0.074% and 0.254%, respectively. These Other Expense limitations will remain in place through at least April 30, 2020, and prior to such date GSAM may not terminate the arrangements without the approval of the Trustees. The Subsidiaries also pay certain other expenses, including service and custody fees. GSAM has agreed to reduce or limit each Subsidiary’s expenses (excluding management fees) to 0.004% of the Subsidiary’s average daily net assets for the Absolute Return Tracker, Alternative Premia, Commodity Strategy and Managed Futures Strategy Funds. In addition, the Funds have entered into certain offset arrangements with the custodian and the transfer agent, which may result in a reduction of the Funds’ expenses and are received irrespective of the application of the “Other Expense” limitations described above.
123
GOLDMAN SACHS ALTERNATIVE FUNDS
Notes to Financial Statements(continued)
June 30, 2019 (Unaudited)
|
| 5. AGREEMENTS AND AFFILIATED TRANSACTIONS (continued) |
For the six months ended June 30, 2019, these expense reductions, including any fee waivers and Other Expense reimbursements, were as follows:
| | | | | | | | | | | | | | | | | | |
| Fund | | | | Management
Fee Waiver | | | Other
Expense
Reimbursement | | | Custody Fee
Credits | | | Total
Expense
Reductions | |
Absolute Return Tracker | | | | $ | 1,426,294 | | | $ | 355,341 | | | $ | 105,491 | | | $ | 1,887,126 | |
Alternative Premia | | | | | 57,643 | | | | 220,764 | | | | 18,337 | | | | 296,744 | |
Commodity Strategy | | | | | 164,985 | | | | 153,901 | | | | 54,720 | | | | 373,606 | |
Managed Futures Strategy | | | | | 131,826 | | | | 11,893 | | | | 24,234 | | | | 167,953 | |
G. Line of Credit Facility— As of June 30, 2019, the Funds participated in a $580,000,000 committed, unsecured revolving line of credit facility (the “facility”) together with other funds of the Trust and certain registered investment companies having management agreements with GSAM or its affiliates. This facility is to be used for temporary emergency purposes, or to allow for an orderly liquidation of securities to meet redemption requests. The interest rate on borrowings is based on the federal funds rate. The facility also requires a fee to be paid by the Funds based on the amount of the commitment that has not been utilized. For the six months ended June 30, 2019, the Funds did not have any borrowings under the facility. Prior to April 30, 2019 the facility was $770,000,000.
H. Other Transactions with Affiliates— The following table provides information about the Funds’ investment in the Goldman Sachs Financial Square Government Fund as of and for the six months ended June 30, 2019:
| | | | | | | | | | | | | | | | | | | | | | | | | | | | |
| Fund | | | | | Beginning
Value as of
December 31, 2018 | | | Purchases
at Cost | | | Proceeds
from Sales | | | Ending Value as of June 30, 2019 | | | Shares as of
June 30, 2019 | | | Dividend Income from
Affiliated
Investment
Company | |
Absolute Return Tracker | | | | | | $ | 1,729,310,513 | | | $ | 609,690,228 | | | $ | (580,201,940 | ) | | $ | 1,758,798,801 | | | | 1,758,798,801 | | | $ | 20,920,412 | |
Alternative Premia | | | | | | | 91,312,279 | | | | 162,406,170 | | | | (188,993,486 | ) | | | 64,724,963 | | | | 64,724,963 | | | �� | 861,001 | |
Commodity Strategy | | | | | | | 113,968,231 | | | | 308,956,756 | | | | (289,980,217 | ) | | | 132,944,770 | | | | 132,944,770 | | | | 1,836,158 | |
Managed Futures Strategy | | | | | | | 195,709,998 | | | | 106,322,230 | | | | (136,036,454 | ) | | | 165,995,774 | | | | 165,995,774 | | | | 2,024,677 | |
The Commodity Strategy Fund invests in the shares of the Goldman Sachs Access Treasury 0-1 Year ETF. The Goldman Sachs Access Treasury 0-1 Year ETF is considered to be affiliated with the Fund. The table below shows the transactions in and earnings from investments in the Goldman Sachs Access Treasury 0-1 Year ETF as of and for the six months ended June 30, 2019:
| | | | | | | | | | | | | | | | | | | | | | | | | | | | | | | | | | |
| Fund | | Affiliated Investment Company | | Beginning
Value as of
December 31, 2018 | | | Purchases
at Cost | | | Proceeds
from Sales | | | Net Realized Gain (Loss) on sale of
Affiliated Investment
Company | | | Change in
Unrealized
Appreciation
(Depreciation) | | | Ending
Value as of
June 30, 2019 | | | Shares as of
June 30, 2019 | | | Dividend Income from
Affiliated
Investment
Company | |
Commodity Strategy | | Goldman Sachs Access Treasury0-1 Year ETF | | $ | 75,037,500 | | | $ | — | | | $ | — | | | $ | — | | | $ | 232,500 | | | $ | 75,270,000 | | | | 750,000 | | | $ | 720,615 | |
124
GOLDMAN SACHS ALTERNATIVE FUNDS
|
| 5. AGREEMENTS AND AFFILIATED TRANSACTIONS (continued) |
As of June 30, 2019, the following Goldman Sachs Fund of Funds Portfolios were beneficial owners of 5% or more of total outstanding shares of the following Funds:
| | | | | | | | | | | | | | |
| Fund | | | | Goldman Sachs
Balanced Strategy
Portfolio | | | Goldman Sachs
Growth and Income
Strategy Portfolio | | | Goldman Sachs
Growth Strategy
Portfolio | |
Alternative Premia | | | | | 13 | % | | | 17 | % | | | 12 | % |
Managed Futures Strategy | | | | | 7 | | | | 9 | | | | 6 | |
As of June 30, 2019, The Goldman Sachs Group, Inc. was the beneficial owner of the following Fund:
| | | | | | | | | | |
| Fund | | | | Class P | | | Class R | |
Alternative Premia | | | | | 73 | % | | | 7 | % |
|
| 6. PORTFOLIO SECURITIES TRANSACTIONS |
The cost of purchases and proceeds from sales and maturities oflong-term securities for the six months ended June 30, 2019, were as follows:
| | | | | | | | | | | | | | | | | | |
| Fund | | | | Purchases of
U.S. Government and
Agency Obligations | | | Purchases (Excluding
U.S. Government and
Agency Obligations) | | | Sales and
Maturities of
U.S. Government and
Agency Obligations | | | Sales and
Maturities (Excluding
U.S. Government and
Agency Obligations) | |
Absolute Return Tracker | | | | $ | — | | | $ | 737,205,236 | | | $ | — | | | $ | 601,243,402 | |
Commodity Strategy | | | | | 44,409,211 | | | | 48,950 | | | | 41,245,640 | | | | 292,028 | |
Pursuant to exemptive relief granted by the Securities and Exchange Commission (“SEC”) and the terms and conditions contained therein, the Absolute Return Tracker Fund may lend its securities through a securities lending agent, Goldman Sachs Agency Lending (“GSAL”), awholly-owned subsidiary of Goldman Sachs, to certain qualified borrowers including Goldman Sachs and affiliates. In accordance with the Fund’s securities lending procedures, the Fund receives cash collateral at least equal to the market value of the securities on loan. The market value of the loaned securities is determined at the close of business of the Fund, at their last sale price or official closing price on the principal exchange or system on which they are traded, and any additional required collateral is delivered to the Fund on the next business day. As with other extensions of credit, the Fund may experience delay in the recovery of their securities or incur a loss should the borrower of the securities breach its agreement with the Fund or become insolvent at a time when the collateral is insufficient to cover the cost of repurchasing securities on loan. Dividend income received from securities on loan may not be subject to withholding taxes and therefore withholding taxes paid may differ from the amounts listed in the Consolidated Statements of Operations. Loans of securities are terminable at any time and as such 1) the remaining contractual maturities of the outstanding securities lending transactions are considered to be overnight and continuous and 2) the borrower, after notice, is required to return borrowed securities within the standard time period for settlement of securities transactions.
The Absolute Return Tracker Fund invests the cash collateral received in connection with securities lending transactions in the Goldman Sachs Financial Square Government Fund (“Government Money Market Fund”), an affiliated series of the Goldman Sachs Trust. The Government Money Market Fund is registered under the Act as an open end investment company, is subject to Rule 2a-7 under the Act, and is managed by GSAM, for which GSAM may receive a management fee of up to 0.16% on an annualized basis of the average daily net assets of the Government Money Market Fund.
125
GOLDMAN SACHS ALTERNATIVE FUNDS
Notes to Financial Statements(continued)
June 30, 2019 (Unaudited)
|
| 7. SECURITIES LENDING (continued) |
In the event of a default by a borrower with respect to any loan, GSAL will exercise any and all remedies provided under the applicable borrower agreement to make the Fund whole. These remedies include purchasing replacement securities by applying the collateral held from the defaulting broker against the purchase cost of the replacement securities. If GSAL is unable to purchase replacement securities, GSAL will indemnify the Fund by paying the Fund an amount equal to the market value of the securities loaned minus the value of cash collateral received from the borrower for the loan, subject to an exclusion for any shortfalls resulting from a loss of value in such cash collateral due to reinvestment risk. The Fund may enter into master netting agreements with borrowers, which provide the right, in the event of a default (including bankruptcy or insolvency), for the non-defaulting party to liquidate the collateral and calculate net exposure to the defaulting party or request additional collateral. However, in the event of a default by a borrower, a resolution authority could determine that such rights are not enforceable due to the restrictions or prohibitions against the right of set-off that may be imposed in accordance with a particular jurisdiction’s bankruptcy or insolvency laws. The Fund’s loaned securities were all subject to enforceable Securities Lending Agreements and the value of the collateral was at least equal to the value of the cash received. The amounts of the Fund’s overnight and continuous agreements, which represent the gross amounts of recognized liabilities for securities lending transactions outstanding as of June 30, 2019, are disclosed as “Payable upon return of securities loaned” on the Consolidated Statements of Assets and Liabilities, where applicable.
Both the Absolute Return Tracker Fund and GSAL received compensation relating to the lending of the Fund’s securities. The amounts earned, if any, by the Fund for the six months ended June 30, 2019, are reported under Investment Income on the Consolidated Statements of Operations.
The table below details securities lending activity with affiliates of Goldman Sachs:
| | | | | | | | | | | | | | |
| | | | | For the Six Months Ended June 30, 2019 | | | Amount Payable to
Goldman Sachs
Upon Return of
Securities Loaned as of
June 30, 2019 | |
| Fund | | | | Earnings of GSAL
Relating to
Securities
Loaned | | | Amount Received
by the Fund
from Lending to
Goldman Sachs | |
Absolute Return Tracker | | | | $ | 12,095 | | | $ | 3,030 | | | $ | 1,332,900 | |
The following table provides information about the Fund’s investment in the Government Money Market Fund for the six months ended June 30, 2019:
| | | | | | | | | | | | | | | | |
| Fund | | Beginning Value as of
December 31, 2018 | | | Purchases
at Cost | | | Proceeds
from Sales | | | Ending Value as of
June 30, 2019 | |
Absolute Return Tracker | | $ | 62,495,245 | | | $ | 147,290,920 | | | $ | (191,700,104 | ) | | $ | 18,086,061 | |
As of the Funds’ most recent fiscal year end, December 31, 2018, the Funds’ capital loss carryforwards and certain timing differences, on a tax-basis were as follows:
| | | | | | | | | | | | | | | | |
| | | Absolute
Return Tracker | | | Alternative
Premia | | | Commodity
Strategy | | | Managed
Futures Strategy | |
Capital loss carryforwards: | | | | | | | | | | | | | | | | |
PerpetualShort-term | | $ | — | | | $ | (1,596,536 | ) | | $ | (5,642,612 | ) | | $ | — | |
PerpetualLong-term | | | — | | | | (607,760 | ) | | | (12,209,074 | ) | | | — | |
Total capital loss carryforwards | | $ | — | | | $ | (2,204,296 | ) | | $ | (17,851,686 | ) | | $ | — | |
Timing differences (Post October Loss Deferral, Qualified Late Year Loss Deferral and Straddle Loss Deferral) | | $ | (30,623,186 | ) | | $ | (285,908 | ) | | $ | (1,990,865 | ) | | $ | (7,630 | ) |
126
GOLDMAN SACHS ALTERNATIVE FUNDS
|
| 8. TAX INFORMATION (continued) |
As of June 30, 2019, the Funds’ aggregate security unrealized gains and losses based on cost for U.S. federal income tax purposes were as follows:
| | | | | | | | | | | | | | | | |
| | | Absolute
Return Tracker | | | Alternative
Premia | | | Commodity
Strategy | | | Managed
Futures Strategy | |
Tax cost | | $ | 2,769,963,883 | | | $ | 64,084,828 | | | $ | 263,252,957 | | | $ | 167,506,162 | |
Gross unrealized gain | | | 145,088,485 | | | | 9,772,988 | | | | 23,371,088 | | | | 19,854,932 | |
Gross unrealized loss | | | (82,589,011 | ) | | | (9,132,853 | ) | | | (1,957,331 | ) | | | (21,365,320 | ) |
Net unrealized gain (loss) | | $ | 62,499,474 | | | $ | 640,135 | | | $ | 21,413,757 | | | $ | (1,510,388 | ) |
The difference between GAAP-basis and tax-basis unrealized gains (losses) is attributable primarily to wash sales, net mark to market gains (losses) on regulated futures, options and foreign currency contracts, and differences related to the tax treatment of swap transactions and underlying fund investments and passive foreign investment company investments.
GSAM has reviewed the Funds’ tax positions for all open tax years (the current and prior three years, as applicable) and has concluded that no provision for income tax is required in the Funds’ financial statements. Such open tax years remain subject to examination and adjustment by tax authorities.
The Funds’ risks include, but are not limited to, the following:
Derivatives Risk — The Funds’ use of derivatives may result in loss. Derivative instruments, which may pose risks in addition to and greater than those associated with investing directly in securities, currencies or other instruments, may be illiquid or less liquid, volatile, difficult to price and leveraged so that small changes in the value of the underlying instruments may produce disproportionate losses to the Funds. Derivatives are also subject to counterparty risk, which is the risk that the other party in the transaction will not fulfill its contractual obligation. The use of derivatives is a highly specialized activity that involves investment techniques and risks different from those associated with investments in more traditional securities and instruments. Losses from derivatives can also result from a lack of correlation between changes in the value of derivative instruments and the portfolio assets (if any) being hedged.
Foreign and Emerging Countries Risk — Investing in foreign markets may involve special risks and considerations not typically associated with investing in the U.S. Foreign securities may be subject to risk of loss because of more or less foreign government regulation, less public information and less economic, political and social stability in the countries in which a Fund invests. The imposition of exchange controls (including repatriation restrictions), confiscations, trade restrictions (including tariffs) and other government restrictions by the U.S. or other governments, or from problems in share registration, settlement or custody, may also result in losses. Foreign risk also involves the risk of negative foreign currency rate fluctuations, which may cause the value of securities denominated in such foreign currency (or other instruments through which a Fund has exposure to foreign currencies) to decline in value. Currency exchange rates may fluctuate significantly over short periods of time. To the extent that a Fund also invests in securities of issuers located in emerging markets, these risks may be more pronounced.
Foreign Custody Risk — If a Fund invests in foreign securities, the Fund may hold such securities and cash with foreign banks, agents, and securities depositories appointed by the Fund’s custodian (each a “Foreign Custodian”). Some foreign custodians may be recently organized or new to the foreign custody business. In some countries, Foreign Custodians may be subject to little or no regulatory oversight over, or independent evaluation of, their operations. Further, the laws of certain countries may place limitations on a Fund’s ability to recover its assets if a Foreign Custodian enters bankruptcy. Investments in emerging markets may be subject to even greater custody risks than investments in more developed markets. Custody services in emerging market countries are very often undeveloped and may be considerably less well regulated than in more developed countries, and thus may not afford the same level of investor protection as would apply in developed countries.
127
GOLDMAN SACHS ALTERNATIVE FUNDS
Notes to Financial Statements(continued)
June 30, 2019 (Unaudited)
|
| 9. OTHER RISKS (continued) |
Interest Rate Risk — When interest rates increase, fixed income securities or instruments held by a Fund will generally decline in value.Long-term fixed income securities or instruments will normally have more price volatility because of this risk thanshort-term fixed income securities or instruments. The risks associated with changing interest rates may have unpredictable effects on the markets and a Fund’s investments. Fluctuations in interest rates may also affect the liquidity of fixed income securities and instruments held by the Funds.
Investments in Other Investment Companies Risk — As a shareholder of another investment company, including an ETF, a Fund will indirectly bear its proportionate share of any net management fees and other expenses paid by such other investment companies, in addition to the fees and expenses regularly borne by the Fund. ETFs are subject to risks that do not apply to conventional mutual funds, including but not limited to the following: (i) the market price of the ETF’s shares may trade at a premium or a discount to their NAV; and (ii) an active trading market for an ETF’s shares may not develop or be maintained.
Large Shareholder Transactions Risk — A Fund may experience adverse effects when certain large shareholders, such as other funds, institutional investors (including those trading by use of non-discretionary mathematical formulas), financial intermediaries (who may make investment decisions on behalf of underlying clients and/or include a Fund in their investment model), individuals, accounts and Goldman Sachs affiliates, purchase or redeem large amounts of shares of a Fund. Such large shareholder redemptions, which may occur rapidly or unexpectedly, may cause a Fund to sell portfolio securities at times when it would not otherwise do so, which may negatively impact a Fund’s NAV and liquidity. These transactions may also accelerate the realization of taxable income to shareholders if such sales of investments resulted in gains, and may also increase transaction costs. In addition, a large redemption could result in a Fund’s current expenses being allocated over a smaller asset base, leading to an increase in the Fund’s expense ratio. Similarly, large Fund share purchases may adversely affect a Fund’s performance to the extent that the Fund is delayed in investing new cash or otherwise maintains a larger cash position than it ordinarily would.
Liquidity Risk — A Fund may make investments that are illiquid or that may become less liquid in response to market developments or adverse investor perceptions. Illiquid investments may be more difficult to value. Liquidity risk may also refer to the risk that a Fund will not be able to pay redemption proceeds within the allowable time period or without significant dilution to remaining investors’ interests because of unusual market conditions, an unusually high volume of redemption requests, or other reasons. To meet redemption requests, a Fund may be forced to sell investments at an unfavorable time and/or under unfavorable conditions. If a Fund is forced to sell securities at an unfavorable time and/or under unfavorable conditions, such sales may adversely affect the Fund’s NAV and dilute remaining investors’ interests. Liquidity risk may be the result of, among other things, the reduced number and capacity of traditional market participants to make a market in fixed income securities or the lack of an active market. The potential for liquidity risk may be magnified by a rising interest rate environment or other circumstances where investor redemptions from fixed income mutual funds may be higher than normal, potentially causing increased supply in the market due to selling activity. These risks may be more pronounced in connection with the Funds’ investments in securities of issuers located in emerging market countries. Redemptions by large shareholders may have a negative impact on a Fund’s liquidity.
Market and Credit Risks — In the normal course of business, a Fund trades financial instruments and enters into financial transactions where risk of potential loss exists due to changes in the market (market risk). Additionally, a Fund may also be exposed to credit risk in the event that an issuer or guarantor fails to perform or that an institution or entity with which the Fund has unsettled or open transactions defaults.
Tax Risk — Historically, the Internal Revenue Service (“IRS”) issued private letter rulings (“PLRs”) in which the IRS specifically concluded that income and gains from investments in commodity index-linked structured notes or awholly-owned foreign subsidiary that invests in commodity-linked instruments are “qualifying income” for purposes of compliance with Subchapter M of the Code. The IRS has issued such PLRs to the Absolute Return Tracker, Alternative Premia and Commodity Strategy Funds. Based on such rulings, these Funds may seek to gain exposure to the commodity markets through investments in commodity-linked notes and/or subsidiaries. The Managed Futures Strategy Fund has not received a PLR, and is not able to rely on PLRs issued to other taxpayers. Additionally, the IRS has suspended the granting of such PLRs, pending review of its position on this
128
GOLDMAN SACHS ALTERNATIVE FUNDS
|
| 9. OTHER RISKS (continued) |
matter. The IRS also recently issued proposed regulations that, if finalized, would generally treat the Fund’s income inclusion with respect to a subsidiary as qualifying income only if there is a distribution out of the earnings and profits of a subsidiary that are attributable to such income inclusion. The proposed regulations, if adopted would apply to taxable years beginning on or after 90 days after the regulations are published as final.
The IRS also recently issued a revenue procedure, which states that the IRS will not in the future issue PLRs that would require a determination of whether an asset (such as a commodity index-linked note) is a “security” under the Investment Company Act of 1940. The Managed Futures Strategy Fund has obtained an opinion of counsel that the Fund’s income from such investments should constitute “qualifying income.” However, no assurances can be provided that the IRS would not be able to successfully assert that the Fund’s income from such investments was not “qualifying income”, in which case the Fund would fail to qualify as regulated investment company (“RIC”) under Subchapter M of the Code if over 10% of its gross income were derived from these investments. If a Fund failed to qualify as a RIC, it would be subject to federal and state income tax on all of its taxable income at regular corporate tax rates. This would significantly adversely affect the returns to, and could cause substantial losses for, Fund shareholders.
Under the Trust’s organizational documents, its Trustees, officers, employees and agents are indemnified, to the extent permitted by the Act and state law, against certain liabilities that may arise out of performance of their duties to the Funds. Additionally, in the course of business, the Funds enter into contracts that contain a variety of indemnification clauses. The Funds’ maximum exposure under these arrangements is unknown, as this would involve future claims that may be made against the Funds that have not yet occurred. However, GSAM believes the risk of loss under these arrangements to be remote.
The Funds have adopted Financial Accounting Standards Board Accounting Standards Update 2017-08 to amend the amortization period for certain purchased callable debt securities held at a premium. Under the new standard, the Funds have changed the amortization period for the premium on certain purchased callable debt securities with non-contingent call features to the earliest call date. In accordance with the transition provisions of the standard, the Funds applied the amendments on a modified retrospective basis beginning with the fiscal period ended June 30, 2019. This change in accounting policy has been made to comply with the newly issued accounting standard and had no impact on total distributable earnings (loss) or the net asset value of the Funds. Upon evaluation, GSAM has concluded that the change in accounting principle does not materially impact the financial statement amounts.
Subsequent events after the Consolidated Statements of Assets and Liabilities date have been evaluated, and GSAM has concluded that there is no impact requiring adjustment or disclosure in the financial statements.
129
GOLDMAN SACHS ALTERNATIVE FUNDS
Notes to Financial Statements(continued)
June 30, 2019 (Unaudited)
|
| 13. SUMMARY OF SHARE TRANSACTIONS |
Share activity is as follows:
| | | | | | | | | | | | | | | | |
| | | Absolute Return Tracker Fund | |
| | | For the Six Months Ended
June 30, 2019
(Unaudited) | | | For the Fiscal Year Ended
December 31, 2018 | |
| | | Shares | | | Dollars | | | Shares | | | Dollars | |
| | | | |
| Class A Shares | | | | | | | | | | | | | | | | |
Shares sold | | | 4,198,144 | | | $ | 38,760,421 | | | | 4,798,033 | | | $ | 44,842,536 | |
Reinvestment of distributions | | | — | | | | — | | | | 160,862 | | | | 1,438,177 | |
Shares redeemed | | | (2,221,731 | ) | | | (20,624,912 | ) | | | (3,160,194 | ) | | | (29,547,552 | ) |
| | | | 1,976,413 | | | | 18,135,509 | | | | 1,798,701 | | | | 16,733,161 | |
| Class C Shares | | | | | | | | | | | | | | | | |
Shares sold | | | 231,842 | | | | 1,958,076 | | | | 1,258,940 | | | | 10,851,182 | |
Reinvestment of distributions | | | — | | | | — | | | | 37,087 | | | | 305,807 | |
Shares redeemed | | | (558,134 | ) | | | (4,759,485 | ) | | | (557,406 | ) | | | (4,790,628 | ) |
| | | | (326,292 | ) | | | (2,801,409 | ) | | | 738,621 | | | | 6,366,361 | |
| Institutional Shares | | | | | | | | | | | | | | | | |
Shares sold | | | 73,837,333 | | | | 702,517,245 | | | | 184,753,329 | | | | 1,781,048,133 | |
Reinvestment of distributions | | | — | | | | — | | | | 4,495,374 | | | | 41,400,790 | |
Shares redeemed | | | (64,726,494 | ) | | | (616,543,923 | ) | | | (112,906,830 | ) | | | (1,081,871,140 | ) |
| | | | 9,110,839 | | | | 85,973,322 | | | | 76,341,873 | | | | 740,577,783 | |
| Investor Shares | | | | | | | | | | | | | | | | |
Shares sold | | | 10,224,591 | | | | 96,334,356 | | | | 23,848,937 | | | | 228,166,646 | |
Reinvestment of distributions | | | — | | | | — | | | | 711,919 | | | | 6,495,957 | |
Shares redeemed | | | (7,448,571 | ) | | | (70,151,646 | ) | | | (6,195,929 | ) | | | (58,596,382 | ) |
| | | | 2,776,020 | | | | 26,182,710 | | | | 18,364,927 | | | | 176,066,221 | |
| Class P Shares(a) | | | | | | | | | | | | | | | | |
Shares sold | | | 4,219,060 | | | | 39,843,975 | | | | 19,347,235 | | | | 187,497,150 | |
Reinvestment of distributions | | | — | | | | — | | | | 462,246 | | | | 4,257,351 | |
Shares redeemed | | | (1,408,543 | ) | | | (13,406,288 | ) | | | (2,987,874 | ) | | | (27,949,398 | ) |
| | | | 2,810,517 | | | | 26,437,687 | | | | 16,821,607 | | | | 163,805,103 | |
| Class R Shares | | | | | | | | | | | | | | | | |
Shares sold | | | 47,077 | | | | 421,309 | | | | 154,712 | | | | 1,419,367 | |
Reinvestment of distributions | | | — | | | | — | | | | 4,837 | | | | 42,136 | |
Shares redeemed | | | (26,358 | ) | | | (236,485 | ) | | | (169,474 | ) | | | (1,539,910 | ) |
| | | | 20,719 | | | | 184,824 | | | | (9,925 | ) | | | (78,407 | ) |
| Class R6 Shares | | | | | | | | | | | | | | | | |
Shares sold | | | 96,464 | | | | 911,148 | | | | 663,674 | | | | 6,405,161 | |
Reinvestment of distributions | | | — | | | | — | | | | 17,884 | | | | 164,520 | |
Shares redeemed | | | (65,148 | ) | | | (615,391 | ) | | | (250,643 | ) | | | (2,382,060 | ) |
| | | | 31,316 | | | | 295,757 | | | | 430,915 | | | | 4,187,621 | |
| | | | |
NET INCREASE | | | 16,399,532 | | | $ | 154,408,400 | | | | 114,486,719 | | | $ | 1,107,657,843 | |
| (a) | | Commenced operations on April 17, 2018. |
130
GOLDMAN SACHS ALTERNATIVE FUNDS
|
| 13. SUMMARY OF SHARE TRANSACTIONS (continued) |
| | | | | | | | | | | | | | | | |
| | | Alternative Premia Fund | |
| | | For the Six Months Ended
June 30, 2019
(Unaudited) | | | For the Fiscal Year Ended
December 31, 2018 | |
| | | Shares | | | Dollars | | | Shares | | | Dollars | |
| | | | |
| Class A Shares | | | | | | | | | | | | | | | | |
Shares sold | | | 146,664 | | | $ | 1,167,763 | | | | 229,026 | | | $ | 1,941,605 | |
Reinvestment of distributions | | | — | | | | — | | | | 59,392 | | | | 471,572 | |
Shares redeemed | | | (220,170 | ) | | | (1,780,771 | ) | | | (689,924 | ) | | | (5,926,201 | ) |
| | | | (73,506 | ) | | | (613,008 | ) | | | (401,506 | ) | | | (3,513,024 | ) |
| Class C Shares | | | | | | | | | | | | | | | | |
Shares sold | | | 1,563 | | | | 11,676 | | | | 15,951 | | | | 126,701 | |
Reinvestment of distributions | | | — | | | | — | | | | 66,038 | | | | 486,701 | |
Shares redeemed | | | (382,092 | ) | | | (2,839,633 | ) | | | (741,371 | ) | | | (5,923,189 | ) |
| | | | (380,529 | ) | | | (2,827,957 | ) | | | (659,382 | ) | | | (5,309,787 | ) |
| Institutional Shares | | | | | | | | | | | | | | | | |
Shares sold | | | 203,941 | | | | 1,715,861 | | | | 3,379,260 | | | | 27,875,999 | |
Reinvestment of distributions | | | — | | | | — | | | | 73,146 | | | | 594,674 | |
Shares redeemed | | | (3,099,344 | ) | | | (26,083,483 | ) | | | (12,067,753 | ) | | | (105,872,944 | ) |
| | | | (2,895,403 | ) | | | (24,367,622 | ) | | | (8,615,347 | ) | | | (77,402,271 | ) |
| Investor Shares | | | | | | | | | | | | | | | | |
Shares sold | | | 130,468 | | | | 1,080,156 | | | | 641,645 | | | | 5,481,288 | |
Reinvestment of distributions | | | — | | | | — | | | | 60,656 | | | | 488,889 | |
Shares redeemed | | | (158,519 | ) | | | (1,300,604 | ) | | | (560,135 | ) | | | (4,843,550 | ) |
| | | | (28,051 | ) | | | (220,448 | ) | | | 142,166 | | | | 1,126,627 | |
| Class P Shares(a) | | | | | | | | | | | | | | | | |
Shares sold | | | — | | | | — | | | | 21,368 | | | | 190,311 | |
Reinvestment of distributions | | | — | | | | — | | | | 84 | | | | 685 | |
Shares redeemed | | | (1 | ) | | | — | | | | (19,814 | ) | | | (172,447 | ) |
| | | | (1 | ) | | | — | | | | 1,638 | | | | 18,549 | |
| Class R Shares | | | | | | | | | | | | | | | | |
Shares sold | | | 23,828 | | | | 191,709 | | | | — | | | | — | |
Reinvestment of distributions | | | — | | | | — | | | | 87 | | | | 677 | |
Shares redeemed | | | (3,060 | ) | | | (24,202 | ) | | | — | | | | 2 | |
| | | | 20,768 | | | | 167,507 | | | | 87 | | | | 679 | |
| Class R6 Shares | | | | | | | | | | | | | | | | |
Shares sold | | | 339,822 | | | | 2,783,030 | | | | 13,234,324 | | | | 115,972,250 | |
Reinvestment of distributions | | | — | | | | — | | | | 339,564 | | | | 2,753,859 | |
Shares redeemed | | | (1,029,675 | ) | | | (8,435,936 | ) | | | (7,709,553 | ) | | | (66,730,018 | ) |
| | | | (689,853 | ) | | | (5,652,906 | ) | | | 5,864,335 | | | | 51,996,091 | |
| | | | |
NET DECREASE | | | (4,046,575 | ) | | $ | (33,514,434 | ) | | | (3,668,009 | ) | | $ | (33,083,136 | ) |
| (a) | | Commenced operations on April 17, 2018. |
131
GOLDMAN SACHS ALTERNATIVE FUNDS
Notes to Financial Statements(continued)
June 30, 2019 (Unaudited)
|
| 13. SUMMARY OF SHARE TRANSACTIONS (continued) |
| | | | | | | | | | | | | | | | |
| | | Commodity Strategy Fund | |
| | | For the Six Months Ended
June 30, 2019
(Unaudited) | | | For the Fiscal Year Ended
December 31, 2018 | |
| | | Shares | | | Dollars | | | Shares | | | Dollars | |
| | | | |
| Class A Shares | | | | | | | | | | | | | | | | |
Shares sold | | | 232,571 | | | $ | 2,504,060 | | | | 1,251,112 | | | $ | 14,934,569 | |
Reinvestment of distributions | | | 12,450 | | | | 136,332 | | | | 24,150 | | | | 260,064 | |
Shares redeemed | | | (530,670 | ) | | | (5,742,419 | ) | | | (2,723,863 | ) | | | (30,606,937 | ) |
| | | | (285,649 | ) | | | (3,102,027 | ) | | | (1,448,601 | ) | | | (15,412,304 | ) |
| Class C Shares | | | | | | | | | | | | | | | | |
Shares sold | | | 12,951 | | | | 131,441 | | | | 89,382 | | | | 1,009,327 | |
Reinvestment of distributions | | | 554 | | | | 5,760 | | | | 535 | | | | 4,993 | |
Shares redeemed | | | (35,677 | ) | | | (362,772 | ) | | | (90,364 | ) | | | (987,027 | ) |
| | | | (22,172 | ) | | | (225,571 | ) | | | (447 | ) | | | 27,293 | |
| Institutional Shares | | | | | | | | | | | | | | | | |
Shares sold | | | 4,508,787 | | | | 48,371,735 | | | | 13,852,341 | | | | 162,239,296 | |
Reinvestment of distributions | | | 79,901 | | | | 883,701 | | | | 254,245 | | | | 2,712,225 | |
Shares redeemed | | | (13,388,904 | ) | | | (143,989,146 | ) | | | (14,630,034 | ) | | | (166,368,584 | ) |
| | | | (8,800,216 | ) | | | (94,733,710 | ) | | | (523,448 | ) | | | (1,417,063 | ) |
| Investor Shares | | | | | | | | | | | | | | | | |
Shares sold | | | 694,526 | | | | 7,534,268 | | | | 756,579 | | | | 8,934,574 | |
Reinvestment of distributions | | | 4,707 | | | | 52,109 | | | | 9,842 | | | | 103,250 | |
Shares redeemed | | | (832,761 | ) | | | (9,175,844 | ) | | | (657,199 | ) | | | (7,833,967 | ) |
| | | | (133,528 | ) | | | (1,589,467 | ) | | | 109,222 | | | | 1,203,857 | |
| Class P Shares(a) | | | | | | | | | | | | | | | | |
Shares sold | | | — | | | | — | | | | 628,959 | | | | 7,585,275 | |
Reinvestment of distributions | | | 2,387 | | | | 26,429 | | | | 6,042 | | | | 66,814 | |
Shares redeemed | | | (1,381 | ) | | | (15,369 | ) | | | (310,349 | ) | | | (3,561,109 | ) |
| | | | 1,006 | | | | 11,060 | | | | 324,652 | | | | 4,090,980 | |
| Class R Shares | | | | | | | | | | | | | | | | |
Shares sold | | | 25,982 | | | | 278,672 | | | | 111,272 | | | | 1,280,888 | |
Reinvestment of distributions | | | 877 | | | | 9,455 | | | | 1,319 | | | | 13,412 | |
Shares redeemed | | | (41,389 | ) | | | (440,014 | ) | | | (133,213 | ) | | | (1,517,725 | ) |
| | | | (14,530 | ) | | | (151,887 | ) | | | (20,622 | ) | | | (223,425 | ) |
| Class R6 Shares | | | | | | | | | | | | | | | | |
Shares sold | | | 8,412,884 | | | | 89,587,023 | | | | 306,122 | | | | 3,580,293 | |
Reinvestment of distributions | | | 55,872 | | | | 619,063 | | | | 189 | | | | 1,957 | |
Shares redeemed | | | (875,921 | ) | | | (9,696,339 | ) | | | (295,426 | ) | | | (3,603,141 | ) |
| | | | 7,592,835 | | | | 80,509,747 | | | | 10,885 | | | | (20,891 | ) |
| | | | |
NET DECREASE | | | (1,662,254 | ) | | $ | (19,281,855 | ) | | | (1,548,359 | ) | | $ | (11,751,553 | ) |
| (a) | | Commenced operations on April 17, 2018. |
132
GOLDMAN SACHS ALTERNATIVE FUNDS
|
| 13. SUMMARY OF SHARE TRANSACTIONS (continued) |
| | | | | | | | | | | | | | | | |
| | | Managed Futures Strategy Fund | |
| | | For the Six Months Ended
June 30, 2019
(Unaudited) | | | For the Fiscal Year Ended
December 31, 2018 | |
| | | Shares | | | Dollars | | | Shares | | | Dollars | |
| | | | |
| Class A Shares | | | | | | | | | | | | | | | | |
Shares sold | | | 210,169 | | | $ | 2,080,470 | | | | 439,024 | | | $ | 4,455,486 | |
Reinvestment of distributions | | | — | | | | — | | | | 1,147 | | | | 11,538 | |
Shares redeemed | | | (184,896 | ) | | | (1,847,449 | ) | | | (329,581 | ) | | | (3,314,739 | ) |
| | | | 25,273 | | | | 233,021 | | | | 110,590 | | | | 1,152,285 | |
| Class C Shares | | | | | | | | | | | | | | | | |
Shares sold | | | 32,916 | | | | 317,681 | | | | 86,827 | | | | 855,715 | |
Reinvestment of distributions | | | — | | | | — | | | | 570 | | | | 5,457 | |
Shares redeemed | | | (59,458 | ) | | | (567,016 | ) | | | (96,054 | ) | | | (926,503 | ) |
| | | | (26,542 | ) | | | (249,335 | ) | | | (8,657 | ) | | | (65,331 | ) |
| Institutional Shares | | | | | | | | | | | | | | | | |
Shares sold | | | 1,160,795 | | | | 11,878,455 | | | | 5,266,745 | | | | 54,615,537 | |
Reinvestment of distributions | | | — | | | | — | | | | 11,693 | | | | 120,438 | |
Shares redeemed | | | (3,296,520 | ) | | | (33,004,905 | ) | | | (12,754,668 | ) | | | (131,316,188 | ) |
| | | | (2,135,725 | ) | | | (21,126,450 | ) | | | (7,476,230 | ) | | | (76,580,213 | ) |
| Investor Shares | | | | | | | | | | | | | | | | |
Shares sold | | | 3,620,818 | | | | 36,679,846 | | | | 6,364,713 | | | | 65,666,187 | |
Reinvestment of distributions | | | — | | | | — | | | | 15,625 | | | | 159,532 | |
Shares redeemed | | | (4,192,155 | ) | | | (42,384,390 | ) | | | (6,237,413 | ) | | | (63,624,182 | ) |
| | | | (571,337 | ) | | | (5,704,544 | ) | | | 142,925 | | | | 2,201,537 | |
| Class P Shares(a) | | | | | | | | | | | | | | | | |
Shares sold | | | — | | | | — | | | | 41,647 | | | | 425,477 | |
Reinvestment of distributions | | | — | | | | — | | | | 64 | | | | 662 | |
Shares redeemed | | | (16,400 | ) | | | (177,165 | ) | | | (8 | ) | | | (81 | ) |
| | | | (16,400 | ) | | | (177,165 | ) | | | 41,703 | | | | 426,058 | |
| Class R Shares | | | | | | | | | | | | | | | | |
Shares sold | | | 1,784 | | | | 17,453 | | | | 5,066 | | | | 50,581 | |
Reinvestment of distributions | | | — | | | | — | | | | 94 | | | | 935 | |
Shares redeemed | | | (6,097 | ) | | | (61,679 | ) | | | (4,551 | ) | | | (46,180 | ) |
| | | | (4,313 | ) | | | (44,226 | ) | | | 609 | | | | 5,336 | |
| Class R6 Shares(b) | | | | | | | | | | | | | | | | |
Shares sold | | | 770,882 | | | | 7,867,000 | | | | 5,758,231 | | | | 58,786,189 | |
Reinvestment of distributions | | | — | | | | — | | | | 8,084 | | | | 83,342 | |
Shares redeemed | | | (694,040 | ) | | | (7,272,000 | ) | | | (843,805 | ) | | | (8,659,000 | ) |
| | | | 76,842 | | | | 595,000 | | | | 4,922,510 | | | | 50,210,531 | |
| | | | |
NET DECREASE | | | (2,652,202 | ) | | $ | (26,473,699 | ) | | | (2,266,550 | ) | | $ | (22,649,797 | ) |
| (a) | | Commenced operations on April 17, 2018. |
| (b) | | Commenced operations on April 30, 2018. |
133
GOLDMAN SACHS ALTERNATIVE FUNDS
Fund Expenses — Six Month Period Ended June 30, 2019 (Unaudited)
As a shareholder of Class A, Class C, Institutional, Investor, Class P, Class R or Class R6 Shares of a Fund you incur two types of costs: (1) transaction costs, including sales charges on purchase payments (with respect to Class A Shares) and contingent deferred sales charges on redemptions (with respect to Class C Shares); and (2) ongoing costs, including management fees; distribution and/or service (12b-1) fees (with respect to Class A, Class C and Class R Shares); and other Fund expenses. This example is intended to help you understand your ongoing costs (in dollars) of investing in Class A, Class C, Institutional, Investor, Class P, Class R and Class R6 Shares of the Funds and to compare these costs with the ongoing costs of investing in other mutual funds.
The example is based on an investment of $1,000 invested at the beginning of the period and held for the entire period from January 1, 2019 through June 30, 2019, which represents a period of 181 days of a 365 day year.
Actual Expenses — The first line under each share class in the table below provides information about actual account values and actual expenses. You may use the information in this line, together with the amount you invested, to estimate the expenses that you paid over the period. Simply divide your account value by $1,000 (for example, an $8,600 account value divided by $1,000=8.6), then multiply the result by the number in the first line under the heading entitled “Expenses Paid” to estimate the expenses you paid on your account during this period.
Hypothetical Example for Comparison Purposes — The second line under each share class in the table below provides information about hypothetical account values and hypothetical expenses based on the Funds’ actual net expense ratio and an assumed rate of return of 5% per year before expenses, which is not the Funds’ actual return. The hypothetical account values and expenses may not be used to estimate the actual ending account balance or expenses you paid for the period. You may use this information to compare the ongoing costs of investing in the Funds and other funds. To do so, compare this 5% hypothetical example with the 5% hypothetical examples that appear in the shareholder reports of the other funds.
Please note that the expenses shown in the table are meant to highlight your ongoing costs only and do not reflect any transactional costs, such as sales charges, redemption fees, or exchange fees. Therefore, the second line of the table is useful in comparing ongoing costs only, and will not help you determine the relative total costs of owning different funds. In addition, if these transactional costs were included, your costs would have been higher.
| | | | | | | | | | | | | | | | | | | | | | | | | | | | | | | | | | | | | | | | | | | | | | | | |
| | | Absolute Return Tracker Fund | | | Alternative Premia Fund | | | Commodity Strategy Fund | | | Managed Futures Strategy Fund | |
| Share Class | | Beginning
Account
Value
01/01/19 | | | Ending
Account
Value
06/30/19 | | | Expenses
Paid for the
6 Months Ended
06/30/19* | | | Beginning
Account
Value
01/01/19 | | | Ending
Account
Value
06/30/19 | | | Expenses
Paid for the
6 Months Ended
06/30/19* | | | Beginning
Account
Value
01/01/19 | | | Ending
Account
Value
06/30/19 | | | Expenses
Paid for the
6 Months Ended
06/30/19* | | | Beginning
Account
Value
01/01/19 | | | Ending
Account
Value
06/30/19 | | | Expenses
Paid for the
6 Months Ended
06/30/19* | |
| Class A | | | | | | | | | | | | | | | | | | | | | | | | | | | | | | | | | | | | | | | | | | | | | | | | |
Actual | | $ | 1,000 | | | $ | 1,071.30 | | | $ | 5.03 | | | $ | 1,000 | | | $ | 1,003.80 | | | $ | 5.76 | | | $ | 1,000 | | | $ | 1,127.60 | | | $ | 4.38 | | | $ | 1,000 | | | $ | 1,047.80 | | | $ | 7.57 | |
Hypothetical 5% return | | | 1,000 | | | | 1,019.93 | + | | | 4.91 | | | | 1,000 | | | | 1,019.04 | + | | | 5.81 | | | | 1,000 | | | | 1,020.68 | + | | | 4.16 | | | | 1,000 | | | | 1,017.41 | + | | | 7.45 | |
| Class C | | | | | | | | | | | | | | | | | | | | | | | | | | | | | | | | | | | | | | | | | | | | | | | | |
Actual | | | 1,000 | | | | 1,067.60 | | | | 8.87 | | | | 1,000 | | | | 1,000.00 | | | | 9.52 | | | | 1,000 | | | | 1,123.80 | | | | 8.32 | | | | 1,000 | | | | 1,043.90 | | | | 11.35 | |
Hypothetical 5% return | | | 1,000 | | | | 1,016.22 | + | | | 8.65 | | | | 1,000 | | | | 1,015.27 | + | | | 9.59 | | | | 1,000 | | | | 1,016.96 | + | | | 7.90 | | | | 1,000 | | | | 1,013.69 | + | | | 11.18 | |
| Institutional | | | | | | | | | | | | | | | | | | | | | | | | | | | | | | | | | | | | | | | | | | | | | | | | |
Actual | | | 1,000 | | | | 1,073.60 | | | | 3.03 | | | | 1,000 | | | | 1,006.20 | | | | 3.93 | | | | 1,000 | | | | 1,129.20 | | | | 2.59 | | | | 1,000 | | | | 1,050.60 | | | | 5.59 | |
Hypothetical 5% return | | | 1,000 | | | | 1,021.87 | + | | | 2.96 | | | | 1,000 | | | | 1,020.88 | + | | | 3.96 | | | | 1,000 | | | | 1,022.36 | + | | | 2.46 | | | | 1,000 | | | | 1,019.34 | + | | | 5.51 | |
| Investor | | | | | | | | | | | | | | | | | | | | | | | | | | | | | | | | | | | | | | | | | | | | | | | | |
Actual | | | 1,000 | | | | 1,072.10 | | | | 3.75 | | | | 1,000 | | | | 1,006.20 | | | | 4.53 | | | | 1,000 | | | | 1,129.50 | | | | 3.06 | | | | 1,000 | | | | 1,050.00 | | | | 6.30 | |
Hypothetical 5% return | | | 1,000 | | | | 1,021.17 | + | | | 3.66 | | | | 1,000 | | | | 1,020.28 | + | | | 4.56 | | | | 1,000 | | | | 1,021.92 | + | | | 2.91 | | | | 1,000 | | | | 1,018.65 | + | | | 6.21 | |
| Class P | | | | | | | | | | | | | | | | | | | | | | | | | | | | | | | | | | | | | | | | | | | | | | | | |
Actual | | | 1,000 | | | | 1,073.70 | | | | 2.98 | | | | 1,000 | | | | 1,006.20 | | | | 3.78 | | | | 1,000 | | | | 1,129.20 | | | | 2.53 | | | | 1,000 | | | | 1,050.60 | | | | 5.59 | |
Hypothetical 5% return | | | 1,000 | | | | 1,021.92 | + | | | 2.91 | | | | 1,000 | | | | 1,021.03 | + | | | 3.81 | | | | 1,000 | | | | 1,022.41 | + | | | 2.41 | | | | 1,000 | | | | 1,019.34 | + | | | 5.51 | |
| Class R | | | | | | | | | | | | | | | | | | | | | | | | | | | | | | | | | | | | | | | | | | | | | | | | |
Actual | | | 1,000 | | | | 1,069.70 | | | | 6.31 | | | | 1,000 | | | | 1,003.90 | | | | 6.96 | | | | 1,000 | | | | 1,126.30 | | | | 5.69 | | | | 1,000 | | | | 1,047.60 | | | | 8.83 | |
Hypothetical 5% return | | | 1,000 | | | | 1,018.70 | + | | | 6.16 | | | | 1,000 | | | | 1,017.85 | + | | | 7.00 | | | | 1,000 | | | | 1,019.44 | + | | | 5.41 | | | | 1,000 | | | | 1,016.17 | + | | | 8.70 | |
| Class R6 | | | | | | | | | | | | | | | | | | | | | | | | | | | | | | | | | | | | | | | | | | | | | | | | |
Actual | | | 1,000 | | | | 1,073.70 | | | | 2.98 | | | | 1,000 | | | | 1,006.20 | | | | 3.83 | | | | 1,000 | | | | 1,130.20 | | | | 2.48 | | | | 1,000 | | | | 1,050.50 | | | | 5.54 | |
Hypothetical 5% return | | | 1,000 | | | | 1,021.92 | + | | | 2.91 | | | | 1,000 | | | | 1,020.98 | + | | | 3.86 | | | | 1,000 | | | | 1,022.46 | + | | | 2.36 | | | | 1,000 | | | | 1,019.39 | + | | | 5.46 | |
| + | | Hypothetical expenses are based on each Fund’s actual annualized net expense ratios and an assumed rate of return of 5% per year before expenses. |
| * | | Expenses are calculated using each Fund’s annualized net expense ratio for each class, which represents the ongoing expenses as a percentage of net assets for the six months ended June 30, 2019. Expenses are calculated by multiplying the annualized net expense ratio by the average account value for the period; then multiplying the result by the number of days in the most recent fiscal half year; and then dividing that result by the number of days in the fiscal year. The annualized net expense ratios for the period were as follows: |
| | | | | | | | | | | | | | | | | | | | | | | | | | | | |
| Fund | | Class A | | | Class C | | | Institutional | | | Investor | | | Class P | | | Class R | | | Class R6 | |
Absolute Return Tracker | | | 0.98 | % | | | 1.73 | % | | | 0.59 | % | | | 0.73 | % | | | 0.58 | % | | | 1.23 | % | | | 0.58 | % |
Alternative Premia | | | 1.16 | | | | 1.92 | | | | 0.79 | | | | 0.91 | | | | 0.76 | | | | 1.40 | | | | 0.77 | |
Commodity Strategy | | | 0.83 | | | | 1.58 | | | | 0.49 | | | | 0.58 | | | | 0.48 | | | | 1.08 | | | | 0.47 | |
Managed Futures Strategy | | | 1.49 | | | | 2.24 | | | | 1.10 | | | | 1.24 | | | | 1.10 | | | | 1.74 | | | | 1.09 | |
134
GOLDMAN SACHS ALTERNATIVE FUNDS
Statement Regarding Basis for Approval of Management Agreement (Unaudited)
Background
The Goldman Sachs Absolute Return Tracker Fund, Goldman Sachs Alternative Premia Fund, Goldman Sachs Commodity Strategy Fund, and Goldman Sachs Managed Futures Strategy Fund (the “Funds”) are investment portfolios of Goldman Sachs Trust (the “Trust”). The Board of Trustees oversees the management of the Trust and reviews the investment performance and expenses of the Funds at regularly scheduled meetings held throughout the year. In addition, the Board of Trustees determines annually whether to approve the continuance of the Trust’s investment management agreement (the “Management Agreement”) with Goldman Sachs Asset Management, L.P. (the “Investment Adviser”) on behalf of the Funds.
The Management Agreement was most recently approved for continuation until June 30, 2020 by the Board of Trustees, including those Trustees who are not parties to the Management Agreement or “interested persons” (as defined in the Investment Company Act of 1940, as amended) of any party thereto (the “Independent Trustees”), at a meeting held onJune 11-12, 2019 (the “Annual Meeting”).
The review process undertaken by the Trustees spans the course of the year and culminates with the Annual Meeting. To assist the Trustees in their deliberations, the Trustees have established a Contract Review Committee (the “Committee”), comprised of the Independent Trustees. The Committee held four meetings over the course of the year since the Management Agreement was last approved. At those Committee meetings, regularly scheduled Board or other committee meetings, and/or the Annual Meeting, matters relevant to the renewal of the Management Agreement were considered by the Board, or the Independent Trustees, as applicable. With respect to each Fund, such matters included:
| | (a) | | the nature and quality of the advisory, administrative, and other services provided to the Fund by the Investment Adviser and its affiliates, including information about: |
| | (i) | | the structure, staff, and capabilities of the Investment Adviser and its portfolio management teams; |
| | (ii) | | the groups within the Investment Adviser and its affiliates that support the portfolio management teams or provide other types of necessary services, including fund services groups (e.g., accounting and financial reporting, tax, shareholder services, and operations); controls and risk management groups (e.g., legal, compliance, valuation oversight, credit risk management, internal audit, compliance testing, market risk analysis, finance, and central funding); sales and distribution support groups, and others (e.g., information technology and training); |
| | (iii) | | trends in employee headcount; |
| | (iv) | | the Investment Adviser’s financial resources and ability to hire and retain talented personnel and strengthen its operations; and |
| | (v) | | the parent company’s support of the Investment Adviser and its mutual fund business, as expressed by the firm’s senior management; |
| | (b) | | information on the investment performance of the Fund, including comparisons to the performance of similar mutual funds, as provided by a third-party mutual fund data provider engaged as part of the contract review process (the “Outside Data Provider”), and a benchmark performance index; and information on general investment outlooks in the markets in which the Fund invests; |
| | (c) | | information provided by the Investment Adviser indicating the Investment Adviser’s views on whether the Fund’s peer group and/or benchmark index had high, medium, or low relevance given the Fund’s particular investment strategy; |
| | (d) | | the terms of the Management Agreement and other agreements with affiliated service providers entered into by the Trust on behalf of the Fund; |
| | (e) | | fee and expense information for the Fund, including: |
| | (i) | | the relative management fee and expense levels of the Fund as compared to those of comparable funds managed by other advisers, as provided by the Outside Data Provider; |
| | (ii) | | the Fund’s expense trends over time; and |
| | (iii) | | to the extent the Investment Adviser manages other types of accounts (such as bank collective trusts, private wealth management accounts, institutional separate accounts,sub-advised mutual funds, andnon-U.S. funds) having investment objectives and policies similar to those of the Fund, comparative information on the advisory fees charged and services provided to those accounts by the Investment Adviser; |
| | (f) | | with respect to the extensive investment performance and expense comparison data provided by the Outside Data Provider, its processes in producing that data for the Fund; |
| | (g) | | the undertakings of the Investment Adviser and its affiliates to implement fee waivers and/or expense limitations; |
| | (h) | | information relating to the profitability of the Management Agreement and the transfer agency and distribution and service arrangements of the Fund to the Investment Adviser and its affiliates; |
| | (i) | | whether the Fund’s existing management fee schedule adequately addressed any economies of scale; |
135
GOLDMAN SACHS ALTERNATIVE FUNDS
Statement Regarding Basis for Approval of Management Agreement (Unaudited) (continued)
| | (j) | | a summary of the“fall-out” benefits derived by the Investment Adviser and its affiliates from their relationships with the Fund, including the fees received by the Investment Adviser’s affiliates from the Fund for transfer agency, securities lending with respect to the Absolute Return Tracker and Alternative Premia Funds, portfolio trading, distribution and other services; |
| | (k) | | a summary of potential benefits derived by the Fund as a result of its relationship with the Investment Adviser; |
| | (l) | | information regarding commissions paid by the Fund and broker oversight, other information regarding portfolio trading, and how the Investment Adviser carries out its duty to seek best execution; |
| | (m) | | portfolio manager ownership of Fund shares; the manner in which portfolio manager compensation is determined; and the number and types of accounts managed by the portfolio managers; |
| | (n) | | the nature and quality of the services provided to the Fund by its unaffiliated service providers, and the Investment Adviser’s general oversight and evaluation (including reports on due diligence) of those service providers as part of the administrative services provided under the Management Agreement; and |
| | (o) | | the Investment Adviser’s processes and policies addressing various types of potential conflicts of interest; its approach to risk management; the annual review of the effectiveness of the Fund’s compliance program; and periodic compliance reports. |
The Trustees also received an overview of the Funds’ distribution arrangements. They received information regarding the Funds’ assets, share purchase and redemption activity, and payment of distribution and service fees. Information was also provided to the Trustees relating to revenue sharing payments made by and services provided by the Investment Adviser and its affiliates to intermediaries that promote the sale, distribution, and/or servicing of Fund shares. The Independent Trustees also discussed the broad range of other investment choices that are available to Fund investors, including the availability of comparable funds managed by other advisers.
The presentations made at the Board and Committee meetings and at the Annual Meeting encompassed the Funds and other mutual funds for which the Board of Trustees has responsibility. In evaluating the Management Agreement at the Annual Meeting, the Trustees relied upon their knowledge, resulting from their meetings and other interactions throughout the year, of the Investment Adviser and its affiliates, their services, and the Funds. In conjunction with these meetings, the Trustees received written materials and oral presentations on the topics covered, and the Investment Adviser addressed the questions and concerns of the Trustees, including concerns regarding the investment performance of certain of the funds they oversee. The Independent Trustees were advised by their independent legal counsel regarding their responsibilities and other regulatory requirements related to the approval and continuation of mutual fund investment management agreements under applicable law. In addition, the Investment Adviser and its affiliates provided the Independent Trustees with a written response to a formal request for information sent on behalf of the Independent Trustees by their independent legal counsel. During the course of their deliberations, the Independent Trustees met in executive sessions with their independent legal counsel, without representatives of the Investment Adviser or its affiliates present.
Nature, Extent, and Quality of the Services Provided Under the Management Agreement
As part of their review, the Trustees considered the nature, extent, and quality of the services provided to the Funds by the Investment Adviser. In this regard, the Trustees considered both the investment advisory services andnon-advisory services that are provided by the Investment Adviser and its affiliates. The Trustees noted the transition in the leadership and changes in personnel of various of the Investment Adviser’s portfolio management teams that had occurred in recent periods, and the ongoing recruitment efforts aimed at bringing high quality investment talent to the Investment Adviser. They also noted the Investment Adviser’s commitment to maintaining high quality systems and expending substantial resources to respond to ongoing changes to the regulatory and control environment in which the Funds and their service providers operate, as well as the efforts of the Investment Adviser and its affiliates to combat cyber security risks. The Trustees concluded that the Investment Adviser continued to commit substantial financial and operational resources to the Funds and expressed confidence that the Investment Adviser would continue to do so in the future. The Trustees also recognized that the Investment Adviser had made significant commitments to address regulatory compliance requirements applicable to the Funds and the Investment Adviser and its affiliates.
Investment Performance
The Trustees also considered the investment performance of the Funds. In this regard, they compared the investment performance of each Fund to its peers usingrankings and ratings (except for the Alternative Premia Fund) compiled by the Outside Data Provider as of December 31, 2018, and updated performance information prepared by the Investment Adviser using the peer group identified by the Outside Data Provider as of March 31, 2019. The information on each Fund’s investment performance was provided for theone-, three-, five-, andten-year periods ending on the applicable dates, to the extent that each Fund had been in
136
GOLDMAN SACHS ALTERNATIVE FUNDS
Statement Regarding Basis for Approval of Management Agreement (Unaudited) (continued)
existence for those periods. The Trustees also reviewed each Fund’s investment performance relative to its performance benchmark. As part of this review, they considered the investment performance trends of the Funds over time, and reviewed the investment performance of each Fund in light of its investment objective and policies and market conditions.
In addition, the Trustees considered materials prepared and presentations made by the Investment Adviser’s senior management and portfolio management personnel in which Fund performance was assessed. The Trustees also considered the Investment Adviser’s periodic reports with respect to the Funds’ risk profiles, and how the Investment Adviser’s approach to risk monitoring and management influences portfolio management. They noted the efforts of the Absolute Return Tracker, Alternative Premia, and Managed Futures Strategy Funds’ portfolio management team to continue to enhance the investment models used in managing the Funds.
The Trustees observed that the Absolute Return Tracker Fund’s Institutional Shares had placed in the top half of the Fund’s peer group for theone-, three-, and five-year periods and the third quartile for theten-year period; had outperformed the Fund’s benchmark index for theone-, three-, five-, andten-year periods; and had outperformed the average performance of a group of competitor funds, as determined by the Investment Adviser (the “Competitor Fund Average”), for theone-, three-, and five-year periods ended March 31, 2019. They noted that the Alternative Premia Fund’s Institutional Shares had outperformed the Fund’s LIBOR-based benchmark index by 3.83% and 1.56%, respectively, for thethree-and five-year periods and underperformed by 2.78% for theone-year period, and had outperformed the Fund’s Competitor Fund Average for theone- and three-year periods and underperformed for the five-year period ended March 31, 2019. The Trustees considered that the Alternative Premia Fund had certain significant differences from the Fund’s benchmark index that caused it to be an imperfect basis for comparison. They also noted that in October 2017, the Alternative Premia Fund had been repositioned from the Dynamic Allocation Fund, which involved changes to the Fund’s investment objective, investment strategy, benchmark, and portfolio management. The Trustees also observed that, following the Alternative Premia Fund’s repositioning, the Fund was placed into a new Morningstar category and, therefore, continued to not have meaningful peer group comparison information. The Trustees noted that the Commodity Strategy Fund’s Institutional Shares had placed in the top half of the Fund’s peer group for theone- and three-year periods, in the third quartile for theten-year period, and in the fourth quartile for the five-year period, and had outperformed the Fund’s benchmark index for the five- andten-year periods and underperformed for theone- and three-year periods ended March 31, 2019. They also noted that the Absolute Return Tracker Fund, Alternative Premia Fund, and Commodity Strategy Fund had experienced certain portfolio management changes in 2018. The Trustees also observed that the Managed Futures Strategy Fund’s Institutional Shares had placed in the top half of the Fund’s peer group for the three- and five-year periods and the third quartile for theone-year period; had outperformed the Fund’s LIBOR-based benchmark index by 1.60% for the five-year period and underperformed for theone- and three-year periods by 4.26% and 1.35%, respectively; and had outperformed the Fund’s Competitor Fund Average for theone-, three-, and five-year periods ended March 31, 2019.
Costs of Services Provided and Competitive Information
The Trustees considered the contractual terms of the Management Agreement and the fee rates payable by each Fund thereunder. In this regard, the Trustees considered information on the services rendered by the Investment Adviser to the Funds, which included both advisory and administrative services that were directed to the needs and operations of the Funds as registered mutual funds.
In particular, the Trustees reviewed analyses prepared by the Outside Data Provider regarding the expense rankings of the Funds. The analyses provided a comparison of each Fund’s management fee and breakpoints to those of a relevant peer group and category universe; an expense analysis which compared each Fund’s overall net and gross expenses to a peer group and a category universe; and data comparing each Fund’s net expenses to the peer and category medians. The analyses also compared each Fund’s other expenses and fee waivers/reimbursements to those of the peer group and category medians. The Trustees concluded that the comparisons provided by the Outside Data Provider were useful in evaluating the reasonableness of the management fees and total expenses paid by the Funds.
In addition, the Trustees considered the Investment Adviser’s undertakings to implement fee waivers and/or expense limitations. The Trustees noted that the Investment Adviser had agreed to waive a portion of its management fee in an amount equal to the entire management fee paid to the Investment Adviser as the investment adviser to each Fund’s wholly-owned subsidiary. They also considered, to the extent that the Investment Adviser manages other types of accounts having investment objectives and policies similar to those of the Funds, comparative fee information for services provided by the Investment Adviser to those accounts, and information that indicated that services provided to the Funds differed in various significant respects from the services provided to other types of accounts which, in many cases, operated under less stringent legal and regulatory structures, required fewer services from the Investment Adviser to a smaller number of client contact points, and were less time-intensive.
In addition, the Trustees noted that shareholders are able to redeem their Fund shares at any time if shareholders believe that the Fund fees and expenses are too high or if they are dissatisfied with the performance of the Fund.
137
GOLDMAN SACHS ALTERNATIVE FUNDS
Statement Regarding Basis for Approval of Management Agreement (Unaudited) (continued)
Profitability
The Trustees reviewed each Fund’s contribution to the Investment Adviser’s revenues andpre-tax profit margins. In this regard the Trustees noted that they had received, among other things, profitability analyses and summaries, revenue and expense schedules by Fund and by function (i.e., investment management, transfer agency and distribution and service), and information on the Investment Adviser’s expense allocation methodology. They observed that the profitability and expense figures are substantially similar to those used by the Investment Adviser for many internal purposes, including compensation decisions among various business groups, and are thus subject to a vigorous internal debate about how certain revenue and expenses should be allocated. The Trustees also noted that the internal audit group within the Goldman Sachs organization periodically audits the expense allocation methodology and that the internal audit group was satisfied with the reasonableness, consistency, and accuracy of the Investment Adviser’s expense allocation methodology. Profitability data for each Fund was provided for 2018 and 2017, and the Trustees considered this information in relation to the Investment Adviser’s overall profitability.
Economies of Scale
The Trustees considered the information that had been provided regarding whether there have been economies of scale with respect to the management of the Funds. The Trustees also considered the breakpoints in the fee rate payable under the Management Agreement for each of the Funds at the following annual percentage rates of the average daily net assets of the Funds:
| | | | | | | | | | | | | | | | |
| | | Absolute
Return
Tracker Fund | | | Alternative Premia Fund | | | Commodity
Strategy
Fund | | | Managed
Futures
Strategy
Fund | |
| | | | |
| First $1 billion | | | 0.70 | % | | | 0.79 | % | | | 0.50 | % | | | 1.00 | % |
| | | | |
| Next $1 billion | | | 0.63 | | | | 0.71 | | | | 0.50 | | | | 0.90 | |
| | | | |
| Next $3 billion | | | 0.60 | | | | 0.68 | | | | 0.45 | | | | 0.86 | |
| | | | |
| Next $3 billion | | | 0.59 | | | | 0.66 | | | | 0.43 | | | | 0.84 | |
| | | | |
| Over $8 billion | | | 0.53 | | | | 0.65 | | | | 0.42 | | | | 0.82 | |
The Trustees noted that the breakpoints were designed to share potential economies of scale, if any, with the Funds and their shareholders as assets under management reach those asset levels. The Trustees considered the amounts of assets in the Funds; the Funds’ recent share purchase and redemption activity; the information provided by the Investment Adviser relating to the costs of the services provided by the Investment Adviser and its affiliates and their realized profits; information comparing fee rates charged by the Investment Adviser with fee rates charged to other funds in the peer groups; and the Investment Adviser’s undertaking to limit certain expenses of the Funds that exceed specified levels. Upon reviewing these matters at the Annual Meeting, the Trustees concluded that the fee breakpoints represented a means of assuring that benefits of scalability, if any, would be passed along to shareholders at the specified asset levels. They also noted that the Investment Adviser had passed along savings to shareholders of the Absolute Return Tracker Fund, which had asset levels above at least the first breakpoint during the prior fiscal year.
Other Benefits to the Investment Adviser and Its Affiliates
The Trustees also considered the other benefits derived by the Investment Adviser and its affiliates from their relationships with the Funds as stated above, including: (a) transfer agency fees received by Goldman Sachs & Co. LLC (“Goldman Sachs”); (b) brokerage and futures commissions earned by Goldman Sachs for executing securities and futures transactions on behalf of the Funds; (c) trading efficiencies resulting from aggregation of orders of the Funds with those for other funds or accounts managed by the Investment Adviser; (d) with respect to the Absolute Return Tracker Fund and Alternative Premia Fund, fees earned by Goldman Sachs Agency Lending (“GSAL”), an affiliate of the Investment Adviser, as securities lending agent (and fees earned by the Investment Adviser for managing the fund in which the Absolute Return Tracker Fund’s and Alternative Premia Fund’s cash collateral is invested); (e) the Investment Adviser’s ability to leverage the infrastructure designed to service the Funds on behalf of its other clients; (f) the Investment Adviser’s ability to cross-market other products and services to Fund shareholders; (g) Goldman Sachs’ retention of certain fees as Fund Distributor; (h) the Investment Adviser’s ability to negotiate better pricing with custodians on behalf of its other clients, as a result of the relationship with the Funds; and (i) the possibility that the working relationship between the Investment Adviser and the Funds’ third-party service providers may cause those service providers to be more likely to do business with other areas of Goldman Sachs. In the course of considering the foregoing, the Independent Trustees requested and received further information quantifying certain of thesefall-out benefits.
138
GOLDMAN SACHS ALTERNATIVE FUNDS
Statement Regarding Basis for Approval of Management Agreement (Unaudited) (continued)
Other Benefits to the Funds and Their Shareholders
The Trustees also noted that the Funds receive certain other potential benefits as a result of their relationship with the Investment Adviser, including: (a) trading efficiencies resulting from aggregation of orders of the Funds with those of other funds or accounts managed by the Investment Adviser; (b) enhanced servicing from vendors due to the volume of business generated by the Investment Adviser and its affiliates; (c) enhanced servicing from broker-dealers due to the volume of business generated by the Investment Adviser and its affiliates; (d) the Investment Adviser’s ability to negotiate favorable terms with derivatives counterparties on behalf of the Funds as a result of the size and reputation of the Goldman Sachs organization; (e) the advantages received from the Investment Adviser’s knowledge and experience gained from managing other accounts and products; (f) the Investment Adviser’s ability to hire and retain qualified personnel to provide services to the Funds because of the reputation of the Goldman Sachs organization; (g) the Funds’ access, through the Investment Adviser, to certain firm-wide resources (e.g., proprietary risk management systems and databases), subject to certain restrictions; (h) the Absolute Return Tracker Fund’s and Alternative Premia Fund’s ability to participate in the securities lending program administered by GSAL, as measured by the revenue received by the Funds in connection with the program; and (i) the Funds’ access to certain affiliated distribution channels. In addition, the Trustees noted the competitive nature of the mutual fund marketplace, and considered that many of the Funds’ shareholders invested in the Funds in part because of the Funds’ relationship with the Investment Adviser and that those shareholders have a general expectation that the relationship will continue.
Conclusion
In connection with their consideration of the Management Agreement, the Trustees gave weight to each of the factors described above, but did not identify any particular factor as controlling their decision. After deliberation and consideration of all of the information provided, including the factors described above, the Trustees concluded, in the exercise of their business judgment, that the management fees paid by each of the Funds were reasonable in light of the services provided to it by the Investment Adviser, the Investment Adviser’s costs and each Fund’s current and reasonably foreseeable asset levels. The Trustees unanimously concluded that the Investment Adviser’s continued management likely would benefit each Fund and its shareholders and that the Management Agreement should be approved and continued with respect to each Fund until June 30, 2020.
139
FUNDS PROFILE
Goldman Sachs Funds
Goldman Sachs is a premier financial services firm, known since 1869 for creating thoughtful and customized investment solutions in complex global markets.
Today, theInvestment Management Division of Goldman Sachs serves a diverse set of clients worldwide, including private institutions, public entities and individuals. With approximately $1.44 trillion in assets under supervision as of June 30, 2019, Goldman Sachs Asset Management (“GSAM”) has portfolio management teams located around the world and our investment professionals bring firsthand knowledge of local markets to every investment decision. Assets under supervision includes assets under management and other client assets for which Goldman Sachs does not have full discretion. GSAM leverages the resources of Goldman Sachs & Co. LLC subject to legal, internal and regulatory restrictions.
Money Market
Financial Square FundsSM
| ∎ | | Financial Square Treasury Solutions Fund1 |
| ∎ | | Financial Square Government Fund1 |
| ∎ | | Financial Square Money Market Fund2 |
| ∎ | | Financial Square Prime Obligations Fund2 |
| ∎ | | Financial Square Treasury Instruments Fund1 |
| ∎ | | Financial Square Treasury Obligations Fund1 |
| ∎ | | Financial Square Federal Instruments Fund1 |
Investor FundsSM
| ∎ | | Investor Money Market Fund3 |
| ∎ | | Investor Tax-Exempt Money Market Fund3 |
Fixed Income
Short Duration and Government
| ∎ | | High Quality Floating Rate Fund |
| ∎ | | Short-Term Conservative Income Fund |
| ∎ | | Short Duration Government Fund |
| ∎ | | Short Duration Income Fund |
| ∎ | | Inflation Protected Securities Fund |
Multi-Sector
Municipal and Tax-Free
| ∎ | | High Yield Municipal Fund |
| ∎ | | Dynamic Municipal Income Fund |
| ∎ | | Short Duration Tax-Free Fund |
| ∎ | | Municipal Income Completion Fund |
Single Sector
| ∎ | | Investment Grade Credit Fund |
| ∎ | | High Yield Floating Rate Fund |
| ∎ | | Emerging Markets Debt Fund |
| ∎ | | Local Emerging Markets Debt Fund |
Fixed Income Alternatives
| ∎ | | Long Short Credit Strategies Fund |
Fundamental Equity
| ∎ | | Small/Mid Cap Value Fund |
| ∎ | | Small/Mid Cap Growth Fund |
| ∎ | | Concentrated Growth Fund |
| ∎ | | Technology Opportunities Fund |
| ∎ | | Growth Opportunities Fund |
| ∎ | | Rising Dividend Growth Fund |
Tax-Advantaged Equity
| ∎ | | U.S. Tax-Managed Equity Fund |
| ∎ | | International Tax-Managed Equity Fund |
| ∎ | | U.S. Equity Dividend and Premium Fund |
| ∎ | | International Equity Dividend and Premium Fund |
Equity Insights
| ∎ | | Small Cap Equity Insights Fund |
| ∎ | | U.S. Equity Insights Fund |
| ∎ | | Small Cap Growth Insights Fund |
| ∎ | | Large Cap Growth Insights Fund |
| ∎ | | Large Cap Value Insights Fund |
| ∎ | | Small Cap Value Insights Fund |
| ∎ | | International Small Cap Insights Fund |
| ∎ | | International Equity Insights Fund |
| ∎ | | Emerging Markets Equity Insights Fund |
Fundamental Equity International
| ∎ | | International Equity Income Fund |
| ∎ | | International Equity ESG Fund |
| ∎ | | Emerging Markets Equity Fund |
| ∎ | | Imprint Emerging Markets Opportunities Fund5 |
| ∎ | | ESG Emerging Markets Equity Fund |
Alternative
| ∎ | | Real Estate Securities Fund |
| ∎ | | International Real Estate Securities Fund |
| ∎ | | Commodity Strategy Fund |
| ∎ | | Global Real Estate Securities Fund |
| ∎ | | Alternative Premia Fund |
| ∎ | | Absolute Return Tracker Fund |
| ∎ | | Managed Futures Strategy Fund |
| ∎ | | MLP Energy Infrastructure Fund |
| ∎ | | Multi-Manager Alternatives Fund |
| ∎ | | Absolute Return Multi-Asset Fund |
| ∎ | | Global Infrastructure Fund |
Total Portfolio Solutions
| ∎ | | Global Managed Beta Fund |
| ∎ | | Multi-Manager Non-Core Fixed Income Fund |
| ∎ | | Multi-Manager U.S. Dynamic Equity Fund |
| ∎ | | Multi-Manager Global Equity Fund |
| ∎ | | Multi-Manager International Equity Fund |
| ∎ | | Tactical Tilt Overlay Fund |
| ∎ | | Balanced Strategy Portfolio |
| ∎ | | Multi-Manager U.S. Small Cap Equity Fund |
| ∎ | | Multi-Manager Real Assets Strategy Fund |
| ∎ | | Growth and Income Strategy Portfolio |
| ∎ | | Growth Strategy Portfolio |
| ∎ | | Dynamic Global Equity Fund4 |
| ∎ | | Satellite Strategies Portfolio |
| ∎ | | Enhanced Dividend Global Equity Portfolio |
| ∎ | | Tax-Advantaged Global Equity Portfolio |
| ∎ | | Strategic Factor Allocation Fund |
| ∎ | | Target Date 2020 Portfolio |
| ∎ | | Target Date 2025 Portfolio |
| ∎ | | Target Date 2030 Portfolio |
| ∎ | | Target Date 2035 Portfolio |
| ∎ | | Target Date 2040 Portfolio |
| ∎ | | Target Date 2045 Portfolio |
| ∎ | | Target Date 2050 Portfolio |
| ∎ | | Target Date 2055 Portfolio |
| ∎ | | Target Date 2060 Portfolio |
| ∎ | | GQG Partners International Opportunities Fund |
| 1 | | You could lose money by investing in the Fund. Although the Fund seeks to preserve the value of your investment at $1.00 per share, it cannot guarantee it will do so. An investment in the Fund is not a deposit of a bank and is not insured or guaranteed by the Federal Deposit Insurance Corporation or any other government agency. The Fund’s sponsor has no legal obligation to provide financial support to the Fund, and you should not expect that the sponsor will provide financial support to the Fund at any time. |
| 2 | | You could lose money by investing in the Fund. Because the share price of the Fund will fluctuate, when you sell your shares they may be worth more or less than what you originally paid for them. The Fund may impose a fee upon sale of your shares or may temporarily suspend your ability to sell shares if the Fund’s liquidity falls below required minimums because of market conditions or other factors. An investment in the Fund is not a deposit of a bank and is not insured or guaranteed by the Federal Deposit Insurance Corporation or any other government agency. The Fund’s sponsor has no legal obligation to provide financial support to the Fund, and you should not expect that the sponsor will provide financial support to the Fund at any time. |
| 3 | | You could lose money by investing in the Fund. Although the Fund seeks to preserve the value of your investment at $1.00 per share, it cannot guarantee it will do so. The Fund may impose a fee upon sale of your shares or may temporarily suspend your ability to sell shares if the Fund’s liquidity falls below required minimums because of market conditions or other factors. An investment in the Fund is not a deposit of a bank and is not insured or guaranteed by the Federal Deposit Insurance Corporation or any other government agency. The Fund’s sponsor has no legal obligation to provide financial support to the Fund, and you should not expect that the sponsor will provide financial support to the Fund at any time. |
| 4 | | Effective after the close of business on February 28, 2019, the Goldman Sachs Equity Growth Strategy Portfolio was renamed the Goldman Sachs Dynamic Global Equity Fund. |
| | | Financial Square FundsSM and Investor FundsSM are registered service marks of Goldman Sachs & Co. LLC. |
| 5 | | Effective after the close of business on August 30, 2019, the Goldman Sachs N-11 Equity Fund was renamed the Goldman Sachs Imprint Emerging Markets Opportunities Fund. |
| * | | This list covers open-end funds only. Please visit our website at www.GSAMFUNDS.com to learn about our closed-end funds and exchange-traded funds. |
| | |
TRUSTEES Jessica Palmer,Chair Kathryn A. Cassidy Diana M. Daniels James A. McNamara Roy W. Templin Gregory G. Weaver | | OFFICERS James A. McNamara,President Joseph F. DiMaria,Principal Financial Officer, Principal Accounting Officer and Treasurer Caroline L. Kraus,Secretary |
| |
GOLDMAN SACHS & CO. LLC Distributor and Transfer Agent | | GOLDMAN SACHS ASSET MANAGEMENT, L.P.Investment Adviser |
Visit our web site atwww.GSAMFUNDS.com to obtain the most recent month-end returns.
Goldman Sachs Asset Management, L.P. 200 West Street, New York, New York 10282
Economic and market forecasts presented herein reflect our judgment as of the date of this presentation and are subject to change without notice. These forecasts do not take into account the specific investment objectives, restrictions, tax and financial situation or other needs of any specific client. Actual data will vary and may not be reflected here. These forecasts are subject to high levels of uncertainty that may affect actual performance. Accordingly, these forecasts should be viewed as merely representative of a broad range of possible outcomes. These forecasts are estimated, based on assumptions, and are subject to significant revision and may change materially as economic and market conditions change. Goldman Sachs has no obligation to provide updates or changes to these forecasts. Case studies and examples are for illustrative purposes only.
The portfolio risk management process includes an effort to monitor and manage risk, but does not imply low risk.
The reports concerning the Funds included in this shareholder report may contain certain forward-looking statements about the factors that may affect the performance of the Funds in the future. These statements are based on Fund management’s predictions and expectations concerning certain future events and their expected impact on the Funds, such as performance of the economy as a whole and of specific industry sectors, changes in the levels of interest rates, the impact of developing world events, and other factors that may influence the future performance of the Funds. Management believes these forward-looking statements to be reasonable, although they are inherently uncertain and difficult to predict. Actual events may cause adjustments in portfolio management strategies from those currently expected to be employed.
A description of the policies and procedures that the Funds use to determine how to vote proxies relating to portfolio securities and information regarding how a Fund voted proxies relating to portfolio securities during the most recent 12-month period ended June 30 is available (i) without charge, upon request by calling 1-800-526-7384 (for Retail Shareholders) or 1-800-621-2550 (for Institutional Shareholders); and (ii) on the Securities and Exchange Commission (“SEC”) web site at http://www.sec.gov.
The Funds will file their portfolio holdings for each month in a fiscal quarter within 60 days after the end of the relevant fiscal quarter on Form N-PORT. Portfolio holdings information for the third month of each fiscal quarter will be made available on the SEC’s web site at http://www.sec.gov. Portfolio holdings information may be obtained upon request and without charge by calling 1-800-526-7384 (for Retail Shareholders) or 1-800-621-2550 (for Institutional Shareholders).
Holdings and allocations shown are as of June 30, 2019 and may not be representative of future investments. Fund holdings should not be relied on in making investment decisions and should not be construed as research or investment advice regarding particular securities. Current and future holdings are subject to risk.
This material is not authorized for distribution to prospective investors unless preceded or accompanied by a current prospectus or summary prospectus, if applicable. Investors should consider the Fund’s objective, risks, and charges and expenses, and read the summary prospectus, if available, and/or the prospectus carefully before investing or sending money. The summary prospectus, if available, and the prospectus contain this and other information about the Fund and may be obtained from your authorized dealer or from Goldman Sachs & Co. LLC by calling (retail – 1-800-526-7384) (institutional – 1-800-621-2550).
© 2019 Goldman Sachs. All rights reserved. 174787-OTU-1029949 SELSATSAR-19
Goldman Sachs Funds

| | | | |
| | |
| Semi-Annual Report | | | | June 30, 2019 |
| | |
| | | | Tax-Advantaged Equity Funds |
| | | | U.S. Equity Dividend and Premium |
| | | | International Equity Dividend and Premium |
| | | | U.S. Tax-Managed Equity |
| | | | International Tax-Managed Equity |
It is our intention that beginning on January 1, 2021, paper copies of the Funds’ annual and semi-annual shareholder reports will no longer be sent by mail, unless you specifically request paper copies of the reports from a Fund or from your financial intermediary. Instead, the reports will be made available on a website, and you will be notified by mail each time a report is posted and provided with a website link to access the report.
If you already elected to receive shareholder reports electronically, you will not be affected by this change and you need not take any action. At any time, you may elect to receive reports and certain communications from the Fund electronically by calling the applicable toll-free number below or by contacting your financial intermediary.
You may elect to receive all future shareholder reports in paper free of charge. If you hold shares of a Fund directly with the Fund’s transfer agent, you can inform the transfer agent that you wish to receive paper copies of reports by calling toll-free 800-621-2550 for Institutional, Service, Class R6 and Class P shareholders or 800-526-7384 for all other shareholders. If you hold shares of a Fund through a financial intermediary, please contact your financial intermediary to make this election. Your election to receive reports in paper will apply to all Goldman Sachs Funds held in your account if you invest through your financial intermediary or all Goldman Sachs Funds held with the Funds’ transfer agent if you invest directly with the transfer agent.

Goldman SachsTax-Advantaged Equity Funds
| ∎ | | U.S. EQUITY DIVIDEND AND PREMIUM |
| ∎ | | INTERNATIONAL EQUITY DIVIDEND AND PREMIUM |
| ∎ | | INTERNATIONALTAX-MANAGED EQUITY |
| | | | |
| | | |
| NOT FDIC-INSURED | | May Lose Value | | No Bank Guarantee |
MARKET REVIEW
Goldman SachsTax-Advantaged Equity Funds
Market Review
During the six months ended June 30, 2019 (the “Reporting Period”), the performance of the U.S. and international equity markets were influenced most by central bank monetary policy, U.S. and global economic data, and geopolitical issues.
U.S. Equities
During the first quarter of 2019, when the Reporting Period started, U.S. equities, as represented by the S&P 500® Index, rose 13.65%. After a volatile end to 2018, the rally to begin 2019 marked the best first quarter performance for the S&P 500® Index since 1998. Federal Reserve (“Fed”) commentary provided a supportive background for U.S. equities, as Fed Chair Jerome Powell reiterated a “patient” approach to monetary policy that included a pause in interest rate hikes and a plan to end quantitative tightening, or the shrinking of the Fed’s balance sheet as securities mature, by the end of the 2019 calendar year. The U.S. unemployment rate remained well below trend at 3.8% in February 2019, and wages grew 3.4% year over year. Housing data showed strength in the first calendar quarter, with new home sales reaching 667,000 in February, bringing the three-month average up to 630,000. Strength in housing data could be partially attributed to a steep decline in mortgage rates resulting from a more cautious Fed. The University of Michigan Consumer Sentiment Index was also a point of significant strength in the U.S. economy, steadily climbing in each month of the first quarter of 2019 and eventually reaching 98.4 in March, its highest level in six months. Economic growth concerns that had dominated the fourth quarter of 2018 failed to completely disappear, however, as fourth quarter 2018 Gross Domestic Product (“GDP”) growth was revised down 0.4% in March 2019 to 2.2%. While the revision was further evidence of a slowing U.S. economy, the result was largely priced in by the U.S. equity market and thus had a limited effect on stock prices outside of the financials sector, which historically tends to be more interest rate sensitive.
The S&P 500® Index rose a solid but more moderate 4.30% during the second quarter of 2019. Trade tensions between the U.S. and China dominated headlines and broadly added noise to the markets. (Noise refers to market activity that can confuse or misrepresent genuine underlying trends.) In April 2019, investors grew optimistic about a possible U.S.-China trade deal, but this optimism faded in May when the U.S. President threatened to raise current tariffs and impose new duties on $300 billion of additional Chinese imports. Also, sanctions were temporarily placed on a Chinese telecommunications giant, until they were lifted in June 2019, when any additional tariffs or compromise were postponed. During the second calendar quarter, the markets kept a close eye on the Fed, which said it might take a more accommodative approach to monetary policy. Following the Fed’s statement, the market consensus actually priced in at least one interest rate cut by the end of 2019. U.S. economic indicators were mixed during the second calendar quarter, with consumer sentiment remaining elevated but nonfarm payroll data and manufacturing indices falling short of consensus expectations.
During the Reporting Period overall, the S&P 500® Index returned 18.54%. All 11 of its sectors posted positive absolute returns, with 10 of the 11 generating double-digit gains. Information technology, consumer discretionary and industrials were the best performing sectors in the S&P 500® Index, as measured by total return, while the weakest performing sectors in the S&P 500® Index during the Reporting Period were health care, energy and utilities.
1
MARKET REVIEW
Within the U.S. equity market, all capitalization segments posted double-digit positive returns, led bymid-cap stocks, as measured by the Russell Midcap® Index, followed bylarge-cap stocks, as measured by the Russell 1000® Index, and thensmall-cap stocks, as measured by the Russell 2000® Index. From a style perspective, growth-oriented stocks significantly outpaced value-oriented stocks across the capitalization spectrum. (All as measured by the FTSE Russell indices.)
International Equities
When the Reporting Period began with the first quarter of 2019, international developed equity markets rebounded across all regions, recovering from weakness in 2018. European equities were resilient despite the overhang of Brexit and slowing economic data in the Eurozone. (Brexit is the popular term for the U.K.’s path out of the European Union.) Japanese equities gained, as fears around the extent of the global economic growth slowdown eased and the Japanese yen gradually weakened. In the U.S., the Fed shifted to a dovish stance amidst slower economic growth. (Dovish tends to suggest lower interest rates; opposite of hawkish.) Meanwhile, there was seemingly significant progress made in the trade talks between China and the U.S., paving the way for a potential resolution.
International developed equity markets continued to advance during the second quarter of 2019, albeit more modestly so than in the prior quarter, supported by the Fed’s signals of its dovish outlook for the remainder of the calendar year. In April 2019, international developed equities performed well while awaiting U.S.-China trade talks to reconvene at the G20 Summit scheduled for the end of June 2019. (Also known as Group of 20 nations, the G20 is a forum attended by finance ministers and central bank governors from the world’s highly developed economies consisting of 19 countries and the European Union.) However, negotiations were halted in May 2019 after the U.S. increased tariffs from 10% to 25% on $200 billion of Chinese goods. This degradation of trade talks contributed to a volatile May, with the MSCI EAFE Index, representing international developed equities, declining 4.80% for the month. On June 18, 2019, the U.S. President announced that he and China’s President would be meeting on the sidelines of the G20 Summit in Osaka, Japan on June 29th to discuss the ongoing trade impasse, resulting in an immediate positive market reaction. The result was both sides agreeing to restart negotiations, and the U.S. agreeing to put plans for the additional tariffs of 25% on all remaining imports from China on an indefinite hold. In an additional positive surprise, the U.S. agreed to lift restrictions it had put in place on a Chinese technology firm, allowing it to purchase equipmentnon-threatening to U.S. national security from U.S. firms. The outcome of the G20 Summit was similar to the previous one held in Buenos Aires in 2018. That is, it led to a temporary truce in trade tensions, a delay in raising tariffs, but no firm resolution.
For the Reporting Period overall, the MSCI EAFE Index posted a return of 14.03% in U.S. dollar terms. All 11 sectors gained, with information technology leading the way, followed by materials and industrials. Communication services, utilities and energy were the weakest performing sectors in the MSCI EAFE Index on the basis of total return during the Reporting Period.
From a country perspective, all equity markets in the MSCI EAFE Index posted a positive absolute return during the Reporting Period. Switzerland, New Zealand and the Netherlands were the strongest individual country constituents in the MSCI EAFE Index on a relative basis during the Reporting Period. Israel, Japan and Finland posted positive absolute returns but most significantly lagged the MSCI EAFE Index on a relative basis during the Reporting Period.
2
MARKET REVIEW
Looking Ahead
In the months ahead, we expect less expensive stocks to outpace more expensive stocks. We also believe that stocks with good momentum are likely to outperform those with poor momentum. Our plan is to seek profitable companies with positive fundamentals, sustainable earnings and a track record of using capital to enhance shareholder value. To that end, we anticipate remaining fully invested, with long-term performance likely to be the result of stock selection rather than sector or capitalization allocations.
We stand behind our investment philosophy that sound economic investment principles, coupled with a disciplined quantitative approach, can provide potentially strong, uncorrelated returns over the long term. Our research agenda is robust, and we continue to enhance our existing models, add new proprietary forecasting signals and improve our trading execution as we seek to provide the most value to our shareholders.
3
INVESTMENT PROCESS
What Differentiates the Goldman Sachs U.S. Equity Dividend and Premium and Goldman Sachs International Equity Dividend and Premium Funds’ Investment Process?
The Goldman Sachs U.S. Equity Dividend and Premium Fund seeks to maximize income and total return. The Goldman Sachs International Equity Dividend and Premium Fund seeks to maximize total return with an emphasis on income. Their portfolios consist primarily oflarge-cap, dividend-paying stocks.1 By investing in these securities, and through the use of option call writing, the Funds seek to generate an attractiveafter-tax cash flow.

A diversified portfolio:
| ∎ | | Create a diversifiedlarge-cap equity portfolio that participates in all industries and sectors. |
| ∎ | | Emphasize higher dividend-paying stocks within each industry and sector. |
Written call options:
| ∎ | | The Funds utilize index call writing to seek to enhance their cash flow. |

| ∎ | | We use proprietary quantitative techniques, including optimization tools, a risk model and a transactions cost model, in identifying a portfolio of stocks that we believe may enhance expected dividend yield while limiting deviations when compared to the S&P 500® Index or MSCI EAFE Index, as applicable. |

| ∎ | | A fully invested, style-consistent portfolio. |
| ∎ | | The Funds seek attractiveafter-tax cash flow from qualified dividends, long-term capital gains and option call writing. |
| ∎ | | The Funds seek to enhanceafter-tax returns by generating distributions primarily from qualified dividends and long-term capital gains. |
| 1 | | Dividends are not guaranteed and a company’s future ability to pay dividends may be limited. |
| | | There is no guarantee that these objectives will be met. |
4
PORTFOLIO RESULTS
U.S. Equity Dividend and Premium Fund
Investment Objective
The Fund seeks to maximize income and total return.
Portfolio Management Discussion and Analysis
Below, the Goldman Sachs Quantitative Investment Strategies Team discusses the Goldman Sachs U.S. Equity Dividend and Premium Fund’s (the “Fund”) performance and positioning for the six-month period ended June 30, 2019 (the “Reporting Period”).
| Q | | How did the Fund perform during the Reporting Period? |
| A | | During the Reporting Period, the Fund’s Class A, Class C, Institutional, Investor, Class P and Class R6 Shares generated cumulative total returns, without sales charges, of 14.77%, 14.43%, 15.01%, 15.03%, 15.02% and 15.03%, respectively. These returns compare to the 18.54% cumulative total return of the Fund’s primary benchmark, the Standard & Poor’s 500® Index (with dividends reinvested) (the “S&P 500® Index”), during the same period. The Bloomberg Barclays U.S. Aggregate Bond Index, the secondary benchmark, returned 6.11%. |
| | | Although the Fund does not invest in fixed income securities, maximizing income is part of the Fund’s investment objective, and therefore we believe that a comparison of the Fund’s performance to that of the Bloomberg Barclays U.S. Aggregate Bond Index is useful to investors. |
| Q | | What key factors were most responsible for the Fund’s performance during the Reporting Period? |
| A | | During the Reporting Period, security selection detracted from the Fund’s relative returns. Specifically, the Fund’s bias toward stocks with higher dividend yields diminished performance. Overall, the Fund was hurt by its investments in the health care, consumer discretionary and energy sectors. Holdings in the information technology and real estate sectors bolstered performance. |
| | | The sale of call options on the S&P 500® Index detracted from the Fund’s total return during the Reporting Period. A call option is an option that gives the holder the right to buy a certain quantity of an underlying security at an agreed-upon price at any time up to an agreed-upon date. |
| Q | | How did the Fund’s call writing affect its performance? |
| A | | Consistent with our investment approach, we wrote index call options on a portion of the stock portfolio’s market value. When the Fund sells an index call option, it retains the premium it receives from the sale. However, if the purchaser exercises the option, the Fund is obligated to pay the purchaser the difference between the price of the index and the exercise price of the option. Although the Fund retains the premium it receives from the sale of the option, the premium may not exceed the difference in the value of the index as call options are exercised. This is what happened during the Reporting Period when the S&P 500® Index appreciated, and thus the Fund’s call writing detracted from performance. |
| | | Call option writing has the potential to reduce Fund volatility. Since its inception, the realized daily volatility of the Fund has been 17.21% compared to the realized volatility of the S&P 500®Index of 18.72%. During the Reporting Period, the realized daily volatility of the Fund was 10.85% compared to the realized volatility of the S&P 500® Index of 12.50%.1 |
| Q | | What was the Fund’s dividend yield during the Reporting Period? |
| A | | While maintaining industry and sector weights consistent with the S&P 500® Index, we favor stocks with higher dividend yields. The dividend yield of the Fund’s Institutional Share class during the Reporting Period was 2.77% compared to 1.96% for the S&P 500® Index. (Dividend yield is a ratio that shows how much a company pays out in dividends in a year divided by its share price.) The Fund’s dividend yield served to enhance its quarterly net |
| | 1 | | The realized daily volatility of the Fund quoted herein is for Institutional Shares, net of fees. Based on GSAM calculations. |
5
PORTFOLIO RESULTS
| | income distributions. As of June 30, 2019, the Standardized30-Day Subsidized Yield was 2.01% and the Standardized30-Day Unsubsidized Yield was 1.99%.2 |
| Q | | Which individual stock holdings detracted significantly from relative performance during the Reporting Period? |
| A | | Relative to the S&P 500® Index, the Fund was hurt by its overweight positions in oil and gas exploration company Occidental Petroleum, pharmaceutical company AbbVie and retailer Macy’s. The Fund was overweight all three stocks primarily due to their attractive dividend yields and/or risk metrics. |
| Q | | Which individual stock holdings contributed most positively to the Fund’s relative results? |
| A | | The Fund benefited from an overweight position versus the S&P 500® Index in aerospace and defense company Lockheed Martin. Underweight positions in health services organization Cigna and biotechnology company Biogen also added to relative returns. The Fund was overweight Lockheed Martin largely because of its attractive dividend yield and/or risk metrics. The underweights in Cigna and Biogen were primarily due to their unattractive yields and/or risk metrics. |
| Q | | How did the Fund use derivatives and similar instruments during the Reporting Period? |
| A | | During the Reporting Period, we used equity index futures, on an opportunistic basis, to equitize the Fund’s excess cash holdings. In other words, we put the Fund’s excess cash holdings to work by using them as collateral for the purchase of equity index futures. Equity index futures did not have a significant impact on Fund performance during the Reporting Period. Consistent with our investment approach, we also wrote equity index options on a portion of the portfolio’s market value in an effort to generate premiums. Equity index options had a negative impact on performance during the Reporting Period. |
| Q | | What changes or enhancements did you make to your quantitative model during the Reporting Period? |
| A | | We made no changes to our quantitative model during the Reporting Period. |
| | 2 | | The Standardized 30-Day Subsidized Yield and Standardized30-Day Unsubsidized Yield of the Fund quoted herein is for Institutional Shares, net of fees. Based on GSAM calculations. |
6
FUND BASICS
U.S. Equity Dividend and Premium Fund
as of June 30, 2019
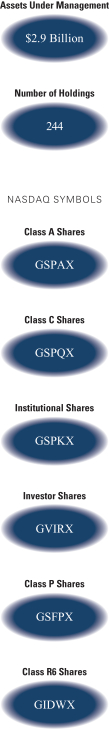
| | | | | | | | | | | | | | |
| | PERFORMANCE REVIEW | |
| | | | |
| | | January 1, 2019–June 30, 2019 | | Fund Total Return
(based on NAV)1 | | | S&P 500® Index2 | | | Bloomberg Barclays U.S.
Aggregate Bond Index3 | |
| | | | |
| | Class A | | | 14.77 | % | | | 18.54 | % | | | 6.11 | % |
| | Class C | | | 14.43 | | | | 18.54 | | | | 6.11 | |
| | Institutional | | | 15.01 | | | | 18.54 | | | | 6.11 | |
| | Investor | | | 15.03 | | | | 18.54 | | | | 6.11 | |
| | Class P | | | 15.02 | | | | 18.54 | | | | 6.11 | |
| | | Class R6 | | | 15.03 | | | | 18.54 | | | | 6.11 | |
| | 1 | | The net asset value (“NAV”) represents the net assets of the class of the Fund(ex-dividend) divided by the total number of shares of the class outstanding. The Fund’s performance reflects the reinvestment of dividends and other distributions. The Fund’s performance does not reflect the deduction of any applicable sales charges. |
| | 2 | | The S&P 500® Index is an unmanaged composite index of 500 common stock prices. The Index figures do not include any deduction for fees, expenses or taxes. It is not possible to invest directly in an index. |
| | 3 | | The Bloomberg Barclays U.S. Aggregate Bond Index represents an unmanaged diversified portfolio of fixed income securities, including U.S. Treasuries, investment-grade corporate bonds, and mortgage-backed and asset-backed securities. The Index figures do not reflect any deduction for fees, expenses or taxes. It is not possible to invest directly in an index. |
| | | | | | | | | | | | | | | | | | | | | | |
| | STANDARDIZED TOTAL RETURNS4 | |
| | | | | | |
| | | For the period ended 6/30/19 | | One Year | | | Five Years | | | Ten Years | | | Since Inception | | | Inception Date | |
| | | | | | |
| | Class A | | | 0.23 | % | | | 6.92 | % | | | 11.45 | % | | | 6.76 | % | | | 8/31/05 | |
| | Class C | | | 4.25 | | | | 7.35 | | | | 11.23 | | | | 6.39 | | | | 8/31/05 | |
| | Institutional | | | 6.53 | | | | 8.58 | | | | 12.52 | | | | 7.62 | | | | 8/31/05 | |
| | Investor | | | 6.38 | | | | 8.43 | | | | N/A | | | | 11.93 | | | | 8/31/10 | |
| | Class P | | | 6.54 | | | | N/A | | | | N/A | | | | 6.00 | | | | 4/17/18 | |
| | | Class R6 | | | 6.46 | | | | N/A | | | | N/A | | | | 8.10 | | | | 4/30/18 | |
| | 4 | | The Standardized Total Returns are average annual total returns or cumulative total returns (only if the performance period is one year or less) as of the most recent calendar quarter-end. They assume reinvestment of all distributions at NAV. These returns reflect a maximum initial sales charge of 5.5% for Class A Shares and the assumed contingent deferred sales charge for Class C Shares (1% if redeemed within 12 months of purchase). Effective July 30, 2018, Class C Shares convert automatically to Class A Shares on or about the fifteenth day of the last month of the calendar quarter that is ten years after the purchase date. The Since Inception returns for Class C Shares do not reflect the conversion to Class A Shares after the first ten years of performance. Because Institutional, Investor, Class P and Class R6 Shares do not involve a sales charge, such a charge is not applied to their Standardized Total Returns. |
The returns set forth in the tables above represent past performance. Past performance does not guarantee future results. The Fund’s investment return and principal value will fluctuate so that an investor’s shares, when redeemed, may be worth more or less than their original cost. Current performance may be lower or higher than the performance quoted above. Please visit our web site atwww.GSAMFUNDS.com to obtain the most recent month-end returns.
7
FUND BASICS
Performance reflects applicable fee waivers and/or expense limitations in effect during the periods shown. In their absence, performance would be reduced. Returns do not reflect the deduction of taxes that a shareholder would pay on Fund distributions or the redemption of Fund shares.
| | | | | | | | | | |
| | EXPENSE RATIOS5 | |
| | | |
| | | | | Net Expense Ratio (Current) | | | Gross Expense Ratio (Before Waivers) | |
| | | |
| | Class A | | | 1.12 | % | | | 1.15 | % |
| | Class C | | | 1.87 | | | | 1.90 | |
| | Institutional | | | 0.74 | | | | 0.76 | |
| | Investor | | | 0.87 | | | | 0.90 | |
| | Class P | | | 0.73 | | | | 0.75 | |
| | | Class R6 | | | 0.73 | | | | 0.75 | |
| | 5 | | The expense ratios of the Fund, both current (net of applicable fee waivers and/or expense limitations) and before waivers (gross of applicable fee waivers and/or expense limitations) are as set forth above according to the most recent publicly available Prospectus for the Fund and may differ from the expense ratios disclosed in the Financial Highlights in this report. Pursuant to contractual arrangements, the Fund’s waivers and/or expense limitations will remain in place through at least April 30, 2020, and prior to such date the Investment Adviser may not terminate the arrangements without the approval of the Fund’s Board of Trustees. If these arrangements are discontinued in the future, the expense ratios may change without shareholder approval. |
| | | | | | | | | | | | | | |
| | STANDARDIZED AFTER-TAX PERFORMANCE AS OF 6/30/196 | |
| | | | |
| | | Class A Shares | | One Year | | | Five Years | | | Ten Years | |
| | | | |
| | Returns before taxes* | | | 0.23 | % | | | 6.92 | % | | | 11.45 | % |
| | Returns after taxes on distributions** | | | -1.53 | | | | 5.42 | | | | 10.21 | |
| | | Returns after taxes on distributions***
and sale of Fund shares | | | 0.97 | | | | 5.17 | | | | 9.29 | |
| 6 | | The after-tax returns are calculated using the historically highest individual federal marginal income tax rates at the time of distributions (currently 23.8% for qualifying ordinary income dividends and long-term capital gain distributions and 40.8% for non-qualifying ordinary income dividends) and do not reflect state and local taxes. Actual after-tax returns will be calculated at calendar year-end and depend on an investor’s tax situation and may differ from those shown. In addition, the after-tax returns shown are not relevant to investors who hold Fund shares through tax-deferred arrangements such as 401(k) plans or individual retirement accounts. Under certain circumstances, the addition of the tax benefits from capital losses resulting from redemptions may cause the Returns After Taxes on Distributions and Sale of Fund Shares to be greater than the Returns After Taxes on Distributions or even Returns Before Taxes.Standardized after-tax returns assume reinvestment of all distributions at NAV and reflect a maximum initialsales charge of 5.5% for Class A Shares. |
| * | | Returns Before Taxesdo not reflect taxes on distributions on the Fund’s Class A Shares nor do they show how performance can be impacted by taxes when shares are redeemed. |
| ** | | Returns After Taxes on Distributionsassume that taxes are paid on distributions on the Fund’s Class A Shares (i.e., dividends and capital gains) but do not reflect taxes that may be incurred upon redemption of the Class A Shares at the end of the performance period. |
| *** | | Returns After Taxes on Distributions and Sale of Fund Sharesreflect taxes paid on distributions on the Fund’s Class A Shares and taxes applicable when the shares are redeemed. |
8
FUND BASICS
| | | | | | | | |
| | TOP TEN HOLDINGS AS OF 6/30/197 |
| | | |
| | | Holding | | % of Net Assets | | | Line of Business |
| | | |
| | Microsoft Corp. | | | 4.5 | % | | Software & Services |
| | Apple, Inc. | | | 3.6 | | | Technology Hardware & Equipment |
| | Amazon.com, Inc. | | | 3.3 | | | Retailing |
| | Facebook, Inc. Class A | | | 1.9 | | | Media & Entertainment |
| | Pfizer, Inc. | | | 1.8 | | | Pharmaceuticals, Biotechnology & Life Sciences |
| | JPMorgan Chase & Co. | | | 1.8 | | | Banks |
| | Exxon Mobil Corp. | | | 1.7 | | | Energy |
| | Johnson & Johnson | | | 1.7 | | | Pharmaceuticals, Biotechnology & Life Sciences |
| | | |
| | AT&T, Inc. | | | 1.6 | | | Telecommunication Services |
| | | |
| | | Chevron Corp. | | | 1.5 | | | Energy |
| | 7 | | The top 10 holdings may not be representative of the Fund’s future investments. |
|
| FUND VS. BENCHMARK SECTOR ALLOCATIONS8 |
|
| As of June 30, 2019 |
| | 8The | | Fund is actively managed and, as such, its composition may differ over time. Consequently, the Fund’s overall sector allocations may differ from percentages contained in the graph above. The graph categorizes investments using Global Industry Classification Standard (“GICS”); however, the sector classifications used by the portfolio management team may differ from GICS. The percentage shown for each investment category reflects the value of investments in that category as a percentage of market value (excluding investments in the securities lending reinvestment vehicle, if any). Underlying sector allocations of exchange traded funds and investment companies held by the Fund are not reflected in the graph above. Investments in the securities lending reinvestment vehicle represented 0.0% of the Fund’s net assets at June 30, 2019. The graph depicts the Fund’s investments but may not represent the Fund’s market exposure due to the exclusion of certain derivatives, if any, as listed in the Additional Investment Information section of the Schedule of Investments. |
9
PORTFOLIO RESULTS
International Equity Dividend and Premium Fund
Investment Objective
The Fund seeks to maximize total return with an emphasis on income.
Portfolio Management Discussion and Analysis
Below, the Goldman Sachs Quantitative Investment Strategies Team discusses the Goldman Sachs International Equity Dividend and Premium Fund’s (the “Fund”) performance and positioning for thesix-month period ended June 30, 2019 (the “Reporting Period”).
| Q | | How did the Fund perform during the Reporting Period? |
| A | | During the Reporting Period, the Fund’s Class A, Class C, Institutional, Investor, Class P and Class R6 Shares generated cumulative total returns, without sales charges, of 9.18%, 8.75%, 9.38%, 9.35%, 9.39% and 9.40%, respectively. These returns compare to the 14.03% cumulative total return of the Fund’s primary benchmark, the MSCI EAFE Index (Net, USD, Unhedged) (“MSCI EAFE Index”). The Bloomberg Barclays Global Aggregate Bond Index (Gross, USD, Unhedged), the secondary benchmark, returned 5.57%. |
| | | Although the Fund does not invest in fixed income securities, maximizing income is part of the Fund’s investment objective, and therefore we believe that a comparison of the Fund’s performance to that of the Bloomberg Barclays Global Aggregate Bond Index is useful to investors. |
| Q | | What key factors were most responsible for the Fund’s performance during the Reporting Period? |
| A | | The Fund was hurt by security selection during the Reporting Period, as the Fund’s bias toward stocks with higher dividend yields detracted from performance. Overall, the Fund was hurt by its investments in the financials, communication services and information technology sectors. It benefited from holdings in the materials sector and, to a lesser extent, the real estate sector. |
| | | The sale of call options on the MSCI EAFE Index diminished the Fund’s total return during the Reporting Period. A call option is an option that gives the holder the right to buy a certain quantity of an underlying security at an agreed-upon price at any time up to an agreed-upon date. |
| Q | | How did the Fund’s call writing affect its performance? |
| A | | Consistent with our investment approach, we wrote index call options on a portion of the stock portfolio’s market value. When the Fund sells an index call option, it retains the premium it receives from the sale. However, if the purchaser exercises the option, the Fund is obligated to pay the purchaser the difference between the price of the index and the exercise price of the option. While the Fund retains the premium it receives from the sale of the option, the premium may not exceed the difference in the value of the index as call options are exercised. This is what happened during the Reporting Period when the MSCI EAFE Index appreciated, and thus the Fund’s call writing detracted from performance. |
| | | Call option writing has the potential to reduce Fund volatility. Since its inception, the realized daily volatility of the Fund has been 18.10% compared to the realized volatility of the MSCI EAFE Index of 18.87%. During the Reporting Period, the realized daily volatility of the Fund was 8.91% compared to the realized volatility of the MSCI EAFE Index of 9.23%.1 |
| Q | | What was the Fund’s dividend yield during the Reporting Period? |
| A | | While maintaining industry and sector weights consistent with the MSCI EAFE Index, we favor stocks with higher dividend yields. The dividend yield of the Fund’s Institutional Share class during the Reporting Period was 4.51% compared to 3.47% for the MSCI EAFE Index. (Dividend yield is a ratio that shows how much a company pays out in dividends in a year divided by its share price.) The Fund’s dividend yield served to enhance its quarterly net income distributions. As of June 30, 2019, the Standardized |
| | 1The | | realized daily volatility of the Fund quoted herein is for Institutional Shares, net of fees. Based on GSAM calculations. |
10
PORTFOLIO RESULTS
| | 30-Day Subsidized Yield was 3.17% and the Standardized30-Day Unsubsidized Yield was 3.06%.2 |
| Q | | Which individual stock holdings detracted significantly from relative performance? |
| A | | Compared to the MSCI EAFE Index, the Fund was hurt by overweight positions relative to the MSCI EAFE Index in Nordic-Baltic banking group Swedbank, German telecommunications company Telefonica Deutschland Holding and French retailer Casino Guichard Perrachon. It was overweight all three stocks primarily because of their attractive dividend yield and/or risk metrics. |
| Q | | Which individual stock holdings contributed most positively to the Fund’s relative results during the Reporting Period? |
| A | | During the Reporting Period, the Fund was helped by overweight positions in Australian iron ore producer Fortescue Metals Group, Anglo-Australian mining company Rio Tinto and French multinational luxury goods conglomerate LVMH Moet Hennessy Louis Vuitton. We chose to overweight all three stocks largely because of their attractive dividend yields and/or risk metrics. |
| Q | | How did the Fund use derivatives and similar instruments during the Reporting Period? |
| A | | During the Reporting Period, we used equity index futures, on an opportunistic basis, to equitize the Fund’s excess cash holdings. In other words, we put the Fund’s excess cash holdings to work by using them as collateral for the purchase of equity index futures. Equity index futures did not have a significant impact on Fund performance during the Reporting Period. Consistent with our investment approach, we also wrote equity index options on a portion of the portfolio’s market value in an effort to generate premiums. Equity index options had a negative impact on performance during the Reporting Period. |
| Q | | What changes or enhancements did you make to your quantitative model during the Reporting Period? |
| A | | We made no changes to our quantitative model during the Reporting Period. |
| | 2The | | Standardized 30-Day Subsidized Yield and Standardized 30-Day Unsubsidized Yield of the Fund quoted herein is for Institutional Shares, net of fees. Based on GSAM calculations. |
11
FUND BASICS
International Equity Dividend and Premium Fund
as of June 30, 2019
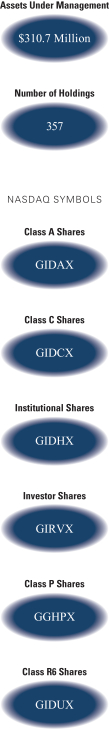
| | | | | | | | | | | | | | |
| | PERFORMANCE REVIEW | |
| | | | |
| | | January 1, 2019–June 30, 2019 | | Fund Total Return
(based on NAV)1 | | | MSCI EAFE Index
(net, USD, unhedged)2 | | | Bloomberg Barclays
Global Aggregate Bond
Index (gross, USD,
unhedged)3 | |
| | | | |
| | Class A | | | 9.18 | % | | | 14.03 | % | | | 5.57 | % |
| | Class C | | | 8.75 | | | | 14.03 | | | | 5.57 | |
| | Institutional | | | 9.38 | | | | 14.03 | | | | 5.57 | |
| | Investor | | | 9.35 | | | | 14.03 | | | | 5.57 | |
| | Class P | | | 9.39 | | | | 14.03 | | | | 5.57 | |
| | | Class R6 | | | 9.40 | | | | 14.03 | | | | 5.57 | |
| | 1 | | The net asset value (“NAV”) represents the net assets of the class of the Fund (ex-dividend) divided by the total number of shares of the class outstanding. The Fund’s performance reflects the reinvestment of dividends and other distributions. The Fund’s performance does not reflect the deduction of any applicable sales charges. |
| | 2 | | The MSCI EAFE Index (net, USD, unhedged) is an unmanaged market capitalization-weighted composite of securities in 21 developed markets. The Index figures do not include any deduction for fees or expenses. It is not possible to invest directly in an index. |
| | 3 | | The Bloomberg Barclays Global Aggregate Bond Index (gross, USD, unhedged) represents an unmanaged diversified portfolio of fixed income securities, including U.S. Treasuries, investment-grade corporate bonds, and mortgage-backed and asset-backed securities. The Index figures do not reflect any deduction for fees, expenses or taxes. It is not possible to invest directly in an index. |
| | | | | | | | | | | | | | | | | | | | |
| | STANDARDIZED TOTAL RETURNS4 | | | |
| | | | | | |
| | | For the period ended 6/30/19 | | One Years | | | Five Years | | | Ten Years | | | Since Inception | | | Inception Date |
| | | | | | |
| | Class A | | | -6.61 | % | | | -1.22 | % | | | 4.07 | % | | | 0.26 | % | | 1/31/08 |
| | Class C | | | -3.05 | | | | -0.88 | | | | 3.86 | | | | -0.12 | | | 1/31/08 |
| | Institutional | | | -0.85 | | | | 0.26 | | | | 5.07 | | | | 1.04 | | | 1/31/08 |
| | Investor | | | -0.97 | | | | 0.11 | | | | N/A | | | | 4.34 | | | 8/31/10 |
| | Class P | | | -0.84 | | | | N/A | | | | N/A | | | | -5.27 | | | 4/17/18 |
| | | Class R6 | | | -0.84 | | | | N/A | | | | N/A | | | | -4.37 | | | 4/30/18 |
| | 4 | | The Standardized Total Returns are average annual total returns or cumulative total returns (only if the performance period is one year or less) as of the most recent calendar quarter-end. They assume reinvestment of all distributions at NAV. These returns reflect a maximum initial sales charge of 5.5% for Class A Shares and the assumed contingent deferred sales charge for Class C Shares (1% if redeemed within 12 months of purchase). Effective July 30, 2018, Class C Shares convert automatically to Class A Shares on or about the fifteenth day of the last month of the calendar quarter that is ten years after the purchase date. The Since Inception returns for Class C Shares do not reflect the conversion to Class A Shares after the first ten years of performance. Because Institutional, Investor, Class P and Class R6 Shares do not involve a sales charge, such a charge is not applied to their Standardized Total Returns. |
The returns set forth in the tables above represent past performance. Past performance does not guarantee future results. The Fund’s investment return and principal value will fluctuate so that an investor’s shares, when redeemed, may be worth more or less than their original cost. Current performance may be lower orhigher than the performance quoted above. Please visit our web site at www.GSAMFUNDS.com to obtain the most recent month-end returns.
12
FUND BASICS
Performance reflects applicable fee waivers and/or expense limitations in effect during the periods shown. In their absence, performance would be reduced. Returns do not reflect the deduction of taxes that a shareholder would pay on Fund distributions or the redemption of Fund shares.
| | | | | | | | | | |
| | EXPENSE RATIOS5 | |
| | | |
| | | | | Net Expense Ratio (Current) | | | Gross Expense Ratio (Before Waivers) | |
| | | |
| | Class A | | | 1.33 | % | | | 1.38 | % |
| | Class C | | | 2.08 | | | | 2.13 | |
| | Institutional | | | 0.94 | | | | 0.99 | |
| | Investor | | | 1.08 | | | | 1.13 | |
| | Class P | | | 0.93 | | | | 0.98 | |
| | | Class R6 | | | 0.93 | | | | 0.98 | |
| | 5 | | The expense ratios of the Fund, both current (net of applicable fee waivers and/or expense limitations) and before waivers (gross of applicable fee waivers and/or expense limitations) are as set forth above according to the most recent publicly available Prospectus for the Fund and may differ from the expense ratios disclosed in the Financial Highlights in this report. Pursuant to contractual arrangements, the Fund’s waivers and/or expense limitations will remain in place through at least April 30, 2020, and prior to such date the Investment Adviser may not terminate the arrangements without the approval of the Fund’s Board of Trustees. If these arrangements are discontinued in the future, the expense ratios may change without shareholder approval. |
| | | | | | | | | | | | | | |
| | STANDARDIZED AFTER-TAX PERFORMANCE AS OF 6/30/196 | |
| | | | |
| | | Class A Shares | | One Year | | | Five Years | | | Ten Years | |
| | | | |
| | Returns before taxes* | | | -6.61 | % | | | -1.22 | % | | | 4.07 | % |
| | Returns after taxes on distributions** | | | -7.51 | | | | -1.87 | | | | 3.39 | |
| | | Returns after taxes on distributions***
and sale of Fund shares | | | -3.76 | | | | -0.84 | | | | 3.40 | |
| 6 | | The after-tax returns are calculated using the historically highest individual federal marginal income tax rates at the time of distributions (currently 23.8% for qualifying ordinary income dividends and long-term capital gain distributions and 40.8% for non-qualifying ordinary income dividends) and do not reflect state and local taxes. Actual after-tax returns will be calculated at calendar year-end and depend on an investor’s tax situation and may differ from those shown. In addition, the after-tax returns shown are not relevant to investors who hold Fund shares through tax-deferred arrangements such as 401(k) plans or individual retirement accounts. Under certain circumstances, the addition of the tax benefits from capital losses resulting from redemptions may cause the Returns After Taxes on Distributions and Sale of Fund Shares to be greater than the Returns After Taxes on Distributions or even Returns Before Taxes.Standardized after-tax returns assume reinvestment of all distributions at NAV and reflect a maximum initialsales charge of 5.5% for Class A Shares. |
| * | | Returns Before Taxesdo not reflect taxes on distributions on the Fund’s Class A Shares nor do they show how performance can be impacted by taxes when shares are redeemed. |
| ** | | Returns After Taxes on Distributionsassume that taxes are paid on distributions on the Fund’s Class A Shares (i.e., dividends and capital gains) but do not reflect taxes that may be incurred upon redemption of the Class A Shares at the end of the performance period. |
| *** | | Returns After Taxes on Distributions and Sale of Fund Sharesreflect taxes paid on distributions on the Fund’s Class A Shares and taxes applicable when the shares are redeemed. |
13
FUND BASICS
| | | | | | | | | | |
| | TOP TEN HOLDINGS AS OF 6/30/197 | | |
| | | | |
| | | Company | | % of Net Assets | | | Line of Business | | Country |
| | | | |
| | HSBC Holdings plc | | | 2.8 | % | | Banks | | United Kingdom |
| | | | |
| | Nestle SA (Registered) | | | 2.3 | | | Food, Beverage & Tobacco | | Switzerland |
| | Novartis AG (Registered) | | | 2.0 | | | Pharmaceuticals,
Biotechnology & Life Sciences | | Switzerland |
| | | | |
| | Roche Holding AG | | | 1.9 | | | Pharmaceuticals,
Biotechnology & Life Sciences | | Switzerland |
| | National Australia Bank Ltd. | | | 1.6 | | | Banks | | Australia |
| | GlaxoSmithKline plc ADR | | | 1.5 | | | Pharmaceuticals,
Biotechnology & Life Sciences | | United Kingdom |
| | | | |
| | Daimler AG (Registered) | | | 1.5 | | | Automobiles & Components | | Germany |
| | Toyota Motor Corp. | | | 1.5 | | | Automobiles & Components | | Japan |
| | Royal Dutch Shell plc Class A | | | 1.5 | | | Energy | | Netherlands |
| | | LVMH Moet Hennessy Louis Vuitton SE | | | 1.3 | | | Consumer Durables & Apparel | | France |
| | 7 | | The top 10 holdings may not be representative of the Fund’s future investments. |
|
| FUND VS. BENCHMARK SECTOR ALLOCATIONS8 |
|
| As of June 30, 2019 |
| | 8 | | The Fund is actively managed and, as such, its composition may differ over time. Consequently, the Fund’s overall sector allocations may differ from percentages contained in the graph above. The graph categorizes investments using Global Industry Classification Standard (“GICS”); however, the sector classifications used by the portfolio management team may differ from GICS. The percentage shown for each investment category reflects the value of investments in that category as a percentage of market value (excluding investments in the securities lending reinvestment vehicle, if any). Investments in the securities lending reinvestment vehicle represented 0.3% of the Fund’s net assets at June 30, 2019. The graph depicts the Fund’s investments but may not represent the Fund’s market exposure due to the exclusion of certain derivatives, if any, as listed in the Additional Investment Information section of the Schedule of Investments. |
14
INVESTMENT PROCESS
What Differentiates the Goldman Sachs GlobalTax-Management Investment Process?
In managing money for many of the world’s wealthiest taxable investors, Goldman Sachs often constructs a diversified investment portfolio around atax-managed core. With the Goldman Sachs U.S.Tax-Managed Equity Fund and Goldman Sachs InternationalTax-Managed Equity Fund, investors can access Goldman Sachs’tax-smart investment expertise while capitalizing on this same strategic approach to portfolio construction.
Goldman Sachs GlobalTax-Management Investment Process
The Goldman Sachs GlobalTax-Management investment process is a disciplined quantitative approach that has been consistently applied since 1989. With the Goldman Sachs U.S.Tax-Managed Equity Fund and the Goldman Sachs InternationalTax-Managed Equity Fund, the investment process is enhanced with an additional layer that seeks to maximizeafter-tax returns.
Advantage: Daily analysis of approximately 3,000 U.S. and international equity securities using a proprietary model.
| ∎ | | Sector and size neutral |
Tax optimization is an additional layer that is built into the existing investment process —a distinct advantage. While other managers may simply seek to minimize taxable distributions through a low turnover strategy, this extension of the investment process seeks to maximizeafter-tax returns —the true objective of every taxable investor.
Advantage: Value added through stock selection — not market timing, industry rotation or style bias.
| ∎ | | A fully invested, style-consistent portfolio |
| ∎ | | Broad access to the total U.S. and international equity markets |
| ∎ | | A consistent goal of seeking to maximizeafter-tax risk-adjusted returns |
15
PORTFOLIO RESULTS
U.S.Tax-Managed Equity Fund
Investment Objective
The Fund seeks to provide long-termafter-tax growth of capital throughtax-sensitive participation in a broadly diversified portfolio of U.S. equity securities.
Portfolio Management Discussion and Analysis
Below, the Goldman Sachs Quantitative Investment Strategies Team discusses the Goldman Sachs U.S.Tax-Managed Equity Fund’s (the “Fund”) performance and positioning for thesix-month period ended June 30, 2019 (the “Reporting Period”).
| Q | | How did the Fund perform during the Reporting Period? |
| A | | During the Reporting Period, the Fund’s Class A, Class C, Institutional, Service, Investor, Class P and Class R6 Shares generated cumulative total returns, without sales charges, of 15.22%, 14.82%, 15.44%, 15.17%, 15.39%, 15.43% and 15.48%, respectively. This compares to the 18.71% cumulative total return of the Fund’s benchmark, the Russell 3000® Index (the “Index”), over the same time period. |
| Q | | What key factors were most responsible for the Fund’s performance during the Reporting Period? |
| A | | The Fund uses a quantitative style of management, in combination with a qualitative overlay, that emphasizes fundamentally based stock selection, careful portfolio construction and efficient implementation. The Fund’s investments are selected using fundamental research and a variety of quantitative techniques based on certain investment themes, including Fundamental Mispricings, High Quality Business Models, Sentiment Analysis and Market Themes & Trends. |
| | | During the Reporting Period, the Fund underperformed the Index, with all four of our quantitative model’s investment themes detracting from performance. Stock selection driven by these investment themes hurt relative returns. |
| Q | | What impact did the Fund’s investment themes have on performance during the Reporting Period? |
| A | | In keeping with our investment approach, we use our quantitative model and four investment themes to take a long-term view of market patterns and look for inefficiencies, selecting stocks for the Fund and overweighting or underweighting the ones chosen by the model. Over time and by design, the performance of any one of the model’s investment themes tends to have a low correlation with the model’s other themes, demonstrating the diversification benefit of the Fund’s theme-driven quantitative model. The variance in performance supports our research indicating that the diversification provided by our different investment themes is a significant investment advantage over the long term, even though the Fund may experience underperformance in the short term. Of course, diversification does not protect an investor from market risk nor does it ensure a profit. |
| | | During the Reporting Period, all four of our investment themes detracted from the Fund’s relative returns. High Quality Business Models was our worst performing theme. High Quality Business Models seeks to identify companies that are generating high quality revenues with sustainable business models and aligned management incentives. Fundamental Mispricings, Sentiment Analysis and Market Themes & Trends also hampered performance, albeit to a lesser extent. Fundamental Mispricings seeks to identify high quality businesses trading at a fair price, which we believe may lead to strong performance over the long run. Sentiment Analysis seeks to identify stocks experiencing improvements in their overall market sentiment. Market Themes & Trends seeks to identify companies positively positioned to benefit from themes and trends in the market and macroeconomic environment. |
| Q | | How did the Fund’s sector and industry allocations affect relative performance? |
| A | | In constructing the Fund’s portfolio, we focus on picking stocks rather than on making sector or industry bets. Consequently, the Fund is similar to the Index in terms of its sector and industry allocations and style. Changes in its sector or industry weights generally do not have a meaningful impact on relative performance. |
16
PORTFOLIO RESULTS
| Q | | How successful was your stock selection during the Reporting Period? |
| A | | The Fund seeks to provide investors with atax-efficient means for maintaining broadly diversified exposure to the entire U.S. equity market, ranging from large- tosmall-cap stocks. During the Reporting Period, certain individual stock positions, led by holdings in the health care, information technology and utilities sectors, detracted from relative performance. On the positive side, the Fund benefited from its investments in the real estate, communication services and financials sectors. |
| Q | | Which individual stock holdings detracted significantly from relative performance? |
| A | | During the Reporting Period, the Fund was hurt by overweight positions compared to the Index in biotechnology firm Biogen, integrated power company NRG Energy and health insurance company Humana. We adopted the overweight in Biogen as a result of our Sentiment Analysis, Fundamental Mispricings and High Quality Business Models investment themes. The overweight in NRG Energy was mainly due to our High Quality Business Models investment theme, while the Fund was overweight Humana primarily because of our Sentiment Analysis investment theme. |
| Q | | Which individual stock holdings contributed most positively to the Fund’s relative results during the Reporting Period? |
| A | | Relative to the Index, the Fund benefited from overweight positions in fast casual restaurant chain Chipotle Mexican Grill, telecommunications conglomerate Sinclair Broadcast Group and food manufacturer Tyson Foods. We decided to overweight Chipotle Mexican Grill largely based on our High Quality Business Models and Sentiment Analysis investment themes. The Fund was overweight Sinclair Broadcast Group because of our High Quality Business Models investment theme. The overweight in Tyson Foods was driven by our Fundamental Mispricings and Market Themes & Trends investment themes. |
| Q | | How did the Fund use derivatives and similar instruments during the Reporting Period? |
| A | | During the Reporting Period, we did not use derivatives as part of an active management strategy to add value to the Fund’s results. However, we used equity index futures, on an opportunistic basis, to equitize the Fund’s excess cash holdings. In other words, we put the Fund’s excess cash holdings to work by using them as collateral for the purchase of equity index futures. Equity index futures had a slightly positive impact on Fund performance during the Reporting Period. |
| Q | | What changes or enhancements did you make to your quantitative model during the Reporting Period? |
| A | | We continuously look for ways to improve our investment process. During the Reporting Period, we made numerous enhancements to our models. For example, in the second quarter of 2019, we introduced a number of new signals. |
| | | First, within our Sentiment Analysis investment theme, we added a suite of signals that utilizes data from the short selling market as an indicator of the market sentiment surrounding individual names. |
| | | Second, within our Market Themes & Trends investment theme, we added a signal that examines the cross-holdings of pooled vehicles to identify thematic trends in the market. Also within our Market Themes & Trends investment theme, we added a signal that examines internet linkages between companies to identify thematic trends. |
| | | Finally, within our Fundamental Mispricings investment theme, we added a signal that we believe to be predictive of industry rotations. |
| Q | | How was the Fund positioned relative to the Index at the end of the Reporting Period? |
| A | | As mentioned previously, we focus on picking stocks rather than on making industry or sector bets. The Fund is similar to the Index in terms of its sector allocation and style. That said, at the end of the Reporting Period, the Fund was overweight relative to the Index in the consumer discretionary, financials and utilities sectors. It was underweight compared to the Index in the communications services, consumer staples, materials and health care sectors. The Fund was relatively neutral versus the Index in the industrials, energy, information technology and real estate sectors at the end of the Reporting Period. |
17
FUND BASICS
U.S.Tax-Managed Equity Fund
as of June 30, 2019
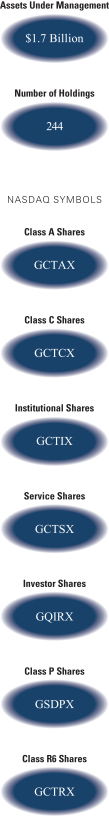
| | | | | | | | | | |
| | PERFORMANCE REVIEW | |
| | | |
| | | January 1, 2019–June 30, 2019 | | Fund Total Return
(based on NAV)1 | | | Russell 3000® Index2 | |
| | | |
| | Class A | | | 15.22 | % | | | 18.71 | % |
| | Class C | | | 14.82 | | | | 18.71 | |
| | Institutional | | | 15.44 | | | | 18.71 | |
| | Service | | | 15.17 | | | | 18.71 | |
| | Investor | | | 15.39 | | | | 18.71 | |
| | Class P | | | 15.43 | | | | 18.71 | |
| | | Class R6 | | | 15.48 | | | | 18.71 | |
| | 1 | | The net asset value (“NAV”) represents the net assets of the class of the Fund(ex-dividend) divided by the total number of shares of the class outstanding. The Fund’s performance assumes the reinvestment of dividends and other distributions. The Fund’s performance does not reflect the deduction of any applicable sales charges. |
| | 2 | | The Russell 3000® Index is an unmanaged index that measures the performance of the 3,000 largest U.S. companies based on total market capitalization, which represents approximately 98% of the investable U.S. equity market. Index figures do not reflect any deduction for fees, expenses or taxes. It is not possible to invest directly in an index. |
| | | | | | | | | | | | | | | | | | | | |
| | STANDARDIZED TOTAL RETURNS3 |
| | | | | | |
| | | For the period ended 6/30/19 | | One Year | | | Five Years | | | Ten Years | | | Since Inception | | | Inception Date |
| | | | | | |
| | Class A | | | -3.32 | % | | | 6.49 | % | | | 13.01 | % | | | 4.87 | % | | 4/3/00 |
| | Class C | | | 0.51 | | | | 6.89 | | | | 12.79 | | | | 4.39 | | | 4/3/00 |
| | Institutional | | | 2.70 | | | | 8.12 | | | | 14.10 | | | | 5.60 | | | 4/3/00 |
| | Service | | | 2.20 | | | | 7.58 | | | | 13.53 | | | | 5.08 | | | 4/3/00 |
| | Investor | | | 2.51 | | | | 7.96 | | | | N/A | | | | 14.14 | | | 8/31/10 |
| | Class P | | | 2.69 | | | | N/A | | | | N/A | | | | 2.63 | | | 4/17/18 |
| | | Class R6 | | | 2.69 | | | | N/A | | | | N/A | | | | 4.61 | | | 4/30/18 |
| | 3 | | The Standardized Total Returns are average annual total returns or cumulative total returns (only if the performance period is one year or less) as of the most recent calendarquarter-end. They assume reinvestment of all distributions at NAV. These returns reflect a maximum initial sales charge of 5.5% for Class A Shares and the assumed contingent deferred sales charge for Class C Shares (1% if redeemed within 12 months of purchase). Effective July 30, 2018, Class C Shares convert automatically to Class A Shares on or about the fifteenth day of the last month of the calendar quarter that is ten years after the purchase date. The Since Inception returns for Class C Shares do not reflect the conversion to Class A Shares after the first ten years of performance. Because Institutional, Service, Investor, Class P and Class R6 Shares do not involve a sales charge, such a charge is not applied to their Standardized Total Returns. |
The returns set forth in the tables above represent past performance. Past performance does not guarantee future results. The Fund’s investment return and principal value will fluctuate so that an investor’s shares, when redeemed, may be worth more or less than their original cost. Current performance may be lower or higher than the performance quoted above. Please visit our web site at www.GSAMFUNDS.com to obtain the most recentmonth-end returns.
18
FUND BASICS
Performance reflects applicable fee waivers and/or expense limitations in effect during the periods shown. In their absence, performance would be reduced. Returns do not reflect the deduction of taxes that a shareholder would pay on Fund distributions or the redemption of Fund shares.
| | | | | | | | | | |
| | EXPENSE RATIOS4 | |
| | | |
| | | | | Net Expense Ratio (Current) | | | Gross Expense Ratio (Before Waivers) | |
| | | |
| | Class A | | | 1.10 | % | | | 1.14 | % |
| | Class C | | | 1.85 | | | | 1.89 | |
| | Institutional | | | 0.75 | | | | 0.75 | |
| | Service | | | 1.25 | | | | 1.25 | |
| | Investor | | | 0.85 | | | | 0.89 | |
| | Class P | | | 0.74 | | | | 0.74 | |
| | | Class R6 | | | 0.74 | | | | 0.74 | |
| | 4 | | The expense ratios of the Fund, both current (net of applicable fee waivers and/or expense limitations) and before waivers (gross of applicable fee waivers and/or expense limitations), are as set forth above according to the most recent publicly available Prospectus.Pursuant to contractual arrangements, the Fund’s waivers and/or expense limitations will remain in place through at least April 30, 2020, and prior to such date the Investment Adviser may not terminate the arrangements without the approval of the Fund’s Board of Trustees. If these arrangements are discontinued in the future, the expense ratios may change without shareholder approval. |
| | | | | | | | | | | | | | |
| | STANDARDIZED AFTER-TAX PERFORMANCE AS OF 6/30/195 | |
| | | | |
| | | Class A Shares | | One Year | | | Five Years | | | Ten Years | |
| | | | |
| | Returns before taxes* | | | -3.32 | % | | | 6.49 | % | | | 13.01 | % |
| | Returns after taxes on distributions** | | | -3.46 | | | | 6.35 | | | | 12.83 | |
| | | | |
| | | Returns after taxes on distributions*** and sale of Fund shares | | | -1.90 | | | | 5.06 | | | | 10.90 | |
| 5 | | The after-tax returns are calculated using the historically highest individual federal marginal income tax rates at the time of distributions (currently 23.8% for qualifying ordinary income dividends and long-term capital gain distributions and 40.8% for non-qualifying ordinary income dividends) and do not reflect state and local taxes. Actual after-tax returns will be calculated at calendar year-end and depend on an investor’s tax situation and may differ from those shown. In addition, the after-tax returns shown are not relevant to investors who hold Fund shares through tax-deferred arrangements such as 401(k) plans or individual retirement accounts. Under certain circumstances, the addition of the tax benefits from capital losses resulting from redemptions may cause the Returns After Taxes on Distributions and Sale of Fund Shares to be greater than the Returns After Taxes on Distributions or even Returns Before Taxes.Standardized after-tax returns assume reinvestment of all distributions at NAV and reflect a maximum initialsales charge of 5.5% for Class A Shares. |
| * | | Returns Before Taxesdo not reflect taxes on distributions on the Fund’s Class A Shares nor do they show how performance can be impacted by taxes when shares are redeemed. |
| ** | | Returns After Taxes on Distributionsassume that taxes are paid on distributions on the Fund’s Class A Shares (i.e., dividends and capital gains) but do not reflect taxes that may be incurred upon redemption of the Class A Shares at the end of the performance period. |
| *** | | Returns After Taxes on Distributions and Sale of Fund Sharesreflect taxes paid on distributions on the Fund’s Class A Shares and taxes applicable when the shares are redeemed. |
19
FUND BASICS
| | | | | | | | |
| | TOP TEN HOLDINGS AS OF 6/30/196 |
| | | |
| | | Holding | | % of Net Assets | | | Line of Business |
| | | |
| | Apple, Inc. | | | 3.6 | % | | Technology Hardware & Equipment |
| | Amazon.com, Inc. | | | 2.7 | | | Retailing |
| | Microsoft Corp. | | | 2.6 | | | Software & Services |
| | Visa, Inc. Class A | | | 1.9 | | | Software & Services |
| | Facebook, Inc. Class A | | | 1.6 | | | Media & Entertainment |
| | PayPal Holdings, Inc. | | | 1.5 | | | Software & Services |
| | Union Pacific Corp. | | | 1.4 | | | Transportation |
| | Valero Energy Corp. | | | 1.2 | | | Energy |
| | Anthem, Inc. | | | 1.2 | | | Health Care Equipment & Services |
| | | General Motors Co. | | | 1.2 | | | Automobiles & Components |
| | 6 | | The top 10 holdings may not be representative of the Fund’s future investments. |
|
| FUND VS. BENCHMARK SECTOR ALLOCATIONS7 |
|
| As of June 30, 2019 |
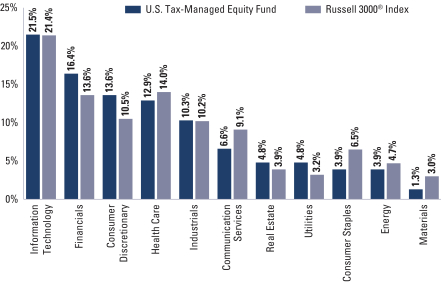
| | 7 | | The Fund is actively managed and, as such, its composition may differ over time. Consequently, the Fund’s overall sector allocations may differ from percentages contained in the graph above. The graph categorizes investments using Global Industry Classification Standard (“GICS”); however, the sector classifications used by the portfolio management team may differ from GICS. The percentage shown for each investment category reflects the value of investments in that category as a percentage of market value. Underlying sector allocations of exchange traded funds and investment companies held by the Fund are not reflected in the graph above. |
20
PORTFOLIO RESULTS
InternationalTax-Managed Equity Fund
Investment Objective
The Fund seeks to provide long-termafter-tax growth of capital throughtax-sensitive participation in a broadly diversified portfolio of international equity securities.
Portfolio Management Discussion and Analysis
Below, the Goldman Sachs Quantitative Investment Strategies Team discusses the Goldman Sachs InternationalTax-Managed Equity Fund’s (the “Fund”) performance and positioning for thesix-month period ended June 30, 2019 (the “Reporting Period”).
| Q | | How did the Fund perform during the Reporting Period? |
| A | | During the Reporting Period, the Fund’s Class A, Class C, Institutional, Investor, Class P and Class R6 Shares generated cumulative total returns, without sales charges, of 11.42%, 10.94%, 11.56%, 11.56%, 11.51% and 11.64%, respectively. This compares to the 14.03% cumulative total return of the Fund’s benchmark, the MSCI EAFE Index (Net, USD, Unhedged) (the “Index”), during the same time period. |
| Q | | What key factors were most responsible for the Fund’s performance during the Reporting Period? |
| A | | The Fund uses a quantitative style of management, in combination with a qualitative overlay, that emphasizes fundamentally based stock selection, careful portfolio construction and efficient implementation. The Fund’s investments are selected using fundamental research and a variety of quantitative techniques based on certain investment themes, including Fundamental Mispricings, High Quality Business Models, Sentiment Analysis and Market Themes & Trends. |
| | | During the Reporting Period, the Fund underperformed the Index, with three of our quantitative model’s four investment themes detracting from performance. Stock selection driven by our investment themes hurt relative returns. |
| Q | | What impact did the Fund’s investment themes have on performance during the Reporting Period? |
| A | | In keeping with our investment approach, we use our quantitative model and four investment themes to take a long-term view of market patterns and look for inefficiencies, selecting stocks for the Fund and overweighting or underweighting the ones chosen by the model. Over time and by design, the performance of any one of the model’s investment themes tends to have a low correlation with the model’s other themes, demonstrating the diversification benefit of the Fund’s theme-driven quantitative model. The variance in performance supports our research indicating that the diversification provided by our different investment themes is a significant investment advantage over the long term, even though the Fund may experience underperformance in the short term. Of course, diversification does not protect an investor from market risk nor does it ensure a profit. |
| | | During the Reporting Period, three of our investment themes — Fundamental Mispricings, High Quality Business Models and Market Themes & Trends — detracted from the Fund’s relative returns. Fundamental Mispricings seeks to identify high quality businesses trading at a fair price, which we believe may lead to strong performance over the long run. High Quality Business Models seeks to identify companies that are generating high quality revenues with sustainable business models and aligned management incentives. Market Themes & Trends seeks to identify companies positively positioned to benefit from themes and trends in the market and macroeconomic environment. |
| | | Our Sentiment Analysis investment theme had a rather neutral impact on relative performance during the Reporting Period. Sentiment Analysis seeks to identify stocks experiencing improvements in their overall market sentiment. |
| Q | | How did the Fund’s sector and industry allocations affect relative performance? |
| A | | In constructing the Fund’s portfolio, we focus on picking stocks rather than on making sector or industry bets. The Fund is similar to the Index in terms of its sector and industry allocations and its style. Changes in its sector or industry weights generally do not have a meaningful impact on relative performance. |
21
PORTFOLIO RESULTS
| Q | | How successful was your stock selection during the Reporting Period? |
| A | | The Fund seeks to provide investors with atax-efficient means for maintaining broadly diversified exposure to the entire EAFE equity market. During the Reporting Period, certain individual stock positions detracted from relative returns, including investments in the industrials, consumer staples and communication services sectors. The Fund was aided mainly by its holdings in the information technology sector. |
| Q | | Which individual stock holdings detracted significantly from relative performance? |
| A | | During the Reporting Period, the Fund was hurt by its overweight position versus the Index in Spain-based International Consolidated Airlines Group. Underweights in LVMH Moet Hennessy Louis Vuitton, a French multinational luxury goods conglomerate, and SAP, a German software company, also dampened returns. The overweight in International Consolidated Airlines Group was the result of our High Quality Business Models, Fundamental Mispricings and Sentiment Analysis investment themes. Our High Quality Business Models and Fundamental Mispricings investment themes led to the Fund’s underweight positions in LVMH Moet Hennessy Louis Vuitton and SAP. |
| Q | | Which individual stock holdings contributed most positively to the Fund’s relative results during the Reporting Period? |
| A | | Compared to the Index, the Fund was helped most by its overweights in Adidas, a German sportwear manufacturer; Temenos, a Switzerland-headquartered company that specializes in enterprise software for banks and financial services companies; and Koninklijke DSM, a Dutch health, nutrition and materials company. We adopted the overweight in Adidas mainly because of our Market Themes & Trends and High Quality Business Models investment themes. The overweight in Temenos was primarily due to our Market Themes & Trends investment theme. The Fund was overweight Koninklijke DSM largely as a result of our Fundamental Mispricings investment theme. |
| Q | | How did the Fund use derivatives and similar instruments during the Reporting Period? |
| A | | During the Reporting Period, we did not use derivatives as part of an active management strategy to add value to the Fund’s results. However, we used equity index futures, on an opportunistic basis, to equitize the Fund’s excess cash holdings. In other words, we put the Fund’s excess cash holdings to work by using them as collateral for the purchase of equity index futures. Equity index futures did not have a significant impact on Fund performance during the Reporting Period. |
| Q | | What changes or enhancements did you make to your quantitative model during the Reporting Period? |
| A | | We continuously look for ways to improve our investment process. During the Reporting Period, we made numerous enhancements to our models. For example, in the second quarter of 2019, we introduced a number of new signals. |
| | | First, within our Sentiment Analysis investment theme, we added a suite of signals that utilizes data from the short selling market as an indicator of the market sentiment surrounding individual names. |
| | | Second, within our Market Themes & Trends investment theme, we added a signal that examines the cross-holdings of pooled vehicles to identify thematic trends in the market. Also within our Market Themes & Trends investment theme, we added a signal that examines internet linkages between companies to identify thematic trends. |
| | | Finally, within our Fundamental Mispricings investment theme, we added a signal that we believe to be predictive of industry rotations. |
| Q | | How was the Fund positioned relative to the Index at the end of the Reporting Period? |
| A | | As mentioned previously, we focus on picking stocks rather than on making industry or sector bets. The Fund is similar to the Index in terms of its sector allocation and style. That said, at the end of the Reporting Period, the Fund was overweight the industrials, information technology, real estate and health care sectors relative to the Index. It was underweight the consumer staples, financials, materials and energy sectors. The Fund was relatively neutrally weighted in the communication services, consumer discretionary and utilities sectors at the end of the Reporting Period. |
| | | At the end of the Reporting Period, the Fund was overweight compared to the Index in Hong Kong, Denmark, Norway, the Netherlands, Belgium and Italy. Relative to the Index, it was underweight the U.K., Switzerland and Germany. The Fund was rather neutrally weighted relative to the Index in Sweden, Spain, Austria, Portugal, Japan, New Zealand, Finland, Ireland, Israel, Singapore, Australia and France at the end of the Reporting Period. |
22
FUND BASICS
International Tax-Managed Equity Fund
as of June 30, 2019
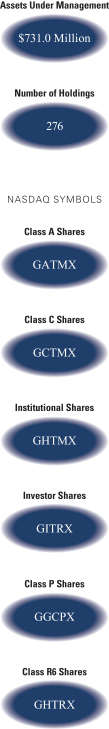
| | | | | | | | | | |
| | PERFORMANCE REVIEW | |
| | | |
| | | January 1, 2019–June 30, 2019 | | Fund Total Return
(based on NAV)1 | | | MSCI EAFE Index
(net, USD, unhedged)2 | |
| | | |
| | Class A | | | 11.42 | % | | | 14.03 | % |
| | Class C | | | 10.94 | | | | 14.03 | |
| | Institutional | | | 11.56 | | | | 14.03 | |
| | Investor | | | 11.56 | | | | 14.03 | |
| | Class P | | | 11.51 | | | | 14.03 | |
| | | Class R6 | | | 11.64 | | | | 14.03 | |
| | 1 | | The net asset value (“NAV”) represents the net assets of the class of the Fund(ex-dividend) divided by the total number of shares of the class outstanding. The Fund’s performance reflects the reinvestment of dividends and other distributions. The Fund’s performance does not reflect the deduction of any applicable sales charges. |
| | 2 | | The unmanaged MSCI EAFE Index (net, USD, unhedged) is a market capitalization-weighted composite of securities in 21 developed markets. The Index figures do not include any deduction for fees or expenses. It is not possible to invest directly in an index. |
| | | | | | | | | | | | | | | | | | | | | | |
| | STANDARDIZED TOTAL RETURNS3 | |
| | | | | | |
| | | For the period ended 6/30/19 | | One Year | | | Five Years | | | Ten Years | | | Since Inception | | | Inception Date | |
| | | | | | |
| | Class A | | | -10.56 | % | | | 1.21 | % | | | 6.22 | % | | | 1.33 | % | | | 1/31/08 | |
| | Class C | | | -7.07 | | | | 1.61 | | | | 6.02 | | | | 1.08 | | | | 1/31/08 | |
| | Institutional | | | -5.09 | | | | 2.77 | | | | 7.25 | | | | 2.24 | | | | 1/31/08 | |
| | Investor | | | -5.21 | | | | 2.61 | | | | N/A | | | | 6.64 | | | | 8/31/10 | |
| | Class P | | | -5.06 | | | | N/A | | | | N/A | | | | -7.24 | | | | 4/17/18 | |
| | | Class R6 | | | -5.07 | | | | N/A | | | | N/A | | | | -6.37 | | | | 4/30/18 | |
| | 3 | | The Standardized Total Returns are average annual total returns or cumulative total returns (only if the performance period is one year or less) as of the most recent calendar quarter-end. They assume reinvestment of all distributions at NAV. These returns reflect a maximum initial sales charge of 5.5% for Class A Shares and the assumed contingent deferred sales charge for Class C Shares (1% if redeemed within 12 months of purchase). Effective July 30, 2018, Class C Shares convert automatically to Class A Shares on or about the fifteenth day of the last month of the calendar quarter that is ten years after the purchase date. The Since Inception returns for Class C Shares do not reflect the conversion to Class A Shares after the first ten years of performance. Because Institutional, Investor, Class P and Class R6 Shares do not involve a sales charge, such a charge is not applied to their Standardized Total Returns. |
The returns set forth in the tables above represent past performance. Past performance does not guarantee future results. The Fund’s investment return and principal value will fluctuate so that an investor’s shares, when redeemed, may be worth more or less than their original cost. Current performance may be lower or higher than the performance quoted above. Please visit our web site at www.GSAMFUNDS.com to obtain the most recent month-end returns. Performance reflects applicable fee waivers and/or expense limitations in effect during the periods shown. In their absence, performance would be reduced. Returns do not reflect the deduction of taxes that a shareholder would pay on Fund distributions or the redemption of Fund shares.
23
FUND BASICS
| | | | | | | | | | |
| | EXPENSE RATIOS4 | |
| | | |
| | | | | Net Expense Ratio (Current) | | | Gross Expense Ratio (Before Waivers) | |
| | | |
| | Class A | | | 1.24 | % | | | 1.37 | % |
| | Class C | | | 1.99 | | | | 2.12 | |
| | Institutional | | | 0.90 | | | | 0.98 | |
| | Investor | | | 0.99 | | | | 1.12 | |
| | Class P | | | 0.89 | | | | 0.97 | |
| | | Class R6 | | | 0.89 | | | | 0.97 | |
| | 4 | | The expense ratios of the Fund, both current (net of applicable fee waivers and/or expense limitations) and before waivers (gross of applicable fee waivers and/or expense limitations) are as set forth above according to the most recent publicly available Prospectus for the Fund and may differ from the expense ratios disclosed in the Financial Highlights in this report. Pursuant to contractual arrangements, the Fund’s waivers and/or expense limitations will remain in place through at least April 30, 2020, and prior to such date the Investment Adviser may not terminate the arrangements without the approval of the Fund’s Board of Trustees. If these arrangements are discontinued in the future, the expense ratios may change without shareholder approval. |
| | | | | | | | | | | | | | |
| | STANDARDIZED AFTER–TAX PERFORMANCE AS OF 6/30/195 | |
| | | | |
| | | Class A Shares | | One Year | | | Five Years | | | Ten Years | |
| | | | |
| | Returns before taxes* | | | -10.56 | % | | | 1.21 | % | | | 6.22 | % |
| | Returns after taxes on distributions** | | | -10.71 | | | | 0.94 | | | | 5.95 | |
| | | Returns after taxes on distributions***
and sale of Fund shares | | | -5.84 | | | | 1.02 | | | | 5.11 | |
| 5 | | The after-tax returns are calculated using the historically highest individual federal marginal income tax rates at the time of distributions (currently 23.8% for qualifying ordinary income dividends and long-term capital gain distributions and 40.8% for non-qualifying ordinary income dividends) and do not reflect state and local taxes. Actual after-tax returns will be calculated at calendar year-end and depend on an investor’s tax situation and may differ from those shown. In addition, the after-tax returns shown are not relevant to investors who hold Fund shares through tax-deferred arrangements such as 401(k) plans or individual retirement accounts. Under certain circumstances, the addition of the tax benefits from capital losses resulting from redemptions may cause the Returns After Taxes on Distributions and Sale of Fund Shares to be greater than the Returns After Taxes on Distributions or even Returns Before Taxes.Standardized after-tax returns assume reinvestment of all distributions at NAV and reflect a maximum initial sales charge of 5.5% for Class A Shares. |
| * | | Returns Before Taxesdo not reflect taxes on distributions on the Fund’s Class A Shares nor do they show how performance can be impacted by taxes when shares are redeemed. |
| ** | | Returns After Taxes on Distributionsassume that taxes are paid on distributions on the Fund’s Class A Shares (i.e., dividends and capital gains) but do not reflect taxes that may be incurred upon redemption of the Class A Shares at the end of the performance period. |
| *** | | Returns After Taxes on Distributions and Sale of Fund Sharesreflect taxes paid on distributions on the Fund’s Class A Shares and taxes applicable when the shares are redeemed. |
24
FUND BASICS
| | | | | | | | |
| | TOP TEN HOLDINGS AS OF 6/30/196 |
| | | |
| | | Holding | | % of Net Assets | | | Line of Business |
| | | |
| | Roche Holding AG | | | 2.0 | % | | Pharmaceuticals, Biotechnology
& Life Sciences |
| | | |
| | AIA Group Ltd. | | | 1.6 | | | Insurance |
| | | |
| | Royal Dutch Shell plc Class B | | | 1.5 | | | Energy |
| | | |
| | Diageo plc | | | 1.3 | | | Food, Beverage & Tobacco |
| | | |
| | Novo Nordisk A/S Class B | | | 1.3 | | | Pharmaceuticals, Biotechnology
& Life Sciences |
| | | |
| | adidas AG | | | 1.2 | | | Consumer Durables & Apparel |
| | | |
| | Air Liquide SA | | | 1.1 | | | Materials |
| | | |
| | Schneider Electric SE | | | 1.1 | | | Capital Goods |
| | | |
| | Sony Corp. | | | 1.1 | | | Consumer Durables & Apparel |
| | | Australia & New Zealand Banking Group Ltd. | | | 1.0 | | | Banks |
| | 6 | | The top 10 holdings may not be representative of the Fund’s future investments. |
|
| FUND VS. BENCHMARK SECTOR ALLOCATIONS7 |
|
| As of June 30, 2019 |
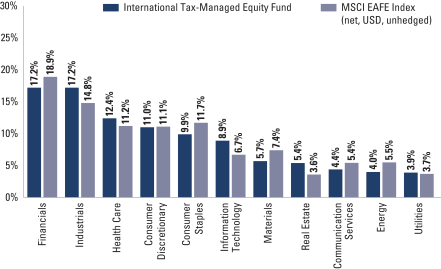
| | 7The | | Fund is actively managed and, as such, its composition may differ over time. Consequently, the Fund’s overall sector allocations may differ from percentages contained in the graph above. The graph categorizes investments using Global Industry Classification Standard (“GICS”); however, the sector classifications used by the portfolio management team may differ from GICS. The percentage shown for each investment category reflects the value of investments in that category as a percentage of market value. The graph depicts the Fund’s investments but may not represent the Fund’s market exposure due to the exclusion of certain derivatives, if any, as listed in the Additional Investment Information section of the Schedule of Investments. |
25
FUND BASICS
Index Definitions
Russell 1000® Index measures the performance of thelarge-cap segment of the U.S. equity universe. The Russell 1000® Index is a subset of the Russell 3000®Index and includes approximately 1000 of the largest securities based on a combination of their market cap and current index membership. The Russell 1000®Index represents approximately 92% of the U.S. market. The Russell 1000®Index is constructed to provide a comprehensive and unbiased barometer for thelarge-cap segment and is completely reconstituted annually to ensure new and growing equities are reflected.
Russell Midcap® Index measures the performance of themid-cap segment of the U.S. equity universe. The Russell Midcap®Index is a subset of the Russell 1000®Index. The Russell Midcap®Index includes approximately 800 of the smallest securities based on a combination of their market cap and current index membership. The Russell Midcap®Index represents approximately 31% of the total market capitalization of the Russell 1000® Index companies. The Russell Midcap®Index is constructed to provide a comprehensive and unbiased barometer for themid-cap segment. The Russell Midcap®Index is completely reconstituted annually to ensure larger stocks do not distort the performance and characteristics of the truemid-cap opportunity set.
Russell 2000® Index measures the performance of thesmall-cap segment of the U.S. equity universe. The Russell 2000®Index is a subset of the Russell 3000®Index representing approximately 10% of the total market capitalization of that index. The Russell 2000®Index includes approximately 2000 of the smallest securities based on a combination of their market cap and current index membership. The Russell 2000®Index is constructed to provide a comprehensive and unbiasedsmall-cap barometer and is completely reconstituted annually to ensure larger stocks do not distort the performance and characteristics of the truesmall-cap opportunity set.
It is not possible to invest directly in an unmanaged index.
26
GOLDMAN SACHS U.S. EQUITY DIVIDEND AND PREMIUM FUND
Schedule of Investments
June 30, 2019 (Unaudited)
| | | | | | | | |
| Shares | | | Description | |
Value | |
|
| Common Stocks – 100.9% | |
| Automobiles & Components – 1.0% | |
| | 2,064,500 | | | Ford Motor Co. | | $ | 21,119,835 | |
| | 203,798 | | | General Motors Co. | | | 7,852,337 | |
| | | | | | | | |
| | | | | | | 28,972,172 | |
| | |
| Banks – 6.0% | |
| | 549,565 | | | Bank of America Corp. | | | 15,937,385 | |
| | 141,500 | | | Citigroup, Inc. | | | 9,909,245 | |
| | 5,900 | | | First Hawaiian, Inc. | | | 152,633 | |
| | 106,300 | | | FNB Corp. | | | 1,251,151 | |
| | 894,800 | | | Huntington Bancshares, Inc. | | | 12,366,136 | |
| | 464,029 | | | JPMorgan Chase & Co.(a)(b) | | | 51,878,442 | |
| | 857,799 | | | New York Community Bancorp, Inc.(b) | | | 8,560,834 | |
| | 555,100 | | | PacWest Bancorp | | | 21,554,533 | |
| | 1,198,199 | | | People’s United Financial, Inc.(b) | | | 20,105,779 | |
| | 101,800 | | | TFS Financial Corp. | | | 1,839,526 | |
| | 260,900 | | | Umpqua Holdings Corp. | | | 4,328,331 | |
| | 581,198 | | | Wells Fargo & Co. | | | 27,502,290 | |
| | | | | | | | |
| | | | | | | 175,386,285 | |
| | |
| Capital Goods – 6.6% | |
| | 87,499 | | | 3M Co. | | | 15,167,077 | |
| | 83,100 | | | Boeing Co. (The) | | | 30,249,231 | |
| | 140,400 | | | Caterpillar, Inc. | | | 19,135,116 | |
| | 41,100 | | | Cummins, Inc. | | | 7,042,074 | |
| | 42,500 | | | Deere & Co. | | | 7,042,675 | |
| | 210,697 | | | Eaton Corp. plc | | | 17,546,846 | |
| | 167,096 | | | Emerson Electric Co. | | | 11,148,645 | |
| | 229,398 | | | Fastenal Co. | | | 7,476,081 | |
| | 86,603 | | | Honeywell International, Inc. | | | 15,119,526 | |
| | 131,400 | | | Johnson Controls International plc | | | 5,428,134 | |
| | 88,934 | | | Lockheed Martin Corp. | | | 32,331,066 | |
| | 10,100 | | | MSC Industrial Direct Co., Inc. Class A | | | 750,026 | |
| | 9,203 | | | Trinity Industries, Inc. | | | 190,966 | |
| | 110,401 | | | United Technologies Corp. | | | 14,374,210 | |
| | 71,699 | | | Watsco, Inc. | | | 11,724,937 | |
| | | | | | | | |
| | | | | | | 194,726,610 | |
| | |
| Commercial & Professional Services – 0.4% | |
| | 69,600 | | | KAR Auction Services, Inc. | | | 1,739,979 | |
| | 387,103 | | | Nielsen Holdings plc | | | 8,748,466 | |
| | | | | | | | |
| | | | | | | 10,488,445 | |
| | |
| Consumer Durables & Apparel – 0.9% | |
| | 48,002 | | | Garmin Ltd. | | | 3,830,404 | |
| | 2,000 | | | Lululemon Athletica, Inc.* | | | 360,420 | |
| | 362,099 | | | Newell Brands, Inc. | | | 5,583,567 | |
| | 41,500 | | | NIKE, Inc. Class B | | | 3,483,925 | |
| | 229,000 | | | Tapestry, Inc. | | | 7,266,170 | |
| | 69,302 | | | VF Corp. | | | 6,053,530 | |
| | | | | | | | |
| | | | | | | 26,578,016 | |
| | |
| Consumer Services – 2.2% | |
| | 200,000 | | | Carnival Corp. | | | 9,310,000 | |
| | 286,802 | | | Extended Stay America, Inc. | | | 4,844,086 | |
| | |
|
| Common Stocks – (continued) | |
| Consumer Services – (continued) | |
| | 260,347 | | | International Game Technology plc | | | 3,376,700 | |
| | 99,303 | | | Las Vegas Sands Corp. | | | 5,867,814 | |
| | 107,801 | | | McDonald’s Corp. | | | 22,385,956 | |
| | 162,200 | | | Six Flags Entertainment Corp. | | | 8,058,096 | |
| | 12,101 | | | Vail Resorts, Inc. | | | 2,700,701 | |
| | 166,700 | | | Wyndham Destinations, Inc. | | | 7,318,130 | |
| | | | | | | | |
| | | | | | | 63,861,483 | |
| | |
| Diversified Financials – 4.0% | |
| | 129,139 | | | Berkshire Hathaway, Inc. Class B* | | | 27,528,561 | |
| | 31,000 | | | BlackRock, Inc. | | | 14,548,300 | |
| | 27,401 | | | CME Group, Inc. | | | 5,318,808 | |
| | 37,300 | | | Eaton Vance Corp. | | | 1,608,749 | |
| | 1,103,604 | | | Invesco Ltd. | | | 22,579,738 | |
| | 393,400 | | | Janus Henderson Group plc | | | 8,418,760 | |
| | 11,400 | | | KKR & Co., Inc. Class A | | | 288,078 | |
| | 87,400 | | | Legg Mason, Inc. | | | 3,345,672 | |
| | 147,300 | | | Morgan Stanley | | | 6,453,213 | |
| | 501,302 | | | Navient Corp. | | | 6,842,772 | |
| | 46,600 | | | Santander Consumer USA Holdings, Inc. | | | 1,116,536 | |
| | 147,600 | | | T. Rowe Price Group, Inc. | | | 16,193,196 | |
| | 6,600 | | | TD Ameritrade Holding Corp. | | | 329,472 | |
| | 70,600 | | | Virtu Financial, Inc. Class A | | | 1,537,668 | |
| | | | | | | | |
| | | | | | | 116,109,523 | |
| | |
| Energy – 6.0% | |
| | 358,798 | | | Chevron Corp.(a) | | | 44,648,823 | |
| | 176,000 | | | Equitrans Midstream Corp. | | | 3,468,960 | |
| | 656,003 | | | Exxon Mobil Corp.(a)(b) | | | 50,269,510 | |
| | 173,100 | | | Helmerich & Payne, Inc. | | | 8,762,322 | |
| | 128,900 | | | Kinder Morgan, Inc. | | | 2,691,432 | |
| | 108,601 | | | Marathon Petroleum Corp. | | | 6,068,624 | |
| | 2,900 | | | Murphy Oil Corp. | | | 71,485 | |
| | 388,699 | | | Occidental Petroleum Corp. | | | 19,543,786 | |
| | 184,600 | | | ONEOK, Inc. | | | 12,702,326 | |
| | 281,100 | | | Schlumberger Ltd. | | | 11,170,914 | |
| | 80,000 | | | Valero Energy Corp. | | | 6,848,800 | |
| | 295,100 | | | Williams Cos., Inc. (The) | | | 8,274,604 | |
| | | | | | | | |
| | | | | | | 174,521,586 | |
| | |
| Food & Staples Retailing – 1.2% | |
| | 23,800 | | | Costco Wholesale Corp. | | | 6,289,388 | |
| | 75,700 | | | Sysco Corp. | | | 5,353,504 | |
| | 100,200 | | | Walgreens Boots Alliance, Inc. | | | 5,477,934 | |
| | 159,141 | | | Walmart, Inc. | | | 17,583,489 | |
| | | | | | | | |
| | | | | | | 34,704,315 | |
| | |
| Food, Beverage & Tobacco – 3.9% | |
| | 250,259 | | | Altria Group, Inc. | | | 11,849,763 | |
| | 106,100 | | | Archer-Daniels-Midland Co. | | | 4,328,880 | |
| | 18,000 | | | Bunge Ltd. | | | 1,002,780 | |
| | 857,500 | | | Coca-Cola Co. (The)(a) | | | 43,663,900 | |
| | 34,900 | | | Flowers Foods, Inc. | | | 812,123 | |
| | 240,202 | | | General Mills, Inc. | | | 12,615,409 | |
| | 277,500 | | | Kraft Heinz Co. (The) | | | 8,613,600 | |
| | |
| | |
| The accompanying notes are an integral part of these financial statements. | | 27 |
GOLDMAN SACHS U.S. EQUITY DIVIDEND AND PREMIUM FUND
Schedule of Investments(continued)
June 30, 2019 (Unaudited)
| | | | | | | | |
| Shares | | | Description | |
Value | |
|
| Common Stocks – (continued) | |
| Food, Beverage & Tobacco – (continued) | |
| | 117,706 | | | PepsiCo, Inc. | | $ | 15,434,788 | |
| | 216,202 | | | Philip Morris International, Inc. | | | 16,978,343 | |
| | | | | | | | |
| | | | | | | 115,299,586 | |
| | |
| Health Care Equipment & Services – 5.8% | |
| | 447,942 | | | Abbott Laboratories | | | 37,671,922 | |
| | 18,100 | | | Align Technology, Inc.* | | | 4,953,970 | |
| | 26,787 | | | Anthem, Inc. | | | 7,559,559 | |
| | 46,400 | | | Becton Dickinson and Co. | | | 11,693,264 | |
| | 210,800 | | | Cardinal Health, Inc. | | | 9,928,680 | |
| | 386,178 | | | CVS Health Corp. | | | 21,042,839 | |
| | 11,600 | | | DexCom, Inc.* | | | 1,738,144 | |
| | 1,100 | | | Hill-Rom Holdings, Inc. | | | 115,082 | |
| | 3,000 | | | Insulet Corp.* | | | 358,140 | |
| | 9,901 | | | Intuitive Surgical, Inc.* | | | 5,193,570 | |
| | 300,753 | | | Medtronic plc | | | 29,290,335 | |
| | 4,100 | | | Penumbra, Inc.* | | | 656,000 | |
| | 52,000 | | | ResMed, Inc. | | | 6,345,560 | |
| | 137,571 | | | UnitedHealth Group, Inc.(a) | | | 33,568,700 | |
| | | | | | | | |
| | | | | | | 170,115,765 | |
| | |
| Household & Personal Products – 1.9% | |
| | 91,998 | | | Kimberly-Clark Corp. | | | 12,261,493 | |
| | 391,498 | | | Procter & Gamble Co. (The)(a) | | | 42,927,756 | |
| | | | | | | | |
| | | | | | | 55,189,249 | |
| | |
| Insurance – 2.4% | |
| | 87,102 | | | Arthur J Gallagher & Co. | | | 7,629,061 | |
| | 1,200 | | | Erie Indemnity Co. Class A | | | 305,136 | |
| | 51,200 | | | Fidelity National Financial, Inc. | | | 2,063,360 | |
| | 41,000 | | | First American Financial Corp. | | | 2,201,700 | |
| | 216,899 | | | Mercury General Corp. | | | 13,556,187 | |
| | 184,001 | | | MetLife, Inc. | | | 9,139,330 | |
| | 537,306 | | | Old Republic International Corp. | | | 12,024,908 | |
| | 117,999 | | | Principal Financial Group, Inc. | | | 6,834,502 | |
| | 156,400 | | | Prudential Financial, Inc. | | | 15,796,400 | |
| | | | | | | | |
| | | | | | | 69,550,584 | |
| | |
| Materials – 2.5% | |
| | 160,216 | | | Corteva, Inc.* | | | 4,737,587 | |
| | 56,601 | | | Domtar Corp. | | | 2,520,442 | |
| | 131,449 | | | Dow, Inc. | | | 6,481,750 | |
| | 160,216 | | | DuPont de Nemours, Inc. | | | 12,027,415 | |
| | 195,899 | | | International Paper Co. | | | 8,486,345 | |
| | 82,300 | | | Linde plc | | | 16,525,840 | |
| | 131,599 | | | LyondellBasell Industries NV Class A | | | 11,334,622 | |
| | 28,600 | | | Olin Corp. | | | 626,626 | |
| | 25,900 | | | Royal Gold, Inc. | | | 2,654,491 | |
| | 126,500 | | | Southern Copper Corp. | | | 4,914,525 | |
| | 111,400 | | | Westrock Co. | | | 4,062,758 | |
| | | | | | | | |
| | | | | | | 74,372,401 | |
| | |
| Media & Entertainment – 7.3% | |
| | 92,285 | | | Activision Blizzard, Inc. | | | 4,355,852 | |
| | 32,357 | | | Alphabet, Inc. Class A* | | | 35,036,160 | |
| | 35,828 | | | Alphabet, Inc. Class C*(a) | | | 38,726,843 | |
| | |
|
| Common Stocks – (continued) | |
| Media & Entertainment – (continued) | |
| | 102,897 | | | Cinemark Holdings, Inc. | | | 3,714,582 | |
| | 464,813 | | | Comcast Corp. Class A | | | 19,652,294 | |
| | 293,941 | | | Facebook, Inc. Class A*(a) | | | 56,730,613 | |
| | 468,401 | | | Interpublic Group of Cos., Inc. (The) | | | 10,581,178 | |
| | 5,599 | | | Match Group, Inc. | | | 376,645 | |
| | 52,190 | | | Netflix, Inc.* | | | 19,170,431 | |
| | 118,500 | | | Twitter, Inc.* | | | 4,135,650 | |
| | 156,000 | | | Walt Disney Co. (The) | | | 21,783,840 | |
| | 8,200 | | | Zillow Group, Inc. Class C* | | | 380,398 | |
| | | | | | | | |
| | | | | | | 214,644,486 | |
| | |
| Pharmaceuticals, Biotechnology & Life Sciences – 8.2% | |
| | 336,286 | | | AbbVie, Inc.(a)(b) | | | 24,454,718 | |
| | 1,600 | | | Alnylam Pharmaceuticals, Inc.* | | | 116,096 | |
| | 150,302 | | | Amgen, Inc. | | | 27,697,652 | |
| | 3,400 | | | Bio-Techne Corp. | | | 708,866 | |
| | 279,604 | | | Bristol-Myers Squibb Co. | | | 12,680,007 | |
| | 91,315 | | | Eli Lilly & Co. | | | 10,116,789 | |
| | 4,300 | | | Exact Sciences Corp.* | | | 507,572 | |
| | 253,199 | | | Gilead Sciences, Inc. | | | 17,106,124 | |
| | 18,900 | | | Illumina, Inc.* | | | 6,958,035 | |
| | 348,903 | | | Johnson & Johnson(a) | | | 48,595,210 | |
| | 291,153 | | | Merck & Co., Inc. | | | 24,413,179 | |
| | 1,209,999 | | | Pfizer, Inc.(a) | | | 52,417,157 | |
| | 200 | | | Sage Therapeutics, Inc.* | | | 36,618 | |
| | 1,499 | | | Sarepta Therapeutics, Inc.* | | | 227,773 | |
| | 49,000 | | | Thermo Fisher Scientific, Inc. | | | 14,390,320 | |
| | | | | | | | |
| | | | | | | 240,426,116 | |
| | |
| Real Estate Investment Trusts – 2.9% | |
| | 67,600 | | | American Homes 4 Rent Class A | | | 1,643,356 | |
| | 101,101 | | | American Tower Corp. | | | 20,670,099 | |
| | 30,700 | | | AvalonBay Communities, Inc. | | | 6,237,626 | |
| | 2,400 | | | Camden Property Trust | | | 250,536 | |
| | 2,499 | | | CoreSite Realty Corp. | | | 287,810 | |
| | 98,700 | | | Crown Castle International Corp. | | | 12,865,545 | |
| | 7,998 | | | CyrusOne, Inc. | | | 461,645 | |
| | 29,901 | | | Digital Realty Trust, Inc. | | | 3,522,039 | |
| | 14,300 | | | Equinix, Inc. | | | 7,211,347 | |
| | 35,305 | | | Equity LifeStyle Properties, Inc. | | | 4,283,347 | |
| | 133,362 | | | Prologis, Inc. | | | 10,682,296 | |
| | 45,900 | | | SBA Communications Corp.* | | | 10,320,156 | |
| | 40,000 | | | Sun Communities, Inc. | | | 5,127,600 | |
| | 14,800 | | | WP Carey, Inc. | | | 1,201,464 | |
| | | | | | | | |
| | | | | | | 84,764,866 | |
| | |
| Retailing – 5.7% | |
| | 51,222 | | | Amazon.com, Inc.*(a) | | | 96,995,516 | |
| | 141,400 | | | Gap, Inc. (The) | | | 2,540,958 | |
| | 158,376 | | | Home Depot, Inc. (The) | | | 32,937,457 | |
| | 69,599 | | | IAA, Inc.* | | | 2,699,049 | |
| | 70,900 | | | Kohl’s Corp. | | | 3,371,295 | |
| | 345,799 | | | Macy’s, Inc. | | | 7,420,847 | |
| | 20,500 | | | Penske Automotive Group, Inc. | | | 969,650 | |
| | 81,199 | | | Target Corp. | | | 7,032,645 | |
| | 161,600 | | | TJX Cos., Inc. (The) | | | 8,545,408 | |
| | |
| | |
| 28 | | The accompanying notes are an integral part of these financial statements. |
GOLDMAN SACHS U.S. EQUITY DIVIDEND AND PREMIUM FUND
| | | | | | | | |
| Shares | | | Description | |
Value | |
|
| Common Stocks – (continued) | |
| Retailing – (continued) | |
| | 4,900 | | | Wayfair, Inc. Class A* | | $ | 715,400 | |
| | 48,300 | | | Williams-Sonoma, Inc.(c) | | | 3,139,500 | |
| | | | | | | | |
| | | | | | | 166,367,725 | |
| | |
| Semiconductors & Semiconductor Equipment – 4.0% | |
| | 164,200 | | | Applied Materials, Inc. | | | 7,374,222 | |
| | 79,490 | | | Broadcom, Inc. | | | 22,881,991 | |
| | 130,700 | | | Cypress Semiconductor Corp. | | | 2,906,768 | |
| | 498,501 | | | Intel Corp. | | | 23,863,243 | |
| | 24,200 | | | Lam Research Corp. | | | 4,545,728 | |
| | 184,401 | | | Maxim Integrated Products, Inc. | | | 11,030,868 | |
| | 55,124 | | | NVIDIA Corp. | | | 9,053,014 | |
| | 238,697 | | | QUALCOMM, Inc. | | | 18,157,681 | |
| | 159,150 | | | Texas Instruments, Inc.(a) | | | 18,264,054 | |
| | | | | | | | |
| | | | | | | 118,077,569 | |
| | |
| Software & Services – 12.7% | |
| | 69,800 | | | Accenture plc Class A | | | 12,896,946 | |
| | 68,500 | | | Adobe, Inc.* | | | 20,183,525 | |
| | 12,800 | | | Atlassian Corp. plc Class A* | | | 1,674,752 | |
| | 48,400 | | | Autodesk, Inc.* | | | 7,884,360 | |
| | 116,400 | | | Automatic Data Processing, Inc. | | | 19,244,412 | |
| | 3,600 | | | DocuSign, Inc.* | | | 178,956 | |
| | 229,002 | | | International Business Machines Corp. | | | 31,579,318 | |
| | 3,200 | | | LogMeIn, Inc. | | | 235,776 | |
| | 87,800 | | | Mastercard, Inc. Class A | | | 23,225,734 | |
| | 976,850 | | | Microsoft Corp.(a) | | | 130,858,826 | |
| | 1,200 | | | Nutanix, Inc. Class A* | | | 31,128 | |
| | 18,800 | | | Okta, Inc.* | | | 2,321,988 | |
| | 209,376 | | | Oracle Corp. | | | 11,928,151 | |
| | 294,900 | | | Paychex, Inc. | | | 24,267,321 | |
| | 113,300 | | | PayPal Holdings, Inc.* | | | 12,968,318 | |
| | 4,700 | | | Sabre Corp. | | | 104,340 | |
| | 119,412 | | | salesforce.com, Inc.* | | | 18,118,383 | |
| | 26,862 | | | ServiceNow, Inc.* | | | 7,375,499 | |
| | 26,700 | | | Splunk, Inc.* | | | 3,357,525 | |
| | 28,100 | | | Square, Inc. Class A* | | | 2,038,093 | |
| | 5,000 | | | Tableau Software, Inc. Class A* | | | 830,100 | |
| | 126,268 | | | Visa, Inc. Class A | | | 21,913,811 | |
| | 1,600 | | | VMware, Inc. Class A | | | 267,536 | |
| | 663,099 | | | Western Union Co. (The) | | | 13,189,039 | |
| | 16,300 | | | Workday, Inc. Class A* | | | 3,350,954 | |
| | 27,400 | | | Zendesk, Inc.* | | | 2,439,422 | |
| | | | | | | | |
| | | | | | | 372,464,213 | |
| | |
| Technology Hardware & Equipment – 6.2% | |
| | 529,188 | | | Apple, Inc.(a)(b) | | | 104,736,889 | |
| | 3,500 | | | CDW Corp. | | | 388,500 | |
| | 768,548 | | | Cisco Systems, Inc.(a) | | | 42,062,632 | |
| | 191,600 | | | Corning, Inc. | | | 6,366,868 | |
| | 211,300 | | | Hewlett Packard Enterprise Co. | | | 3,158,935 | |
| | 239,200 | | | HP, Inc. | | | 4,972,968 | |
| | 38,800 | | | National Instruments Corp. | | | 1,629,212 | |
| | 67,600 | | | NetApp, Inc. | | | 4,170,920 | |
| | 131,399 | | | Seagate Technology plc | | | 6,191,521 | |
| | 99,100 | | | Western Digital Corp. | | | 4,712,205 | |
| | |
|
| Common Stocks – (continued) | |
| Technology Hardware & Equipment – (continued) | |
| | 111,699 | | | Xerox Corp. | | | 3,955,261 | |
| | | | | | | | |
| | | | | | | 182,345,911 | |
| | |
| Telecommunication Services – 2.7% | |
| | 1,428,128 | | | AT&T, Inc.(a) | | | 47,856,570 | |
| | 569,602 | | | Verizon Communications, Inc.(b) | | | 32,541,362 | |
| | | | | | | | |
| | | | | | | 80,397,932 | |
| | |
| Transportation – 2.2% | |
| | 8,800 | | | Copa Holdings SA Class A | | | 858,616 | |
| | 61,800 | | | CSX Corp. | | | 4,781,466 | |
| | 77,500 | | | Delta Air Lines, Inc. | | | 4,398,125 | |
| | 37,102 | | | Norfolk Southern Corp. | | | 7,395,542 | |
| | 1,200 | | | Ryder System, Inc. | | | 69,960 | |
| | 133,200 | | | Union Pacific Corp. | | | 22,525,452 | |
| | 221,898 | | | United Parcel Service, Inc. Class B | | | 22,915,406 | |
| | | | | | | | |
| | | | | | | 62,944,567 | |
| | |
| Utilities – 4.2% | |
| | 333,700 | | | CenterPoint Energy, Inc. | | | 9,553,831 | |
| | 393,997 | | | Dominion Energy, Inc. | | | 30,463,848 | |
| | 326,200 | | | Duke Energy Corp. | | | 28,783,888 | |
| | 18,300 | | | FirstEnergy Corp. | | | 783,423 | |
| | 769,501 | | | PPL Corp. | | | 23,862,226 | |
| | 557,701 | | | Southern Co. (The) | | | 30,829,711 | |
| | | | | | | | |
| | | | | | | 124,276,927 | |
| | |
| | TOTAL COMMON STOCKS | |
| | (Cost $2,511,352,208) | | $ | 2,956,586,332 | |
| | |
| | | | | | | | |
| Shares | | | Dividend Rate | | Value | |
|
| Investment Company(d)– 0.5% | |
| Goldman Sachs Financial Square Government Fund –
Institutional Shares |
|
| | 14,985,574 | | | 2.308% | | $ | 14,985,574 | |
| | (Cost $14,985,574) | |
| | |
| TOTAL INVESTMENTS BEFORE SECURITIES
LENDING REINVESTMENT VEHICLE |
|
| | (Cost $2,526,337,782) | | $ | 2,971,571,906 | |
| | |
| | |
|
| Securities Lending Reinvestment Vehicle(d)– 0.0% | |
| Goldman Sachs Financial Square Government Fund –
Institutional Shares |
|
| | 854,750 | | | 2.308% | | $ | 854,750 | |
| | (Cost $854,750) | |
| | |
| | TOTAL INVESTMENTS – 101.4% | |
| | (Cost $2,527,192,532) | | $ | 2,972,426,656 | |
| | |
| LIABILITIES IN EXCESS OF
OTHER ASSETS – (1.4)% | | | (42,333,000 | ) |
| | |
| | NET ASSETS – 100.0% | | $ | 2,930,093,656 | |
| | |
| | |
| The accompanying notes are an integral part of these financial statements. | | 29 |
GOLDMAN SACHS U.S. EQUITY DIVIDEND AND PREMIUM FUND
Schedule of Investments(continued)
June 30, 2019 (Unaudited)
| | |
The percentage shown for each investment category reflects the value of investments in that category as a percentage of net assets. |
| |
* | | Non-income producing security. |
| |
(a) | | All or a portion of security is segregated as collateral for call options written. |
| |
(b) | | All or a portion of security is segregated as collateral for initial margin requirements on futures transactions. |
| |
(c) | | All or a portion of security is on loan. |
| |
(d) | | Represents an Affiliated Issuer. |
| | |
|
Currency Abbreviation: |
USD | | —United States Dollar |
|
|
| ADDITIONAL INVESTMENT INFORMATION |
FUTURES CONTRACTS — At June 30, 2019, the Fund had the following futures contracts:
| | | | | | | | | | | | | | | | |
| Description | | Number of
Contracts | | | Expiration
Date | | | Notional
Amount | | | Unrealized
Appreciation/
(Depreciation) | |
Short position contracts: | | | | | | | | | | | | | | | | |
S&P 500E-Mini Index | | | (93 | ) | | | 09/20/2019 | | | $ | (13,690,530 | ) | | $ | 66,777 | |
WRITTEN OPTIONS CONTRACTS — At June 30, 2019, the Fund had the following written options contracts:
| | | | | | | | | | | | | | | | | | | | | | | | | | | | | | |
| Description | | Counterparty | | Exercise Price | | | Expiration
Date | | | Number of
Contracts | | | Notional
Amount | | | Value | | | Premiums Paid
(Received) by
the Fund | | | Unrealized
Appreciation/
Depreciation | |
Written options contracts: | | | | | | | | | | | | | | | | | | | | | | | | | |
Calls | | | | | | | | | | | | | | | | | | | | | | | | | | | | | | |
S&P 500 Index | | Morgan Stanley Co., Inc. | | | 2,975 USD | | | | 07/31/2019 | | | | 1,356 | | | $ | (398,902,656 | ) | | $ | (4,006,980 | ) | | $ | (7,318,332 | ) | | $ | 3,311,352 | |
| | | | | 2,800 USD | | | | 08/30/2019 | | | | 1,335 | | | | (392,724,960 | ) | | | (22,941,975 | ) | | | (8,992,547 | ) | | | (13,949,428 | ) |
| | | | | | 2,970 USD | | | | 09/30/2019 | | | | 1,327 | | | | (390,371,552 | ) | | | (9,375,255 | ) | | | (8,298,288 | ) | | | (1,076,967 | ) |
| | | | | |
| Total written options contracts | | | | 4,018 | | | | | | | $ | (36,324,210 | ) | | $ | (24,609,167 | ) | | $ | (11,715,043 | ) |
| | |
| 30 | | The accompanying notes are an integral part of these financial statements. |
GOLDMAN SACHS INTERNATIONAL EQUITY DIVIDEND AND PREMIUM FUND
Schedule of Investments
June 30, 2019 (Unaudited)
| | | | | | | | |
| Shares | | | Description | |
Value | |
|
| Common Stocks – 99.6% | |
| Australia – 8.4% | |
| | 61,039 | | | AGL Energy Ltd. (Utilities) | | $ | 858,420 | |
| | 64,976 | | | APA Group (Utilities) | | | 492,733 | |
| | 221,119 | | | Aurizon Holdings Ltd. (Transportation) | | | 839,405 | |
| | 211,635 | | | Bank of Queensland Ltd. (Banks) | | | 1,417,153 | |
| | 78,383 | | | Bendigo & Adelaide Bank Ltd. (Banks) | | | 637,997 | |
| | 19,642 | | | BHP Group Ltd. (Materials) | | | 570,965 | |
| | 88,859 | | | Coca-Cola Amatil Ltd. (Food, Beverage & Tobacco) | | | 637,921 | |
| | 37,066 | | | Commonwealth Bank of Australia (Banks) | | | 2,156,817 | |
| | 141,445 | | | Fortescue Metals Group Ltd. (Materials) | | | 899,531 | |
| | 642,433 | | | Harvey Norman Holdings Ltd. (Retailing) | | | 1,838,372 | |
| | 123,134 | | | Insurance Australia Group Ltd. (Insurance) | | | 714,912 | |
| | 270,244 | | | National Australia Bank Ltd. (Banks) | | | 5,076,288 | |
| | 13,762 | | | Rio Tinto Ltd. (Materials) | | | 1,007,726 | |
| | 11,619 | | | Rio Tinto plc (Materials) | | | 719,136 | |
| | 46,976 | | | Rio Tinto plc ADR (Materials)(a)(b) | | | 2,928,484 | |
| | 13,758 | | | Sonic Healthcare Ltd. (Health Care Equipment & Services) | | | 262,145 | |
| | 101,278 | | | South32 Ltd. (Materials) | | | 227,029 | |
| | 951 | | | Sydney Airport (Transportation) | | | 5,373 | |
| | 177,223 | | | Tabcorp Holdings Ltd. (Consumer Services) | | | 553,717 | |
| | 681,606 | | | Telstra Corp. Ltd. (Telecommunication Services) | | | 1,843,134 | |
| | 85,162 | | | Transurban Group (Transportation) | | | 881,802 | |
| | 25,653 | | | Wesfarmers Ltd. (Retailing) | | | 652,104 | |
| | 41,292 | | | Westpac Banking Corp. (Banks) | | | 822,960 | |
| | 262 | | | Woodside Petroleum Ltd. (Energy) | | | 6,720 | |
| | | | | | | | |
| | | | | | | 26,050,844 | |
| | |
| Austria – 0.0% | |
| | 2,799 | | | voestalpine AG (Materials)(b) | | | 86,530 | |
| | |
| Belgium – 1.9% | |
| | 8,440 | | | Ageas (Insurance) | | | 439,221 | |
| | 26,752 | | | Anheuser-Busch InBev SA/NV (Food, Beverage & Tobacco)(b) | | | 2,367,294 | |
| | 23,678 | | | KBC Group NV (Banks)(b) | | | 1,553,876 | |
| | 46,480 | | | Proximus SADP (Telecommunication Services) | | | 1,373,706 | |
| | 212 | | | Solvay SA (Materials)(b) | | | 22,016 | |
| | | | | | | | |
| | | | | | | 5,756,113 | |
| | |
| Denmark – 1.4% | |
| | 11,670 | | | Coloplast A/S Class B (Health Care Equipment & Services) | | | 1,319,163 | |
| | 32,419 | | | Novo Nordisk A/S Class B (Pharmaceuticals, Biotechnology & Life Sciences) | | | 1,655,872 | |
| | 37,740 | | | Tryg A/S (Insurance) | | | 1,228,077 | |
| | | | | | | | |
| | | | | | | 4,203,112 | |
| | |
|
| Common Stocks – (continued) | |
| Finland – 2.7% | |
| | 18,793 | | | Fortum OYJ (Utilities) | | $ | 415,356 | |
| | 23,392 | | | Kone OYJ Class B (Capital Goods) | | | 1,381,375 | |
| | 12,594 | | | Metso OYJ (Capital Goods) | | | 495,652 | |
| | 165,522 | | | Nokia OYJ (Technology Hardware & Equipment) | | | 824,431 | |
| | 258,325 | | | Nordea Bank Abp (Banks) | | | 1,875,747 | |
| | 20,549 | | | Orion OYJ Class B (Pharmaceuticals, Biotechnology & Life Sciences) | | | 753,550 | |
| | 43,523 | | | Sampo OYJ Class A (Insurance)(b) | | | 2,054,479 | |
| | 12,919 | | | Stora Enso OYJ Class R (Materials) | | | 152,027 | |
| | 19,925 | | | UPM-Kymmene OYJ (Materials) | | | 530,145 | |
| | | | | | | | |
| | | | | | | 8,482,762 | |
| | |
| France – 10.4% | |
| | 1,137 | | | Accor SA (Consumer Services)(b) | | | 48,806 | |
| | 156 | | | Aeroports de Paris (Transportation) | | | 27,523 | |
| | 7,025 | | | Air Liquide SA (Materials) | | | 982,575 | |
| | 12,766 | | | Airbus SE (Capital Goods) | | | 1,806,664 | |
| | 31,802 | | | AXA SA (Insurance) | | | 835,175 | |
| | 24,706 | | | BNP Paribas SA (Banks) | | | 1,171,195 | |
| | 36,142 | | | Bouygues SA (Capital Goods)(b) | | | 1,338,447 | |
| | 8,909 | | | Capgemini SE (Software & Services)(b) | | | 1,107,684 | |
| | 39,682 | | | Casino Guichard Perrachon SA (Food & Staples Retailing)(b)(c) | | | 1,353,672 | |
| | 36,180 | | | Credit Agricole SA (Banks) | | | 431,726 | |
| | 10,779 | | | Danone SA (Food, Beverage & Tobacco) | | | 912,682 | |
| | 17,029 | | | Edenred (Commercial & Professional Services) | | | 867,874 | |
| | 18,344 | | | Electricite de France SA (Utilities) | | | 231,279 | |
| | 237,977 | | | Engie SA (Utilities)(b) | | | 3,608,563 | |
| | 9,925 | | | Eutelsat Communications SA (Media & Entertainment) | | | 185,360 | |
| | 3,203 | | | Kering SA (Consumer Durables & Apparel) | | | 1,890,484 | |
| | 746 | | | L’Oreal SA (Household & Personal Products)(b) | | | 212,109 | |
| | 9,709 | | | LVMH Moet Hennessy Louis Vuitton SE (Consumer Durables & Apparel)(b) | | | 4,127,544 | |
| | 5,545 | | | Orange SA (Telecommunication Services) | | | 87,462 | |
| | 8,050 | | | Renault SA (Automobiles & Components) | | | 506,105 | |
| | 71,573 | | | Rexel SA (Capital Goods) | | | 908,430 | |
| | 565 | | | Safran SA (Capital Goods) | | | 82,655 | |
| | 35,412 | | | Sanofi (Pharmaceuticals, Biotechnology & Life Sciences)(b) | | | 3,060,387 | |
| | 25,900 | | | Schneider Electric SE (Capital Goods)(b) | | | 2,343,507 | |
| | 45,082 | | | Societe Generale SA (Banks)(b) | | | 1,137,842 | |
| | 12,100 | | | Suez (Utilities) | | | 174,601 | |
| | 53,239 | | | TOTAL SA (Energy)(b) | | | 2,986,348 | |
| | | | | | | | |
| | | | | | | 32,426,699 | |
| | |
| Germany – 8.2% | |
| | 9,133 | | | Allianz SE (Registered) (Insurance)(b) | | | 2,202,663 | |
| | 36,655 | | | BASF SE (Materials)(b) | | | 2,666,623 | |
| | |
| | |
| The accompanying notes are an integral part of these financial statements. | | 31 |
GOLDMAN SACHS INTERNATIONAL EQUITY DIVIDEND AND PREMIUM FUND
Schedule of Investments(continued)
June 30, 2019 (Unaudited)
| | | | | | | | |
| Shares | | | Description | |
Value | |
|
| Common Stocks – (continued) | |
| Germany – (continued) | |
| | 17,394 | | | Bayer AG (Registered) (Pharmaceuticals, Biotechnology & Life Sciences)(b) | | $ | 1,206,453 | |
| | 13,810 | | | Bayerische Motoren Werke AG (Automobiles & Components)(b) | | | 1,020,800 | |
| | 15,417 | | | Bayerische Motoren Werke AG (Preference) (Automobiles & Components)(d) | | | 955,259 | |
| | 4,321 | | | Covestro AG (Materials)(e) | | | 219,980 | |
| | 83,654 | | | Daimler AG (Registered) (Automobiles & Components)(b) | | | 4,665,535 | |
| | 7,555 | | | Deutsche Lufthansa AG (Registered) (Transportation) | | | 129,537 | |
| | 44,017 | | | Deutsche Post AG (Registered) (Transportation) | | | 1,448,019 | |
| | 15,810 | | | Evonik Industries AG (Materials)(b) | | | 460,669 | |
| | 4,831 | | | FUCHS PETROLUB SE (Preference) (Materials)(d) | | | 189,666 | |
| | 16,209 | | | GEA Group AG (Capital Goods) | | | 460,466 | |
| | 10,953 | | | HUGO BOSS AG (Consumer Durables & Apparel)(b) | | | 729,972 | |
| | 53,908 | | | ProSiebenSat.1 Media SE (Media & Entertainment)(b) | | | 844,499 | |
| | 16,581 | | | SAP SE (Software & Services)(b) | | | 2,273,120 | |
| | 30,840 | | | Siemens AG (Registered) (Capital Goods) | | | 3,671,322 | |
| | 408,991 | | | Telefonica Deutschland Holding AG (Telecommunication Services)(b) | | | 1,142,661 | |
| | 5,334 | | | TUI AG (Consumer Services) | | | 52,372 | |
| | 14,697 | | | Vonovia SE (Real Estate)(b) | | | 702,073 | |
| | 1,754 | | | Wirecard AG (Software & Services) | | | 296,104 | |
| | | | | | | | |
| | | | | | | 25,337,793 | |
| | |
| Hong Kong – 3.5% | |
| | 138,600 | | | AIA Group Ltd. (Insurance) | | | 1,496,728 | |
| | 17,900 | | | ASM Pacific Technology Ltd. (Semiconductors & Semiconductor Equipment) | | | 183,518 | |
| | 32,908 | | | CK Asset Holdings Ltd. (Real Estate) | | | 257,804 | |
| | 101,000 | | | Hang Lung Properties Ltd. (Real Estate) | | | 240,280 | |
| | 26,800 | | | Hang Seng Bank Ltd. (Banks) | | | 667,065 | |
| | 13,310 | | | Henderson Land Development Co. Ltd. (Real Estate) | | | 73,382 | |
| | 238,471 | | | Hong Kong & China Gas Co. Ltd. (Utilities) | | | 528,668 | |
| | 45,529 | | | Hong Kong Exchanges & Clearing Ltd. (Diversified Financials) | | | 1,608,999 | |
| | 50,200 | | | Hongkong Land Holdings Ltd. (Real Estate)(b) | | | 323,575 | |
| | 27,000 | | | Hysan Development Co. Ltd. (Real Estate) | | | 139,513 | |
| | 82,014 | | | I-CABLE Communications Ltd. (Media & Entertainment)* | | | 1,039 | |
| | 7,600 | | | Jardine Matheson Holdings Ltd. (Capital Goods)(b) | | | 479,355 | |
| | 5,000 | | | Jardine Strategic Holdings Ltd. (Capital Goods)(b) | | | 190,786 | |
| | |
|
| Common Stocks – (continued) | |
| Hong Kong – (continued) | |
| | 262,000 | | | Link REIT (REIT) | | | 3,224,019 | |
| | 64,000 | | | MTR Corp. Ltd. (Transportation) | | | 431,094 | |
| | 136,564 | | | Sino Land Co. Ltd. (Real Estate) | | | 229,029 | |
| | 2,500 | | | Sun Hung Kai Properties Ltd. (Real Estate) | | | 42,413 | |
| | 58,200 | | | Swire Properties Ltd. (Real Estate) | | | 235,286 | |
| | 24,000 | | | Techtronic Industries Co. Ltd. (Capital Goods) | | | 183,860 | |
| | 16,000 | | | Wharf Holdings Ltd. (The) (Real Estate) | | | 42,406 | |
| | 48,000 | | | Wharf Real Estate Investment Co. Ltd. (Real Estate) | | | 338,276 | |
| | | | | | | | |
| | | | | | | 10,917,095 | |
| | |
| Ireland – 0.3% | |
| | 24,568 | | | CRH plc (Materials)(b) | | | 803,060 | |
| | |
| Israel – 0.1% | |
| | 172,983 | | | Bezeq The Israeli Telecommunication Corp. Ltd. (Telecommunication Services) | | | 131,022 | |
| | 19,044 | | | Israel Chemicals Ltd. (Materials) | | | 100,190 | |
| | 14,757 | | | Teva Pharmaceutical Industries Ltd. ADR (Pharmaceuticals, Biotechnology & Life Sciences)*(b) | | | 136,207 | |
| | | | | | | | |
| | | | | | | 367,419 | |
| | |
| Italy – 1.1% | |
| | 41,322 | | | Assicurazioni Generali SpA (Insurance) | | | 777,993 | |
| | 121,622 | | | Eni SpA (Energy)(b) | | | 2,022,249 | |
| | 21,515 | | | Mediobanca Banca di Credito Finanziario SpA (Banks) | | | 221,858 | |
| | 110,624 | | | Snam SpA (Energy) | | | 550,335 | |
| | | | | | | | |
| | | | | | | 3,572,435 | |
| | |
| Japan – 23.6% | |
| | 2,400 | | | ABC-Mart, Inc. (Retailing) | | | 156,520 | |
| | 13,000 | | | AEON Financial Service Co. Ltd. (Diversified Financials) | | | 209,818 | |
| | 20,100 | | | AGC, Inc. (Capital Goods) | | | 696,302 | |
| | 19,100 | | | Alfresa Holdings Corp. (Health Care Equipment & Services) | | | 472,364 | |
| | 2,500 | | | Alps Alpine Co. Ltd. (Technology Hardware & Equipment) | | | 42,339 | |
| | 20,900 | | | Aozora Bank Ltd. (Banks) | | | 502,533 | |
| | 41,000 | | | Asahi Kasei Corp. (Materials) | | | 438,313 | |
| | 7,700 | | | Astellas Pharma, Inc. (Pharmaceuticals, Biotechnology & Life Sciences) | | | 109,731 | |
| | 53,100 | | | Bridgestone Corp. (Automobiles & Components) | | | 2,094,739 | |
| | 115,600 | | | Canon, Inc. (Technology Hardware & Equipment) | | | 3,385,123 | |
| | 7,000 | | | Chugai Pharmaceutical Co. Ltd. (Pharmaceuticals, Biotechnology & Life Sciences) | | | 458,450 | |
| | 31,100 | | | Chugoku Electric Power Co., Inc. (The) (Utilities) | | | 392,195 | |
| | 27,700 | | | Daicel Corp. (Materials) | | | 246,861 | |
| | |
| | |
| 32 | | The accompanying notes are an integral part of these financial statements. |
GOLDMAN SACHS INTERNATIONAL EQUITY DIVIDEND AND PREMIUM FUND
| | | | | | | | |
| Shares | | | Description | |
Value | |
|
| Common Stocks – (continued) | |
| Japan – (continued) | |
| | 9,700 | | | Dai-ichi Life Holdings, Inc. (Insurance) | | $ | 146,759 | |
| | 2,600 | | | Daiichi Sankyo Co. Ltd. (Pharmaceuticals, Biotechnology & Life Sciences) | | | 136,358 | |
| | 2,800 | | | Daikin Industries Ltd. (Capital Goods) | | | 366,629 | |
| | 6,600 | | | Daito Trust Construction Co. Ltd. (Real Estate) | | | 841,705 | |
| | 18,900 | | | Daiwa House Industry Co. Ltd. (Real Estate) | | | 552,272 | |
| | 236,000 | | | Daiwa Securities Group, Inc. (Diversified Financials) | | | 1,036,145 | |
| | 2,900 | | | Denso Corp. (Automobiles & Components) | | | 122,282 | |
| | 1,500 | | | Disco Corp. (Semiconductors & Semiconductor Equipment) | | | 247,524 | |
| | 13,600 | | | Eisai Co. Ltd. (Pharmaceuticals, Biotechnology & Life Sciences) | | | 770,797 | |
| | 9,100 | | | FANUC Corp. (Capital Goods) | | | 1,690,896 | |
| | 400 | | | Fast Retailing Co. Ltd. (Retailing) | | | 242,119 | |
| | 2,600 | | | Fuji Electric Co. Ltd. (Capital Goods) | | | 90,107 | |
| | 600 | | | Hamamatsu Photonics KK (Technology Hardware & Equipment) | | | 23,440 | |
| | 1,300 | | | Hikari Tsushin, Inc. (Retailing) | | | 284,006 | |
| | 32,500 | | | Hino Motors Ltd. (Capital Goods) | | | 274,307 | |
| | 1,916 | | | Hirose Electric Co. Ltd. (Technology Hardware & Equipment) | | | 214,397 | |
| | 6,000 | | | Hitachi Chemical Co. Ltd. (Materials) | | | 163,534 | |
| | 7,700 | | | Hitachi Ltd. (Technology Hardware & Equipment) | | | 283,304 | |
| | 2,900 | | | Hitachi Metals Ltd. (Materials) | | | 32,885 | |
| | 33,700 | | | Honda Motor Co. Ltd. (Automobiles & Components) | | | 871,441 | |
| | 12,900 | | | Hulic Co. Ltd. (Real Estate) | | | 103,854 | |
| | 24,449 | | | Idemitsu Kosan Co. Ltd. (Energy) | | | 739,460 | |
| | 11,800 | | | Isuzu Motors Ltd. (Automobiles & Components) | | | 134,769 | |
| | 126,000 | | | ITOCHU Corp. (Capital Goods) | | | 2,413,785 | |
| | 700 | | | Japan Airlines Co. Ltd. (Transportation) | | | 22,341 | |
| | 34,300 | | | Japan Exchange Group, Inc. (Diversified Financials) | | | 546,290 | |
| | 50,400 | | | Japan Post Holdings Co. Ltd. (Insurance) | | | 570,781 | |
| | 38,600 | | | Japan Tobacco, Inc. (Food, Beverage & Tobacco) | | | 850,886 | |
| | 20,900 | | | JFE Holdings, Inc. (Materials) | | | 307,749 | |
| | 6,400 | | | JSR Corp. (Materials) | | | 101,378 | |
| | 109,900 | | | JXTG Holdings, Inc. (Energy) | | | 547,731 | |
| | 9,300 | | | Kakaku.com, Inc. (Media & Entertainment) | | | 179,866 | |
| | 10,000 | | | Kaneka Corp. (Materials) | | | 377,027 | |
| | 19,000 | | | Kao Corp. (Household & Personal Products) | | | 1,449,783 | |
| | 9,000 | | | Kawasaki Heavy Industries Ltd. (Capital Goods) | | | 212,258 | |
| | 33,900 | | | KDDI Corp. (Telecommunication Services) | | | 862,643 | |
| | |
|
| Common Stocks – (continued) | |
| Japan – (continued) | |
| | 200 | | | Keyence Corp. (Technology Hardware & Equipment) | | | 123,344 | |
| | 7,700 | | | Kikkoman Corp. (Food, Beverage & Tobacco) | | | 335,769 | |
| | 8,000 | | | Kintetsu Group Holdings Co. Ltd. (Transportation) | | | 383,539 | |
| | 43,800 | | | Kirin Holdings Co. Ltd. (Food, Beverage & Tobacco) | | | 945,752 | |
| | 43,600 | | | Komatsu Ltd. (Capital Goods) | | | 1,058,512 | |
| | 23,600 | | | Konica Minolta, Inc. (Technology Hardware & Equipment) | | | 229,948 | |
| | 5,700 | | | Kose Corp. (Household & Personal Products) | | | 962,057 | |
| | 7,500 | | | Kubota Corp. (Capital Goods) | | | 125,299 | |
| | 7,300 | | | Kyushu Railway Co. (Transportation) | | | 212,961 | |
| | 7,700 | | | Lawson, Inc. (Food & Staples Retailing) | | | 369,922 | |
| | 40,800 | | | LIXIL Group Corp. (Capital Goods) | | | 647,211 | |
| | 7,800 | | | M3, Inc. (Health Care Equipment & Services) | | | 143,137 | |
| | 6,000 | | | Makita Corp. (Capital Goods) | | | 204,855 | |
| | 179,100 | | | Marubeni Corp. (Capital Goods) | | | 1,188,823 | |
| | 16,100 | | | Marui Group Co. Ltd. (Retailing) | | | 328,329 | |
| | 2,800 | | | MEIJI Holdings Co. Ltd. (Food, Beverage & Tobacco) | | | 200,203 | |
| | 22,600 | | | Mitsubishi Chemical Holdings Corp. (Materials) | | | 158,230 | |
| | 20,900 | | | Mitsubishi Corp. (Capital Goods) | | | 552,290 | |
| | 23,400 | | | Mitsubishi Electric Corp. (Capital Goods) | | | 309,350 | |
| | 400 | | | Mitsubishi Heavy Industries Ltd. (Capital Goods) | | | 17,445 | |
| | 100 | | | Mitsubishi Materials Corp. (Materials) | | | 2,849 | |
| | 5,400 | | | Mitsubishi Motors Corp. (Automobiles & Components) | | | 25,937 | |
| | 239,900 | | | Mitsubishi UFJ Financial Group, Inc. (Banks) | | | 1,142,638 | |
| | 138,100 | | | Mizuho Financial Group, Inc. (Banks) | | | 200,815 | |
| | 13,700 | | | MS&AD Insurance Group Holdings, Inc. (Insurance) | | | 435,474 | |
| | 21,400 | | | Murata Manufacturing Co. Ltd. (Technology Hardware & Equipment) | | | 963,444 | |
| | 4,500 | | | Nabtesco Corp. (Capital Goods) | | | 125,716 | |
| | 3,900 | | | NEC Corp. (Technology Hardware & Equipment) | | | 153,898 | |
| | 10,200 | | | NGK Spark Plug Co. Ltd. (Automobiles & Components) | | | 191,896 | |
| | 3,700 | | | Nidec Corp. (Capital Goods) | | | 508,139 | |
| | 1,900 | | | Nintendo Co. Ltd. (Media & Entertainment) | | | 697,108 | |
| | 8,300 | | | Nippon Express Co. Ltd. (Transportation) | | | 442,390 | |
| | 2,400 | | | Nippon Paint Holdings Co. Ltd. (Materials) | | | 93,434 | |
| | 392 | | | Nippon Prologis REIT, Inc. (REIT) | | | 905,466 | |
| | 4,401 | | | Nippon Steel Corp. (Materials) | | | 75,741 | |
| | 13,300 | | | Nippon Telegraph & Telephone Corp. (Telecommunication Services) | | | 619,643 | |
| | |
| | |
| The accompanying notes are an integral part of these financial statements. | | 33 |
GOLDMAN SACHS INTERNATIONAL EQUITY DIVIDEND AND PREMIUM FUND
Schedule of Investments(continued)
June 30, 2019 (Unaudited)
| | | | | | | | |
| Shares | | | Description | |
Value | |
|
| Common Stocks – (continued) | |
| Japan – (continued) | |
| | 72,300 | | | Nissan Motor Co. Ltd. (Automobiles & Components) | | $ | 517,846 | |
| | 11,600 | | | Nisshin Seifun Group, Inc. (Food, Beverage & Tobacco) | | | 264,930 | |
| | 7,100 | | | Nitto Denko Corp. (Materials) | | | 351,425 | |
| | 3,500 | | | Nomura Real Estate Holdings, Inc. (Real Estate) | | | 75,387 | |
| | 29,700 | | | Nomura Research Institute Ltd. (Software & Services) | | | 477,613 | |
| | 32,300 | | | NSK Ltd. (Capital Goods) | | | 288,708 | |
| | 82,000 | | | NTT DOCOMO, Inc. (Telecommunication Services) | | | 1,913,218 | |
| | 4,200 | | | Obic Co. Ltd. (Software & Services) | | | 477,310 | |
| | 19,000 | | | Odakyu Electric Railway Co. Ltd. (Transportation) | | | 465,605 | |
| | 2,300 | | | Omron Corp. (Technology Hardware & Equipment) | | | 120,626 | |
| | 3,400 | | | Ono Pharmaceutical Co. Ltd. (Pharmaceuticals, Biotechnology & Life Sciences) | | | 61,131 | |
| | 5,400 | | | Otsuka Corp. (Software & Services) | | | 217,766 | |
| | 3,400 | | | Otsuka Holdings Co. Ltd. (Pharmaceuticals, Biotechnology & Life Sciences) | | | 111,101 | |
| | 55,400 | | | Panasonic Corp. (Consumer Durables & Apparel) | | | 462,765 | |
| | 10,500 | | | Park24 Co. Ltd. (Commercial & Professional Services) | | | 245,150 | |
| | 4,000 | | | Pola Orbis Holdings, Inc. (Household & Personal Products) | | | 112,088 | |
| | 15,900 | | | Recruit Holdings Co. Ltd. (Commercial & Professional Services) | | | 532,362 | |
| | 49,100 | | | Resona Holdings, Inc. (Banks) | | | 204,825 | |
| | 400 | | | Ryohin Keikaku Co. Ltd. (Retailing) | | | 72,474 | |
| | 24,500 | | | Sankyo Co. Ltd. (Consumer Durables & Apparel) | | | 888,323 | |
| | 22,600 | | | SBI Holdings, Inc. (Diversified Financials) | | | 561,344 | |
| | 30,800 | | | Seiko Epson Corp. (Technology Hardware & Equipment) | | | 488,002 | |
| | 83,200 | | | Sekisui House Ltd. (Consumer Durables & Apparel) | | | 1,370,854 | |
| | 67,800 | | | Seven Bank Ltd. (Banks) | | | 177,683 | |
| | 7,000 | | | Shimadzu Corp. (Technology Hardware & Equipment) | | | 172,327 | |
| | 9,400 | | | Shin-Etsu Chemical Co. Ltd. (Materials) | | | 879,482 | |
| | 5,700 | | | Shiseido Co. Ltd. (Household & Personal Products) | | | 431,129 | |
| | 17,800 | | | SoftBank Group Corp. (Telecommunication Services) | | | 857,343 | |
| | 3,800 | | | Sompo Holdings, Inc. (Insurance) | | | 146,990 | |
| | 14,900 | | | Sony Corp. (Consumer Durables & Apparel) | | | 782,995 | |
| | 39,800 | | | Subaru Corp. (Automobiles & Components) | | | 969,017 | |
| | 59,000 | | | Sumitomo Chemical Co. Ltd. (Materials) | | | 274,724 | |
| | |
|
| Common Stocks – (continued) | |
| Japan – (continued) | |
| | 129,600 | | | Sumitomo Corp. (Capital Goods) | | | 1,968,375 | |
| | 5,500 | | | Sumitomo Metal Mining Co. Ltd. (Materials) | | | 164,871 | |
| | 8,900 | | | Sumitomo Mitsui Financial Group, Inc. (Banks) | | | 315,467 | |
| | 11,400 | | | Sumitomo Mitsui Trust Holdings, Inc. (Banks) | | | 414,180 | |
| | 9,700 | | | Sysmex Corp. (Health Care Equipment & Services) | | | 634,575 | |
| | 52,600 | | | Takeda Pharmaceutical Co. Ltd. (Pharmaceuticals, Biotechnology & Life Sciences) | | | 1,871,131 | |
| | 1,000 | | | TDK Corp. (Technology Hardware & Equipment) | | | 77,894 | |
| | 52,900 | | | Tohoku Electric Power Co., Inc. (Utilities) | | | 535,290 | |
| | 22,300 | | | Tokio Marine Holdings, Inc. (Insurance) | | | 1,118,911 | |
| | 10,500 | | | Tokyo Electron Ltd. (Semiconductors & Semiconductor Equipment) | | | 1,475,831 | |
| | 300 | | | Tokyo Gas Co. Ltd. (Utilities) | | | 7,072 | |
| | 17,700 | | | Tokyu Fudosan Holdings Corp. (Real Estate) | | | 97,956 | |
| | 4,600 | | | TOTO Ltd. (Capital Goods) | | | 182,170 | |
| | 3,800 | | | Toyoda Gosei Co. Ltd. (Automobiles & Components) | | | 74,265 | |
| | 74,020 | | | Toyota Motor Corp. (Automobiles & Components) | | | 4,593,966 | |
| | 12,700 | | | Trend Micro, Inc. (Software & Services) | | | 567,486 | |
| | 61,200 | | | USS Co. Ltd. (Retailing) | | | 1,209,007 | |
| | 3,300 | | | Yamaha Corp. (Consumer Durables & Apparel) | | | 157,071 | |
| | 22,600 | | | Yamaha Motor Co. Ltd. (Automobiles & Components) | | | 402,820 | |
| | 4,900 | | | Yamato Holdings Co. Ltd. (Transportation) | | | 99,879 | |
| | 2,800 | | | Yaskawa Electric Corp. (Technology Hardware & Equipment) | | | 95,752 | |
| | 3,900 | | | ZOZO, Inc. (Retailing) | | | 73,191 | |
| | | | | | | | |
| | | | | | | 73,208,063 | |
| | |
| Luxembourg – 0.7% | |
| | 19,039 | | | RTL Group SA (Media & Entertainment)(b) | | | 974,459 | |
| | 60,498 | | | SES SA FDR (Media & Entertainment) | | | 945,894 | |
| | 21,967 | | | Tenaris SA (Energy) | | | 288,114 | |
| | | | | | | | |
| | | | | | | 2,208,467 | |
| | |
| Macau – 0.4% | |
| | 58,000 | | | Galaxy Entertainment Group Ltd. (Consumer Services) | | | 390,166 | |
| | 82,800 | | | MGM China Holdings Ltd. (Consumer Services) | | | 140,661 | |
| | 94,800 | | | Sands China Ltd. (Consumer Services) | | | 452,866 | |
| | 129,600 | | | Wynn Macau Ltd. (Consumer Services) | | | 290,129 | |
| | | | | | | | |
| | | | | | | 1,273,822 | |
| | |
| | |
| 34 | | The accompanying notes are an integral part of these financial statements. |
GOLDMAN SACHS INTERNATIONAL EQUITY DIVIDEND AND PREMIUM FUND
| | | | | | | | |
| Shares | | | Description | |
Value | |
|
| Common Stocks – (continued) | |
| Mexico – 0.0% | |
| | 5,854 | | | Fresnillo plc (Materials) | | $ | 64,791 | |
| | |
| Netherlands – 4.6% | |
| | 146,986 | | | Aegon NV (Insurance) | | | 730,145 | |
| | 2,074 | | | Akzo Nobel NV (Materials) | | | 194,894 | |
| | 6,573 | | | ASML Holding NV (Semiconductors & Semiconductor Equipment) | | | 1,367,775 | |
| | 126,191 | | | ING Groep NV (Banks)(b) | | | 1,461,764 | |
| | 3,885 | | | Koninklijke DSM NV (Materials) | | | 479,349 | |
| | 27,544 | | | Koninklijke Philips NV (Health Care Equipment & Services) | | | 1,197,501 | |
| | 16,692 | | | NN Group NV (Insurance) | | | 671,000 | |
| | 13,987 | | | Randstad NV (Commercial & Professional Services) | | | 767,646 | |
| | 138,988 | | | Royal Dutch Shell plc Class A (Energy)(b) | | | 4,528,902 | |
| | 91,972 | | | Royal Dutch Shell plc Class B (Energy)(b) | | | 3,013,619 | |
| | | | | | | | |
| | | | | | | 14,412,595 | |
| | |
| New Zealand – 0.4% | |
| | 44,354 | | | Fisher & Paykel Healthcare Corp. Ltd. (Health Care Equipment & Services) | | | 461,393 | |
| | 256,999 | | | Spark New Zealand Ltd. (Telecommunication Services) | | | 691,425 | |
| | | | | | | | |
| | | | | | | 1,152,818 | |
| | |
| Norway – 1.1% | |
| | 29,110 | | | Gjensidige Forsikring ASA (Insurance) | | | 586,716 | |
| | 118,351 | | | Mowi ASA (Food, Beverage & Tobacco) | | | 2,769,285 | |
| | | | | | | | |
| | | | | | | 3,356,001 | |
| | |
| Portugal – 0.3% | |
| | 79,882 | | | EDP – Energias de Portugal SA (Utilities) | | | 303,587 | |
| | 23,361 | | | Galp Energia SGPS SA (Energy) | | | 359,275 | |
| | 26,389 | | | Jeronimo Martins SGPS SA (Food & Staples Retailing) | | | 425,369 | |
| | | | | | | | |
| | | | | | | 1,088,231 | |
| | |
| Singapore – 1.2% | |
| | 2,800 | | | City Developments Ltd. (Real Estate) | | | 19,614 | |
| | 48,200 | | | ComfortDelGro Corp. Ltd. (Transportation) | | | 94,790 | |
| | 62,500 | | | DBS Group Holdings Ltd. (Banks) | | | 1,200,629 | |
| | 63,500 | | | Keppel Corp. Ltd. (Capital Goods) | | | 312,889 | |
| | 113,200 | | | SATS Ltd. (Transportation) | | | 436,764 | |
| | 58,200 | | | Singapore Exchange Ltd. (Diversified Financials) | | | 340,966 | |
| | 211,200 | | | Singapore Technologies Engineering Ltd. (Capital Goods) | | | 646,860 | |
| | 121,600 | | | Singapore Telecommunications Ltd. (Telecommunication Services) | | | 314,739 | |
| | 10,900 | | | United Overseas Bank Ltd. (Banks) | | | 210,720 | |
| | | | | | | | |
| | | | | | | 3,577,971 | |
| | |
|
| Common Stocks – (continued) | |
| South Africa – 0.2% | |
| | 27,115 | | | Anglo American plc (Materials) | | | 774,633 | |
| | |
| Spain – 3.2% | |
| | 3,302 | | | ACS Actividades de Construccion y Servicios SA (Capital Goods)(b) | | | 132,110 | |
| | 12,460 | | | Amadeus IT Group SA (Software & Services) | | | 987,399 | |
| | 164,781 | | | Banco Santander SA (Banks) | | | 763,703 | |
| | 49,244 | | | Enagas SA (Energy) | | | 1,314,153 | |
| | 74,268 | | | Endesa SA (Utilities)(b) | | | 1,910,215 | |
| | 98,536 | | | Ferrovial SA (Capital Goods)(b) | | | 2,522,385 | |
| | 7,110 | | | Iberdrola SA (Utilities) | | | 70,788 | |
| | 20,456 | | | Mapfre SA (Insurance) | | | 59,820 | |
| | 48,755 | | | Naturgy Energy Group SA (Utilities) | | | 1,343,631 | |
| | 99,564 | | | Telefonica SA (Telecommunication Services) | | | 818,745 | |
| | | | | | | | |
| | | | | | | 9,922,949 | |
| | |
| Sweden – 1.8% | |
| | 7,077 | | | Atlas Copco AB Class B (Capital Goods) | | | 203,467 | |
| | 209,832 | | | Skandinaviska Enskilda Banken AB Class A (Banks) | | | 1,942,817 | |
| | 42,554 | | | Skanska AB Class B (Capital Goods) | | | 768,907 | |
| | 156,733 | | | Swedbank AB Class A (Banks) | | | 2,359,513 | |
| | 9,845 | | | Telefonaktiebolaget LM Ericsson Class B (Technology Hardware & Equipment) | | | 93,446 | |
| | 46,855 | | | Telia Co. AB (Telecommunication Services) | | | 207,723 | |
| | | | | | | | |
| | | | | | | 5,575,873 | |
| | |
| Switzerland – 11.0% | |
| | 63,111 | | | ABB Ltd. (Registered) (Capital Goods) | | | 1,265,260 | |
| | 11,392 | | | Adecco Group AG (Registered) (Commercial & Professional Services) | | | 684,629 | |
| | 1,451 | | | Alcon, Inc. (Health Care Equipment & Services)* | | | 89,599 | |
| | 2,590 | | | EMS-Chemie Holding AG (Registered) (Materials) | | | 1,681,295 | |
| | 313 | | | Geberit AG (Registered) (Capital Goods) | | | 146,305 | |
| | 390 | | | Givaudan SA (Registered) (Materials) | | | 1,101,567 | |
| | 259,704 | | | Glencore plc (Materials)* | | | 898,817 | |
| | 8,736 | | | Kuehne + Nagel International AG (Registered) (Transportation) | | | 1,297,619 | |
| | 31,527 | | | LafargeHolcim Ltd. (Registered) (Materials)* | | | 1,541,561 | |
| | 69,268 | | | Nestle SA (Registered) (Food, Beverage & Tobacco) | | | 7,170,779 | |
| | 66,483 | | | Novartis AG (Registered) (Pharmaceuticals, Biotechnology & Life Sciences) | | | 6,069,351 | |
| | 20,588 | | | Roche Holding AG (Pharmaceuticals, Biotechnology & Life Sciences) | | | 5,789,096 | |
| | 397 | | | SGS SA (Registered) (Commercial & Professional Services) | | | 1,011,897 | |
| | |
| | |
| The accompanying notes are an integral part of these financial statements. | | 35 |
GOLDMAN SACHS INTERNATIONAL EQUITY DIVIDEND AND PREMIUM FUND
Schedule of Investments(continued)
June 30, 2019 (Unaudited)
| | | | | | | | |
| Shares | | | Description | |
Value | |
|
| Common Stocks – (continued) | |
| Switzerland – (continued) | |
| | 1,293 | | | Sonova Holding AG (Registered) (Health Care Equipment & Services) | | $ | 294,285 | |
| | 96,970 | | | STMicroelectronics NV (Semiconductors & Semiconductor Equipment)(b) | | | 1,719,867 | |
| | 737 | | | Temenos AG (Registered) (Software & Services)* | | | 131,963 | |
| | 42,725 | | | UBS Group AG (Registered) (Diversified Financials)* | | | 507,797 | |
| | 8,140 | | | Zurich Insurance Group AG (Insurance) | | | 2,832,308 | |
| | | | | | | | |
| | | | | | | 34,233,995 | |
| | |
| United Kingdom – 13.1% | |
| | 38,232 | | | AstraZeneca plc ADR (Pharmaceuticals, Biotechnology & Life Sciences)(b) | | | 1,578,217 | |
| | 250,164 | | | BAE Systems plc (Capital Goods) | | | 1,572,249 | |
| | 89,865 | | | BP plc ADR (Energy)(b) | | | 3,747,371 | |
| | 52,689 | | | British American Tobacco plc (Food, Beverage & Tobacco)(b) | | | 1,839,686 | |
| | 95,372 | | | Centrica plc (Utilities) | | | 106,318 | |
| | 15,610 | | | Compass Group plc (Consumer Services) | | | 374,199 | |
| | 13,945 | | | Diageo plc (Food, Beverage & Tobacco) | | | 600,197 | |
| | 50,835 | | | easyJet plc (Transportation) | | | 615,484 | |
| | 130,365 | | | G4S plc (Commercial & Professional Services) | | | 344,898 | |
| | 118,203 | | | GlaxoSmithKline plc ADR (Pharmaceuticals, Biotechnology & Life Sciences)(b) | | | 4,730,484 | |
| | 1,029,471 | | | HSBC Holdings plc (Banks) | | | 8,592,239 | |
| | 34,388 | | | Imperial Brands plc (Food, Beverage & Tobacco)(b) | | | 806,920 | |
| | 118,879 | | | J Sainsbury plc (Food & Staples Retailing) | | | 295,414 | |
| | 851,727 | | | Legal & General Group plc (Insurance)(b) | | | 2,918,030 | |
| | 91,034 | | | Marks & Spencer Group plc (Retailing) | | | 243,399 | |
| | 1,016 | | | Next plc (Retailing)(b) | | | 71,147 | |
| | 110,948 | | | Persimmon plc (Consumer Durables & Apparel)(b) | | | 2,818,630 | |
| | 1,916 | | | Reckitt Benckiser Group plc (Household & Personal Products)(b) | | | 151,277 | |
| | 27,421 | | | Royal Mail plc (Transportation) | | | 73,791 | |
| | 67,126 | | | Segro plc (REIT) | | | 623,232 | |
| | 63,726 | | | SSE plc (Utilities) | | | 908,309 | |
| | 65,223 | | | Unilever NV CVA (Household & Personal Products) | | | 3,962,831 | |
| | 57,354 | | | Unilever plc ADR (Household & Personal Products)(b) | | | 3,554,227 | |
| | 61,537 | | | Wm Morrison Supermarkets plc (Food & Staples Retailing) | | | 157,514 | |
| | | | | | | | |
| | | | | | | 40,686,063 | |
| | |
| | TOTAL COMMON STOCKS | |
| | (Cost $312,366,906) | | $ | 309,540,134 | |
| | |
| | | | | | | | | | | | |
| Units | | | Description | | Expiration
Month | | | Value | |
| |
| Right*(b) – 0.0% | | | | |
| Spain – 0.0% | | | | |
| | 3,302 | | | ACS Actividades
de Construccion
y Servicios SA
(Capital Goods) | | | 07/2019 | | | $ | 5,182 | |
| | (Cost $5,509) | | | | | |
| | |
| TOTAL INVESTMENTS BEFORE SECURITIES
LENDING REINVESTMENT VEHICLE |
|
| | (Cost $312,372,415) | | | $ | 309,545,316 | |
| | |
| | | | | | | | |
| Shares | | | Dividend Rate | | Value | |
|
| Securities Lending Reinvestment Vehicle(f) – 0.3% | |
| Goldman Sachs Financial Square Government Fund –
Institutional Shares |
|
| | 801,360 | | | 2.308% | | $ | 801,360 | |
| | (Cost $801,360) | |
| | |
| | TOTAL INVESTMENTS – 99.9% | |
| | (Cost $313,173,775) | | $ | 310,346,676 | |
| | |
| OTHER ASSETS IN EXCESS OF
LIABILITIES – 0.1% | | | 397,384 | |
| | |
| | NET ASSETS – 100.0% | | $ | 310,744,060 | |
| | |
| | |
|
| The percentage shown for each investment category reflects the value of investments in that category as a percentage of net assets. |
| |
* | | Non-income producing security. |
| |
(a) | | All or a portion of security is segregated as collateral for initial margin requirements on futures transactions. |
| |
(b) | | All or a portion of security is segregated as collateral for call options written. |
| |
(c) | | All or a portion of security is on loan. |
| |
(d) | | Preference Shares are a special type of equity investment that shares in the earnings of the company, has limited voting rights, and receives a greater dividend than applicable Common Shares. |
| |
(e) | | Exempt from registration under Rule 144A of the Securities Act of 1933. |
| |
(f) | | Represents an Affiliated Issuer. |
| | |
|
Investment Abbreviations: |
ADR | | —American Depositary Receipt |
CVA | | —Dutch Certification |
FDR | | —Fiduciary Depositary Receipt |
REIT | | —Real Estate Investment Trust |
|
Currency Abbreviations: |
EUR | | —Euro |
GBP | | —British Pound |
JPY | | —Japanese Yen |
|
| | |
| 36 | | The accompanying notes are an integral part of these financial statements. |
GOLDMAN SACHS INTERNATIONAL EQUITY DIVIDEND AND PREMIUM FUND
|
| ADDITIONAL INVESTMENT INFORMATION |
FUTURES CONTRACTS — At June 30, 2019, the Fund had the following futures contracts:
| | | | | | | | | | | | | | | | |
| Description | | Number of
Contracts | | | Expiration
Date | | | Notional
Amount | | | Unrealized
Appreciation/
(Depreciation) | |
Long position contracts: | | | | | | | | | | | | | | | | |
EURO STOXX 50 Index | | | 34 | | | | 09/20/2019 | | | $ | 1,340,004 | | | $ | 36,362 | |
FTSE 100 Index | | | 7 | | | | 09/20/2019 | | | | 655,079 | | | | 7,967 | |
MSCI Singapore Index | | | 2 | | | | 07/30/2019 | | | | 55,898 | | | | 492 | |
SPI 200 Index | | | 2 | | | | 09/19/2019 | | | | 230,237 | | | | 2,900 | |
TOPIX Index | | | 4 | | | | 09/12/2019 | | | | 575,430 | | | | 1,806 | |
| | | | |
| Total Futures Contracts | | | | | | | | | | | | | | $ | 49,527 | |
WRITTEN OPTIONS CONTRACTS — At June 30, 2019, the Fund had the following written options contracts:
| | | | | | | | | | | | | | | | | | | | | | | | | | | | | | |
| Description | | Counterparty | | Exercise
Price | | | Expiration
Date | | | Number of
Contracts | | | Notional
Amount | | | Value | | | Premiums Paid
(Received) by
the Fund | | | Unrealized
Appreciation/
Depreciation | |
Written options contracts: | | | | | | | | | | | | | | | | | | | | | | | | | |
Calls | | | | | | | | | | | | | | | | | | | | | | | | | | | | | | |
EURO STOXX 50 Index | | Morgan Stanley Co., Inc. | | | 3,500 EUR | | | | 09/20/2019 | | | | 1,604 | | | $ | (55,717,988 | ) | | $ | (1,216,547 | ) | | $ | (1,234,293 | ) | | $ | 17,746 | |
FTSE 100 Index | | | | | 7,425 GBP | | | | 09/20/2019 | | | | 244 | | | | (18,118,537 | ) | | | (381,137 | ) | | | (403,867 | ) | | | 22,730 | |
Nikkei 225 Index | | | | | 21,250 JPY | | | | 09/13/2019 | | | | 174 | | | | (3,702,010,080 | ) | | | (952,187 | ) | | | (818,926 | ) | | | (133,261 | ) |
| | | | | | |
| Total written options contracts | | | | | | | | 2,022 | | | | | | | $ | (2,549,871 | ) | | $ | (2,457,086 | ) | | $ | (92,785 | ) |
| | |
| The accompanying notes are an integral part of these financial statements. | | 37 |
GOLDMAN SACHS U.S. TAX-MANAGED EQUITY FUND
Schedule of Investments
June 30, 2019 (Unaudited)
| | | | | | | | |
| Shares | | | Description | |
Value | |
|
| Common Stocks – 98.7% | |
| Automobiles & Components – 1.3% | |
| | 549,440 | | | General Motors Co. | | $ | 21,169,923 | |
| | 21,887 | | | Gentex Corp. | | | 538,639 | |
| | | | | | | | |
| | | | | | | 21,708,562 | |
| | |
| Banks – 6.9% | |
| | 8,543 | | | CenterState Bank Corp. | | | 196,745 | |
| | 8,614 | | | Central Pacific Financial Corp. | | | 258,076 | |
| | 4,680 | | | CIT Group, Inc. | | | 245,887 | |
| | 221,931 | | | Citigroup, Inc. | | | 15,541,828 | |
| | 466,911 | | | Citizens Financial Group, Inc. | | | 16,509,973 | |
| | 548,127 | | | Fifth Third Bancorp | | | 15,292,743 | |
| | 3,267 | | | First Citizens BancShares, Inc. Class A | | | 1,471,032 | |
| | 52,438 | | | JPMorgan Chase & Co. | | | 5,862,568 | |
| | 208,520 | | | KeyCorp | | | 3,701,230 | |
| | 20,792 | | | NMI Holdings, Inc. Class A* | | | 590,285 | |
| | 47,974 | | | PNC Financial Services Group, Inc. (The) | | | 6,585,871 | |
| | 184,396 | | | Popular, Inc. | | | 10,001,639 | |
| | 144,559 | | | Radian Group, Inc. | | | 3,303,173 | |
| | 357,210 | | | Regions Financial Corp. | | | 5,336,717 | |
| | 26,535 | | | Signature Bank | | | 3,206,490 | |
| | 40,347 | | | SVB Financial Group* | | | 9,061,533 | |
| | 245,978 | | | Synovus Financial Corp. | | | 8,609,230 | |
| | 118,239 | | | Western Alliance Bancorp* | | | 5,287,648 | |
| | 165,382 | | | Zions Bancorp NA | | | 7,604,264 | |
| | | | | | | | |
| | | | | | | 118,666,932 | |
| | |
| Capital Goods – 6.2% | |
| | 28,057 | | | AECOM* | | | 1,061,957 | |
| | 27,444 | | | Aerojet Rocketdyne Holdings, Inc.* | | | 1,228,668 | |
| | 68,979 | | | Albany International Corp. Class A | | | 5,719,049 | |
| | 14,958 | | | Allison Transmission Holdings, Inc. | | | 693,303 | |
| | 33,469 | | | Boeing Co. (The) | | | 12,183,051 | |
| | 39,817 | | | Curtiss-Wright Corp. | | | 5,061,935 | |
| | 11,432 | | | Eaton Corp. plc | | | 952,057 | |
| | 44,355 | | | Fluor Corp. | | | 1,494,320 | |
| | 13,565 | | | Fortive Corp. | | | 1,105,819 | |
| | 4,388 | | | Franklin Electric Co., Inc. | | | 208,430 | |
| | 96,554 | | | Harris Corp. | | | 18,261,258 | |
| | 41,574 | | | HD Supply Holdings, Inc.* | | | 1,674,601 | |
| | 4,318 | | | HEICO Corp. | | | 577,792 | |
| | 9,481 | | | Honeywell International, Inc. | | | 1,655,288 | |
| | 8,012 | | | Hubbell, Inc. | | | 1,044,765 | |
| | 114,094 | | | Illinois Tool Works, Inc. | | | 17,206,516 | |
| | 186,237 | | | Johnson Controls International plc | | | 7,693,450 | |
| | 26,915 | | | Lockheed Martin Corp. | | | 9,784,679 | |
| | 17,861 | | | Parker-Hannifin Corp. | | | 3,036,549 | |
| | 64,168 | | | Raytheon Co. | | | 11,157,532 | |
| | 4,653 | | | United Rentals, Inc.* | | | 617,127 | |
| | 9,033 | | | WABCO Holdings, Inc.* | | | 1,197,776 | |
| | 23,184 | | | Watsco, Inc. | | | 3,791,279 | |
| | | | | | | | |
| | | | | | | 107,407,201 | |
| | |
| Commercial & Professional Services – 1.3% | |
| | 29,156 | | | Cintas Corp. | | | 6,918,427 | |
| | 7,506 | | | CoStar Group, Inc.* | | | 4,158,774 | |
| | |
|
| Common Stocks – (continued) | |
| Commercial & Professional Services – (continued) | |
| | 55,072 | | | Insperity, Inc. | | | 6,726,494 | |
| | 44,519 | | | ManpowerGroup, Inc. | | | 4,300,536 | |
| | | | | | | | |
| | | | | | | 22,104,231 | |
| | |
| Consumer Durables & Apparel – 1.3% | |
| | 8,617 | | | Columbia Sportswear Co. | | | 863,079 | |
| | 114,608 | | | NIKE, Inc. Class B | | | 9,621,341 | |
| | 1,156 | | | NVR, Inc.* | | | 3,896,009 | |
| | 69,688 | | | Ralph Lauren Corp. | | | 7,915,860 | |
| | | | | | | | |
| | | | | | | 22,296,289 | |
| | |
| Consumer Services – 4.5% | |
| | 45,624 | | | Carnival Corp. | | | 2,123,797 | |
| | 20,555 | | | Chipotle Mexican Grill, Inc.* | | | 15,064,348 | |
| | 46,795 | | | Domino’s Pizza, Inc. | | | 13,022,113 | |
| | 68,312 | | | Hilton Worldwide Holdings, Inc. | | | 6,676,815 | |
| | 165,230 | | | Starbucks Corp. | | | 13,851,231 | |
| | 127,797 | | | Wingstop, Inc. | | | 12,108,766 | |
| | 5,307 | | | Wyndham Destinations, Inc. | | | 232,977 | |
| | 5,307 | | | Wyndham Hotels & Resorts, Inc. | | | 295,812 | |
| | 87,531 | | | Yum China Holdings, Inc. | | | 4,043,932 | |
| | 87,531 | | | Yum! Brands, Inc. | | | 9,687,056 | |
| | | | | | | | |
| | | | | | | 77,106,847 | |
| | |
| Diversified Financials – 4.9% | |
| | 556,635 | | | Ally Financial, Inc. | | | 17,250,119 | |
| | 32,395 | | | Ameriprise Financial, Inc. | | | 4,702,458 | |
| | 38,603 | | | Berkshire Hathaway, Inc. Class B* | | | 8,229,001 | |
| | 4,505 | | | Capital One Financial Corp. | | | 408,784 | |
| | 137,041 | | | E*TRADE Financial Corp. | | | 6,112,029 | |
| | 13,256 | | | Morgan Stanley | | | 580,745 | |
| | 48,508 | | | MSCI, Inc. | | | 11,583,225 | |
| | 71,481 | | | Nasdaq, Inc. | | | 6,874,328 | |
| | 509,239 | | | Synchrony Financial | | | 17,655,316 | |
| | 213,353 | | | Voya Financial, Inc. | | | 11,798,421 | |
| | | | | | | | |
| | | | | | | 85,194,426 | |
| | |
| Energy – 3.9% | |
| | 17,542 | | | Arch Coal, Inc. Class A | | | 1,652,632 | |
| | 242,468 | | | ConocoPhillips | | | 14,790,548 | |
| | 7,731 | | | CVR Energy, Inc. | | | 386,473 | |
| | 18,267 | | | Diamondback Energy, Inc. | | | 1,990,555 | |
| | 20,740 | | | Exxon Mobil Corp. | | | 1,589,306 | |
| | 68,098 | | | Helmerich & Payne, Inc. | | | 3,447,121 | |
| | 142,607 | | | HollyFrontier Corp. | | | 6,599,852 | |
| | 158,635 | | | Marathon Oil Corp. | | | 2,254,203 | |
| | 86,778 | | | Occidental Petroleum Corp. | | | 4,363,198 | |
| | 30,354 | | | PBF Energy, Inc. Class A | | | 950,080 | |
| | 17,043 | | | TechnipFMC plc | | | 442,095 | |
| | 250,445 | | | Valero Energy Corp. | | | 21,440,596 | |
| | 247,662 | | | Williams Cos., Inc. (The) | | | 6,944,443 | |
| | | | | | | | |
| | | | | | | 66,851,102 | |
| | |
| Food & Staples Retailing – 0.4% | |
| | 340,406 | | | Kroger Co. (The) | | | 7,390,214 | |
| | |
| | |
| 38 | | The accompanying notes are an integral part of these financial statements. |
GOLDMAN SACHS U.S. TAX-MANAGED EQUITY FUND
| | | | | | | | |
| Shares | | | Description | |
Value | |
|
| Common Stocks – (continued) | |
| Food, Beverage & Tobacco – 2.7% | |
| | 11,625 | | | Coca-Cola European Partners plc | | $ | 656,812 | |
| | 107,558 | | | Freshpet, Inc.* | | | 4,894,965 | |
| | 57,396 | | | Lamb Weston Holdings, Inc. | | | 3,636,611 | |
| | 13,685 | | | Lancaster Colony Corp. | | | 2,033,591 | |
| | 26,959 | | | Mondelez International, Inc. Class A | | | 1,453,090 | |
| | 130,860 | | | Monster Beverage Corp.* | | | 8,352,794 | |
| | 148,510 | | | Philip Morris International, Inc. | | | 11,662,490 | |
| | 7,412 | | | Sanderson Farms, Inc. | | | 1,012,183 | |
| | 167,342 | | | Tyson Foods, Inc. Class A | | | 13,511,193 | |
| | | | | | | | |
| | | | | | | 47,213,729 | |
| | |
| Health Care Equipment & Services – 6.1% | |
| | 52,362 | | | Align Technology, Inc.* | | | 14,331,479 | |
| | 75,870 | | | Anthem, Inc. | | | 21,411,273 | |
| | 15,245 | | | Cardinal Health, Inc. | | | 718,040 | |
| | 42,333 | | | Cigna Corp. | | | 6,669,564 | |
| | 1,458 | | | HCA Healthcare, Inc. | | | 197,078 | |
| | 19,950 | | | Hill-Rom Holdings, Inc. | | | 2,087,169 | |
| | 35,490 | | | Humana, Inc. | | | 9,415,497 | |
| | 37,074 | | | IDEXX Laboratories, Inc.* | | | 10,207,584 | |
| | 98,100 | | | McKesson Corp. | | | 13,183,659 | |
| | 1,291 | | | Mesa Laboratories, Inc. | | | 315,443 | |
| | 76,038 | | | UnitedHealth Group, Inc. | | | 18,554,032 | |
| | 9,667 | | | Universal Health Services, Inc. Class B | | | 1,260,480 | |
| | 25,207 | | | WellCare Health Plans, Inc.* | | | 7,185,760 | |
| | | | | | | | |
| | | | | | | 105,537,058 | |
| | |
| Household & Personal Products – 0.7% | |
| | 160,190 | | | Colgate-Palmolive Co. | | | 11,480,818 | |
| | 8,185 | | | Procter & Gamble Co. (The) | | | 897,485 | |
| | | | | | | | |
| | | | | | | 12,378,303 | |
| | |
| Insurance – 4.3% | |
| | 124,496 | | | Argo Group International Holdings Ltd. | | | 9,218,929 | |
| | 36,331 | | | Athene Holding Ltd. Class A* | | | 1,564,413 | |
| | 98,971 | | | Lincoln National Corp. | | | 6,378,681 | |
| | 17,026 | | | Marsh & McLennan Cos., Inc. | | | 1,698,343 | |
| | 24,073 | | | Mercury General Corp. | | | 1,504,563 | |
| | 11,862 | | | Old Republic International Corp. | | | 265,472 | |
| | 198,232 | | | Progressive Corp. (The) | | | 15,844,684 | |
| | 28,050 | | | Prudential Financial, Inc. | | | 2,833,050 | |
| | 107,660 | | | Reinsurance Group of America, Inc. | | | 16,798,190 | |
| | 52,724 | | | Travelers Cos., Inc. (The) | | | 7,883,292 | |
| | 142,586 | | | Unum Group | | | 4,783,760 | |
| | 5,529 | | | White Mountains Insurance Group Ltd. | | | 5,647,652 | |
| | | | | | | | |
| | | | | | | 74,421,029 | |
| | |
| Materials – 1.2% | |
| | 1,072 | | | Air Products & Chemicals, Inc. | | | 242,669 | |
| | 36,943 | | | Berry Global Group, Inc.* | | | 1,942,832 | |
| | 12,663 | | | Celanese Corp. | | | 1,365,072 | |
| | 16,812 | | | Domtar Corp. | | | 748,638 | |
| | 14,002 | | | Sealed Air Corp. | | | 599,006 | |
| | |
|
| Common Stocks – (continued) | |
| Materials – (continued) | |
| | 27,445 | | | Sherwin-Williams Co. (The) | | | 12,577,769 | |
| | 151,219 | | | Warrior Met Coal, Inc. | | | 3,949,840 | |
| | | | | | | | |
| | | | | | | 21,425,826 | |
| | |
| Media & Entertainment – 5.9% | |
| | 17,973 | | | Alphabet, Inc. Class A* | | | 19,461,164 | |
| | 17,039 | | | Alphabet, Inc. Class C* | | | 18,417,626 | |
| | 94,443 | | | Comcast Corp. Class A | | | 3,993,050 | |
| | 138,810 | | | Facebook, Inc. Class A* | | | 26,790,330 | |
| | 20,711 | | | Match Group, Inc. | | | 1,393,229 | |
| | 20,176 | | | Netflix, Inc.* | | | 7,411,048 | |
| | 132,657 | | | Nexstar Media Group, Inc. Class A | | | 13,398,357 | |
| | 182,201 | | | Sinclair Broadcast Group, Inc. Class A | | | 9,771,440 | |
| | 4,419 | | | Twitter, Inc.* | | | 154,223 | |
| | | | | | | | |
| | | | | | | 100,790,467 | |
| | |
| Pharmaceuticals, Biotechnology & Life Sciences – 6.6% | |
| | 77,032 | | | AbbVie, Inc. | | | 5,601,767 | |
| | 123,755 | | | Alexion Pharmaceuticals, Inc.* | | | 16,209,430 | |
| | 69,013 | | | Amgen, Inc. | | | 12,717,716 | |
| | 46,866 | | | Biogen, Inc.* | | | 10,960,551 | |
| | 77,057 | | | Bristol-Myers Squibb Co. | | | 3,494,535 | |
| | 22,484 | | | Genomic Health, Inc.* | | | 1,307,894 | |
| | 236,309 | | | Gilead Sciences, Inc. | | | 15,965,036 | |
| | 55,829 | | | Incyte Corp.* | | | 4,743,232 | |
| | 4,786 | | | IQVIA Holdings, Inc.* | | | 770,067 | |
| | 101,303 | | | Johnson & Johnson | | | 14,109,482 | |
| | 26,154 | | | Merck & Co., Inc. | | | 2,193,013 | |
| | 279,257 | | | Pfizer, Inc. | | | 12,097,413 | |
| | 11,659 | | | Repligen Corp.* | | | 1,002,091 | |
| | 3,494 | | | Thermo Fisher Scientific, Inc. | | | 1,026,118 | |
| | 66,452 | | | Vertex Pharmaceuticals, Inc.* | | | 12,185,968 | |
| | | | | | | | |
| | | | | | | 114,384,313 | |
| | |
| Real Estate – 4.7% | |
| | 88,800 | | | American Tower Corp. (REIT) | | | 18,155,160 | |
| | 15,149 | | | Apartment Investment & Management Co. Class A (REIT) | | | 759,268 | |
| | 113,236 | | | Camden Property Trust (REIT) | | | 11,820,706 | |
| | 12,080 | | | CBRE Group, Inc. Class A* | | | 619,704 | |
| | 18,849 | | | CoreSite Realty Corp. (REIT) | | | 2,170,839 | |
| | 4,262 | | | Digital Realty Trust, Inc. (REIT) | | | 502,021 | |
| | 42,484 | | | Douglas Emmett, Inc. (REIT) | | | 1,692,563 | |
| | 257,053 | | | Duke Realty Corp. (REIT) | | | 8,125,445 | |
| | 39,468 | | | Equity LifeStyle Properties, Inc. (REIT) | | | 4,789,047 | |
| | 130,009 | | | First Industrial Realty Trust, Inc. (REIT) | | | 4,776,531 | |
| | 72,247 | | | Host Hotels & Resorts, Inc. (REIT) | | | 1,316,340 | |
| | 126,488 | | | Kimco Realty Corp. (REIT) | | | 2,337,498 | |
| | 6,000 | | | Lamar Advertising Co. Class A (REIT) | | | 484,260 | |
| | 95,996 | | | Prologis, Inc. (REIT) | | | 7,689,280 | |
| | 1,888 | | | PS Business Parks, Inc. (REIT) | | | 318,185 | |
| | 320,737 | | | Rexford Industrial Realty, Inc. (REIT) | | | 12,948,391 | |
| | 68,437 | | | STORE Capital Corp. (REIT) | | | 2,271,455 | |
| | |
| | |
| The accompanying notes are an integral part of these financial statements. | | 39 |
GOLDMAN SACHS U.S. TAX-MANAGED EQUITY FUND
Schedule of Investments(continued)
June 30, 2019 (Unaudited)
| | | | | | | | |
| Shares | | | Description | |
Value | |
|
| Common Stocks – (continued) | |
| Real Estate – (continued) | |
| | 14,722 | | | Terreno Realty Corp. (REIT) | | $ | 721,967 | |
| | | | | | | | |
| | | | | | | 81,498,660 | |
| | |
| Retailing – 6.4% | |
| | 24,516 | | | Amazon.com, Inc.* | | | 46,424,233 | |
| | 6,539 | | | AutoZone, Inc.* | | | 7,189,434 | |
| | 2,356 | | | Booking Holdings, Inc.* | | | 4,416,817 | |
| | 202,246 | | | eBay, Inc. | | | 7,988,717 | |
| | 3,786 | | | Expedia Group, Inc. | | | 503,652 | |
| | 108,585 | | | Lowe’s Cos., Inc. | | | 10,957,312 | |
| | 1,541 | | | MercadoLibre, Inc.* | | | 942,737 | |
| | 31,865 | | | O’Reilly Automotive, Inc.* | | | 11,768,382 | |
| | 227,000 | | | Target Corp. | | | 19,660,470 | |
| | | | | | | | |
| | | | | | | 109,851,754 | |
| | |
| Semiconductors & Semiconductor Equipment – 3.6% | |
| | 340,111 | | | Applied Materials, Inc. | | | 15,274,385 | |
| | 75,302 | | | Cree, Inc.* | | | 4,230,466 | |
| | 46,951 | | | Inphi Corp.* | | | 2,352,245 | |
| | 31,784 | | | Intel Corp. | | | 1,521,500 | |
| | 37,989 | | | KLA-Tencor Corp. | | | 4,490,300 | |
| | 7,332 | | | Kulicke & Soffa Industries, Inc. | | | 165,337 | |
| | 15,650 | | | Lam Research Corp. | | | 2,939,696 | |
| | 52,273 | | | Maxim Integrated Products, Inc. | | | 3,126,971 | |
| | 137,479 | | | NXP Semiconductors NV | | | 13,419,325 | |
| | 96,874 | | | ON Semiconductor Corp.* | | | 1,957,824 | |
| | 100,492 | | | Teradyne, Inc. | | | 4,814,572 | |
| | 63,128 | | | Texas Instruments, Inc. | | | 7,244,569 | |
| | | | | | | | |
| | | | | | | 61,537,190 | |
| | |
| Software & Services – 12.5% | |
| | 44,829 | | | Adobe, Inc.* | | | 13,208,865 | |
| | 18,021 | | | Black Knight, Inc.* | | | 1,083,963 | |
| | 31,401 | | | Cadence Design Systems, Inc.* | | | 2,223,505 | |
| | 96,260 | | | Citrix Systems, Inc. | | | 9,446,956 | |
| | 68,560 | | | Cornerstone OnDemand, Inc.* | | | 3,971,681 | |
| | 5,074 | | | EPAM Systems, Inc.* | | | 878,309 | |
| | 79,080 | | | Fortinet, Inc.* | | | 6,075,716 | |
| | 17,179 | | | GoDaddy, Inc. Class A* | | | 1,205,107 | |
| | 51,327 | | | HubSpot, Inc.* | | | 8,752,280 | |
| | 6,626 | | | Intuit, Inc. | | | 1,731,573 | |
| | 71,085 | | | Leidos Holdings, Inc. | | | 5,676,137 | |
| | 27,259 | | | Mastercard, Inc. Class A | | | 7,210,823 | |
| | 339,794 | | | Microsoft Corp. | | | 45,518,804 | |
| | 212,943 | | | Oracle Corp. | | | 12,131,363 | |
| | 35,788 | | | Palo Alto Networks, Inc.* | | | 7,292,163 | |
| | 222,554 | | | PayPal Holdings, Inc.* | | | 25,473,531 | |
| | 71,300 | | | ServiceNow, Inc.* | | | 19,576,841 | |
| | 14,006 | | | Smartsheet, Inc. Class A* | | | 677,890 | |
| | 14,421 | | | Synopsys, Inc.* | | | 1,855,839 | |
| | 36,907 | | | Teradata Corp.* | | | 1,323,116 | |
| | 31,837 | | | VeriSign, Inc.* | | | 6,659,027 | |
| | 189,026 | | | Visa, Inc. Class A | | | 32,805,462 | |
| | | | | | | | |
| | | | | | | 214,778,951 | |
| | |
| Technology Hardware & Equipment – 5.2% | |
| | 16,391 | | | Acacia Communications, Inc.* | | | 773,000 | |
| | 311,602 | | | Apple, Inc. | | | 61,672,268 | |
| | |
|
| Common Stocks – (continued) | |
| Technology Hardware & Equipment – (continued) | |
| | 10,463 | | | CDW Corp. | | | 1,161,393 | |
| | 158,887 | | | Jabil, Inc. | | | 5,020,829 | |
| | 169,190 | | | Keysight Technologies, Inc.* | | | 15,194,954 | |
| | 9,352 | | | Motorola Solutions, Inc. | | | 1,559,259 | |
| | 29,331 | | | National Instruments Corp. | | | 1,231,609 | |
| | 42,942 | | | NetApp, Inc. | | | 2,649,521 | |
| | | | | | | | |
| | | | | | | 89,262,833 | |
| | |
| Telecommunication Services – 0.7% | |
| | 34,825 | | | AT&T, Inc. | | | 1,166,986 | |
| | 167,581 | | | Cogent Communications Holdings, Inc. | | | 9,947,608 | |
| | 3,466 | | | Telephone & Data Systems, Inc. | | | 105,366 | |
| | | | | | | | |
| | | | | | | 11,219,960 | |
| | |
| Transportation – 2.7% | |
| | 24,642 | | | Alaska Air Group, Inc. | | | 1,574,870 | |
| | 31,353 | | | CSX Corp. | | | 2,425,782 | |
| | 69,991 | | | Delta Air Lines, Inc. | | | 3,971,989 | |
| | 31,470 | | | Norfolk Southern Corp. | | | 6,272,915 | |
| | 148,567 | | | Southwest Airlines Co. | | | 7,544,233 | |
| | 144,393 | | | Union Pacific Corp. | | | 24,418,300 | |
| | | | | | | | |
| | | | | | | 46,208,089 | |
| | |
| Utilities – 4.7% | |
| | 274,270 | | | AES Corp. | | | 4,596,765 | |
| | 141,003 | | | Ameren Corp. | | | 10,590,736 | |
| | 142,614 | | | American Electric Power Co., Inc. | | | 12,551,458 | |
| | 9,873 | | | American Water Works Co., Inc. | | | 1,145,268 | |
| | 46,810 | | | CMS Energy Corp. | | | 2,710,767 | |
| | 28,282 | | | DTE Energy Co. | | | 3,616,702 | |
| | 232,096 | | | Exelon Corp. | | | 11,126,682 | |
| | 278,733 | | | FirstEnergy Corp. | | | 11,932,560 | |
| | 249,061 | | | NRG Energy, Inc. | | | 8,747,022 | |
| | 441,944 | | | PPL Corp. | | | 13,704,684 | |
| | | | | | | | |
| | | | | | | 80,722,644 | |
| | |
| | TOTAL COMMON STOCKS | |
| | (Cost $1,185,245,289) | | $ | 1,699,956,610 | |
| | |
| | | | | | | | |
| Shares | | | Dividend
Rate | | Value | |
|
| Investment Company(a)– 0.0% | |
| Goldman Sachs Financial Square Government Fund –
Institutional Shares |
|
| | 61,302 | | | 2.308% | | $ | 61,302 | |
| | (Cost $61,302) | |
| | |
| | TOTAL INVESTMENTS – 98.7% | |
| | (Cost $1,185,306,591) | | $ | 1,700,017,912 | |
| | |
| OTHER ASSETS IN EXCESS OF
LIABILITIES – 1.3% | | | 21,803,901 | |
| | |
| | NET ASSETS – 100.0% | | $ | 1,721,821,813 | |
| | |
| | |
| 40 | | The accompanying notes are an integral part of these financial statements. |
GOLDMAN SACHS U.S. TAX-MANAGED EQUITY FUND
| | |
|
| The percentage shown for each investment category reflects the value of investments in that category as a percentage of net assets. |
| |
* | | Non-income producing security. |
| |
(a) | | Represents an Affiliated Issuer. |
| | |
|
Investment Abbreviation: |
REIT | | —Real Estate Investment Trust |
|
| | |
| The accompanying notes are an integral part of these financial statements. | | 41 |
GOLDMAN SACHS INTERNATIONAL TAX-MANAGED EQUITY FUND
Schedule of Investments
June 30, 2019 (Unaudited)
| | | | | | | | |
| Shares | | | Description | | Value | |
|
| Common Stocks – 98.1% | |
| Australia – 7.3% | |
| | 175,329 | | | Altium Ltd. (Software & Services) | | $ | 4,232,311 | |
| | 95,082 | | | ASX Ltd. (Diversified Financials) | | | 5,508,764 | |
| | 728,504 | | | Aurelia Metals Ltd. (Materials)* | | | 253,533 | |
| | 192,754 | | | Aurizon Holdings Ltd. (Transportation) | | | 731,727 | |
| | 370,752 | | | Australia & New Zealand Banking Group Ltd. (Banks) | | | 7,359,184 | |
| | 234,052 | | | BHP Group plc (Materials) | | | 5,985,732 | |
| | 786,623 | | | Boral Ltd. (Materials) | | | 2,836,888 | |
| | 31,971 | | | CIMIC Group Ltd. (Capital Goods) | | | 1,005,343 | |
| | 745,439 | | | Coca-Cola Amatil Ltd. (Food, Beverage & Tobacco) | | | 5,351,523 | |
| | 11,099 | | | Cochlear Ltd. (Health Care Equipment & Services) | | | 1,615,969 | |
| | 5,806 | | | Commonwealth Bank of Australia (Banks) | | | 337,686 | |
| | 115,043 | | | Magellan Financial Group Ltd. (Diversified Financials) | | | 4,130,106 | |
| | 131,249 | | | Mount Gibson Iron Ltd. (Materials) | | | 94,279 | |
| | 7,113 | | | Pro Medicus Ltd. (Health Care Equipment & Services) | | | 126,721 | |
| | 65,637 | | | QBE Insurance Group Ltd. (Insurance) | | | 546,045 | |
| | 84,701 | | | Regis Resources Ltd. (Materials) | | | 314,517 | |
| | 37,044 | | | Rio Tinto Ltd. (Materials) | | | 2,712,556 | |
| | 41,483 | | | Rio Tinto plc ADR (Materials) | | | 2,586,050 | |
| | 41,674 | | | Sonic Healthcare Ltd. (Health Care Equipment & Services) | | | 794,055 | |
| | 524,887 | | | South32 Ltd. (Materials) | | | 1,176,608 | |
| | 219,699 | | | Woodside Petroleum Ltd. (Energy) | | | 5,634,964 | |
| | | | | | | | |
| | | | | | | 53,334,561 | |
| | |
| Austria – 0.3% | |
| | 11,915 | | | OMV AG (Energy) | | | 580,793 | |
| | 60,116 | | | UNIQA Insurance Group AG (Insurance) | | | 560,193 | |
| | 40,977 | | | Wienerberger AG (Materials) | | | 1,011,110 | |
| | | | | | | | |
| | | | | | | 2,152,096 | |
| | |
| Belgium – 2.0% | |
| | 47,872 | | | Ageas (Insurance) | | | 2,491,275 | |
| | 6,195 | | | Cofinimmo SA (REIT) | | | 804,463 | |
| | 80,847 | | | KBC Group NV (Banks) | | | 5,305,610 | |
| | 61,353 | | | UCB SA (Pharmaceuticals, Biotechnology & Life Sciences) | | | 5,091,662 | |
| | 6,998 | | | Warehouses De Pauw CVA (REIT) | | | 1,177,699 | |
| | | | | | | | |
| | | | | | | 14,870,709 | |
| | |
| China – 0.3% | |
| | 139,000 | | | China Mengniu Dairy Co. Ltd. (Food, Beverage & Tobacco)* | | | 538,920 | |
| | 269,000 | | | CITIC Telecom International Holdings Ltd. (Telecommunication Services) | | | 106,667 | |
| | 842,500 | | | Fosun International Ltd. (Capital Goods) | | | 1,121,714 | |
| | 584,000 | | | Towngas China Co. Ltd. (Utilities)* | | | 420,693 | |
| | | | | | | | |
| | | | | | | 2,187,994 | |
| | |
|
| Common Stocks – (continued) | |
| Denmark – 3.3% | |
| | 40,318 | | | Carlsberg A/S Class B (Food, Beverage & Tobacco) | | | 5,350,089 | |
| | 97,964 | | | GN Store Nord A/S (Health Care Equipment & Services) | | | 4,579,573 | |
| | 183,617 | | | Novo Nordisk A/S Class B (Pharmaceuticals, Biotechnology & Life Sciences) | | | 9,378,643 | |
| | 21,191 | | | Pandora A/S (Consumer Durables & Apparel) | | | 753,806 | |
| | 14,927 | | | Royal Unibrew A/S (Food, Beverage & Tobacco) | | | 1,091,249 | |
| | 19,041 | | | SimCorp A/S (Software & Services) | | | 1,843,209 | |
| | 16,695 | | | Vestas Wind Systems A/S (Capital Goods) | | | 1,446,350 | |
| | | | | | | | |
| | | | | | | 24,442,919 | |
| | |
| Finland – 0.6% | |
| | 22,170 | | | Kone OYJ Class B (Capital Goods) | | | 1,309,212 | |
| | 30,668 | | | Neste OYJ (Energy) | | | 1,042,634 | |
| | 74,978 | | | Valmet OYJ (Capital Goods) | | | 1,870,501 | |
| | | | | | | | |
| | | | | | | 4,222,347 | |
| | |
| France – 10.9% | |
| | 58,482 | | | Air Liquide SA (Materials) | | | 8,179,783 | |
| | 143,929 | | | BNP Paribas SA (Banks) | | | 6,822,996 | |
| | 56,942 | | | Bureau Veritas SA (Commercial & Professional Services) | | | 1,405,490 | |
| | 8,411 | | | Christian Dior SE (Consumer Durables & Apparel) | | | 4,410,864 | |
| | 16,766 | | | Coface SA (Insurance) | | | 169,107 | |
| | 186 | | | Dassault Aviation SA (Capital Goods) | | | 267,337 | |
| | 32,401 | | | Dassault Systemes SE (Software & Services) | | | 5,168,131 | |
| | 25,843 | | | Eiffage SA (Capital Goods) | | | 2,554,051 | |
| | 10,583 | | | Gaztransport Et Technigaz SA (Energy) | | | 1,061,598 | |
| | 12,906 | | | Gecina SA (REIT) | | | 1,931,284 | |
| | 18,669 | | | Ipsen SA (Pharmaceuticals, Biotechnology & Life Sciences) | | | 2,546,372 | |
| | 11,771 | | | Kering SA (Consumer Durables & Apparel) | | | 6,947,515 | |
| | 46,572 | | | Lagardere SCA (Media & Entertainment) | | | 1,213,335 | |
| | 31,651 | | | Legrand SA (Capital Goods) | | | 2,313,967 | |
| | 12,021 | | | Pernod Ricard SA (Food, Beverage & Tobacco) | | | 2,213,985 | |
| | 211,700 | | | Peugeot SA (Automobiles & Components) | | | 5,210,459 | |
| | 52,812 | | | Publicis Groupe SA (Media & Entertainment) | | | 2,787,461 | |
| | 8,696 | | | Safran SA (Capital Goods) | | | 1,272,153 | |
| | 24,725 | | | Sartorius Stedim Biotech (Pharmaceuticals, Biotechnology & Life Sciences) | | | 3,898,715 | |
| | 90,352 | | | Schneider Electric SE (Capital Goods) | | | 8,175,309 | |
| | 103,953 | | | SCOR SE (Insurance) | | | 4,557,177 | |
| | 105,676 | | | Societe Generale SA (Banks) | | | 2,667,198 | |
| | |
| | |
| 42 | | The accompanying notes are an integral part of these financial statements. |
GOLDMAN SACHS INTERNATIONAL TAX-MANAGED EQUITY FUND
| | | | | | | | |
| Shares | | | Description | | Value | |
|
| Common Stocks – (continued) | |
| France – (continued) | |
| | 18,406 | | | Teleperformance (Commercial & Professional Services) | | $ | 3,687,771 | |
| | | | | | | | |
| | | | | | | 79,462,058 | |
| | |
| Germany – 6.9% | |
| | 27,180 | | | Aareal Bank AG (Banks) | | | 716,022 | |
| | 28,571 | | | adidas AG (Consumer Durables & Apparel) | | | 8,839,013 | |
| | 10,586 | | | alstria office REIT-AG (REIT) | | | 171,412 | |
| | 2,545 | | | CANCOM SE (Software & Services) | | | 135,085 | |
| | 3,046 | | | CompuGroup Medical SE (Health Care Equipment & Services) | | | 245,999 | |
| | 7,838 | | | Covestro AG (Materials)(a) | | | 399,029 | |
| | 24,483 | | | Deutsche Boerse AG (Diversified Financials) | | | 3,456,264 | |
| | 60,029 | | | Deutsche Pfandbriefbank AG (Banks)(a) | | | 722,821 | |
| | 110,997 | | | Deutsche Post AG (Registered) (Transportation) | | | 3,651,448 | |
| | 512,394 | | | E.ON SE (Utilities) | | | 5,559,535 | |
| | 159,947 | | | Evotec SE (Pharmaceuticals, Biotechnology & Life Sciences)* | | | 4,478,147 | |
| | 13,879 | | | GEA Group AG (Capital Goods) | | | 393,895 | |
| | 13,490 | | | HOCHTIEF AG (Capital Goods) | | | 1,642,858 | |
| | 2,442 | | | HUGO BOSS AG (Consumer Durables & Apparel) | | | 162,749 | |
| | 29,163 | | | Merck KGaA (Pharmaceuticals, Biotechnology & Life Sciences) | | | 3,046,113 | |
| | 68,217 | | | Nemetschek SE (Software & Services) | | | 4,109,589 | |
| | 66,422 | | | ProSiebenSat.1 Media SE (Media & Entertainment) | | | 1,040,538 | |
| | 8,862 | | | RIB Software SE (Software & Services) | | | 182,018 | |
| | 33,110 | | | Siemens AG (Registered) (Capital Goods) | | | 3,941,922 | |
| | 20,287 | | | Siltronic AG (Semiconductors & Semiconductor Equipment) | | | 1,474,203 | |
| | 3,881 | | | Talanx AG (Insurance) | | | 168,180 | |
| | 12,484 | | | TLG Immobilien AG (Real Estate) | | | 365,536 | |
| | 31,875 | | | Wirecard AG (Software & Services) | | | 5,381,020 | |
| | | | | | | | |
| | | | | | | 50,283,396 | |
| | |
| Hong Kong – 5.8% | |
| | 1,075,600 | | | AIA Group Ltd. (Insurance) | | | 11,615,330 | |
| | 311,000 | | | Cathay Pacific Airways Ltd. (Transportation) | | | 464,774 | |
| | 705,000 | | | CK Asset Holdings Ltd. (Real Estate) | | | 5,523,025 | |
| | 589,000 | | | CK Hutchison Holdings Ltd. (Capital Goods) | | | 5,809,748 | |
| | 304,500 | | | CLP Holdings Ltd. (Utilities) | | | 3,355,529 | |
| | 186,284 | | | Hong Kong Exchanges & Clearing Ltd. (Diversified Financials) | | | 6,583,294 | |
| | 310,500 | | | Kerry Properties Ltd. (Real Estate) | | | 1,304,261 | |
| | 268,500 | | | Link REIT (REIT) | | | 3,304,004 | |
| | 243,000 | | | NWS Holdings Ltd. (Capital Goods) | | | 499,795 | |
| | |
|
| Common Stocks – (continued) | |
| Hong Kong – (continued) | |
| | 52,000 | | | Road King Infrastructure Ltd. (Real Estate) | | | 107,321 | |
| | 352,500 | | | Swire Pacific Ltd. Class B (Real Estate) | | | 668,648 | |
| | 281,800 | | | Swire Properties Ltd. (Real Estate) | | | 1,139,238 | |
| | 865,500 | | | Yue Yuen Industrial Holdings Ltd. (Consumer Durables & Apparel) | | | 2,373,912 | |
| | | | | | | | |
| | | | | | | 42,748,879 | |
| | |
| Ireland – 0.1% | |
| | 190,005 | | | C&C Group plc (Food, Beverage & Tobacco) | | | 844,774 | |
| | |
| Israel – 0.0% | |
| | 54,990 | | | Plus500 Ltd. (Diversified Financials) | | | 363,888 | |
| | |
| Italy – 2.8% | |
| | 11,518 | | | Banca Generali SpA (Diversified Financials) | | | 331,656 | |
| | 122,889 | | | Davide Campari-Milano SpA (Food, Beverage & Tobacco) | | | 1,203,901 | |
| | 21,828 | | | DiaSorin SpA (Health Care Equipment & Services) | | | 2,535,820 | |
| | 457,215 | | | Enel SpA (Utilities) | | | 3,189,417 | |
| | 335,638 | | | Leonardo SpA (Capital Goods) | | | 4,258,082 | |
| | 466,036 | | | Mediobanca Banca di Credito Finanziario SpA (Banks) | | | 4,805,670 | |
| | 43,738 | | | Moncler SpA (Consumer Durables & Apparel) | | | 1,874,670 | |
| | 158,043 | | | UniCredit SpA (Banks) | | | 1,945,325 | |
| | | | | | | | |
| | | | | | | 20,144,541 | |
| | |
| Japan – 22.6% | |
| | 76,600 | | | AEON Financial Service Co. Ltd. (Diversified Financials) | | | 1,236,313 | |
| | 286,500 | | | Ajinomoto Co., Inc. (Food, Beverage & Tobacco) | | | 4,970,417 | |
| | 221,100 | | | Amada Holdings Co. Ltd. (Capital Goods) | | | 2,499,145 | |
| | 388,800 | | | Astellas Pharma, Inc. (Pharmaceuticals, Biotechnology & Life Sciences) | | | 5,540,698 | |
| | 130,200 | | | Benesse Holdings, Inc. (Consumer Services) | | | 3,038,526 | |
| | 29,400 | | | Central Japan Railway Co. (Transportation) | | | 5,894,936 | |
| | 119,100 | | | Chubu Electric Power Co., Inc. (Utilities) | | | 1,673,038 | |
| | 2,200 | | | CyberAgent, Inc. (Media & Entertainment) | | | 80,173 | |
| | 19,500 | | | Daicel Corp. (Materials) | | | 173,783 | |
| | 183,300 | | | Daiwa House Industry Co. Ltd. (Real Estate) | | | 5,356,158 | |
| | 33,800 | | | Denso Corp. (Automobiles & Components) | | | 1,425,214 | |
| | 62,100 | | | East Japan Railway Co. (Transportation) | | | 5,815,279 | |
| | 7,600 | | | Electric Power Development Co. Ltd. (Utilities) | | | 172,947 | |
| | |
| | |
| The accompanying notes are an integral part of these financial statements. | | 43 |
GOLDMAN SACHS INTERNATIONAL TAX-MANAGED EQUITY FUND
Schedule of Investments(continued)
June 30, 2019 (Unaudited)
| | | | | | | | |
| Shares | | | Description | | Value | |
|
| Common Stocks – (continued) | |
| Japan – (continued) | |
| | 4,800 | | | Fuji Oil Holdings, Inc. (Food, Beverage & Tobacco) | | $ | 144,796 | |
| | 71,300 | | | Fujitsu Ltd. (Software & Services) | | | 4,982,892 | |
| | 10,800 | | | Hankyu Hanshin Holdings, Inc. (Transportation) | | | 387,529 | |
| | 190,600 | | | Hitachi Ltd. (Technology Hardware & Equipment) | | | 7,012,691 | |
| | 410,500 | | | Hulic Co. Ltd. (Real Estate) | | | 3,304,825 | |
| | 70,500 | | | IHI Corp. (Capital Goods) | | | 1,704,346 | |
| | 52,300 | | | ITOCHU Corp. (Capital Goods) | | | 1,001,913 | |
| | 32,400 | | | Itochu Techno-Solutions Corp. (Software & Services) | | | 832,948 | |
| | 7,400 | | | Japan Airlines Co. Ltd. (Transportation) | | | 236,176 | |
| | 8,800 | | | JGC Corp. (Capital Goods) | | | 120,393 | |
| | 8,700 | | | Kajima Corp. (Capital Goods) | | | 119,664 | |
| | 82,100 | | | Kao Corp. (Household & Personal Products) | | | 6,264,589 | |
| | 163,600 | | | KDDI Corp. (Telecommunication Services) | | | 4,163,078 | |
| | 55,100 | | | Kewpie Corp. (Food, Beverage & Tobacco) | | | 1,217,989 | |
| | 92,100 | | | Konami Holdings Corp. (Media & Entertainment) | | | 4,332,271 | |
| | 18,400 | | | K’s Holdings Corp. (Retailing) | | | 173,741 | |
| | 106,400 | | | LIXIL Group Corp. (Capital Goods) | | | 1,687,825 | |
| | 8,100 | | | Look Holdings, Inc. (Consumer Durables & Apparel) | | | 95,718 | |
| | 10,800 | | | Mandom Corp. (Household & Personal Products) | | | 261,883 | |
| | 28,300 | | | Mitsubishi Heavy Industries Ltd. (Capital Goods) | | | 1,234,222 | |
| | 4,400 | | | Mitsubishi Materials Corp. (Materials) | | | 125,350 | |
| | 74,100 | | | Mitsubishi UFJ Lease & Finance Co. Ltd. (Diversified Financials) | | | 393,763 | |
| | 225,900 | | | Mitsui Fudosan Co. Ltd. (Real Estate) | | | 5,490,317 | |
| | 121,000 | | | MS&AD Insurance Group Holdings, Inc. (Insurance) | | | 3,846,156 | |
| | 98,900 | | | Nexon Co. Ltd. (Media & Entertainment)* | | | 1,444,894 | |
| | 5,100 | | | Nippon Flour Mills Co. Ltd. (Food, Beverage & Tobacco) | | | 81,672 | |
| | 5,500 | | | Nisshin Oillio Group Ltd. (The) (Food, Beverage & Tobacco) | | | 154,229 | |
| | 78,000 | | | Nomura Real Estate Holdings, Inc. (Real Estate) | | | 1,680,043 | |
| | 9,900 | | | Nomura Research Institute Ltd. (Software & Services) | | | 159,204 | |
| | 3,700 | | | NS Solutions Corp. (Software & Services) | | | 117,731 | |
| | 377,700 | | | NTT Data Corp. (Software & Services) | | | 5,043,076 | |
| | 147,500 | | | NTT DOCOMO, Inc. (Telecommunication Services) | | | 3,441,460 | |
| | 205,200 | | | Obayashi Corp. (Capital Goods) | | | 2,027,110 | |
| | 20,800 | | | Obic Co. Ltd. (Software & Services) | | | 2,363,821 | |
| | 258,400 | | | Osaka Gas Co. Ltd. (Utilities) | | | 4,509,588 | |
| | |
|
| Common Stocks – (continued) | |
| Japan – (continued) | |
| | 43,200 | | | Pola Orbis Holdings, Inc. (Household & Personal Products) | | | 1,210,554 | |
| | 113,500 | | | SAMTY Co. Ltd. (Real Estate) | | | 1,729,491 | |
| | 27,800 | | | Sankyo Co. Ltd. (Consumer Durables & Apparel) | | | 1,007,974 | |
| | 2,900 | | | Sawai Pharmaceutical Co. Ltd. (Pharmaceuticals, Biotechnology & Life Sciences) | | | 156,965 | |
| | 17,800 | | | SCSK Corp. (Software & Services) | | | 877,432 | |
| | 125,200 | | | Sekisui Chemical Co. Ltd. (Consumer Durables & Apparel) | | | 1,885,166 | |
| | 90,700 | | | Shionogi & Co. Ltd. (Pharmaceuticals, Biotechnology & Life Sciences) | | | 5,240,904 | |
| | 37,100 | | | SoftBank Group Corp. (Telecommunication Services) | | | 1,786,934 | |
| | 146,400 | | | Sony Corp. (Consumer Durables & Apparel) | | | 7,693,316 | |
| | 198,300 | | | Subaru Corp. (Automobiles & Components) | | | 4,828,042 | |
| | 130,600 | | | Sumitomo Corp. (Capital Goods) | | | 1,983,563 | |
| | 49,800 | | | Sumitomo Heavy Industries Ltd. (Capital Goods) | | | 1,720,485 | |
| | 128,800 | | | Sumitomo Mitsui Trust Holdings, Inc. (Banks) | | | 4,679,512 | |
| | 136,300 | | | Sumitomo Realty & Development Co. Ltd. (Real Estate) | | | 4,876,099 | |
| | 22,100 | | | Sundrug Co. Ltd. (Food & Staples Retailing) | | | 599,366 | |
| | 71,200 | | | Taisei Corp. (Capital Goods) | | | 2,593,570 | |
| | 61,000 | | | TIS, Inc. (Software & Services) | | | 3,117,328 | |
| | 38,000 | | | Tobu Railway Co. Ltd. (Transportation) | | | 1,109,007 | |
| | 71,900 | | | Toshiba Corp. (Capital Goods) | | | 2,241,466 | |
| | 7,000 | | | Towa Pharmaceutical Co. Ltd. (Pharmaceuticals, Biotechnology & Life Sciences) | | | 178,179 | |
| | 22,200 | | | Toyo Seikan Group Holdings Ltd. (Materials) | | | 441,398 | |
| | 15,100 | | | Toyota Motor Corp. (Automobiles & Components) | | | 937,164 | |
| | 1,201,100 | | | Yahoo Japan Corp. (Media & Entertainment) | | | 3,533,091 | |
| | 707,100 | | | Yamada Denki Co. Ltd. (Retailing) | | | 3,129,399 | |
| | | | | | | | |
| | | | | | | 165,590,935 | |
| | |
| Netherlands – 6.0% | |
| | 60,959 | | | Akzo Nobel NV (Materials) | | | 5,728,332 | |
| | 6,435 | | | ASM International NV (Semiconductors & Semiconductor Equipment) | | | 417,648 | |
| | 22,052 | | | ASML Holding NV (Semiconductors & Semiconductor Equipment) | | | 4,588,798 | |
| | 111,638 | | | ASR Nederland NV (Insurance) | | | 4,536,005 | |
| | |
| | |
| 44 | | The accompanying notes are an integral part of these financial statements. |
GOLDMAN SACHS INTERNATIONAL TAX-MANAGED EQUITY FUND
| | | | | | | | |
| Shares | | | Description | | Value | |
|
| Common Stocks – (continued) | |
| Netherlands – (continued) | |
| | 152,131 | | | BE Semiconductor Industries NV (Semiconductors & Semiconductor Equipment) | | $ | 3,903,720 | |
| | 14,587 | | | Koninklijke Philips NV (Health Care Equipment & Services) | | | 634,184 | |
| | 2,596 | | | NSI NV (REIT) | | | 109,959 | |
| | 15,870 | | | NXP Semiconductors NV (Semiconductors & Semiconductor Equipment) | | | 1,549,071 | |
| | 86,930 | | | Randstad NV (Commercial & Professional Services) | | | 4,770,962 | |
| | 16,431 | | | Royal Dutch Shell plc Class A (Energy) | | | 535,046 | |
| | 297,158 | | | Royal Dutch Shell plc Class B (Energy) | | | 9,736,888 | |
| | 15,820 | | | Royal Dutch Shell plc Class B ADR (Energy) | | | 1,040,007 | |
| | 89,622 | | | Wolters Kluwer NV (Commercial & Professional Services) | | | 6,520,117 | |
| | | | | | | | |
| | | | | | | 44,070,737 | |
| | |
| Norway – 2.1% | |
| | 41,100 | | | Aker BP ASA (Energy) | | | 1,185,374 | |
| | 124,706 | | | Austevoll Seafood ASA (Food, Beverage & Tobacco) | | | 1,310,749 | |
| | 233,588 | | | DNB ASA (Banks) | | | 4,352,596 | |
| | 35,510 | | | Mowi ASA (Food, Beverage & Tobacco) | | | 830,896 | |
| | 341,012 | | | Orkla ASA (Food, Beverage & Tobacco) | | | 3,026,457 | |
| | 47,658 | | | Salmar ASA (Food, Beverage & Tobacco) | | | 2,074,683 | |
| | 68,225 | | | Telenor ASA (Telecommunication Services) | | | 1,449,522 | |
| | 23,902 | | | TGS NOPEC Geophysical Co. ASA (Energy) | | | 672,607 | |
| | 9,250 | | | Tomra Systems ASA (Commercial & Professional Services) | | | 304,460 | |
| | | | | | | | |
| | | | | | | 15,207,344 | |
| | |
| Portugal – 0.3% | |
| | 524,643 | | | EDP – Energias de Portugal SA (Utilities) | | | 1,993,875 | |
| | |
| Singapore – 0.7% | |
| | 815,200 | | | Singapore Exchange Ltd. (Diversified Financials) | | | 4,775,871 | |
| | |
| South Africa – 0.2% | |
| | 48,213 | | | Anglo American plc (Materials) | | | 1,377,370 | |
| | |
| Spain – 3.3% | |
| | 58,113 | | | ACS Actividades de Construccion y Servicios SA (Capital Goods) | | | 2,325,043 | |
| | 228,892 | | | Banco Bilbao Vizcaya Argentaria SA (Banks) | | | 1,276,687 | |
| | 1,169,111 | | | Banco Santander SA (Banks) | | | 5,418,424 | |
| | |
|
| Common Stocks – (continued) | |
| Spain – (continued) | |
| | 133,787 | | | Enagas SA (Energy) | | | 3,570,316 | |
| | 26,758 | | | Grifols SA (Pharmaceuticals, Biotechnology & Life Sciences) | | | 791,863 | |
| | 80,663 | | | Iberdrola SA (Utilities) | | | 803,095 | |
| | 237,928 | | | Repsol SA (Energy) | | | 3,733,767 | |
| | 746,454 | | | Telefonica SA (Telecommunication Services) | | | 6,138,317 | |
| | | | | | | | |
| | | | | | | 24,057,512 | |
| | |
| Sweden – 3.5% | |
| | 6,248 | | | Alfa Laval AB (Capital Goods) | | | 136,535 | |
| | 158,079 | | | Atlas Copco AB Class A (Capital Goods) | | | 5,065,744 | |
| | 5,012 | | | Atlas Copco AB Class B (Capital Goods) | | | 144,097 | |
| | 183,961 | | | Boliden AB (Materials) | | | 4,713,804 | |
| | 184,969 | | | Electrolux ABSeries B (Consumer Durables & Apparel) | | | 4,741,409 | |
| | 12,246 | | | Lifco AB Class B (Capital Goods) | | | 679,709 | |
| | 277,289 | | | Sandvik AB (Capital Goods) | | | 5,095,479 | |
| | 96,081 | | | Swedish Match AB (Food, Beverage & Tobacco) | | | 4,062,138 | |
| | 50,925 | | | Volvo AB Class B (Capital Goods) | | | 809,182 | |
| | | | | | | | |
| | | | | | | 25,448,097 | |
| | |
| Switzerland – 7.6% | |
| | 86,715 | | | Adecco Group AG (Registered) (Commercial & Professional Services) | | | 5,211,345 | |
| | 17,579 | | | Baloise Holding AG (Registered) (Insurance) | | | 3,113,364 | |
| | 38 | | | Belimo Holding AG (Registered) (Capital Goods) | | | 233,559 | |
| | 58,739 | | | Coca-Cola HBC AG (Food, Beverage & Tobacco)* | | | 2,218,873 | |
| | 7,783 | | | Flughafen Zurich AG (Registered) (Transportation) | | | 1,465,821 | |
| | 6,425 | | | Helvetia Holding AG (Registered) (Insurance) | | | 806,528 | |
| | 54,222 | | | LafargeHolcim Ltd. (Registered) (Materials)* | | | 2,651,268 | |
| | 18,777 | | | Lonza Group AG (Registered) (Pharmaceuticals, Biotechnology & Life Sciences)* | | | 6,338,981 | |
| | 58,948 | | | Nestle SA (Registered) (Food, Beverage & Tobacco) | | | 6,102,429 | |
| | 61,103 | | | Novartis AG (Registered) (Pharmaceuticals, Biotechnology & Life Sciences) | | | 5,578,201 | |
| | 688 | | | Partners Group Holding AG (Diversified Financials) | | | 541,057 | |
| | 52,279 | | | Roche Holding AG (Pharmaceuticals, Biotechnology & Life Sciences) | | | 14,700,220 | |
| | 24,116 | | | Sonova Holding AG (Registered) (Health Care Equipment & Services) | | | 5,488,768 | |
| | |
| | |
| The accompanying notes are an integral part of these financial statements. | | 45 |
GOLDMAN SACHS INTERNATIONAL TAX-MANAGED EQUITY FUND
Schedule of Investments(continued)
June 30, 2019 (Unaudited)
| | | | | | | | |
| Shares | | | Description | | Value | |
|
| Common Stocks – (continued) | |
| Switzerland – (continued) | |
| | 1,311 | | | Tecan Group AG (Registered) (Pharmaceuticals, Biotechnology & Life Sciences) | | $ | 340,476 | |
| | 3,962 | | | Temenos AG (Registered) (Software & Services)* | | | 709,412 | |
| | | | | | | | |
| | | | | | | 55,500,302 | |
| | |
| United Kingdom – 11.4% | |
| | 8,315 | | | Ashtead Group plc (Capital Goods) | | | 238,236 | |
| | 641,166 | | | Aviva plc (Insurance) | | | 3,395,974 | |
| | 525,398 | | | Barratt Developments plc (Consumer Durables & Apparel) | | | 3,823,319 | |
| | 52,588 | | | boohoo Group plc (Retailing)* | | | 141,318 | |
| | 2,669 | | | BP plc ADR (Energy) | | | 111,297 | |
| | 78,403 | | | British American Tobacco plc (Food, Beverage & Tobacco) | | | 2,737,515 | |
| | 7,799 | | | Compass Group plc (Consumer Services) | | | 186,956 | |
| | 226,735 | | | Diageo plc (Food, Beverage & Tobacco) | | | 9,758,739 | |
| | 21,947 | | | Dialog Semiconductor plc (Semiconductors & Semiconductor Equipment)* | | | 883,134 | |
| | 1,158,116 | | | Direct Line Insurance Group plc (Insurance) | | | 4,881,783 | |
| | 227,330 | | | Experian plc (Commercial & Professional Services) | | | 6,885,728 | |
| | 26,270 | | | Fevertree Drinks plc (Food, Beverage & Tobacco) | | | 773,274 | |
| | 307,121 | | | Fiat Chrysler Automobiles NV (Automobiles & Components) | | | 4,262,358 | |
| | 22,420 | | | Greggs plc (Consumer Services) | | | 653,465 | |
| | 73,029 | | | GVC Holdings plc (Consumer Services) | | | 605,368 | |
| | 187,571 | | | Halma plc (Technology Hardware & Equipment) | | | 4,817,316 | |
| | 15,228 | | | HomeServe plc (Commercial & Professional Services) | | | 229,471 | |
| | 178,349 | | | HSBC Holdings plc (Banks) | | | 1,488,548 | |
| | 22,295 | | | Imperial Brands plc (Food, Beverage & Tobacco) | | | 523,156 | |
| | 444,038 | | | International Consolidated Airlines Group SA (Transportation) | | | 2,692,057 | |
| | 79,439 | | | JD Sports Fashion plc (Retailing) | | | 591,809 | |
| | 1,468,944 | | | Legal & General Group plc (Insurance) | | | 5,032,624 | |
| | 3,601,402 | | | Lloyds Banking Group plc (Banks) | | | 2,586,600 | |
| | 574,493 | | | National Grid plc (Utilities) | | | 6,109,660 | |
| | 17,165 | | | Next plc (Retailing) | | | 1,202,012 | |
| | 166,691 | | | Persimmon plc (Consumer Durables & Apparel) | | | 4,234,778 | |
| | 266,178 | | | Smith & Nephew plc (Health Care Equipment & Services) | | | 5,779,955 | |
| | 1,514,409 | | | Taylor Wimpey plc (Consumer Durables & Apparel) | | | 3,038,894 | |
| | |
|
| Common Stocks – (continued) | |
| United Kingdom – (continued) | |
| | 32,974 | | | Unilever NV CVA (Household & Personal Products) | | | 2,003,440 | |
| | 17,834 | | | Unilever plc (Household & Personal Products) | | | 1,107,051 | |
| | 45,109 | | | Unilever plc ADR (Household & Personal Products) | | | 2,795,405 | |
| | | | | | | | |
| | | | | | | 83,571,240 | |
| | |
| United States – 0.1% | |
| | 10,526 | | | Carnival plc ADR (Consumer Services) | | | 476,512 | |
| | |
| | TOTAL COMMON STOCKS | |
| | (Cost $672,568,125) | | $ | 717,127,957 | |
| | |
| | | | | | | | | | | | |
| Units | | | Description | | Expiration
Month | | | Value | |
| |
| Right* – 0.0% | | | | |
| Spain – 0.0% | | | | |
| | 58,229 | | | ACS
Actividades de
Construccion y
Servicios SA
(Capital Goods) | | | 07/2019 | | | $ | 91,373 | |
| | (Cost $ $97,152) | | | | | |
| | |
| | TOTAL INVESTMENTS – 98.1% | |
| | (Cost $672,665,277) | | | | | | $ | 717,219,330 | |
| | |
| OTHER ASSETS IN EXCESS OF
LIABILITIES – 1.9% |
| | | 13,788,141 | |
| | |
| | NET ASSETS – 100.0% | | | | | | $ | 731,007,471 | |
| | |
| | |
|
| The percentage shown for each investment category reflects the value of investments in that category as a percentage of net assets. |
| |
* | | Non-income producing security. |
| |
(a) | | Exempt from registration under Rule 144A of the Securities Act of 1933. |
| | | | |
|
Investment Abbreviations: |
ADR | | —American Depositary Receipt |
CVA | | —Dutch Certification | | |
REIT | | —Real Estate Investment Trust | | |
|
| | |
| 46 | | The accompanying notes are an integral part of these financial statements. |
GOLDMAN SACHS INTERNATIONAL TAX-MANAGED EQUITY FUND
|
| ADDITIONAL INVESTMENT INFORMATION |
FUTURES CONTRACTS — At June 30, 2019, the Fund had the following futures contracts:
| | | | | | | | | | | | | | |
| Description | | Number of
Contracts | | | Expiration
Date | | Notional
Amount | | | Unrealized
Appreciation/
(Depreciation) | |
Long position contracts: | | | | | | | | | | | | | | |
EURO STOXX 50 Index | | | 95 | | | 09/20/2019 | | $ | 3,744,129 | | | $ | 101,668 | |
FTSE 100 Index | | | 18 | | | 09/20/2019 | | | 1,684,487 | | | | 20,928 | |
Hang Seng Index | | | 1 | | | 07/30/2019 | | | 182,450 | | | | 2,088 | |
MSCI Singapore Index | | | 4 | | | 07/30/2019 | | | 111,796 | | | | 1,033 | |
SPI 200 Index | | | 6 | | | 09/19/2019 | | | 690,712 | | | | 8,707 | |
TOPIX Index | | | 11 | | | 09/12/2019 | | | 1,582,433 | | | | 10,081 | |
| | | | |
| Total Futures Contracts | | | | | | | | | | | | $ | 144,505 | |
| | |
| The accompanying notes are an integral part of these financial statements. | | 47 |
GOLDMAN SACHSTAX-ADVANTAGED EQUITY FUNDS
Statements of Assets and Liabilities
June 30, 2019 (Unaudited)
| | | | | | | | | | | | | | | | | | |
| | | | | U.S. Equity
Dividend and
Premium Fund | | | International Equity
Dividend and
Premium Fund | | | U.S.Tax-
Managed
Equity Fund | | | International
Tax-Managed
Equity Fund | |
| | Assets: | | | | | |
| | | | | |
| | Investments in unaffiliated issuers, at value (cost $2,511,352,208, $312,372,415, $1,185,245,289 and $672,665,277)(a) | | $ | 2,956,586,332 | | | $ | 309,545,316 | | | $ | 1,699,956,610 | | | $ | 717,219,330 | |
| | Investments in affiliated issuers, at value (cost $14,985,574, $0, $61,302 and $0) | | | 14,985,574 | | | | — | | | | 61,302 | | | | — | |
| | Investments in affiliated securities lending reinvestment vehicle, at value (cost $854,750, $801,360, $0 and $0) | | | 854,750 | | | | 801,360 | | | | — | | | | — | |
| | Cash | | | 438,109 | | | | — | | | | 26,258,678 | | | | 693,797 | |
| | Foreign currencies, at value (cost $0, $2,148,307, $0 and $7,266,194) | | | — | | | | 2,168,994 | | | | — | | | | 7,267,393 | |
| | Receivables: | | | | | | | | | | | | | | | | |
| | Investments sold | | | 8,298,288 | | | | — | | | | 454,058 | | | | 14,370,195 | |
| | Dividends | | | 3,220,023 | | | | 805,105 | | | | 1,480,105 | | | | 1,286,272 | |
| | Fund shares sold | | | 1,454,027 | | | | 155,724 | | | | 281,493 | | | | 2,190,788 | |
| | Reimbursement from investment adviser | | | 52,894 | | | | 27,603 | | | | — | | | | 45,397 | |
| | Securities lending income | | | 138 | | | | 3,709 | | | | — | | | | 182 | |
| | Foreign tax reclaims | | | — | | | | 2,060,402 | | | | — | | | | 1,884,979 | |
| | Due from custodian | | | — | | | | — | | | | — | | | | 11,693,095 | |
| | Variation margin on futures | | | — | | | | 14,681 | | | | — | | | | 39,789 | |
| | Other assets | | | 91,352 | | | | 55,190 | | | | 71,825 | | | | 47,031 | |
| | Total assets | | | 2,985,981,487 | | | | 315,638,084 | | | | 1,728,564,071 | | | | 756,738,248 | |
| | | | | | | | | | | | | | | | | | |
| | Liabilities: | | | | | | | | | | | | | | | | |
| | Written options, at value (premiums received $24,609,167, $2,457,086, $0 and $0) | | | 36,324,210 | | | | 2,549,871 | | | | — | | | | — | |
| | Variation margin on futures | | | 61,837 | | | | — | | | | — | | | | — | |
| | Payables: | | | | | | | | | | | | | | | | |
| | Investments purchased | | | 11,233,824 | | | | 138 | | | | — | | | | 24,514,985 | |
| | Fund shares redeemed | | | 5,096,941 | | | | 334,418 | | | | 5,557,157 | | | | 457,925 | |
| | Management fees | | | 1,661,807 | | | | 204,695 | | | | 935,886 | | | | 500,243 | |
| | Payable upon return of securities loaned | | | 854,750 | | | | 801,360 | | | | — | | | | — | |
| | Distribution and Service fees and Transfer Agency fees | | | 329,928 | | | | 10,720 | | | | 77,133 | | | | 23,450 | |
| | Due to custodian | | | — | | | | 777,836 | | | | — | | | | — | |
| | Accrued expenses and other liabilities | | | 324,534 | | | | 214,986 | | | | 172,082 | | | | 234,174 | |
| | Total liabilities | | | 55,887,831 | | | | 4,894,024 | | | | 6,742,258 | | | | 25,730,777 | |
| | | | | | | | | | | | | | | | | | |
| | Net Assets: | | | | | | | | | | | | | | | | |
| | Paid-in capital | | | 2,434,740,941 | | | | 358,628,570 | | | | 1,192,597,863 | | | | 699,680,799 | |
| | Total distributable earnings (loss) | | | 495,352,715 | | | | (47,884,510 | ) | | | 529,223,950 | | | | 31,326,672 | |
| | NET ASSETS | | $ | 2,930,093,656 | | | $ | 310,744,060 | | | $ | 1,721,821,813 | | | $ | 731,007,471 | |
| | | Net Assets: | | | | | | | | | | | | | | | | |
| | | Class A | | $ | 194,950,063 | | | $ | 2,826,713 | | | $ | 63,654,048 | | | $ | 8,695,841 | |
| | | Class C | | | 140,568,832 | | | | 892,025 | | | | 15,860,010 | | | | 1,820,677 | |
| | | Institutional | | | 1,214,657,522 | | | | 11,149,902 | | | | 39,459,323 | | | | 17,723,901 | |
| | | Service | | | — | | | | — | | | | 1,571,505 | | | | — | |
| | | Investor | | | 462,128,749 | | | | 10,909,669 | | | | 20,023,069 | | | | 17,800,345 | |
| | | Class P | | | 646,718,990 | | | | 149,712,223 | | | | 124,200,263 | | | | 66,532,999 | |
| | | Class R6 | | | 271,069,500 | | | | 135,253,528 | | | | 1,457,053,595 | | | | 618,433,708 | |
| | | Total Net Assets | | $ | 2,930,093,656 | | | $ | 310,744,060 | | | $ | 1,721,821,813 | | | $ | 731,007,471 | |
| | | Shares outstanding $0.001 par value (unlimited shares authorized): | | | | | | | | | | | | | | | | |
| | | Class A | | | 14,952,422 | | | | 403,743 | | | | 2,704,108 | | | | 874,375 | |
| | | Class C | | | 10,826,178 | | | | 132,066 | | | | 713,417 | | | | 189,156 | |
| | | Institutional | | | 93,402,447 | | | | 1,623,734 | | | | 1,634,108 | | | | 1,782,860 | |
| | | Service | | | — | | | | — | | | | 66,341 | | | | — | |
| | | Investor | | | 35,514,722 | | | | 1,593,313 | | | | 836,963 | | | | 1,791,561 | |
| | | Class P | | | 49,735,970 | | | | 21,783,175 | | | | 5,186,947 | | | | 6,732,767 | |
| | | Class R6 | | | 20,851,612 | | | | 19,708,301 | | | | 60,866,943 | | | | 62,612,601 | |
| | | Net asset value, offering and redemption price per share:(b) | | | | | | | | | | | | | | | | |
| | | Class A | | $ | 13.04 | | | $ | 7.00 | | | $ | 23.54 | | | $ | 9.95 | |
| | | Class C | | | 12.98 | | | | 6.75 | | | | 22.23 | | | | 9.63 | |
| | | Institutional | | | 13.00 | | | | 6.87 | | | | 24.15 | | | | 9.94 | |
| | | Service | | | — | | | | — | | | | 23.69 | | | | — | |
| | | Investor | | | 13.01 | | | | 6.85 | | | | 23.92 | | | | 9.94 | |
| | | Class P | | | 13.00 | | | | 6.87 | | | | 23.94 | | | | 9.88 | |
| | | Class R6 | | | 13.00 | | | | 6.86 | | | | 23.94 | | | | 9.88 | |
| | (a) | | Includes loaned securities having a market value of $835,380 and $761,357, for the U.S. Equity Dividend and Premium and International Equity Dividend and Premium Funds, respectively. |
| | (b) | | Maximum public offering price per share for Class A Shares of the U.S. Equity Dividend and Premium, International Equity Dividend and Premium, U.S.Tax-Managed Equity and InternationalTax-Managed Equity Funds is $13.80, $7.41, $24.91 and $10.53, respectively. At redemption, Class C Shares may be subject to a contingent deferred sales charge assessed on the amount equal to the lesser of the current NAV or the original purchase price of the shares. |
| | |
| 48 | | The accompanying notes are an integral part of these financial statements. |
GOLDMAN SACHSTAX-ADVANTAGED EQUITY FUNDS
Statements of Operations
For the Six Months Ended June 30, 2019 (Unaudited)
| | | | | | | | | | | | | | | | | | |
| | | | | U.S. Equity
Dividend and
Premium Fund | | | International Equity
Dividend and
Premium Fund | | | U.S.Tax-
Managed
Equity Fund | | | International
Tax-Managed
Equity Fund | |
| | Investment income: | |
| | | | | |
| | Dividends — unaffiliated issuers (net of foreign taxes withheld of $0, $942,114, $12,539 and $1,441,571) | | $ | 41,292,786 | | | $ | 8,887,684 | | | $ | 13,967,493 | | | $ | 14,652,700 | |
| | | | | |
| | Dividends — affiliated issuers | | | 214,362 | | | | 2,555 | | | | 40,063 | | | | 4,162 | |
| | | | | |
| | Securities lending income — affiliated issuer | | | 424 | | | | 20,106 | | | | 430 | | | | 28,086 | |
| | | | | |
| | Total investment income | | | 41,507,572 | | | | 8,910,345 | | | | 14,007,986 | | | | 14,684,948 | |
| | | | | | | | | | | | | | | | | | |
| | Expenses: | | | | | | | | | | | | | | | | |
| | | | | |
| | Management fees | | | 10,099,080 | | | | 1,265,579 | | | | 5,558,114 | | | | 2,954,276 | |
| | | | | |
| | Transfer Agency fees(a) | | | 1,090,519 | | | | 57,644 | | | | 322,832 | | | | 126,179 | |
| | | | | |
| | Distribution and Service fees(a) | | | 968,478 | | | | 8,395 | | | | 155,765 | | | | 22,533 | |
| | | | | |
| | Custody, accounting and administrative services | | | 187,429 | | | | 89,010 | | | | 108,870 | | | | 160,996 | |
| | | | | |
| | Printing and mailing costs | | | 124,614 | | | | 19,381 | | | | 27,597 | | | | 21,962 | |
| | | | | |
| | Registration fees | | | 114,122 | | | | 79,533 | | | | 68,640 | | | | 49,473 | |
| | | | | |
| | Professional fees | | | 51,314 | | | | 58,771 | | | | 51,768 | | | | 60,152 | |
| | | | | |
| | Trustee fees | | | 10,815 | | | | 8,239 | | | | 9,322 | | | | 8,544 | |
| | | | | |
| | Service share fees — Service and Shareholder Administration Plan | | | — | | | | — | | | | 2,692 | | | | — | |
| | | | | |
| | Other | | | 35,265 | | | | 59,895 | | | | 25,093 | | | | 23,574 | |
| | | | | |
| | Total expenses | | | 12,681,636 | | | | 1,646,447 | | | | 6,330,693 | | | | 3,427,689 | |
| | | | | |
| | Less — expense reductions | | | (380,760 | ) | | | (168,269 | ) | | | (34,749 | ) | | | (283,423 | ) |
| | | | | |
| | Net expenses | | | 12,300,876 | | | | 1,478,178 | | | | 6,295,944 | | | | 3,144,266 | |
| | | | | |
| | NET INVESTMENT INCOME | | | 29,206,696 | | | | 7,432,167 | | | | 7,712,042 | | | | 11,540,682 | |
| | | | | | | | | | | | | | | | | | |
| | Realized and unrealized gain (loss): | | | | | | | | | | | | | | | | |
| | | | | |
| | Net realized gain (loss) from: | | | | | | | | | | | | | | | | |
| | | | | |
| | Investments — unaffiliated issuers | | | 83,874,744 | | | | (8,752,535 | ) | | | 3,907,469 | | | | (13,494,572 | ) |
| | | | | |
| | In-kind transactions | | | — | | | | — | | | | 19,283,017 | | | | — | |
| | | | | |
| | Futures contracts | | | (679,534 | ) | | | 154,611 | | | | 1,554,335 | | | | 345,643 | |
| | | | | |
| | Foreign currency transactions | | | — | | | | 42,913 | | | | — | | | | (307,722 | ) |
| | | | | |
| | Written options | | | (28,029,718 | ) | | | (7,244,218 | ) | | | — | | | | — | |
| | | | | |
| | Net change in unrealized gain (loss) on: | | | | | | | | | | | | | | | | |
| | | | | |
| | Investments — unaffiliated issuers | | | 340,478,116 | | | | 37,000,655 | | | | 196,635,479 | | | | 76,243,670 | |
| | | | | |
| | Futures contracts | | | 292,960 | | | | 67,782 | | | | 485,166 | | | | 148,552 | |
| | | | | |
| | Foreign currency translation | | | — | | | | 26,882 | | | | — | | | | 15,390 | |
| | | | | |
| | Written options | | | (22,643,742 | ) | | | (302,748 | ) | | | — | | | | — | |
| | | | | |
| | Net realized and unrealized gain | | | 373,292,826 | | | | 20,993,342 | | | | 221,865,466 | | | | 62,950,961 | |
| | | | | |
| | NET INCREASE IN NET ASSETS RESULTING FROM OPERATIONS | | $ | 402,499,522 | | | $ | 28,425,509 | | | $ | 229,577,508 | | | $ | 74,491,643 | |
| | (a) | | Class specific Distribution and/or Service, and Transfer Agency fees were as follows: |
| | | | | | | | | | | | | | | | | | | | | | | | | | | | | | | | | | | | |
| | | Distribution and/or Service
Fees | | | Transfer Agency Fees | |
Fund | | Class A | | | Class C | | | Class A | | | Class C | | | Institutional | | | Service | | | Investor | | | Class P | | | Class R6 | |
U.S. Equity Dividend and Premium | | $ | 247,702 | | | $ | 720,776 | | | $ | 178,346 | | | $ | 129,739 | | | $ | 237,215 | | | $ | N/A | | | $ | 405,745 | | | $ | 99,317 | | | $ | 40,157 | |
International Equity Dividend and Premium | | | 3,138 | | | | 5,257 | | | | 2,260 | | | | 946 | | | | 2,480 | | | | N/A | | | | 8,976 | | | | 23,271 | | | | 19,711 | |
U.S.Tax-Managed Equity | | | 77,020 | | | | 78,745 | | | | 55,454 | | | | 14,174 | | | | 7,645 | | | | 215 | | | | 17,648 | | | | 16,978 | | | | 210,718 | |
InternationalTax-Managed Equity | | | 10,726 | | | | 11,807 | | | | 7,723 | | | | 2,125 | | | | 3,650 | | | | N/A | | | | 15,352 | | | | 9,919 | | | | 87,410 | |
| | |
| The accompanying notes are an integral part of these financial statements. | | 49 |
GOLDMAN SACHSTAX-ADVANTAGED EQUITY FUNDS
Statements of Changes in Net Assets
| | | | | | | | | | | | | | | | | | | | | | |
| | | | | U.S. Equity Dividend and Premium Fund | | | | | | International Equity Dividend and Premium Fund | |
| | | | | For the
Six Months Ended
June 30, 2019
(Unaudited) | | | For the Fiscal
Year Ended
December 31, 2018 | | | | | | For the
Six Months Ended
June 30, 2019
(Unaudited) | | | For the Fiscal
Year Ended
December 31, 2018 | |
| | From operations: | | | | | | | | | | | | | |
| | Net investment income | | $ | 29,206,696 | | | $ | 63,743,516 | | | | | | | $ | 7,432,167 | | | $ | 11,805,837 | |
| | Net realized gain (loss) | | | 55,165,492 | | | | 190,385,768 | | | | | | | | (15,799,229 | ) | | | (1,079,490 | ) |
| | Net change in unrealized gain (loss) | | | 318,127,334 | | | | (457,858,509 | ) | | | | | | | 36,792,571 | | | | (61,449,995 | ) |
| | Net increase (decrease) in net assets resulting from operations | | | 402,499,522 | | | | (203,729,225 | ) | | | | | | | 28,425,509 | | | | (50,723,648 | ) |
| | | | | | | | | | | | | | | | | | | | | | |
| | Distributions to shareholders: | | | | | | | | | | | | | |
| | From distributable earnings: | | | | | | | | | | | | | | | | | | | | |
| | Class A Shares | | | (1,701,055 | ) | | | (15,468,512 | ) | | | | | | | (57,436 | ) | | | (91,884 | ) |
| | Class C Shares | | | (726,109 | ) | | | (9,209,896 | ) | | | | | | | (16,434 | ) | | | (54,797 | ) |
| | Institutional Shares | | | (12,581,427 | ) | | | (97,415,908 | ) | | | | | | | (270,752 | ) | | | (2,464,098 | ) |
| | Investor Shares | | | (4,497,847 | ) | | | (33,144,596 | ) | | | | | | | (244,955 | ) | | | (187,293 | ) |
| | Class P Shares(a) | | | (6,851,272 | ) | | | (50,730,626 | ) | | | | | | | (3,538,713 | ) | | | (5,301,151 | ) |
| | Class R6 Shares(b) | | | (2,853,889 | ) | | | (18,072,196 | ) | | | | | | | (3,137,496 | ) | | | (3,555,021 | ) |
| | Total distributions to shareholders | | | (29,211,599 | ) | | | (224,041,734 | ) | | | | | | | (7,265,786 | ) | | | (11,654,244 | ) |
| | | | | | | | | | | | | | | | | | | | | | |
| | From share transactions: | | | | | | | | | | | | | |
| | Proceeds from sales of shares | | | 325,981,173 | | | | 1,907,832,243 | | | | | | | | 18,610,862 | | | | 423,531,802 | |
| | Reinvestment of distributions | | | 26,036,915 | | | | 201,664,139 | | | | | | | | 7,179,960 | | | | 11,429,363 | |
| | Cost of shares redeemed | | | (561,436,135 | ) | | | (2,407,191,500 | ) | | | | | | | (51,032,704 | ) | | | (471,997,811 | ) |
| | Net decrease in net assets resulting from share transactions | | | (209,418,047 | ) | | | (297,695,118 | ) | | | | | | | (25,241,882 | ) | | | (37,036,646 | ) |
| | TOTAL INCREASE (DECREASE) | | | 163,869,876 | | | | (725,466,077 | ) | | | | | | | (4,082,159 | ) | | | (99,414,538 | ) |
| | | | | | | | | | | | | | | | | | | | | | |
| | Net Assets: | | | | | | | | | | | | | |
| | Beginning of period | | | 2,766,223,780 | | | | 3,491,689,857 | | | | | | | | 314,826,219 | | | | 414,240,757 | |
| | End of period | | $ | 2,930,093,656 | | | $ | 2,766,223,780 | | | | | | | $ | 310,744,060 | | | $ | 314,826,219 | |
| | (a) | | Commenced operations on April 17, 2018. |
| | (b) | | Commenced operations on April 30, 2018. |
| | |
| 50 | | The accompanying notes are an integral part of these financial statements. |
GOLDMAN SACHSTAX-ADVANTAGED EQUITY FUNDS
Statements of Changes in Net Assets(continued)
| | | | | | | | | | | | | | | | | | | | | | |
| | | | | U.S.Tax-Managed Equity Fund | | | | | | InternationalTax-Managed Equity Fund | |
| | | | | For the
Six Months Ended
June 30, 2019
(Unaudited) | | | For the Fiscal
Year Ended
December 31, 2018 | | | | | | For the
Six Months Ended
June 30, 2019
(Unaudited) | | | For the Fiscal
Year Ended
December 31, 2018 | |
| | From operations: | | | | | | | | | | | | | |
| | Net investment income | | $ | 7,712,042 | | | $ | 12,721,634 | | | | | | | $ | 11,540,682 | | | $ | 14,175,859 | |
| | Net realized gain (loss) | | | 24,744,821 | | | | 81,954,561 | | | | | | | | (13,456,651 | ) | | | (11,451,104 | ) |
| | Net change in unrealized gain (loss) | | | 197,120,645 | | | | (220,615,121 | ) | | | | | | | 76,407,612 | | | | (132,332,601 | ) |
| | Net increase (decrease) in net assets resulting from operations | | | 229,577,508 | | | | (125,938,926 | ) | | | | | | | 74,491,643 | | | | (129,607,846 | ) |
| | | | | | | | | | | | | | | | | | | | | | |
| | Distributions to shareholders: | | | | | | | | | | | | | |
| | From distributable earnings: | | | | | | | | | | | | | | | | | | | | |
| | Class A Shares | | | — | | | | (319,218 | ) | | | | | | | — | | | | (143,812 | ) |
| | Class C Shares | | | — | | | | — | | | | | | | | — | | | | (20,693 | ) |
| | Institutional Shares | | | — | | | | (36,134 | ) | | | | | | | — | | | | (355,413 | ) |
| | Service Shares | | | — | | | | (2,719 | ) | | | | | | | — | | | | — | |
| | Investor Shares | | | — | | | | (134,928 | ) | | | | | | | — | | | | (297,404 | ) |
| | Class P Shares(a) | | | — | | | | (908,225 | ) | | | | | | | — | | | | (1,579,421 | ) |
| | Class R6 Shares(b) | | | — | | | | (11,402,299 | ) | | | | | | | — | | | | (11,604,834 | ) |
| | Total distributions to shareholders | | | — | | | | (12,803,523 | ) | | | | | | | — | | | | (14,001,577 | ) |
| | | | | | | | | | | | | | | | | | | | | | |
| | From share transactions: | | | | | | | | | | | | | |
| | Proceeds from sales of shares | | | 107,071,760 | | | | 1,849,737,045 | | | | | | | | 62,778,324 | | | | 859,458,016 | |
| | Proceeds paid in connection within-kind transactions | | | (25,670,000 | ) | | | (121,370,000 | ) | | | | | | | — | | | | — | |
| | Reinvestment of distributions | | | — | | | | 12,780,494 | | | | | | | | — | | | | 13,987,660 | |
| | Cost of shares redeemed | | | (76,257,506 | ) | | | (1,601,182,871 | ) | | | | | | | (43,383,455 | ) | | | (739,640,420 | ) |
| | Net increase in net assets resulting from share transactions | | | 5,144,254 | | | | 139,964,668 | | | | | | | | 19,394,869 | | | | 133,805,256 | |
| | TOTAL INCREASE (DECREASE) | | | 234,721,762 | | | | 1,222,219 | | | | | | | | 93,886,512 | | | | (9,804,167 | ) |
| | | | | | | | | | | | | | | | | | | | | | |
| | Net Assets: | | | | | | | | | | | | | |
| | Beginning of period | | | 1,487,100,051 | | | | 1,485,877,832 | | | | | | | | 637,120,959 | | | | 646,925,126 | |
| | End of period | | $ | 1,721,821,813 | | | $ | 1,487,100,051 | | | | | | | $ | 731,007,471 | | | $ | 637,120,959 | |
| | (a) | | Commenced operations on April 17, 2018. |
| | (b) | | Commenced operations on April 30, 2018. |
| | |
| The accompanying notes are an integral part of these financial statements. | | 51 |
GOLDMAN SACHS U.S. EQUITY DIVIDEND AND PREMIUM FUND
Financial Highlights
Selected Data for a Share Outstanding Throughout Each Period
| | | | | | | | | | | | | | | | | | | | | | | | | | |
| | | | | Goldman Sachs U.S. Equity Dividend and Premium Fund | |
| | | | | Class A Shares | |
| | | | | Six Months Ended
June 30, 2019
(Unaudited) | | | Year Ended December 31, | |
| | | | | 2018 | | | 2017 | | | 2016 | | | 2015 | | | 2014 | |
| | Per Share Data | | | | | | | | | | | | | | | | | | | | | | | | |
| | | | | | | |
| | Net asset value, beginning of period | | $ | 11.46 | | | $ | 13.16 | | | $ | 12.11 | | | $ | 11.34 | | | $ | 11.76 | | | $ | 11.26 | |
| | | | | | | |
| | Net investment income(a) | | | 0.11 | | | | 0.21 | | | | 0.19 | | | | 0.20 | | | | 0.21 | | | | 0.23 | |
| | | | | | | |
| | Net realized and unrealized gain (loss) | | | 1.58 | | | | (1.05 | ) | | | 1.61 | | | | 1.21 | | | | 0.04 | | | | 0.95 | |
| | | | | | | |
| | Total from investment operations | | | 1.69 | | | | (0.84 | ) | | | 1.80 | | | | 1.41 | | | | 0.25 | | | | 1.18 | |
| | | | | | | |
| | Distributions to shareholders from net investment income | | | (0.11 | ) | | | (0.22 | ) | | | (0.19 | ) | | | (0.19 | ) | | | (0.20 | ) | | | (0.22 | ) |
| | | | | | | |
| | Distributions to shareholders from net realized gains | | | — | | | | (0.64 | ) | | | (0.56 | ) | | | (0.45 | ) | | | (0.47 | ) | | | (0.46 | ) |
| | | | | | | |
| | Total distributions | | | (0.11 | ) | | | (0.86 | ) | | | (0.75 | ) | | | (0.64 | ) | | | (0.67 | ) | | | (0.68 | ) |
| | | | | | | |
| | Net asset value, end of period | | $ | 13.04 | | | $ | 11.46 | | | $ | 13.16 | | | $ | 12.11 | | | $ | 11.34 | | | $ | 11.76 | |
| | | | | | | |
| | Total return(b) | | | 14.77 | % | | | (6.63 | )% | | | 14.83 | % | | | 12.73 | % | | | 2.08 | % | | | 10.47 | % |
| | | | | | | |
| | Net assets, end of period (in 000s) | | $ | 194,950 | | | $ | 187,524 | | | $ | 275,451 | | | $ | 294,401 | | | $ | 194,237 | | | $ | 172,832 | |
| | | | | | | |
| | Ratio of net expenses to average net assets | | | 1.13 | %(c) | | | 1.12 | % | | | 1.13 | % | | | 1.16 | % | | | 1.17 | % | | | 1.19 | % |
| | | | | | | |
| | Ratio of total expenses to average net assets | | | 1.16 | %(c) | | | 1.15 | % | | | 1.15 | % | | | 1.19 | % | | | 1.20 | % | | | 1.20 | % |
| | | | | | | |
| | Ratio of net investment income to average net assets | | | 1.73 | %(c) | | | 1.61 | % | | | 1.47 | % | | | 1.67 | % | | | 1.75 | % | | | 1.96 | % |
| | | | | | | |
| | Portfolio turnover rate(d) | | | 10 | % | | | 37 | % | | | 34 | % | | | 23 | % | | | 39 | % | | | 53 | % |
| | (a) | | Calculated based on the average shares outstanding methodology. |
| | (b) | | Assumes investment at the net asset value at the beginning of the period, reinvestment of all distributions, a complete redemption of the investment at the net asset value at the end of the period and no sales or redemption charges (if any). Total returns would be reduced if a sales or redemption charge was taken into account. Returns do not reflect the impact of taxes to shareholders relating to Fund distributions or the redemption of Fund shares. Total returns for periods less than one full year are not annualized. |
| | (d) | | The Fund’s portfolio turnover rate is calculated in accordance with regulatory requirements, without regard to transactions involving short term investments and certain derivatives. If such transactions were included, the Fund’s portfolio turnover rate may be higher. |
| | |
| 52 | | The accompanying notes are an integral part of these financial statements. |
GOLDMAN SACHS U.S. EQUITY DIVIDEND AND PREMIUM FUND
Financial Highlights(continued)
Selected Data for a Share Outstanding Throughout Each Period
| | | | | | | | | | | | | | | | | | | | | | | | | | |
| | | | | Goldman Sachs U.S. Equity Dividend and Premium Fund | |
| | | | | Class C Shares | |
| | | | | Six Months Ended
June 30, 2019
(Unaudited) | | | Year Ended December 31, | |
| | | | | 2018 | | | 2017 | | | 2016 | | | 2015 | | | 2014 | |
| | Per Share Data | | | | | | | | | | | | | | | | | | | | | | | | |
| | | | | | | |
| | Net asset value, beginning of period | | $ | 11.41 | | | $ | 13.11 | | | $ | 12.07 | | | $ | 11.31 | | | $ | 11.74 | | | $ | 11.24 | |
| | | | | | | |
| | Net investment income(a) | | | 0.06 | | | | 0.11 | | | | 0.10 | | | | 0.11 | | | | 0.12 | | | | 0.14 | |
| | | | | | | |
| | Net realized and unrealized gain (loss) | | | 1.57 | | | | (1.05 | ) | | | 1.60 | | | | 1.21 | | | | 0.03 | | | | 0.96 | |
| | | | | | | |
| | Total from investment operations | | | 1.63 | | | | (0.94 | ) | | | 1.70 | | | | 1.32 | | | | 0.15 | | | | 1.10 | |
| | | | | | | |
| | Distributions to shareholders from net investment income | | | (0.06 | ) | | | (0.12 | ) | | | (0.10 | ) | | | (0.11 | ) | | | (0.11 | ) | | | (0.14 | ) |
| | | | | | | |
| | Distributions to shareholders from net realized gains | | | — | | | | (0.64 | ) | | | (0.56 | ) | | | (0.45 | ) | | | (0.47 | ) | | | (0.46 | ) |
| | | | | | | |
| | Total distributions | | | (0.06 | ) | | | (0.76 | ) | | | (0.66 | ) | | | (0.56 | ) | | | (0.58 | ) | | | (0.60 | ) |
| | | | | | | |
| | Net asset value, end of period | | $ | 12.98 | | | $ | 11.41 | | | $ | 13.11 | | | $ | 12.07 | | | $ | 11.31 | | | $ | 11.74 | |
| | | | | | | |
| | Total return(b) | | | 14.43 | % | | | (7.38 | )% | | | 13.99 | % | | | 11.92 | % | | | 1.26 | % | | | 9.68 | % |
| | | | | | | |
| | Net assets, end of period (in 000s) | | $ | 140,569 | | | $ | 139,580 | | | $ | 177,178 | | | $ | 142,909 | | | $ | 90,091 | | | $ | 74,125 | |
| | | | | | | |
| | Ratio of net expenses to average net assets | | | 1.88 | %(c) | | | 1.87 | % | | | 1.88 | % | | | 1.91 | % | | | 1.92 | % | | | 1.94 | % |
| | | | | | | |
| | Ratio of total expenses to average net assets | | | 1.91 | %(c) | | | 1.90 | % | | | 1.90 | % | | | 1.94 | % | | | 1.95 | % | | | 1.95 | % |
| | | | | | | |
| | Ratio of net investment income to average net assets | | | 0.98 | %(c) | | | 0.86 | % | | | 0.76 | % | | | 0.92 | % | | | 1.01 | % | | | 1.21 | % |
| | | | | | | |
| | Portfolio turnover rate(d) | | | 10 | % | | | 37 | % | | | 34 | % | | | 23 | % | | | 39 | % | | | 53 | % |
| | (a) | | Calculated based on the average shares outstanding methodology. |
| | (b) | | Assumes investment at the net asset value at the beginning of the period, reinvestment of all distributions, a complete redemption of the investment at the net asset value at the end of the period and no sales or redemption charges (if any). Total returns would be reduced if a sales or redemption charge was taken into account. Returns do not reflect the impact of taxes to shareholders relating to Fund distributions or the redemption of Fund shares. Total returns for periods less than one full year are not annualized. |
| | (d) | | The Fund’s portfolio turnover rate is calculated in accordance with regulatory requirements, without regard to transactions involving short term investments and certain derivatives. If such transactions were included, the Fund’s portfolio turnover rate may be higher. |
| | |
| The accompanying notes are an integral part of these financial statements. | | 53 |
GOLDMAN SACHS U.S. EQUITY DIVIDEND AND PREMIUM FUND
Financial Highlights (continued)
Selected Data for a Share Outstanding Throughout Each Period
| | | | | | | | | | | | | | | | | | | | | | | | | | |
| | | | | Goldman Sachs U.S. Equity Dividend and Premium Fund | |
| | | | | Institutional Shares | |
| | | | | Six Months Ended
June 30, 2019
(Unaudited) | | | Year Ended December 31, | |
| | | | | 2018 | | | 2017 | | | 2016 | | | 2015 | | | 2014 | |
| | Per Share Data | | | | | | | | | | | | | | | | | | | | | | | | |
| | | | | | | |
| | Net asset value, beginning of period | | $ | 11.43 | | | $ | 13.13 | | | $ | 12.09 | | | $ | 11.31 | | | $ | 11.73 | | | $ | 11.24 | |
| | | | | | | |
| | Net investment income(a) | | | 0.13 | | | | 0.27 | | | | 0.24 | | | | 0.24 | | | | 0.25 | | | | 0.27 | |
| | | | | | | |
| | Net realized and unrealized gain (loss) | | | 1.57 | | | | (1.06 | ) | | | 1.60 | | | | 1.22 | | | | 0.04 | | | | 0.95 | |
| | | | | | | |
| | Total from investment operations | | | 1.70 | | | | (0.79 | ) | | | 1.84 | | | | 1.46 | | | | 0.29 | | | | 1.22 | |
| | | | | | | |
| | Distributions to shareholders from net investment income | | | (0.13 | ) | | | (0.27 | ) | | | (0.24 | ) | | | (0.23 | ) | | | (0.24 | ) | | | (0.27 | ) |
| | | | | | | |
| | Distributions to shareholders from net realized gains | | | — | | | | (0.64 | ) | | | (0.56 | ) | | | (0.45 | ) | | | (0.47 | ) | | | (0.46 | ) |
| | | | | | | |
| | Total distributions | | | (0.13 | ) | | | (0.91 | ) | | | (0.80 | ) | | | (0.68 | ) | | | (0.71 | ) | | | (0.73 | ) |
| | | | | | | |
| | Net asset value, end of period | | $ | 13.00 | | | $ | 11.43 | | | $ | 13.13 | | | $ | 12.09 | | | $ | 11.31 | | | $ | 11.73 | |
| | | | | | | |
| | Total return(b) | | | 15.01 | % | | | (6.28 | )% | | | 15.31 | % | | | 13.17 | % | | | 2.49 | % | | | 10.83 | % |
| | | | | | | |
| | Net assets, end of period (in 000s) | | $ | 1,214,658 | | | $ | 1,106,179 | | | $ | 2,565,883 | | | $ | 2,062,756 | | | $ | 1,262,977 | | | $ | 1,149,361 | |
| | | | | | | |
| | Ratio of net expenses to average net assets | | | 0.75 | %(c) | | | 0.74 | % | | | 0.74 | % | | | 0.76 | % | | | 0.77 | % | | | 0.79 | % |
| | | | | | | |
| | Ratio of total expenses to average net assets | | | 0.77 | %(c) | | | 0.76 | % | | | 0.76 | % | | | 0.79 | % | | | 0.80 | % | | | 0.80 | % |
| | | | | | | |
| | Ratio of net investment income to average net assets | | | 2.10 | %(c) | | | 2.01 | % | | | 1.89 | % | | | 2.07 | % | | | 2.15 | % | | | 2.36 | % |
| | | | | | | |
| | Portfolio turnover rate(d) | | | 10 | % | | | 37 | % | | | 34 | % | | | 23 | % | | | 39 | % | | | 53 | % |
| | (a) | | Calculated based on the average shares outstanding methodology. |
| | (b) | | Assumes investment at the net asset value at the beginning of the period, reinvestment of all distributions, a complete redemption of the investment at the net asset value at the end of the period and no sales or redemption charges (if any). Total returns would be reduced if a sales or redemption charge was taken into account. Returns do not reflect the impact of taxes to shareholders relating to Fund distributions or the redemption of Fund shares. Total returns for periods less than one full year are not annualized. |
| | (d) | | The Fund’s portfolio turnover rate is calculated in accordance with regulatory requirements, without regard to transactions involving short term investments and certain derivatives. If such transactions were included, the Fund’s portfolio turnover rate may be higher. |
| | |
| 54 | | The accompanying notes are an integral part of these financial statements. |
GOLDMAN SACHS U.S. EQUITY DIVIDEND AND PREMIUM FUND
Financial Highlights(continued)
Selected Data for a Share Outstanding Throughout Each Period
| | | | | | | | | | | | | | | | | | | | | | | | | | |
| | | | | Goldman Sachs U.S. Equity Dividend and Premium Fund | |
| | | | | Investor Shares(a) | |
| | | | | Six Months Ended
June 30, 2019
(Unaudited) | | | Year Ended December 31, | |
| | | | | 2018 | | | 2017 | | | 2016 | | | 2015 | | | 2014 | |
| | Per Share Data | | | | | | | | | | | | | | | | | | | | | | | | |
| | | | | | | |
| | Net asset value, beginning of period | | $ | 11.44 | | | $ | 13.14 | | | $ | 12.10 | | | $ | 11.33 | | | $ | 11.75 | | | $ | 11.25 | |
| | | | | | | |
| | Net investment income(b) | | | 0.12 | | | | 0.25 | | | | 0.23 | | | | 0.23 | | | | 0.24 | | | | 0.26 | |
| | | | | | | |
| | Net realized and unrealized gain (loss) | | | 1.58 | | | | (1.06 | ) | | | 1.60 | | | | 1.21 | | | | 0.04 | | | | 0.95 | |
| | | | | | | |
| | Total from investment operations | | | 1.70 | | | | (0.81 | ) | | | 1.83 | | | | 1.44 | | | | 0.28 | | | | 1.21 | |
| | | | | | | |
| | Distributions to shareholders from net investment income | | | (0.13 | ) | | | (0.25 | ) | | | (0.23 | ) | | | (0.22 | ) | | | (0.23 | ) | | | (0.25 | ) |
| | | | | | | |
| | Distributions to shareholders from net realized gains | | | — | | | | (0.64 | ) | | | (0.56 | ) | | | (0.45 | ) | | | (0.47 | ) | | | (0.46 | ) |
| | | | | | | |
| | Total distributions | | | (0.13 | ) | | | (0.89 | ) | | | (0.79 | ) | | | (0.67 | ) | | | (0.70 | ) | | | (0.71 | ) |
| | | | | | | |
| | Net asset value, end of period | | $ | 13.01 | | | $ | 11.44 | | | $ | 13.14 | | | $ | 12.10 | | | $ | 11.33 | | | $ | 11.75 | |
| | | | | | | |
| | Total return(c) | | | 15.03 | % | | | (6.47 | )% | | | 15.18 | % | | | 12.92 | % | | | 2.34 | % | | | 10.75 | % |
| | | | | | | |
| | Net assets, end of period (in 000s) | | $ | 462,129 | | | $ | 432,136 | | | $ | 473,178 | | | $ | 174,527 | | | $ | 54,106 | | | $ | 39,960 | |
| | | | | | | |
| | Ratio of net expenses to average net assets | | | 0.88 | %(d) | | | 0.87 | % | | | 0.88 | % | | | 0.91 | % | | | 0.92 | % | | | 0.94 | % |
| | | | | | | |
| | Ratio of total expenses to average net assets | | | 0.91 | %(d) | | | 0.90 | % | | | 0.90 | % | | | 0.94 | % | | | 0.95 | % | | | 0.95 | % |
| | | | | | | |
| | Ratio of net investment income to average net assets | | | 1.97 | %(d) | | | 1.86 | % | | | 1.76 | % | | | 1.90 | % | | | 2.03 | % | | | 2.21 | % |
| | | | | | | |
| | Portfolio turnover rate(e) | | | 10 | % | | | 37 | % | | | 34 | % | | | 23 | % | | | 39 | % | | | 53 | % |
| | (a) | | Effective August 15, 2017, Class IR changed its name to Investor Shares. |
| | (b) | | Calculated based on the average shares outstanding methodology. |
| | (c) | | Assumes investment at the net asset value at the beginning of the period, reinvestment of all distributions, a complete redemption of the investment at the net asset value at the end of the period and no sales or redemption charges (if any). Total returns would be reduced if a sales or redemption charge was taken into account. Returns do not reflect the impact of taxes to shareholders relating to Fund distributions or the redemption of Fund shares. Total returns for periods less than one full year are not annualized. |
| | (e) | | The Fund’s portfolio turnover rate is calculated in accordance with regulatory requirements, without regard to transactions involving short term investments and certain derivatives. If such transactions were included, the Fund’s portfolio turnover rate may be higher. |
| | |
| The accompanying notes are an integral part of these financial statements. | | 55 |
GOLDMAN SACHS U.S. EQUITY DIVIDEND AND PREMIUM FUND
Financial Highlights(continued)
Selected Data for a Share Outstanding Throughout Each Period
| | | | | | | | | | |
| | | | | Goldman Sachs U.S. Equity
Dividend and Premium Fund | |
| | | | | Class P Shares | |
| | | �� | | Six Months Ended
June 30, 2019
(Unaudited) | | | For the period
April 17, 2018* to
December 31, 2018 | |
| | Per Share Data | | | | | | | | |
| | | |
| | Net asset value, beginning of period | | $ | 11.43 | | | $ | 13.12 | |
| | | |
| | Net investment income(a) | | | 0.13 | | | | 0.18 | |
| | | |
| | Net realized and unrealized gain (loss) | | | 1.57 | | | | (1.03 | ) |
| | | |
| | Total from investment operations | | | 1.70 | | | | (0.85 | ) |
| | | |
| | Distributions to shareholders from net investment income | | | (0.13 | ) | | | (0.20 | ) |
| | | |
| | Distributions to shareholders from net realized gains | | | — | | | | (0.64 | ) |
| | | |
| | Total distributions | | | (0.13 | ) | | | (0.84 | ) |
| | | |
| | Net asset value, end of period | | $ | 13.00 | | | $ | 11.43 | |
| | | |
| | Total return(b) | | | 15.02 | % | | | (6.73 | )% |
| | | |
| | Net assets, end of period (in 000s) | | $ | 646,719 | | | $ | 648,424 | |
| | | |
| | Ratio of net expenses to average net assets | | | 0.74 | %(c) | | | 0.73 | %(c) |
| | | |
| | Ratio of total expenses to average net assets | | | 0.76 | %(c) | | | 0.76 | %(c) |
| | | |
| | Ratio of net investment income to average net assets | | | 2.12 | %(c) | | | 1.93 | %(c) |
| | | |
| | Portfolio turnover rate(d) | | | 10 | % | | | 37 | % |
| | * | | Commencement of Operations. |
| | (a) | | Calculated based on the average shares outstanding methodology. |
| | (b) | | Assumes investment at the net asset value at the beginning of the period, reinvestment of all distributions, a complete redemption of the investment at the net asset value at the end of the period and no sales or redemption charges (if any). Total returns would be reduced if a sales or redemption charge was taken into account. Returns do not reflect the impact of taxes to shareholders relating to Fund distributions or the redemption of Fund shares. Total returns for periods less than one full year are not annualized. |
| | (d) | | The Fund’s portfolio turnover rate is calculated in accordance with regulatory requirements, without regard to transactions involving short term investments and certain derivatives. If such transactions were included, the Fund’s portfolio turnover rate may be higher. |
| | |
| 56 | | The accompanying notes are an integral part of these financial statements. |
GOLDMAN SACHS U.S. EQUITY DIVIDEND AND PREMIUM FUND
Financial Highlights(continued)
Selected Data for a Share Outstanding Throughout Each Period
| | | | | | | | | | |
| | | | | Goldman Sachs U.S. Equity Dividend and
Premium Fund | |
| | | | | Class R6 Shares | |
| | | | | Six Months Ended
June 30, 2019
(Unaudited) | | | For the period
April 30, 2018* to
December 31, 2018 | |
| | Per Share Data | | | | | | | | |
| | | |
| | Net asset value, beginning of period | | $ | 11.42 | | | $ | 12.84 | |
| | | |
| | Net investment income(a) | | | 0.13 | | | | 0.17 | |
| | | |
| | Net realized and unrealized gain (loss) | | | 1.58 | | | | (0.75 | ) |
| | | |
| | Total from investment operations | | | 1.71 | | | | (0.58 | ) |
| | | |
| | Distributions to shareholders from net investment income | | | (0.13 | ) | | | (0.20 | ) |
| | | |
| | Distributions to shareholders from net realized gains | | | — | | | | (0.64 | ) |
| | | |
| | Total distributions | | | (0.13 | ) | | | (0.84 | ) |
| | | |
| | Net asset value, end of period | | $ | 13.00 | | | $ | 11.42 | |
| | | |
| | Total return(b) | | | 15.03 | % | | | (4.78 | )% |
| | | |
| | Net assets, end of period (in 000s) | | $ | 271,070 | | | $ | 252,381 | |
| | | |
| | Ratio of net expenses to average net assets | | | 0.74 | %(c) | | | 0.73 | %(c) |
| | | |
| | Ratio of total expenses to average net assets | | | 0.76 | %(c) | | | 0.76 | %(c) |
| | | |
| | Ratio of net investment income to average net assets | | | 2.12 | %(c) | | | 1.91 | %(c) |
| | | |
| | Portfolio turnover rate(d) | | | 10 | % | | | 37 | % |
| | * | | Commencement of Operations. |
| | (a) | | Calculated based on the average shares outstanding methodology. |
| | (b) | | Assumes investment at the net asset value at the beginning of the period, reinvestment of all distributions, a complete redemption of the investment at the net asset value at the end of the period and no sales or redemption charges (if any). Total returns would be reduced if a sales or redemption charge was taken into account. Returns do not reflect the impact of taxes to shareholders relating to Fund distributions or the redemption of Fund shares. Total returns for periods less than one full year are not annualized. |
| | (d) | | The Fund’s portfolio turnover rate is calculated in accordance with regulatory requirements, without regard to transactions involving short term investments and certain derivatives. If such transactions were included, the Fund’s portfolio turnover rate may be higher. |
| | |
| The accompanying notes are an integral part of these financial statements. | | 57 |
GOLDMAN SACHS INTERNATIONAL EQUITY DIVIDEND AND PREMIUM FUND
Financial Highlights(continued)
Selected Data for a Share Outstanding Throughout Each Period
| | | | | | | | | | | | | | | | | | | | | | | | | | |
| | | | | Goldman Sachs International Equity Dividend and Premium Fund | |
| | | | | Class A Shares | |
| | | | | Six Months Ended
June 30, 2019
(Unaudited) | | | Year Ended December 31, | |
| | | | | 2018 | | | 2017 | | | 2016 | | | 2015 | | | 2014 | |
| | Per Share Data | | | | | | | | | | | | | | | | | | | | | | | | |
| | | | | | | |
| | Net asset value, beginning of period | | $ | 6.55 | | | $ | 7.76 | | | $ | 6.43 | | | $ | 6.56 | | | $ | 7.14 | | | $ | 8.00 | |
| | | | | | | |
| | Net investment income(a) | | | 0.15 | | | | 0.20 | | | | 0.15 | | | | 0.18 | | | | 0.16 | (b) | | | 0.25 | (c) |
| | | | | | | |
| | Net realized and unrealized gain (loss) | | | 0.45 | | | | (1.22 | ) | | | 1.34 | | | | (0.14 | ) | | | (0.49 | ) | | | (0.64 | ) |
| | | | | | | |
| | Total from investment operations | | | 0.60 | | | | (1.02 | ) | | | 1.49 | | | | 0.04 | | | | (0.33 | ) | | | (0.39 | ) |
| | | | | | | |
| | Distributions to shareholders from net investment income | | | (0.15 | ) | | | (0.19 | ) | | | (0.16 | ) | | | (0.17 | ) | | | (0.14 | ) | | | (0.23 | ) |
| | | | | | | |
| | Distributions to shareholders from net realized gains | | | — | | | | — | | | | — | | | | — | | | | (0.11 | ) | | | (0.24 | ) |
| | | | | | | |
| | Total distributions | | | (0.15 | ) | | | (0.19 | ) | | | (0.16 | ) | | | (0.17 | ) | | | (0.25 | ) | | | (0.47 | ) |
| | | | | | | |
| | Net asset value, end of period | | $ | 7.00 | | | $ | 6.55 | | | $ | 7.76 | | | $ | 6.43 | | | $ | 6.56 | | | $ | 7.14 | |
| | | | | | | |
| | Total return(d) | | | 9.18 | % | | | (13.34 | )% | | | 23.36 | % | | | 0.66 | % | | | (4.80 | )% | | | (5.30 | )% |
| | | | | | | |
| | Net assets, end of period (in 000s) | | $ | 2,827 | | | $ | 2,232 | | | $ | 3,962 | | | $ | 5,968 | | | $ | 9,532 | | | $ | 10,565 | |
| | | | | | | |
| | Ratio of net expenses to average net assets | | | 1.33 | %(e) | | | 1.34 | % | | | 1.34 | % | | | 1.37 | % | | | 1.37 | % | | | 1.35 | % |
| | | | | | | |
| | Ratio of total expenses to average net assets | | | 1.44 | %(e) | | | 1.38 | % | | | 1.34 | % | | | 1.38 | % | | | 1.37 | % | | | 1.35 | % |
| | | | | | | |
| | Ratio of net investment income to average net assets | | | 4.42 | %(e) | | | 2.71 | % | | | 2.16 | % | | | 2.87 | % | | | 2.26 | %(b) | | | 3.13 | %(c) |
| | | | | | | |
| | Portfolio turnover rate(f) | | | — | % | | | 14 | % | | | 17 | % | | | 18 | % | | | 100 | % | | | 44 | % |
| | (a) | | Calculated based on the average shares outstanding methodology. |
| | (b) | | Reflects income recognized from a corporate action which amounted to $0.03 per share and 0.38% of average net assets. |
| | (c) | | Reflects income recognized from a corporate action which amounted to $0.05 per share and 0.69% of average net assets. |
| | (d) | | Assumes investment at the net asset value at the beginning of the period, reinvestment of all distributions, a complete redemption of the investment at the net asset value at the end of the period and no sales or redemption charges (if any). Total returns would be reduced if a sales or redemption charge was taken into account. Returns do not reflect the impact of taxes to shareholders relating to Fund distributions or the redemption of Fund shares. Total returns for periods less than one full year are not annualized. |
| | (f) | | The Fund’s portfolio turnover rate is calculated in accordance with regulatory requirements, without regard to transactions involving short term investments and certain derivatives. If such transactions were included, the Fund’s portfolio turnover rate may be higher. |
| | |
| 58 | | The accompanying notes are an integral part of these financial statements. |
GOLDMAN SACHS INTERNATIONAL EQUITY DIVIDEND AND PREMIUM FUND
Financial Highlights(continued)
Selected Data for a Share Outstanding Throughout Each Period
| | | | | | | | | | | | | | | | | | | | | | | | | | |
| | | | | Goldman Sachs International Equity Dividend and Premium Fund | |
| | | | | Class C Shares | |
| | | | | Six Months Ended
June 30, 2019
(Unaudited) | | | Year Ended December 31, | |
| | | | | 2018 | | | 2017 | | | 2016 | | | 2015 | | | 2014 | |
| | Per Share Data | | | | | | | | | | | | | | | | | | | | | | | | |
| | | | | | | |
| | Net asset value, beginning of period | | $ | 6.32 | | | $ | 7.48 | | | $ | 6.21 | | | $ | 6.35 | | | $ | 6.94 | | | $ | 7.80 | |
| | | | | | | |
| | Net investment income(a) | | | 0.11 | | | | 0.16 | | | | 0.09 | | | | 0.12 | | | | 0.09 | (b) | | | 0.18 | (c) |
| | | | | | | |
| | Net realized and unrealized gain (loss) | | | 0.44 | | | | (1.20 | ) | | | 1.30 | | | | (0.14 | ) | | | (0.47 | ) | | | (0.62 | ) |
| | | | | | | |
| | Total from investment operations | | | 0.55 | | | | (1.04 | ) | | | 1.39 | | | | (0.02 | ) | | | (0.38 | ) | | | (0.44 | ) |
| | | | | | | |
| | Distributions to shareholders from net investment income | | | (0.12 | ) | | | (0.12 | ) | | | (0.12 | ) | | | (0.12 | ) | | | (0.10 | ) | | | (0.18 | ) |
| | | | | | | |
| | Distributions to shareholders from net realized gains | | | — | | | | — | | | | — | | | | — | | | | (0.11 | ) | | | (0.24 | ) |
| | | | | | | |
| | Total distributions | | | (0.12 | ) | | | (0.12 | ) | | | (0.12 | ) | | | (0.12 | ) | | | (0.21 | ) | | | (0.42 | ) |
| | | | | | | |
| | Net asset value, end of period | | $ | 6.75 | | | $ | 6.32 | | | $ | 7.48 | | | $ | 6.21 | | | $ | 6.35 | | | $ | 6.94 | |
| | | | | | | |
| | Total return(d) | | | 8.75 | % | | | (14.01 | )% | | | 22.50 | % | | | (0.21 | )% | | | (5.59 | )% | | | (6.04 | )% |
| | | | | | | |
| | Net assets, end of period (in 000s) | | $ | 892 | | | $ | 1,252 | | | $ | 4,276 | | | $ | 2,549 | | | $ | 3,329 | | | $ | 2,634 | |
| | | | | | | |
| | Ratio of net expenses to average net assets | | | 2.08 | %(e) | | | 2.09 | % | | | 2.09 | % | | | 2.12 | % | | | 2.12 | % | | | 2.10 | % |
| | | | | | | |
| | Ratio of total expenses to average net assets | | | 2.19 | %(e) | | | 2.11 | % | | | 2.09 | % | | | 2.13 | % | | | 2.12 | % | | | 2.10 | % |
| | | | | | | |
| | Ratio of net investment income to average net assets | | | 3.41 | %(e) | | | 2.24 | % | | | 1.29 | % | | | 2.00 | % | | | 1.38 | %(b) | | | 2.32 | %(c) |
| | | | | | | |
| | Portfolio turnover rate(f) | | | — | % | | | 14 | % | | | 17 | % | | | 18 | % | | | 100 | % | | | 44 | % |
| | (a) | | Calculated based on the average shares outstanding methodology. |
| | (b) | | Reflects income recognized from a corporate action which amounted to $0.03 per share and 0.38% of average net assets. |
| | (c) | | Reflects income recognized from a corporate action which amounted to $0.05 per share and 0.69% of average net assets. |
| | (d) | | Assumes investment at the net asset value at the beginning of the period, reinvestment of all distributions, a complete redemption of the investment at the net asset value at the end of the period and no sales or redemption charges (if any). Total returns would be reduced if a sales or redemption charge was taken into account. Returns do not reflect the impact of taxes to shareholders relating to Fund distributions or the redemption of Fund shares. Total returns for periods less than one full year are not annualized. |
| | (f) | | The Fund’s portfolio turnover rate is calculated in accordance with regulatory requirements, without regard to transactions involving short term investments and certain derivatives. If such transactions were included, the Fund’s portfolio turnover rate may be higher. |
| | |
| The accompanying notes are an integral part of these financial statements. | | 59 |
GOLDMAN SACHS INTERNATIONAL EQUITY DIVIDEND AND PREMIUM FUND
Financial Highlights(continued)
Selected Data for a Share Outstanding Throughout Each Period
| | | | | | | | | | | | | | | | | | | | | | | | | | |
| | | | | Goldman Sachs International Equity Dividend and Premium Fund | |
| | | | | Institutional Shares | |
| | | | | Six Months Ended
June 30, 2019
(Unaudited) | | | Year Ended December 31, | |
| | | | | 2018 | | | 2017 | | | 2016 | | | 2015 | | | 2014 | |
| | Per Share Data | | | | | | | | | | | | | | | | | | | | | | | | |
| | | | | | | |
| | Net asset value, beginning of period | | $ | 6.42 | | | $ | 7.62 | | | $ | 6.32 | | | $ | 6.46 | | | $ | 7.03 | | | $ | 7.89 | |
| | | | | | | |
| | Net investment income(a) | | | 0.16 | | | | 0.31 | | | | 0.18 | | | | 0.19 | | | | 0.18 | (b) | | | 0.27 | (c) |
| | | | | | | |
| | Net realized and unrealized gain (loss) | | | 0.45 | | | | (1.29 | ) | | | 1.31 | | | | (0.14 | ) | | | (0.48 | ) | | | (0.63 | ) |
| | | | | | | |
| | Total from investment operations | | | 0.61 | | | | (0.98 | ) | | | 1.49 | | | | 0.05 | | | | (0.30 | ) | | | (0.36 | ) |
| | | | | | | |
| | Distributions to shareholders from net investment income | | | (0.16 | ) | | | (0.22 | ) | | | (0.19 | ) | | | (0.19 | ) | | | (0.16 | ) | | | (0.26 | ) |
| | | | | | | |
| | Distributions to shareholders from net realized gains | | | — | | | | — | | | | — | | | | — | | | | (0.11 | ) | | | (0.24 | ) |
| | | | | | | |
| | Total distributions | | | (0.16 | ) | | | (0.22 | ) | | | (0.19 | ) | | | (0.19 | ) | | | (0.27 | ) | | | (0.50 | ) |
| | | | | | | |
| | Net asset value, end of period | | $ | 6.87 | | | $ | 6.42 | | | $ | 7.62 | | | $ | 6.32 | | | $ | 6.46 | | | $ | 7.03 | |
| | | | | | | |
| | Total return(d) | | | 9.38 | % | | | (12.96 | )% | | | 23.85 | % | | | 0.92 | % | | | (4.42 | )% | | | (4.99 | )% |
| | | | | | | |
| | Net assets, end of period (in 000s) | | $ | 11,150 | | | $ | 15,696 | | | $ | 399,955 | | | $ | 307,311 | | | $ | 281,204 | | | $ | 415,503 | |
| | | | | | | |
| | Ratio of net expenses to average net assets | | | 0.94 | %(e) | | | 0.95 | % | | | 0.95 | % | | | 0.97 | % | | | 0.97 | % | | | 0.95 | % |
| | | | | | | |
| | Ratio of total expenses to average net assets | | | 1.05 | %(e) | | | 0.95 | % | | | 0.95 | % | | | 0.98 | % | | | 0.97 | % | | | 0.95 | % |
| | | | | | | |
| | Ratio of net investment income to average net assets | | | 4.75 | %(e) | | | 4.12 | % | | | 2.58 | % | | | 3.08 | % | | | 2.65 | %(b) | | | 3.45 | %(c) |
| | | | | | | |
| | Portfolio turnover rate(f) | | | — | % | | | 14 | % | | | 17 | % | | | 18 | % | | | 100 | % | | | 44 | % |
| | (a) | | Calculated based on the average shares outstanding methodology. |
| | (b) | | Reflects income recognized from a corporate action which amounted to $0.03 per share and 0.38% of average net assets. |
| | (c) | | Reflects income recognized from a corporate action which amounted to $0.05 per share and 0.69% of average net assets. |
| | (d) | | Assumes investment at the net asset value at the beginning of the period, reinvestment of all distributions, a complete redemption of the investment at the net asset value at the end of the period and no sales or redemption charges (if any). Total returns would be reduced if a sales or redemption charge was taken into account. Returns do not reflect the impact of taxes to shareholders relating to Fund distributions or the redemption of Fund shares. Total returns for periods less than one full year are not annualized. |
| | (f) | | The Fund’s portfolio turnover rate is calculated in accordance with regulatory requirements, without regard to transactions involving short term investments and certain derivatives. If such transactions were included, the Fund’s portfolio turnover rate may be higher. |
| | |
| 60 | | The accompanying notes are an integral part of these financial statements. |
GOLDMAN SACHS INTERNATIONAL EQUITY DIVIDEND AND PREMIUM FUND
Financial Highlights(continued)
Selected Data for a Share Outstanding Throughout Each Period
| | | | | | | | | | | | | | | | | | | | | | | | | | |
| | | | | Goldman Sachs International Equity Dividend and Premium Fund | |
| | | | | Investor Shares(a) | |
| | | | | Six Months Ended
June 30, 2019
(Unaudited) | | | Year Ended December 31, | |
| | | | | 2018 | | | 2017 | | | 2016 | | | 2015 | | | 2014 | |
| | Per Share Data | | | | | | | | | | | | | | | | | | | | | | | | |
| | | | | | | |
| | Net asset value, beginning of period | | $ | 6.41 | | | $ | 7.60 | | | $ | 6.31 | | | $ | 6.44 | | | $ | 7.02 | | | $ | 7.88 | |
| | | | | | | |
| | Net investment income(b) | | | 0.16 | | | | 0.20 | | | | 0.17 | | | | 0.17 | | | | 0.16 | (c) | | | 0.28 | (d) |
| | | | | | | |
| | Net realized and unrealized gain (loss) | | | 0.44 | | | | (1.18 | ) | | | 1.30 | | | | (0.11 | ) | | | (0.48 | ) | | | (0.66 | ) |
| | | | | | | |
| | Total from investment operations | | | 0.60 | | | | (0.98 | ) | | | 1.47 | | | | 0.06 | | | | (0.32 | ) | | | (0.38 | ) |
| | | | | | | |
| | Distributions to shareholders from net investment income | | | (0.16 | ) | | | (0.21 | ) | | | (0.18 | ) | | | (0.19 | ) | | | (0.15 | ) | | | (0.24 | ) |
| | | | | | | |
| | Distributions to shareholders from net realized gains | | | — | | | | — | | | | — | | | | — | | | | (0.11 | ) | | | (0.24 | ) |
| | | | | | | |
| | Total distributions | | | (0.16 | ) | | | (0.21 | ) | | | (0.18 | ) | | | (0.19 | ) | | | (0.26 | ) | | | (0.48 | ) |
| | | | | | | |
| | Net asset value, end of period | | $ | 6.85 | | | $ | 6.41 | | | $ | 7.60 | | | $ | 6.31 | | | $ | 6.44 | | | $ | 7.02 | |
| | | | | | | |
| | Total return(e) | | | 9.35 | % | | | (13.10 | )% | | | 23.58 | % | | | 0.96 | % | | | (4.69 | )% | | | (5.16 | )% |
| | | | | | | |
| | Net assets, end of period (in 000s) | | $ | 10,910 | | | $ | 8,207 | | | $ | 6,048 | | | $ | 2,111 | | | $ | 749 | | | $ | 862 | |
| | | | | | | |
| | Ratio of net expenses to average net assets | | | 1.08 | %(f) | | | 1.09 | % | | | 1.09 | % | | | 1.12 | % | | | 1.12 | % | | | 1.09 | % |
| | | | | | | |
| | Ratio of total expenses to average net assets | | | 1.19 | %(f) | | | 1.14 | % | | | 1.09 | % | | | 1.13 | % | | | 1.12 | % | | | 1.09 | % |
| | | | | | | |
| | Ratio of net investment income to average net assets | | | 4.76 | %(f) | | | 2.76 | % | | | 2.36 | % | | | 2.64 | % | | | 2.33 | %(c) | | | 3.52 | %(d) |
| | | | | | | |
| | Portfolio turnover rate(g) | | | — | % | | | 14 | % | | | 17 | % | | | 18 | % | | | 100 | % | | | 44 | % |
| | (a) | | Effective August 15, 2017, Class IR changed its name to Investor Shares. |
| | (b) | | Calculated based on the average shares outstanding methodology. |
| | (c) | | Reflects income recognized from a corporate action which amounted to $0.03 per share and 0.38% of average net assets. |
| | (d) | | Reflects income recognized from a corporate action which amounted to $0.05 per share and 0.69% of average net assets. |
| | (e) | | Assumes investment at the net asset value at the beginning of the period, reinvestment of all distributions, a complete redemption of the investment at the net asset value at the end of the period and no sales or redemption charges (if any). Total returns would be reduced if a sales or redemption charge was taken into account. Returns do not reflect the impact of taxes to shareholders relating to Fund distributions or the redemption of Fund shares. Total returns for periods less than one full year are not annualized. |
| | (g) | | The Fund’s portfolio turnover rate is calculated in accordance with regulatory requirements, without regard to transactions involving short term investments and certain derivatives. If such transactions were included, the Fund’s portfolio turnover rate may be higher. |
| | |
| The accompanying notes are an integral part of these financial statements. | | 61 |
GOLDMAN SACHS INTERNATIONAL EQUITY DIVIDEND AND PREMIUM FUND
Financial Highlights(continued)
Selected Data for a Share Outstanding Throughout Each Period
| | | | | | | | | | |
| | | | | Goldman Sachs International Equity
Dividend and Premium Fund | |
| | | | | Class P Shares | |
| | | | | Six Months Ended
June 30, 2019
(Unaudited) | | | For the period
April 17, 2018* to
December 31, 2018 | |
| | Per Share Data | | | | | | | | |
| | | |
| | Net asset value, beginning of period | | $ | 6.43 | | | $ | 7.71 | |
| | | |
| | Net investment income(a) | | | 0.16 | | | | 0.09 | |
| | | |
| | Net realized and unrealized gain (loss) | | | 0.44 | | | | (1.18 | ) |
| | | |
| | Total from investment operations | | | 0.60 | | | | (1.09 | ) |
| | | |
| | Distributions to shareholders from net investment income | | | (0.16 | ) | | | (0.19 | ) |
| | | |
| | Net asset value, end of period | | $ | 6.87 | | | $ | 6.43 | |
| | | |
| | Total return(b) | | | 9.39 | % | | | (14.35 | )% |
| | | |
| | Net assets, end of period (in 000s) | | $ | 149,712 | | | $ | 162,129 | |
| | | |
| | Ratio of net expenses to average net assets | | | 0.93 | %(c) | | | 0.93 | %(c) |
| | | |
| | Ratio of total expenses to average net assets | | | 1.04 | %(c) | | | 1.03 | %(c) |
| | | |
| | Ratio of net investment income to average net assets | | | 4.73 | %(c) | | | 1.81 | %(c) |
| | | |
| | Portfolio turnover rate(d) | | | — | % | | | 14 | % |
| | * | | Commencement of Operations. |
| | (a) | | Calculated based on the average shares outstanding methodology. |
| | (b) | | Assumes investment at the net asset value at the beginning of the period, reinvestment of all distributions, a complete redemption of the investment at the net asset value at the end of the period and no sales or redemption charges (if any). Total returns would be reduced if a sales or redemption charge was taken into account. Returns do not reflect the impact of taxes to shareholders relating to Fund distributions or the redemption of Fund shares. Total returns for periods less than one full year are not annualized. |
| | (d) | | The Fund’s portfolio turnover rate is calculated in accordance with regulatory requirements, without regard to transactions involving short term investments and certain derivatives. If such transactions were included, the Fund’s portfolio turnover rate may be higher. |
| | |
| 62 | | The accompanying notes are an integral part of these financial statements. |
GOLDMAN SACHS INTERNATIONAL EQUITY DIVIDEND AND PREMIUM FUND
Financial Highlights(continued)
Selected Data for a Share Outstanding Throughout Each Period
| | | | | | | | | | |
| | | | | Goldman Sachs International Equity
Dividend and Premium Fund | |
| | | | | Class R6 Shares | |
| | | | | Six Months Ended
June 30, 2019
(Unaudited) | | | For the period
April 30, 2018* to
December 31, 2018 | |
| | Per Share Data | | | | | | | | |
| | | |
| | Net asset value, beginning of period | | $ | 6.42 | | | $ | 7.60 | |
| | | |
| | Net investment income(a) | | | 0.16 | | | | 0.08 | |
| | | |
| | Net realized and unrealized gain (loss) | | | 0.44 | | | | (1.07 | ) |
| | | |
| | Total from investment operations | | | 0.60 | | | | (0.99 | ) |
| | | |
| | Distributions to shareholders from net investment income | | | (0.16 | ) | | | (0.19 | ) |
| | | |
| | Net asset value, end of period | | $ | 6.86 | | | $ | 6.42 | |
| | | |
| | Total return(b) | | | 9.40 | % | | | (13.25 | )% |
| | | |
| | Net assets, end of period (in 000s) | | $ | 135,254 | | | $ | 125,311 | |
| | | |
| | Ratio of net expenses to average net assets | | | 0.93 | %(c) | | | 0.93 | %(c) |
| | | |
| | Ratio of total expenses to average net assets | | | 1.04 | %(c) | | | 1.03 | %(c) |
| | | |
| | Ratio of net investment income to average net assets | | | 4.81 | %(c) | | | 1.81 | %(c) |
| | | |
| | Portfolio turnover rate(d) | | | — | % | | | 14 | % |
| | * | | Commencement of Operations. |
| | (a) | | Calculated based on the average shares outstanding methodology. |
| | (b) | | Assumes investment at the net asset value at the beginning of the period, reinvestment of all distributions, a complete redemption of the investment at the net asset value at the end of the period and no sales or redemption charges (if any). Total returns would be reduced if a sales or redemption charge was taken into account. Returns do not reflect the impact of taxes to shareholders relating to Fund distributions or the redemption of Fund shares. Total returns for periods less than one full year are not annualized. |
| | (d) | | The Fund’s portfolio turnover rate is calculated in accordance with regulatory requirements, without regard to transactions involving short term investments and certain derivatives. If such transactions were included, the Fund’s portfolio turnover rate may be higher. |
| | |
| The accompanying notes are an integral part of these financial statements. | | 63 |
GOLDMAN SACHS U.S.TAX-MANAGED EQUITY FUND
Financial Highlights(continued)
Selected Data for a Share Outstanding Throughout Each Period
| | | | | | | | | | | | | | | | | | | | | | | | | | |
| | | | | Goldman Sachs U.S.Tax-Managed Equity Fund | |
| | | | | Class A Shares | |
| | | | | Six Months Ended
June 30, 2019
(Unaudited) | | | Year Ended December 31, | |
| | | | | 2018 | | | 2017 | | | 2016 | | | 2015 | | | 2014 | |
| | Per Share Data | | | | | | | | | | | | | | | | | | | | | | | | |
| | | | | | | |
| | Net asset value, beginning of period | | $ | 20.43 | | | $ | 22.37 | | | $ | 18.75 | | | $ | 17.28 | | | $ | 17.44 | | | $ | 15.45 | |
| | | | | | | |
| | Net investment income(a) | | | 0.06 | | | | 0.10 | | | | 0.13 | | | | 0.11 | | | | 0.13 | | | | 0.09 | |
| | | | | | | |
| | Net realized and unrealized gain (loss) | | | 3.05 | | | | (1.93 | ) | | | 3.60 | | | | 1.47 | | | | (0.18 | ) | | | 1.97 | |
| | | | | | | |
| | Total from investment operations | | | 3.11 | | | | (1.83 | ) | | | 3.73 | | | | 1.58 | | | | (0.05 | ) | | | 2.06 | |
| | | | | | | |
| | Distributions to shareholders from net investment income | | | — | | | | (0.11 | ) | | | (0.11 | ) | | | (0.11 | ) | | | (0.11 | ) | | | (0.07 | ) |
| | | | | | | |
| | Net asset value, end of period | | $ | 23.54 | | | $ | 20.43 | | | $ | 22.37 | | | $ | 18.75 | | | $ | 17.28 | | | $ | 17.44 | |
| | | | | | | |
| | Total return(b) | | | 15.22 | % | | | (8.15 | )% | | | 19.88 | % | | | 9.09 | % | | | (0.28 | )% | | | 13.32 | % |
| | | | | | | |
| | Net assets, end of period (in 000s) | | $ | 63,654 | | | $ | 57,833 | | | $ | 50,218 | | | $ | 51,206 | | | $ | 57,913 | | | $ | 51,253 | |
| | | | | | | |
| | Ratio of net expenses to average net assets | | | 1.12 | %(c) | | | 1.14 | % | | | 1.15 | % | | | 1.17 | % | | | 1.17 | % | | | 1.18 | % |
| | | | | | | |
| | Ratio of total expenses to average net assets | | | 1.14 | %(c) | | | 1.14 | % | | | 1.15 | % | | | 1.17 | % | | | 1.17 | % | | | 1.19 | % |
| | | | | | | |
| | Ratio of net investment income to average net assets | | | 0.57 | %(c) | | | 0.44 | % | | | 0.61 | % | | | 0.61 | % | | | 0.73 | % | | | 0.52 | % |
| | | | | | | |
| | Portfolio turnover rate(d) | | | 105 | % | | | 152 | % | | | 108 | % | | | 118 | % | | | 96 | % | | | 57 | % |
| | (a) | | Calculated based on the average shares outstanding methodology. |
| | (b) | | Assumes investment at the net asset value at the beginning of the period, reinvestment of all distributions, a complete redemption of the investment at the net asset value at the end of the period and no sales or redemption charges (if any). Total returns would be reduced if a sales or redemption charge was taken into account. Returns do not reflect the impact of taxes to shareholders relating to Fund distributions or the redemption of Fund shares. Total returns for periods less than one full year are not annualized. |
| | (d) | | The Fund’s portfolio turnover rate is calculated in accordance with regulatory requirements, without regard to transactions involving short term investments and certain derivatives. If such transactions were included, the Fund’s portfolio turnover rate may be higher. |
| | |
| 64 | | The accompanying notes are an integral part of these financial statements. |
GOLDMAN SACHS U.S.TAX-MANAGED EQUITY FUND
Financial Highlights (continued)
Selected Data for a Share Outstanding Throughout Each Period
| | | | | | | | | | | | | | | | | | | | | | | | | | |
| | | | | Goldman Sachs U.S.Tax-Managed Equity Fund | |
| | | | | Class C Shares | |
| | | | | Six Months Ended
June 30, 2019
(Unaudited) | | | Year Ended December 31, | |
| | | | | 2018 | | | 2017 | | | 2016 | | | 2015 | | | 2014 | |
| | Per Share Data | | | | | | | | | | | | | | | | | | | | | | | | |
| | | | | | | |
| | Net asset value, beginning of period | | $ | 19.36 | | | $ | 21.24 | | | $ | 17.86 | | | $ | 16.48 | | | $ | 16.67 | | | $ | 14.82 | |
| | | | | | | |
| | Net investment loss(a) | | | (0.02 | ) | | | (0.07 | ) | | | (0.03 | ) | | | (0.02 | ) | | | — | (b) | | | (0.04 | ) |
| | | | | | | |
| | Net realized and unrealized gain (loss) | | | 2.89 | | | | (1.81 | ) | | | 3.41 | | | | 1.40 | | | | (0.18 | ) | | | 1.89 | |
| | | | | | | |
| | Total from investment operations | | | 2.87 | | | | (1.88 | ) | | | 3.38 | | | | 1.38 | | | | (0.18 | ) | | | 1.85 | |
| | | | | | | |
| | Distributions to shareholders from net investment income | | | — | | | | — | | | | — | | | | — | | | | (0.01 | ) | | | — | |
| | | | | | | |
| | Net asset value, end of period | | $ | 22.23 | | | $ | 19.36 | | | $ | 21.24 | | | $ | 17.86 | | | $ | 16.48 | | | $ | 16.67 | |
| | | | | | | |
| | Total return(c) | | | 14.82 | % | | | (8.85 | )% | | | 18.93 | % | | | 8.35 | % | | | (1.05 | )% | | | 12.48 | % |
| | | | | | | |
| | Net assets, end of period (in 000s) | | $ | 15,860 | | | $ | 14,380 | | | $ | 22,337 | | | $ | 22,512 | | | $ | 22,194 | | | $ | 15,750 | |
| | | | | | | |
| | Ratio of net expenses to average net assets | | | 1.87 | %(d) | | | 1.88 | % | | | 1.90 | % | | | 1.92 | % | | | 1.92 | % | | | 1.93 | % |
| | | | | | | |
| | Ratio of total expenses to average net assets | | | 1.89 | %(d) | | | 1.89 | % | | | 1.90 | % | | | 1.92 | % | | | 1.92 | % | | | 1.94 | % |
| | | | | | | |
| | Ratio of net investment loss to average net assets | | | (0.18 | )%(d) | | | (0.33 | )% | | | (0.14 | )% | | | (0.15 | )% | | | (0.02 | )% | | | (0.22 | )% |
| | | | | | | |
| | Portfolio turnover rate(e) | | | 105 | % | | | 152 | % | | | 108 | % | | | 118 | % | | | 96 | % | | | 57 | % |
| | (a) | | Calculated based on the average shares outstanding methodology. |
| | (b) | | Amount is less than $0.005 per share. |
| | (c) | | Assumes investment at the net asset value at the beginning of the period, reinvestment of all distributions, a complete redemption of the investment at the net asset value at the end of the period and no sales or redemption charges (if any). Total returns would be reduced if a sales or redemption charge was taken into account. Returns do not reflect the impact of taxes to shareholders relating to Fund distributions or the redemption of Fund shares. Total returns for periods less than one full year are not annualized. |
| | (e) | | The Fund’s portfolio turnover rate is calculated in accordance with regulatory requirements, without regard to transactions involving short term investments and certain derivatives. If such transactions were included, the Fund’s portfolio turnover rate may be higher. |
| | |
| The accompanying notes are an integral part of these financial statements. | | 65 |
GOLDMAN SACHS U.S.TAX-MANAGED EQUITY FUND
Financial Highlights(continued)
Selected Data for a Share Outstanding Throughout Each Period
| | | | | | | | | | | | | | | | | | | | | | | | | | |
| | | | | Goldman Sachs U.S.Tax-Managed Equity Fund | |
| | | | | Institutional Shares | |
| | | | | Six Months Ended
June 30, 2019
(Unaudited) | | | Year Ended December 31, | |
| | | | | 2018 | | | 2017 | | | 2016 | | | 2015 | | | 2014 | |
| | Per Share Data | | | | | | | | | | | | | | | | | | | | | | | | |
| | | | | | | |
| | Net asset value, beginning of period | | $ | 20.91 | | | $ | 22.71 | | | $ | 19.04 | | | $ | 17.53 | | | $ | 17.69 | | | $ | 15.66 | |
| | | | | | | |
| | Net investment income(a) | | | 0.11 | | | | 0.19 | | | | 0.21 | | | | 0.18 | | | | 0.20 | | | | 0.15 | |
| | | | | | | |
| | Net realized and unrealized gain (loss) | | | 3.13 | | | | (1.97 | ) | | | 3.65 | | | | 1.51 | | | | (0.18 | ) | | | 2.01 | |
| | | | | | | |
| | Total from investment operations | | | 3.24 | | | | (1.78 | ) | | | 3.86 | | | | 1.69 | | | | 0.02 | | | | 2.16 | |
| | | | | | | |
| | Distributions to shareholders from net investment income | | | — | | | | (0.02 | ) | | | (0.19 | ) | | | (0.18 | ) | | | (0.18 | ) | | | (0.13 | ) |
| | | | | | | |
| | Net asset value, end of period | | $ | 24.15 | | | $ | 20.91 | | | $ | 22.71 | | | $ | 19.04 | | | $ | 17.53 | | | $ | 17.69 | |
| | | | | | | |
| | Total return(b) | | | 15.44 | % | | | (7.78 | )% | | | 20.29 | % | | | 9.61 | % | | | 0.10 | % | | | 13.78 | % |
| | | | | | | |
| | Net assets, end of period (in 000s) | | $ | 39,459 | | | $ | 34,812 | | | $ | 1,395,335 | | | $ | 1,057,850 | | | $ | 957,273 | | | $ | 735,421 | |
| | | | | | | |
| | Ratio of net expenses to average net assets | | | 0.74 | %(c) | | | 0.74 | % | | | 0.75 | % | | | 0.77 | % | | | 0.77 | % | | | 0.78 | % |
| | | | | | | |
| | Ratio of total expenses to average net assets | | | 0.75 | %(c) | | | 0.74 | % | | | 0.75 | % | | | 0.77 | % | | | 0.77 | % | | | 0.79 | % |
| | | | | | | |
| | Ratio of net investment income to average net assets | | | 0.95 | %(c) | | | 0.79 | % | | | 1.02 | % | | | 1.01 | % | | | 1.12 | % | | | 0.93 | % |
| | | | | | | |
| | Portfolio turnover rate(d) | | | 105 | % | | | 152 | % | | | 108 | % | | | 118 | % | | | 96 | % | | | 57 | % |
| | (a) | | Calculated based on the average shares outstanding methodology. |
| | (b) | | Assumes investment at the net asset value at the beginning of the period, reinvestment of all distributions, a complete redemption of the investment at the net asset value at the end of the period and no sales or redemption charges (if any). Total returns would be reduced if a sales or redemption charge was taken into account. Returns do not reflect the impact of taxes to shareholders relating to Fund distributions or the redemption of Fund shares. Total returns for periods less than one full year are not annualized. |
| | (d) | | The Fund’s portfolio turnover rate is calculated in accordance with regulatory requirements, without regard to transactions involving short term investments and certain derivatives. If such transactions were included, the Fund’s portfolio turnover rate may be higher. |
| | |
| 66 | | The accompanying notes are an integral part of these financial statements. |
GOLDMAN SACHS U.S.TAX-MANAGED EQUITY FUND
Financial Highlights(continued)
Selected Data for a Share Outstanding Throughout Each Period
| | | | | | | | | | | | | | | | | | | | | | | | | | |
| | | | | Goldman Sachs U.S.Tax-Managed Equity Fund | |
| | | | | Service Shares | |
| | | | | Six Months Ended
June 30, 2019
(Unaudited) | | | Year Ended December 31, | |
| | | | | 2018 | | | 2017 | | | 2016 | | | 2015 | | | 2014 | |
| | Per Share Data | | | | | | | | | | | | | | | | | | | | | | | | |
| | | | | | | |
| | Net asset value, beginning of period | | $ | 20.57 | | | $ | 22.51 | | | $ | 18.88 | | | $ | 17.33 | | | $ | 17.53 | | | $ | 15.49 | |
| | | | | | | |
| | Net investment income(a) | | | 0.06 | | | | 0.08 | | | | 0.11 | | | | 0.09 | | | | 0.12 | | | | 0.04 | |
| | | | | | | |
| | Net realized and unrealized gain (loss) | | | 3.06 | | | | (1.94 | ) | | | 3.61 | | | | 1.49 | | | | (0.19 | ) | | | 2.00 | |
| | | | | | | |
| | Total from investment operations | | | 3.12 | | | | (1.86 | ) | | | 3.72 | | | | 1.58 | | | | (0.07 | ) | | | 2.04 | |
| | | | | | | |
| | Distributions to shareholders from net investment income | | | — | | | | (0.08 | ) | | | (0.09 | ) | | | (0.03 | ) | | | (0.13 | ) | | | — | |
| | | | | | | |
| | Net asset value, end of period | | $ | 23.69 | | | $ | 20.57 | | | $ | 22.51 | | | $ | 18.88 | | | $ | 17.33 | | | $ | 17.53 | |
| | | | | | | |
| | Total return(b) | | | 15.17 | % | | | (8.26 | )% | | | 19.71 | % | | | 9.07 | % | | | (0.41 | )% | | | 13.17 | % |
| | | | | | | |
| | Net assets, end of period (in 000s) | | $ | 1,572 | | | $ | 732 | | | $ | 736 | | | $ | 614 | | | $ | 1,236 | | | $ | 58 | |
| | | | | | | |
| | Ratio of net expenses to average net assets | | | 1.24 | %(c) | | | 1.25 | % | | | 1.25 | % | | | 1.27 | % | | | 1.27 | % | | | 1.28 | % |
| | | | | | | |
| | Ratio of total expenses to average net assets | | | 1.25 | %(c) | | | 1.25 | % | | | 1.25 | % | | | 1.27 | % | | | 1.27 | % | | | 1.29 | % |
| | | | | | | |
| | Ratio of net investment income to average net assets | | | 0.50 | %(c) | | | 0.33 | % | | | 0.52 | % | | | 0.53 | % | | | 0.67 | % | | | 0.25 | % |
| | | | | | | |
| | Portfolio turnover rate(d) | | | 105 | % | | | 152 | % | | | 108 | % | | | 118 | % | | | 96 | % | | | 57 | % |
| | (a) | | Calculated based on the average shares outstanding methodology. |
| | (b) | | Assumes investment at the net asset value at the beginning of the period, reinvestment of all distributions, a complete redemption of the investment at the net asset value at the end of the period and no sales or redemption charges (if any). Total returns would be reduced if a sales or redemption charge was taken into account. Returns do not reflect the impact of taxes to shareholders relating to Fund distributions or the redemption of Fund shares. Total returns for periods less than one full year are not annualized. |
| | (d) | | The Fund’s portfolio turnover rate is calculated in accordance with regulatory requirements, without regard to transactions involving short term investments and certain derivatives. If such transactions were included, the Fund’s portfolio turnover rate may be higher. |
| | |
| The accompanying notes are an integral part of these financial statements. | | 67 |
GOLDMAN SACHS U.S.TAX-MANAGED EQUITY FUND
Financial Highlights(continued)
Selected Data for a Share Outstanding Throughout Each Period
| | | | | | | | | | | | | | | | | | | | | | | | | | |
| | | | | Goldman Sachs U.S.Tax-Managed Equity Fund | |
| | | | | Investor Shares(a) | |
| | | | | Six Months Ended
June 30, 2019
(Unaudited) | | | Year Ended December 31, | |
| | | | | 2018 | | | 2017 | | | 2016 | | | 2015 | | | 2014 | |
| | Per Share Data | | | | | | | | | | | | | | | | | | | | | | | | |
| | | | | | | |
| | Net asset value, beginning of period | | $ | 20.73 | | | $ | 22.70 | | | $ | 19.03 | | | $ | 17.54 | | | $ | 17.70 | | | $ | 15.68 | |
| | | | | | | |
| | Net investment income(b) | | | 0.09 | | | | 0.16 | | | | 0.18 | | | | 0.15 | | | | 0.18 | | | | 0.13 | |
| | | | | | | |
| | Net realized and unrealized gain (loss) | | | 3.10 | | | | (1.97 | ) | | | 3.65 | | | | 1.50 | | | | (0.18 | ) | | | 2.00 | |
| | | | | | | |
| | Total from investment operations | | | 3.19 | | | | (1.81 | ) | | | 3.83 | | | | 1.65 | | | | — | (c) | | | 2.13 | |
| | | | | | | |
| | Distributions to shareholders from net investment income | | | — | | | | (0.16 | ) | | | (0.16 | ) | | | (0.16 | ) | | | (0.16 | ) | | | (0.11 | ) |
| | | | | | | |
| | Net asset value, end of period | | $ | 23.92 | | | $ | 20.73 | | | $ | 22.70 | | | $ | 19.03 | | | $ | 17.54 | | | $ | 17.70 | |
| | | | | | | |
| | Total return(d) | | | 15.39 | % | | | (7.95 | )% | | | 20.14 | % | | | 9.40 | % | | | (0.03 | )% | | | 13.57 | % |
| | | | | | | |
| | Net assets, end of period (in 000s) | | $ | 20,023 | | | $ | 17,894 | | | $ | 17,251 | | | $ | 14,262 | | | $ | 6,799 | | | $ | 4,175 | |
| | | | | | | |
| | Ratio of net expenses to average net assets | | | 0.87 | %(e) | | | 0.89 | % | | | 0.90 | % | | | 0.92 | % | | | 0.92 | % | | | 0.93 | % |
| | | | | | | |
| | Ratio of total expenses to average net assets | | | 0.89 | %(e) | | | 0.89 | % | | | 0.90 | % | | | 0.93 | % | | | 0.92 | % | | | 0.94 | % |
| | | | | | | |
| | Ratio of net investment income to average net assets | | | 0.82 | %(e) | | | 0.68 | % | | | 0.88 | % | | | 0.84 | % | | | 0.99 | % | | | 0.78 | % |
| | | | | | | |
| | Portfolio turnover rate(f) | | | 105 | % | | | 152 | % | | | 108 | % | | | 118 | % | | | 96 | % | | | 57 | % |
| | (a) | | Effective August 15, 2017, Class IR changed its name to Investor Shares. |
| | (b) | | Calculated based on the average shares outstanding methodology. |
| | (c) | | Amount is less than $0.005 per share. |
| | (d) | | Assumes investment at the net asset value at the beginning of the period, reinvestment of all distributions, a complete redemption of the investment at the net asset value at the end of the period and no sales or redemption charges (if any). Total returns would be reduced if a sales or redemption charge was taken into account. Returns do not reflect the impact of taxes to shareholders relating to Fund distributions or the redemption of Fund shares. Total returns for periods less than one full year are not annualized. |
| | (f) | | The Fund’s portfolio turnover rate is calculated in accordance with regulatory requirements, without regard to transactions involving short term investments and certain derivatives. If such transactions were included, the Fund’s portfolio turnover rate may be higher. |
| | |
| 68 | | The accompanying notes are an integral part of these financial statements. |
GOLDMAN SACHS U.S.TAX-MANAGED EQUITY FUND
Financial Highlights(continued)
Selected Data for a Share Outstanding Throughout Each Period
| | | | | | | | | | |
| | | | | Goldman Sachs U.S.Tax-
Managed Equity Fund | |
| | | | | Class P Shares | |
| | | | | Six Months Ended
June 30, 2019
(Unaudited) | | | For the period
April 17, 2018* to
December 31, 2018 | |
| | Per Share Data | | | | | | | | |
| | | |
| | Net asset value, beginning of period | | $ | 20.74 | | | $ | 23.43 | |
| | | |
| | Net investment income(a) | | | 0.11 | | | | 0.16 | |
| | | |
| | Net realized and unrealized gain (loss) | | | 3.09 | | | | (2.66 | ) |
| | | |
| | Total from investment operations | | | 3.20 | | | | (2.50 | ) |
| | | |
| | Distributions to shareholders from net investment income | | | — | | | | (0.19 | ) |
| | | |
| | Net asset value, end of period | | $ | 23.94 | | | $ | 20.74 | |
| | | |
| | Total return(b) | | | 15.43 | % | | | (10.62 | )% |
| | | |
| | Net assets, end of period (in 000s) | | $ | 124,200 | | | $ | 97,892 | |
| | | |
| | Ratio of net expenses to average net assets | | | 0.73 | %(c) | | | 0.74 | %(c) |
| | | |
| | Ratio of total expenses to average net assets | | | 0.74 | %(c) | | | 0.75 | %(c) |
| | | |
| | Ratio of net investment income to average net assets | | | 0.95 | %(c) | | | 0.95 | %(c) |
| | | |
| | Portfolio turnover rate(d) | | | 105 | % | | | 152 | % |
| | * | | Commencement of Operations. |
| | (a) | | Calculated based on the average shares outstanding methodology. |
| | (b) | | Assumes investment at the net asset value at the beginning of the period, reinvestment of all distributions, a complete redemption of the investment at the net asset value at the end of the period and no sales or redemption charges (if any). Total returns would be reduced if a sales or redemption charge was taken into account. Returns do not reflect the impact of taxes to shareholders relating to Fund distributions or the redemption of Fund shares. Total returns for periods less than one full year are not annualized. |
| | (d) | | The Fund’s portfolio turnover rate is calculated in accordance with regulatory requirements, without regard to transactions involving short term investments and certain derivatives. If such transactions were included, the Fund’s portfolio turnover rate may be higher. |
| | |
| The accompanying notes are an integral part of these financial statements. | | 69 |
GOLDMAN SACHS U.S.TAX-MANAGED EQUITY FUND
Financial Highlights(continued)
Selected Data for a Share Outstanding Throughout Each Period
| | | | | | | | | | |
| | | | | Goldman Sachs U.S.Tax-
Managed Equity Fund | |
| | | | | Class R6 Shares | |
| | | | | Six Months Ended
June 30, 2019
(Unaudited) | | | For the period
April 30, 2018* to
December 31, 2018 | |
| | Per Share Data | | | | | | | | |
| | | |
| | Net asset value, beginning of period | | $ | 20.73 | | | $ | 22.93 | |
| | | |
| | Net investment income(a) | | | 0.11 | | | | 0.13 | |
| | | |
| | Net realized and unrealized gain (loss) | | | 3.10 | | | | (2.14 | ) |
| | | |
| | Total from investment operations | | | 3.21 | | | | (2.01 | ) |
| | | |
| | Distributions to shareholders from net investment income | | | — | | | | (0.19 | ) |
| | | |
| | Net asset value, end of period | | $ | 23.94 | | | $ | 20.73 | |
| | | |
| | Total return(b) | | | 15.48 | % | | | (8.72 | )% |
| | | |
| | Net assets, end of period (in 000s) | | $ | 1,457,054 | | | $ | 1,263,556 | |
| | | |
| | Ratio of net expenses to average net assets | | | 0.73 | %(c) | | | 0.74 | %(c) |
| | | |
| | Ratio of total expenses to average net assets | | | 0.74 | %(c) | | | 0.74 | %(c) |
| | | |
| | Ratio of net investment income to average net assets | | | 0.96 | %(c) | | | 0.85 | %(c) |
| | | |
| | Portfolio turnover rate(d) | | | 105 | % | | | 152 | % |
| | * | | Commencement of Operations. |
| | (a) | | Calculated based on the average shares outstanding methodology. |
| | (b) | | Assumes investment at the net asset value at the beginning of the period, reinvestment of all distributions, a complete redemption of the investment at the net asset value at the end of the period and no sales or redemption charges (if any). Total returns would be reduced if a sales or redemption charge was taken into account. Returns do not reflect the impact of taxes to shareholders relating to Fund distributions or the redemption of Fund shares. Total returns for periods less than one full year are not annualized. |
| | (d) | | The Fund’s portfolio turnover rate is calculated in accordance with regulatory requirements, without regard to transactions involving short term investments and certain derivatives. If such transactions were included, the Fund’s portfolio turnover rate may be higher. |
| | |
| 70 | | The accompanying notes are an integral part of these financial statements. |
GOLDMAN SACHS INTERNATIONALTAX-MANAGED EQUITY FUND
Financial Highlights(continued)
Selected Data for a Share Outstanding Throughout Each Period
| | | | | | | | | | | | | | | | | | | | | | | | | | |
| | | | | Goldman Sachs InternationalTax-Managed Equity Fund | |
| | | | | Class A Shares | |
| | | | | Six Months Ended
June 30, 2019
(Unaudited) | | | Year Ended December 31, | |
| | | | | 2018 | | | 2017 | | | 2016 | | | 2015 | | | 2014 | |
| | Per Share Data | | | | | | | | | | | | | | | | | | | | | | | | |
| | | | | | | |
| | Net asset value, beginning of period | | $ | 8.93 | | | $ | 10.93 | | | $ | 8.62 | | | $ | 8.67 | | | $ | 8.45 | | | $ | 9.18 | |
| | | | | | | |
| | Net investment income(a) | | | 0.14 | | | | 0.18 | | | | 0.11 | | | | 0.12 | | | | 0.11 | | | | 0.27 | (b) |
| | | | | | | |
| | Net realized and unrealized gain (loss) | | | 0.88 | | | | (2.03 | ) | | | 2.38 | | | | (0.04 | ) | | | 0.21 | | | | (0.80 | ) |
| | | | | | | |
| | Total from investment operations | | | 1.02 | | | | (1.85 | ) | | | 2.49 | | | | 0.08 | | | | 0.32 | | | | (0.53 | ) |
| | | | | | | |
| | Distributions to shareholders from net investment income | | | — | | | | (0.15 | ) | | | (0.18 | ) | | | (0.13 | ) | | | (0.10 | ) | | | (0.20 | ) |
| | | | | | | |
| | Net asset value, end of period | | $ | 9.95 | | | $ | 8.93 | | | $ | 10.93 | | | $ | 8.62 | | | $ | 8.67 | | | $ | 8.45 | |
| | | | | | | |
| | Total return(c) | | | 11.42 | % | | | (16.86 | )% | | | 28.85 | % | | | 0.93 | % | | | 3.77 | % | | | (5.79 | )% |
| | | | | | | |
| | Net assets, end of period (in 000s) | | $ | 8,696 | | | $ | 8,145 | | | $ | 9,429 | | | $ | 5,082 | | | $ | 3,408 | | | $ | 2,151 | |
| | | | | | | |
| | Ratio of net expenses to average net assets | | | 1.27 | %(d) | | | 1.29 | % | | | 1.31 | % | | | 1.38 | % | | | 1.38 | % | | | 1.38 | % |
| | | | | | | |
| | Ratio of total expenses to average net assets | | | 1.37 | %(d) | | | 1.37 | % | | | 1.36 | % | | | 1.39 | % | | | 1.39 | % | | | 1.42 | % |
| | | | | | | |
| | Ratio of net investment income to average net assets | | | 2.96 | %(d) | | | 1.69 | % | | | 1.04 | % | | | 1.37 | % | | | 1.22 | % | | | 2.98 | %(b) |
| | | | | | | |
| | Portfolio turnover rate(e) | | | 109 | % | | | 177 | % | | | 134 | % | | | 125 | % | | | 113 | % | | | 106 | % |
| | (a) | | Calculated based on the average shares outstanding methodology. |
| | (b) | | Reflects income recognized from special dividends which amounted to $0.06 per share and 0.71% of average net assets. |
| | (c) | | Assumes investment at the net asset value at the beginning of the period, reinvestment of all distributions, a complete redemption of the investment at the net asset value at the end of the period and no sales or redemption charges (if any). Total returns would be reduced if a sales or redemption charge was taken into account. Returns do not reflect the impact of taxes to shareholders relating to Fund distributions or the redemption of Fund shares. Total returns for periods less than one full year are not annualized. |
| | (e) | | The Fund’s portfolio turnover rate is calculated in accordance with regulatory requirements, without regard to transactions involving short term investments and certain derivatives. If such transactions were included, the Fund’s portfolio turnover rate may be higher. |
| | |
| The accompanying notes are an integral part of these financial statements. | | 71 |
GOLDMAN SACHS INTERNATIONALTAX-MANAGED EQUITY FUND
Financial Highlights(continued)
Selected Data for a Share Outstanding Throughout Each Period
| | | | | | | | | | | | | | | | | | | | | | | | | | |
| | | | | Goldman Sachs InternationalTax-Managed Equity Fund | |
| | | | | Class C Shares | |
| | | | | Six Months Ended
June 30, 2019
(Unaudited) | | | Year Ended December 31, | |
| | | | | 2018 | | | 2017 | | | 2016 | | | 2015 | | | 2014 | |
| | Per Share Data | | | | | | | | | | | | | | | | | | | | | | | | |
| | | | | | | |
| | Net asset value, beginning of period | | $ | 8.68 | | | $ | 10.59 | | | $ | 8.39 | | | $ | 8.45 | | | $ | 8.27 | | | $ | 9.03 | |
| | | | | | | |
| | Net investment income(a) | | | 0.10 | | | | 0.10 | | | | 0.04 | | | | 0.06 | | | | 0.02 | | | | 0.15 | (b) |
| | | | | | | |
| | Net realized and unrealized gain (loss) | | | 0.85 | | | | (1.94 | ) | | | 2.30 | | | | (0.05 | ) | | | 0.23 | | | | (0.74 | ) |
| | | | | | | |
| | Total from investment operations | | | 0.95 | | | | (1.84 | ) | | | 2.34 | | | | 0.01 | | | | 0.25 | | | | (0.59 | ) |
| | | | | | | |
| | Distributions to shareholders from net investment income | | | — | | | | (0.07 | ) | | | (0.14 | ) | | | (0.07 | ) | | | (0.07 | ) | | | (0.17 | ) |
| | | | | | | |
| | Net asset value, end of period | | $ | 9.63 | | | $ | 8.68 | | | $ | 10.59 | | | $ | 8.39 | | | $ | 8.45 | | | $ | 8.27 | |
| | | | | | | |
| | Total return(c) | | | 10.94 | % | | | (17.39 | )% | | | 27.85 | % | | | 0.11 | % | | | 3.07 | % | | | (6.55 | )% |
| | | | | | | |
| | Net assets, end of period (in 000s) | | $ | 1,821 | | | $ | 2,551 | | | $ | 2,661 | | | $ | 1,012 | | | $ | 812 | | | $ | 181 | |
| | | | | | | |
| | Ratio of net expenses to average net assets | | | 2.03 | %(d) | | | 2.04 | % | | | 2.06 | % | | | 2.13 | % | | | 2.13 | % | | | 2.13 | % |
| | | | | | | |
| | Ratio of total expenses to average net assets | | | 2.12 | %(d) | | | 2.12 | % | | | 2.11 | % | | | 2.14 | % | | | 2.13 | % | | | 2.17 | % |
| | | | | | | |
| | Ratio of net investment income to average net assets | | | 2.09 | %(d) | | | 1.01 | % | | | 0.40 | % | | | 0.67 | % | | | 0.20 | % | | | 1.71 | %(b) |
| | | | | | | |
| | Portfolio turnover rate(e) | | | 109 | % | | | 177 | % | | | 134 | % | | | 125 | % | | | 113 | % | | | 106 | % |
| | (a) | | Calculated based on the average shares outstanding methodology. |
| | (b) | | Reflects income recognized from special dividends which amounted to $0.06 per share and 0.71% of average net assets. |
| | (c) | | Assumes investment at the net asset value at the beginning of the period, reinvestment of all distributions, a complete redemption of the investment at the net asset value at the end of the period and no sales or redemption charges (if any). Total returns would be reduced if a sales or redemption charge was taken into account. Returns do not reflect the impact of taxes to shareholders relating to Fund distributions or the redemption of Fund shares. Total returns for periods less than one full year are not annualized. |
| | (e) | | The Fund’s portfolio turnover rate is calculated in accordance with regulatory requirements, without regard to transactions involving short term investments and certain derivatives. If such transactions were included, the Fund’s portfolio turnover rate may be higher. |
| | |
| 72 | | The accompanying notes are an integral part of these financial statements. |
GOLDMAN SACHS INTERNATIONALTAX-MANAGED EQUITY FUND
Financial Highlights(continued)
Selected Data for a Share Outstanding Throughout Each Period
| | | | | | | | | | | | | | | | | | | | | | | | | | |
| | | | | Goldman Sachs InternationalTax-Managed Equity Fund | |
| | | | | Institutional Shares | |
| | | | | Six Months Ended
June 30, 2019
(Unaudited) | | | Year Ended December 31, | |
| | | | | 2018 | | | 2017 | | | 2016 | | | 2015 | | | 2014 | |
| | Per Share Data | | | | | | | | | | | | | | | | | | | | | | | | |
| | | | | | | |
| | Net asset value, beginning of period | | $ | 8.91 | | | $ | 10.85 | | | $ | 8.54 | | | $ | 8.59 | | | $ | 8.36 | | | $ | 9.10 | |
| | | | | | | |
| | Net investment income(a) | | | 0.15 | | | | 0.31 | | | | 0.17 | | | | 0.16 | | | | 0.15 | | | | 0.28 | (b) |
| | | | | | | |
| | Net realized and unrealized gain (loss) | | | 0.88 | | | | (2.10 | ) | | | 2.34 | | | | (0.05 | ) | | | 0.21 | | | | (0.77 | ) |
| | | | | | | |
| | Total from investment operations | | | 1.03 | | | | (1.79 | ) | | | 2.51 | | | | 0.11 | | | | 0.36 | | | | (0.49 | ) |
| | | | | | | |
| | Distributions to shareholders from net investment income | | | — | | | | (0.15 | ) | | | (0.20 | ) | | | (0.16 | ) | | | (0.13 | ) | | | (0.25 | ) |
| | | | | | | |
| | Net asset value, end of period | | $ | 9.94 | | | $ | 8.91 | | | $ | 10.85 | | | $ | 8.54 | | | $ | 8.59 | | | $ | 8.36 | |
| | | | | | | |
| | Total return(c) | | | 11.56 | % | | | (16.49 | )% | | | 29.42 | % | | | 1.26 | % | | | 4.26 | % | | | (5.48 | )% |
| | | | | | | |
| | Net assets, end of period (in 000s) | | $ | 17,724 | | | $ | 16,948 | | | $ | 619,288 | | | $ | 519,135 | | | $ | 426,168 | | | $ | 316,062 | |
| | | | | | | |
| | Ratio of net expenses to average net assets | | | 0.90 | %(d) | | | 0.90 | % | | | 0.92 | % | | | 0.98 | % | | | 0.98 | % | | | 0.98 | % |
| | | | | | | |
| | Ratio of total expenses to average net assets | | | 0.98 | %(d) | | | 0.96 | % | | | 0.97 | % | | | 0.99 | % | | | 0.99 | % | | | 1.02 | % |
| | | | | | | |
| | Ratio of net investment income to average net assets | | | 3.14 | %(d) | | | 2.87 | % | | | 1.74 | % | | | 1.90 | % | | | 1.71 | % | | | 3.12 | %(b) |
| | | | | | | |
| | Portfolio turnover rate(e) | | | 109 | % | | | 177 | % | | | 134 | % | | | 125 | % | | | 113 | % | | | 106 | % |
| | (a) | | Calculated based on the average shares outstanding methodology. |
| | (b) | | Reflects income recognized from special dividends which amounted to $0.06 per share and 0.71% of average net assets. |
| | (c) | | Assumes investment at the net asset value at the beginning of the period, reinvestment of all distributions, a complete redemption of the investment at the net asset value at the end of the period and no sales or redemption charges (if any). Total returns would be reduced if a sales or redemption charge was taken into account. Returns do not reflect the impact of taxes to shareholders relating to Fund distributions or the redemption of Fund shares. Total returns for periods less than one full year are not annualized. |
| | (e) | | The Fund’s portfolio turnover rate is calculated in accordance with regulatory requirements, without regard to transactions involving short term investments and certain derivatives. If such transactions were included, the Fund’s portfolio turnover rate may be higher. |
| | |
| The accompanying notes are an integral part of these financial statements. | | 73 |
GOLDMAN SACHS INTERNATIONALTAX-MANAGED EQUITY FUND
Financial Highlights(continued)
Selected Data for a Share Outstanding Throughout Each Period
| | | | | | | | | | | | | | | | | | | | | | | | | | |
| | | | | Goldman Sachs InternationalTax-Managed Equity Fund | |
| | | | | Investor Shares(a) | |
| | | | | Six Months Ended
June 30, 2019
(Unaudited) | | | Year Ended December 31, | |
| | | | | 2018 | | | 2017 | | | 2016 | | | 2015 | | | 2014 | |
| | Per Share Data | | | | | | | | | | | | | | | | | | | | | | | | |
| | | | | | | |
| | Net asset value, beginning of period | | $ | 8.91 | | | $ | 10.91 | | | $ | 8.61 | | | $ | 8.65 | | | $ | 8.43 | | | $ | 9.17 | |
| | | | | | | |
| | Net investment income(b) | | | 0.16 | | | | 0.19 | | | | 0.13 | | | | 0.15 | | | | 0.07 | | | | 0.29 | (c) |
| | | | | | | |
| | Net realized and unrealized gain (loss) | | | 0.87 | | | | (2.00 | ) | | | 2.36 | | | | (0.05 | ) | | | 0.27 | | | | (0.80 | ) |
| | | | | | | |
| | Total from investment operations | | | 1.03 | | | | (1.81 | ) | | | 2.49 | | | | 0.10 | | | | 0.34 | | | | (0.51 | ) |
| | | | | | | |
| | Distributions to shareholders from net investment income | | | — | | | | (0.19 | ) | | | (0.19 | ) | | | (0.14 | ) | | | (0.12 | ) | | | (0.23 | ) |
| | | | | | | |
| | Net asset value, end of period | | $ | 9.94 | | | $ | 8.91 | | | $ | 10.91 | | | $ | 8.61 | | | $ | 8.65 | | | $ | 8.43 | |
| | | | | | | |
| | Total return(d) | | | 11.56 | % | | | (16.66 | )% | | | 29.09 | % | | | 1.21 | % | | | 4.04 | % | | | (5.59 | )% |
| | | | | | | |
| | Net assets, end of period (in 000s) | | $ | 17,800 | | | $ | 14,008 | | | $ | 15,547 | | | $ | 1,251 | | | $ | 1,444 | | | $ | 205 | |
| | | | | | | |
| | Ratio of net expenses to average net assets | | | 1.02 | %(e) | | | 1.04 | % | | | 1.05 | % | | | 1.13 | % | | | 1.13 | % | | | 1.13 | % |
| | | | | | | |
| | Ratio of total expenses to average net assets | | | 1.12 | %(e) | | | 1.12 | % | | | 1.11 | % | | | 1.14 | % | | | 1.13 | % | | | 1.17 | % |
| | | | | | | |
| | Ratio of net investment income to average net assets | | | 3.26 | %(e) | | | 1.82 | % | | | 1.30 | % | | | 1.76 | % | | | 0.84 | % | | | 3.12 | %(c) |
| | | | | | | |
| | Portfolio turnover rate(f) | | | 109 | % | | | 177 | % | | | 134 | % | | | 125 | % | | | 113 | % | | | 106 | % |
| | (a) | | Effective August 15, 2017, Class IR changed its name to Investor Shares. |
| | (b) | | Calculated based on the average shares outstanding methodology. |
| | (c) | | Reflects income recognized from special dividends which amounted to $0.06 per share and 0.71% of average net assets. |
| | (d) | | Assumes investment at the net asset value at the beginning of the period, reinvestment of all distributions, a complete redemption of the investment at the net asset value at the end of the period and no sales or redemption charges (if any). Total returns would be reduced if a sales or redemption charge was taken into account. Returns do not reflect the impact of taxes to shareholders relating to Fund distributions or the redemption of Fund shares. Total returns for periods less than one full year are not annualized. |
| | (f) | | The Fund’s portfolio turnover rate is calculated in accordance with regulatory requirements, without regard to transactions involving short term investments and certain derivatives. If such transactions were included, the Fund’s portfolio turnover rate may be higher. |
| | |
| 74 | | The accompanying notes are an integral part of these financial statements. |
GOLDMAN SACHS INTERNATIONALTAX-MANAGED EQUITY FUND
Financial Highlights(continued)
Selected Data for a Share Outstanding Throughout Each Period
| | | | | | | | | | |
| | | | | Goldman Sachs International
Tax-Managed Equity Fund | |
| | | | | Class P Shares | |
| | | | | Six Months Ended
June 30, 2019
(Unaudited) | | | For the period
April 17, 2018* to
December 31, 2018 | |
| | Per Share Data | | | | | | | | |
| | | |
| | Net asset value, beginning of period | | $ | 8.86 | | | $ | 11.07 | |
| | | |
| | Net investment income(a) | | | 0.16 | | | | 0.10 | |
| | | |
| | Net realized and unrealized gain (loss) | | | 0.86 | | | | (2.11 | ) |
| | | |
| | Total from investment operations | | | 1.02 | | | | (2.01 | ) |
| | | |
| | Distributions to shareholders from net investment income | | | — | | | | (0.20 | ) |
| | | |
| | Net asset value, end of period | | $ | 9.88 | | | $ | 8.86 | |
| | | |
| | Total return(b) | | | 11.51 | % | | | (18.09 | )% |
| | | |
| | Net assets, end of period (in 000s) | | $ | 66,533 | | | $ | 64,578 | |
| | | |
| | Ratio of net expenses to average net assets | | | 0.89 | %(c) | | | 0.89 | %(c) |
| | | |
| | Ratio of total expenses to average net assets | | | 0.97 | %(c) | | | 1.00 | %(c) |
| | | |
| | Ratio of net investment income to average net assets | | | 3.28 | %(c) | | | 1.43 | %(c) |
| | | |
| | Portfolio turnover rate(d) | | | 109 | % | | | 177 | % |
| | * | | Commencement of Operations. |
| | (a) | | Calculated based on the average shares outstanding methodology. |
| | (b) | | Assumes investment at the net asset value at the beginning of the period, reinvestment of all distributions, a complete redemption of the investment at the net asset value at the end of the period and no sales or redemption charges (if any). Total returns would be reduced if a sales or redemption charge was taken into account. Returns do not reflect the impact of taxes to shareholders relating to Fund distributions or the redemption of Fund shares. Total returns for periods less than one full year are not annualized. |
| | (d) | | The Fund’s portfolio turnover rate is calculated in accordance with regulatory requirements, without regard to transactions involving short term investments and certain derivatives. If such transactions were included, the Fund’s portfolio turnover rate may be higher. |
| | |
| The accompanying notes are an integral part of these financial statements. | | 75 |
GOLDMAN SACHS INTERNATIONALTAX-MANAGED EQUITY FUND
Financial Highlights(continued)
Selected Data for a Share Outstanding Throughout Each Period
| | | | | | | | | | |
| | | | | Goldman Sachs International
Tax-Managed Equity Fund | |
| | | | | Class R6 Shares | |
| | | | | Six Months Ended
June 30, 2019
(Unaudited) | | | For the period
April 30, 2018* to
December 31, 2018 | |
| | Per Share Data | | | | | | | | |
| | | |
| | Net asset value, beginning of period | | $ | 8.85 | | | $ | 10.92 | |
| | | |
| | Net investment income(a) | | | 0.16 | | | | 0.08 | |
| | | |
| | Net realized and unrealized gain (loss) | | | 0.87 | | | | (1.95 | ) |
| | | |
| | Total from investment operations | | | 1.03 | | | | (1.87 | ) |
| | | |
| | Distributions to shareholders from net investment income | | | — | | | | (0.20 | ) |
| | | |
| | Net asset value, end of period | | $ | 9.88 | | | $ | 8.85 | |
| | | |
| | Total return(b) | | | 11.64 | % | | | (17.07 | )% |
| | | |
| | Net assets, end of period (in 000s) | | $ | 618,434 | | | $ | 530,891 | |
| | | |
| | Ratio of net expenses to average net assets | | | 0.89 | %(c) | | | 0.89 | %(c) |
| | | |
| | Ratio of total expenses to average net assets | | | 0.97 | %(c) | | | 0.99 | %(c) |
| | | |
| | Ratio of net investment income to average net assets | | | 3.34 | %(c) | | | 1.14 | %(c) |
| | | |
| | Portfolio turnover rate(d) | | | 109 | % | | | 177 | % |
| | * | | Commencement of Operations. |
| | (a) | | Calculated based on the average shares outstanding methodology. |
| | (b) | | Assumes investment at the net asset value at the beginning of the period, reinvestment of all distributions, a complete redemption of the investment at the net asset value at the end of the period and no sales or redemption charges (if any). Total returns would be reduced if a sales or redemption charge was taken into account. Returns do not reflect the impact of taxes to shareholders relating to Fund distributions or the redemption of Fund shares. Total returns for periods less than one full year are not annualized. |
| | (d) | | The Fund’s portfolio turnover rate is calculated in accordance with regulatory requirements, without regard to transactions involving short term investments and certain derivatives. If such transactions were included, the Fund’s portfolio turnover rate may be higher. |
| | |
| 76 | | The accompanying notes are an integral part of these financial statements. |
GOLDMAN SACHS TAX-ADVANTAGED EQUITY FUNDS
Notes to Financial Statements
June 30, 2019 (Unaudited)
Goldman Sachs Trust (the “Trust”) is a Delaware statutory trust registered under the Investment Company Act of 1940, as amended (the “Act”), as anopen-end management investment company. The following table lists those series of the Trust that are included in this report (collectively, the “Funds” or individually a “Fund”), along with their corresponding share classes and respective diversification status under the Act:
| | | | |
| Fund | | Share Classes Offered | | Diversified/ Non-diversified |
U.S. Equity Dividend and Premium, International Equity Dividend and Premium, International Tax-Managed Equity | | A, C, Institutional, Investor, P and R6 | | Diversified |
U. S.Tax-Managed Equity | | A, C, Institutional, Service, Investor, P and R6 | | Diversified |
Class A Shares are sold with afront-end sales charge of up to 5.50%. Class C Shares are sold with a contingent deferred sales charge (“CDSC”) of 1.00%, which is imposed on redemptions made within 12 months of purchase. Institutional, Service, Investor, Class P and Class R6 Shares are not subject to a sales charge.
Goldman Sachs Asset Management, L.P. (“GSAM”), an affiliate of Goldman Sachs & Co. LLC (“Goldman Sachs”), serves as investment adviser to the Funds pursuant to a management agreement (the “Agreement”) with the Trust.
|
| 2. SIGNIFICANT ACCOUNTING POLICIES |
The financial statements have been prepared in accordance with accounting principles generally accepted in the United States of America (“GAAP”) and require management to make estimates and assumptions that may affect the reported amounts and disclosures. Actual results may differ from those estimates and assumptions.
A. Investment Valuation — The Funds’ valuation policy is to value investments at fair value.
B. Investment Income and Investments — Investment income includes interest income, dividend income, and securities lending income, if any. Interest income is accrued daily and adjusted for amortization of premiums and accretion of discounts. Dividend income is recognized onex-dividend date or, for certain foreign securities, as soon as such information is obtained subsequent to theex-dividend date. Investment transactions are reflected on trade date. Realized gains and losses are calculated using identified cost. Investment transactions are recorded on the following business day for daily net asset value (“NAV”) calculations. Investment income is recorded net of any foreign withholding taxes, less any amounts reclaimable. The Funds may file withholding tax reclaims in certain jurisdictions to recover a portion of amounts previously withheld. Any foreign capital gains tax is accrued daily based upon net unrealized gains, and is payable upon sale of such investments. Distributions received from the Funds’ investments in United States (“U.S.”) real estate investment trusts (“REITs”) may be characterized as ordinary income, net capital gain or a return of capital. A return of capital is recorded by the Funds as a reduction to the cost basis of the REIT.
For derivative contracts, realized gains and losses are recorded upon settlement of the contract.
C. Class Allocations and Expenses— Investment income, realized and unrealized gain (loss), if any, andnon-class specific expenses of each Fund are allocated daily based upon the proportion of net assets of each class.Non-class specific expenses directly incurred by a Fund are charged to that Fund, while such expenses incurred by the Trust are allocated across the applicable Funds on astraight-line and/orpro-rata basis depending upon the nature of the expenses. Class specific expenses, where applicable, are borne by the respective share classes and include Distribution and Service, Transfer Agency and Service and Shareholder Administration fees.
D. Federal Taxes and Distributions to Shareholders — It is each Fund’s policy to comply with the requirements of the Internal Revenue Code of 1986, as amended (the “Code”), applicable to regulated investment companies and to distribute each year substantially all of its investment company taxable income and capital gains to its shareholders. Accordingly, each Fund is not
77
GOLDMAN SACHS TAX-ADVANTAGED EQUITY FUNDS
Notes to Financial Statements(continued)
June 30, 2019 (Unaudited)
|
| 2. SIGNIFICANT ACCOUNTING POLICIES (continued) |
required to make any provisions for the payment of federal income tax. Distributions to shareholders are recorded on theex-dividend date. Income and capital gains distributions, if any, are declared and paid according to the following schedule:
| | | | | | |
| Fund | | | | Income Distributions Declared/Paid | | Capital Gains Distributions
Declared/Paid |
U.S. Equity Dividend and Premium International Equity Dividend and Premium | | | | Quarterly | | Annually |
U.S.Tax-Managed Equity International Tax-Managed Equity | | | | Annually | | Annually |
Net capital losses, if any, are carried forward to future fiscal years and may be used to the extent allowed by the Code to offset any future capital gains. Losses that are carried forward will retain their character as either short-term or long-term capital losses. Utilization of capital loss carryforwards will reduce the requirement of future capital gains distributions.
The characterization of distributions to shareholders for financial reporting purposes is determined in accordance with federal income tax rules, which may differ from GAAP. The source of each Fund’s distributions may be shown in the accompanying financial statements as either from distributable earnings or capital. Certain components of the Funds’ net assets on the Statements of Assets and Liabilities reflect permanent GAAP/tax differences based on the appropriate tax character.
E. Foreign Currency Translation — The accounting records and reporting currency of a Fund are maintained in U.S. dollars. Assets and liabilities denominated in foreign currencies are translated into U.S. dollars using the current exchange rates at the close of each business day. The effect of changes in foreign currency exchange rates on investments is included within net realized and unrealized gain (loss) on investments. Changes in the value of other assets and liabilities as a result of fluctuations in foreign exchange rates are included in the Statements of Operations within net change in unrealized gain (loss) on foreign currency translation. Transactions denominated in foreign currencies are translated into U.S. dollars on the date the transaction occurred, the effects of which are included within net realized gain (loss) on foreign currency transactions.
F. In-Kind Transactions — Each Fund may allow investors, under certain circumstances, to purchase shares with securities instead of cash. In addition, the Trust reserves the right to redeem an investor’s shares by distributing securities instead of cash. These are known asin-kind transactions. Securities included as part ofin-kind purchases and redemptions of Fund shares are valued in the same manner as they are valued for purposes of computing a Fund’s NAV, in accordance with the Fund’s Valuation Procedures, and such valuations are as of the date the trade is submitted pursuant to the procedures specified in the Funds’
prospectus.
|
| 3. INVESTMENTS AND FAIR VALUE MEASUREMENTS |
U.S. GAAP defines the fair value of a financial instrument as the amount that would be received to sell an asset or paid to transfer a liability in an orderly transaction between market participants at the measurement date (i.e., the exit price); the Funds’ policy is to use the market approach. GAAP establishes a fair value hierarchy that prioritizes the inputs to valuation techniques used to measure fair value. The hierarchy gives the highest priority to unadjusted quoted prices in active markets for identical assets or liabilities (Level 1 measurements) and the lowest priority to unobservable inputs (Level 3 measurements). The levels used for classifying investments are not necessarily an indication of the risk associated with investing in these investments. The three levels of the fair value hierarchy are described below:
Level 1 — Unadjusted quoted prices in active markets that are accessible at the measurement date for identical, unrestricted assets or liabilities;
Level 2 — Quoted prices in markets that are not active or financial instruments for which significant inputs are observable (including, but not limited to, quoted prices for similar investments, interest rates, foreign exchange rates, volatility and credit spreads), either directly or indirectly;
78
GOLDMAN SACHS TAX-ADVANTAGED EQUITY FUNDS
|
| 3. INVESTMENTS AND FAIR VALUE MEASUREMENTS (continued) |
Level 3 — Prices or valuations that require significant unobservable inputs (including GSAM’s assumptions in determining fair value measurement).
The Board of Trustees (“Trustees”) has approved Valuation Procedures that govern the valuation of the portfolio investments held by the Funds, including investments for which market quotations are not readily available. The Trustees have delegated to GSAMday-to-day responsibility for implementing and maintaining internal controls and procedures related to the valuation of the Funds’ investments. To assess the continuing appropriateness of pricing sources and methodologies, GSAM regularly performs price verification procedures and issues challenges as necessary to third party pricing vendors or brokers, and any differences are reviewed in accordance with the Valuation Procedures.
A. Level 1 and Level 2 Fair Value Investments — The valuation techniques and significant inputs used in determining the fair values for investments classified as Level 1 and Level 2 are as follows:
Equity Securities — Equity securities traded on a U.S. securities exchange or the NASDAQ system, or those located on certain foreign exchanges, including but not limited to the Americas, are valued daily at their last sale price or official closing price on the principal exchange or system on which they are traded. If there is no sale or official closing price or such price is believed by GSAM to not represent fair value, equity securities are valued at the last bid price for long positions and at the last ask price for short positions. To the extent these investments are actively traded, they are classified as Level 1 of the fair value hierarchy, otherwise they are generally classified as Level 2.
Unlisted equity securities for which market quotations are available are valued at the last sale price on the valuation date, or if no sale occurs, at the last bid price, and are generally classified as Level 2. Securities traded on certain foreign securities exchanges are valued daily at fair value determined by an independent fair value service (if available) under Valuation Procedures approved by the Trustees and consistent with applicable regulatory guidance. The independent fair value service takes into account multiple factors including, but not limited to, movements in the securities markets, certain depositary receipts, futures contracts and foreign currency exchange rates that have occurred subsequent to the close of the foreign securities exchange. These investments are generally classified as Level 2 of the fair value hierarchy.
Money Market Funds — Investments in the Goldman Sachs Financial Square Government Fund (“Underlying Fund”) are valued at the NAV of the Institutional Share class on the day of valuation. These investments are generally classified as Level 1 of the fair value hierarchy. For information regarding the Underlying Fund’s accounting policies and investment holdings, please see the Underlying Fund’s shareholder report.
Derivative Contracts—A derivative is an instrument whose value is derived from underlying assets, indices, reference rates or a combination of these factors. A Fund enters into derivative transactions to hedge against changes in interest rates, securities prices, and/or currency exchange rates, to increase total return, or to gain access to certain markets or attain exposure to other underliers. For financial reporting purposes, cash collateral that has been pledged to cover obligations of a Fund and cash collateral received, if any, is reported separately on the Statements of Assets and Liabilities as receivables/payables for collateral on certain derivatives contracts.Non-cash collateral pledged by a Fund, if any, is noted in the Schedules of Investments.
Exchange-traded derivatives, including futures and options contracts, are generally valued at the last sale or settlement price on the exchange where they are principally traded. Exchange-traded options without settlement prices are generally valued at the midpoint of the bid and ask prices on the exchange where they are principally traded (or, in the absence oftwo-way trading, at the last bid price for long positions and the last ask price for short positions). Exchange-traded derivatives typically fall within Level 1 of the fair value hierarchy.Over-the-counter (“OTC”) and centrally cleared derivatives are valued using market transactions and other market evidence, including market-based inputs to models, calibration to market-clearing transactions, broker or dealer quotations, or other alternative pricing sources. Where models are used, the selection of a particular model to value OTC and centrally cleared derivatives depends upon the contractual terms of, and specific risks inherent in, the instrument, as well as the availability of pricing information in the market. Valuation models require a variety of inputs, including contractual terms, market prices, yield curves, credit curves, measures of volatility, voluntary and involuntary prepayment rates, loss severity rates and correlations of such inputs. For OTC and centrally cleared derivatives that trade in liquid markets, model inputs can generally be
79
GOLDMAN SACHS TAX-ADVANTAGED EQUITY FUNDS
Notes to Financial Statements(continued)
June 30, 2019 (Unaudited)
|
| 3. INVESTMENTS AND FAIR VALUE MEASUREMENTS (continued) |
verified and model selection does not involve significant management judgment. OTC and centrally cleared derivatives are classified within Level 2 of the fair value hierarchy when significant inputs are corroborated by market evidence.
i. Futures Contracts — Futures contracts are contracts to buy or sell a standardized quantity of a specified commodity or security. Upon entering into a futures contract, a Fund deposits cash or securities in an account on behalf of the broker in an amount sufficient to meet the initial margin requirement. Subsequent payments are made or received by a Fund equal to the daily change in the contract value and are recorded as variation margin receivable or payable with a corresponding offset to unrealized gains or losses.
ii. Options — When a Fund writes call or put options, an amount equal to the premium received is recorded as a liability and is subsequentlymarked-to-market to reflect the current value of the option written. Swaptions are options on interest rate and or credit default, swap contracts.
Upon the purchase of a call option or a put option by a Fund, the premium paid is recorded as an investment and subsequentlymarked-to-market to reflect the current value of the option. Certain options may be purchased with premiums to be determined on a future date. The premiums for these options are based upon implied volatility parameters at specified terms.
B. Level 3 Fair Value Investments — To the extent that significant inputs to valuation models and other alternative pricing sources are unobservable, or if quotations are not readily available, or if GSAM believes that such quotations do not accurately reflect fair value, the fair value of a Fund’s investments may be determined under Valuation Procedures approved by the Trustees. GSAM, consistent with its procedures and applicable regulatory guidance, may make an adjustment to the most recent valuation prices of either domestic or foreign securities in light of significant events to reflect what it believes to be the fair value of the securities at the time of determining a Fund’s NAV. To the extent investments are valued using single source broker quotations obtained directly from the broker or passed through from third party pricing vendors, such investments are classified as Level 3 investments. GSAM did not develop the unobservable inputs for valuation of Level 3 Assets and Liabilities.
C. Fair Value Hierarchy — The following is a summary of the Funds’ investments and derivatives classified in the fair value hierarchy as of June 30, 2019:
| | | | | | | | | | | | |
| | | |
| U.S. EQUITY DIVIDEND AND PREMIUM | | | | | | | | | | | | |
| | | |
| Investment Type | | Level 1 | | | Level 2 | | | Level 3 | |
| | | |
| Assets | | | | | | | | | | | | |
| | | |
Common Stock and/or Other Equity Investments(a) | | | | | | | | | | | | |
| | | |
Europe | | $ | 24,944,600 | | | $ | — | | | $ | — | |
| | | |
North America | | | 2,926,727,207 | | | | — | | | | — | |
| | | |
South America | | | 4,914,525 | | | | — | | | | — | |
| | | |
Investment Company | | | 14,985,574 | | | | — | | | | — | |
| | | |
Securities Lending Reinvestment Vehicle | | | 854,750 | | | | — | | | | — | |
| | | |
| Total | | $ | 2,972,426,656 | | | $ | — | | | $ | — | |
| (a) | | Amounts are disclosed by continent to highlight the impact of time zone differences between local market close and the calculation of NAV. Security valuations are based on the principal exchange or system on which they are traded, which may differ from country of domicile. The Funds utilize fair value model prices provided by an independent fair value service for certain international equity securities, resulting in a Level 2 classification. |
80
GOLDMAN SACHS TAX-ADVANTAGED EQUITY FUNDS
|
| 3. INVESTMENTS AND FAIR VALUE MEASUREMENTS (continued) |
| | | | | | | | | | | | |
|
| U.S. EQUITY DIVIDEND AND PREMIUM (continued) | |
| | | |
Derivative Type | | Level 1 | | | Level 2 | | | Level 3 | |
| | | |
| Assets(a) | | | | | | | | | | | | |
| | | |
Futures Contracts | | $ | 66,777 | | | $ | — | | | $ | — | |
| | | |
| Liabilities | | | | | | | | | | | | |
| | | |
Written Options Contracts | | | $ (36,324,210) | | | $ | — | | | $ | — | |
| | | |
| INTERNATIONAL EQUITY DIVIDEND AND PREMIUM | | | | | | | | | | | | |
| | | |
| Investment Type | | Level 1 | | | Level 2 | | | Level 3 | |
| | | |
| Assets | | | | | | | | | | | | |
| | | |
Common Stock and/or Other Equity Investments(b) | | | | | | | | | | | | |
| | | |
Africa | | $ | — | | | $ | 774,633 | | | $ | — | |
| | | |
Asia | | | 136,207 | | | | 89,208,163 | | | | — | |
| | | |
Australia and Oceania | | | 2,928,484 | | | | 24,275,178 | | | | — | |
| | | |
Europe | | | 13,610,299 | | | | 178,547,561 | | | | — | |
| | | |
North America | | | — | | | | 64,791 | | | | — | |
| | | |
Securities Lending Reinvestment Vehicle | | | 801,360 | | | | — | | | | — | |
| | | |
| Total | | $ | 17,476,350 | | | $ | 292,870,326 | | | $ | — | |
| | | |
| Derivative Type | | | | | | | | | |
| | | |
| Assets(a) | | | | | | | | | | | | |
| | | |
Futures Contracts | | $ | 49,527 | | | $ | — | | | $ | — | |
| | | |
| Liabilities | | | | | | | | | | | | |
| | | |
Written Options Contracts | | | $ (2,549,871) | | | $ | — | | | $ | — | |
| | | |
| U.S.TAX-MANAGED EQUITY | | | | | | | | | | | | |
| | | |
| Investment Type | | Level 1 | | | Level 2 | | | Level 3 | |
| | | |
| Assets | | | | | | | | | | | | |
| | | |
Common Stock and/or Other Equity Investments(b) | | | | | | | | | | | | |
| | | |
Asia | | $ | 4,209,269 | | | $ | — | | | $ | — | |
| | | |
Europe | | | 14,518,232 | | | | | | | | | |
| | | |
North America | | | 1,680,286,372 | | | | — | | | | — | |
| | | |
South America | | | 942,737 | | | | — | | | | — | |
| | | |
Investment Company | | | 61,302 | | | | — | | | | — | |
| | | |
| Total | | $ | 1,700,017,912 | | | $ | — | | | $ | — | |
| (a) | | Amount shown represents unrealized gain (loss) at period end. |
| (b) | | Amounts are disclosed by continent to highlight the impact of time zone differences between local market close and the calculation of NAV. Security valuations are based on the principal exchange or system on which they are traded, which may differ from country of domicile. The Funds utilize fair value model prices provided by an independent fair value service for certain international equity securities, resulting in a Level 2 classification. |
81
GOLDMAN SACHS TAX-ADVANTAGED EQUITY FUNDS
Notes to Financial Statements(continued)
June 30, 2019 (Unaudited)
|
| 3. INVESTMENTS AND FAIR VALUE MEASUREMENTS (continued) |
| | | | | | | | | | | | |
| | | |
| INTERNATIONALTAX-MANAGED EQUITY | | | | | | | | | | | | |
| | | |
| Investment Type | | Level 1 | | | Level 2 | | | Level 3 | |
| | | |
| Assets | | | | | | | | | | | | |
| | | |
Common Stock and/or Other Equity Investments(a) | | | | | | | | | | | | |
| | | |
Africa | | $ | — | | | $ | 1,377,370 | | | $ | — | |
| | | |
Asia | | | — | | | | 215,667,567 | | | | — | |
| | | |
Australia and Oceania | | | 2,586,050 | | | | 50,748,511 | | | | — | |
| | | |
Europe | | | 5,495,780 | | | | 440,867,540 | | | | — | |
| | | |
North America | | | 476,512 | | | | — | | | | — | |
| | | |
| Total | | $ | 8,558,342 | | | $ | 708,660,988 | | | $ | — | |
| | | |
| Derivative Type | | | | | | | | | |
| | | |
| Assets(b) | | | | | | | | | | | | |
| | | |
Futures Contracts | | $ | 144,505 | | | $ | — | | | $ | — | |
| (a) | | Amounts are disclosed by continent to highlight the impact of time zone differences between local market close and the calculation of NAV. Security valuations are based on the principal exchange or system on which they are traded, which may differ from country of domicile. The Funds utilize fair value model prices provided by an independent fair value service for certain international equity securities, resulting in a Level 2 classification. |
| (b) | | Amount shown represents unrealized gain (loss) at period end. |
For further information regarding security characteristics, see the Schedules of Investments.
|
| 4. INVESTMENTS IN DERIVATIVES |
The following table sets forth, by certain risk types, the gross value of derivative contracts (not considered to be hedging instruments for accounting disclosure purposes) as of June 30, 2019. These instruments were used as part of the Funds’ investment strategies and to obtain and/or manage exposure related to the risks below. The values in the tables below exclude the effects of cash collateral received or posted pursuant to these derivative contracts, and therefore are not representative of the Funds’ net exposure.
| | | | | | | | | | | | | | |
| Fund | | Risk | | Statements of Assets and Liabilities | | Assets(a) | | | Statements of Assets
and Liabilities | | Liabilities | |
U.S. Equity Dividend and Premium | | Equity | | Variation margin on futures Contracts | | $ | 66,777 | | | Payable for written options at value | | $ | (36,324,210) | |
International Equity Dividend and Premium | | Equity | | Variation margin on futures Contracts | | | 49,527 | | | Payable for written options at value | | | (2,549,871) | |
InternationalTax-Managed Equity | | Equity | | Variation margin on futures Contracts | | | 144,505 | | | — | | | — | |
Total | | | | | | $ | 260,809 | | | | | $ | (38,874,081) | |
| (a) | | Includes unrealized gain (loss) on futures contracts described in the Additional Investment Information sections of the Schedules of Investments. Only variation margin as of June 30, 2019 is reported within the Statements of Assets and Liabilities. |
The following table sets forth, by certain risk types, the Funds’ gains (losses) related to these derivatives and their indicative volumes for the six months ended June 30, 2019. These gains (losses) should be considered in the context that these derivative contracts may have been executed to create investment opportunities and/or economically hedge certain investments, and
82
GOLDMAN SACHS TAX-ADVANTAGED EQUITY FUNDS
|
| 4. INVESTMENTS IN DERIVATIVES (continued) |
accordingly, certain gains (losses) on such derivative contracts may offset certain (losses) gains attributable to investments. These gains (losses) are included in “Net realized gain (loss)” or “Net change in unrealized gain (loss)” on the Statements of Operations:
| | | | | | | | | | | | | | | | |
| Fund | | Risk | | Statements of Operations | | Net Realized
Gain (Loss) | | | Net Change in
Unrealized
Gain (Loss) | | | Average
Number of
Contracts(a) | |
U.S. Equity Dividend and Premium | | Equity | | Net realized gain (loss) from futures contracts and written options/Net change in unrealized gain (loss) on futures contracts and written options | | $ | (28,709,252 | ) | | $ | (22,350,782 | ) | | | 3,975 | |
International Equity Dividend and Premium | | Equity | | Net realized gain (loss) from futures contracts and written options/Net change in unrealized gain (loss) on futures contracts and written options | | | (7,089,607 | ) | | | (234,966 | ) | | | 2,230 | |
U.S.Tax-Managed Equity | | Equity | | Net realized gain (loss) from futures contracts/Net change in unrealized gain (loss) on futures contracts | | | 1,554,335 | | | | 485,166 | | | | 42 | |
InternationalTax-Managed Equity | | Equity | | Net realized gain (loss) from futures contracts/Net change in unrealized gain (loss) on futures contracts | | | 345,643 | | | | 148,552 | | | | 117 | |
Total | | | | | | $ | (33,898,881 | ) | | $ | (21,952,030 | ) | | | 6,364 | |
| (a) | | Average number of contracts is based on the average of month end balances for the six months ended June 30, 2019. |
|
| 5. AGREEMENTS AND AFFILIATED TRANSACTIONS |
A. Management Agreement — Under the Agreement, GSAM manages the Funds, subject to the general supervision of the Trustees.
As compensation for the services rendered pursuant to the Agreement, the assumption of the expenses related thereto and administration of the Funds’ business affairs, including providing facilities, GSAM is entitled to a management fee, accrued daily and paid monthly, equal to an annual percentage rate of each Fund’s average daily net assets.
For the six months ended June 30, 2019, contractual and effective net management fees with GSAM were at the following rates:
| | | | | | | | | | | | | | | | | | | | | | | | | | | | | | |
| | | | | Contractual Management Rate | | | | | | | |
| Fund | | | | First
$1 billion | | | Next
$1 billion | | | Next
$3 billion | | | Next
$3 billion | | | Over
$8 billion | | | Effective
Rate | | | Effective Net
Management
Rate^ | |
U.S. Equity Dividend and Premium | | | | | 0.75 | % | | | 0.68 | % | | | 0.65 | % | | | 0.64 | % | | | 0.63 | % | | | 0.69 | % | | | 0.69 | % |
International Equity Dividend and Premium | | | | | 0.81 | | | | 0.73 | | | | 0.69 | | | | 0.68 | | | | 0.67 | | | | 0.81 | | | | 0.81 | |
U.S.Tax-Managed Equity | | | | | 0.70 | | | | 0.63 | | | | 0.60 | | | | 0.59 | | | | 0.58 | | | | 0.67 | | | | 0.67 | |
InternationalTax-Managed Equity | | | | | 0.85 | | | | 0.77 | | | | 0.73 | | | | 0.72 | | | | 0.71 | | | | 0.85 | | | | 0.85 | |
| ^ | | Effective Net Management Rate includes the impact of management fee waivers of affiliated Underlying Funds, if any. |
The Funds invest in Institutional Shares of the Goldman Sachs Financial Square Government Fund, which is an affiliated Underlying Fund. GSAM has agreed to waive a portion of its management fee payable by the Funds in an amount equal to the
83
GOLDMAN SACHS TAX-ADVANTAGED EQUITY FUNDS
Notes to Financial Statements(continued)
June 30, 2019 (Unaudited)
|
| 5. AGREEMENTS AND AFFILIATED TRANSACTIONS (continued) |
management fee it earns as an investment adviser to the affiliated Underlying Fund in which the Funds invest, except those management fees it earns from the Funds’ investments of cash collateral received in connection with securities lending transactions in the Goldman Sachs Financial Square Government Fund. For the six months ended June 30, 2019, GSAM waived $14,429, $173, $2,793 and $142 of the U.S. Equity Dividend and Premium, International Equity Dividend and Premium, U.S.Tax-Managed Equity and InternationalTax-Managed Equity Funds’ management fees, respectively.
B. Distribution and/or Service(12b-1) Plans — The Trust, on behalf of Class A Shares of each applicable Fund, has adopted a Distribution and Service Plan subject to Rule12b-1 under the Act. Under the Distribution and Service Plan, Goldman Sachs, which serves as distributor (the “Distributor”), is entitled to a fee accrued daily and paid monthly for distribution services and personal and account maintenance services, which may then be paid by Goldman Sachs to authorized dealers. These fees are equal to an annual percentage rate of the average daily net assets attributable to Class A Shares of the Funds, as set forth below.
The Trust, on behalf of Class C Shares of each applicable Fund, has adopted a Distribution Plan subject to Rule12b-1 under the Act. Under the Distribution Plan, Goldman Sachs as Distributor is entitled to a fee accrued daily and paid monthly for distribution services, which may then be paid by Goldman Sachs to authorized dealers. These fees are equal to an annual percentage rate of the average daily net assets attributable to Class C Shares of the Funds, as set forth below.
The Trust, on behalf of Service Shares of each applicable Fund, has adopted a Service Plan subject to Rule12b-1 under the Act to allow Service Shares to compensate service organizations (including Goldman Sachs) for providing personal and account maintenance services to their customers who are beneficial owners of such shares. The Service Plan provides for compensation to the service organizations equal to an annual percentage rate of the average daily net assets attributable to Service Shares of the Funds, as set forth below.
| | | | | | | | | | | | |
| | | Distribution and/or Service Plan Rates | |
| | | Class A* | | | Class C | | | Service | |
Distribution and/or Service Plan | | | 0.25 | % | | | 0.75 | % | | | 0.25 | % |
| * | | With respect to Class A Shares, the Distributor at its discretion may use compensation for distribution services paid under the Distribution Plan to compensate service organizations for personal and account maintenance services and expenses as long as such total compensation does not exceed the maximum cap on “service fees” imposed by the Financial Industry Regulatory Authority. |
C. Distribution Agreement — Goldman Sachs, as Distributor of the shares of the Funds pursuant to a Distribution Agreement, may retain a portion of the Class A Shares’ front end sales charge and Class C Shares’ CDSC. During the six months ended June 30, 2019, Goldman Sachs retained the following amounts:
| | | | | | | | | | |
| | | | | Front End
Sales Charge | | | Contingent Deferred
Sales Charge | |
| Fund | | | | Class A | | | Class C | |
U.S. Equity Dividend and Premium | | | | $ | 20,988 | | | $ | 4 | |
International Equity Dividend and Premium | | | | | 2,715 | | | | — | |
U.S.Tax-Managed Equity | | | | | 1,284 | | | | — | |
InternationalTax-Managed Equity | | | | | 34 | | | | — | |
D. Service and/or Shareholder Administration Plans — The Trust, on behalf of each applicable Fund, has adopted Service and/or Shareholder Administration Plans to allow Class C and Service Shares, respectively, to compensate service organizations (including Goldman Sachs) for providing varying levels of personal and account maintenance and/or shareholder administration services to their customers who are beneficial owners of such shares. The Service and/or Shareholder Administration Plans each provide for compensation to the service organizations equal to an annual percentage rate of 0.25% of the average daily net assets attributable to Class C and/or Service Shares of the Funds, respectively.
84
GOLDMAN SACHS TAX-ADVANTAGED EQUITY FUNDS
|
| 5. AGREEMENTS AND AFFILIATED TRANSACTIONS (continued) |
E. Transfer Agency Agreement — Goldman Sachs also serves as the transfer agent of the Funds for a fee pursuant to the Transfer Agency Agreement. The fees charged for such transfer agency services are accrued daily and paid monthly at annual rates as follows: 0.18% of the average daily net assets of Class A, Class C and Investor Shares; 0.03% of the average daily net assets of Class P and Class R6 Shares; and 0.04% of the average daily net assets of Institutional and Service Shares. Goldman Sachs has agreed to waive a portion of its transfer agency fee equal to 0.01% as an annual percentage rate of the average daily net assets attributable to Class A, Class C, and Investor Shares of the U.S. Equity Dividend and Premium Fund. This arrangement will remain in effect through at least April 30, 2020, and prior to such date Goldman Sachs may not terminate the arrangement without the approval of the Board of Trustees.
Effective April 30, 2019, Goldman Sachs has agreed to waive a portion of its transfer agency fee equal to 0.05% and 0.04% as an annual percentage rate of the average daily net assets attributable to Class A, Class C, and Investor Shares of the International Tax-Managed Equity and U.S. Tax-Managed Equity Funds, respectively. These arrangements will remain in effect through at least April 30, 2020, and prior to such date Goldman Sachs may not terminate the arrangements without the approval of the Board of Trustees. Prior to April 30, 2019, there was no transfer agency waiver in place for these funds.
F. Other Expense Agreements and Affiliated Transactions — GSAM has agreed to reduce or limit certain “Other Expenses” of the Funds (excluding acquired fund fees and expenses, transfer agency fees and expenses, service fees and shareholder administration fees (as applicable), taxes, interest, brokerage fees, expenses of shareholder meetings, litigation and indemnification, and extraordinary expenses) to the extent such expenses exceed, on an annual basis, a percentage rate of the average daily net assets of each Fund. Such Other Expense reimbursements, if any, are accrued daily and paid monthly. In addition, the Funds are not obligated to reimburse GSAM for prior fiscal year expense reimbursements, if any. The Other Expense limitations as an annual percentage rate of average daily net assets for the U.S. Equity Dividend and Premium, International Equity Dividend and Premium, U.S.Tax-Managed Equity and InternationalTax-Managed Equity Funds are 0.014%, 0.094%, 0.044% and 0.014%, respectively. These Other Expense limitations will remain in place through at least April 30, 2020, and prior to such date GSAM may not terminate the arrangements without the approval of the Trustees. In addition, the Funds have entered into certain offset arrangements with the custodian and the transfer agent, which may result in a reduction of the Funds’ expenses and are received irrespective of the application of the “Other Expense” limitations described above.
For the six months ended June 30, 2019, these expense reductions, including any fee waivers and Other Expense reimbursements, were as follows:
| | | | | | | | | | | | | | | | | | | | | | |
| Fund | | | | Management
Fee Waiver | | | Other
Expense
Reimbursement | | | Custody Fee
Credits | | | Transfer
Agency
Waivers/
Credits | | | Total
Expense
Reductions | |
U.S. Equity Dividend and Premium | | | | $ | 14,429 | | | $ | 319,782 | | | $ | 6,888 | | | $ | 39,661 | | | $ | 380,760 | |
International Equity Dividend and Premium | | | | | 173 | | | | 167,904 | | | | 192 | | | | — | | | | 168,269 | |
U.S.Tax-Managed Equity | | | | | 2,793 | | | | — | | | | 25,293 | | | | 6,663 | | | | 34,749 | |
InternationalTax-Managed Equity | | | | | 142 | | | | 276,014 | | | | 4,871 | | | | 2,396 | | | | 283,423 | |
G. Line of Credit Facility — As of June 30, 2019, the Funds participated in a $580,000,000 committed, unsecured revolving line of credit facility (the “facility”) together with other funds of the Trust and certain registered investment companies having management agreements with GSAM or its affiliates. This facility is to be used for temporary emergency purposes, or to allow for an orderly liquidation of securities to meet redemption requests. The interest rate on borrowings is based on the federal funds rate. The facility also requires a fee to be paid by the Funds based on the amount of the commitment that has not been utilized. For the six months ended June 30, 2019, the Funds did not have any borrowings under the facility. Prior to April 30, 2019 the facility was $770,000,000.
H. Other Transactions with Affiliates— For the six months ended June 30, 2019, Goldman Sachs earned $300 and $239 in brokerage commissions from portfolio transactions, including futures transactions executed with Goldman Sachs as the Futures Commission Merchant, on behalf of the International Equity Dividend and Premium and InternationalTax-Managed Equity Funds, respectively.
85
GOLDMAN SACHS TAX-ADVANTAGED EQUITY FUNDS
Notes to Financial Statements(continued)
June 30, 2019 (Unaudited)
|
| 5. AGREEMENTS AND AFFILIATED TRANSACTIONS (continued) |
The following table provides information about the Funds’ investment in the Goldman Sachs Financial Square Government Fund as of and for the six months ended June 30, 2019:
| | | | | | | | | | | | | | | | | | | | | | | | |
| Fund | | Beginning Value as of
December 31, 2018 | | | Purchases
at Cost | | | Proceeds
from Sales | | | Ending Value as of
June 30, 2019 | | | Shares as of
June 30, 2019 | | | Dividend income
from Affiliated
Investment
Company | |
U.S. Equity Dividend and Premium | | $ | — | | | $ | 248,387,367 | | | $ | (233,401,793 | ) | | $ | 14,985,574 | | | | 14,985,574 | | | $ | 214,362 | |
International Equity Dividend and Premium | | | — | | | | 10,357,628 | | | | (10,357,628 | ) | | | — | | | | — | | | | 2,555 | |
U.S.Tax-Managed Equity | | | 9,875,798 | | | | 94,102,339 | | | | (103,916,835 | ) | | | 61,302 | | | | 61,302 | | | | 40,063 | |
InternationalTax-Managed Equity | | | — | | | | 7,492,424 | | | | (7,492,424 | ) | | | — | | | | — | | | | 4,162 | |
As of June 30, 2019, the following Goldman Sachs GlobalTax-Aware Equity Portfolios were beneficial owners of 5% or more of total outstanding shares of the following Funds:
| | | | | | | | | | |
| Fund | | | | Goldman Sachs
Enhanced Dividend
Global Equity
Portfolio | | | Goldman Sachs
Tax-Advantaged
Global Equity
Portfolio | |
U.S. Equity Dividend and Premium | | | | | 9 | % | | | — | % |
International Equity Dividend and Premium | | | | | 44 | | | | — | |
U.S.Tax-Managed Equity | | | | | — | | | | 84 | |
InternationalTax-Managed Equity | | | | | — | | | | 84 | |
|
| 6. PORTFOLIO SECURITIES TRANSACTIONS |
The cost of purchases and proceeds from sales and maturities of long-term securities for the six months ended June 30, 2019, were as follows:
| | | | | | | | | | |
| Fund | | | | Purchases | | | Sales | |
U.S. Equity Dividend and Premium | | | | $ | 306,895,603 | | | $ | 602,816,187 | |
International Equity Dividend and Premium | | | | | 416,115 | | | | 34,496,051 | |
U.S.Tax-Managed Equity | | | | | 1,782,743,527 | | | | 1,702,479,483 | |
InternationalTax-Managed Equity | | | | | 764,193,874 | | | | 744,331,593 | |
Pursuant to exemptive relief granted by the Securities and Exchange Commission (“SEC”) and the terms and conditions contained therein, the Funds may lend their securities through a securities lending agent, Goldman Sachs Agency Lending (“GSAL”), a wholly-owned subsidiary of Goldman Sachs, to certain qualified borrowers including Goldman Sachs and affiliates. In accordance with the Funds’ securities lending procedures, the Funds receive cash collateral at least equal to the market value of the securities on loan. The market value of the loaned securities is determined at the close of business of the Funds, at their last sale price or official closing price on the principal exchange or system on which they are traded, and any additional required collateral is
86
GOLDMAN SACHS TAX-ADVANTAGED EQUITY FUNDS
|
| 7. SECURITIES LENDING (continued) |
delivered to the Funds on the next business day. As with other extensions of credit, the Funds may experience delay in the recovery of their securities or incur a loss should the borrower of the securities breach its agreement with the Funds or become insolvent at a time when the collateral is insufficient to cover the cost of repurchasing securities on loan. Dividend income received from securities on loan may not be subject to withholding taxes and therefore withholding taxes paid may differ from the amounts listed in the Statements of Operations. Loans of securities are terminable at any time and as such 1) the remaining contractual maturities of the outstanding securities lending transactions are considered to be overnight and continuous and 2) the borrower, after notice, is required to return borrowed securities within the standard time period for settlement of securities transactions.
The Funds invest the cash collateral received in connection with securities lending transactions in the Goldman Sachs Financial Square Government Fund (“Government Money Market Fund”), an affiliated series of the Goldman Sachs Trust. The Government Money Market Fund is registered under the Act as an open end investment company, is subject to Rule2a-7 under the Act, and is managed by GSAM, for which GSAM may receive a management fee of up to 0.16% on an annualized basis of the average daily net assets of the Government Money Market Fund.
In the event of a default by a borrower with respect to any loan, GSAL will exercise any and all remedies provided under the applicable borrower agreement to make the Funds whole. These remedies include purchasing replacement securities by applying the collateral held from the defaulting broker against the purchase cost of the replacement securities. If GSAL is unable to purchase replacement securities, GSAL will indemnify the Funds by paying the Funds an amount equal to the market value of the securities loaned minus the value of cash collateral received from the borrower for the loan, subject to an exclusion for any shortfalls resulting from a loss of value in such cash collateral due to reinvestment risk. The Funds may enter into master netting agreements with borrowers, which provide the right, in the event of a default (including bankruptcy or insolvency), for thenon-defaulting party to liquidate the collateral and calculate net exposure to the defaulting party or request additional collateral. However, in the event of a default by a borrower, a resolution authority could determine that such rights are not enforceable due to the restrictions or prohibitions against the right ofset-off that may be imposed in accordance with a particular jurisdiction’s bankruptcy or insolvency laws. The Funds’ loaned securities were all subject to enforceable Securities Lending Agreements and the value of the collateral was at least equal to the value of the cash received. The amounts of the Funds’ overnight and continuous agreements, which represent the gross amounts of recognized liabilities for securities lending transactions outstanding as of June 30, 2019 are disclosed as “Payable upon return of securities loaned” on the Statements of Assets and Liabilities, where applicable. The Goldman Sachs U.S.Tax-Managed Equity and InternationalTax-Managed Equity Funds did not have securities on loan as of June 30, 2019.
Each of the Funds and GSAL received compensation relating to the lending of the Funds’ securities. The amounts earned, if any, by the Funds for the six months ended June 30, 2019, are reported under Investment Income on the Statements of Operations.
The table below details securities lending activity with affiliates of Goldman Sachs:
| | | | | | | | | | | | | | |
| | | | | For the six months ended June 30, 2019 | | | Amount Payable to
Goldman Sachs
Upon Return of
Securities Loaned as of
June 30, 2019 | |
| Fund | | | | Earnings of GSAL
Relating to
Securities
Loaned | | | Amount Received
by the Funds from Lending to
Goldman Sachs | |
U.S. Equity Dividend and Premium | | | | $ | 43 | | | $ | 172 | | | $ | — | |
International Equity Dividend and Premium | | | | | 2,254 | | | | — | | | | — | |
U.S.Tax-Managed Equity | | | | | 47 | | | | 47 | | | | — | |
InternationalTax-Managed Equity | | | | | 3,253 | | | | 4,885 | | | | — | |
87
GOLDMAN SACHS TAX-ADVANTAGED EQUITY FUNDS
Notes to Financial Statements(continued)
June 30, 2019 (Unaudited)
|
| 7. SECURITIES LENDING (continued) |
The following table provides information about the Funds’ investment in the Government Money Market Fund for the six months ended June 30, 2019:
| | | | | | | | | | | | | | | | | | |
| Fund | | | | Beginning Value as of December 31, 2018 | | | Purchases
at Cost | | | Proceeds
from Sales | | | Ending
Value as of
June 30, 2019 | |
U.S. Equity Dividend and Premium | | | | $ | 2,016,000 | | | $ | 12,662,700 | | | $ | (13,823,950 | ) | | $
|
854,750 |
|
International Equity Dividend and Premium | | | | | 2,448,255 | | | | 3,126,191 | | | | (4,773,086 | ) | | | 801,360 | |
U.S.Tax-Managed Equity | | | | | 148,800 | | | | 3,745,350 | | | | (3,894,150 | ) | | | — | |
InternationalTax-Managed Equity | | | | | 4,166,835 | | | | 13,545,719 | | | | (17,712,554 | ) | | | — | |
As of the Funds’ most recent fiscal year end, December 31, 2018, the Funds’ capital loss carryforwards and certain timing differences, on atax-basis were as follows:
| | | | | | | | | | | | | | | | |
| | | U.S. Equity
Dividend and
Premium | | | International
Equity Dividend
and Premium | | | U.S.
Tax-Managed
Equity | | | International
Tax-Managed
Equity | |
Capital loss carryforwards: | | | | | | | | | | | | | | | | |
Perpetual Long-term | | $ | — | | | | (26,664,963 | ) | | $ | — | | | $ | — | |
Perpetual Short-term | | | — | | | | (1,984,705 | ) | | | (16,633,317 | ) | | | (8,180,925 | ) |
Total capital loss carryforwards | | $ | — | | | | $(28,649,668) | | | $ | (16,633,317 | ) | | $ | (8,180,925 | ) |
Timing differences (Post October Loss Deferral and Deferred Dividends) | | $ | (1,916,424 | ) | | $ | (949,478 | ) | | $ | (878,700 | ) | | $ | (3,010,114 | ) |
As of June 30, 2019, the Funds’ aggregate security unrealized gains and losses based on cost for U.S. federal income tax purposes were as follows:
| | | | | | | | | | | | | | | | |
| | | U.S. Equity
Dividend and
Premium | | | International
Equity Dividend
and Premium | | | U.S.
Tax-Managed
Equity | | | International
Tax-Managed
Equity | |
Tax cost | | $ | 2,537,695,118 | | | $ | 312,949,815 | | | $ | 1,186,004,247 | | | $ | 673,345,541 | |
Gross unrealized gain | | | 601,838,994 | | | | 40,791,597 | | | | 517,054,844 | | | | 57,496,848 | |
Gross unrealized loss | | | (167,107,456 | ) | | | (43,394,736 | ) | | | (3,041,179 | ) | | | (13,623,059 | ) |
Net unrealized gain (loss) | | $ | 434,731,538 | | | $ | (2,603,139 | ) | | $ | 514,013,665 | | | $ | 43,873,789 | |
The difference between GAAP-basis andtax-basis unrealized gains (losses) is attributable primarily to wash sales, net mark to market gains (losses) on regulated futures and options contracts, and differences in the tax treatment of underlying fund investments, real estate investment trust investments and passive foreign investment company investments.
GSAM has reviewed the Funds’ tax positions for all open tax years (the current and prior three years, as applicable) and has concluded that no provision for income tax is required in the Funds’ financial statements. Such open tax years remain subject to examination and adjustment by tax authorities.
88
GOLDMAN SACHS TAX-ADVANTAGED EQUITY FUNDS
The Funds’ risks include, but are not limited to, the following:
Derivatives Risk — The Funds’ use of derivatives may result in loss. Derivative instruments, which may pose risks in addition to and greater than those associated with investing directly in securities, currencies or other instruments, may be illiquid or less liquid, volatile, difficult to price and leveraged so that small changes in the value of the underlying instruments may produce disproportionate losses to the Funds. Derivatives are also subject to counterparty risk, which is the risk that the other party in the transaction will not fulfill its contractual obligation. The use of derivatives is a highly specialized activity that involves investment techniques and risks different from those associated with investments in more traditional securities and instruments. Losses from derivatives can also result from a lack of correlation between changes in the value of derivative instruments and the portfolio assets (if any) being hedged.
Foreign and Emerging Countries Risk — Investing in foreign markets may involve special risks and considerations not typically associated with investing in the U.S. Foreign securities may be subject to risk of loss because of more or less foreign government regulation, less public information and less economic, political and social stability in the countries in which a Fund invests. The imposition of exchange controls (including repatriation restrictions), confiscations, trade restrictions (including tariffs) and other government restrictions by the U.S. or other governments, or from problems in share registration, settlement or custody, may also result in losses. Foreign risk also involves the risk of negative foreign currency rate fluctuations, which may cause the value of securities denominated in such foreign currency (or other instruments through which a Fund has exposure to foreign currencies) to decline in value. Currency exchange rates may fluctuate significantly over short periods of time. To the extent that a Fund also invests in securities of issuers located in emerging markets, these risks may be more pronounced.
Foreign Custody Risk— If a Fund invests in foreign securities, the Fund may hold such securities and cash with foreign banks, agents, and securities depositories appointed by the Fund’s custodian (each a “Foreign Custodian”). Some foreign custodians may be recently organized or new to the foreign custody business. In some countries, Foreign Custodians may be subject to little or no regulatory oversight over, or independent evaluation of, their operations. Further, the laws of certain countries may place limitations on a Fund’s ability to recover its assets if a Foreign Custodian enters bankruptcy. Investments in emerging markets may be subject to even greater custody risks than investments in more developed markets. Custody services in emerging market countries are very often undeveloped and may be considerably less well regulated than in more developed countries, and thus may not afford the same level of investor protection as would apply in developed countries.
Investments in Other Investment Companies Risk — As a shareholder of another investment company, a Fund will indirectly bear its proportionate share of any net management fees and other expenses paid by such other investment companies, in addition to the fees and expenses regularly borne by the Fund.
Large Shareholder Transactions Risk — A Fund may experience adverse effects when certain large shareholders, such as other funds, institutional investors (including those trading by use ofnon-discretionary mathematical formulas), financial intermediaries (who may make investment decisions on behalf of underlying clients and/or include a Fund in their investment model), individuals, accounts and Goldman Sachs affiliates, purchase or redeem large amounts of shares of a Fund. Such large shareholder redemptions, which may occur rapidly or unexpectedly, may cause a Fund to sell portfolio securities at times when it would not otherwise do so, which may negatively impact a Fund’s NAV and liquidity. These transactions may also accelerate the realization of taxable income to shareholders if such sales of investments resulted in gains, and may also increase transaction costs. In addition, a large redemption could result in a Fund’s current expenses being allocated over a smaller asset base, leading to an increase in the Fund’s expense ratio. Similarly, large Fund share purchases may adversely affect a Fund’s performance to the extent that the Fund is delayed in investing new cash or otherwise maintains a larger cash position than it ordinarily would.
Liquidity Risk — A Fund may make investments that are illiquid or that may become less liquid in response to market developments or adverse investor perceptions. Illiquid investments may be more difficult to value. Liquidity risk may also refer to the risk that a Fund will not be able to pay redemption proceeds within the allowable time period or without significant dilution to remaining investors’ interests because of unusual market conditions, an unusually high volume of redemption requests, or other reasons. To meet redemption requests, a Fund may be forced to sell investments at an unfavorable time and/or under unfavorable
89
GOLDMAN SACHS TAX-ADVANTAGED EQUITY FUNDS
Notes to Financial Statements(continued)
June 30, 2019 (Unaudited)
|
| 9. OTHER RISKS (continued) |
conditions. If a Fund is forced to sell securities at an unfavorable time and/or under unfavorable conditions, such sales may adversely affect the Fund’s NAV and dilute remaining investors’ interests. These risks may be more pronounced in connection with the Fund’s investments in securities of issuers located in emerging market countries. Redemptions by large shareholders may have a negative impact on a Fund’s liquidity.
Market and Credit Risks — In the normal course of business, a Fund trades financial instruments and enters into financial transactions where risk of potential loss exists due to changes in the market (market risk). Additionally, a Fund may also be exposed to credit risk in the event that an issuer or guarantor fails to perform or that an institution or entity with which the Fund has unsettled or open transactions defaults.
Under the Trust’s organizational documents, its Trustees, officers, employees and agents are indemnified, to the extent permitted by the Act and state law, against certain liabilities that may arise out of performance of their duties to the Funds. Additionally, in the course of business, the Funds enter into contracts that contain a variety of indemnification clauses. The Funds’ maximum exposure under these arrangements is unknown, as this would involve future claims that may be made against the Funds that have not yet occurred. However, GSAM believes the risk of loss under these arrangements to be remote.
Subsequent events after the Statements of Assets and Liabilities date have been evaluated, and GSAM has concluded that there is no impact requiring adjustment or disclosure in the financial statements.
90
GOLDMAN SACHS TAX-ADVANTAGED EQUITY FUNDS
|
| 12. SUMMARY OF SHARE TRANSACTIONS |
Share activity is as follows:
| | | | | | | | | | | | | | | | |
| | | U.S. Equity Dividend and Premium Fund | |
| | | | |
| | | For the Six Months Ended
June 30, 2019
(Unaudited) | | | For the Fiscal Year Ended
December 31, 2018 | |
| | | | |
| | | Shares | | | Dollars | | | Shares | | | Dollars | |
| | | | |
| Class A Shares | | | | | | | | | | | | | | | | |
Shares sold | | | 1,812,435 | | | $ | 22,798,701 | | | | 5,295,207 | | | $ | 70,158,277 | |
Reinvestment of distributions | | | 126,213 | | | | 1,619,195 | | | | 1,217,097 | | | | 14,874,034 | |
Shares redeemed | | | (3,352,259 | ) | | | (42,341,641 | ) | | | (11,074,287 | ) | | | (141,568,778 | ) |
| | | | (1,413,611 | ) | | | (17,923,745 | ) | | | (4,561,983 | ) | | | (56,536,467 | ) |
| Class C Shares | | | | | | | | | | | | | | | | |
Shares sold | | | 425,835 | | | | 5,382,891 | | | | 2,086,830 | | | | 27,160,327 | |
Reinvestment of distributions | | | 48,682 | | | | 621,488 | | | | 659,608 | | | | 7,980,024 | |
Shares redeemed | | | (1,878,432 | ) | | | (23,688,667 | ) | | | (4,031,361 | ) | | | (52,408,594 | ) |
| | | | (1,403,915 | ) | | | (17,684,288 | ) | | | (1,284,923 | ) | | | (17,268,243 | ) |
| Institutional Shares | | | | | | | | | | | | | | | | |
Shares sold | | | 16,995,948 | | | | 213,239,668 | | | | 33,504,921 | | | | 441,167,825 | |
Reinvestment of distributions | | | 749,511 | | | | 9,593,471 | | | | 6,280,998 | | | | 76,871,798 | |
Shares redeemed | | | (21,141,599 | ) | | | (265,329,117 | ) | | | (138,392,227 | ) | | | (1,825,561,094 | ) |
| | | | (3,396,140 | ) | | | (42,495,978 | ) | | | (98,606,308 | ) | | | (1,307,521,471 | ) |
| Investor Shares | | | | | | | | | | | | | | | | |
Shares sold | | | 4,739,858 | | | | 59,293,266 | | | | 13,150,709 | | | | 172,599,651 | |
Reinvestment of distributions | | | 351,121 | | | | 4,497,601 | | | | 2,715,798 | | | | 33,135,461 | |
Shares redeemed | | | (7,366,902 | ) | | | (91,732,901 | ) | | | (14,086,815 | ) | | | (183,423,650 | ) |
| | | | (2,275,923 | ) | | | (27,942,034 | ) | | | 1,779,692 | | | | 22,311,462 | |
| Class P Shares(a) | | | | | | | | | | | | | | | | |
Shares sold | | | 1,308,915 | | | | 16,454,458 | | | | 66,170,177 | | | | 886,799,790 | |
Reinvestment of distributions | | | 535,419 | | | | 6,851,272 | | | | 4,165,280 | | | | 50,730,626 | |
Shares redeemed | | | (8,857,228 | ) | | | (111,014,741 | ) | | | (13,586,593 | ) | | | (169,426,665 | ) |
| | | | (7,012,894 | ) | | | (87,709,011 | ) | | | 56,748,864 | | | | 768,103,751 | |
| Class R6 Shares(b) | | | | | | | | | | | | | | | | |
Shares sold | | | 708,214 | | | | 8,812,189 | | | | 23,298,666 | | | | 309,946,373 | |
Reinvestment of distributions | | | 223,072 | | | | 2,853,888 | | | | 1,484,667 | | | | 18,072,196 | |
Shares redeemed | | | (2,172,892 | ) | | | (27,329,068 | ) | | | (2,690,115 | ) | | | (34,802,719 | ) |
| | | | (1,241,606 | ) | | | (15,662,991 | ) | | | 22,093,218 | | | | 293,215,850 | |
| | | | |
NET DECREASE | | | (16,744,089 | ) | | | $ (209,418,047) | | | | (23,831,440) | | | | $ (297,695,118) | |
| (a) | | Commenced operations on April 17, 2018. |
| (b) | | Commenced operations on April 30, 2018. |
91
GOLDMAN SACHS TAX-ADVANTAGED EQUITY FUNDS
Notes to Financial Statements(continued)
June 30, 2019 (Unaudited)
|
| 12. SUMMARY OF SHARE TRANSACTIONS (continued) |
| | | | | | | | | | | | | | | | |
| | | International Equity Dividend and Premium Fund | |
| | | | |
| | | For the Six Months Ended
June 30, 2019
(Unaudited) | | | For the Fiscal Year Ended
December 31, 2018 | |
| | | | |
| | | Shares | | | Dollars | | | Shares | | | Dollars | |
| | | | |
| Class A Shares | | | | | | | | | | | | | | | | |
Shares sold | | | 125,196 | | | $ | 869,828 | | | | 185,864 | | | $ | 1,394,265 | |
Reinvestment of distributions | | | 8,244 | | | | 57,398 | | | | 12,738 | | | | 91,921 | |
Shares redeemed | | | (70,460 | ) | | | (491,737 | ) | | | (368,502 | ) | | | (2,705,700 | ) |
| | | | 62,980 | | | | 435,489 | | | | (169,900 | ) | | | (1,219,514 | ) |
| Class C Shares | | | | | | | | | | | | | | | | |
Shares sold | | | 7,642 | | | | 51,223 | | | | 30,138 | | | | 226,469 | |
Reinvestment of distributions | | | 2,410 | | | | 16,197 | | | | 7,774 | | | | 54,558 | |
Shares redeemed | | | (76,023 | ) | | | (509,105 | ) | | | (411,315 | ) | | | (2,910,023 | ) |
| | | | (65,971 | ) | | | (441,685 | ) | | | (373,403 | ) | | | (2,628,996 | ) |
| Institutional Shares | | | | | | | | | | | | | | | | |
Shares sold | | | 97,379 | | | | 664,481 | | | | 3,299,255 | | | | 25,150,510 | |
Reinvestment of distributions | | | 27,100 | | | | 185,201 | | | | 302,041 | | | | 2,239,419 | |
Shares redeemed | | | (943,805 | ) | | | (6,240,207 | ) | | | (53,613,348 | ) | | | (391,611,679 | ) |
| | | | (819,326 | ) | | | (5,390,525 | ) | | | (50,012,052 | ) | | | (364,221,750 | ) |
| Investor Shares | | | | | | | | | | | | | | | | |
Shares sold | | | 435,637 | | | | 2,953,006 | | | | 792,283 | | | | 5,588,837 | |
Reinvestment of distributions | | | 35,943 | | | | 244,955 | | | | 26,898 | | | | 187,293 | |
Shares redeemed | | | (159,243 | ) | | | (1,088,487 | ) | | | (333,831 | ) | | | (2,430,334 | ) |
| | | | 312,337 | | | | 2,109,474 | | | | 485,350 | | | | 3,345,796 | |
| Class P Shares(a) | | | | | | | | | | | | | | | | |
Shares sold | | | 745,287 | | | | 5,055,049 | | | | 33,241,157 | | | | 239,776,975 | |
Reinvestment of distributions | | | 517,821 | | | | 3,538,713 | | | | 759,524 | | | | 5,301,151 | |
Shares redeemed | | | (4,694,369 | ) | | | (31,875,572 | ) | | | (8,786,245 | ) | | | (59,552,901 | ) |
| | | | (3,431,261 | ) | | | (23,281,810 | ) | | | 25,214,436 | | | | 185,525,225 | |
| Class R6 Shares(b) | | | | | | | | | | | | | | | | |
Shares sold | | | 1,323,688 | | | | 9,017,275 | | | | 20,858,813 | | | | 151,394,746 | |
Reinvestment of distributions | | | 459,728 | | | | 3,137,496 | | | | 511,578 | | | | 3,555,021 | |
Shares redeemed | | | (1,591,537 | ) | | | (10,827,596 | ) | | | (1,853,969 | ) | | | (12,787,174 | ) |
| | | | 191,879 | | | | 1,327,175 | | | | 19,516,422 | | | | 142,162,593 | |
| | | | |
NET DECREASE | | | (3,749,362 | ) | | | $(25,241,882) | | | | (5,339,147 | ) | | | $(37,036,646) | |
| (a) | | Commenced operations on April 17, 2018. |
| (b) | | Commenced operations on April 30, 2018. |
92
GOLDMAN SACHS TAX-ADVANTAGED EQUITY FUNDS
|
| 12. SUMMARY OF SHARE TRANSACTIONS (continued) |
| | | | | | | | | | | | | | | | |
| | | U.S.Tax-Managed Equity Fund | |
| | | | |
| | | For the Six Months Ended
June 30, 2019
(Unaudited) | | | For the Fiscal Year Ended
December 31, 2018 | |
| | | | |
| | | Shares | | | Dollars | | | Shares | | | Dollars | |
| | | | |
| Class A Shares | | | | | | | | | | | | | | | | |
Shares sold | | | 88,161 | | | $ | 2,020,771 | | | | 814,705 | | | $ | 19,000,067 | |
Reinvestment of distributions | | | — | | | | — | | | | 15,443 | | | | 303,925 | |
Shares redeemed | | | (215,356 | ) | | | (4,808,899 | ) | | | (243,885 | ) | | | (5,567,445 | ) |
| | | | (127,195 | ) | | | (2,788,128 | ) | | | 586,263 | | | | 13,736,547 | |
| Class C Shares | | | | | | | | | | | | | | | | |
Shares sold | | | 77,412 | | | | 1,663,406 | | | | 224,904 | | | | 4,799,971 | |
Shares redeemed | | | (106,667 | ) | | | (2,327,571 | ) | | | (533,843 | ) | | | (11,927,357 | ) |
| | | | (29,255 | ) | | | (664,165 | ) | | | (308,939 | ) | | | (7,127,386 | ) |
| Institutional Shares | | | | | | | | | | | | | | | | |
Shares sold | | | 152,883 | | | | 3,563,523 | | | | 6,330,060 | | | | 148,125,329 | |
Reinvestment of distributions | | | — | | | | — | | | | 1,416 | | | | 28,533 | |
Shares redeemed | | | (183,246 | ) | | | (4,282,829 | ) | | | (63,995,284 | ) | | | (1,536,242,572 | ) |
Shares redeemed in connection within-kind transactions | | | — | | | | — | | | | (2,117,152 | ) | | | (48,160,000 | ) |
| | | | (30,363 | ) | | | (719,306 | ) | | | (59,780,960 | ) | | | (1,436,248,710 | ) |
| Service Shares | | | | | | | | | | | | | | | | |
Shares sold | | | 32,003 | | | | 741,599 | | | | 6,595 | | | | 155,606 | |
Reinvestment of distributions | | | — | | | | — | | | | 137 | | | | 2,719 | |
Shares redeemed | | | (1,270 | ) | | | (29,368 | ) | | | (3,821 | ) | | | (83,145 | ) |
| | | | 30,733 | | | | 712,231 | | | | 2,911 | | | | 75,180 | |
| Investor Shares | | | | | | | | | | | | | | | | |
Shares sold | | | 70,507 | | | | 1,638,651 | | | | 263,401 | | | | 6,120,169 | |
Reinvestment of distributions | | | — | | | | — | | | | 6,750 | | | | 134,794 | |
Shares redeemed | | | (96,609 | ) | | | (2,244,355 | ) | | | (167,106 | ) | | | (3,921,618 | ) |
| | | | (26,102 | ) | | | (605,704 | ) | | | 103,045 | | | | 2,333,345 | |
| Class P Shares(a) | | | | | | | | | | | | | | | | |
Shares sold | | | 940,707 | | | | 22,037,667 | | | | 4,933,205 | | | | 117,732,028 | |
Reinvestment of distributions | | | — | | | | — | | | | 45,457 | | | | 908,224 | |
Shares redeemed | | | (474,211 | ) | | | (10,895,990 | ) | | | (258,211 | ) | | | (5,610,626 | ) |
| | | | 466,496 | | | | 11,141,677 | | | | 4,720,451 | | | | 113,029,626 | |
| Class R6 Shares(b) | | | | | | | | | | | | | | | | |
Shares sold | | | 3,234,799 | | | | 75,406,143 | | | | 65,073,762 | | | | 1,553,803,875 | |
Reinvestment of distributions | | | — | | | | — | | | | 570,971 | | | | 11,402,299 | |
Shares redeemed | | | (2,204,862 | ) | | | (51,668,494 | ) | | | (1,683,318 | ) | | | (37,830,108 | ) |
Shares redeemed in connection within-kind transactions | | | (1,108,855 | ) | | | (25,670,000 | ) | | | (3,015,553 | ) | | | (73,210,000 | ) |
| | | | (78,918 | ) | | | (1,932,351 | ) | | | 60,945,862 | | | | 1,454,166,066 | |
| | | | |
NET INCREASE | | | 205,396 | | | $ | 5,144,254 | | | | 6,268,633 | | | $ | 139,964,668 | |
| (a) | | Commenced operations on April 17, 2018. |
| (b) | | Commenced operations on April 30, 2018. |
93
GOLDMAN SACHS TAX-ADVANTAGED EQUITY FUNDS
Notes to Financial Statements(continued)
June 30, 2019 (Unaudited)
|
| 12. SUMMARY OF SHARE TRANSACTIONS (continued) |
| | | | | | | | | | | | | | | | |
| | | InternationalTax-Managed Equity Fund | |
| | | | |
| | | For the Six Months Ended
June 30, 2019
(Unaudited) | | | For the Fiscal Year Ended
December 31, 2018 | |
| | | | |
| | | Shares | | | Dollars | | | Shares | | | Dollars | |
| | | | |
| Class A Shares | | | | | | | | | | | | | | | | |
Shares sold | | | 107,906 | | | $ | 1,046,467 | | | | 433,592 | | | $ | 4,744,157 | |
Reinvestment of distributions | | | — | | | | — | | | | 16,440 | | | | 143,686 | |
Shares redeemed | | | (145,569 | ) | | | (1,405,210 | ) | | | (401,065 | ) | | | (4,071,679 | ) |
| | | | (37,663 | ) | | | (358,743 | ) | | | 48,967 | | | | 816,164 | |
| Class C Shares | | | | | | | | | | | | | | | | |
Shares sold | | | 5,277 | | | | 48,851 | | | | 185,896 | | | | 1,983,469 | |
Reinvestment of distributions | | | — | | | | — | | | | 2,415 | | | | 20,501 | |
Shares redeemed | | | (110,125 | ) | | | (1,028,823 | ) | | | (145,534 | ) | | | (1,419,976 | ) |
| | | | (104,848 | ) | | | (979,972 | ) | | | 42,777 | | | | 583,994 | |
| Institutional Shares | | | | | | | | | | | | | | | | |
Shares sold | | | 720,083 | | | | 6,846,373 | | | | 7,605,815 | | | | 82,771,894 | |
Reinvestment of distributions | | | — | | | | — | | | | 39,199 | | | | 341,815 | |
Shares redeemed | | | (839,389 | ) | | | (8,142,306 | ) | | | (62,839,603 | ) | | | (668,058,108 | ) |
| | | | (119,306 | ) | | | (1,295,933 | ) | | | (55,194,589 | ) | | | (584,944,399 | ) |
| Investor Shares | | | | | | | | | | | | | | | | |
Shares sold | | | 481,604 | | | | 4,585,698 | | | | 1,372,365 | | | | 14,541,257 | |
Reinvestment of distributions | | | — | | | | — | | | | 34,106 | | | | 297,404 | |
Shares redeemed | | | (261,921 | ) | | | (2,533,183 | ) | | | (1,258,959 | ) | | | (13,294,693 | ) |
| | | | 219,683 | | | | 2,052,515 | | | | 147,512 | | | | 1,543,968 | |
| Class P Shares(a) | | | | | | | | | | | | | | | | |
Shares sold | | | 561,311 | | | | 5,268,330 | | | | 11,151,190 | | | | 115,721,758 | |
Reinvestment of distributions | | | — | | | | — | | | | 182,381 | | | | 1,579,421 | |
Shares redeemed | | | (1,119,533 | ) | | | (10,613,426 | ) | | | (4,042,582 | ) | | | (36,926,746 | ) |
| | | | (558,222 | ) | | | (5,345,096 | ) | | | 7,290,989 | | | | 80,374,433 | |
| Class R6 Shares(b) | | | | | | | | | | | | | | | | |
Shares sold | | | 4,676,817 | | | | 44,982,605 | | | | 60,289,988 | | | | 639,695,481 | |
Reinvestment of distributions | | | — | | | | — | | | | 1,340,050 | | | | 11,604,833 | |
Shares redeemed | | | (2,031,509 | ) | | | (19,660,507 | ) | | | (1,662,745 | ) | | | (15,869,218 | ) |
| | | | 2,645,308 | | | | 25,322,098 | | | | 59,967,293 | | | | 635,431,096 | |
| | | | |
NET INCREASE | | | 2,044,952 | | | $ | 19,394,869 | | | | 12,302,949 | | | $ | 133,805,256 | |
| (a) | | Commenced operations on April 17, 2018. |
| (b) | | Commenced operations on April 30, 2018. |
94
GOLDMAN SACHS TAX-ADVANTAGED EQUITY FUNDS
Fund Expenses — Six Month Period Ended June 30, 2019 (Unaudited)
As a shareholder of Class A, Class C, Institutional, Service, Investor, Class P or Class R6 Shares of a Fund you incur types of costs: (1) transaction costs, including sales charges on purchase payments (with respect to Class A Shares) contingent deferred sales charges on redemptions (with respect to Class C Shares), (if any); and (2) ongoing costs, including management fees; distribution and/or service (12b-1) fees (with respect to Class A, Class C and Service Shares); and other Fund expenses. This example is intended to help you understand your ongoing costs (in dollars) of investing in Class A, Class C, Institutional, Service, Investor, Class P and Class R6 Shares of the Funds and to compare these costs with the ongoing costs of investing in other mutual funds.
The example is based on an investment of $1,000 invested at the beginning of the period and held for the entire period from January 1, 2019 through June 30, 2019, which represents a period of 181 days of a 365 day year.
Actual Expenses— The first line under each share class in the table below provides information about actual account values and actual expenses. You may use the information in this line, together with the amount you invested, to estimate the expenses that you paid over the period. Simply divide your account value by $1,000 (for example, an $8,600 account value divided by $1,000=8.6), then multiply the result by the number in the first line under the heading entitled “Expenses Paid” to estimate the expenses you paid on your account during this period.
Hypothetical Example for Comparison Purposes— The second line under each share class in the table below provides information about hypothetical account values and hypothetical expenses based on the Funds’ actual net expense ratio and an assumed rate of return of 5% per year before expenses, which is not the Funds’ actual return. The hypothetical account values and expenses may not be used to estimate the actual ending account balance or expenses you paid for the period. You may use this information to compare the ongoing costs of investing in the Funds and other funds. To do so, compare this 5% hypothetical example with the 5% hypothetical examples that appear in the shareholder reports of the other funds.
Please note that the expenses shown in the table are meant to highlight your ongoing costs only and do not reflect any transactional costs, such as sales charges, redemption fees or exchange fees. Therefore, the second line of the table is useful in comparing ongoing costs only and will not help you determine the relative total costs of owning different funds. In addition, if these transactional costs were included, your costs would have been higher.
| | | | | | | | | | | | | | | | | | | | | | | | | | | | | | | | | | | | | | | | | | | | | | | | |
| | | U.S. Equity Dividend and Premium Fund | | | International Equity Dividend and Premium Fund | | | U.S.Tax-Managed Equity Fund | | | InternationalTax-Managed Equity Fund | |
| Share Class | | Beginning
Account
Value
01/01/19 | | | Ending
Account
Value
06/30/19 | | | Expenses
Paid for the
6 Months Ended
06/30/19* | | | Beginning
Account
Value
01/01/19 | | | Ending
Account
Value
06/30/19 | | | Expenses
Paid for the
6 Months Ended
06/30/19* | | | Beginning
Account
Value
01/01/19 | | | Ending
Account
Value
06/30/19 | | | Expenses
Paid for the
6 Months Ended
06/30/19* | | | Beginning
Account
Value
01/01/19 | | | Ending
Account
Value
06/30/19 | | | Expenses
Paid for the
6 Months Ended
06/30/19* | |
| Class A | | | | | | | | | | | | | | | | | | | | | | | | | | | | | | | | | | | | | | | | | | | | | | | | |
Actual | | $ | 1,000 | | | $ | 1,147.70 | | | $ | 6.02 | | | $ | 1,000 | | | $ | 1,091.80 | | | $ | 6.90 | | | $ | 1,000 | | | $ | 1,152.20 | | | $ | 5.98 | | | $ | 1,000 | | | $ | 1,114.20 | | | $ | 6.66 | |
Hypothetical 5% return | | | 1,000 | | | | 1,019.19 | + | | | 5.66 | | | | 1,000 | | | | 1,018.20 | + | | | 6.66 | | | | 1,000 | | | | 1,019.24 | + | | | 5.61 | | | | 1,000 | | | | 1,018.50 | + | | | 6.36 | |
| Class C | | | | | | | | | | | | | | | | | | | | | | | | | | | | | | | | | | | | | | | | | | | | | | | | |
Actual | | | 1,000 | | | | 1,144.30 | | | | 10.00 | | | | 1,000 | | | | 1,087.50 | | | | 10.77 | | | | 1,000 | | | | 1,148.20 | | | | 9.96 | | | | 1,000 | | | | 1,109.40 | | | | 10.62 | |
Hypothetical 5% return | | | 1,000 | | | | 1,015.47 | + | | | 9.39 | | | | 1,000 | | | | 1,014.48 | + | | | 10.39 | | | | 1,000 | | | | 1,015.52 | + | | | 9.35 | | | | 1,000 | | | | 1,014.73 | + | | | 10.14 | |
| Institutional | | | | | | | | | | | | | | | | | | | | | | | | | | | | | | | | | | | | | | | | | | | | | | | | |
Actual | | | 1,000 | | | | 1,150.10 | | | | 4.00 | | | | 1,000 | | | | 1,093.80 | | | | 4.88 | | | | 1,000 | | | | 1,154.40 | | | | 3.95 | | | | 1,000 | | | | 1,115.60 | | | | 4.72 | |
Hypothetical 5% return | | | 1,000 | | | | 1,021.08 | + | | | 3.76 | | | | 1,000 | | | | 1,020.13 | + | | | 4.71 | | | | 1,000 | | | | 1,021.12 | + | | | 3.71 | | | | 1,000 | | | | 1,020.33 | + | | | 4.51 | |
| Service | | | | | | | | | | | | | | | | | | | | | | | | | | | | | | | | | | | | | | | | | | | | | | | | |
Actual | | | N/A | | | | N/A | | | | N/A | | | | N/A | | | | N/A | | | | N/A | | | | 1,000 | | | | 1,151.70 | | | | 6.62 | | | | N/A | | | | N/A | | | | N/A | |
Hypothetical 5% return | | | N/A | | | | N/A | | | | N/A | | | | N/A | | | | N/A | | | | N/A | | | | 1,000 | | | | 1,018.65 | + | | | 6.21 | | | | N/A | | | | N/A | | | | N/A | |
| Investor | | | | | | | | | | | | | | | | | | | | | | | | | | | | | | | | | | | | | | | | | | | | | | | | |
Actual | | | 1,000 | | | | 1,150.30 | | | | 4.69 | | | | 1,000 | | | | 1,093.50 | | | | 5.61 | | | | 1,000 | | | | 1,153.90 | | | | 4.65 | | | | 1,000 | | | | 1,115.60 | | | | 5.35 | |
Hypothetical 5% return | | | 1,000 | | | | 1,020.43 | + | | | 4.41 | | | | 1,000 | | | | 1,019.44 | + | | | 5.41 | | | | 1,000 | | | | 1,020.48 | + | | | 4.36 | | | | 1,000 | | | | 1,019.74 | + | | | 5.11 | |
| Class P | | | | | | | | | | | | | | | | | | | | | | | | | | | | | | | | | | | | | | | | | | | | | | | | |
Actual | | | 1,000 | | | | 1,150.20 | | | | 3.95 | | | | 1,000 | | | | 1,093.90 | | | | 4.83 | | | | 1,000 | | | | 1,154.30 | | | | 3.90 | | | | 1,000 | | | | 1,115.10 | | | | 4.67 | |
Hypothetical 5% return | | | 1,000 | | | | 1,021.12 | + | | | 3.71 | | | | 1,000 | | | | 1,020.18 | + | | | 4.66 | | | | 1,000 | | | | 1,021.17 | + | | | 3.66 | | | | 1,000 | | | | 1,020.38 | + | | | 4.46 | |
| Class R6 | | | | | | | | | | | | | | | | | | | | | | | | | | | | | | | | | | | | | | | | | | | | | | | | |
Actual | | | 1,000 | | | | 1,150.30 | | | | 3.95 | | | | 1,000 | | | | 1,094.00 | | | | 4.83 | | | | 1,000 | | | | 1,154.80 | | | | 3.90 | | | | 1,000 | | | | 1,116.40 | | | | 4.67 | |
Hypothetical 5% return | | | 1,000 | | | | 1,021.12 | + | | | 3.71 | | | | 1,000 | | | | 1,020.18 | + | | | 4.66 | | | | 1,000 | | | | 1,021.17 | + | | | 3.66 | | | | 1,000 | | | | 1,020.38 | + | | | 4.46 | |
| + | | Hypothetical expenses are based on each Fund’s actual annualized net expense ratios and an assumed rate of return of 5% per year before expenses. |
| * | | Expenses are calculated using each Fund’s annualized net expense ratio for each class, which represents the ongoing expenses as a percentage of net assets for the six months ended June 30, 2019. Expenses are calculated by multiplying the annualized net expense ratio by the average account value for the period; then multiplying the result by the number of days in the most recent fiscal half year; and then dividing that result by the number of days in the fiscal year. The annualized net expense ratios for the period were as follows: |
| | | | | | | | | | | | | | | | | | | | | | | | | | | | |
| Fund | | Class A | | | Class C | | | Institutional | | | Service | | | Investor | | | Class P | | | Class R6 | |
U.S. Equity Dividend and Premium | | | 1.13 | % | | | 1.88 | % | | | 0.75 | % | | | N/A | | | | 0.88 | % | | | 0.74 | % | | | 0.74 | % |
International Equity Dividend and Premium | | | 1.33 | | | | 2.08 | | | | 0.94 | | | | N/A | | | | 1.08 | | | | 0.93 | | | | 0.93 | |
U.S.Tax-Managed Equity | | | 1.12 | | | | 1.87 | | | | 0.74 | | | | 1.24 | % | | | 0.87 | | | | 0.73 | | | | 0.73 | |
InternationalTax-Managed Equity | | | 1.27 | | | | 2.03 | | | | 0.90 | | | | N/A | | | | 1.02 | | | | 0.89 | | | | 0.89 | |
95
GOLDMAN SACHS TAX-ADVANTAGED EQUITY FUNDS
Statement Regarding Basis for Approval of Management Agreement (Unaudited)
Background
The Goldman Sachs International Equity Dividend and Premium Fund, Goldman Sachs InternationalTax-Managed Equity Fund, Goldman Sachs U.S. Equity Dividend and Premium Fund, and Goldman Sachs U.S.Tax-Managed Equity Fund (the “Funds”) are investment portfolios of Goldman Sachs Trust (the “Trust”). The Board of Trustees oversees the management of the Trust and reviews the investment performance and expenses of the Funds at regularly scheduled meetings held throughout the year. In addition, the Board of Trustees determines annually whether to approve the continuance of the Trust’s investment management agreement (the “Management Agreement”) with Goldman Sachs Asset Management, L.P (the “Investment Adviser”) on behalf of the Funds.
The Management Agreement was most recently approved for continuation until June 30, 2020 by the Board of Trustees, including those Trustees who are not parties to the Management Agreement or “interested persons” (as defined in the Investment Company Act of 1940, as amended) of any party thereto (the “Independent Trustees”), at a meeting held onJune 11-12, 2019 (the “Annual Meeting”).
The review process undertaken by the Trustees spans the course of the year and culminates with the Annual Meeting. To assist the Trustees in their deliberations, the Trustees have established a Contract Review Committee (the “Committee”), comprised of the Independent Trustees. The Committee held four meetings over the course of the year since the Management Agreement was last approved. At those Committee meetings, regularly scheduled Board or other committee meetings, and/or the Annual Meeting, matters relevant to the renewal of the Management Agreement were considered by the Board, or the Independent Trustees, as applicable. With respect to each Fund, such matters included:
| | (a) | | the nature and quality of the advisory, administrative, and other services provided to the Fund by the Investment Adviser and its affiliates, including information about: |
| | (i) | | the structure, staff, and capabilities of the Investment Adviser and its portfolio management teams; |
| | (ii) | | the groups within the Investment Adviser and its affiliates that support the portfolio management teams or provide other types of necessary services, including fund services groups (e.g., accounting and financial reporting, tax, shareholder services, and operations); controls and risk management groups (e.g., legal, compliance, valuation oversight, credit risk management, internal audit, compliance testing, market risk analysis, finance, and central funding); sales and distribution support groups, and others (e.g., information technology and training); |
| | (iii) | | trends in employee headcount; |
| | (iv) | | the Investment Adviser’s financial resources and ability to hire and retain talented personnel and strengthen its operations; and |
| | (v) | | the parent company’s support of the Investment Adviser and its mutual fund business, as expressed by the firm’s senior management; |
| | (b) | | information on the investment performance of the Fund, including comparisons to the performance of similar mutual funds, as provided by a third-party mutual fund data provider engaged as part of the contract review process (the “Outside Data Provider”), and a benchmark performance index; and information on general investment outlooks in the markets in which the Fund invests; |
| | (c) | | information provided by the Investment Adviser indicating the Investment Adviser’s views on whether the Fund’s peer group and/or benchmark index had high, medium, or low relevance given the Fund’s particular investment strategy; |
| | (d) | | the terms of the Management Agreement and other agreements with affiliated service providers entered into by the Trust on behalf of the Fund; |
| | (e) | | fee and expense information for the Fund, including: |
| | (i) | | the relative management fee and expense levels of the Fund as compared to those of comparable funds managed by other advisers, as provided by the Outside Data Provider; |
| | (ii) | | the Fund’s expense trends over time; and |
| | (iii) | | to the extent the Investment Adviser manages other types of accounts (such as bank collective trusts, private wealth management accounts, institutional separate accounts,sub-advised mutual funds, andnon-U.S. funds) having investment objectives and policies similar to those of the Fund, comparative information on the advisory fees charged and services provided to those accounts by the Investment Adviser; |
| | (f) | | with respect to the extensive investment performance and expense comparison data provided by the Outside Data Provider, its processes in producing that data for the Fund; |
| | (g) | | the undertakings of the Investment Adviser and its affiliates to implement fee waivers and/or expense limitations; |
| | (h) | | information relating to the profitability of the Management Agreement and the transfer agency and distribution and service arrangements of the Fund to the Investment Adviser and its affiliates; |
| | (i) | | whether the Fund’s existing management fee schedule adequately addressed any economies of scale; |
96
GOLDMAN SACHS TAX-ADVANTAGED EQUITY FUNDS
Statement Regarding Basis for Approval of Management Agreement (Unaudited) (continued)
| | (j) | | a summary of the“fall-out” benefits derived by the Investment Adviser and its affiliates from their relationships with the Fund, including the fees received by the Investment Adviser’s affiliates from the Fund for transfer agency, securities lending, portfolio trading, distribution and other services; |
| | (k) | | a summary of potential benefits derived by the Fund as a result of its relationship with the Investment Adviser; |
| | (l) | | information regarding commissions paid by the Fund and broker oversight, other information regarding portfolio trading, and how the Investment Adviser carries out its duty to seek best execution; |
| | (m) | | portfolio manager ownership of Fund shares; the manner in which portfolio manager compensation is determined; and the number and types of accounts managed by the portfolio managers; |
| | (n) | | the nature and quality of the services provided to the Fund by its unaffiliated service providers, and the Investment Adviser’s general oversight and evaluation (including reports on due diligence) of those service providers as part of the administrative services provided under the Management Agreement; and |
| | (o) | | the Investment Adviser’s processes and policies addressing various types of potential conflicts of interest; its approach to risk management; the annual review of the effectiveness of the Fund’s compliance program; and periodic compliance reports. |
The Trustees also received an overview of the Funds’ distribution arrangements. They received information regarding the Funds’ assets, share purchase and redemption activity, and payment of distribution, service, and shareholder administration fees, as applicable. Information was also provided to the Trustees relating to revenue sharing payments made by and services provided by the Investment Adviser and its affiliates to intermediaries that promote the sale, distribution, and/or servicing of Fund shares. The Independent Trustees also discussed the broad range of other investment choices that are available to Fund investors, including the availability of comparable funds managed by other advisers.
The presentations made at the Board and Committee meetings and at the Annual Meeting encompassed the Funds and other mutual funds for which the Board of Trustees has responsibility. In evaluating the Management Agreement at the Annual Meeting, the Trustees relied upon their knowledge, resulting from their meetings and other interactions throughout the year, of the Investment Adviser and its affiliates, their services, and the Funds. In conjunction with these meetings, the Trustees received written materials and oral presentations on the topics covered, and the Investment Adviser addressed the questions and concerns of the Trustees, including concerns regarding the investment performance of certain of the funds they oversee. The Independent Trustees were advised by their independent legal counsel regarding their responsibilities and other regulatory requirements related to the approval and continuation of mutual fund investment management agreements under applicable law. In addition, the Investment Adviser and its affiliates provided the Independent Trustees with a written response to a formal request for information sent on behalf of the Independent Trustees by their independent legal counsel. During the course of their deliberations, the Independent Trustees met in executive sessions with their independent legal counsel, without representatives of the Investment Adviser or its affiliates present.
Nature, Extent, and Quality of the Services Provided Under the Management Agreement
As part of their review, the Trustees considered the nature, extent, and quality of the services provided to the Funds by the Investment Adviser. In this regard, the Trustees considered both the investment advisory services andnon-advisory services that are provided by the Investment Adviser and its affiliates. The Trustees noted the transition in the leadership and changes in personnel of various of the Investment Adviser’s portfolio management teams that had occurred in recent periods, and the ongoing recruitment efforts aimed at bringing high quality investment talent to the Investment Adviser. They also noted the Investment Adviser’s commitment to maintaining high quality systems and expending substantial resources to respond to ongoing changes to the regulatory and control environment in which the Funds and their service providers operate, as well as the efforts of the Investment Adviser and its affiliates to combat cyber security risks. The Trustees concluded that the Investment Adviser continued to commit substantial financial and operational resources to the Funds and expressed confidence that the Investment Adviser would continue to do so in the future. The Trustees also recognized that the Investment Adviser had made significant commitments to address regulatory compliance requirements applicable to the Funds and the Investment Adviser and its affiliates.
Investment Performance
The Trustees also considered the investment performance of the Funds. In this regard, they compared the investment performance of each Fund to its peers using rankings and ratings compiled by the Outside Data Provider as of December 31, 2018, and updated performance information prepared by the Investment Adviser using the peer group identified by the Outside Data Provider as of March 31, 2019. The information on each Fund’s investment performance was provided for theone-, three-,five-, andten-year periods ending on the applicable dates. The Trustees also reviewed each Fund’s investment performance relative to its
97
GOLDMAN SACHS TAX-ADVANTAGED EQUITY FUNDS
Statement Regarding Basis for Approval of Management Agreement (Unaudited) (continued)
performance benchmark. As part of this review, they considered the investment performance trends of the Funds over time, and reviewed the investment performance of each Fund in light of its investment objective and policies and market conditions.
In addition, the Trustees considered materials prepared and presentations made by the Investment Adviser’s senior management and portfolio management personnel in which Fund performance was assessed. The Trustees also considered the Investment Adviser’s periodic reports with respect to the Funds’ risk profiles, and how the Investment Adviser’s approach to risk monitoring and management influences portfolio management. They noted the efforts of the Funds’ portfolio management team to continue to enhance the investment models used in managing the Funds.
The Trustees considered that the International Equity Dividend and Premium Fund had placed in the third quartile of the Fund’s peer group for theone-,three-, and five-year periods and in the fourth quartile for theten-year period, and had underperformed the Fund’s benchmark index for theone-,three-,five-, andten-year periods ended March 31, 2019. They noted that the InternationalTax-Managed Equity Fund had placed in the top half of the Fund’s peer group for thefive- andten-year periods, the third quartile for the three-year period, and the fourth quartile for theone-year period, and had outperformed the Fund’s benchmark index for thefive- andten-year periods and underperformed for theone- and three-year periods ended March 31, 2019. The Trustees observed that the U.S. Equity Dividend and Premium Fund had placed in the third quartile of the Fund’s peer group for theone-,five-, andten-year periods and in the fourth quartile for the three-year period, and had underperformed the Fund’s benchmark index for theone-,three-,five-, andten-year periods ended March 31, 2019. They also noted that the U.S.Tax-Managed Equity Fund had placed in the top half of the Fund’s peer group for theten-year period, in the third quartile for thethree- and five-year periods, and in the fourth quartile for theone-year period, and had underperformed the Fund’s benchmark index for theone-,three-,five-, andten-year periods ended March 31, 2019.
Costs of Services Provided and Competitive Information
The Trustees considered the contractual terms of the Management Agreement and the fee rates payable by each Fund thereunder. In this regard, the Trustees considered information on the services rendered by the Investment Adviser to the Funds, which included both advisory and administrative services that were directed to the needs and operations of the Funds as registered mutual funds.
In particular, the Trustees reviewed analyses prepared by the Outside Data Provider regarding the expense rankings of the Funds. The analyses provided a comparison of each Fund’s management fee and breakpoints to those of a relevant peer group and category universe; an expense analysis which compared each Fund’s overall net and gross expenses to a peer group and a category universe; and data comparing each Fund’s net expenses to the peer and category medians. The analyses also compared each Fund’s other expenses and fee waivers/reimbursements to those of the peer group and category medians. The Trustees concluded that the comparisons provided by the Outside Data Provider were useful in evaluating the reasonableness of the management fees and total expenses paid by the Funds.
In addition, the Trustees considered the Investment Adviser’s undertakings to implement fee waivers and/or expense limitations. The Trustees also noted that certain changes were being made to existing fee waiver or expense limitation arrangements of the International Equity Dividend and Premium Fund and U.S. Equity Dividend and Premium Fund that would have the effect of decreasing expenses of Class A, Class C, and Investor Shares of each Fund and/or total Fund expenses, with such changes taking effect in connection with the Funds’ next annual registration statement update. They also considered, to the extent that the Investment Adviser manages other types of accounts having investment objectives and policies similar to those of the Funds, comparative fee information for services provided by the Investment Adviser to those accounts, and information that indicated that services provided to the Funds differed in various significant respects from the services provided to other types of accounts which, in many cases, operated under less stringent legal and regulatory structures, required fewer services from the Investment Adviser to a smaller number of client contact points, and were less time-intensive.
In addition, the Trustees noted that shareholders are able to redeem their Fund shares at any time if shareholders believe that the Fund fees and expenses are too high or if they are dissatisfied with the performance of the Fund.
Profitability
The Trustees reviewed each Fund’s contribution to the Investment Adviser’s revenues andpre-tax profit margins. In this regard the Trustees noted that they had received, among other things, profitability analyses and summaries, revenue and expense schedules by Fund and by function (i.e., investment management, transfer agency and distribution and service), and information on the Investment Adviser’s expense allocation methodology. They observed that the profitability and expense figures are substantially similar to those used by the Investment Adviser for many internal purposes, including compensation decisions among various business groups, and are thus subject to a vigorous internal debate about how certain revenue and expenses should be allocated. The Trustees also noted that the internal audit group within the Goldman Sachs organization periodically audits the
98
GOLDMAN SACHS TAX-ADVANTAGED EQUITY FUNDS
Statement Regarding Basis for Approval of Management Agreement (Unaudited) (continued)
expense allocation methodology and that the internal audit group was satisfied with the reasonableness, consistency, and accuracy of the Investment Adviser’s expense allocation methodology. Profitability data for each Fund was provided for 2018 and 2017, and the Trustees considered this information in relation to the Investment Adviser’s overall profitability.
Economies of Scale
The Trustees considered the information that had been provided regarding whether there have been economies of scale with respect to the management of the Funds. The Trustees also considered the breakpoints in the fee rate payable under the Management Agreement for each of the Funds at the following annual percentage rates of the average daily net assets of the Funds:
| | | | | | | | | | | | | | | | |
| | | International
Equity Dividend
and Premium
Fund | | | International
Tax-Managed
Equity
Fund | | | U.S. Equity
Dividend and
Premium
Fund | | | U.S.
Tax-Managed
Equity
Fund | |
| | | | |
| First $1 billion | | | 0.81 | % | | | 0.85 | % | | | 0.75 | % | | | 0.70 | % |
| | | | |
| Next $1 billion | | | 0.73 | | | | 0.77 | | | | 0.68 | | | | 0.63 | |
| | | | |
| Next $3 billion | | | 0.69 | | | | 0.73 | | | | 0.65 | | | | 0.60 | |
| | | | |
| Next $3 billion | | | 0.68 | | | | 0.72 | | | | 0.64 | | | | 0.59 | |
| | | | |
| Over $8 billion | | | 0.67 | | | | 0.71 | | | | 0.63 | | | | 0.58 | |
The Trustees noted that the breakpoints were designed to share potential economies of scale, if any, with the Funds and their shareholders as assets under management reach those asset levels. The Trustees considered the amounts of assets in the Funds; the Funds’ recent share purchase and redemption activity; the information provided by the Investment Adviser relating to the costs of the services provided by the Investment Adviser and its affiliates and their realized profits; information comparing fee rates charged by the Investment Adviser with fee rates charged to other funds in the peer groups; the transfer agent’s undertaking to waive a portion of its fee with respect to the InternationalTax-Managed Equity Fund, U.S. Equity Dividend and Premium Fund and U.S.Tax-Managed Equity Fund and the Investment Adviser’s undertaking to limit certain expenses of the Funds that exceed specified levels. Upon reviewing these matters at the Annual Meeting, the Trustees concluded that the fee breakpoints represented a means of assuring that benefits of scalability, if any, would be passed along to shareholders at the specified asset levels. They also noted that the Investment Adviser had passed along savings to shareholders of the U.S. Equity Dividend and Premium Fund and U.S.Tax-Managed Equity Fund, which had asset levels above at least the first breakpoint during the prior fiscal year.
Other Benefits to the Investment Adviser and Its Affiliates
The Trustees also considered the other benefits derived by the Investment Adviser and its affiliates from their relationships with the Funds as stated above, including: (a) transfer agency fees received by Goldman Sachs & Co. LLC (“Goldman Sachs”); (b) brokerage and futures commissions earned by Goldman Sachs for executing securities and futures transactions on behalf of the Funds; (c) trading efficiencies resulting from aggregation of orders of the Funds with those for other funds or accounts managed by the Investment Adviser; (d) fees earned by Goldman Sachs Agency Lending (“GSAL”), an affiliate of the Investment Adviser, as securities lending agent (and fees earned by the Investment Adviser for managing the fund in which the Funds’ cash collateral is invested); (e) the Investment Adviser’s ability to leverage the infrastructure designed to service the Funds on behalf of its other clients; (f) the Investment Adviser’s ability to cross-market other products and services to Fund shareholders; (g) Goldman Sachs’ retention of certain fees as Fund Distributor; (h) the Investment Adviser’s ability to negotiate better pricing with custodians on behalf of its other clients, as a result of the relationship with the Funds; and (i) the possibility that the working relationship between the Investment Adviser and the Funds’ third-party service providers may cause those service providers to be more likely to do business with other areas of Goldman Sachs. In the course of considering the foregoing, the Independent Trustees requested and received further information quantifying certain of thesefall-out benefits.
Other Benefits to the Funds and Their Shareholders
The Trustees also noted that the Funds receive certain other potential benefits as a result of their relationship with the Investment Adviser, including: (a) trading efficiencies resulting from aggregation of orders of the Funds with those of other funds or accounts managed by the Investment Adviser; (b) enhanced servicing from vendors due to the volume of business generated by the Investment Adviser and its affiliates; (c) enhanced servicing from broker-dealers due to the volume of business generated by the Investment Adviser and its affiliates; (d) the Investment Adviser’s ability to negotiate favorable terms with derivatives counterparties on behalf of the Funds as a result of the size and reputation of the Goldman Sachs organization; (e) the advantages received from the Investment Adviser’s knowledge and experience gained from managing other accounts and products; (f) the
99
GOLDMAN SACHS TAX-ADVANTAGED EQUITY FUNDS
Statement Regarding Basis for Approval of Management Agreement (Unaudited) (continued)
Investment Adviser’s ability to hire and retain qualified personnel to provide services to the Funds because of the reputation of the Goldman Sachs organization; (g) the Funds’ access, through the Investment Adviser, to certain firm-wide resources (e.g., proprietary risk management systems and databases), subject to certain restrictions; (h) the Funds’ ability to participate in the securities lending program administered by GSAL, as measured by the revenue received by the Funds in connection with the program; and (i) the Funds’ access to certain affiliated distribution channels. In addition, the Trustees noted the competitive nature of the mutual fund marketplace, and considered that many of the Funds’ shareholders invested in the Funds in part because of the Funds’ relationship with the Investment Adviser and that those shareholders have a general expectation that the relationship will continue.
Conclusion
In connection with their consideration of the Management Agreement, the Trustees gave weight to each of the factors described above, but did not identify any particular factor as controlling their decision. After deliberation and consideration of all of the information provided, including the factors described above, the Trustees concluded, in the exercise of their business judgment, that the management fees paid by each of the Funds were reasonable in light of the services provided to it by the Investment Adviser, the Investment Adviser’s costs and each Fund’s current and reasonably foreseeable asset levels. The Trustees unanimously concluded that the Investment Adviser’s continued management likely would benefit each Fund and its shareholders and that the Management Agreement should be approved and continued with respect to each Fund until June 30, 2020.
100
FUNDS PROFILE
Goldman Sachs Funds
Goldman Sachs is a premier financial services firm, known since 1869 for creating thoughtful and customized investment solutions in complex global markets.
Today, theInvestment Management Division of Goldman Sachs serves a diverse set of clients worldwide, including private institutions, public entities and individuals. With approximately $1.44 trillion in assets under supervision as of June 30, 2019, Goldman Sachs Asset Management (“GSAM”) has portfolio management teams located around the world and our investment professionals bring firsthand knowledge of local markets to every investment decision. Assets under supervision includes assets under management and other client assets for which Goldman Sachs does not have full discretion. GSAM leverages the resources of Goldman Sachs & Co. LLC subject to legal, internal and regulatory restrictions.
Money Market
Financial Square FundsSM
| ∎ | | Financial Square Treasury Solutions Fund1 |
| ∎ | | Financial Square Government Fund1 |
| ∎ | | Financial Square Money Market Fund2 |
| ∎ | | Financial Square Prime Obligations Fund2 |
| ∎ | | Financial Square Treasury Instruments Fund1 |
| ∎ | | Financial Square Treasury Obligations Fund1 |
| ∎ | | Financial Square Federal Instruments Fund1 |
Investor FundsSM
| ∎ | | Investor Money Market Fund3 |
| ∎ | | Investor Tax-Exempt Money Market Fund3 |
Fixed Income
Short Duration and Government
| ∎ | | High Quality Floating Rate Fund |
| ∎ | | Short-Term Conservative Income Fund |
| ∎ | | Short Duration Government Fund |
| ∎ | | Short Duration Income Fund |
| ∎ | | Inflation Protected Securities Fund |
Multi-Sector
Municipal and Tax-Free
| ∎ | | High Yield Municipal Fund |
| ∎ | | Dynamic Municipal Income Fund |
| ∎ | | Short Duration Tax-Free Fund |
| ∎ | | Municipal Income Completion Fund |
Single Sector
| ∎ | | Investment Grade Credit Fund |
| ∎ | | High Yield Floating Rate Fund |
| ∎ | | Emerging Markets Debt Fund |
| ∎ | | Local Emerging Markets Debt Fund |
Fixed Income Alternatives
| ∎ | | Long Short Credit Strategies Fund |
Fundamental Equity
| ∎ | | Small/Mid Cap Value Fund |
| ∎ | | Small/Mid Cap Growth Fund |
| ∎ | | Concentrated Growth Fund |
| ∎ | | Technology Opportunities Fund |
| ∎ | | Growth Opportunities Fund |
| ∎ | | Rising Dividend Growth Fund |
Tax-Advantaged Equity
| ∎ | | U.S. Tax-Managed Equity Fund |
| ∎ | | International Tax-Managed Equity Fund |
| ∎ | | U.S. Equity Dividend and Premium Fund |
| ∎ | | International Equity Dividend and Premium Fund |
Equity Insights
| ∎ | | Small Cap Equity Insights Fund |
| ∎ | | U.S. Equity Insights Fund |
| ∎ | | Small Cap Growth Insights Fund |
| ∎ | | Large Cap Growth Insights Fund |
| ∎ | | Large Cap Value Insights Fund |
| ∎ | | Small Cap Value Insights Fund |
| ∎ | | International Small Cap Insights Fund |
| ∎ | | International Equity Insights Fund |
| ∎ | | Emerging Markets Equity Insights Fund |
Fundamental Equity International
| ∎ | | International Equity Income Fund |
| ∎ | | International Equity ESG Fund |
| ∎ | | Emerging Markets Equity Fund |
| ∎ | | Imprint Emerging Markets Opportunities Fund5 |
| ∎ | | ESG Emerging Markets Equity Fund |
Alternative
| ∎ | | Real Estate Securities Fund |
| ∎ | | International Real Estate Securities Fund |
| ∎ | | Commodity Strategy Fund |
| ∎ | | Global Real Estate Securities Fund |
| ∎ | | Alternative Premia Fund |
| ∎ | | Absolute Return Tracker Fund |
| ∎ | | Managed Futures Strategy Fund |
| ∎ | | MLP Energy Infrastructure Fund |
| ∎ | | Multi-Manager Alternatives Fund |
| ∎ | | Absolute Return Multi-Asset Fund |
| ∎ | | Global Infrastructure Fund |
Total Portfolio Solutions
| ∎ | | Global Managed Beta Fund |
| ∎ | | Multi-Manager Non-Core Fixed Income Fund |
| ∎ | | Multi-Manager U.S. Dynamic Equity Fund |
| ∎ | | Multi-Manager Global Equity Fund |
| ∎ | | Multi-Manager International Equity Fund |
| ∎ | | Tactical Tilt Overlay Fund |
| ∎ | | Balanced Strategy Portfolio |
| ∎ | | Multi-Manager U.S. Small Cap Equity Fund |
| ∎ | | Multi-Manager Real Assets Strategy Fund |
| ∎ | | Growth and Income Strategy Portfolio |
| ∎ | | Growth Strategy Portfolio |
| ∎ | | Dynamic Global Equity Fund4 |
| ∎ | | Satellite Strategies Portfolio |
| ∎ | | Enhanced Dividend Global Equity Portfolio |
| ∎ | | Tax-Advantaged Global Equity Portfolio |
| ∎ | | Strategic Factor Allocation Fund |
| ∎ | | Target Date 2020 Portfolio |
| ∎ | | Target Date 2025 Portfolio |
| ∎ | | Target Date 2030 Portfolio |
| ∎ | | Target Date 2035 Portfolio |
| ∎ | | Target Date 2040 Portfolio |
| ∎ | | Target Date 2045 Portfolio |
| ∎ | | Target Date 2050 Portfolio |
| ∎ | | Target Date 2055 Portfolio |
| ∎ | | Target Date 2060 Portfolio |
| ∎ | | GQG Partners International Opportunities Fund |
| 1 | | You could lose money by investing in the Fund. Although the Fund seeks to preserve the value of your investment at $1.00 per share, it cannot guarantee it will do so. An investment in the Fund is not a deposit of a bank and is not insured or guaranteed by the Federal Deposit Insurance Corporation or any other government agency. The Fund’s sponsor has no legal obligation to provide financial support to the Fund, and you should not expect that the sponsor will provide financial support to the Fund at any time. |
| 2 | | You could lose money by investing in the Fund. Because the share price of the Fund will fluctuate, when you sell your shares they may be worth more or less than what you originally paid for them. The Fund may impose a fee upon sale of your shares or may temporarily suspend your ability to sell shares if the Fund’s liquidity falls below required minimums because of market conditions or other factors. An investment in the Fund is not a deposit of a bank and is not insured or guaranteed by the Federal Deposit Insurance Corporation or any other government agency. The Fund’s sponsor has no legal obligation to provide financial support to the Fund, and you should not expect that the sponsor will provide financial support to the Fund at any time. |
| 3 | | You could lose money by investing in the Fund. Although the Fund seeks to preserve the value of your investment at $1.00 per share, it cannot guarantee it will do so. The Fund may impose a fee upon sale of your shares or may temporarily suspend your ability to sell shares if the Fund’s liquidity falls below required minimums because of market conditions or other factors. An investment in the Fund is not a deposit of a bank and is not insured or guaranteed by the Federal Deposit Insurance Corporation or any other government agency. The Fund’s sponsor has no legal obligation to provide financial support to the Fund, and you should not expect that the sponsor will provide financial support to the Fund at any time. |
| 4 | | Effective after the close of business on February 28, 2019, the Goldman Sachs Equity Growth Strategy Portfolio was renamed the Goldman Sachs Dynamic Global Equity Fund. |
| | | Financial Square FundsSM and Investor FundsSM are registered service marks of Goldman Sachs & Co. LLC. |
| 5 | | Effective after the close of business on August 30, 2019, the Goldman Sachs N-11 Equity Fund was renamed the Goldman Sachs Imprint Emerging Markets Opportunities Fund. |
| * | | This list covers open-end funds only. Please visit our website at www.GSAMFUNDS.com to learn about our closed-end funds and exchange-traded funds. |
| | |
TRUSTEES Jessica Palmer,Chair Kathryn A. Cassidy Diana M. Daniels James A. McNamara Roy W. Templin Gregory G. Weaver | | OFFICERS James A. McNamara,President Joseph F. DiMaria,Principal Financial Officer,Principal Accounting Officer and Treasurer Caroline L. Kraus,Secretary |
| |
GOLDMAN SACHS & CO. LLC Distributor and Transfer Agent | | GOLDMAN SACHS ASSET MANAGEMENT, L.P. Investment Adviser |
Visit our web site atwww.GSAMFUNDS.com to obtain the most recentmonth-end returns.
Goldman Sachs Asset Management, L.P. 200 West Street, New York, New York 10282
The reports concerning the Funds included in this shareholder report may contain certain forward-looking statements about the factors that may affect the performance of the Funds in the future. These statements are based on Fund management’s predictions and expectations concerning certain future events and their expected impact on the Funds, such as performance of the economy as a whole and of specific industry sectors, changes in the levels of interest rates, the impact of developing world events, and other factors that may influence the future performance of the Funds. Management believes these forward-looking statements to be reasonable, although they are inherently uncertain and difficult to predict. Actual events may cause adjustments in portfolio management strategies from those currently expected to be employed.
A description of the policies and procedures that the Funds use to determine how to vote proxies relating to portfolio securities and information regarding how a Fund voted proxies relating to portfolio securities during the most recent12-month period ended June 30 is available (i) without charge, upon request by calling1-800-526-7384 (for Retail Shareholders) or1-800-621-2550 (for Institutional Shareholders); and (ii) on the Securities and Exchange Commission (“SEC”) web site at http://www.sec.gov.
The Funds will file portfolio holdings information for each month in a fiscal quarter within 60 days after the end of the relevant fiscal quarter on Form N-PORT. Portfolio holdings information for the third month of each fiscal quarter will be made available on the SEC’s web site at http://www.sec.gov. Portfolio holdings information may be obtained upon request and without charge by calling1-800-526-7384 (for Retail Shareholders) or1-800-621-2550 (for Institutional Shareholders).
Goldman Sachs & Co. LLC (‘‘Goldman Sachs’’) does not provide legal, tax or accounting advice. Any statement contained in this communication (including any attachments) concerning U.S. tax matters was not intended or written to be used, and cannot be used, for the purpose of avoiding penalties under the Internal Revenue Code, and was written to support the promotion or marketing of the transaction(s) or matter(s) addressed. Clients of Goldman Sachs should obtain their own independent tax advice based on their particular circumstances.
Holdings and allocations shown are as of June 30, 2019 and may not be representative of future investments. Fund holdings should not be relied on in making investment decisions and should not be construed as research or investment advice regarding particular securities. Current and future holdings are subject to risk.
The Global Industry Classification Standard (GICS) was developed by and is the exclusive property and a service mark of Morgan Stanley Capital International Inc. (MSCI) and Standard & Poor’s, a division of The McGraw-Hill Companies, Inc. (S&P) and is licensed for use by Goldman Sachs. Neither MSCI, S&P nor any other party involved in making or compiling the GICS or any GICS classifications makes any express or implied warranties or representations with respect to such standard or classification (or the results to be obtained by the use thereof), and all such parties hereby expressly disclaim all warranties of originality, accuracy, completeness, merchantability or fitness for a particular purpose with respect to any of such standard or classification. Without limiting any of the foregoing, in no event shall MSCI, S&P, any of their affiliates or any third party involved in making or compiling the GICS or any GICS classifications have any liability for any direct, indirect, special, punitive, consequential or any other damages (including lost profits) even if notified of the possibility of such damages.
The portfolio risk management process includes an effort to monitor and manage risk, but does not imply low risk.
This material is not authorized for distribution to prospective investors unless preceded or accompanied by a current prospectus or summary prospectus, if applicable. Investors should consider a Fund’s objective, risks, and charges and expenses, and read the summary prospectus, if available, and/or the prospectus carefully before investing or sending money. The summary prospectus, if available, and the prospectus contain this and other information about a Fund and may be obtained from your authorized dealer or from Goldman Sachs & Co. LLC by calling (retail –1-800-526-7384) (institutional –1-800-621-2550).
© 2019 Goldman Sachs. All rights reserved. 174796-OTU-1029951 TAXADVSAR-19/28K
Goldman Sachs Funds

| | | | |
| | |
| Semi-Annual Report | | | | June 30, 2019 |
| | |
| | | | Dynamic Global Equity Fund* |
*Effective after the close of business on February 28, 2019, the Goldman Sachs Equity Growth Strategy Portfolio was renamed the Goldman Sachs Dynamic Global Equity Fund.
It is our intention that beginning on January 1, 2021, paper copies of the Fund’s annual and semi-annual shareholder reports will no longer be sent by mail, unless you specifically request paper copies of the reports from the Fund or from your financial intermediary. Instead, the reports will be made available on a website, and you will be notified by mail each time a report is posted and provided with a website link to access the report.
If you already elected to receive shareholder reports electronically, you will not be affected by this change and you need not take any action. At any time, you may elect to receive reports and certain communications from the Fund electronically by calling the applicable toll-free number below or by contacting your financial intermediary.
You may elect to receive all future shareholder reports in paper free of charge. If you hold shares of the Fund directly with the Fund’s transfer agent, you can inform the transfer agent that you wish to receive paper copies of reports by callingtoll-free 800-621-2550 for Institutional, Service, Class R6 and Class P shareholders or800-526-7384 for all other shareholders. If you hold shares of the Fund through a financial intermediary, please contact your financial intermediary to make this election. Your election to receive reports in paper will apply to all Goldman Sachs Funds held in your account if you invest through your financial intermediary or all Goldman Sachs Funds held with the Fund’s transfer agent if you invest directly with the transfer agent.

Goldman Sachs Dynamic Global Equity Fund
| | | | |
| | | |
| NOT FDIC-INSURED | | May Lose Value | | No Bank Guarantee |
PORTFOLIO RESULTS
Goldman Sachs Dynamic Global Equity Fund
Investment Objectives
The Dynamic Global Equity Fund seeks long-term capital appreciation.
Portfolio Management Discussion and Analysis
Effective after the close of business on February 28, 2019, the Goldman Sachs Equity Growth Strategy Portfolio was renamed the Goldman Sachs Dynamic Global Equity Fund (the “Fund”) and it ceased to be among the Goldman Sachs Fund of Funds Portfolios — Asset Allocation. At the same time, its principal investment strategy changed. No modifications in the Fund’s investment objective or benchmark index were made in connection with this change. The performance information reported below is the combined performance of the Fund, reflecting current and prior investment strategies and policies.
Below, the Goldman Sachs Global Portfolio Solutions (“GPS”) Team discusses the Fund’s performance and positioning for thesix-month period ended June 30, 2019 (the “Reporting Period”).
| Q | | How did the Fund perform during the Reporting Period? |
| A | | During the Reporting Period, the Fund’s Class A, Class C, Institutional, Service, Investor, Class P, Class R and Class R6 Shares generated cumulative total returns of 15.81%, 15.41%, 16.07%, 15.74%, 15.91%, 16.06%, 15.69% and 16.00%, respectively. This compares to the 16.23% cumulative total return of the Fund’s benchmark, MSCI All Country World Index (Net, USD, Unhedged) (the “Index”), during the same period. |
| Q | | How did the Fund’s principal investment strategy change after February 28, 2019? |
| A | | Until the close of business on February 28, 2019, the Fund sought to achieve its investment objective by investing mainly in a combination of underlying funds and exchange-traded funds (“ETFs”) (collectively, the “Underlying Funds”). Some of the Underlying Funds invested primarily in equity securities (the “Underlying Equity Funds”) and other Underlying Funds invested dynamically across other markets using various strategies, including a managed-volatility or trend-following approach (the “Underlying Dynamic Funds”). Under normal conditions, substantially all (at least 80%) of the Fund’s total assets were to be allocated among the Underlying Equity Funds. |
| | | After February 28, 2019, the Fund significantly reduced its allocation to the Underlying Funds, while increasing its allocation to derivative instruments in order to gain exposure to global equity asset classes. The Fund’s investments may include Underlying Funds (including ETFs), futures, forwards, options and other instruments with similar economic exposures. The Fund may continue to invest in Underlying Funds that currently exist or that may become available for investment in the future for which Goldman Sachs Asset Management, L.P. or an affiliate now or in the future acts as investment adviser or principal underwriter. |
| Q | | What economic and market factors most influenced the Fund during the Reporting Period? |
| A | | During the Reporting Period overall, the factors most influencing the financial markets and the Fund were global economic data, central bank monetary policy and geopolitics. |
| | | During the first quarter of 2019, when the Reporting Period began, risk assets broadly rebounded from asell-off in the fourth quarter of 2018, as investor sentiment turned positive on a combination of dovish global central bank policy, tentative stabilization in Chinese economic growth and seemingly promising developments in U.S.-China trade talks. (Dovish tends to suggest lower interest rates; opposite of hawkish.) Although global economic growth continued to decelerate during the first calendar quarter, a few “green shoots” began to emerge. (Green shoots is a term used to describe signs of economic recovery or positive data during an economic downturn.) Indications of a bottoming in Chinese credit growth, a modestpick-up in fixed asset investment, and an uptick in March 2019 manufacturing data made investors hopeful for a recovery in Chinese and global |
1
PORTFOLIO RESULTS
| | economic growth. As inflationary pressures remained rather muted, the U.S. Federal Reserve (the “Fed”) and the European Central Bank (“ECB”) each made a dovish shift and then maintained monetary policy stances that were broadly supportive of economic growth. More specifically, the Fed signaled it would make no additional short-term interest rate hikes during 2019, and the ECB indicated it was reluctant to raise interest rates during the calendar year. Global equities, as measured by the MSCI ACWI Investable Market Index, were up 12.86% during the first calendar quarter, led by a rally in U.S. stocks. Emerging markets equities overall underperformed developed markets equities, but Chinese stocks, as represented by the MSCI China Index, rose more than 17%. In fixed income, the10-year U.S. Treasury yield fell during the first quarter of 2019. |
| | | In the second quarter of 2019, continued weakness in global economic growth and low levels of inflation led the Fed and ECB to indicate they might ease monetary policy. In June, the Fed signaled its next policy move was more likely to be an interest rate cut than an interest rate hike. The Fed’s dot plot, which shows interest rate projections of the members of the Federal Open Market Committee, revealed that policymakers expected to keep interest rates stable during 2019, followed by a 25 basis point cut in 2020. (A basis point is 1/100th of a percentage point.) Meanwhile, the ECB hinted that interest rate cuts and quantitative easing were on the table should economic data disappoint in the near term. Global equities were volatile during the second calendar quarter overall, though they rose 3.88%, as measured by the MSCI ACWI Investable Market Index. In May 2019, global equities had suffered a significant decline amid headwinds from U.S.-China trade negotiations. They then recovered in June, driven by dovish central bank actions and market expectations of a pause in U.S.-China trade tensions ahead of the G20 meeting at month end. (Also known as Group of 20 nations, the G20 is a forum attended by finance ministers and central bank governors from the world’s highly developed economies consisting of 19 countries and the European Union.) In fixed income, the10-year U.S. Treasury yield and the10-year German government bond yield fell during the second quarter of 2019 in response to global economic growth weakness and dovish central bank policies. |
| Q | | What key factors were responsible for the Fund’s performance during the Reporting Period? |
| A | | Performance is typically driven by four sources of return: long-term strategic asset allocation, medium-term cycle-aware allocation, short-term tactical allocation and excess returns from investments in Underlying Funds. Strategic asset allocation is the process by which we seek to budget or allocate portfolio risk, as opposed to capital, across a set of asset allocation risk factors. The strategic asset allocation is implemented using a range ofbottom-up security selection strategies across equity asset classes, using fundamental or quantitative investment techniques, as well as the use of derivative instruments. We then incorporate when appropriate our medium-term cycle-aware views and short-term tactical views into the Fund in order to react to changes in the economic cycle and the markets, respectively. (Our short-term tactical views were eliminated from the Fund when its principal investment strategy changed after the close of business on February 28, 2019.) The Fund’s positioning may therefore change over time. |
| | | During the Reporting Period, the Fund generated strongly positive double-digit absolute returns but underperformed the Index on a relative basis. |
| | | Long-term strategic asset allocation added most to the Fund’s performance. The contribution from our short-term tactical decisions was also positive. On the other hand, security selection within the Underlying Funds generated mixed results. We did not hold any medium-term cycle-aware views in the Fund during the Reporting Period. |
| | | Beginning in January 2019, we began to shift the Fund to a new long-term strategic allocation. The Fund benefited from our efforts to identify attractive entry points in the financial markets as we made the transition. Additionally, during the Reporting Period, the Fund was helped by its allocations to U.S.small-cap stocks, which are not held by the Index. An allocation to U.S.large-cap growth stocks further bolstered performance. Additionally, an allocation to a macroeconomic hedge strategy, which utilizes interest rate options to profit if interest rates fall, remain constant, or rise less than anticipated, contributed most positively. Conversely, an allocation to global real estate securities, which are not held by the Index, diminished returns. Our decision to reduce equity risk toward the end of the Reporting Period detracted marginally from the Fund’s performance as global equities continued to rally. |
| | | Our short-term tactical views, which sought to take advantage of what we considered short-term market mispricing, added to the Fund’s returns during the Reporting Period overall. We eliminated the Fund’s short-term tactical allocation after the close of business on February 28, 2019, when the Fund’s principal investment strategy changed. |
2
PORTFOLIO RESULTS
| | | Overall, security selection within the Underlying Funds was mixed, with underperformance concentrated in Underlying Equity Funds during the Reporting Period. |
| Q | | How did the Underlying Funds perform relative to their respective benchmark indices during the Reporting Period? |
| A | | Among Underlying Equity Funds, the Goldman Sachs International Small Cap Insights Fund and the Goldman Sachs ActiveBeta® International Equity ETF outperformed their respective benchmark indices during the Reporting Period. The Goldman Sachs Large Cap Value Insights Fund, the Goldman Sachs Large Cap Growth Insights Fund, the Goldman Sachs International Equity Insights Fund, the Goldman Sachs Emerging Markets Equity Insights Fund, the Goldman Sachs Small Cap Equity Insights Fund, the Goldman Sachs ActiveBeta® U.S. Large Cap Equity ETF and the Goldman Sachs ActiveBeta® Emerging Markets Equity ETF underperformed their respective benchmark indices. Among Underlying Funds that invest in real assets, both the Goldman Sachs Global Infrastructure Fund and the Goldman Sachs Real Estate Securities Fund outperformed their respective benchmark indices during the Reporting Period. |
| Q | | How did the Fund use derivatives and similar instruments during the Reporting Period? |
| A | | During the Reporting Period, the Fund used derivatives for the passive replication of asset classes. Specifically, the Fund held strategic positions in U.S.large-cap equities through S&P 500® Index futures; international equities through MSCI EAFE Index futures; emerging markets stocks through MSCI Emerging Markets Index futures; and Canadian stocks through S&P/TSX 60 Index futures (each had a positive impact on performance). |
| | | The Fund employed forward foreign currency exchange contracts within a foreign currency hedging strategy (negative impact), which seeks to manage the risk associated with investing innon-U.S. currencies. In addition, equity options were used within our volatility selling strategy (negative impact). Our volatility selling strategy seeks to benefit from the difference between implied volatility (i.e., expectations of future volatility) and realized volatility (i.e., historical volatility) in equity markets. Finally, the Fund utilized interest rate options in a macroeconomic hedge strategy (positive impact). |
| | | During the Reporting Period overall, some of the Underlying Funds used derivatives to apply their active investment views with greater versatility and potentially to afford greater risk management precision. As market conditions warranted during the Reporting Period, some of these Underlying Funds engaged in forward foreign currency exchange contracts, financial futures contracts, options, swap contracts and structured securities to attempt to enhance portfolio return and for hedging purposes. |
| Q | | What changes did you make within the Fund during the Reporting Period? |
| A | | At the start of the Reporting Period, we began moving the Fund to a new long-term strategic allocation. As part of that effort, we increased the Fund’s exposure to the Goldman Sachs ActiveBeta® U.S. Large Cap Equity ETF during January and February 2019. We also added new strategies that sought to diversify the Fund beyond traditional equity asset classes. Specifically, we added a volatility selling strategy (accomplished through equity options) and a London Interbank Offered Rate (“LIBOR”) floors strategy (accomplished through interest rates options). Additionally, we added an allocation to global infrastructure securities to diversify the Fund’s exposure to real assets beyond global real estate securities. Finally, we added a foreign currency hedging strategy (accomplished through forward foreign currency exchange contracts). |
| | | Between the beginning of the Reporting Period and February 28, 2019, we expressed our short-term tactical views that the Fund have long positions in emerging markets equities, U.S.large-cap equities and international equities. We eliminated the Fund’s short-term tactical allocation after February 28th, preferring to access other sources of potential excess returns. |
| | | After the close of business on February 28, 2019, when the Fund’s principal investment strategy changed, we began adding passive exposure to U.S.large-cap stocks,non-U.S. developed markets equities and emerging markets equities (accomplished through futures). We also increased passive index replication by raising the Fund’s exposure to Goldman Sachs ActiveBeta® ETFs broadly. |
| | | Toward the end of the Reporting Period, we reduced equity risk in the Fund through the purchase of put options on U.S. large cap equities. (A put option is an option contract giving the owner the right, but not the obligation, to sell a specified amount of an underlying asset at a specified price within a specified time.) |
3
PORTFOLIO RESULTS
| Q | | Were there any changes to the Fund’s portfolio management team during the Reporting Period? |
| A | | Effective February 19, 2019, Raymond Chan no longer served as a portfolio manager of the Fund. Additionally, Neill Nuttall began serving as a portfolio manager of the Fund on February 19, 2019. By design, all investment decisions for the Fund are performed within aco-lead or team structure, with multiple subject matter experts. This strategic decision making has been the cornerstone of our approach and ensures continuity in the Fund. At the end of the Reporting Period, the portfolio managers for the Fund were Neill Nuttall and Christopher Lvoff. |
| Q | | What is the Fund’s tactical view and strategy for the months ahead? |
| A | | At the end of the Reporting Period, we emphasized three macro themes. First, we believed the U.S. economy was in “rollover,” meaning we expected increased economic weakness. The economic “green shoots” we had expected to grow during the Reporting Period had instead started to wither. Trade risks also remained elevated, in our view. Our research shows that economic rollovers are characterized by high risks of recession and severe equity declines as well as by episodes of “false positives” and premature warning signals. Second, at the end of the Reporting Period, we believed global economic uncertainty had increased overall. Although we thought the risk of recession had risen, we did not think it was time to position the Fund for such a scenario. Third, we considered a dynamic investment approach particularly important, and we planned to address increased economic uncertainty through the Fund’s positioning and its level of risk exposure. |
| | | At the asset class level at the end of the Reporting Period, we expected a continuation of the equity bull market, assuming the global economy continued to expand over the medium term. However, we thought the upside was likely to be limited by moderately elevated equity valuations and limitations to corporate earnings growth. |
4
FUND BASICS
Dynamic Global Equity Fund
as of June 30, 2019
| | | | | | | | | | |
| | PERFORMANCE REVIEW | |
| | | |
| | | January 1–June 30, 2019 | | Fund Total Return
(based on NAV)1 | | | MSCI® ACWI Index2 | |
| | | |
| | Class A | | | 15.81 | % | | | 16.23 | % |
| | Class C | | | 15.41 | | | | 16.23 | |
| | Institutional | | | 16.07 | | | | 16.23 | |
| | Service | | | 15.74 | | | | 16.23 | |
| | Investor | | | 15.91 | | | | 16.23 | |
| | Class P | | | 16.06 | | | | 16.23 | |
| | Class R | | | 15.69 | | | | 16.23 | |
| | | Class R6 | | | 16.00 | | | | 16.23 | |
| | | | | | | | | |
| | 1 | | The net asset value (“NAV”) represents the net assets of the class of the Fund(ex-dividend) divided by the total number of shares of the class outstanding. The Fund’s performance assumes the reinvestment of dividends and other distributions. The Fund’s performance does not reflect the deduction of any applicable sales charges. |
| | 2 | | The Fund’s benchmark is the MSCI All Country World Index (Net, USD, Unhedged) (“MSCI® ACWI Index”). The MSCI® ACWI Index is a freefloat-adjusted market capitalization weighted index that is designed to measure the equity market performance of developed and emerging markets. The MSCI® ACWI Index consists of 47 country indices comprising 23 developed and 24 emerging market country indices. The developed market country indices included are: Australia, Austria, Belgium, Canada, Denmark, Finland, France, Germany, Hong Kong, Ireland, Israel, Italy, Japan, Netherlands, New Zealand, Norway, Portugal, Singapore, Spain, Sweden, Switzerland, the United Kingdom and the United States. The emerging market country indices are: Brazil, Chile, China, Colombia, Czech Republic, Egypt, Greece, Hungary, India, Indonesia, Korea, Malaysia, Mexico, Pakistan, Peru, Philippines, Poland, Russia, Qatar, South Africa, Taiwan, Thailand, Turkey and the United Arab Emirates. The index figures do not include any deduction for fees or expenses. It is not possible to invest directly in an unmanaged index. |
The returns set forth in the table above represent past performance. Past performance does not guarantee future results. The Fund’s investment return and principal value will fluctuate so that an investor’s shares, when redeemed, may be worth more or less than their original cost. Current performance may be lower or higher than the performance quoted above. Please visit our web site at www.gsamfunds.com to obtain the most recentmonth-end returns.Performance reflects applicable fee waivers and/or expense limitations in effect during the periods shown. In their absence, performance would be reduced. Returns do not reflect the deduction of taxes that a shareholder would pay on Fund distributions or the redemption of Fund shares.
5
FUND BASICS
| | | | | | | | | | | | | | | | | | | | |
| | STANDARDIZED TOTAL RETURNS3 |
| | | | | | |
| | | For the period ended 6/30/19 | | One Year | | | Five Years | | | Ten Years | | | Since Inception | | | Inception Date |
| | | | | | |
| | Class A | | | -2.47 | % | | | 4.99 | % | | | 9.58 | % | | | 4.98 | % | | 1/2/98 |
| | Class C | | | 1.47 | | | | 5.41 | | | | 9.39 | | | | 4.48 | | | 1/2/98 |
| | Institutional | | | 3.60 | | | | 6.60 | | | | 10.64 | | | | 5.66 | | | 1/2/98 |
| | Service | | | 3.11 | | | | 6.08 | | | | 10.09 | | | | 5.15 | | | 1/2/98 |
| | Investor | | | 3.45 | | | | 6.45 | | | | 10.49 | | | | 4.28 | | | 11/30/07 |
| | Class P | | | 3.60 | | | | N/A | | | | N/A | | | | 0.99 | | | 4/17/18 |
| | Class R | | | 2.95 | | | | 5.92 | | | | 9.97 | | | | 3.80 | | | 11/30/07 |
| | | Class R6 | | | 3.61 | | | | N/A | | | | N/A | | | | 7.84 | | | 7/31/15 |
| | 3 | | The Standardized Total Returns are average annual total returns or cumulative total returns (only if the performance period is one year or less) as of the most recent calendarquarter-end.They assume reinvestment of all distributions at NAV. These returns reflect a maximum initial sales charge of 5.5% for Class A Shares and the assumed contingent deferred sales charge for Class C Shares (1% if redeemed within 12 months of purchase). Because Institutional, Service,Investor, Class P, Class R and Class R6 Shares do not involve a sales charge, such a charge is not applied to their Standardized Total Returns. |
The returns set forth in the table above represent past performance. Past performance does not guarantee future results. The Fund’s investment return and principal value will fluctuate so that an investor’s shares, when redeemed, may be worth more or less than their original cost. Current performance may be lower or higher than the performance quoted above. Please visit our web site at www.gsamfunds.com to obtain the most recentmonth-end returns.Performance reflects applicable fee waivers and/or expense limitations in effect during the periods shown. In their absence, performance would be reduced. Returns do not reflect the deduction of taxes that a shareholder would pay on Fund distributions or the redemption of Fund shares.
| | | | | | | | | | |
| | EXPENSE RATIOS4 | |
| | | |
| | | | | Net Expense Ratio (Current) | | | Gross Expense Ratio (Before Waivers) | |
| | | |
| | Class A | | | 0.83 | % | | | 0.91 | % |
| | Class C | | | 1.58 | | | | 1.66 | |
| | Institutional | | | 0.44 | | | | 0.52 | |
| | Service | | | 0.94 | | | | 1.02 | |
| | Investor | | | 0.58 | | | | 0.66 | |
| | Class P | | | 0.43 | | | | 0.51 | |
| | Class R | | | 1.08 | | | | 1.16 | |
| | | Class R6 | | | 0.43 | | | | 0.51 | |
| | 4 | | The expense ratios of the Fund, both current (net of applicable fee waivers and/or expense limitations) and before waivers (gross of applicable fee waivers and/or expense limitations) are as set forth above according to the most recent publicly available Prospectus for the Fund and may differ from the expense ratios disclosed in the Financial Highlights in this report. Pursuant to contractual arrangements, the Fund’s waivers and/or expense limitations will remain in place through at least April 30, 2020, and prior to such date, the Investment Adviser may not terminate the arrangements without the approval of the Fund’s Board of Trustees. If these arrangements are discontinued in the future, the expense ratios may change without shareholder approval. |
6
FUND BASICS
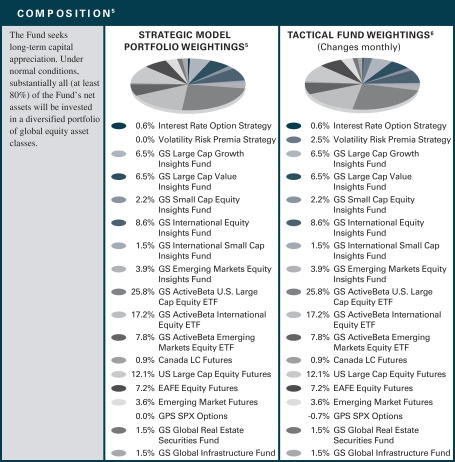
| | 5 | | Strategic allocation is the process of determining the areas of the global markets in which to invest, and in what long-term proportion, for each underlying fund. Our global approach attempts to generate strong long-term returns across geographies and asset classes, and is determined through a careful review of market opportunities and risk/return tradeoffs. On a monthly basis or as needed, we shift assets around the strategic allocation, over and under-weighting asset classes and countries relative to the neutral starting point, seeking to benefit from changing short-term conditions in global capital markets. This is called tactical asset allocation. |
| | 6 | | Generally, tactical fund weightings are rebalanced approximately monthly, but they may be rebalanced more or less frequently at the discretion of the Investment Adviser based on the market environment and its macro views. The weightings in the chart above reflect the allocations as of June 30, 2019. Actual underlying fund weighting in the Fund may differ from the figures shown above due to rounding, differences in returns of the underlying funds, or both. The above figures are not indicative of future allocations. |
7
FUND BASICS
|
| OVERALL UNDERLYING FUND WEIGHTINGS7 |
|
| Percentage of Net Assets |
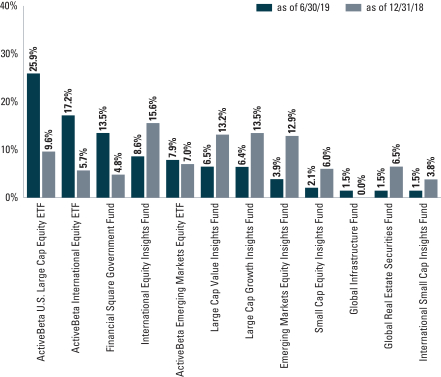
| | 7 | | The Fund is actively managed and, as such, its composition may differ over time. The percentage shown for each underlying fund reflects the value of that underlying fund as a percentage of net assets of the Fund. Figures in the above graph may not sum to 100% due to rounding and/or the exclusion of other assets and liabilities. The graph depicts the Fund’s investments but may not represent the Fund’s market exposure due to the exclusion of certain derivatives, if any, as listed in the Additional Investment Information section of the Schedule of Investments. |
8
GOLDMAN SACHS DYNAMIC GLOBAL EQUITY FUND
Index Definitions
MSCI ACWI Investable Market Indexcaptures large, mid and small cap representation across 23 developed markets and 26 emerging markets countries.
MSCI China Index captures large and mid cap representation across China H shares, B shares, Red chips, P chips and foreign listings.
MSCI EAFE Index is an equity index that captureslarge-cap andmid-cap representation across 21 developed markets countries around the world, excluding the U.S. and Canada. The index covers approximately 85% of the free float-adjusted market capitalization in each country. Developed markets countries in the index include Australia, Austria, Belgium, Denmark, Finland, France, Germany, Hong Kong, Ireland, Israel, Italy, Japan, the Netherlands, New Zealand, Norway, Portugal, Singapore, Spain, Sweden, Switzerland and the U.K.
MSCI Emerging Markets Index captureslarge-cap andmid-cap representation across 24 emerging markets countries. The index covers approximately 85% of the free float-adjusted market capitalization in each country. Emerging markets countries in the index include Brazil, Chile, China, Colombia, Czech Republic, Egypt, Greece, Hungary, India, Indonesia, Korea, Malaysia, Mexico, Pakistan, Peru, Philippines, Poland, Qatar, Russia, South Africa, Taiwan, Thailand, Turkey and United Arab Emirates.
S&P 500® Index is a U.S. stock market index based on the market capitalizations of 500 large companies having common stock listed on the New York Stock Exchange or NASDAQ. The S&P 500® Index components and their weightings are determined by S&P Dow Jones Indices.
S&P/TSX 60 Index is a stock market index of 60 large companies listed on the Toronto Stock Exchange.
It is not possible to invest directly in an unmanaged index.
9
GOLDMAN SACHS DYNAMIC GLOBAL EQUITY FUND
Schedule of Investments
June 30, 2019 (Unaudited)
| | | | | | | | |
Shares | | | Description | | Value | |
|
| Underlying Funds(a) – 83.0% | |
| Equity – 32.0% | |
| | 5,726,000 | | | Goldman Sachs International Equity Insights Fund – Class R6 | | $ | 71,918,561 | |
| | 2,579,080 | | | Goldman Sachs Large Cap Value Insights Fund – Class R6 | | | 53,851,180 | |
| | 1,684,395 | | | Goldman Sachs Large Cap Growth Insights Fund – Class R6 | | | 53,749,034 | |
| | 3,364,729 | | | Goldman Sachs Emerging Markets Equity Insights Fund – Class R6 | | | 32,200,458 | |
| | 687,996 | | | Goldman Sachs Small Cap Equity Insights Fund – Class R6 | | | 17,936,054 | |
| | 1,079,535 | | | Goldman Sachs Global Infrastructure Fund – Class R6 | | | 12,608,967 | |
| | 1,104,774 | | | Goldman Sachs Global Real Estate Securities Fund – Class R6 | | | 12,395,563 | |
| | 1,060,314 | | | Goldman Sachs International Small Cap Insights Fund – Class R6 | | | 12,183,006 | |
| | | | | | | | |
| | | | | | | 266,842,823 | |
| | |
| Exchange Traded Funds – 51.0% | |
| | 3,669,227 | | | Goldman Sachs ActiveBeta U.S. Large Cap Equity ETF | | | 215,640,471 | |
| | 4,987,100 | | | Goldman Sachs ActiveBeta International Equity ETF | | | 143,030,028 | |
| | 2,011,678 | | | Goldman Sachs ActiveBeta Emerging Markets Equity ETF | | | 66,123,856 | |
| | | | | | | | |
| | | | | | | 424,794,355 | |
| | |
| | TOTAL UNDERLYING FUNDS – 83.0% | |
| | (Cost $659,335,036) | | $ | 691,637,178 | |
| | |
| | | | | | | | |
| Shares | | | Dividend Rate | | Value | |
|
| Investment Company(a) – 13.5% | |
| Goldman Sachs Financial Square Government Fund –
Institutional Shares |
|
| | 112,151,707 | | | 2.308% | | $ | 112,151,707 | |
| | (Cost $112,151,707) | |
| | |
| | TOTAL INVESTMENTS – 96.5% | |
| | (Cost $771,486,743) | | $ | 803,788,885 | |
| | |
| OTHER ASSETS IN EXCESS OF
LIABILITIES – 3.5% | | | 29,261,423 | |
| | |
| | NET ASSETS – 100.0% | | $ | 833,050,308 | |
| | |
| | |
| The percentage shown for each investment category reflects the value of investments in that category as a percentage of net assets. |
| |
(a) | | Represents an Affiliated Issuer. |
| | |
|
Currency Abbreviations: |
AUD | | —Australian Dollar |
CAD | | —Canadian Dollar |
CHF | | —Swiss Franc |
DKK | | —Danish Krone |
EUR | | —Euro |
GBP | | —British Pound |
GBP | | —Great British Pound |
HKD | | —Hong Kong Dollar |
ILS | | —Israeli Shekel |
JPY | | —Japanese Yen |
NOK | | —Norwegian Krone |
NZD | | —New Zealand Dollar |
SEK | | —Swedish Krona |
SGD | | —Singapore Dollar |
USD | | —U.S. Dollar |
|
Investment Abbreviations: |
ETF | | —Exchange Traded Fund |
PLC | | —Public Limited Company |
|
| | |
| 10 | | The accompanying notes are an integral part of these financial statements. |
GOLDMAN SACHS DYNAMIC GLOBAL EQUITY FUND
|
| ADDITIONAL INVESTMENT INFORMATION |
FORWARD FOREIGN CURRENCY EXCHANGE CONTRACTS — At June 30, 2019, the Fund had the following forward foreign currency exchange contracts:
FORWARD FOREIGN CURRENCY EXCHANGE CONTRACTS WITH UNREALIZED GAIN
| | | | | | | | | | | | | | | | | | | | |
| Counterparty | | Currency
Purchased | | | Currency
Sold | | | Settlement
Date | | | Unrealized
Gain | |
| | | | | | |
MS & Co. Int. PLC | | USD | | | 8,690,203 | | | GBP | | | 6,800,000 | | | | 09/18/19 | | | $ | 23,774 | |
FORWARD FOREIGN CURRENCY EXCHANGE CONTRACTS WITH UNREALIZED LOSS
| | | | | | | | | | | | | | | | | | | | |
| Counterparty | | Currency
Purchased | | | Currency
Sold | | | Settlement
Date | | | Unrealized
Loss | |
MS & Co. Int. PLC | | USD | | | 4,714,882 | | | CHF | | | 4,630,000 | | | | 09/18/19 | | | $ | (62,194 | ) |
| | USD | | | 12,705,663 | | | JPY | | | 1,363,000,000 | | | | 09/18/19 | | | | (10,309 | ) |
| | USD | | | 3,683,988 | | | AUD | | | 5,260,000 | | | | 09/18/19 | | | | (17,641 | ) |
| | USD | | | 368,876 | | | NOK | | | 3,200,000 | | | | 09/18/19 | | | | (7,075 | ) |
| | USD | | | 917,697 | | | DKK | | | 6,030,000 | | | | 09/18/19 | | | | (7,157 | ) |
| | USD | | | 133,023 | | | NZD | | | 200,000 | | | | 09/18/19 | | | | (1,538 | ) |
| | USD | | | 156,731 | | | ILS | | | 560,000 | | | | 09/18/19 | | | | (953 | ) |
| | USD | | | 1,967,056 | | | HKD | | | 15,400,000 | | | | 09/18/19 | | | | (5,046 | ) |
| | USD | | | 705,174 | | | SGD | | | 960,000 | | | | 09/18/19 | | | | (5,217 | ) |
| | USD | | | 16,560,525 | | | EUR | | | 14,580,000 | | | | 09/18/19 | | | | (122,769 | ) |
| | | USD | | | 1,396,272 | | | SEK | | | 13,050,000 | | | | 09/18/19 | | | | (17,021 | ) |
| | | | | | |
| TOTAL | | | | | | | | | | | | | | | | | | $ | (256,920 | ) |
| | | | | | |
| TOTAL | | | | | | | | | | | | | | | | | | $ | (233,146 | ) |
FUTURES CONTRACTS — At June 30, 2019, the Fund had the following futures contracts:
| | | | | | | | | | | | | | | | |
| Description | | Number of
Contracts | | | Expiration
Date | | | Notional
Amount | | | Unrealized
Appreciation/
(Depreciation) | |
Long position contracts: | | | | | | | | | | | | | | | | |
Mini MSCI EAFE Index | | | 629 | | | | 09/20/19 | | | $ | 60,487,785 | | | $ | 1,689,778 | |
MSCI Emerging Markets Index | | | 578 | | | | 09/20/19 | | | | 30,443,260 | | | | 1,283,119 | |
S&P 500E-Mini Index | | | 690 | | | | 09/20/19 | | | | 101,574,900 | | | | 1,706,508 | |
S&P Toronto Stock Exchange 60 Index | | | 50 | | | | 09/19/19 | | | | 7,465,923 | | | | 67,427 | |
| | | | |
| TOTAL FUTURES CONTRACTS | | | | | | | | | | | | | | $ | 4,746,832 | |
| | |
| The accompanying notes are an integral part of these financial statements. | | 11 |
GOLDMAN SACHS DYNAMIC GLOBAL EQUITY FUND
Schedule of Investments(continued)
June 30, 2019 (Unaudited)
|
| ADDITIONAL INVESTMENT INFORMATION (continued) |
PURCHASED AND WRITTEN OPTIONS CONTRACTS — At June 30, 2019, the Fund had the following purchased and written options:
EXCHANGE TRADED OPTIONS ON FUTURES
| | | | | | | | | | | | | | | | | | | | | | | | | | | | |
| Description | | Exercise
Price | | | Expiration
Date | | | Number of
Contracts | | | Notional
Amount | | | Market
Value | | | Premiums
Paid (Received)
by Fund | | | Unrealized
Appreciation/
(Depreciation) | |
Purchased option contracts | | | | | | | | | | | | | | | | | | | | | | | | | | | | |
Calls | | | | | | | | | | | | | | | | | | | | | | | | | | | | |
Eurodollar Futures | | $ | 97.500 | | | | 09/14/2020 | | | | 36 | | | $ | 90,000 | | | $ | 86,400 | | | $ | 50,483 | | | $ | 35,917 | |
Eurodollar Futures | | | 97.500 | | | | 12/14/2020 | | | | 19 | | | | 47,500 | | | | 46,075 | | | | 28,069 | | | | 18,006 | |
Eurodollar Futures | | | 97.000 | | | | 03/15/2021 | | | | 205 | | | | 512,500 | | | | 750,812 | | | | 541,163 | | | | 209,649 | |
Eurodollar Futures | | | 98.500 | | | | 06/15/2020 | | | | 31 | | | | 77,500 | | | | 17,050 | | | | 15,572 | | | | 1,478 | |
Eurodollar Futures | | | 98.250 | | | | 03/15/2021 | | | | 605 | | | | 1,512,500 | | | | 703,312 | | | | 704,341 | | | | (1,029 | ) |
Eurodollar Futures | | | 98.250 | | | | 06/14/2021 | | | | 511 | | | | 1,277,500 | | | | 606,812 | | | | 629,610 | | | | (22,798 | ) |
Eurodollar Futures | | | 98.500 | | | | 12/13/2021 | | | | 296 | | | | 740,000 | | | | 273,800 | | | | 291,087 | | | | (17,287 | ) |
Eurodollar Futures | | | 97.000 | | | | 06/14/2021 | | | | 205 | | | | 512,500 | | | | 740,563 | | | | 538,601 | | | | 201,962 | |
Eurodollar Futures | | | 98.250 | | | | 09/13/2021 | | | | 500 | | | | 1,250,000 | | | | 606,251 | | | | 599,298 | | | | 6,953 | |
Eurodollar Futures | | | 98.000 | | | | 06/14/2021 | | | | 394 | | | | 985,000 | | | | 615,625 | | | | 343,612 | | | | 272,013 | |
Eurodollar Futures | | | 97.000 | | | | 09/13/2021 | | | | 266 | | | | 665,000 | | | | 947,625 | | | | 689,942 | | | | 257,683 | |
Eurodollar Futures | | | 98.500 | | | | 03/16/2020 | | | | 47 | | | | 117,500 | | | | 15,863 | | | | 15,972 | | | | (109 | ) |
Eurodollar Futures | | | 97.125 | | | | 09/14/2020 | | | | 23 | | | | 57,500 | | | | 76,043 | | | | 28,803 | | | | 47,240 | |
Eurodollar Futures | | | 97.125 | | | | 12/14/2020 | | | | 31 | | | | 77,500 | | | | 102,881 | | | | 41,147 | | | | 61,734 | |
Eurodollar Futures | | | 98.000 | | | | 03/15/2021 | | | | 213 | | | | 532,500 | | | | 330,150 | | | | 192,194 | | | | 137,956 | |
| | | | | | | |
| TOTAL | | | | | | | | | | | 3,382 | | | $ | 8,455,000 | | | $ | 5,919,262 | | | $ | 4,709,894 | | | $ | 1,209,368 | |
PURCHASED AND WRITTEN OPTIONS CONTRACTS ON EQUITIES
| | | | | | | | | | | | | | | | | | | | | | | | | | | | |
| Description | | Exercise
Price | | | Expiration
Date | | | Number of
Contracts | | | Notional
Amount | | | Market
Value | | | Premiums
Paid (Received)
by Fund | | | Unrealized
Appreciation/
(Depreciation) | |
Written option contracts | | | | | | | | | | | | | | | | | | | | | | | | | | | | |
Calls | | | | | | | | | | | | | | | | | | | | | | | | | | | | |
S&P 500 Index | | $ | 3,010.000 | | | | 07/31/2019 | | | | (11 | ) | | $ | (1,100 | ) | | $ | (17,215 | ) | | $ | (15,893 | ) | | $ | (1,322 | ) |
S&P 500 Index | | | 2,910.000 | | | | 08/30/2019 | | | | (1 | ) | | | (100 | ) | | | (8,740 | ) | | | (3,679 | ) | | | (5,061 | ) |
S&P 500 Index | | | 2,995.000 | | | | 08/30/2019 | | | | (1 | ) | | | (100 | ) | | | (3,780 | ) | | | (2,431 | ) | | | (1,349 | ) |
S&P 500 Index | | | 3,025.000 | | | | 08/30/2019 | | | | (5 | ) | | | (500 | ) | | | (12,650 | ) | | | (11,920 | ) | | | (730 | ) |
S&P 500 Index | | | 2,865.000 | | | | 07/03/2019 | | | | (13 | ) | | | (1,300 | ) | | | (103,870 | ) | | | (32,217 | ) | | | (71,653 | ) |
S&P 500 Index | | | 2,890.000 | | | | 07/31/2019 | | | | (4 | ) | | | (400 | ) | | | (33,260 | ) | | | (17,171 | ) | | | (16,089 | ) |
S&P 500 Index | | | 2,900.000 | | | | 07/31/2019 | | | | (4 | ) | | | (400 | ) | | | (30,280 | ) | | | (7,194 | ) | | | (23,086 | ) |
S&P 500 Index | | | 2,940.000 | | | | 07/31/2019 | | | | (2 | ) | | | (200 | ) | | | (9,730 | ) | | | (6,171 | ) | | | (3,559 | ) |
S&P 500 Index | | | 2,950.000 | | | | 07/10/2019 | | | | (13 | ) | | | (1,300 | ) | | | (30,745 | ) | | | (17,018 | ) | | | (13,727 | ) |
S&P 500 Index | | | 2,960.000 | | | | 07/31/2019 | | | | (3 | ) | | | (300 | ) | | | (11,145 | ) | | | (6,407 | ) | | | (4,738 | ) |
S&P 500 Index | | | 2,970.000 | | | | 07/31/2019 | | | | (3 | ) | | | (300 | ) | | | (9,600 | ) | | | (6,820 | ) | | | (2,780 | ) |
S&P 500 Index | | | 2,980.000 | | | | 07/17/2019 | | | | (13 | ) | | | (1,300 | ) | | | (20,930 | ) | | | (21,425 | ) | | | 495 | |
S&P 500 Index | | | 2,985.000 | | | | 07/24/2019 | | | | (13 | ) | | | (1,300 | ) | | | (24,960 | ) | | | (22,912 | ) | | | (2,048 | ) |
S&P 500 Index | | | 2,990.000 | | | | 07/31/2019 | | | | (10 | ) | | | (1,000 | ) | | | (22,950 | ) | | | (20,462 | ) | | | (2,488 | ) |
S&P 500 Index | | | 2,995.000 | | | | 07/31/2019 | | | | (12 | ) | | | (1,200 | ) | | | (25,140 | ) | | | (22,826 | ) | | | (2,314 | ) |
S&P 500 Index | | | 3,000.000 | | | | 07/31/2019 | | | | (10 | ) | | | (1,000 | ) | | | (19,100 | ) | | | (18,880 | ) | | | (220 | ) |
S&P 500 Index | | | 3,005.000 | | | | 07/31/2019 | | | | (10 | ) | | | (1,000 | ) | | | (17,300 | ) | | | (16,792 | ) | | | (508 | ) |
| | | | | | | |
| | | | | | | | | | | | (128 | ) | | $ | (12,800 | ) | | $ | (401,395 | ) | | $ | (250,218 | ) | | $ | (151,177 | ) |
| | |
| 12 | | The accompanying notes are an integral part of these financial statements. |
GOLDMAN SACHS DYNAMIC GLOBAL EQUITY FUND
|
| ADDITIONAL INVESTMENT INFORMATION (continued) |
PURCHASED AND WRITTEN OPTIONS CONTRACTS ON EQUITIES (continued)
| | | | | | | | | | | | | | | | | | | | | | | | | | | | |
| Description | | Exercise
Price | | | Expiration
Date | | | Number of
Contracts | | | Notional
Amount | | | Market
Value | | | Premiums
Paid (Received)
by Fund | | | Unrealized
Appreciation/
(Depreciation) | |
Puts | | | | | | | | | | | | | | | | | | | | | | | | | | | | |
S&P 500 Index | | $ | 2,790.000 | | | | 07/31/2019 | | | | (4 | ) | | $ | (400 | ) | | $ | (5,320 | ) | | $ | (19,717 | ) | | $ | 14,397 | |
S&P 500 Index | | | 2,695.000 | | | | 08/30/2019 | | | | (1 | ) | | | (100 | ) | | | (1,610 | ) | | | (4,639 | ) | | | 3,029 | |
S&P 500 Index | | | 2,800.000 | | | | 08/30/2019 | | | | (1 | ) | | | (100 | ) | | | (2,890 | ) | | | (5,217 | ) | | | 2,327 | |
S&P 500 Index | | | 2,840.000 | | | | 08/30/2019 | | | | (2 | ) | | | (200 | ) | | | (7,230 | ) | | | (9,511 | ) | | | 2,281 | |
S&P 500 Index | | | 2,845.000 | | | | 08/30/2019 | | | | (3 | ) | | | (300 | ) | | | (11,145 | ) | | | (13,526 | ) | | | 2,381 | |
S&P 500 Index | | | 2,715.000 | | | | 07/31/2019 | | | | (4 | ) | | | (400 | ) | | | (3,020 | ) | | | (11,283 | ) | | | 8,263 | |
S&P 500 Index | | | 2,720.000 | | | | 07/31/2019 | | | | (4 | ) | | | (400 | ) | | | (3,140 | ) | | | (23,600 | ) | | | 20,460 | |
S&P 500 Index | | | 2,740.000 | | | | 07/03/2019 | | | | (13 | ) | | | (1,300 | ) | | | (715 | ) | | | (30,790 | ) | | | 30,075 | |
S&P 500 Index | | | 2,740.000 | | | | 07/31/2019 | | | | (2 | ) | | | (200 | ) | | | (1,820 | ) | | | (9,529 | ) | | | 7,709 | |
S&P 500 Index | | | 2,820.000 | | | | 07/31/2019 | | | | (3 | ) | | | (300 | ) | | | (5,055 | ) | | | (10,116 | ) | | | 5,061 | |
S&P 500 Index | | | 2,835.000 | | | | 07/10/2019 | | | | (13 | ) | | | (1,300 | ) | | | (8,190 | ) | | | (40,553 | ) | | | 32,363 | |
S&P 500 Index | | | 2,860.000 | | | | 07/31/2019 | | | | (2 | ) | | | (200 | ) | | | (4,640 | ) | | | (7,009 | ) | | | 2,369 | |
S&P 500 Index | | | 2,865.000 | | | | 07/31/2019 | | | | (11 | ) | | | (1,100 | ) | | | (26,565 | ) | | | (30,129 | ) | | | 3,564 | |
S&P 500 Index | | | 2,870.000 | | | | 07/17/2019 | | | | (13 | ) | | | (1,300 | ) | | | (19,760 | ) | | | (30,508 | ) | | | 10,748 | |
S&P 500 Index | | | 2,870.000 | | | | 07/24/2019 | | | | (13 | ) | | | (1,300 | ) | | | (25,870 | ) | | | (33,914 | ) | | | 8,044 | |
S&P 500 Index | | | 2,870.000 | | | | 07/31/2019 | | | | (10 | ) | | | (1,000 | ) | | | (25,150 | ) | | | (27,255 | ) | | | 2,105 | |
S&P 500 Index | | | 2,875.000 | | | | 07/31/2019 | | | | (10 | ) | | | (1,000 | ) | | | (26,150 | ) | | | (29,130 | ) | | | 2,980 | |
S&P 500 Index | | | 2,880.000 | | | | 07/31/2019 | | | | (10 | ) | | | (1,000 | ) | | | (27,250 | ) | | | (29,814 | ) | | | 2,564 | |
S&P 500 Index | | | 2,885.000 | | | | 07/31/2019 | | | | (10 | ) | | | (1,000 | ) | | | (28,450 | ) | | | (31,377 | ) | | | 2,927 | |
| | | | | | | |
| | | | | | | | | | | | (129 | ) | | $ | (12,900 | ) | | $ | (233,970 | ) | | $ | (397,617 | ) | | $ | 163,647 | |
| | | | | | | |
| TOTAL | | | | | | | | | | | (257 | ) | | $ | (25,700 | ) | | $ | (635,365 | ) | | $ | (647,835 | ) | | $ | 12,470 | |
OVER-THE-COUNTER OPTIONS ON EQUITIES
| | | | | | | | | | | | | | | | | | | | | | | | | | | | | | |
| Description | | Counterparty | | Exercise
Price | | | Expiration
Date | | | Number of
Contracts | | | Notional
Amount | | | Market
Value | | | Premiums
Paid (Received)
by Fund | | | Unrealized
Appreciation/
(Depreciation) | |
Purchased option contracts | | | | | | | | | | | | | | | | | | | | | | | | | | | | | | |
Puts | | | | | | | | | | | | | | | | | | | | | | | | | | | | | | |
SPX Index | | Barclays Bank PLC | | $ | 2,801.58 | | | | 01/17/2020 | | | | 5,823 | | | $ | 5,823 | | | $ | 465,199 | | | $ | 516,617 | | | $ | (51,418 | ) |
| | |
|
Abbreviations: |
MS & Co. Int. PLC | | —Morgan Stanley & Co. International PLC |
|
| | |
| The accompanying notes are an integral part of these financial statements. | | 13 |
GOLDMAN SACHS DYNAMIC GLOBAL EQUITY FUND
Statement of Assets and Liabilities
June 30, 2019 (Unaudited)
| | | | | | |
| | | | | | |
| | Assets: | | | | |
| | Investments in Affiliated Funds, at value (cost $771,486,743) | | $ | 803,788,885 | |
| | Purchased options, at value (cost $5,226,511) | | | 6,384,461 | |
| | Cash | | | 16,516,468 | |
| | Foreign currencies, at value (cost $42,418) | | | 58,265 | |
| | Unrealized gain on forward foreign currency exchange contracts | | | 23,774 | |
| | Variation margin on futures | | | 725,104 | |
| | Receivables: | | | | |
| | Collateral on certain derivative contracts(a) | | | 12,410,598 | |
| | Investments sold | | | 248,238 | |
| | Dividends | | | 205,615 | |
| | Fund shares sold | | | 109,317 | |
| | Reimbursement from investment adviser | | | 31,593 | |
| | Other assets | | | 78,186 | |
| | Total assets | | | 840,580,504 | |
| | | | | | |
| | Liabilities: | | | | |
| | Unrealized loss on forward foreign currency exchange contracts | | | 256,920 | |
| | Written option contracts, at value (premium received $647,835) | | | 635,365 | |
| | Payables: | | | | |
| | Fund shares redeemed | | | 5,204,286 | |
| | Investments purchased | | | 715,823 | |
| | Collateral on certain derivative contracts(b) | | | 470,000 | |
| | Management fees | | | 101,053 | |
| | Distribution and Service fees and Transfer Agency fees | | | 94,147 | |
| | Accrued expenses | | | 52,602 | |
| | Total liabilities | | | 7,530,196 | |
| | | | | | |
| | Net Assets: | | | | |
| | Paid-in capital | | | 772,714,963 | |
| | Total distributable earnings (loss) | | | 60,335,345 | |
| | | NET ASSETS | | $ | 833,050,308 | |
| | | Net Assets: | | | | |
| | | Class A | | $ | 155,750,450 | |
| | | Class C | | | 19,738,865 | |
| | | Institutional | | | 19,991,552 | |
| | | Service | | | 629,026 | |
| | | Investor | | | 5,213,529 | |
| | | Class P | | | 119,072,461 | |
| | | Class R | | | 5,788,189 | |
| | | Class R6 | | | 506,866,236 | |
| | | Total Net Assets | | $ | 833,050,308 | |
| | | Shares Outstanding $0.001 par value (unlimited number of shares authorized): | | | | |
| | | Class A | | | 8,271,788 | |
| | | Class C | | | 1,084,779 | |
| | | Institutional | | | 1,048,389 | |
| | | Service | | | 33,546 | |
| | | Investor | | | 280,525 | |
| | | Class P | | | 6,240,239 | |
| | | Class R | | | 310,180 | |
| | | Class R6 | | | 26,572,874 | |
| | | Net asset value, offering and redemption price per share:(c) | | | | |
| | | Class A | | | $18.83 | |
| | | Class C | | | 18.20 | |
| | | Institutional | | | 19.07 | |
| | | Service | | | 18.75 | |
| | | Investor | | | 18.58 | |
| | | Class P | | | 19.08 | |
| | | Class R | | | 18.66 | |
| | | Class R6 | | | 19.07 | |
| | (a) | | Includes segregated cash of $5,068,762, $340,000 and $7,001,836 relating to initial margin requirements and/or collateral on futures, forwards and options transactions, respectively |
| | (b) | | Segregated for initial margin and/or collateral on swaps contracts transactions of $470,000. |
| | (c) | | Maximum public offering price per share for Class A Shares is $19.93. At redemption, Class C Shares may be subject to a contingent deferred sales charge, assessed on the amount equal to the lesser of the current net asset value (“NAV”) or the original purchase price of the shares. |
| | |
| 14 | | The accompanying notes are an integral part of these financial statements. |
GOLDMAN SACHS DYNAMIC GLOBAL EQUITY FUND
Statement of Operations
For the Six Months Ended June 30, 2019 (Unaudited)
| | | | | | |
| | | | | | |
| | Investment income: | |
| | |
| | Dividends from Affiliated Funds | | $ | 5,283,755 | |
| | |
| | Interest | | | 14,608 | |
| | |
| | Total investment income | | | 5,298,363 | |
| | | | | | |
| | Expenses: | |
| | |
| | Management fees | | | 331,308 | |
| | |
| | Distribution and Service fees(a) | | | 315,102 | |
| | |
| | Transfer Agency fees(a) | | | 203,044 | |
| | |
| | Registration fees | | | 60,320 | |
| | |
| | Professional fees | | | 42,939 | |
| | |
| | Custody, accounting and administrative services | | | 30,135 | |
| | |
| | Printing and mailing costs | | | 22,622 | |
| | |
| | Trustee fees | | | 8,212 | |
| | |
| | Service Share fees — Service Plan | | | 745 | |
| | |
| | Service Share fees — Shareholder Administration Plan | | | 745 | |
| | |
| | Prime Broker Fees | | | 105 | |
| | |
| | Other | | | 8,099 | |
| | |
| | Total expenses | | | 1,023,376 | |
| | |
| | Less — expense reductions | | | (164,163 | ) |
| | |
| | Net expenses | | | 859,213 | |
| | |
| | NET INVESTMENT INCOME | | | 4,439,150 | |
| | | | | | |
| | Realized and unrealized gain (loss): | |
| | |
| | Net realized gain (loss) from: | | | | |
| | |
| | Affiliated Funds | | | 18,042,222 | |
| | |
| | Purchased options | | | 2,348,625 | |
| | |
| | Futures contracts | | | 3,868,825 | |
| | |
| | Written options | | | (478,284 | ) |
| | |
| | Forward foreign currency exchange contracts | | | 85,878 | |
| | |
| | Foreign currency transactions | | | (26,674 | ) |
| | |
| | Net change in unrealized gain (loss) on: | | | | |
| | |
| | Affiliated Funds | | | 31,466,236 | |
| | |
| | Purchased options | | | 1,187,342 | |
| | |
| | Futures contracts | | | 4,885,349 | |
| | |
| | Written options | | | 12,470 | |
| | |
| | Forward foreign currency exchange contracts | | | (233,146 | ) |
| | |
| | Foreign currency translation | | | 5,938 | |
| | |
| | Net realized and unrealized gain | | | 61,164,781 | |
| | |
| | NET INCREASE IN NET ASSETS RESULTING FROM OPERATIONS | | $ | 65,603,931 | |
| | (a) | | Class specific Distribution and/or Service and Transfer Agent fees were as follows: |
| | | | | | | | | | | | | | | | | | | | | | | | | | | | | | | | | | | | | | | | | | |
Distribution and/or Service Fees | | | Transfer Agent Fees | |
Class A | | | Class C | | | Class R | | | Class A | | | Class C | | | Institutional | | | Service | | | Investor | | | Class P | | | Class R | | | Class R6 | |
| $ | 183,059 | | | $ | 118,194 | | | $ | 13,849 | | | $ | 131,802 | | | $ | 21,275 | | | $ | 3,726 | | | $ | 119 | | | $ | 4,923 | | | $ | 16,935 | | | $ | 4,986 | | | $ | 19,278 | |
| | |
| The accompanying notes are an integral part of these financial statements. | | 15 |
GOLDMAN SACHS DYNAMIC GLOBAL EQUITY FUND
Statements of Changes in Net Assets
| | | | | | | | | | |
| | | | | For the
Six Months Ended
June 30, 2019
(Unaudited) | | | For the Fiscal
Year Ended
December 31, 2018 | |
| | From operations: | |
| | | |
| | Net investment income | | $ | 4,439,150 | | | $ | 3,378,018 | |
| | | |
| | Net realized gain | | | 23,840,592 | | | | 17,581,598 | |
| | | |
| | Net change in unrealized gain (loss) | | | 37,324,189 | | | | (58,513,379 | ) |
| | Net increase (decrease) in net assets resulting from operations | | | 65,603,931 | | | | (37,553,763 | ) |
| | | | | | | | | | |
| | Distributions to shareholders: | |
| | | |
| | From distributable earnings: | | | | | | | | |
| | | |
| | Class A Shares | | | — | | | | (3,527,838 | ) |
| | | |
| | Class C Shares | | | — | | | | (103,569 | ) |
| | | |
| | Institutional Shares | | | — | | | | (477,191 | ) |
| | | |
| | Service Shares | | | — | | | | (12,880 | ) |
| | | |
| | Investor Shares | | | — | | | | (162,939 | ) |
| | | |
| | Class P Shares(a) | | | — | | | | (3,046,018 | ) |
| | | |
| | Class R Shares | | | — | | | | (117,644 | ) |
| | | |
| | Class R6 Shares | | | — | | | | (133,363 | ) |
| | | |
| | Total distributions to shareholders | | | — | | | | (7,581,442 | ) |
| | | | | | | | | | |
| | From share transactions: | |
| | | |
| | Proceeds from sales of shares | | | 504,091,019 | | | | 194,331,566 | |
| | | |
| | Reinvestment of distributions | | | — | | | | 7,197,075 | |
| | | |
| | Cost of shares redeemed | | | (31,139,223 | ) | | | (235,405,360 | ) |
| | Net increase (decrease) in net assets resulting from share transactions | | | 472,951,796 | | | | (33,876,719 | ) |
| | TOTAL INCREASE (DECREASE) | | | 538,555,727 | | | | (79,011,924 | ) |
| | | | | | | | | | |
| | Net assets: | |
| | Beginning of period | | | 294,494,581 | | | | 373,506,505 | |
| | | |
| | End of period | | $ | 833,050,308 | | | $ | 294,494,581 | |
| | (a) | | Class P Shares commenced operations on April 17, 2018. |
| | |
| 16 | | The accompanying notes are an integral part of these financial statements. |
GOLDMAN SACHS DYNAMIC GLOBAL EQUITY FUND
Financial Highlights
Selected Share Data for a Share Outstanding Throughout Each Period
| | | | | | | | | | | | | | | | | | | | | | | | | | |
| | | | | Goldman Sachs Dynamic Global Equity Fund | |
| | | | | Class A Shares | |
| | | | | Six Months Ended
June 30, 2019
(Unaudited) | | | Year Ended December 31, | |
| | | | | 2018 | | | 2017 | | | 2016 | | | 2015 | | | 2014 | |
| | Per Share Data | |
| | | | | | | |
| | Net asset value, beginning of period | | $ | 16.26 | | | $ | 18.84 | | | $ | 15.25 | | | $ | 14.44 | | | $ | 14.46 | | | $ | 14.29 | |
| | | | | | | |
| | Net investment income(a)(b) | | | 0.11 | | | | 0.20 | | | | 0.16 | | | | 0.16 | | | | 0.09 | | | | 0.23 | |
| | | | | | | |
| | Net realized and unrealized gain (loss) | | | 2.46 | | | | (2.35 | ) | | | 3.80 | | | | 0.83 | | | | 0.03 | | | | 0.20 | |
| | | | | | | |
| | Total from investment operations | | | 2.57 | | | | (2.15 | ) | | | 3.96 | | | | 0.99 | | | | 0.12 | | | | 0.43 | |
| | | | | | | |
| | Distributions to shareholders from net investment income | | | — | | | | (0.43 | ) | | | (0.37 | ) | | | (0.18 | ) | | | (0.14 | ) | | | (0.26 | ) |
| | | | | | | |
| | Net asset value, end of period | | $ | 18.83 | | | $ | 16.26 | | | $ | 18.84 | | | $ | 15.25 | | | $ | 14.44 | | | $ | 14.46 | |
| | | | | | | |
| | Total return(c) | | | 15.81 | % | | | (11.40 | )% | | | 25.96 | % | | | 6.81 | % | | | 0.83 | % | | | 3.01 | % |
| | | | | | | |
| | Net assets, end of period (in 000s) | | $ | 155,750 | | | $ | 135,758 | | | $ | 137,276 | | | $ | 124,514 | | | $ | 134,851 | | | $ | 148,611 | |
| | | | | | | |
| | Ratio of net expenses to average net assets(d) | | | 0.58 | %(e) | | | 0.58 | % | | | 0.59 | % | | | 0.59 | % | | | 0.59 | % | | | 0.60 | % |
| | | | | | | |
| | Ratio of total expenses to average net assets(d) | | | 0.67 | %(e) | | | 0.66 | % | | | 0.67 | % | | | 0.69 | % | | | 0.67 | % | | | 0.68 | % |
| | | | | | | |
| | Ratio of net investment income to average net assets(b) | | | 1.19 | %(e) | | | 1.09 | % | | | 0.93 | % | | | 1.12 | % | | | 0.63 | % | | | 1.56 | % |
| | | | | | | |
| | Portfolio turnover rate(f) | | | 37 | % | | | 11 | % | | | 53 | % | | | 39 | % | | | 18 | % | | | 23 | % |
| | (a) | | Calculated based on the average shares outstanding methodology. |
| | (b) | | Recognition of net investment income by the Fund is affected by the timing of declaration of dividends by the Underlying Funds in which the Fund invests. |
| | (c) | | Assumes investment at the NAV at the beginning of the period, reinvestment of all dividends and distributions, a complete redemption of the investment at the NAV at the end of the period and no sales or redemption charges (if any). Total returns would be reduced if a sales or redemption charge was taken into account. Returns do not reflect the impact of taxes to shareholders relating to Fund distributions or the redemption of Fund shares. Total returns for periods less than one full year are not annualized. |
| | (d) | | Expense ratios exclude the expenses of the Underlying Funds in which the Fund invests. |
| | (f) | | The Fund’s portfolio turnover rate is calculated in accordance with regulatory requirements, without regard to transactions involving short term investments and certain derivatives. If such transactions were included, the Fund’s portfolio turnover rate may be higher. |
| | |
| The accompanying notes are an integral part of these financial statements. | | 17 |
GOLDMAN SACHS DYNAMIC GLOBAL EQUITY FUND
Financial Highlights(continued)
Selected Share Data for a Share Outstanding Throughout Each Period
| | | | | | | | | | | | | | | | | | | | | | | | | | |
| | | | | Goldman Sachs Dynamic Global Equity Fund | |
| | | | | Class C Shares | |
| | | | | Six Months Ended
June 30, 2019
(Unaudited) | | | Year Ended December 31, | |
| | | | | 2018 | | | 2017 | | | 2016 | | | 2015 | | | 2014 | |
| | Per Share Data | |
| | | | | | | |
| | Net asset value, beginning of period | | $ | 15.77 | | | $ | 18.01 | | | $ | 14.58 | | | $ | 13.82 | | | $ | 13.83 | | | $ | 13.68 | |
| | | | | | | |
| | Net investment income (loss)(a)(b) | | | 0.02 | | | | (0.05 | ) | | | 0.01 | | | | 0.05 | | | | (0.02 | ) | | | 0.10 | |
| | | | | | | |
| | Net realized and unrealized gain (loss) | | | 2.41 | | | | (2.12 | ) | | | 3.65 | | | | 0.78 | | | | 0.04 | | | | 0.20 | |
| | | | | | | |
| | Total from investment operations | | | 2.43 | | | | (2.17 | ) | | | 3.66 | | | | 0.83 | | | | 0.02 | | | | 0.30 | |
| | | | | | | |
| | Distributions to shareholders from net investment income | | | — | | | | (0.07 | ) | | | (0.23 | ) | | | (0.07 | ) | | | (0.03 | ) | | | (0.15 | ) |
| | | | | | | |
| | Net asset value, end of period | | $ | 18.20 | | | $ | 15.77 | | | $ | 18.01 | | | $ | 14.58 | | | $ | 13.82 | | | $ | 13.83 | |
| | | | | | | |
| | Total return(c) | | | 15.41 | % | | | (12.04 | )% | | | 25.08 | % | | | 5.95 | % | | | 0.13 | % | | | 2.18 | % |
| | | | | | | |
| | Net assets, end of period (in 000s) | | $ | 19,739 | | | $ | 23,020 | | | $ | 68,315 | | | $ | 75,027 | | | $ | 83,743 | | | $ | 96,667 | |
| | | | | | | |
| | Ratio of net expenses to average net assets(d) | | | 1.33 | %(e) | | | 1.33 | % | | | 1.34 | % | | | 1.34 | % | | | 1.34 | % | | | 1.35 | % |
| | | | | | | |
| | Ratio of total expenses to average net assets(d) | | | 1.42 | %(e) | | | 1.40 | % | | | 1.42 | % | | | 1.44 | % | | | 1.42 | % | | | 1.42 | % |
| | | | | | | |
| | Ratio of net investment income (loss) to average net assets(b) | | | 0.23 | %(e) | | | (0.29 | )% | | | 0.08 | % | | | 0.33 | % | | | (0.15 | )% | | | 0.71 | % |
| | | | | | | |
| | Portfolio turnover rate(f) | | | 37 | % | | | 11 | % | | | 53 | % | | | 39 | % | | | 18 | % | | | 23 | % |
| | (a) | | Calculated based on the average shares outstanding methodology. |
| | (b) | | Recognition of net investment income by the Fund is affected by the timing of declaration of dividends by the Underlying Funds in which the Fund invests. |
| | (c) | | Assumes investment at the NAV at the beginning of the period, reinvestment of all dividends and distributions, a complete redemption of the investment at the NAV at the end of the period and no sales or redemption charges (if any). Total returns would be reduced if a sales or redemption charge was taken into account. Returns do not reflect the impact of taxes to shareholders relating to Fund distributions or the redemption of Fund shares. Total returns for periods less than one full year are not annualized. |
| | (d) | | Expense ratios exclude the expenses of the Underlying Funds in which the Fund invests. |
| | (f) | | The Fund’s portfolio turnover rate is calculated in accordance with regulatory requirements, without regard to transactions involving short term investments and certain derivatives. If such transactions were included, the Fund’s portfolio turnover rate may be higher. |
| | |
| 18 | | The accompanying notes are an integral part of these financial statements. |
GOLDMAN SACHS DYNAMIC GLOBAL EQUITY FUND
Financial Highlights(continued)
Selected Share Data for a Share Outstanding Throughout Each Period
| | | | | | | | | | | | | | | | | | | | | | | | | | |
| | | | | Goldman Sachs Dynamic Global Equity Fund | |
| | | | | Institutional Shares | |
| | | | | Six Months Ended
June 30, 2019
(Unaudited) | | | Year Ended December 31, | |
| | | | | 2018 | | | 2017 | | | 2016 | | | 2015 | | | 2014 | |
| | Per Share Data | |
| | | | | | | |
| | Net asset value, beginning of period | | $ | 16.43 | | | $ | 19.01 | | | $ | 15.38 | | | $ | 14.57 | | | $ | 14.58 | | | $ | 14.41 | |
| | | | | | | |
| | Net investment income(a)(b) | | | 0.14 | | | | 0.09 | | | | 0.24 | | | | 0.23 | | | | 0.16 | | | | 0.29 | |
| | | | | | | |
| | Net realized and unrealized gain (loss) | | | 2.50 | | | | (2.20 | ) | | | 3.83 | | | | 0.82 | | | | 0.03 | | | | 0.20 | |
| | | | | | | |
| | Total from investment operations | | | 2.64 | | | | (2.11 | ) | | | 4.07 | | | | 1.05 | | | | 0.19 | | | | 0.49 | |
| | | | | | | |
| | Distributions to shareholders from net investment income | | | — | | | | (0.47 | ) | | | (0.44 | ) | | | (0.24 | ) | | | (0.20 | ) | | | (0.32 | ) |
| | | | | | | |
| | Net asset value, end of period | | $ | 19.07 | | | $ | 16.43 | | | $ | 19.01 | | | $ | 15.38 | | | $ | 14.57 | | | $ | 14.58 | |
| | | | | | | |
| | Total return(c) | | | 16.07 | % | | | (11.07 | )% | | | 26.48 | % | | | 7.18 | % | | | 1.31 | % | | | 3.38 | % |
| | | | | | | |
| | Net assets, end of period (in 000s) | | $ | 19,992 | | | $ | 16,974 | | | $ | 155,828 | | | $ | 119,108 | | | $ | 117,357 | | | $ | 130,499 | |
| | | | | | | |
| | Ratio of net expenses to average net assets(d) | | | 0.19 | %(e) | | | 0.19 | % | | | 0.20 | % | | | 0.19 | % | | | 0.19 | % | | | 0.20 | % |
| | | | | | | |
| | Ratio of total expenses to average net assets(d) | | | 0.28 | %(e) | | | 0.26 | % | | | 0.28 | % | | | 0.29 | % | | | 0.27 | % | | | 0.28 | % |
| | | | | | | |
| | Ratio of net investment income to average net assets(b) | | | 1.58 | %(e) | | | 0.47 | % | | | 1.40 | % | | | 1.55 | % | | | 1.05 | % | | | 1.96 | % |
| | | | | | | |
| | Portfolio turnover rate(f) | | | 37 | % | | | 11 | % | | | 53 | % | | | 39 | % | | | 18 | % | | | 23 | % |
| | (a) | | Calculated based on the average shares outstanding methodology. |
| | (b) | | Recognition of net investment income by the Fund is affected by the timing of declaration of dividends by the Underlying Funds in which the Fund invests. |
| | (c) | | Assumes investment at the NAV at the beginning of the period, reinvestment of all dividends and distributions, a complete redemption of the investment at the NAV at the end of the period and no sales or redemption charges (if any). Total returns would be reduced if a sales or redemption charge was taken into account. Returns do not reflect the impact of taxes to shareholders relating to Fund distributions or the redemption of Fund shares. Total returns for periods less than one full year are not annualized. |
| | (d) | | Expense ratios exclude the expenses of the Underlying Funds in which the Fund invests. |
| | (f) | | The Fund’s portfolio turnover rate is calculated in accordance with regulatory requirements, without regard to transactions involving short term investments and certain derivatives. If such transactions were included, the Fund’s portfolio turnover rate may be higher. |
| | |
| The accompanying notes are an integral part of these financial statements. | | 19 |
GOLDMAN SACHS DYNAMIC GLOBAL EQUITY FUND
Financial Highlights(continued)
Selected Share Data for a Share Outstanding Throughout Each Period
| | | | | | | | | | | | | | | | | | | | | | | | | | |
| | | | | Goldman Sachs Dynamic Global Equity Fund | |
| | | | | Service Shares | |
| | | | | Six Months Ended
June 30, 2019
(Unaudited) | | | Year Ended December 31, | |
| | | | | 2018 | | | 2017 | | | 2016 | | | 2015 | | | 2014 | |
| | Per Share Data | |
| | | | | | | |
| | Net asset value, beginning of period | | $ | 16.20 | | | $ | 18.75 | | | $ | 15.19 | | | $ | 14.39 | | | $ | 14.40 | | | $ | 14.22 | |
| | | | | | | |
| | Net investment income(a)(b) | | | 0.09 | | | | 0.15 | | | | 0.16 | | | | 0.15 | | | | 0.08 | | | | 0.19 | |
| | | | | | | |
| | Net realized and unrealized gain (loss) | | | 2.46 | | | | (2.31 | ) | | | 3.76 | | | | 0.81 | | | | 0.03 | | | | 0.23 | |
| | | | | | | |
| | Total from investment operations | | | 2.55 | | | | (2.16 | ) | | | 3.92 | | | | 0.96 | | | | 0.11 | | | | 0.42 | |
| | | | | | | |
| | Distributions to shareholders from net investment income | | | — | | | | (0.39 | ) | | | (0.36 | ) | | | (0.16 | ) | | | (0.12 | ) | | | (0.24 | ) |
| | | | | | | |
| | Net asset value, end of period | | $ | 18.75 | | | $ | 16.20 | | | $ | 18.75 | | | $ | 15.19 | | | $ | 14.39 | | | $ | 14.40 | |
| | | | | | | |
| | Total return(c) | | | 15.74 | % | | | (11.48 | )% | | | 25.79 | % | | | 6.66 | % | | | 0.78 | % | | | 2.94 | % |
| | | | | | | |
| | Net assets, end of period (in 000s) | | $ | 629 | | | $ | 543 | | | $ | 684 | | | $ | 470 | | | $ | 577 | | | $ | 626 | |
| | | | | | | |
| | Ratio of net expenses to average net assets(d) | | | 0.69 | %(e) | | | 0.69 | % | | | 0.69 | % | | | 0.69 | % | | | 0.69 | % | | | 0.70 | % |
| | | | | | | |
| | Ratio of total expenses to average net assets(d) | | | 0.78 | %(e) | | | 0.77 | % | | | 0.78 | % | | | 0.79 | % | | | 0.77 | % | | | 0.77 | % |
| | | | | | | |
| | Ratio of net investment income to average net assets(b) | | | 1.07 | %(e) | | | 0.80 | % | | | 0.91 | % | | | 1.01 | % | | | 0.52 | % | | | 1.27 | % |
| | | | | | | |
| | Portfolio turnover rate(f) | | | 37 | % | | | 11 | % | | | 53 | % | | | 39 | % | | | 18 | % | | | 23 | % |
| | (a) | | Calculated based on the average shares outstanding methodology. |
| | (b) | | Recognition of net investment income by the Fund is affected by the timing of declaration of dividends by the Underlying Funds in which the Fund invests. |
| | (c) | | Assumes investment at the NAV at the beginning of the period, reinvestment of all dividends and distributions, a complete redemption of the investment at the NAV at the end of the period and no sales or redemption charges (if any). Total returns would be reduced if a sales or redemption charge was taken into account. Returns do not reflect the impact of taxes to shareholders relating to Fund distributions or the redemption of Fund shares. Total returns for periods less than one full year are not annualized. |
| | (d) | | Expense ratios exclude the expenses of the Underlying Funds in which the Fund invests. |
| | (f) | | The Fund’s portfolio turnover rate is calculated in accordance with regulatory requirements, without regard to transactions involving short term investments and certain derivatives. If such transactions were included, the Fund’s portfolio turnover rate may be higher. |
| | |
| 20 | | The accompanying notes are an integral part of these financial statements. |
GOLDMAN SACHS DYNAMIC GLOBAL EQUITY FUND
Financial Highlights(continued)
Selected Share Data for a Share Outstanding Throughout Each Period
| | | | | | | | | | | | | | | | | | | | | | | | | | |
| | | | | Goldman Sachs Dynamic Global Equity Fund | |
| | | | | Investor Shares | |
| | | | | Six Months Ended
June 30, 2019
(Unaudited) | | | Year Ended December 31, | |
| | | | | 2018 | | | 2017 | | | 2016 | | | 2015 | | | 2014 | |
| | Per Share Data | |
| | | | | | | |
| | Net asset value, beginning of period | | $ | 16.03 | | | $ | 18.58 | | | $ | 15.03 | | | $ | 14.25 | | | $ | 14.27 | | | $ | 14.11 | |
| | | | | | | |
| | Net investment income(a)(b) | | | 0.12 | | | | 0.24 | | | | 0.18 | | | | 0.21 | | | | 0.13 | | | | 0.32 | |
| | | | | | | |
| | Net realized and unrealized gain (loss) | | | 2.43 | | | | (2.32 | ) | | | 3.78 | | | | 0.79 | | | | 0.03 | | | | 0.14 | |
| | | | | | | |
| | Total from investment operations | | | 2.55 | | | | (2.08 | ) | | | 3.96 | | | | 1.00 | | | | 0.16 | | | | 0.46 | |
| | | | | | | |
| | Distributions to shareholders from net investment income | | | — | | | | (0.47 | ) | | | (0.41 | ) | | | (0.22 | ) | | | (0.18 | ) | | | (0.30 | ) |
| | | | | | | |
| | Net asset value, end of period | | $ | 18.58 | | | $ | 16.03 | | | $ | 18.58 | | | $ | 15.03 | | | $ | 14.25 | | | $ | 14.27 | |
| | | | | | | |
| | Total return(c) | | | 15.91 | % | | | (11.18 | )% | | | 26.35 | % | | | 6.99 | % | | | 1.11 | % | | | 3.27 | % |
| | | | | | | |
| | Net assets, end of period (in 000s) | | $ | 5,214 | | | $ | 5,703 | | | $ | 5,481 | | | $ | 5,663 | | | $ | 5,282 | | | $ | 5,280 | |
| | | | | | | |
| | Ratio of net expenses to average net assets(d) | | | 0.33 | %(e) | | | 0.33 | % | | | 0.34 | % | | | 0.34 | % | | | 0.34 | % | | | 0.35 | % |
| | | | | | | |
| | Ratio of total expenses to average net assets(d) | | | 0.42 | %(e) | | | 0.41 | % | | | 0.42 | % | | | 0.44 | % | | | 0.42 | % | | | 0.43 | % |
| | | | | | | |
| | Ratio of net investment income to average net assets(b) | | | 1.35 | %(e) | | | 1.28 | % | | | 1.07 | % | | | 1.47 | % | | | 0.91 | % | | | 2.19 | % |
| | | | | | | |
| | Portfolio turnover rate(f) | | | 37 | % | | | 11 | % | | | 53 | % | | | 39 | % | | | 18 | % | | | 23 | % |
| | (a) | | Calculated based on the average shares outstanding methodology. |
| | (b) | | Recognition of net investment income by the Fund is affected by the timing of declaration of dividends by the Underlying Funds in which the Fund invests. |
| | (c) | | Assumes investment at the NAV at the beginning of the period, reinvestment of all dividends and distributions, a complete redemption of the investment at the NAV at the end of the period and no sales or redemption charges (if any). Total returns would be reduced if a sales or redemption charge was taken into account. Returns do not reflect the impact of taxes to shareholders relating to Fund distributions or the redemption of Fund shares. Total returns for periods less than one full year are not annualized. |
| | (d) | | Expense ratios exclude the expenses of the Underlying Funds in which the Fund invests. |
| | (f) | | The Fund’s portfolio turnover rate is calculated in accordance with regulatory requirements, without regard to transactions involving short term investments and certain derivatives. If such transactions were included, the Fund’s portfolio turnover rate may be higher. |
| | |
| The accompanying notes are an integral part of these financial statements. | | 21 |
GOLDMAN SACHS DYNAMIC GLOBAL EQUITY FUND
Financial Highlights(continued)
Selected Share Data for a Share Outstanding Throughout Each Period
| | | | | | | | | | |
| | | | | Goldman Sachs Dynamic Global Equity Fund | |
| | | | | Class P Shares | |
| | | | | Six Months Ended
June 30, 2019
(Unaudited) | | | Period Ended
December 31, 2018(a) | |
| | Per Share Data | |
| | | |
| | Net asset value, beginning of period | | $ | 16.44 | | | $ | 19.43 | |
| | | |
| | Net investment income(b)(c) | | | 0.14 | | | | 0.31 | |
| | | |
| | Net realized and unrealized gain (loss) | | | 2.50 | | | | (2.80 | ) |
| | | |
| | Total from investment operations | | | 2.64 | | | | (2.49 | ) |
| | | |
| | Distributions to shareholders from net investment income | | | — | | | | (0.50 | ) |
| | | |
| | Net asset value, end of period | | $ | 19.08 | | | $ | 16.44 | |
| | | |
| | Total return(d) | | | 16.06 | % | | | (12.80 | )% |
| | | |
| | Net assets, end of period (in 000s) | | $ | 119,072 | | | $ | 103,074 | |
| | | |
| | Ratio of net expenses to average net assets(e) | | | 0.18 | %(f) | | | 0.18 | %(f) |
| | | |
| | Ratio of total expenses to average net assets(e) | | | 0.27 | %(f) | | | 0.27 | %(f) |
| | | |
| | Ratio of net investment income to average net assets(c) | | | 1.57 | %(f) | | | 2.33 | %(f) |
| | | |
| | Portfolio turnover rate(g) | | | 37 | % | | | 11 | % |
| | (a) | | Commenced operations on April 17, 2018. |
| | (b) | | Calculated based on the average shares outstanding methodology. |
| | (c) | | Recognition of net investment income by the Fund is affected by the timing of declaration of dividends by the Underlying Funds in which the Fund invests. |
| | (d) | | Assumes investment at the NAV at the beginning of the period, reinvestment of all dividends and distributions, a complete redemption of the investment at the NAV at the end of the period and no sales or redemption charges (if any). Total returns would be reduced if a sales or redemption charge was taken into account. Returns do not reflect the impact of taxes to shareholders relating to Fund distributions or the redemption of Fund shares. Total returns for periods less than one full year are not annualized. |
| | (e) | | Expense ratios exclude the expenses of the Underlying Funds in which the Fund invests. |
| | (g) | | The Fund’s portfolio turnover rate is calculated in accordance with regulatory requirements, without regard to transactions involving short term investments and certain derivatives. If such transactions were included, the Fund’s portfolio turnover rate may be higher. |
| | |
| 22 | | The accompanying notes are an integral part of these financial statements. |
GOLDMAN SACHS DYNAMIC GLOBAL EQUITY FUND
Financial Highlights(continued)
Selected Share Data for a Share Outstanding Throughout Each Period
| | | | | | | | | | | | | | | | | | | | | | | | | | |
| | | | | Goldman Sachs Dynamic Global Equity Fund | |
| | | | | Class R Shares | |
| | | | | Six Months Ended
June 30, 2019
(Unaudited) | | | Year Ended December 31, | |
| | | | | 2018 | | | 2017 | | | 2016 | | | 2015 | | | 2014 | |
| | Per Share Data | |
| | | | | | | |
| | Net asset value, beginning of period | | $ | 16.13 | | | $ | 18.69 | | | $ | 15.15 | | | $ | 14.37 | | | $ | 14.37 | | | $ | 14.17 | |
| | | | | | | |
| | Net investment income(a)(b) | | | 0.08 | | | | 0.14 | | | | 0.19 | | | | 0.16 | | | | 0.04 | | | | 0.13 | |
| | | | | | | |
| | Net realized and unrealized gain (loss) | | | 2.45 | | | | (2.32 | ) | | | 3.70 | | | | 0.78 | | | | 0.05 | | | | 0.26 | |
| | | | | | | |
| | Total from investment operations | | | 2.53 | | | | (2.18 | ) | | | 3.89 | | | | 0.94 | | | | 0.09 | | | | 0.39 | |
| | | | | | | |
| | Distributions to shareholders from net investment income | | | — | | | | (0.38 | ) | | | (0.35 | ) | | | (0.16 | ) | | | (0.09 | ) | | | (0.19 | ) |
| | | | | | | |
| | Net asset value, end of period | | $ | 18.66 | | | $ | 16.13 | | | $ | 18.69 | | | $ | 15.15 | | | $ | 14.37 | | | $ | 14.37 | |
| | | | | | | |
| | Total return(c) | | | 15.69 | % | | | (11.63 | )% | | | 25.70 | % | | | 6.49 | % | | | 0.61 | % | | | 2.77 | % |
| | | | | | | |
| | Net assets, end of period (in 000s) | | $ | 5,788 | | | $ | 4,938 | | | $ | 5,910 | | | $ | 2,031 | | | $ | 1,785 | | | $ | 2,339 | |
| | | | | | | |
| | Ratio of net expenses to average net assets(d) | | | 0.83 | %(e) | | | 0.83 | % | | | 0.84 | % | | | 0.84 | % | | | 0.84 | % | | | 0.85 | % |
| | | | | | | |
| | Ratio of total expenses to average net assets(d) | | | 0.92 | %(e) | | | 0.91 | % | | | 0.92 | % | | | 0.94 | % | | | 0.92 | % | | | 0.92 | % |
| | | | | | | |
| | Ratio of net investment income to average net assets(b) | | | 0.91 | %(e) | | | 0.77 | % | | | 1.06 | % | | | 1.10 | % | | | 0.28 | % | | | 0.86 | % |
| | | | | | | |
| | Portfolio turnover rate(f) | | | 37 | % | | | 11 | % | | | 53 | % | | | 39 | % | | | 18 | % | | | 23 | % |
| | (a) | | Calculated based on the average shares outstanding methodology. |
| | (b) | | Recognition of net investment income by the Fund is affected by the timing of declaration of dividends by the Underlying Funds in which the Fund invests. |
| | (c) | | Assumes investment at the NAV at the beginning of the period, reinvestment of all dividends and distributions, a complete redemption of the investment at the NAV at the end of the period and no sales or redemption charges (if any). Total returns would be reduced if a sales or redemption charge was taken into account. Returns do not reflect the impact of taxes to shareholders relating to Fund distributions or the redemption of Fund shares. Total returns for periods less than one full year are not annualized. |
| | (d) | | Expense ratios exclude the expenses of the Underlying Funds in which the Fund invests. |
| | (f) | | The Fund’s portfolio turnover rate is calculated in accordance with regulatory requirements, without regard to transactions involving short term investments and certain derivatives. If such transactions were included, the Fund’s portfolio turnover rate may be higher. |
| | |
| The accompanying notes are an integral part of these financial statements. | | 23 |
GOLDMAN SACHS DYNAMIC GLOBAL EQUITY FUND
Financial Highlights(continued)
Selected Share Data for a Share Outstanding Throughout Each Period
| | | | | | | | | | | | | | | | | | | | | | |
| | | | | Goldman Sachs Dynamic Global Equity Fund | |
| | | | | Class R6 Shares | |
| | | | | Six Months Ended
June 30, 2019 (Unaudited) | | | Year Ended December 31, | | | Period Ended
December 31, 2015(a) | |
| | | | | 2018 | | | 2017 | | | 2016 | |
| | Per Share Data | |
| | | | | | |
| | Net asset value, beginning of period | | $ | 16.44 | | | $ | 19.04 | | | $ | 15.37 | | | $ | 14.57 | | | $ | 15.38 | |
| | | | | | |
| | Net investment income(b)(c) | | | 0.35 | | | | 1.61 | | | | 0.12 | | | | 0.24 | | | | 0.14 | |
| | | | | | |
| | Net realized and unrealized gain (loss) | | | 2.28 | | | | (3.71 | ) | | | 3.96 | | | | 0.80 | | | | (0.74 | ) |
| | | | | | |
| | Total from investment operations | | | 2.63 | | | | (2.10 | ) | | | 4.08 | | | | 1.04 | | | | (0.60 | ) |
| | | | | | |
| | Distributions to shareholders from net investment income | | | — | | | | (0.50 | ) | | | (0.41 | ) | | | (0.24 | ) | | | (0.21 | ) |
| | | | | | |
| | Net asset value, end of period | | $ | 19.07 | | | $ | 16.44 | | | $ | 19.04 | | | $ | 15.37 | | | $ | 14.57 | |
| | | | | | |
| | Total return(d) | | | 16.00 | % | | | (11.00 | )% | | | 26.54 | % | | | 7.12 | % | | | (3.93 | )% |
| | | | | | |
| | Net assets, end of period (in 000s) | | $ | 506,866 | | | $ | 4,485 | | | $ | 13 | | | $ | 10 | | | $ | 10 | |
| | | | | | |
| | Ratio of net expenses to average net assets(e) | | | 0.18 | %(f) | | | 0.18 | % | | | 0.18 | % | | | 0.19 | % | | | 0.18 | %(f) |
| | | | | | |
| | Ratio of total expenses to average net assets(e) | | | 0.23 | %(f) | | | 0.32 | % | | | 0.24 | % | | | 0.28 | % | | | 0.29 | %(f) |
| | | | | | |
| | Ratio of net investment income to average net assets(c) | | | 3.80 | %(f) | | | 9.20 | % | | | 0.66 | % | | | 1.63 | % | | | 2.32 | %(f) |
| | | | | | |
| | Portfolio turnover rate(g) | | | 37 | % | | | 11 | % | | | 53 | % | | | 39 | % | | | 18 | % |
| | (a) | | Commenced operations on July 31, 2015. |
| | (b) | | Calculated based on the average shares outstanding methodology. |
| | (c) | | Recognition of net investment income by the Fund is affected by the timing of declaration of dividends by the Underlying Funds in which the Fund invests. |
| | (d) | | Assumes investment at the NAV at the beginning of the period, reinvestment of all dividends and distributions, a complete redemption of the investment at the NAV at the end of the period and no sales or redemption charges (if any). Total returns would be reduced if a sales or redemption charge was taken into account. Returns do not reflect the impact of taxes to shareholders relating to Fund distributions or the redemption of Fund shares. Total returns for periods less than one full year are not annualized. |
| | (e) | | Expense ratios exclude the expenses of the Underlying Funds in which the Fund invests. |
| | (g) | | The Fund’s portfolio turnover rate is calculated in accordance with regulatory requirements, without regard to transactions involving short term investments and certain derivatives. If such transactions were included, the Fund’s portfolio turnover rate may be higher. |
| | |
| 24 | | The accompanying notes are an integral part of these financial statements. |
GOLDMAN SACHS DYNAMIC GLOBAL EQUITY FUND
Notes to Financial Statements
June 30, 2019 (Unaudited)
Goldman Sachs Trust (the “Trust”) is a Delaware statutory trust registered under the Investment Company Act of 1940, as amended (the “Act”), as an open-end management investment company. The Trust includes the Goldman Sachs Dynamic Global Equity Fund (the “Fund”). Effective after the close of business on February 28, 2019, the Goldman Sachs Equity Growth Strategy Portfolio was renamed the Goldman Sachs Dynamic Global Equity Fund and changed its principal investment strategy. The Fund is a diversified portfolio and currently offers eight classes of shares: Class A, Class C, Institutional, Service, Investor, Class P, Class R, Class R6 Shares.
Class A Shares are sold with a front-end sales charge of up to 5.50%. Class C Shares are sold with a contingent deferred sales charge (“CDSC”) of 1.00%, which is imposed on redemptions made within 12 months of purchase. Institutional, Service, Investor, Class P, Class R and Class R6 Shares are not subject to a sales charge.
Goldman Sachs Asset Management, L.P. (“GSAM”), an affiliate of Goldman Sachs & Co. LLC (“Goldman Sachs”), serves as investment adviser to the Fund pursuant to a management agreement (the “Agreement”) with the Trust.
|
| 2. SIGNIFICANT ACCOUNTING POLICIES |
The financial statements have been prepared in accordance with accounting principles generally accepted in the United States of America (“GAAP”) and require management to make estimates and assumptions that may affect the reported amounts and disclosures. Actual results may differ from those estimates and assumptions.
A. Investment Valuation— The Fund’s valuation policy is to value investments at fair value.
B. Investment Income and Investments— Investment income includes interest income, dividend income, and securities lending income, if any. Interest income is accrued daily and adjusted for amortization of premiums and accretion of discounts. Dividend income is recognized on ex-dividend date or, for certain foreign securities, as soon as such information is obtained subsequent to the ex-dividend date. Investment transactions are reflected on trade date. Realized gains and losses are calculated using identified cost. Investment transactions are recorded on the following business day for daily net asset value (“NAV”) calculations. Investment income is recorded net of any foreign withholding taxes, less any amounts reclaimable. The Fund may file withholding tax reclaims in certain jurisdictions to recover a portion of amounts previously withheld. Any foreign capital gains tax is accrued daily based upon net unrealized gains, and is payable upon sale of such investments. Income distributions are recognized as capital gains or income in the financial statements in accordance with the character that is distributed.
For derivative contracts, realized gains and losses are recorded upon settlement of the contract. Upfront payments, if any, are made or received upon entering into a swap agreement and are reflected in the Statement of Assets and Liabilities. Upfront payments are recognized over the contract’s term/event as realized gains or losses, with the exception of forward starting swap contracts whose realized gains or losses are recognized from the effective start date.
C. Class Allocations and Expenses — Investment income, realized and unrealized gain (loss), if any, and non-class specific expenses of the Fund are allocated daily based upon the proportion of net assets of each class.Non-class specific expenses directly incurred by the Fund are charged to the Fund, while such expenses incurred by the Trust are allocated across the Fund on a straight-line and/orpro-rata basis depending upon the nature of the expenses. Class specific expenses, where applicable, are borne by the respective share classes and include Distribution and Service, Transfer Agency and Service and Shareholder Administration fees. Expenses included in the accompanying financial statements reflect the expenses of the Fund and do not include any expenses associated with the Underlying Funds (“Underlying Funds”). Because the Underlying Funds have varied expense and fee levels and the Fund may own different proportions of the Underlying Funds at different times, the amount of fees and expenses incurred indirectly by the Fund will vary.
D. Federal Taxes and Distributions to Shareholders — It is the Fund’s policy to comply with the requirements of the Internal Revenue Code of 1986, as amended (the “Code”), applicable to regulated investment companies and to distribute each year substantially all of its investment company taxable income and capital gains to its shareholders. Accordingly, the Fund is not required to make any provisions for the payment of federal income tax. Distributions to shareholders are recorded on the ex-dividend date. Income and capital gains distributions, if any, are declared and paid at least annually.
25
GOLDMAN SACHS DYNAMIC GLOBAL EQUITY FUND
Notes to Financial Statements(continued)
June 30, 2019 (Unaudited)
|
| 2. SIGNIFICANT ACCOUNTING POLICIES (continued) |
Net capital losses, if any, are carried forward to future fiscal years and may be used to the extent allowed by the Code to offset any future capital gains. Losses that are carried forward will retain their character as eithershort-term orlong-term capital losses. Utilization of capital loss carryforwards will reduce the requirement of future capital gains distributions.
The characterization of distributions to shareholders for financial reporting purposes is determined in accordance with federal income tax rules, which may differ from GAAP. The source of the Fund’s distributions may be shown in the accompanying financial statements as either from distributable earnings or capital. Certain components of the Fund’s net assets on the Statement of Assets and Liabilities reflect permanent GAAP/tax differences based on the appropriate tax character.
E. Foreign Currency Translation— The accounting records and reporting currency of the Fund are maintained in U.S. dollars. Assets and liabilities denominated in foreign currencies are translated into U.S. dollars using the current exchange rates at the close of each business day. The effect of changes in foreign currency exchange rates on investments is included within net realized and unrealized gain (loss) on investments. Changes in the value of other assets and liabilities as a result of fluctuations in foreign exchange rates are included in the Statement of Operations within net change in unrealized gain (loss) on foreign currency translation. Transactions denominated in foreign currencies are translated into U.S. dollars on the date the transaction occurred, the effects of which are included within net realized gain (loss) on foreign currency transactions.
|
| 3. INVESTMENTS AND FAIR VALUE MEASUREMENTS |
U.S. GAAP defines the fair value of a financial instrument as the amount that would be received to sell an asset or paid to transfer a liability in an orderly transaction between market participants at the measurement date (i.e., the exit price); the Fund’s policy is to use the market approach. GAAP establishes a fair value hierarchy that prioritizes the inputs to valuation techniques used to measure fair value. The hierarchy gives the highest priority to unadjusted quoted prices in active markets for identical assets or liabilities (Level 1 measurements) and the lowest priority to unobservable inputs (Level 3 measurements). The levels used for classifying investments are not necessarily an indication of the risk associated with investing in these investments. The three levels of the fair value hierarchy are described below:
Level 1 — Unadjusted quoted prices in active markets that are accessible at the measurement date for identical, unrestricted assets or liabilities;
Level 2 — Quoted prices in markets that are not active or financial instruments for which significant inputs are observable (including, but not limited to, quoted prices for similar investments, interest rates, foreign exchange rates, volatility and credit spreads), either directly or indirectly;
Level 3 — Prices or valuations that require significant unobservable inputs (including GSAM’s assumptions in determining fair value measurement).
The Board of Trustees (“Trustees”) has approved Valuation Procedures that govern the valuation of the portfolio investments held by the Fund, including investments for which market quotations are not readily available. The Trustees have delegated to GSAMday-to-day responsibility for implementing and maintaining internal controls and procedures related to the valuation of the Fund’s investments. To assess the continuing appropriateness of pricing sources and methodologies, GSAM regularly performs price verification procedures and issues challenges as necessary to third party pricing vendors or brokers, and any differences are reviewed in accordance with the Valuation Procedures.
A. Level 1 and Level 2 Fair Value Investments — The valuation techniques and significant inputs used in determining the fair values for investments classified as Level 1 and Level 2 are as follows:
Underlying Funds (including Money Market Funds) — Underlying funds (“Underlying Funds”) include other investment companies and exchange-traded funds (“ETFs”). Investments in the Underlying Funds (except ETFs) are valued at the NAV per share on the day of valuation. ETFs are valued daily at the last sale price or official closing price on the principal exchange or system on which the investment is traded. Because the Fund invests in Underlying Funds that fluctuate in value, the Fund’s shares will correspondingly fluctuate in value. To the extent these investments are actively traded, they are classified as Level 1 of the fair
26
GOLDMAN SACHS DYNAMIC GLOBAL EQUITY FUND
|
| 3. INVESTMENTS AND FAIR VALUE MEASUREMENTS (continued) |
value hierarchy, otherwise they are generally classified as Level 2. For information regarding an Underlying Fund’s accounting policies and investment holdings, please see the Underlying Fund’s shareholder report.
Derivative Contracts — A derivative is an instrument whose value is derived from underlying assets, indices, reference rates or a combination of these factors. The Fund enters into derivative transactions to hedge against changes in interest rates, securities prices, and/or currency exchange rates, to increase total return, or to gain access to certain markets or attain exposure to other underliers. For financial reporting purposes, cash collateral that has been pledged to cover obligations of a Fund and cash collateral received, if any, is reported separately on the Statement of Assets and Liabilities as receivables/payables for collateral on certain derivatives contracts.Non-cash collateral pledged by the Fund, if any, is noted in the Schedule of Investments.
Exchange-traded derivatives, including futures and options contracts, are valued at the last sale or settlement price on the exchange where they are principally traded. Exchange-traded options without settlement prices are generally valued at the midpoint of the bid and ask prices on the exchange where they are principally traded (or, in the absence of two-way trading, at the last bid price for long positions and the last ask price for short positions). Exchange-traded derivatives typically fall within Level 1 of the fair value hierarchy.Over-the-counter (“OTC”) and centrally cleared derivatives are valued using market transactions and other market evidence, including market-based inputs to models, calibration to market-clearing transactions, broker or dealer quotations, or other alternative pricing sources. Where models are used, the selection of a particular model to value OTC and centrally cleared derivatives depends upon the contractual terms of, and specific risks inherent in, the instrument, as well as the availability of pricing information in the market. Valuation models require a variety of inputs, including contractual terms, market prices, yield curves, credit curves, measures of volatility, voluntary and involuntary prepayment rates, loss severity rates and correlations of such inputs. For OTC and centrally cleared derivatives that trade in liquid markets, model inputs can generally be verified and model selection does not involve significant management judgment. OTC and centrally cleared derivatives are classified within Level 2 of the fair value hierarchy when significant inputs are corroborated by market evidence.
i. Forward Contracts — A forward contract is a contract between two parties to buy or sell an asset at a specified price on a future date. A forward contract settlement can occur on a cash or delivery basis. Forward contracts aremarked-to-market daily using independent vendor prices, and the change in value, if any, is recorded as an unrealized gain or loss. Cash and certain investments may be used to collateralize forward contracts.
Aforward foreign currency exchange contract is a forward contract in which the Fund agrees to receive or deliver a fixed quantity of one currency for another, at a pre-determined price at a future date. All forward foreign currency exchange contracts aremarked-to-market daily at the applicable forward rate. Non-deliverable forward foreign currency exchange contracts are settled with the counterparty in cash without the delivery of foreign currency.
ii. Futures Contracts — Futures contracts are contracts to buy or sell a standardized quantity of a specified commodity or security. Upon entering into a futures contract, the Fund deposits cash or securities in an account on behalf of the broker in an amount sufficient to meet the initial margin requirement. Subsequent payments are made or received by the Fund equal to the daily change in the contract value and are recorded as variation margin receivable or payable with a corresponding offset to unrealized gains or losses.
iii. Options — When the Fund writes call or put options, an amount equal to the premium received is recorded as a liability and is subsequentlymarked-to-market to reflect the current value of the option written. Swaptions are options on interest rate and/or credit default swap contracts.
Upon the purchase of a call option or a put option by the Fund, the premium paid is recorded as an investment and subsequentlymarked-to-market to reflect the current value of the option. Certain options may be purchased with premiums to be determined on a future date. The premiums for these options are based upon implied volatility parameters at specified terms.
B. Level 3 Fair Value Investments — To the extent that significant inputs to valuation models and other alternative pricing sources are unobservable, or if quotations are not readily available, or if GSAM believes that such quotations do not accurately reflect fair value, the fair value of the Fund’s investments may be determined under Valuation Procedures approved by the
27
GOLDMAN SACHS DYNAMIC GLOBAL EQUITY FUND
Notes to Financial Statements(continued)
June 30, 2019 (Unaudited)
|
| 3. INVESTMENTS AND FAIR VALUE MEASUREMENTS (continued) |
Trustees. GSAM, consistent with its procedures and applicable regulatory guidance, may make an adjustment to the most recent valuation prices of either domestic or foreign securities in light of significant events to reflect what it believes to be the fair value of the securities at the time of determining the Fund’s NAV. To the extent investments are valued using single source broker quotations obtained directly from the broker or passed through from third party pricing vendors, such investments are classified as Level 3 investments. GSAM did not develop the unobservable inputs for valuation of Level 3 Assets and Liabilities.
C. Fair Value Hierarchy — The following is a summary of the Fund’s investments and derivatives classified in the fair value hierarchy as of June 30, 2019:
| | | | | | | | | | | | |
| | | |
| Investment Type | | Level 1 | | | Level 2 | | | Level 3 | |
| | | |
| Assets | | | | | | | | | | | | |
| | | |
Underlying Funds | | | | | | | | | | | | |
| | | |
Equity | | $ | 266,842,823 | | | $ | — | | | $ | — | |
| | | |
Exchange Traded Funds | | | 424,794,355 | | | | — | | | | — | |
| | | |
Investment Company | | | 112,151,707 | | | | — | | | | — | |
| | | |
| Total | | $ | 803,788,885 | | | $ | — | | | $ | — | |
| | | |
| Derivative Type | | | | | | | | | |
| | | |
| Assets | | | | | | | | | | | | |
| | | |
Forward Foreign Currency Exchange Contracts(a) | | $ | — | | | $ | 23,774 | | | $ | — | |
| | | |
Futures Contracts(a) | | | 4,746,832 | | | | — | | | | — | |
| | | |
Options Purchased | | | 5,919,262 | | | | 465,199 | | | | — | |
| | | |
| Total | | $ | 10,666,094 | | | $ | 488,973 | | | $ | — | |
| | | |
| Liabilities | | | | | | | | | | | | |
| | | |
Forward Foreign Currency Exchange Contracts(a) | | $ | — | | | $ | (256,920 | ) | | $ | — | |
| | | |
Written Option Contracts | | | (635,365 | ) | | | — | | | | — | |
| | | |
| Total | | $ | (635,365 | ) | | $ | (256,920 | ) | | $ | — | |
| (a) | | Amount shown represents unrealized gain (loss) at period end. |
For further information regarding security characteristics, see the Schedule of Investments.
|
| 4. INVESTMENTS IN DERIVATIVES |
The following tables set forth, by certain risk types, the gross value of derivative contracts (not considered to be hedging instruments for accounting disclosure purposes) as of June 30, 2019. These instruments were used as part of the Fund’s investment strategies and to obtain and/or manage exposure related to the risks below. The values in the tables below exclude the effects of
28
GOLDMAN SACHS DYNAMIC GLOBAL EQUITY FUND
|
| 4. INVESTMENTS IN DERIVATIVES (continued) |
cash collateral received or posted pursuant to these derivative contracts, and therefore are not representative of the Fund’s net exposure.
| | | | | | | | | | | | |
| Risk | | Statement of Assets
and Liabilities | | Assets | | | Statement of Assets
and Liabilities | | Liabilities | |
Interest | | Purchased options, at value | | $ | 5,919,262 | | | — | | $ | — | |
Currency | | Receivable for unrealized gain on forward foreign currency exchange contracts | | | 23,774 | (a) | | Payable for unrealized loss on forward foreign currency contracts | | | (256,920 | )(a) |
Equity | | Variation margin on future contracts;
Purchased options, at value | | | 5,212,031 | (a) | | Written options, at value | | | (635,365 | ) |
Total | | | | $ | 11,155,067 | | | | | $ | (892,285 | ) |
| (a) | | Includes unrealized gain (loss) on futures contracts described in the Additional Investment Information sections of the Schedule of Investments. Only the variation margin as of June 30, 2019 is reported within the Statement of Assets and Liabilities. |
The following tables set forth, by certain risk types, the Fund’s gains (losses) related to these derivatives and their indicative volumes for the six months ended June 30, 2019. These gains (losses) should be considered in the context that these derivative contracts may have been executed to create investment opportunities and/or economically hedge certain investments, and accordingly, certain gains (losses) on such derivative contracts may offset certain (losses) gains attributable to investments. These gains (losses) are included in “Net realized gain (loss)” or “Net change in unrealized gain (loss)” on the Statement of Operations:
| | | | | | | | | | | | | | |
| Risk | | Statement of Operations | | Net Realized
Gain (Loss) | | | Net Change in
Unrealized
Gain (Loss) | | | Average
Number of
Contracts(a) | |
| Interest | | Net change in unrealized gain (loss) from futures contracts and purchased options/Net change in unrealized gain (loss) on purchased options | | $ | 2,621,792 | | | $ | 1,238,760 | | | | 9 | |
| Equity | | Net realized gain (loss) from futures contracts, purchased options and written options/Net change in unrealized gain (loss) on futures contracts, purchased options and written options | | | 3,117,374 | | | | 4,846,401 | | | | 1,081 | |
| Currency | | Net realized gain (loss) from forward foreign currency exchange contracts/Net change in unrealized gain (loss) on forward foreign currency exchange contracts | | | 85,878 | | | | (233,146 | ) | | | 12 | |
| Total | | | | $ | 5,825,044 | | | $ | 5,852,015 | | | | 1,102 | |
| (a) | | Average number of contracts is based on the average of month end balances for the six months period ended June 30, 2019. |
|
| 5. AGREEMENTS AND AFFILIATED TRANSACTIONS |
A. Management Agreement — Under the Agreement, GSAM manages the Fund, subject to the general supervision of the Trustees.
As compensation for the services rendered pursuant to the Agreement, the assumption of the expenses related thereto and administration of the Fund’s business affairs, including providing facilities, GSAM is entitled to a management fee, accrued daily and paid monthly, equal to an annual percentage rate of the Fund’s average daily net assets of 0.15% for the Fund.
B. Distribution and/or Service (12b-1) Plans — The Trust, on behalf of Class A and Class R Shares of the Fund, has adopted Distribution and Service Plans subject to Rule 12b-1 under the Act. Under the Distribution and Service Plans, Goldman Sachs, which serves as distributor (the “Distributor”), is entitled to a fee accrued daily and paid monthly for distribution services and personal and account maintenance services, which may then be paid by Goldman Sachs to authorized dealers. These fees are equal to an annual percentage rate of the average daily net assets attributable to Class A or Class R Shares of the Fund, as applicable, as set forth below.
29
GOLDMAN SACHS DYNAMIC GLOBAL EQUITY FUND
Notes to Financial Statements(continued)
June 30, 2019 (Unaudited)
|
| 5. AGREEMENTS AND AFFILIATED TRANSACTIONS (continued) |
The Trust, on behalf of Class C Shares of the Fund, has adopted a Distribution Plan subject to Rule 12b-1 under the Act. Under the Distribution Plan, Goldman Sachs as Distributor is entitled to a fee accrued daily and paid monthly for distribution services, which may then be paid by Goldman Sachs to authorized dealers. These fees are equal to an annual percentage rate of the average daily net assets attributable to Class C Shares of the Fund, as set forth below.
The Trust, on behalf of Service Shares of the Fund, has adopted a Service Plan subject to Rule 12b-1 under the Act to allow Service Shares to compensate service organizations (including Goldman Sachs) for providing personal and account maintenance services to their customers who are beneficial owners of such shares. The Service Plan provides for compensation to the service organizations equal to an annual percentage rate of the average daily net assets attributable to Service Shares of the Fund, as set forth below.
| | | | | | | | | | | | | | | | |
| | | Distribution and/or Service Plans Rates | |
| | | Class A* | | | Class C | | | Class R* | | | Service | |
Distribution and/or Service Plans | | | 0.25 | % | | | 0.75 | % | | | 0.50 | % | | | 0.25 | % |
| * | | With respect to Class A and Class R Shares, the Distributor at its discretion may use compensation for distribution services paid under the Distribution and/or Service Plans to compensate service organizations for personal and account maintenance services and expenses as long as such total compensation does not exceed the maximum cap on “service fees” imposed by the Financial Industry Regulatory Authority. |
C. Distribution Agreement — Goldman Sachs, as Distributor of the shares of the Fund pursuant to a Distribution Agreement, may retain a portion of the Class A Shares’ front end sales charge and Class C Shares’ CDSC. During the six months ended June 30, 2019, Goldman Sachs retained $4,598 of the front end sales charges and $377 of the CDSC for this Fund.
D. Service and/or Shareholder Administration Plans — The Trust, on behalf of the Fund, has adopted Service and/or Shareholder Administration Plans to allow Class C and Service Shares, respectively, to compensate service organizations (including Goldman Sachs) for providing varying levels of personal and account maintenance and/or shareholder administration services to their customers who are beneficial owners of such shares. The Service and/or Shareholder Administration Plans each provide for compensation to the service organizations equal to an annual percentage rate of 0.25% of the average daily net assets attributable to Class C and/or Service Shares of the Fund, respectively.
E. Transfer Agency Agreement — Goldman Sachs also serves as the transfer agent of the Fund for a fee pursuant to the Transfer Agency Agreement. The fees charged for such transfer agency services are accrued daily and paid monthly at annual rates as follows: 0.18% of the average daily net assets of Class A, Class C, Investor and Class R Shares; 0.03% of the average daily net assets of Class P and Class R6 Shares; and 0.04% of the average daily net assets of Institutional and Service Shares.
F. Other Expense Agreements and Affiliated Transactions — GSAM has agreed to reduce or limit certain “Other Expenses” of the Fund (excluding acquired fund fees and expenses, transfer agency fees and expenses, service fees and shareholder administration fees (as applicable), taxes, interest, brokerage fees, expenses of shareholder meetings, litigation and indemnification, and extraordinary expenses) to the extent such expenses exceed, on an annual basis, a percentage rate of the average daily net assets of the Fund. Such Other Expense reimbursements, if any, are accrued daily and paid monthly. In addition, the Fund is not obligated to reimburse GSAM for prior fiscal year expense reimbursements, if any. The Other Expense limitations as an annual percentage rate of average daily net assets for the Fund is 0.004% . These Other Expense limitations will remain in place through at least April 30, 2020, and prior to such date GSAM may not terminate the arrangements without the approval of the Trustees. In addition, the Fund has entered into certain offset arrangements with the transfer agent, which may result in a reduction of the Fund’s expenses and are received irrespective of the application of the “Other Expense” limitations described above.
30
GOLDMAN SACHS DYNAMIC GLOBAL EQUITY FUND
|
| 5. AGREEMENTS AND AFFILIATED TRANSACTIONS (continued) |
For the six months ended June 30, 2019, these expense reductions, including any fee waivers and Other Expense reimbursements, were as follows:
| | | | | | | | | | |
Transfer Agency
Waivers/Credits | | | Other Expense
Reimbursements | | | Total Expense
Reductions | |
| $ | 669 | | | $ | 163,494 | | | $ | 164,163 | |
G. Line of Credit Facility — As of June 30, 2019, the Fund participated in a $580,000,000 committed, unsecured revolving line of credit facility (the “facility”) together with other funds of the Trust and certain registered investment companies having management agreements with GSAM or its affiliates. This facility is to be used for temporary emergency purposes, or to allow for an orderly liquidation of securities to meet redemption requests. The interest rate on borrowings is based on the federal funds rate. The facility also requires a fee to be paid by the Fund based on the amount of the commitment that has not been utilized. For the six months ended June 30, 2019, the Fund did not have any borrowings under the facility. Prior to April 30, 2019 the facility was $770,000,000.
H. Other Transactions with Affiliates — The Fund invests primarily in Class R6 Shares of the Underlying Funds (except certain Underlying Funds that are ETFs). These Underlying Funds are considered to be affiliated with the Fund. The tables below show the transactions in and earnings from investments in these Underlying Funds for the six months ended June 30, 2019 (in thousands):
| | | | | | | | | | | | | | | | | | | | | | | | | | | | | | | | |
| Underlying Funds | | Market
Value as of
12/31/2018 | | | Purchases
at Cost | | | Proceeds
from Sales | | | Realized
Gain (Loss) | | | Change in
Unrealized
Gain (Loss) | | | Market
Value as of
6/30/2019 | | | Shares as of
6/30/2019 | | | Dividend
Income | |
Goldman Sachs ActiveBeta Emerging Markets Equity ETF | | $ | 20,713 | | | $ | 41,630 | | | $ | — | | | $ | — | | | $ | 3,781 | | | $ | 66,124 | | | | 2,012 | | | $ | 578 | |
Goldman Sachs ActiveBeta International Equity ETF | | | 16,668 | | | | 121,062 | | | | — | | | | — | | | | 5,300 | | | | 143,030 | | | | 4,987 | | | | 2,288 | |
Goldman Sachs ActiveBeta U.S. Large Cap Equity ETF | | | 28,186 | | | | 177,258 | | | | (1,382 | ) | | | 13 | | | | 11,565 | | | | 215,640 | | | | 3,669 | | | | 1,260 | |
Goldman Sachs Emerging Markets Equity Insights Fund | | | 38,090 | | | | 18,999 | | | | (28,500 | ) | | | 460 | | | | 3,151 | | | | 32,200 | | | | 3,365 | | | | — | |
Goldman Sachs Global Infrastructure Fund | | | — | | | | 12,042 | | | | — | | | | — | | | | 567 | | | | 12,609 | | | | 1,080 | | | | 142 | |
Goldman Sachs Global Real Estate Securities Fund | | | 19,120 | | | | 7,106 | | | | (16,000 | ) | | | 908 | | | | 1,262 | | | | 12,396 | | | | 1,105 | | | | 105 | |
Goldman Sachs International Equity Insights Fund | | | 45,968 | | | | 46,701 | | | | (27,099 | ) | | | 3,944 | | | | 2,405 | | | | 71,919 | | | | 5,726 | | | | — | |
Goldman Sachs International Small Cap Insights Fund | | | 11,123 | | | | 6,999 | | | | (7,300 | ) | | | 1,441 | | | | (80 | ) | | | 12,183 | | | | 1,060 | | | | — | |
Goldman Sachs Large Cap Growth Insights Fund | | | 39,705 | | | | 31,000 | | | | (23,800 | ) | | | 5,464 | | | | 1,380 | | | | 53,749 | | | | 1,684 | | | | — | |
Goldman Sachs Large Cap Value Insights Fund | | | 38,990 | | | | 32,344 | | | | (22,701 | ) | | | 4,530 | | | | 688 | | | | 53,851 | | | | 2,579 | | | | 344 | |
Goldman Sachs Small Cap Equity Insights Fund | | | 17,707 | | | | 10,500 | | | | (13,000 | ) | | | 1,282 | | | | 1,447 | | | | 17,936 | | | | 688 | | | | — | |
| | | | | | | | |
Total | | $ | 276,270 | | | $ | 505,641 | | | $ | (139,782 | ) | | $ | 18,042 | | | $ | 31,466 | | | $ | 691,637 | | | | | | | $ | 4,717 | |
The table below shows the transactions in and earnings from investments in the Goldman Sachs Financial Square Government Fund for the six months ended June 30, 2019 (in thousands):
| | | | | | | | | | | | | | | | | | | | | | | | |
| Fund | | Beginning
Value as of
12/31/2018 | | | Purchases
at Cost | | | Proceeds
from Sales | | | Ending
Value as of
06/30/2019 | | | Shares as of
06/30/2019 | | | Dividend Income from
Affiliated Investment
Company | |
Dynamic Global Equity Fund | | $ | 14,101 | | | $ | 414,031 | | | $ | (315,980 | ) | | $ | 112,152 | | | | 112,152 | | | $ | 567 | |
31
GOLDMAN SACHS DYNAMIC GLOBAL EQUITY FUND
Notes to Financial Statements(continued)
June 30, 2019 (Unaudited)
|
| 6. PORTFOLIO SECURITIES TRANSACTIONS |
The cost of purchases and proceeds from sales and maturities oflong-term securities for the six months ended June 30, 2019, were $513,054,319 and $144,839,787, respectively.
As of the Fund’s most recent fiscal year end, December 31, 2018, the Fund’s certain timing differences on a tax basis were as follows:
| | | | |
Timing differences (Qualified Late Year Loss Deferral/Post October Loss Deferral) | | $ | (364,596 | ) |
As of June 30, 2019, the Fund’s aggregate security unrealized gains and losses based on cost for U.S. federal income tax purposes were as follows:
| | | | |
Tax Cost | | $ | 782,366,870 | |
Gross unrealized gain | | | 27,329,380 | |
Gross unrealized loss | | | (5,907,365 | ) |
Net unrealized gain (loss) | | $ | 21,422,015 | |
The difference between GAAP-basis and tax basis unrealized gains (losses) is attributable primarily to wash sales, net mark to market gains/(losses) on regulated futures.
GSAM has reviewed the Fund’s tax positions for all open tax years (the current and prior three years, as applicable) and has concluded that no provision for income tax is required in the Fund’s financial statements. Such open tax years remain subject to examination and adjustment by tax authorities.
The Fund’s risks include, but are not limited to, the following:
Derivatives Risk — The Fund’s use of derivatives may result in loss. Derivative instruments, which may pose risks in addition to and greater than those associated with investing directly in securities, currencies or other instruments, may be illiquid or less liquid, volatile, difficult to price and leveraged so that small changes in the value of the underlying instruments may produce disproportionate losses to the Fund. Derivatives are also subject to counterparty risk, which is the risk that the other party in the transaction will not fulfill its contractual obligation. The use of derivatives is a highly specialized activity that involves investment techniques and risks different from those associated with investments in more traditional securities and instruments. Losses from derivatives can also result from a lack of correlation between changes in the value of derivative instruments and the portfolio assets (if any) being hedged.
Foreign and Emerging Countries Risk — Investing in foreign markets may involve special risks and considerations not typically associated with investing in the United States. Foreign securities may be subject to risk of loss because of more or less foreign government regulation, less public information and less economic, political and social stability in the countries in which the Fund invests. The imposition of exchange controls (including repatriation restrictions), confiscations, trade restrictions (including tariffs) and other government restrictions by the United States or other governments, or from problems in share registration, settlement or custody, may also result in losses. Foreign risk also involves the risk of negative foreign currency rate fluctuations, which may cause the value of securities denominated in such foreign currency (or other instruments through which the Fund has exposure to foreign currencies) to decline in value. Currency exchange rates may fluctuate significantly over short periods of time. To the extent that the Fund also invest in securities of issuers located in emerging markets, these risks may be more pronounced.
Investments in the Underlying Funds Risk— The investments of the Fund are concentrated in the Underlying Funds, and the Fund’s investment performance is directly related to the investment performance of the Underlying Funds it holds. The Fund is
32
GOLDMAN SACHS DYNAMIC GLOBAL EQUITY FUND
|
| 8. OTHER RISKS (continued) |
subject to the risk factors associated with the investments of the Underlying Funds in direct proportion to the amount of assets allocated to each. The Fund that has a relative concentration of its portfolio in a single Underlying Fund may be more susceptible to adverse developments affecting that Underlying Fund, and may be more susceptible to losses because of these developments.
Large Shareholder Transactions Risk — The Fund may experience adverse effects when certain large shareholders, such as other funds, institutional investors (including those trading by use of non-discretionary mathematical formulas), financial intermediaries (who may make investment decisions on behalf of underlying clients and/or include the Fund in their investment model), individuals, accounts and Goldman Sachs affiliates, purchase or redeem large amounts of shares of the Fund. Such large shareholder redemptions, which may occur rapidly or unexpectedly, may cause the Fund to sell portfolio securities at times when it would not otherwise do so, which may negatively impact the Fund’s NAV and liquidity. These transactions may also accelerate the realization of taxable income to shareholders if such sales of investments resulted in gains, and may also increase transaction costs. In addition, a large redemption could result in the Fund’s current expenses being allocated over a smaller asset base, leading to an increase in the Fund’s expense ratio. Similarly, large Fund share purchases may adversely affect the Fund’s performance to the extent that the Fund is delayed in investing new cash or otherwise maintains a larger cash position than it ordinarily would.
Liquidity Risk — The Fund may make investments that are illiquid or that may become less liquid in response to market developments or adverse investor perceptions. Illiquid investments may be more difficult to value. Liquidity risk may also refer to the risk that the Fund will not be able to pay redemption proceeds within the allowable time period or without significant dilution to remaining investors’ interests because of unusual market conditions, an unusually high volume of redemption requests, or other reasons. To meet redemption requests, the Fund may be forced to sell investments at an unfavorable time and/or under unfavorable conditions. If a Fund is forced to sell securities at an unfavorable time and/or under unfavorable conditions, such sales may adversely affect Fund’s NAV and dilute remaining investors’ interests. Liquidity risk may be the result of, among other things, the reduced number and capacity of traditional market participants to make a market in fixed income securities or the lack of an active market. The potential for liquidity risk may be magnified by a rising interest rate environment or other circumstances where investor redemptions from fixed income mutual funds may be higher than normal, potentially causing increased supply in the market due to selling activity. These risks may be more pronounced in connection with the Fund’s investments in securities of issuers located in emerging market countries. Redemptions by large shareholders may have a negative impact on the Fund’s liquidity.
Market and Credit Risks— In the normal course of business, the Fund trades financial instruments and enters into financial transactions where risk of potential loss exists due to changes in the market (market risk). Additionally, the Fund may also be exposed to credit risk in the event that an issuer or guarantor fails to perform or that an institution or entity with which the Fund has unsettled or open transactions defaults.
Under the Trust’s organizational documents, its Trustees, officers, employees and agents are indemnified, to the extent permitted by the Act and state law, against certain liabilities that may arise out of performance of their duties to the Fund. Additionally, in the course of business, the Fund enters into contracts that contain a variety of indemnification clauses. The Fund’s maximum exposure under these arrangements is unknown, as this would involve future claims that may be made against the Fund that have not yet occurred. However, GSAM believes the risk of loss under these arrangements to be remote.
Subsequent events after the Statement of Assets and Liabilities date have been evaluated, and GSAM has concluded that there is no impact requiring adjustment or disclosure in the financial statements.
33
GOLDMAN SACHS DYNAMIC GLOBAL EQUITY FUND
Notes to Financial Statements(continued)
June 30, 2019 (Unaudited)
|
| 11. SUMMARY OF SHARE TRANSACTIONS |
| | | | | | | | | | | | | | | | |
| Share activity is as follows: | | | | | | | | | | | | |
| | | For the Six Months Ended
June 30, 2019
(Unaudited) | | | For the Fiscal Year Ended
December 31, 2018 | |
| | | | |
| | | Shares | | | Dollars | | | Shares | | | Dollars | |
| | | | |
| Class A Shares | | | | | | | | | | | | | | | | |
Shares sold | | | 419,432 | | | $ | 7,642,488 | | | | 2,185,895 | | | $ | 41,265,498 | |
Reinvestment of distributions | | | — | | | | — | | | | 199,644 | | | | 3,228,235 | |
Shares redeemed | | | (497,371 | ) | | | (8,941,825 | ) | | | (1,323,048 | ) | | | (24,484,673 | ) |
| | | | (77,939 | ) | | | (1,299,337 | ) | | | 1,062,491 | | | | 20,009,060 | |
| Class C Shares | | | | | | | | | | | | | | | | |
Shares sold | | | 25,950 | | | | 447,784 | | | | 137,482 | | | | 2,444,514 | |
Reinvestment of distributions | | | — | | | | — | | | | 6,208 | | | | 97,349 | |
Shares redeemed | | | (400,824 | ) | | | (7,073,691 | ) | | | (2,477,506 | ) | | | (44,551,615 | ) |
| | | | (374,874 | ) | | | (6,625,907 | ) | | | (2,333,816 | ) | | | (42,009,752 | ) |
| Institutional Shares | | | | | | | | | | | | | | | | |
Shares sold | | | 85,974 | | | | 1,591,088 | | | | 733,770 | | | | 13,870,499 | |
Reinvestment of distributions | | | — | | | | — | | | | 28,655 | | | | 468,222 | |
Shares redeemed | | | (70,434 | ) | | | (1,278,616 | ) | | | (7,926,783 | ) | | | (154,475,133 | ) |
| | | | 15,540 | | | | 312,472 | | | | (7,164,358 | ) | | | (140,136,412 | ) |
| Service Shares | | | | | | | | | | | | | | | | |
Shares sold | | | 163 | | | | 2,718 | | | | 3,181 | | | | 60,227 | |
Reinvestment of distributions | | | — | | | | — | | | | 565 | | | | 9,100 | |
Shares redeemed | | | (110 | ) | | | (1,939 | ) | | | (6,737 | ) | | | (123,165 | ) |
| | | | 53 | | | | 779 | | | | (2,991 | ) | | | (53,838 | ) |
| Investor Shares | | | | | | | | | | | | | | | | |
Shares sold | | | 30,207 | | | | 534,145 | | | | 125,237 | | | | 2,335,716 | |
Reinvestment of distributions | | | — | | | | — | | | | 10,222 | | | | 162,939 | |
Shares redeemed | | | (105,510 | ) | | | (1,886,017 | ) | | | (74,682 | ) | | | (1,365,679 | ) |
| | | | (75,303 | ) | | | (1,351,872 | ) | | | 60,777 | | | | 1,132,976 | |
| Class P Shares(a) | | | | | | | | | | | | | | | | |
Shares sold | | | 310,250 | | | | 5,634,748 | | | | 6,534,613 | | | | 128,079,127 | |
Reinvestment of distributions | | | — | | | | — | | | | 186,301 | | | | 3,046,018 | |
Shares redeemed | | | (338,141 | ) | | | (6,151,776 | ) | | | (452,784 | ) | | | (8,567,805 | ) |
| | | | (27,891 | ) | | | (517,028 | ) | | | 6,268,130 | | | | 122,557,340 | |
| Class R Shares | | | | | | | | | | | | | | | | |
Shares sold | | | 33,979 | | | | 610,295 | | | | 76,021 | | | | 1,401,993 | |
Reinvestment of distributions | | | — | | | | — | | | | 7,266 | | | | 116,549 | |
Shares redeemed | | | (29,890 | ) | | | (543,061 | ) | | | (93,404 | ) | | | (1,736,597 | ) |
| | | | 4,089 | | | | 67,234 | | | | (10,117 | ) | | | (218,055 | ) |
| Class R6 Shares | | | | | | | | | | | | | | | | |
Shares sold | | | 26,576,601 | | | | 487,627,753 | | | | 273,672 | | | | 4,873,992 | |
Reinvestment of distributions | | | — | | | | — | | | | 4,200 | | | | 68,663 | |
Shares redeemed | | | (276,545 | ) | | | (5,262,298 | ) | | | (5,738 | ) | | | (100,693 | ) |
| | | | 26,300,056 | | | | 482,365,455 | | | | 272,134 | | | | 4,841,962 | |
| | | | |
NET INCREASE (DECREASE) | | | 25,763,731 | | | $ | 472,951,796 | | | | (1,847,750 | ) | | $ | (33,876,719 | ) |
| (a) | | Class P Shares commenced operations on April 17, 2018. |
34
GOLDMAN SACHS DYNAMIC GLOBAL EQUITY FUND
| | |
| | |
Fund Expenses — Six Months Period Ended June 30, 2019 (Unaudited) | | |
As a shareholder of Class A, Class C, Institutional, Service, Investor, Class P, Class R or Class R6 Shares of the Fund, you incur two types of costs: (1) transaction costs, including sales charges on purchase payments (with respect to Class A Shares), contingent deferred sales charges on redemptions (with respect to Class C Shares), and (2) ongoing costs, including management fees; distribution and/or service (12b-1) fees (with respect to Class A, Class C and Class R Shares); and other Fund expenses.
The Example is intended to help you understand your ongoing costs (in dollars) of investing in Class A, Class C, Institutional, Service, Investor, Class P, Class R or Class R6 Shares of the Fund and to compare these costs with the ongoing costs of investing in other mutual funds. The Example is based on an investment of $1,000 invested at the beginning of the period and held for the entire period from January 1, 2019 through June 30, 2019, which represents a period of 181 days of a 365 day year.
Actual Expenses — The first line under each share class in the table below provides information about actual account values and actual expenses. You may use the information in this line, together with the amount you invested, to estimate the expenses that you paid over the period. Simply divide your account value by $1,000 (for example, an $8,600 account value divided by $1,000=8.6), then multiply the result by the number in the first line under the heading entitled “Expenses Paid” to estimate the expenses you paid on your account during this period.
Hypothetical Example for Comparison Purposes — The second line under each share class in the table below provides information about hypothetical account values and hypothetical expenses based on the Fund’s actual net expense ratios and an assumed rate of return of 5% per year before expenses, which is not the Fund’s actual return. The hypothetical account values and expenses may not be used to estimate the actual ending account balance or expenses you paid for the period. You may use this information to compare the ongoing costs of investing in the Fund and other funds. To do so, compare this 5% hypothetical example with the 5% hypothetical examples that appear in the shareholder reports of the other funds.
Please note that the expenses shown in the table are meant to highlight your ongoing costs only and do not reflect any transactional costs, such as sales charges, redemption fees, or exchange fees and do not include expenses of Underlying Funds in which the Fund invests. Therefore, the second line of the table is useful in comparing ongoing costs only and will not help you determine the relative total costs of owning different funds. In addition, if these transactional costs were included, your costs would have been higher.
| | | | | | | | | | | | |
| | | Dynamic Global Equity Fund | |
| Share Class | | Beginning
Account Value
1/1/19 | | | Ending
Account Value
6/30/19 | | | Expenses Paid for the
6 months ended
6/30/19* | |
| Class A | | | | | | | | | | | | |
Actual | | $ | 1,000.00 | | | $ | 1,158.10 | | | $ | 3.10 | |
Hypothetical 5% return | | | 1,000.00 | | | | 1,021.92 | + | | | 2.91 | |
| Class C | | | | | | | | | | | | |
Actual | | | 1,000.00 | | | | 1,154.10 | | | | 7.10 | |
Hypothetical 5% return | | | 1,000.00 | | | | 1,018.20 | + | | | 6.66 | |
| Institutional | | | | | | | | | | | | |
Actual | | | 1,000.00 | | | | 1,160.70 | | | | 1.02 | |
Hypothetical 5% return | | | 1,000.00 | | | | 1,023.85 | + | | | 0.95 | |
| Service | | | | | | | | | | | | |
Actual | | | 1,000.00 | | | | 1,157.40 | | | | 3.69 | |
Hypothetical 5% return | | | 1,000.00 | | | | 1,021.37 | + | | | 3.46 | |
| Investor | | | | | | | | | | | | |
Actual | | | 1,000.00 | | | | 1,159.10 | | | | 1.77 | |
Hypothetical 5% return | | | 1,000.00 | | | | 1,023.16 | + | | | 1.66 | |
| Class P | | | | | | | | | | | | |
Actual | | | 1,000.00 | | | | 1,160.60 | | | | 0.96 | |
Hypothethical 5% return | | | 1,000.00 | | | | 1,023.90 | + | | | 0.90 | |
| Class R | | | | | | | | | | | | |
Actual | | | 1,000.00 | | | | 1,156.90 | | | | 4.44 | |
Hypothetical 5% return | | | 1,000.00 | | | | 1,020.68 | + | | | 4.16 | |
| Class R6 | | | | | | | | | | | | |
Actual | | | 1,000.00 | | | | 1,160.00 | | | | 0.96 | |
Hypothetical 5% return | | | 1,000.00 | | | | 1,023.90 | + | | | 0.90 | |
| | + | | Hypothetical expenses are based on the Fund’s actual annualized net expense ratios and an assumed rate of return of 5% per year before expenses. | |
| | * | | Expenses for each share class are calculated using the Fund’s annualized net expense ratio for each class, which represents the ongoing expenses as a percentage of net assets for the six months ended June 30, 2019. Expenses are calculated by multiplying the annualized net expense ratio by the average account value for the period; then multiplying the result by the number of days in the most recent fiscal half year; and then dividing that result by the number of days in the fiscal year. The annualized net expense ratios for the period were as follows: | |
| | | | | | | | | | | | | | | | | | | | | | | | | | | | | | | | |
| Fund | | Class A | | | Class C | | | Institutional | | | Service | | | Investor | | | Class P | | | Class R | | | R6 | |
Dynamic Global Equity Fund | | | 0.58 | % | | | 1.33 | % | | | 0.19 | % | | | 0.69 | % | | | 0.33 | % | | | 0.18 | % | | | 0.83 | % | | | 0.18 | % |
35
GOLDMAN SACHS DYNAMIC GLOBAL EQUITY FUND
Statement Regarding Basis for Approval of Management Agreement (Unaudited)
Background
The Goldman Sachs Dynamic Global Equity Fund (the “Fund”) is an investment portfolio of Goldman Sachs Trust (the “Trust”). The Board of Trustees oversees the management of the Trust and reviews the investment performance and expenses of the Fund at regularly scheduled meetings held throughout the year. In addition, the Board of Trustees determines annually whether to approve the continuance of the Trust’s investment management agreement (the “Management Agreement”) with Goldman Sachs Asset Management, L.P. (the “Investment Adviser”) on behalf of the Fund.
The Management Agreement was most recently approved for continuation until June 30, 2020 by the Board of Trustees, including those Trustees who are not parties to the Management Agreement or “interested persons” (as defined in the Investment Company Act of 1940, as amended) of any party thereto (the “Independent Trustees”), at a meeting held onJune 11-12, 2019 (the “Annual Meeting”).
The review process undertaken by the Trustees spans the course of the year and culminates with the Annual Meeting. To assist the Trustees in their deliberations, the Trustees have established a Contract Review Committee (the “Committee”), comprised of the Independent Trustees. The Committee held four meetings over the course of the year since the Management Agreement was last approved. At those Committee meetings, regularly scheduled Board or other committee meetings, and/or the Annual Meeting, matters relevant to the renewal of the Management Agreement were considered by the Board, or the Independent Trustees, as applicable. With respect to the Fund, such matters included:
| | (a) | | the nature and quality of the advisory, administrative, and other services provided to the Fund and the underlying funds in which it invests (the “Underlying Funds”) by the Investment Adviser and its affiliates, including information about: |
| | (i) | | the structure, staff, and capabilities of the Investment Adviser and its portfolio management teams; |
| | (ii) | | the groups within the Investment Adviser and its affiliates that support the portfolio management teams or provide other types of necessary services, including fund services groups (e.g., accounting and financial reporting, tax, shareholder services, and operations); controls and risk management groups (e.g., legal, compliance, valuation oversight, credit risk management, internal audit, compliance testing, market risk analysis, finance, and central funding); sales and distribution support groups, and others (e.g., information technology and training); |
| | (iii) | | trends in employee headcount; |
| | (iv) | | the Investment Adviser’s financial resources and ability to hire and retain talented personnel and strengthen its operations; and |
| | (v) | | the parent company’s support of the Investment Adviser and its mutual fund business, as expressed by the firm’s senior management; |
| | (b) | | information on the investment performance of the Fund and the Underlying Funds, including comparisons to the performance of similar mutual funds, as provided by a third-party mutual fund data provider engaged as part of the contract review process (the “Outside Data Provider”), and a benchmark performance index; and information on general investment outlooks in the markets in which the Fund and the Underlying Funds invest; |
| | (c) | | information provided by the Investment Adviser indicating the Investment Adviser’s views on whether the Fund’s peer group and/or benchmark index had high, medium, or low relevance given the Fund’s particular investment strategy; |
| | (d) | | the terms of the Management Agreement and other agreements with affiliated service providers entered into by the Trust on behalf of the Fund; |
| | (e) | | fee and expense information for the Fund, including: |
| | (i) | | the relative management fee and expense levels of the Fund as compared to those of comparable funds managed by other advisers, as provided by the Outside Data Provider; |
| | (ii) | | the Fund’s expense trends over time; and |
| | (iii) | | to the extent the Investment Adviser manages other types of accounts (such as bank collective trusts, private wealth management accounts, institutional separate accounts,sub-advised mutual funds, andnon-U.S. funds) having investment objectives and policies similar to those of the Fund, comparative information on the advisory fees charged and services provided to those accounts by the Investment Adviser; |
| | (f) | | with respect to the extensive investment performance and expense comparison data provided by the Outside Data Provider, its processes in producing that data for the Fund; |
| | (g) | | the undertakings of the Investment Adviser and its affiliates to implement fee waivers and/or expense limitations with respect to the Fund and the Underlying Funds; |
| | (h) | | information relating to the profitability of the Management Agreement and the transfer agency and distribution and service arrangements of the Fund to the Investment Adviser and its affiliates; |
| | (i) | | whether the Fund’s existing management fee schedule, together with the management fee schedules of the Underlying Funds, adequately addressed any economies of scale; |
36
GOLDMAN SACHS DYNAMIC GLOBAL EQUITY FUND
Statement Regarding Basis for Approval of Management Agreement (Unaudited) (continued)
| | (j) | | a summary of the“fall-out” benefits derived by the Investment Adviser and its affiliates from their relationships with the Fund and/or the Underlying Funds, including the fees received by the Investment Adviser’s affiliates from the Fund and/or the Underlying Funds for transfer agency, securities lending, portfolio trading, distribution and other services; |
| | (k) | | a summary of potential benefits derived by the Fund and/or the Underlying Funds as a result of their relationship with the Investment Adviser; |
| | (l) | | information regarding commissions paid by the Fund and the Underlying Equity Funds and broker oversight, an update on the Investment Adviser’s soft dollars practices, other information regarding portfolio trading, and how the Investment Adviser carries out its duty to seek best execution; |
| | (m) | | portfolio manager ownership of Fund shares; the manner in which portfolio manager compensation is determined; and the number and types of accounts managed by the portfolio managers; |
| | (n) | | the nature and quality of the services provided to the Fund and the Underlying Funds by their unaffiliated service providers, and the Investment Adviser’s general oversight and evaluation (including reports on due diligence) of those service providers as part of the administrative services provided under the Management Agreement; and |
| | (o) | | the Investment Adviser’s processes and policies addressing various types of potential conflicts of interest; its approach to risk management; the annual review of the effectiveness of the Fund’s compliance program; and periodic compliance reports. |
The Trustees also received an overview of the Fund’s distribution arrangements. They received information regarding the Fund’s assets, share purchase and redemption activity, and payment of distribution, service, and shareholder administration fees. Information was also provided to the Trustees relating to revenue sharing payments made by and services provided by the Investment Adviser and its affiliates to intermediaries that promote the sale, distribution, and/or servicing of Fund shares. The Independent Trustees also discussed the broad range of other investment choices that are available to Fund investors, including the availability of comparable funds managed by other advisers.
The presentations made at the Board and Committee meetings and at the Annual Meeting encompassed the Fund and other mutual funds for which the Board of Trustees has responsibility. In evaluating the Management Agreement at the Annual Meeting, the Trustees relied upon their knowledge, resulting from their meetings and other interactions throughout the year, of the Investment Adviser and its affiliates, their services, and the Fund. In conjunction with these meetings, the Trustees received written materials and oral presentations on the topics covered, and the Investment Adviser addressed the questions and concerns of the Trustees, including concerns regarding the investment performance of certain of the funds they oversee. The Independent Trustees were advised by their independent legal counsel regarding their responsibilities and other regulatory requirements related to the approval and continuation of mutual fund investment management agreements under applicable law. In addition, the Investment Adviser and its affiliates provided the Independent Trustees with a written response to a formal request for information sent on behalf of the Independent Trustees by their independent legal counsel. During the course of their deliberations, the Independent Trustees met in executive sessions with their independent legal counsel, without representatives of the Investment Adviser or its affiliates present.
Nature, Extent, and Quality of the Services Provided Under the Management Agreement
As part of their review, the Trustees considered the nature, extent, and quality of the services provided to the Fund and the Underlying Funds by the Investment Adviser. In this regard, the Trustees considered both the investment advisory services andnon-advisory services that are provided by the Investment Adviser and its affiliates. The Trustees noted the transition in the leadership and changes in personnel of various of the Investment Adviser’s portfolio management teams that had occurred in recent periods, and the ongoing recruitment efforts aimed at bringing high quality investment talent to the Investment Adviser. They also noted the Investment Adviser’s commitment to maintaining high quality systems and expending substantial resources to respond to ongoing changes to the regulatory and control environment in which the Fund and the Underlying Funds and their service providers operate, as well as the efforts of the Investment Adviser and its affiliates to combat cyber security risks. The Trustees concluded that the Investment Adviser continued to commit substantial financial and operational resources to the Fund and expressed confidence that the Investment Adviser would continue to do so in the future. The Trustees also recognized that the Investment Adviser had made significant commitments to address regulatory compliance requirements applicable to the Fund, the Underlying Funds, and the Investment Adviser and its affiliates.
Investment Performance
The Trustees also considered the investment performance of the Fund and the Underlying Funds. In this regard, they compared the investment performance of the Fund to its peers usingrankings and ratings compiled by the Outside Data Provider as of December 31, 2018, and updated performance information prepared by the Investment Adviser using the peer group identified
37
GOLDMAN SACHS DYNAMIC GLOBAL EQUITY FUND
Statement Regarding Basis for Approval of Management Agreement (Unaudited) (continued)
by the Outside Data Provider as of March 31, 2019. The information on the Fund’s investment performance was provided for theone-, three-, five-, andten-year periods ending on the applicable dates. The Trustees also reviewed the Fund’s investment performance relative to its performance benchmark. As part of this review, they considered the investment performance trends of the Fund over time, and reviewed the investment performance of the Fund in light of its investment objective and policies and market conditions.
In addition, the Trustees considered materials prepared and presentations made by the Investment Adviser’s senior management and portfolio management personnel in which Fund performance was assessed. The Trustees also considered the Investment Adviser’s periodic reports with respect to the Fund’s and Underlying Funds’ risk profiles, and how the Investment Adviser’s approach to risk monitoring and management influences portfolio management. They noted the efforts of the portfolio management team of certain Underlying Funds to continue to enhance the investment models used in managing the Underlying Funds.
The Trustees further observed that the Fund’s Institutional Shares had placed in the top half of the Fund’s peer group for the three-, five-, andten-year periods and the third quartile for theone-year period, and had underperformed the Fund’s benchmark index for theone-year period, matched the performance for the three-year period, and outperformed for the five- andten-year periods ended March 31, 2019. They also noted that in February 2019, the Fund had been repositioned from the Equity Growth Strategy Portfolio, which involved changes to the Fund’s investment strategies.
Costs of Services Provided and Competitive Information
The Trustees considered the contractual terms of the Management Agreement and the fee rates payable by the Fund thereunder. In this regard, the Trustees considered information on the services rendered by the Investment Adviser to the Fund, which included both advisory and administrative services that were directed to the needs and operations of the Fund as a registered mutual fund.
In particular, the Trustees reviewed analyses prepared by the Outside Data Provider regarding the expense rankings of the Fund. The analyses provided a comparison of the Fund’s management fee to those of a relevant peer group and category universe; an expense analysis which compared the Fund’s overall net and gross expenses to a peer group and a category universe; and data comparing the Fund’s net expenses to the peer and category medians. The analyses also compared the Fund’s other expenses and fee waivers/reimbursements to those of the peer group and category medians. The Trustees concluded that the comparisons provided by the Outside Data Provider were useful in evaluating the reasonableness of the management fees and total expenses paid by the Fund.
In addition, the Trustees considered the Investment Adviser’s undertakings to implement fee waivers and/or expense limitations with respect to the Fund and the Underlying Funds. They also considered, to the extent that the Investment Adviser manages other types of accounts having investment objectives and policies similar to those of the Fund, comparative fee information for services provided by the Investment Adviser to those accounts, and information that indicated that services provided to the Fund differed in various significant respects from the services provided to other types of accounts which, in many cases, operated under less stringent legal and regulatory structures, required fewer services from the Investment Adviser to a smaller number of client contact points, and were less time-intensive.
In addition, the Trustees noted that shareholders are able to redeem their Fund shares at any time if shareholders believe that the Fund fees and expenses are too high or if they are dissatisfied with the performance of the Fund.
Profitability
The Trustees reviewed the Fund’s contribution to the Investment Adviser’s revenues andpre-tax profit margins. In this regard the Trustees noted that they had received, among other things, profitability analyses and summaries, revenue and expense schedules by Fund and by function (i.e., investment management, transfer agency and distribution and service), and information on the Investment Adviser’s expense allocation methodology. They observed that the profitability and expense figures are substantially similar to those used by the Investment Adviser for many internal purposes, including compensation decisions among various business groups, and are thus subject to a vigorous internal debate about how certain revenue and expenses should be allocated. The Trustees also noted that the internal audit group within the Goldman Sachs organization periodically audits the expense allocation methodology and that the internal audit group was satisfied with the reasonableness, consistency, and accuracy of the Investment Adviser’s expense allocation methodology. Profitability data for the Fund was provided for 2018 and 2017, and the Trustees considered this information in relation to the Investment Adviser’s overall profitability.
Economies of Scale
The Trustees considered the information that had been provided regarding whether there have been economies of scale with respect to the management of the Fund.
38
GOLDMAN SACHS DYNAMIC GLOBAL EQUITY FUND
Statement Regarding Basis for Approval of Management Agreement (Unaudited) (continued)
The Trustees noted that, although the Fund itself does not have breakpoints in its management fee schedules, any benefits of the breakpoints in the management fee schedules of certain Underlying Funds, when reached, would pass through to the shareholders in the Fund at the specified asset levels. The Trustees considered the amounts of assets in the Fund; the Fund’s recent purchase and redemption activity; the information provided by the Investment Adviser relating to the costs of the services provided by the Investment Adviser and its affiliates and the profits realized by them; information comparing the fee rates charged by the Investment Adviser with fee rates charged to other funds in the peer groups; and the Investment Adviser’s undertaking to limit certain expenses of the Fund and Underlying Funds that exceed specified levels. They also considered the services provided to the Fund under the Management Agreement and the fees and expenses borne by the Underlying Funds, and determined that the management fees payable by the Fund were not duplicative of the management fees paid at the Underlying Fund level.
Other Benefits to the Investment Adviser and Its Affiliates
The Trustees also considered the other benefits derived by the Investment Adviser and its affiliates from their relationships with the Fund and/or the Underlying Funds as stated above, including: (a) transfer agency fees received by Goldman Sachs & Co. LLC (“Goldman Sachs”); (b) brokerage and futures commissions earned by Goldman Sachs for executing securities and futures transactions on behalf of the Fund and/or the Underlying Funds; (c) research received by the Investment Adviser from broker-dealers in exchange for executing certain transactions on behalf of the Fund and/or the Underlying Funds; (d) trading efficiencies resulting from aggregation of orders of the Fund and/or the Underlying Funds with those for other funds or accounts managed by the Investment Adviser; (e) fees earned by Goldman Sachs Agency Lending (“GSAL”), an affiliate of the Investment Adviser, as securities lending agent for certain Underlying Funds (and fees earned by the Investment Adviser for managing the fund in which those Underlying Funds’ cash collateral is invested); (f) the Investment Adviser’s ability to leverage the infrastructure designed to service the Fund and the Underlying Funds on behalf of its other clients; (g) the Investment Adviser’s ability to cross-market other products and services to Fund shareholders; (h) Goldman Sachs’ retention of certain fees as Fund Distributor; (i) the Investment Adviser’s ability to negotiate better pricing with custodians on behalf of its other clients, as a result of the relationship with the Fund and Underlying Funds; and (j) the possibility that the working relationship between the Investment Adviser and the Fund’s and Underlying Funds’ third-party service providers may cause those service providers to be more likely to do business with other areas of Goldman Sachs. In the course of considering the foregoing, the Independent Trustees requested and received further information quantifying certain of thesefall-out benefits.
Other Benefits to the Fund and Its Shareholders
The Trustees also noted that the Fund and/or the Underlying Funds receive certain other potential benefits as a result of their relationship with the Investment Adviser, including: (a) trading efficiencies resulting from aggregation of orders of the Fund and/or the Underlying Funds with those of other funds or accounts managed by the Investment Adviser; (b) enhanced servicing from vendors due to the volume of business generated by the Investment Adviser and its affiliates; (c) enhanced servicing from broker-dealers due to the volume of business generated by the Investment Adviser and its affiliates; (d) with respect to the Fund and certain Underlying Funds, the Investment Adviser’s ability to negotiate favorable terms with derivatives counterparties as a result of the size and reputation of the Goldman Sachs organization; (e) the advantages received from the Investment Adviser’s knowledge and experience gained from managing other accounts and products; (f) the Investment Adviser’s ability to hire and retain qualified personnel to provide services to the Fund and the Underlying Funds because of the reputation of the Goldman Sachs organization; (g) the Fund’s and Underlying Funds’ access, through the Investment Adviser, to certain firm-wide resources (e.g., proprietary risk management systems and databases), subject to certain restrictions; (h) with respect to certain Underlying Funds, the ability to participate in the securities lending program administered by GSAL, as measured by the revenue received by the Underlying Funds in connection with the program; and (i) the Fund’s and Underlying Funds’ access to certain affiliated distribution channels. In addition, the Trustees noted the competitive nature of the mutual fund marketplace, and considered that many of the Fund’s shareholders invested in the Fund in part because of the Fund’s relationship with the Investment Adviser and that those shareholders have a general expectation that the relationship will continue.
Conclusion
In connection with their consideration of the Management Agreement, the Trustees gave weight to each of the factors described above, but did not identify any particular factor as controlling their decision. After deliberation and consideration of all of the information provided, including the factors described above, the Trustees concluded, in the exercise of their business judgment, that the management fees paid by the Fund were reasonable in light of the services provided to it by the Investment Adviser, the Investment Adviser’s costs and the Fund’s current and reasonably foreseeable asset levels. The Trustees unanimously concluded that the Investment Adviser’s continued management likely would benefit the Fund and its shareholders and that the Management Agreement should be approved and continued with respect to the Fund until June 30, 2020.
39
FUNDS PROFILE
Goldman Sachs Funds
Goldman Sachs is a premier financial services firm, known since 1869 for creating thoughtful and customized investment solutions in complex global markets.
Today, theInvestment Management Division of Goldman Sachs serves a diverse set of clients worldwide, including private institutions, public entities and individuals. With approximately $1.44 trillion in assets under supervision as of June 30, 2019, Goldman Sachs Asset Management (“GSAM”) has portfolio management teams located around the world and our investment professionals bring firsthand knowledge of local markets to every investment decision. Assets under supervision includes assets under management and other client assets for which Goldman Sachs does not have full discretion. GSAM leverages the resources of Goldman Sachs & Co. LLC subject to legal, internal and regulatory restrictions.
Money Market
Financial Square FundsSM
| ∎ | | Financial Square Treasury Solutions Fund1 |
| ∎ | | Financial Square Government Fund1 |
| ∎ | | Financial Square Money Market Fund2 |
| ∎ | | Financial Square Prime Obligations Fund2 |
| ∎ | | Financial Square Treasury Instruments Fund1 |
| ∎ | | Financial Square Treasury Obligations Fund1 |
| ∎ | | Financial Square Federal Instruments Fund1 |
Investor FundsSM
| ∎ | | Investor Money Market Fund3 |
| ∎ | | Investor Tax-Exempt Money Market Fund3 |
Fixed Income
Short Duration and Government
| ∎ | | High Quality Floating Rate Fund |
| ∎ | | Short-Term Conservative Income Fund |
| ∎ | | Short Duration Government Fund |
| ∎ | | Short Duration Income Fund |
| ∎ | | Inflation Protected Securities Fund |
Multi-Sector
Municipal and Tax-Free
| ∎ | | High Yield Municipal Fund |
| ∎ | | Dynamic Municipal Income Fund |
| ∎ | | Short Duration Tax-Free Fund |
| ∎ | | Municipal Income Completion Fund |
Single Sector
| ∎ | | Investment Grade Credit Fund |
| ∎ | | High Yield Floating Rate Fund |
| ∎ | | Emerging Markets Debt Fund |
| ∎ | | Local Emerging Markets Debt Fund |
Fixed Income Alternatives
| ∎ | | Long Short Credit Strategies Fund |
Fundamental Equity
| ∎ | | Small/Mid Cap Value Fund |
| ∎ | | Small/Mid Cap Growth Fund |
| ∎ | | Concentrated Growth Fund |
| ∎ | | Technology Opportunities Fund |
| ∎ | | Growth Opportunities Fund |
| ∎ | | Rising Dividend Growth Fund |
Tax-Advantaged Equity
| ∎ | | U.S. Tax-Managed Equity Fund |
| ∎ | | International Tax-Managed Equity Fund |
| ∎ | | U.S. Equity Dividend and Premium Fund |
| ∎ | | International Equity Dividend and Premium Fund |
Equity Insights
| ∎ | | Small Cap Equity Insights Fund |
| ∎ | | U.S. Equity Insights Fund |
| ∎ | | Small Cap Growth Insights Fund |
| ∎ | | Large Cap Growth Insights Fund |
| ∎ | | Large Cap Value Insights Fund |
| ∎ | | Small Cap Value Insights Fund |
| ∎ | | International Small Cap Insights Fund |
| ∎ | | International Equity Insights Fund |
| ∎ | | Emerging Markets Equity Insights Fund |
Fundamental Equity International
| ∎ | | International Equity Income Fund |
| ∎ | | International Equity ESG Fund |
| ∎ | | Emerging Markets Equity Fund |
| ∎ | | Imprint Emerging Markets Opportunities Fund5 |
| ∎ | | ESG Emerging Markets Equity Fund |
Alternative
| ∎ | | Real Estate Securities Fund |
| ∎ | | International Real Estate Securities Fund |
| ∎ | | Commodity Strategy Fund |
| ∎ | | Global Real Estate Securities Fund |
| ∎ | | Alternative Premia Fund |
| ∎ | | Absolute Return Tracker Fund |
| ∎ | | Managed Futures Strategy Fund |
| ∎ | | MLP Energy Infrastructure Fund |
| ∎ | | Multi-Manager Alternatives Fund |
| ∎ | | Absolute Return Multi-Asset Fund |
| ∎ | | Global Infrastructure Fund |
Total Portfolio Solutions
| ∎ | | Global Managed Beta Fund |
| ∎ | | Multi-Manager Non-Core Fixed Income Fund |
| ∎ | | Multi-Manager U.S. Dynamic Equity Fund |
| ∎ | | Multi-Manager Global Equity Fund |
| ∎ | | Multi-Manager International Equity Fund |
| ∎ | | Tactical Tilt Overlay Fund |
| ∎ | | Balanced Strategy Portfolio |
| ∎ | | Multi-Manager U.S. Small Cap Equity Fund |
| ∎ | | Multi-Manager Real Assets Strategy Fund |
| ∎ | | Growth and Income Strategy Portfolio |
| ∎ | | Growth Strategy Portfolio |
| ∎ | | Dynamic Global Equity Fund4 |
| ∎ | | Satellite Strategies Portfolio |
| ∎ | | Enhanced Dividend Global Equity Portfolio |
| ∎ | | Tax-Advantaged Global Equity Portfolio |
| ∎ | | Strategic Factor Allocation Fund |
| ∎ | | Target Date 2020 Portfolio |
| ∎ | | Target Date 2025 Portfolio |
| ∎ | | Target Date 2030 Portfolio |
| ∎ | | Target Date 2035 Portfolio |
| ∎ | | Target Date 2040 Portfolio |
| ∎ | | Target Date 2045 Portfolio |
| ∎ | | Target Date 2050 Portfolio |
| ∎ | | Target Date 2055 Portfolio |
| ∎ | | Target Date 2060 Portfolio |
| ∎ | | GQG Partners International Opportunities Fund |
| 1 | | You could lose money by investing in the Fund. Although the Fund seeks to preserve the value of your investment at $1.00 per share, it cannot guarantee it will do so. An investment in the Fund is not a deposit of a bank and is not insured or guaranteed by the Federal Deposit Insurance Corporation or any other government agency. The Fund’s sponsor has no legal obligation to provide financial support to the Fund, and you should not expect that the sponsor will provide financial support to the Fund at any time. |
| 2 | | You could lose money by investing in the Fund. Because the share price of the Fund will fluctuate, when you sell your shares they may be worth more or less than what you originally paid for them. The Fund may impose a fee upon sale of your shares or may temporarily suspend your ability to sell shares if the Fund’s liquidity falls below required minimums because of market conditions or other factors. An investment in the Fund is not a deposit of a bank and is not insured or guaranteed by the Federal Deposit Insurance Corporation or any other government agency. The Fund’s sponsor has no legal obligation to provide financial support to the Fund, and you should not expect that the sponsor will provide financial support to the Fund at any time. |
| 3 | | You could lose money by investing in the Fund. Although the Fund seeks to preserve the value of your investment at $1.00 per share, it cannot guarantee it will do so. The Fund may impose a fee upon sale of your shares or may temporarily suspend your ability to sell shares if the Fund’s liquidity falls below required minimums because of market conditions or other factors. An investment in the Fund is not a deposit of a bank and is not insured or guaranteed by the Federal Deposit Insurance Corporation or any other government agency. The Fund’s sponsor has no legal obligation to provide financial support to the Fund, and you should not expect that the sponsor will provide financial support to the Fund at any time. |
| 4 | | Effective after the close of business on February 28, 2019, the Goldman Sachs Equity Growth Strategy Portfolio was renamed the Goldman Sachs Dynamic Global Equity Fund. |
| | | Financial Square FundsSM and Investor FundsSM are registered service marks of Goldman Sachs & Co. LLC. |
| 5 | | Effective after the close of business on August 30, 2019, the Goldman Sachs N-11 Equity Fund was renamed the Goldman Sachs Imprint Emerging Markets Opportunities Fund. |
| * | | This list covers open-end funds only. Please visit our website at www.GSAMFUNDS.com to learn about our closed-end funds and exchange-traded funds. |
| | |
TRUSTEES Jessica Palmer,Chair Kathryn A. Cassidy Diana M. Daniels James A. McNamara Roy W. Templin Gregory G. Weaver | | OFFICERS James A. McNamara,President Joseph F. DiMaria,Principal Financial Officer, Principal Accounting Officer and Treasurer Caroline L. Kraus,Secretary |
| |
GOLDMAN SACHS & CO. LLC Distributor and Transfer Agent | | GOLDMAN SACHS ASSET MANAGEMENT, L.P. Investment Adviser |
Visit our web site atwww.GSAMFUNDS.com to obtain the most recent month-end returns.
Goldman Sachs Asset Management, L.P. 200 West Street, New York, New York 10282
The portfolio risk management process includes an effort to monitor and manage risk, but does not imply low risk.
The reports concerning the Fund included in this shareholder report may contain certain forward-looking statements about the factors that may affect the performance of the Fund in the future. These statements are based on Fund management’s predictions and expectations concerning certain future events and their expected impact on the Fund, such as performance of the economy as a whole and of specific industry sectors, changes in the levels of interest rates, the impact of developing world events, and other factors that may influence the future performance of the Fund. Management believes these forward-looking statements to be reasonable, although they are inherently uncertain and difficult to predict. Actual events may cause adjustments in portfolio management strategies from those currently expected to be employed.
Diversification does not protect an investor from market risk and does not ensure a profit.
Views and opinions expressed are for informational purposes only and do not constitute a recommendation by GSAM to buy, sell, or hold any security. Views and opinions are current as of the date of this presentation and may be subject to change. They should not be construed as investment advice.
A description of the policies and procedures that the Fund uses to determine how to vote proxies relating to portfolio securities and information regarding how the Fund voted proxies relating to portfolio securities during the most recent 12-month period ended June 30 is available (i) without charge, upon request by calling 1-800-526-7384 (for Retail Shareholders) or 1-800-621-2550 (for Institutional Shareholders); and (ii) on the Securities and Exchange Commission (“SEC”) web site at http://www.sec.gov.
References to indices, benchmarks or other measures of relative market performance over a specified period of time are provided for your information only and do not imply that the portfolio will achieve similar results. The index composition may not reflect the manner in which a portfolio is constructed. While an adviser seeks to design a portfolio which reflects appropriate risk and return features, portfolio characteristics may deviate from those of the benchmark.
The Fund will file its portfolio holdings information for each month in a fiscal quarter within 60 days after the end of the relevant fiscal quarter on Form N-PORT. Portfolio holdings information for the third month of each fiscal quarter will be made available on the SEC’s web site at http://www.sec.gov. Portfolio holdings information may be obtained upon request and without charge by calling 1-800-526-7384 (for Retail Shareholders) or 1-800-621-2550 (for Institutional Shareholders).
Holdings and allocations shown are as of June 30, 2019 and may not be representative of future investments. Fund holdings should not be relied on in making investment decisions and should not be construed as research or investment advice regarding particular securities. Current and future holdings are subject to risk.
This material is not authorized for distribution to prospective investors unless preceded or accompanied by a current prospectus or summary prospectus, if applicable. Investors should consider the Fund’s objective, risks, and charges and expenses, and read the summary prospectus, if available, and/or the prospectus carefully before investing or sending money. The summary prospectus, if available, and the prospectus contain this and other information about the Fund and may be obtained from your authorized dealer or from Goldman Sachs & Co. LLC by calling (retail – 1-800-526-7384) (institutional – 1-800-621-2550).
© 2018 Goldman Sachs. All rights reserved. 174987-OTU-1031028 DYNGLEQSAR-19
(a) As of the end of the period covered by this report, the registrant has adopted a code of ethics that applies to the registrant’s principal executive officer, principal financial officer, principal accounting officer or controller, or persons performing similar functions, regardless of whether these individuals are employed by the registrant or a third party (the “Code of Ethics”).
(b) During the period covered by this report, no amendments were made to the provisions of the Code of Ethics.
(c) During the period covered by this report, the registrant did not grant any waivers, including an implicit waiver, from any provision of the Code of Ethics.
(d) A copy of the Code of Ethics is available as provided in Item 13(a)(1) of this report.
| ITEM 3. | AUDIT COMMITTEE FINANCIAL EXPERT. |
The registrant’s board of trustees has determined that the registrant has at least one “audit committee financial expert” (as defined in Item 3 of Form N-CSR) serving on its audit committee. Gregory G. Weaver is the “audit committee financial expert” and is “independent” (as each term is defined in Item 3 of Form N-CSR).
| ITEM 4. | PRINCIPAL ACCOUNTANT FEES AND SERVICES. |
The information required by this Item is only required in an annual report on this Form N-CSR.
| ITEM 5. | AUDIT COMMITTEE OF LISTED REGISTRANTS. |
| ITEM 6. | SCHEDULE OF INVESTMENTS. |
| | Schedule of Investments is included as part of the Report to Shareholders filed under Item 1. |
| ITEM 7. | DISCLOSURE OF PROXY VOTING POLICIES AND PROCEDURES FORCLOSED-END MANAGEMENT INVESTMENT COMPANIES. |
| ITEM 8. | PORTFOLIO MANAGERS OFCLOSED-END MANAGEMENT INVESTMENT COMPANIES. |
| ITEM 9. | PURCHASES OF EQUITY SECURITIES BYCLOSED-END MANAGEMENT INVESTMENT COMPANY AND AFFILIATED PURCHASERS. |
| ITEM 10. | SUBMISSION OF MATTERS TO A VOTE OF SECURITY HOLDERS. |
| | There have been no material changes to the procedures by which shareholders may recommend nominees to the registrant’s board of trustees. |
| ITEM 11. | CONTROLS AND PROCEDURES. |
| | (a) | The registrant’s principal executive and principal financial officers, or persons performing similar functions have concluded that the registrant’s disclosure controls and procedures (as defined in Rule30a-3(c) under the Investment Company Act of 1940, as amended (the “1940 Act”)) are effective as of a date within 90 days of the filing of this report that includes the disclosure required by this paragraph, based on the evaluation of these controls and procedures required by Rule30a-3(b) under the 1940 Act and15d-15(b) under the Securities Exchange Act of 1934, as amended. |
| | (b) | There were no changes in the registrant’s internal control over financial reporting (as defined in Rule30a-3(d) under the 1940 Act) that occurred during the period covered by this report that have materially affected, or are reasonably likely to materially affect, the registrant’s internal control over financial reporting. |
| ITEM 12. | DISCLOSURE OF SECURITIES LENDING ACTIVITIES FOR CLOSED-END MANAGEMENT INVESTMENT COMPANIES |
| | | | |
| (a)(1) | | Goldman Sachs Trust’s Code of Ethics for Principal Executive and Senior Financial Officers is incorporated by reference to Exhibit 12(a)(1) of the registrant’s Form N-CSR filed on July 8, 2015 for its International Equity Insights Funds. |
| | |
| (a)(2) | | Exhibit 99.CERT | | Certifications pursuant to Section 302 of the Sarbanes-Oxley Act of 2002 filed herewith. |
| | |
| (a)(3) | | | | Not applicable to open-end investment companies. |
| | |
| (a)(4) | | | | There was no change in the registrant’s independent public accountant for the period covered by this report. |
| | |
| (b) | | Exhibit 99.906CERT | | Certifications pursuant to Section 906 of the Sarbanes-Oxley Act of 2002 filed herewith. |
SIGNATURES
Pursuant to the requirements of the Securities Exchange Act of 1934 and the Investment Company Act of 1940, the registrant has duly caused this report to be signed on its behalf by the undersigned, thereunto duly authorized.
| | |
| | | Goldman Sachs Trust |
| |
| By: | | /s/ James A. McNamara |
| |
| | |
| | James A. McNamara |
| | President/Chief Executive Officer |
| | Goldman Sachs Trust |
| |
| Date: | | August 28, 2019 |
Pursuant to the requirements of the Securities Exchange Act of 1934 and the Investment Company Act of 1940, this report has been signed below by the following persons on behalf of the registrant and in the capacities and on the dates indicated.
| | |
| By: | | /s/ James A. McNamara |
| |
| | |
| | James A. McNamara |
| | President/Chief Executive Officer |
| | Goldman Sachs Trust |
| |
| Date: | | August 28, 2019 |
| |
| By: | | /s/ Joseph F. DiMaria |
| |
| | |
| | Joseph F. DiMaria |
| | Principal Financial Officer |
| | Goldman Sachs Trust |
| |
| Date: | | August 28, 2019 |