UNITED STATES
SECURITIES AND EXCHANGE COMMISSION
Washington, D.C. 20549
FORMN-CSR
CERTIFIED SHAREHOLDER REPORT OF REGISTERED
MANAGEMENT INVESTMENT COMPANIES
Investment Company Act file number811-05349
Goldman Sachs Trust
(Exact name of registrant as specified in charter)
71 South Wacker Drive, Chicago, Illinois 60606
(Address of principal executive offices) (Zip code)
| | |
| Caroline Kraus, Esq. | | Copies to: |
| Goldman Sachs & Co. LLC | | Geoffrey R.T. Kenyon, Esq. |
| 200 West Street | | Dechert LLP |
| New York, New York 10282 | | 100 Oliver Street |
| | 40th Floor |
| | Boston, MA 02110-2605 |
(Name and address of agents for service)
Registrant’s telephone number, including area code:(312) 655-4400
Date of fiscal year end: October 31
Date of reporting period: April 30, 2020
| ITEM 1. | REPORTS TO STOCKHOLDERS. |
| | The Semi-Annual Report to Shareholders is filed herewith. |
Goldman Sachs Funds

| | | | |
| | |
| Semi-Annual Report | | | | April 30, 2020 |
| | |
| | | | Dividend Focus Funds |
| | | | Income Builder |
| | | | Rising Dividend Growth |
It is our intention that beginning on January 1, 2021, paper copies of the Funds’ annual and semi-annual shareholder reports will no longer be sent by mail, unless you specifically request paper copies of the reports from a Fund or from your financial intermediary. Instead, the reports will be made available on a website, and you will be notified by mail each time a report is posted and provided with a website link to access the report.
If you already elected to receive shareholder reports electronically, you will not be affected by this change and you need not take any action. At any time, you may elect to receive reports and certain communications from a Fund electronically by calling the applicable toll-free number below or by contacting your financial intermediary.
You may elect to receive all future shareholder reports in paper free of charge. If you hold shares of a Fund directly with the Fund’s transfer agent, you can inform the transfer agent that you wish to receive paper copies of reports by callingtoll-free 800-621-2550 for Institutional, Class R6 and Class P shareholders or800-526-7384 for all other shareholders. If you hold shares of a Fund through a financial intermediary, please contact your financial intermediary to make this election. Your election to receive reports in paper will apply to all Goldman Sachs Funds held in your account if you invest through your financial intermediary or all Goldman Sachs Funds held with the Funds’ transfer agent if you invest directly with the transfer agent.

Goldman Sachs Dividend Focus Funds
| | | | |
| | | |
| NOT FDIC-INSURED | | May Lose Value | | No Bank Guarantee |
Goldman Sachs Dividend Focus Funds
Recent Market Events related to COVID-19
While this semi-annual report covers the six month period ended April 30, 2020, we want to describe some more recent events through the end of May.
An outbreak of a novel strain of coronavirus (COVID-19) has emerged globally. The outbreak of COVID-19 has prompted a number of measures to limit the spread, including travel and border restrictions, quarantines, curfews and restrictions on large gatherings. In turn, these resulted in lower consumer activity, diminished demand for a wide range of products and services, and disruption in manufacturing and supply chains. While governments have already taken unprecedented action to limit disruption to the financial system, global financial markets have experienced and may continue to experience significant volatility resulting from the spread of and subsequent intervening measures intended to limit the spread of COVID-19. The Fund could be negatively impacted if the value of a portfolio holding were harmed by such political or economic conditions, events, or actions. The full extent of the impact of COVID-19 on the Fund’s performance cannot be determined at this time and will depend on future developments, including the duration and the continued spread of the outbreak. Goldman Sachs Asset Management’s long-term commitment to you, our Fund shareholders, remains unchanged. We encourage you to maintain perspective and stay current with timely commentary and investment insights by visiting gsam.com.
i
FUND BASICS
Income Builder Fund
as of April 30, 2020
| | | | | | | | | | | | | | |
| | PERFORMANCE REVIEW | | | | | |
| | | | |
| | | November 1, 2019–April 30, 2020 | | Fund Total Return
(based on NAV)1 | | | Russell 1000®
Value Index2 | | | ICE BofAML BB to B U.S. High
Yield Constrained Index3 | |
| | | | |
| | Class A | | | -5.70 | % | | | -13.66 | % | | | -6.20 | % |
| | Class C | | | -6.06 | | | | -13.66 | | | | -6.20 | |
| | Institutional | | | -5.52 | | | | -13.66 | | | | -6.20 | |
| | Investor | | | -5.59 | | | | -13.66 | | | | -6.20 | |
| | Class P | | | -5.51 | | | | -13.66 | | | | -6.20 | |
| | | Class R6 | | | -5.52 | | | | -13.66 | | | | -6.20 | |
| 1 | | The net asset value (“NAV”) represents the net assets of the class of the Fund (ex-dividend) divided by the total number of shares of the class outstanding. The Fund’s performance assumes the reinvestment of dividends and other distributions. The Fund’s performance does not reflect the deduction of any applicable sales charges. |
| 2 | | The Russell 1000® Value Index measures the performance of the large-cap value segment of the U.S. equity universe. It includes those Russell 1000® Index companies with lower price-to-book ratios and lower expected growth values. This index is constructed to provide a comprehensive and unbiased barometer for the large-cap value segment. The Index is completely reconstituted annually to ensure new and growing equities are included and that the represented companies continue to reflect value characteristics. It is not possible to invest directly in an unmanaged index. |
| 3 | | The BofAML BB to B U.S. High Yield Constrained Index contains all securities in the ICE BofAML U.S. High Yield Index rated BB1 through B3, based on an average of Moody’s, S&P and Fitch, but caps issuer exposure at 2%. Index constituents are capitalization-weighted, based on their current amount outstanding, provided the total allocation to an individual issuer does not exceed 2%. Issuers that exceed the limit are reduced to 2% and the face value of each of their bonds is adjusted on apro-rata basis. Similarly, the face values of bonds of all other issuers that fall below the 2% cap are increased on a pro-rata basis. It is not possible to invest directly in an unmanaged index. |
The returns set forth in the table above represent past performance. Past performance does not guarantee future results. The Fund’s investment return and principal value will fluctuate so that an investor’s shares, when redeemed, may be worth more or less than their original cost. Current performance may be lower or higher than the performance quoted above. Please visit our web site at www.GSAMFUNDS.com to obtain the most recent month-end returns.Performance reflects applicable fee waivers and/or expense limitations in effect during the periods shown. In their absence, performance would be reduced. Returns do not reflect the deduction of taxes that a shareholder would pay on Fund distributions or the redemption of Fund shares.
1
FUND BASICS
| | | | | | | | |
| | TOP TEN EQUITY HOLDINGS AS OF 4/30/204 |
| | | |
| | | Holding | | % of Net Assets | | | Line of Business |
| | | |
| | Johnson & Johnson | | | 1.5 | % | | Pharmaceuticals |
| | Chevron Corp. | | | 1.0 | | | Oil, Gas & Consumable Fuels |
| | Cisco Systems, Inc. | | | 0.9 | | | Communications Equipment |
| | Verizon Communications, Inc. | | | 0.9 | | | Diversified Telecommunication Services |
| | Eli Lilly & Co. | | | 0.8 | | | Pharmaceuticals |
| | The Home Depot, Inc. | | | 0.8 | | | Specialty Retail |
| | Comcast Corp. Class A | | | 0.8 | | | Media |
| | Microsoft Corp. | | | 0.8 | | | Software |
| | Medtronic PLC | | | 0.8 | | | Health Care Equipment & Supplies |
| | | Linde PLC | | | 0.7 | | | Chemicals |
| 4 | | The top 10 holdings may not be representative of the Fund’s future investments. |
| | | | | | |
| FUND’S EQUITY SECTOR ALLOCATIONS VS. BENCHMARK5 |
| |
| As of April 30, 2020 | | |
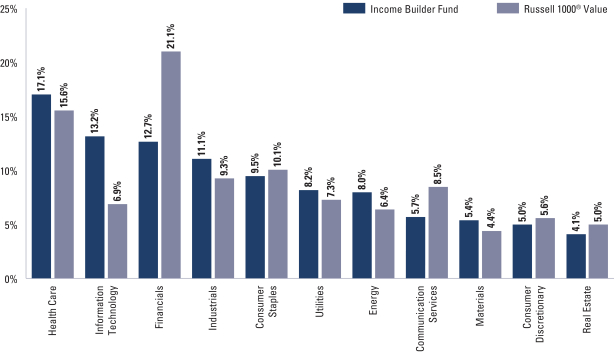
| 5 | | The Fund is actively managed and, as such, its composition may differ over time. Consequently, the Fund’s overall sector allocations may differ from the percentages contained in the graph above. The graph categorizes investments using the Global Industry Classification Standard (“GICS”); however, the sector classifications used by the portfolio management team may differ from GICS. The percentage shown for each investment category reflects the value of investments in that category as a percentage of the total value of the Fund’s Equity investments market value (excluding investments in the securities lending reinvestment vehicle, if any). Investments in the securities lending reinvestment vehicle represented 0.8% of the Fund’s net assets as of April 30, 2020. The graph depicts the Fund’s investments but may not represent the Fund’s market exposure due to the exclusion of certain derivatives, if any, as listed in the Additional Investment Information section of the Schedule of Investments. |
2
FUND BASICS
|
| FUND’S FIXED INCOME FUND COMPOSITION6 |
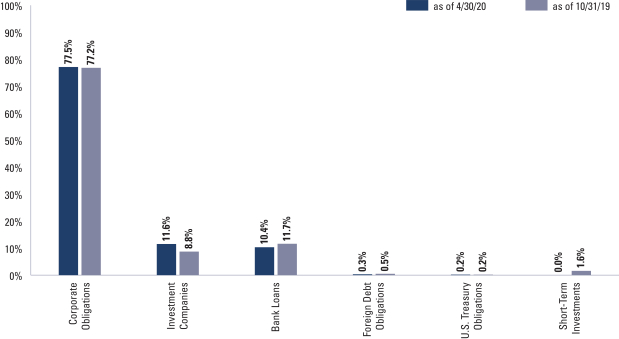
| 6 | | The percentage shown for each investment category reflects the value of investments in that category as a percentage of the Fund’s Fixed Income investments. Short-term investments represent commercial paper. The graph depicts the Fund’s investments but may not represent the Fund’s market exposure due to the exclusion of certain derivatives, if any, as listed in the Additional Investment Information section of the Schedule of Investments. |
For more information about your Fund, please refer to www.GSAMFUNDS.com. There, you can learn more about your Fund’s investment strategies, holdings, and performance.
3
FUND BASICS
Rising Dividend Growth Fund
as of April 30, 2020
| | | | | | | | | | |
| | PERFORMANCE REVIEW | |
| | | |
| | | November 1, 2019–April 30, 2020 | | Fund Total Return
(based on NAV)1 | | | S&P 500 Index2 | |
| | | |
| | Class A | | | -12.53 | % | | | -3.16 | % |
| | Class C | | | -12.90 | | | | -3.16 | |
| | Institutional | | | -12.43 | | | | -3.16 | |
| | Investor | | | -12.49 | | | | -3.16 | |
| | Class P | | | -12.43 | | | | -3.16 | |
| | Class R | | | -12.64 | | | | -3.16 | |
| | | Class R6 | | | -12.44 | | | | -3.16 | |
| 1 | | The net asset value (“NAV”) represents the net assets of the class of the Fund (ex-dividend) divided by the total number of shares of the class outstanding. The Fund’s performance reflects the reinvestment of dividends and other distributions. The Fund’s performance does not reflect the deduction of any applicable sales charges. |
| 2 | | The S&P 500 Index is the Standard & Poor’s 500 Composite Index of 500 stocks, an unmanaged index of common stock prices. The Index figures do not reflect any deduction for fees, expenses or taxes. It is not possible to invest directly in an index. |
The returns set forth in the tables above represent past performance. Past performance does not guarantee future results. The Fund’s investment return and principal value will fluctuate so that an investor’s shares, when redeemed, may be worth more or less than their original cost. Current performance may be lower or higher than the performance quoted above. Please visit our web site at www.GSAMFUNDS.com to obtain the most recent month-end returns.Performance reflects applicable fee waivers and/or expense limitations in effect during the periods shown. In their absence, performance would be reduced. Returns do not reflect the deduction of taxes that a shareholder would pay on Fund distributions or the redemption of Fund shares.
4
FUND BASICS
| | | | | | | | |
| | TOP TEN HOLDINGS AS OF 4/30/203 |
| | | |
| | | Holding | | % of Net Assets | | | Line of Business |
| | Activision Blizzard, Inc. | | | 2.2 | % | | Entertainment |
| | Comcast Corp. Class A | | | 2.0 | | | Media |
| | Enterprise Products Partners LP | | | 2.0 | | | Oil, Gas & Consumable Fuels |
| | The Walt Disney Co. | | | 1.8 | | | Entertainment |
| | UnitedHealth Group, Inc. | | | 1.6 | | | Health Care Providers & Services |
| | Danaher Corp. | | | 1.6 | | | Health Care Equipment & Supplies |
| | Microsoft Corp. | | | 1.5 | | | Software |
| | Magellan Midstream Partners LP | | | 1.5 | | | Oil, Gas & Consumable Fuels |
| | MPLX LP | | | 1.4 | | | Oil, Gas & Consumable Fuels |
| | | The Home Depot, Inc. | | | 1.4 | | | Specialty Retail |
| 3 | | The top 10 holdings may not be representative of the Fund’s future investments. The top 10 holdings exclude investments in money market funds. |
|
| FUND VS. BENCHMARK SECTOR ALLOCATION4 |
|
| As of April 30, 2020 |
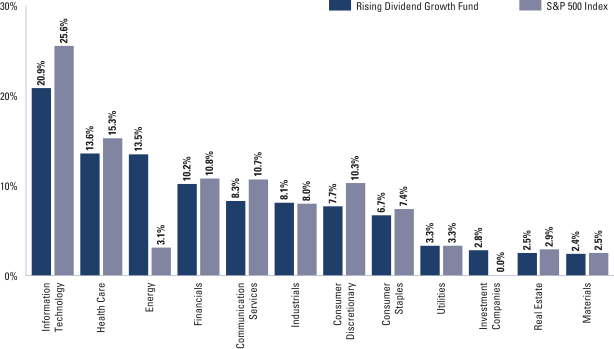
| 4 | | The Fund is actively managed and, as such, its composition may differ over time. Consequently, the Fund’s overall sector allocations may differ from the percentages contained in the graph above. The graph categorizes investments using the Global Industry Classification Standard (“GICS”); however, the sector classifications used by the portfolio management team may differ from GICS. The percentage shown for each investment category reflects the value of investments in that category as a percentage of market value. The graph depicts the Fund’s investments but may not represent the Fund’s market exposure due to the exclusion of certain derivatives, if any, as listed in the Additional Investment Information section of the Schedule of Investments. |
For more information about the Fund, please refer to www.GSAMFUNDS.com. There, you can learn more about the Fund’s investment strategies, holdings, and performance.
5
GOLDMAN SACHS INCOME BUILDER FUND
Schedule of Investments
April 30, 2020 (Unaudited)
| | | | | | | | |
| Shares | | |
Description | | Value | |
|
| Common Stocks – 35.7% | |
| Aerospace & Defense – 0.5% | |
| | 23,714 | | | Northrop Grumman Corp. | | $ | 7,841,508 | |
| | |
| Banks – 2.0% | |
| | 120,840 | | | JPMorgan Chase & Co. | | | 11,571,638 | |
| | 2,377,373 | | | Lloyds Banking Group PLC ADR | | | 3,732,476 | |
| | 39,003 | | | M&T Bank Corp. | | | 4,371,456 | |
| | 167,676 | | | Truist Financial Corp. | | | 6,257,668 | |
| | 224,892 | | | Wells Fargo & Co. | | | 6,533,113 | |
| | | | | | | | |
| | | | | | | 32,466,351 | |
| | |
| Beverages – 0.5% | |
| | 178,531 | | | TheCoca-Cola Co. | | | 8,192,788 | |
| | |
| Biotechnology – 0.2% | |
| | 15,148 | | | Amgen, Inc. | | | 3,623,705 | |
| | |
| Capital Markets – 1.1% | |
| | 11,434 | | | BlackRock, Inc. | | | 5,740,325 | |
| | 178,423 | | | Morgan Stanley | | | 7,035,219 | |
| | 51,969 | | | Singapore Exchange Ltd. ADR | | | 5,268,617 | |
| | | | | | | | |
| | | | | | | 18,044,161 | |
| | |
| Chemicals – 1.0% | |
| | 21,141 | | | Ecolab, Inc. | | | 4,090,784 | |
| | 63,972 | | | Linde PLC | | | 11,770,208 | |
| | | | | | | | |
| | | | | | | 15,860,992 | |
| | |
| Commercial Services & Supplies – 0.4% | |
| | 89,733 | | | Republic Services, Inc. | | | 7,029,683 | |
| | |
| Communications Equipment – 1.1% | |
| | 349,781 | | | Cisco Systems, Inc. | | | 14,823,719 | |
| | 136,517 | | | Juniper Networks, Inc. | | | 2,948,767 | |
| | | | | | | | |
| | | | | | | 17,772,486 | |
| | |
| Construction & Engineering – 0.3% | |
| | 248,896 | | | Vinci SA ADR | | | 5,060,056 | |
| | |
| Containers & Packaging – 0.5% | |
| | 248,520 | | | International Paper Co. | | | 8,511,810 | |
| | |
| Diversified Telecommunication Services – 0.9% | |
| | 249,224 | | | Verizon Communications, Inc. | | | 14,317,919 | |
| | |
| Electric Utilities – 0.9% | |
| | 875,805 | | | Enel SpA ADR | | | 5,916,063 | |
| | 21,338 | | | NextEra Energy, Inc. | | | 4,931,638 | |
| | 64,936 | | | Xcel Energy, Inc. | | | 4,127,332 | |
| | | | | | | | |
| | | | | | | 14,975,033 | |
| | |
| Electrical Equipment – 0.6% | |
| | 551,790 | | | Schneider Electric SE ADR | | | 10,023,265 | |
| | |
| Electronic Equipment, Instruments & Components – 0.5% | |
| | 75,856 | | | National Instruments Corp. | | | 2,914,388 | |
| | 56,583 | | | TE Connectivity Ltd. | | | 4,156,587 | |
| | | | | | | | |
| | | | | | | 7,070,975 | |
| | |
|
| Common Stocks – (continued) | |
| Energy Equipment & Services – 0.1% | |
| | 117,569 | | | Baker Hughes Co. | | | 1,640,088 | |
| | |
| Entertainment – 0.3% | |
| | 50,189 | | | The Walt Disney Co. | | | 5,427,940 | |
| | |
| Equity Real Estate Investment Trusts (REITs) – 1.5% | |
| | 16,554 | | | Alexandria Real Estate Equities, Inc. | | | 2,600,468 | |
| | 32,607 | | | American Tower Corp. | | | 7,760,466 | |
| | 30,260 | | | AvalonBay Communities, Inc. | | | 4,930,867 | |
| | 50,268 | | | Camden Property Trust | | | 4,427,103 | |
| | 158,519 | | | Hudson Pacific Properties, Inc. | | | 3,896,397 | |
| | | | | | | | |
| | | | | | | 23,615,301 | |
| | |
| Food & Staples Retailing – 0.3% | |
| | 128,219 | | | The Kroger Co. | | | 4,053,003 | |
| | |
| Food Products – 0.9% | |
| | 89,376 | | | Mondelez International, Inc. Class A | | | 4,597,501 | |
| | 93,039 | | | Nestle SA ADR | | | 9,778,399 | |
| | | | | | | | |
| | | | | | | 14,375,900 | |
| | |
| Health Care Equipment & Supplies – 1.2% | |
| | 124,505 | | | Medtronic PLC | | | 12,155,423 | |
| | 55,978 | | | Zimmer Biomet Holdings, Inc. | | | 6,700,567 | |
| | | | | | | | |
| | | | | | | 18,855,990 | |
| | |
| Health Care Providers & Services – 1.2% | |
| | 180,412 | | | CVS Health Corp. | | | 11,104,359 | |
| | 25,902 | | | UnitedHealth Group, Inc. | | | 7,575,558 | |
| | | | | | | | |
| | | | | | | 18,679,917 | |
| | |
| Hotels, Restaurants & Leisure – 0.7% | |
| | 56,652 | | | McDonald’s Corp. | | | 10,625,649 | |
| | |
| Household Products – 1.0% | |
| | 38,504 | | | Kimberly-Clark Corp. | | | 5,332,034 | |
| | 93,818 | | | The Procter & Gamble Co. | | | 11,058,328 | |
| | | | | | | | |
| | | | | | | 16,390,362 | |
| | |
| Industrial Conglomerates – 0.4% | |
| | 46,865 | | | Honeywell International, Inc. | | | 6,650,143 | |
| | |
| Insurance – 1.0% | |
| | 65,727 | | | Chubb Ltd. | | | 7,099,173 | |
| | 33,261 | | | The Travelers Cos., Inc. | | | 3,366,346 | |
| | 168,012 | | | Zurich Insurance Group AG ADR | | | 5,290,698 | |
| | | | | | | | |
| | | | | | | 15,756,217 | |
| | |
| IT Services – 0.5% | |
| | 17,919 | | | Accenture PLC Class A | | | 3,318,420 | |
| | 38,189 | | | Fidelity National Information Services, Inc. | | | 5,036,747 | |
| | | | | | | | |
| | | | | | | 8,355,167 | |
| | |
| Machinery – 0.8% | |
| | 46,968 | | | Deere & Co. | | | 6,813,178 | |
| | 46,221 | | | Stanley Black & Decker, Inc. | | | 5,093,554 | |
| | | | | | | | |
| | | | | | | 11,906,732 | |
| | |
| | |
| 6 | | The accompanying notes are an integral part of these financial statements. |
GOLDMAN SACHS INCOME BUILDER FUND
| | | | | | | | |
| Shares | | |
Description | | Value | |
|
| Common Stocks – (continued) | |
| Media – 0.8% | |
| | 194,739 | | | Bright Pattern Holding Co. | | $ | 253,160 | |
| | 328,845 | | | Comcast Corp. Class A | | | 12,374,437 | |
| | | | | | | | |
| | | | | | | 12,627,597 | |
| | |
| Metals & Mining – 0.5% | |
| | 157,963 | | | Rio Tinto PLC ADR | | | 7,296,311 | |
| | |
| Multi-Utilities – 1.4% | |
| | 88,932 | | | Ameren Corp. | | | 6,469,803 | |
| | 60,599 | | | CMS Energy Corp. | | | 3,459,597 | |
| | 105,761 | | | National Grid PLC ADR | | | 6,193,364 | |
| | 64,346 | | | Public Service Enterprise Group, Inc. | | | 3,262,985 | |
| | 27,635 | | | Sempra Energy | | | 3,422,595 | |
| | | | | | | | |
| | | | | | | 22,808,344 | |
| | |
| Oil, Gas & Consumable Fuels – 2.8% | |
| | 201,194 | | | Antero Midstream Corp. | | | 955,672 | |
| | 263,599 | | | BP PLC ADR | | | 6,273,656 | |
| | 172,219 | | | Chevron Corp. | | | 15,844,148 | |
| | 600,957 | | | Energy Transfer LP | | | 5,048,039 | |
| | 300,620 | | | Enterprise Products Partners LP | | | 5,278,887 | |
| | 140,772 | | | Plains All American Pipeline LP | | | 1,243,017 | |
| | 304,118 | | | Royal Dutch Shell PLC ADR Class A(a) | | | 10,075,429 | |
| | | | | | | | |
| | | | | | | 44,718,848 | |
| | |
| Personal Products – 0.3% | |
| | 106,821 | | | Unilever NV | | | 5,279,094 | |
| | |
| Pharmaceuticals – 3.6% | |
| | 95,686 | | | AstraZeneca PLC ADR | | | 5,002,464 | |
| | 101,271 | | | Bristol-Myers Squibb Co. | | | 6,158,289 | |
| | 82,715 | | | Eli Lilly & Co. | | | 12,791,048 | |
| | 163,521 | | | Johnson & Johnson | | | 24,534,691 | |
| | 113,924 | | | Novartis AG ADR | | | 9,652,781 | |
| | | | | | | | |
| | | | | | | 58,139,273 | |
| | |
| Road & Rail – 1.0% | |
| | 33,310 | | | Norfolk Southern Corp. | | | 5,699,341 | |
| | 62,405 | | | Union Pacific Corp. | | | 9,971,695 | |
| | | | | | | | |
| | | | | | | 15,671,036 | |
| | |
| Semiconductors & Semiconductor Equipment – 1.3% | |
| | 23,756 | | | Analog Devices, Inc. | | | 2,603,658 | |
| | 150,022 | | | Intel Corp. | | | 8,998,319 | |
| | 73,904 | | | Texas Instruments, Inc. | | | 8,578,037 | |
| | | | | | | | |
| | | | | | | 20,180,014 | |
| | |
| Software – 0.8% | |
| | 68,320 | | | Microsoft Corp. | | | 12,243,627 | |
| | |
| Specialty Retail – 1.1% | |
| | 54,306 | | | Lowe’s Cos., Inc. | | | 5,688,553 | |
| | 56,960 | | | The Home Depot, Inc. | | | 12,521,517 | |
| | | | | | | | |
| | | | | | | 18,210,070 | |
| | |
| Technology Hardware, Storage & Peripherals – 0.7% | |
| | 38,071 | | | Apple, Inc. | | | 11,185,260 | |
| | |
|
| Common Stocks – (continued) | |
| Technology – Software/Services(b)(c) – 0.0% | |
| | 194,739 | | | Aspect Software, Inc. Class B | | | 48,685 | |
| | |
| Tobacco – 0.4% | |
| | 90,672 | | | Philip Morris International, Inc. | | | 6,764,131 | |
| | |
| Water Utilities – 0.6% | |
| | 78,688 | | | American Water Works Co., Inc. | | | 9,575,543 | |
| | |
| | TOTAL COMMON STOCKS | |
| | (Cost $544,928,639) | | $ | 571,870,974 | |
| | |
| | | | | | |
| Shares | | Dividend
Rate | | Value | |
|
| Preferred Stocks(d) – 0.5% | |
| Capital Markets(e) – 0.3% | |
Morgan Stanley (3M USD LIBOR + 3.708%) | |
| 183,597 | | 6.375% | | $ | 4,929,579 | |
| |
| Diversified Telecommunication Services – 0.1% | |
Qwest Corp. | |
| 43,276 | | 6.500 | | | 1,004,003 | |
| |
| Insurance(e) – 0.1% | |
Delphi Financial Group, Inc. (3M USD LIBOR + 3.190%) | |
| 143,849 | | 4.882 | | | 2,517,358 | |
| |
| TOTAL PREFERRED STOCKS | |
| (Cost $8,780,988) | | $ | 8,450,940 | |
| |
| | | | | | | | | | | | | | |
Principal
Amount | | | Interest
Rate | | | Maturity
Date | | | Value | |
|
| Corporate Obligations – 49.6% | |
| Advertising(d)(f) – 0.2% | |
| | Lamar Media Corp. | |
| $ | 600,000 | | | | 3.750 | % | | | 02/15/28 | | | $ | 552,000 | |
| | Outfront Media Capital LLC/Outfront Media Capital Corp. | |
| | 360,000 | | | | 5.000 | | | | 08/15/27 | | | | 341,100 | |
| | Terrier Media Buyer, Inc. | |
| | 2,850,000 | | | | 8.875 | | | | 12/15/27 | | | | 2,337,000 | |
| | | | | | | | | | | | | | |
| | | | | | | | | | | | | 3,230,100 | |
| | |
| Aerospace & Defense(d) – 0.9% | |
| | Arconic, Inc. | |
| | 2,242,000 | | | | 5.400 | | | | 04/15/21 | | | | 2,284,037 | |
| | Boeing Co. | |
| | 3,432,000 | | | | 5.150 | | | | 05/01/30 | | | | 3,432,000 | |
| | 3,432,000 | | | | 5.805 | | | | 05/01/50 | | | | 3,432,000 | |
| | Bombardier, Inc.(f) | |
| | 1,125,000 | | | | 7.500 | | | | 12/01/24 | | | | 745,313 | |
| | 3,301,000 | | | | 7.500 | | | | 03/15/25 | | | | 2,129,145 | |
| | TransDigm, Inc. | |
| | 365,000 | | | | 6.500 | | | | 05/15/25 | | | | 324,850 | |
| | 3,300,000 | | | | 5.500 | (f) | | | 11/15/27 | | | | 2,755,500 | |
| | | | | | | | | | | | | | |
| | | | | | | | | | | | | 15,102,845 | |
| | |
| | |
| The accompanying notes are an integral part of these financial statements. | | 7 |
GOLDMAN SACHS INCOME BUILDER FUND
Schedule of Investments(continued)
April 30, 2020 (Unaudited)
| | | | | | | | | | | | | | |
Principal
Amount | | | Interest
Rate | | | Maturity
Date | | | Value | |
|
| Corporate Obligations – (continued) | |
| Agriculture – 0.7% | |
| | BAT Capital Corp.(d) | |
| $ | 10,000,000 | | | | 4.390 | % | | | 08/15/37 | | | $ | 10,158,100 | |
| | MHP SE | |
| | 330,000 | | | | 7.750 | | | | 05/10/24 | | | | 320,822 | |
| | | | | | | | | | | | | | |
| | | | | | | | | | | | | 10,478,922 | |
| | |
| Airlines(f) – 0.1% | |
| | Air Canada Pass ThroughTrust Series 2013-1, Class B | |
| | 1,617,143 | | | | 5.375 | | | | 05/15/21 | | | | 1,441,586 | |
| | |
| Automotive – 1.2% | |
| | American Axle & Manufacturing, Inc.(d) | |
| | 1,000 | | | | 6.250 | | | | 04/01/25 | | | | 750 | |
| | Cooper Standard Automotive, Inc.(d) | |
| | 1,350,000 | | | | 5.625 | | | | 11/15/26 | | | | 918,000 | |
| | Dealer Tire LLC/DT Issuer LLC(d)(f) | |
| | 2,934,000 | | | | 8.000 | | | | 02/01/28 | | | | 2,046,465 | |
| | Delphi Technologies PLC(f) | |
| | 4,100,000 | | | | 5.000 | | | | 10/01/25 | | | | 3,833,500 | |
| | Ford Motor Co. | |
| | 1,464,000 | | | | 8.500 | | | | 04/21/23 | | | | 1,451,208 | |
| | Ford Motor Credit Co. LLC | |
| | 2,500,000 | | | | 5.875 | | | | 08/02/21 | | | | 2,458,425 | |
| | 1,600,000 | | | | 4.140 | (d) | | | 02/15/23 | | | | 1,476,134 | |
| | 400,000 | | | | 4.687 | (d) | | | 06/09/25 | | | | 354,332 | |
| | General Motors Co.(d) | |
| | 3,000,000 | | | | 6.600 | | | | 04/01/36 | | | | 2,799,900 | |
| | Panther BF Aggregator 2 LP/Panther Finance Co., Inc.(d)(f) | |
| | 1,850,000 | | | | 8.500 | | | | 05/15/27 | | | | 1,567,875 | |
| | The Goodyear Tire & Rubber Co.(d) | |
| | 3,050,000 | | | | 5.125 | | | | 11/15/23 | | | | 2,790,750 | |
| | | | | | | | | | | | | | |
| | | | | | | | | | | | | 19,697,339 | |
| | |
| Banks – 3.6% | |
| | Akbank Turk A/S(d)(e)(5 Year USD Swap + 5.026%) | |
| | 320,000 | | | | 7.200 | | | | 03/16/27 | | | | 292,400 | |
| | Banco do Brasil SA(d)(e)(10 Year CMT + 4.398%) | |
| | 560,000 | | | | 6.250 | | | | 04/15/49 | | | | 462,088 | |
| | Banco Mercantil del Norte SA(d)(e)(f)(5 Year CMT + 4.967%) | |
| | 680,000 | | | | 6.750 | | | | 09/27/49 | | | | 536,860 | |
| Banco Santander Mexico SA Institucion de Banca Multiple Grupo
Financiero Santand(f) |
|
| | 250,000 | | | | 5.375 | | | | 04/17/25 | | | | 256,563 | |
| | Bank of America Corp.(d)(e) (3M USD LIBOR + 3.898%) | |
| | 4,000,000 | | | | 6.100 | | | | 03/17/49 | | | | 4,231,080 | |
| | BBVA Bancomer SA(d)(e)(5 Year CMT + 2.650%) | |
| | 530,000 | | | | 5.125 | | | | 01/18/33 | | | | 453,812 | |
| | BNP Paribas SA(f) | |
| | 2,700,000 | | | | 4.375 | | | | 05/12/26 | | | | 2,884,761 | |
| | CIT Group, Inc.(d) | |
| | 4,025,000 | | | | 5.250 | | | | 03/07/25 | | | | 3,964,625 | |
| | Citigroup, Inc.(d)(e) | |
| | (3M USD LIBOR + 4.517%) | |
| | 1,890,000 | | | | 6.250 | | | | 08/15/49 | | | | 2,010,487 | |
| | (SOFR + 3.914%) | |
| | 900,000 | | | | 4.412 | | | | 03/31/31 | | | | 1,033,875 | |
| | |
|
| Corporate Obligations – (continued) | |
| Banks – (continued) | |
| | Credit Bank of Moscow Via CBOM Finance PLC(f) | |
| 260,000 | | | | 4.700 | | | | 01/29/25 | | | | 247,325 | |
| | Credit Suisse Group AG(d)(e)(f) | |
| | (5 Year CMT + 3.293%) | |
| | 1,150,000 | | | | 5.100 | | | | 01/24/49 | | | | 1,032,154 | |
| | (5 Year USD Swap + 4.598%) | |
| | 4,025,000 | | | | 7.500 | | | | 12/11/49 | | | | 4,236,469 | |
| | Deutsche Bank AG(d)(e) | |
| | (5 year CMT + 4.524%) | |
| | 800,000 | | | | 6.000 | | | | 10/30/49 | | | | 576,000 | |
| | (5 Year USD Swap + 2.248%) | |
| | 2,000,000 | | | | 4.296 | | | | 05/24/28 | | | | 1,795,000 | |
| | FirstRand Bank Ltd.(d)(e)(5 Year USD Swap + 3.561%) | |
| | 320,000 | | | | 6.250 | | | | 04/23/28 | | | | 304,500 | |
| | Grupo Aval Ltd.(d)(f) | |
| | 340,000 | | | | 4.375 | | | | 02/04/30 | | | | 283,050 | |
| | ING Groep NV(d)(e)(5 Year USD Swap + 4.446%) | |
| | 5,000,000 | | | | 6.500 | | | | 04/16/49 | | | | 4,975,000 | |
| | Intesa Sanpaolo SpA(f) | |
| | 8,000,000 | | | | 5.017 | | | | 06/26/24 | | | | 7,850,000 | |
| | Itau Unibanco Holding SA(d)(e)(5 Year CMT + 3.981%) | |
| | 500,000 | | | | 6.125 | | | | 12/12/49 | | | | 463,750 | |
| | JPMorgan Chase & Co.(d)(e) | |
| | (3M USD LIBOR + 3.330%) | |
| | 4,000,000 | | | | 6.125 | | | | 04/30/49 | | | | 4,099,720 | |
| | (3M USD LIBOR + 3.800%) | |
| | 2,700,000 | | | | 5.300 | | | | 08/01/49 | | | | 2,561,544 | |
| | Morgan Stanley, Inc.(d)(e) (3M USD LIBOR + 3.610%) | |
| | 2,731,000 | | | | 4.829 | | | | 07/15/49 | | | | 2,464,727 | |
| | Royal Bank of Scotland Group PLC | |
| | 2,675,000 | | | | 3.875 | | | | 09/12/23 | | | | 2,799,521 | |
| | 2,975,000 | | | | 6.000 | | | | 12/19/23 | | | | 3,231,454 | |
| | Turkiye Vakiflar Bankasi TAO | |
| | 200,000 | | | | 6.000 | | | | 11/01/22 | | | | 186,313 | |
| | UBS Group AG(d)(e)(5 Year USD Swap + 4.590%) | |
| | 4,000,000 | | | �� | 6.875 | | | | 08/07/49 | | | | 4,100,000 | |
| | United Bank for Africa PLC | |
| | 470,000 | | | | 7.750 | | | | 06/08/22 | | | | 414,188 | |
| | | | | | | | | | | | | | |
| | | | | | | | | | | | | 57,747,266 | |
| | |
| Beverages – 0.9% | |
| | Anadolu Efes Biracilik Ve Malt Sanayii A/S | |
| | 350,000 | | | | 3.375 | | | | 11/01/22 | | | | 333,922 | |
| Anheuser-Busch Cos. LLC/Anheuser-Busch InBev Worldwide,
Inc.(d) |
|
| | 3,000,000 | | | | 4.700 | | | | 02/01/36 | | | | 3,328,830 | |
| | Anheuser-Busch InBev Worldwide, Inc.(d) | |
| | 3,000,000 | | | | 4.150 | | | | 01/23/25 | | | | 3,340,260 | |
| | Central American Bottling Corp.(d) | |
| | 480,000 | | | | 5.750 | | | | 01/31/27 | | | | 469,800 | |
| | Constellation Brands, Inc.(d) | |
| | 2,700,000 | | | | 3.700 | | | | 12/06/26 | | | | 2,894,211 | |
| | Keurig Dr Pepper, Inc.(d) | |
| | 2,000,000 | | | | 4.057 | | | | 05/25/23 | | | | 2,142,660 | |
| | 1,055,000 | | | | 3.200 | | | | 05/01/30 | | | | 1,124,968 | |
| | 308,000 | | | | 3.800 | | | | 05/01/50 | | | | 327,715 | |
| | | | | | | | | | | | | | |
| | | | | | | | | | | | | 13,962,366 | |
| | |
| | |
| 8 | | The accompanying notes are an integral part of these financial statements. |
GOLDMAN SACHS INCOME BUILDER FUND
| | | | | | | | | | | | | | |
Principal
Amount | | | Interest
Rate | | | Maturity
Date | | | Value | |
|
| Corporate Obligations – (continued) | |
| Building Materials(d) – 0.8% | |
| | BMC East LLC(f) | |
| $ | 2,750,000 | | | | 5.500 | % | | | 10/01/24 | | | $ | 2,612,500 | |
| | Builders FirstSource, Inc.(f) | |
| | 1,507,000 | | | | 6.750 | | | | 06/01/27 | | | | 1,559,745 | |
| | 940,000 | | | | 5.000 | | | | 03/01/30 | | | | 813,100 | |
| | Cemex SAB de CV | |
| | 490,000 | | | | 5.700 | | | | 01/11/25 | | | | 443,572 | |
| | 230,000 | | | | 7.750 | | | | 04/16/26 | | | | 214,602 | |
| | Cornerstone Building Brands, Inc.(f) | |
| | 2,780,000 | | | | 8.000 | | | | 04/15/26 | | | | 2,335,200 | |
| | Griffon Corp. | |
| | 2,168,000 | | | | 5.750 | | | | 03/01/28 | | | | 2,059,600 | |
| | Masonite International Corp.(f) | |
| | 2,075,000 | | | | 5.375 | | | | 02/01/28 | | | | 1,976,437 | |
| | | | | | | | | | | | | | |
| | | | | | | | | | | | | 12,014,756 | |
| | |
| Chemicals – 0.8% | |
| | Air Products and Chemicals, Inc.(d) | |
| | 484,000 | | | | 2.800 | | | | 05/15/50 | | | | 491,531 | |
| | Ingevity Corp.(d)(f) | |
| | 2,775,000 | | | | 4.500 | | | | 02/01/26 | | | | 2,448,937 | |
| | Kraton Polymers LLC/Kraton Polymers Capital Corp.(d)(f) | |
| | 1,900,000 | | | | 7.000 | | | | 04/15/25 | | | | 1,828,750 | |
| | OCI NV(d)(f) | |
| | 1,250,000 | | | | 5.250 | | | | 11/01/24 | | | | 1,243,750 | |
| | Polyone Corp.(d)(f) | |
| | 1,953,000 | | | | 5.750 | | | | 05/15/25 | | | | 1,977,413 | |
| | PQ Corp.(d)(f) | |
| | 3,400,000 | | | | 6.750 | | | | 11/15/22 | | | | 3,421,250 | |
| | Sasol Financing USA LLC(d) | |
| | 200,000 | | | | 6.500 | | | | 09/27/28 | | | | 131,000 | |
| | WR Grace & Co-Conn(f) | |
| | 1,800,000 | | | | 5.125 | | | | 10/01/21 | | | | 1,811,250 | |
| | | | | | | | | | | | | | |
| | | | | | | | | | | | | 13,353,881 | |
| | |
| Coal(d) – 0.0% | |
| | Mongolian Mining Corp./Energy Resources LLC | |
| | 330,000 | | | | 9.250 | | | | 04/15/24 | | | | 198,413 | |
| | |
| Commercial Services – 1.5% | |
| | Allied Universal Holdco LLC/Allied Universal Finance Corp.(d)(f) | |
| | 2,557,000 | | | | 6.625 | | | | 07/15/26 | | | | 2,643,299 | |
| | 3,020,000 | | | | 9.750 | | | | 07/15/27 | | | | 3,061,525 | |
| GEMS MENASA Cayman Ltd./GEMS Education Delaware
LLC(d)(f) |
|
| | 1,800,000 | | | | 7.125 | | | | 07/31/26 | | | | 1,652,063 | |
| | Global Liman Isletmeleri(d) | |
| | 200,000 | | | | 8.125 | | | | 11/14/21 | | | | 100,125 | |
| | IHS Markit Ltd.(d)(f) | |
| | 5,675,000 | | | | 4.750 | | | | 02/15/25 | | | | 6,144,209 | |
| | Prime Security Services Borrower LLC/Prime Finance, Inc.(f) | |
| | 3,550,000 | | | | 5.250 | | | | 04/15/24 | | | | 3,474,562 | |
| | Refinitiv US Holdings, Inc.(d)(f) | |
| | 3,000,000 | | | | 8.250 | | | | 11/15/26 | | | | 3,258,750 | |
| | Techem Verwaltungsgesellschaft 674 MBH(d) | |
| EUR | 760,000 | | | | 6.000 | | | | 07/30/26 | | | | 830,764 | |
| | |
|
| Corporate Obligations – (continued) | |
| Commercial Services – (continued) | |
| | The ADT Security Corp. | |
| $ | 1,850,000 | | | | 4.125 | | | | 06/15/23 | | | | 1,810,687 | |
| | The Hertz Corp.(d)(f) | |
| | 2,000,000 | | | | 6.000 | | | | 01/15/28 | | | | 360,000 | |
| | | | | | | | | | | | | | |
| | | | | | | | | | | | | 23,335,984 | |
| | |
| Computers(d) – 1.0% | |
| | Banff Merger Sub, Inc.(f) | |
| | 1,000,000 | | | | 9.750 | | | | 09/01/26 | | | | 887,500 | |
| | Dell International LLC/EMC Corp.(f) | |
| | 5,000,000 | | | | 8.100 | | | | 07/15/36 | | | | 6,093,850 | |
| | Hewlett Packard Enterprise Co. | |
| | 3,000,000 | | | | 6.200 | | | | 10/15/35 | | | | 3,557,850 | |
| | Presidio Holdings, Inc.(f) | |
| | 2,095,000 | | | | 8.250 | | | | 02/01/28 | | | | 2,068,812 | |
| | Western Digital Corp. | |
| | 3,000,000 | | | | 4.750 | | | | 02/15/26 | | | | 3,060,000 | |
| | | | | | | | | | | | | | |
| | | | | | | | | | | | | 15,668,012 | |
| | |
| Distribution & Wholesale(d)(f) – 0.8% | |
| | Core & Main Holdings LP(g)(PIK 9.375%, Cash 8.625%) | |
| | 3,000,000 | | | | 8.625 | | | | 09/15/24 | | | | 2,940,000 | |
| | IAA, Inc. | |
| | 750,000 | | | | 5.500 | | | | 06/15/27 | | | | 747,187 | |
| | Performance Food Group, Inc. | |
| | 2,150,000 | | | | 5.500 | | | | 06/01/24 | | | | 2,096,250 | |
| | 1,150,000 | | | | 5.500 | | | | 10/15/27 | | | | 1,086,750 | |
| | Resideo Funding, Inc. | |
| | 3,282,000 | | | | 6.125 | | | | 11/01/26 | | | | 2,878,045 | |
| | Univar Solutions USA, Inc. | |
| | 3,200,000 | | | | 5.125 | | | | 12/01/27 | | | | 3,152,000 | |
| | | | | | | | | | | | | | |
| | | | | | | | | | | | | 12,900,232 | |
| | |
| Diversified Financial Services – 2.8% | |
| | AerCap Holdings NV(d)(e)(5 Year CMT + 4.535%) | |
| | 1,825,000 | | | | 5.875 | | | | 10/10/79 | | | | 1,204,500 | |
| | Air Lease Corp.(d) | |
| | 2,750,000 | | | | 3.750 | | | | 06/01/26 | | | | 2,427,397 | |
| | Ally Financial, Inc. | |
| | 4,000,000 | | | | 8.000 | | | | 11/01/31 | | | | 4,895,000 | |
| | Alpha Holding SA(d)(f) | |
| | 200,000 | | | | 9.000 | | | | 02/10/25 | | | | 136,750 | |
| | Avolon Holdings Funding Ltd.(d)(f) | |
| | 3,450,000 | | | | 5.250 | | | | 05/15/24 | | | | 3,020,716 | |
| | CoBank ACB(d)(e) (3M USD LIBOR + 4.660%) | |
| | 5,350,000 | | | | 6.250 | | | | 10/01/49 | | | | 5,273,120 | |
| | Curo Group Holdings Corp.(d)(f) | |
| | 2,125,000 | | | | 8.250 | | | | 09/01/25 | | | | 1,715,938 | |
| Global Aircraft Leasing Co. Ltd.(d)(f)(g)(PIK 7.250%, Cash
6.500%) |
|
| | 1,750,000 | | | | 6.500 | | | | 09/15/24 | | | | 1,045,625 | |
| | LPL Holdings, Inc.(d)(f) | |
| | 487,000 | | | | 5.750 | | | | 09/15/25 | | | | 480,913 | |
| | 1,350,000 | | | | 4.625 | | | | 11/15/27 | | | | 1,275,750 | |
| | Lukoil Securities BV(f) | |
| | 500,000 | | | | 3.875 | | | | 05/06/30 | | | | 499,063 | |
| | |
| | |
| The accompanying notes are an integral part of these financial statements. | | 9 |
GOLDMAN SACHS INCOME BUILDER FUND
Schedule of Investments(continued)
April 30, 2020 (Unaudited)
| | | | | | | | | | | | | | |
Principal
Amount | | | Interest
Rate | | | Maturity
Date | | | Value | |
|
| Corporate Obligations – (continued) | |
| Diversified Financial Services – (continued) | |
| | Nationstar Mortgage Holdings, Inc.(d)(f) | |
| $ | 3,050,000 | | | | 8.125 | % | | | 07/15/23 | | | $ | 2,928,000 | |
| | Navient Corp. | |
| | 3,000,000 | | | | 5.500 | | | | 01/25/23 | | | | 2,775,000 | |
| | Oilflow SPV 1 DAC | |
| | 551,250 | | | | 12.000 | | | | 01/13/22 | | | | 418,950 | |
| | Park Aerospace Holdings Ltd.(d)(f) | |
| | 2,235,000 | | | | 5.250 | | | | 08/15/22 | | | | 2,048,869 | |
| | Quicken Loans, Inc.(d)(f) | |
| | 2,000,000 | | | | 5.750 | | | | 05/01/25 | | | | 1,957,342 | |
| | Raymond James Financial, Inc.(d) | |
| | 900,000 | | | | 4.650 | | | | 04/01/30 | | | | 1,007,901 | |
| | Springleaf Finance Corp. | |
| | 2,600,000 | | | | 6.125 | | | | 05/15/22 | | | | 2,567,500 | |
| | 3,500,000 | | | | 7.125 | | | | 03/15/26 | | | | 3,268,125 | |
| | 1,800,000 | | | | 5.375 | (d) | | | 11/15/29 | | | | 1,503,000 | |
| | The Charles Schwab Corp.(d)(e) | |
| | (3M USD LIBOR + 3.315%) | |
| | 2,195,000 | | | | 4.625 | | | | 03/01/49 | | | | 2,124,299 | |
| | (5 year CMT + 4.971%) | |
| | 1,250,000 | | | | 5.375 | | | | 06/01/49 | | | | 1,287,725 | |
| | Visa, Inc.(d) | |
| | 450,000 | | | | 2.700 | | | | 04/15/40 | | | | 466,808 | |
| | | | | | | | | | | | | | |
| | | | | | | | | | | | | 44,328,291 | |
| | |
| Electrical – 0.5% | |
| | Calpine Corp.(d)(f) | |
| | 3,100,000 | | | | 4.500 | | | | 02/15/28 | | | | 2,999,250 | |
| | Eskom Holdings SOC Ltd. | |
| | 200,000 | | | | 5.750 | | | | 01/26/21 | | | | 178,500 | |
| | 630,000 | | | | 6.350 | (h) | | | 08/10/28 | | | | 562,472 | |
| | Listrindo Capital B.V.(d) | |
| | 520,000 | | | | 4.950 | | | | 09/14/26 | | | | 486,850 | |
| | LLPL Capital Pte Ltd. | |
| | 442,198 | | | | 6.875 | | | | 02/04/39 | | | | 449,384 | |
| | Minejesa Capital B.V. | |
| | 260,000 | | | | 4.625 | | | | 08/10/30 | | | | 247,000 | |
| | NRG Energy, Inc.(d) | |
| | 2,800,000 | | | | 3.750 | (f) | | | 06/15/24 | | | | 2,871,540 | |
| | 140,000 | | | | 7.250 | | | | 05/15/26 | | | | 150,500 | |
| | 115,000 | | | | 5.750 | | | | 01/15/28 | | | | 123,625 | |
| | | | | | | | | | | | | | |
| | | | | | | | | | | | | 8,069,121 | |
| | |
| Energy-Alternate Sources(d) – 0.1% | |
| | Enviva Partners LP/Enviva Partners Finance Corp.(f) | |
| | 1,400,000 | | | | 6.500 | | | | 01/15/26 | | | | 1,464,750 | |
| | Greenko Dutch B.V. | |
| | 690,000 | | | | 5.250 | | | | 07/24/24 | | | | 608,062 | |
| | | | | | | | | | | | | | |
| | | | | | | | | | | | | 2,072,812 | |
| | |
| Engineering & Construction – 0.1% | |
| | Aeropuertos Dominicanos Siglo XXI SA(d) | |
| | 630,000 | | | | 6.750 | | | | 03/30/29 | | | | 516,600 | |
| | GMR Hyderabad International Airport Ltd. | |
| | 660,000 | | | | 5.375 | | | | 04/10/24 | | | | 568,425 | |
| | IHS Netherlands Holdco B.V.(d)(f) | |
| | 200,000 | | | | 7.125 | | | | 03/18/25 | | | | 180,000 | |
| | |
|
| Corporate Obligations – (continued) | |
| Engineering & Construction – (continued) | |
| | Mexico City Airport Trust(d) | |
| $ | 520,000 | | | | 5.500 | % | | | 10/31/46 | | | $ | 429,406 | |
| | | | | | | | | | | | | | |
| | | | | | | | | | | | | 1,694,431 | |
| | |
| Entertainment(d) – 0.5% | |
| | AMC Entertainment Holdings, Inc. | |
| | 4,200,000 | | | | 5.875 | | | | 11/15/26 | | | | 934,500 | |
| | Banijay Entertainment SASU(f) | |
| | 1,800,000 | | | | 5.375 | | | | 03/01/25 | | | | 1,660,500 | |
| | Motion Bondco DAC(f) | |
| | 3,250,000 | | | | 6.625 | | | | 11/15/27 | | | | 2,591,875 | |
| | Scientific Games International, Inc.(f) | |
| | 1,000,000 | | | | 5.000 | | | | 10/15/25 | | | | 871,250 | |
| | 2,100,000 | | | | 8.250 | | | | 03/15/26 | | | | 1,585,500 | |
| | 500,000 | | | | 7.000 | | | | 05/15/28 | | | | 358,750 | |
| | Vail Resorts, Inc. Co.(f) | |
| | 247,000 | | | | 6.250 | | | | 05/15/25 | | | | 255,645 | |
| | | | | | | | | | | | | | |
| | | | | | | | | | | | | 8,258,020 | |
| | |
| Environmental(d)(f) – 0.3% | |
| | GFL Environmental, Inc. | |
| | 570,000 | | | | 7.000 | | | | 06/01/26 | | | | 598,500 | |
| | 730,000 | | | | 5.125 | | | | 12/15/26 | | | | 757,375 | |
| | 858,000 | | | | 8.500 | | | | 05/01/27 | | | | 933,075 | |
| | Stericycle, Inc. | |
| | 1,950,000 | | | | 5.375 | | | | 07/15/24 | | | | 1,954,875 | |
| | | | | | | | | | | | | | |
| | | | | | | | | | | | | 4,243,825 | |
| | |
| Food & Drug Retailing(d) – 1.4% | |
| Albertsons Cos., Inc./Safeway, Inc./New Albertsons
LP/Albertsons LLC(f) |
|
| | 550,000 | | | | 3.500 | | | | 02/15/23 | | | | 544,500 | |
| | 2,595,000 | | | | 4.625 | | | | 01/15/27 | | | | 2,607,975 | |
| | 1,995,000 | | | | 5.875 | | | | 02/15/28 | | | | 2,064,825 | |
| | 502,000 | | | | 4.875 | | | | 02/15/30 | | | | 507,020 | |
| | Arcor SAIC | |
| | 110,000 | | | | 6.000 | | | | 07/06/23 | | | | 88,275 | |
| | B&G Foods, Inc. | |
| | 4,020,000 | | | | 5.250 | | | | 04/01/25 | | | | 4,070,250 | |
| | Kraft Heinz Foods Co. | |
| | 3,198,000 | | | | 5.000 | | | | 07/15/35 | | | | 3,422,077 | |
| | 2,592,000 | | | | 4.375 | | | | 06/01/46 | | | | 2,458,375 | |
| | Post Holdings, Inc.(f) | |
| | 5,984,000 | | | | 4.625 | | | | 04/15/30 | | | | 5,864,320 | |
| | | | | | | | | | | | | | |
| | | | | | | | | | | | | 21,627,617 | |
| | |
| Food Service(d)(f) – 0.0% | |
| | Aramark Services, Inc. | |
| | 620,000 | | | | 6.375 | | | | 05/01/25 | | | | 641,700 | |
| | |
| Forest Products&Paper(d) – 0.1% | |
| | Mercer International, Inc. | |
| | 1,850,000 | | | | 7.375 | | | | 01/15/25 | | | | 1,792,188 | |
| | |
| Gaming(d)(f) – 0.4% | |
| | Boyd Gaming Corp. | |
| | 2,950,000 | | | | 4.750 | | | | 12/01/27 | | | | 2,540,687 | |
| | |
| | |
| 10 | | The accompanying notes are an integral part of these financial statements. |
GOLDMAN SACHS INCOME BUILDER FUND
| | | | | | | | | | | | | | |
Principal
Amount | | | Interest
Rate | | | Maturity
Date | | | Value | |
|
| Corporate Obligations – (continued) | |
| Gaming(d)(f) – (continued) | |
| | Station Casinos LLC | |
| $ | 3,273,000 | | | | 4.500 | % | | | 02/15/28 | | | $ | 2,618,400 | |
| | Wynn Macau Ltd. | |
| | 550,000 | | | | 5.125 | | | | 12/15/29 | | | | 530,750 | |
| | | | | | | | | | | | | | |
| | | | | | | | | | | | | 5,689,837 | |
| | |
| Gas(d) – 0.3% | |
| | AmeriGas Partners LP/AmeriGas Finance Corp. | |
| | 4,125,000 | | | | 5.875 | | | | 08/20/26 | | | | 4,217,812 | |
| | |
| Health Care Products(d)(f) – 0.0% | |
| | Hill-Rom Holdings, Inc. | |
| | 400,000 | | | | 4.375 | | | | 09/15/27 | | | | 409,000 | |
| | |
| Healthcare Providers & Services – 2.6% | |
| | Centene Corp.(d) | |
| | 2,840,000 | | | | 4.250 | | | | 12/15/27 | | | | 2,817,196 | |
| | 1,500,000 | | | | 3.375 | | | | 02/15/30 | | | | 1,500,000 | |
| | Acadia Healthcare Co., Inc.(d) | |
| | 2,732,000 | | | | 6.500 | | | | 03/01/24 | | | | 2,595,400 | |
| | Centene Corp.(d)(f) | |
| | 2,840,000 | | | | 4.250 | | | | 12/15/27 | | | | 2,970,782 | |
| | 1,500,000 | | | | 3.375 | | | | 02/15/30 | | | | 1,517,070 | |
| | Charles River Laboratories International, Inc.(d)(f) | |
| | 650,000 | | | | 4.250 | | | | 05/01/28 | | | | 655,688 | |
| | CHS/Community Health Systems, Inc.(d) | |
| | 1,990,000 | | | | 6.250 | | | | 03/31/23 | | | | 1,870,600 | |
| | Encompass Health Corp.(d) | |
| | 1,200,000 | | | | 4.500 | | | | 02/01/28 | | | | 1,200,000 | |
| | HCA, Inc. | |
| | 8,870,000 | | | | 5.000 | | | | 03/15/24 | | | | 9,621,910 | |
| | 250,000 | | | | 5.875 | (d) | | | 02/15/26 | | | | 279,375 | |
| | MEDNAX, Inc.(d)(f) | |
| | 3,650,000 | | | | 5.250 | | | | 12/01/23 | | | | 3,477,318 | |
| | Select Medical Corp.(d)(f) | |
| | 1,700,000 | | | | 6.250 | | | | 08/15/26 | | | | 1,623,500 | |
| | Tenet Healthcare Corp. | |
| | 5,600,000 | | | | 8.125 | | | | 04/01/22 | | | | 5,628,000 | |
| | 2,000,000 | | | | 6.250 | (d)(f) | | | 02/01/27 | | | | 1,970,000 | |
| | Universal Health Services, Inc.(d)(f) | |
| | 2,650,000 | | | | 5.000 | | | | 06/01/26 | | | | 2,696,216 | |
| | | | | | | | | | | | | | |
| | | | | | | | | | | | | 40,423,055 | |
| | |
| Holding Companies-Diversified(d) – 0.0% | |
| | KOC Holding A/S | |
| | 700,000 | | | | 6.500 | | | | 03/11/25 | | | | 686,219 | |
| | |
| Home Builders – 0.7% | |
| Brookfield Residential Properties, Inc./Brookfield Residential US
Corp.(d)(f) |
|
| | 1,642,000 | | | | 4.875 | | | | 02/15/30 | | | | 1,354,650 | |
| | Installed Building Products, Inc.(d)(f) | |
| | 800,000 | | | | 5.750 | | | | 02/01/28 | | | | 768,000 | |
| | Lennar Corp.(d) | |
| | 1,825,000 | | | | 4.125 | | | | 01/15/22 | | | | 1,831,844 | |
| | M/I Homes, Inc.(d)(f) | |
| | 1,378,000 | | | | 4.950 | | | | 02/01/28 | | | | 1,212,640 | |
| | |
|
| Corporate Obligations – (continued) | |
| Home Builders – (continued) | |
| | PulteGroup, Inc. | |
| 3,000,000 | | | | 7.875 | | | | 06/15/32 | | | | 3,450,000 | |
| | TRI Pointe Group, Inc.(d) | |
| | 1,850,000 | | | | 5.250 | | | | 06/01/27 | | | | 1,665,000 | |
| | Williams Scotsman International, Inc.(d)(f) | |
| | 1,350,000 | | | | 6.875 | | | | 08/15/23 | | | | 1,358,437 | |
| | | | | | | | | | | | | | |
| | | | | | | | | | | | | 11,640,571 | |
| | |
| Household Products(d) – 0.1% | |
| | Spectrum Brands, Inc. | |
| | 1,800,000 | | | | 5.750 | | | | 07/15/25 | | | | 1,795,500 | |
| | |
| Housewares(d) – 0.0% | |
| | Turkiye Sise ve Cam Fabrikalari A/S | |
| | 530,000 | | | | 6.950 | | | | 03/14/26 | | | | 511,119 | |
| | |
| Insurance – 0.8% | |
| | Acrisure LLC/Acrisure Finance, Inc.(d)(f) | |
| | 1,550,000 | | | | 10.125 | | | | 08/01/26 | | | | 1,565,500 | |
| | Fidelity & Guaranty Life Holdings, Inc.(d)(f) | |
| | 2,850,000 | | | | 5.500 | | | | 05/01/25 | | | | 3,003,187 | |
| | HUB International Ltd.(d)(f) | |
| | 1,760,000 | | | | 7.000 | | | | 05/01/26 | | | | 1,749,000 | |
| | Prudential Financial, Inc.(d)(e) (3M USD LIBOR + 3.920%) | |
| | 4,300,000 | | | | 5.625 | | | | 06/15/43 | | | | 4,438,159 | |
| | Transatlantic Holdings, Inc. | |
| | 75,000 | | | | 8.000 | | | | 11/30/39 | | | | 110,062 | |
| | USI, Inc.(d)(f) | |
| | 1,850,000 | | | | 6.875 | | | | 05/01/25 | | | | 1,854,625 | |
| | | | | | | | | | | | | | |
| | | | | | | | | | | | | 12,720,533 | |
| | |
| Internet – 2.0% | |
| | 21Vianet Group, Inc. | |
| | 400,000 | | | | 7.875 | | | | 10/15/21 | | | | 365,024 | |
| | Booking Holdings, Inc.(d) | |
| | 3,494,000 | | | | 4.100 | | | | 04/13/25 | | | | 3,699,098 | |
| | 2,850,000 | | | | 4.625 | | | | 04/13/30 | | | | 3,158,028 | |
| | Expedia Group, Inc.(d)(f) | |
| | 1,160,000 | | | | 6.250 | | | | 05/01/25 | | | | 1,181,750 | |
| | Getty Images, Inc.(d)(f) | |
| | 250,000 | | | | 9.750 | | | | 03/01/27 | | | | 185,625 | |
| | Go Daddy Operating Co. LLC/GD Finance Co., Inc.(d)(f) | |
| | 1,305,000 | | | | 5.250 | | | | 12/01/27 | | | | 1,340,887 | |
| | GrubHub Holdings, Inc.(d)(f) | |
| | 3,400,000 | | | | 5.500 | | | | 07/01/27 | | | | 3,179,000 | |
| | Match Group, Inc.(d)(f) | |
| | 2,379,000 | | | | 4.125 | | | | 08/01/30 | | | | 2,307,630 | |
| | Netflix, Inc.(d)(f) | |
| | 350,000 | | | | 4.875 | | | | 06/15/30 | | | | 373,625 | |
| | NortonLifeLock, Inc.(d)(f) | |
| | 4,000,000 | | | | 5.000 | | | | 04/15/25 | | | | 4,040,000 | |
| | Twitter, Inc.(d)(f) | |
| | 4,305,000 | | | | 3.875 | | | | 12/15/27 | | | | 4,283,475 | |
| | Uber Technologies, Inc.(d)(f) | |
| | 3,000,000 | | | | 7.500 | | | | 11/01/23 | | | | 3,003,750 | |
| | VeriSign, Inc.(d) | |
| | 4,000,000 | | | | 5.250 | | | | 04/01/25 | | | | 4,369,920 | |
| | | | | | | | | | | | | | |
| | | | | | | | | | | | | 31,487,812 | |
| | |
| | |
| The accompanying notes are an integral part of these financial statements. | | 11 |
GOLDMAN SACHS INCOME BUILDER FUND
Schedule of Investments(continued)
April 30, 2020 (Unaudited)
| | | | | | | | | | | | | | |
Principal
Amount | | | Interest
Rate | | | Maturity
Date | | | Value | |
|
| Corporate Obligations – (continued) | |
| Iron/Steel – 0.2% | |
| | ABJA Investment Co. Pte Ltd. | |
| $ | 650,000 | | | | 5.950 | % | | | 07/31/24 | | | $ | 579,719 | |
| | Cleveland-Cliffs, Inc.(d) | |
| | 1,038,000 | | | | 5.750 | | | | 03/01/25 | | | | 731,790 | |
| | 2,250,000 | | | | 5.875 | | | | 06/01/27 | | | | 1,406,250 | |
| | Vale Overseas Ltd. | |
| | 300,000 | | | | 6.250 | | | | 08/10/26 | | | | 327,300 | |
| | | | | | | | | | | | | | |
| | | | | | | | | | | | | 3,045,059 | |
| | |
| Leisure Time(d)(f) – 0.2% | |
| | Sabre GLBL, Inc. | |
| | 2,405,000 | | | | 9.250 | | | | 04/15/25 | | | | 2,540,281 | |
| | |
| Lodging(d) – 0.0% | |
| | Fortune Star BVI Ltd. | |
| | 340,000 | | | | 5.250 | | | | 03/23/22 | | | | 327,569 | |
| | |
| Machinery-Diversified(d)(f) – 0.0% | |
| | Titan Acquisition Ltd./Titan Co-Borrower LLC | |
| | 588,000 | | | | 7.750 | | | | 04/15/26 | | | | 546,840 | |
| | |
| Media – 4.8% | |
| | Altice Financing SA(d) | |
| | 200,000 | | | | 7.500 | | | | 05/15/26 | | | | 208,500 | |
| | AMC Networks, Inc.(d) | |
| | 1,800,000 | | | | 4.750 | | | | 08/01/25 | | | | 1,651,500 | |
| | CCO Holdings LLC/CCO Holdings Capital Corp.(d)(f) | |
| | 3,000,000 | | | | 5.875 | | | | 05/01/27 | | | | 3,120,000 | |
| | 4,980,000 | | | | 4.750 | | | | 03/01/30 | | | | 5,079,600 | |
| Charter Communications Operating LLC/Charter
Communications Operating Capital(d) |
|
| | 12,000,000 | | | | 6.384 | | | | 10/23/35 | | | | 15,471,000 | |
| | Clear Channel Worldwide Holdings, Inc.(d)(f) | |
| | 2,033,000 | | | | 9.250 | | | | 02/15/24 | | | | 1,692,473 | |
| | CSC Holdings LLC | |
| | 985,000 | | | | 5.250 | | | | 06/01/24 | | | | 1,030,556 | |
| | 5,450,000 | | | | 5.500 | (d)(f) | | | 05/15/26 | | | | 5,613,500 | |
| | Cumulus Media New Holdings, Inc.(d)(f) | |
| | 2,680,000 | | | | 6.750 | | | | 07/01/26 | | | | 2,177,500 | |
| | Diamond Sports Group LLC/Diamond Sports Finance Co.(d)(f) | |
| | 1,590,000 | | | | 5.375 | | | | 08/15/26 | | | | 1,208,400 | |
| | 3,345,000 | | | | 6.625 | | | | 08/15/27 | | | | 1,806,300 | |
| | DISH DBS Corp. | |
| | 6,300,000 | | | | 5.875 | | | | 07/15/22 | | | | 6,315,750 | |
| | Entercom Media Corp.(d)(f) | |
| | 2,300,000 | | | | 7.250 | | | | 11/01/24 | | | | 1,437,500 | |
| | 4,250,000 | | | | 6.500 | | | | 05/01/27 | | | | 3,134,375 | |
| | Gray Television, Inc.(d)(f) | |
| | 2,125,000 | | | | 7.000 | | | | 05/15/27 | | | | 2,140,937 | |
| | iHeartCommunications, Inc.(d)(f) | |
| | 1,450,000 | | | | 5.250 | | | | 08/15/27 | | | | 1,319,500 | |
| | 550,000 | | | | 4.750 | | | | 01/15/28 | | | | 481,250 | |
| | Meredith Corp.(d) | |
| | 2,610,000 | | | | 6.875 | | | | 02/01/26 | | | | 2,218,500 | |
| | Nexstar Broadcasting, Inc.(d)(f) | |
| | 1,500,000 | | | | 5.625 | | | | 07/15/27 | | | | 1,425,000 | |
| | Scripps Escrow, Inc.(d)(f) | |
| | 1,050,000 | | | | 5.875 | | | | 07/15/27 | | | | 887,250 | |
| | |
|
| Corporate Obligations – (continued) | |
| Media – (continued) | |
| | Sinclair Television Group, Inc.(d)(f) | |
| 2,100,000 | | | | 5.875 | | | | 03/15/26 | | | | 1,816,500 | |
| | Sirius XM Radio, Inc.(d)(f) | |
| | 1,085,000 | | | | 4.625 | | | | 07/15/24 | | | | 1,101,275 | |
| | TEGNA, Inc.(d)(f) | |
| | 2,300,000 | | | | 4.625 | | | | 03/15/28 | | | | 2,052,750 | |
| | The E.W. Scripps Co.(d)(f) | |
| | 1,875,000 | | | | 5.125 | | | | 05/15/25 | | | | 1,603,125 | |
| | Videotron Ltd.(d)(f) | |
| | 5,125,000 | | | | 5.375 | | | | 06/15/24 | | | | 5,406,875 | |
| | Virgin Media Secured Finance PLC(d) | |
| GBP | 4,000,000 | | | | 4.875 | | | | 01/15/27 | | | | 4,993,060 | |
| | Ziggo Bond Co. B.V.(d)(f) | |
| EUR | 675,000 | | | | 3.375 | | | | 02/28/30 | | | | 693,926 | |
| $ | 500,000 | | | | 5.125 | | | | 02/28/30 | | | | 492,500 | |
| | | | | | | | | | | | | | |
| | | | | | | | | | | | | 76,579,402 | |
| | |
| Mining – 1.2% | |
| | Constellium SE(d)(f) | |
| | 2,100,000 | | | | 5.875 | | | | 02/15/26 | | | | 1,942,500 | |
| | First Quantum Minerals Ltd.(d)(f) | |
| | 4,000,000 | | | | 7.250 | | | | 04/01/23 | | | | 3,590,000 | |
| | FMG Resources August 2006 Pty Ltd.(d)(f) | |
| | 2,325,000 | | | | 4.750 | | | | 05/15/22 | | | | 2,327,906 | |
| | Freeport-McMoRan, Inc.(d) | |
| | 2,950,000 | | | | 3.875 | | | | 03/15/23 | | | | 2,938,938 | |
| | 2,000,000 | | | | 5.400 | | | | 11/14/34 | | | | 1,860,000 | |
| | Glencore Finance Canada Ltd.(f) | |
| | 3,000,000 | | | | 5.550 | | | | 10/25/42 | | | | 3,066,990 | |
| | Novelis Corp.(d)(f) | |
| | 2,100,000 | | | | 5.875 | | | | 09/30/26 | | | | 2,042,250 | |
| | 2,400,000 | | | | 4.750 | | | | 01/30/30 | | | | 2,136,000 | |
| | Vedanta Resources Finance II PLC(d)(f) | |
| | 200,000 | | | | 9.250 | | | | 04/23/26 | | | | 78,750 | |
| | | | | | | | | | | | | | |
| | | | | | | | | | | | | 19,983,334 | |
| | |
| Office(d) – 0.1% | |
| | CDW LLC/CDW Finance Corp. | |
| | 1,440,000 | | | | 4.125 | | | | 05/01/25 | | | | 1,454,400 | |
| | |
| Oil Field Services – 0.9% | |
| | Antero Resources Corp.(d) | |
| | 6,500,000 | | | | 5.125 | | | | 12/01/22 | | | | 4,290,000 | |
| | Cenovus Energy, Inc.(d) | |
| | 153,000 | | | | 3.000 | | | | 08/15/22 | | | | 135,338 | |
| | 1,412,000 | | | | 3.800 | | | | 09/15/23 | | | | 1,180,517 | |
| | Chesapeake Energy Corp. | |
| | 2,000,000 | | | | 5.500 | | | | 09/15/26 | | | | 100,000 | |
| | Compania General Combust(d) | |
| | 590,000 | | | | 9.500 | | | | 11/07/21 | | | | 364,694 | |
| | DNO ASA(d)(f) | |
| | 420,000 | | | | 8.375 | | | | 05/29/24 | | | | 273,420 | |
| | Ensign Drilling, Inc.(d)(f) | |
| | 1,400,000 | | | | 9.250 | | | | 04/15/24 | | | | 406,000 | |
| | Geopark Ltd.(d)(f) | |
| | 200,000 | | | | 5.500 | | | | 01/17/27 | | | | 125,375 | |
| | |
| | |
| 12 | | The accompanying notes are an integral part of these financial statements. |
GOLDMAN SACHS INCOME BUILDER FUND
| | | | | | | | | | | | | | |
Principal
Amount | | | Interest
Rate | | | Maturity
Date | | | Value | |
|
| Corporate Obligations – (continued) | |
| Oil Field Services – (continued) | |
| | Kosmos Energy Ltd.(d) | |
| $ | 500,000 | | | | 7.125 | % | | | 04/04/26 | | | $ | 306,563 | |
| | Laredo Petroleum, Inc.(d) | |
| | 2,213,000 | | | | 9.500 | | | | 01/15/25 | | | | 951,590 | |
| | MEG Energy Corp.(d)(f) | |
| | 2,480,000 | | | | 7.125 | | | | 02/01/27 | | | | 1,698,800 | |
| | Nabors Industries Ltd.(d)(f) | |
| | 840,000 | | | | 7.250 | | | | 01/15/26 | | | | 344,400 | |
| | Nexen, Inc. | |
| | 5,000 | | | | 6.400 | | | | 05/15/37 | | | | 6,973 | |
| | 50,000 | | | | 7.500 | | | | 07/30/39 | | | | 80,094 | |
| | Noble Holding International Ltd.(d) | |
| | 840,000 | | | | 7.750 | | | | 01/15/24 | | | | 2,100 | |
| | 1,975,000 | | | | 7.875 | (f) | | | 02/01/26 | | | | 459,187 | |
| | Petrobras Global Finance B.V.(i) | |
| | 500,000 | | | | 6.850 | | | | 06/05/15 | | | | 467,500 | |
| | Petroleos Mexicanos | |
| EUR | 220,000 | | | | 2.500 | | | | 08/21/21 | | | | 228,279 | |
| | Range Resources Corp.(d) | |
| $ | 846,000 | | | | 5.875 | | | | 07/01/22 | | | | 761,400 | |
| | Sunoco LP/Sunoco Finance Corp.(d) | |
| | 545,000 | | | | 5.500 | | | | 02/15/26 | | | | 523,200 | |
| | Tecpetrol SA(d) | |
| | 770,000 | | | | 4.875 | | | | 12/12/22 | | | | 593,862 | |
| | Transocean, Inc.(d)(f) | |
| | 2,070,000 | | | | 8.000 | | | | 02/01/27 | | | | 786,600 | |
| USA Compression Partners LP/USA Compression Finance
Corp.(d) |
|
| | 1,300,000 | | | | 6.875 | | | | 04/01/26 | | | | 1,066,000 | |
| | | | | | | | | | | | | | |
| | | | | | | | | | | | | 15,151,892 | |
| | |
| Packaging – 2.0% | |
| | ARD Finance SA(d)(g) (PIK 5.750%, Cash 5.000%) | |
| EUR | 1,850,000 | | | | 5.000 | | | | 06/30/27 | | | | 1,824,590 | |
| | (PIK 7.250%, Cash 6.500%) | |
| $ | 3,950,000 | | | | 6.500 | (f) | | | 06/30/27 | | | | 3,693,250 | |
| | Ardagh Packaging Finance PLC/Ardagh Holdings USA, Inc.(d)(f) | |
| | 6,000,000 | | | | 6.000 | | | | 02/15/25 | | | | 5,970,000 | |
| | 650,000 | | | | 5.250 | | | | 08/15/27 | | | | 631,312 | |
| | Berry Global, Inc.(d)(f) | |
| | 2,200,000 | | | | 4.500 | | | | 02/15/26 | | | | 2,172,500 | |
| | 2,000,000 | | | | 5.625 | | | | 07/15/27 | | | | 2,065,000 | |
| | Graphic Packaging International LLC(f) | |
| | 646,000 | | | | 3.500 | | | | 03/15/28 | | | | 616,930 | |
| | LABL Escrow Issuer LLC(d)(f) | |
| | 1,750,000 | | | | 6.750 | | | | 07/15/26 | | | | 1,758,750 | |
| | Mauser Packaging Solutions Holding Co.(d)(f) | |
| | 2,150,000 | | | | 5.500 | | | | 04/15/24 | | | | 1,978,000 | |
| | 965,000 | | | | 7.250 | | | | 04/15/25 | | | | 753,906 | |
| | Owens-Brockway Glass Container, Inc.(f) | |
| | 1,750,000 | | | | 5.875 | | | | 08/15/23 | | | | 1,811,250 | |
| Reynolds Group Issuer, Inc./Reynolds Group Issuer
LLC/Reynolds Group Issuer Lu(d)(f) |
|
| | 190,000 | | | | 7.000 | | | | 07/15/24 | | | | 190,475 | |
| | |
|
| Corporate Obligations – (continued) | |
| Packaging – (continued) | |
| | Sealed Air Corp.(f) | |
| 2,000,000 | | | | 5.250 | (d) | | | 04/01/23 | | | | 2,060,000 | |
| | 1,300,000 | | | | 4.000 | (d) | | | 12/01/27 | | | | 1,280,500 | |
| | 1,843,000 | | | | 6.875 | | | | 07/15/33 | | | | 2,029,604 | |
| | Trivium Packaging Finance B.V.(d)(f) | |
| | 1,075,000 | | | | 5.500 | | | | 08/15/26 | | | | 1,101,875 | |
| | 1,300,000 | | | | 8.500 | | | | 08/15/27 | | | | 1,353,625 | |
| | | | | | | | | | | | | | |
| | | | | | | | | | | | | 31,291,567 | |
| | |
| Pharmaceuticals(d) – 1.7% | |
| | Bausch Health Cos., Inc.(f) | |
| | 65,000 | | | | 5.875 | | | | 05/15/23 | | | | 64,025 | |
| | 4,000,000 | | | | 9.000 | | | | 12/15/25 | | | | 4,340,000 | |
| | 1,350,000 | | | | 5.000 | | | | 01/30/28 | | | | 1,296,000 | |
| | 1,350,000 | | | | 5.250 | | | | 01/30/30 | | | | 1,336,500 | |
| | Becton Dickinson & Co. | |
| | 2,000,000 | | | | 2.894 | | | | 06/06/22 | | | | 2,049,740 | |
| | 3,375,000 | | | | 3.363 | | | | 06/06/24 | | | | 3,593,633 | |
| | CVS Health Corp. | |
| | 2,775,000 | | | | 3.700 | | | | 03/09/23 | | | | 2,942,499 | |
| | 4,715,000 | | | | 3.750 | | | | 04/01/30 | | | | 5,230,995 | |
| | HLF Financing S.a.r.l. LLC/Herbalife International, Inc.(f) | |
| | 2,745,000 | | | | 7.250 | | | | 08/15/26 | | | | 2,662,650 | |
| | Mylan NV | |
| | 3,000,000 | | | | 3.950 | | | | 06/15/26 | | | | 3,175,500 | |
| | Vizient, Inc.(f) | |
| | 580,000 | | | | 6.250 | | | | 05/15/27 | | | | 604,650 | |
| | | | | | | | | | | | | | |
| | | | | | | | | | | | | 27,296,192 | |
| | |
| Pipelines – 3.1% | |
| | Buckeye Partners LP(d) | |
| | 2,100,000 | | | | 4.350 | | | | 10/15/24 | | | | 1,937,649 | |
| | 1,835,000 | | | | 4.125 | (f) | | | 03/01/25 | | | | 1,697,375 | |
| | 2,801,000 | | | | 3.950 | | | | 12/01/26 | | | | 2,489,389 | |
| | 929,000 | | | | 4.125 | | | | 12/01/27 | | | | 833,778 | |
| | 1,217,000 | | | | 4.500 | (f) | | | 03/01/28 | | | | 1,095,300 | |
| | Cheniere Energy Partners LP(d)(f) | |
| | 1,800,000 | | | | 4.500 | | | | 10/01/29 | | | | 1,656,000 | |
| | DCP Midstream Operating LP(f) | |
| | 4,000,000 | | | | 6.750 | | | | 09/15/37 | | | | 2,360,000 | |
| | Energy Transfer Operating LP | |
| | 4,000,000 | | | | 4.250 | (d) | | | 03/15/23 | | | | 3,964,600 | |
| | 2,985,000 | | | | 6.625 | | | | 10/15/36 | | | | 2,956,075 | |
| Enterprise Products Operating LLC(d)(e) (3M USD LIBOR +
2.778%) |
|
| | 1,000,000 | | | | 4.358 | | | | 06/01/67 | | | | 774,610 | |
| | Genesis Energy LP/Genesis Energy Finance Corp.(d) | |
| | 3,500,000 | | | | 6.000 | | | | 05/15/23 | | | | 3,062,500 | |
| | 2,010,000 | | | | 7.750 | | | | 02/01/28 | | | | 1,708,500 | |
| | Kinder Morgan Energy Partners LP | |
| | 7,000,000 | | | | 7.300 | | | | 08/15/33 | | | | 8,746,570 | |
| | NGPL PipeCo LLC(d)(f) | |
| | 1,315,000 | | | | 4.375 | | | | 08/15/22 | | | | 1,318,866 | |
| | Plains All American Pipeline LP/PAA Finance Corp.(d) | |
| | 3,000,000 | | | | 3.600 | | | | 11/01/24 | | | | 2,824,590 | |
| | |
| | |
| The accompanying notes are an integral part of these financial statements. | | 13 |
GOLDMAN SACHS INCOME BUILDER FUND
Schedule of Investments(continued)
April 30, 2020 (Unaudited)
| | | | | | | | | | | | | | |
Principal
Amount | | | Interest
Rate | | | Maturity
Date | | | Value | |
|
| Corporate Obligations – (continued) | |
| Pipelines – (continued) | |
| Targa Resources Partners LP/Targa Resources Partners Finance
Corp.(d) |
|
| $ | 5,000,000 | | | | 5.125 | % | | | 02/01/25 | | | $ | 4,500,000 | |
| | The Williams Cos., Inc. | |
| | 7,000,000 | | | | 7.500 | | | | 01/15/31 | | | | 8,180,410 | |
| | | | | | | | | | | | | | |
| | | | | | | | | | | | | 50,106,212 | |
| | |
| Real Estate Investment Trust – 1.9% | |
| | American Tower Corp. | |
| | 2,250,000 | | | | 5.000 | | | | 02/15/24 | | | | 2,516,602 | |
| Brookfield Property REIT, Inc./BPR Cumulus LLC/BPR Nimbus
LLC/GGSI Sellco LL(d)(f) |
|
| | 600,000 | | | | 5.750 | | | | 05/15/26 | | | | 482,026 | |
| | Country Garden Holdings Co. Ltd.(d) | |
| | 650,000 | | | | 6.500 | | | | 04/08/24 | | | | 657,719 | |
| | Crown Castle International Corp. | |
| | 2,250,000 | | | | 5.250 | | | | 01/15/23 | | | | 2,457,697 | |
| | 300,000 | | | | 4.150 | (d) | | | 07/01/50 | | | | 349,917 | |
| | Growthpoint Properties International Pty Ltd. | |
| | 270,000 | | | | 5.872 | | | | 05/02/23 | | | | 254,644 | |
| | IRSA Propiedades Comerciales SA(d) | |
| | 540,000 | | | | 8.750 | | | | 03/23/23 | | | | 265,262 | |
| | Kaisa Group Holdings Ltd. | |
| | 320,000 | | | | 11.750 | | | | 02/26/21 | | | | 321,900 | |
| Ladder Capital Finance Holdings LLLP/Ladder Capital Finance
Corp.(d)(f) |
|
| | 2,500,000 | | | | 5.875 | | | | 08/01/21 | | | | 2,215,625 | |
| | 4,000,000 | | | | 5.250 | | | | 03/15/22 | | | | 3,300,000 | |
| | 2,027,000 | | | | 4.250 | | | | 02/01/27 | | | | 1,449,305 | |
| | MPT Operating Partnership LP/MPT Finance Corp.(d) | |
| | 4,000,000 | | | | 6.375 | | | | 03/01/24 | | | | 4,128,280 | |
| | 3,000,000 | | | | 5.000 | | | | 10/15/27 | | | | 3,059,160 | |
| | NE Property B.V.(d) | |
| EUR | 470,000 | | | | 1.750 | | | | 11/23/24 | | | | 444,713 | |
| | Realogy Group LLC/Realogy Co-Issuer Corp.(d)(f) | |
| $ | 1,600,000 | | | | 4.875 | | | | 06/01/23 | | | | 1,216,000 | |
| | 1,950,000 | | | | 9.375 | | | | 04/01/27 | | | | 1,365,000 | |
| | SBA Communications Corp.(d)(f) | |
| | 2,637,000 | | | | 3.875 | | | | 02/15/27 | | | | 2,689,740 | |
| | Scenery Journey Ltd.(d) | |
| | 310,000 | | | | 13.000 | | | | 11/06/22 | | | | 284,425 | |
| | Starwood Property Trust, Inc.(d) | |
| | 2,700,000 | | | | 4.750 | | | | 03/15/25 | | | | 2,281,500 | |
| | VICI Properties LP/VICI Note Co., Inc.(d)(f) | |
| | 1,526,000 | | | | 3.500 | | | | 02/15/25 | | | | 1,436,348 | |
| | | | | | | | | | | | | | |
| | | | | | | | | | | | | 31,175,863 | |
| | |
| Retailing – 1.9% | |
| | 1011778 BC ULC/New Red Finance, Inc.(d)(f) | |
| | 3,000,000 | | | | 5.000 | | | | 10/15/25 | | | | 3,007,500 | |
| | Asbury Automotive Group, Inc.(d)(f) | |
| | 246,000 | | | | 4.500 | | | | 03/01/28 | | | | 203,565 | |
| | Beacon Roofing Supply, Inc.(d)(f) | |
| | 2,907,000 | | | | 4.875 | | | | 11/01/25 | | | | 2,558,160 | |
| | Burlington Coat Factory Warehouse Corp.(d)(f) | |
| | 684,000 | | | | 6.250 | | | | 04/15/25 | | | | 695,970 | |
| | |
|
| Corporate Obligations – (continued) | |
| Retailing – (continued) | |
| | eG Global Finance PLC(d)(f) | |
| 3,800,000 | | | | 6.750 | | | | 02/07/25 | | | | 3,458,000 | |
| | Eurotorg LLC Via Bonitron DAC | |
| | 410,000 | | | | 8.750 | | | | 10/30/22 | | | | 395,778 | |
| | IRB Holding Corp.(d)(f) | |
| | 2,710,000 | | | | 6.750 | | | | 02/15/26 | | | | 2,235,750 | |
| | Lowe’s Cos., Inc.(d) | |
| | 7,237,000 | | | | 5.125 | | | | 04/15/50 | | | | 9,415,771 | |
| | PetSmart, Inc.(d)(f) | |
| | 2,800,000 | | | | 5.875 | | | | 06/01/25 | | | | 2,814,000 | |
| | Suburban Propane Partners LP/Suburban Energy Finance Corp.(d) | |
| | 550,000 | | | | 5.500 | | | | 06/01/24 | | | | 541,750 | |
| | The Home Depot, Inc.(d) | |
| | 1,170,000 | | | | 3.350 | | | | 04/15/50 | | | | 1,290,031 | |
| | Yum! Brands, Inc.(d)(f) | |
| | 63,000 | | | | 7.750 | | | | 04/01/25 | | | | 68,985 | |
| | 3,064,000 | | | | 4.750 | | | | 01/15/30 | | | | 3,125,280 | |
| | | | | | | | | | | | | | |
| | | | | | | | | | | | | 29,810,540 | |
| | |
| Semiconductors – 0.9% | |
| | Amkor Technology, Inc.(d)(f) | |
| | 1,398,000 | | | | 6.625 | | | | 09/15/27 | | | | 1,446,930 | |
| | Broadcom, Inc.(d)(f) | |
| | 4,000,000 | | | | 3.625 | | | | 10/15/24 | | | | 4,215,160 | |
| | 3,117,000 | | | | 5.000 | | | | 04/15/30 | | | | 3,497,492 | |
| | Microchip Technology, Inc. | |
| | 2,000,000 | | | | 3.922 | | | | 06/01/21 | | | | 2,032,144 | |
| | NXP BV/NXP Funding LLC(f) | |
| | 3,000,000 | | | | 4.125 | | | | 06/01/21 | | | | 3,064,050 | |
| | Qorvo, Inc.(d)(f) | |
| | 750,000 | | | | 4.375 | | | | 10/15/29 | | | | 746,250 | |
| | | | | | | | | | | | | | |
| | | | | | | | | | | | | 15,002,026 | |
| | |
| Software(d) – 0.8% | |
| | Castle US Holding Corp.(f) | |
| | 2,824,000 | | | | 9.500 | | | | 02/15/28 | | | | 2,640,440 | |
| | Fiserv, Inc. | |
| | 2,775,000 | | | | 3.200 | | | | 07/01/26 | | | | 2,972,746 | |
| | Nuance Communications, Inc. | |
| | 3,000,000 | | | | 5.625 | | | | 12/15/26 | | | | 3,157,500 | |
| | Open Text Corp.(f) | |
| | 1,105,000 | | | | 3.875 | | | | 02/15/28 | | | | 1,071,850 | |
| | Oracle Corp. | |
| | 1,405,000 | | | | 3.600 | | | | 04/01/50 | | | | 1,594,394 | |
| | PTC, Inc.(f) | |
| | 4,000 | | | | 3.625 | | | | 02/15/25 | | | | 3,950 | |
| | SS&C Technologies, Inc.(f) | |
| | 850,000 | | | | 5.500 | | | | 09/30/27 | | | | 875,500 | |
| | | | | | | | | | | | | | |
| | | | | | | | | | | | | 12,316,380 | |
| | |
| Technology – Hardware(d)(f) – 0.1% | |
| | NXP BV | |
| | 982,000 | | | | 3.400 | | | | 05/01/30 | | | | 985,604 | |
| | |
| Telecommunication Services – 4.5% | |
| | Altice France SA(d)(f) | |
| | 5,000,000 | | | | 7.375 | | | | 05/01/26 | | | | 5,250,000 | |
| | |
| | |
| 14 | | The accompanying notes are an integral part of these financial statements. |
GOLDMAN SACHS INCOME BUILDER FUND
| | | | | | | | | | | | | | |
Principal
Amount | | | Interest
Rate | | | Maturity
Date | | | Value | |
|
| Corporate Obligations – (continued) | |
| Telecommunication Services – (continued) | |
| | AT&T, Inc.(d) | |
| $ | 3,000,000 | | | | 5.250 | % | | | 03/01/37 | | | $ | 3,553,770 | |
| | CenturyLink, Inc. | |
| | 1,450,000 | | | | 5.125 | (d)(f) | | | 12/15/26 | | | | 1,386,563 | |
| | 2,870,000 | | | | 7.650 | | | | 03/15/42 | | | | 2,905,875 | |
| | Cincinnati Bell, Inc.(d)(f) | |
| | 2,000,000 | | | | 7.000 | | | | 07/15/24 | | | | 2,000,000 | |
| | CommScope, Inc.(d)(f) | |
| | 2,675,000 | | | | 5.500 | | | | 06/15/24 | | | | 2,380,750 | |
| | 1,100,000 | | | | 6.000 | | | | 03/01/26 | | | | 1,100,000 | |
| | Digicel Group Two Ltd.(d)(f) | |
| | 1,845,000 | | | | 8.250 | | | | 09/30/22 | | | | 55,488 | |
| | Intelsat Jackson Holdings SA(d)(f) | |
| | 4,800,000 | | | | 8.000 | | | | 02/15/24 | | | | 4,896,000 | |
| | 3,000,000 | | | | 8.500 | | | | 10/15/24 | | | | 1,725,000 | |
| | MTN Mauritius Investments Ltd. | |
| | 420,000 | | | | 6.500 | | | | 10/13/26 | | | | 403,069 | |
| | Nokia of America Corp. | |
| | 3,000,000 | | | | 6.450 | | | | 03/15/29 | | | | 3,097,500 | |
| | Qwest Corp. | |
| | 4,780,000 | | | | 6.750 | | | | 12/01/21 | | | | 4,994,813 | |
| | Sprint Capital Corp. | |
| | 1,150,000 | | | | 8.750 | | | | 03/15/32 | | | | 1,618,625 | |
| | Sprint Corp. | |
| | 10,039,000 | | | | 7.875 | | | | 09/15/23 | | | | 11,281,326 | |
| | T-Mobile USA, Inc.(d) | |
| | 3,000,000 | | | | 4.000 | | | | 04/15/22 | | | | 3,063,750 | |
| | 6,000,000 | | | | 6.500 | | | | 01/15/26 | | | | 6,322,500 | |
| | 1,896,000 | | | | 4.500 | (f) | | | 04/15/50 | | | | 2,193,994 | |
| | Telecom Argentina SA(d) | |
| | 340,000 | | | | 6.500 | | | | 06/15/21 | | | | 307,700 | |
| | 310,000 | | | | 8.000 | (f) | | | 07/18/26 | | | | 248,291 | |
| | Telecom Italia Capital SA | |
| | 3,025,000 | | | | 7.200 | | | | 07/18/36 | | | | 3,353,969 | |
| | 1,000,000 | | | | 7.721 | | | | 06/04/38 | | | | 1,151,250 | |
| | Telecom Italia SpA(f) | |
| | 5,000,000 | | | | 5.303 | | | | 05/30/24 | | | | 5,168,750 | |
| | Verizon Communications, Inc. | |
| | 3,000,000 | | | | 5.250 | | | | 03/16/37 | | | | 3,986,040 | |
| | | | | | | | | | | | | | |
| | | | | | | | | | | | | 72,445,023 | |
| | |
| Toys/Games/Hobbies(d) – 0.1% | |
| | Mattel, Inc. | |
| | 2,475,000 | | | | 3.150 | | | | 03/15/23 | | | | 2,301,750 | |
| | |
| Transportation – 0.0% | |
| | MV24 Capital B.V.(f) | |
| | 335,260 | | | | 6.748 | | | | 06/01/34 | | | | 282,771 | |
| | Rumo Luxembourg S.a.r.l.(d) | |
| | 240,000 | | | | 5.875 | | | | 01/18/25 | | | | 236,700 | |
| | | | | | | | | | | | | | |
| | | | | | | | | | | | | 519,471 | |
| | |
| | TOTAL CORPORATE OBLIGATIONS | |
| | (Cost $835,989,547) | | | | | | | $ | 794,320,570 | |
| | |
|
| Mortgage-Backed Obligations(e) – 0.0% | |
| Collateralized Mortgage Obligation – 0.0% | |
| Sequential Floating Rate – 0.0% | |
| Merrill Lynch Alternative Note Asset TrustSeries 2007-OAR3,
Class A1 (1M LIBOR + 0.190%) |
|
| $ | 225,391 | | | | 1.137 | % | | | 07/25/47 | | | $ | 186,197 | |
| | (Cost $87,339) | |
| | |
| | |
|
| Foreign Debt Obligations – 0.2% | |
| Sovereign – 0.2% | |
| | Ecuador Government International Bond | |
| $ | 490,000 | | | | 10.750 | % | | | 03/28/22 | | | $ | 153,125 | |
| | 330,000 | | | | 7.950 | | | | 06/20/24 | | | | 102,630 | |
| | Republic of Angola | |
| | 300,000 | | | | 9.500 | | | | 11/12/25 | | | | 141,750 | |
| | Republic of Argentina | |
| | 380,000 | | | | 4.625 | | | | 01/11/23 | | | | 106,756 | |
| | Republic of Egypt | |
| EUR | 590,000 | | | | 4.750 | | | | 04/11/25 | | | | 566,945 | |
| | Republic of Nigeria | |
| $ | 690,000 | | | | 6.500 | | | | 11/28/27 | | | | 519,872 | |
| | Republic of Sri Lanka(f) | |
| | 630,000 | | | | 6.350 | | | | 06/28/24 | | | | 371,658 | |
| | Republic of Turkey | |
| | 760,000 | | | | 6.125 | | | | 10/24/28 | | | | 692,550 | |
| | Ukraine Government Bond | |
| | 680,000 | | | | 7.750 | | | | 09/01/23 | | | | 644,300 | |
| | |
| | TOTAL FOREIGN DEBT OBLIGATIONS | |
| | (Cost $4,655,071) | | | | | | | $ | 3,299,586 | |
| | |
| | | | | | | | | | | | | | |
|
| Bank Loans(e)(j) – 6.7% | |
| Aerospace – 0.2% | |
| | TransDigm, Inc. (1M LIBOR + 2.250%) | |
| $ | 4,261,511 | | | | 2.654 | % | | | 12/09/25 | | | $ | 3,720,171 | |
| | |
| Automotive – 0.1% | |
| | Adient US LLC (3M LIBOR + 4.000%) | |
| | 1,955,287 | | | | 6.889 | | | | 05/06/24 | | | | 1,753,658 | |
| | |
| Automotive – Parts – 0.2% | |
| | Tenneco, Inc. (1M LIBOR + 3.000%) | |
| | 4,463,699 | | | | 3.404 | | | | 10/01/25 | | | | 3,453,787 | |
| | |
| Chemicals – 0.3% | |
| | Momentive Performance Materials, Inc. (1M LIBOR + 3.250%) | |
| | 2,133,875 | | | | 3.660 | | | | 05/15/24 | | | | 1,896,097 | |
| | Starfruit Finco B.V. (1M LIBOR + 3.000%) | |
| | 2,893,963 | | | | 3.864 | | | | 10/01/25 | | | | 2,619,037 | |
| | | | | | | | | | | | | | |
| | | | | | | | | | | | | 4,515,134 | |
| | |
| Diversified Financial Services – 0.0% | |
| | Fiserv Investment Solutions, Inc. (3M LIBOR + 5.500%) | |
| | 650,000 | | | | 6.442 | | | | 02/18/27 | | | | 617,500 | |
| | |
| | |
| The accompanying notes are an integral part of these financial statements. | | 15 |
GOLDMAN SACHS INCOME BUILDER FUND
Schedule of Investments(continued)
April 30, 2020 (Unaudited)
| | | | | | | | | | | | | | |
Principal
Amount | | | Interest
Rate | | | Maturity
Date | | | Value | |
|
| Bank Loans(e)(j) – (continued) | |
| Environmental – 0.1% | |
| | Advanced Disposal Services, Inc. (1 Week LIBOR + 2.250%) | |
| $ | 1,957,405 | | | | 3.000 | % | | | 11/10/23 | | | $ | 1,930,764 | |
| | |
| Food & Drug Retailers – 0.1% | |
| | B&G Foods, Inc. (1M LIBOR + 2.500%) | |
| | 746,250 | | | | 2.904 | | | | 10/10/26 | | | | 719,669 | |
| | |
| Health Care – Services – 0.4% | |
| | MPH Acquisition Holdings LLC (3M LIBOR + 2.750%) | |
| | 1,928,826 | | | | 4.200 | | | | 06/07/23 | | | | 1,770,913 | |
| | Sotera Health Holdings LLC (1M LIBOR + 4.500%) | |
| | 1,984,733 | | | | 5.500 | | | | 12/13/26 | | | | 1,902,366 | |
| | U.S. Renal Care, Inc. (1M LIBOR + 5.000%) | |
| | 2,189,000 | | | | 5.438 | | | | 06/26/26 | | | | 2,063,811 | |
| | Verscend Holding Corp. (1M LIBOR + 4.500%) | |
| | 1,379,000 | | | | 4.904 | | | | 08/27/25 | | | | 1,295,915 | |
| | | | | | | | | | | | | | |
| | | | | | | | | | | | | 7,033,005 | |
| | |
| Home Construction – 0.1% | |
| | Brookfield Residential Properties, Inc. (1M LIBOR + 2.250%) | |
| | 2,037,890 | | | | 2.654 | | | | 08/28/23 | | | | 1,732,206 | |
| | |
| Media – Broadcasting & Radio – 0.2% | |
| | Cumulus Media New Holdings, Inc. (6M LIBOR + 3.750%) | |
| | 920,375 | | | | 4.822 | | | | 03/31/26 | | | | 771,578 | |
| | Getty Images, Inc. (1M LIBOR + 4.500%) | |
| | 1,953,846 | | | | 4.938 | | | | 02/19/26 | | | | 1,636,346 | |
| | | | | | | | | | | | | | |
| | | | | | | | | | | | | 2,407,924 | |
| | |
| Media – Cable – 0.3% | |
| | CSC Holdings LLC | |
| | (1M LIBOR + 2.250%) | |
| | 1,702,805 | | | | 3.064 | | | | 07/17/25 | | | | 1,617,392 | |
| | (1M LIBOR + 2.500%) | |
| | 3,792,370 | | | | 3.314 | | | | 04/15/27 | | | | 3,603,434 | |
| | | | | | | | | | | | | | |
| | | | | | | | | | | | | 5,220,826 | |
| | |
| Media – Non Cable – 0.1% | |
| | Terrier Media Buyer, Inc. (3M LIBOR + 4.250%) | |
| | 1,197,000 | | | | 5.700 | | | | 12/17/26 | | | | 1,110,218 | |
| | |
| Packaging – 0.3% | |
| | Flex Acquisition Co., Inc. (3M LIBOR + 3.250%) | |
| | 2,800,000 | | | | 4.683 | | | | 06/29/25 | | | | 2,606,800 | |
| | Reynolds Group Holdings, Inc. (1M LIBOR + 2.750%) | |
| | 2,954,169 | | | | 3.154 | | | | 02/05/23 | | | | 2,810,774 | |
| | | | | | | | | | | | | | |
| | | | | | | | | | | | | 5,417,574 | |
| | |
| Pharmaceuticals – 0.7% | |
| | Alphabet Holding Co., Inc. (1M LIBOR + 7.750%) | |
| | 5,000,000 | | | | 8.154 | | | | 09/26/25 | | | | 3,970,850 | |
| Valeant Pharmaceuticals International, Inc. (1M LIBOR +
3.000%) |
|
| | 7,124,112 | | | | 3.718 | | | | 06/02/25 | | | | 6,883,673 | |
| | | | | | | | | | | | | | |
| | | | | | | | | | | | | 10,854,523 | |
| | |
| Restaurants – 0.0% | |
| | 1011778 B.C. Unlimited Liability Co. (1M LIBOR + 1.750%) | |
| | 452,569 | | | | 2.154 | | | | 11/19/26 | | | | 423,293 | |
| | |
|
| Bank Loans(e)(j) – (continued) | |
| Retailers – 0.2% | |
| | OEConnection LLC (3M LIBOR + 4.000%) | |
| 2,067,640 | | | | 4.941 | | | | 09/25/26 | | | | 1,819,523 | |
| | Staples, Inc. (1M LIBOR + 5.000%) | |
| | 1,588,000 | | | | 6.016 | | | | 04/16/26 | | | | 1,259,808 | |
| | | | | | | | | | | | | | |
| | | | | | | | | | | | | 3,079,331 | |
| | |
| Services Cyclical – Business Services – 0.3% | |
| | EVO Payments International LLC (1M LIBOR + 3.250%) | |
| | 2,954,774 | | | | 3.690 | | | | 12/22/23 | | | | 2,727,256 | |
| | Travelport Finance S.a.r.l. (3M LIBOR + 5.000%) | |
| | 3,084,500 | | | | 6.072 | | | | 05/29/26 | | | | 1,869,978 | |
| | | | | | | | | | | | | | |
| | | | | | | | | | | | | 4,597,234 | |
| | |
| Services Cyclical – Consumer Services – 0.2% | |
| | Asurion LLC (1M LIBOR + 3.000%) | |
| | 3,346,473 | | | | 3.404 | | | | 08/04/22 | | | | 3,215,961 | |
| | |
| Technology – Software/Services – 2.1% | |
| | Banff Merger Sub, Inc. (1M LIBOR + 4.250%) | |
| | 4,949,157 | | | | 4.654 | | | | 10/02/25 | | | | 4,256,275 | |
| | Cerence, Inc. (1M LIBOR + 6.000%) | |
| | 1,833,813 | | | | 7.016 | | | | 10/01/24 | | | | 1,668,769 | |
| | Ceridian HCM Holding, Inc.(1 Week LIBOR + 2.500%) | |
| | 2,955,000 | | | | 2.637 | | | | 04/30/25 | | | | 2,778,941 | |
| | DCert Buyer, Inc. (1M LIBOR + 4.000%) | |
| | 1,775,000 | | | | 4.404 | | | | 10/16/26 | | | | 1,665,536 | |
| | Infor (US), Inc. (1M LIBOR + 2.750%) | |
| | 4,100,744 | | | | 3.750 | | | | 02/01/22 | | | | 4,022,133 | |
| | Ion Trading Technologies S.a.r.l. (3M LIBOR + 4.000%) | |
| | 1,988,694 | | | | 5.072 | | | | 11/21/24 | | | | 1,831,249 | |
| | MA FinanceCo. LLC (1M LIBOR + 2.250%) | |
| | 3,602,166 | | | | 2.654 | | | | 11/19/21 | | | | 3,410,819 | |
| | Refinitiv US Holdings Inc. (1M LIBOR + 3.250%) | |
| | 4,098,125 | | | | 3.654 | | | | 10/01/25 | | | | 4,004,647 | |
| SS&C Technologies Holdings Europe S.a.r.l. (1M LIBOR +
1.750%) |
|
| | 1,248,948 | | | | 2.154 | | | | 04/16/25 | | | | 1,199,128 | |
| | SS&C Technologies, Inc. (1M LIBOR + 1.750%) | |
| | 1,750,284 | | | | 2.154 | | | | 04/16/25 | | | | 1,680,465 | |
| | The Dun & Bradstreet Corp. (1M LIBOR + 4.000%) | |
| | 3,100,000 | | | | 4.487 | | | | 02/06/26 | | | | 2,890,750 | |
| | The Ultimate Software Group, Inc. (1M LIBOR + 3.750%) | |
| | 1,641,750 | | | | 4.154 | | | | 05/04/26 | | | | 1,563,028 | |
| | Tibco Software, Inc. (1M LIBOR + 3.750%) | |
| | 1,979,846 | | | | 4.160 | | | | 06/30/26 | | | | 1,851,157 | |
| | | | | | | | | | | | | | |
| | | | | | | | | | | | | 32,822,897 | |
| | |
| Telecommunication Services – 0.3% | |
| | Hoya Midco LLC(6M LIBOR + 3.500%) | |
| | 4,392,623 | | | | 4.572 | | | | 06/30/24 | | | | 3,118,763 | |
| | Level 3 Financing, Inc. (1M LIBOR + 1.750%) | |
| | 2,023,967 | | | | 2.154 | | | | 03/01/27 | | | | 1,934,568 | |
| | | | | | | | | | | | | | |
| | | | | | | | | | | | | 5,053,331 | |
| | |
| Wireless Telecommunications – 0.2% | |
| | Intelsat Jackson Holdings SA (3M PRIME + 2.750%) | |
| | 3,000,000 | | | | 4.237 | | | | 11/27/23 | | | | 2,938,320 | |
| | |
| | |
| 16 | | The accompanying notes are an integral part of these financial statements. |
GOLDMAN SACHS INCOME BUILDER FUND
| | | | | | | | | | | | | | |
Principal
Amount | | | Interest
Rate | | | Maturity
Date | | | Value | |
|
| Bank Loans(e)(j) – (continued) | |
| Wirelines Telecommunications – 0.3% | |
| | Consolidated Communications, Inc. (1M LIBOR + 3.000%) | |
| $ | 4,862,347 | | | | 4.000 | % | | | 10/04/23 | | | $ | 4,295,056 | |
| | |
| | TOTAL BANK LOANS | |
| | (Cost $117,411,803) | | | | | | | $ | 106,912,382 | |
| | |
| | | | | | | | | | | | | | |
|
| U.S. Treasury Obligation(k) – 0.1% | |
| | United States Treasury Note | |
| $ | 1,730,000 | | | | 1.875 | % | | | 12/15/20 | | | $ | 1,748,652 | |
| | (Cost $1,728,788) | |
| | |
| | | | | | | | |
| Shares | | Dividend
Rate | | | Value | |
| | | | | | | | |
|
| Investment Companies(l) – 7.5% | |
Goldman Sachs Emerging Markets Equity Fund – Class R6 Shares | |
| 2,516 | | | 1.277 | % | | $ | 49,635 | |
Goldman Sachs Financial Square Government Fund – Class R6 Shares | |
| 30,708,389 | | | 0.233 | | | | 30,708,389 | |
Goldman Sachs Financial Square Government Fund – Institutional Shares | |
| 88,574,154 | | | 0.233 | | | | 88,574,154 | |
Goldman Sachs High Yield Fund – Class R6 Shares | |
| 8,592 | | | 6.516 | | | | 48,630 | |
| |
| TOTAL INVESTMENT COMPANIES | |
| (Cost $119,383,209) | | | $ | 119,380,808 | |
| |
| TOTAL INVESTMENTS BEFORE SECURITIES LENDING REINVESTMENT VEHICLE | |
| (Cost $1,632,965,384) | | | $ | 1,606,170,109 | |
| |
| | | | | | | | |
|
| Securities Lending Reinvestment Vehicle(l) – 0.8% | |
Goldman Sachs Financial Square Government Fund – Institutional Shares | |
| 12,020,491 | | | 0.233% | | | $ | 12,020,491 | |
| (Cost $12,020,491) | |
| |
| TOTAL INVESTMENTS – 101.1% | |
| (Cost $1,644,985,875) | | | $ | 1,618,190,600 | |
| |
LIABILITIES IN EXCESS OF
OTHER ASSETS – (1.1)% | | | | (17,516,471 | ) |
| |
| NET ASSETS – 100.0% | | | $ | 1,600,674,129 | |
| |
| | |
|
| The percentage shown for each investment category reflects the value of investments in that category as a percentage of net assets. |
| |
(a) | | All or a portion of security is on loan. |
| |
(b) | | Significant unobservable inputs were used in the valuation of this portfolio security; i.e., Level 3. |
| |
(c) | | Security is currently in default and/or non-income producing. |
| |
(d) | | Security with “Call” features with resetting interest rates. Maturity dates disclosed are the final maturity dates. |
| |
(e) | | Variable rate security. Except for floating rate notes (for which final maturity is disclosed), maturity date disclosed is the next interest reset date. Interest rate disclosed is that which is in effect on April 30, 2020. |
| |
(f) | | Exempt from registration under Rule 144A of the Securities Act of 1933. |
| |
(g) | | Pay-in-kind securities. |
| |
(h) | | Guaranteed by a foreign government until maturity. Total market value of these securities amounts to $562,472, which represents approximately 0.0% of the Fund’s net assets as of April 30, 2020. |
| |
(i) | | Actual maturity date is June 5, 2115. |
| |
(j) | | Bank Loans often require prepayments from excess cash flows or permit the borrower to repay at its election. The degree to which borrowers repay, whether as a contractual requirement or at their election, cannot be predicted with accuracy. As a result, the actual remaining maturity may be substantially less than the stated maturities shown. As bank loan positions may involve multiple underlying tranches for which the aggregate position is presented, the stated interest rate represents the weighted average interest rate of all contracts on April 30, 2020. Bank Loans typically have rates of interest which are predetermined either daily, monthly, quarterly or semi-annually by reference to a base lending rate, plus a premium. These base lending rates are primarily the London-Interbank Offered Rate (“LIBOR”), and secondarily the prime rate offered by one or more major United States banks (the “Prime Rate”) and the certificate of deposit (“CD”) rate or other base lending rates used by commercial lenders. |
| |
(k) | | All or a portion of security is segregated as collateral for initial margin requirements on futures transactions. |
| |
(l) | | Represents an affiliated issuer. |
| | |
|
Currency Abbreviations: |
EUR | | —Euro |
GBP | | —British Pound |
USD | | —U.S. Dollar |
| | |
Investment Abbreviations: |
ADR | | —American Depositary Receipt |
CMT | | —Constant Maturity Treasury Indexes |
EURO | | —Euro Offered Rate |
LIBOR | | —London Interbank Offered Rate |
LLC | | —Limited Liability Company |
LP | | —Limited Partnership |
MTN | | —Medium Term Note |
PLC | | —Public Limited Company |
REIT | | —Real Estate Investment Trust |
SOFR | | —Secured Overnight Funding Rate |
|
| | |
| The accompanying notes are an integral part of these financial statements. | | 17 |
GOLDMAN SACHS INCOME BUILDER FUND
Schedule of Investments(continued)
April 30, 2020 (Unaudited)
|
| ADDITIONAL INVESTMENT INFORMATION |
UNFUNDED LOAN COMMITMENTS — At April 30, 2020, the Fund had unfunded loan commitments which could be extended at the option of the borrowers, pursuant to the following loan agreements:
| | | | | | | | | | | | |
| Borrower | | Principal
Amount | | | Current
Value | | | Unrealized
Gain (Loss) | |
OEConnection LLC, due 09/25/26 | | $ | 196,970 | | | $ | 173,334 | | | $ | (22,734 | ) |
FORWARD FOREIGN CURRENCY EXCHANGE CONTRACTS — At April 30, 2020, the Fund had the following forward foreign currency exchange contracts:
FORWARD FOREIGN CURRENCY EXCHANGE CONTRACTS WITH UNREALIZED GAIN
| | | | | | | | | | | | | | | | | | |
| Counterparty | | Currency
Purchased | | Currency
Sold | | | Settlement
Date | | | Unrealized
Gain | |
MS & Co. Int. PLC | | EUR | | 28,025 | | USD | | | 30,480 | | | | 05/14/20 | | | $ | 239 | |
FORWARD FOREIGN CURRENCY EXCHANGE CONTRACTS WITH UNREALIZED LOSS
| | | | | | | | | | | | | | | | | | | | | | | | |
| Counterparty | | Currency
Purchased | | | Currency
Sold | | | Settlement
Date | | | Unrealized
Gain | |
MS & Co. Int. PLC. | | | USD | | | | 4,123,062 | | | | EUR | | | | 3,797,602 | | | | 05/14/20 | | | $ | (39,632 | ) |
| | | | USD | | | | 4,454,786 | | | | GBP | | | | 3,577,443 | | | | 07/15/20 | | | | (52,434 | ) |
| | | | | | |
| | | | | | | | | | | | | | | | | | | | | | | $ | (92,066 | ) |
FUTURES CONTRACTS — At April 30, 2020, the Fund had the following futures contracts:
| | | | | | | | | | | | | | | | |
| Description | | Number of
Contracts | | | Expiration
Date | | | Notional
Amount | | | Unrealized
Appreciation/
(Depreciation) | |
Long position contracts: | | | | | | | | | | | | | | | | |
S&P 500E-Mini Index | | | 391 | | | | 06/19/20 | | | $ | 56,741,920 | | | $ | 4,290,497 | |
Ultra Long U.S. Treasury Bonds | | | 265 | | | | 06/19/20 | | | | 59,567,031 | | | | 6,401,225 | |
Ultra 10 Year U.S. Treasury Notes | | | 97 | | | | 06/19/20 | | | | 15,232,031 | | | | 431,422 | |
2 Year U.S. Treasury Notes | | | 109 | | | | 06/30/20 | | | | 24,026,836 | | | | 24,395 | |
5 Year U.S. Treasury Notes | | | 31 | | | | 06/30/20 | | | | 3,890,016 | | | | 51,409 | |
10 Year U.S. Treasury Notes | | | 148 | | | | 06/19/20 | | | | 20,581,250 | | | | 260,554 | |
20 Year U.S. Treasury Bonds | | | 11 | | | | 06/19/20 | | | | 1,991,344 | | | | 156,068 | |
| | | | |
| Total | | | | | | | | | | | | | | $ | 11,615,570 | |
Short position contracts: | | | | | | | | | | | | | | | | |
5 Year U.S. Treasury Notes | | | (295 | ) | | | 06/30/20 | | | | (37,017,891 | ) | | | (6,309 | ) |
20 Year U.S. Treasury Bonds | | | (186 | ) | | | 06/19/20 | | | | (33,671,812 | ) | | | (2,087,820 | ) |
| | | | |
| Total | | | | | | | | | | | | | | $ | (2,094,129 | ) |
| | | | |
| TOTAL FUTURES CONTRACTS | | | | | | | | | | | | | | $ | 9,521,441 | |
| | |
| 18 | | The accompanying notes are an integral part of these financial statements. |
GOLDMAN SACHS INCOME BUILDER FUND
|
| ADDITIONAL INVESTMENT INFORMATION (continued) |
SWAP CONTRACTS — At April 30, 2020, the Fund had the following swap contracts:
CENTRALLY CLEARED INTEREST RATE SWAP CONTRACTS
| | | | | | | | | | | | | | | | | | | | | | | | | | |
| Payments Made by the Fund | | Payments
Received
by Fund | | | Termination
Date | | Notional
Amount
(000s) | | | Market
Value | | | Upfront
Premium
(Received)
Paid | | | Unrealized
Appreciation/
(Depreciation) | |
1M EURO(a) | | | 6M EURO(b) | | | 03/18/25 | | | EUR | | | | 320 | | | $ | (6,281 | ) | | $ | 2,569 | | | $ | (8,850 | ) |
1M EURO + 0.250%(a) | | | 6M EURO(b) | | | 03/18/27 | | | | | | | 160 | (c) | | | (6,625 | ) | | | (3,845 | ) | | | (2,780 | ) |
1.750(a) | | | 3M LIBOR(d) | | | 03/18/23 | | $ | | | | | 540 | (c) | | | (22,615 | ) | | | (2,148 | ) | | | (20,467 | ) |
2.250(a) | | | 3M LIBOR(d) | | | 03/18/50 | | | | | | | 10 | | | | (3,904 | ) | | | (2,506 | ) | | | (1,398 | ) |
3M LIBOR(d) | | | 1.750%(a) | | | 03/18/22 | | | | | | | 10,870 | (c) | | | 300,162 | | | | 96,651 | | | | 203,511 | |
3M LIBOR(d) | | | 1.750(a) | | | 03/18/25 | | | | | | | 119,810 | (c) | | | 7,961,545 | | | | 394,860 | | | | 7,566,685 | |
3M LIBOR(d) | | | 2.000(a) | | | 03/18/27 | | | | | | | 4,050 | (c) | | | 416,212 | | | | 110,993 | | | | 305,219 | |
3M LIBOR(d) | | | 2.000(a) | | | 03/18/30 | | | | | | | 144,710 | (c) | | | 19,307,113 | | | | 2,175,595 | | | | 17,131,518 | |
3M LIBOR(d) | | | 2.250(a) | | | 03/18/40 | | | | | | | 20 | | | | 5,484 | | | | 5,255 | | | | 229 | |
| | | | | | | |
| TOTAL | | | | | | | | | | | | | | | | $ | 27,951,091 | | | $ | 2,777,424 | | | $ | 25,173,667 | |
| | (a) | | Payments made semi-annually. |
| | (b) | | Payments made annually. |
| | (c) | | Represents forward starting interest rate swaps whose effective dates of commencement of accruals and cash flows occur subsequent to April 30, 2020. |
| | (d) | | Payments made quarterly. |
| | |
|
| Abbreviations: |
MS & Co. Int. PLC | | —Morgan Stanley & Co. International PLC |
|
| | |
| The accompanying notes are an integral part of these financial statements. | | 19 |
GOLDMAN SACHS RISING DIVIDEND GROWTH FUND
Schedule of Investments
April 30, 2020 (Unaudited)
| | | | | | | | |
Shares | | |
Description | | Value | |
|
| Common Stocks – 96.7% | |
| Air Freight & Logistics – 0.9% | |
| | 34,790 | | | FedEx Corp. | | $ | 4,410,328 | |
| | |
| Banks – 0.3% | |
| | 76,360 | | | Bank OZK | | | 1,727,263 | |
| | |
| Building Products – 1.1% | |
| | 66,490 | | | A.O. Smith Corp. | | | 2,817,846 | |
| | 14,370 | | | Lennox International, Inc. | | | 2,682,592 | |
| | | | | | | | |
| | | | | | | 5,500,438 | |
| | |
| Capital Markets – 5.7% | |
| | 28,810 | | | Ameriprise Financial, Inc. | | | 3,311,422 | |
| | 12,430 | | | BlackRock, Inc. | | | 6,240,357 | |
| | 26,327 | | | Evercore, Inc. Class A | | | 1,358,473 | |
| | 14,640 | | | FactSet Research Systems, Inc. | | | 4,026,000 | |
| | 23,530 | | | Moody’s Corp. | | | 5,738,967 | |
| | 57,425 | | | SEI Investments Co. | | | 2,926,378 | |
| | 41,414 | | | T. Rowe Price Group, Inc. | | | 4,788,701 | |
| | | | | | | | |
| | | | | | | 28,390,298 | |
| | |
| Chemicals – 2.1% | |
| | 23,240 | | | Ecolab, Inc. | | | 4,496,940 | |
| | 4,085 | | | NewMarket Corp. | | | 1,680,732 | |
| | 7,762 | | | The Sherwin-Williams Co. | | | 4,163,304 | |
| | | | | | | | |
| | | | | | | 10,340,976 | |
| | |
| Commercial Services & Supplies – 0.9% | |
| | 112,000 | | | Rollins, Inc. | | | 4,480,000 | |
| | |
| Consumer Finance – 0.5% | |
| | 61,834 | | | Discover Financial Services | | | 2,657,007 | |
| | |
| Electric Utilities – 0.7% | |
| | 16,050 | | | NextEra Energy, Inc. | | | 3,709,476 | |
| | |
| Electrical Equipment – 0.9% | |
| | 23,625 | | | Rockwell Automation, Inc. | | | 4,476,465 | |
| | |
| Electronic Equipment, Instruments & Components – 3.3% | |
| | 51,570 | | | Amphenol Corp. Class A | | | 4,551,568 | |
| | 25,075 | | | Badger Meter, Inc. | | | 1,480,177 | |
| | 171,145 | | | Corning, Inc. | | | 3,766,902 | |
| | 64,242 | | | National Instruments Corp. | | | 2,468,178 | |
| | 57,113 | | | TE Connectivity Ltd. | | | 4,195,521 | |
| | | | | | | | |
| | | | | | | 16,462,346 | |
| | |
| Energy Equipment & Services – 0.3% | |
| | 202,400 | | | USA Compression Partners LP | | | 1,621,224 | |
| | |
| Entertainment – 4.0% | |
| | 172,585 | | | Activision Blizzard, Inc. | | | 10,998,842 | |
| | 84,550 | | | The Walt Disney Co. | | | 9,144,083 | |
| | | | | | | | |
| | | | | | | 20,142,925 | |
| | |
| Equity Real Estate Investment Trusts (REITs) – 2.5% | |
| | 50,140 | | | Equity LifeStyle Properties, Inc. | | | 3,023,944 | |
| | 33,910 | | | Extra Space Storage, Inc. | | | 2,992,218 | |
| | 98,755 | | | Iron Mountain, Inc. | | | 2,387,896 | |
| | |
|
| Common Stocks – (continued) | |
| Equity Real Estate Investment Trusts (REITs) – (continued) | |
| | 21,620 | | | Public Storage | | | 4,009,429 | |
| | | | | | | | |
| | | | | | | 12,413,487 | |
| | |
| Food & Staples Retailing – 3.9% | |
| | 17,150 | | | Casey’s General Stores, Inc. | | | 2,596,681 | |
| | 22,400 | | | Costco Wholesale Corp. | | | 6,787,200 | |
| | 172,355 | | | The Kroger Co. | | | 5,448,142 | |
| | 106,995 | | | Walgreens Boots Alliance, Inc. | | | 4,631,814 | |
| | | | | | | | |
| | | | | | | 19,463,837 | |
| | |
| Food Products – 1.8% | |
| | 102,325 | | | Hormel Foods Corp. | | | 4,793,926 | |
| | 31,390 | | | Ingredion, Inc. | | | 2,548,868 | |
| | 11,700 | | | J&J Snack Foods Corp. | | | 1,486,251 | |
| | | | | | | | |
| | | | | | | 8,829,045 | |
| | |
| Health Care Equipment & Supplies – 4.4% | |
| | 33,010 | | | Cantel Medical Corp. | | | 1,221,370 | |
| | 48,075 | | | Danaher Corp. | | | 7,858,339 | |
| | 65,970 | | | Medtronic PLC | | | 6,440,651 | |
| | 34,760 | | | Stryker Corp. | | | 6,480,307 | |
| | | | | | | | |
| | | | | | | 22,000,667 | |
| | |
| Health Care Providers & Services – 8.3% | |
| | 62,715 | | | AmerisourceBergen Corp. | | | 5,623,027 | |
| | 94,375 | | | Cardinal Health, Inc. | | | 4,669,675 | |
| | 8,000 | | | Chemed Corp. | | | 3,332,560 | |
| | 104,096 | | | CVS Health Corp. | | | 6,407,109 | |
| | 37,473 | | | McKesson Corp. | | | 5,293,061 | |
| | 83,670 | | | Patterson Cos., Inc. | | | 1,529,488 | |
| | 47,475 | | | Quest Diagnostics, Inc. | | | 5,227,472 | |
| | 43,086 | | | The Ensign Group, Inc. | | | 1,611,847 | |
| | 27,350 | | | UnitedHealth Group, Inc. | | | 7,999,055 | |
| | | | | | | | |
| | | | | | | 41,693,294 | |
| | |
| Hotels, Restaurants & Leisure – 1.4% | |
| | 34,695 | | | Brinker International, Inc. | | | 807,700 | |
| | 13,930 | | | Cracker Barrel Old Country Store, Inc. | | | 1,356,782 | |
| | 53,680 | | | Yum! Brands, Inc. | | | 4,639,562 | |
| | | | | | | | |
| | | | | | | 6,804,044 | |
| | |
| Independent Power and Renewable Electricity Producers – 0.7% | |
| | 15,000 | | | Brookfield Renewable Partner LP | | | 703,350 | |
| | 54,200 | | | NextEra Energy Partners LP | | | 2,725,718 | |
| | | | | | | | |
| | | | | | | 3,429,068 | |
| | |
| Industrial Conglomerates – 1.1% | |
| | 34,930 | | | 3M Co. | | | 5,306,578 | |
| | |
| Insurance – 3.6% | |
| | 34,629 | | | American Financial Group, Inc. | | | 2,293,825 | |
| | 25,650 | | | Aon PLC | | | 4,428,985 | |
| | 80,850 | | | Principal Financial Group, Inc. | | | 2,943,749 | |
| | 59,300 | | | Prudential Financial, Inc. | | | 3,698,541 | |
| | |
| | |
| 20 | | The accompanying notes are an integral part of these financial statements. |
GOLDMAN SACHS RISING DIVIDEND GROWTH FUND
| | | | | | | | |
Shares | | |
Description | | Value | |
|
| Common Stocks – (continued) | |
| Insurance – (continued) | |
| | 24,010 | | | Reinsurance Group of America, Inc. | | $ | 2,513,367 | |
| | 19,360 | | | The Hanover Insurance Group, Inc. | | | 1,943,357 | |
| | | | | | | | |
| | | | | | | 17,821,824 | |
| | |
| IT Services – 8.5% | |
| | 33,192 | | | Accenture PLC Class A | | | 6,146,826 | |
| | 37,240 | | | Automatic Data Processing, Inc. | | | 5,462,736 | |
| | 35,642 | | | Broadridge Financial Solutions, Inc. | | | 4,134,472 | |
| | 50,130 | | | International Business Machines Corp. | | | 6,294,323 | |
| | 27,935 | | | Jack Henry & Associates, Inc. | | | 4,568,769 | |
| | 23,090 | | | Mastercard, Inc. Class A | | | 6,349,057 | |
| | 155,130 | | | The Western Union Co. | | | 2,958,329 | |
| | 37,540 | | | Visa, Inc. Class A | | | 6,709,149 | |
| | | | | | | | |
| | | | | | | 42,623,661 | |
| | |
| Leisure Products – 1.0% | |
| | 43,095 | | | Hasbro, Inc. | | | 3,111,890 | |
| | 27,469 | | | Polaris, Inc. | | | 1,948,376 | |
| | | | | | | | |
| | | | | | | 5,060,266 | |
| | |
| Machinery – 0.5% | |
| | 53,265 | | | Donaldson Co., Inc. | | | 2,334,605 | |
| | |
| Media – 4.2% | |
| | 269,615 | | | Comcast Corp. Class A | | | 10,145,638 | |
| | 78,835 | | | Meredith Corp. | | | 1,169,123 | |
| | 104,580 | | | Omnicom Group, Inc. | | | 5,964,197 | |
| | 221,729 | | | ViacomCBS, Inc. Class B | | | 3,827,043 | |
| | | | | | | | |
| | | | | | | 21,106,001 | |
| | |
| Metals & Mining – 0.4% | |
| | 20,663 | | | Reliance Steel & Aluminum Co. | | | 1,850,992 | |
| | |
| Multi-Utilities – 1.9% | |
| | 36,235 | | | Sempra Energy | | | 4,487,705 | |
| | 53,355 | | | WEC Energy Group, Inc. | | | 4,831,295 | |
| | | | | | | | |
| | | | | | | 9,319,000 | |
| | |
| Oil, Gas & Consumable Fuels – 13.1% | |
| | 55,400 | | | BP Midstream Partners LP | | | 633,776 | |
| | 143,000 | | | Cheniere Energy Partners LP | | | 4,823,390 | |
| | 52,500 | | | Enbridge, Inc. | | | 1,610,700 | |
| | 796,800 | | | Energy Transfer LP | | | 6,693,120 | |
| | 573,900 | | | Enterprise Products Partners LP | | | 10,077,684 | |
| | 248,377 | | | Hess Midstream LP Class A | | | 4,341,630 | |
| | 165,000 | | | Kinder Morgan, Inc. | | | 2,512,950 | |
| | 178,000 | | | Magellan Midstream Partners LP | | | 7,321,140 | |
| | 394,100 | | | MPLX LP | | | 7,133,210 | |
| | 99,000 | | | ONEOK, Inc. | | | 2,963,070 | |
| | 110,000 | | | Pembina Pipeline Corp. | | | 2,523,400 | |
| | 117,000 | | | Phillips 66 Partners LP | | | 4,978,350 | |
| | 34,000 | | | Shell Midstream Partners LP | | | 499,460 | |
| | 40,000 | | | Sunoco LP | | | 992,800 | |
| | 35,000 | | | TC Energy Corp. | | | 1,622,600 | |
| | |
|
| Common Stocks – (continued) | |
| Oil, Gas & Consumable Fuels – (continued) | |
| | 45,526 | | | TC PipeLines LP | | | 1,525,121 | |
| | 270,000 | | | The Williams Cos., Inc. | | | 5,229,900 | |
| | | | | | | | |
| | | | | | | 65,482,301 | |
| | |
| Personal Products – 1.0% | |
| | 29,510 | | | The Estee Lauder Cos., Inc. Class A | | | 5,205,564 | |
| | |
| Pharmaceuticals – 0.7% | |
| | 70,325 | | | Perrigo Co. PLC | | | 3,748,322 | |
| | |
| Professional Services – 0.2% | |
| | 23,540 | | | Insperity, Inc. | | | 1,123,093 | |
| | |
| Semiconductors & Semiconductor Equipment – 5.9% | |
| | 49,685 | | | Analog Devices, Inc. | | | 5,445,476 | |
| | 101,680 | | | Applied Materials, Inc. | | | 5,051,462 | |
| | 30,995 | | | KLA Corp. | | | 5,085,970 | |
| | 20,286 | | | Power Integrations, Inc. | | | 2,076,272 | |
| | 74,735 | | | QUALCOMM, Inc. | | | 5,879,402 | |
| | 52,885 | | | Texas Instruments, Inc. | | | 6,138,362 | |
| | | | | | | | |
| | | | | | | 29,676,944 | |
| | |
| Software – 2.2% | |
| | 43,180 | | | Microsoft Corp. | | | 7,738,288 | |
| | 63,180 | | | Oracle Corp. | | | 3,346,644 | |
| | | | | | | | |
| | | | | | | 11,084,932 | |
| | |
| Specialty Retail – 2.5% | |
| | 39,884 | | | Aaron’s, Inc. | | | 1,272,698 | |
| | 56,300 | | | Best Buy Co., Inc. | | | 4,319,899 | |
| | 31,390 | | | The Home Depot, Inc. | | | 6,900,464 | |
| | | | | | | | |
| | | | | | | 12,493,061 | |
| | |
| Technology Hardware, Storage & Peripherals – 0.8% | |
| | 259,430 | | | HP, Inc. | | | 4,023,759 | |
| | |
| Textiles, Apparel & Luxury Goods – 2.8% | |
| | 30,210 | | | Columbia Sportswear Co. | | | 2,202,026 | |
| | 68,615 | | | NIKE, Inc. Class B | | | 5,981,855 | |
| | 30,915 | | | Ralph Lauren Corp. | | | 2,280,909 | |
| | 59,818 | | | VF Corp. | | | 3,475,426 | |
| | | | | | | | |
| | | | | | | 13,940,216 | |
| | |
| Trading Companies & Distributors – 2.6% | |
| | 126,665 | | | Fastenal Co. | | | 4,587,806 | |
| | 30,483 | | | MSC Industrial Direct Co., Inc. Class A | | | 1,818,006 | |
| | 13,399 | | | W.W. Grainger, Inc. | | | 3,692,497 | |
| | 16,704 | | | Watsco, Inc. | | | 2,689,177 | |
| | | | | | | | |
| | | | | | | 12,787,486 | |
| | |
| | TOTAL COMMON STOCKS | |
| | (Cost $458,537,817) | | $ | 483,540,793 | |
| | |
| | |
| The accompanying notes are an integral part of these financial statements. | | 21 |
GOLDMAN SACHS RISING DIVIDEND GROWTH FUND
Schedule of Investments(continued)
April 30, 2020 (Unaudited)
| | | | | | |
| Shares | | Dividend
Rate | | Value | |
|
| Investment Companies(a) – 2.8% | |
Goldman Sachs Financial Square Government Fund – Class R6 Shares | |
| 12,660,010 | | 0.233% | | $ | 12,660,010 | |
Goldman Sachs Financial Square Government Fund – Institutional Shares | |
| 1,185,910 | | 0.233 | | | 1,185,910 | |
| |
| TOTAL INVESTMENT COMPANIES | |
| (Cost $13,845,920) | | $ | 13,845,920 | |
| |
| TOTAL INVESTMENTS – 99.5% | |
| (Cost $472,383,737) | | $ | 497,386,713 | |
| |
| OTHER ASSETS IN EXCESS OF LIABILITIES – 0.5% | | | 2,322,037 | |
| |
| NET ASSETS – 100.0% | | $ | 499,708,750 | |
| |
| | |
|
| The percentage shown for each investment category reflects the value of investments in that category as a percentage of net assets. |
| |
* | | Non-income producing security. |
| |
(a) | | Represents affiliated funds. |
| | |
|
Investment Abbreviations: |
LP | | — Limited Partnership |
PLC | | — Public Limited Company |
|
|
| ADDITIONAL INVESTMENT INFORMATION |
FUTURES CONTRACTS — At April 30, 2020, the Fund had the following futures contracts:
| | | | | | | | | | | | | | | | |
| Description | | Number of
Contracts | | | Expiration
Date | | | Notional
Amount | | | Unrealized
Appreciation/
(Depreciation) | |
S&P 500E-Mini Index | | | 115 | | | | 06/19/20 | | | $ | 16,688,800 | | | $ | 1,673,364 | |
| | |
| 22 | | The accompanying notes are an integral part of these financial statements. |
GOLDMAN SACHS DIVIDEND FOCUS FUNDS
Statements of Assets and Liabilities
April 30, 2020 (Unaudited)
| | | | | | | | | | |
| | | | | Income Builder
Fund | | | Rising Dividend
Growth Fund | |
| | Assets: | |
| | Investments, at value (cost $1,513,582,175 and $458,537,817, respectively)(a) | | $ | 1,486,789,301 | | | $ | 483,540,793 | |
| | Investments of affiliated issuers, at value (cost $119,383,209 and $13,845,920, respectively) | | | 119,380,808 | | | | 13,845,920 | |
| | Investments in securities lending reinvestment vehicle — affiliated issuer, at value (identified cost $12,020,491 and $0, respectively) | | | 12,020,491 | | | | — | |
| | Cash | | | 20,763,596 | | | | 126,674 | |
| | Foreign currencies, at value (cost $1,747,372 and $0, respectively) | | | 1,748,658 | | | | — | |
| | Variation margin on futures contracts | | | 3,770,690 | | | | 202,353 | |
| | Unrealized gain on forward foreign currency exchange contracts | | | 239 | | | | — | |
| | Receivables: | | | | | | | | |
| | Collateral on certain derivative contracts(b) | | | 29,242,746 | | | | 1,518,000 | |
| | Investments sold | | | 20,149,616 | | | | 1,384,875 | |
| | Dividends and interest | | | 13,762,328 | | | | 916,800 | |
| | Fund shares sold | | | 2,330,675 | | | | 162,450 | |
| | Foreign tax reclaims | | | 260,671 | | | | 423,230 | |
| | Reimbursement from investment adviser | | | 23,150 | | | | 45,886 | |
| | Securities lending income | | | 8,682 | | | | — | |
| | Other assets | | | 76,043 | | | | 78,873 | |
| | | |
| | Total assets | | | 1,710,327,694 | | | | 502,245,854 | |
| | | | | | | | | | |
| | Liabilities: | | | | | | | | |
| | Unrealized loss on forward foreign currency exchange contracts | | | 92,066 | | | | — | |
| | Unrealized loss on unfunded loan commitment | | | 22,734 | | | | — | |
| | Variation margin on swaps contracts | | | 139,693 | | | | — | |
| | Variation margin on futures contracts | | | 179,528 | | | | — | |
| | Payables: | | | | | | | | |
| | Fund shares redeemed | | | 71,183,647 | | | | 1,078,402 | |
| | Investments purchased | | | 14,803,103 | | | | 708,931 | |
| | Payable upon return of securities loaned | | | 12,020,491 | | | | — | |
| | Investments purchased on an extended-settlement basis | | | 9,365,825 | | | | — | |
| | Collateral on certain derivative contracts(c) | | | 250,000 | | | | — | |
| | Management fees | | | 682,797 | | | | 289,264 | |
| | Distribution and service fees and transfer agency fees | | | 535,835 | | | | 186,215 | |
| | Accrued expenses | | | 377,846 | | | | 274,292 | |
| | | |
| | Total liabilities | | | 109,653,565 | | | | 2,537,104 | |
| | | | | | | | | | |
| | Net Assets: | | | | | | | | |
| | Paid-in capital | | | 1,649,972,213 | | | | 498,669,127 | |
| | Total distributable earnings (loss) | | | (49,298,084 | ) | | | 1,039,623 | |
| | | |
| | | NET ASSETS | | $ | 1,600,674,129 | | | $ | 499,708,750 | |
| | | Net Assets: | | | | | | | | |
| | | Class A | | $ | 282,370,264 | | | $ | 152,550,038 | |
| | | Class C | | | 408,066,723 | | | | 135,396,619 | |
| | | Institutional | | | 591,483,946 | | | | 128,961,605 | |
| | | Investor | | | 248,244,110 | | | | 70,419,373 | |
| | | Class P | | | 12,389,336 | | | | 9,011,075 | |
| | | Class R | | | — | | | | 1,384,708 | |
| | | Class R6 | | | 58,119,750 | | | | 1,985,332 | |
| | | Total Net Assets | | $ | 1,600,674,129 | | | $ | 499,708,750 | |
| | | Shares Outstanding $0.001 par value (unlimited number of shares authorized): | | | | | | | | |
| | | Class A | | | 12,870,789 | | | | 17,238,029 | |
| | | Class C | | | 18,937,310 | | | | 15,021,278 | |
| | | Institutional | | | 26,345,260 | | | | 13,782,786 | |
| | | Investor | | | 11,090,789 | | | | 7,538,430 | |
| | | Class P | | | 551,834 | | | | 963,018 | |
| | | Class R | | | — | | | | 157,191 | |
| | | Class R6 | | | 2,589,861 | | | | 212,248 | |
| | | Net asset value, offering and redemption price per share:(d) | | | | | | | | |
| | | Class A | | | $21.94 | | | | $8.85 | |
| | | Class C | | | 21.55 | | | | 9.01 | |
| | | Institutional | | | 22.45 | | | | 9.36 | |
| | | Investor | | | 22.38 | | | | 9.34 | |
| | | Class P | | | 22.45 | | | | 9.36 | |
| | | Class R | | | — | | | | 8.81 | |
| | | Class R6 | | | 22.44 | | | | 9.35 | |
| | (a) | | Includes loaned securities having a market value of $11,748,625 and $0, respectively. |
| | (b) | | Segregated for initial margin and/or collateral as follows: |
| | | | | | | | | | | | |
| Fund | | Futures | | | Swaps | | | Options | |
Income Builder | | $ | 7,220,803 | | | $ | 12,491,943 | | | $ | 9,530,000 | |
Rising Dividend Growth | | | 1,518,000 | | | | — | | | | — | |
| | (c) | | Segregated for initial margin and/or collateral as follows: |
| | | | |
| Fund | | Forwards | |
Income Bulder | | $ | 250,000 | |
Rising Dividend Growth | | | — | |
| | (d) | | Maximum public offering price per share for Class A shares of the Income Builder and the Rising Dividend Growth Funds is $23.22 and $9.37, respectively. At redemption, Class C Shares may be subject to a contingent deferred sales charge, assessed on the amount equal to the lesser of the current net asset value or the original purchase price of the shares. |
| | |
| The accompanying notes are an integral part of these financial statements. | | 23 |
GOLDMAN SACHS DIVIDEND FOCUS FUNDS
Statements of Operations
For the Six Months Ended April 30, 2020 (Unaudited)
| | | | | | | | | | |
| | | | | Income Builder
Fund | | | Rising Dividend
Growth Fund | |
| | Investment income: | |
| | | |
| | Interest | | $ | 26,745,079 | | | $ | 5,387 | |
| | | |
| | Dividends — unaffiliated issuers (net of foreign withholding taxes of $345,669 and $28,739) | | | 8,831,236 | | | | 5,646,220 | |
| | | |
| | Dividends — affiliated issuers | | | 693,461 | | | | 91,712 | |
| | | |
| | Securities lending income — affiliated issuer | | | 31,447 | | | | 2,037 | |
| | | |
| | Total investment income | | | 36,301,223 | | | | 5,745,356 | |
| | | | | | | | | | |
| | Expenses: | |
| | | |
| | Management fees | | | 4,492,007 | | | | 2,362,836 | |
| | | |
| | Distribution and Service fees(a) | | | 2,604,445 | | | | 1,075,961 | |
| | | |
| | Transfer Agency fees(a) | | | 1,004,519 | | | | 415,087 | |
| | | |
| | Custody, accounting and administrative services | | | 142,643 | | | | 85,016 | |
| | | |
| | Printing and mailing costs | | | 101,096 | | | | 67,933 | |
| | | |
| | Professional fees | | | 68,455 | | | | 78,386 | |
| | | |
| | Shareholder meeting expense | | | 65,797 | | | | — | |
| | | |
| | Registration fees | | | 64,202 | | | | 59,103 | |
| | | |
| | Trustee fees | | | 10,188 | | | | 9,380 | |
| | | |
| | Other | | | 13,847 | | | | 11,391 | |
| | | |
| | Total expenses | | | 8,567,199 | | | | 4,165,093 | |
| | | |
| | Less — expense reductions | | | (197,798 | ) | | | (413,436 | ) |
| | | |
| | Net expenses | | | 8,369,401 | | | | 3,751,657 | |
| | | |
| | NET INVESTMENT INCOME | | | 27,931,822 | | | | 1,993,699 | |
| | | | | | | | | | |
| | Realized and unrealized gain (loss): | |
| | | |
| | Net realized gain (loss) from: | | | | | | | | |
| | | |
| | Investments — unaffiliated issuers | | | (35,533,410 | ) | | | 3,843,002 | |
| | | |
| | Purchased options | | | (1,762,405 | ) | | | — | |
| | | |
| | Futures contracts | | | (4,435,274 | ) | | | (2,018,013 | ) |
| | | |
| | Written options | | | (7,313,824 | ) | | | — | |
| | | |
| | Swap contracts | | | 14,909,247 | | | | — | |
| | | |
| | Forward foreign currency exchange contracts | | | 37,391 | | | | — | |
| | | |
| | Foreign currency transactions | | | 79,001 | | | | (623 | ) |
| | | |
| | Net change in unrealized gain (loss) on: | | | | | | | | |
| | | |
| | Investments — unaffiliated issuers | | | (143,315,058 | ) | | | (86,037,417 | ) |
| | | |
| | Investments — affiliated issuers | | | (11,875 | ) | | | — | |
| | | |
| | Futures contracts | | | 11,787,011 | | | | 1,438,431 | |
| | | |
| | Unfunded loan commitments | | | (21,736 | ) | | | — | |
| | | |
| | Written options | | | 202,150 | | | | — | |
| | | |
| | Swap contracts | | | 22,782,916 | | | | — | |
| | | |
| | Forward foreign currency exchange contracts | | | 137,025 | | | | — | |
| | | |
| | Foreign currency translation | | | (14,208 | ) | | | 185 | |
| | | |
| | Net realized and unrealized loss | | | (142,473,049 | ) | | | (82,774,435 | ) |
| | | |
| | NET DECREASE IN NET ASSETS RESULTING FROM OPERATIONS | | $ | (114,541,227 | ) | | $ | (80,780,736 | ) |
| | (a) | | Class specific Distribution and/or Service and Transfer Agency fees were as follows: |
| | | | | | | | | | | | | | | | | | | | | | | | | | | | | | | | | | | | | | | | |
| | | Distribution and/or Service Fees | | | Transfer Agency Fees | |
Fund | | Class A | | | Class C | | | Class R | | | Class A | | | Class C | | | Institutional | | | Investor | | | Class P | | | Class R | | | Class R6 | |
Income Builder | | $ | 380,615 | | | $ | 2,223,830 | | | $ | — | | | $ | 258,818 | | | $ | 378,051 | | | $ | 131,113 | | | $ | 227,633 | | | $ | 2,436 | | | $ | — | | | $ | 6,468 | |
Rising Dividend Growth | | | 231,636 | | | | 839,439 | | | | 4,886 | | | | 157,512 | | | | 142,705 | | | | 33,253 | | | | 77,295 | | | | 2,322 | | | | 1,661 | | | | 339 | |
| | |
| 24 | | The accompanying notes are an integral part of these financial statements. |
GOLDMAN SACHS DIVIDEND FOCUS FUNDS
Statements of Changes in Net Assets
| | | | | | | | | | | | | | | | | | | | | | |
| | | | | Income Builder Fund | | | | | | Rising Dividend Growth Fund | |
| | | | | For the
Six Months Ended
April 30, 2020
(Unaudited) | | | For the Fiscal
Year Ended
October 31, 2019 | | | | | | For the
Six Months Ended
April 30, 2020
(Unaudited) | | | For the Fiscal
Year Ended
October 31, 2019 | |
| | From operations: | |
| | | | | | |
| | Net investment income | | $ | 27,931,822 | | | $ | 59,120,070 | | | | | | | $ | 1,993,699 | | | $ | 7,250,499 | |
| | | | | | |
| | Net realized gain (loss) | | | (34,019,274 | ) | | | 42,470,279 | | | | | | | | 1,824,366 | | | | 69,754,135 | |
| | | | | | |
| | Net change in unrealized gain (loss) | | | (108,453,775 | ) | | | 100,543,196 | | | | | | | | (84,598,801 | ) | | | 451,466 | |
| | Net increase (decrease) in net assets resulting from operations | | | (114,541,227 | ) | | | 202,133,545 | | | | | | | | (80,780,736 | ) | | | 77,456,100 | |
| | | | | | | | | | | | | | | | | | | | | | |
| | Distributions to shareholders: | |
| | | | | | |
| | From distributable earnings | | | | | | | | | | | | | | | | | | | | |
| | | | | | |
| | Class A Shares | | | (5,197,334 | ) | | | (11,236,076 | ) | | | | | | | (19,757,403 | ) | | | (122,698,079 | ) |
| | | | | | |
| | Class C Shares | | | (6,068,489 | ) | | | (13,981,530 | ) | | | | | | | (17,126,194 | ) | | | (142,610,726 | ) |
| | | | | | |
| | Institutional Shares | | | (12,282,654 | ) | | | (24,548,602 | ) | | | | | | | (17,181,027 | ) | | | (164,809,422 | ) |
| | | | | | |
| | Investor Shares | | | (4,808,632 | ) | | | (8,998,284 | ) | | | | | | | (9,486,286 | ) | | | (83,957,904 | ) |
| | | | | | |
| | Class P Shares | | | (301,498 | ) | | | (523,868 | ) | | | | | | | (1,736,876 | ) | | | (16,342,234 | ) |
| | | | | | |
| | Class R Shares | | | — | | | | — | | | | | | | | (221,235 | ) | | | (1,522,397 | ) |
| | | | | | |
| | Class R6 Shares | | | (778,105 | ) | | | (325,169 | ) | | | | | | | (210,690 | ) | | | (57,671 | ) |
| | | | | | |
| | Total distributions to shareholders | | | (29,436,712 | ) | | | (59,613,529 | ) | | | | | | | (65,719,711 | ) | | | (531,998,433 | ) |
| | | | | | | | | | | | | | | | | | | | | | |
| | From share transactions: | |
| | | | | | |
| | Proceeds from sales of shares | | | 391,544,460 | | | | 385,979,825 | | | | | | | | 30,905,413 | | | | 177,494,764 | |
| | | | | | |
| | Reinvestment of distributions | | | 26,277,772 | | | | 53,137,972 | | | | | | | | 59,519,249 | | | | 475,127,949 | |
| | | | | | |
| | Cost of shares redeemed | | | (348,650,750 | ) | | | (627,911,281 | ) | | | | | | | (169,925,376 | ) | | | (815,636,639 | ) |
| | | | | | |
| | Net increase (decrease) in net assets resulting from share transactions | | | 69,171,482 | | | | (188,793,484 | ) | | | | | | | (79,500,714 | ) | | | (163,013,926 | ) |
| | | | | | |
| | TOTAL DECREASE | | | (74,806,457 | ) | | | (46,273,468 | ) | | | | | | | (226,001,161 | ) | | | (617,556,259 | ) |
| | | | | | | | | | | | | | | | | | | | | | |
| | Net assets: | |
| | | | | | |
| | Beginning of period | | | 1,675,480,586 | | | | 1,721,754,054 | | | | | | | | 725,709,911 | | | | 1,343,266,170 | |
| | | | | | |
| | End of period | | $ | 1,600,674,129 | | | $ | 1,675,480,586 | | | | | | | $ | 499,708,750 | | | $ | 725,709,911 | |
| | |
| The accompanying notes are an integral part of these financial statements. | | 25 |
GOLDMAN SACHS INCOME BUILDER FUND
Financial Highlights
Selected Share Data for a Share Outstanding Throughout Each Period
| | | | | | | | | | | | | | | | | | | | | | | | | | |
| | | | | Goldman Sachs Income Builder Fund | |
| | | | | Class A Shares | |
| | | | | Six Months Ended
April 30, 2020
(Unaudited) | | | Year Ended October 31, | |
| | | | | 2019 | | | 2018 | | | 2017 | | | 2016 | | | 2015 | |
| | Per Share Data | |
| | | | | | | |
| | Net asset value, beginning of period | | $ | 23.67 | | | $ | 21.67 | | | $ | 22.72 | | | $ | 21.60 | | | $ | 21.77 | | | $ | 22.83 | |
| | | | | | | |
| | Net investment income(a) | | | 0.37 | | | | 0.82 | | | | 0.80 | | | | 0.79 | | | | 0.79 | | | | 0.84 | |
| | | | | | | |
| | Net realized and unrealized gain (loss) | | | (1.70 | ) | | | 2.02 | | | | (1.02 | ) | | | 1.17 | | | | (0.16 | ) | | | (0.99 | ) |
| | | | | | | |
| | Total from investment operations | | | (1.33 | ) | | | 2.84 | | | | (0.22 | ) | | | 1.96 | | | | 0.63 | | | | (0.15 | ) |
| | | | | | | |
| | Distributions to shareholders from net investment income | | | (0.40 | ) | | | (0.84 | ) | | | (0.80 | ) | | | (0.80 | ) | | | (0.80 | ) | | | (0.82 | ) |
| | | | | | | |
| | Distributions to shareholder from return of capital | | | — | | | | — | | | | (0.03 | ) | | | (0.04 | ) | | | — | | | | (0.09 | ) |
| | | | | | | |
| | Total distributions | | | (0.40 | ) | | | (0.84 | ) | | | (0.83 | ) | | | (0.84 | ) | | | (0.80 | ) | | | (0.91 | ) |
| | | | | | | |
| | Net asset value, end of period | | $ | 21.94 | | | $ | 23.67 | | | $ | 21.67 | | | $ | 22.72 | | | $ | 21.60 | | | $ | 21.77 | |
| | | | | | | |
| | Total return(b) | | | (5.70 | )% | | | 13.34 | % | | | (1.03 | )% | | | 9.21 | % | | | 3.04 | % | | | (0.70 | )% |
| | | | | | | |
| | Net assets, end of period (in 000s) | | $ | 282,370 | | | $ | 314,951 | | | $ | 309,719 | | | $ | 387,349 | | | $ | 574,574 | | | $ | 708,457 | |
| | | | | | | |
| | Ratio of net expenses to average net assets | | | 0.97 | %(c) | | | 0.95 | % | | | 0.97 | % | | | 0.98 | % | | | 0.98 | % | | | 0.97 | % |
| | | | | | | |
| | Ratio of total expenses to average net assets | | | 0.99 | %(c) | | | 1.00 | % | | | 1.02 | % | | | 1.10 | % | | | 1.10 | % | | | 1.10 | % |
| | | | | | | |
| | Ratio of net investment income to average net assets | | | 3.23 | %(c) | | | 3.63 | % | | | 3.54 | % | | | 3.55 | % | | | 3.75 | % | | | 3.73 | % |
| | | | | | | |
| | Portfolio turnover rate(d) | | | 22 | % | | | 47 | % | | | 42 | % | | | 51 | % | | | 80 | % | | | 57 | % |
| | (a) | | Calculated based on the average shares outstanding methodology. |
| | (b) | | Assumes investment at the NAV at the beginning of the period, reinvestment of all dividends and distributions, a complete redemption of the investment at the NAV at the end of the period and no sales or redemption charges (if any). Total returns would be reduced if a sales or redemption charge was taken into account. Returns do not reflect the impact of taxes to shareholders relating to Fund distributions or the redemption of Fund shares. Total returns for periods less than one full year are not annualized. |
| | (d) | | The Fund’s portfolio turnover rate is calculated in accordance with regulatory requirements, without regard to transactions involving short term investments and certain derivatives. If such transactions were included, the Fund’s portfolio turnover rate may be higher. |
| | |
| 26 | | The accompanying notes are an integral part of these financial statements. |
GOLDMAN SACHS INCOME BUILDER FUND
Financial Highlights(continued)
Selected Share Data for a Share Outstanding Throughout Each Period
| | | | | | | | | | | | | | | | | | | | | | | | | | |
| | | | | Goldman Sachs Income Builder Fund | |
| | | | | Class C Shares | |
| | | | | Six Months Ended
April 30, 2020
(Unaudited) | | | Year Ended October 31, | |
| | | | | 2019 | | | 2018 | | | 2017 | | | 2016 | | | 2015 | |
| | Per Share Data | |
| | | | | | | |
| | Net asset value, beginning of period | | $ | 23.26 | | | $ | 21.31 | | | $ | 22.35 | | | $ | 21.26 | | | $ | 21.45 | | | $ | 22.51 | |
| | | | | | | |
| | Net investment income(a) | | | 0.28 | | | | 0.64 | | | | 0.62 | | | | 0.61 | | | | 0.62 | | | | 0.66 | |
| | | | | | | |
| | Net realized and unrealized gain (loss) | | | (1.68 | ) | | | 1.98 | | | | (1.00 | ) | | | 1.16 | | | | (0.16 | ) | | | (0.98 | ) |
| | | | | | | |
| | Total from investment operations | | | (1.40 | ) | | | 2.62 | | | | (0.38 | ) | | | 1.77 | | | | 0.46 | | | | (0.32 | ) |
| | | | | | | |
| | Distributions to shareholders from net investment income | | | (0.31 | ) | | | (0.67 | ) | | | (0.64 | ) | | | (0.65 | ) | | | (0.65 | ) | | | (0.66 | ) |
| | | | | | | |
| | Distributions to shareholders from return of capital | | | — | | | | — | | | | (0.02 | ) | | | (0.03 | ) | | | — | | | | (0.08 | ) |
| | | | | | | |
| | Total distributions | | | (0.31 | ) | | | (0.67 | ) | | | (0.66 | ) | | | (0.68 | ) | | | (0.65 | ) | | | (0.74 | ) |
| | | | | | | |
| | Net asset value, end of period | | $ | 21.55 | | | $ | 23.26 | | | $ | 21.31 | | | $ | 22.35 | | | $ | 21.26 | | | $ | 21.45 | |
| | | | | | | |
| | Total return(b) | | | (6.06 | )% | | | 12.44 | % | | | (1.74 | )% | | | 8.41 | % | | | 2.25 | % | | | (1.44 | )% |
| | | | | | | |
| | Net assets, end of period (in 000s) | | $ | 408,067 | | | $ | 463,483 | | | $ | 475,897 | | | $ | 619,357 | | | $ | 682,819 | | | $ | 704,566 | |
| | | | | | | |
| | Ratio of net expenses to average net assets | | | 1.72 | %(c) | | | 1.70 | % | | | 1.72 | % | | | 1.73 | % | | | 1.73 | % | | | 1.72 | % |
| | | | | | | |
| | Ratio of total expenses to average net assets | | | 1.74 | %(c) | | | 1.75 | % | | | 1.77 | % | | | 1.85 | % | | | 1.85 | % | | | 1.85 | % |
| | | | | | | |
| | Ratio of net investment income to average net assets | | | 2.48 | %(c) | | | 2.88 | % | | | 2.79 | % | | | 2.79 | % | | | 2.98 | % | | | 2.98 | % |
| | | | | | | |
| | Portfolio turnover rate(d) | | | 22 | % | | | 47 | % | | | 42 | % | | | 51 | % | | | 80 | % | | | 57 | % |
| | (a) | | Calculated based on the average shares outstanding methodology. |
| | (b) | | Assumes investment at the NAV at the beginning of the period, reinvestment of all dividends and distributions, a complete redemption of the investment at the NAV at the end of the period and no sales or redemption charges (if any). Total returns would be reduced if a sales or redemption charge was taken into account. Returns do not reflect the impact of taxes to shareholders relating to Fund distributions or the redemption of Fund shares. Total returns for periods less than one full year are not annualized. |
| | (d) | | The Fund’s portfolio turnover rate is calculated in accordance with regulatory requirements, without regard to transactions involving short term investments and certain derivatives. If such transactions were included, the Fund’s portfolio turnover rate may be higher. |
| | |
| The accompanying notes are an integral part of these financial statements. | | 27 |
GOLDMAN SACHS INCOME BUILDER FUND
Financial Highlights(continued)
Selected Share Data for a Share Outstanding Throughout Each Period
| | | | | | | | | | | | | | | | | | | | | | | | | | |
| | | | | Goldman Sachs Income Builder Fund | |
| | | | | Institutional Shares | |
| | | | | Six Months Ended
April 30, 2020
(Unaudited) | | | Year Ended October 31, | |
| | | | | 2019 | | | 2018 | | | 2017 | | | 2016 | | | 2015 | |
| | Per Share Data | |
| | | | | | | |
| | Net asset value, beginning of period | | $ | 24.21 | | | $ | 22.15 | | | $ | 23.20 | | | $ | 22.04 | | | $ | 22.20 | | | $ | 23.25 | |
| | | | | | | |
| | Net investment income(a) | | | 0.42 | | | | 0.93 | | | | 0.90 | | | | 0.90 | | | | 0.89 | | | | 0.94 | |
| | | | | | | |
| | Net realized and unrealized gain (loss) | | | (1.74 | ) | | | 2.06 | | | | (1.03 | ) | | | 1.19 | | | | (0.17 | ) | | | (0.99 | ) |
| | | | | | | |
| | Total from investment operations | | | (1.32 | ) | | | 2.99 | | | | (0.13 | ) | | | 2.09 | | | | 0.72 | | | | (0.05 | ) |
| | | | | | | |
| | Distributions to shareholders from net investment income | | | (0.44 | ) | | | (0.93 | ) | | | (0.89 | ) | | | (0.88 | ) | | | (0.88 | ) | | | (0.90 | ) |
| | | | | | | |
| | Distributions to shareholders from return of capital | | | — | | | | — | | | | (0.03 | ) | | | (0.05 | ) | | | — | | | | (0.10 | ) |
| | | | | | | |
| | Total distributions | | | (0.44 | ) | | | (0.93 | ) | | | (0.92 | ) | | | (0.93 | ) | | | (0.88 | ) | | | (1.00 | ) |
| | | | | | | |
| | Net asset value, end of period | | $ | 22.45 | | | $ | 24.21 | | | $ | 22.15 | | | $ | 23.20 | | | $ | 22.04 | | | $ | 22.20 | |
| | | | | | | |
| | Total return(b) | | | (5.52 | )% | | | 13.76 | % | | | (0.63 | )% | | | 9.64 | % | | | 3.42 | % | | | (0.25 | )% |
| | | | | | | |
| | Net assets, end of period (in 000s) | | $ | 591,484 | | | $ | 609,414 | | | $ | 680,661 | | | $ | 818,309 | | | $ | 740,182 | | | $ | 766,537 | |
| | | | | | | |
| | Ratio of net expenses to average net assets | | | 0.59 | %(c) | | | 0.57 | % | | | 0.58 | % | | | 0.58 | % | | | 0.58 | % | | | 0.57 | % |
| | | | | | | |
| | Ratio of total expenses to average net assets | | | 0.61 | %(c) | | | 0.61 | % | | | 0.63 | % | | | 0.70 | % | | | 0.70 | % | | | 0.70 | % |
| | | | | | | |
| | Ratio of net investment income to average net assets | | | 3.63 | %(c) | | | 4.03 | % | | | 3.93 | % | | | 3.93 | % | | | 4.13 | % | | | 4.13 | % |
| | | | | | | |
| | Portfolio turnover rate(d) | | | 22 | % | | | 47 | % | | | 42 | % | | | 51 | % | | | 80 | % | | | 57 | % |
| | (a) | | Calculated based on the average shares outstanding methodology. |
| | (b) | | Assumes investment at the NAV at the beginning of the period, reinvestment of all dividends and distributions, a complete redemption of the investment at the NAV at the end of the period and no sales or redemption charges (if any). Total returns would be reduced if a sales or redemption charge was taken into account. Returns do not reflect the impact of taxes to shareholders relating to Fund distributions or the redemption of Fund shares. Total returns for periods less than one full year are not annualized. |
| | (d) | | The Fund’s portfolio turnover rate is calculated in accordance with regulatory requirements, without regard to transactions involving short term investments and certain derivatives. If such transactions were included, the Fund’s portfolio turnover rate may be higher. |
| | |
| 28 | | The accompanying notes are an integral part of these financial statements. |
GOLDMAN SACHS INCOME BUILDER FUND
Financial Highlights(continued)
Selected Share Data for a Share Outstanding Throughout Each Period
| | | | | | | | | | | | | | | | | | | | | | | | | | |
| | | | | Goldman Sachs Income Builder Fund | |
| | | | | Investor Shares | |
| | | | | Six Months Ended
April 30, 2020
(Unaudited) | | | Year Ended October 31, | |
| | | | | 2019 | | | 2018 | | | 2017 | | | 2016 | | | 2015 | |
| | Per Share Data | |
| | | | | | | |
| | Net asset value, beginning of period | | $ | 24.14 | | | $ | 22.09 | | | $ | 23.14 | | | $ | 21.98 | | | $ | 22.14 | | | $ | 23.20 | |
| | | | | | | |
| | Net investment income(a) | | | 0.41 | | | | 0.89 | | | | 0.87 | | | | 0.86 | | | | 0.85 | | | | 0.91 | |
| | | | | | | |
| | Net realized and unrealized gain (loss) | | | (1.75 | ) | | | 2.05 | | | | (1.03 | ) | | | 1.20 | | | | (0.16 | ) | | | (1.01 | ) |
| | | | | | | |
| | Total from investment operations | | | (1.34 | ) | | | 2.94 | | | | (0.16 | ) | | | 2.06 | | | | 0.69 | | | | (0.10 | ) |
| | | | | | | |
| | Distributions to shareholders from net investment income | | | (0.42 | ) | | | (0.89 | ) | | | (0.86 | ) | | | (0.85 | ) | | | (0.85 | ) | | | (0.86 | ) |
| | | | | | | |
| | Distributions to shareholders from return of capital | | | — | | | | — | | | | (0.03 | ) | | | (0.05 | ) | | | — | | | | (0.10 | ) |
| | | | | | | |
| | Total distributions | | | (0.42 | ) | | | (0.89 | ) | | | (0.89 | ) | | | (0.90 | ) | | | (0.85 | ) | | | (0.96 | ) |
| | | | | | | |
| | Net asset value, end of period | | $ | 22.38 | | | $ | 24.14 | | | $ | 22.09 | | | $ | 23.14 | | | $ | 21.98 | | | $ | 22.14 | |
| | | | | | | |
| | Total return(b) | | | (5.59 | )% | | | 13.59 | % | | | (0.77 | )% | | | 9.51 | % | | | 3.28 | % | | | (0.45 | )% |
| | | | | | | |
| | Net assets, end of period (in 000s) | | $ | 248,244 | | | $ | 263,228 | | | $ | 239,226 | | | $ | 302,778 | | | $ | 142,813 | | | $ | 130,575 | |
| | | | | | | |
| | Ratio of net expenses to average net assets | | | 0.72 | %(c) | | | 0.70 | % | | | 0.72 | % | | | 0.73 | % | | | 0.73 | % | | | 0.72 | % |
| | | | | | | |
| | Ratio of total expenses to average net assets | | | 0.74 | %(c) | | | 0.75 | % | | | 0.77 | % | | | 0.85 | % | | | 0.85 | % | | | 0.85 | % |
| | | | | | | |
| | Ratio of net investment income to average net assets | | | 3.48 | %(c) | | | 3.87 | % | | | 3.79 | % | | | 3.77 | % | | | 3.96 | % | | | 3.98 | % |
| | | | | | | |
| | Portfolio turnover rate(d) | | | 22 | % | | | 47 | % | | | 42 | % | | | 51 | % | | | 80 | % | | | 57 | % |
| | (a) | | Calculated based on the average shares outstanding methodology. |
| | (b) | | Assumes investment at the NAV at the beginning of the period, reinvestment of all dividends and distributions, a complete redemption of the investment at the NAV at the end of the period and no sales or redemption charges (if any). Total returns would be reduced if a sales or redemption charge was taken into account. Returns do not reflect the impact of taxes to shareholders relating to Fund distributions or the redemption of Fund shares. Total returns for periods less than one full year are not annualized. |
| | (d) | | The Fund’s portfolio turnover rate is calculated in accordance with regulatory requirements, without regard to transactions involving short term investments and certain derivatives. If such transactions were included, the Fund’s portfolio turnover rate may be higher. |
| | |
| The accompanying notes are an integral part of these financial statements. | | 29 |
GOLDMAN SACHS INCOME BUILDER FUND
Financial Highlights(continued)
Selected Share Data for a Share Outstanding Throughout Each Period
| | | | | | | | | | | | | | |
| | | | | Goldman Sachs Income Builder Fund | |
| | | | | Class P Shares | |
| | | | | Six Months Ended
April 30, 2020
(Unaudited) | | | Year Ended
October 31, 2019 | | | Period Ended
October 31, 2018(a) | |
| | Per Share Data | |
| | | | |
| | Net asset value, beginning of period | | $ | 24.21 | | | $ | 22.15 | | | $ | 22.95 | |
| | | | |
| | Net investment income(b) | | | 0.42 | | | | 0.94 | | | | 0.45 | |
| | | | |
| | Net realized and unrealized gain (loss) | | | (1.74 | ) | | | 2.05 | | | | (0.71 | ) |
| | | | |
| | Total from investment operations | | | (1.32 | ) | | | 2.99 | | | | (0.26 | ) |
| | | | |
| | Distributions to shareholders from net investment income | | | (0.44 | ) | | | (0.93 | ) | | | (0.51 | ) |
| | | | |
| | Distributions to shareholder from return of capital | | | — | | | | — | | | | (0.03 | ) |
| | | | |
| | Total distributions | | | (0.44 | ) | | | (0.93 | ) | | | (0.54 | ) |
| | | | |
| | Net asset value, end of period | | $ | 22.45 | | | $ | 24.21 | | | $ | 22.15 | |
| | | | |
| | Total return(c) | | | (5.51 | )% | | | 13.77 | % | | | (1.18 | )% |
| | | | |
| | Net assets, end of period (in 000s) | | $ | 12,389 | | | $ | 13,919 | | | $ | 16,122 | |
| | | | |
| | Ratio of net expenses to average net assets | | | 0.58 | %(d) | | | 0.56 | % | | | 0.58 | %(d) |
| | | | |
| | Ratio of total expenses to average net assets | | | 0.60 | %(d) | | | 0.61 | % | | | 0.58 | %(d) |
| | | | |
| | Ratio of net investment income to average net assets | | | 3.59 | %(d) | | | 4.04 | % | | | 3.60 | %(d) |
| | | | |
| | Portfolio turnover rate(e) | | | 22 | % | | | 47 | % | | | 42 | % |
| | (a) | | Commenced operations on April 16, 2018. |
| | (b) | | Calculated based on the average shares outstanding methodology. |
| | (c) | | Assumes investment at the NAV at the beginning of the period, reinvestment of all dividends and distributions, a complete redemption of the investment at the NAV at the end of the period and no sales or redemption charges (if any). Total returns would be reduced if a sales or redemption charge was taken into account. Returns do not reflect the impact of taxes to shareholders relating to Fund distributions or the redemption of Fund shares. Total returns for periods less than one full year are not annualized. |
| | (e) | | The Fund’s portfolio turnover rate is calculated in accordance with regulatory requirements, without regard to transactions involving short term investments and certain derivatives. If such transactions were included, the Fund’s portfolio turnover rate may be higher. |
| | |
| 30 | | The accompanying notes are an integral part of these financial statements. |
GOLDMAN SACHS INCOME BUILDER FUND
Financial Highlights(continued)
Selected Share Data for a Share Outstanding Throughout Each Period
| | | | | | | | | | | | | | | | | | | | | | | | | | |
| | | | | Goldman Sachs Income Builder Fund | |
| | | | | Class R6 Shares | |
| | | | | Six Months Ended
April 30, 2020
(Unaudited) | | | Year Ended October 31, | | | Period Ended
October 31, 2015(a) | |
| | | | | 2019 | | | 2018 | | | 2017 | | | 2016 | |
| | Per Share Data | |
| | | | | | | |
| | Net asset value, beginning of period | | $ | 24.21 | | | $ | 22.15 | | | $ | 23.20 | | | $ | 22.04 | | | $ | 22.20 | | | $ | 22.83 | |
| | | | | | | |
| | Net investment income(b) | | | 0.42 | | | | 0.93 | | | | 0.85 | | | | 0.90 | | | | 0.89 | | | | 0.18 | |
| | | | | | | |
| | Net realized and unrealized gain (loss) | | | (1.75 | ) | | | 2.06 | | | | (0.98 | ) | | | 1.19 | | | | (0.17 | ) | | | (0.56 | ) |
| | | | | | | |
| | Total from investment operations | | | (1.33 | ) | | | 2.99 | | | | (0.13 | ) | | | 2.09 | | | | 0.72 | | | | (0.38 | ) |
| | | | | | | |
| | Distributions to shareholders from net investment income | | | (0.44 | ) | | | (0.93 | ) | | | (0.89 | ) | | | (0.88 | ) | | | (0.88 | ) | | | (0.22 | ) |
| | | | | | | |
| | Distributions to shareholder from return of capital | | | — | | | | — | | | | (0.03 | ) | | | (0.05 | ) | | | — | | | | (0.03 | ) |
| | | | | | | |
| | Total distributions | | | (0.44 | ) | | | (0.93 | ) | | | (0.92 | ) | | | (0.93 | ) | | | (0.88 | ) | | | (0.25 | ) |
| | | | | | | |
| | Net asset value, end of period | | $ | 22.44 | | | $ | 24.21 | | | $ | 22.15 | | | $ | 23.20 | | | $ | 22.04 | | | $ | 22.20 | |
| | | | | | | |
| | Total return(c) | | | (5.52 | )% | | | 13.72 | % | | | (0.62 | )% | | | 9.69 | % | | | 3.38 | % | | | (1.63 | )% |
| | | | | | | |
| | Net assets, end of period (in 000s) | | $ | 58,120 | | | $ | 10,486 | | | $ | 130 | | | $ | 11 | | | $ | 10 | | | $ | 10 | |
| | | | | | | |
| | Ratio of net expenses to average net assets | | | 0.58 | %(d) | | | 0.56 | % | | | 0.57 | % | | | 0.57 | % | | | 0.58 | % | | | 0.58 | %(d) |
| | | | | | | |
| | Ratio of total expenses to average net assets | | | 0.60 | %(d) | | | 0.61 | % | | | 0.61 | % | | | 0.69 | % | | | 0.70 | % | | | 0.69 | %(d) |
| | | | | | | |
| | Ratio of net investment income to average net assets | | | 3.66 | %(d) | | | 3.96 | % | | | 3.72 | % | | | 3.93 | % | | | 4.12 | % | | | 3.15 | %(d) |
| | | | | | | |
| | Portfolio turnover rate(e) | | | 22 | % | | | 47 | % | | | 42 | % | | | 51 | % | | | 80 | % | | | 57 | % |
| | (a) | | Commenced operations on July 31, 2015. |
| | (b) | | Calculated based on the average shares outstanding methodology. |
| | (c) | | Assumes investment at the NAV at the beginning of the period, reinvestment of all dividends and distributions, a complete redemption of the investment at the NAV at the end of the period and no sales or redemption charges (if any). Total returns would be reduced if a sales or redemption charge was taken into account. Returns do not reflect the impact of taxes to shareholders relating to Fund distributions or the redemption of Fund shares. Total returns for periods less than one full year are not annualized. |
| | (e) | | The Fund’s portfolio turnover rate is calculated in accordance with regulatory requirements, without regard to transactions involving short term investments and certain derivatives. If such transactions were included, the Fund’s portfolio turnover rate may be higher. |
| | |
| The accompanying notes are an integral part of these financial statements. | | 31 |
GOLDMAN SACHS RISING DIVIDEND GROWTH FUND
Financial Highlights(continued)
Selected Share Data for a Share Outstanding Throughout Each Period
| | | | | | | | | | | | | | | | | | | | | | | | | | |
| | | | | Goldman Sachs Rising Dividend Growth Fund | |
| | | | | Class A Shares | |
| | | | | Six Months Ended
April 30, 2020
(Unaudited) | | | Year Ended October 31, | |
| | | | | 2019 | | | 2018 | | | 2017 | | | 2016 | | | 2015 | |
| | Per Share Data | |
| | | | | | | |
| | Net asset value, beginning of period | | $ | 11.18 | | | $ | 19.56 | | | $ | 22.54 | | | $ | 19.66 | | | $ | 20.68 | | | $ | 21.25 | |
| | | | | | | |
| | Net investment income(a) | | | 0.04 | | | | 0.10 | | | | 0.09 | | | | 0.11 | | | | 0.07 | | | | 0.06 | |
| | | | | | | |
| | Net realized and unrealized gain (loss) | | | (1.28 | ) | | | 0.78 | | | | 1.25 | | | | 3.48 | | | | (0.83 | ) | | | (0.42 | ) |
| | | | | | | |
| | Total from investment operations | | | (1.24 | ) | | | 0.88 | | | | 1.34 | | | | 3.59 | | | | (0.76 | ) | | | (0.36 | ) |
| | | | | | | |
| | Distributions to shareholders from net investment income | | | (0.11 | ) | | | (0.22 | ) | | | (0.28 | ) | | | (0.25 | ) | | | (0.12 | ) | | | (0.10 | ) |
| | | | | | | |
| | Distributions to shareholder from net realized gains | | | (0.98 | ) | | | (9.04 | ) | | | (4.04 | ) | | | (0.46 | ) | | | (0.14 | ) | | | — | |
| | | | | | | |
| | Distributions to shareholder from return of capital | | | — | | | | — | | | | — | | | | — | | | | — | | | | (0.11 | ) |
| | | | | | | |
| | Total distributions | | | (1.09 | ) | | | (9.26 | ) | | | (4.32 | ) | | | (0.71 | ) | | | (0.26 | ) | | | (0.21 | ) |
| | | | | | | |
| | Net asset value, end of period | | $ | 8.85 | | | $ | 11.18 | | | $ | 19.56 | | | $ | 22.54 | | | $ | 19.66 | | | $ | 20.68 | |
| | | | | | | |
| | Total return(b) | | | (12.53 | )% | | | 10.41 | % | | | 6.27 | % | | | 18.59 | % | | | (3.71 | )% | | | (1.72 | )% |
| | | | | | | |
| | Net assets, end of period (in 000s) | | $ | 152,550 | | | $ | 208,416 | | | $ | 297,772 | | | $ | 370,204 | | | $ | 697,430 | | | $ | 1,054,093 | |
| | | | | | | |
| | Ratio of net expenses to average net assets | | | 1.12 | %(c) | | | 1.15 | % | | | 1.17 | % | | | 1.16 | % | | | 1.14 | % | | | 1.13 | % |
| | | | | | | |
| | Ratio of total expenses to average net assets | | | 1.27 | %(c) | | | 1.27 | % | | | 1.20 | % | | | 1.19 | % | | | 1.16 | % | | | 1.15 | % |
| | | | | | | |
| | Ratio of net investment income (loss) to average net assets | | | 0.71 | %(c) | | | 0.86 | % | | | 0.42 | % | | | 0.52 | % | | | 0.35 | % | | | 0.28 | % |
| | | | | | | |
| | Portfolio turnover rate(d) | | | 10 | % | | | 45 | % | | | 101 | % | | | 45 | % | | | 16 | % | | | 25 | % |
| | (a) | | Calculated based on the average shares outstanding methodology. |
| | (b) | | Assumes investment at the NAV at the beginning of the period, reinvestment of all dividends and distributions, a complete redemption of the investment at the NAV at the end of the period and no sales or redemption charges (if any). Total returns would be reduced if a sales or redemption charge was taken into account. Returns do not reflect the impact of taxes to shareholders relating to Fund distributions or the redemption of Fund shares. Total returns for periods less than one full year are not annualized. |
| | (d) | | The Fund’s portfolio turnover rate is calculated in accordance with regulatory requirements, without regard to transactions involving short term investments and certain derivatives. If such transactions were included, the Fund’s portfolio turnover rate may be higher. |
| | |
| 32 | | The accompanying notes are an integral part of these financial statements. |
GOLDMAN SACHS RISING DIVIDEND GROWTH FUND
Financial Highlights(continued)
Selected Share Data for a Share Outstanding Throughout Each Period
| | | | | | | | | | | | | | | | | | | | | | | | | | |
| | | | | Goldman Sachs Rising Dividend Growth Fund | |
| | | | | Class C Shares | |
| | | | | Six Months Ended
April 30, 2020
(Unaudited) | | | Year Ended October 31, | |
| | | | | 2019 | | | 2018 | | | 2017 | | | 2016 | | | 2015 | |
| | Per Share Data | |
| | | | | | | |
| | Net asset value, beginning of period | | $ | 11.36 | | | $ | 19.71 | | | $ | 22.69 | | | $ | 19.79 | | | $ | 20.84 | | | $ | 21.41 | |
| | | | | | | |
| | Net investment income (loss)(a) | | | — | (b) | | | 0.01 | | | | (0.07 | ) | | | (0.05 | ) | | | (0.08 | ) | | | (0.10 | ) |
| | | | | | | |
| | Net realized and unrealized gain (loss) | | | (1.30 | ) | | | 0.80 | | | | 1.26 | | | | 3.50 | | | | (0.84 | ) | | | (0.42 | ) |
| | | | | | | |
| | Total from investment operations | | | (1.30 | ) | | | 0.81 | | | | 1.19 | | | | 3.45 | | | | (0.92 | ) | | | (0.52 | ) |
| | | | | | | |
| | Distributions to shareholders from net investment income | | | (0.07 | ) | | | (0.12 | ) | | | (0.13 | ) | | | (0.13 | ) | | | (0.06 | ) | | | (0.02 | ) |
| | | | | | | |
| | Distributions to shareholders from net realized gains | | | (0.98 | ) | | | (9.04 | ) | | | (4.04 | ) | | | (0.42 | ) | | | (0.07 | ) | | | — | |
| | | | | | | |
| | Distributions to shareholders from return of capital | | | — | | | | — | | | | — | | | | — | | | | — | | | | (0.03 | ) |
| | | | | | | |
| | Total Distributions | | | (1.05 | ) | | | (9.16 | ) | | | (4.17 | ) | | | (0.55 | ) | | | (0.13 | ) | | | (0.05 | ) |
| | | | | | | |
| | Net asset value, end of period | | $ | 9.01 | | | $ | 11.36 | | | $ | 19.71 | | | $ | 22.69 | | | $ | 19.79 | | | $ | 20.84 | |
| | | | | | | |
| | Total return(c) | | | (12.90 | )% | | | 9.55 | % | | | 5.49 | % | | | 17.68 | % | | | (4.43 | )% | | | (2.44 | )% |
| | | | | | | |
| | Net assets, end of period (in 000s) | | $ | 135,397 | | | $ | 194,302 | | | $ | 348,220 | | | $ | 463,110 | | | $ | 571,438 | | | $ | 732,998 | |
| | | | | | | |
| | Ratio of net expenses to average net assets | | | 1.87 | %(d) | | | 1.90 | % | | | 1.92 | % | | | 1.91 | % | | | 1.89 | % | | | 1.88 | % |
| | | | | | | |
| | Ratio of total expenses to average net assets | | | 2.02 | %(d) | | | 2.02 | % | | | 1.95 | % | | | 1.94 | % | | | 1.91 | % | | | 1.90 | % |
| | | | | | | |
| | Ratio of net investment income (loss) to average net assets | | | (0.04 | )%(d) | | | 0.12 | % | | | (0.33 | )% | | | (0.23 | )% | | | (0.40 | )% | | | (0.47 | )% |
| | | | | | | |
| | Portfolio turnover rate(e) | | | 10 | % | | | 45 | % | | | 101 | % | | | 45 | % | | | 16 | % | | | 25 | % |
| | (a) | | Calculated based on the average shares outstanding methodology. |
| | (b) | | Amount is less than $0.005. |
| | (c) | | Assumes investment at the NAV at the beginning of the period, reinvestment of all dividends and distributions, a complete redemption of the investment at the NAV at the end of the period and no sales or redemption charges (if any). Total returns would be reduced if a sales or redemption charge was taken into account. Returns do not reflect the impact of taxes to shareholders relating to Fund distributions or the redemption of Fund shares. Total returns for periods less than one full year are not annualized. |
| | (e) | | The Fund’s portfolio turnover rate is calculated in accordance with regulatory requirements, without regard to transactions involving short term investments and certain derivatives. If such transactions were included, the Fund’s portfolio turnover rate may be higher. |
| | |
| The accompanying notes are an integral part of these financial statements. | | 33 |
GOLDMAN SACHS RISING DIVIDEND GROWTH FUND
Financial Highlights(continued)
Selected Share Data for a Share Outstanding Throughout Each Period
| | | | | | | | | | | | | | | | | | | | | | | | | | |
| | | | | Goldman Sachs Rising Dividend Growth Fund | |
| | | | | Institutional Shares | |
| | | | | Six Months Ended
April 30, 2020
(Unaudited) | | | Year Ended October 31, | |
| | | | | 2019 | | | 2018 | | | 2017 | | | 2016 | | | 2015 | |
| | Per Share Data | |
| | | | | | | |
| | Net asset value, beginning of period | | $ | 11.76 | | | $ | 20.08 | | | $ | 23.02 | | | $ | 20.08 | | | $ | 21.12 | | | $ | 21.69 | |
| | | | | | | |
| | Net investment income(a) | | | 0.05 | | | | 0.15 | | | | 0.18 | | | | 0.20 | | | | 0.15 | | | | 0.15 | |
| | | | | | | |
| | Net realized and unrealized gain (loss) | | | (1.34 | ) | | | 0.83 | | | | 1.28 | | | | 3.55 | | | | (0.85 | ) | | | (0.43 | ) |
| | | | | | | |
| | Total from investment operations | | | (1.29 | ) | | | 0.98 | | | | 1.46 | | | | 3.75 | | | | (0.70 | ) | | | (0.28 | ) |
| | | | | | | |
| | Distributions to shareholders from net investment income | | | (0.13 | ) | | | (0.26 | ) | | | (0.36 | ) | | | (0.31 | ) | | | (0.15 | ) | | | (0.14 | ) |
| | | | | | | |
| | Distributions to shareholders from net realized gains | | | (0.98 | ) | | | (9.04 | ) | | | (4.04 | ) | | | (0.50 | ) | | | (0.19 | ) | | | — | |
| | | | | | | |
| | Distributions to shareholders from return of capital | | | — | | | | — | | | | — | | | | — | | | | — | | | | (0.15 | ) |
| | | | | | | |
| | Total Distributions | | | (1.11 | ) | | | (9.30 | ) | | | (4.40 | ) | | | (0.81 | ) | | | (0.34 | ) | | | (0.29 | ) |
| | | | | | | |
| | Net asset value, end of period | | $ | 9.36 | | | $ | 11.76 | | | $ | 20.08 | | | $ | 23.02 | | | $ | 20.08 | | | $ | 21.12 | |
| | | | | | | |
| | Total return(b) | | | (12.43 | )% | | | 10.85 | % | | | 6.75 | % | | | 19.01 | % | | | (3.35 | )% | | | (1.29 | )% |
| | | | | | | |
| | Net assets, end of period (in 000s) | | $ | 128,962 | | | $ | 191,509 | | | $ | 425,555 | | | $ | 759,274 | | | $ | 958,317 | | | $ | 1,476,799 | |
| | | | | | | |
| | Ratio of net expenses to average net assets | | | 0.80 | %(c) | | | 0.80 | % | | | 0.78 | % | | | 0.76 | % | | | 0.74 | % | | | 0.73 | % |
| | | | | | | |
| | Ratio of total expenses to average net assets | | | 0.89 | %(c) | | | 0.88 | % | | | 0.81 | % | | | 0.79 | % | | | 0.76 | % | | | 0.74 | % |
| | | | | | | |
| | Ratio of net investment income to average net assets | | | 1.02 | %(c) | | | 1.25 | % | | | 0.83 | % | | | 0.92 | % | | | 0.74 | % | | | 0.67 | % |
| | | | | | | |
| | Portfolio turnover rate(d) | | | 10 | % | | | 45 | % | | | 101 | % | | | 45 | % | | | 16 | % | | | 25 | % |
| | (a) | | Calculated based on the average shares outstanding methodology. |
| | (b) | | Assumes investment at the NAV at the beginning of the period, reinvestment of all dividends and distributions, a complete redemption of the investment at the NAV at the end of the period and no sales or redemption charges (if any). Total returns would be reduced if a sales or redemption charge was taken into account. Returns do not reflect the impact of taxes to shareholders relating to Fund distributions or the redemption of Fund shares. Total returns for periods less than one full year are not annualized. |
| | (d) | | The Fund’s portfolio turnover rate is calculated in accordance with regulatory requirements, without regard to transactions involving short term investments and certain derivatives. If such transactions were included, the Fund’s portfolio turnover rate may be higher. |
| | |
| 34 | | The accompanying notes are an integral part of these financial statements. |
GOLDMAN SACHS RISING DIVIDEND GROWTH FUND
Financial Highlights(continued)
Selected Share Data for a Share Outstanding Throughout Each Period
| | | | | | | | | | | | | | | | | | | | | | | | | | |
| | | | | Goldman Sachs Rising Dividend Growth Fund | |
| | | | | Investor Shares | |
| | | | | Six Months Ended
April 30, 2020
(Unaudited) | | | Year Ended October 31, | |
| | | | | 2019 | | | 2018 | | | 2017 | | | 2016 | | | 2015 | |
| | Per Share Data | |
| | | | | | | |
| | Net asset value, beginning of period | | $ | 11.75 | | | $ | 20.07 | | | $ | 23.01 | | | $ | 20.07 | | | $ | 21.10 | | | $ | 21.68 | |
| | | | | | | |
| | Net investment income(a) | | | 0.05 | | | | 0.14 | | | | 0.14 | | | | 0.17 | | | | 0.12 | | | | 0.11 | |
| | | | | | | |
| | Net realized and unrealized gain (loss) | | | (1.36 | ) | | | 0.83 | | | | 1.29 | | | | 3.54 | | | | (0.84 | ) | | | (0.43 | ) |
| | | | | | | |
| | Total from investment operations | | | (1.31 | ) | | | 0.97 | | | | 1.43 | | | | 3.71 | | | | (0.72 | ) | | | (0.32 | ) |
| | | | | | | |
| | Distributions to shareholders from net investment income | | | (0.12 | ) | | | (0.25 | ) | | | (0.33 | ) | | | (0.27 | ) | | | (0.14 | ) | | | (0.13 | ) |
| | | | | | | |
| | Distributions to shareholders from net realized gains | | | (0.98 | ) | | | (9.04 | ) | | | (4.04 | ) | | | (0.50 | ) | | | (0.17 | ) | | | — | |
| | | | | | | |
| | Distributions to shareholders from return of capital | | | — | | | | — | | | | — | | | | — | | | | — | | | | (0.13 | ) |
| | | | | | | |
| | Total distributions | | | (1.10 | ) | | | (9.29 | ) | | | (4.37 | ) | | | (0.77 | ) | | | (0.31 | ) | | | (0.26 | ) |
| | | | | | | |
| | Net asset value, end of period | | $ | 9.34 | | | $ | 11.75 | | | $ | 20.07 | | | $ | 23.01 | | | $ | 20.07 | | | $ | 21.10 | |
| | | | | | | |
| | Total return(b) | | | (12.49 | )% | | | 10.73 | % | | | 6.56 | % | | | 18.85 | % | | | (3.45 | )% | | | (1.49 | )% |
| | | | | | | |
| | Net assets, end of period (in 000s) | | $ | 70,419 | | | $ | 105,498 | | | $ | 227,158 | | | $ | 362,752 | | | $ | 272,442 | | | $ | 437,422 | |
| | | | | | | |
| | Ratio of net expenses to average net assets | | | 0.87 | %(c) | | | 0.90 | % | | | 0.92 | % | | | 0.91 | % | | | 0.89 | % | | | 0.88 | % |
| | | | | | | |
| | Ratio of total expenses to average net assets | | | 1.02 | %(c) | | | 1.02 | % | | | 0.95 | % | | | 0.94 | % | | | 0.91 | % | | | 0.89 | % |
| | | | | | | |
| | Ratio of net investment income to average net assets | | | 0.95 | %(c) | | | 1.13 | % | | | 0.68 | % | | | 0.79 | % | | | 0.59 | % | | | 0.53 | % |
| | | | | | | |
| | Portfolio turnover rate(d) | | | 10 | % | | | 45 | % | | | 101 | % | | | 45 | % | | | 16 | % | | | 25 | % |
| | (a) | | Calculated based on the average shares outstanding methodology. |
| | (b) | | Assumes investment at the NAV at the beginning of the period, reinvestment of all dividends and distributions, a complete redemption of the investment at the NAV at the end of the period and no sales or redemption charges (if any). Total returns would be reduced if a sales or redemption charge was taken into account. Returns do not reflect the impact of taxes to shareholders relating to Fund distributions or the redemption of Fund shares. Total returns for periods less than one full year are not annualized. |
| | (d) | | The Fund’s portfolio turnover rate is calculated in accordance with regulatory requirements, without regard to transactions involving short term investments and certain derivatives. If such transactions were included, the Fund’s portfolio turnover rate may be higher. |
| | |
| The accompanying notes are an integral part of these financial statements. | | 35 |
GOLDMAN SACHS RISING DIVIDEND GROWTH FUND
Financial Highlights(continued)
Selected Share Data for a Share Outstanding Throughout Each Period
| | | | | | | | | | | | | | |
| | | | | Goldman Sachs Rising Dividend Growth Fund | |
| | | | | Class P Shares | |
| | | | | Six Months Ended
April 30, 2020
(Unaudited) | | | Year Ended
October 31, 2019 | | | Period Ended
October 31, 2018(a) | |
| | Per Share Data | |
| | | | |
| | Net asset value, beginning of period | | $ | 11.76 | | | $ | 20.08 | | | $ | 20.21 | |
| | | | |
| | Net investment income (loss)(b) | | | 0.06 | | | | 0.15 | | | | (0.04 | ) |
| | | | |
| | Net realized and unrealized gain (loss) | | | (1.35 | ) | | | 0.84 | | | | 0.25 | |
| | | | |
| | Total from investment operations | | | (1.29 | ) | | | 0.99 | | | | 0.21 | |
| | | | |
| | Distributions to shareholders from net investment income | | | (0.13 | ) | | | (0.27 | ) | | | (0.21 | ) |
| | | | |
| | Distributions to shareholder from net realized gains | | | (0.98 | ) | | | (9.04 | ) | | | (0.13 | ) |
| | | | |
| | Total distributions | | | (1.11 | ) | | | (9.31 | ) | | | (0.34 | ) |
| | | | |
| | Net asset value, end of period | | $ | 9.36 | | | $ | 11.76 | | | $ | 20.08 | |
| | | | |
| | Total return(c) | | | (12.43 | )% | | | 10.86 | % | | | 1.03 | % |
| | | | |
| | Net assets, end of period (in 000s) | | $ | 9,011 | | | $ | 21,171 | | | $ | 41,067 | |
| | | | |
| | Ratio of net expenses to average net assets | | | 0.79 | %(d) | | | 0.79 | % | | | 0.77 | %(d) |
| | | | |
| | Ratio of total expenses to average net assets | | | 0.88 | %(d) | | | 0.87 | % | | | 0.81 | %(d) |
| | | | |
| | Ratio of net investment income to average net assets | | | 1.03 | %(d) | | | 1.24 | % | | | (0.37 | )%(d) |
| | | | |
| | Portfolio turnover rate(e) | | | 10 | % | | | 45 | % | | | 101 | % |
| | (a) | | Commenced operations on April 16, 2018. |
| | (b) | | Calculated based on the average shares outstanding methodology. |
| | (c) | | Assumes investment at the NAV at the beginning of the period, reinvestment of all dividends and distributions, a complete redemption of the investment at the NAV at the end of the period and no sales or redemption charges (if any). Total returns would be reduced if a sales or redemption charge was taken into account. Returns do not reflect the impact of taxes to shareholders relating to Fund distributions or the redemption of Fund shares. Total returns for periods less than one full year are not annualized. |
| | (e) | | The Fund’s portfolio turnover rate is calculated in accordance with regulatory requirements, without regard to transactions involving short term investments and certain derivatives. If such transactions were included, the Fund’s portfolio turnover rate may be higher. |
| | |
| 36 | | The accompanying notes are an integral part of these financial statements. |
GOLDMAN SACHS RISING DIVIDEND GROWTH FUND
Financial Highlights(continued)
Selected Share Data for a Share Outstanding Throughout Each Period
| | | | | | | | | | | | | | | | | | | | | | | | | | |
| | | | | Goldman Sachs Rising Dividend Growth Fund | |
| | | | | Class R Shares | |
| | | | | Six Months Ended
April 30, 2020
(Unaudited) | | | Year Ended October 31, | |
| | | | | 2019 | | | 2018 | | | 2017 | | | 2016 | | | 2015 | |
| | Per Share Data | |
| | | | | | | |
| | Net asset value, beginning of period | | $ | 11.13 | | | $ | 19.51 | | | $ | 22.49 | | | $ | 19.63 | | | $ | 20.66 | | | $ | 21.20 | |
| | | | | | | |
| | Net investment income(a) | | | 0.02 | | | | 0.07 | | | | 0.04 | | | | 0.06 | | | | 0.02 | | | | 0.01 | |
| | | | | | | |
| | Net realized and unrealized gain (loss) | | | (1.27 | ) | | | 0.78 | | | | 1.25 | | | | 3.47 | | | | (0.84 | ) | | | (0.43 | ) |
| | | | | | | |
| | Total from investment operations | | | (1.25 | ) | | | 0.85 | | | | 1.29 | | | | 3.53 | | | | (0.82 | ) | | | (0.42 | ) |
| | | | | | | |
| | Distributions to shareholders from net investment income | | | (0.09 | ) | | | (0.19 | ) | | | (0.23 | ) | | | (0.21 | ) | | | (0.08 | ) | | | (0.06 | ) |
| | | | | | | |
| | Distributions to shareholders from net realized gains | | | (0.98 | ) | | | (9.04 | ) | | | (4.04 | ) | | | (0.46 | ) | | | (0.13 | ) | | | — | |
| | | | | | | |
| | Distributions to shareholders from return of capital | | | — | | | | — | | | | — | | | | — | | | | — | | | | (0.06 | ) |
| | | | | | | |
| | Total distributions | | | (1.07 | ) | | | (9.23 | ) | | | (4.27 | ) | | | (0.67 | ) | | | (0.21 | ) | | | (0.12 | ) |
| | | | | | | |
| | Net asset value, end of period | | $ | 8.81 | | | $ | 11.13 | | | $ | 19.51 | | | $ | 22.49 | | | $ | 19.63 | | | $ | 20.66 | |
| | | | | | | |
| | Total return(b) | | | (12.64 | )% | | | 10.08 | % | | | 6.07 | % | | | 18.27 | % | | | (3.96 | )% | | | (2.00 | )% |
| | | | | | | |
| | Net assets, end of period (in 000s) | | $ | 1,385 | | | $ | 2,575 | | | $ | 3,484 | | | $ | 4,506 | | | $ | 4,749 | | | $ | 3,740 | |
| | | | | | | |
| | Ratio of net expenses to average net assets | | | 1.37 | %(c) | | | 1.40 | % | | | 1.42 | % | | | 1.41 | % | | | 1.39 | % | | | 1.38 | % |
| | | | | | | |
| | Ratio of total expenses to average net assets | | | 1.52 | %(c) | | | 1.52 | % | | | 1.45 | % | | | 1.44 | % | | | 1.41 | % | | | 1.39 | % |
| | | | | | | |
| | Ratio of net investment income to average net assets | | | 0.49 | %(c) | | | 0.61 | % | | | 0.18 | % | | | 0.27 | % | | | 0.10 | % | | | 0.05 | % |
| | | | | | | |
| | Portfolio turnover rate(d) | | | 10 | % | | | 45 | % | | | 101 | % | | | 45 | % | | | 16 | % | | | 25 | % |
| | (a) | | Calculated based on the average shares outstanding methodology. |
| | (b) | | Assumes investment at the NAV at the beginning of the period, reinvestment of all dividends and distributions, a complete redemption of the investment at the NAV at the end of the period and no sales or redemption charges (if any). Total returns would be reduced if a sales or redemption charge was taken into account. Returns do not reflect the impact of taxes to shareholders relating to Fund distributions or the redemption of Fund shares. Total returns for periods less than one full year are not annualized. |
| | (d) | | The Fund’s portfolio turnover rate is calculated in accordance with regulatory requirements, without regard to transactions involving short term investments and certain derivatives. If such transactions were included, the Fund’s portfolio turnover rate may be higher. |
| | |
| The accompanying notes are an integral part of these financial statements. | | 37 |
GOLDMAN SACHS RISING DIVIDEND GROWTH FUND
Financial Highlights(continued)
Selected Share Data for a Share Outstanding Throughout Each Period
| | | | | | | | | | | | | | |
| | | | | Goldman Sachs Rising Dividend Growth Fund | |
| | | | | Class R6 Shares | |
| | | | | Six Months Ended
April 30, 2020
(Unaudited) | | | Year Ended
October 31, 2019 | | | Period Ended
October 31, 2018(a) | |
| | Per Share Data | |
| | | | |
| | Net asset value, beginning of period | | $ | 11.76 | | | $ | 20.08 | | | $ | 20.18 | |
| | | | |
| | Net investment income(b) | | | 0.05 | | | | 0.14 | | | | 0.02 | |
| | | | |
| | Net realized and unrealized gain (loss) | | | (1.35 | ) | | | 0.85 | | | | 0.29 | |
| | | | |
| | Total from investment operations | | | (1.30 | ) | | | 0.99 | | | | 0.31 | |
| | | | |
| | Distributions to shareholders from net investment income | | | (0.13 | ) | | | (0.27 | ) | | | (0.28 | ) |
| | | | |
| | Distributions to shareholder from net realized gains | | | (0.98 | ) | | | (9.04 | ) | | | (0.13 | ) |
| | | | |
| | Total distributions | | | (1.11 | ) | | | (9.31 | ) | | | (0.41 | ) |
| | | | |
| | Net asset value, end of period | | $ | 9.35 | | | $ | 11.76 | | | $ | 20.08 | |
| | | | |
| | Total return(c) | | | (12.44 | )% | | | 10.78 | % | | | 1.54 | % |
| | | | |
| | Net assets, end of period (in 000s) | | $ | 1,985 | | | $ | 2,240 | | | $ | 10 | |
| | | | |
| | Ratio of net expenses to average net assets | | | 0.79 | %(d) | | | 0.80 | % | | | 0.77 | %(d) |
| | | | |
| | Ratio of total expenses to average net assets | | | 0.88 | %(d) | | | 0.89 | % | | | 0.80 | %(d) |
| | | | |
| | Ratio of net investment income to average net assets | | | 1.01 | %(d) | | | 1.19 | % | | | 0.16 | %(d) |
| | | | |
| | Portfolio turnover rate(e) | | | 10 | % | | | 45 | % | | | 101 | % |
| | (a) | | Commenced operations on February 28, 2018. |
| | (b) | | Calculated based on the average shares outstanding methodology. |
| | (c) | | Assumes investment at the NAV at the beginning of the period, reinvestment of all dividends and distributions, a complete redemption of the investment at the NAV at the end of the period and no sales or redemption charges (if any). Total returns would be reduced if a sales or redemption charge was taken into account. Returns do not reflect the impact of taxes to shareholders relating to Fund distributions or the redemption of Fund shares. Total returns for periods less than one full year are not annualized. |
| | (e) | | The Fund’s portfolio turnover rate is calculated in accordance with regulatory requirements, without regard to transactions involving short term investments and certain derivatives. If such transactions were included, the Fund’s portfolio turnover rate may be higher. |
| | |
| 38 | | The accompanying notes are an integral part of these financial statements. |
GOLDMAN SACHS DIVIDEND FOCUS FUNDS
Notes to Financial Statements
April 30, 2020 (Unaudited)
Goldman Sachs Trust (the “Trust”) is a Delaware statutory trust registered under the Investment Company Act of 1940, as amended (the “Act”), as anopen-end management investment company. The following table lists those series of the Trust that are included in this report (collectively, the “Funds” or individually a “Fund”), along with their corresponding share classes and respective diversification status under the Act:
| | | | |
| Fund | | Share Classes Offered | | Diversified/
Non-diversified |
Income Builder | | A, C, Institutional, Investor, P and R6 | | Diversified |
Rising Dividend Growth | | A, C, Institutional, Investor, P, R and R6 | | Diversified |
Class A Shares are sold with afront-end sales charge of up to 5.50%. Class C Shares are sold with contingent deferred sales charge (“CDSC”) of 1.00% which is imposed on redemptions made within 12 months of purchase. Institutional, Investor, Class P, Class R and Class R6 Shares are not subject to a sales charge.
Goldman Sachs Asset Management, L.P. (“GSAM”), an affiliate of Goldman Sachs & Co. LLC (“Goldman Sachs”), serves as investment adviser to the Fund pursuant to a management agreement (the “Agreement”) with the Trust. Dividend Assets Capital, LLC (“DAC” or the “Sub Adviser”) serves as thesub-adviser to the Rising Dividend Growth Fund. GSAM compensates theSub-Adviser directly in accordance with the terms of theSub-Advisory Agreement. The Fund is not charged any separate or additional investment advisory fees by theSub-Adviser.
|
| 2. SIGNIFICANT ACCOUNTING POLICIES |
The financial statements have been prepared in accordance with accounting principles generally accepted in the United States of America (“GAAP”) and require management to make estimates and assumptions that may affect the reported amounts and disclosures. Actual results may differ from those estimates and assumptions. Each Fund is an investment company under GAAP and follows the accounting and reporting guidance applicable to investment companies.
A. Investment Valuation — The Funds’ valuation policy is to value investments at fair value.
B. Investment Income and Investments — Investment income includes interest income, dividend income and securities lending income, if any. Interest income is accrued daily and adjusted for amortization of premiums and accretion of discounts. Dividend income is recognized onex-dividend date or, for certain foreign securities, as soon as such information is obtained subsequent to theex-dividend date.Non-cash dividends, if any, are recorded at the fair market value of the securities received. Investment transactions are reflected on trade date. Realized gains and losses are calculated using identified cost. Investment transactions are recorded on the following business day for daily net asset value (“NAV”) calculations. Investment income is recorded net of any foreign withholding taxes, less any amounts reclaimable. The Funds may file withholding tax reclaims in certain jurisdictions to recover a portion of amounts previously withheld. Any foreign capital gains tax is accrued daily based upon net unrealized gains, and is payable upon sale of such investments. Distributions received from the Funds’ investments in U.S. real estate investment trusts (“REITs”) may be characterized as ordinary income, net capital gain and/or a return of capital. A return of capital is recorded by the Funds as a reduction to the cost basis of the REIT. Distributions from master limited partnerships (“MLPs”) are generally recorded based on the characterization reported on the MLP’s tax return. A Fund records itspro-rata share of the income/loss and capital gains/losses, allocated from the underlying partnerships and adjusts the cost basis of the underlying partnerships accordingly. For derivative contracts, realized gains and losses are recorded upon settlement of the contract. Upfront payments, if any, are made or received upon entering into a swap agreement and are reflected in the Statements of Assets and Liabilities. Upfront payments are recognized over the contract’s term/event as realized gains or losses, with the exception of forward starting swap contracts whose realized gains or losses are recognized from the effective start date. For securities with paydown provisions, principal payments received are treated as a proportionate reduction to the cost basis of the securities, and excess or shortfall amounts are recorded as income.
39
GOLDMAN SACHS DIVIDEND FOCUS FUNDS
Notes to Financial Statements(continued)
April 30, 2020 (Unaudited)
|
| 2. SIGNIFICANT ACCOUNTING POLICIES (continued) |
C. Class Allocations and Expenses —Investment income, realized and unrealized gain (loss), if any, andnon-class specific expenses of each Fund are allocated daily based upon the proportion of net assets of each class.Non-class specific expenses directly incurred by a Fund are charged to that Fund, while such expenses incurred by the Trust are allocated across the applicable Funds on a straight-line and/orpro-rata basis depending upon the nature of the expenses. Class specific expenses, where applicable, are borne by the respective share classes and include Distribution and Service, Transfer Agency and Service fees.
D. Federal Taxes and Distributions to Shareholders — It is each Fund’s policy to comply with the requirements of the Internal Revenue Code of 1986, as amended (the “Code”), applicable to regulated investment companies and to distribute each year substantially all of its investment company taxable income and capital gains to its shareholders. Accordingly, each Fund is not required to make any provisions for the payment of federal income tax. Distributions to shareholders are recorded on theex-dividend date. Income and capital gains distributions, if any, are declared according to the following schedule:
| | | | | | |
| Fund | | | | Income Distributions
Declared/Paid | | Capital Gains Distributions
Declared/Paid |
Income Builder | | | | Monthly | | Annually |
Rising Dividend Growth | | | | Quarterly | | Annually |
Net capital losses, if any, are carried forward to future fiscal years and may be used to the extent allowed by the Code to offset any future capital gains. Losses that are carried forward will retain their character as either short-term or long-term capital losses. Utilization of capital loss carryforwards will reduce the requirement of future capital gains distributions.
The characterization of distributions to shareholders for financial reporting purposes is determined in accordance with federal income tax rules, which may differ from GAAP. The source of each Fund’s distributions may be shown in the accompanying financial statements as either from distributable earnings or capital. Certain components of the Funds’ net assets on the Statements of Assets and Liabilities reflect permanent GAAP/tax differences based on the appropriate tax character.
E. Foreign Currency Translation — The accounting records and reporting currency of the Funds are maintained in U.S. dollars. Assets and liabilities denominated in foreign currencies are translated into U.S. dollars using the current exchange rates at the close of each business day. The effect of changes in foreign currency exchange rates on investments is included within net realized and unrealized gain (loss) on investments. Changes in the value of other assets and liabilities as a result of fluctuations in foreign exchange rates are included in the Statements of Operations within net change in unrealized gain (loss) on foreign currency translation. Transactions denominated in foreign currencies are translated into U.S. dollars on the date the transaction occurred, the effects of which are included within net realized gain (loss) on foreign currency transactions.
|
| 3. INVESTMENTS AND FAIR VALUE MEASUREMENTS |
U.S. GAAP defines the fair value of a financial instrument as the amount that would be received to sell an asset or paid to transfer a liability in an orderly transaction between market participants at the measurement date (i.e., the exit price); the Funds’ policy is to use the market approach. GAAP establishes a fair value hierarchy that prioritizes the inputs to valuation techniques used to measure fair value. The hierarchy gives the highest priority to unadjusted quoted prices in active markets for identical assets or liabilities (Level 1 measurements) and the lowest priority to unobservable inputs (Level 3 measurements). The levels used for classifying investments are not necessarily an indication of the risk associated with investing in these investments. The three levels of the fair value hierarchy are described below:
Level 1 — Unadjusted quoted prices in active markets that are accessible at the measurement date for identical, unrestricted assets or liabilities;
Level 2 — Quoted prices in markets that are not active or financial instruments for which significant inputs are observable (including, but not limited to, quoted prices for similar investments, interest rates, foreign exchange rates, volatility and credit spreads), either directly or indirectly;
40
GOLDMAN SACHS DIVIDEND FOCUS FUNDS
|
| 3. INVESTMENTS AND FAIR VALUE MEASUREMENTS (continued) |
Level 3 — Prices or valuations that require significant unobservable inputs (including GSAM’s assumptions in determining fair value measurement).
The Board of Trustees (“Trustees”) has approved Valuation Procedures that govern the valuation of the portfolio investments held by the Funds, including investments for which market quotations are not readily available. The Trustees have delegated to GSAMday-to-day responsibility for implementing and maintaining internal controls and procedures related to the valuation of the Funds’ investments. To assess the continuing appropriateness of pricing sources and methodologies, GSAM regularly performs price verification procedures and issues challenges as necessary to third party pricing vendors or brokers, and any differences are reviewed in accordance with the Valuation Procedures.
A. Level 1 and Level 2 Fair Value Investments — The valuation techniques and significant inputs used in determining the fair values for investments classified as Level 1 and Level 2 are as follows:
Equity Securities — Equity securities traded on a United States (“U.S.”) securities exchange or the NASDAQ system, or those located on certain foreign exchanges, including but not limited to the Americas, are valued daily at their last sale price or official closing price on the principal exchange or system on which they are traded. If there is no sale or official closing price or such price is believed by GSAM to not represent fair value, equity securities may be valued at the closing bid price for long positions and at the closing ask price for short positions. To the extent these investments are actively traded, they are classified as Level 1 of the fair value hierarchy, otherwise they are generally classified as Level 2. Certain equity securities containing unique attributes may be classified as Level 2.
Unlisted equity securities for which market quotations are available are valued at the last sale price on the valuation date, or if no sale occurs, at the last bid price for long positions or the last ask price for short positions, and are generally classified as Level 2. Securities traded on certain foreign securities exchanges are valued daily at fair value determined by an independent fair value service (if available) under Valuation Procedures approved by the Trustees and consistent with applicable regulatory guidance. The independent fair value service takes into account multiple factors including, but not limited to, movements in the securities markets, certain depositary receipts, futures contracts and foreign currency exchange rates that have occurred subsequent to the close of the foreign securities exchange. These investments are generally classified as Level 2 of the fair value hierarchy.
Underlying Funds (including Money Market Funds) — Underlying funds (“Underlying Funds”) include other investment companies and exchange-traded funds (“ETFs”). Investments in the Underlying Funds (except ETFs) are valued at the NAV per share on the day of valuation. ETFs are valued daily at the last sale price or official closing price on the principal exchange or system on which the investment is traded. Because the Funds invest in Underlying Funds that fluctuate in value, the Funds’ shares will correspondingly fluctuate in value. To the extent these investments are actively traded, they are classified as Level 1 of the fair value hierarchy, otherwise they are generally classified as Level 2. For information regarding an Underlying Fund’s accounting policies and investment holdings, please see the Underlying Fund’s shareholder report.
Debt Securities — Debt securities for which market quotations are readily available are valued daily on the basis of quotations supplied by dealers or an independent pricing service approved by the Trustees. The pricing services may use valuation models or matrix pricing, which consider: (i) yield or price with respect to bonds that are considered comparable in characteristics such as rating, interest rate and maturity date or (ii) quotations from securities dealers to determine current value. With the exception of treasury securities of G7 countries, which are generally classified as Level 1, these investments are generally classified as Level 2 of the fair value hierarchy.
i. Bank Loans — Bank loans (“Loans”) are interests in amounts owed by corporate, governmental, or other borrowers to lenders or lending syndicates. Loans are arranged through private negotiations between the borrower and one or more financial institutions (“Lenders”). A Fund’s investments in Loans are in the form of either participations in Loans (“Participations”) or assignments of all or a portion of Loans from third parties (“Assignments”). With respect to Participations, a Fund has the right to receive payments of principal, interest and any fees to which it is entitled from the Lender selling the Participations and only upon receipt by the Lender of the payments from the borrower. A Fund generally has no right to enforce compliance by the borrower with the terms of the loan agreement with respect to Participations.
41
GOLDMAN SACHS DIVIDEND FOCUS FUNDS
Notes to Financial Statements(continued)
April 30, 2020 (Unaudited)
|
| 3. INVESTMENTS AND FAIR VALUE MEASUREMENTS (continued) |
Conversely, assignments result in a Fund having a direct contractual relationship with the borrower, and the Fund may be permitted to enforce compliance by the borrower with the terms of the loan agreement.
ii. Commercial Paper — Commercial paper normally represents short-term unsecured promissory notes issued in bearer form by banks or bank holding companies, corporations, finance companies and other issuers. Commercial paper consists of direct U.S. dollar-denominated obligations of domestic or foreign issuers. Asset-backed commercial paper is issued by a special purpose entity that is organized to issue the commercial paper and to purchase trade receivables or other financial assets.
iii. Mortgage-Backed and Asset-Backed Securities — Mortgage-backed securities represent direct or indirect participations in, or are collateralized by and payable from, mortgage loans secured by residential and/or commercial real estate property. Asset-backed securities include securities whose principal and interest payments are collateralized by pools of other assets or receivables. The value of certain mortgage-backed and asset-backed securities (including adjustable rate mortgage loans) may be particularly sensitive to changes in prevailing interest rates. The value of these securities may also fluctuate in response to the market’s perception of the creditworthiness of the issuers.
Asset-backed securities may present credit risks that are not presented by mortgage-backed securities because they generally do not have the benefit of a security interest in collateral that is comparable to mortgage assets. Some asset-backed securities may only have a subordinated claim on collateral.
Stripped mortgage-backed securities are usually structured with two different classes: one that receives substantially all interest payments (interest-only, or “IO” and/or high coupon rate with relatively low principal amount, or “IOette”), and the other that receives substantially all principal payments (principal-only, or “PO”) from a pool of mortgage loans. Little to no principal will be received at the maturity of an IO; as a result, periodic adjustments are recorded to reduce the cost of the security until maturity. These adjustments are included in interest income.
Derivative Contracts —A derivative is an instrument whose value is derived from underlying assets, indices, reference rates or a combination of these factors. A Fund enters into derivative transactions to hedge against changes in interest rates, securities prices, and/or currency exchange rates, to increase total return, or to gain access to certain markets or attain exposure to other underliers. For financial reporting purposes, cash collateral that has been pledged to cover obligations of a Fund and cash collateral received, if any, is reported separately on the Statements of Assets and Liabilities as receivables/payables for collateral on certain derivatives contracts.Non-cash collateral pledged by a Fund, if any, is noted in the Schedules of Investments.
Exchange-traded derivatives, including futures and options contracts, are generally valued at the last sale or settlement price on the exchange where they are principally traded. Exchange-traded options without settlement prices are generally valued at the midpoint of the bid and ask prices on the exchange where they are principally traded (or, in the absence oftwo-way trading, at the last bid price for long positions and the last ask price for short positions). Exchange-traded derivatives typically fall within Level 1 of the fair value hierarchy.Over-the-counter (“OTC”) and centrally cleared derivatives are valued using market transactions and other market evidence, including market-based inputs to models, calibration to market-clearing transactions, broker or dealer quotations, or other alternative pricing sources. Where models are used, the selection of a particular model to value OTC and centrally cleared derivatives depends upon the contractual terms of, and specific risks inherent in, the instrument, as well as the availability of pricing information in the market. Valuation models require a variety of inputs, including contractual terms, market prices, yield curves, credit curves, measures of volatility, voluntary and involuntary prepayment rates, loss severity rates and correlations of such inputs. For OTC and centrally cleared derivatives that trade in liquid markets, model inputs can generally be verified and model selection does not involve significant management judgment. OTC and centrally cleared derivatives are classified within Level 2 of the fair value hierarchy when significant inputs are corroborated by market evidence.
i. Forward Contracts — A forward contract is a contract between two parties to buy or sell an asset at a specified price on a future date. A forward contract settlement can occur on a cash or delivery basis. Forward contracts aremarked-to-market daily using independent vendor prices, and the change in value, if any, is recorded as an unrealized gain or loss. Cash and certain investments may be used to collateralize forward contracts.
42
GOLDMAN SACHS DIVIDEND FOCUS FUNDS
|
| 3. INVESTMENTS AND FAIR VALUE MEASUREMENTS (continued) |
Aforward foreign currency exchange contractis a forward contract in which a Fund agrees to receive or deliver a fixed quantity of one currency for another, at apre-determined price at a future date. All forward foreign currency exchange contracts aremarked-to-market daily at the applicable forward rate.Non-deliverable forward foreign currency exchange contracts are settled with the counterparty in cash without the delivery of foreign currency.
ii. Futures Contracts — Futures contracts are contracts to buy or sell a standardized quantity of a specified commodity or security. Upon entering into a futures contract, a Fund deposits cash or securities in an account on behalf of the broker in an amount sufficient to meet the initial margin requirement. Subsequent payments are made or received by a Fund equal to the daily change in the contract value and are recorded as variation margin receivable or payable with a corresponding offset to unrealized gains or losses.
iii. Options — When a Fund writes call or put options, an amount equal to the premium received is recorded as a liability and is subsequentlymarked-to-market to reflect the current value of the option written. Swaptions are options on interest rate swap contracts or credit default swap contracts.
Upon the purchase of a call option or a put option by a Fund, the premium paid is recorded as an investment and subsequentlymarked-to-market to reflect the current value of the option. Certain options may be purchased with premiums to be determined on a future date. The premiums for these options are based upon implied volatility parameters at specified terms.
iv. Swap Contracts — Bilateral swap contracts are agreements in which a Fund and a counterparty agree to exchange periodic payments on a specified notional amount or make a net payment upon termination. Bilateral swap transactions are privately negotiated in the OTC market and payments are settled through direct payments between a Fund and the counterparty. By contrast, certain swap transactions are subject to mandatory central clearing. These swaps are executed through a derivatives clearing member (“DCM”), acting in an agency capacity, and submitted to a central counterparty (“CCP”) (“centrally cleared swaps”), in which case all payments are settled with the CCP through the DCM. Swaps aremarked-to-market daily using pricing vendor quotations, counterparty or clearinghouse prices or model prices, and the change in value, if any, is recorded as an unrealized gain or loss. Upon entering into a swap contract, a Fund is required to satisfy an initial margin requirement by delivering cash or securities to the counterparty (or in some cases, segregated in a triparty account on behalf of the counterparty), which can be adjusted by anymark-to-market gains or losses pursuant to bilateral or centrally cleared arrangements. For centrally cleared swaps the daily change in valuation, if any, is recorded as a receivable or payable for variation margin.
An interest rate swap is an agreement that obligates two parties to exchange a series of cash flows at specified intervals, based upon or calculated by reference to changes in interest rates on a specified notional principal amount. The payment flows are usually netted against each other, with the difference being paid by one party to the other.
B. Level 3 Fair Value Investments— To the extent that significant inputs to valuation models and other alternative pricing sources are unobservable, or if quotations are not readily available, or if GSAM believes that such quotations do not accurately reflect fair value, the fair value of a Fund’s investments may be determined under Valuation Procedures approved by the Trustees. GSAM, consistent with its procedures and applicable regulatory guidance, may make an adjustment to the most recent valuation prices of either domestic or foreign securities in light of significant events to reflect what it believes to be the fair value of the securities at the time of determining a Fund’s NAV. To the extent investments are valued using single source broker quotations obtained directly from the broker or passed through from third party pricing vendors, such investments are classified as Level 3 investments. GSAM did not develop the unobservable inputs for valuation of Level 3 Assets and Liabilities.
43
GOLDMAN SACHS DIVIDEND FOCUS FUNDS
Notes to Financial Statements(continued)
April 30, 2020 (Unaudited)
|
| 3. INVESTMENTS AND FAIR VALUE MEASUREMENTS (continued) |
C. Fair Value Hierarchy — The following is a summary of the Funds’ investments and derivatives classified in the fair value hierarchy as of April 30, 2020:
| | | | | | | | | | | | |
|
| INCOME BUILDER | |
| | | |
| Investment Type | | Level 1 | | | Level 2 | | | Level 3 | |
| | | |
| Assets | | | | | | | | | | | | |
| | | |
Common Stock and/or Other Equity Investments(a) | | | | | | | | | | | | |
| | | |
Asia | | $ | 5,268,617 | | | $ | — | | | $ | — | |
| | | |
Europe | | | 128,073,867 | | | | — | | | | — | |
| | | |
North America | | | 438,226,645 | | | | 8,704,100 | | | | 48,685 | |
| | | |
Fixed Income | | | | | | | | | | | | |
| | | |
Corporate Obligations | | | — | | | | 794,320,570 | | | | — | |
| | | |
Mortgage-Backed Obligations | | | — | | | | 186,197 | | | | — | |
| | | |
Foreign Debt Obligations | | | — | | | | 3,299,586 | | | | — | |
| | | |
Bank Loans | | | — | | | | 106,912,382 | | | | — | |
| | | |
U.S. Treasury Obligations | | | 1,748,652 | | | | — | | | | — | |
| | | |
Investment Companies | | | 119,380,808 | | | | — | | | | — | |
| | | |
Securities Lending Reinvestment Vehicle | | | 12,020,491 | | | | — | | | | — | |
| | | |
| Total | | $ | 704,719,080 | | | $ | 913,422,835 | | | $ | 48,685 | |
| | | |
| Liabilities(b) | | | | | | | | | | | | |
| | | |
Unfunded Loan Commitment | | $ | — | | | $ | (22,734 | ) | | $ | — | |
| | | |
| Derivative Type | | | | | | | | | |
| | | |
| Assets(b) | | | | | | | | | | | | |
| | | |
Forward Foreign Currency Exchange Contracts | | $ | — | | | $ | 239 | | | $ | — | |
| | | |
Futures Contracts | | | 11,615,570 | | | | — | | | | — | |
| | | |
Interest Rate Swap Contracts | | | — | | | | 25,207,162 | | | | — | |
| | | |
| Total | | $ | 11,615,570 | | | $ | 25,207,401 | | | $ | — | |
| | | |
| Liabilities(b) | | | | | | | | | | | | |
| | | |
Forward Foreign Currency Exchange Contracts | | $ | — | | | $ | (92,066 | ) | | $ | — | |
| | | |
Futures Contracts | | | (2,094,129 | ) | | | — | | | | — | |
| | | |
Interest Rate Swap Contracts | | | — | | | | (33,495 | ) | | | — | |
| | | |
| Total | | $ | (2,094,129 | ) | | $ | (125,561 | ) | | $ | — | |
| (a) | | Amounts are disclosed by continent to highlight the impact of time zone differences between local market close and the calculation of net asset value. Security valuations are based on the principal exchange or system on which they are traded, which may differ from country of domicile. The Funds utilize fair value model prices provided by an independent fair value service for international equities, resulting in a Level 2 classification. |
| (b) | | Amount shown represents unrealized gain (loss) at period end. |
44
GOLDMAN SACHS DIVIDEND FOCUS FUNDS
|
| 3. INVESTMENTS AND FAIR VALUE MEASUREMENTS (continued) |
| | | | | | | | | | | | |
|
| RISING DIVIDEND GROWTH | |
| | | |
| Investment Type | | Level 1 | | | Level 2 | | | Level 3 | |
| | | |
| Assets | | | | | | | | | | | | |
| | | |
Common Stock and/or Other Equity Investments(a) | | | | | | | | | | | | |
| | | |
Europe | | $ | 24,960,305 | | | $ | — | | | $ | — | |
| | | |
North America | | | 458,580,488 | | | | — | | | | — | |
| | | |
Investment Companies | | | 13,845,920 | | | | — | | | | — | |
| | | |
| Total | | $ | 497,386,713 | | | $ | — | | | $ | — | |
| | | |
| Derivative Type | | | | | | | | | |
| | | |
| Assets(b) | | | | | | | | | | | | |
| | | |
Futures Contracts | | $ | 1,673,364 | | | $ | — | | | $ | — | |
| (a) | | Amounts are disclosed by continent to highlight the impact of time zone differences between local market close and the calculation of net asset value. Security valuations are based on the principal exchange or system on which they are traded, which may differ from country of domicile. The Funds utilize fair value model prices provided by an independent fair value service for international equities, resulting in a Level 2 classification. |
| (b) | | Amount shown represents unrealized gain (loss) at period end. |
For further information regarding security characteristics, see the Schedules of Investments.
|
| 4. INVESTMENTS IN DERIVATIVES |
The following tables set forth, by certain risk types, the gross value of derivative contracts (not considered to be hedging instruments for accounting disclosure purposes) as of April 30, 2020. These instruments were used as part of the Funds’ investment strategies and to obtain and/or manage exposure related to the risks below. The values in the tables below exclude the effects of cash collateral received or posted pursuant to these derivative contracts, and therefore are not representative of the Funds’ net exposure.
| | | | | | | | | | | | |
|
| Income Builder | |
| Risk | | Statements of Assets and Liabilities | | Assets | | | Statements of Assets
and Liabilities | | Liabilities | |
Interest rate | | Variation margin on swap contracts; Variation margin on futures contracts | | $ | 32,532,235 | (a) | | Variation margin on swap contracts; Variation margin on futures contracts | | $ | (2,127,624) | (a) |
Equity | | Variation margin on futures contracts | | | 4,290,497 | (a) | | — | | | — | |
Currency | | Receivable for unrealized gain on forward foreign currency exchange contracts | | | 239 | | | Payable for unrealized gain on forward foreign currency exchange contracts | | | (92,066) | |
| Total | | | | $ | 36,822,971 | | | | | $ | (2,219,690) | |
|
| Rising Dividend Growth | |
| Risk | | Statements of Assets
and Liabilities | | Assets | | | Statements of Assets
and Liabilities | | Liabilities | |
| Equity | | Variation margin on futures contracts | | $ | 1,673,364 | (a) | | — | | $ | — | |
| (a) | | Includes unrealized gain (loss) on futures contracts described in the Additional Investment Information sections of the Schedules of Investments. Only current day’s variation margin is reported within the Statements of Assets and Liabilities. |
45
GOLDMAN SACHS DIVIDEND FOCUS FUNDS
Notes to Financial Statements(continued)
April 30, 2020 (Unaudited)
|
| 4. INVESTMENTS IN DERIVATIVES (continued) |
The following tables set forth, by certain risk types, the Funds’ gains (losses) related to these derivatives and their indicative volumes for the six months ended April 30, 2020. These gains (losses) should be considered in the context that these derivative contracts may have been executed to create investment opportunities and/or economically hedge certain investments, and accordingly, certain gains (losses) on such derivative contracts may offset certain (losses) gains attributable to investments. These gains (losses) are included in “Net realized gain (loss)” or “Net change in unrealized gain (loss)” on the Statements of Operations:
| | | | | | | | | | | | |
|
| Income Builder |
| Risk | | Statements of Operations | | Net Realized
Gain (Loss) | | | Net Change in
Unrealized
Gain (Loss) | | | Average
Number of
Contracts(a) |
Interest rate | | Net realized gain (loss) from futures contracts and swap contracts/Net change in unrealized gain (loss) on futures contracts and swap contracts | | $ | 17,970,893 | | | $ | 30,830,114 | | | 1,396 |
Equity | | Net realized gain (loss) from purchased options and written options/Net change in unrealized gain (loss) on futures contracts and written options | | | (16,573,149) | | | | 3,941,963 | | | 406 |
Currency | | Net realized gain (loss) from forward foreign currency exchange contracts/Net change in unrealized gain (loss) on forward foreign currency exchange contracts | | | 37,391 | | | | 137,025 | | | 3 |
| Total | | | | $ | 1,435,135 | | | $ | 34,909,102 | | | 1,805 |
|
| Rising Dividend Growth |
| Risk | | Statements of Operations | | Net Realized
Gain (Loss) | | | Net Change in
Unrealized
Gain (Loss) | | | Average
Number of
Contracts(a) |
Equity | | Net realized gain (loss) from futures contracts/Net unrealized gain (loss) on futures contracts | | $ | (2,018,013 | ) | | $ | 1,438,431 | | | 122 |
| (a) | | Average number of contracts is based on the average of month end balances for the six month ended April 30, 2020. |
|
| 5. AGREEMENTS AND AFFILIATED TRANSACTIONS |
A. Management Agreement — Under the Agreement, GSAM manages the Funds, subject to the general supervision of the Trustees.
As compensation for the services rendered pursuant to the Agreement, the assumption of the expenses related thereto and administration of the Funds’ business affairs, including providing facilities, GSAM is entitled to a management fee, accrued daily and paid monthly, equal to an annual percentage rate of each Fund’s average daily net assets.
| | | | | | | | | | | | | | | | | | | | | | | | | | | | | | | | |
| | | | | | Contractual Management Rate | | | Effective Net
Management
Rate^ | |
| Fund | | | | | First
$1 billion | | | Next
$1 billion | | | Next
$3 billion | | | Next
$3 billion | | | Over
$8 billion | | | Effective
Rate | |
Income Builder | | | | | | | 0.54 | % | | | 0.49 | % | | | 0.46 | % | | | 0.45 | % | | | 0.44 | % | | | 0.52 | % | | | 0.51 | % |
Rising Dividend Growth | | | | | | | 0.75 | | | | 0.68 | | | | 0.64 | | | | 0.63 | | | | 0.62 | | | | 0.75 | | | | 0.75 | |
| ^ | | Effective Net Management Rate includes impact of management fee waivers of underlying funds, if any. |
Certain Funds invest in Institutional Shares of the Goldman Sachs Financial Square Government Fund and Class R6 Shares of the Goldman Sachs Emerging Markets Equity Fund, Goldman Sachs Financial Square Government Fund, and Goldman Sachs High Yield Fund, which are affiliated Underlying Funds. GSAM has agreed to waive a portion of its management fee payable by the Funds in an amount equal to the management fee it earns as an investment adviser to any of the affiliated Underlying Funds in
46
GOLDMAN SACHS DIVIDEND FOCUS FUNDS
|
| 5. AGREEMENTS AND AFFILIATED TRANSACTIONS (continued) |
which the Funds invest. For the six months ended April 30, 2020, GSAM waived the following amounts of the Funds’ management fees:
| | | | | | |
| Fund | | | | Management
Fee Waived | |
Income Builder | | | | $ | 90,345 | |
Rising Dividend Growth | | | | | 11,751 | |
B. Distribution and/or Service(12b-1) Plans — The Trust, on behalf of Class A and Class R Shares of each applicable Fund, has adopted Distribution and Service Plans subject to Rule12b-1 under the Act. Under the Distribution and Service Plans, Goldman Sachs, which serves as distributor (the “Distributor”), is entitled to a fee accrued daily and paid monthly, for distribution services and personal and account maintenance services, which may then be paid by Goldman Sachs to authorized dealers. These fees are equal to an annual percentage rate of the average daily net assets attributable to Class A or Class R Shares of the Funds, as applicable, as set forth below.
The Trust, on behalf of Class C Shares of each applicable Fund, has adopted a Distribution Plan subject to Rule12b-1 under the Act. Under the Distribution Plan, Goldman Sachs as Distributor is entitled to a fee accrued daily and paid monthly for distribution services, which may then be paid by Goldman Sachs to authorized dealers. These fees are equal to an annual percentage rate of the average daily net assets attributable to Class C Shares of the Funds, as set forth below.
| | | | | | | | | | | | |
| | | Distribution and/or Service Plan Rates | |
| | | Class A* | | | Class C | | | Class R* | |
Distribution and/or Service Plan | | | 0.25 | % | | | 0.75 | % | | | 0.50 | % |
| * | | With respect to Class A and Class R Shares, the Distributor at its discretion may use compensation for distribution services paid under the Distribution and/or Service Plan to compensate service organizations for personal and account maintenance services and expenses as long as such total compensation does not exceed the maximum cap on “service fees” imposed by the Financial Industry Regulatory Authority. |
C. Distribution Agreement — Goldman Sachs, as Distributor of the shares of the Funds pursuant to a Distribution Agreement, may retain a portion of the Class A Shares’ front end sales charge and Class C Shares’ CDSC. During the six months ended April 30, 2020, Goldman Sachs retained the following amounts:
| | | | | | | | | | |
| | | | | Front End
Sales Charge | | | Contingent Deferred
Sales Charge | |
| | | | | Class A | | | Class C | |
Income Builder | | | | $ | 41,020 | | | $ | — | |
Rising Dividend Growth | | | | | 6,890 | | | | 18 | |
D. Service Plan — The Trust, on behalf of each applicable Fund, has adopted a Service Plan to allow Class C Shares to compensate service organizations (including Goldman Sachs) for providing varying levels of personal and account maintenance services to their customers who are beneficial owners of such shares. The Service Plan provides for compensation to the service organizations equal to an annual percentage rate of 0.25% of the average daily net assets attributable to Class C Shares of the Funds.
E. Transfer Agency Agreement — Goldman Sachs also serves as the transfer agent of the Funds for a fee pursuant to the Transfer Agency Agreement. The fees charged for such transfer agency services are accrued daily and paid monthly at annual rates as follows: 0.17% of the average daily net assets of Class A, Class C, Investor and Class R Shares; 0.03% of the average daily net assets of Class P and R6 Shares; and 0.04% of the average daily net assets of Institutional Shares.
Goldman Sachs has agreed to waive a portion of its transfer agency fees by an amount equal to 0.06% as an annual percentage rate of the average daily net assets attributable to Class A, Class C, Investor and Class R Shares of the Rising Dividend Growth
47
GOLDMAN SACHS DIVIDEND FOCUS FUNDS
Notes to Financial Statements(continued)
April 30, 2020 (Unaudited)
|
| 5. AGREEMENTS AND AFFILIATED TRANSACTIONS (continued) |
Fund. This arrangement will remain in effect through at least February 28, 2021, and prior to such date, Goldman Sachs may not terminate the arrangement without the approval of the Board of Trustees.
F. Other Expense Agreements and Affiliated Transactions — GSAM has agreed to reduce or limit certain “Other Expenses” of the Funds (excluding acquired fund fees and expenses, transfer agency fees and expenses, service fees and shareholder administration fees (as applicable), taxes, interest, brokerage fees, expenses of shareholder meetings, litigation and indemnification, and extraordinary expenses) to the extent such expenses exceed, on an annual basis, a percentage rate of the average daily net assets of each Fund. Such Other Expense reimbursements, if any, are accrued daily and paid monthly. In addition, the Funds are not obligated to reimburse GSAM for prior fiscal year expense reimbursements, if any. The Other Expense limitations as an annual percentage rate of average daily net assets for the Income Builder and Rising Dividend Growth Funds are 0.034% and 0.014%, respectively. These Other Expense limitations will remain in place through at least February 28, 2021, and prior to such date GSAM may not terminate the arrangements without the approval of the Trustees. In addition, the Funds have entered into certain offset arrangements with the transfer agent, which may result in a reduction of the Funds’ expenses and are received irrespective of the application of the “Other Expense” limitations described above.
Goldman Sachs may voluntarily waive a portion of any payments under the Rising Dividend Growth Fund’s Transfer Agency Agreement, and this waiver is in addition to what is stipulated in any contractual fee waiver arrangements (as applicable). This temporary waiver may be modified or terminated at any time at the option of Goldman Sachs without shareholder approval.
For the six months ended April 30, 2020, these expense reductions, including any fee waivers and Other Expense reimbursements, were as follows:
| | | | | | | | | | | | | | | | | | |
| Fund | | | | Management
Fee Waiver | | | Transfer
Agency
Waivers/
Credits | | | Other
Expense
Reimbursements | | | Total
Expense
Reductions | |
Income Builder | | | | $ | 90,345 | | | $ | 1,500 | | | $ | 105,953 | | | $ | 197,798 | |
Rising Dividend Growth | | | | | 11,751 | | | | 134,583 | | | | 267,102 | | | | 413,436 | |
G. Line of Credit Facility — As of April 30, 2020, the Funds participated in a $700,000,000 committed, unsecured revolving line of credit facility (the “facility”) together with other funds of the Trust and certain registered investment companies having management agreements with GSAM or its affiliates. This facility is to be used for temporary emergency purposes, or to allow for an orderly liquidation of securities to meet redemption requests. The interest rate on borrowings is based on the federal funds rate. The facility also requires a fee to be paid by the Funds based on the amount of the commitment that has not been utilized. For the six months ended April 30, 2020, the Funds did not have any borrowings under the facility. Prior to April 28, 2020, the facility was $580,000,000.
H. Other Transactions with Affiliates — For the six months ended April 30, 2020, Goldman Sachs earned $8,279 in brokerage commissions from portfolio transactions, on behalf of the Income Builder Fund.
48
GOLDMAN SACHS DIVIDEND FOCUS FUNDS
|
| 5. AGREEMENTS AND AFFILIATED TRANSACTIONS (continued) |
The table below shows the transactions in and earnings from investments in the Underlying Funds for the six months ended April 30, 2020:
| | | | | | | | | | | | | | | | | | | | | | | | | | | | | | |
| Fund | | Underlying Fund | | Beginning
Value as of
October 31,
2019 | | | Purchases
at Cost | | | Proceeds
from Sales | | | Change in
Unrealized
Gain/(Loss) | | | Ending
Value as of
April 30, 2020 | | | Shares as of
April 30, 2020 | | | Dividend
Income | |
| Income Builder | | Goldman Sachs Emerging Markets Equity Fund — Class R6 Shares | | $ | 54,599 | | | $ | 626 | | | $ | — | | | $ | (5,590 | ) | | $ | 49,635 | | | | 2,516 | | | $ | 626 | |
| | | Goldman Sachs Financial Square Government Fund — Institutional Shares | | | 42,020,144 | | | | 375,994,152 | | | | (329,440,142 | ) | | | — | | | | 88,574,154 | | | | 88,574,154 | | | | 531,649 | |
| | | Goldman Sachs Financial Square Government Fund — Class R6 Shares | | | 47,167,247 | | | | 293,630,761 | | | | (310,089,619 | ) | | | — | | | | 30,708,389 | | | | 30,708,389 | | | | 159,624 | |
| | | Goldman Sachs High Yield Fund — Class R6 Shares | | | 53,353 | | | | 1,562 | | | | — | | | | (6,285 | ) | | | 48,630 | | | | 8,592 | | | | 1,562 | |
| Total | | | | $ | 89,295,343 | | | $ | 669,627,101 | | | $ | (639,529,761 | ) | | $ | (11,875 | ) | | $ | 119,380,808 | | | | | | | $ | 693,461 | |
| | | | | | | | |
| Rising Dividend Growth | | Goldman Sachs Financial Square Government Fund — Institutional Shares | | $ | 117,787 | | | $ | 14,164,034 | | | $ | (13,095,911 | ) | | $ | — | | | $ | 1,185,910 | | | | 1,185,910 | | | $ | 6,565 | |
| | | Goldman Sachs Financial Square Government Fund — Class R6 Shares | | | 16,595,220 | | | | 150,483,319 | | | | (154,418,529 | ) | | | — | | | | 12,660,010 | | | | 12,660,010 | | | | 85,147 | |
| Total | | | | $ | 16,713,007 | | | $ | 164,647,353 | | | $ | (167,514,440 | ) | | $ | — | | | $ | 13,845,920 | | | | | | | $ | 91,712 | |
|
| 6. PORTFOLIO SECURITIES TRANSACTIONS |
The cost of purchases and proceeds from sales and maturities of long-term securities for the six months ended April 30, 2020, were as follows:
| | | | | | | | | | |
| Fund | | | | Purchases | | | Sales and Maturities | |
Income Builder | | | | $ | 493,400,697 | | | $ | 346,323,754 | |
Rising Dividend Growth | | | | | 63,384,223 | | | | 198,776,424 | |
The Income Builder Fund may lend its securities through a securities lending agent, the Bank of New York Mellon (“BNYM”), to certain qualified borrowers. Pursuant to exemptive relief granted by the SEC and the terms and conditions contained therein, the Rising Dividend Growth Fund may lend its securities through a securities lending agent, Goldman Sachs Agency Lending (“GSAL”), a wholly-owned subsidiary of Goldman Sachs, to certain qualified borrowers including Goldman Sachs and affiliates. In accordance with the Funds’ securities lending procedures, the Funds receive cash collateral at least equal to the market value of the securities on loan. The market value of the loaned securities is determined at the close of business of the Funds, at their last sale
49
GOLDMAN SACHS DIVIDEND FOCUS FUNDS
Notes to Financial Statements(continued)
April 30, 2020 (Unaudited)
|
| 7. SECURITIES LENDING (continued) |
price or official closing price on the principal exchange or system on which they are traded, and any additional required collateral is delivered to the Funds on the next business day. As with other extensions of credit, the Funds may experience delay in the recovery of their securities or incur a loss should the borrower of the securities breach its agreement with the Funds or become insolvent at a time when the collateral is insufficient to cover the cost of repurchasing securities on loan. Dividend income received from securities on loan may not be subject to withholding taxes and therefore withholding taxes paid may differ from the amounts listed in the Statements of Operations. Loans of securities are terminable at any time and as such 1) the remaining contractual maturities of the outstanding securities lending transactions are considered to be overnight and continuous and 2) the borrower, after notice, is required to return borrowed securities within the standard time period for settlement of securities transactions.
The Funds invest the cash collateral received in connection with securities lending transactions in the Goldman Sachs Financial Square Government Fund (“Government Money Market Fund”), an affiliated series of the Goldman Sachs Trust. The Government Money Market Fund is registered under the Act as an open end investment company, is subject to Rule2a-7 under the Act, and is managed by GSAM, for which GSAM may receive a management fee of up to 0.16% on an annualized basis of the average daily net assets of the Government Money Market Fund.
In the event of a default by a borrower with respect to any loan, GSAL will and BNYM may exercise any and all remedies provided under the applicable borrower agreement to make the Funds whole. These remedies include purchasing replacement securities by applying the collateral held from the defaulting broker against the purchase cost of the replacement securities. If GSAL or BNYM are unable to purchase replacement securities, GSAL and/or BNYM will indemnify the Funds by paying the Funds an amount equal to the market value of the securities loaned minus the value of cash collateral received from the borrower for the loan, subject to an exclusion for any shortfalls resulting from a loss of value in such cash collateral due to reinvestment risk. The Funds’ master netting agreements with certain borrowers provide the right, in the event of a default (including bankruptcy or insolvency), for thenon-defaulting party to liquidate the collateral and calculate net exposure to the defaulting party or request additional collateral. However, in the event of a default by a borrower, a resolution authority could determine that such rights are not enforceable due to the restrictions or prohibitions against the right ofset-off that may be imposed in accordance with a particular jurisdiction’s bankruptcy or insolvency laws. The Funds’ loaned securities were all subject to enforceable Securities Lending Agreements and the value of the collateral was at least equal to the value of the cash received. The amounts of the Funds’ overnight and continuous agreements, which represent the gross amounts of recognized liabilities for securities lending transactions outstanding as of April 30, 2020, are disclosed as “Payable upon return of securities loaned” on the Statements of Assets and Liabilities, where applicable.
The Funds, GSAL and BNYM received compensation relating to the lending of the Funds’ securities. The amounts earned, if any, by the Funds’ for the six months ended April 30, 2020, are reported under Investment Income on the Statements of Operations.
The table below details securities lending activity with affiliates of Goldman Sachs:
| | | | | | | | | | | | | | |
| | | | | For the Six Months Ended April 30, 2020 | | | Amounts Payable to
Goldman Sachs
Upon Return of
Securities Loaned as of
April 30, 2020 | |
| Fund | | | | Earnings of GSAL
Relating to
Securities
Loaned | | | Amounts Received
by the Funds
from Lending to
Goldman Sachs | |
Rising Dividend Growth | | | | $ | 227 | | | $ | — | | | $ | — | |
The following table provides information about the Funds’ investment in the Government Money Market Fund for the six months ended April 30, 2020.
| | | | | | | | | | | | | | | | | | | | | | |
| Fund | | | | Beginning
value as of
October 31, 2019 | | | Purchases
at Cost | | | Proceeds
from Sales | | | Ending
value as of
April 30, 2020 | | | Shares as of
April 30, 2020 | |
Income Builder | | | | $ | 92,000 | | | $ | 65,657,925 | | | $ | (53,729,434 | ) | | $ | 12,020,491 | | | | 12,020,491 | |
Rising Dividend Growth | | | | | — | | | | 29,970,747 | | | | (29,970,747 | ) | | | — | | | | — | |
50
GOLDMAN SACHS DIVIDEND FOCUS FUNDS
As of the Funds’ most recent fiscal year end, October 31, 2019, the Funds’ capital loss carryforwards and timing differences on a tax basis were as follows:
| | | | | | | | |
| | | Income
Builder | | | Rising
Dividend
Growth | |
Capital loss carryforwards: | | | | | | | | |
Perpetual Short-Term | | $ | (5,277,107 | ) | | $ | — | |
Perpetual Long-Term | | | (19,236,354 | ) | | | — | |
Total capital loss carryforwards | | $ | (24,513,461 | ) | | $ | — | |
Timing differences (Straddles) | | $ | (7,372 | ) | | $ | — | |
As of April 30, 2020, the Funds’ aggregate security unrealized gains and losses based on cost for U.S. federal income tax purposes were as follows:
| | | | | | | | |
| | | Income
Builder | | | Rising
Dividend
Growth | |
Tax Cost | | $ | 1,644,033,835 | | | $ | 499,635,545 | |
Gross unrealized gain | | | 98,241,429 | | | | 92,216,396 | |
Gross unrealized loss | | | (124,084,664 | ) | | | (94,465,228 | ) |
Net unrealized gains (losses) | | $ | (25,843,235 | ) | | $ | (2,248,832 | ) |
The difference between GAAP-basis and tax basis unrealized gains (losses) is attributable primarily to wash sales, net mark to market gains (losses) on regulated futures contracts and foreign currency contracts, differences to the tax treatment of underlying fund investments, partnership investments, and material modification of debt securities.
GSAM has reviewed the Funds’ tax positions for all open tax years (the current and prior three years, as applicable) and has concluded that no provision for income tax is required in the Funds’ financial statements. Such open tax years remain subject to examination and adjustment by tax authorities.
The Funds’ risks include, but are not limited to, the following:
Derivatives Risk — The Funds’ use of derivatives may result in loss. Derivative instruments, which may pose risks in addition to and greater than those associated with investing directly in securities, currencies or other instruments, may be illiquid or less liquid, volatile, difficult to price and leveraged so that small changes in the value of the underlying instruments may produce disproportionate losses to the Funds. Derivatives are also subject to counterparty risk, which is the risk that the other party in the transaction will not fulfill its contractual obligation. The use of derivatives is a highly specialized activity that involves investment techniques and risks different from those associated with investments in more traditional securities and instruments. Losses from derivatives can also result from a lack of correlation between changes in the value of derivative instruments and the portfolio assets (if any) being hedged.
Dividend-Paying Investments Risk — A Fund’s investments in dividend-paying securities could cause a Fund to underperform other funds. Securities that pay dividends, as a group, can fall out of favor with the market, causing such securities to underperform securities that do not pay dividends. Depending upon market conditions and political and legislative responses to such conditions, dividend-paying securities that meet a Fund’s investment criteria may not be widely available and/or may be highly concentrated in
51
GOLDMAN SACHS DIVIDEND FOCUS FUNDS
Notes to Financial Statements(continued)
April 30, 2020 (Unaudited)
|
| 9. OTHER RISKS (continued) |
only a few market sectors. In addition, issuers that have paid regular dividends or distributions to shareholders may not continue to do so at the same level or at all in the future. This may limit the ability of a Fund to produce current income.
Floating and Variable Rate Obligations Risk — Floating rate and variable rate obligations are debt instruments issued by companies or other entities with interest rates that reset periodically (typically, daily, monthly, quarterly, or semiannually) in response to changes in the market rate of interest on which the interest rate is based. For floating and variable rate obligations, there may be a lag between an actual change in the underlying interest rate benchmark and the reset time for an interest payment of such an obligation, which could harm or benefit a Fund, depending on the interest rate environment or other circumstances. In a rising interest rate environment, for example, a floating or variable rate obligation that does not reset immediately would prevent a Fund from taking full advantage of rising interest rates in a timely manner. However, in a declining interest rate environment, a Fund may benefit from a lag due to an obligation’s interest rate payment not being immediately impacted by a decline in interest rates.
In 2017, the United Kingdom’s Financial Conduct Authority (“FCA”) warned that LIBOR may cease to be available or appropriate for use by 2021. The unavailability or replacement of LIBOR may affect the value, liquidity or return on certain Fund investments and may result in costs incurred in connection with closing out positions and entering into new trades. Any pricing adjustments to a Fund’s investments resulting from a substitute reference rate may also adversely affect the Fund’s performance and/or NAV.
Foreign Countries Risk — Investing in foreign markets may involve special risks and considerations not typically associated with investing in the United States. Foreign securities may be subject to risk of loss because of more or less foreign government regulation, less public information and less economic, political and social stability in the countries in which a Fund invests. The imposition of exchange controls (including repatriation restrictions), confiscation of assets and property, trade restrictions (including tariffs) and other government restrictions by the United States or other governments, or from problems in share registration, settlement or custody, may also result in losses. Foreign risk also involves the risk of negative foreign currency rate fluctuations, which may cause the value of securities denominated in such foreign currency (or other instruments through which a Fund has exposure to foreign currencies) to decline in value. Currency exchange rates may fluctuate significantly over short periods of time.
Foreign Custody Risk — If a Fund invests in foreign securities, the Fund may hold such securities and cash with foreign banks, agents, and securities depositories appointed by the Fund’s custodian (each a “Foreign Custodian”). Some foreign custodians may be recently organized or new to the foreign custody business. In some countries, Foreign Custodians may be subject to little or no regulatory oversight over, or independent evaluation of, their operations. Further, the laws of certain countries may place limitations on a Fund’s ability to recover its assets if a Foreign Custodian enters bankruptcy.
Interest Rate Risk — When interest rates increase, fixed income securities or instruments held by a Fund will generally decline in value. Long-term fixed income securities or instruments will normally have more price volatility because of this risk than short-term fixed income securities or instruments. The risks associated with changing interest rates may have unpredictable effects on the markets and a Fund’s investments. Fluctuations in interest rates may also affect the liquidity of fixed income securities and instruments held by the Funds.
Investments in Other Investment Companies Risk — As a shareholder of another investment company, a Fund will indirectly bear its proportionate share of any net management fees and other expenses paid by such other investment companies, in addition to the fees and expenses regularly borne by the Fund.
Large Shareholder Transactions Risk —A Fund may experience adverse effects when certain large shareholders, such as other funds, institutional investors (including those trading by use ofnon-discretionary mathematical formulas), financial intermediaries (who may make investment decisions on behalf of underlying clients and/or include a Fund in their investment model), individuals, accounts and Goldman Sachs affiliates, purchase or redeem large amounts of shares of a Fund. Such large shareholder redemptions, which may occur rapidly or unexpectedly, may cause a Fund to sell portfolio securities at times when it would not otherwise do so, which may negatively impact a Fund’s NAV and liquidity. These transactions may also accelerate the
52
GOLDMAN SACHS DIVIDEND FOCUS FUNDS
|
| 9. OTHER RISKS (continued) |
realization of taxable income to shareholders if such sales of investments resulted in gains, and may also increase transaction costs. In addition, a large redemption could result in a Fund’s current expenses being allocated over a smaller asset base, leading to an increase in the Fund’s expense ratio. Similarly, large Fund share purchases may adversely affect a Fund’s performance to the extent that the Fund is delayed in investing new cash or otherwise maintains a larger cash position than it ordinarily would.
Liquidity Risk — A Fund may make investments that are illiquid or that may become less liquid in response to market developments or adverse investor perceptions. Illiquid investments may be more difficult to value. Liquidity risk may also refer to the risk that a Fund will not be able to pay redemption proceeds within the allowable time period or without significant dilution to remaining investors’ interests because of unusual market conditions, an unusually high volume of redemption requests, or other reasons. To meet redemption requests, a Fund may be forced to sell investments at an unfavorable time and/or under unfavorable conditions. If a Fund is forced to sell securities at an unfavorable time and/or under unfavorable conditions, such sales may adversely affect the Fund’s NAV and dilute remaining investors’ interests. Liquidity risk may be the result of, among other things, the reduced number and capacity of traditional market participants to make a market in fixed income securities or the lack of an active market. The potential for liquidity risk may be magnified by a rising interest rate environment or other circumstances where investor redemptions from fixed income mutual funds may be higher than normal, potentially causing increased supply in the market due to selling activity. Redemptions by large shareholders may have a negative impact on a Fund’s liquidity.
Loan-Related Investments Risk — In addition to risks generally associated with debt investments (e.g., interest rate risk and default risk), loan-related investments such as loan participations and assignments are subject to other risks. Although a loan obligation may be fully collateralized at the time of acquisition, the collateral may decline in value, be or become illiquid or less liquid, or lose all or substantially all of its value subsequent to investment. Many loan investments are subject to legal or contractual restrictions on resale and certain loan investments may be or become illiquid or less liquid and more difficult to value, particularly in the event of a downgrade of the loan or the borrower. There is less readily available, reliable information about most loan investments than is the case for many other types of securities. Substantial increases in interest rates may cause an increase in loan obligation defaults. With respect to loan participations, a Fund may not always have direct recourse against a borrower if the borrower fails to pay scheduled principal and/or interest; may be subject to greater delays, expenses and risks than if a Fund had purchased a direct obligation of the borrower; and may be regarded as the creditor of the agent lender (rather than the borrower), subjecting a Fund to the creditworthiness of that lender as well. Investors in loans, such as a Fund, may not be entitled to rely on the anti-fraud protections of the federal securities laws, although they may be entitled to certain contractual remedies. The market for loan obligations may be subject to irregular trading activity, wide bid/ask spreads and extended trade settlement periods. Because transactions in many loans are subject to extended trade settlement periods, a Fund may not receive the proceeds from the sale of a loan for a period after the sale. As a result, sale proceeds related to the sale of loans may not be available to make additional investments or to meet a Fund’s redemption obligations for a period after the sale of the loans, and, as a result, a Fund may have to sell other investments or engage in borrowing transactions, such as borrowing from its credit facility, if necessary to raise cash to meet its obligations.
Senior Loans hold the most senior position in the capital structure of a business entity, and are typically secured with specific collateral, but are nevertheless usually rated below investment grade. Because Second Lien Loans are subordinated or unsecured and thus lower in priority of payment to Senior Loans, they are subject to the additional risk that the cash flow of the borrower and property securing the loan or debt, if any, may be insufficient to meet scheduled payments after giving effect to the senior secured obligations of the borrower. Second Lien Loans generally have greater price volatility than Senior Loans and may be less liquid.
Market and Credit Risks — In the normal course of business, a Fund trades financial instruments and enters into financial transactions where risk of potential loss exists due to changes in the market (market risk). The value of the securities in which a Fund invests may go up or down in response to the prospects of individual companies, particular sectors or governments and/or general economic conditions throughout the world due to increasingly interconnected global economies and financial markets. Events such as war, acts of terrorism, social unrest, natural disasters, the spread of infectious illness or other public health threats could also significantly impact a Fund and its investments. Additionally, a Fund may also be exposed to credit risk in the event that an issuer or guarantor fails to perform or that an institution or entity with which the Fund has unsettled or open transactions defaults.
53
GOLDMAN SACHS DIVIDEND FOCUS FUNDS
Notes to Financial Statements(continued)
April 30, 2020 (Unaudited)
|
| 9. OTHER RISKS (continued) |
Master Limited Partnership Risk — Investments in securities of MLPs involve risks that differ from investments in common stock, including risks related to limited control and limited rights to vote on matters affecting the MLP, risks related to potential conflicts of interest between the MLP and the MLP’s general partner, cash flow risks, dilution risks, limited liquidity and risks related to the general partner’s right to require unit-holders to sell their common units at an undesirable time or price.
Under the Trust’s organizational documents, its Trustees, officers, employees and agents are indemnified, to the extent permitted by the Act and state law, against certain liabilities that may arise out of performance of their duties to the Funds. Additionally, in the course of business, the Funds enter into contracts that contain a variety of indemnification clauses. The Funds’ maximum exposure under these arrangements is unknown, as this would involve future claims that may be made against the Funds that have not yet occurred. However, GSAM believes the risk of loss under these arrangements to be remote.
Income Builder Fund has adopted Financial Accounting Standards Board Accounting Standards Update2017-08 to amend the amortization period for certain purchased callable debt securities held at a premium. Under the new standard, the Fund has changed the amortization period for the premium on certain purchased callable debt securities withnon-contingent call features to the earliest call date. In accordance with the transition provisions of the standard, the Funds applied the amendments on a modified retrospective basis beginning with the fiscal period ended April 30, 2020. This change in accounting policy has been made to comply with the newly issued accounting standard and had no impact on total distributable earnings (loss) or the net asset value of the Fund. Upon evaluation, GSAM has concluded that the change in accounting principle does not materially impact the financial statement amounts.
In March 2020, the FASB issued Accounting Standard Update (“ASU”) No. 2020-04, “Reference Rate Reform (Topic 848): Facilitation of the Effects of Reference Rate Reform on Financial Reporting.” This ASU provides optional exceptions for applying GAAP to contract modifications, hedging relationships and other transactions affected reference rate reform if certain criteria are met. ASU 2020-04 is elective and is effective on March 12, 2020 through December 31, 2022. GSAM expects that the adoption of this guidance will not have a material impact on the Funds’ financial statements.
Effective at the close of business on June 30, 2020 (the “Effective Date”), DAC will no longer serve as sub-adviser to the Rising Dividend Growth Fund and will no longer manage the Fund’s investments in MLPs and energy infrastructure companies (the “MLP, Energy & Infrastructure Sleeve”). Beginning at the close of Business on the Effective Date, GSAM’s Energy & Infrastructure Team will manage the MLP, Energy & Infrastructure Sleeve.
Subsequent events after the Statements of Assets and Liabilities date have been evaluated. Other than the matter discussed above, GSAM has concluded that there is no impact requiring adjustment or disclosure in the financial statements.
54
GOLDMAN SACHS DIVIDEND FOCUS FUNDS
|
| 13. SUMMARY OF SHARE TRANSACTIONS |
Share activity is as follows:
| | | | | | | | | | | | | | | | |
| | | Income Builder Fund | |
| | | | |
| | | For the Six Months Ended
April 30, 2020
(Unaudited) | | | For the Fiscal Year Ended
October 31, 2019 | |
| | | | |
| | | Shares | | | Dollars | | | Shares | | | Dollars | |
| | | | |
| Class A Shares | | | | | | | | | | | | | | | | |
Shares sold | | | 1,253,586 | | | $ | 29,122,297 | | | | 1,799,656 | | | $ | 40,853,964 | |
Reinvestment of distributions | | | 216,216 | | | | 4,953,318 | | | | 473,912 | | | | 10,712,396 | |
Shares redeemed | | | (1,904,518 | ) | | | (43,470,718 | ) | | | (3,259,093 | ) | | | (72,590,615 | ) |
| | | | (434,716 | ) | | | (9,395,103 | ) | | | (985,525 | ) | | | (21,024,255 | ) |
| Class C Shares | | | | | | | | | | | | | | | | |
Shares sold | | | 1,175,895 | | | | 27,007,392 | | | | 2,010,857 | | | | 44,464,284 | |
Reinvestment of distributions | | | 243,611 | | | | 5,472,478 | | | | 569,398 | | | | 12,640,806 | |
Shares redeemed | | | (2,411,329 | ) | | | (53,569,502 | ) | | | (4,986,655 | ) | | | (109,946,008 | ) |
| | | | (991,823 | ) | | | (21,089,632 | ) | | | (2,406,400 | ) | | | (52,840,918 | ) |
| Institutional Shares | | | | | | | | | | | | | | | | |
Shares sold | | | 8,690,044 | | | | 208,423,766 | | | | 7,470,375 | | | | 173,813,483 | |
Reinvestment of distributions | | | 426,284 | | | | 9,966,435 | | | | 865,254 | | | | 19,941,926 | |
Shares redeemed | | | (7,939,288 | ) | | | (180,618,339 | ) | | | (13,897,580 | ) | | | (318,459,334 | ) |
| | | | 1,177,040 | | | | 37,771,862 | | | | (5,561,951 | ) | | | (124,703,925 | ) |
| Investor Shares | | | | | | | | | | | | | | | | |
Shares sold | | | 2,693,765 | | | | 64,261,566 | | | | 4,827,414 | | | | 111,049,360 | |
Reinvestment of distributions | | | 205,577 | | | | 4,808,632 | | | | 390,392 | | | | 8,998,199 | |
Shares redeemed | | | (2,712,492 | ) | | | (60,506,536 | ) | | | (5,145,695 | ) | | | (116,297,027 | ) |
| | | | 186,850 | | | | 8,563,662 | | | | 72,111 | | | | 3,750,532 | |
| Class P Shares | | | | | | | | | | | | | | | | |
Shares sold | | | 242,662 | | | | 5,867,500 | | | | 95,414 | | | | 2,230,065 | |
Reinvestment of distributions | | | 12,771 | | | | 301,498 | | | | 22,699 | | | | 523,868 | |
Shares redeemed | | | (278,445 | ) | | | (6,491,726 | ) | | | (271,094 | ) | | | (6,089,236 | ) |
| | | | (23,012 | ) | | | (322,728 | ) | | | (152,981 | ) | | | (3,335,303 | ) |
| Class R6 Shares | | | | | | | | | | | | | | | | |
Shares sold | | | 2,313,197 | | | | 56,861,939 | | | | 611,262 | | | | 13,568,669 | |
Reinvestment of distributions | | | 33,740 | | | | 775,411 | | | | 13,716 | | | | 320,777 | |
Shares redeemed | | | (190,259 | ) | | | (3,993,929 | ) | | | (197,660 | ) | | | (4,529,061 | ) |
| | | | 2,156,678 | | | | 53,643,421 | | | | 427,318 | | | | 9,360,385 | |
| | | | |
NET INCREASE (DECREASE) | | | 2,071,017 | | | $ | 69,171,482 | | | | (8,607,428 | ) | | $ | (188,793,484 | ) |
55
GOLDMAN SACHS DIVIDEND FOCUS FUNDS
Notes to Financial Statements(continued)
April 30, 2020 (Unaudited)
|
| 13. SUMMARY OF SHARE TRANSACTIONS (continued) |
| | | | | | | | | | | | | | | | |
| |
| | | Rising Dividend Growth Fund | |
| | | | |
| | | For the Six Months Ended
April 30, 2020
(Unaudited) | | | For the Fiscal Year Ended
October 31, 2019
| |
| | | | |
| | | Shares | | | Dollars | | | Shares | | | Dollars | |
| | | | |
| Class A Shares | | | | | | | | | | | | | | | | |
Shares sold | | | 1,009,740 | | | $ | 9,720,008 | | | | 3,875,656 | | | $ | 41,704,284 | |
Reinvestment of distributions | | | 1,787,371 | | | | 18,780,657 | | | | 11,404,340 | | | | 115,817,078 | |
Shares redeemed | | | (4,196,453 | ) | | | (40,440,347 | ) | | | (11,867,123 | ) | | | (144,815,996 | ) |
| | | | (1,399,342 | ) | | | (11,939,682 | ) | | | 3,412,873 | | | | 12,705,366 | |
| Class C Shares | | | | | | | | | | | | | | | | |
Shares sold | | | 304,396 | | | | 3,211,672 | | | | 1,990,737 | | | | 21,306,015 | |
Reinvestment of distributions | | | 1,408,529 | | | | 15,134,624 | | | | 12,146,115 | | | | 124,900,331 | |
Shares redeemed | | | (3,791,349 | ) | | | (38,662,596 | ) | | | (14,700,253 | ) | | | (176,996,871 | ) |
| | | | (2,078,424 | ) | | | (20,316,300 | ) | | | (563,401 | ) | | | (30,790,525 | ) |
| Institutional Shares | | | | | | | | | | | | | | | | |
Shares sold | | | 1,094,266 | | | | 11,603,566 | | | | 6,366,869 | | | | 88,407,748 | |
Reinvestment of distributions | | | 1,259,019 | | | | 13,957,671 | | | | 12,457,809 | | | | 132,953,032 | |
Shares redeemed | | | (4,849,663 | ) | | | (49,460,852 | ) | | | (23,734,594 | ) | | | (312,316,042 | ) |
| | | | (2,496,378 | ) | | | (23,899,615 | ) | | | (4,909,916 | ) | | | (90,955,262 | ) |
| Investor Shares | | | | | | | | | | | | | | | | |
Shares sold | | | 503,804 | | | | 5,415,068 | | | | 1,916,994 | | | | 22,095,019 | |
Reinvestment of distributions | | | 856,184 | | | | 9,484,422 | | | | 7,878,882 | | | | 83,943,748 | |
Shares redeemed | | | (2,803,092 | ) | | | (29,167,302 | ) | | | (12,134,679 | ) | | | (156,756,382 | ) |
| | | | (1,443,104 | ) | | | (14,267,812 | ) | | | (2,338,803 | ) | | | (50,717,615 | ) |
| Class P Shares | | | | | | | | | | | | | | | | |
Shares sold | | | 31,839 | | | | 316,159 | | | | 17,063 | | | | 209,619 | |
Reinvestment of distributions | | | 155,848 | | | | 1,736,876 | | | | 1,531,128 | | | | 16,342,234 | |
Shares redeemed | | | (1,024,300 | ) | | | (10,612,908 | ) | | | (1,793,344 | ) | | | (22,149,574 | ) |
| | | | (836,613 | ) | | | (8,559,873 | ) | | | (245,153 | ) | | | (5,597,721 | ) |
| Class R Shares | | | | | | | | | | | | | | | | |
Shares sold | | | 10,647 | | | | 108,449 | | | | 89,215 | | | | 955,086 | |
Reinvestment of distributions | | | 20,409 | | | | 214,309 | | | | 110,225 | | | | 1,113,855 | |
Shares redeemed | | | (105,138 | ) | | | (1,086,518 | ) | | | (146,729 | ) | | | (1,739,234 | ) |
| | | | (74,082 | ) | | | (763,760 | ) | | | 52,711 | | | | 329,707 | |
| Class R6 Shares | | | | | | | | | | | | | | | | |
Shares sold | | | 50,770 | | | | 530,491 | | | | 260,151 | | | | 2,816,993 | |
Reinvestment of distributions | | | 19,052 | | | | 210,690 | | | | 5,071 | | | | 57,671 | |
Shares redeemed | | | (47,997 | ) | | | (494,853 | ) | | | (75,304 | ) | | | (862,540 | ) |
| | | | 21,825 | | | | 246,328 | | | | 189,918 | | | | 2,012,124 | |
| | | | |
NET DECREASE | | | (8,306,118 | ) | | $ | (79,500,714 | ) | | | (4,401,771 | ) | | $ | (163,013,926 | ) |
56
GOLDMAN SACHS DIVIDEND FOCUS FUNDS
Voting Results of Special Meeting of Shareholders (Unaudited)
A Special Meeting (the “Meeting”) of the Goldman Sachs Trust (“GST”) was held on January 23, 2020 to consider and act upon the proposals below. The Funds have amortized their respective share of the proxy, shareholder meeting and other related costs and GSAM has agreed to reimburse the Funds to the extent such expenses exceed a specified percentage of the Funds’ net assets.
At the Meeting, Dwight L. Bush, Kathryn A. Cassidy, Joaquin Delgado and Gregory G. Weaver were elected to the Trust’s Board of Trustees. In electing trustees, the Trust’s shareholders voted as follows:
| | | | | | | | | | | | | | | | |
Proposal 1. Election of Trustees | | For | | | Against | | | Withheld | | | Broker Non-Votes | |
| | | | |
Dwight L. Bush | | | 94,278,961,728.065 | | | | 0 | | | | 349,026,343.365 | | | | 0 | |
| | | | |
Kathryn A. Cassidy | | | 94,310,850,789.164 | | | | 0 | | | | 317,137,282.266 | | | | 0 | |
| | | | |
Joaquin Delgado | | | 94,282,646,444.727 | | | | 0 | | | | 345,341,626.703 | | | | 0 | |
| | | | |
Gregory G. Weaver | | | 94,306,589,873.348 | | | | 0 | | | | 321,398,198.082 | | | | 0 | |
| | | | | | | | | | | | | | | | |
At the Meeting, the shareholders of the Goldman Sachs Large Cap Growth Insights Fund approved a change to the Fund’s sub-classification under the Act from “diversified” to “non-diversified”. The Trust’s shareholders voted as follows:
| | | | | | | | | | | | | | | | |
Proposal 2. To approve a change to the Fund’s sub-classification under
the Investment Company Act of 1940 from “diversified” to
“non-diversified” and to eliminate a related fundamental
investment restriction. | | For | | | Against | | | Abstained | | | Broker Non-Votes | |
| | | | |
Large Cap Growth Insights Fund | | | 23,785,792.632 | | | | 250,521.921 | | | | 196,802.993 | | | | 9,592,467.322 | |
| | | | | | | | | | | | | | | | |
57
GOLDMAN SACHS DIVIDEND FOCUS FUNDS
Liquidity Risk Management Program(Unaudited)
Each Fund has adopted and implemented a liquidity risk management program (the “Program”) in accordance withRule 22e-4 under the 1940 Act. The Program seeks to assess and manage each Fund’s liquidity risk, i.e., the risk that a Fund is unable to satisfy redemption requests without significantly diluting remaining investors’ interests in the Fund. The Board of Trustees of the Trust has designated GSAM, each Fund’s investment adviser, to administer the Program. Certain aspects of the Program rely on third parties to perform certain functions, including the provision of market data and application of models.
The Program is comprised of various components designed to support the assessment and/or management of liquidity risk, including: (1) the periodic assessment (no less frequently than annually) of certain factors that influence a Fund’s liquidity risk; (2) the periodic classification (no less frequently than monthly) of a Fund’s investments into one of four liquidity categories that reflect an estimate of their liquidity under current market conditions; (3) a 15% limit on the acquisition of “illiquid investments” (as defined under Rule22e-4); (4) for a Fund that does not invest primarily in “highly liquid investments” (as defined under Rule22e-4), the determination of a minimum percentage of the Fund’s assets that will generally be invested in highly liquid investments (a “Highly Liquid Investment Minimum”); and (5) periodic reporting to the Board of Trustees.
At a meeting of the Board of Trustees on February11-12, 2020, GSAM provided a written report to the Board addressing the operation, and the adequacy and effectiveness of the implementation, of the Program, including, as applicable, the operation of any Highly Liquid Investment Minimum and any material changes to the Program, for the initial period from December 1, 2018 through December 31, 2019 (the “Reporting Period”). Among other things, the annual report discussed: (1) the results of stress tests designed to assess liquidity under a hypothetical stressed scenario involving elevated redemptions; and (2) an assessment of the methodologies used to classify investments into one of four liquidity categories. The report concluded that the Program was reasonably designed to assess and manage liquidity risk and was adequately and effectively implemented during the Reporting Period.
There can be no assurance that the Program will achieve its objectives under all circumstances in the future. Please refer to your Fund’s prospectus for more information regarding the Fund’s exposure to liquidity risk and other risks to which it may be subject.
58
GOLDMAN SACHS DIVIDEND FOCUS FUNDS
| | |
| | |
Fund Expenses — Period Ended April 30, 2020 (Unaudited) | | |
As a shareholder of Class A, Class C, Institutional, Investor, Class P, Class R and Class R6 Shares of a Fund, you incur two types of costs: (1) transaction costs, including sales charges on purchase payments (with respect to Class A Shares), contingent deferred sales charges on redemptions (with respect to Class C Shares), and (2) ongoing costs, including management fees; distribution and/or service(12b-1) fees (with respect to Class A, Class C, and Class R Shares); and other Fund expenses. This Example is intended to help you understand your ongoing costs (in dollars) of investing in Class A, Class C, Institutional, Investor, Class P, Class R or Class R6 Shares of the Funds and to compare these costs with the ongoing costs of investing in other mutual funds.
The Example is based on an investment of $1,000 invested at the beginning of the period and held for the entire period from November 1, 2019 through April 30, 2020, which represents a period of 182 days in a 366 day year.
Actual Expenses — The first line under each share class in the table below provides information about actual account values and actual expenses. You may use the information in this line, together with the amount you invested, to estimate the expenses that you paid over the period. Simply divide your account value by $1,000 (for example, an $8,600 account value divided by $1,000=8.6), then multiply the result by the number in the first line under the heading entitled “Expenses Paid” to estimate the expenses you paid on your account during this period.
Hypothetical Example for Comparison Purposes — The second line under each share class in the table below provides information about hypothetical account values and hypothetical expenses based on the Funds’ actual net expense ratios and an assumed rate of return of 5% per year before expenses, which is not the Funds’ actual return. The hypothetical account values and expenses may not be used to estimate the actual ending account balance or expenses you paid for the period. You may use this information to compare the ongoing costs of investing in the Funds and other funds. To do so, compare this 5% hypothetical example with the 5% hypothetical examples that appear in the shareholder reports of the other funds.
Please note that the expenses shown in the table are meant to highlight your ongoing costs only and do not reflect any transactional costs, such as sales charges, redemption fees, or exchange fees. Therefore, the second line of the table is useful in comparing ongoing costs only, and will not help you determine the relative total costs of owning different funds. In addition, if these transactional costs were included, your costs would have been higher:
| | | | | | | | | | | | | | | | | | | | | | | | |
| | | Income Builder Fund | | | Rising Dividend Growth Fund | |
| Share Class | | Beginning
Account Value
11/1/19 | | | Ending
Account Value
4/30/20 | | | Expenses
Paid for the
6 months
ended
4/30/20* | | | Beginning
Account Value
11/1/19 | | | Ending
Account Value
4/30/20 | | | Expenses
Paid for the
6 months
ended
4/30/20* | |
| Class A | | | | | | | | | | | | | | | | | | | | | | | | |
Actual | | $ | 1,000.00 | | | $ | 943.00 | | | $ | 4.64 | | | $ | 1,000.00 | | | $ | 874.70 | | | $ | 5.22 | |
Hypothetical 5% return | | | 1,000.00 | | | | 1,020.09 | + | | | 4.82 | | | | 1,000.00 | | | | 1,019.29 | + | | | 5.62 | |
| Class C | | | | | | | | | | | | | | | | | | | | | | | | |
Actual | | | 1,000.00 | | | | 939.40 | | | | 8.25 | | | | 1,000.00 | | | | 871.00 | | | | 8.70 | |
Hypothetical 5% return | | | 1,000.00 | | | | 1,016.36 | + | | | 8.57 | | | | 1,000.00 | | | | 1,015.56 | + | | | 9.37 | |
| Institutional | | | | | | | | | | | | | | | | | | | | | | | | |
Actual | | | 1,000.00 | | | | 944.80 | | | | 2.80 | | | | 1,000.00 | | | | 875.70 | | | | 3.73 | |
Hypothetical 5% return | | | 1,000.00 | | | | 1,021.98 | + | | | 2.92 | | | | 1,000.00 | | | | 1,020.88 | + | | | 4.02 | |
| Investor | | | | | | | | | | | | | | | | | | | | | | | | |
Actual | | | 1,000.00 | | | | 944.10 | | | | 3.43 | | | | 1,000.00 | | | | 875.10 | | | | 4.06 | |
Hypothetical 5% return | | | 1,000.00 | | | | 1,021.33 | + | | | 3.57 | | | | 1,000.00 | | | | 1,020.54 | + | | | 4.37 | |
| Class P | | | | | | | | | | | | | | | | | | | | | | | | |
Actual | | | 1,000.00 | | | | 944.90 | | | | 2.80 | | | | 1,000.00 | | | | 875.70 | | | | 3.68 | |
Hypothetical 5% return | | | 1,000.00 | | | | 1,021.98 | + | | | 2.92 | | | | 1,000.00 | | | | 1,020.93 | + | | | 3.97 | |
| Class R | | | | | | | | | | | | | | | | | | | | | | | | |
Actual | | | N/A | | | | N/A | | | | N/A | | | | 1,000.00 | | | | 873.60 | | | | 6.38 | |
Hypothetical 5% return | | | N/A | | | | N/A | | | | N/A | | | | 1,000.00 | | | | 1,018.05 | + | | | 6.87 | |
| Class R6 | | | | | | | | | | | | | | | | | | | | | | | | |
Actual | | | 1,000.00 | | | | 944.80 | | | | 2.76 | | | | 1,000.00 | | | | 875.60 | | | | 3.68 | |
Hypothetical 5% return | | | 1,000.00 | | | | 1,022.03 | + | | | 2.87 | | | | 1,000.00 | | | | 1,020.93 | + | | | 3.97 | |
| | + | | Expenses for each share class are calculated using each Fund’s annualized net expense ratio (excluding proxy fees) for each class, which represents the ongoing expenses as a percentage of net assets for the six months ended April 30, 2020. Expenses are calculated by multiplying the annualized net expense ratio (excluding proxy fees) by the average account value for the period; then multiplying the result by the number of days in the most recent fiscal half year; and then dividing that result by the number of days in the fiscal year. The annualized net expense ratios for the period were as follows: | |
| | | | | | | | | | | | | | | | | | | | | | | | | | | | |
| Fund | | Class A | | | Class C | | | Institutional | | | Investor | | | Class P | | | Class R | | | Class R6 | |
Income Builder | | | 0.97 | % | | | 1.72 | % | | | 0.59 | % | | | 0.72 | % | | | 0.58 | % | | | N/A | | | | 0.58 | % |
Rising Dividend Growth | | | 1.12 | | | | 1.87 | | | | 0.80 | | | | 0.87 | | | | 0.79 | | | | 1.37 | % | | | 0.79 | |
| | * | | Hypothetical expenses are based on each Fund’s actual annualized net expense ratios (excluding proxy fees) and an assumed rate of return of 5% per year before expenses. | |
59
FUNDS PROFILE
Goldman Sachs Funds
Goldman Sachs is a premier financial services firm, known since 1869 for creating thoughtful and customized investment solutions in complex global markets.
Today, theConsumer and Investment Management Division of Goldman Sachs serves a diverse set of clients worldwide, including private institutions, public entities and individuals. With approximately $1.66 trillion in assets under supervision as of March 31, 2020, Goldman Sachs Asset Management (“GSAM”) has portfolio management teams located around the world and our investment professionals bring firsthand knowledge of local markets to every investment decision. Assets under supervision includes assets under management and other client assets for which Goldman Sachs does not have full discretion. GSAM leverages the resources of Goldman Sachs & Co. LLC subject to legal, internal and regulatory restrictions.
Money Market
Financial Square FundsSM
| ∎ | | Financial Square Treasury Solutions Fund1 |
| ∎ | | Financial Square Government Fund1 |
| ∎ | | Financial Square Money Market Fund2 |
| ∎ | | Financial Square Prime Obligations Fund2 |
| ∎ | | Financial Square Treasury Instruments Fund1 |
| ∎ | | Financial Square Treasury Obligations Fund1 |
| ∎ | | Financial Square Federal Instruments Fund1 |
Investor FundsSM
| ∎ | | Investor Money Market Fund3 |
| ∎ | | Investor Tax-Exempt Money Market Fund3 |
Fixed Income
Short Duration and Government
| ∎ | | High Quality Floating Rate Fund |
| ∎ | | Short-Term Conservative Income Fund |
| ∎ | | Short Duration Government Fund |
| ∎ | | Short Duration Income Fund |
| ∎ | | Inflation Protected Securities Fund |
Multi-Sector
| ∎ | | Global Core Fixed Income Fund4 |
Municipal and Tax-Free
| ∎ | | High Yield Municipal Fund |
| ∎ | | Dynamic Municipal Income Fund |
| ∎ | | Short Duration Tax-Free Fund |
| ∎ | | Municipal Income Completion Fund |
Single Sector
| ∎ | | Investment Grade Credit Fund |
| ∎ | | High Yield Floating Rate Fund |
| ∎ | | Emerging Markets Debt Fund |
| ∎ | | Local Emerging Markets Debt Fund |
Fixed Income Alternatives
| ∎ | | Long Short Credit Strategies Fund |
Fundamental Equity
| ∎ | | Small/Mid Cap Value Fund |
| ∎ | | Small/Mid Cap Growth Fund |
| ∎ | | Concentrated Growth Fund |
| ∎ | | Technology Opportunities Fund |
| ∎ | | Growth Opportunities Fund |
| ∎ | | Rising Dividend Growth Fund |
Tax-Advantaged Equity
| ∎ | | U.S. Tax-Managed Equity Fund |
| ∎ | | International Tax-Managed Equity Fund |
| ∎ | | U.S. Equity Dividend and Premium Fund |
| ∎ | | International Equity Dividend and Premium Fund |
Equity Insights
| ∎ | | Small Cap Equity Insights Fund |
| ∎ | | U.S. Equity Insights Fund |
| ∎ | | Small Cap Growth Insights Fund |
| ∎ | | Large Cap Growth Insights Fund |
| ∎ | | Large Cap Value Insights Fund |
| ∎ | | Small Cap Value Insights Fund |
| ∎ | | International Small Cap Insights Fund |
| ∎ | | International Equity Insights Fund |
| ∎ | | Emerging Markets Equity Insights Fund |
Fundamental Equity International
| ∎ | | International Equity Income Fund |
| ∎ | | International Equity ESG Fund |
| ∎ | | Emerging Markets Equity Fund |
| ∎ | | Imprint Emerging Markets Opportunities Fund6 |
| ∎ | | ESG Emerging Markets Equity Fund |
Alternative
| ∎ | | Real Estate Securities Fund |
| ∎ | | International Real Estate Securities Fund |
| ∎ | | Commodity Strategy Fund |
| ∎ | | Global Real Estate Securities Fund |
| ∎ | | Alternative Premia Fund |
| ∎ | | Absolute Return Tracker Fund |
| ∎ | | Managed Futures Strategy Fund |
| ∎ | | MLP Energy Infrastructure Fund |
| ∎ | | Multi-Manager Alternatives Fund |
| ∎ | | Global Infrastructure Fund |
Total Portfolio Solutions
| ∎ | | Global Managed Beta Fund |
| ∎ | | Multi-Manager Non-Core Fixed Income Fund |
| ∎ | | Multi-Manager U.S. Dynamic Equity Fund |
| ∎ | | Multi-Manager Global Equity Fund |
| ∎ | | Multi-Manager International Equity Fund |
| ∎ | | Tactical Tilt Overlay Fund |
| ∎ | | Balanced Strategy Portfolio |
| ∎ | | Multi-Manager U.S. Small Cap Equity Fund |
| ∎ | | Multi-Manager Real Assets Strategy Fund |
| ∎ | | Growth and Income Strategy Portfolio |
| ∎ | | Growth Strategy Portfolio |
| ∎ | | Dynamic Global Equity Fund |
| ∎ | | Satellite Strategies Portfolio |
| ∎ | | Enhanced Dividend Global Equity Portfolio |
| ∎ | | Tax-Advantaged Global Equity Portfolio |
| ∎ | | Strategic Factor Allocation Fund |
| ∎ | | Target Date Retirement Portfolio7 |
| ∎ | | Target Date 2025 Portfolio |
| ∎ | | Target Date 2030 Portfolio |
| ∎ | | Target Date 2035 Portfolio |
| ∎ | | Target Date 2040 Portfolio |
| ∎ | | Target Date 2045 Portfolio |
| ∎ | | Target Date 2050 Portfolio |
| ∎ | | Target Date 2055 Portfolio |
| ∎ | | Target Date 2060 Portfolio |
| ∎ | | GQG Partners International Opportunities Fund |
| 1 | | You could lose money by investing in the Fund. Although the Fund seeks to preserve the value of your investment at $1.00 per share, it cannot guarantee it will do so. An investment in the Fund is not a deposit of a bank and is not insured or guaranteed by the Federal Deposit Insurance Corporation or any other government agency. The Fund’s sponsor has no legal obligation to provide financial support to the Fund, and you should not expect that the sponsor will provide financial support to the Fund at any time. |
| 2 | | You could lose money by investing in the Fund. Because the share price of the Fund will fluctuate, when you sell your shares they may be worth more or less than what you originally paid for them. The Fund may impose a fee upon sale of your shares or may temporarily suspend your ability to sell shares if the Fund’s liquidity falls below required minimums because of market conditions or other factors. An investment in the Fund is not a deposit of a bank and is not insured or guaranteed by the Federal Deposit Insurance Corporation or any other government agency. The Fund’s sponsor has no legal obligation to provide financial support to the Fund, and you should not expect that the sponsor will provide financial support to the Fund at any time. |
| 3 | | You could lose money by investing in the Fund. Although the Fund seeks to preserve the value of your investment at $1.00 per share, it cannot guarantee it will do so. The Fund may impose a fee upon sale of your shares or may temporarily suspend your ability to sell shares if the Fund’s liquidity falls below required minimums because of market conditions or other factors. An investment in the Fund is not a deposit of a bank and is not insured or guaranteed by the Federal Deposit Insurance Corporation or any other government agency. The Fund’s sponsor has no legal obligation to provide financial support to the Fund, and you should not expect that the sponsor will provide financial support to the Fund at any time. |
| 4 | | Effective after the close of business on April 30, 2020, the Goldman Sachs Global Income Fund was renamed the Goldman Sachs Global Core Fixed Income Fund. |
| 5Effective | | after the close of business of November 20, 2019, the Goldman Sachs Asia Equity Fund was renamed the Goldman Sachs China Equity Fund. |
| 6Effective | | after the close of business on August 30, 2019, the Goldman Sachs N-11 Equity Fund was renamed the Goldman Sachs Imprint Emerging Markets Opportunities Fund. |
| 7Effective | | December 27, 2019, the Goldman Sachs Target Date 2020 Portfolio was renamed the Goldman Sachs Target Date Retirement Portfolio. |
| | | Financial Square FundsSM and Investor FundsSM are registered service marks of Goldman Sachs & Co. LLC. |
| * | | This list covers open-end funds only. Please visit our website at www.GSAMFUNDS.com to learn about our closed-end funds and exchange-traded funds. |
| | |
TRUSTEES Jessica Palmer,Chair Dwight L. Bush Kathryn A. Cassidy Diana M. Daniels Joaquin Delgado James A. McNamara Roy W. Templin Gregory G. Weaver | | OFFICERS James A. McNamara,President Joseph F. DiMaria,Principal Financial Officer, Principal Accounting Officer and Treasurer Caroline L. Kraus,Secretary |
| |
GOLDMAN SACHS & CO. LLC Distributor and Transfer Agent | | GOLDMAN SACHS ASSET MANAGEMENT, L.P. Investment Adviser |
Visit our website atwww.GSAMFUNDS.com to obtain the most recent month-end returns.
Goldman Sachs Asset Management, L.P., 200 West Street, New York, New York 10282
The reports concerning the Funds included in this shareholder report may contain certain forward-looking statements about the factors that may affect the performance of the Funds in the future. These statements are based on Fund management’s predictions and expectations concerning certain future events and their expected impact on the Funds, such as performance of the economy as a whole and of specific industry sectors, changes in the levels of interest rates, the impact of developing world events, and other factors that may influence the future performance of the Funds. Management believes these forward-looking statements to be reasonable, although they are inherently uncertain and difficult to predict. Actual events may cause adjustments in portfolio management strategies from those currently expected to be employed.
A description of the policies and procedures that the Funds use to determine how to vote proxies relating to portfolio securities and information regarding how the Funds voted proxies relating to portfolio securities during the most recent 12-month period ended June 30 is available (i) without charge, upon request by calling 1-800-526-7384 (for Retail Shareholders) or 1-800-621-2550 (for Institutional Shareholders); and (ii) on the Securities and Exchange Commission (“SEC”) web site at http://www.sec.gov.
The Funds will file their portfolio holdings for each month in a fiscal quarter within 60 days after the end of the relevant fiscal quarter on Form N-PORT. Portfolio holdings information for the third month of each fiscal quarter will be made available on the SEC’s web site at http://www.sec.gov. Portfolio holdings information may be obtained upon request and without charge by calling 1-800-526-7384 (for Retail Shareholders) or 1-800-621-2550 (for Institutional Shareholders).
All or a portion of the Funds’ distributions may be treated for tax purposes as a return of capital, however, the final characterization of such distributions will be reported annually on Form 1099-DIV. The final tax status of the distributions may differ substantially from the above dividend information.
Fund holdings and allocations shown are unaudited, and may not be representative of current or future investments. Fund holdings and allocations may not include the Funds’ entire investment portfolio, which may change at any time. Fund holdings should not be relied on in making investment decisions and should not be construed as research or investment advice regarding particular securities. Current and future holdings are subject to risk.
Economic and market forecasts presented herein reflect our judgment as of the date of this presentation and are subject to change without notice. These forecasts do not take into account the specific investment objectives, restrictions, tax and financial situation or other needs of any specific client. Actual data will vary and may not be reflected here. These forecasts are subject to high levels of uncertainty that may affect actual performance. Accordingly, these forecasts should be viewed as merely representative of a broad range of possible outcomes. These forecasts are estimated, based on assumptions, and are subject to significant revision and may change materially as economic and market conditions change. Goldman Sachs has no obligation to provide updates or changes to these forecasts. Case studies and examples are for illustrative purposes only.
The Global Industry Classification Standard (GICS) was developed by and is the exclusive property and a service mark of Morgan Stanley Capital International Inc. (MSCI) and Standard & Poor’s, a division of The McGraw-Hill Companies, Inc. (S&P) and is licensed for use by Goldman Sachs. Neither MSCI, S&P nor any other party involved in making or compiling the GICS or any GICS classifications makes any express or implied warranties or representations with respect to such standard or classification (or the results to be obtained by the use thereof), and all such parties hereby expressly disclaim all warranties of originality, accuracy, completeness, merchantability or fitness for a particular purpose with respect to any of such standard or classification. Without limiting any of the foregoing, in no event shall MSCI, S&P, any of their affiliates or any third party involved in making or compiling the GICS or any GICS classifications have any liability for any direct, indirect, special, punitive, consequential or any other damages (including lost profits) even if notified of the possibility of such damages.
The portfolio risk management process includes an effort to monitor and manage risk, but does not imply low risk.
This material is not authorized for distribution to prospective investors unless preceded or accompanied by a current Prospectus or summary prospectus, if applicable. Investors should consider a Fund’s objective, risks, and charges and expenses, and read the summary prospectus, if available, and/or the Prospectus carefully before investing or sending money. The summary prospectus, if available, and the Prospectus contain this and other information about a Fund and may be obtained from your authorized dealer or from Goldman Sachs & Co. LLC by calling (retail – 1-800-526-7384) (institutional – 1-800-621-2550).
© 2020 Goldman Sachs. All rights reserved. 206023-OTU-1214520 DIVFOSAR-20
Goldman Sachs Funds

| | | | |
| | |
| Semi-Annual Report | | | | April 30, 2020 |
| | |
| | | | Domestic Equity Insights Funds |
| | | | Large Cap Growth Insights |
| | | | Large Cap Value Insights |
| | | | Small Cap Equity Insights |
| | | | Small Cap Growth Insights |
| | | | Small Cap Value Insights |
| | | | U.S. Equity Insights |
It is our intention that beginning on January 1, 2021, paper copies of the Funds’ annual and semi-annual shareholder reports will no longer be sent by mail, unless you specifically request paper copies of the reports from a Fund or from your financial intermediary. Instead, the reports will be made available on a website, and you will be notified by mail each time a report is posted and provided with a website link to access the report.
If you already elected to receive shareholder reports electronically, you will not be affected by this change and you need not take any action. At any time, you may elect to receive reports and certain communications from a Fund electronically by calling the applicable toll-free number below or by contacting your financial intermediary.
You may elect to receive all future shareholder reports in paper free of charge. If you hold shares of a Fund directly with the Fund’s transfer agent, you can inform the transfer agent that you wish to receive paper copies of reports by calling toll-free800-621-2550 for Institutional, Service, Class R6 and Class P shareholders or800-526-7384 for all other shareholders. If you hold shares of a Fund through a financial intermediary, please contact your financial intermediary to make this election. Your election to receive reports in paper will apply to all Goldman Sachs Funds held in your account if you invest through your financial intermediary or all Goldman Sachs Funds held with the Funds’ transfer agent if you invest directly with the transfer agent.

Goldman Sachs Domestic Equity Insights Funds
| ∎ | | LARGE CAP GROWTH INSIGHTS |
| ∎ | | LARGE CAP VALUE INSIGHTS |
| ∎ | | SMALL CAP EQUITY INSIGHTS |
| ∎ | | SMALL CAP GROWTH INSIGHTS |
| ∎ | | SMALL CAP VALUE INSIGHTS |
| | | | |
| | | |
| NOT FDIC-INSURED | | May Lose Value | | No Bank Guarantee |
Recent Market Events related to COVID-19
While this semi-annual report covers the six month period ended April 30, 2020, we want to describe some more recent events through the end of May.
An outbreak of a novel strain of coronavirus (COVID-19) has emerged globally. The outbreak of COVID-19 has prompted a number of measures to limit the spread, including travel and border restrictions, quarantines, curfews and restrictions on large gatherings. In turn, these resulted in lower consumer activity, diminished demand for a wide range of products and services, and disruption in manufacturing and supply chains. While governments have already taken unprecedented action to limit disruption to the financial system, global financial markets have experienced and may continue to experience significant volatility resulting from the spread of and subsequent intervening measures intended to limit the spread of COVID-19. The Funds could be negatively impacted if the value of a portfolio holding were harmed by such political or economic conditions, events, or actions. The full extent of the impact of COVID-19 on a Fund’s performance cannot be determined at this time and will depend on future developments, including the duration and the continued spread of the outbreak. Goldman Sachs Asset Management’s long-term commitment to you, our Fund shareholders, remains unchanged. We encourage you to maintain perspective and stay current with timely commentary and investment insights by visiting gsam.com.
i
FUND BASICS
Large Cap Growth Insights Fund
as of April 30, 2020
| | | | | | | | | | |
| | PERFORMANCE REVIEW | |
| | | |
| | | November 1, 2019–April 30, 2020 | | Fund Total Return
(based on NAV)1 | | | Russell 1000®
Growth Index2 | |
| | Class A | | | 2.68 | % | | | 6.09 | % |
| | Class C | | | 2.34 | | | | 6.09 | |
| | Institutional | | | 2.90 | | | | 6.09 | |
| | Service | | | 2.63 | | | | 6.09 | |
| | Investor | | | 2.82 | | | | 6.09 | |
| | Class P | | | 2.89 | | | | 6.09 | |
| | Class R | | | 2.56 | | | | 6.09 | |
| | | Class R6 | | | 2.91 | | | | 6.09 | |
| 1 | | The net asset value (“NAV”) represents the net assets of the class of the Fund(ex-dividend) divided by the total number of shares of the class outstanding. The Fund’s performance assumes the reinvestment of dividends and other distributions. The Fund’s performance does not reflect the deduction of any applicable sales charges. |
| 2 | | The Russell 1000® Growth Index (with dividends reinvested) is an unmanaged market capitalization weighted index of the 1000 largest U.S. companies with higherprice-to-book ratios and higher forecasted growth values. The figures for the Russell 1000® Growth Index do not include any deduction for fees, expenses or taxes. It is not possible to invest directly in an index. |
The returns set forth in the tables above represent past performance. Past performance does not guarantee future results. The Fund’s investment return and principal value will fluctuate so that an investor’s shares, when redeemed, may be worth more or less than their original cost. Current performance may be lower or higher than the performance quoted above. Please visit our web site at www.GSAMFUNDS.com to obtain the most recentmonth-end returns.Performance reflects applicable fee waivers and/or expense limitations in effect during the periods shown. In their absence, performance would be reduced. Returns do not reflect the deduction of taxes that a shareholder would pay on Fund distributions or the redemption of Fund shares.
1
FUND BASICS
| | | | | | | | |
| | TOP TEN HOLDINGS AS OF 4/30/20203 |
| | | |
| | | Holding | | % of Net Assets | | | Line of Business |
| | | |
| | Microsoft Corp. | | | 9.6 | % | | Software |
| | Apple, Inc. | | | 9.2 | | | Technology Hardware, Storage & Peripherals |
| | Amazon.com, Inc. | | | 8.0 | | | Internet & Direct Marketing Retail |
| | Alphabet, Inc., Class C | | | 3.6 | | | Interactive Media & Services |
| | Facebook, Inc., Class A | | | 2.7 | | | Interactive Media & Services |
| | NVIDIA Corp. | | | 2.1 | | | Semiconductors & Semiconductor Equipment |
| | Alphabet, Inc., Class A | | | 1.8 | | | Interactive Media & Services |
| | AbbVie, Inc. | | | 1.8 | | | Biotechnology |
| | Union Pacific Corp. | | | 1.8 | | | Road & Rail |
| | | PayPal Holdings, Inc. | | | 1.5 | | | IT Services |
| 3 | | The top 10 holdings may not be representative of the Portfolio’s future investments. |
| | | | |
| FUND VS. BENCHMARK SECTOR ALLOCATIONS4 |
|
| As of April 30, 2020 |
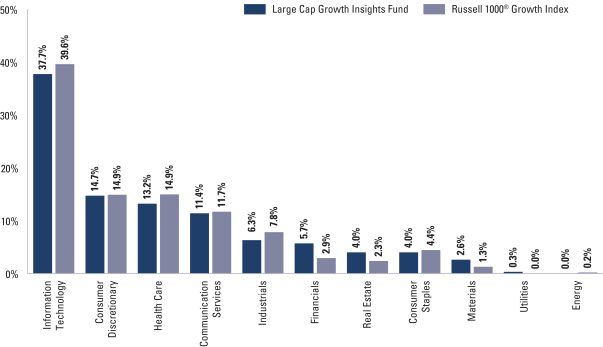
| 4 | | The Fund is actively managed and, as such, its composition may differ over time. Consequently, the Fund’s overall sector allocations may differ from the percentages contained in the graph above. The graph categorizes investments using the Global Industry Classification Standard (“GICS”), however, the sector classifications used by the portfolio management team may differ from GICS. The percentage shown for each investment category reflects the value of investments in that category as a percentage of market value (excluding investments in the securities lending reinvestment vehicle, if any). The graph depicts the Fund’s investments but may not represent the Fund’s market exposure due to the exclusion of certain derivatives, if any, as listed in the Additional Investment Information section of the Schedule of Investments. Percentages may not sum to 100% due to rounding. |
For more information about the Fund, please refer to www.GSAMFUNDS.com. There, you can learn more about the Fund’s investment strategies, holdings, and performance.
2
FUND BASICS
Large Cap Value Insights Fund
as of April 30, 2020
| | | | | | | | | | |
| | PERFORMANCE REVIEW | |
| | | |
| | | November 1, 2019–April 30, 2020 | | Fund Total Return
(based on NAV)1 | | | Russell 1000®
Value Index2 | |
| | Class A | | | -14.43 | % | | | -13.66 | % |
| | Class C | | | -14.75 | | | | -13.66 | |
| | Institutional | | | -14.27 | | | | -13.66 | |
| | Service | | | -14.49 | | | | -13.66 | |
| | Investor | | | -14.33 | | | | -13.66 | |
| | Class P | | | -14.27 | | | | -13.66 | |
| | Class R | | | -14.56 | | | | -13.66 | |
| | | Class R6 | | | -14.26 | | | | -13.66 | |
| 1 | | The net asset value (“NAV”) represents the net assets of the class of the Fund(ex-dividend) divided by the total number of shares of the class outstanding. The Fund’s performance assumes the reinvestment of dividends and other distributions. The Fund’s performance does not reflect the deduction of any applicable sales charges. |
| 2 | | The Russell 1000® Value Index (with dividends reinvested) is an unmanaged market capitalization weighted index of the 1000 largest U.S. companies with lowerprice-to-book ratios and lower forecasted growth values. The figures for the Russell 1000® Value Index do not include any deduction for fees, expenses or taxes. It is not possible to invest directly in an index. |
The returns set forth in the tables above represent past performance. Past performance does not guarantee future results. The Fund’s investment return and principal value will fluctuate so that an investor’s shares, when redeemed, may be worth more or less than their original cost. Current performance may be lower or higher than the performance quoted above. Please visit our web site at www.GSAMFUNDS.com to obtain the most recentmonth-end returns.Performance reflects applicable fee waivers and/or expense limitations in effect during the periods shown. In their absence, performance would be reduced. Returns do not reflect the deduction of taxes that a shareholder would pay on Fund distributions or the redemption of Fund shares.
3
FUND BASICS
| | | | | | | | |
| | TOP TEN HOLDINGS AS OF 4/30/203 |
| | | |
| | | Holding | | % of Net Assets | | | Line of Business |
| | | |
| | Berkshire Hathaway, Inc., Class B | | | 4.2 | % | | Diversified Financial Services |
| | Procter & Gamble Co. (The) | | | 3.3 | | | Household Products |
| | Bank of America Corp. | | | 2.0 | | | Banks |
| | Johnson & Johnson | | | 2.0 | | | Pharmaceuticals |
| | Comcast Corp., Class A | | | 1.7 | | | Media |
| | JPMorgan Chase & Co. | | | 1.6 | | | Banks |
| | CME Group, Inc. | | | 1.5 | | | Capital Markets |
| | Home Depot, Inc. (The) | | | 1.4 | | | Specialty Retail |
| | Chevron Corp. | | | 1.4 | | | Oil, Gas & Consumable Fuels |
| | | Target Corp. | | | 1.4 | | | Multiline Retail |
| 3 | | The top 10 holdings may not be representative of the Portfolio’s future investments. The top 10 holdings exclude investments in money market funds. |
|
| FUND VS. BENCHMARK SECTOR ALLOCATIONS4 |
|
| As of April 30, 2020 |
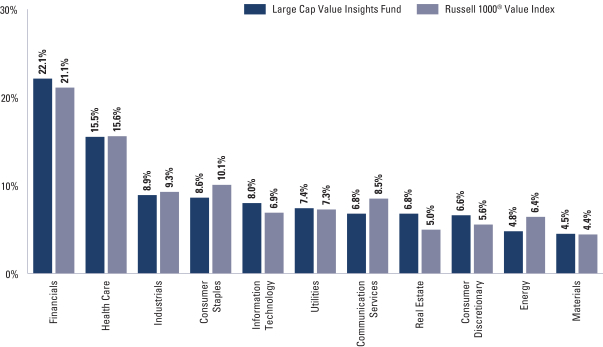
| 4 | | The Fund is actively managed and, as such, its composition may differ over time. Consequently, the Fund’s overall sector allocations may differ from the percentages contained in the graph above. The graph categorizes investments using the Global Industry Classification Standard (“GICS”); however, the sector classifications used by the portfolio management team may differ from GICS. The percentage shown for each investment category reflects the value of investments in that category as a percentage of market value. The graph depicts the Fund’s investments but may not represent the Fund’s market exposure due to the exclusion of certain derivatives, if any, as listed in the Additional Investment Information section of the Schedule of Investments. Percentages may not sum to 100% due to rounding. |
For more information about the Fund, please refer to www.GSAMFUNDS.com. There, you can learn more about the Fund’s investment strategies, holdings, and performance.
4
FUND BASICS
Small Cap Equity Insights Fund
as of April 30, 2020
| | | | | | | | | | |
| | PERFORMANCE REVIEW | |
| | | |
| | | November 1, 2019–April 30, 2020 | | Fund Total Return
(based on NAV)1 | | | Russell 2000® Index2 | |
| | Class A | | | -20.18 | % | | | -15.47 | % |
| | Class C | | | -20.51 | | | | -15.47 | |
| | Institutional | | | -20.03 | | | | -15.47 | |
| | Service | | | -20.22 | | | | -15.47 | |
| | Investor | | | -20.10 | | | | -15.47 | |
| | Class P | | | -20.03 | | | | -15.47 | |
| | Class R | | | -20.27 | | | | -15.47 | |
| | | Class R6 | | | -20.03 | | | | -15.47 | |
| 1 | | The net asset value (“NAV”) represents the net assets of the class of the Fund(ex-dividend) divided by the total number of shares of the class outstanding. The Fund’s performance assumes the reinvestment of dividends and other distributions. The Fund’s performance does not reflect the deduction of any applicable sales charges. |
| 2 | | The Russell 2000® Index (with dividends reinvested) is an unmanaged index of common stock prices that measures the performance of the 2000 smallest companies in the Russell 3000® Index. The figures for the Russell 2000® Index do not include any deduction for fees, expenses or taxes. It is not possible to invest directly in an index. |
The returns set forth in the tables above represent past performance. Past performance does not guarantee future results. The Fund’s investment return and principal value will fluctuate so that an investor’s shares, when redeemed, may be worth more or less than their original cost. Current performance may be lower or higher than the performance quoted above. Please visit our web site at www.GSAMFUNDS.com to obtain the most recentmonth-end returns.Performance reflects applicable fee waivers and/or expense limitations in effect during the periods shown. In their absence, performance would be reduced. Returns do not reflect the deduction of taxes that a shareholder would pay on Fund distributions or the redemption of Fund shares.
5
FUND BASICS
| | | | | | | | |
| | TOP TEN HOLDINGS AS OF 4/30/203 |
| | | |
| | | Holding | | % of Net Assets | | | Line of Business |
| | | |
| | Teladoc Health, Inc. | | | 1.0 | % | | Health Care Technology |
| | Haemonetics Corp. | | | 1.0 | | | Health Care Equipment & Supplies |
| | First Industrial Realty Trust, Inc. REIT | | | 1.0 | | | Equity Real Estate Investment Trusts (REITs) |
| | ACADIA Pharmaceuticals, Inc. | | | 0.9 | | | Biotechnology |
| | Rexford Industrial Realty, Inc. REIT | | | 0.9 | | | Equity Real Estate Investment Trusts (REITs) |
| | Wingstop, Inc. | | | 0.8 | | | Hotels, Restaurants & Leisure |
| | Terreno Realty Corp. REIT | | | 0.8 | | | Equity Real Estate Investment Trusts (REITs) |
| | Perspecta, Inc. | | | 0.8 | | | IT Services |
| | Cogent Communications Holdings, Inc. | | | 0.8 | | | Diversified Telecommunication Services |
| | | CVB Financial Corp. | | | 0.8 | | | Banks |
| 3 | | The top 10 holdings may not be representative of the Fund’s future investments. The top 10 holdings exclude investments in money market funds. |
|
| FUND VS. BENCHMARK SECTOR ALLOCATIONS4 |
|
| As of April 30, 2020 |
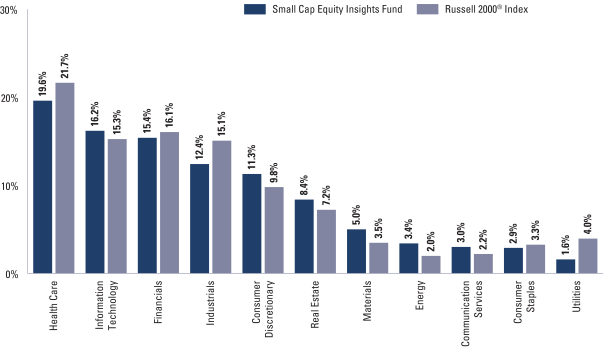
| 4 | | The Fund is actively managed and, as such, its composition may differ over time. Consequently, the Fund’s overall sector allocations may differ from the percentages contained in the graph above. The graph categorizes investments using the Global Industry Classification Standard (“GICS”), however, the sector classifications used by the portfolio management team may differ from GICS. The percentage shown for each investment category reflects the value of investments in that category as a percentage of market value (excluding investments in the securities lending reinvestment vehicle, if any). Investments in the securities lending reinvestment vehicle represented 0.9% of the Fund’s net assets as of April 30, 2020. The graph depicts the Fund’s investments but may not represent the Fund’s market exposure due to the exclusion of certain derivatives, if any, as listed in the Additional Investment Information section of the Schedule of Investments. Percentages may not sum to 100% due to rounding. |
For more information about the Fund, please refer to www.GSAMFUNDS.com. There, you can learn more about the Fund’s investment strategies, holdings, and performance.
6
FUND BASICS
Small Cap Growth Insights Fund
as of April 30, 2020
| | | | | | | | | | |
| | PERFORMANCE REVIEW | |
| | | |
| | | November 1, 2019- April 30, 2020 | | Fund Total Return
(based on NAV)1 | | | Russell 2000
Growth® Index2 | |
| | Class A | | | -14.32 | % | | | -7.62 | % |
| | Class C | | | -14.66 | | | | -7.62 | |
| | Institutional | | | -14.15 | | | | -7.62 | |
| | Investor | | | -14.23 | | | | -7.62 | |
| | Class P | | | -14.17 | | | | -7.62 | |
| | Class R | | | -14.46 | | | | -7.62 | |
| | | Class R6 | | | -14.15 | | | | -7.62 | |
| 1 | | The net asset value (“NAV”) represents the net assets of the class of the Fund(ex-dividend) divided by the total number of shares of the class outstanding. The Fund’s performance assumes the reinvestment of dividends and other distributions. The Fund’s performance does not reflect the deduction of any applicable sales charges. |
| 2 | | The Russell 2000® Growth Index (with dividends reinvested) is an unmanaged index of common stock prices that measures the performance of those Russell 2000 companies with higherprice-to-book ratios and higher forecasted growth values. The Russell 2000® Growth Index figures do not reflect any deduction for fees, expenses or taxes. It is not possible to invest directly in an index. |
The returns set forth in the tables above represent past performance. Past performance does not guarantee future results. The Fund’s investment return and principal value will fluctuate so that an investor’s shares, when redeemed, may be worth more or less than their original cost. Current performance may be lower or higher than the performance quoted above. Please visit our web site at www.GSAMFUNDS.com to obtain the most recentmonth-end returns.Performance reflects applicable fee waivers and/or expense limitations in effect during the periods shown. In their absence, performance would be reduced. Returns do not reflect the deduction of taxes that a shareholder would pay on Fund distributions or the redemption of Fund shares.
7
FUND BASICS
| | | | | | | | |
| | TOP TEN HOLDINGS AS OF 4/30/20203 |
| | | |
| | | Holding | | % of Net Assets | | | Line of Business |
| | | |
| | Teladoc Health, Inc. | | | 1.6 | % | | Health Care Technology |
| | ACADIA Pharmaceuticals, Inc. | | | 1.2 | | | Biotechnology |
| | Haemonetics Corp. | | | 1.2 | | | Health Care Equipment & Supplies |
| | Inphi Corp. | | | 1.0 | | | Semiconductors & Semiconductor Equipment |
| | Wingstop, Inc. | | | 0.9 | | | Hotels, Restaurants & Leisure |
| | Five9, Inc. | | | 0.9 | | | Software |
| | Cogent Communications Holdings, Inc. | | | 0.9 | | | Diversified Telecommunication Services |
| | Qualys, Inc. | | | 0.9 | | | Software |
| | QTS Realty Trust, Inc., Class A REIT | | | 0.9 | | | Equity Real Estate Investment Trusts (REITs) |
| | | Omnicell, Inc. | | | 0.9 | | | Health Care Technology |
| 3 | | The top 10 holdings may not be representative of the Fund’s future investments. The top 10 holdings exclude investments in money market funds. |
|
| FUND VS. BENCHMARK SECTOR ALLOCATIONS4 |
|
| As of April 30, 2020 |
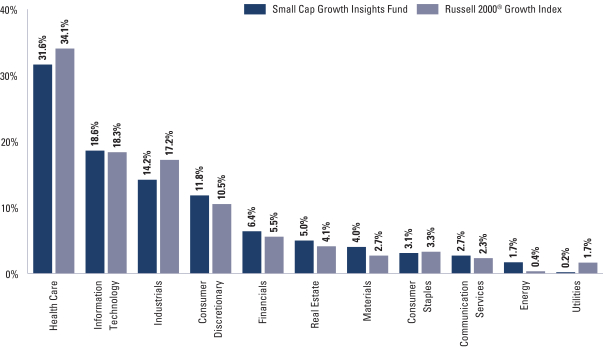
| 4 | | The Fund is actively managed and, as such, its composition may differ over time. Consequently, the Fund’s overall sector allocations may differ from the percentages contained in the graph above. The graph categorizes investments using the Global Industry Classification Standard (“GICS”), however, the sector classifications used by the portfolio management team may differ from GICS. The percentage shown for each investment category reflects the value of investments in that category as a percentage of market value (excluding investments in the securities lending reinvestment vehicle, if any). Investments in the securities lending reinvestment vehicle represented 0.8% of the Fund’s net assets as of April 30, 2020 . The graph depicts the Fund’s investments but may not represent the Fund’s market exposure due to the exclusion of certain derivatives, if any, as listed in the Additional Investment Information section of the Schedule of Investments. Percentages may not sum to 100% due to rounding. |
For more information about the Fund, please refer to www.GSAMFUNDS.com. There, you can learn more about the Fund’s investment strategies, holdings, and performance.
8
FUND BASICS
Small Cap Value Insights Fund
as of April 30, 2020
| | | | | | | | | | |
| | PERFORMANCE REVIEW | |
| | | |
| | | November 1, 2019–April 30, 2020 | | Fund Total Return
(based on NAV)1 | | | Russell 2000®
Value Index2 | |
| | | |
| | Class A | | | -24.82 | % | | | -23.44 | % |
| | Class C | | | -25.11 | | | | -23.44 | |
| | Institutional | | | -24.68 | | |
| -23.44
|
|
| | Investor | | | -24.76 | | |
| -23.44
|
|
| | Class P | | | -24.69 | | |
| -23.44
|
|
| | Class R | | | -24.94 | | |
| -23.44
|
|
| | | Class R6 | | | -24.68 | | |
| -23.44
|
|
| 1 | | The net asset value (“NAV”) represents the net assets of the class of the Fund(ex-dividend) divided by the total number of shares of the class outstanding. The Fund’s performance assumes the reinvestment of dividends and other distributions. The Fund’s performance does not reflect the deduction of any applicable sales charges. |
| 2 | | The Russell 2000® Value Index (with dividends reinvested) is an unmanaged index of common stock prices that measures the performance of those Russell 2000 companies with lowerprice-to-book ratios and lower forecasted growth values. The Russell 2000® Value Index figures do not reflect any deduction for fees, expenses or taxes. It is not possible to invest directly in an index. |
The returns set forth in the tables above represent past performance. Past performance does not guarantee future results. The Fund’s investment return and principal value will fluctuate so that an investor’s shares, when redeemed, may be worth more or less than their original cost. Current performance may be lower or higher than the performance quoted above. Please visit our web site at www.GSAMFUNDS.com to obtain the most recentmonth-end returns.Performance reflects applicable fee waivers and/or expense limitations in effect during the periods shown. In their absence, performance would be reduced. Returns do not reflect the deduction of taxes that a shareholder would pay on Fund distributions or the redemption of Fund shares.
9
FUND BASICS
| | | | | | | | |
| | TOP TEN HOLDINGS AS OF 4/30/20203 |
| | | |
| | | Holding | | % of Net Assets | | | Line of Business |
| | | |
| | Lumentum Holdings, Inc. | | | 1.2 | % | | Communications Equipment |
| | First Industrial Realty Trust, Inc. REIT | | | 1.0 | | | Equity Real Estate Investment Trusts (REITs) |
| | Terreno Realty Corp. REIT | | | 0.9 | | | Equity Real Estate Investment Trusts (REITs) |
| | Cirrus Logic, Inc. | | | 0.9 | | | Semiconductors & Semiconductor Equipment |
| | CVB Financial Corp. | | | 0.9 | | | Banks |
| | Perspecta, Inc. | | | 0.9 | | | IT Services |
| | Murphy USA, Inc. | | | 0.8 | | | Specialty Retail |
| | Avista Corp. | | | 0.8 | | | Multi-Utilities |
| | STAG Industrial, Inc. REIT | | | 0.7 | | | Equity Real Estate Investment Trusts (REITs) |
| | | Portland General Electric Co. | | | 0.7 | | | Electric Utilities |
| 3 | | The top 10 holdings may not be representative of the Fund’s future investments. The top 10 holdings exclude investments in money market funds. |
|
| FUND VS. BENCHMARK SECTOR ALLOCATIONS4 |
|
| As of April 30, 2020 |
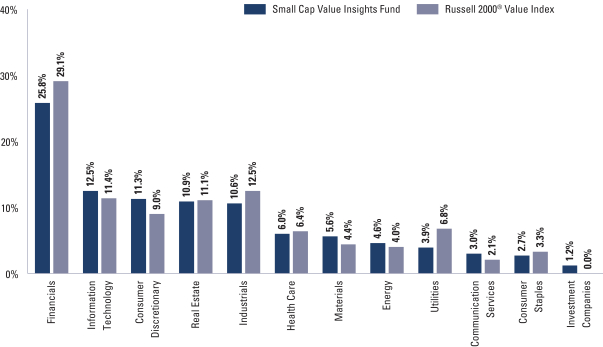
| 4 | | The Fund is actively managed and, as such, its composition may differ over time. Consequently, the Fund’s overall sector allocations may differ from the percentages contained in the graph above. The graph categorizes investments using the Global Industry Classification Standard (“GICS”); however, the sector classifications used by the portfolio management team may differ from GICS. The percentage shown for each investment category reflects the value of investments in that category as a percentage of market value (excluding investments in the securities lending reinvestment vehicle, if any). Investments in the securities lending reinvestment vehicle represented 2.0% of the Fund’s net assets as of April 30, 2020. The graph depicts the Fund’s investments but may not represent the Fund’s market exposure due to the exclusion of certain derivatives, if any, as listed in the Additional Investment Information section of the Schedule of Investments. Percentages may not sum to 100% due to rounding. |
For more information about the Fund, please refer to www.GSAMFUNDS.com. There, you can learn more about the Fund’s investment strategies, holdings, and performance.
10
FUND BASICS
U.S. Equity Insights Fund
as of April 30, 2020
| | | | | | | | | | |
| | PERFORMANCE REVIEW | |
| | | |
| | | November 1, 2019–April 30, 2020 | | Fund Total Return
(based on NAV)1 | | | S&P 500® Index2 | |
| | Class A | | | -3.20 | % | | | -3.16 | % |
| | Class C | | | -3.53 | | | | -3.16 | |
| | Institutional | | | -2.99 | | | | -3.16 | |
| | Service | | | -3.25 | | | | -3.16 | |
| | Investor | | | -3.06 | | | | -3.16 | |
| | Class P | | | -3.00 | | | | -3.16 | |
| | Class R | | | -3.30 | | | | -3.16 | |
| | | Class R6 | | | -3.01 | | | | -3.16 | |
| 1 | | The net asset value (“NAV”) represents the net assets of the class of the Fund(ex-dividend) divided by the total number of shares of the class outstanding. The Fund’s performance assumes the reinvestment of dividends and other distributions. The Fund’s performance does not reflect the deduction of any applicable sales charges. |
| 2 | | The S&P 500® Index (with dividends reinvested) is the Standard & Poor’s 500 Composite Index of 500 stocks, an unmanaged index of common stock prices. The figures for the S&P 500® Index do not include any deduction for fees, expenses or taxes. It is not possible to invest directly in an index. |
The returns set forth in the tables above represent past performance. Past performance does not guarantee future results. The Fund’s investment return and principal value will fluctuate so that an investor’s shares, when redeemed, may be worth more or less than their original cost. Current performance may be lower or higher than the performance quoted above. Please visit our web site at www.GSAMFUNDS.com to obtain the most recentmonth-end returns.Performance reflects applicable fee waivers and/or expense limitations in effect during the periods shown. In their absence, performance would be reduced. Returns do not reflect the deduction of taxes that a shareholder would pay on Fund distributions or the redemption of Fund shares.
11
FUND BASICS
| | | | | | | | |
| | TOP TEN HOLDINGS AS OF 4/30/203 |
| | | |
| | | Holding | | % of Net Assets | | | Line of Business |
| | | |
| | Microsoft Corp. | | | 6.4 | % | | Software |
| | Apple, Inc. | | | 6.1 | | | Technology Hardware, Storage & Peripherals |
| | Amazon.com, Inc. | | | 5.3 | | | Internet & Direct Marketing Retail |
| | Alphabet, Inc., Class C | | | 2.5 | | | Interactive Media & Services |
| | Berkshire Hathaway, Inc., Class B | | | 2.5 | | | Diversified Financial Services |
| | Procter & Gamble Co. (The) | | | 2.2 | | | Household Products |
| | Facebook, Inc., Class A | | | 1.8 | | | Interactive Media & Services |
| | NVIDIA Corp. | | | 1.7 | | | Semiconductors & Semiconductor Equipment |
| | Home Depot, Inc. (The) | | | 1.7 | | | Specialty Retail |
| | | Comcast Corp., Class A | | | 1.5 | | | Media |
| 3 | | The top 10 holdings may not be representative of the Portfolio’s future investments. |
|
| FUND VS. BENCHMARK SECTOR ALLOCATIONS4 |
|
| As of April 30, 2020 |

| 4 | | The Fund is actively managed and, as such, its composition may differ over time. Consequently, the Fund’s overall sector allocations may differ from the percentages contained in the graph above. The graph categorizes investments using the Global Industry Classification Standard (“GICS”), however, the sector classifications used by the portfolio management team may differ from GICS. The percentage shown for each investment category reflects the value of investments in that category as a percentage of market value (excluding investments in the securities lending reinvestment vehicle, if any). The graph depicts the Fund’s investments but may not represent the Fund’s market exposure due to the exclusion of certain derivatives, if any, as listed in the Additional Investment Information section of the Schedule of Investments. Percentages may not sum to 100% due to rounding. |
For more information about the Fund, please refer to www.GSAMFUNDS.com. There, you can learn more about the Fund’s investment strategies, holdings, and performance.
12
GOLDMAN SACHS LARGE CAP GROWTH INSIGHTS FUND
Schedule of Investments
April 30, 2020 (Unaudited)
| | | | | | | | |
| Shares | | | Description | | Value | |
|
| Common Stocks – 99.1% | |
| Aerospace & Defense – 0.4% | |
| | 16,851 | | | Hexcel Corp. | | $ | 582,876 | |
| | 18,993 | | | Teledyne Technologies, Inc.* | | | 6,185,450 | |
| | | | | | | | |
| | | | | | | 6,768,326 | |
| | |
| Airlines – 0.0% | |
| | 5,179 | | | Copa Holdings SA, Class A (Panama) | | | 228,964 | |
| | |
| Automobiles – 0.7% | |
| | 16,063 | | | Tesla, Inc.* | | | 12,559,339 | |
| | |
| Banks – 0.3% | |
| | 19,254 | | | Citizens Financial Group, Inc. | | | 431,097 | |
| | 14,751 | | | SVB Financial Group* | | | 2,849,451 | |
| | 56,797 | | | Western Alliance Bancorp | | | 2,037,876 | |
| | | | | | | | |
| | | | | | | 5,318,424 | |
| | |
| Beverages – 0.7% | |
| | 5,667 | | | Brown-Forman Corp., Class B | | | 352,487 | |
| | 172,415 | | | Monster Beverage Corp.* | | | 10,656,971 | |
| | 6,423 | | | PepsiCo, Inc. | | | 849,699 | |
| | | | | | | | |
| | | | | | | 11,859,157 | |
| | |
| Biotechnology – 4.0% | |
| | 366,367 | | | AbbVie, Inc. | | | 30,115,368 | |
| | 34,073 | | | Alexion Pharmaceuticals, Inc.* | | | 3,661,825 | |
| | 27,611 | | | Biogen, Inc.* | | | 8,195,773 | |
| | 9,704 | | | Bluebird Bio, Inc.* | | | 522,852 | |
| | 92,984 | | | Gilead Sciences, Inc. | | | 7,810,656 | |
| | 70,055 | | | Incyte Corp.* | | | 6,841,571 | |
| | 31,314 | | | Moderna, Inc.* | | | 1,440,131 | |
| | 13,350 | | | Regeneron Pharmaceuticals, Inc.* | | | 7,020,498 | |
| | 8,465 | | | Sarepta Therapeutics, Inc.* | | | 997,854 | |
| | | | | | | | |
| | | | | | | 66,606,528 | |
| | |
| Building Products – 0.2% | |
| | 14,926 | | | Allegion PLC | | | 1,500,660 | |
| | 13,105 | | | Trane Technologies PLC | | | 1,145,639 | |
| | | | | | | | |
| | | | | | | 2,646,299 | |
| | |
| Capital Markets – 2.3% | |
| | 30,167 | | | Cboe Global Markets, Inc. | | | 2,997,996 | |
| | 63,147 | | | CME Group, Inc. | | | 11,253,427 | |
| | 9,960 | | | LPL Financial Holdings, Inc. | | | 599,791 | |
| | 2,506 | | | MarketAxess Holdings, Inc. | | | 1,140,255 | |
| | 1,575 | | | Moody’s Corp. | | | 384,143 | |
| | 76,600 | | | S&P Global, Inc. | | | 22,434,608 | |
| | | | | | | | |
| | | | | | | 38,810,220 | |
| | |
| Chemicals – 2.0% | |
| | 11,068 | | | Air Products and Chemicals, Inc. | | | 2,496,719 | |
| | 468,401 | | | Axalta Coating Systems Ltd.* | | | 9,246,236 | |
| | 19,502 | | | CF Industries Holdings, Inc. | | | 536,305 | |
| | 39,347 | | | Element Solutions, Inc.* | | | 403,307 | |
| | 4,096 | | | NewMarket Corp. | | | 1,685,258 | |
| | 36,913 | | | Sherwin-Williams Co. (The) | | | 19,799,026 | |
| | | | | | | | |
| | | | | | | 34,166,851 | |
| | |
|
| Common Stocks – (continued) | |
| Commercial Services & Supplies – 0.7% | |
| | 21,645 | | | Cintas Corp. | | | 4,801,510 | |
| | 20,251 | | | Republic Services, Inc. | | | 1,586,463 | |
| | 61,860 | | | Waste Connections, Inc. | | | 5,314,393 | |
| | | | | | | | |
| | | | | | | 11,702,366 | |
| | |
| Communications Equipment – 1.7% | |
| | 22,195 | | | Arista Networks, Inc.* | | | 4,867,363 | |
| | 569,005 | | | Cisco Systems, Inc. | | | 24,114,432 | |
| | | | | | | | |
| | | | | | | 28,981,795 | |
| | |
| Consumer Finance – 0.7% | |
| | 216,754 | | | Ally Financial, Inc. | | | 3,552,598 | |
| | 41,415 | | | Discover Financial Services | | | 1,779,603 | |
| | 311,265 | | | Synchrony Financial | | | 6,159,934 | |
| | | | | | | | |
| | | | | | | 11,492,135 | |
| | |
| Containers & Packaging – 0.3% | |
| | 68,036 | | | Ball Corp. | | | 4,462,481 | |
| | |
| Diversified Consumer Services – 0.6% | |
| | 26,736 | | | Bright Horizons Family Solutions, Inc.* | | | 3,113,407 | |
| | 18,091 | | | frontdoor, Inc.* | | | 700,302 | |
| | 58,932 | | | Service Corp. International | | | 2,165,162 | |
| | 131,693 | | | ServiceMaster Global Holdings, Inc.* | | | 4,484,147 | |
| | | | | | | | |
| | | | | | | 10,463,018 | |
| | |
| Diversified Financial Services – 1.5% | |
| | 87,719 | | | Berkshire Hathaway, Inc., Class B* | | | 16,435,032 | |
| | 193,702 | | | Voya Financial, Inc. | | | 8,749,519 | |
| | | | | | | | |
| | | | | | | 25,184,551 | |
| | |
| Electrical Equipment – 0.4% | |
| | 64,381 | | | AMETEK, Inc. | | | 5,399,635 | |
| | 10,102 | | | Emerson Electric Co. | | | 576,117 | |
| | 23,840 | | | Sensata Technologies Holding PLC* | | | 867,299 | |
| | | | | | | | |
| | | | | | | 6,843,051 | |
| | |
| Electronic Equipment, Instruments & Components – 1.3% | |
| | 14,306 | | | CDW Corp. | | | 1,585,105 | |
| | 188,846 | | | Keysight Technologies, Inc.* | | | 18,274,627 | |
| | 31,211 | | | National Instruments Corp. | | | 1,199,127 | |
| | 3,664 | | | Zebra Technologies Corp., Class A* | | | 841,474 | |
| | | | | | | | |
| | | | | | | 21,900,333 | |
| | |
| Entertainment – 1.3% | |
| | 35,419 | | | Netflix, Inc.* | | | 14,870,667 | |
| | 30,116 | | | Roku, Inc.* | | | 3,650,963 | |
| | 8,522 | | | Spotify Technology SA* | | | 1,291,679 | |
| | 209,946 | | | Zynga, Inc., Class A* | | | 1,582,993 | |
| | | | | | | | |
| | | | | | | 21,396,302 | |
| | |
| Equity Real Estate Investment Trusts (REITs) – 4.0% | |
| | 370,983 | | | American Homes 4 Rent, Class A REIT | | | 8,955,530 | |
| | 17,782 | | | Americold Realty Trust REIT | | | 543,951 | |
| | 43,095 | | | Brixmor Property Group, Inc. REIT | | | 493,438 | |
| | |
| | |
| The accompanying notes are an integral part of these financial statements. | | 13 |
GOLDMAN SACHS LARGE CAP GROWTH INSIGHTS FUND
Schedule of Investments(continued)
April 30, 2020 (Unaudited)
| | | | | | | | |
| Shares | | | Description | | Value | |
|
| Common Stocks – (continued) | |
| Equity Real Estate Investment Trusts (REITs) – (continued) | |
| | 85,159 | | | Camden Property Trust REIT | | $ | 7,499,953 | |
| | 54,376 | | | Douglas Emmett, Inc. REIT | | | 1,657,924 | |
| | 224,695 | | | Duke Realty Corp. REIT | | | 7,796,917 | |
| | 210,453 | | | Equity LifeStyle Properties, Inc. REIT | | | 12,692,420 | |
| | 11,908 | | | Essex Property Trust, Inc. REIT | | | 2,906,743 | |
| | 7,525 | | | Extra Space Storage, Inc. REIT | | | 664,006 | |
| | 21,356 | | | Healthcare Trust of America, Inc., Class A REIT | | | 525,998 | |
| | 343,597 | | | Invitation Homes, Inc. REIT | | | 8,126,069 | |
| | 61,621 | | | Retail Properties of America, Inc., Class A REIT | | | 382,050 | |
| | 51,380 | | | SBA Communications Corp. REIT | | | 14,896,090 | |
| | | | | | | | |
| | | | | | | 67,141,089 | |
| | |
| Food & Staples Retailing – 2.1% | |
| | 58,268 | | | Casey’s General Stores, Inc. | | | 8,822,358 | |
| | 83,194 | | | Costco Wholesale Corp. | | | 25,207,782 | |
| | 67,175 | | | US Foods Holding Corp.* | | | 1,444,262 | |
| | | | | | | | |
| | | | | | | 35,474,402 | |
| | |
| Health Care Equipment & Supplies – 2.4% | |
| | 30,306 | | | Align Technology, Inc.* | | | 6,511,244 | |
| | 96,549 | | | Edwards Lifesciences Corp.* | | | 20,999,407 | |
| | 7,631 | | | IDEXX Laboratories, Inc.* | | | 2,118,366 | |
| | 6,981 | | | STERIS PLC | | | 994,793 | |
| | 19,391 | | | Teleflex, Inc. | | | 6,503,741 | |
| | 17,514 | | | West Pharmaceutical Services, Inc. | | | 3,314,700 | |
| | | | | | | | |
| | | | | | | 40,442,251 | |
| | |
| Health Care Providers & Services – 4.0% | |
| | 47,147 | | | AmerisourceBergen Corp. | | | 4,227,200 | |
| | 37,835 | | | Anthem, Inc. | | | 10,621,420 | |
| | 47,054 | | | Cigna Corp. | | | 9,212,232 | |
| | 19,346 | | | HCA Healthcare, Inc. | | | 2,125,738 | |
| | 22,834 | | | Humana, Inc. | | | 8,718,478 | |
| | 76,798 | | | UnitedHealth Group, Inc. | | | 22,461,111 | |
| | 84,128 | | | Universal Health Services, Inc., Class B | | | 8,891,488 | |
| | | | | | | | |
| | | | | | | 66,257,667 | |
| | |
| Hotels, Restaurants & Leisure – 1.8% | |
| | 15,715 | | | Chipotle Mexican Grill, Inc.* | | | 13,806,413 | |
| | 32,957 | | | Domino’s Pizza, Inc. | | | 11,928,127 | |
| | 10,426 | | | Dunkin’ Brands Group, Inc. | | | 655,170 | |
| | 56,156 | | | Yum China Holdings, Inc. (China) | | | 2,721,320 | |
| | 17,117 | | | Yum! Brands, Inc. | | | 1,479,422 | |
| | | | | | | | |
| | | | | | | 30,590,452 | |
| | |
| Household Durables – 0.0% | |
| | 7,467 | | | Tempur Sealy International, Inc.* | | | 401,351 | |
| | |
| Household Products – 1.2% | |
| | 57,794 | | | Church & Dwight Co., Inc. | | | 4,045,002 | |
| | 123,498 | | | Procter & Gamble Co. (The) | | | 14,556,709 | |
| | 20,853 | | | Reynolds Consumer Products, Inc. | | | 676,263 | |
| | | | | | | | |
| | | | | | | 19,277,974 | |
| | |
|
| Common Stocks – (continued) | |
| Industrial Conglomerates – 0.1% | |
| | 98,291 | | | General Electric Co. | | | 668,379 | |
| | 3,990 | | | Roper Technologies, Inc. | | | 1,360,710 | |
| | | | | | | | |
| | | | | | | 2,029,089 | |
| | |
| Insurance – 0.8% | |
| | 980 | | | Alleghany Corp. | | | 523,036 | |
| | 4,540 | | | American Financial Group, Inc. | | | 300,730 | |
| | 45,934 | | | Aon PLC | | | 7,931,424 | |
| | 109,619 | | | Athene Holding Ltd., Class A* | | | 2,959,713 | |
| | 11,133 | | | Primerica, Inc. | | | 1,156,830 | |
| | 11,055 | | | Reinsurance Group of America, Inc. | | | 1,157,237 | |
| | | | | | | | |
| | | | | | | 14,028,970 | |
| | |
| Interactive Media & Services – 8.1% | |
| | 22,626 | | | Alphabet, Inc., Class A* | | | 30,470,434 | |
| | 44,008 | | | Alphabet, Inc., Class C* | | | 59,351,830 | |
| | 217,530 | | | Facebook, Inc., Class A* | | | 44,530,566 | |
| | 54,555 | | | Pinterest, Inc., Class A* | | | 1,127,106 | |
| | | | | | | | |
| | | | | | | 135,479,936 | |
| | |
| Internet & Direct Marketing Retail – 8.2% | |
| | 53,923 | | | Amazon.com, Inc.* | | | 133,405,502 | |
| | 114,583 | | | eBay, Inc. | | | 4,563,841 | |
| | | | | | | | |
| | | | | | | 137,969,343 | |
| | |
| IT Services – 7.9% | |
| | 71,283 | | | Alliance Data Systems Corp. | | | 3,569,140 | |
| | 19,045 | | | Amdocs Ltd. | | | 1,227,260 | |
| | 13,256 | | | Automatic Data Processing, Inc. | | | 1,944,523 | |
| | 78,793 | | | Booz Allen Hamilton Holding Corp. | | | 5,786,558 | |
| | 135,567 | | | Cognizant Technology Solutions Corp., Class A | | | 7,865,597 | |
| | 9,476 | | | EPAM Systems, Inc.* | | | 2,093,154 | |
| | 36,663 | | | FleetCor Technologies, Inc.* | | | 8,844,949 | |
| | 4,215 | | | Gartner, Inc.* | | | 500,784 | |
| | 35,876 | | | International Business Machines Corp. | | | 4,504,590 | |
| | 40,478 | | | Mastercard, Inc., Class A | | | 11,130,236 | |
| | 113,559 | | | Okta, Inc.* | | | 17,181,477 | |
| | 209,148 | | | PayPal Holdings, Inc.* | | | 25,725,204 | |
| | 56,399 | | | Square, Inc., Class A* | | | 3,673,831 | |
| | 79,638 | | | VeriSign, Inc.* | | | 16,683,364 | |
| | 100,213 | | | Visa, Inc., Class A | | | 17,910,067 | |
| | 200,669 | | | Western Union Co. (The) | | | 3,826,758 | |
| | | | | | | | |
| | | | | | | 132,467,492 | |
| | |
| Life Sciences Tools & Services – 1.6% | |
| | 58,660 | | | Illumina, Inc.* | | | 18,714,300 | |
| | 37,263 | | | IQVIA Holdings, Inc.* | | | 5,313,331 | |
| | 51,017 | | | QIAGEN NV* | | | 2,126,899 | |
| | | | | | | | |
| | | | | | | 26,154,530 | |
| | |
| Machinery – 0.5% | |
| | 33,435 | | | Allison Transmission Holdings, Inc. | | | 1,215,028 | |
| | 39,703 | | | Illinois Tool Works, Inc. | | | 6,451,737 | |
| | 9,606 | | | Snap-on, Inc. | | | 1,251,566 | |
| | | | | | | | |
| | | | | | | 8,918,331 | |
| | |
| | |
| 14 | | The accompanying notes are an integral part of these financial statements. |
GOLDMAN SACHS LARGE CAP GROWTH INSIGHTS FUND
| | | | | | | | |
| Shares | | | Description | | Value | |
|
| Common Stocks – (continued) | |
| Media – 2.0% | |
| | 23,446 | | | Charter Communications, Inc., Class A* | | $ | 11,611,162 | |
| | 410,628 | | | Comcast Corp., Class A | | | 15,451,932 | |
| | 316,623 | | | Liberty Global PLC, Class C (United Kingdom)* | | | 5,797,367 | |
| | | | | | | | |
| | | | | | | 32,860,461 | |
| | |
| Metals & Mining – 0.3% | |
| | 184,053 | | | Arconic Corp.* | | | 1,604,942 | |
| | 23,598 | | | Royal Gold, Inc. | | | 2,891,463 | |
| | | | | | | | |
| | | | | | | 4,496,405 | |
| | |
| Multiline Retail – 1.1% | |
| | 46,417 | | | Dollar General Corp. | | | 8,136,900 | |
| | 91,013 | | | Target Corp. | | | 9,987,767 | |
| | | | | | | | |
| | | | | | | 18,124,667 | |
| | |
| Multi-Utilities – 0.3% | |
| | 7,226 | | | DTE Energy Co. | | | 749,625 | |
| | 75,695 | | | Public Service Enterprise Group, Inc. | | | 3,838,494 | |
| | | | | | | | |
| | | | | | | 4,588,119 | |
| | |
| Pharmaceuticals – 1.2% | |
| | 153,097 | | | Horizon Therapeutics PLC* | | | 5,517,616 | |
| | 177,401 | | | Merck & Co., Inc. | | | 14,074,995 | |
| | | | | | | | |
| | | | | | | 19,592,611 | |
| | |
| Professional Services – 1.5% | |
| | 43,596 | | | CoreLogic, Inc. | | | 1,674,958 | |
| | 8,499 | | | CoStar Group, Inc.* | | | 5,509,562 | |
| | 65,582 | | | IHS Markit Ltd. | | | 4,413,669 | |
| | 173,194 | | | TransUnion | | | 13,645,955 | |
| | | | | | | | |
| | | | | | | 25,244,144 | |
| | |
| Road & Rail – 2.4% | |
| | 4,901 | | | JB Hunt Transport Services, Inc. | | | 495,589 | |
| | 44,879 | | | Norfolk Southern Corp. | | | 7,678,797 | |
| | 15,053 | | | Old Dominion Freight Line, Inc. | | | 2,187,051 | |
| | 183,084 | | | Union Pacific Corp. | | | 29,254,992 | |
| | | | | | | | |
| | | | | | | 39,616,429 | |
| | |
| Semiconductors & Semiconductor Equipment – 3.5% | |
| | 91,641 | | | Advanced Micro Devices, Inc.* | | | 4,801,072 | |
| | 18,903 | | | Lam Research Corp. | | | 4,825,558 | |
| | 122,258 | | | NVIDIA Corp. | | | 35,733,568 | |
| | 90,881 | | | QUALCOMM, Inc. | | | 7,149,608 | |
| | 37,594 | | | Universal Display Corp. | | | 5,643,612 | |
| | | | | | | | |
| | | | | | | 58,153,418 | |
| | |
| Software – 13.8% | |
| | 30,861 | | | Adobe, Inc.* | | | 10,913,684 | |
| | 2,994 | | | Alteryx, Inc., Class A* | | | 338,861 | |
| | 14,750 | | | Atlassian Corp. PLC, Class A* | | | 2,293,478 | |
| | 38,558 | | | DocuSign, Inc.* | | | 4,038,951 | |
| | 2,116 | | | Fair Isaac Corp.* | | | 746,821 | |
| | 196,526 | | | FireEye, Inc.* | | | 2,262,014 | |
| | 95,787 | | | Fortinet, Inc.* | | | 10,320,091 | |
| | 899,252 | | | Microsoft Corp. | | | 161,154,951 | |
| | |
|
| Common Stocks – (continued) | |
| Software – (continued) | |
| | 41,613 | | | Palo Alto Networks, Inc.* | | | 8,177,371 | |
| | 26,562 | | | Paycom Software, Inc.* | | | 6,933,213 | |
| | 4,236 | | | Proofpoint, Inc.* | | | 515,648 | |
| | 2,629 | | | RingCentral, Inc., Class A* | | | 600,805 | |
| | 15,923 | | | ServiceNow, Inc.* | | | 5,597,571 | |
| | 4,936 | | | Smartsheet, Inc., Class A* | | | 260,226 | |
| | 11,489 | | | SS&C Technologies Holdings, Inc. | | | 633,733 | |
| | 6,247 | | | Tyler Technologies, Inc.* | | | 2,003,351 | |
| | 55,545 | | | Workday, Inc., Class A* | | | 8,548,376 | |
| | 78,914 | | | Zscaler, Inc.* | | | 5,293,551 | |
| | | | | | | | |
| | | | | | | 230,632,696 | |
| | |
| Specialty Retail – 2.0% | |
| | 15,048 | | | Best Buy Co., Inc. | | | 1,154,633 | |
| | 5,212 | | | Carvana Co.*(a) | | | 417,533 | |
| | 91,989 | | | Home Depot, Inc. (The) | | | 20,221,942 | |
| | 72,086 | | | Lowe’s Cos, Inc. | | | 7,551,008 | |
| | 10,287 | | | O’Reilly Automotive, Inc.* | | | 3,974,280 | |
| | | | | | | | |
| | | | | | | 33,319,396 | |
| | |
| Technology Hardware, Storage & Peripherals – 9.2% | |
| | 522,463 | | | Apple, Inc. | | | 153,499,630 | |
| | 11,964 | | | NetApp, Inc. | | | 523,664 | |
| | | | | | | | |
| | | | | | | 154,023,294 | |
| | |
| TOTAL INVESTMENTS BEFORE SECURITIES
LENDING REINVESTMENT VEHICLE |
|
| | (Cost $1,208,527,538) | | $ | 1,658,674,657 | |
| | |
| | | | | | | | |
| Shares | | | Dividend Rate | | Value | |
|
| Securities Lending Reinvestment Vehicle – 0.0%(b) | |
| Goldman Sachs Financial Square Government Fund –
Institutional Shares |
|
| | 424,340 | | | 0.233% | | $ | 424,340 | |
| | (Cost $424,340) | |
| | |
| | TOTAL INVESTMENTS – 99.1% | |
| | (Cost $1,208,951,878) | | $ | 1,659,098,997 | |
| | |
| OTHER ASSETS IN EXCESS OF
LIABILITIES – 0.9% | | | 14,825,359 | |
| | |
| | NET ASSETS – 100.0% | | $ | 1,673,924,356 | |
| | |
| | |
|
| The percentage shown for each investment category reflects the value of investments in that category as a percentage of net assets. |
| |
* | | Non-income producing security. |
| |
(a) | | All or a portion of security is on loan. |
| |
(b) | | Represents an affiliated issuer. |
| | |
|
Investment Abbreviations: |
PLC | | —Public Limited Company |
REIT | | —Real Estate Investment Trust |
|
| | |
| The accompanying notes are an integral part of these financial statements. | | 15 |
GOLDMAN SACHS LARGE CAP VALUE INSIGHTS FUND
Schedule of Investments
April 30, 2020 (Unaudited)
| | | | | | | | |
| Shares | | | Description | | Value | |
|
| Common Stocks – 99.5% | |
| Aerospace & Defense – 0.7% | |
| | 14,121 | | | Raytheon Technologies Corp. | | $ | 915,182 | |
| | 4,804 | | | Teledyne Technologies, Inc.* | | | 1,564,519 | |
| | | | | | | | |
| | | | | | | 2,479,701 | |
| | |
| Airlines – 0.2% | |
| | 15,576 | | | Copa Holdings SA, Class A (Panama) | | | 688,615 | |
| | |
| Auto Components – 0.2% | |
| | 34,943 | | | Gentex Corp. | | | 847,018 | |
| | |
| Automobiles – 0.7% | |
| | 105,255 | | | General Motors Co. | | | 2,346,134 | |
| | |
| Banks – 8.5% | |
| | 285,844 | | | Bank of America Corp. | | | 6,874,548 | |
| | 48,850 | | | Citigroup, Inc. | | | 2,372,156 | |
| | 90,295 | | | Citizens Financial Group, Inc. | | | 2,021,705 | |
| | 3,086 | | | Comerica, Inc. | | | 107,578 | |
| | 32,687 | | | East West Bancorp, Inc. | | | 1,146,333 | |
| | 21,244 | | | First Hawaiian, Inc. | | | 373,682 | |
| | 71,762 | | | First Horizon National Corp. | | | 651,599 | |
| | 56,671 | | | JPMorgan Chase & Co. | | | 5,426,815 | |
| | 39,957 | | | PacWest Bancorp | | | 808,730 | |
| | 66,844 | | | Popular, Inc. | | | 2,579,510 | |
| | 3,905 | | | Prosperity Bancshares, Inc. | | | 234,027 | |
| | 23,502 | | | Signature Bank | | | 2,518,944 | |
| | 9,806 | | | Sterling Bancorp. | | | 120,908 | |
| | 9,129 | | | SVB Financial Group* | | | 1,763,449 | |
| | 13,328 | | | Synovus Financial Corp. | | | 280,021 | |
| | 53,317 | | | Western Alliance Bancorp | | | 1,913,014 | |
| | 3,707 | | | Zions Bancorp NA | | | 117,178 | |
| | | | | | | | |
| | | | | | | 29,310,197 | |
| | |
| Beverages – 0.8% | |
| | 42,303 | | | Monster Beverage Corp.* | | | 2,614,749 | |
| | |
| Biotechnology – 3.7% | |
| | 34,230 | | | AbbVie, Inc. | | | 2,813,706 | |
| | 8,593 | | | Alexion Pharmaceuticals, Inc.* | | | 923,490 | |
| | 8,674 | | | Biogen, Inc.* | | | 2,574,703 | |
| | 3,363 | | | Bluebird Bio, Inc.* | | | 181,199 | |
| | 55,438 | | | Gilead Sciences, Inc. | | | 4,656,792 | |
| | 3,199 | | | Moderna, Inc.* | | | 147,122 | |
| | 2,807 | | | Regeneron Pharmaceuticals, Inc.* | | | 1,476,145 | |
| | | | | | | | |
| | | | | | | 12,773,157 | |
| | |
| Building Products – 2.0% | |
| | 24,281 | | | Allegion PLC | | | 2,441,212 | |
| | 121,936 | | | Johnson Controls International PLC | | | 3,549,557 | |
| | 12,410 | | | Trane Technologies PLC | | | 1,084,882 | |
| | | | | | | | |
| | | | | | | 7,075,651 | |
| | |
| Capital Markets – 3.1% | |
| | 8,507 | | | Cboe Global Markets, Inc. | | | 845,426 | |
| | 34,556 | | | Charles Schwab Corp. (The) | | | 1,303,452 | |
| | 29,372 | | | CME Group, Inc. | | | 5,234,384 | |
| | 18,077 | | | Invesco Ltd. | | | 155,824 | |
| | |
|
| Common Stocks – (continued) | |
| Capital Markets – (continued) | |
| | 10,738 | | | S&P Global, Inc. | | | 3,144,945 | |
| | | | | | | | |
| | | | | | | 10,684,031 | |
| | |
| Chemicals – 3.7% | |
| | 11,070 | | | Air Products and Chemicals, Inc. | | | 2,497,171 | |
| | 174,488 | | | Axalta Coating Systems Ltd.* | | | 3,444,393 | |
| | 11,750 | | | CF Industries Holdings, Inc. | | | 323,125 | |
| | 23,554 | | | Corteva, Inc. | | | 616,879 | |
| | 22,068 | | | Dow, Inc. | | | 809,675 | |
| | 16,150 | | | Element Solutions, Inc.* | | | 165,537 | |
| | 7,894 | | | Linde PLC (United Kingdom) | | | 1,452,417 | |
| | 227 | | | NewMarket Corp. | | | 93,397 | |
| | 6,607 | | | Sherwin-Williams Co. (The) | | | 3,543,797 | |
| | | | | | | | |
| | | | | | | 12,946,391 | |
| | |
| Commercial Services & Supplies – 0.4% | |
| | 7,308 | | | Republic Services, Inc. | | | 572,509 | |
| | 8,313 | | | Waste Connections, Inc. | | | 714,170 | |
| | | | | | | | |
| | | | | | | 1,286,679 | |
| | |
| Communications Equipment – 0.1% | |
| | 4,183 | | | Cisco Systems, Inc. | | | 177,276 | |
| | |
| Construction Materials – 0.0% | |
| | 744 | | | Martin Marietta Materials, Inc. | | | 141,531 | |
| | |
| Consumer Finance – 1.1% | |
| | 118,771 | | | Ally Financial, Inc. | | | 1,946,657 | |
| | 94,439 | | | Synchrony Financial | | | 1,868,948 | |
| | | | | | | | |
| | | | | | | 3,815,605 | |
| | |
| Containers & Packaging – 0.1% | |
| | 23,143 | | | Graphic Packaging Holding Co. | | | 308,959 | |
| | 5,826 | | | Westrock Co. | | | 187,539 | |
| | | | | | | | |
| | | | | | | 496,498 | |
| | |
| Diversified Consumer Services – 0.2% | |
| | 5,064 | | | frontdoor, Inc.* | | | 196,027 | |
| | 354 | | | Graham Holdings Co., Class B | | | 138,064 | |
| | 13,406 | | | ServiceMaster Global Holdings, Inc.* | | | 456,474 | |
| | | | | | | | |
| | | | | | | 790,565 | |
| | |
| Diversified Financial Services – 5.6% | |
| | 77,042 | | | Berkshire Hathaway, Inc., Class B* | | | 14,434,589 | |
| | 104,843 | | | Equitable Holdings, Inc. | | | 1,920,724 | |
| | 64,443 | | | Voya Financial, Inc. | | | 2,910,890 | |
| | | | | | | | |
| | | | | | | 19,266,203 | |
| | |
| Diversified Telecommunication Services – 2.4% | |
| | 106,772 | | | AT&T, Inc. | | | 3,253,343 | |
| | 123,330 | | | CenturyLink, Inc. | | | 1,309,764 | |
| | 64,375 | | | Verizon Communications, Inc. | | | 3,698,344 | |
| | | | | | | | |
| | | | | | | 8,261,451 | |
| | |
| Electric Utilities – 2.0% | |
| | 3,992 | | | American Electric Power Co., Inc. | | | 331,775 | |
| | 7,475 | | | Duke Energy Corp. | | | 632,834 | |
| | |
| | |
| 16 | | The accompanying notes are an integral part of these financial statements. |
GOLDMAN SACHS LARGE CAP VALUE INSIGHTS FUND
| | | | | | | | |
| Shares | | | Description | | Value | |
|
| Common Stocks – (continued) | |
| Electric Utilities – (continued) | |
| | 1,487 | | | Entergy Corp. | | $ | 142,023 | |
| | 61,496 | | | FirstEnergy Corp. | | | 2,537,940 | |
| | 4,274 | | | IDACORP, Inc. | | | 392,268 | |
| | 5,441 | | | NextEra Energy, Inc. | | | 1,257,524 | |
| | 3,848 | | | OGE Energy Corp. | | | 121,289 | |
| | 24,037 | | | Southern Co. (The) | | | 1,363,619 | |
| | | | | | | | |
| | | | | | | 6,779,272 | |
| | |
| Electrical Equipment – 0.8% | |
| | 11,568 | | | AMETEK, Inc. | | | 970,208 | |
| | 21,664 | | | Emerson Electric Co. | | | 1,235,498 | |
| | 13,361 | | | Sensata Technologies Holding PLC* | | | 486,073 | |
| | | | | | | | |
| | | | | | | 2,691,779 | |
| | |
| Electronic Equipment, Instruments & Components – 1.0% | |
| | 35,720 | | | Keysight Technologies, Inc.* | | | 3,456,624 | |
| | |
| Energy Equipment & Services – 0.2% | |
| | 11,674 | | | Apergy Corp.*(a) | | | 107,518 | |
| | 59,783 | | | TechnipFMC PLC (United Kingdom) | | | 532,666 | |
| | | | | | | | |
| | | | | | | 640,184 | |
| | |
| Entertainment – 1.1% | |
| | 20,337 | | | Walt Disney Co. (The) | | | 2,199,446 | |
| | 233,281 | | | Zynga, Inc., Class A* | | | 1,758,939 | |
| | | | | | | | |
| | | | | | | 3,958,385 | |
| | |
| Equity Real Estate Investment Trusts (REITs) – 6.7% | |
| | 32,913 | | | American Homes 4 Rent, Class A REIT | | | 794,520 | |
| | 2,228 | | | AvalonBay Communities, Inc. REIT | | | 363,053 | |
| | 35,284 | | | Brixmor Property Group, Inc. REIT | | | 404,002 | |
| | 22,517 | | | Camden Property Trust REIT | | | 1,983,072 | |
| | 11,162 | | | CyrusOne, Inc. REIT | | | 783,014 | |
| | 24,183 | | | Douglas Emmett, Inc. REIT | | | 737,340 | |
| | 109,906 | | | Duke Realty Corp. REIT | | | 3,813,738 | |
| | 13,021 | | | Empire State Realty Trust, Inc., Class A REIT | | | 108,855 | |
| | 17,901 | | | Equity LifeStyle Properties, Inc. REIT | | | 1,079,609 | |
| | 5,246 | | | Equity Residential REIT | | | 341,305 | |
| | 5,974 | | | Essex Property Trust, Inc. REIT | | | 1,458,253 | |
| | 67,055 | | | Healthcare Trust of America, Inc., Class A REIT | | | 1,651,565 | |
| | 6,334 | | | Hudson Pacific Properties, Inc. REIT | | | 155,690 | |
| | 140,767 | | | Invitation Homes, Inc. REIT | | | 3,329,139 | |
| | 770 | | | Mid-America Apartment Communities, Inc. REIT | | | 86,178 | |
| | 19,929 | | | National Retail Properties, Inc. REIT | | | 650,483 | |
| | 2,626 | | | SBA Communications Corp. REIT | | | 761,330 | |
| | 67,571 | | | STORE Capital Corp. REIT | | | 1,356,150 | |
| | 14,873 | | | Sun Communities, Inc. REIT | | | 1,998,931 | |
| | 27,812 | | | Welltower, Inc. REIT | | | 1,424,809 | |
| | | | | | | | |
| | | | | | | 23,281,036 | |
| | |
| Food & Staples Retailing – 3.5% | |
| | 7,481 | | | Casey’s General Stores, Inc. | | | 1,132,698 | |
| | 8,701 | | | Costco Wholesale Corp. | | | 2,636,403 | |
| | |
|
| Common Stocks – (continued) | |
| Food & Staples Retailing – (continued) | |
| | 42,515 | | | US Foods Holding Corp.* | | | 914,073 | |
| | 85,714 | | | Walgreens Boots Alliance, Inc. | | | 3,710,559 | |
| | 29,879 | | | Walmart, Inc. | | | 3,631,792 | |
| | | | | | | | |
| | | | | | | 12,025,525 | |
| | |
| Food Products – 0.1% | |
| | 1,471 | | | Ingredion, Inc. | | | 119,445 | |
| | 5,436 | | | Kraft Heinz Co. (The) | | | 164,874 | |
| | 2,482 | | | TreeHouse Foods, Inc.* | | | 128,394 | |
| | | | | | | | |
| | | | | | | 412,713 | |
| | |
| Gas Utilities – 0.1% | |
| | 1,732 | | | Atmos Energy Corp. | | | 176,612 | |
| | |
| Health Care Equipment & Supplies – 3.0% | |
| | 5,806 | | | Abbott Laboratories | | | 534,675 | |
| | 15,538 | | | Edwards Lifesciences Corp.* | | | 3,379,515 | |
| | 36,594 | | | Medtronic PLC | | | 3,572,672 | |
| | 17,330 | | | STERIS PLC | | | 2,469,525 | |
| | 1,624 | | | West Pharmaceutical Services, Inc. | | | 307,358 | |
| | | | | | | | |
| | | | | | | 10,263,745 | |
| | |
| Health Care Providers & Services – 3.8% | |
| | 13,144 | | | Anthem, Inc. | | | 3,689,915 | |
| | 3,633 | | | Cardinal Health, Inc. | | | 179,761 | |
| | 17,854 | | | Cigna Corp. | | | 3,495,456 | |
| | 6,120 | | | Humana, Inc. | | | 2,336,739 | |
| | 33,342 | | | Universal Health Services, Inc., Class B | | | 3,523,916 | |
| | | | | | | | |
| | | | | | | 13,225,787 | |
| | |
| Hotels, Restaurants & Leisure – 1.1% | |
| | 1,731 | | | Chipotle Mexican Grill, Inc.* | | | 1,520,770 | |
| | 4,405 | | | Domino’s Pizza, Inc. | | | 1,594,302 | |
| | 4,144 | | | McDonald’s Corp. | | | 777,248 | |
| | | | | | | | |
| | | | | | | 3,892,320 | |
| | |
| Household Durables – 0.1% | |
| | 2,077 | | | Whirlpool Corp. | | | 232,084 | |
| | |
| Household Products – 3.6% | |
| | 6,167 | | | Kimberly-Clark Corp. | | | 854,006 | |
| | 97,302 | | | Procter & Gamble Co. (The) | | | 11,468,987 | |
| | 6,426 | | | Reynolds Consumer Products, Inc. | | | 208,395 | |
| | | | | | | | |
| | | | | | | 12,531,388 | |
| | |
| Independent Power and Renewable Electricity Producers – 0.9% | |
| | 223,555 | | | AES Corp. (The) | | | 2,962,104 | |
| | |
| Industrial Conglomerates – 1.2% | |
| | 476,577 | | | General Electric Co. | | | 3,240,724 | |
| | 2,401 | | | Roper Technologies, Inc. | | | 818,813 | |
| | | | | | | | |
| | | | | | | 4,059,537 | |
| | |
| Insurance – 3.7% | |
| | 22,739 | | | Allstate Corp. (The) | | | 2,313,011 | |
| | 15,829 | | | American Financial Group, Inc. | | | 1,048,513 | |
| | 6,344 | | | Aon PLC | | | 1,095,419 | |
| | |
| | |
| The accompanying notes are an integral part of these financial statements. | | 17 |
GOLDMAN SACHS LARGE CAP VALUE INSIGHTS FUND
Schedule of Investments(continued)
April 30, 2020 (Unaudited)
| | | | | | | | |
| Shares | | | Description | | Value | |
|
| Common Stocks – (continued) | |
| Insurance – (continued) | |
| | 45,595 | | | Athene Holding Ltd., Class A* | | $ | 1,231,065 | |
| | 4,702 | | | Brighthouse Financial, Inc.* | | | 120,888 | |
| | 11,001 | | | Chubb Ltd. | | | 1,188,218 | |
| | 10,462 | | | Cincinnati Financial Corp. | | | 688,400 | |
| | 11,781 | | | Lincoln National Corp. | | | 417,872 | |
| | 845 | | | Primerica, Inc. | | | 87,804 | |
| | 29,627 | | | Reinsurance Group of America, Inc. | | | 3,101,354 | |
| | 85,364 | | | Unum Group | | | 1,489,602 | |
| | | | | | | | |
| | | | | | | 12,782,146 | |
| | |
| Internet & Direct Marketing Retail – 1.2% | |
| | 1,403 | | | Amazon.com, Inc.* | | | 3,471,022 | |
| | 18,063 | | | eBay, Inc. | | | 719,449 | |
| | | | | | | | |
| | | | | | | 4,190,471 | |
| | |
| IT Services – 2.9% | |
| | 18,123 | | | Amdocs Ltd. | | | 1,167,846 | |
| | 22,280 | | | Cognizant Technology Solutions Corp., Class A | | | 1,292,685 | |
| | 20,140 | | | International Business Machines Corp. | | | 2,528,778 | |
| | 2,222 | | | Okta, Inc.* | | | 336,189 | |
| | 8,435 | | | PayPal Holdings, Inc.* | | | 1,037,505 | |
| | 16,514 | | | VeriSign, Inc.* | | | 3,459,518 | |
| | 12,868 | | | Western Union Co. (The) | | | 245,393 | |
| | | | | | | | |
| | | | | | | 10,067,914 | |
| | |
| Life Sciences Tools & Services – 1.3% | |
| | 2,888 | | | Illumina, Inc.* | | | 921,359 | |
| | 19,556 | | | IQVIA Holdings, Inc.* | | | 2,788,490 | |
| | 20,297 | | | QIAGEN NV* | | | 846,182 | |
| | | | | | | | |
| | | | | | | 4,556,031 | |
| | |
| Machinery – 0.9% | |
| | 4,167 | | | AGCO Corp. | | | 220,184 | |
| | 7,275 | | | Flowserve Corp. | | | 204,937 | |
| | 1,008 | | | Illinois Tool Works, Inc. | | | 163,800 | |
| | 4,895 | | | ITT, Inc. | | | 258,064 | |
| | 20,517 | | | Otis Worldwide Corp.* | | | 1,044,521 | |
| | 8,884 | | | Snap-on, Inc. | | | 1,157,496 | |
| | | | | | | | |
| | | | | | | 3,049,002 | |
| | |
| Media – 3.3% | |
| | 2,685 | | | Charter Communications, Inc., Class A* | | | 1,329,693 | |
| | 152,924 | | | Comcast Corp., Class A | | | 5,754,530 | |
| | 13,470 | | | Liberty Broadband Corp., Class C* | | | 1,652,500 | |
| | 102,548 | | | Liberty Global PLC, Class C (United Kingdom)* | | | 1,877,654 | |
| | 66,006 | | | News Corp., Class A | | | 654,119 | |
| | | | | | | | |
| | | | | | | 11,268,496 | |
| | |
| Metals & Mining – 0.6% | |
| | 130,758 | | | Alcoa Corp.* | | | 1,065,678 | |
| | 17,752 | | | Arconic Corp.* | | | 154,797 | |
| | 5,096 | | | Royal Gold, Inc. | | | 624,413 | |
| | 2,678 | | | Southern Copper Corp. (Peru) | | | 86,874 | |
| | | | | | | | |
| | | | | | | 1,931,762 | |
| | |
|
| Common Stocks – (continued) | |
| Multiline Retail – 1.5% | |
| | 2,789 | | | Dollar General Corp. | | | 488,912 | |
| | 42,694 | | | Target Corp. | | | 4,685,239 | |
| | | | | | | | |
| | | | | | | 5,174,151 | |
| | |
| Multi-Utilities – 4.5% | |
| | 35,879 | | | Ameren Corp. | | | 2,610,197 | |
| | 39,875 | | | CenterPoint Energy, Inc. | | | 679,071 | |
| | 52,064 | | | CMS Energy Corp. | | | 2,972,334 | |
| | 17,812 | | | Consolidated Edison, Inc. | | | 1,403,586 | |
| | 37,047 | | | DTE Energy Co. | | | 3,843,256 | |
| | 62,637 | | | Public Service Enterprise Group, Inc. | | | 3,176,322 | |
| | 8,446 | | | WEC Energy Group, Inc. | | | 764,785 | |
| | | | | | | | |
| | | | | | | 15,449,551 | |
| | |
| Oil, Gas & Consumable Fuels – 4.6% | |
| | 51,995 | | | Chevron Corp. | | | 4,783,540 | |
| | 10,779 | | | ConocoPhillips | | | 453,796 | |
| | 12,951 | | | Continental Resources, Inc. | | | 212,267 | |
| | 47,082 | | | EOG Resources, Inc. | | | 2,236,866 | |
| | 48,730 | | | Exxon Mobil Corp. | | | 2,264,483 | |
| | 47,157 | | | Kinder Morgan, Inc. | | | 718,201 | |
| | 46,357 | | | Marathon Oil Corp. | | | 283,705 | |
| | 61,408 | | | Marathon Petroleum Corp. | | | 1,969,969 | |
| | 4,677 | | | ONEOK, Inc. | | | 139,983 | |
| | 7,741 | | | PBF Energy, Inc., Class A | | | 88,247 | |
| | 15,320 | | | Pioneer Natural Resources Co. | | | 1,368,229 | |
| | 35,897 | | | Targa Resources Corp. | | | 465,225 | |
| | 41,181 | | | Williams Cos., Inc. (The) | | | 797,676 | |
| | | | | | | | |
| | | | | | | 15,782,187 | |
| | |
| Pharmaceuticals – 3.6% | |
| | 15,130 | | | Horizon Therapeutics PLC* | | | 545,285 | |
| | 6,041 | | | Jazz Pharmaceuticals PLC* | | | 666,020 | |
| | 45,216 | | | Johnson & Johnson | | | 6,784,209 | |
| | 5,583 | | | Merck & Co., Inc. | | | 442,955 | |
| | 101,008 | | | Pfizer, Inc. | | | 3,874,667 | |
| | | | | | | | |
| | | | | | | 12,313,136 | |
| | |
| Professional Services – 0.6% | |
| | 28,254 | | | IHS Markit Ltd. | | | 1,901,494 | |
| | 4,280 | | | TransUnion | | | 337,221 | |
| | | | | | | | |
| | | | | | | 2,238,715 | |
| | |
| Road & Rail – 1.7% | |
| | 3,095 | | | JB Hunt Transport Services, Inc. | | | 312,966 | |
| | 24,834 | | | Knight-Swift Transportation Holdings, Inc. | | | 923,328 | |
| | 12,467 | | | Norfolk Southern Corp. | | | 2,133,104 | |
| | 2,283 | | | Old Dominion Freight Line, Inc. | | | 331,697 | |
| | 14,430 | | | Union Pacific Corp. | | | 2,305,770 | |
| | | | | | | | |
| | | | | | | 6,006,865 | |
| | |
| Semiconductors & Semiconductor Equipment – 3.1% | |
| | 5,847 | | | Advanced Micro Devices, Inc.* | | | 306,324 | |
| | 6,705 | | | Analog Devices, Inc. | | | 734,868 | |
| | 23,798 | | | Applied Materials, Inc. | | | 1,182,285 | |
| | |
| | |
| 18 | | The accompanying notes are an integral part of these financial statements. |
GOLDMAN SACHS LARGE CAP VALUE INSIGHTS FUND
| | | | | | | | |
| Shares | | | Description | | Value | |
|
| Common Stocks – (continued) | |
| Semiconductors & Semiconductor Equipment – (continued) | |
| | 70,280 | | | Intel Corp. | | $ | 4,215,394 | |
| | 3,792 | | | Lam Research Corp. | | | 968,022 | |
| | 9,914 | | | NVIDIA Corp. | | | 2,897,664 | |
| | 3,748 | | | Skyworks Solutions, Inc. | | | 389,342 | |
| | 766 | | | Universal Display Corp. | | | 114,992 | |
| | | | | | | | |
| | | | | | | 10,808,891 | |
| | |
| Software – 0.2% | |
| | 3,959 | | | Microsoft Corp. | | | 709,492 | |
| | |
| Specialty Retail – 1.5% | |
| | 3,617 | | | Best Buy Co., Inc. | | | 277,532 | |
| | 22,200 | | | Home Depot, Inc. (The) | | | 4,880,226 | |
| | | | | | | | |
| | | | | | | 5,157,758 | |
| | |
| Technology Hardware, Storage & Peripherals – 0.7% | |
| | 7,876 | | | Apple, Inc. | | | 2,313,969 | |
| | |
| Tobacco – 0.6% | |
| | 52,125 | | | Altria Group, Inc. | | | 2,045,907 | |
| | 597 | | | Philip Morris International, Inc. | | | 44,536 | |
| | | | | | | | |
| | | | | | | 2,090,443 | |
| | |
| Trading Companies & Distributors – 0.3% | |
| | 29,251 | | | HD Supply Holdings, Inc.* | | | 868,170 | |
| | 8,352 | | | Univar Solutions, Inc.* | | | 121,271 | |
| | 5,089 | | | WESCO International, Inc.* | | | 131,652 | |
| | | | | | | | |
| | | | | | | 1,121,093 | |
| | |
| TOTAL INVESTMENTS BEFORE SECURITIES
LENDING REINVESTMENT VEHICLE |
|
| | (Cost $358,065,067) | | $ | 343,602,620 | |
| | |
| | | | | | | | |
| Shares | | | Dividend Rate | | Value | |
|
| Securities Lending Reinvestment Vehicle – 0.0%(b) | |
| Goldman Sachs Financial Square Government Fund –
Institutional Shares |
|
| | 119,900 | | | 0.233% | | $ | 119,900 | |
| | (Cost $119,900) | |
| | |
| | TOTAL INVESTMENTS – 99.5% | |
| | (Cost $358,184,967) | | $ | 343,722,520 | |
| | |
| OTHER ASSETS IN EXCESS OF
LIABILITIES – 0.5% | | | 1,775,281 | |
| | |
| | NET ASSETS – 100.0% | | $ | 345,497,801 | |
| | |
| | |
|
| The percentage shown for each investment category reflects the value of investments in that category as a percentage of net assets. |
| |
* | | Non-income producing security. |
| |
(a) | | All or a portion of security is on loan. |
| |
(b) | | Represents an affiliated issuer. |
| | |
|
Investment Abbreviations: |
PLC | | —Public Limited Company |
REIT | | —Real Estate Investment Trust |
|
| | |
| The accompanying notes are an integral part of these financial statements. | | 19 |
GOLDMAN SACHS SMALL CAP EQUITY INSIGHTS FUND
Schedule of Investments
April 30, 2020 (Unaudited)
| | | | | | | | |
| Shares | | | Description | | Value | |
|
| Common Stocks – 100.0% | |
| Aerospace & Defense – 1.0% | |
| | 70,811 | | | Aerojet Rocketdyne Holdings, Inc.* | | $ | 2,913,165 | |
| | 28,950 | | | Astronics Corp.* | | | 259,971 | |
| | 11,396 | | | Axon Enterprise, Inc.* | | | 828,603 | |
| | 49,527 | | | Maxar Technologies, Inc. | | | 624,535 | |
| | 8,318 | | | Mercury Systems, Inc.* | | | 741,633 | |
| | | | | | | | |
| | | | | | | 5,367,907 | |
| | |
| Air Freight & Logistics – 0.4% | |
| | 98,308 | | | Echo Global Logistics, Inc.* | | | 1,723,339 | |
| | 6,262 | | | Hub Group, Inc., Class A* | | | 301,265 | |
| | 47,374 | | | Radiant Logistics, Inc.* | | | 202,761 | |
| | | | | | | | |
| | | | | | | 2,227,365 | |
| | |
| Airlines – 0.3% | |
| | 46,776 | | | SkyWest, Inc. | | | 1,447,717 | |
| | |
| Auto Components – 0.2% | |
| | 9,752 | | | Gentherm, Inc.* | | | 365,115 | |
| | 9,921 | | | Standard Motor Products, Inc. | | | 403,685 | |
| | 2,166 | | | Visteon Corp.* | | | 130,610 | |
| | | | | | | | |
| | | | | | | 899,410 | |
| | |
| Banks – 9.0% | |
| | 76,378 | | | 1st Source Corp. | | | 2,652,608 | |
| | 47,786 | | | Amalgamated Bank, Class A | | | 511,310 | |
| | 68,229 | | | Atlantic Capital Bancshares, Inc.* | | | 856,274 | |
| | 15,270 | | | Atlantic Union Bankshares Corp. | | | 364,495 | |
| | 123,682 | | | Bancorp, Inc. (The)* | | | 862,064 | |
| | 4,789 | | | Banner Corp. | | | 184,041 | |
| | 99,849 | | | Boston Private Financial Holdings, Inc. | | | 758,852 | |
| | 316,091 | | | Cadence BanCorp | | | 2,092,522 | |
| | 38,004 | | | Cathay General Bancorp | | | 1,061,072 | |
| | 131,099 | | | Central Pacific Financial Corp. | | | 2,292,922 | |
| | 1,302 | | | Century Bancorp, Inc., Class A | | | 97,246 | |
| | 73,912 | | | Columbia Banking System, Inc. | | | 1,994,885 | |
| | 201,802 | | | CVB Financial Corp. | | | 4,194,455 | |
| | 381,067 | | | First BanCorp. | | | 2,221,621 | |
| | 82,028 | | | First Bancorp/Southern Pines NC | | | 2,181,125 | |
| | 219,984 | | | First Commonwealth Financial Corp. | | | 2,094,248 | |
| | 40,045 | | | First Financial Bankshares, Inc. | | | 1,115,253 | |
| | 12,674 | | | First Financial Corp. | | | 450,181 | |
| | 148,243 | | | First Foundation, Inc. | | | 2,039,824 | |
| | 48,787 | | | First Internet Bancorp | | | 765,956 | |
| | 87,526 | | | Heartland Financial USA, Inc. | | | 2,973,258 | |
| | 122,084 | | | Hilltop Holdings, Inc. | | | 2,356,221 | |
| | 24,522 | | | Hope Bancorp, Inc. | | | 243,994 | |
| | 31,290 | | | Horizon Bancorp, Inc. | | | 356,080 | |
| | 13,450 | | | IBERIABANK Corp. | | | 557,637 | |
| | 82,603 | | | Independent Bank Group, Inc. | | | 2,503,697 | |
| | 93,817 | | | International Bancshares Corp. | | | 2,719,755 | |
| | 5,276 | | | Lakeland Bancorp, Inc. | | | 59,038 | |
| | 12,469 | | | Metropolitan Bank Holding Corp.* | | | 312,847 | |
| | 32,816 | | | National Bank Holdings Corp., Class A | | | 872,249 | |
| | 5,851 | | | Northeast Bank | | | 98,004 | |
| | 23,862 | | | Preferred Bank | | | 910,335 | |
| | 79,839 | | | Seacoast Banking Corp. of Florida* | | | 1,793,982 | |
| | |
|
| Common Stocks – (continued) | |
| Banks – (continued) | |
| | 20,768 | | | Sierra Bancorp | | | 421,590 | |
| | 36,507 | | | Southern National Bancorp of Virginia, Inc. | | | 367,626 | |
| | 85,044 | | | TriCo Bancshares | | | 2,561,525 | |
| | 27,902 | | | TriState Capital Holdings, Inc.* | | | 396,766 | |
| | 13,944 | | | UMB Financial Corp. | | | 708,913 | |
| | 11,913 | | | Westamerica Bancorporation | | | 750,519 | |
| | | | | | | | |
| | | | | | | 49,754,990 | |
| | |
| Beverages – 0.7% | |
| | 1,663 | | | Boston Beer Co., Inc. (The), Class A* | | | 775,806 | |
| | 12,594 | | | Coca-Cola Consolidated, Inc. | | | 2,965,509 | |
| | | | | | | | |
| | | | | | | 3,741,315 | |
| | |
| Biotechnology – 9.3% | |
| | 107,813 | | | ACADIA Pharmaceuticals, Inc.* | | | 5,208,446 | |
| | 22,987 | | | Acceleron Pharma, Inc.* | | | 2,081,013 | |
| | 23,572 | | | Agenus, Inc.* | | | 62,819 | |
| | 42,877 | | | Allogene Therapeutics, Inc.* | | | 1,239,145 | |
| | 70,254 | | | Amicus Therapeutics, Inc.* | | | 829,700 | |
| | 36,231 | | | Anika Therapeutics, Inc.* | | | 1,203,956 | |
| | 40,444 | | | Apellis Pharmaceuticals, Inc.* | | | 1,386,016 | |
| | 15,445 | | | Arcus Biosciences, Inc.* | | | 407,903 | |
| | 167,934 | | | Ardelyx, Inc.* | | | 1,105,006 | |
| | 31,485 | | | Arena Pharmaceuticals, Inc.* | | | 1,541,820 | |
| | 18,878 | | | Arrowhead Pharmaceuticals, Inc.* | | | 649,970 | |
| | 8,956 | | | Atara Biotherapeutics, Inc.* | | | 74,245 | |
| | 45,143 | | | Biohaven Pharmaceutical Holding Co. Ltd.* | | | 2,126,235 | |
| | 6,440 | | | BioSpecifics Technologies Corp.* | | | 366,500 | |
| | 17,412 | | | Blueprint Medicines Corp.* | | | 1,024,348 | |
| | 301,276 | | | Catalyst Pharmaceuticals, Inc.* | | | 1,428,048 | |
| | 61,653 | | | Coherus Biosciences, Inc.* | | | 1,023,440 | |
| | 10,261 | | | Constellation Pharmaceuticals, Inc.* | | | 369,191 | |
| | 35,169 | | | Deciphera Pharmaceuticals, Inc.* | | | 2,039,099 | |
| | 19,052 | | | Dicerna Pharmaceuticals, Inc.* | | | 375,324 | |
| | 40,994 | | | Editas Medicine, Inc.* | | | 947,781 | |
| | 51,359 | | | Enanta Pharmaceuticals, Inc.* | | | 2,381,517 | |
| | 49,170 | | | FibroGen, Inc.* | | | 1,813,881 | |
| | 5,311 | | | G1 Therapeutics, Inc.* | | | 69,733 | |
| | 38,503 | | | Global Blood Therapeutics, Inc.* | | | 2,946,250 | |
| | 18,938 | | | Halozyme Therapeutics, Inc.* | | | 429,040 | |
| | 17,328 | | | Heron Therapeutics, Inc.* | | | 247,097 | |
| | 119,012 | | | ImmunoGen, Inc.* | | | 485,569 | |
| | 21,269 | | | Immunomedics, Inc.* | | | 646,152 | |
| | 8,343 | | | Insmed, Inc.* | | | 191,889 | |
| | 16,578 | | | Intercept Pharmaceuticals, Inc.* | | | 1,358,070 | |
| | 26,638 | | | Iovance Biotherapeutics, Inc.* | | | 856,412 | |
| | 5,836 | | | Ironwood Pharmaceuticals, Inc.* | | | 58,360 | |
| | 40,771 | | | Karyopharm Therapeutics, Inc.* | | | 899,001 | |
| | 3,002 | | | Kiniksa Pharmaceuticals Ltd., Class A* | | | 59,890 | |
| | 10,516 | | | Kura Oncology, Inc.* | | | 153,008 | |
| | 8,459 | | | Minerva Neurosciences, Inc.* | | | 75,877 | |
| | 18,061 | | | Mirati Therapeutics, Inc.* | | | 1,535,907 | |
| | 34,714 | | | Momenta Pharmaceuticals, Inc.* | | | 1,100,434 | |
| | 13,006 | | | Myriad Genetics, Inc.* | | | 201,073 | |
| | |
| | |
| 20 | | The accompanying notes are an integral part of these financial statements. |
GOLDMAN SACHS SMALL CAP EQUITY INSIGHTS FUND
| | | | | | | | |
| Shares | | | Description | | Value | |
|
| Common Stocks – (continued) | |
| Biotechnology – (continued) | |
| | 11,229 | | | Principia Biopharma, Inc.* | | $ | 698,219 | |
| | 86,332 | | | Prothena Corp. PLC (Ireland)* | | | 968,645 | |
| | 13,069 | | | PTC Therapeutics, Inc.* | | | 665,474 | |
| | 73,267 | | | Radius Health, Inc.* | | | 1,149,559 | |
| | 13,817 | | | REVOLUTION Medicines, Inc.* | | | 432,058 | |
| | 8,558 | | | Rocket Pharmaceuticals, Inc.*(a) | | | 126,658 | |
| | 23,940 | | | Turning Point Therapeutics, Inc.* | | | 1,233,149 | |
| | 67,139 | | | Veracyte, Inc.* | | | 1,810,739 | |
| | 17,955 | | | Viking Therapeutics, Inc.* | | | 103,421 | |
| | 68,873 | | | Voyager Therapeutics, Inc.* | | | 744,517 | |
| | 6,163 | | | XBiotech, Inc.* | | | 97,499 | |
| | 68,168 | | | Xencor, Inc.* | | | 1,992,551 | |
| | 13,853 | | | Y-mAbs Therapeutics, Inc.* | | | 465,184 | |
| | | | | | | | |
| | | | | | | 51,486,838 | |
| | |
| Building Products – 2.1% | |
| | 8,007 | | | AAON, Inc. | | | 381,454 | |
| | 4,425 | | | Builders FirstSource, Inc.* | | | 81,199 | |
| | 17,751 | | | CSW Industrials, Inc. | | | 1,175,826 | |
| | 58,607 | | | Gibraltar Industries, Inc.* | | | 2,713,504 | |
| | 37,947 | | | Griffon Corp. | | | 622,710 | |
| | 13,637 | | | JELD-WEN Holding, Inc.* | | | 173,190 | |
| | 7,348 | | | Masonite International Corp.* | | | 434,120 | |
| | 2,630 | | | Patrick Industries, Inc. | | | 108,409 | |
| | 72,748 | | | Quanex Building Products Corp. | | | 907,168 | |
| | 55,164 | | | Simpson Manufacturing Co., Inc. | | | 3,977,324 | |
| | 23,170 | | | Universal Forest Products, Inc. | | | 952,750 | |
| | | | | | | | |
| | | | | | | 11,527,654 | |
| | |
| Capital Markets – 0.4% | |
| | 11,244 | | | Artisan Partners Asset Management, Inc., Class A | | | 331,023 | |
| | 21,408 | | | Donnelley Financial Solutions, Inc.* | | | 155,850 | |
| | 23,462 | | | Federated Hermes, Inc. | | | 534,230 | |
| | 63,578 | | | Oppenheimer Holdings, Inc., Class A | | | 1,308,435 | |
| | 2,594 | | | Westwood Holdings Group, Inc. | | | 59,740 | |
| | | | | | | | |
| | | | | | | 2,389,278 | |
| | |
| Chemicals – 2.0% | |
| | 12,801 | | | Chase Corp. | | | 1,206,622 | |
| | 208,351 | | | Ferro Corp.* | | | 2,077,259 | |
| | 7,789 | | | Ingevity Corp.* | | | 404,405 | |
| | 21,720 | | | Koppers Holdings, Inc.* | | | 342,307 | |
| | 78,373 | | | Minerals Technologies, Inc. | | | 3,451,547 | |
| | 139,648 | | | PolyOne Corp. | | | 3,252,402 | |
| | 2,997 | | | Sensient Technologies Corp. | | | 143,227 | |
| | 13,233 | | | Trinseo SA | | | 270,615 | |
| | | | | | | | |
| | | | | | | 11,148,384 | |
| | |
| Commercial Services & Supplies – 1.7% | |
| | 23,324 | | | Brady Corp., Class A | | | 1,015,527 | |
| | 20,355 | | | Brink’s Co. (The) | | | 1,040,548 | |
| | 15,449 | | | Cimpress PLC (Ireland)*(a) | | | 1,124,533 | |
| | 6,402 | | | Ennis, Inc. | | | 119,141 | |
| | 85,984 | | | HNI Corp. | | | 2,092,851 | |
| | 34,118 | | | Kimball International, Inc., Class B | | | 418,628 | |
| | |
|
| Common Stocks – (continued) | |
| Commercial Services & Supplies – (continued) | |
| | 42,287 | | | McGrath RentCorp | | | 2,306,756 | |
| | 8,040 | | | MSA Safety, Inc. | | | 904,741 | |
| | 42,797 | | | Pitney Bowes, Inc. | | | 151,073 | |
| | 6,751 | | | Steelcase, Inc., Class A | | | 73,923 | |
| | | | | | | | |
| | | | | | | 9,247,721 | |
| | |
| Communications Equipment – 2.0% | |
| | 7,393 | | | Applied Optoelectronics, Inc.*(a) | | | 79,253 | |
| | 52,986 | | | Comtech Telecommunications Corp. | | | 980,771 | |
| | 89,194 | | | Extreme Networks, Inc.* | | | 303,260 | |
| | 231,968 | | | Harmonic, Inc.* | | | 1,345,414 | |
| | 47,740 | | | Infinera Corp.* | | | 294,317 | |
| | 16,135 | | | Inseego Corp.* | | | 192,813 | |
| | 51,278 | | | Lumentum Holdings, Inc.* | | | 4,148,903 | |
| | 34,921 | | | NETGEAR, Inc.* | | | 837,406 | |
| | 241,127 | | | Viavi Solutions, Inc.* | | | 2,912,814 | |
| | | | | | | | |
| | | | | | | 11,094,951 | |
| | |
| Construction & Engineering – 0.7% | |
| | 44,373 | | | Aegion Corp.* | | | 712,187 | |
| | 9,692 | | | Arcosa, Inc. | | | 361,221 | |
| | 123,840 | | | Great Lakes Dredge & Dock Corp.* | | | 1,094,745 | |
| | 47,891 | | | MasTec, Inc.* | | | 1,719,287 | |
| | | | | | | | |
| | | | | | | 3,887,440 | |
| | |
| Construction Materials – 0.5% | |
| | 200,089 | | | Summit Materials, Inc., Class A* | | | 3,023,345 | |
| | |
| Consumer Finance – 0.8% | |
| | 116,623 | | | Enova International, Inc.* | | | 1,870,633 | |
| | 49,149 | | | Nelnet, Inc., Class A | | | 2,366,524 | |
| | | | | | | | |
| | | | | | | 4,237,157 | |
| | |
| Containers & Packaging – 0.1% | |
| | 32,236 | | | Myers Industries, Inc. | | | 398,437 | |
| | |
| Distributors – 0.2% | |
| | 40,054 | | | Core-Mark Holding Co, Inc. | | | 1,151,152 | |
| | |
| Diversified Consumer Services – 1.7% | |
| | 37,552 | | | American Public Education, Inc.* | | | 967,715 | |
| | 38,860 | | | Chegg, Inc.* | | | 1,661,265 | |
| | 38,003 | | | Collectors Universe, Inc. | | | 834,926 | |
| | 12,560 | | | K12, Inc.* | | | 285,237 | |
| | 231,276 | | | Laureate Education, Inc., Class A* | | | 2,190,184 | |
| | 24,734 | | | Perdoceo Education Corp.* | | | 321,542 | |
| | 15,563 | | | Strategic Education, Inc. | | | 2,479,186 | |
| | 34,292 | | | WW International, Inc.* | | | 874,789 | |
| | | | | | | | |
| | | | | | | 9,614,844 | |
| | |
| Diversified Financial Services – 0.2% | |
| | 117,573 | | | Banco Latinoamericano de Comercio Exterior SA, Class E (Panama) | | | 1,342,684 | |
| | |
| Diversified Telecommunication Services – 1.3% | |
| | 4,319 | | | Bandwidth, Inc., Class A* | | | 352,258 | |
| | 50,096 | | | Cogent Communications Holdings, Inc. | | | 4,199,548 | |
| | |
| | |
| The accompanying notes are an integral part of these financial statements. | | 21 |
GOLDMAN SACHS SMALL CAP EQUITY INSIGHTS FUND
Schedule of Investments(continued)
April 30, 2020 (Unaudited)
| | | | | | | | |
| Shares | | | Description | | Value | |
|
| Common Stocks – (continued) | |
| Diversified Telecommunication Services – (continued) | |
| | 129,649 | | | Consolidated Communications Holdings, Inc.* | | $ | 812,899 | |
| | 7,984 | | | Iridium Communications, Inc.* | | | 179,680 | |
| | 400,966 | | | ORBCOMM, Inc.* | | | 1,058,550 | |
| | 61,587 | | | Vonage Holdings Corp.* | | | 514,867 | |
| | | | | | | | |
| | | | | | | 7,117,802 | |
| | |
| Electric Utilities – 0.5% | |
| | 60,378 | | | Portland General Electric Co. | | | 2,825,087 | |
| | |
| Electrical Equipment – 0.6% | |
| | 67,378 | | | Atkore International Group, Inc.* | | | 1,639,981 | |
| | 33,147 | | | Bloom Energy Corp., Class A*(a) | | | 254,237 | |
| | 14,624 | | | Encore Wire Corp. | | | 669,487 | |
| | 21,632 | | | Powell Industries, Inc. | | | 548,804 | |
| | | | | | | | |
| | | | | | | 3,112,509 | |
| | |
| Electronic Equipment, Instruments & Components – 3.9% | |
| | 58,568 | | | Belden, Inc. | | | 2,002,440 | |
| | 67,228 | | | Benchmark Electronics, Inc. | | | 1,388,930 | |
| | 41,548 | | | CTS Corp. | | | 962,252 | |
| | 6,324 | | | Fabrinet (Thailand)* | | | 396,831 | |
| | 56,792 | | | Itron, Inc.* | | | 3,965,217 | |
| | 148,631 | | | Knowles Corp.* | | | 2,311,212 | |
| | 32,782 | | | Methode Electronics, Inc. | | | 984,116 | |
| | 2,969 | | | Novanta, Inc.* | | | 257,976 | |
| | 36,516 | | | Plexus Corp.* | | | 2,289,188 | |
| | 10,762 | | | Rogers Corp.* | | | 1,195,012 | |
| | 94,183 | | | Sanmina Corp.* | | | 2,611,695 | |
| | 32,181 | | | TTM Technologies, Inc.* | | | 372,978 | |
| | 100,873 | | | Vishay Intertechnology, Inc. | | | 1,673,483 | |
| | 54,898 | | | Vishay Precision Group, Inc.* | | | 1,269,242 | |
| | | | | | | | |
| | | | | | | 21,680,572 | |
| | |
| Energy Equipment & Services – 0.8% | |
| | 34,763 | | | Cactus, Inc., Class A | | | 618,086 | |
| | 16,682 | | | DMC Global, Inc. | | | 430,562 | |
| | 85,991 | | | Matrix Service Co.* | | | 897,746 | |
| | 5,073 | | | Nabors Industries Ltd.(a) | | | 74,725 | |
| | 79,829 | | | SEACOR Holdings, Inc.* | | | 2,255,968 | |
| | 13,571 | | | Solaris Oilfield Infrastructure, Inc., Class A | | | 92,826 | |
| | | | | | | | |
| | | | | | | 4,369,913 | |
| | |
| Entertainment – 0.1% | |
| | 69,406 | | | IMAX Corp.* | | | 798,169 | |
| | |
| Equity Real Estate Investment Trusts (REITs) – 8.2% | |
| | 82,645 | | | American Assets Trust, Inc. REIT | | | 2,340,506 | |
| | 173,825 | | | Cedar Realty Trust, Inc. REIT | | | 182,516 | |
| | 21,348 | | | City Office REIT, Inc. REIT | | | 215,615 | |
| | 3,335 | | | Community Healthcare Trust, Inc. REIT | | | 124,062 | |
| | 7,696 | | | EastGroup Properties, Inc. REIT | | | 815,776 | |
| | 67,485 | | | Essential Properties Realty Trust, Inc. REIT | | | 991,355 | |
| | 140,024 | | | First Industrial Realty Trust, Inc. REIT | | | 5,288,706 | |
| | 22,762 | | | Gladstone Commercial Corp. REIT | | | 359,640 | |
| | |
|
| Common Stocks – (continued) | |
| Equity Real Estate Investment Trusts (REITs) – (continued) | |
| | 123,908 | | | Independence Realty Trust, Inc. REIT | | | 1,247,754 | |
| | 328,246 | | | Lexington Realty Trust REIT | | | 3,430,171 | |
| | 74,293 | | | NexPoint Residential Trust, Inc. REIT | | | 2,233,991 | |
| | 18,954 | | | Office Properties Income Trust REIT | | | 519,340 | |
| | 42,100 | | | Pebblebrook Hotel Trust REIT | | | 498,464 | |
| | 251,375 | | | Physicians Realty Trust REIT | | | 3,876,202 | |
| | 39,709 | | | Piedmont Office Realty Trust, Inc., Class A REIT | | | 688,951 | |
| | 20,210 | | | PS Business Parks, Inc. REIT | | | 2,608,909 | |
| | 64,031 | | | QTS Realty Trust, Inc., Class A REIT | | | 4,003,858 | |
| | 11,346 | | | Retail Opportunity Investments Corp. REIT | | | 110,113 | |
| | 60,181 | | | Retail Value, Inc. REIT | | | 870,819 | |
| | 115,072 | | | Rexford Industrial Realty, Inc. REIT | | | 4,685,732 | |
| | 9,102 | | | Ryman Hospitality Properties, Inc. REIT | | | 321,665 | |
| | 180,762 | | | Sabra Health Care REIT, Inc. REIT | | | 2,317,369 | |
| | 91,302 | | | STAG Industrial, Inc. REIT | | | 2,396,677 | |
| | 82,093 | | | Terreno Realty Corp. REIT | | | 4,500,338 | |
| | 1,005 | | | Universal Health Realty Income Trust REIT | | | 107,495 | |
| | 63,335 | | | Urban Edge Properties REIT | | | 728,352 | |
| | | | | | | | |
| | | | | | | 45,464,376 | |
| | |
| Food & Staples Retailing – 0.5% | |
| | 4,990 | | | Chefs’ Warehouse, Inc. (The)* | | | 70,259 | |
| | 21,044 | | | Ingles Markets, Inc., Class A | | | 859,227 | |
| | 51,370 | | | Performance Food Group Co.* | | | 1,507,709 | |
| | 2,072 | | | Weis Markets, Inc. | | | 103,662 | |
| | | | | | | | |
| | | | | | | 2,540,857 | |
| | |
| Food Products – 1.4% | |
| | 37,847 | | | B&G Foods, Inc.(a) | | | 734,989 | |
| | 9,278 | | | Calavo Growers, Inc. | | | 538,124 | |
| | 61,996 | | | Darling Ingredients, Inc.* | | | 1,276,497 | |
| | 6,736 | | | Freshpet, Inc.* | | | 507,962 | |
| | 25,562 | | | J&J Snack Foods Corp. | | | 3,247,141 | |
| | 19,634 | | | John B. Sanfilippo & Son, Inc. | | | 1,612,540 | |
| | | | | | | | |
| | | | | | | 7,917,253 | |
| | |
| Gas Utilities – 0.4% | |
| | 8,319 | | | New Jersey Resources Corp. | | | 281,016 | |
| | 6,137 | | | Northwest Natural Holding Co. | | | 399,518 | |
| | 19,016 | | | Southwest Gas Holdings, Inc. | | | 1,441,413 | |
| | | | | | | | |
| | | | | | | 2,121,947 | |
| | |
| Health Care Equipment & Supplies – 3.8% | |
| | 35,940 | | | Antares Pharma, Inc.* | | | 116,446 | |
| | 4,851 | | | Cardiovascular Systems, Inc.* | | | 203,742 | |
| | 57,515 | | | GenMark Diagnostics, Inc.* | | | 719,513 | |
| | 32,381 | | | Globus Medical, Inc., Class A* | | | 1,536,802 | |
| | 47,416 | | | Haemonetics Corp.* | | | 5,394,992 | |
| | 2,643 | | | Inogen, Inc.* | | | 132,150 | |
| | 9,623 | | | Integer Holdings Corp.* | | | 716,528 | |
| | 36,413 | | | Invacare Corp. | | | 273,826 | |
| | 62,202 | | | Natus Medical, Inc.* | | | 1,554,428 | |
| | 38,785 | | | Novocure Ltd.* | | | 2,552,053 | |
| | |
| | |
| 22 | | The accompanying notes are an integral part of these financial statements. |
GOLDMAN SACHS SMALL CAP EQUITY INSIGHTS FUND
| | | | | | | | |
| Shares | | | Description | | Value | |
|
| Common Stocks – (continued) | |
| Health Care Equipment & Supplies – (continued) | |
| | 36,842 | | | NuVasive, Inc.* | | $ | 2,242,941 | |
| | 16,318 | | | Quidel Corp.* | | | 2,268,202 | |
| | 29,126 | | | Surmodics, Inc.* | | | 1,109,701 | |
| | 28,589 | | | Tandem Diabetes Care, Inc.* | | | 2,280,830 | |
| | | | | | | | |
| | | | | | | 21,102,154 | |
| | |
| Health Care Providers & Services – 0.8% | |
| | 21,649 | | | Community Health Systems, Inc.* | | | 65,597 | |
| | 32,314 | | | Cross Country Healthcare, Inc.* | | | 203,255 | |
| | 16,522 | | | Magellan Health, Inc.* | | | 1,003,381 | |
| | 75,858 | | | Select Medical Holdings Corp.* | | | 1,294,896 | |
| | 65,849 | | | Tenet Healthcare Corp.* | | | 1,328,833 | |
| | 18,897 | | | Triple-S Management Corp., Class B* | | | 319,926 | |
| | | | | | | | |
| | | | | | | 4,215,888 | |
| | |
| Health Care Technology – 2.3% | |
| | 58,809 | | | Inovalon Holdings, Inc., Class A* | | | 1,029,157 | |
| | 30,115 | | | Livongo Health, Inc.*(a) | | | 1,204,901 | |
| | 51,362 | | | Omnicell, Inc.* | | | 3,744,290 | |
| | 9,610 | | | Schrodinger, Inc.* | | | 445,904 | |
| | 16,112 | | | Simulations Plus, Inc. | | | 613,062 | |
| | 34,188 | | | Teladoc Health, Inc.* | | | 5,627,003 | |
| | 4,761 | | | Vocera Communications, Inc.* | | | 90,269 | |
| | | | | | | | |
| | | | | | | 12,754,586 | |
| | |
| Hotels, Restaurants & Leisure – 2.4% | |
| | 1,248 | | | Cracker Barrel Old Country Store, Inc. | | | 121,555 | |
| | 179,833 | | | Denny’s Corp.* | | | 2,026,718 | |
| | 173,972 | | | Everi Holdings, Inc.* | | | 861,161 | |
| | 18,132 | | | Marriott Vacations Worldwide Corp. | | | 1,504,956 | |
| | 181,339 | | | Red Rock Resorts, Inc., Class A | | | 1,987,475 | |
| | 61,568 | | | Scientific Games Corp.* | | | 776,373 | |
| | 24,608 | | | Texas Roadhouse, Inc. | | | 1,158,791 | |
| | 39,826 | | | Wingstop, Inc. | | | 4,670,395 | |
| | | | | | | | |
| | | | | | | 13,107,424 | |
| | |
| Household Durables – 1.9% | |
| | 14,674 | | | Century Communities, Inc.* | | | 314,317 | |
| | 36,025 | | | GoPro, Inc., Class A*(a) | | | 126,808 | |
| | 24,029 | | | KB Home | | | 630,521 | |
| | 3,534 | | | LGI Homes, Inc.* | | | 214,090 | |
| | 79,630 | | | M/I Homes, Inc.* | | | 2,027,380 | |
| | 102,844 | | | Sonos, Inc.* | | | 1,051,065 | |
| | 26,049 | | | TopBuild Corp.* | | | 2,427,506 | |
| | 269,287 | | | TRI Pointe Group, Inc.* | | | 3,091,415 | |
| | 21,239 | | | Universal Electronics, Inc.* | | | 876,746 | |
| | | | | | | | |
| | | | | | | 10,759,848 | |
| | |
| Household Products – 0.1% | |
| | 22,268 | | | Central Garden & Pet Co., Class A* | | | 677,170 | |
| | |
| Insurance – 3.7% | |
| | 180,024 | | | American Equity Investment Life Holding Co. | | | 3,784,104 | |
| | 40,211 | | | AMERISAFE, Inc. | | | 2,560,234 | |
| | 38,581 | | | Argo Group International Holdings Ltd. | | | 1,364,224 | |
| | |
|
| Common Stocks – (continued) | |
| Insurance – (continued) | |
| | 15,804 | | | eHealth, Inc.* | | | 1,686,287 | |
| | 18,908 | | | FBL Financial Group, Inc., Class A | | | 738,925 | |
| | 438,636 | | | Genworth Financial, Inc., Class A* | | | 1,592,249 | |
| | 40,058 | | | Goosehead Insurance, Inc., Class A* | | | 2,248,856 | |
| | 2,442 | | | HCI Group, Inc. | | | 101,709 | |
| | 182,842 | | | MBIA, Inc.* | | | 1,488,334 | |
| | 1,889 | | | National Western Life Group, Inc., Class A | | | 364,067 | |
| | 5,913 | | | Selective Insurance Group, Inc. | | | 296,419 | |
| | 91,915 | | | Stewart Information Services Corp. | | | 2,928,412 | |
| | 45,513 | | | Trupanion, Inc.*(a) | | | 1,361,294 | |
| | | | | | | | |
| | | | | | | 20,515,114 | |
| | |
| Interactive Media & Services – 0.3% | |
| | 174,638 | | | Cars.com, Inc.* | | | 904,625 | |
| | 12,303 | | | EverQuote, Inc., Class A* | | | 479,448 | |
| | 19,942 | | | Meet Group, Inc. (The)* | | | 123,042 | |
| | 14,895 | | | Yelp, Inc.* | | | 332,903 | |
| | | | | | | | |
| | | | | | | 1,840,018 | |
| | |
| Internet & Direct Marketing Retail – 0.6% | |
| | 29,979 | | | PetMed Express, Inc. | | | 1,186,269 | |
| | 24,689 | | | Quotient Technology, Inc.* | | | 177,267 | |
| | 170,534 | | | Rubicon Project, Inc. (The)* | | | 1,222,729 | |
| | 17,694 | | | Shutterstock, Inc. | | | 672,372 | |
| | | | | | | | |
| | | | | | | 3,258,637 | |
| | |
| IT Services – 1.8% | |
| | 17,469 | | | Cass Information Systems, Inc. | | | 700,682 | |
| | 49,433 | | | Conduent, Inc.* | | | 124,571 | |
| | 5,525 | | | EVERTEC, Inc. | | | 140,003 | |
| | 12,579 | | | Hackett Group, Inc. (The) | | | 186,547 | |
| | 19,986 | | | MAXIMUS, Inc. | | | 1,345,458 | |
| | 28,039 | | | Perficient, Inc.* | | | 976,598 | |
| | 208,257 | | | Perspecta, Inc. | | | 4,492,103 | |
| | 17,114 | | | Science Applications International Corp. | | | 1,397,529 | |
| | 20,141 | | | Virtusa Corp.* | | | 664,653 | |
| | | | | | | | |
| | | | | | | 10,028,144 | |
| | |
| Leisure Products – 0.6% | |
| | 2,929 | | | Johnson Outdoors, Inc., Class A | | | 200,226 | |
| | 18,789 | | | Malibu Boats, Inc., Class A* | | | 645,966 | |
| | 7,666 | | | Vista Outdoor, Inc.* | | | 77,580 | |
| | 88,443 | | | YETI Holdings, Inc.* | | | 2,441,911 | |
| | | | | | | | |
| | | | | | | 3,365,683 | |
| | |
| Life Sciences Tools & Services – 0.8% | |
| | 45,525 | | | Medpace Holdings, Inc.* | | | 3,635,627 | |
| | 7,973 | | | NanoString Technologies, Inc.* | | | 253,222 | |
| | 8,358 | | | Syneos Health, Inc.* | | | 466,293 | |
| | | | | | | | |
| | | | | | | 4,355,142 | |
| | |
| Machinery – 2.6% | |
| | 44,871 | | | Albany International Corp., Class A | | | 2,294,703 | |
| | 23,161 | | | Barnes Group, Inc. | | | 888,919 | |
| | 40,788 | | | Columbus McKinnon Corp. | | | 1,104,539 | |
| | |
| | |
| The accompanying notes are an integral part of these financial statements. | | 23 |
GOLDMAN SACHS SMALL CAP EQUITY INSIGHTS FUND
Schedule of Investments(continued)
April 30, 2020 (Unaudited)
| | | | | | | | |
| Shares | | | Description | | Value | |
|
| Common Stocks – (continued) | |
| Machinery – (continued) | |
| | 2,592 | | | Douglas Dynamics, Inc. | | $ | 95,800 | |
| | 17,297 | | | Federal Signal Corp. | | | 465,808 | |
| | 25,025 | | | Franklin Electric Co., Inc. | | | 1,271,270 | |
| | 3,599 | | | Hurco Cos., Inc. | | | 117,651 | |
| | 24,963 | | | Miller Industries, Inc. | | | 758,376 | |
| | 44,272 | | | Mueller Industries, Inc. | | | 1,146,645 | |
| | 24,396 | | | Navistar International Corp.* | | | 579,893 | |
| | 10,888 | | | Proto Labs, Inc.* | | | 1,106,112 | |
| | 11,152 | | | RBC Bearings, Inc.* | | | 1,412,735 | |
| | 53,795 | | | Rexnord Corp. | | | 1,466,990 | |
| | 16,316 | | | SPX Corp.* | | | 622,129 | |
| | 6,252 | | | Terex Corp. | | | 94,968 | |
| | 95,113 | | | Wabash National Corp. | | | 779,927 | |
| | | | | | | | |
| | | | | | | 14,206,465 | |
| | |
| Marine – 0.1% | |
| | 96,604 | | | Costamare, Inc. (Monaco) | | | 484,952 | |
| | |
| Media – 1.2% | |
| | 18,314 | | | Cardlytics, Inc.* | | | 823,214 | |
| | 52,120 | | | Liberty Latin America Ltd., Class A (Chile)* | | | 557,684 | |
| | 150,454 | | | Liberty Latin America Ltd., Class C (Chile)* | | | 1,555,694 | |
| | 95,371 | | | MSG Networks, Inc., Class A* | | | 1,133,008 | |
| | 48,745 | | | Scholastic Corp. | | | 1,417,017 | |
| | 36,363 | | | TechTarget, Inc.* | | | 847,985 | |
| | 33,904 | | | WideOpenWest, Inc.* | | | 200,712 | |
| | | | | | | | |
| | | | | | | 6,535,314 | |
| | |
| Metals & Mining – 1.7% | |
| | 43,114 | | | Carpenter Technology Corp. | | | 955,838 | |
| | 63,788 | | | Haynes International, Inc. | | | 1,409,715 | |
| | 396,237 | | | Hecla Mining Co. | | | 1,042,103 | |
| | 15,252 | | | Kaiser Aluminum Corp. | | | 1,101,652 | |
| | 56,245 | | | Materion Corp. | | | 2,910,116 | |
| | 68,355 | | | Novagold Resources, Inc. (Canada)* | | | 764,893 | |
| | 54,369 | | | Worthington Industries, Inc. | | | 1,437,516 | |
| | | | | | | | |
| | | | | | | 9,621,833 | |
| | |
| Mortgage Real Estate Investment Trusts (REITs) – 0.4% | |
| | 334,846 | | | Anworth Mortgage Asset Corp. REIT | | | 575,935 | |
| | 64,002 | | | Arlington Asset Investment Corp., Class A REIT | | | 181,126 | |
| | 9,018 | | | ARMOUR Residential REIT, Inc. REIT | | | 79,719 | |
| | 69,557 | | | Capstead Mortgage Corp. REIT | | | 361,001 | |
| | 14,162 | | | Great Ajax Corp. REIT | | | 123,209 | |
| | 53,338 | | | Ladder Capital Corp. REIT | | | 424,037 | |
| | 219,521 | | | New York Mortgage Trust, Inc. REIT | | | 478,556 | |
| | 14,036 | | | TPG RE Finance Trust, Inc. REIT | | | 107,937 | |
| | | | | | | | |
| | | | | | | 2,331,520 | |
| | |
| Multiline Retail – 0.1% | |
| | 17,584 | | | Big Lots, Inc. | | | 412,345 | |
| | |
| Multi-Utilities – 0.6% | |
| | 37,617 | | | Avista Corp. | | | 1,619,036 | |
| | |
|
| Common Stocks – (continued) | |
| Multi-Utilities – (continued) | |
| | 6,566 | | | Black Hills Corp. | | | 406,698 | |
| | 11,155 | | | NorthWestern Corp. | | | 643,532 | |
| | 18,035 | | | Unitil Corp. | | | 907,341 | |
| | | | | | | | |
| | | | | | | 3,576,607 | |
| | |
| Oil, Gas & Consumable Fuels – 2.6% | |
| | 84,231 | | | Ardmore Shipping Corp. (Ireland) | | | 554,240 | |
| | 43,341 | | | Brigham Minerals, Inc., Class A | | | 558,665 | |
| | 74,038 | | | Clean Energy Fuels Corp.* | | | 159,552 | |
| | 15,039 | | | CVR Energy, Inc. | | | 358,680 | |
| | 438,578 | | | DHT Holdings, Inc. | | | 3,184,076 | |
| | 40,281 | | | Dorian LPG Ltd.* | | | 382,267 | |
| | 173,755 | | | GasLog Ltd. (Monaco) | | | 802,748 | |
| | 97,177 | | | International Seaways, Inc. | | | 2,351,683 | |
| | 71,031 | | | Nordic American Tankers Ltd.(a) | | | 427,607 | |
| | 64,615 | | | Renewable Energy Group, Inc.* | | | 1,603,098 | |
| | 20,082 | | | Scorpio Tankers, Inc. (Monaco)(a) | | | 439,595 | |
| | 58,057 | | | Teekay Tankers Ltd., Class A (Bermuda)* | | | 1,179,138 | |
| | 101,277 | | | World Fuel Services Corp. | | | 2,531,925 | |
| | | | | | | | |
| | | | | | | 14,533,274 | |
| | |
| Paper & Forest Products – 0.7% | |
| | 62,747 | | | Boise Cascade Co. | | | 1,962,099 | |
| | 112,908 | | | PH Glatfelter Co. | | | 1,648,457 | |
| | 5,478 | | | Schweitzer-Mauduit International, Inc. | | | 176,501 | |
| | | | | | | | |
| | | | | | | 3,787,057 | |
| | |
| Personal Products – 0.2% | |
| | 20,417 | | | Inter Parfums, Inc. | | | 912,436 | |
| | 4,426 | | | Medifast, Inc. | | | 335,845 | |
| | | | | | | | |
| | | | | | | 1,248,281 | |
| | |
| Pharmaceuticals – 2.8% | |
| | 61,150 | | | Amphastar Pharmaceuticals, Inc.* | | | 1,036,492 | |
| | 42,228 | | | ANI Pharmaceuticals, Inc.* | | | 1,689,542 | |
| | 2,751 | | | Arvinas, Inc.* | | | 144,428 | |
| | 21,615 | | | Axsome Therapeutics, Inc.* | | | 2,054,073 | |
| | 67,344 | | | BioDelivery Sciences International, Inc.* | | | 307,089 | |
| | 26,761 | | | Corcept Therapeutics, Inc.* | | | 338,794 | |
| | 185,249 | | | Innoviva, Inc.* | | | 2,626,831 | |
| | 71,238 | | | Kala Pharmaceuticals, Inc.* | | | 709,530 | |
| | 15,306 | | | MyoKardia, Inc.* | | | 961,523 | |
| | 67,312 | | | Omeros Corp.*(a) | | | 1,118,725 | |
| | 18,471 | | | Pacira BioSciences, Inc.* | | | 762,668 | |
| | 52,360 | | | Phibro Animal Health Corp., Class A | | | 1,398,536 | |
| | 5,673 | | | Reata Pharmaceuticals, Inc., Class A* | | | 897,242 | |
| | 60,612 | | | Supernus Pharmaceuticals, Inc.* | | | 1,418,321 | |
| | | | | | | | |
| | | | | | | 15,463,794 | |
| | |
| Professional Services – 1.7% | |
| | 34,140 | | | ASGN, Inc.* | | | 1,585,803 | |
| | 11,405 | | | Barrett Business Services, Inc. | | | 557,933 | |
| | 14,897 | | | Exponent, Inc. | | | 1,047,706 | |
| | 19,123 | | | Huron Consulting Group, Inc.* | | | 1,071,653 | |
| | 8,613 | | | ICF International, Inc. | | | 633,400 | |
| | |
| | |
| 24 | | The accompanying notes are an integral part of these financial statements. |
GOLDMAN SACHS SMALL CAP EQUITY INSIGHTS FUND
| | | | | | | | |
| Shares | | | Description | | Value | |
|
| Common Stocks – (continued) | |
| Professional Services – (continued) | |
| | 8,740 | | | Insperity, Inc. | | $ | 416,985 | |
| | 52,219 | | | Kforce, Inc. | | | 1,563,959 | |
| | 37,036 | | | Resources Connection, Inc. | | | 402,952 | |
| | 42,023 | | | TriNet Group, Inc.* | | | 2,057,866 | |
| | | | | | | | |
| | | | | | | 9,338,257 | |
| | |
| Real Estate Management & Development – 0.2% | |
| | 59,544 | | | Kennedy-Wilson Holdings, Inc. | | | 842,548 | |
| | 98,912 | | | Newmark Group, Inc., Class A | | | 383,778 | |
| | 5,531 | | | Redfin Corp.* | | | 116,870 | |
| | | | | | | | |
| | | | | | | 1,343,196 | |
| | |
| Road & Rail – 0.6% | |
| | 105,678 | | | Marten Transport Ltd. | | | 2,369,301 | |
| | 18,604 | | | Werner Enterprises, Inc. | | | 746,392 | |
| | | | | | | | |
| | | | | | | 3,115,693 | |
| | |
| Semiconductors & Semiconductor Equipment – 4.1% | |
| | 49,523 | | | Ambarella, Inc.* | | | 2,603,919 | |
| | 151,468 | | | Amkor Technology, Inc.* | | | 1,496,504 | |
| | 33,802 | | | Cirrus Logic, Inc.* | | | 2,555,431 | |
| | 13,331 | | | Enphase Energy, Inc.* | | | 624,291 | |
| | 73,287 | | | FormFactor, Inc.* | | | 1,707,587 | |
| | 41,167 | | | Inphi Corp.* | | | 3,974,262 | |
| | 97,068 | | | Lattice Semiconductor Corp.* | | | 2,185,001 | |
| | 7,634 | | | MaxLinear, Inc.* | | | 125,885 | |
| | 37,728 | | | Power Integrations, Inc. | | | 3,861,461 | |
| | 186,284 | | | Rambus, Inc.* | | | 2,334,138 | |
| | 4,090 | | | Silicon Laboratories, Inc.* | | | 397,630 | |
| | 4,437 | | | Synaptics, Inc.* | | | 290,135 | |
| | 7,970 | | | Ultra Clean Holdings, Inc.* | | | 146,568 | |
| | 33,964 | | | Veeco Instruments, Inc.* | | | 371,227 | |
| | | | | | | | |
| | | | | | | 22,674,039 | |
| | |
| Software – 4.5% | |
| | 11,150 | | | American Software, Inc., Class A | | | 183,752 | |
| | 38,244 | | | Blackline, Inc.* | | | 2,322,941 | |
| | 5,872 | | | Box, Inc., Class A* | | | 94,774 | |
| | 50,426 | | | Cornerstone OnDemand, Inc.* | | | 1,692,297 | |
| | 84,727 | | | Digital Turbine, Inc.* | | | 496,500 | |
| | 18,294 | | | Everbridge, Inc.* | | | 2,037,586 | |
| | 38,669 | | | Five9, Inc.* | | | 3,583,456 | |
| | 16,716 | | | MicroStrategy, Inc., Class A* | | | 2,111,732 | |
| | 8,184 | | | OneSpan, Inc.* | | | 137,491 | |
| | 3,372 | | | PROS Holdings, Inc.* | | | 115,963 | |
| | 39,780 | | | Qualys, Inc.* | | | 4,194,403 | |
| | 23,290 | | | Rapid7, Inc.* | | | 1,060,860 | |
| | 71,608 | | | SPS Commerce, Inc.* | | | 3,974,960 | |
| | 162,301 | | | SVMK, Inc.* | | | 2,548,126 | |
| | 76,072 | | | Telenav, Inc.* | | | 355,256 | |
| | 3,150 | | | Verint Systems, Inc.* | | | 134,631 | |
| | 12,698 | | | VirnetX Holding Corp.* | | | 70,601 | |
| | | | | | | | |
| | | | | | | 25,115,329 | |
| | |
| Specialty Retail – 2.8% | |
| | 15,783 | | | America’s Car-Mart, Inc.* | | | 1,040,889 | |
| | |
|
| Common Stocks – (continued) | |
| Specialty Retail – (continued) | |
| | 44,637 | | | Asbury Automotive Group, Inc.* | | | 3,012,998 | |
| | 7,614 | | | Boot Barn Holdings, Inc.* | | | 140,554 | |
| | 23,228 | | | GameStop Corp., Class A*(a) | | | 133,096 | |
| | 9,631 | | | Lithia Motors, Inc., Class A | | | 1,064,803 | |
| | 38,790 | | | Murphy USA, Inc.* | | | 4,142,772 | |
| | 53,927 | | | National Vision Holdings, Inc.* | | | 1,429,066 | |
| | 158,643 | | | Office Depot, Inc. | | | 352,187 | |
| | 11,553 | | | Sally Beauty Holdings, Inc.* | | | 112,180 | |
| | 116,215 | | | Sonic Automotive, Inc., Class A | | | 2,490,487 | |
| | 96,178 | | | Sportsman’s Warehouse Holdings, Inc.* | | | 688,635 | |
| | 30,362 | | | Tilly’s, Inc., Class A | | | 178,832 | |
| | 47,586 | | | Zumiez, Inc.* | | | 1,005,968 | |
| | | | | | | | |
| | | | | | | 15,792,467 | |
| | |
| Textiles, Apparel & Luxury Goods – 0.9% | |
| | 45,978 | | | Crocs, Inc.* | | | 1,114,967 | |
| | 8,478 | | | Deckers Outdoor Corp.* | | | 1,261,187 | |
| | 7,484 | | | G-III Apparel Group Ltd.* | | | 84,794 | |
| | 7,701 | | | Kontoor Brands, Inc. | | | 149,476 | |
| | 118,990 | | | Wolverine World Wide, Inc. | | | 2,438,105 | |
| | | | | | | | |
| | | | | | | 5,048,529 | |
| | |
| Thrifts & Mortgage Finance – 1.0% | |
| | 23,266 | | | Essent Group Ltd. | | | 635,627 | |
| | 34,029 | | | Meridian Bancorp, Inc. | | | 400,862 | |
| | 66,976 | | | PennyMac Financial Services, Inc. | | | 2,020,666 | |
| | 8,181 | | | Radian Group, Inc. | | | 122,551 | |
| | 50,836 | | | Walker & Dunlop, Inc. | | | 1,953,627 | |
| | 2,811 | | | Washington Federal, Inc. | | | 75,166 | |
| | 8,959 | | | WSFS Financial Corp. | | | 261,424 | |
| | | | | | | | |
| | | | | | | 5,469,923 | |
| | |
| Trading Companies & Distributors – 0.9% | |
| | 104,426 | | | Foundation Building Materials, Inc.* | | | 1,221,784 | |
| | 40,557 | | | GMS, Inc.* | | | 745,438 | |
| | 56,841 | | | H&E Equipment Services, Inc. | | | 924,235 | |
| | 185,192 | | | MRC Global, Inc.* | | | 992,629 | |
| | 143,043 | | | NOW, Inc.* | | | 882,575 | |
| | 11,022 | | | Triton International Ltd. (Bermuda) | | | 341,462 | |
| | | | | | | | |
| | | | | | | 5,108,123 | |
| | |
| Water Utilities – 0.1% | |
| | 5,773 | | | American States Water Co. | | | 458,203 | |
| | 2,752 | | | California Water Service Group | | | 123,620 | |
| | | | | | | | |
| | | | | | | 581,823 | |
| | |
| Wireless Telecommunication Services – 0.1% | |
| | 7,678 | | | Shenandoah Telecommunications Co. | | | 410,850 | |
| | 7,008 | | | Spok Holdings, Inc. | | | 71,902 | |
| | | | | | | | |
| | | | | | | 482,752 | |
| | |
| TOTAL INVESTMENTS BEFORE SECURITIES
LENDING REINVESTMENT VEHICLE |
|
| | (Cost $625,893,584) | | $ | 554,188,455 | |
| | |
| | |
| The accompanying notes are an integral part of these financial statements. | | 25 |
GOLDMAN SACHS SMALL CAP EQUITY INSIGHTS FUND
Schedule of Investments(continued)
April 30, 2020 (Unaudited)
| | | | | | | | |
| Shares | | | Dividend Rate | | Value | |
|
| Securities Lending Reinvestment Vehicle – 0.9%(b) | |
| Goldman Sachs Financial Square Government Fund –
Institutional Shares |
|
| | 4,716,670 | | | 0.233% | | $ | 4,716,670 | |
| | (Cost $4,716,670) | |
| | |
| | TOTAL INVESTMENTS – 100.9% | |
| | (Cost $630,610,254) | | $ | 558,905,125 | |
| | |
| LIABILITIES IN EXCESS OF
OTHER ASSETS – (0.9)% | | | (4,781,742 | ) |
| | |
| | NET ASSETS – 100.0% | | $ | 554,123,383 | |
| | |
| | |
|
| The percentage shown for each investment category reflects the value of investments in that category as a percentage of net assets. |
| |
* | | Non-income producing security. |
| |
(a) | | All or a portion of security is on loan. |
| |
(b) | | Represents an affiliated issuer. |
| | |
|
Investment Abbreviations: |
PLC | | —Public Limited Company |
REIT | | —Real Estate Investment Trust |
|
| | |
| ADDITIONAL INVESTMENT INFORMATION |
FUTURES CONTRACTS — At April 30, 2020, the Fund had the following futures contracts:
| | | | | | | | | | | | | | |
| Description | | Number of
Contracts | | | Expiration
Date | | Notional
Amount | | | Unrealized
Appreciation/
(Depreciation) | |
E-mini Russell 2000 Index | | | 6 | | | 06/19/20 | | $ | 310,333 | | | $ | 81,677 | |
| | |
| 26 | | The accompanying notes are an integral part of these financial statements. |
GOLDMAN SACHS SMALL CAP GROWTH INSIGHTS FUND
Schedule of Investments
April 30, 2020 (Unaudited)
| | | | | | | | |
| Shares | | | Description | | Value | |
|
| Common Stocks – 98.8% | |
| Aerospace & Defense – 1.7% | |
| | 137,517 | | | Aerojet Rocketdyne Holdings, Inc.* | | $ | 5,657,449 | |
| | 97,317 | | | Astronics Corp.* | | | 873,907 | |
| | 58,317 | | | Axon Enterprise, Inc.* | | | 4,240,229 | |
| | 70,914 | | | Kratos Defense & Security Solutions, Inc.* | | | 1,065,128 | |
| | 22,254 | | | Maxar Technologies, Inc. | | | 280,623 | |
| | 51,335 | | | Mercury Systems, Inc.* | | | 4,577,029 | |
| | | | | | | | |
| | | | | | | 16,694,365 | |
| | |
| Air Freight & Logistics – 0.3% | |
| | 161,058 | | | Echo Global Logistics, Inc.* | | | 2,823,347 | |
| | 71,472 | | | Radiant Logistics, Inc.* | | | 305,900 | |
| | | | | | | | |
| | | | | | | 3,129,247 | |
| | |
| Airlines – 0.0% | |
| | 4,812 | | | Allegiant Travel Co. | | | 377,646 | |
| | |
| Auto Components – 0.2% | |
| | 40,934 | | | Gentherm, Inc.* | | | 1,532,569 | |
| | 5,819 | | | Standard Motor Products, Inc. | | | 236,775 | |
| | | | | | | | |
| | | | | | | 1,769,344 | |
| | |
| Banks – 2.8% | |
| | 61,171 | | | Amalgamated Bank, Class A | | | 654,530 | |
| | 61,669 | | | Atlantic Capital Bancshares, Inc.* | | | 773,946 | |
| | 233,895 | | | Cadence BanCorp | | | 1,548,385 | |
| | 178,206 | | | Central Pacific Financial Corp. | | | 3,116,823 | |
| | 192,471 | | | CVB Financial Corp. | | | 4,000,510 | |
| | 47,604 | | | First BanCorp. | | | 277,531 | |
| | 90,520 | | | First Financial Bankshares, Inc. | | | 2,520,982 | |
| | 134,736 | | | First Foundation, Inc. | | | 1,853,967 | |
| | 53,177 | | | Hilltop Holdings, Inc. | | | 1,026,316 | |
| | 108,175 | | | Independent Bank Group, Inc. | | | 3,278,784 | |
| | 131,579 | | | International Bancshares Corp. | | | 3,814,475 | |
| | 29,965 | | | National Bank Holdings Corp., Class A | | | 796,470 | |
| | 7,986 | | | Preferred Bank | | | 304,666 | |
| | 9,416 | | | Seacoast Banking Corp. of Florida* | | | 211,578 | |
| | 60,003 | | | TriCo Bancshares | | | 1,807,290 | |
| | 3,492 | | | UMB Financial Corp. | | | 177,533 | |
| | 12,309 | | | Westamerica Bancorporation | | | 775,467 | |
| | | | | | | | |
| | | | | | | 26,939,253 | |
| | |
| Beverages – 0.9% | |
| | 7,091 | | | Boston Beer Co., Inc. (The), Class A* | | | 3,308,022 | |
| | 24,223 | | | Coca-Cola Consolidated, Inc. | | | 5,703,790 | |
| | | | | | | | |
| | | | | | | 9,011,812 | |
| | |
| Biotechnology – 14.8% | |
| | 245,333 | | | ACADIA Pharmaceuticals, Inc.* | | | 11,852,037 | |
| | 63,392 | | | Acceleron Pharma, Inc.* | | | 5,738,878 | |
| | 83,051 | | | Agenus, Inc.* | | | 221,331 | |
| | 124,959 | | | Allogene Therapeutics, Inc.* | | | 3,611,315 | |
| | 324,760 | | | Amicus Therapeutics, Inc.* | | | 3,835,416 | |
| | 91,432 | | | Apellis Pharmaceuticals, Inc.* | | | 3,133,375 | |
| | 6,483 | | | Arcus Biosciences, Inc.* | | | 171,216 | |
| | 149,319 | | | Ardelyx, Inc.* | | | 982,519 | |
| | |
|
| Common Stocks – (continued) | |
| Biotechnology – (continued) | |
| | 84,043 | | | Arena Pharmaceuticals, Inc.* | | | 4,115,586 | |
| | 80,952 | | | Arrowhead Pharmaceuticals, Inc.* | | | 2,787,177 | |
| | 20,012 | | | Atara Biotherapeutics, Inc.* | | | 165,899 | |
| | 98,895 | | | Biohaven Pharmaceutical Holding Co. Ltd.* | | | 4,657,955 | |
| | 13,522 | | | BioSpecifics Technologies Corp.* | | | 769,537 | |
| | 62,899 | | | Blueprint Medicines Corp.* | | | 3,700,348 | |
| | 25,455 | | | Bridgebio Pharma, Inc.* | | | 777,141 | |
| | 564,259 | | | Catalyst Pharmaceuticals, Inc.* | | | 2,674,588 | |
| | 19,194 | | | ChemoCentryx, Inc.* | | | 1,017,474 | |
| | 124,929 | | | Coherus Biosciences, Inc.* | | | 2,073,821 | |
| | 14,831 | | | Constellation Pharmaceuticals, Inc.* | | | 533,619 | |
| | 86,420 | | | Deciphera Pharmaceuticals, Inc.* | | | 5,010,632 | |
| | 86,604 | | | Dicerna Pharmaceuticals, Inc.* | | | 1,706,099 | |
| | 126,761 | | | Editas Medicine, Inc.* | | | 2,930,714 | |
| | 22,319 | | | Emergent BioSolutions, Inc.* | | | 1,650,490 | |
| | 104,176 | | | Enanta Pharmaceuticals, Inc.* | | | 4,830,641 | |
| | 36,075 | | | Epizyme, Inc.* | | | 593,794 | |
| | 6,126 | | | Esperion Therapeutics, Inc.*(a) | | | 242,590 | |
| | 40,818 | | | Fate Therapeutics, Inc.* | | | 1,117,597 | |
| | 109,383 | | | FibroGen, Inc.* | | | 4,035,139 | |
| | 18,859 | | | G1 Therapeutics, Inc.* | | | 247,619 | |
| | 97,391 | | | Global Blood Therapeutics, Inc.* | | | 7,452,359 | |
| | 169,599 | | | Halozyme Therapeutics, Inc.* | | | 3,842,265 | |
| | 88,907 | | | Heron Therapeutics, Inc.* | | | 1,267,814 | |
| | 194,205 | | | ImmunoGen, Inc.* | | | 792,356 | |
| | 139,245 | | | Immunomedics, Inc.* | | | 4,230,263 | |
| | 24,395 | | | Inovio Pharmaceuticals, Inc.*(a) | | | 293,472 | |
| | 44,177 | | | Insmed, Inc.* | | | 1,016,071 | |
| | 45,386 | | | Intercept Pharmaceuticals, Inc.* | | | 3,718,021 | |
| | 125,902 | | | Iovance Biotherapeutics, Inc.* | | | 4,047,749 | |
| | 87,960 | | | Ironwood Pharmaceuticals, Inc.* | | | 879,600 | |
| | 120,286 | | | Karyopharm Therapeutics, Inc.* | | | 2,652,306 | |
| | 13,080 | | | Kiniksa Pharmaceuticals Ltd., Class A* | | | 260,946 | |
| | 14,337 | | | Kodiak Sciences, Inc.* | | | 782,083 | |
| | 21,524 | | | Kura Oncology, Inc.* | | | 313,174 | |
| | 54,009 | | | Minerva Neurosciences, Inc.* | | | 484,461 | |
| | 57,636 | | | Mirati Therapeutics, Inc.* | | | 4,901,365 | |
| | 96,601 | | | Momenta Pharmaceuticals, Inc.* | | | 3,062,252 | |
| | 9,682 | | | Myriad Genetics, Inc.* | | | 149,684 | |
| | 25,135 | | | Natera, Inc.* | | | 931,000 | |
| | 13,814 | | | Novavax, Inc.*(a) | �� | | 250,448 | |
| | 226,195 | | | Pieris Pharmaceuticals, Inc.* | | | 599,417 | |
| | 33,375 | | | Principia Biopharma, Inc.* | | | 2,075,258 | |
| | 67,401 | | | Prothena Corp. PLC (Ireland)* | | | 756,239 | |
| | 54,864 | | | PTC Therapeutics, Inc.* | | | 2,793,675 | |
| | 207,357 | | | Radius Health, Inc.* | | | 3,253,431 | |
| | 29,908 | | | REVOLUTION Medicines, Inc.* | | | 935,223 | |
| | 37,693 | | | Rocket Pharmaceuticals, Inc.*(a) | | | 557,856 | |
| | 48,252 | | | Turning Point Therapeutics, Inc.* | | | 2,485,461 | |
| | 26,599 | | | Ultragenyx Pharmaceutical, Inc.* | | | 1,607,378 | |
| | 188,461 | | | Veracyte, Inc.* | | | 5,082,793 | |
| | 28,789 | | | Viking Therapeutics, Inc.* | | | 165,825 | |
| | 164,288 | | | Voyager Therapeutics, Inc.* | | | 1,775,953 | |
| | 16,115 | | | XBiotech, Inc.*(a) | | | 254,939 | |
| | 164,903 | | | Xencor, Inc.* | | | 4,820,115 | |
| | |
| | |
| The accompanying notes are an integral part of these financial statements. | | 27 |
GOLDMAN SACHS SMALL CAP GROWTH INSIGHTS FUND
Schedule of Investments(continued)
April 30, 2020 (Unaudited)
| | | | | | | | |
| Shares | | | Description | | Value | |
|
| Common Stocks – (continued) | |
| Biotechnology – (continued) | |
| | 24,034 | | | Y-mAbs Therapeutics, Inc.* | | $ | 807,062 | |
| | | | | | | | |
| | | | | | | 144,482,861 | |
| | |
| Building Products – 2.0% | |
| | 14,349 | | | AAON, Inc. | | | 683,586 | |
| | 90,789 | | | Builders FirstSource, Inc.* | | | 1,665,978 | |
| | 50,078 | | | CSW Industrials, Inc. | | | 3,317,167 | |
| | 41,124 | | | Gibraltar Industries, Inc.* | | | 1,904,041 | |
| | 24,843 | | | JELD-WEN Holding, Inc.* | | | 315,506 | |
| | 5,910 | | | Masonite International Corp.* | | | 349,163 | |
| | 4,935 | | | Patrick Industries, Inc. | | | 203,421 | |
| | 107,605 | | | Simpson Manufacturing Co., Inc. | | | 7,758,320 | |
| | 83,148 | | | Universal Forest Products, Inc. | | | 3,419,046 | |
| | | | | | | | |
| | | | | | | 19,616,228 | |
| | |
| Capital Markets – 0.3% | |
| | 91,969 | | | Federated Hermes, Inc. | | | 2,094,134 | |
| | 43,107 | | | Oppenheimer Holdings, Inc., Class A | | | 887,142 | |
| | 2,687 | | | PJT Partners, Inc., Class A | | | 130,696 | |
| | | | | | | | |
| | | | | | | 3,111,972 | |
| | |
| Chemicals – 2.1% | |
| | 7,587 | | | Balchem Corp. | | | 677,064 | |
| | 30,097 | | | Chase Corp. | | | 2,836,943 | |
| | 361,546 | | | Ferro Corp.* | | | 3,604,614 | |
| | 57,944 | | | Ingevity Corp.* | | | 3,008,452 | |
| | 49,393 | | | Koppers Holdings, Inc.* | | | 778,434 | |
| | 38,705 | | | Kraton Corp.* | | | 604,185 | |
| | 61,864 | | | Minerals Technologies, Inc. | | | 2,724,490 | |
| | 253,727 | | | PolyOne Corp. | | | 5,909,302 | |
| | | | | | | | |
| | | | | | | 20,143,484 | |
| | |
| Commercial Services & Supplies – 2.2% | |
| | 67,806 | | | Brady Corp., Class A | | | 2,952,273 | |
| | 47,353 | | | Brink’s Co. (The) | | | 2,420,686 | |
| | 8,926 | | | Casella Waste Systems, Inc., Class A* | | | 413,988 | |
| | 20,808 | | | Cimpress PLC (Ireland)*(a) | | | 1,514,614 | |
| | 168,158 | | | HNI Corp. | | | 4,092,966 | |
| | 112,093 | | | Kimball International, Inc., Class B | | | 1,375,381 | |
| | 82,472 | | | McGrath RentCorp | | | 4,498,848 | |
| | 30,789 | | | MSA Safety, Inc. | | | 3,464,686 | |
| | 71,376 | | | Pitney Bowes, Inc. | | | 251,957 | |
| | | | | | | | |
| | | | | | | 20,985,399 | |
| | |
| Communications Equipment – 1.3% | |
| | 11,381 | | | Calix, Inc.* | | | 130,881 | |
| | 218,397 | | | Extreme Networks, Inc.* | | | 742,550 | |
| | 221,824 | | | Harmonic, Inc.* | | | 1,286,579 | |
| | 43,497 | | | Infinera Corp.* | | | 268,159 | |
| | 40,229 | | | Inseego Corp.* | | | 480,737 | |
| | 37,638 | | | Lumentum Holdings, Inc.* | | | 3,045,291 | |
| | 28,172 | | | NETGEAR, Inc.* | | | 675,565 | |
| | 517,394 | | | Viavi Solutions, Inc.* | | | 6,250,119 | |
| | | | | | | | |
| | | | | | | 12,879,881 | |
| | |
|
| Common Stocks – (continued) | |
| Construction & Engineering – 0.7% | |
| | 246,484 | | | Great Lakes Dredge & Dock Corp.* | | | 2,178,919 | |
| | 119,275 | | | MasTec, Inc.* | | | 4,281,972 | |
| | 20,521 | | | WillScot Corp.* | | | 239,070 | |
| | | | | | | | |
| | | | | | | 6,699,961 | |
| | |
| Construction Materials – 0.5% | |
| | 294,096 | | | Summit Materials, Inc., Class A* | | | 4,443,791 | |
| | |
| Consumer Finance – 0.6% | |
| | 230,001 | | | Enova International, Inc.* | | | 3,689,216 | |
| | 19,127 | | | FirstCash, Inc. | | | 1,374,084 | |
| | 20,681 | | | Nelnet, Inc., Class A | | | 995,790 | |
| | | | | | | | |
| | | | | | | 6,059,090 | |
| | |
| Containers & Packaging – 0.1% | |
| | 69,245 | | | Myers Industries, Inc. | | | 855,868 | |
| | |
| Distributors – 0.2% | |
| | 75,155 | | | Core-Mark Holding Co, Inc. | | | 2,159,955 | |
| | |
| Diversified Consumer Services – 1.9% | |
| | 30,062 | | | American Public Education, Inc.* | | | 774,698 | |
| | 118,733 | | | Chegg, Inc.* | | | 5,075,836 | |
| | 59,691 | | | Collectors Universe, Inc. | | | 1,311,411 | |
| | 65,839 | | | K12, Inc.* | | | 1,495,203 | |
| | 185,808 | | | Laureate Education, Inc., Class A* | | | 1,759,602 | |
| | 124,177 | | | Perdoceo Education Corp.* | | | 1,614,301 | |
| | 37,344 | | | Strategic Education, Inc. | | | 5,948,899 | |
| | 7,890 | | | WW International, Inc.* | | | 201,274 | |
| | | | | | | | |
| | | | | | | 18,181,224 | |
| | |
| Diversified Financial Services – 0.0% | |
| | 29,647 | | | Banco Latinoamericano de Comercio Exterior SA, Class E (Panama) | | | 338,569 | |
| | |
| Diversified Telecommunication Services – 1.2% | |
| | 12,778 | | | Bandwidth, Inc., Class A* | | | 1,042,174 | |
| | 107,473 | | | Cogent Communications Holdings, Inc. | | | 9,009,462 | |
| | 538,564 | | | ORBCOMM, Inc.* | | | 1,421,809 | |
| | 67,423 | | | Vonage Holdings Corp.* | | | 563,656 | |
| | | | | | | | |
| | | | | | | 12,037,101 | |
| | |
| Electrical Equipment – 0.5% | |
| | 130,697 | | | Atkore International Group, Inc.* | | | 3,181,165 | |
| | 19,971 | | | Bloom Energy Corp., Class A* | | | 153,178 | |
| | 10,776 | | | Generac Holdings, Inc.* | | | 1,050,013 | |
| | 12,035 | | | Powell Industries, Inc. | | | 305,328 | |
| | 4,300 | | | Vicor Corp.* | | | 228,631 | |
| | | | | | | | |
| | | | | | | 4,918,315 | |
| | |
| Electronic Equipment, Instruments & Components – 3.0% | |
| | 11,863 | | | Badger Meter, Inc. | | | 700,273 | |
| | 39,648 | | | Belden, Inc. | | | 1,355,565 | |
| | 63,347 | | | Benchmark Electronics, Inc. | | | 1,308,749 | |
| | 36,025 | | | Fabrinet (Thailand)* | | | 2,260,569 | |
| | 110,603 | | | Itron, Inc.* | | | 7,722,301 | |
| | 101,556 | | | Knowles Corp.* | | | 1,579,196 | |
| | |
| | |
| 28 | | The accompanying notes are an integral part of these financial statements. |
GOLDMAN SACHS SMALL CAP GROWTH INSIGHTS FUND
| | | | | | | | |
| Shares | | | Description | | Value | |
|
| Common Stocks – (continued) | |
| Electronic Equipment, Instruments & Components – (continued) | |
| | 14,245 | | | Novanta, Inc.* | | $ | 1,237,748 | |
| | 65,710 | | | Plexus Corp.* | | | 4,119,360 | |
| | 35,763 | | | Rogers Corp.* | | | 3,971,124 | |
| | 95,617 | | | Sanmina Corp.* | | | 2,651,459 | |
| | 11,023 | | | TTM Technologies, Inc.* | | | 127,757 | |
| | 88,995 | | | Vishay Precision Group, Inc.* | | | 2,057,564 | |
| | | | | | | | |
| | | | | | | 29,091,665 | |
| | |
| Energy Equipment & Services – 0.5% | |
| | 48,953 | | | Cactus, Inc., Class A | | | 870,384 | |
| | 12,431 | | | DMC Global, Inc. | | | 320,844 | |
| | 108,986 | | | Matrix Service Co.* | | | 1,137,814 | |
| | 100,199 | | | SEACOR Holdings, Inc.* | | | 2,831,624 | |
| | | | | | | | |
| | | | | | | 5,160,666 | |
| | |
| Entertainment – 0.2% | |
| | 132,487 | | | Glu Mobile, Inc.* | | | 1,033,399 | |
| | 89,370 | | | IMAX Corp.* | | | 1,027,755 | |
| | | | | | | | |
| | | | | | | 2,061,154 | |
| | |
| Equity Real Estate Investment Trusts (REITs) – 4.6% | |
| | 148,474 | | | American Assets Trust, Inc. REIT | | | 4,204,784 | |
| | 8,612 | | | Community Healthcare Trust, Inc. REIT | | | 320,366 | |
| | 35,991 | | | EastGroup Properties, Inc. REIT | | | 3,815,046 | |
| | 205,166 | | | Essential Properties Realty Trust, Inc. REIT | | | 3,013,889 | |
| | 181,752 | | | First Industrial Realty Trust, Inc. REIT | | | 6,864,773 | |
| | 10,437 | | | Independence Realty Trust, Inc. REIT | | | 105,101 | |
| | 133,843 | | | NexPoint Residential Trust, Inc. REIT | | | 4,024,659 | |
| | 179,424 | | | Physicians Realty Trust REIT | | | 2,766,718 | |
| | 30,502 | | | PS Business Parks, Inc. REIT | | | 3,937,503 | |
| | 139,051 | | | QTS Realty Trust, Inc., Class A REIT | | | 8,694,859 | |
| | 10,539 | | | Ryman Hospitality Properties, Inc. REIT | | | 372,448 | |
| | 58,923 | | | Sabra Health Care REIT, Inc. REIT | | | 755,393 | |
| | 111,754 | | | Terreno Realty Corp. REIT | | | 6,126,354 | |
| | 1,062 | | | Universal Health Realty Income Trust REIT | | | 113,591 | |
| | | | | | | | |
| | | | | | | 45,115,484 | |
| | |
| Food & Staples Retailing – 0.5% | |
| | 8,858 | | | Chefs’ Warehouse, Inc. (The)* | | | 124,721 | |
| | 147,536 | | | Performance Food Group Co.* | | | 4,330,181 | |
| | | | | | | | |
| | | | | | | 4,454,902 | |
| | |
| Food Products – 1.4% | |
| | 29,449 | | | Calavo Growers, Inc. | | | 1,708,042 | |
| | 6,105 | | | Darling Ingredients, Inc.* | | | 125,702 | |
| | 21,938 | | | Freshpet, Inc.* | | | 1,654,345 | |
| | 50,368 | | | J&J Snack Foods Corp. | | | 6,398,247 | |
| | 42,927 | | | John B. Sanfilippo & Son, Inc. | | | 3,525,594 | |
| | | | | | | | |
| | | | | | | 13,411,930 | |
| | |
| Health Care Equipment & Supplies – 6.4% | |
| | 258,273 | | | Antares Pharma, Inc.* | | | 836,805 | |
| | 43,471 | | | Cardiovascular Systems, Inc.* | | | 1,825,782 | |
| | 218,212 | | | GenMark Diagnostics, Inc.* | | | 2,729,832 | |
| | |
|
| Common Stocks – (continued) | |
| Health Care Equipment & Supplies – (continued) | |
| | 142,684 | | | Globus Medical, Inc., Class A* | | | 6,771,783 | |
| | 98,729 | | | Haemonetics Corp.* | | | 11,233,386 | |
| | 27,334 | | | Inogen, Inc.* | | | 1,366,700 | |
| | 31,845 | | | Integer Holdings Corp.* | | | 2,371,179 | |
| | 39,918 | | | Invacare Corp. | | | 300,183 | |
| | 8,096 | | | iRhythm Technologies, Inc.* | | | 855,261 | |
| | 25,178 | | | Lantheus Holdings, Inc.* | | | 328,573 | |
| | 124,167 | | | Natus Medical, Inc.* | | | 3,102,933 | |
| | 116,569 | | | Novocure Ltd.* | | | 7,670,240 | |
| | 89,658 | | | NuVasive, Inc.* | | | 5,458,379 | |
| | 55,735 | | | Quidel Corp.* | | | 7,747,165 | |
| | 95,300 | | | Surmodics, Inc.* | | | 3,630,930 | |
| | 79,849 | | | Tandem Diabetes Care, Inc.* | | | 6,370,353 | |
| | 1,635 | | | Utah Medical Products, Inc. | | | 135,705 | |
| | | | | | | | |
| | | | | | | 62,735,189 | |
| | |
| Health Care Providers & Services – 1.5% | |
| | 13,773 | | | Amedisys, Inc.* | | | 2,536,436 | |
| | 24,280 | | | LHC Group, Inc.* | | | 3,156,157 | |
| | 43,452 | | | Magellan Health, Inc.* | | | 2,638,840 | |
| | 9,388 | | | National Research Corp. | | | 484,327 | |
| | 166,450 | | | Select Medical Holdings Corp.* | | | 2,841,302 | |
| | 140,335 | | | Tenet Healthcare Corp.* | | | 2,831,960 | |
| | | | | | | | |
| | | | | | | 14,489,022 | |
| | |
| Health Care Technology – 3.8% | |
| | 83,894 | | | HMS Holdings Corp.* | | | 2,405,660 | |
| | 89,909 | | | Inovalon Holdings, Inc., Class A* | | | 1,573,408 | |
| | 3,182 | | | Inspire Medical Systems, Inc.* | | | 228,022 | |
| | 96,828 | | | Livongo Health, Inc.*(a) | | | 3,874,088 | |
| | 125,230 | | | NextGen Healthcare, Inc.* | | | 1,321,177 | |
| | 117,093 | | | Omnicell, Inc.* | | | 8,536,080 | |
| | 38,700 | | | Schrodinger, Inc.* | | | 1,795,680 | |
| | 29,142 | | | Simulations Plus, Inc. | | | 1,108,853 | |
| | 94,427 | | | Teladoc Health, Inc.* | | | 15,541,740 | |
| | 11,247 | | | Vocera Communications, Inc.* | | | 213,243 | |
| | | | | | | | |
| | | | | | | 36,597,951 | |
| | |
| Hotels, Restaurants & Leisure – 2.9% | |
| | 4,883 | | | Chart Industries, Inc. | | | 216,756 | |
| | 12,235 | | | Cracker Barrel Old Country Store, Inc. | | | 1,191,689 | |
| | 339,492 | | | Denny’s Corp.* | | | 3,826,075 | |
| | 391,719 | | | Everi Holdings, Inc.* | | | 1,939,009 | |
| | 12,437 | | | Marriott Vacations Worldwide Corp. | | | 1,032,271 | |
| | 342,505 | | | Red Rock Resorts, Inc., Class A | | | 3,753,855 | |
| | 164,808 | | | Scientific Games Corp.* | | | 2,078,229 | |
| | 97,452 | | | Texas Roadhouse, Inc. | | | 4,589,014 | |
| | 78,266 | | | Wingstop, Inc. | | | 9,178,254 | |
| | | | | | | | |
| | | | | | | 27,805,152 | |
| | |
| Household Durables – 1.9% | |
| | 33,529 | | | Century Communities, Inc.* | | | 718,191 | |
| | 24,424 | | | Installed Building Products, Inc.* | | | 1,204,347 | |
| | 11,256 | | | iRobot Corp.*(a) | | | 686,166 | |
| | 4,266 | | | LGI Homes, Inc.* | | | 258,434 | |
| | 57,856 | | | M/I Homes, Inc.* | | | 1,473,014 | |
| | |
| | |
| The accompanying notes are an integral part of these financial statements. | | 29 |
GOLDMAN SACHS SMALL CAP GROWTH INSIGHTS FUND
Schedule of Investments(continued)
April 30, 2020 (Unaudited)
| | | | | | | | |
| Shares | | | Description | | Value | |
|
| Common Stocks – (continued) | |
| Household Durables – (continued) | |
| | 219,542 | | | Sonos, Inc.* | | $ | 2,243,719 | |
| | 73,566 | | | TopBuild Corp.* | | | 6,855,616 | |
| | 278,761 | | | TRI Pointe Group, Inc.* | | | 3,200,176 | |
| | 37,134 | | | Universal Electronics, Inc.* | | | 1,532,892 | |
| | | | | | | | |
| | | | | | | 18,172,555 | |
| | |
| Insurance – 2.2% | |
| | 243,410 | | | American Equity Investment Life Holding Co. | | | 5,116,478 | |
| | 35,104 | | | eHealth, Inc.* | | | 3,745,597 | |
| | 85,754 | | | Goosehead Insurance, Inc., Class A* | | | 4,814,230 | |
| | 4,796 | | | Kinsale Capital Group, Inc. | | | 520,941 | |
| | 319,911 | | | MBIA, Inc.* | | | 2,604,076 | |
| | 27,822 | | | Stewart Information Services Corp. | | | 886,409 | |
| | 106,972 | | | Trupanion, Inc.*(a) | | | 3,199,532 | |
| | | | | | | | |
| | | | | | | 20,887,263 | |
| | |
| Interactive Media & Services – 0.5% | |
| | 317,977 | | | Cars.com, Inc.* | | | 1,647,121 | |
| | 24,159 | | | EverQuote, Inc., Class A* | | | 941,476 | |
| | 104,327 | | | Yelp, Inc.* | | | 2,331,709 | |
| | | | | | | | |
| | | | | | | 4,920,306 | |
| | |
| Internet & Direct Marketing Retail – 0.7% | |
| | 446,326 | | | Groupon, Inc.* | | | 544,518 | |
| | 34,871 | | | PetMed Express, Inc. | | | 1,379,845 | |
| | 20,143 | | | Quotient Technology, Inc.* | | | 144,627 | |
| | 290,818 | | | Rubicon Project, Inc. (The)* | | | 2,085,165 | |
| | 56,060 | | | Shutterstock, Inc. | | | 2,130,280 | |
| | | | | | | | |
| | | | | | | 6,284,435 | |
| | |
| IT Services – 2.4% | |
| | 17,977 | | | Cass Information Systems, Inc. | | | 721,057 | |
| | 16,374 | | | EVERTEC, Inc. | | | 414,917 | |
| | 7,535 | | | ExlService Holdings, Inc.* | | | 465,136 | |
| | 16,993 | | | Hackett Group, Inc. (The) | | | 252,006 | |
| | 39,977 | | | I3 Verticals, Inc., Class A* | | | 929,066 | |
| | 55,575 | | | MAXIMUS, Inc. | | | 3,741,309 | |
| | 12,808 | | | NIC, Inc. | | | 310,338 | |
| | 15,733 | | | Paysign, Inc.* | | | 130,486 | |
| | 82,942 | | | Perficient, Inc.* | | | 2,888,870 | |
| | 266,291 | | | Perspecta, Inc. | | | 5,743,897 | |
| | 73,790 | | | Science Applications International Corp. | | | 6,025,691 | |
| | 4,357 | | | TTEC Holdings, Inc. | | | 169,836 | |
| | 46,391 | | | Virtusa Corp.* | | | 1,530,903 | |
| | | | | | | | |
| | | | | | | 23,323,512 | |
| | |
| Leisure Products – 0.8% | |
| | 2,416 | | | Johnson Outdoors, Inc., Class A | | | 165,158 | |
| | 49,675 | | | Malibu Boats, Inc., Class A* | | | 1,707,827 | |
| | 85,852 | | | MasterCraft Boat Holdings, Inc.* | | | 897,153 | |
| | 2,816 | | | Sturm Ruger & Co., Inc. | | | 149,811 | |
| | 157,710 | | | YETI Holdings, Inc.* | | | 4,354,373 | |
| | | | | | | | |
| | | | | | | 7,274,322 | |
| | |
|
| Common Stocks – (continued) | |
| Life Sciences Tools & Services – 1.0% | |
| | 121,656 | | | Fluidigm Corp.* | | | 272,509 | �� |
| | 98,034 | | | Medpace Holdings, Inc.* | | | 7,828,995 | |
| | 11,021 | | | NanoString Technologies, Inc.* | | | 350,027 | |
| | 13,763 | | | Repligen Corp.* | | | 1,598,573 | |
| | | | | | | | |
| | | | | | | 10,050,104 | |
| | |
| Machinery – 3.3% | |
| | 104,416 | | | Albany International Corp., Class A | | | 5,339,834 | |
| | 36,060 | | | Barnes Group, Inc. | | | 1,383,983 | |
| | 8,673 | | | Chart Industries, Inc.* | | | 309,799 | |
| | 81,597 | | | Columbus McKinnon Corp. | | | 2,209,647 | |
| | 6,559 | | | Douglas Dynamics, Inc. | | | 242,421 | |
| | 23,700 | | | ESCO Technologies, Inc. | | | 1,808,310 | |
| | 12,611 | | | Evoqua Water Technologies Corp.* | | | 202,406 | |
| | 78,765 | | | Federal Signal Corp. | | | 2,121,141 | |
| | 69,230 | | | Franklin Electric Co., Inc. | | | 3,516,884 | |
| | 18,862 | | | Miller Industries, Inc. | | | 573,028 | |
| | 99,733 | | | Mueller Industries, Inc. | | | 2,583,085 | |
| | 35,041 | | | Proto Labs, Inc.* | | | 3,559,815 | |
| | 35,262 | | | RBC Bearings, Inc.* | | | 4,466,990 | |
| | 47,499 | | | Rexnord Corp. | | | 1,295,298 | |
| | 65,824 | | | SPX Corp.* | | | 2,509,869 | |
| | | | | | | | |
| | | | | | | 32,122,510 | |
| | |
| Marine – 0.1% | |
| | 177,502 | | | Costamare, Inc. (Monaco) | | | 891,060 | |
| | |
| Media – 0.7% | |
| | 48,268 | | | Cardlytics, Inc.* | | | 2,169,647 | |
| | 16,436 | | | Liberty Latin America Ltd., Class A (Chile)* | | | 175,865 | |
| | 142,993 | | | Liberty Latin America Ltd., Class C (Chile)* | | | 1,478,548 | |
| | 17,863 | | | Loral Space & Communications, Inc.* | | | 392,986 | |
| | 15,464 | | | Scholastic Corp. | | | 449,538 | |
| | 88,136 | | | TechTarget, Inc.* | | | 2,055,331 | |
| | | | | | | | |
| | | | | | | 6,721,915 | |
| | |
| Metals & Mining – 1.0% | |
| | 42,623 | | | Kaiser Aluminum Corp. | | | 3,078,659 | |
| | 72,081 | | | Materion Corp. | | | 3,729,471 | |
| | 73,272 | | | Novagold Resources, Inc. (Canada)* | | | 819,914 | |
| | 72,952 | | | Worthington Industries, Inc. | | | 1,928,851 | |
| | | | | | | | |
| | | | | | | 9,556,895 | |
| | |
| Multiline Retail – 0.0% | |
| | 8,588 | | | Big Lots, Inc. | | | 201,389 | |
| | |
| Multi-Utilities – 0.1% | |
| | 30,280 | | | Avista Corp. | | | 1,303,251 | |
| | |
| Oil, Gas & Consumable Fuels – 1.1% | |
| | 72,062 | | | Ardmore Shipping Corp. (Ireland) | | | 474,168 | |
| | 67,716 | | | Brigham Minerals, Inc., Class A | | | 872,859 | |
| | 401,462 | | | DHT Holdings, Inc. | | | 2,914,614 | |
| | 55,333 | | | Dorian LPG Ltd.* | | | 525,110 | |
| | 185,700 | | | GasLog Ltd. (Monaco) | | | 857,934 | |
| | |
| | |
| 30 | | The accompanying notes are an integral part of these financial statements. |
GOLDMAN SACHS SMALL CAP GROWTH INSIGHTS FUND
| | | | | | | | |
| Shares | | | Description | | Value | |
|
| Common Stocks – (continued) | |
| Oil, Gas & Consumable Fuels – (continued) | |
| | 35,788 | | | International Seaways, Inc. | | $ | 866,070 | |
| | 36,426 | | | Renewable Energy Group, Inc.* | | | 903,729 | |
| | 27,045 | | | Teekay Tankers Ltd., Class A (Bermuda)* | | | 549,284 | |
| | 114,985 | | | World Fuel Services Corp. | | | 2,874,625 | |
| | | | | | | | |
| | | | | | | 10,838,393 | |
| | |
| Paper & Forest Products – 0.4% | |
| | 135,597 | | | Boise Cascade Co. | | | 4,240,118 | |
| | |
| Personal Products – 0.3% | |
| | 42,911 | | | Inter Parfums, Inc. | | | 1,917,693 | |
| | 13,231 | | | Medifast, Inc. | | | 1,003,968 | |
| | | | | | | | |
| | | | | | | 2,921,661 | |
| | |
| Pharmaceuticals – 3.9% | |
| | 163,239 | | | Amphastar Pharmaceuticals, Inc.* | | | 2,766,901 | |
| | 82,739 | | | ANI Pharmaceuticals, Inc.* | | | 3,310,387 | |
| | 58,215 | | | Axsome Therapeutics, Inc.* | | | 5,532,171 | |
| | 281,010 | | | BioDelivery Sciences International, Inc.* | | | 1,281,406 | |
| | 137,527 | | | Corcept Therapeutics, Inc.* | | | 1,741,092 | |
| | 373,153 | | | Innoviva, Inc.* | | | 5,291,309 | |
| | 94,033 | | | Kala Pharmaceuticals, Inc.*(a) | | | 936,569 | |
| | 60,085 | | | MyoKardia, Inc.* | | | 3,774,540 | |
| | 9,331 | | | NGM Biopharmaceuticals, Inc.* | | | 170,384 | |
| | 148,132 | | | Omeros Corp.*(a) | | | 2,461,954 | |
| | 63,106 | | | Pacira BioSciences, Inc.* | | | 2,605,647 | |
| | 146,135 | | | Phibro Animal Health Corp., Class A | | | 3,903,266 | |
| | 6,979 | | | Reata Pharmaceuticals, Inc., Class A* | | | 1,103,799 | |
| | 123,586 | | | Supernus Pharmaceuticals, Inc.* | | | 2,891,912 | |
| | | | | | | | |
| | | | | | | 37,771,337 | |
| | |
| Professional Services – 2.3% | |
| | 51,999 | | | ASGN, Inc.* | | | 2,415,354 | |
| | 23,044 | | | Barrett Business Services, Inc. | | | 1,127,312 | |
| | 77,189 | | | Exponent, Inc. | | | 5,428,702 | |
| | 35,324 | | | Huron Consulting Group, Inc.* | | | 1,979,557 | |
| | 10,142 | | | ICF International, Inc. | | | 745,843 | |
| | 49,248 | | | Insperity, Inc. | | | 2,349,622 | |
| | 123,397 | | | Kforce, Inc. | | | 3,695,740 | |
| | 100,175 | | | TriNet Group, Inc.* | | | 4,905,570 | |
| | | | | | | | |
| | | | | | | 22,647,700 | |
| | |
| Real Estate Management & Development – 0.3% | |
| | 123,903 | | | Kennedy-Wilson Holdings, Inc. | | | 1,753,227 | |
| | 7,697 | | | Marcus & Millichap, Inc.* | | | 223,598 | |
| | 106,226 | | | Newmark Group, Inc., Class A | | | 412,157 | |
| | 29,883 | | | Redfin Corp.* | | | 631,428 | |
| | | | | | | | |
| | | | | | | 3,020,410 | |
| | |
| Road & Rail – 0.3% | |
| | 97,756 | | | Marten Transport Ltd. | | | 2,191,689 | |
| | 3,973 | | | Saia, Inc.* | | | 367,582 | |
| | | | | | | | |
| | | | | | | 2,559,271 | |
| | |
|
| Common Stocks – (continued) | |
| Semiconductors & Semiconductor Equipment – 4.2% | |
| | 103,758 | | | Ambarella, Inc.* | | | 5,455,596 | |
| | 21,333 | | | Amkor Technology, Inc.* | | | 210,770 | |
| | 72,179 | | | Enphase Energy, Inc.* | | | 3,380,143 | |
| | 130,689 | | | FormFactor, Inc.* | | | 3,045,054 | |
| | 95,704 | | | Inphi Corp.* | | | 9,239,264 | |
| | 270,510 | | | Lattice Semiconductor Corp.* | | | 6,089,180 | |
| | 73,521 | | | MaxLinear, Inc.* | | | 1,212,361 | |
| | 79,364 | | | Power Integrations, Inc. | | | 8,122,905 | |
| | 28,333 | | | Rambus, Inc.* | | | 355,013 | |
| | 39,834 | | | Silicon Laboratories, Inc.* | | | 3,872,661 | |
| | | | | | | | |
| | | | | | | 40,982,947 | |
| | |
| Software – 7.6% | |
| | 9,282 | | | Agilysys, Inc.* | | | 181,834 | |
| | 52,965 | | | American Software, Inc., Class A | | | 872,863 | |
| | 12,289 | | | Appian Corp.* | | | 561,239 | |
| | 12,166 | | | Blackbaud, Inc. | | | 672,293 | |
| | 106,976 | | | Blackline, Inc.* | | | 6,497,722 | |
| | 59,042 | | | Bottomline Technologies DE, Inc.* | | | 2,457,918 | |
| | 70,616 | | | Box, Inc., Class A* | | | 1,139,742 | |
| | 114,158 | | | Cornerstone OnDemand, Inc.* | | | 3,831,142 | |
| | 304,903 | | | Digital Turbine, Inc.* | | | 1,786,732 | |
| | 36,379 | | | Domo, Inc., Class B* | | | 707,572 | |
| | 54,039 | | | Everbridge, Inc.* | | | 6,018,864 | |
| | 97,971 | | | Five9, Inc.* | | | 9,078,973 | |
| | 43,125 | | | MicroStrategy, Inc., Class A* | | | 5,447,981 | |
| | 280,618 | | | MobileIron, Inc.* | | | 1,428,346 | |
| | 23,719 | | | Model N, Inc.* | | | 684,530 | |
| | 10,809 | | | OneSpan, Inc.* | | | 181,591 | |
| | 42,709 | | | PROS Holdings, Inc.* | | | 1,468,763 | |
| | 84,076 | | | Qualys, Inc.* | | | 8,864,973 | |
| | 75,805 | | | Rapid7, Inc.* | | | 3,452,918 | |
| | 7,365 | | | ShotSpotter, Inc.* | | | 253,135 | |
| | 146,659 | | | SPS Commerce, Inc.* | | | 8,141,041 | |
| | 368,270 | | | SVMK, Inc.* | | | 5,781,839 | |
| | 139,034 | | | Telenav, Inc.* | | | 649,289 | |
| | 15,674 | | | Varonis Systems, Inc.* | | | 1,050,942 | |
| | 58,300 | | | Verint Systems, Inc.* | | | 2,491,742 | |
| | 46,604 | | | VirnetX Holding Corp.* | | | 259,118 | |
| | | | | | | | |
| | | | | | | 73,963,102 | |
| | |
| Specialty Retail – 2.3% | |
| | 40,498 | | | America’s Car-Mart, Inc.* | | | 2,670,843 | |
| | 77,820 | | | Asbury Automotive Group, Inc.* | | | 5,252,850 | |
| | 40,282 | | | Boot Barn Holdings, Inc.* | | | 743,606 | |
| | 94,981 | | | Hudson Ltd., Class A* | | | 465,407 | |
| | 11,658 | | | Lithia Motors, Inc., Class A | | | 1,288,909 | |
| | 55,963 | | | Murphy USA, Inc.* | | | 5,976,848 | |
| | 144,152 | | | National Vision Holdings, Inc.* | | | 3,820,028 | |
| | 14,421 | | | Sleep Number Corp.* | | | 431,188 | |
| | 58,623 | | | Sonic Automotive, Inc., Class A | | | 1,256,291 | |
| | 64,377 | | | Sportsman’s Warehouse Holdings, Inc.* | | | 460,939 | |
| | | | | | | | |
| | | | | | | 22,366,909 | |
| | |
| Textiles, Apparel & Luxury Goods – 1.0% | |
| | 103,957 | | | Crocs, Inc.* | | | 2,520,957 | |
| | |
| | |
| The accompanying notes are an integral part of these financial statements. | | 31 |
GOLDMAN SACHS SMALL CAP GROWTH INSIGHTS FUND
Schedule of Investments(continued)
April 30, 2020 (Unaudited)
| | | | | | | | |
| Shares | | | Description | | Value | |
|
| Common Stocks – (continued) | |
| Textiles, Apparel & Luxury Goods – (continued) | |
| | 26,723 | | | Deckers Outdoor Corp.* | | $ | 3,975,314 | |
| | 17,849 | | | Kontoor Brands, Inc. | | | 346,449 | |
| | 8,140 | | | Steven Madden Ltd. | | | 204,070 | |
| | 149,815 | | | Wolverine World Wide, Inc. | | | 3,069,709 | |
| | | | | | | | |
| | | | | | | 10,116,499 | |
| | |
| Thrifts & Mortgage Finance – 0.5% | |
| | 20,932 | | | Essent Group Ltd. | | | 571,862 | |
| | 54,741 | | | Meridian Bancorp, Inc. | | | 644,849 | |
| | 6,333 | | | Meta Financial Group, Inc. | | | 116,654 | |
| | 45,504 | | | PennyMac Financial Services, Inc. | | | 1,372,856 | |
| | 46,610 | | | Walker & Dunlop, Inc. | | | 1,791,222 | |
| | | | | �� | | | |
| | | | | | | 4,497,443 | |
| | |
| Trading Companies & Distributors – 0.7% | |
| | 165,915 | | | Foundation Building Materials, Inc.* | | | 1,941,206 | |
| | 76,940 | | | GMS, Inc.* | | | 1,414,157 | |
| | 94,491 | | | H&E Equipment Services, Inc. | | | 1,536,424 | |
| | 233,831 | | | MRC Global, Inc.* | | | 1,253,334 | |
| | 9,408 | | | SiteOne Landscape Supply, Inc.* | | | 833,831 | |
| | | | | | | | |
| | | | | | | 6,978,952 | |
| | |
| Water Utilities – 0.1% | |
| | 12,558 | | | American States Water Co. | | | 996,728 | |
| | |
| Wireless Telecommunication Services – 0.0% | |
| | 7,714 | | | Shenandoah Telecommunications Co. | | | 412,776 | |
| | |
| TOTAL INVESTMENTS BEFORE SECURITIES LENDING
REINVESTMENT VEHICLE |
|
| | (Cost $1,008,457,248) | | $ | 961,782,244 | |
| | |
| Shares | | | Dividend Rate | | Value | |
|
| Securities Lending Reinvestment Vehicle – 0.8%(b) | |
| Goldman Sachs Financial Square Government Fund –
Institutional Shares |
|
| | 7,572,066 | | | 0.233% | | $ | 7,572,066 | |
| | (Cost $7,572,066) | |
| | |
| | TOTAL INVESTMENTS – 99.6% | |
| | (Cost $1,016,029,314) | | $ | 969,354,310 | |
| | |
| OTHER ASSETS IN EXCESS OF
LIABILITIES – 0.4% | | | 4,153,746 | |
| | |
| | NET ASSETS – 100.0% | | $ | 973,508,056 | |
| | |
| | |
|
| The percentage shown for each investment category reflects the value of investments in that category as a percentage of net assets. |
| |
* | | Non-income producing security. |
| |
(a) | | All or a portion of security is on loan. |
| |
(b) | | Represents an affiliated issuer. |
| | |
|
Investment Abbreviations: |
PLC | | —Public Limited Company |
REIT | | —Real Estate Investment Trust |
|
|
| ADDITIONAL INVESTMENT INFORMATION |
FUTURES CONTRACTS — At April 30, 2020, the Fund had the following futures contracts:
| | | | | | | | | | | | | | |
| Description | | Number of
Contracts | | | Expiration
Date | | Notional
Amount | | | Unrealized
Appreciation/
(Depreciation) | |
E-mini Russell 2000 Index | | | 97 | | | 06/19/20 | | $ | 5,463,424 | | | $ | 874,071 | |
| | |
| 32 | | The accompanying notes are an integral part of these financial statements. |
GOLDMAN SACHS SMALL CAP VALUE INSIGHTS FUND
Schedule of Investments
April 30, 2020 (Unaudited)
| | | | | | | | |
| Shares | | | Description | | Value | |
|
| Common Stocks – 97.4% | |
| Aerospace & Defense – 0.8% | |
| | 93,359 | | | Aerojet Rocketdyne Holdings, Inc.* | | $ | 3,840,789 | |
| | 101,241 | | | Maxar Technologies, Inc. | | | 1,276,649 | |
| | | | | | | | |
| | | | | | | 5,117,438 | |
| | |
| Air Freight & Logistics – 0.4% | |
| | 93,775 | | | Echo Global Logistics, Inc.* | | | 1,643,876 | |
| | 21,080 | | | Hub Group, Inc., Class A* | | | 1,014,159 | |
| | 44,769 | | | Radiant Logistics, Inc.* | | | 191,611 | |
| | | | | | | | |
| | | | | | | 2,849,646 | |
| | |
| Airlines – 0.3% | |
| | 63,176 | | | SkyWest, Inc. | | | 1,955,297 | |
| | |
| Auto Components – 0.7% | |
| | 35,715 | | | Adient PLC* | | | 535,011 | |
| | 20,891 | | | American Axle & Manufacturing Holdings, Inc.* | | | 90,249 | |
| | 56,502 | | | Dana, Inc. | | | 649,773 | |
| | 21,749 | | | Motorcar Parts of America, Inc.* | | | 309,488 | |
| | 28,574 | | | Standard Motor Products, Inc. | | | 1,162,676 | |
| | 27,056 | | | Visteon Corp.* | | | 1,631,477 | |
| | | | | | | | |
| | | | | | | 4,378,674 | |
| | |
| Banks – 15.8% | |
| | 68,547 | | | 1st Source Corp. | | | 2,380,637 | |
| | 93,716 | | | Amalgamated Bank, Class A | | | 1,002,761 | |
| | 29,126 | | | Ameris Bancorp | | | 740,674 | |
| | 89,633 | | | Atlantic Capital Bancshares, Inc.* | | | 1,124,894 | |
| | 72,422 | | | Atlantic Union Bankshares Corp. | | | 1,728,713 | |
| | 15,259 | | | BancFirst Corp. | | | 587,624 | |
| | 248,717 | | | Bancorp, Inc. (The)* | | | 1,733,557 | |
| | 28,852 | | | BancorpSouth Bank | | | 631,570 | |
| | 17,294 | | | Bank of Marin Bancorp | | | 570,010 | |
| | 20,711 | | | Bank of NT Butterfield & Son Ltd. (The) (Bermuda) | | | 455,849 | |
| | 15,300 | | | Banner Corp. | | | 587,979 | |
| | 9,857 | | | Baycom Corp.* | | | 121,537 | |
| | 11,933 | | | Berkshire Hills Bancorp, Inc. | | | 203,338 | |
| | 159,653 | | | Boston Private Financial Holdings, Inc. | | | 1,213,363 | |
| | 20,045 | | | Bridge Bancorp, Inc. | | | 414,731 | |
| | 524,362 | | | Cadence BanCorp | | | 3,471,276 | |
| | 25,543 | | | Capital City Bank Group, Inc. | | | 562,968 | |
| | 120,530 | | | Cathay General Bancorp | | | 3,365,198 | |
| | 139,089 | | | Central Pacific Financial Corp. | | | 2,432,667 | |
| | 8,146 | | | CNB Financial Corp. | | | 144,510 | |
| | 117,369 | | | Columbia Banking System, Inc. | | | 3,167,789 | |
| | 12,180 | | | Community Bank System, Inc. | | | 761,128 | |
| | 276,029 | | | CVB Financial Corp. | | | 5,737,263 | |
| | 27,578 | | | Financial Institutions, Inc. | | | 533,634 | |
| | 536,826 | | | First BanCorp. | | | 3,129,696 | |
| | 90,484 | | | First Bancorp/Southern Pines NC | | | 2,405,970 | |
| | 13,431 | | | First Bancshares, Inc. (The) | | | 267,546 | |
| | 259,521 | | | First Commonwealth Financial Corp. | | | 2,470,640 | |
| | 6,567 | | | First Community Bankshares, Inc. | | | 154,784 | |
| | 31,792 | | | First Financial Bankshares, Inc. | | | 885,407 | |
| | 27,509 | | | First Financial Corp. | | | 977,120 | |
| | |
|
| Common Stocks – (continued) | |
| Banks – (continued) | |
| | 203,322 | | | First Foundation, Inc. | | | 2,797,711 | |
| | 25,551 | | | First Internet Bancorp | | | 401,151 | |
| | 33,089 | | | First Interstate BancSystem, Inc., Class A | | | 1,118,408 | |
| | 20,465 | | | Glacier Bancorp, Inc. | | | 779,307 | |
| | 78,256 | | | Hancock Whitney Corp. | | | 1,636,333 | |
| | 89,980 | | | Hanmi Financial Corp. | | | 1,086,059 | |
| | 14,237 | | | HBT Financial, Inc. | | | 165,861 | |
| | 103,558 | | | Heartland Financial USA, Inc. | | | 3,517,865 | |
| | 39,986 | | | Heritage Financial Corp. | | | 801,719 | |
| | 119,745 | | | Hilltop Holdings, Inc. | | | 2,311,078 | |
| | 18,219 | | | Home BancShares, Inc. | | | 279,297 | |
| | 153,040 | | | Hope Bancorp, Inc. | | | 1,522,748 | |
| | 71,158 | | | Horizon Bancorp, Inc. | | | 809,778 | |
| | 55,402 | | | IBERIABANK Corp. | | | 2,296,967 | |
| | 62,244 | | | Independent Bank Corp. | | | 914,364 | |
| | 115,730 | | | Independent Bank Group, Inc. | | | 3,507,776 | |
| | 146,477 | | | International Bancshares Corp. | | | 4,246,368 | |
| | 85,913 | | | Investors Bancorp, Inc. | | | 799,850 | |
| | 94,856 | | | Lakeland Bancorp, Inc. | | | 1,061,439 | |
| | 24,949 | | | Mercantile Bank Corp. | | | 588,796 | |
| | 11,306 | | | Metropolitan Bank Holding Corp.* | | | 283,668 | |
| | 8,672 | | | MidWestOne Financial Group, Inc. | | | 180,985 | |
| | 77,877 | | | National Bank Holdings Corp., Class A | | | 2,069,971 | |
| | 4,355 | | | NBT Bancorp, Inc. | | | 144,281 | |
| | 12,115 | | | Northeast Bank | | | 202,926 | |
| | 7,059 | | | Northrim BanCorp, Inc. | | | 165,534 | |
| | 13,944 | | | OFG Bancorp | | | 175,416 | |
| | 49,023 | | | Old Second Bancorp, Inc. | | | 403,459 | |
| | 53,510 | | | Pacific Premier Bancorp, Inc. | | | 1,142,438 | |
| | 25,798 | | | Peapack-Gladstone Financial Corp. | | | 486,808 | |
| | 52,444 | | | Preferred Bank | | | 2,000,739 | |
| | 12,405 | | | QCR Holdings, Inc. | | | 381,826 | |
| | 7,938 | | | Republic Bancorp, Inc., Class A | | | 264,574 | |
| | 111,043 | | | Seacoast Banking Corp. of Florida* | | | 2,495,136 | |
| | 39,515 | | | Sierra Bancorp | | | 802,155 | |
| | 17,046 | | | Simmons First National Corp., Class A | | | 318,760 | |
| | 3,408 | | | South State Corp. | | | 197,119 | |
| | 74,535 | | | Southern National Bancorp of Virginia, Inc. | | | 750,567 | |
| | 127,714 | | | TriCo Bancshares | | | 3,846,746 | |
| | 100,964 | | | TriState Capital Holdings, Inc.* | | | 1,435,708 | |
| | 65,172 | | | Trustmark Corp. | | | 1,734,227 | |
| | 83,252 | | | UMB Financial Corp. | | | 4,232,532 | |
| | 334,024 | | | Valley National Bancorp | | | 2,792,441 | |
| | 43,801 | | | Westamerica Bancorporation | | | 2,759,463 | |
| | | | | | | | |
| | | | | | | 103,875,187 | |
| | |
| Beverages – 0.1% | |
| | 1,688 | | | Coca-Cola Consolidated, Inc. | | | 397,473 | |
| | |
| Biotechnology – 2.8% | |
| | 57,460 | | | ACADIA Pharmaceuticals, Inc.* | | | 2,775,893 | |
| | 9,790 | | | Acceleron Pharma, Inc.* | | | 886,289 | |
| | 43,360 | | | Agenus, Inc.* | | | 115,554 | |
| | 8,273 | | | Akero Therapeutics, Inc.* | | | 168,769 | |
| | |
| | |
| The accompanying notes are an integral part of these financial statements. | | 33 |
GOLDMAN SACHS SMALL CAP VALUE INSIGHTS FUND
Schedule of Investments(continued)
April 30, 2020 (Unaudited)
| | | | | | | | |
| Shares | | | Description | | Value | |
|
| Common Stocks – (continued) | |
| Biotechnology – (continued) | |
| | 25,761 | | | Allogene Therapeutics, Inc.* | | $ | 744,493 | |
| | 33,847 | | | Anika Therapeutics, Inc.* | | | 1,124,736 | |
| | 2,770 | | | Aprea Therapeutics, Inc. (Sweden)* | | | 88,058 | |
| | 36,448 | | | Arcus Biosciences, Inc.* | | | 962,592 | |
| | 119,888 | | | Ardelyx, Inc.* | | | 788,863 | |
| | 37,221 | | | Arena Pharmaceuticals, Inc.* | | | 1,822,712 | |
| | 12,548 | | | Atara Biotherapeutics, Inc.* | | | 104,023 | |
| | 2,066 | | | Biohaven Pharmaceutical Holding Co. Ltd.* | | | 97,309 | |
| | 3,437 | | | Bridgebio Pharma, Inc.* | | | 104,932 | |
| | 104,038 | | | Catalyst Pharmaceuticals, Inc.* | | | 493,140 | |
| | 43,258 | | | Coherus Biosciences, Inc.* | | | 718,083 | |
| | 3,875 | | | Cortexyme, Inc.*(a) | | | 176,777 | |
| | 13,914 | | | Deciphera Pharmaceuticals, Inc.* | | | 806,734 | |
| | 11,167 | | | Enanta Pharmaceuticals, Inc.* | | | 517,814 | |
| | 3,783 | | | FibroGen, Inc.* | | | 139,555 | |
| | 18,383 | | | G1 Therapeutics, Inc.* | | | 241,369 | |
| | 1,668 | | | IGM Biosciences, Inc.* | | | 91,356 | |
| | 75,438 | | | ImmunoGen, Inc.* | | | 307,787 | |
| | 6,371 | | | Karyopharm Therapeutics, Inc.* | | | 140,481 | |
| | 19,771 | | | Kiniksa Pharmaceuticals Ltd., Class A* | | | 394,431 | |
| | 17,046 | | | Minerva Neurosciences, Inc.* | | | 152,903 | |
| | 4,449 | | | Mirati Therapeutics, Inc.* | | | 378,343 | |
| | 32,304 | | | Myriad Genetics, Inc.* | | | 499,420 | |
| | 21,052 | | | Novavax, Inc.*(a) | | | 381,673 | |
| | 5,792 | | | Oyster Point Pharma, Inc.* | | | 170,285 | |
| | 5,547 | | | Prevail Therapeutics, Inc.* | | | 80,154 | |
| | 48,501 | | | Prothena Corp. PLC (Ireland)* | | | 544,181 | |
| | 23,276 | | | REVOLUTION Medicines, Inc.* | | | 727,840 | |
| | 5,011 | | | Stoke Therapeutics, Inc.* | | | 105,381 | |
| | 21,195 | | | Turning Point Therapeutics, Inc.* | | | 1,091,754 | |
| | 7,480 | | | XBiotech, Inc.* | | | 118,334 | |
| | 17,489 | | | Xencor, Inc.* | | | 511,203 | |
| | | | | | | | |
| | | | | | | 18,573,221 | |
| | |
| Building Products – 1.7% | |
| | 18,234 | | | AAON, Inc. | | | 868,668 | |
| | 14,371 | | | Apogee Enterprises, Inc. | | | 293,743 | |
| | 32,684 | | | Caesarstone Ltd. | | | 320,630 | |
| | 74,661 | | | Gibraltar Industries, Inc.* | | | 3,456,804 | |
| | 58,848 | | | Griffon Corp. | | | 965,696 | |
| | 31,633 | | | JELD-WEN Holding, Inc.* | | | 401,739 | |
| | 9,293 | | | Patrick Industries, Inc. | | | 383,058 | |
| | 126,111 | | | Quanex Building Products Corp. | | | 1,572,604 | |
| | 22,316 | | | Simpson Manufacturing Co., Inc. | | | 1,608,984 | |
| | 30,411 | | | Universal Forest Products, Inc. | | | 1,250,500 | |
| | | | | | | | |
| | | | | | | 11,122,426 | |
| | |
| Capital Markets – 0.6% | |
| | 24,490 | | | Artisan Partners Asset Management, Inc., Class A | | | 720,986 | |
| | 46,042 | | | Donnelley Financial Solutions, Inc.* | | | 335,186 | |
| | 59,173 | | | Oppenheimer Holdings, Inc., Class A | | | 1,217,780 | |
| | 27,169 | | | PJT Partners, Inc., Class A | | | 1,321,500 | |
| | 3,058 | | | Virtus Investment Partners, Inc. | | | 248,524 | |
| | | | | | | | |
| | | | | | | 3,843,976 | |
| | |
|
| Common Stocks – (continued) | |
| Chemicals – 2.0% | |
| | 1,006 | | | Balchem Corp. | | | 89,775 | |
| | 194,974 | | | Ferro Corp.* | | | 1,943,891 | |
| | 23,510 | | | FutureFuel Corp. | | | 244,034 | |
| | 2,225 | | | Hawkins, Inc. | | | 83,282 | |
| | 8,056 | | | Ingevity Corp.* | | | 418,268 | |
| | 44,829 | | | Koppers Holdings, Inc.* | | | 706,505 | |
| | 26,651 | | | Kronos Worldwide, Inc. | | | 252,918 | |
| | 75,811 | | | Minerals Technologies, Inc. | | | 3,338,716 | |
| | 67,034 | | | Orion Engineered Carbons SA (Luxembourg) | | | 610,680 | |
| | 157,681 | | | PolyOne Corp. | | | 3,672,390 | |
| | 12,409 | | | Sensient Technologies Corp. | | | 593,026 | |
| | 66,426 | | | Trinseo SA | | | 1,358,412 | |
| | | | | | | | |
| | | | | | | 13,311,897 | |
| | |
| Commercial Services & Supplies – 1.3% | |
| | 67,621 | | | ACCO Brands Corp. | | | 500,396 | |
| | 14,021 | | | Brady Corp., Class A | | | 610,474 | |
| | 25,841 | | | Cimpress PLC (Ireland)*(a) | | | 1,880,966 | |
| | 16,435 | | | Ennis, Inc. | | | 305,855 | |
| | 79,546 | | | HNI Corp. | | | 1,936,150 | |
| | 54,582 | | | Kimball International, Inc., Class B | | | 669,721 | |
| | 12,174 | | | McGrath RentCorp | | | 664,092 | |
| | 4,138 | | | MSA Safety, Inc. | | | 465,649 | |
| | 299,774 | | | Pitney Bowes, Inc. | | | 1,058,202 | |
| | 34,066 | | | Steelcase, Inc., Class A | | | 373,023 | |
| | | | | | | | |
| | | | | | | 8,464,528 | |
| | |
| Communications Equipment – 2.5% | |
| | 58,487 | | | Applied Optoelectronics, Inc.*(a) | | | 626,981 | |
| | 53,820 | | | Comtech Telecommunications Corp. | | | 996,208 | |
| | 204,374 | | | Extreme Networks, Inc.* | | | 694,872 | |
| | 356,355 | | | Harmonic, Inc.* | | | 2,066,859 | |
| | 156,706 | | | Infinera Corp.* | | | 966,093 | |
| | 33,292 | | | Inseego Corp.* | | | 397,839 | |
| | 97,541 | | | Lumentum Holdings, Inc.* | | | 7,892,042 | |
| | 84,539 | | | NETGEAR, Inc.* | | | 2,027,245 | |
| | 9,660 | | | NetScout Systems, Inc.* | | | 255,797 | |
| | 12,225 | | | Viavi Solutions, Inc.* | | | 147,678 | |
| | | | | | | | |
| | | | | | | 16,071,614 | |
| | |
| Construction & Engineering – 0.7% | |
| | 35,994 | | | Aegion Corp.* | | | 577,704 | |
| | 37,623 | | | Arcosa, Inc. | | | 1,402,209 | |
| | 122,956 | | | Great Lakes Dredge & Dock Corp.* | | | 1,086,931 | |
| | 32,235 | | | MasTec, Inc.* | | | 1,157,237 | |
| | 45,992 | | | Tutor Perini Corp.* | | | 321,944 | |
| | 27,325 | | | WillScot Corp.* | | | 318,336 | |
| | | | | | | | |
| | | | | | | 4,864,361 | |
| | |
| Construction Materials – 0.6% | |
| | 249,576 | | | Summit Materials, Inc., Class A* | | | 3,771,093 | |
| | |
| Consumer Finance – 0.9% | |
| | 5,374 | | | Encore Capital Group, Inc.* | | | 139,616 | |
| | 97,983 | | | Enova International, Inc.* | | | 1,571,647 | |
| | |
| | |
| 34 | | The accompanying notes are an integral part of these financial statements. |
GOLDMAN SACHS SMALL CAP VALUE INSIGHTS FUND
| | | | | | | | |
| Shares | | | Description | | Value | |
|
| Common Stocks – (continued) | |
| Consumer Finance – (continued) | |
| | 59,264 | | | Nelnet, Inc., Class A | | $ | 2,853,562 | |
| | 43,708 | | | PRA Group, Inc.* | | | 1,212,460 | |
| | 11,603 | | | Regional Management Corp.* | | | 184,952 | |
| | | | | | | | |
| | | | | | | 5,962,237 | |
| | |
| Containers & Packaging – 0.0% | |
| | 4,815 | | | UFP Technologies, Inc.* | | | 207,045 | |
| | |
| Distributors – 0.3% | |
| | 63,952 | | | Core-Mark Holding Co, Inc. | | | 1,837,980 | |
| | |
| Diversified Consumer Services – 1.6% | |
| | 58,001 | | | American Public Education, Inc.* | | | 1,494,686 | |
| | 64,461 | | | Collectors Universe, Inc. | | | 1,416,208 | |
| | 99,632 | | | Houghton Mifflin Harcourt Co.* | | | 159,411 | |
| | 32,700 | | | K12, Inc.* | | | 742,617 | |
| | 318,387 | | | Laureate Education, Inc., Class A* | | | 3,015,125 | |
| | 21,562 | | | Perdoceo Education Corp.* | | | 280,306 | |
| | 10,185 | | | Strategic Education, Inc. | | | 1,622,471 | |
| | 72,357 | | | WW International, Inc.* | | | 1,845,827 | |
| | | | | | | | |
| | | | | | | 10,576,651 | |
| | |
| Diversified Financial Services – 0.3% | |
| | 170,202 | | | Banco Latinoamericano de Comercio Exterior SA, Class E (Panama) | | | 1,943,707 | |
| | 111,148 | | | On Deck Capital, Inc.* | | | 134,489 | |
| | | | | | | | |
| | | | | | | 2,078,196 | |
| | |
| Diversified Telecommunication Services – 1.1% | |
| | 39,879 | | | Cincinnati Bell, Inc.* | | | 584,227 | |
| | 36,761 | | | Cogent Communications Holdings, Inc. | | | 3,081,675 | |
| | 193,861 | | | Consolidated Communications Holdings, Inc.* | | | 1,215,508 | |
| | 28,396 | | | Iridium Communications, Inc.* | | | 639,052 | |
| | 395,614 | | | ORBCOMM, Inc.* | | | 1,044,421 | |
| | 111,952 | | | Vonage Holdings Corp.* | | | 935,919 | |
| | | | | | | | |
| | | | | | | 7,500,802 | |
| | |
| Electric Utilities – 1.1% | |
| | 33,763 | | | ALLETE, Inc. | | | 1,943,398 | |
| | 1,276 | | | MGE Energy, Inc. | | | 82,506 | |
| | 6,806 | | | PNM Resources, Inc. | | | 275,575 | |
| | 97,611 | | | Portland General Electric Co. | | | 4,567,219 | |
| | | | | | | | |
| | | | | | | 6,868,698 | |
| | |
| Electrical Equipment – 0.5% | |
| | 28,420 | | | Atkore International Group, Inc.* | | | 691,743 | |
| | 87,353 | | | Bloom Energy Corp., Class A* | | | 669,997 | |
| | 25,604 | | | Encore Wire Corp. | | | 1,172,151 | |
| | 37,708 | | | Powell Industries, Inc. | | | 956,652 | |
| | | | | | | | |
| | | | | | | 3,490,543 | |
| | |
| Electronic Equipment, Instruments & Components – 3.8% | |
| | 96,809 | | | Arlo Technologies, Inc.* | | | 265,257 | |
| | 92,966 | | | Belden, Inc. | | | 3,178,508 | |
| | 77,700 | | | Benchmark Electronics, Inc. | | | 1,605,282 | |
| | 22,503 | | | CTS Corp. | | | 521,169 | |
| | |
|
| Common Stocks – (continued) | |
| Electronic Equipment, Instruments & Components – (continued) | |
| | 9,790 | | | Fabrinet (Thailand)* | | | 614,323 | |
| | 43,037 | | | Itron, Inc.* | | | 3,004,843 | |
| | 136,430 | | | Knowles Corp.* | | | 2,121,486 | |
| | 57,262 | | | Methode Electronics, Inc. | | | 1,719,005 | |
| | 44,629 | | | Plexus Corp.* | | | 2,797,792 | |
| | 102,578 | | | Sanmina Corp.* | | | 2,844,488 | |
| | 14,702 | | | ScanSource, Inc.* | | | 381,076 | |
| | 4,914 | | | Tech Data Corp.* | | | 691,105 | |
| | 182,313 | | | TTM Technologies, Inc.* | | | 2,113,008 | |
| | 121,190 | | | Vishay Intertechnology, Inc. | | | 2,010,542 | |
| | 44,179 | | | Vishay Precision Group, Inc.* | | | 1,021,418 | |
| | | | | | | | |
| | | | | | | 24,889,302 | |
| | |
| Energy Equipment & Services – 0.8% | |
| | 59,314 | | | Cactus, Inc., Class A | | | 1,054,603 | |
| | 18,216 | | | DMC Global, Inc. | | | 470,155 | |
| | 212,204 | | | Helix Energy Solutions Group, Inc.* | | | 538,998 | |
| | 90,954 | | | Matrix Service Co.* | | | 949,560 | |
| | 10,500 | | | Nabors Industries Ltd.(a) | | | 154,665 | |
| | 32,601 | | | Oceaneering International, Inc.* | | | 167,569 | |
| | 57,211 | | | SEACOR Holdings, Inc.* | | | 1,616,783 | |
| | 56,876 | | | Solaris Oilfield Infrastructure, Inc., Class A | | | 389,032 | |
| | 78,812 | | | US Silica Holdings, Inc. | | | 151,319 | |
| | | | | | | | |
| | | | | | | 5,492,684 | |
| | |
| Entertainment – 0.0% | |
| | 20,696 | | | Gaia, Inc.* | | | 188,127 | |
| | |
| Equity Real Estate Investment Trusts (REITs) – 10.6% | |
| | 59,484 | | | American Assets Trust, Inc. REIT | | | 1,684,587 | |
| | 22,384 | | | CareTrust REIT, Inc. REIT | | | 368,888 | |
| | 180,473 | | | Cedar Realty Trust, Inc. REIT | | | 189,497 | |
| | 175,863 | | | City Office REIT, Inc. REIT | | | 1,776,216 | |
| | 14,514 | | | Community Healthcare Trust, Inc. REIT | | | 539,921 | |
| | 26,878 | | | CorEnergy Infrastructure Trust, Inc. REIT | | | 326,299 | |
| | 1,297 | | | EastGroup Properties, Inc. REIT | | | 137,482 | |
| | 134,606 | | | Essential Properties Realty Trust, Inc. REIT | | | 1,977,362 | |
| | 167,442 | | | First Industrial Realty Trust, Inc. REIT | | | 6,324,284 | |
| | 33,670 | | | Franklin Street Properties Corp. REIT | | | 183,165 | |
| | 80,496 | | | Gladstone Commercial Corp. REIT | | | 1,271,837 | |
| | 14,692 | | | Global Medical REIT, Inc. REIT | | | 153,091 | |
| | 44,840 | | | Hannon Armstrong Sustainable Infrastructure Capital, Inc. REIT | | | 1,255,072 | |
| | 6,239 | | | Healthcare Realty Trust, Inc. REIT | | | 183,364 | |
| | 255,577 | | | Independence Realty Trust, Inc. REIT | | | 2,573,660 | |
| | 66,115 | | | Kite Realty Group Trust REIT | | | 676,357 | |
| | 341,796 | | | Lexington Realty Trust REIT | | | 3,571,768 | |
| | 19,685 | | | Monmouth Real Estate Investment Corp. REIT | | | 267,519 | |
| | 5,399 | | | National Health Investors, Inc. REIT | | | 297,269 | |
| | 28,320 | | | NexPoint Residential Trust, Inc. REIT | | | 851,582 | |
| | 78,012 | | | Office Properties Income Trust REIT | | | 2,137,529 | |
| | 182,363 | | | Pebblebrook Hotel Trust REIT | | | 2,159,178 | |
| | |
| | |
| The accompanying notes are an integral part of these financial statements. | | 35 |
GOLDMAN SACHS SMALL CAP VALUE INSIGHTS FUND
Schedule of Investments(continued)
April 30, 2020 (Unaudited)
| | | | | | | | |
| Shares | | | Description | | Value | |
|
| Common Stocks – (continued) | |
| Equity Real Estate Investment Trusts (REITs) – (continued) | |
| | 292,124 | | | Physicians Realty Trust REIT | | $ | 4,504,552 | |
| | 119,584 | | | Piedmont Office Realty Trust, Inc., Class A REIT | | | 2,074,782 | |
| | 25,647 | | | PotlatchDeltic Corp. REIT | | | 900,466 | |
| | 2,735 | | | PS Business Parks, Inc. REIT | | | 353,061 | |
| | 48,561 | | | QTS Realty Trust, Inc., Class A REIT | | | 3,036,519 | |
| | 212,925 | | | Retail Opportunity Investments Corp. REIT | | | 2,066,437 | |
| | 105,953 | | | Retail Value, Inc. REIT | | | 1,533,140 | |
| | 111,834 | | | Rexford Industrial Realty, Inc. REIT | | | 4,553,881 | |
| | 52,799 | | | RLJ Lodging Trust REIT | | | 490,503 | |
| | 116,526 | | | RPT Realty REIT | | | 794,707 | |
| | 28,700 | | | Ryman Hospitality Properties, Inc. REIT | | | 1,014,258 | |
| | 347,357 | | | Sabra Health Care REIT, Inc. REIT | | | 4,453,117 | |
| | 9,684 | | | Saul Centers, Inc. REIT | | | 315,892 | |
| | 184,453 | | | STAG Industrial, Inc. REIT | | | 4,841,891 | |
| | 107,909 | | | Terreno Realty Corp. REIT | | | 5,915,571 | |
| | 10,616 | | | UMH Properties, Inc. REIT | | | 137,902 | |
| | 11,055 | | | Universal Health Realty Income Trust REIT | | | 1,182,443 | |
| | 147,412 | | | Urban Edge Properties REIT | | | 1,695,238 | |
| | 51,155 | | | Whitestone REIT | | | 346,831 | |
| | 52,601 | | | Xenia Hotels & Resorts, Inc. REIT | | | 510,230 | |
| | | | | | | | |
| | | | | | | 69,627,348 | |
| | |
| Food & Staples Retailing – 0.7% | |
| | 55,896 | | | Ingles Markets, Inc., Class A | | | 2,282,233 | |
| | 22,005 | | | Performance Food Group Co.* | | | 645,847 | |
| | 26,034 | | | Weis Markets, Inc. | | | 1,302,481 | |
| | | | | | | | |
| | | | | | | 4,230,561 | |
| | |
| Food Products – 1.8% | |
| | 122,833 | | | B&G Foods, Inc.(a) | | | 2,385,417 | |
| | 2,289 | | | Calavo Growers, Inc. | | | 132,762 | |
| | 161,810 | | | Darling Ingredients, Inc.* | | | 3,331,668 | |
| | 30,964 | | | Fresh Del Monte Produce, Inc. | | | 882,784 | |
| | 24,124 | | | J&J Snack Foods Corp. | | | 3,064,472 | |
| | 4,991 | | | John B. Sanfilippo & Son, Inc. | | | 409,911 | |
| | 40,058 | | | Tootsie Roll Industries, Inc. | | | 1,407,237 | |
| | | | | | | | |
| | | | | | | 11,614,251 | |
| | |
| Gas Utilities – 0.9% | |
| | 33,188 | | | New Jersey Resources Corp. | | | 1,121,091 | |
| | 6,632 | | | Northwest Natural Holding Co. | | | 431,743 | |
| | 3,034 | | | ONE Gas, Inc. | | | 241,840 | |
| | 49,123 | | | Southwest Gas Holdings, Inc. | | | 3,723,523 | |
| | 7,437 | | | Spire, Inc. | | | 542,604 | |
| | | | | | | | |
| | | | | | | 6,060,801 | |
| | |
| Health Care Equipment & Supplies – 0.6% | |
| | 5,870 | | | CryoLife, Inc.* | | | 131,077 | |
| | 22,435 | | | GenMark Diagnostics, Inc.* | | | 280,662 | |
| | 5,071 | | | Globus Medical, Inc., Class A* | | | 240,670 | |
| | 15,599 | | | Haemonetics Corp.* | | | 1,774,854 | |
| | 31,005 | | | Invacare Corp. | | | 233,157 | |
| | 1,467 | | | LivaNova PLC* | | | 77,927 | |
| | |
|
| Common Stocks – (continued) | |
| Health Care Equipment & Supplies – (continued) | |
| | 20,700 | | | Natus Medical, Inc.* | | | 517,293 | |
| | 5,193 | | | Quidel Corp.* | | | 721,827 | |
| | | | | | | | |
| | | | | | | 3,977,467 | |
| | |
| Health Care Providers & Services – 0.4% | |
| | 71,735 | | | Community Health Systems, Inc.* | | | 217,357 | |
| | 25,384 | | | Magellan Health, Inc.* | | | 1,541,570 | |
| | 7,791 | | | National HealthCare Corp. | | | 532,671 | |
| | 24,283 | | | Tenet Healthcare Corp.* | | | 490,031 | |
| | | | | | | | |
| | | | | | | 2,781,629 | |
| | |
| Health Care Technology – 0.6% | |
| | 14,899 | | | Computer Programs and Systems, Inc. | | | 358,023 | |
| | 65,373 | | | Inovalon Holdings, Inc., Class A* | | | 1,144,028 | |
| | 8,718 | | | Livongo Health, Inc.*(a) | | | 348,807 | |
| | 22,169 | | | Schrodinger, Inc.* | | | 1,028,642 | |
| | 5,386 | | | Simulations Plus, Inc. | | | 204,937 | |
| | 3,053 | | | Teladoc Health, Inc.* | | | 502,493 | |
| | 13,396 | | | Vocera Communications, Inc.* | | | 253,988 | |
| | | | | | | | |
| | | | | | | 3,840,918 | |
| | |
| Hotels, Restaurants & Leisure – 1.3% | |
| | 134,648 | | | Denny’s Corp.* | | | 1,517,483 | |
| | 69,158 | | | Everi Holdings, Inc.* | | | 342,332 | |
| | 10,837 | | | Jack in the Box, Inc. | | | 653,471 | |
| | 32,362 | | | Marriott Vacations Worldwide Corp. | | | 2,686,046 | |
| | 103,306 | | | Red Rock Resorts, Inc., Class A | | | 1,132,234 | |
| | 5,416 | | | Texas Roadhouse, Inc. | | | 255,040 | |
| | 18,482 | | | Wingstop, Inc. | | | 2,167,384 | |
| | | | | | | | |
| | | | | | | 8,753,990 | |
| | |
| Household Durables – 1.9% | |
| | 14,594 | | | Century Communities, Inc.* | | | 312,604 | |
| | 70,819 | | | GoPro, Inc., Class A*(a) | | | 249,283 | |
| | 29,485 | | | KB Home | | | 773,686 | |
| | 94,443 | | | M/I Homes, Inc.* | | | 2,404,519 | |
| | 35,927 | | | MDC Holdings, Inc. | | | 1,050,865 | |
| | 6,538 | | | Meritage Homes Corp.* | | | 343,637 | |
| | 38,259 | | | Sonos, Inc.* | | | 391,007 | |
| | 88,780 | | | Taylor Morrison Home Corp.* | | | 1,291,749 | |
| | 11,860 | | | TopBuild Corp.* | | | 1,105,233 | |
| | 273,427 | | | TRI Pointe Group, Inc.* | | | 3,138,942 | |
| | 38,960 | | | Universal Electronics, Inc.* | | | 1,608,269 | |
| | | | | | | | |
| | | | | | | 12,669,794 | |
| | |
| Household Products – 0.2% | |
| | 39,530 | | | Central Garden & Pet Co., Class A* | | | 1,202,107 | |
| | |
| Insurance – 3.9% | |
| | 210,540 | | | American Equity Investment Life Holding Co. | | | 4,425,551 | |
| | 38,397 | | | AMERISAFE, Inc. | | | 2,444,737 | |
| | 51,479 | | | Argo Group International Holdings Ltd. | | | 1,820,297 | |
| | 48,448 | | | CNO Financial Group, Inc. | | | 681,179 | |
| | 986 | | | eHealth, Inc.* | | | 105,206 | |
| | 3,851 | | | Enstar Group Ltd. (Bermuda)* | | | 556,932 | |
| | |
| | |
| 36 | | The accompanying notes are an integral part of these financial statements. |
GOLDMAN SACHS SMALL CAP VALUE INSIGHTS FUND
| | | | | | | | |
| Shares | | | Description | | Value | |
|
| Common Stocks – (continued) | |
| Insurance – (continued) | |
| | 22,196 | | | FBL Financial Group, Inc., Class A | | $ | 867,420 | |
| | 550,598 | | | Genworth Financial, Inc., Class A* | | | 1,998,671 | |
| | 39,652 | | | Goosehead Insurance, Inc., Class A* | | | 2,226,063 | |
| | 19,493 | | | HCI Group, Inc. | | | 811,883 | |
| | 1,019 | | | Investors Title Co. | | | 136,444 | |
| | 239,269 | | | MBIA, Inc.* | | | 1,947,650 | |
| | 4,694 | | | National Western Life Group, Inc., Class A | | | 904,675 | |
| | 20,616 | | | Selective Insurance Group, Inc. | | | 1,033,480 | |
| | 92,092 | | | Stewart Information Services Corp. | | | 2,934,051 | |
| | 55,945 | | | Third Point Reinsurance Ltd. (Bermuda)* | | | 416,231 | |
| | 69,705 | | | Trupanion, Inc.*(a) | | | 2,084,876 | |
| | | | | | | | |
| | | | | | | 25,395,346 | |
| | |
| Interactive Media & Services – 0.2% | |
| | 166,989 | | | Cars.com, Inc.* | | | 865,003 | |
| | 13,307 | | | EverQuote, Inc., Class A* | | | 518,574 | |
| | 30,613 | | | TrueCar, Inc.* | | | 78,369 | |
| | | | | | | | |
| | | | | | | 1,461,946 | |
| | |
| Internet & Direct Marketing Retail – 0.7% | |
| | 42,859 | | | PetMed Express, Inc. | | | 1,695,930 | |
| | 128,976 | | | Quotient Technology, Inc.* | | | 926,048 | |
| | 201,251 | | | Rubicon Project, Inc. (The)* | | | 1,442,970 | |
| | 8,610 | | | Shutterstock, Inc. | | | 327,180 | |
| | 2,537 | | | Stamps.com, Inc.* | | | 401,531 | |
| | | | | | | | |
| | | | | | | 4,793,659 | |
| | |
| IT Services – 1.7% | |
| | 230,049 | | | Conduent, Inc.* | | | 579,723 | |
| | 60,361 | | | Hackett Group, Inc. (The) | | | 895,154 | |
| | 80,683 | | | Limelight Networks, Inc.* | | | 409,063 | |
| | 11,010 | | | LiveRamp Holdings, Inc.* | | | 416,839 | |
| | 57,974 | | | Perficient, Inc.* | | | 2,019,234 | |
| | 263,220 | | | Perspecta, Inc. | | | 5,677,655 | |
| | 5,401 | | | Sykes Enterprises, Inc.* | | | 154,631 | |
| | 7,243 | | | TTEC Holdings, Inc. | | | 282,332 | |
| | 28,522 | | | Virtusa Corp.* | | | 941,226 | |
| | | | | | | | |
| | | | | | | 11,375,857 | |
| | |
| Leisure Products – 0.5% | |
| | 15,544 | | | Acushnet Holdings Corp. | | | 425,906 | |
| | 20,602 | | | Clarus Corp. | | | 220,029 | |
| | 2,662 | | | Johnson Outdoors, Inc., Class A | | | 181,974 | |
| | 57,165 | | | Vista Outdoor, Inc.* | | | 578,510 | |
| | 74,348 | | | YETI Holdings, Inc.* | | | 2,052,748 | |
| | | | | | | | |
| | | | | | | 3,459,167 | |
| | |
| Life Sciences Tools & Services – 0.3% | |
| | 14,521 | | | Medpace Holdings, Inc.* | | | 1,159,647 | |
| | 17,205 | | | Syneos Health, Inc.* | | | 959,867 | |
| | | | | | | | |
| | | | | | | 2,119,514 | |
| | |
| Machinery – 2.1% | |
| | 16,204 | | | Albany International Corp., Class A | | | 828,673 | |
| | 34,551 | | | Altra Industrial Motion Corp. | | | 964,318 | |
| | |
|
| Common Stocks – (continued) | |
| Machinery – (continued) | |
| | 41,845 | | | Barnes Group, Inc. | | | 1,606,011 | |
| | 36,094 | | | Columbus McKinnon Corp. | | | 977,425 | |
| | 12,507 | | | Douglas Dynamics, Inc. | | | 462,259 | |
| | 29,928 | | | Federal Signal Corp. | | | 805,961 | |
| | 8,288 | | | Franklin Electric Co., Inc. | | | 421,030 | |
| | 42,005 | | | Miller Industries, Inc. | | | 1,276,112 | |
| | 27,625 | | | Mueller Industries, Inc. | | | 715,487 | |
| | 20,418 | | | Mueller Water Products, Inc., Class A | | | 193,767 | |
| | 43,767 | | | Navistar International Corp.* | | | 1,040,342 | |
| | 2,773 | | | Proto Labs, Inc.* | | | 281,709 | |
| | 100,402 | | | Rexnord Corp. | | | 2,737,963 | |
| | 3,500 | | | SPX FLOW, Inc.* | | | 113,995 | |
| | 132,730 | | | Wabash National Corp. | | | 1,088,386 | |
| | | | | | | | |
| | | | | | | 13,513,438 | |
| | |
| Marine – 0.2% | |
| | 196,475 | | | Costamare, Inc. (Monaco) | | | 986,305 | |
| | |
| Media – 1.6% | |
| | 16,741 | | | Cardlytics, Inc.* | | | 752,508 | |
| | 147,443 | | | Liberty Latin America Ltd., Class A (Chile)* | | | 1,577,640 | |
| | 289,737 | | | Liberty Latin America Ltd., Class C (Chile)* | | | 2,995,881 | |
| | 149,738 | | | MSG Networks, Inc., Class A* | | | 1,778,887 | |
| | 72,820 | | | National CineMedia, Inc. | | | 240,306 | |
| | 92,379 | | | Scholastic Corp. | | | 2,685,458 | |
| | 124,726 | | | WideOpenWest, Inc.* | | | 738,378 | |
| | | | | | | | |
| | | | | | | 10,769,058 | |
| | |
| Metals & Mining – 1.9% | |
| | 102,052 | | | Allegheny Technologies, Inc.* | | | 766,410 | |
| | 66,124 | | | Carpenter Technology Corp. | | | 1,465,969 | |
| | 38,137 | | | Coeur Mining, Inc.* | | | 160,557 | |
| | 65,505 | | | Haynes International, Inc. | | | 1,447,660 | |
| | 615,702 | | | Hecla Mining Co. | | | 1,619,296 | |
| | 18,686 | | | Kaiser Aluminum Corp. | | | 1,349,690 | |
| | 56,112 | | | Materion Corp. | | | 2,903,235 | |
| | 34,472 | | | Novagold Resources, Inc. (Canada)* | | | 385,742 | |
| | 26,846 | | | Ryerson Holding Corp.* | | | 124,029 | |
| | 87,651 | | | Worthington Industries, Inc. | | | 2,317,492 | |
| | | | | | | | |
| | | | | | | 12,540,080 | |
| | |
| Mortgage Real Estate Investment Trusts (REITs) – 1.7% | |
| | 490,448 | | | Anworth Mortgage Asset Corp. REIT | | | 843,571 | |
| | 131,880 | | | Apollo Commercial Real Estate Finance, Inc. REIT | | | 1,074,822 | |
| | 167,597 | | | Arlington Asset Investment Corp., Class A REIT | | | 474,300 | |
| | 70,524 | | | ARMOUR Residential REIT, Inc. REIT | | | 623,432 | |
| | 73,584 | | | Blackstone Mortgage Trust, Inc., Class A REIT | | | 1,731,432 | |
| | 237,177 | | | Capstead Mortgage Corp. REIT | | | 1,230,949 | |
| | 43,414 | | | Colony Credit Real Estate, Inc. REIT | | | 208,821 | |
| | 40,085 | | | Granite Point Mortgage Trust, Inc. REIT | | | 199,623 | |
| | 86,152 | | | Great Ajax Corp. REIT | | | 749,522 | |
| | |
| | |
| The accompanying notes are an integral part of these financial statements. | | 37 |
GOLDMAN SACHS SMALL CAP VALUE INSIGHTS FUND
Schedule of Investments(continued)
April 30, 2020 (Unaudited)
| | | | | | | | |
| Shares | | | Description | | Value | |
|
| Common Stocks – (continued) | |
| Mortgage Real Estate Investment Trusts (REITs) – (continued) | |
| | 179,317 | | | Invesco Mortgage Capital, Inc. REIT | | $ | 545,124 | |
| | 167,498 | | | Ladder Capital Corp. REIT | | | 1,331,609 | |
| | 333,438 | | | New York Mortgage Trust, Inc. REIT | | | 726,895 | |
| | 35,000 | | | PennyMac Mortgage Investment Trust REIT | | | 364,000 | |
| | 90,321 | | | Redwood Trust, Inc. REIT | | | 370,316 | |
| | 118,789 | | | TPG RE Finance Trust, Inc. REIT | | | 913,487 | |
| | | | | | | | |
| | | | | | | 11,387,903 | |
| | |
| Multiline Retail – 0.2% | |
| | 56,913 | | | Big Lots, Inc. | | | 1,334,610 | |
| | |
| Multi-Utilities – 1.8% | |
| | 118,389 | | | Avista Corp. | | | 5,095,463 | |
| | 23,603 | | | Black Hills Corp. | | | 1,461,970 | |
| | 43,337 | | | NorthWestern Corp. | | | 2,500,111 | |
| | 51,060 | | | Unitil Corp. | | | 2,568,829 | |
| | | | | | | | |
| | | | | | | 11,626,373 | |
| | |
| Oil, Gas & Consumable Fuels – 3.8% | |
| | 140,346 | | | Ardmore Shipping Corp. (Ireland) | | | 923,477 | |
| | 100,730 | | | Brigham Minerals, Inc., Class A | | | 1,298,410 | |
| | 198,613 | | | Clean Energy Fuels Corp.* | | | 428,011 | |
| | 32,624 | | | CVR Energy, Inc. | | | 778,082 | |
| | 475,586 | | | DHT Holdings, Inc. | | | 3,452,754 | |
| | 102,851 | | | Dorian LPG Ltd.* | | | 976,056 | |
| | 107,867 | | | GasLog Ltd. (Monaco) | | | 498,346 | |
| | 20,905 | | | Green Plains, Inc. | | | 122,712 | |
| | 114,242 | | | International Seaways, Inc. | | | 2,764,656 | |
| | 158,776 | | | Matador Resources Co.*(a) | | | 1,117,783 | |
| | 290,835 | | | Nordic American Tankers Ltd.(a) | | | 1,750,827 | |
| | 167,313 | | | Oasis Petroleum, Inc.*(a) | | | 117,772 | |
| | 33,879 | | | Par Pacific Holdings, Inc.* | | | 329,304 | |
| | 121,868 | | | Renewable Energy Group, Inc.* | | | 3,023,545 | |
| | 31,024 | | | Scorpio Tankers, Inc. (Monaco)(a) | | | 679,115 | |
| | 24,627 | | | SFL Corp. Ltd. (Norway) | | | 278,039 | |
| | 229,406 | | | SM Energy Co.(a) | | | 929,094 | |
| | 87,499 | | | Teekay Corp. (Bermuda)* | | | 325,496 | |
| | 105,306 | | | Teekay Tankers Ltd., Class A (Bermuda)* | | | 2,138,765 | |
| | 121,835 | | | World Fuel Services Corp. | | | 3,045,875 | |
| | | | | | | | |
| | | | | | | 24,978,119 | |
| | |
| Paper & Forest Products – 1.1% | |
| | 84,905 | | | Boise Cascade Co. | | | 2,654,979 | |
| | 23,639 | | | Clearwater Paper Corp.* | | | 565,918 | |
| | 43,549 | | | Louisiana-Pacific Corp. | | | 870,980 | |
| | 145,582 | | | PH Glatfelter Co. | | | 2,125,497 | |
| | 21,081 | | | Schweitzer-Mauduit International, Inc. | | | 679,230 | |
| | | | | | | | |
| | | | | | | 6,896,604 | |
| | |
| Personal Products – 0.1% | |
| | 6,293 | | | Medifast, Inc. | | | 477,513 | |
| | |
| Pharmaceuticals – 1.2% | |
| | 13,321 | | | ANI Pharmaceuticals, Inc.* | | | 532,973 | |
| | 8,985 | | | Axsome Therapeutics, Inc.* | | | 853,845 | |
| | |
|
| Common Stocks – (continued) | |
| Pharmaceuticals – (continued) | |
| | 4,330 | | | Cara Therapeutics, Inc.* | | | 64,171 | |
| | 23,387 | | | Corcept Therapeutics, Inc.* | | | 296,080 | |
| | 187,978 | | | Innoviva, Inc.* | | | 2,665,528 | |
| | 10,705 | | | Intra-Cellular Therapies, Inc.* | | | 189,157 | |
| | 110,275 | | | Kala Pharmaceuticals, Inc.*(a) | | | 1,098,339 | |
| | 22,728 | | | NGM Biopharmaceuticals, Inc.* | | | 415,013 | |
| | 57,086 | | | Omeros Corp.*(a) | | | 948,769 | |
| | 12,600 | | | Phibro Animal Health Corp., Class A | | | 336,546 | |
| | 3,790 | | | Reata Pharmaceuticals, Inc., Class A* | | | 599,426 | |
| | | | | | | | |
| | | | | | | 7,999,847 | |
| | |
| Professional Services – 0.8% | |
| | 8,609 | | | ASGN, Inc.* | | | 399,888 | |
| | 7,436 | | | Exponent, Inc. | | | 522,974 | |
| | 13,915 | | | Franklin Covey Co.* | | | 288,736 | |
| | 3,446 | | | FTI Consulting, Inc.* | | | 438,883 | |
| | 43,474 | | | Huron Consulting Group, Inc.* | | | 2,436,283 | |
| | 1,377 | | | ICF International, Inc. | | | 101,265 | |
| | 4,000 | | | Insperity, Inc. | | | 190,840 | |
| | 71,980 | | | Resources Connection, Inc. | | | 783,142 | |
| | | | | | | | |
| | | | | | | 5,162,011 | |
| | |
| Real Estate Management & Development – 0.4% | |
| | 136,827 | | | Kennedy-Wilson Holdings, Inc. | | | 1,936,102 | |
| | 151,314 | | | Newmark Group, Inc., Class A | | | 587,098 | |
| | | | | | | | |
| | | | | | | 2,523,200 | |
| | |
| Road & Rail – 0.5% | |
| | 96,667 | | | Marten Transport Ltd. | | | 2,167,274 | |
| | 6,715 | | | Saia, Inc.* | | | 621,272 | |
| | 4,971 | | | Werner Enterprises, Inc. | | | 199,436 | |
| | | | | | | | |
| | | | | | | 2,987,982 | |
| | |
| Semiconductors & Semiconductor Equipment – 3.6% | |
| | 46,588 | | | Ambarella, Inc.* | | | 2,449,597 | |
| | 237,520 | | | Amkor Technology, Inc.* | | | 2,346,698 | |
| | 77,770 | | | Cirrus Logic, Inc.* | | | 5,879,412 | |
| | 12,772 | | | Cohu, Inc. | | | 211,121 | |
| | 136,855 | | | FormFactor, Inc.* | | | 3,188,721 | |
| | 17,003 | | | Inphi Corp.* | | | 1,641,470 | |
| | 32,938 | | | Power Integrations, Inc. | | | 3,371,204 | |
| | 165,685 | | | Rambus, Inc.* | | | 2,076,033 | |
| | 29,454 | | | Synaptics, Inc.* | | | 1,925,997 | |
| | 5,305 | | | Ultra Clean Holdings, Inc.* | | | 97,559 | |
| | 16,474 | | | Veeco Instruments, Inc.* | | | 180,061 | |
| | | | | | | | |
| | | | | | | 23,367,873 | |
| | |
| Software – 1.0% | |
| | 23,625 | | | Blackline, Inc.* | | | 1,434,982 | |
| | 7,735 | | | MicroStrategy, Inc., Class A* | | | 977,163 | |
| | 6,405 | | | OneSpan, Inc.* | | | 107,604 | |
| | 14,892 | | | Qualys, Inc.* | | | 1,570,212 | |
| | 2,610 | | | ShotSpotter, Inc.* | | | 89,706 | |
| | 15,869 | | | SPS Commerce, Inc.* | | | 880,888 | |
| | 57,977 | | | SVMK, Inc.* | | | 910,239 | |
| | 74,943 | | | Telenav, Inc.* | | | 349,984 | |
| | |
| | |
| 38 | | The accompanying notes are an integral part of these financial statements. |
GOLDMAN SACHS SMALL CAP VALUE INSIGHTS FUND
| | | | | | | | |
| Shares | | | Description | | Value | |
|
| Common Stocks – (continued) | |
| Software – (continued) | |
| | 19,984 | | | VirnetX Holding Corp.* | | $ | 111,111 | |
| | | | | | | | |
| | | | | | | 6,431,889 | |
| | |
| Specialty Retail – 3.3% | |
| | 6,129 | | | Aaron’s, Inc. | | | 195,576 | |
| | 32,316 | | | Asbury Automotive Group, Inc.* | | | 2,181,330 | |
| | 82,137 | | | Bed Bath & Beyond, Inc.(a) | | | 508,428 | |
| | 46,485 | | | Caleres, Inc. | | | 376,993 | |
| | 19,506 | | | Cato Corp. (The), Class A | | | 219,638 | |
| | 90,918 | | | GameStop Corp., Class A*(a) | | | 520,960 | |
| | 16,767 | | | Group 1 Automotive, Inc. | | | 948,845 | |
| | 43,344 | | | Hudson Ltd., Class A* | | | 212,386 | |
| | 15,111 | | | Lithia Motors, Inc., Class A | | | 1,670,672 | |
| | 4,858 | | | MarineMax, Inc.* | | | 70,004 | |
| | 51,090 | | | Murphy USA, Inc.* | | | 5,456,412 | |
| | 44,209 | | | National Vision Holdings, Inc.* | | | 1,171,539 | |
| | 826,336 | | | Office Depot, Inc. | | | 1,834,466 | |
| | 112,351 | | | Sally Beauty Holdings, Inc.* | | | 1,090,928 | |
| | 4,208 | | | Sleep Number Corp.* | | | 125,819 | |
| | 108,219 | | | Sonic Automotive, Inc., Class A | | | 2,319,133 | |
| | 184,070 | | | Sportsman’s Warehouse Holdings, Inc.* | | | 1,317,941 | |
| | 83,684 | | | Tilly’s, Inc., Class A | | | 492,899 | |
| | 52,145 | | | Zumiez, Inc.* | | | 1,102,345 | |
| | | | | | | | |
| | | | | | | 21,816,314 | |
| | |
| Technology Hardware, Storage & Peripherals – 0.0% | |
| | 11,294 | | | 3D Systems Corp.* | | | 95,886 | |
| | |
| Textiles, Apparel & Luxury Goods – 0.8% | |
| | 16,566 | | | Crocs, Inc.* | | | 401,725 | |
| | 86,481 | | | G-III Apparel Group Ltd.* | | | 979,830 | |
| | 37,907 | | | Kontoor Brands, Inc. | | | 735,775 | |
| | 44,727 | | | Movado Group, Inc. | | | 461,135 | |
| | 5,631 | | | Steven Madden Ltd. | | | 141,169 | |
| | 112,867 | | | Wolverine World Wide, Inc. | | | 2,312,645 | |
| | | | | | | | |
| | | | | | | 5,032,279 | |
| | |
| Thrifts & Mortgage Finance – 2.7% | |
| | 50,396 | | | Axos Financial, Inc.* | | | 1,161,628 | |
| | 69,237 | | | Essent Group Ltd. | | | 1,891,555 | |
| | 8,934 | | | Federal Agricultural Mortgage Corp., Class C | | | 595,272 | |
| | 16,039 | | | Luther Burbank Corp. | | | 172,580 | |
| | 148,622 | | | Meridian Bancorp, Inc. | | | 1,750,767 | |
| | 5,742 | | | Meta Financial Group, Inc. | | | 105,768 | |
| | 14,392 | | | Mr Cooper Group, Inc.* | | | 137,875 | |
| | 90,272 | | | PennyMac Financial Services, Inc. | | | 2,723,506 | |
| | 172,461 | | | Radian Group, Inc. | | | 2,583,466 | |
| | 56,009 | | | Walker & Dunlop, Inc. | | | 2,152,426 | |
| | 90,790 | | | Washington Federal, Inc. | | | 2,427,725 | |
| | 63,269 | | | WSFS Financial Corp. | | | 1,846,189 | |
| | | | | | | | |
| | | | | | | 17,548,757 | |
| | |
| Trading Companies & Distributors – 1.4% | |
| | 103,567 | | | Foundation Building Materials, Inc.* | | | 1,211,734 | |
| | 41,878 | | | GMS, Inc.* | | | 769,718 | |
| | |
|
| Common Stocks – (continued) | |
| Trading Companies & Distributors – (continued) | |
| | 114,560 | | | H&E Equipment Services, Inc. | | | 1,862,746 | |
| | 326,729 | | | MRC Global, Inc.* | | | 1,751,267 | |
| | 262,125 | | | NOW, Inc.* | | | 1,617,311 | |
| | 6,969 | | | Rush Enterprises, Inc., Class A | | | 261,337 | |
| | 56,607 | | | Triton International Ltd. (Bermuda) | | | 1,753,685 | |
| | 17,871 | | | Veritiv Corp.* | | | 167,451 | |
| | | | | | | | |
| | | | | | | 9,395,249 | |
| | |
| Water Utilities – 0.2% | |
| | 6,164 | | | Cadiz, Inc.* | | | 65,770 | |
| | 32,414 | | | California Water Service Group | | | 1,456,037 | |
| | | | | | | | |
| | | | | | | 1,521,807 | |
| | |
| | TOTAL COMMON STOCKS | |
| | (Cost $718,277,774) | | $ | 639,446,548 | |
| | |
| | | | | | | | |
| Shares | | | Dividend Rate | | Value | |
|
| Investment Company – 1.2%(b) | |
| Goldman Sachs Financial Square Government Fund –
Institutional Shares |
|
| | 7,789,206 | | | 0.233% | | $ | 7,789,206 | |
| | (Cost $7,789,206) | |
| | |
| TOTAL INVESTMENTS BEFORE SECURITIES
LENDING REINVESTMENT VEHICLE |
|
| | (Cost $726,066,980) | | $ | 647,235,754 | |
| | |
| | | | | | | | |
|
| Securities Lending Reinvestment Vehicle – 2.0%(b) | |
| Goldman Sachs Financial Square Government Fund –
Institutional Shares |
|
| | 13,122,270 | | | 0.233% | | $ | 13,122,270 | |
| | (Cost $13,122,270) | |
| | |
| | TOTAL INVESTMENTS – 100.6% | |
| | (Cost $739,189,250) | | $ | 660,358,024 | |
| | |
| LIABILITIES IN EXCESS OF
OTHER ASSETS – (0.6)% | | | (3,580,515 | ) |
| | |
| | NET ASSETS – 100.0% | | $ | 656,777,509 | |
| | |
| | |
|
| The percentage shown for each investment category reflects the value of investments in that category as a percentage of net assets. |
| |
* | | Non-income producing security. |
| |
(a) | | All or a portion of security is on loan. |
| |
(b) | | Represents an affiliated issuer. |
| | |
|
Investment Abbreviations: |
PLC | | —Public Limited Company |
REIT | | —Real Estate Investment Trust |
|
| | |
| The accompanying notes are an integral part of these financial statements. | | 39 |
GOLDMAN SACHS SMALL CAP VALUE INSIGHTS FUND
Schedule of Investments(continued)
April 30, 2020 (Unaudited)
|
| ADDITIONAL INVESTMENT INFORMATION |
FUTURES CONTRACTS — At April 30, 2020, the Fund had the following futures contracts:
| | | | | | | | | | | | | | |
| Description | | Number of
Contracts | | | Expiration
Date | | Notional
Amount | | | Unrealized
Appreciation/
(Depreciation) | |
E-mini Russell 2000 Index | | | 234 | | | 06/19/20 | | $ | 14,174,203 | | | $ | 1,114,187 | |
| | |
| 40 | | The accompanying notes are an integral part of these financial statements. |
GOLDMAN SACHS U.S. EQUITY INSIGHTS FUND
Schedule of Investments
April 30, 2020 (Unaudited)
| | | | | | | | |
| Shares | | | Description | | Value | |
|
| Common Stocks – 98.7% | |
| Aerospace & Defense – 0.5% | |
| | 5,048 | | | Hexcel Corp. | | $ | 174,611 | |
| | 24,221 | | | Raytheon Technologies Corp. | | | 1,569,763 | |
| | 8,590 | | | Teledyne Technologies, Inc.* | | | 2,797,505 | |
| | | | | | | | |
| | | | | | | 4,541,879 | |
| | |
| Automobiles – 0.5% | |
| | 122,930 | | | General Motors Co. | | | 2,740,110 | |
| | 1,674 | | | Tesla, Inc.* | | | 1,308,867 | |
| | | | | | | | |
| | | | | | | 4,048,977 | |
| | |
| Banks – 3.4% | |
| | 444,981 | | | Bank of America Corp. | | | 10,701,793 | |
| | 55,291 | | | Citigroup, Inc. | | | 2,684,931 | |
| | 141,467 | | | Citizens Financial Group, Inc. | | | 3,167,446 | |
| | 52,356 | | | East West Bancorp, Inc. | | | 1,836,125 | |
| | 27,123 | | | First Hawaiian, Inc. | | | 477,094 | |
| | 65,519 | | | First Horizon National Corp. | | | 594,913 | |
| | 23,174 | | | JPMorgan Chase & Co. | | | 2,219,142 | |
| | 31,633 | | | PacWest Bancorp | | | 640,252 | |
| | 50,851 | | | Popular, Inc. | | | 1,962,340 | |
| | 5,714 | | | Prosperity Bancshares, Inc. | | | 342,440 | |
| | 7,380 | | | Signature Bank | | | 790,988 | |
| | 15,193 | | | SVB Financial Group* | | | 2,934,832 | |
| | 5,864 | | | Webster Financial Corp. | | | 165,658 | |
| | 36,246 | | | Western Alliance Bancorp | | | 1,300,506 | |
| | | | | | | | |
| | | | | | | 29,818,460 | |
| | |
| Beverages – 0.6% | |
| | 2,151 | | | Brown-Forman Corp., Class B | | | 133,792 | |
| | 81,341 | | | Monster Beverage Corp.* | | | 5,027,687 | |
| | | | | | | | |
| | | | | | | 5,161,479 | |
| | |
| Biotechnology – 4.1% | |
| | 154,640 | | | AbbVie, Inc. | | | 12,711,408 | |
| | 7,506 | | | Alexion Pharmaceuticals, Inc.* | | | 806,670 | |
| | 21,654 | | | Biogen, Inc.* | | | 6,427,557 | |
| | 2,951 | | | Bluebird Bio, Inc.* | | | 159,000 | |
| | 110,528 | | | Gilead Sciences, Inc. | | | 9,284,352 | |
| | 24,347 | | | Incyte Corp.* | | | 2,377,728 | |
| | 6,972 | | | Regeneron Pharmaceuticals, Inc.* | | | 3,666,435 | |
| | | | | | | | |
| | | | | | | 35,433,150 | |
| | |
| Building Products – 0.7% | |
| | 4,048 | | | Allegion PLC | | | 406,986 | |
| | 185,067 | | | Johnson Controls International PLC | | | 5,387,300 | |
| | 3,436 | | | Trane Technologies PLC | | | 300,375 | |
| | | | | | | | |
| | | | | | | 6,094,661 | |
| | |
| Capital Markets – 2.9% | |
| | 3,409 | | | Cboe Global Markets, Inc. | | | 338,786 | |
| | 56,593 | | | Charles Schwab Corp. (The) | | | 2,134,688 | |
| | 59,263 | | | CME Group, Inc. | | | 10,561,259 | |
| | 6,522 | | | Intercontinental Exchange, Inc. | | | 583,393 | |
| | 487 | | | MarketAxess Holdings, Inc. | | | 221,590 | |
| | 2,863 | | | Moody’s Corp. | | | 698,286 | |
| | 37,143 | | | S&P Global, Inc. | | | 10,878,442 | |
| | | | | | | | |
| | | | | | | 25,416,444 | |
| | |
|
| Common Stocks – (continued) | |
| Chemicals – 2.2% | |
| | 16,637 | | | Air Products and Chemicals, Inc. | | | 3,752,974 | |
| | 100,135 | | | Axalta Coating Systems Ltd.* | | | 1,976,665 | |
| | 14,335 | | | CF Industries Holdings, Inc. | | | 394,213 | |
| | 38,202 | | | Corteva, Inc. | | | 1,000,510 | |
| | 8,739 | | | Linde PLC (United Kingdom) | | | 1,607,889 | |
| | 19,178 | | | Sherwin-Williams Co. (The) | | | 10,286,504 | |
| | | | | | | | |
| | | | | | | 19,018,755 | |
| | |
| Commercial Services & Supplies – 0.8% | |
| | 13,121 | | | Cintas Corp. | | | 2,910,631 | |
| | 1,336 | | | Republic Services, Inc. | | | 104,662 | |
| | 47,537 | | | Waste Connections, Inc. | | | 4,083,904 | |
| | | | | | | | |
| | | | | | | 7,099,197 | |
| | |
| Communications Equipment – 1.1% | |
| | 4,802 | | | Arista Networks, Inc.* | | | 1,053,078 | |
| | 194,997 | | | Cisco Systems, Inc. | | | 8,263,973 | |
| | | | | | | | |
| | | | | | | 9,317,051 | |
| | |
| Construction Materials – 0.0% | |
| | 1,001 | | | Martin Marietta Materials, Inc. | | | 190,420 | |
| | |
| Consumer Finance – 1.1% | |
| | 211,075 | | | Ally Financial, Inc. | | | 3,459,519 | |
| | 17,848 | | | Discover Financial Services | | | 766,928 | |
| | 8,319 | | | OneMain Holdings, Inc. | | | 201,403 | |
| | 240,964 | | | Synchrony Financial | | | 4,768,678 | |
| | | | | | | | |
| | | | | | | 9,196,528 | |
| | |
| Containers & Packaging – 0.3% | |
| | 74,872 | | | Amcor PLC | | | 671,602 | |
| | 23,040 | | | Ball Corp. | | | 1,511,193 | |
| | | | | | | | |
| | | | | | | 2,182,795 | |
| | |
| Diversified Consumer Services – 0.1% | |
| | 2,790 | | | Bright Horizons Family Solutions, Inc.* | | | 324,896 | |
| | 5,707 | | | frontdoor, Inc.* | | | 220,918 | |
| | 621 | | | Graham Holdings Co., Class B | | | 242,196 | |
| | | | | | | | |
| | | | | | | 788,010 | |
| | |
| Diversified Financial Services – 3.0% | |
| | 115,858 | | | Berkshire Hathaway, Inc., Class B* | | | 21,707,155 | |
| | 92,810 | | | Voya Financial, Inc. | | | 4,192,228 | |
| | | | | | | | |
| | | | | | | 25,899,383 | |
| | |
| Diversified Telecommunication Services – 0.1% | |
| | 123,669 | | | CenturyLink, Inc. | | | 1,313,365 | |
| | |
| Electric Utilities – 0.9% | |
| | 122,590 | | | FirstEnergy Corp. | | | 5,059,289 | |
| | 13,554 | | | NextEra Energy, Inc. | | | 3,132,601 | |
| | | | | | | | |
| | | | | | | 8,191,890 | |
| | |
| Electrical Equipment – 0.5% | |
| | 26,649 | | | AMETEK, Inc. | | | 2,235,052 | |
| | 43,039 | | | Emerson Electric Co. | | | 2,454,514 | |
| | | | | | | | |
| | | | | | | 4,689,566 | |
| | |
| | |
| The accompanying notes are an integral part of these financial statements. | | 41 |
GOLDMAN SACHS U.S. EQUITY INSIGHTS FUND
Schedule of Investments(continued)
April 30, 2020 (Unaudited)
| | | | | | | | |
| Shares | | | Description | | Value | |
|
| Common Stocks – (continued) | |
| Electronic Equipment, Instruments & Components – 1.1% | |
| | 95,152 | | | Keysight Technologies, Inc.* | | $ | 9,207,859 | |
| | |
| Energy Equipment & Services – 0.2% | |
| | 169,891 | | | TechnipFMC PLC (United Kingdom) | | | 1,513,729 | |
| | |
| Entertainment – 0.8% | |
| | 14,346 | | | Netflix, Inc.* | | | 6,023,168 | |
| | 7,105 | | | Roku, Inc.* | | | 861,339 | |
| | 1,105 | | | Spotify Technology SA* | | | 167,485 | |
| | | | | | | | |
| | | | | | | 7,051,992 | |
| | |
| Equity Real Estate Investment Trusts (REITs) – 4.4% | |
| | 84,854 | | | American Homes 4 Rent, Class A REIT | | | 2,048,376 | |
| | 1,716 | | | AvalonBay Communities, Inc. REIT | | | 279,622 | |
| | 32,850 | | | Brixmor Property Group, Inc. REIT | | | 376,132 | |
| | 42,566 | | | Camden Property Trust REIT | | | 3,748,788 | |
| | 10,730 | | | CyrusOne, Inc. REIT | | | 752,709 | |
| | 6,396 | | | Douglas Emmett, Inc. REIT | | | 195,014 | |
| | 230,818 | | | Duke Realty Corp. REIT | | | 8,009,385 | |
| | 54,043 | | | Empire State Realty Trust, Inc., Class A REIT | | | 451,799 | |
| | 95,038 | | | Equity LifeStyle Properties, Inc. REIT | | | 5,731,742 | |
| | 5,360 | | | Equity Residential REIT | | | 348,722 | |
| | 13,076 | | | Essex Property Trust, Inc. REIT | | | 3,191,852 | |
| | 43,483 | | | Healthcare Trust of America, Inc., Class A REIT | | | 1,070,986 | |
| | 5,826 | | | Hudson Pacific Properties, Inc. REIT | | | 143,203 | |
| | 237,941 | | | Invitation Homes, Inc. REIT | | | 5,627,305 | |
| | 2,828 | | | Mid-America Apartment Communities, Inc. REIT | | | 316,510 | |
| | 18,697 | | | SBA Communications Corp. REIT | | | 5,420,634 | |
| | 1,348 | | | Sun Communities, Inc. REIT | | | 181,171 | |
| | | | | | | | |
| | | | | | | 37,893,950 | |
| | |
| Food & Staples Retailing – 3.3% | |
| | 14,521 | | | Casey’s General Stores, Inc. | | | 2,198,625 | |
| | 42,562 | | | Costco Wholesale Corp. | | | 12,896,286 | |
| | 129,504 | | | Walgreens Boots Alliance, Inc. | | | 5,606,228 | |
| | 63,024 | | | Walmart, Inc. | | | 7,660,567 | |
| | | | | | | | |
| | | | | | | 28,361,706 | |
| | |
| Health Care Equipment & Supplies – 2.8% | |
| | 28,922 | | | Abbott Laboratories | | | 2,663,427 | |
| | 8,595 | | | Align Technology, Inc.* | | | 1,846,636 | |
| | 45,267 | | | Edwards Lifesciences Corp.* | | | 9,845,572 | |
| | 59,831 | | | Medtronic PLC | | | 5,841,301 | |
| | 10,761 | | | STERIS PLC | | | 1,533,442 | |
| | 7,678 | | | Teleflex, Inc. | | | 2,575,201 | |
| | | | | | | | |
| | | | | | | 24,305,579 | |
| | |
| Health Care Providers & Services – 4.7% | |
| | 8,454 | | | AmerisourceBergen Corp. | | | 757,986 | |
| | 31,350 | | | Anthem, Inc. | | | 8,800,885 | |
| | 28,370 | | | Cardinal Health, Inc. | | | 1,403,748 | |
| | 37,793 | | | Cigna Corp. | | | 7,399,113 | |
| | 23,075 | | | HCA Healthcare, Inc. | | | 2,535,481 | |
| | 14,125 | | | Humana, Inc. | | | 5,393,207 | |
| | |
|
| Common Stocks – (continued) | |
| Health Care Providers & Services – (continued) | |
| | 26,142 | | | UnitedHealth Group, Inc. | | | 7,645,751 | |
| | 61,084 | | | Universal Health Services, Inc., Class B | | | 6,455,968 | |
| | | | | | | | |
| | | | | | | 40,392,139 | |
| | |
| Hotels, Restaurants & Leisure – 1.4% | |
| | 6,684 | | | Chipotle Mexican Grill, Inc.* | | | 5,872,228 | |
| | 8,579 | | | Domino’s Pizza, Inc. | | | 3,104,997 | |
| | 14,140 | | | International Game Technology PLC | | | 106,616 | |
| | 12,396 | | | McDonald’s Corp. | | | 2,324,994 | |
| | 3,111 | | | Yum China Holdings, Inc. (China) | | | 150,759 | |
| | 10,834 | | | Yum! Brands, Inc. | | | 936,383 | |
| | | | | | | | |
| | | | | | | 12,495,977 | |
| | |
| Household Durables – 0.2% | |
| | 28,646 | | | D.R. Horton, Inc. | | | 1,352,664 | |
| | |
| Household Products – 2.2% | |
| | 8,808 | | | Church & Dwight Co., Inc. | | | 616,472 | |
| | 157,874 | | | Procter & Gamble Co. (The) | | | 18,608,608 | |
| | | | | | | | |
| | | | | | | 19,225,080 | |
| | |
| Independent Power and Renewable Electricity Producers – 0.1% | |
| | 80,730 | | | AES Corp. (The) | | | 1,069,673 | |
| | |
| Industrial Conglomerates – 0.8% | |
| | 903,004 | | | General Electric Co. | | | 6,140,427 | |
| | 1,911 | | | Roper Technologies, Inc. | | | 651,709 | |
| | | | | | | | |
| | | | | | | 6,792,136 | |
| | |
| Insurance – 2.0% | |
| | 35,733 | | | Allstate Corp. (The) | | | 3,634,761 | |
| | 25,892 | | | American Financial Group, Inc. | | | 1,715,086 | |
| | 31,863 | | | Aon PLC | | | 5,501,784 | |
| | 59,139 | | | Athene Holding Ltd., Class A* | | | 1,596,753 | |
| | 11,787 | | | Brighthouse Financial, Inc.* | | | 303,044 | |
| | 5,615 | | | Fidelity National Financial, Inc. | | | 151,886 | |
| | 24,141 | | | Lincoln National Corp. | | | 856,281 | |
| | 1,191 | | | Primerica, Inc. | | | 123,757 | |
| | 16,388 | | | Reinsurance Group of America, Inc. | | | 1,715,496 | |
| | 84,976 | | | Unum Group | | | 1,482,831 | |
| | | | | | | | |
| | | | | | | 17,081,679 | |
| | |
| Interactive Media & Services – 5.5% | |
| | 7,281 | | | Alphabet, Inc., Class A* | | | 9,805,323 | |
| | 16,103 | | | Alphabet, Inc., Class C* | | | 21,717,472 | |
| | 76,482 | | | Facebook, Inc., Class A* | | | 15,656,630 | |
| | 6,888 | | | Pinterest, Inc., Class A* | | | 142,306 | |
| | 10,815 | | | Snap, Inc., Class A* | | | 190,452 | |
| | | | | | | | |
| | | | | | | 47,512,183 | |
| | |
| Internet & Direct Marketing Retail – 5.5% | |
| | 18,630 | | | Amazon.com, Inc.* | | | 46,090,620 | |
| | 35,711 | | | eBay, Inc. | | | 1,422,369 | |
| | | | | | | | |
| | | | | | | 47,512,989 | |
| | |
| IT Services – 4.9% | |
| | 7,662 | | | Amdocs Ltd. | | | 493,739 | |
| | |
| | |
| 42 | | The accompanying notes are an integral part of these financial statements. |
GOLDMAN SACHS U.S. EQUITY INSIGHTS FUND
| | | | | | | | |
| Shares | | | Description | | Value | |
|
| Common Stocks – (continued) | |
| IT Services – (continued) | |
| | 17,358 | | | Automatic Data Processing, Inc. | | $ | 2,546,245 | |
| | 6,387 | | | Booz Allen Hamilton Holding Corp. | | | 469,061 | |
| | 59,011 | | | Cognizant Technology Solutions Corp., Class A | | | 3,423,818 | |
| | 11,721 | | | FleetCor Technologies, Inc.* | | | 2,827,691 | |
| | 49,224 | | | International Business Machines Corp. | | | 6,180,566 | |
| | 2,537 | | | Mastercard, Inc., Class A | | | 697,599 | |
| | 16,986 | | | Okta, Inc.* | | | 2,569,982 | |
| | 95,879 | | | PayPal Holdings, Inc.* | | | 11,793,117 | |
| | 38,829 | | | VeriSign, Inc.* | | | 8,134,287 | |
| | 17,540 | | | Visa, Inc., Class A | | | 3,134,749 | |
| | 10,722 | | | Western Union Co. (The) | | | 204,469 | |
| | | | | | | | |
| | | | | | | 42,475,323 | |
| | |
| Life Sciences Tools & Services – 1.5% | |
| | 21,704 | | | Illumina, Inc.* | | | 6,924,227 | |
| | 32,206 | | | IQVIA Holdings, Inc.* | | | 4,592,253 | |
| | 1,706 | | | Mettler-Toledo International, Inc.* | | | 1,228,218 | |
| | 15,194 | | | QIAGEN NV* | | | 633,438 | |
| | | | | | | | |
| | | | | | | 13,378,136 | |
| | |
| Machinery – 0.7% | |
| | 4,907 | | | AGCO Corp. | | | 259,286 | |
| | 10,203 | | | Flowserve Corp. | | | 287,418 | |
| | 19,222 | | | Illinois Tool Works, Inc. | | | 3,123,575 | |
| | 8,609 | | | Otis Worldwide Corp.* | | | 438,284 | |
| | 12,723 | | | Snap-on, Inc. | | | 1,657,680 | |
| | | | | | | | |
| | | | | | | 5,766,243 | |
| | |
| Media – 3.5% | |
| | 16,772 | | | Charter Communications, Inc., Class A* | | | 8,305,998 | |
| | 352,588 | | | Comcast Corp., Class A | | | 13,267,886 | |
| | 15,590 | | | Liberty Broadband Corp., Class C* | | | 1,912,581 | |
| | 367,006 | | | Liberty Global PLC, Class C (United Kingdom)* | | | 6,719,880 | |
| | | | | | | | |
| | | | | | | 30,206,345 | |
| | |
| Metals & Mining – 0.1% | |
| | 6,957 | | | Royal Gold, Inc. | | | 852,441 | |
| | 6,309 | | | Southern Copper Corp. (Peru) | | | 204,664 | |
| | | | | | | | |
| | | | | | | 1,057,105 | |
| | |
| Mortgage Real Estate Investment Trusts (REITs) – 0.0% | |
| | 22,049 | | | Chimera Investment Corp. REIT | | | 171,321 | |
| | |
| Multiline Retail – 1.4% | |
| | 14,444 | | | Dollar General Corp. | | | 2,532,033 | |
| | 90,401 | | | Target Corp. | | | 9,920,606 | |
| | | | | | | | |
| | | | | | | 12,452,639 | |
| | |
| Multi-Utilities – 2.5% | |
| | 63,171 | | | CMS Energy Corp. | | | 3,606,432 | |
| | 28,317 | | | Consolidated Edison, Inc. | | | 2,231,380 | |
| | 66,839 | | | DTE Energy Co. | | | 6,933,878 | |
| | 171,671 | | | Public Service Enterprise Group, Inc. | | | 8,705,436 | |
| | | | | | | | |
| | | | | | | 21,477,126 | |
| | |
|
| Common Stocks – (continued) | |
| Oil, Gas & Consumable Fuels – 1.7% | |
| | 66,557 | | | Chevron Corp. | | | 6,123,244 | |
| | 78,767 | | | EOG Resources, Inc. | | | 3,742,220 | |
| | 10,252 | | | Kinder Morgan, Inc. | | | 156,138 | |
| | 76,738 | | | Marathon Petroleum Corp. | | | 2,461,755 | |
| | 6,668 | | | ONEOK, Inc. | | | 199,573 | |
| | 21,843 | | | Pioneer Natural Resources Co. | | | 1,950,798 | |
| | 20,640 | | | Targa Resources Corp. | | | 267,495 | |
| | 13,299 | | | Williams Cos., Inc. (The) | | | 257,602 | |
| | | | | | | | |
| | | | | | | 15,158,825 | |
| | |
| Pharmaceuticals – 2.3% | |
| | 40,279 | | | Horizon Therapeutics PLC* | | | 1,451,655 | |
| | 44,640 | | | Johnson & Johnson | | | 6,697,786 | |
| | 120,676 | | | Merck & Co., Inc. | | | 9,574,434 | |
| | 61,557 | | | Pfizer, Inc. | | | 2,361,326 | |
| | | | | | | | |
| | | | | | | 20,085,201 | |
| | |
| Professional Services – 1.1% | |
| | 4,632 | | | CoStar Group, Inc.* | | | 3,002,740 | |
| | 49,313 | | | IHS Markit Ltd. | | | 3,318,765 | |
| | 36,903 | | | TransUnion | | | 2,907,588 | |
| | | | | | | | |
| | | | | | | 9,229,093 | |
| | |
| Road & Rail – 1.7% | |
| | 11,336 | | | Norfolk Southern Corp. | | | 1,939,590 | |
| | 2,891 | | | Old Dominion Freight Line, Inc. | | | 420,033 | |
| | 78,548 | | | Union Pacific Corp. | | | 12,551,185 | |
| | | | | | | | |
| | | | | | | 14,910,808 | |
| | |
| Semiconductors & Semiconductor Equipment – 2.9% | |
| | 40,675 | | | Advanced Micro Devices, Inc.* | | | 2,130,963 | |
| | 24,161 | | | Applied Materials, Inc. | | | 1,200,319 | |
| | 13,726 | | | Intel Corp. | | | 823,286 | |
| | 10,105 | | | Lam Research Corp. | | | 2,579,604 | |
| | 51,290 | | | NVIDIA Corp. | | | 14,991,041 | |
| | 32,106 | | | QUALCOMM, Inc. | | | 2,525,779 | |
| | 5,376 | | | Universal Display Corp. | | | 807,045 | |
| | | | | | | | |
| | | | | | | 25,058,037 | |
| | |
| Software – 7.7% | |
| | 10,112 | | | Adobe, Inc.* | | | 3,576,008 | |
| | 19,842 | | | Fortinet, Inc.* | | | 2,137,777 | |
| | 311,624 | | | Microsoft Corp. | | | 55,846,137 | |
| | 29,426 | | | Oracle Corp. | | | 1,558,695 | |
| | 7,354 | | | Palo Alto Networks, Inc.* | | | 1,445,134 | |
| | 9,664 | | | Workday, Inc., Class A* | | | 1,487,290 | |
| | 5,748 | | | Zscaler, Inc.* | | | 385,576 | |
| | | | | | | | |
| | | | | | | 66,436,617 | |
| | |
| Specialty Retail – 2.2% | |
| | 1,942 | | | Best Buy Co., Inc. | | | 149,010 | |
| | 66,816 | | | Home Depot, Inc. (The) | | | 14,688,161 | |
| | 27,824 | | | Lowe’s Cos, Inc. | | | 2,914,564 | |
| | 3,350 | | | O’Reilly Automotive, Inc.* | | | 1,294,239 | |
| | | | | | | | |
| | | | | | | 19,045,974 | |
| | |
| | |
| The accompanying notes are an integral part of these financial statements. | | 43 |
GOLDMAN SACHS U.S. EQUITY INSIGHTS FUND
Schedule of Investments(continued)
April 30, 2020 (Unaudited)
| | | | | | | | |
| Shares | | | Description | | Value | |
|
| Common Stocks – (continued) | |
| Technology Hardware, Storage & Peripherals – 6.1% | |
| | 180,353 | | | Apple, Inc. | | $ | 52,987,711 | |
| | |
| Tobacco – 0.6% | |
| | 132,143 | | | Altria Group, Inc. | | | 5,186,613 | |
| | |
| Trading Companies & Distributors – 0.0% | |
| | 4,115 | | | WESCO International, Inc.* | | | 106,455 | |
| | |
| | TOTAL INVESTMENTS – 98.7% | |
| | (Cost $722,111,378) | | $ | 855,360,917 | |
| | |
| OTHER ASSETS IN EXCESS OF
LIABILITIES – 1.3% | | | 11,366,472 | |
| | |
| | NET ASSETS – 100.0% | | $ | 866,727,389 | |
| | |
| | |
|
| The percentage shown for each investment category reflects the value of investments in that category as a percentage of net assets. |
| |
* | | Non-income producing security. |
| | |
|
Investment Abbreviations: |
PLC | | —Public Limited Company |
REIT | | —Real Estate Investment Trust |
|
| | |
| 44 | | The accompanying notes are an integral part of these financial statements. |
GOLDMAN SACHS DOMESTIC EQUITY INSIGHTS FUNDS
Statements of Assets and Liabilities
April 30, 2020 (Unaudited)
| | | | | | | | | | | | | | |
| | | | | Large Cap Growth
Insights Fund | | | Large Cap Value
Insights Fund | | | Small Cap Equity
Insights Fund | |
| | Assets: | |
| | Investments in unaffiliated issuers, at value (cost $1,208,527,538, $358,065,067 and $625,893,584, respectively)(a) | | $ | 1,658,674,657 | | | $ | 343,602,620 | | | $ | 554,188,455 | |
| | Investments in securities lending reinvestment vehicle, at value which equals cost | | | 424,340 | | | | 119,900 | | | | 4,716,670 | |
| | Cash | | | 11,708,229 | | | | 2,363,043 | | | | 1,880,498 | |
| | Receivables: | | | | | | | | | | | | |
| | Investments sold | | | 46,614,322 | | | | — | | | | 3,737 | |
| | Fund shares sold | | | 1,890,052 | | | | 285,684 | | | | 1,205,706 | |
| | Dividends | | | 794,302 | | | | 385,162 | | | | 131,352 | |
| | Reimbursement from investment adviser | | | 39,389 | | | | 31,713 | | | | 43,674 | |
| | Securities lending income | | | 48 | | | | 3 | | | | 4,979 | |
| | Collateral on certain derivative contracts(b) | | | — | | | | — | | | | 56,860 | |
| | Other assets | | | 95,064 | | | | 66,461 | | | | 68,302 | |
| | Total assets | | | 1,720,240,403 | | | | 346,854,586 | | | | 562,300,233 | |
| | | | | | | | | | | | | | |
| | Liabilities: | | | | | | | | | | | | |
| | Variation margin on futures contracts | | | — | | | | — | | | | 15,690 | |
| | Payables: | | | | | | | | | | | | |
| | Investments purchased | | | 42,313,382 | | | | — | | | | — | |
| | Fund shares redeemed | | | 2,328,841 | | | | 836,288 | | | | 2,798,532 | |
| | Management fees | | | 647,039 | | | | 141,904 | | | | 334,585 | |
| | Upon return of securities loaned | | | 424,340 | | | | 119,900 | | | | 4,716,670 | |
| | Distribution and Service fees and Transfer Agency fees | | | 216,817 | | | | 48,407 | | | | 43,735 | |
| | Accrued expenses | | | 385,628 | | | | 210,286 | | | | 267,638 | |
| | Total liabilities | | | 46,316,047 | | | | 1,356,785 | | | | 8,176,850 | |
| | | | | | | | | | | | | | |
| | Net Assets: | |
| | Paid-in capital | | | 1,284,809,163 | | | | 391,061,127 | | | | 663,555,988 | |
| | Total distributable earnings (loss) | | | 389,115,193 | | | | (45,563,326 | ) | | | (109,432,605 | ) |
| | | NET ASSETS | | $ | 1,673,924,356 | | | $ | 345,497,801 | | | $ | 554,123,383 | |
| | | Net Assets: | | | | | | | | | | | | |
| | | Class A | | $ | 265,535,051 | | | $ | 51,298,131 | | | $ | 37,978,021 | |
| | | Class C | | | 37,329,326 | | | | 10,005,385 | | | | 5,697,159 | |
| | | Institutional | | | 646,306,803 | | | | 92,365,004 | | | | 240,142,437 | |
| | | Service | | | 37,379,545 | | | | 5,745,471 | | | | 2,623,773 | |
| | | Investor | | | 312,321,267 | | | | 90,952,845 | | | | 59,890,136 | |
| | | Class P | | | 50,733,081 | | | | 28,058,207 | | | | 80,996,367 | |
| | | Class R | | | 26,560,228 | | | | 4,520,561 | | | | 12,844,374 | |
| | | Class R6 | | | 297,759,055 | | | | 62,552,197 | | | | 113,951,116 | |
| | | Total Net Assets | | $ | 1,673,924,356 | | | $ | 345,497,801 | | | $ | 554,123,383 | |
| | | Shares Outstanding $0.001 par value (unlimited number of shares authorized): | | | | | | | | | | | | |
| | | Class A | | | 8,514,966 | | | | 2,841,138 | | | | 1,860,961 | |
| | | Class C | | | 1,365,467 | | | | 559,276 | | | | 329,435 | |
| | | Institutional | | | 19,955,387 | | | | 5,123,232 | | | | 11,290,096 | |
| | | Service | | | 1,218,856 | | | | 316,790 | | | | 130,816 | |
| | | Investor | | | 10,165,785 | | | | 5,058,151 | | | | 2,952,471 | |
| | | Class P | | | 1,568,071 | | | | 1,557,224 | | | | 3,808,279 | |
| | | Class R | | | 875,021 | | | | 252,085 | | | | 645,463 | |
| | | Class R6 | | | 9,198,872 | | | | 3,469,799 | | | | 5,356,698 | |
| | | Net asset value, offering and redemption price per share:(c) | | | | | | | | | | | | |
| | | Class A | | | $31.18 | | | | $18.06 | | | | $20.41 | |
| | | Class C | | | 27.34 | | | | 17.89 | | | | 17.29 | |
| | | Institutional | | | 32.39 | | | | 18.03 | | | | 21.27 | |
| | | Service | | | 30.67 | | | | 18.14 | | | | 20.06 | |
| | | Investor | | | 30.72 | | | | 17.98 | | | | 20.28 | |
| | | Class P | | | 32.35 | | | | 18.02 | | | | 21.27 | |
| | | Class R | | | 30.35 | | | | 17.93 | | | | 19.90 | |
| | | Class R6 | | | 32.37 | | | | 18.03 | | | | 21.27 | |
| | (a) | | Includes loaned securities having a market value of $392,539, $101,310 and $4,492,364, respectively. |
| | (b) | | Segregated for initial margin and/or collateral as follows: |
| | | | |
| Fund | | Futures | |
| |
Small Cap Equity Insights | | $ | 56,860 | |
| | (c) | | Maximum public offering price per share for Class A Shares of the Large Cap Growth Insights, Large Cap Value Insights and Small Cap Equity Insights Funds is $32.99, $19.11 and $21.60, respectively. At redemption, Class C Shares may be subject to a contingent deferred sales charge, assessed on the amount equal to the lesser of the current net asset value (“NAV”) or the original purchase price of the shares. |
| | |
| The accompanying notes are an integral part of these financial statements. | | 45 |
GOLDMAN SACHS DOMESTIC EQUITY INSIGHTS FUNDS
Statements of Assets and Liabilities(continued)
April 30, 2020 (Unaudited)
| | | | | | | | | | | | | | |
| | | | | Small Cap Growth
Insights Fund | | | Small Cap Value
Insights Fund | | | U.S. Equity
Insights Fund | |
| | Assets: | |
| | Investments in unaffiliated issuers, at value (cost $1,008,457,248, $718,277,774 and $722,111,378, respectively)(a) | | $ | 961,782,244 | | | $ | 639,446,548 | | | $ | 855,360,917 | |
| | Investments in affiliated issuers, at value (cost $0, $7,789,206 and $0, respectively) | | | — | | | | 7,789,206 | | | | — | |
| | Investments in securities lending reinvestment vehicle, at value which equals cost | | | 7,572,066 | | | | 13,122,270 | | | | — | |
| | Cash | | | 14,539,711 | | | | 11,199,749 | | | | 12,159,063 | |
| | Receivables: | | | | | | | | | | | | |
| | Investments sold | | | 14,460,063 | | | | 10,553,507 | | | | 23,411,720 | |
| | Fund shares sold | | | 1,826,797 | | | | 1,009,932 | | | | 734,759 | |
| | Collateral on certain derivative contracts(b) | | | 767,570 | | | | 1,837,540 | | | | — | |
| | Dividends | | | 82,914 | | | | 207,007 | | | | 565,171 | |
| | Reimbursement from investment adviser | | | 61,659 | | | | 52,279 | | | | 41,498 | |
| | Securities lending income | | | 4,119 | | | | 12,353 | | | | — | |
| | Other assets | | | 79,027 | | | | 90,733 | | | | 75,310 | |
| | Total assets | | | 1,001,176,170 | | | | 685,321,124 | | | | 892,348,438 | |
| | | | | | | | | | | | | | |
| | Liabilities: | | | | | | | | | | | | |
| | Variation margin on futures contracts | | | 253,655 | | | | 611,910 | | | | — | |
| | Payables: | | | | | | | | | | | | |
| | Investments purchased | | | 15,976,040 | | | | 13,063,639 | | | | 23,720,527 | |
| | Upon return of securities loaned | | | 7,572,066 | | | | 13,122,270 | | | | — | |
| | Fund shares redeemed | | | 2,820,889 | | | | 1,114,308 | | | | 1,040,356 | |
| | Management fees | | | 580,562 | | | | 323,820 | | | | 348,560 | |
| | Distribution and Service fees and Transfer Agency fees | | | 84,986 | | | | 61,075 | | | | 145,147 | |
| | Accrued expenses | | | 379,916 | | | | 246,593 | | | | 366,459 | |
| | Total liabilities | | | 27,668,114 | | | | 28,543,615 | | | | 25,621,049 | |
| | | | | | | | | | | | | | |
| | Net Assets: | |
| | Paid-in capital | | | 1,059,527,397 | | | | 779,076,653 | | | | 785,990,532 | |
| | Total distributable earnings (loss) | | | (86,019,341 | ) | | | (122,299,144 | ) | | | 80,736,857 | |
| | | NET ASSETS | | $ | 973,508,056 | | | $ | 656,777,509 | | | $ | 866,727,389 | |
| | | Net Assets: | | | | | | | | | | | | |
| | | Class A | | $ | 49,974,126 | | | $ | 94,427,455 | | | $ | 269,242,192 | |
| | | Class C | | | 6,693,803 | | | | 5,468,186 | | | | 14,409,945 | |
| | | Institutional | | | 275,909,630 | | | | 153,561,040 | | | | 239,943,721 | |
| | | Service | | | — | | | | — | | | | 5,163,179 | |
| | | Investor | | | 357,244,206 | | | | 230,244,039 | | | | 83,065,883 | |
| | | Class P | | | 9,049,084 | | | | 29,908,560 | | | | 210,354,617 | |
| | | Class R | | | 7,670,191 | | | | 6,877,874 | | | | 37,858,678 | |
| | | Class R6 | | | 266,967,016 | | | | 136,290,355 | | | | 6,689,174 | |
| | | Total Net Assets | | $ | 973,508,056 | | | $ | 656,777,509 | | | $ | 866,727,389 | |
| | | Shares Outstanding $0.001 par value (unlimited number of shares authorized): | | | | | | | | | | | | |
| | | Class A | | | 1,685,116 | | | | 3,184,001 | | | | 5,698,590 | |
| | | Class C | | | 305,243 | | | | 269,105 | | | | 342,129 | |
| | | Institutional | | | 7,754,057 | | | | 3,821,287 | | | | 4,915,917 | |
| | | Service | | | — | | | | — | | | | 109,915 | |
| | | Investor | | | 11,667,494 | | | | 7,809,755 | | | | 1,783,700 | |
| | | Class P | | | 254,179 | | | | 744,487 | | | | 4,313,427 | |
| | | Class R | | | 270,738 | | | | 236,807 | | | | 816,964 | |
| | | Class R6 | | | 7,498,432 | | | | 3,392,392 | | | | 137,165 | |
| | | Net asset value, offering and redemption price per share:(c) | | | | | | | | | | | | |
| | | Class A | | | $29.66 | | | | $29.66 | | | | $47.25 | |
| | | Class C | | | 21.93 | | | | 20.32 | | | | 42.12 | |
| | | Institutional | | | 35.58 | | | | 40.19 | | | | 48.81 | |
| | | Service | | | — | | | | — | | | | 46.97 | |
| | | Investor | | | 30.62 | | | | 29.48 | | | | 46.57 | |
| | | Class P | | | 35.60 | | | | 40.17 | | | | 48.77 | |
| | | Class R | | | 28.33 | | | | 29.04 | | | | 46.34 | |
| | | Class R6 | | | 35.60 | | | | 40.18 | | | | 48.77 | |
| | (a) | | Includes loaned securities having a market value of $7,190,667, $12,158,432 and $–, respectively. |
| | (b) | | Segregated for initial margin and/or collateral as follows: |
| | | | |
| Fund | | Futures | |
Small Cap Growth Insights | | $ | 767,570 | |
| |
Small Cap Value Insights | | | 1,837,540 | |
| | (c) | | Maximum public offering price per share for Class A Shares of the Small Cap Growth Insights, Small Cap Value Insights and U.S. Equity Insights Funds is $31.39, $31.39 and $50.00, respectively. At redemption, Class C Shares may be subject to a contingent deferred sales charge, assessed on the amount equal to the lesser of the current net asset value (“NAV”) or the original purchase price of the shares. |
| | |
| 46 | | The accompanying notes are an integral part of these financial statements. |
GOLDMAN SACHS DOMESTIC EQUITY INSIGHTS FUNDS
Statements of Operations
For the Six Months Ended April 30, 2020 (Unaudited)
| | | | | | | | | | | | | | |
| | | | | Large Cap Growth
Insights Fund | | | Large Cap Value
Insights Fund | | | Small Cap Equity
Insights Fund | |
| | Investment income: | |
| | | | |
| | Dividends — unaffiliated issuers (net of foreign withholding taxes of $6,242, $5,814 and $13,967, respectively) | | $ | 10,073,963 | | | $ | 5,010,941 | | | $ | 3,830,262 | |
| | | | |
| | Dividends — affiliated issuers | | | 763 | | | | 1,521 | | | | 41,656 | |
| | | | |
| | Securities lending income — affiliated issuer | | | 60,662 | | | | 1,366 | | | | 41,988 | |
| | | | |
| | Total investment income | | | 10,135,388 | | | | 5,013,828 | | | | 3,913,909 | |
| | | | | | | | | | | | | | |
| | Expenses: | |
| | | | |
| | Management fees | | | 4,596,573 | | | | 1,082,139 | | | | 2,624,104 | |
| | | | |
| | Transfer Agency fees(a) | | | 828,599 | | | | 205,339 | | | | 213,235 | |
| | | | |
| | Distribution and Service fees(a) | | | 634,237 | | | | 147,627 | | | | 134,117 | |
| | | | |
| | Custody, accounting and administrative services | | | 114,534 | | | | 58,838 | | | | 81,084 | |
| | | | |
| | Printing and mailing costs | | | 109,745 | | | | 41,426 | | | | 45,443 | |
| | | | |
| | Service Share fees — Service Plan | | | 58,030 | | | | 8,537 | | | | 3,516 | |
| | | | |
| | Service Share fees — Shareholder Administration Plan | | | 58,030 | | | | 8,537 | | | | 3,516 | |
| | | | |
| | Professional fees | | | 49,503 | | | | 49,504 | | | | 49,504 | |
| | | | |
| | Registration fees | | | 19,606 | | | | 39,185 | | | | 42,412 | |
| | | | |
| | Trustee fees | | | 10,023 | | | | 8,872 | | | | 9,085 | |
| | | | |
| | Other | | | 25,430 | | | | 8,830 | | | | 15,738 | |
| | | | |
| | Total expenses | | | 6,504,310 | | | | 1,658,834 | | | | 3,221,754 | |
| | | | |
| | Less — expense reductions | | | (293,429 | ) | | | (198,803 | ) | | | (235,131 | ) |
| | | | |
| | Net expenses | | | 6,210,881 | | | | 1,460,031 | | | | 2,986,623 | |
| | | | |
| | NET INVESTMENT INCOME | | | 3,924,507 | | | | 3,553,797 | | | | 927,283 | |
| | | | | | | | | | | | | | |
| | Realized and unrealized gain (loss): | |
| | | | |
| | Net realized gain (loss) from: | | | | | | | | | | | | |
| | | | |
| | Investments | | | (53,104,020 | ) | | | (23,829,919 | ) | | | (26,522,260 | ) |
| | | | |
| | Futures contracts | | | (195,658 | ) | | | 309,441 | | | | (2,707,251 | ) |
| | | | |
| | Net change in unrealized gain (loss) on: | | | | | | | | | | | | |
| | | | |
| | Investments | | | 94,136,346 | | | | (40,758,316 | ) | | | (115,604,354 | ) |
| | | | |
| | Futures contracts | | | — | | | | — | | | | 222,789 | |
| | | | |
| | Net realized and unrealized gain (loss) | | | 40,836,668 | | | | (64,278,794 | ) | | | (144,611,076 | ) |
| | | | |
| | NET INCREASE (DECREASE) IN NET ASSETS RESULTING FROM OPERATIONS | | $ | 44,761,175 | | | $ | (60,724,997 | ) | | $ | (143,683,793 | ) |
| | (a) | | Class specific Distribution and/or Service and Transfer Agency fees were as follows: |
| | | | | | | | | | | | | | | | | | | | | | | | | | | | | | | | | | | | | | | | | | | | |
| | | Distribution and/or Service Fees | | | Transfer Agency Fees | |
Fund | | Class A | | | Class C | | | Class R | | | Class A | | | Class C | | | Institutional | | | Service | | | Investor | | | Class P | | | Class R | | | Class R6 | |
Large Cap Growth Insights | | $ | 358,781 | | | $ | 200,888 | | | $ | 74,568 | | | $ | 243,971 | | | $ | 34,151 | | | $ | 141,765 | | | $ | 9,285 | | | $ | 319,707 | | | $ | 7,541 | | | $ | 25,353 | | | $ | 46,826 | |
Large Cap Value Insights | | | 75,526 | | | | 59,553 | | | | 12,548 | | | | 51,357 | | | | 10,124 | | | | 22,317 | | | | 1,366 | | | | 100,595 | | | | 4,848 | | | | 4,266 | | | | 10,466 | |
Small Cap Equity Insights | | | 60,649 | | | | 36,030 | | | | 37,438 | | | | 41,241 | | | | 6,125 | | | | 54,397 | | | | 562 | | | | 62,658 | | | | 14,718 | | | | 12,729 | | | | 20,805 | |
| | |
| The accompanying notes are an integral part of these financial statements. | | 47 |
GOLDMAN SACHS DOMESTIC EQUITY INSIGHTS FUNDS
Statements of Operations(continued)
For the Six Months Ended April 30, 2020 (Unaudited)
| | | | | | | | | | | | | | |
| | | | | Small Cap Growth
Insights Fund | | | Small Cap Value
Insights Fund | | | U.S. Equity
Insights Fund | |
| | Investment income: | |
| | | | |
| | Dividends — unaffiliated issuers (net of foreign withholding taxes of $1,593, $20,926 and $12,344, respectively) | | $ | 3,464,575 | | | $ | 5,015,477 | | | $ | 8,321,164 | |
| | | | |
| | Dividends — affiliated issuers | | | 31,915 | | | | 69,867 | | | | 7,969 | |
| | | | |
| | Securities lending income — affiliated issuer | | | 57,817 | | | | 31,514 | | | | 4,607 | |
| | | | |
| | Total investment income | | | 3,557,576 | | | | 5,116,858 | | | | 8,333,740 | |
| | | | | | | | | | | | | | |
| | Expenses: | |
| | | | |
| | Management fees | | | 4,366,015 | | | | 2,291,669 | | | | 2,488,321 | |
| | | | |
| | Transfer Agency fees(a) | | | 502,821 | | | | 246,302 | | | | 470,981 | |
| | | | |
| | Printing and mailing costs | | | 166,039 | | | | 51,859 | | | | 100,510 | |
| | | | |
| | Distribution and Service fees(a) | | | 159,423 | | | | 202,396 | | | | 539,853 | |
| | | | |
| | Custody, accounting and administrative services | | | 100,165 | | | | 79,189 | | | | 86,491 | |
| | | | |
| | Professional fees | | | 49,503 | | | | 49,502 | | | | 49,503 | |
| | | | |
| | Registration fees | | | 27,423 | | | | 48,086 | | | | 29,641 | |
| | | | |
| | Trustee fees | | | 9,452 | | | | 8,977 | | | | 9,298 | |
| | | | |
| | Service Share fees — Service Plan | | | — | | | | — | | | | 8,034 | |
| | | | |
| | Service Share fees — Shareholder Administration Plan | | | — | | | | — | | | | 8,034 | |
| | | | |
| | Other | | | 31,776 | | | | 20,174 | | | | 23,847 | |
| | | | |
| | Total expenses | | | 5,412,617 | | | | 2,998,154 | | | | 3,814,513 | |
| | | | |
| | Less — expense reductions | | | (367,350 | ) | | | (255,441 | ) | | | (281,718 | ) |
| | | | |
| | Net expenses | | | 5,045,267 | | | | 2,742,713 | | | | 3,532,795 | |
| | | | |
| | NET INVESTMENT INCOME (LOSS) | | | (1,487,691 | ) | | | 2,374,145 | | | | 4,800,945 | |
| | | | | | | | | | | | | | |
| | Realized and unrealized gain (loss): | |
| | | | |
| | Net realized gain (loss) from: | | | | | | | | | | | | |
| | | | |
| | Investments | | | (39,053,314 | ) | | | (37,880,395 | ) | | | (39,546,768 | ) |
| | | | |
| | Futures contracts | | | 3,386,152 | | | | (3,832,513 | ) | | | 255,674 | |
| | | | |
| | Net change in unrealized gain (loss) on: | | | | | | | | | | | | |
| | | | |
| | Investments | | | (122,208,257 | ) | | | (111,049,982 | ) | | | 4,589,667 | |
| | | | |
| | Futures contracts | | | 1,108,929 | | | | 705,986 | | | | — | |
| | | | |
| | Net realized and unrealized loss | | | (156,766,490 | ) | | | (152,056,904 | ) | | | (34,701,427 | ) |
| | | | |
| | NET DECREASE IN NET ASSETS RESULTING FROM OPERATIONS | | $ | (158,254,181 | ) | | $ | (149,682,759 | ) | | $ | (29,900,482 | ) |
| | (a) | | Class specific Distribution and/or Service and Transfer Agency fees were as follows: |
| | | | | | | | | | | | | | | | | | | | | | | | | | | | | | | | | | | | | | | | | | | | |
| | | Distribution and/or Service Fees | | | Transfer Agency Fees | |
Fund | | Class A | | | Class C | | | Class R | | | Class A | | | Class C | | | Institutional | | | Service | | | Investor | | | Class P | | | Class R | | | Class R6 | |
Small Cap Growth Insights | | $ | 84,963 | | | $ | 38,595 | | | $ | 35,865 | | | $ | 57,774 | | | $ | 6,561 | | | $ | 64,805 | | | $ | — | | | $ | 315,556 | | | $ | 1,782 | | | $ | 12,194 | | | $ | 44,149 | |
Small Cap Value Insights | | | 147,014 | | | | 36,158 | | | | 19,224 | | | | 99,970 | | | | 6,147 | | | | 36,920 | | | | — | | | | 70,867 | | | | 6,388 | | | | 6,536 | | | | 19,474 | |
U.S. Equity Insights | | | 358,209 | | | | 76,721 | | | | 104,923 | | | | 243,581 | | | | 13,043 | | | | 53,417 | | | | 1,285 | | | | 88,256 | | | | 34,415 | | | | 35,674 | | | | 1,310 | |
| | |
| 48 | | The accompanying notes are an integral part of these financial statements. |
GOLDMAN SACHS DOMESTIC EQUITY INSIGHTS FUNDS
Statements of Changes in Net Assets
| | | | | | | | | | | | | | | | | | | | | | |
| | | | | Large Cap Growth Insights Fund | | | | | | Large Cap Value Insights Fund | |
| | | | | For the
Six Months Ended
April 30, 2020
(Unaudited) | | | For the Fiscal
Year Ended
October 31, 2019 | | | | | | For the
Six Months Ended
April 30, 2020
(Unaudited) | | | For the Fiscal
Year Ended
October 31, 2019 | |
| | From operations: | |
| | | | | | |
| | Net investment income | | $ | 3,924,507 | | | $ | 12,022,707 | | | | | | | $ | 3,553,797 | | | $ | 8,266,546 | |
| | | | | | |
| | Net realized gain (loss) | | | (53,299,678 | ) | | | 67,769,530 | | | | | | | | (23,520,478 | ) | | | (5,618,538 | ) |
| | | | | | |
| | Net change in unrealized gain (loss) | | | 94,136,346 | | | | 147,817,520 | | | | | | | | (40,758,316 | ) | | | 24,942,599 | |
| | | | | | |
| | Net increase (decrease) in net assets resulting from operations | | | 44,761,175 | | | | 227,609,757 | | | | | | | | (60,724,997 | ) | | | 27,590,607 | |
| | | | | | | | | | | | | | | | | | | | | | |
| | Distributions to shareholders: | |
| | | | | | |
| | From distributable earnings: | | | | | | | | | | | | | | | | | | | | |
| | | | | | |
| | Class A Shares | | | (11,437,017 | ) | | | (27,564,725 | ) | | | | | | | (436,922 | ) | | | (4,045,532 | ) |
| | | | | | |
| | Class C Shares | | | (1,652,223 | ) | | | (4,973,335 | ) | | | | | | | (38,428 | ) | | | (634,798 | ) |
| | | | | | |
| | Institutional Shares | | | (30,583,438 | ) | | | (67,332,090 | ) | | | | | | | (1,024,478 | ) | | | (8,978,283 | ) |
| | | | | | |
| | Service Shares | | | (1,907,093 | ) | | | (4,268,995 | ) | | | | | | | (43,462 | ) | | | (592,566 | ) |
| | | | | | |
| | Investor Shares | | | (16,644,105 | ) | | | (35,840,025 | ) | | | | | | | (1,011,484 | ) | | | (6,499,108 | ) |
| | | | | | |
| | Class P Shares | | | (2,075,071 | ) | | | (3,340,204 | ) | | | | | | | (307,857 | ) | | | (1,984,309 | ) |
| | | | | | |
| | Class R Shares | | | (1,215,415 | ) | | | (2,118,839 | ) | | | | | | | (30,313 | ) | | | (346,593 | ) |
| | | | | | |
| | Class R6 Shares | | | (12,792,716 | ) | | | (30,834,650 | ) | | | | | | | (654,231 | ) | | | (10,049,072 | ) |
| | | | | | |
| | Total distributions to shareholders | | | (78,307,078 | ) | | | (176,272,883 | ) | | | | | | | (3,547,175 | ) | | | (33,130,261 | ) |
| | | | | | | | | | | | | | | | | | | | | | |
| | From share transactions: | |
| | | | | | |
| | Proceeds from sales of shares | | | 233,553,731 | | | | 674,755,517 | | | | | | | | 50,734,012 | | | | 313,186,552 | |
| | | | | | |
| | Reinvestment of distributions | | | 69,749,290 | | | | 159,092,941 | | | | | | | | 3,370,898 | | | | 30,462,643 | |
| | | | | | |
| | Cost of shares redeemed | | | (548,736,598 | ) | | | (990,901,692 | ) | | | | | | | (97,396,343 | ) | | | (357,980,026 | ) |
| | | | | | |
| | Net decrease in net assets resulting from share transactions | | | (245,433,577 | ) | | | (157,053,234 | ) | | | | | | | (43,291,433 | ) | | | (14,330,831 | ) |
| | | | | | |
| | TOTAL DECREASE | | | (278,979,480 | ) | | | (105,716,360 | ) | | | | | | | (107,563,605 | ) | | | (19,870,485 | ) |
| | | | | | | | | | | | | | | | | | | | | | |
| | Net assets: | |
| | | | | | |
| | Beginning of period | | | 1,952,903,836 | | | | 2,058,620,196 | | | | | | | | 453,061,406 | | | | 472,931,891 | |
| | | | | | |
| | End of period | | $ | 1,673,924,356 | | | $ | 1,952,903,836 | | | | | | | $ | 345,497,801 | | | $ | 453,061,406 | |
| | |
| The accompanying notes are an integral part of these financial statements. | | 49 |
GOLDMAN SACHS DOMESTIC EQUITY INSIGHTS FUNDS
Statements of Changes in Net Assets(continued)
| | | | | | | | | | | | | | | | | | | | | | |
| | | | | Small Cap Equity Insights Fund | | | | | | Small Cap Growth Insights Fund | |
| | | | | For the
Six Months Ended
April 30, 2020
(Unaudited) | | | For the Fiscal
Year Ended
October 31, 2019 | | | | | | For the
Six Months Ended
April 30, 2020
(Unaudited) | | | For the Fiscal
Year Ended
October 31, 2019 | |
| | From operations: | |
| | | | | | |
| | Net investment income (loss) | | $ | 927,283 | | | $ | 3,000,138 | | | | | | | $ | (1,487,691 | ) | | $ | (896,597 | ) |
| | | | | | |
| | Net realized gain (loss) | | | (29,229,511 | ) | | | (8,624,564 | ) | | | | | | | (35,667,162 | ) | | | 12,785,720 | |
| | | | | | |
| | Net change in unrealized gain (loss) | | | (115,381,565 | ) | | | 53,942,051 | | | | | | | | (121,099,328 | ) | | | 61,026,644 | |
| | | | | | |
| | Net increase (decrease) in net assets resulting from operations | | | (143,683,793 | ) | | | 48,317,625 | | | | | | | | (158,254,181 | ) | | | 72,915,767 | |
| | | | | | | | | | | | | | | | | | | | | | |
| | Distributions to shareholders: | |
| | | | | | |
| | From distributable earnings: | | | | | | | | | | | | | | | | | | | | |
| | | | | | |
| | Class A Shares | | | (108,619 | ) | | | (2,973,498 | ) | | | | | | | (1,157,729 | ) | | | (8,979,679 | ) |
| | | | | | |
| | Class C Shares | | | — | | | | (464,085 | ) | | | | | | | (152,869 | ) | | | (1,069,015 | ) |
| | | | | | |
| | Institutional Shares | | | (1,626,736 | ) | | | (11,437,346 | ) | | | | | | | (3,974,277 | ) | | | (27,575,852 | ) |
| | | | | | |
| | Service Shares | | | (3,071 | ) | | | (124,376 | ) | | | | | | | — | | | | — | |
| | | | | | |
| | Investor Shares | | | (374,689 | ) | | | (2,425,323 | ) | | | | | | | (5,138,376 | ) | | | (31,017,003 | ) |
| | | | | | |
| | Class P Shares | | | (596,984 | ) | | | (3,278,915 | ) | | | | | | | (145,698 | ) | | | (778,940 | ) |
| | | | | | |
| | Class R Shares | | | — | | | | (786,446 | ) | | | | | | | (284,681 | ) | | | (2,101,140 | ) |
| | | | | | |
| | Class R6 Shares | | | (850,889 | ) | | | (9,476,064 | ) | | | | | | | (3,615,584 | ) | | | (14,097,427 | ) |
| | | | | | |
| | Total distributions to shareholders | | | (3,560,988 | ) | | | (30,966,053 | ) | | | | | | | (14,469,214 | ) | | | (85,619,056 | ) |
| | | | | | | | | | | | | | | | | | | | | | |
| | From share transactions: | |
| | | | | | |
| | Proceeds from sales of shares | | | 134,204,591 | | | | 382,161,015 | | | | | | | | 189,907,205 | | | | 549,336,651 | |
| | | | | | |
| | Reinvestment of distributions | | | 3,490,560 | | | | 30,650,153 | | | | | | | | 14,049,097 | | | | 84,301,544 | |
| | | | | | |
| | Cost of shares redeemed | | | (142,018,403 | ) | | | (300,885,593 | ) | | | | | | | (218,800,176 | ) | | | (321,356,916 | ) |
| | | | | | |
| | Net increase (decrease) in net assets resulting from share transactions | | | (4,323,252 | ) | | | 111,925,575 | | | | | | | | (14,843,874 | ) | | | 312,281,279 | |
| | | | | | |
| | TOTAL INCREASE (DECREASE) | | | (151,568,033 | ) | | | 129,277,147 | | | | | | | | (187,567,269 | ) | | | 299,577,990 | |
| | | | | | | | | | | | | | | | | | | | | | |
| | Net assets: | |
| | | | | | |
| | Beginning of period | | | 705,691,416 | | | | 576,414,269 | | | | | | | | 1,161,075,325 | | | | 861,497,335 | |
| | | | | | |
| | End of period | | $ | 554,123,383 | | | $ | 705,691,416 | | | | | | | $ | 973,508,056 | | | $ | 1,161,075,325 | |
| | |
| 50 | | The accompanying notes are an integral part of these financial statements. |
GOLDMAN SACHS DOMESTIC EQUITY INSIGHTS FUNDS
Statements of Changes in Net Assets(continued)
| | | | | | | | | | | | | | | | | | | | | | |
| | | | | Small Cap Value Insights Fund | | | | | | U.S. Equity Insights Fund | |
| | | | | For the
Six Months Ended
April 30, 2020
(Unaudited) | | | For the Fiscal
Year Ended
October 31, 2019 | | | | | | For the
Six Months Ended
April 30, 2020
(Unaudited) | | | For the Fiscal
Year Ended
October 31, 2019 | |
| | From operations: | |
| | | | | | |
| | Net investment income | | $ | 2,374,145 | | | $ | 3,524,458 | | | | | | | $ | 4,800,945 | | | $ | 17,119,702 | |
| | | | | | |
| | Net realized loss | | | (41,712,908 | ) | | | (3,519,243 | ) | | | | | | | (39,291,094 | ) | | | (12,531,144 | ) |
| | | | | | |
| | Net change in unrealized gain (loss) | | | (110,343,996 | ) | | | 37,195,393 | | | | | | | | 4,589,667 | | | | 112,092,449 | |
| | | | | | |
| | Net increase (decrease) in net assets resulting from operations | | | (149,682,759 | ) | | | 37,200,608 | | | | | | | | (29,900,482 | ) | | | 116,681,007 | |
| | | | | | | | | | | | | | | | | | | | | | |
| | Distributions to shareholders: | |
| | | | | | |
| | From distributable earnings: | | | | | | | | | | | | | | | | | | | | |
| | | | | | |
| | Class A Shares | | | (827,588 | ) | | | (10,543,077 | ) | | | | | | | (4,157,726 | ) | | | (11,514,034 | ) |
| | | | | | |
| | Class C Shares | | | (32,365 | ) | | | (844,101 | ) | | | | | | | (140,003 | ) | | | (572,348 | ) |
| | | | | | |
| | Institutional Shares | | | (1,458,393 | ) | | | (4,776,734 | ) | | | | | | | (4,700,529 | ) | | | (34,531,169 | ) |
| | | | | | |
| | Service Shares | | | — | | | | — | | | | | | | | (95,840 | ) | | | (218,665 | ) |
| | | | | | |
| | Investor Shares | | | (694,092 | ) | | | (1,907,349 | ) | | | | | | | (1,879,914 | ) | | | (4,499,108 | ) |
| | | | | | |
| | Class P Shares | | | (358,606 | ) | | | (2,877,391 | ) | | | | | | | (4,032,946 | ) | | | (6,101,132 | ) |
| | | | | | |
| | Class R Shares | | | (61,450 | ) | | | (225,486 | ) | | | | | | | (507,892 | ) | | | (1,722,455 | ) |
| | | | | | |
| | Class R6 Shares | | | (897,586 | ) | | | (1,908,993 | ) | | | | | | | (169,754 | ) | | | (1,352,886 | ) |
| | | | | | |
| | Total distributions to shareholders | | | (4,330,080 | ) | | | (23,083,131 | ) | | | | | | | (15,684,604 | ) | | | (60,511,797 | ) |
| | | | | | | | | | | | | | | | | | | | | | |
| | From share transactions: | |
| | | | | | |
| | Proceeds from sales of shares | | | 362,073,980 | | | | 372,978,518 | | | | | | | | 101,860,000 | | | | 475,796,540 | |
| | | | | | |
| | Reinvestment of distributions | | | 4,217,944 | | | | 22,702,592 | | | | | | | | 15,415,026 | | | | 59,440,795 | |
| | | | | | |
| | Cost of shares redeemed | | | (123,790,329 | ) | | | (106,350,529 | ) | | | | | | | (221,520,260 | ) | | | (1,128,321,651 | ) |
| | | | | | |
| | Net increase (decrease) in net assets resulting from share transactions | | | 242,501,595 | | | | 289,330,581 | | | | | | | | (104,245,234 | ) | | | (593,084,316 | ) |
| | | | | | |
| | TOTAL INCREASE (DECREASE) | | | 88,488,756 | | | | 303,448,058 | | | | | | | | (149,830,320 | ) | | | (536,915,106 | ) |
| | | | | | | | | | | | | | | | | | | | | | |
| | Net assets: | |
| | | | | | |
| | Beginning of period | | | 568,288,753 | | | | 264,840,695 | | | | | | | | 1,016,557,709 | | | | 1,553,472,815 | |
| | | | | | |
| | End of period | | $ | 656,777,509 | | | $ | 568,288,753 | | | | | | | $ | 866,727,389 | | | $ | 1,016,557,709 | |
| | |
| The accompanying notes are an integral part of these financial statements. | | 51 |
GOLDMAN SACHS LARGE CAP GROWTH INSIGHTS FUND
Financial Highlights
Selected Share Data for a Share Outstanding Throughout Each Period
| | | | | | | | | | | | | | | | | | | | | | | | | | |
| | | | | Goldman Sachs Large Cap Growth Insights Fund | |
| | | | | Class A Shares | |
| | | | | Six Months Ended
April 30, 2020
(Unaudited) | | | Year Ended October 31, | |
| | | | | 2019 | | | 2018 | | | 2017 | | | 2016 | | | 2015 | |
| | Per Share Data | |
| | | | | | | |
| | Net asset value, beginning of period | | $ | 31.54 | | | $ | 31.05 | | | $ | 30.36 | | | $ | 23.44 | | | $ | 23.13 | | | $ | 21.57 | |
| | | | | | | |
| | Net investment income(a) | | | 0.03 | | | | 0.10 | | | | 0.10 | | | | 0.10 | | | | 0.11 | | | | 0.16 | |
| | | | | | | |
| | Net realized and unrealized gain | | | 0.83 | | | | 3.00 | | | | 1.96 | | | | 6.93 | | | | 0.33 | | | | 1.55 | |
| | | | | | | |
| | Total from investment operations | | | 0.86 | | | | 3.10 | | | | 2.06 | | | | 7.03 | | | | 0.44 | | | | 1.71 | |
| | | | | | | |
| | Distributions to shareholders from net investment income | | | (0.10 | ) | | | (0.09 | ) | | | (0.08 | ) | | | (0.11 | ) | | | (0.13 | ) | | | (0.15 | ) |
| | | | | | | |
| | Distributions to shareholders from net realized gains | | | (1.12 | ) | | | (2.52 | ) | | | (1.29 | ) | | | — | | | | — | | | | — | |
| | | | | | | |
| | Total distributions | | | (1.22 | ) | | | (2.61 | ) | | | (1.37 | ) | | | (0.11 | ) | | | (0.13 | ) | | | (0.15 | ) |
| | | | | | | |
| | Net asset value, end of period | | $ | 31.18 | | | $ | 31.54 | | | $ | 31.05 | | | $ | 30.36 | | | $ | 23.44 | | | $ | 23.13 | |
| | | | | | | |
| | Total Return(b) | | | 2.68 | % | | | 11.28 | % | | | 6.95 | % | | | 30.11 | % | | | 1.93 | % | | | 7.96 | % |
| | | | | | | |
| | Net assets, end of period (in 000’s) | | $ | 265,535 | | | $ | 301,506 | | | $ | 317,418 | | | $ | 316,689 | | | $ | 254,036 | | | $ | 200,634 | |
| | | | | | | |
| | Ratio of net expenses to average net assets | | | 0.92 | %(c) | | | 0.93 | % | | | 0.92 | % | | | 0.95 | % | | | 0.96 | % | | | 0.96 | % |
| | | | | | | |
| | Ratio of total expenses to average net assets | | | 0.95 | %(c) | | | 0.97 | % | | | 0.95 | % | | | 1.10 | % | | | 1.15 | % | | | 1.16 | % |
| | | | | | | |
| | Ratio of net investment income to average net assets | | | 0.17 | %(c) | | | 0.33 | % | | | 0.32 | % | | | 0.38 | % | | | 0.49 | % | | | 0.72 | % |
| | | | | | | |
| | Portfolio turnover rate(d) | | | 104 | % | | | 192 | % | | | 188 | % | | | 196 | % | | | 254 | % | | | 222 | % |
| | (a) | | Calculated based on the average shares outstanding methodology. |
| | (b) | | Assumes investment at the NAV at the beginning of the period, reinvestment of all dividends and distributions, a complete redemption of the investment at the NAV at the end of the period and no sales or redemption charges (if any). Total returns would be reduced if a sales or redemption charge was taken into account. Returns do not reflect the impact of taxes to shareholders relating to Fund distributions or the redemption of Fund shares. Total returns for periods less than one full year are not annualized. |
| | (d) | | The Fund’s portfolio turnover rate is calculated in accordance with regulatory requirements, without regard to transactions involving short term investments and certain derivatives. If such transactions were included, the Fund’s portfolio turnover rate may be higher. |
| | |
| 52 | | The accompanying notes are an integral part of these financial statements. |
GOLDMAN SACHS LARGE CAP GROWTH INSIGHTS FUND
Financial Highlights(continued)
Selected Share Data for a Share Outstanding Throughout Each Period
| | | | | | | | | | | | | | | | | | | | | | | | | | |
| | | | | Goldman Sachs Large Cap Growth Insights Fund | |
| | | | | Class C Shares | |
| | | | | Six Months Ended
April 30, 2020
(Unaudited) | | | Year Ended October 31, | |
| | | | | 2019 | | | 2018 | | | 2017 | | | 2016 | | | 2015 | |
| | Per Share Data | |
| | | | | | | |
| | Net asset value, beginning of period | | $ | 27.79 | | | $ | 27.78 | | | $ | 27.42 | | | $ | 21.23 | | | $ | 21.02 | | | $ | 19.67 | |
| | | | | | | |
| | Net investment loss(a) | | | (0.08 | ) | | | (0.10 | ) | | | (0.12 | ) | | | (0.09 | ) | | | (0.05 | ) | | | (0.01 | ) |
| | | | | | | |
| | Net realized and unrealized gain | | | 0.75 | | | | 2.63 | | | | 1.77 | | | | 6.28 | | | | 0.30 | | | | 1.41 | |
| | | | | | | |
| | Total from investment operations | | | 0.67 | | | | 2.53 | | | | 1.65 | | | | 6.19 | | | | 0.25 | | | | 1.40 | |
| | | | | | | |
| | Distributions to shareholders from net investment income | | | — | | | | — | | | | — | | | | — | | | | (0.04 | ) | | | (0.05 | ) |
| | | | | | | |
| | Distributions to shareholders from net realized gains | | | (1.12 | ) | | | (2.52 | ) | | | (1.29 | ) | | | — | | | | — | | | | — | |
| | | | | | | |
| | Total distributions | | | (1.12 | ) | | | (2.52 | ) | | | (1.29 | ) | | | — | | | | (0.04 | ) | | | (0.05 | ) |
| | | | | | | |
| | Net asset value, end of period | | $ | 27.34 | | | $ | 27.79 | | | $ | 27.78 | | | $ | 27.42 | | | $ | 21.23 | | | $ | 21.02 | |
| | | | | | | |
| | Total Return(b) | | | 2.34 | % | | | 10.42 | % | | | 6.18 | % | | | 29.16 | % | | | 1.18 | % | | | 7.12 | % |
| | | | | | | |
| | Net assets, end of period (in 000’s) | | $ | 37,329 | | | $ | 42,004 | | | $ | 56,046 | | | $ | 63,500 | | | $ | 48,610 | | | $ | 49,658 | |
| | | | | | | |
| | Ratio of net expenses to average net assets | | | 1.67 | %(c) | | | 1.68 | % | | | 1.67 | % | | | 1.70 | % | | | 1.71 | % | | | 1.71 | % |
| | | | | | | |
| | Ratio of total expenses to average net assets | | | 1.70 | %(c) | | | 1.72 | % | | | 1.70 | % | | | 1.85 | % | | | 1.90 | % | | | 1.91 | % |
| | | | | | | |
| | Ratio of net investment loss to average net assets | | | (0.60 | )%(c) | | | (0.40 | )% | | | (0.42 | )% | | | (0.37 | )% | | | (0.25 | )% | | | (0.05 | )% |
| | | | | | | |
| | Portfolio turnover rate(d) | | | 104 | % | | | 192 | % | | | 188 | % | | | 196 | % | | | 254 | % | | | 222 | % |
| | (a) | | Calculated based on the average shares outstanding methodology. |
| | (b) | | Assumes investment at the NAV at the beginning of the period, reinvestment of all dividends and distributions, a complete redemption of the investment at the NAV at the end of the period and no sales or redemption charges (if any). Total returns would be reduced if a sales or redemption charge was taken into account. Returns do not reflect the impact of taxes to shareholders relating to Fund distributions or the redemption of Fund shares. Total returns for periods less than one full year are not annualized. |
| | (d) | | The Fund’s portfolio turnover rate is calculated in accordance with regulatory requirements, without regard to transactions involving short term investments and certain derivatives. If such transactions were included, the Fund’s portfolio turnover rate may be higher. |
| | |
| The accompanying notes are an integral part of these financial statements. | | 53 |
GOLDMAN SACHS LARGE CAP GROWTH INSIGHTS FUND
Financial Highlights(continued)
Selected Share Data for a Share Outstanding Throughout Each Period
| | | | | | | | | | | | | | | | | | | | | | | | | | |
| | | | | Goldman Sachs Large Cap Growth Insights Fund | |
| | | | | Institutional Shares | |
| | | | | Six Months Ended
April 30, 2020
(Unaudited) | | | Year Ended October 31, | |
| | | | | 2019 | | | 2018 | | | 2017 | | | 2016 | | | 2015 | |
| | Per Share Data | |
| | | | | | | |
| | Net asset value, beginning of period | | $ | 32.77 | | | $ | 32.17 | | | $ | 31.39 | | | $ | 24.21 | | | $ | 23.86 | | | $ | 22.22 | |
| | | | | | | |
| | Net investment income(a) | | | 0.09 | | | | 0.23 | | | | 0.23 | | | | 0.22 | | | | 0.21 | | | | 0.26 | |
| | | | | | | |
| | Net realized and unrealized gain | | | 0.88 | | | | 3.09 | | | | 2.02 | | | | 7.15 | | | | 0.34 | | | | 1.60 | |
| | | | | | | |
| | Total from investment operations | | | 0.97 | | | | 3.32 | | | | 2.25 | | | | 7.37 | | | | 0.55 | | | | 1.86 | |
| | | | | | | |
| | Distributions to shareholders from net investment income | | | (0.23 | ) | | | (0.20 | ) | | | (0.18 | ) | | | (0.19 | ) | | | (0.20 | ) | | | (0.22 | ) |
| | | | | | | |
| | Distributions to shareholders from net realized gains | | | (1.12 | ) | | | (2.52 | ) | | | (1.29 | ) | | | — | | | | — | | | | — | |
| | | | | | | |
| | Total distributions | | | (1.35 | ) | | | (2.72 | ) | | | (1.47 | ) | | | (0.19 | ) | | | (0.20 | ) | | | (0.22 | ) |
| | | | | | | |
| | Net asset value, end of period | | $ | 32.39 | | | $ | 32.77 | | | $ | 32.17 | | | $ | 31.39 | | | $ | 24.21 | | | $ | 23.86 | |
| | | | | | | |
| | Total Return(b) | | | 2.90 | % | | | 11.70 | % | | | 7.38 | % | | | 30.63 | % | | | 2.35 | % | | | 8.41 | % |
| | | | | | | |
| | Net assets, end of period (in 000’s) | | $ | 646,307 | | | $ | 760,316 | | | $ | 806,091 | | | $ | 897,009 | | | $ | 448,961 | | | $ | 493,322 | |
| | | | | | | |
| | Ratio of net expenses to average net assets | | | 0.54 | %(c) | | | 0.54 | % | | | 0.53 | % | | | 0.56 | % | | | 0.56 | % | | | 0.56 | % |
| | | | | | | |
| | Ratio of total expenses to average net assets | | | 0.57 | %(c) | | | 0.58 | % | | | 0.56 | % | | | 0.70 | % | | | 0.75 | % | | | 0.76 | % |
| | | | | | | |
| | Ratio of net investment income to average net assets | | | 0.56 | %(c) | | | 0.72 | % | | | 0.71 | % | | | 0.78 | % | | | 0.89 | % | | | 1.13 | % |
| | | | | | | |
| | Portfolio turnover rate(d) | | | 104 | % | | | 192 | % | | | 188 | % | | | 196 | % | | | 254 | % | | | 222 | % |
| | (a) | | Calculated based on the average shares outstanding methodology. |
| | (b) | | Assumes investment at the NAV at the beginning of the period, reinvestment of all dividends and distributions, a complete redemption of the investment at the NAV at the end of the period and no sales or redemption charges (if any). Total returns would be reduced if a sales or redemption charge was taken into account. Returns do not reflect the impact of taxes to shareholders relating to Fund distributions or the redemption of Fund shares. Total returns for periods less than one full year are not annualized. |
| | (d) | | The Fund’s portfolio turnover rate is calculated in accordance with regulatory requirements, without regard to transactions involving short term investments and certain derivatives. If such transactions were included, the Fund’s portfolio turnover rate may be higher. |
| | |
| 54 | | The accompanying notes are an integral part of these financial statements. |
GOLDMAN SACHS LARGE CAP GROWTH INSIGHTS FUND
Financial Highlights(continued)
Selected Share Data for a Share Outstanding Throughout Each Period
| | | | | | | | | | | | | | | | | | | | | | | | | | |
| | | | | Goldman Sachs Large Cap Growth Insights Fund | |
| | | | | Service Shares | |
| | | | | Six Months Ended
April 30, 2020
(Unaudited) | | | Year Ended October 31, | |
| | | | | 2019 | | | 2018 | | | 2017 | | | 2016 | | | 2015 | |
| | Per Share Data | |
| | | | | | | |
| | Net asset value, beginning of period | | $ | 31.02 | | | $ | 30.53 | | | $ | 29.94 | | | $ | 23.15 | | | $ | 22.89 | | | $ | 21.41 | |
| | | | | | | |
| | Net investment income(a) | | | 0.01 | | | | 0.07 | | | | 0.07 | | | | 0.04 | | | | 0.08 | | | | 0.13 | |
| | | | | | | |
| | Net realized and unrealized gain | | | 0.83 | | | | 2.95 | | | | 1.92 | | | | 6.88 | | | | 0.33 | | | | 1.55 | |
| | | | | | | |
| | Total from investment operations | | | 0.84 | | | | 3.02 | | | | 1.99 | | | | 6.92 | | | | 0.41 | | | | 1.68 | |
| | | | | | | |
| | Distributions to shareholders from net investment income | | | (0.07 | ) | | | (0.01 | ) | | | (0.11 | ) | | | (0.13 | ) | | | (0.15 | ) | | | (0.20 | ) |
| | | | | | | |
| | Distributions to shareholders from net realized gains | | | (1.12 | ) | | | (2.52 | ) | | | (1.29 | ) | | | — | | | | — | | | | — | |
| | | | | | | |
| | Total distributions | | | (1.19 | ) | | | (2.53 | ) | | | (1.40 | ) | | | (0.13 | ) | | | (0.15 | ) | | | (0.20 | ) |
| | | | | | | |
| | Net asset value, end of period | | $ | 30.67 | | | $ | 31.02 | | | $ | 30.53 | | | $ | 29.94 | | | $ | 23.15 | | | $ | 22.89 | |
| | | | | | | |
| | Total Return(b) | | | 2.63 | % | | | 11.15 | % | | | 6.82 | % | | | 30.04 | % | | | 1.82 | % | | | 7.88 | % |
| | | | | | | |
| | Net assets, end of period (in 000’s) | | $ | 37,380 | | | $ | 50,445 | | | $ | 53,347 | | | $ | 67,450 | | | $ | 12,517 | | | $ | 3,096 | |
| | | | | | | |
| | Ratio of net expenses to average net assets | | | 1.04 | %(c) | | | 1.04 | % | | | 1.03 | % | | | 1.05 | % | | | 1.06 | % | | | 1.06 | % |
| | | | | | | |
| | Ratio of total expenses to average net assets | | | 1.07 | %(c) | | | 1.08 | % | | | 1.06 | % | | | 1.19 | % | | | 1.26 | % | | | 1.26 | % |
| | | | | | | |
| | Ratio of net investment income to average net assets | | | 0.05 | %(c) | | | 0.22 | % | | | 0.21 | % | | | 0.17 | % | | | 0.34 | % | | | 0.60 | % |
| | | | | | | |
| | Portfolio turnover rate(d) | | | 104 | % | | | 192 | % | | | 188 | % | | | 196 | % | | | 254 | % | | | 222 | % |
| | (a) | | Calculated based on the average shares outstanding methodology. |
| | (b) | | Assumes investment at the NAV at the beginning of the period, reinvestment of all dividends and distributions, a complete redemption of the investment at the NAV at the end of the period and no sales or redemption charges (if any). Total returns would be reduced if a sales or redemption charge was taken into account. Returns do not reflect the impact of taxes to shareholders relating to Fund distributions or the redemption of Fund shares. Total returns for periods less than one full year are not annualized. |
| | (d) | | The Fund’s portfolio turnover rate is calculated in accordance with regulatory requirements, without regard to transactions involving short term investments and certain derivatives. If such transactions were included, the Fund’s portfolio turnover rate may be higher. |
| | |
| The accompanying notes are an integral part of these financial statements. | | 55 |
GOLDMAN SACHS LARGE CAP GROWTH INSIGHTS FUND
Financial Highlights(continued)
Selected Share Data for a Share Outstanding Throughout Each Period
| | | | | | | | | | | | | | | | | | | | | | | | | | |
| | | | | Goldman Sachs Large Cap Growth Insights Fund | |
| | | | | Investor Shares | |
| | | | | Six Months Ended
April 30, 2020
(Unaudited) | | | Year Ended October 31, | |
| | | | | 2019 | | | 2018 | | | 2017 | | | 2016 | | | 2015 | |
| | Per Share Data | |
| | | | | | | |
| | Net asset value, beginning of period | | $ | 31.13 | | | $ | 30.69 | | | $ | 30.03 | | | $ | 23.19 | | | $ | 22.88 | | | $ | 21.36 | |
| | | | | | | |
| | Net investment income(a) | | | 0.07 | | | | 0.17 | | | | 0.18 | | | | 0.16 | | | | 0.17 | | | | 0.22 | |
| | | | | | | |
| | Net realized and unrealized gain | | | 0.83 | | | | 2.95 | | | | 1.93 | | | | 6.86 | | | | 0.32 | | | | 1.52 | |
| | | | | | | |
| | Total from investment operations | | | 0.90 | | | | 3.12 | | | | 2.11 | | | | 7.02 | | | | 0.49 | | | | 1.74 | |
| | | | | | | |
| | Distributions to shareholders from net investment income | | | (0.19 | ) | | | (0.16 | ) | | | (0.16 | ) | | | (0.18 | ) | | | (0.18 | ) | | | (0.22 | ) |
| | | | | | | |
| | Distributions to shareholders from net realized gains | | | (1.12 | ) | | | (2.52 | ) | | | (1.29 | ) | | | — | | | | — | | | | — | |
| | | | | | | |
| | Total distributions | | | (1.31 | ) | | | (2.68 | ) | | | (1.45 | ) | | | (0.18 | ) | | | (0.18 | ) | | | (0.22 | ) |
| | | | | | | |
| | Net asset value, end of period | | $ | 30.72 | | | $ | 31.13 | | | $ | 30.69 | | | $ | 30.03 | | | $ | 23.19 | | | $ | 22.88 | |
| | | | | | | |
| | Total Return(b) | | | 2.82 | % | | | 11.56 | % | | | 7.23 | % | | | 30.43 | % | | | 2.18 | % | | | 8.21 | % |
| | | | | | | |
| | Net assets, end of period (in 000’s) | | $ | 312,321 | | | $ | 401,677 | | | $ | 415,757 | | | $ | 365,836 | | | $ | 48,133 | | | $ | 36,001 | |
| | | | | | | |
| | Ratio of net expenses to average net assets | | | 0.67 | %(c) | | | 0.68 | % | | | 0.67 | % | | | 0.70 | % | | | 0.71 | % | | | 0.71 | % |
| | | | | | | |
| | Ratio of total expenses to average net assets | | | 0.70 | %(c) | | | 0.72 | % | | | 0.70 | % | | | 0.84 | % | | | 0.90 | % | | | 0.91 | % |
| | | | | | | |
| | Ratio of net investment income to average net assets | | | 0.43 | %(c) | | | 0.58 | % | | | 0.56 | % | | | 0.59 | % | | | 0.74 | % | | | 0.97 | % |
| | | | | | | |
| | Portfolio turnover rate(d) | | | 104 | % | | | 192 | % | | | 188 | % | | | 196 | % | | | 254 | % | | | 222 | % |
| | (a) | | Calculated based on the average shares outstanding methodology. |
| | (b) | | Assumes investment at the NAV at the beginning of the period, reinvestment of all dividends and distributions, a complete redemption of the investment at the NAV at the end of the period and no sales or redemption charges (if any). Total returns would be reduced if a sales or redemption charge was taken into account. Returns do not reflect the impact of taxes to shareholders relating to Fund distributions or the redemption of Fund shares. Total returns for periods less than one full year are not annualized. |
| | (d) | | The Fund’s portfolio turnover rate is calculated in accordance with regulatory requirements, without regard to transactions involving short term investments and certain derivatives. If such transactions were included, the Fund’s portfolio turnover rate may be higher. |
| | |
| 56 | | The accompanying notes are an integral part of these financial statements. |
GOLDMAN SACHS LARGE CAP GROWTH INSIGHTS FUND
Financial Highlights(continued)
Selected Share Data for a Share Outstanding Throughout Each Period
| | | | | | | | | | | | | | |
| | | | | Goldman Sachs Large Cap Growth Insights Fund | |
| | | | | Class P Shares | |
| | | | | Six Months Ended
April 30, 2020
(Unaudited) | | | Year Ended
October 31, 2019 | | | Period Ended
October 31, 2018(a) | |
| | Per Share Data | | | | | | | | | | | | |
| | | | |
| | Net asset value, beginning of period | | $ | 32.74 | | | $ | 32.15 | | | $ | 32.07 | |
| | | | |
| | Net investment income(b) | | | 0.09 | | | | 0.22 | | | | 0.12 | |
| | | | |
| | Net realized and unrealized gain (loss) | | | 0.88 | | | | 3.10 | | | | (0.04 | ) |
| | | | |
| | Total from investment operations | | | 0.97 | | | | 3.32 | | | | 0.08 | |
| | | | |
| | Distributions to shareholders from net investment income | | | (0.24 | ) | | | (0.21 | ) | | | — | |
| | | | |
| | Distributions to shareholders from net realized gains | | | (1.12 | ) | | | (2.52 | ) | | | — | |
| | | | |
| | Total distributions | | | (1.36 | ) | | | (2.73 | ) | | | — | |
| | | | |
| | Net asset value, end of period | | $ | 32.35 | | | $ | 32.74 | | | $ | 32.15 | |
| | | | |
| | Total Return(c) | | | 2.89 | % | | | 11.71 | % | | | 0.25 | % |
| | | | |
| | Net assets, end of period (in 000’s) | | $ | 50,733 | | | $ | 49,099 | | | $ | 39,938 | |
| | | | |
| | Ratio of net expenses to average net assets | | | 0.53 | %(d) | | | 0.53 | % | | | 0.52 | %(d) |
| | | | |
| | Ratio of total expenses to average net assets | | | 0.56 | %(d) | | | 0.57 | % | | | 0.56 | %(d) |
| | | | |
| | Ratio of net investment income to average net assets | | | 0.56 | %(d) | | | 0.71 | % | | | 0.66 | %(d) |
| | | | |
| | Portfolio turnover rate(e) | | | 104 | % | | | 192 | % | | | 188 | % |
| | (a) | | Commenced operations on April 16, 2018. |
| | (b) | | Calculated based on the average shares outstanding methodology. |
| | (c) | | Assumes investment at the NAV at the beginning of the period, reinvestment of all dividends and distributions, a complete redemption of the investment at the NAV at the end of the period and no sales or redemption charges (if any). Total returns would be reduced if a sales or redemption charge was taken into account. Returns do not reflect the impact of taxes to shareholders relating to Fund distributions or the redemption of Fund shares. Total returns for periods less than one full year are not annualized. |
| | (e) | | The Fund’s portfolio turnover rate is calculated in accordance with regulatory requirements, without regard to transactions involving short term investments and certain derivatives. If such transactions were included, the Fund’s portfolio turnover rate may be higher. |
| | |
| The accompanying notes are an integral part of these financial statements. | | 57 |
GOLDMAN SACHS LARGE CAP GROWTH INSIGHTS FUND
Financial Highlights(continued)
Selected Share Data for a Share Outstanding Throughout Each Period
| | | | | | | | | | | | | | | | | | | | | | | | | | |
| | | | | Goldman Sachs Large Cap Growth Insights Fund | |
| | | | | Class R Shares | |
| | | | | Six Months Ended
April 30, 2020
(Unaudited) | | | Year Ended October 31, | |
| | | | | 2019 | | | 2018 | | | 2017 | | | 2016 | | | 2015 | |
| | Per Share Data | |
| | | | | | | |
| | Net asset value, beginning of period | | $ | 30.73 | | | $ | 30.30 | | | $ | 29.67 | | | $ | 22.93 | | | $ | 22.71 | | | $ | 21.25 | |
| | | | | | | |
| | Net investment income (loss)(a) | | | (0.01 | ) | | | 0.02 | | | | 0.02 | | | | 0.04 | | | | 0.05 | | | | 0.09 | |
| | | | | | | |
| | Net realized and unrealized gain | | | 0.82 | | | | 2.93 | | | | 1.92 | | | | 6.78 | | | | 0.32 | | | | 1.55 | |
| | | | | | | |
| | Total from investment operations | | | 0.81 | | | | 2.95 | | | | 1.94 | | | | 6.82 | | | | 0.37 | | | | 1.64 | |
| | | | | | | |
| | Distributions to shareholders from net investment income | | | (0.07 | ) | | | — | | | | (0.02 | ) | | | (0.08 | ) | | | (0.15 | ) | | | (0.18 | ) |
| | | | | | | |
| | Distributions to shareholders from net realized gains | | | (1.12 | ) | | | (2.52 | ) | | | (1.29 | ) | | | — | | | | — | | | | — | |
| | | | | | | |
| | Total distributions | | | (1.19 | ) | | | (2.52 | ) | | | (1.31 | ) | | | (0.08 | ) | | | (0.15 | ) | | | (0.18 | ) |
| | | | | | | |
| | Net asset value, end of period | | $ | 30.35 | | | $ | 30.73 | | | $ | 30.30 | | | $ | 29.67 | | | $ | 22.93 | | | $ | 22.71 | |
| | | | | | | |
| | Total Return(b) | | | 2.56 | % | | | 10.98 | % | | | 6.69 | % | | | 29.81 | % | | | 1.66 | % | | | 7.73 | % |
| | | | | | | |
| | Net assets, end of period (in 000’s) | | $ | 26,560 | | | $ | 34,397 | | | $ | 25,893 | | | $ | 29,734 | | | $ | 20,635 | | | $ | 10,660 | |
| | | | | | | |
| | Ratio of net expenses to average net assets | | | 1.17 | %(c) | | | 1.18 | % | | | 1.17 | % | | | 1.20 | % | | | 1.21 | % | | | 1.21 | % |
| | | | | | | |
| | Ratio of total expenses to average net assets | | | 1.20 | %(c) | | | 1.22 | % | | | 1.20 | % | | | 1.35 | % | | | 1.40 | % | | | 1.41 | % |
| | | | | | | |
| | Ratio of net investment income (loss) to average net assets | | | (0.08 | )%(c) | | | 0.05 | % | | | 0.08 | % | | | 0.14 | % | | | 0.22 | % | | | 0.39 | % |
| | | | | | | |
| | Portfolio turnover rate(d) | | | 104 | % | | | 192 | % | | | 188 | % | | | 196 | % | | | 254 | % | | | 222 | % |
| | (a) | | Calculated based on the average shares outstanding methodology. |
| | (b) | | Assumes investment at the NAV at the beginning of the period, reinvestment of all dividends and distributions, a complete redemption of the investment at the NAV at the end of the period and no sales or redemption charges (if any). Total returns would be reduced if a sales or redemption charge was taken into account. Returns do not reflect the impact of taxes to shareholders relating to Fund distributions or the redemption of Fund shares. Total returns for periods less than one full year are not annualized. |
| | (d) | | The Fund’s portfolio turnover rate is calculated in accordance with regulatory requirements, without regard to transactions involving short term investments and certain derivatives. If such transactions were included, the Fund’s portfolio turnover rate may be higher. |
| | |
| 58 | | The accompanying notes are an integral part of these financial statements. |
GOLDMAN SACHS LARGE CAP GROWTH INSIGHTS FUND
Financial Highlights(continued)
Selected Share Data for a Share Outstanding Throughout Each Period
| | | | | | | | | | | | | | | | | | | | | | | | | | |
| | | | | Goldman Sachs Large Cap Growth Insights Fund | |
| | | | | Class R6 Shares | |
| | | | | Six Months Ended
April 30, 2020
(Unaudited) | | | Year Ended October 31, | | | Period Ended
October 31, 2015(a) | |
| | | | | 2019 | | | 2018 | | | 2017 | | | 2016 | |
| | Per Share Data | |
| | | | | | | |
| | Net asset value, beginning of period | | $ | 32.75 | | | $ | 32.15 | | | $ | 31.38 | | | $ | 24.21 | | | $ | 23.86 | | | $ | 23.90 | |
| | | | | | | |
| | Net investment income(b) | | | 0.09 | | | | 0.23 | | | | 0.24 | | | | 0.21 | | | | 0.18 | | | | 0.06 | |
| | | | | | | |
| | Net realized and unrealized gain (loss) | | | 0.88 | | | | 3.10 | | | | 2.01 | | | | 7.16 | | | | 0.38 | | | | (0.10 | ) |
| | | | | | | |
| | Total from investment operations | | | 0.97 | | | | 3.33 | | | | 2.25 | | | | 7.37 | | | | 0.56 | | | | (0.04 | ) |
| | | | | | | |
| | Distributions to shareholders from net investment income | | | (0.23 | ) | | | (0.21 | ) | | | (0.19 | ) | | | (0.20 | ) | | | (0.21 | ) | | | — | |
| | | | | | | |
| | Distributions to shareholders from net realized gains | | | (1.12 | ) | | | (2.52 | ) | | | (1.29 | ) | | | — | | | | — | | | | — | |
| | | | | | | |
| | Total distributions | | | (1.35 | ) | | | (2.73 | ) | | | (1.48 | ) | | | (0.20 | ) | | | (0.21 | ) | | | — | |
| | | | | | | |
| | Net asset value, end of period | | $ | 32.37 | | | $ | 32.75 | | | $ | 32.15 | | | $ | 31.38 | | | $ | 24.21 | | | $ | 23.86 | |
| | | | | | | |
| | Total Return(c) | | | 2.91 | % | | | 11.72 | % | | | 7.37 | % | | | 30.64 | % | | | 2.38 | % | | | (0.17 | )% |
| | | | | | | |
| | Net assets, end of period (in 000’s) | | $ | 297,759 | | | $ | 313,461 | | | $ | 344,129 | | | $ | 133,877 | | | $ | 8,208 | | | $ | 10 | |
| | | | | | | |
| | Ratio of net expenses to average net assets | | | 0.53 | %(d) | | | 0.53 | % | | | 0.52 | % | | | 0.54 | % | | | 0.54 | % | | | 0.54 | %(d) |
| | | | | | | |
| | Ratio of total expenses to average net assets | | | 0.56 | %(d) | | | 0.57 | % | | | 0.55 | % | | | 0.67 | % | | | 0.74 | % | | | 0.74 | %(d) |
| | | | | | | |
| | Ratio of net investment income to average net assets | | | 0.56 | %(d) | | | 0.75 | % | | | 0.71 | % | | | 0.74 | % | | | 0.72 | % | | | 1.00 | %(d) |
| | | | | | | |
| | Portfolio turnover rate(e) | | | 104 | % | | | 192 | % | | | 188 | % | | | 196 | % | | | 254 | % | | | 222 | % |
| | (a) | | Commenced operations on July 31, 2015. |
| | (b) | | Calculated based on the average shares outstanding methodology. |
| | (c) | | Assumes investment at the NAV at the beginning of the period, reinvestment of all dividends and distributions, a complete redemption of the investment at the NAV at the end of the period and no sales or redemption charges (if any). Total returns would be reduced if a sales or redemption charge was taken into account. Returns do not reflect the impact of taxes to shareholders relating to Fund distributions or the redemption of Fund shares. Total returns for periods less than one full year are not annualized. |
| | (e) | | The Fund’s portfolio turnover rate is calculated in accordance with regulatory requirements, without regard to transactions involving short term investments and certain derivatives. If such transactions were included, the Fund’s portfolio turnover rate may be higher. |
| | |
| The accompanying notes are an integral part of these financial statements. | | 59 |
GOLDMAN SACHS LARGE CAP VALUE INSIGHTS FUND
Financial Highlights(continued)
Selected Share Data for a Share Outstanding Throughout Each Period
| | | | | | | | | | | | | | | | | | | | | | | | | | |
| | | | | Goldman Sachs Large Cap Value Insights Fund | |
| | | | | Class A Shares | |
| | | | | Six Months Ended
April 30, 2020
(Unaudited) | | | Year Ended October 31, | |
| | | | | 2019 | | | 2018 | | | 2017 | | | 2016 | | | 2015 | |
| | Per Share Data | |
| | | | | | | |
| | Net asset value, beginning of period | | $ | 21.27 | | | $ | 21.59 | | | $ | 21.01 | | | $ | 17.27 | | | $ | 16.92 | | | $ | 16.86 | |
| | | | | | | |
| | Net investment income(a) | | | 0.15 | | | | 0.28 | | | | 0.25 | | | | 0.27 | | | | 0.23 | | | | 0.24 | |
| | | | | | | |
| | Net realized and unrealized gain (loss) | | | (3.21 | ) | | | 0.75 | | | | 0.56 | | | | 3.77 | | | | 0.33 | | | | 0.06 | |
| | | | | | | |
| | Total from investment operations | | | (3.06 | ) | | | 1.03 | | | | 0.81 | | | | 4.04 | | | | 0.56 | | | | 0.30 | |
| | | | | | | |
| | Distributions to shareholders from net investment income | | | (0.15 | ) | | | (0.29 | ) | | | (0.23 | ) | | | (0.30 | ) | | | (0.21 | ) | | | (0.24 | ) |
| | | | | | | |
| | Distributions to shareholders from net realized gains | | | — | | | | (1.06 | ) | | | — | | | | — | | | | — | | | | — | |
| | | | | | | |
| | Total distributions | | | (0.15 | ) | | | (1.35 | ) | | | (0.23 | ) | | | (0.30 | ) | | | (0.21 | ) | | | (0.24 | ) |
| | | | | | | |
| | Net asset value, end of period | | $ | 18.06 | | | $ | 21.27 | | | $ | 21.59 | | | $ | 21.01 | | | $ | 17.27 | | | $ | 16.92 | |
| | | | | | | |
| | Total Return(b) | | | (14.43 | )% | | | 5.30 | % | | | 3.82 | % | | | 23.51 | % | | | 3.35 | % | | | 1.82 | % |
| | | | | | | |
| | Net assets, end of period (in 000’s) | | $ | 51,298 | | | $ | 65,556 | | | $ | 62,349 | | | $ | 63,848 | | | $ | 60,942 | | | $ | 62,150 | |
| | | | | | | |
| | Ratio of net expenses to average net assets | | | 0.94 | %(c) | | | 0.95 | % | | | 0.95 | % | | | 0.96 | % | | | 0.96 | % | | | 0.96 | % |
| | | | | | | |
| | Ratio of total expenses to average net assets | | | 1.04 | %(c) | | | 1.07 | % | | | 1.03 | % | | | 1.10 | % | | | 1.15 | % | | | 1.12 | % |
| | | | | | | |
| | Ratio of net investment income to average net assets | | | 1.48 | %(c) | | | 1.36 | % | | | 1.13 | % | | | 1.37 | % | | | 1.36 | % | | | 1.39 | % |
| | | | | | | |
| | Portfolio turnover rate(d) | | | 94 | % | | | 225 | % | | | 202 | % | | | 208 | % | | | 229 | % | | | 221 | % |
| | (a) | | Calculated based on the average shares outstanding methodology. |
| | (b) | | Assumes investment at the NAV at the beginning of the period, reinvestment of all dividends and distributions, a complete redemption of the investment at the NAV at the end of the period and no sales or redemption charges (if any). Total returns would be reduced if a sales or redemption charge was taken into account. Returns do not reflect the impact of taxes to shareholders relating to Fund distributions or the redemption of Fund shares. Total returns for periods less than one full year are not annualized. |
| | (d) | | The Fund’s portfolio turnover rate is calculated in accordance with regulatory requirements, without regard to transactions involving short term investments and certain derivatives. If such transactions were included, the Fund’s portfolio turnover rate may be higher. |
| | |
| 60 | | The accompanying notes are an integral part of these financial statements. |
GOLDMAN SACHS LARGE CAP VALUE INSIGHTS FUND
Financial Highlights(continued)
Selected Share Data for a Share Outstanding Throughout Each Period
| | | | | | | | | | | | | | | | | | | | | | | | | | |
| | | | | Goldman Sachs Large Cap Value Insights Fund | |
| | | | | Class C Shares | |
| | | | | Six Months Ended
April 30, 2020
(Unaudited) | | | Year Ended October 31, | |
| | | | | 2019 | | | 2018 | | | 2017 | | | 2016 | | | 2015 | |
| | Per Share Data | |
| | | | | | | |
| | Net asset value, beginning of period | | $ | 21.06 | | | $ | 21.39 | | | $ | 20.82 | | | $ | 17.12 | | | $ | 16.78 | | | $ | 16.71 | |
| | | | | | | |
| | Net investment income(a) | | | 0.07 | | | | 0.12 | | | | 0.08 | | | | 0.11 | | | | 0.10 | | | | 0.11 | |
| | | | | | | |
| | Net realized and unrealized gain (loss) | | | (3.17 | ) | | | 0.75 | | | | 0.55 | | | | 3.75 | | | | 0.33 | | | | 0.07 | |
| | | | | | | |
| | Total from investment operations | | | (3.10 | ) | | | 0.87 | | | | 0.63 | | | | 3.86 | | | | 0.43 | | | | 0.18 | |
| | | | | | | |
| | Distributions to shareholders from net investment income | | | (0.07 | ) | | | (0.14 | ) | | | (0.06 | ) | | | (0.16 | ) | | | (0.09 | ) | | | (0.11 | ) |
| | | | | | | |
| | Distributions to shareholders from net realized gains | | | — | | | | (1.06 | ) | | | — | | | | — | | | | — | | | | — | |
| | | | | | | |
| | Total distributions | | | (0.07 | ) | | | (1.20 | ) | | | (0.06 | ) | | | (0.16 | ) | | | (0.09 | ) | | | (0.11 | ) |
| | | | | | | |
| | Net asset value, end of period | | $ | 17.89 | | | $ | 21.06 | | | $ | 21.39 | | | $ | 20.82 | | | $ | 17.12 | | | $ | 16.78 | |
| | | | | | | |
| | Total Return(b) | | | (14.75 | )% | | | 4.53 | % | | | 3.00 | % | | | 22.59 | % | | | 2.56 | % | | | 1.11 | % |
| | | | | | | |
| | Net assets, end of period (in 000’s) | | $ | 10,005 | | | $ | 12,694 | | | $ | 10,058 | | | $ | 10,601 | | | $ | 13,437 | | | $ | 15,658 | |
| | | | | | | |
| | Ratio of net expenses to average net assets | | | 1.70 | %(c) | | | 1.70 | % | | | 1.70 | % | | | 1.71 | % | | | 1.71 | % | | | 1.71 | % |
| | | | | | | |
| | Ratio of total expenses to average net assets | | | 1.79 | %(c) | | | 1.82 | % | | | 1.78 | % | | | 1.85 | % | | | 1.90 | % | | | 1.87 | % |
| | | | | | | |
| | Ratio of net investment income to average net assets | | | 0.74 | %(c) | | | 0.61 | % | | | 0.37 | % | | | 0.59 | % | | | 0.61 | % | | | 0.64 | % |
| | | | | | | |
| | Portfolio turnover rate(d) | | | 94 | % | | | 225 | % | | | 202 | % | | | 208 | % | | | 229 | % | | | 221 | % |
| | (a) | | Calculated based on the average shares outstanding methodology. |
| | (b) | | Assumes investment at the NAV at the beginning of the period, reinvestment of all dividends and distributions, a complete redemption of the investment at the NAV at the end of the period and no sales or redemption charges (if any). Total returns would be reduced if a sales or redemption charge was taken into account. Returns do not reflect the impact of taxes to shareholders relating to Fund distributions or the redemption of Fund shares. Total returns for periods less than one full year are not annualized. |
| | (d) | | The Fund’s portfolio turnover rate is calculated in accordance with regulatory requirements, without regard to transactions involving short term investments and certain derivatives. If such transactions were included, the Fund’s portfolio turnover rate may be higher. |
| | |
| The accompanying notes are an integral part of these financial statements. | | 61 |
GOLDMAN SACHS LARGE CAP VALUE INSIGHTS FUND
Financial Highlights(continued)
Selected Share Data for a Share Outstanding Throughout Each Period
| | | | | | | | | | | | | | | | | | | | | | | | | | |
| | | | | Goldman Sachs Large Cap Value Insights Fund | |
| | | | | Institutional Shares | |
| | | | | Six Months Ended
April 30, 2020
(Unaudited) | | | Year Ended October 31, | |
| | | | | 2019 | | | 2018 | | | 2017 | | | 2016 | | | 2015 | |
| | Per Share Data | |
| | | | | | | |
| | Net asset value, beginning of period | | $ | 21.24 | | | $ | 21.57 | | | $ | 20.99 | | | $ | 17.25 | | | $ | 16.91 | | | $ | 16.85 | |
| | | | | | | |
| | Net investment income(a) | | | 0.19 | | | | 0.36 | | | | 0.33 | | | | 0.35 | | | | 0.29 | | | | 0.31 | |
| | | | | | | |
| | Net realized and unrealized gain (loss) | | | (3.21 | ) | | | 0.74 | | | | 0.56 | | | | 3.77 | | | | 0.32 | | | | 0.06 | |
| | | | | | | |
| | Total from investment operations | | | (3.02 | ) | | | 1.10 | | | | 0.89 | | | | 4.12 | | | | 0.61 | | | | 0.37 | |
| | | | | | | |
| | Distributions to shareholders from net investment income | | | (0.19 | ) | | | (0.37 | ) | | | (0.31 | ) | | | (0.38 | ) | | | (0.27 | ) | | | (0.31 | ) |
| | | | | | | |
| | Distributions to shareholders from net realized gains | | | — | | | | (1.06 | ) | | | — | | | | — | | | | — | | | | — | |
| | | | | | | |
| | Total distributions | | | (0.19 | ) | | | (1.43 | ) | | | (0.31 | ) | | | (0.38 | ) | | | (0.27 | ) | | | (0.31 | ) |
| | | | | | | |
| | Net asset value, end of period | | $ | 18.03 | | | $ | 21.24 | | | $ | 21.57 | | | $ | 20.99 | | | $ | 17.25 | | | $ | 16.91 | |
| | | | | | | |
| | Total Return(b) | | | (14.27 | )% | | | 5.68 | % | | | 4.22 | % | | | 24.02 | % | | | 3.69 | % | | | 2.24 | % |
| | | | | | | |
| | Net assets, end of period (in 000’s) | | $ | 92,365 | | | $ | 120,417 | | | $ | 122,587 | | | $ | 261,684 | | | $ | 341,830 | | | $ | 296,403 | |
| | | | | | | |
| | Ratio of net expenses to average net assets | | | 0.56 | %(c) | | | 0.57 | % | | | 0.56 | % | | | 0.56 | % | | | 0.56 | % | | | 0.56 | % |
| | | | | | | |
| | Ratio of total expenses to average net assets | | | 0.66 | %(c) | | | 0.68 | % | | | 0.64 | % | | | 0.70 | % | | | 0.75 | % | | | 0.72 | % |
| | | | | | | |
| | Ratio of net investment income to average net assets | | | 1.85 | %(c) | | | 1.74 | % | | | 1.52 | % | | | 1.78 | % | | | 1.73 | % | | | 1.81 | % |
| | | | | | | |
| | Portfolio turnover rate(d) | | | 94 | % | | | 225 | % | | | 202 | % | | | 208 | % | | | 229 | % | | | 221 | % |
| | (a) | | Calculated based on the average shares outstanding methodology. |
| | (b) | | Assumes investment at the NAV at the beginning of the period, reinvestment of all dividends and distributions, a complete redemption of the investment at the NAV at the end of the period and no sales or redemption charges (if any). Total returns would be reduced if a sales or redemption charge was taken into account. Returns do not reflect the impact of taxes to shareholders relating to Fund distributions or the redemption of Fund shares. Total returns for periods less than one full year are not annualized. |
| | (d) | | The Fund’s portfolio turnover rate is calculated in accordance with regulatory requirements, without regard to transactions involving short term investments and certain derivatives. If such transactions were included, the Fund’s portfolio turnover rate may be higher. |
| | |
| 62 | | The accompanying notes are an integral part of these financial statements. |
GOLDMAN SACHS LARGE CAP VALUE INSIGHTS FUND
Financial Highlights(continued)
Selected Share Data for a Share Outstanding Throughout Each Period
| | | | | | | | | | | | | | | | | | | | | | | | | | |
| | | | | Goldman Sachs Large Cap Value Insights Fund | |
| | | | | Service Shares | |
| | | | | Six Months Ended
April 30, 2020
(Unaudited) | | | Year Ended October 31, | |
| | | | | 2019 | | | 2018 | | | 2017 | | | 2016 | | | 2015 | |
| | Per Share Data | |
| | | | | | | |
| | Net asset value, beginning of period | | $ | 21.36 | | | $ | 21.67 | | | $ | 21.09 | | | $ | 17.34 | | | $ | 16.99 | | | $ | 16.92 | |
| | | | | | | |
| | Net investment income(a) | | | 0.14 | | | | 0.27 | | | | 0.22 | | | | 0.25 | | | | 0.21 | | | | 0.22 | |
| | | | | | | |
| | Net realized and unrealized gain (loss) | | | (3.23 | ) | | | 0.75 | | | | 0.56 | | | | 3.79 | | | | 0.33 | | | | 0.07 | |
| | | | | | | |
| | Total from investment operations | | | (3.09 | ) | | | 1.02 | | | | 0.78 | | | | 4.04 | | | | 0.54 | | | | 0.29 | |
| | | | | | | |
| | Distributions to shareholders from net investment income | | | (0.13 | ) | | | (0.27 | ) | | | (0.20 | ) | | | (0.29 | ) | | | (0.19 | ) | | | (0.22 | ) |
| | | | | | | |
| | Distributions to shareholders from net realized gains | | | — | | | | (1.06 | ) | | | — | | | | — | | | | — | | | | — | |
| | | | | | | |
| | Total distributions | | | (0.13 | ) | | | (1.33 | ) | | | (0.20 | ) | | | (0.29 | ) | | | (0.19 | ) | | | (0.22 | ) |
| | | | | | | |
| | Net asset value, end of period | | $ | 18.14 | | | $ | 21.36 | | | $ | 21.67 | | | $ | 21.09 | | | $ | 17.34 | | | $ | 16.99 | |
| | | | | | | |
| | Total Return(b) | | | (14.49 | )% | | | 5.19 | % | | | 3.70 | % | | | 23.37 | % | | | 3.22 | % | | | 1.77 | % |
| | | | | | | |
| | Net assets, end of period (in 000’s) | | $ | 5,745 | | | $ | 7,554 | | | $ | 10,199 | | | $ | 8,403 | | | $ | 6,014 | | | $ | 7,271 | |
| | | | | | | |
| | Ratio of net expenses to average net assets | | | 1.06 | %(c) | | | 1.07 | % | | | 1.06 | % | | | 1.06 | % | | | 1.06 | % | | | 1.06 | % |
| | | | | | | |
| | Ratio of total expenses to average net assets | | | 1.16 | %(c) | | | 1.18 | % | | | 1.14 | % | | | 1.20 | % | | | 1.24 | % | | | 1.22 | % |
| | | | | | | |
| | Ratio of net investment income to average net assets | | | 1.36 | %(c) | | | 1.28 | % | | | 1.00 | % | | | 1.28 | % | | | 1.27 | % | | | 1.29 | % |
| | | | | | | |
| | Portfolio turnover rate(d) | | | 94 | % | | | 225 | % | | | 202 | % | | | 208 | % | | | 229 | % | | | 221 | % |
| | (a) | | Calculated based on the average shares outstanding methodology. |
| | (b) | | Assumes investment at the NAV at the beginning of the period, reinvestment of all dividends and distributions, a complete redemption of the investment at the NAV at the end of the period and no sales or redemption charges (if any). Total returns would be reduced if a sales or redemption charge was taken into account. Returns do not reflect the impact of taxes to shareholders relating to Fund distributions or the redemption of Fund shares. Total returns for periods less than one full year are not annualized. |
| | (d) | | The Fund’s portfolio turnover rate is calculated in accordance with regulatory requirements, without regard to transactions involving short term investments and certain derivatives. If such transactions were included, the Fund’s portfolio turnover rate may be higher. |
| | |
| The accompanying notes are an integral part of these financial statements. | | 63 |
GOLDMAN SACHS LARGE CAP VALUE INSIGHTS FUND
Financial Highlights(continued)
Selected Share Data for a Share Outstanding Throughout Each Period
| | | | | | | | | | | | | | | | | | | | | | | | | | |
| | | | | Goldman Sachs Large Cap Value Insights Fund | |
| | | | | Investor Shares | |
| | | | | Six Months Ended
April 30, 2020
(Unaudited) | | | Year Ended October 31, | |
| | | | | 2019 | | | 2018 | | | 2017 | | | 2016 | | | 2015 | |
| | Per Share Data | |
| | | | | | | |
| | Net asset value, beginning of period | | $ | 21.18 | | | $ | 21.51 | | | $ | 20.94 | | | $ | 17.22 | | | $ | 16.88 | | | $ | 16.81 | |
| | | | | | | |
| | Net investment income(a) | | | 0.17 | | | | 0.32 | | | | 0.29 | | | | 0.34 | | | | 0.26 | | | | 0.27 | |
| | | | | | | |
| | Net realized and unrealized gain (loss) | | | (3.20 | ) | | | 0.76 | | | | 0.57 | | | | 3.74 | | | | 0.33 | | | | 0.08 | |
| | | | | | | |
| | Total from investment operations | | | (3.03 | ) | | | 1.08 | | | | 0.86 | | | | 4.08 | | | | 0.59 | | | | 0.35 | |
| | | | | | | |
| | Distributions to shareholders from net investment income | | | (0.17 | ) | | | (0.35 | ) | | | (0.29 | ) | | | (0.36 | ) | | | (0.25 | ) | | | (0.28 | ) |
| | | | | | | |
| | Distributions to shareholders from net realized gains | | | — | | | | (1.06 | ) | | | — | | | | — | | | | — | | | | — | |
| | | | | | | |
| | Total distributions | | | (0.17 | ) | | | (1.41 | ) | | | (0.29 | ) | | | (0.36 | ) | | | (0.25 | ) | | | (0.28 | ) |
| | | | | | | |
| | Net asset value, end of period | | $ | 17.98 | | | $ | 21.18 | | | $ | 21.51 | | | $ | 20.94 | | | $ | 17.22 | | | $ | 16.88 | |
| | | | | | | |
| | Total Return(b) | | | (14.33 | )% | | | 5.55 | % | | | 4.07 | % | | | 23.79 | % | | | 3.57 | % | | | 2.14 | % |
| | | | | | | |
| | Net assets, end of period (in 000’s) | | $ | 90,953 | | | $ | 134,069 | | | $ | 84,895 | | | $ | 29,871 | | | $ | 9,947 | | | $ | 5,425 | |
| | | | | | | |
| | Ratio of net expenses to average net assets | | | 0.69 | %(c) | | | 0.70 | % | | | 0.70 | % | | | 0.71 | % | | | 0.71 | % | | | 0.71 | % |
| | | | | | | |
| | Ratio of total expenses to average net assets | | | 0.79 | %(c) | | | 0.82 | % | | | 0.78 | % | | | 0.84 | % | | | 0.90 | % | | | 0.87 | % |
| | | | | | | |
| | Ratio of net investment income to average net assets | | | 1.72 | %(c) | | | 1.58 | % | | | 1.33 | % | | | 1.70 | % | | | 1.56 | % | | | 1.60 | % |
| | | | | | | |
| | Portfolio turnover rate(d) | | | 94 | % | | | 225 | % | | | 202 | % | | | 208 | % | | | 229 | % | | | 221 | % |
| | (a) | | Calculated based on the average shares outstanding methodology. |
| | (b) | | Assumes investment at the NAV at the beginning of the period, reinvestment of all dividends and distributions, a complete redemption of the investment at the NAV at the end of the period and no sales or redemption charges (if any). Total returns would be reduced if a sales or redemption charge was taken into account. Returns do not reflect the impact of taxes to shareholders relating to Fund distributions or the redemption of Fund shares. Total returns for periods less than one full year are not annualized. |
| | (d) | | The Fund’s portfolio turnover rate is calculated in accordance with regulatory requirements, without regard to transactions involving short term investments and certain derivatives. If such transactions were included, the Fund’s portfolio turnover rate may be higher. |
| | |
| 64 | | The accompanying notes are an integral part of these financial statements. |
GOLDMAN SACHS LARGE CAP VALUE INSIGHTS FUND
Financial Highlights(continued)
Selected Share Data for a Share Outstanding Throughout Each Period
| | | | | | | | | | | | | | |
| | | | | Goldman Sachs Large Cap Value Insights Fund | |
| | | | | Class P Shares | |
| | | | | Six Months Ended
April 30, 2020
(Unaudited) | | | Year Ended
October 31, 2019 | | | Period Ended
October 31, 2018(a) | |
| | Per Share Data | | | | | | | | | | | | |
| | | | |
| | Net asset value, beginning of period | | $ | 21.23 | | | $ | 21.55 | | | $ | 21.87 | |
| | | | |
| | Net investment income(b) | | | 0.19 | | | | 0.36 | | | | 0.17 | |
| | | | |
| | Net realized and unrealized gain (loss) | | | (3.21 | ) | | | 0.76 | | | | (0.33 | ) |
| | | | |
| | Total from investment operations | | | (3.02 | ) | | | 1.12 | | | | (0.16 | ) |
| | | | |
| | Distributions to shareholders from net investment income | | | (0.19 | ) | | | (0.38 | ) | | | (0.16 | ) |
| | | | |
| | Distributions to shareholders from net realized gains | | | — | | | | (1.06 | ) | | | — | |
| | | | |
| | Total distributions | | | (0.19 | ) | | | (1.44 | ) | | | (0.16 | ) |
| | | | |
| | Net asset value, end of period | | $ | 18.02 | | | $ | 21.23 | | | $ | 21.55 | |
| | | | |
| | Total Return(c) | | | (14.27 | )% | | | 5.74 | % | | | (0.77 | )% |
| | | | |
| | Net assets, end of period (in 000’s) | | $ | 28,058 | | | $ | 33,601 | | | $ | 27,967 | |
| | | | |
| | Ratio of net expenses to average net assets | | | 0.55 | %(d) | | | 0.56 | % | | | 0.55 | %(d) |
| | | | |
| | Ratio of total expenses to average net assets | | | 0.65 | %(d) | | | 0.67 | % | | | 0.65 | %(d) |
| | | | |
| | Ratio of net investment income to average net assets | | | 1.84 | %(d) | | | 1.75 | % | | | 1.38 | %(d) |
| | | | |
| | Portfolio turnover rate(e) | | | 94 | % | | | 225 | % | | | 202 | % |
| | (a) | | Commenced operations on April 16, 2018. |
| | (b) | | Calculated based on the average shares outstanding methodology. |
| | (c) | | Assumes investment at the NAV at the beginning of the period, reinvestment of all dividends and distributions, a complete redemption of the investment at the NAV at the end of the period and no sales or redemption charges (if any). Total returns would be reduced if a sales or redemption charge was taken into account. Returns do not reflect the impact of taxes to shareholders relating to Fund distributions or the redemption of Fund shares. Total returns for periods less than one full year are not annualized. |
| | (e) | | The Fund’s portfolio turnover rate is calculated in accordance with regulatory requirements, without regard to transactions involving short term investments and certain derivatives. If such transactions were included, the Fund’s portfolio turnover rate may be higher. |
| | |
| The accompanying notes are an integral part of these financial statements. | | 65 |
GOLDMAN SACHS LARGE CAP VALUE INSIGHTS FUND
Financial Highlights(continued)
Selected Share Data for a Share Outstanding Throughout Each Period
| | | | | | | | | | | | | | | | | | | | | | | | | | |
| | | | | Goldman Sachs Large Cap Value Insights Fund | |
| | | | | Class R Shares | |
| | | | | Six Months Ended
April 30, 2020
(Unaudited) | | | Year Ended October 31, | |
| | | | | 2019 | | | 2018 | | | 2017 | | | 2016 | | | 2015 | |
| | Per Share Data | |
| | | | | | | |
| | Net asset value, beginning of period | | $ | 21.12 | | | $ | 21.45 | | | $ | 20.88 | | | $ | 17.18 | | | $ | 16.84 | | | $ | 16.81 | |
| | | | | | | |
| | Net investment income(a) | | | 0.12 | | | | 0.23 | | | | 0.19 | | | | 0.24 | | | | 0.18 | | | | 0.18 | |
| | | | | | | |
| | Net realized and unrealized gain (loss) | | | (3.19 | ) | | | 0.74 | | | | 0.56 | | | | 3.73 | | | | 0.33 | | | | 0.08 | |
| | | | | | | |
| | Total from investment operations | | | (3.07 | ) | | | 0.97 | | | | 0.75 | | | | 3.97 | | | | 0.51 | | | | 0.26 | |
| | | | | | | |
| | Distributions to shareholders from net investment income | | | (0.12 | ) | | | (0.24 | ) | | | (0.18 | ) | | | (0.27 | ) | | | (0.17 | ) | | | (0.23 | ) |
| | | | | | | |
| | Distributions to shareholders from net realized gains | | | — | | | | (1.06 | ) | | | — | | | | — | | | | — | | | | — | |
| | | | | | | |
| | Total distributions | | | (0.12 | ) | | | (1.30 | ) | | | (0.18 | ) | | | (0.27 | ) | | | (0.17 | ) | | | (0.23 | ) |
| | | | | | | |
| | Net asset value, end of period | | $ | 17.93 | | | $ | 21.12 | | | $ | 21.45 | | | $ | 20.88 | | | $ | 17.18 | | | $ | 16.84 | |
| | | | | | | |
| | Total Return(b) | | | (14.56 | )% | | | 5.01 | % | | | 3.56 | % | | | 23.19 | % | | | 3.08 | % | | | 1.56 | % |
| | | | | | | |
| | Net assets, end of period (in 000’s) | | $ | 4,521 | | | $ | 5,189 | | | $ | 5,651 | | | $ | 5,240 | | | $ | 1,877 | | | $ | 1,270 | |
| | | | | | | |
| | Ratio of net expenses to average net assets | | | 1.19 | %(c) | | | 1.20 | % | | | 1.20 | % | | | 1.21 | % | | | 1.21 | % | | | 1.21 | % |
| | | | | | | |
| | Ratio of total expenses to average net assets | | | 1.29 | %(c) | | | 1.32 | % | | | 1.28 | % | | | 1.34 | % | | | 1.40 | % | | | 1.37 | % |
| | | | | | | |
| | Ratio of net investment income to average net assets | | | 1.23 | %(c) | | | 1.12 | % | | | 0.88 | % | | | 1.22 | % | | | 1.07 | % | | | 1.07 | % |
| | | | | | | |
| | Portfolio turnover rate(d) | | | 94 | % | | | 225 | % | | | 202 | % | | | 208 | % | | | 229 | % | | | 221 | % |
| | (a) | | Calculated based on the average shares outstanding methodology. |
| | (b) | | Assumes investment at the NAV at the beginning of the period, reinvestment of all dividends and distributions, a complete redemption of the investment at the NAV at the end of the period and no sales or redemption charges (if any). Total returns would be reduced if a sales or redemption charge was taken into account. Returns do not reflect the impact of taxes to shareholders relating to Fund distributions or the redemption of Fund shares. Total returns for periods less than one full year are not annualized. |
| | (d) | | The Fund’s portfolio turnover rate is calculated in accordance with regulatory requirements, without regard to transactions involving short term investments and certain derivatives. If such transactions were included, the Fund’s portfolio turnover rate may be higher. |
| | |
| 66 | | The accompanying notes are an integral part of these financial statements. |
GOLDMAN SACHS LARGE CAP VALUE INSIGHTS FUND
Financial Highlights(continued)
Selected Share Data for a Share Outstanding Throughout Each Period
| | | | | | | | | | | | | | | | | | | | | | | | | | |
| | | | | Goldman Sachs Large Cap Value Insights Fund | |
| | | | | Class R6 Shares | |
| | | | | Six Months Ended
April 30, 2020
(Unaudited) | | | Year Ended October 31, | | | Period Ended
October 31, 2015(a) | |
| | | | | 2019 | | | 2018 | | | 2017 | | | 2016 | |
| | Per Share Data | |
| | | | | | | |
| | Net asset value, beginning of period | | $ | 21.24 | | | $ | 21.56 | | | $ | 20.99 | | | $ | 17.25 | | | $ | 16.90 | | | $ | 17.23 | |
| | | | | | | |
| | Net investment income(b) | | | 0.19 | | | | 0.40 | | | | 0.33 | | | | 0.36 | | | | 0.29 | | | | 0.07 | |
| | | | | | | |
| | Net realized and unrealized gain (loss) | | | (3.21 | ) | | | 0.72 | | | | 0.55 | | | | 3.77 | | | | 0.34 | | | | (0.32 | ) |
| | | | | | | |
| | Total from investment operations | | | (3.02 | ) | | | 1.12 | | | | 0.88 | | | | 4.13 | | | | 0.63 | | | | (0.25 | ) |
| | | | | | | |
| | Distributions to shareholders from net investment income | | | (0.19 | ) | | | (0.38 | ) | | | (0.31 | ) | | | (0.39 | ) | | | (0.28 | ) | | | (0.08 | ) |
| | | | | | | |
| | Distributions to shareholders from net realized gains | | | — | | | | (1.06 | ) | | | — | | | | — | | | | — | | | | — | |
| | | | | | | |
| | Total distributions | | | (0.19 | ) | | | (1.44 | ) | | | (0.31 | ) | | | (0.39 | ) | | | (0.28 | ) | | | (0.08 | ) |
| | | | | | | |
| | Net asset value, end of period | | $ | 18.03 | | | $ | 21.24 | | | $ | 21.56 | | | $ | 20.99 | | | $ | 17.25 | | | $ | 16.90 | |
| | | | | | | |
| | Total Return(c) | | | (14.26 | )% | | | 5.73 | % | | | 4.19 | % | | | 24.05 | % | | | 3.76 | % | | | (1.41 | )% |
| | | | | | | |
| | Net assets, end of period (in 000’s) | | $ | 62,552 | | | $ | 73,981 | | | $ | 149,225 | | | $ | 75 | | | $ | 10 | | | $ | 10 | |
| | | | | | | |
| | Ratio of net expenses to average net assets | | | 0.55 | %(d) | | | 0.55 | % | | | 0.55 | % | | | 0.55 | % | | | 0.54 | % | | | 0.58 | %(d) |
| | | | | | | |
| | Ratio of total expenses to average net assets | | | 0.65 | %(d) | | | 0.66 | % | | | 0.62 | % | | | 0.67 | % | | | 0.74 | % | | | 0.74 | %(d) |
| | | | | | | |
| | Ratio of net investment income to average net assets | | | 1.85 | %(d) | | | 1.84 | % | | | 1.47 | % | | | 1.81 | % | | | 1.77 | % | | | 1.62 | %(d) |
| | | | | | | |
| | Portfolio turnover rate(e) | | | 94 | % | | | 225 | % | | | 202 | % | | | 208 | % | | | 229 | % | | | 221 | % |
| | (a) | | Commenced operations on July 31, 2015. |
| | (b) | | Calculated based on the average shares outstanding methodology. |
| | (c) | | Assumes investment at the NAV at the beginning of the period, reinvestment of all dividends and distributions, a complete redemption of the investment at the NAV at the end of the period and no sales or redemption charges (if any). Total returns would be reduced if a sales or redemption charge was taken into account. Returns do not reflect the impact of taxes to shareholders relating to Fund distributions or the redemption of Fund shares. Total returns for periods less than one full year are not annualized. |
| | (e) | | The Fund’s portfolio turnover rate is calculated in accordance with regulatory requirements, without regard to transactions involving short term investments and certain derivatives. If such transactions were included, the Fund’s portfolio turnover rate may be higher. |
| | |
| The accompanying notes are an integral part of these financial statements. | | 67 |
GOLDMAN SACHS SMALL CAP EQUITY INSIGHTS FUND
Financial Highlights(continued)
Selected Share Data for a Share Outstanding Throughout Each Period
| | | | | | | | | | | | | | | | | | | | | | | | | | |
| | | | | Goldman Sachs Small Cap Equity Insights Fund | |
| | | | | Class A Shares | |
| | | | | Six Months Ended
April 30, 2020
(Unaudited) | | | Year Ended October 31, | |
| | | | | 2019 | | | 2018 | | | 2017 | | | 2016 | | | 2015 | |
| | Per Share Data | |
| | | | | | | |
| | Net asset value, beginning of period | | $ | 25.62 | | | $ | 25.74 | | | $ | 24.77 | | | $ | 19.73 | | | $ | 19.10 | | | $ | 18.25 | |
| | | | | | | |
| | Net investment income(a) | | | 0.02 | | | | 0.05 | | | | 0.01 | (b) | | | 0.04 | | | | 0.08 | | | | 0.03 | |
| | | | | | | |
| | Net realized and unrealized gain (loss) | | | (5.18 | ) | | | 1.23 | | | | 0.96 | | | | 5.06 | | | | 0.58 | | | | 0.82 | |
| | | | | | | |
| | Total from investment operations | | | (5.16 | ) | | | 1.28 | | | | 0.97 | | | | 5.10 | | | | 0.66 | | | | 0.85 | |
| | | | | | | |
| | Distributions to shareholders from net investment income | | | (0.05 | ) | | | — | | | | — | | | | (0.06 | ) | | | (0.03 | ) | | | — | |
| | | | | | | |
| | Distributions to shareholders from net realized gains | | | — | | | | (1.40 | ) | | | — | | | | — | | | | — | | | | — | |
| | | | | | | |
| | Total distributions | | | (0.05 | ) | | | (1.40 | ) | | | — | | | | (0.06 | ) | | | (0.03 | ) | | | — | |
| | | | | | | |
| | Net asset value, end of period | | $ | 20.41 | | | $ | 25.62 | | | $ | 25.74 | | | $ | 24.77 | | | $ | 19.73 | | | $ | 19.10 | |
| | | | | | | |
| | Total Return(c) | | | (20.18 | )% | | | 5.64 | % | | | 3.92 | % | | | 25.87 | % | | | 3.44 | % | | | 4.66 | % |
| | | | | | | |
| | Net assets, end of period (in 000’s) | | $ | 37,978 | | | $ | 53,503 | | | $ | 55,472 | | | $ | 41,945 | | | $ | 31,733 | | | $ | 34,680 | |
| | | | | | | |
| | Ratio of net expenses to average net assets | | | 1.22 | %(d) | | | 1.23 | % | | | 1.23 | % | | | 1.24 | % | | | 1.25 | % | | | 1.26 | % |
| | | | | | | |
| | Ratio of total expenses to average net assets | | | 1.30 | %(d) | | | 1.34 | % | | | 1.31 | % | | | 1.43 | % | �� | | 1.49 | % | | | 1.47 | % |
| | | | | | | |
| | Ratio of net investment income to average net assets | | | 0.14 | %(d) | | | 0.19 | % | | | 0.04 | %(b) | | | 0.16 | % | | | 0.43 | % | | | 0.15 | % |
| | | | | | | |
| | Portfolio turnover rate(e) | | | 63 | % | | | 140 | % | | | 111 | % | | | 137 | % | | | 144 | % | | | 127 | % |
| | (a) | | Calculated based on the average shares outstanding methodology. |
| | (b) | | Reflects income recognized from special dividends which amounted to $0.04 per share and 0.15% of average net assets. |
| | (c) | | Assumes investment at the NAV at the beginning of the period, reinvestment of all dividends and distributions, a complete redemption of the investment at the NAV at the end of the period and no sales or redemption charges (if any). Total returns would be reduced if a sales or redemption charge was taken into account. Returns do not reflect the impact of taxes to shareholders relating to Fund distributions or the redemption of Fund shares. Total returns for periods less than one full year are not annualized. |
| | (e) | | The Fund’s portfolio turnover rate is calculated in accordance with regulatory requirements, without regard to transactions involving short term investments and certain derivatives. If such transactions were included, the Fund’s portfolio turnover rate may be higher. |
| | |
| 68 | | The accompanying notes are an integral part of these financial statements. |
GOLDMAN SACHS SMALL CAP EQUITY INSIGHTS FUND
Financial Highlights(continued)
Selected Share Data for a Share Outstanding Throughout Each Period
| | | | | | | | | | | | | | | | | | | | | | | | | | |
| | | | | Goldman Sachs Small Cap Equity Insights Fund | |
| | | | | Class C Shares | |
| | | | | Six Months Ended
April 30, 2020
(Unaudited) | | | Year Ended October 31, | |
| | | | | 2019 | | | 2018 | | | 2017 | | | 2016 | | | 2015 | |
| | Per Share Data | |
| | | | | | | |
| | Net asset value, beginning of period | | $ | 21.75 | | | $ | 22.23 | | | $ | 21.56 | | | $ | 17.25 | | | $ | 16.81 | | | $ | 16.18 | |
| | | | | | | |
| | Net investment loss(a) | | | (0.02 | ) | | | (0.12 | ) | | | (0.17 | )(b) | | | (0.11 | ) | | | (0.05 | ) | | | (0.10 | ) |
| | | | | | | |
| | Net realized and unrealized gain (loss) | | | (4.44 | ) | | | 1.04 | | | | 0.84 | | | | 4.42 | | | | 0.49 | | | | 0.73 | |
| | | | | | | |
| | Total from investment operations | | | (4.46 | ) | | | 0.92 | | | | 0.67 | | | | 4.31 | | | | 0.44 | | | | 0.63 | |
| | | | | | | |
| | Distributions to shareholders from net realized gains | | | — | | | | (1.40 | ) | | | — | | | | — | | | | — | | | | — | |
| | | | | | | |
| | Net asset value, end of period | | $ | 17.29 | | | $ | 21.75 | | | $ | 22.23 | | | $ | 21.56 | | | $ | 17.25 | | | $ | 16.81 | |
| | | | | | | |
| | Total Return(c) | | | (20.51 | )% | | | 4.86 | % | | | 3.16 | % | | | 24.93 | % | | | 2.61 | % | | | 3.89 | % |
| | | | | | | |
| | Net assets, end of period (in 000’s) | | $ | 5,697 | | | $ | 7,785 | | | $ | 7,139 | | | $ | 9,439 | | | $ | 12,133 | | | $ | 14,153 | |
| | | | | | | |
| | Ratio of net expenses to average net assets | | | 1.97 | %(d) | | | 1.98 | % | | | 1.98 | % | | | 1.99 | % | | | 2.00 | % | | | 2.01 | % |
| | | | | | | |
| | Ratio of total expenses to average net assets | | | 2.05 | %(d) | | | 2.09 | % | | | 2.06 | % | | | 2.18 | % | | | 2.24 | % | | | 2.22 | % |
| | | | | | | |
| | Ratio of net investment loss to average net assets | | | (0.21 | )%(d) | | | (0.57 | )% | | | (0.72 | )%(b) | | | (0.56 | )% | | | (0.32 | )% | | | (0.60 | )% |
| | | | | | | |
| | Portfolio turnover rate(e) | | | 63 | % | | | 140 | % | | | 111 | % | | | 137 | % | | | 144 | % | | | 127 | % |
| | (a) | | Calculated based on the average shares outstanding methodology. |
| | (b) | | Reflects income recognized from special dividends which amounted to $0.04 per share and 0.15% of average net assets. |
| | (c) | | Assumes investment at the NAV at the beginning of the period, reinvestment of all dividends and distributions, a complete redemption of the investment at the NAV at the end of the period and no sales or redemption charges (if any). Total returns would be reduced if a sales or redemption charge was taken into account. Returns do not reflect the impact of taxes to shareholders relating to Fund distributions or the redemption of Fund shares. Total returns for periods less than one full year are not annualized. |
| | (e) | | The Fund’s portfolio turnover rate is calculated in accordance with regulatory requirements, without regard to transactions involving short term investments and certain derivatives. If such transactions were included, the Fund’s portfolio turnover rate may be higher. |
| | |
| The accompanying notes are an integral part of these financial statements. | | 69 |
GOLDMAN SACHS SMALL CAP EQUITY INSIGHTS FUND
Financial Highlights(continued)
Selected Share Data for a Share Outstanding Throughout Each Period
| | | | | | | | | | | | | | | | | | | | | | | | | | |
| | | | | Goldman Sachs Small Cap Equity Insights Fund | |
| | | | | Institutional Shares | |
| | | | | Six Months Ended
April 30, 2020
(Unaudited) | | | Year Ended October 31, | |
| | | | | 2019 | | | 2018 | | | 2017 | | | 2016 | | | 2015 | |
| | Per Share Data | |
| | | | | | | |
| | Net asset value, beginning of period | | $ | 26.74 | | | $ | 26.77 | | | $ | 25.73 | | | $ | 20.47 | | | $ | 19.84 | | | $ | 18.94 | |
| | | | | | | |
| | Net investment income(a) | | | 0.04 | | | | 0.14 | | | | 0.12 | (b) | | | 0.13 | | | | 0.17 | | | | 0.11 | |
| | | | | | | |
| | Net realized and unrealized gain (loss) | | | (5.36 | ) | | | 1.29 | | | | 0.99 | | | | 5.27 | | | | 0.57 | | | | 0.86 | |
| | | | | | | |
| | Total from investment operations | | | (5.32 | ) | | | 1.43 | | | | 1.11 | | | | 5.40 | | | | 0.74 | | | | 0.97 | |
| | | | | | | |
| | Distributions to shareholders from net investment income | | | (0.15 | ) | | | (0.06 | ) | | | (0.07 | ) | | | (0.14 | ) | | | (0.11 | ) | | | (0.07 | ) |
| | | | | | | |
| | Distributions to shareholders from net realized gains | | | — | | | | (1.40 | ) | | | — | | | | — | | | | — | | | | — | |
| | | | | | | |
| | Total distributions | | | (0.15 | ) | | | (1.46 | ) | | | (0.07 | ) | | | (0.14 | ) | | | (0.11 | ) | | | (0.07 | ) |
| | | | | | | |
| | Net asset value, end of period | | $ | 21.27 | | | $ | 26.74 | | | $ | 26.77 | | | $ | 25.73 | | | $ | 20.47 | | | $ | 19.84 | |
| | | | | | | |
| | Total Return(c) | | | (20.03 | )% | | | 6.03 | % | | | 4.32 | % | | | 26.44 | % | | | 3.77 | % | | | 5.13 | % |
| | | | | | | |
| | Net assets, end of period (in 000’s) | | $ | 240,142 | | | $ | 290,652 | | | $ | 212,229 | | | $ | 231,226 | | | $ | 176,644 | | | $ | 81,067 | |
| | | | | | | |
| | Ratio of net expenses to average net assets | | | 0.84 | %(d) | | | 0.85 | % | | | 0.84 | % | | | 0.84 | % | | | 0.85 | % | | | 0.86 | % |
| | | | | | | |
| | Ratio of total expenses to average net assets | | | 0.92 | %(d) | | | 0.96 | % | | | 0.93 | % | | | 1.03 | % | | | 1.08 | % | | | 1.07 | % |
| | | | | | | |
| | Ratio of net investment income to average net assets | | | 0.31 | %(d) | | | 0.54 | % | | | 0.43 | %(b) | | | 0.56 | % | | | 0.84 | % | | | 0.57 | % |
| | | | | | | |
| | Portfolio turnover rate(e) | | | 63 | % | | | 140 | % | | | 111 | % | | | 137 | % | | | 144 | % | | | 127 | % |
| | (a) | | Calculated based on the average shares outstanding methodology. |
| | (b) | | Reflects income recognized from special dividends which amounted to $0.04 per share and 0.15% of average net assets. |
| | (c) | | Assumes investment at the NAV at the beginning of the period, reinvestment of all dividends and distributions, a complete redemption of the investment at the NAV at the end of the period and no sales or redemption charges (if any). Total returns would be reduced if a sales or redemption charge was taken into account. Returns do not reflect the impact of taxes to shareholders relating to Fund distributions or the redemption of Fund shares. Total returns for periods less than one full year are not annualized. |
| | (e) | | The Fund’s portfolio turnover rate is calculated in accordance with regulatory requirements, without regard to transactions involving short term investments and certain derivatives. If such transactions were included, the Fund’s portfolio turnover rate may be higher. |
| | |
| 70 | | The accompanying notes are an integral part of these financial statements. |
GOLDMAN SACHS SMALL CAP EQUITY INSIGHTS FUND
Financial Highlights(continued)
Selected Share Data for a Share Outstanding Throughout Each Period
| | | | | | | | | | | | | | | | | | | | | | | | | | |
| | | | | Goldman Sachs Small Cap Equity Insights Fund | |
| | | | | Service Shares | |
| | | | | Six Months Ended
April 30, 2020
(Unaudited) | | | Year Ended October 31, | |
| | | | | 2019 | | | 2018 | | | 2017 | | | 2016 | | | 2015 | |
| | Per Share Data | |
| | | | | | | |
| | Net asset value, beginning of period | | $ | 25.17 | | | $ | 25.34 | | | $ | 24.41 | | | $ | 19.44 | | | $ | 18.82 | | | $ | 18.00 | |
| | | | | | | |
| | Net investment income (loss)(a) | | | 0.01 | | | | 0.01 | | | | (0.02 | )(b) | | | 0.01 | | | | 0.06 | | | | 0.02 | |
| | | | | | | |
| | Net realized and unrealized gain (loss) | | | (5.09 | ) | | | 1.22 | | | | 0.95 | | | | 5.00 | | | | 0.56 | | | | 0.80 | |
| | | | | | | |
| | Total from investment operations | | | (5.08 | ) | | | 1.23 | | | | 0.93 | | | | 5.01 | | | | 0.62 | | | | 0.82 | |
| | | | | | | |
| | Distributions to shareholders from net investment income | | | (0.03 | ) | | | — | | | | — | | | | (0.04 | ) | | | — | | | | — | |
| | | | | | | |
| | Distributions to shareholders from net realized gains | | | — | | | | (1.40 | ) | | | — | | | | — | | | | — | | | | — | |
| | | | | | | |
| | Total distributions | | | (0.03 | ) | | | (1.40 | ) | | | — | | | | (0.04 | ) | | | — | | | | — | |
| | | | | | | |
| | Net asset value, end of period | | $ | 20.06 | | | $ | 25.17 | | | $ | 25.34 | | | $ | 24.41 | | | $ | 19.44 | | | $ | 18.82 | |
| | | | | | | |
| | Total Return(c) | | | (20.22 | )% | | | 5.52 | % | | | 3.81 | % | | | 25.77 | % | | | 3.29 | % | | | 4.56 | % |
| | | | | | | |
| | Net assets, end of period (in 000’s) | | $ | 2,624 | | | $ | 3,141 | | | $ | 2,031 | | | $ | 769 | | | $ | 651 | | | $ | 959 | |
| | | | | | | |
| | Ratio of net expenses to average net assets | | | 1.34 | %(d) | | | 1.35 | % | | | 1.34 | % | | | 1.34 | % | | | 1.35 | % | | | 1.36 | % |
| | | | | | | |
| | Ratio of total expenses to average net assets | | | 1.42 | %(d) | | | 1.45 | % | | | 1.42 | % | | | 1.53 | % | | | 1.59 | % | | | 1.58 | % |
| | | | | | | |
| | Ratio of net investment income (loss) to average net assets | | | 0.08 | %(d) | | | 0.04 | % | | | (0.06 | )%(b) | | | 0.06 | % | | | 0.31 | % | | | 0.12 | % |
| | | | | | | |
| | Portfolio turnover rate(e) | | | 63 | % | | | 140 | % | | | 111 | % | | | 137 | % | | | 144 | % | | | 127 | % |
| | (a) | | Calculated based on the average shares outstanding methodology. |
| | (b) | | Reflects income recognized from special dividends which amounted to $0.04 per share and 0.15% of average net assets. |
| | (c) | | Assumes investment at the NAV at the beginning of the period, reinvestment of all dividends and distributions, a complete redemption of the investment at the NAV at the end of the period and no sales or redemption charges (if any). Total returns would be reduced if a sales or redemption charge was taken into account. Returns do not reflect the impact of taxes to shareholders relating to Fund distributions or the redemption of Fund shares. Total returns for periods less than one full year are not annualized. |
| | (e) | | The Fund’s portfolio turnover rate is calculated in accordance with regulatory requirements, without regard to transactions involving short term investments and certain derivatives. If such transactions were included, the Fund’s portfolio turnover rate may be higher. |
| | |
| The accompanying notes are an integral part of these financial statements. | | 71 |
GOLDMAN SACHS SMALL CAP EQUITY INSIGHTS FUND
Financial Highlights(continued)
Selected Share Data for a Share Outstanding Throughout Each Period
| | | | | | | | | | | | | | | | | | | | | | | | | | |
| | | | | Goldman Sachs Small Cap Equity Insights Fund | |
| | | | | Investor Shares | |
| | | | | Six Months Ended
April 30, 2020
(Unaudited) | | | Year Ended October 31, | |
| | | | | 2019 | | | 2018 | | | 2017 | | | 2016 | | | 2015 | |
| | Per Share Data | |
| | | | | | | |
| | Net asset value, beginning of period | | $ | 25.50 | | | $ | 25.62 | | | $ | 24.61 | | | $ | 19.61 | | | $ | 19.02 | | | $ | 18.14 | |
| | | | | | | |
| | Net investment income(a) | | | 0.03 | | | | 0.09 | | | | 0.08 | (b) | | | 0.14 | | | | 0.09 | | | | 0.06 | |
| | | | | | | |
| | Net realized and unrealized gain (loss) | | | (5.13 | ) | | | 1.24 | | | | 0.95 | | | | 4.99 | | | | 0.59 | | | | 0.84 | |
| | | | | | | |
| | Total from investment operations | | | (5.10 | ) | | | 1.33 | | | | 1.03 | | | | 5.13 | | | | 0.68 | | | | 0.90 | |
| | | | | | | |
| | Distributions to shareholders from net investment income | | | (0.12 | ) | | | (0.05 | ) | | | (0.02 | ) | | | (0.13 | ) | | | (0.09 | ) | | | (0.02 | ) |
| | | | | | | |
| | Distributions to shareholders from net realized gains | | | — | | | | (1.40 | ) | | | — | | | | — | | | | — | | | | — | |
| | | | | | | |
| | Total distributions | | | (0.12 | ) | | | (1.45 | ) | | | (0.02 | ) | | | (0.13 | ) | | | (0.09 | ) | | | (0.02 | ) |
| | | | | | | |
| | Net asset value, end of period | | $ | 20.28 | | | $ | 25.50 | | | $ | 25.62 | | | $ | 24.61 | | | $ | 19.61 | | | $ | 19.02 | |
| | | | | | | |
| | Total Return(c) | | | (20.10 | )% | | | 5.90 | % | | | 4.19 | % | | | 26.22 | % | | | 3.63 | % | | | 4.99 | % |
| | | | | | | |
| | Net assets, end of period (in 000’s) | | $ | 59,890 | | | $ | 74,881 | | | $ | 44,984 | | | $ | 2,684 | | | $ | 7,462 | | | $ | 1,119 | |
| | | | | | | |
| | Ratio of net expenses to average net assets | | | 0.97 | %(d) | | | 0.99 | % | | | 0.98 | % | | | 0.99 | % | | | 0.99 | % | | | 1.01 | % |
| | | | | | | |
| | Ratio of total expenses to average net assets | | | 1.05 | %(d) | | | 1.09 | % | | | 1.06 | % | | | 1.17 | % | | | 1.22 | % | | | 1.23 | % |
| | | | | | | |
| | Ratio of net investment income to average net assets | | | 0.26 | %(d) | | | 0.40 | % | | | 0.31 | %(b) | | | 0.60 | % | | | 0.45 | % | | | 0.32 | % |
| | | | | | | |
| | Portfolio turnover rate(e) | | | 63 | % | | | 140 | % | | | 111 | % | | | 137 | % | | | 144 | % | | | 127 | % |
| | (a) | | Calculated based on the average shares outstanding methodology. |
| | (b) | | Reflects income recognized from special dividends which amounted to $0.04 per share and 0.15% of average net assets. |
| | (c) | | Assumes investment at the NAV at the beginning of the period, reinvestment of all dividends and distributions, a complete redemption of the investment at the NAV at the end of the period and no sales or redemption charges (if any). Total returns would be reduced if a sales or redemption charge was taken into account. Returns do not reflect the impact of taxes to shareholders relating to Fund distributions or the redemption of Fund shares. Total returns for periods less than one full year are not annualized. |
| | (e) | | The Fund’s portfolio turnover rate is calculated in accordance with regulatory requirements, without regard to transactions involving short term investments and certain derivatives. If such transactions were included, the Fund’s portfolio turnover rate may be higher. |
| | |
| 72 | | The accompanying notes are an integral part of these financial statements. |
GOLDMAN SACHS SMALL CAP EQUITY INSIGHTS FUND
Financial Highlights(continued)
Selected Share Data for a Share Outstanding Throughout Each Period
| | | | | | | | | | | | | | |
| | | | | Goldman Sachs Small Cap Equity Insights Fund | |
| | | | | Class P Shares | |
| | | | | Six Months Ended
April 30, 2020
(Unaudited) | | | Year Ended
October 31, 2019 | | | Period Ended
October 31, 2018(a) | |
| | Per Share Data | | | | | | | | | | | | |
| | | | |
| | Net asset value, beginning of period | | $ | 26.74 | | | $ | 26.77 | | | $ | 27.21 | |
| | | | |
| | Net investment income(b) | | | 0.04 | | | | 0.13 | | | | 0.08 | (c) |
| | | | |
| | Net realized and unrealized gain (loss) | | | (5.36 | ) | | | 1.30 | | | | (0.52 | ) |
| | | | |
| | Total from investment operations | | | (5.32 | ) | | | 1.43 | | | | (0.44 | ) |
| | | | |
| | Distributions to shareholders from net investment income | | | (0.15 | ) | | | (0.06 | ) | | | — | |
| | | | |
| | Distributions to shareholders from net realized gains | | | — | | | | (1.40 | ) | | | — | |
| | | | |
| | Total distributions | | | (0.15 | ) | | | (1.46 | ) | | | — | |
| | | | |
| | Net asset value, end of period | | $ | 21.27 | | | $ | 26.74 | | | $ | 26.77 | |
| | | | |
| | Total Return(d) | | | (20.03 | )% | | | 6.06 | % | | | (1.62 | )% |
| | | | |
| | Net assets, end of period (in 000’s) | | $ | 80,996 | | | $ | 106,039 | | | $ | 66,823 | |
| | | | |
| | Ratio of net expenses to average net assets | | | 0.83 | %(e) | | | 0.84 | % | | | 0.83 | %(e) |
| | | | |
| | Ratio of total expenses to average net assets | | | 0.91 | %(e) | | | 0.94 | % | | | 0.92 | %(e) |
| | | | |
| | Ratio of net investment income to average net assets | | | 0.32 | %(e) | | | 0.53 | % | | | 0.48 | %(c)(e) |
| | | | |
| | Portfolio turnover rate(f) | | | 63 | % | | | 140 | % | | | 111 | % |
| | (a) | | Commenced operations on April 16, 2018. |
| | (b) | | Calculated based on the average shares outstanding methodology. |
| | (c) | | Reflects income recognized from special dividends which amounted to $0.04 per share and 0.15% of average net assets. |
| | (d) | | Assumes investment at the NAV at the beginning of the period, reinvestment of all dividends and distributions, a complete redemption of the investment at the NAV at the end of the period and no sales or redemption charges (if any). Total returns would be reduced if a sales or redemption charge was taken into account. Returns do not reflect the impact of taxes to shareholders relating to Fund distributions or the redemption of Fund shares. Total returns for periods less than one full year are not annualized. |
| | (f) | | The Fund’s portfolio turnover rate is calculated in accordance with regulatory requirements, without regard to transactions involving short term investments and certain derivatives. If such transactions were included, the Fund’s portfolio turnover rate may be higher. |
| | |
| The accompanying notes are an integral part of these financial statements. | | 73 |
GOLDMAN SACHS SMALL CAP EQUITY INSIGHTS FUND
Financial Highlights(continued)
Selected Share Data for a Share Outstanding Throughout Each Period
| | | | | | | | | | | | | | | | | | | | | | | | | | |
| | | | | Goldman Sachs Small Cap Equity Insights Fund | |
| | | | | Class R Shares | |
| | | | | Six Months Ended
April 30, 2020
(Unaudited) | | | Year Ended October 31, | |
| | | | | 2019 | | | 2018 | | | 2017 | | | 2016 | | | 2015 | |
| | Per Share Data | |
| | | | | | | |
| | Net asset value, beginning of period | | $ | 24.96 | | | $ | 25.18 | | | $ | 24.29 | | | $ | 19.36 | | | $ | 18.78 | | | $ | 17.98 | |
| | | | | | | |
| | Net investment income (loss)(a) | | | — | (b) | | | (0.02 | ) | | | (0.06 | )(c) | | | (0.02 | ) | | | 0.03 | | | | (0.02 | ) |
| | | | | | | |
| | Net realized and unrealized gain (loss) | | | (5.06 | ) | | | 1.20 | | | | 0.95 | | | | 4.98 | | | | 0.55 | | | | 0.82 | |
| | | | | | | |
| | Total from investment operations | | | (5.06 | ) | | | 1.18 | | | | 0.89 | | | | 4.96 | | | | 0.58 | | | | 0.80 | |
| | | | | | | |
| | Distributions to shareholders from net investment income | | | — | | | | — | | | | — | | | | (0.03 | ) | | | — | (b) | | | — | |
| | | | | | | |
| | Distributions to shareholders from net realized gains | | | — | | | | (1.40 | ) | | | — | | | | — | | | | — | | | | — | |
| | | | | | | |
| | Total distributions | | | — | | | | (1.40 | ) | | | — | | | | (0.03 | ) | | | — | | | | — | |
| | | | | | | |
| | Net asset value, end of period | | $ | 19.90 | | | $ | 24.96 | | | $ | 25.18 | | | $ | 24.29 | | | $ | 19.36 | | | $ | 18.78 | |
| | | | | | | |
| | Total Return(d) | | | (20.27 | )% | | | 5.35 | % | | | 3.66 | % | | | 25.60 | % | | | 3.11 | % | | | 4.45 | % |
| | | | | | | |
| | Net assets, end of period (in 000’s) | | $ | 12,844 | | | $ | 16,562 | | | $ | 14,625 | | | $ | 15,284 | | | $ | 9,954 | | | $ | 8,986 | |
| | | | | | | |
| | Ratio of net expenses to average net assets | | | 1.47 | %(e) | | | 1.48 | % | | | 1.48 | % | | | 1.49 | % | | | 1.50 | % | | | 1.51 | % |
| | | | | | | |
| | Ratio of total expenses to average net assets | | | 1.55 | %(e) | | | 1.59 | % | | | 1.56 | % | | | 1.68 | % | | | 1.74 | % | | | 1.72 | % |
| | | | | | | |
| | Ratio of net investment income (loss) to average net assets | | | 0.02 | %(e) | | | (0.08 | )% | | | (0.22 | )%(c) | | | (0.10 | )% | | | 0.18 | % | | | (0.11 | )% |
| | | | | | | |
| | Portfolio turnover rate(f) | | | 63 | % | | | 140 | % | | | 111 | % | | | 137 | % | | | 144 | % | | | 127 | % |
| | (a) | | Calculated based on the average shares outstanding methodology. |
| | (b) | | Amount is less than $0.005 per share. |
| | (c) | | Reflects income recognized from special dividends which amounted to $0.04 per share and 0.15% of average net assets. |
| | (d) | | Assumes investment at the NAV at the beginning of the period, reinvestment of all dividends and distributions, a complete redemption of the investment at the NAV at the end of the period and no sales or redemption charges (if any). Total returns would be reduced if a sales or redemption charge was taken into account. Returns do not reflect the impact of taxes to shareholders relating to Fund distributions or the redemption of Fund shares. Total returns for periods less than one full year are not annualized. |
| | (f) | | The Fund’s portfolio turnover rate is calculated in accordance with regulatory requirements, without regard to transactions involving short term investments and certain derivatives. If such transactions were included, the Fund’s portfolio turnover rate may be higher. |
| | |
| 74 | | The accompanying notes are an integral part of these financial statements. |
GOLDMAN SACHS SMALL CAP EQUITY INSIGHTS FUND
Financial Highlights(continued)
Selected Share Data for a Share Outstanding Throughout Each Period
| | | | | | | | | | | | | | | | | | | | | | | | | | |
| | | | | Goldman Sachs Small Cap Equity Insights Fund | |
| | | | | Class R6 Shares | |
| | | | | Six Months Ended
April 30, 2020
(Unaudited) | | | Year Ended October 31, | | | Period Ended
October 31, 2015(a) | |
| | | | | 2019 | | | 2018 | | | 2017 | | | 2016 | |
| | Per Share Data | |
| | | | | | | |
| | Net asset value, beginning of period | | $ | 26.74 | | | $ | 26.77 | | | $ | 25.73 | | | $ | 20.47 | | | $ | 19.84 | | | $ | 20.22 | |
| | | | | | | |
| | Net investment income(b) | | | 0.04 | | | | 0.16 | | | | 0.13 | (c) | | | 0.11 | | | | 0.17 | | | | 0.02 | |
| | | | | | | |
| | Net realized and unrealized gain (loss) | | | (5.36 | ) | | | 1.27 | | | | 0.99 | | | | 5.29 | | | | 0.58 | | | | (0.40 | ) |
| | | | | | | |
| | Total from investment operations | | | (5.32 | ) | | | 1.43 | | | | 1.12 | | | | 5.40 | | | | 0.75 | | | | (0.38 | ) |
| | | | | | | |
| | Distributions to shareholders from net investment income | | | (0.15 | ) | | | (0.06 | ) | | | (0.08 | ) | | | (0.14 | ) | | | (0.12 | ) | | | — | |
| | | | | | | |
| | Distributions to shareholders from net realized gains | | | — | | | | (1.40 | ) | | | — | | | | — | | | | — | | | | — | |
| | | | | | | |
| | Total distributions | | | (0.15 | ) | | | (1.46 | ) | | | (0.08 | ) | | | (0.14 | ) | | | (0.12 | ) | | | — | |
| | | | | | | |
| | Net asset value, end of period | | $ | 21.27 | | | $ | 26.74 | | | $ | 26.77 | | | $ | 25.73 | | | $ | 20.47 | | | $ | 19.84 | |
| | | | | | | |
| | Total Return(d) | | | (20.03 | )% | | | 6.05 | % | | | 4.35 | % | | | 26.45 | % | | | 3.81 | % | | | (1.88 | )% |
| | | | | | | |
| | Net assets, end of period (in 000’s) | | $ | 113,951 | | | $ | 153,129 | | | $ | 173,112 | | | $ | 337 | | | $ | 35 | | | $ | 10 | |
| | | | | | | |
| | Ratio of net expenses to average net assets | | | 0.83 | %(e) | | | 0.84 | % | | | 0.83 | % | | | 0.83 | % | | | 0.83 | % | | | 0.86 | %(e) |
| | | | | | | |
| | Ratio of total expenses to average net assets | | | 0.90 | %(e) | | | 0.94 | % | | | 0.89 | % | | | 1.02 | % | | | 1.06 | % | | | 1.06 | %(e) |
| | | | | | | |
| | Ratio of net investment income to average net assets | | | 0.32 | %(e) | | | 0.63 | % | | | 0.45 | %(c) | | | 0.47 | % | | | 0.85 | % | | | 0.38 | %(e) |
| | | | | | | |
| | Portfolio turnover rate(f) | | | 63 | % | | | 140 | % | | | 111 | % | | | 137 | % | | | 144 | % | | | 127 | % |
| | (a) | | Commenced operations on July 31, 2015. |
| | (b) | | Calculated based on the average shares outstanding methodology. |
| | (c) | | Reflects income recognized from special dividends which amounted to $0.04 per share and 0.15% of average net assets. |
| | (d) | | Assumes investment at the NAV at the beginning of the period, reinvestment of all dividends and distributions, a complete redemption of the investment at the NAV at the end of the period and no sales or redemption charges (if any). Total returns would be reduced if a sales or redemption charge was taken into account. Returns do not reflect the impact of taxes to shareholders relating to Fund distributions or the redemption of Fund shares. Total returns for periods less than one full year are not annualized. |
| | (f) | | The Fund’s portfolio turnover rate is calculated in accordance with regulatory requirements, without regard to transactions involving short term investments and certain derivatives. If such transactions were included, the Fund’s portfolio turnover rate may be higher. |
| | |
| The accompanying notes are an integral part of these financial statements. | | 75 |
GOLDMAN SACHS SMALL CAP GROWTH INSIGHTS FUND
Financial Highlights(continued)
Selected Share Data for a Share Outstanding Throughout Each Period
| | | | | | | | | | | | | | | | | | | | | | | | | | |
| | | | | Goldman Sachs Small Cap Growth Insights Fund | |
| | | | | Class A Shares | |
| | | | | Six Months Ended
April 30, 2020
(Unaudited) | | | Year Ended October 31, | |
| | | | | 2019 | | | 2018 | | | 2017 | | | 2016 | | | 2015 | |
| | Per Share Data | |
| | | | | | | |
| | Net asset value, beginning of period | | $ | 35.08 | | | $ | 37.25 | | | $ | 36.71 | | | $ | 28.34 | | | $ | 31.15 | | | $ | 31.17 | |
| | | | | | | |
| | Net investment loss(a) | | | (0.23 | ) | | | (0.12 | ) | | | (0.13 | )(b) | | | (0.07 | ) | | | — | (c) | | | (0.10 | ) |
| | | | | | | |
| | Net realized and unrealized gain (loss) | | | (4.70 | ) | | | 1.76 | | | | 2.20 | | | | 8.44 | | | | (0.12 | )(d) | | | 1.87 | |
| | | | | | | |
| | Total from investment operations | | | (4.93 | ) | | | 1.64 | | | | 2.07 | | | | 8.37 | | | | (0.12 | ) | | | 1.77 | |
| | | | | | | |
| | Distributions to shareholders from net investment income | | | — | (c) | | | — | | | | — | | | | — | | | | — | | | | — | |
| | | | | | | |
| | Distributions to shareholders from net realized gains | | | (0.49 | ) | | | (3.81 | ) | | | (1.53 | ) | | | — | | | | (2.69 | ) | | | (1.79 | ) |
| | | | | | | |
| | Total distributions | | | (0.49 | ) | | | (3.81 | ) | | | (1.53 | ) | | | — | | | | (2.69 | ) | | | (1.79 | ) |
| | | | | | | |
| | Net asset value, end of period | | $ | 29.66 | | | $ | 35.08 | | | $ | 37.25 | | | $ | 36.71 | | | $ | 28.34 | | | $ | 31.15 | |
| | | | | | | |
| | Total Return(e) | | | (14.32 | )% | | | 5.65 | % | | | 5.87 | % | | | 29.53 | % | | | (0.37 | )% | | | 5.95 | % |
| | | | | | | |
| | Net assets, end of period (in 000’s) | | $ | 49,974 | | | $ | 84,557 | | | $ | 88,316 | | | $ | 77,969 | | | $ | 65,195 | | | $ | 43,647 | |
| | | | | | | |
| | Ratio of net expenses to average net assets | | | 1.22 | %(f) | | | 1.24 | % | | | 1.22 | % | | | 1.22 | % | | | 1.25 | % | | | 1.26 | % |
| | | | | | | |
| | Ratio of total expenses to average net assets | | | 1.29 | %(f) | | | 1.32 | % | | | 1.32 | % | | | 1.40 | % | | | 1.51 | % | | | 1.60 | % |
| | | | | | | |
| | Ratio of net investment loss to average net assets | | | (1.38 | )%(f) | | | (0.36 | )% | | | (0.35 | )%(b) | | | (0.21 | )% | | | — | % | | | (0.33 | )% |
| | | | | | | |
| | Portfolio turnover rate(g) | | | 60 | % | | | 140 | % | | | 127 | % | | | 136 | % | | | 139 | % | | | 145 | % |
| | (a) | | Calculated based on the average shares outstanding methodology. |
| | (b) | | Reflects income recognized from special dividends which amounted to $0.05 per share and 0.12% of average net assets. |
| | (c) | | Amount is less than $0.005 per share. |
| | (d) | | The amount shown for a share outstanding does not correspond with the aggregate net gain on investments for during the period due to the timing of sales and redemptions of Fund shares in relation to the fluctuating market values of the investments of the Fund. |
| | (e) | | Assumes investment at the NAV at the beginning of the period, reinvestment of all dividends and distributions, a complete redemption of the investment at the NAV at the end of the period and no sales or redemption charges (if any). Total returns would be reduced if a sales or redemption charge was taken into account. Returns do not reflect the impact of taxes to shareholders relating to Fund distributions or the redemption of Fund shares. Total returns for periods less than one full year are not annualized. |
| | (g) | | The Fund’s portfolio turnover rate is calculated in accordance with regulatory requirements, without regard to transactions involving short term investments and certain derivatives. If such transactions were included, the Fund’s portfolio turnover rate may be higher. |
| | |
| 76 | | The accompanying notes are an integral part of these financial statements. |
GOLDMAN SACHS SMALL CAP GROWTH INSIGHTS FUND
Financial Highlights(continued)
Selected Share Data for a Share Outstanding Throughout Each Period
| | | | | | | | | | | | | | | | | | | | | | | | | | |
| | | | | Goldman Sachs Small Cap Growth Insights Fund | |
| | | | | Class C Shares | |
| | | | | Six Months Ended
April 30, 2020
(Unaudited) | | | Year Ended October 31, | |
| | | | | 2019 | | | 2018 | | | 2017 | | | 2016 | | | 2015 | |
| | Per Share Data | |
| | | | | | | |
| | Net asset value, beginning of period | | $ | 26.16 | | | $ | 28.98 | | | $ | 29.12 | | | $ | 22.64 | | | $ | 25.61 | | | $ | 26.12 | |
| | | | | | | |
| | Net investment loss(a) | | | (0.53 | ) | | | (0.28 | ) | | | (0.33 | )(b) | | | (0.25 | ) | | | (0.16 | ) | | | (0.28 | ) |
| | | | | | | |
| | Net realized and unrealized gain (loss) | | | (3.21 | ) | | | 1.27 | | | | 1.72 | | | | 6.73 | | | | (0.12 | )(c) | | | 1.56 | |
| | | | | | | |
| | Total from investment operations | | | (3.74 | ) | | | 0.99 | | | | 1.39 | | | | 6.48 | | | | (0.28 | ) | | | 1.28 | |
| | | | | | | |
| | Distributions to shareholders from net investment income | | | — | (d) | | | — | | | | — | | | | — | | | | — | | | | — | |
| | | | | | | |
| | Distributions to shareholders from net realized gains | | | (0.49 | ) | | | (3.81 | ) | | | (1.53 | ) | | | — | | | | (2.69 | ) | | | (1.79 | ) |
| | | | | | | |
| | Total distributions | | | (0.49 | ) | | | (3.81 | ) | | | (1.53 | ) | | | — | | | | (2.69 | ) | | | (1.79 | ) |
| | | | | | | |
| | Net asset value, end of period | | $ | 21.93 | | | $ | 26.16 | | | $ | 28.98 | | | $ | 29.12 | | | $ | 22.64 | | | $ | 25.61 | |
| | | | | | | |
| | Total Return(e) | | | (14.66 | )% | | | 4.92 | % | | | 5.03 | % | | | 28.62 | % | | | (1.14 | )% | | | 5.18 | % |
| | | | | | | |
| | Net assets, end of period (in 000’s) | | $ | 6,694 | | | $ | 8,303 | | | $ | 8,179 | | | $ | 9,852 | | | $ | 7,420 | | | $ | 7,964 | |
| | | | | | | |
| | Ratio of net expenses to average net assets | | | 1.98 | %(f) | | | 1.99 | % | | | 1.97 | % | | | 1.97 | % | | | 2.00 | % | | | 2.01 | % |
| | | | | | | |
| | Ratio of total expenses to average net assets | | | 2.04 | %(f) | | | 2.07 | % | | | 2.07 | % | | | 2.15 | % | | | 2.26 | % | | | 2.36 | % |
| | | | | | | |
| | Ratio of net investment loss to average net assets | | | (4.32 | )%(f) | | | (1.11 | )% | | | (1.09 | )%(b) | | | (0.95 | )% | | | (0.74 | )% | | | (1.06 | )% |
| | | | | | | |
| | Portfolio turnover rate(g) | | | 60 | % | | | 140 | % | | | 127 | % | | | 136 | % | | | 139 | % | | | 145 | % |
| | (a) | | Calculated based on the average shares outstanding methodology. |
| | (b) | | Reflects income recognized from special dividends which amounted to $0.05 per share and 0.12% of average net assets. |
| | (c) | | The amount shown for a share outstanding does not correspond with the aggregate net gain on investments for during the period due to the timing of sales and redemptions of Fund shares in relation to the fluctuating market values of the investments of the Fund. |
| | (d) | | Amount is less than $0.005 per share. |
| | (e) | | Assumes investment at the NAV at the beginning of the period, reinvestment of all dividends and distributions, a complete redemption of the investment at the NAV at the end of the period and no sales or redemption charges (if any). Total returns would be reduced if a sales or redemption charge was taken into account. Returns do not reflect the impact of taxes to shareholders relating to Fund distributions or the redemption of Fund shares. Total returns for periods less than one full year are not annualized. |
| | (g) | | The Fund’s portfolio turnover rate is calculated in accordance with regulatory requirements, without regard to transactions involving short term investments and certain derivatives. If such transactions were included, the Fund’s portfolio turnover rate may be higher. |
| | |
| The accompanying notes are an integral part of these financial statements. | | 77 |
GOLDMAN SACHS SMALL CAP GROWTH INSIGHTS FUND
Financial Highlights(continued)
Selected Share Data for a Share Outstanding Throughout Each Period
| | | | | | | | | | | | | | | | | | | | | | | | | | |
| | | | | Goldman Sachs Small Cap Growth Insights Fund | |
| | | | | Institutional Shares | |
| | | | | Six Months Ended
April 30, 2020
(Unaudited) | | | Year Ended October 31, | |
| | | | | 2019 | | | 2018 | | | 2017 | | | 2016 | | | 2015 | |
| | Per Share Data | |
| | | | | | | |
| | Net asset value, beginning of period | | $ | 41.92 | | | $ | 43.56 | | | $ | 42.53 | | | $ | 32.76 | | | $ | 35.46 | | | $ | 35.10 | |
| | | | | | | |
| | Net investment income(a) | | | 0.01 | | | | 0.01 | | | | 0.02 | (c) | | | 0.05 | | | | 0.13 | | | | 0.02 | |
| | | | | | | |
| | Net realized and unrealized gain (loss) | | | (5.86 | ) | | | 2.16 | | | | 2.54 | | | | 9.79 | | | | (0.14 | )(d) | | | 2.13 | |
| | | | | | | |
| | Total from investment operations | | | (5.85 | ) | | | 2.17 | | | | 2.56 | | | | 9.84 | | | | (0.01 | ) | | | 2.15 | |
| | | | | | | |
| | Distributions to shareholders from net investment income | | | — | (b) | | | — | | | | — | | | | (0.07 | ) | | | — | | | | — | |
| | | | | | | |
| | Distributions to shareholders from net realized gains | | | (0.49 | ) | | | (3.81 | ) | | | (1.53 | ) | | | — | | | | (2.69 | ) | | | (1.79 | ) |
| | | | | | | |
| | Total distributions | | | (0.49 | ) | | | (3.81 | ) | | | (1.53 | ) | | | (0.07 | ) | | | (2.69 | )�� | | | (1.79 | ) |
| | | | | | | |
| | Net asset value, end of period | | $ | 35.58 | | | $ | 41.92 | | | $ | 43.56 | | | $ | 42.53 | | | $ | 32.76 | | | $ | 35.46 | |
| | | | | | | |
| | Total Return(e) | | | (14.15 | )% | | | 6.08 | % | | | 6.26 | % | | | 30.04 | % | | | 0.01 | % | | | 6.39 | % |
| | | | | | | |
| | Net assets, end of period (in 000’s) | | $ | 275,910 | | | $ | 349,348 | | | $ | 307,032 | | | $ | 265,199 | | | $ | 91,248 | | | $ | 64,023 | |
| | | | | | | |
| | Ratio of net expenses to average net assets | | | 0.84 | %(f) | | | 0.85 | % | | | 0.84 | % | | | 0.85 | % | | | 0.85 | % | | | 0.86 | % |
| | | | | | | |
| | Ratio of total expenses to average net assets | | | 0.91 | %(f) | | | 0.93 | % | | | 0.93 | % | | | 1.01 | % | | | 1.11 | % | | | 1.20 | % |
| | | | | | | |
| | Ratio of net investment income to average net assets | | | 0.05 | %(f) | | | 0.02 | % | | | 0.03 | %(c) | | | 0.13 | % | | | 0.40 | % | | | 0.06 | % |
| | | | | | | |
| | Portfolio turnover rate(g) | | | 60 | % | | | 140 | % | | | 127 | % | | | 136 | % | | | 139 | % | | | 145 | % |
| | (a) | | Calculated based on the average shares outstanding methodology. |
| | (b) | | Amount is less than $0.005 per share. |
| | (c) | | Reflects income recognized from special dividends which amounted to $0.05 per share and 0.12% of average net assets. |
| | (d) | | The amount shown for a share outstanding does not correspond with the aggregate net gain on investments for during the period due to the timing of sales and redemptions of Fund shares in relation to the fluctuating market values of the investments of the Fund. |
| | (e) | | Assumes investment at the NAV at the beginning of the period, reinvestment of all dividends and distributions, a complete redemption of the investment at the NAV at the end of the period and no sales or redemption charges (if any). Total returns would be reduced if a sales or redemption charge was taken into account. Returns do not reflect the impact of taxes to shareholders relating to Fund distributions or the redemption of Fund shares. Total returns for periods less than one full year are not annualized. |
| | (g) | | The Fund’s portfolio turnover rate is calculated in accordance with regulatory requirements, without regard to transactions involving short term investments and certain derivatives. If such transactions were included, the Fund’s portfolio turnover rate may be higher. |
| | |
| 78 | | The accompanying notes are an integral part of these financial statements. |
GOLDMAN SACHS SMALL CAP GROWTH INSIGHTS FUND
Financial Highlights(continued)
Selected Share Data for a Share Outstanding Throughout Each Period
| | | | | | | | | | | | | | | | | | | | | | | | | | |
| | | | | Goldman Sachs Small Cap Growth Insights Fund | |
| | | | | Investor Shares | |
| | | | | Six Months Ended
April 30, 2020
(Unaudited) | | | Year Ended October 31, | |
| | | | | 2019 | | | 2018 | | | 2017 | | | 2016 | | | 2015 | |
| | Per Share Data | |
| | | | | | | |
| | Net asset value, beginning of period | | $ | 36.16 | | | $ | 38.18 | | | $ | 37.50 | | | $ | 28.93 | | | $ | 31.68 | | | $ | 31.59 | |
| | | | | | | |
| | Net investment income (loss)(a) | | | (0.08 | ) | | | (0.04 | ) | | | (0.04 | )(b) | | | — | (c) | | | 0.01 | | | | (0.04 | ) |
| | | | | | | |
| | Net realized and unrealized gain (loss) | | | (4.97 | ) | | | 1.83 | | | | 2.25 | | | | 8.63 | | | | (0.07 | )(d) | | | 1.92 | |
| | | | | | | |
| | Total from investment operations | | | (5.05 | ) | | | 1.79 | | | | 2.21 | | | | 8.63 | | | | (0.06 | ) | | | 1.88 | |
| | | | | | | |
| | Distributions to shareholders from net investment income | | | — | (c) | | | — | | | | — | | | | (0.06 | ) | | | — | | | | — | |
| | | | | | | |
| | Distributions to shareholders from net realized gains | | | (0.49 | ) | | | (3.81 | ) | | | (1.53 | ) | | | — | | | | (2.69 | ) | | | (1.79 | ) |
| | | | | | | |
| | Total distributions | | | (0.49 | ) | | | (3.81 | ) | | | (1.53 | ) | | | (0.06 | ) | | | (2.69 | ) | | | (1.79 | ) |
| | | | | | | |
| | Net asset value, end of period | | $ | 30.62 | | | $ | 36.16 | | | $ | 38.18 | | | $ | 37.50 | | | $ | 28.93 | | | $ | 31.68 | |
| | | | | | | |
| | Total Return(e) | | | (14.23 | )% | | | 5.93 | % | | | 6.13 | % | | | 29.87 | % | | | (0.15 | )% | | | 6.24 | % |
| | | | | | | |
| | Net assets, end of period (in 000’s) | | $ | 357,244 | | | $ | 378,807 | | | $ | 308,366 | | | $ | 192,860 | | | $ | 47,826 | | | $ | 4,683 | |
| | | | | | | |
| | Ratio of net expenses to average net assets | | | 0.97 | %(f) | | | 0.99 | % | | | 0.97 | % | | | 0.96 | % | | | 1.00 | % | | | 1.01 | % |
| | | | | | | |
| | Ratio of total expenses to average net assets | | | 1.04 | %(f) | | | 1.07 | % | | | 1.07 | % | | | 1.16 | % | | | 1.23 | % | | | 1.33 | % |
| | | | | | | |
| | Ratio of net investment income (loss) to average net assets | | | (0.47 | )%(f) | | | (0.12 | )% | | | (0.10 | )%(b) | | | 0.01 | % | | | 0.04 | % | | | (0.12 | )% |
| | | | | | | |
| | Portfolio turnover rate(g) | | | 60 | % | | | 140 | % | | | 127 | % | | | 136 | % | | | 139 | % | | | 145 | % |
| | (a) | | Calculated based on the average shares outstanding methodology. |
| | (b) | | Reflects income recognized from special dividends which amounted to $0.05 per share and 0.12% of average net assets. |
| | (c) | | Amount is less than $0.005 per share. |
| | (d) | | The amount shown for a share outstanding does not correspond with the aggregate net gain on investments for during the period due to the timing of sales and redemptions of Fund shares in relation to the fluctuating market values of the investments of the Fund. |
| | (e) | | Assumes investment at the NAV at the beginning of the period, reinvestment of all dividends and distributions, a complete redemption of the investment at the NAV at the end of the period and no sales or redemption charges (if any). Total returns would be reduced if a sales or redemption charge was taken into account. Returns do not reflect the impact of taxes to shareholders relating to Fund distributions or the redemption of Fund shares. Total returns for periods less than one full year are not annualized. |
| | (g) | | The Fund’s portfolio turnover rate is calculated in accordance with regulatory requirements, without regard to transactions involving short term investments and certain derivatives. If such transactions were included, the Fund’s portfolio turnover rate may be higher. |
| | |
| The accompanying notes are an integral part of these financial statements. | | 79 |
GOLDMAN SACHS SMALL CAP GROWTH INSIGHTS FUND
Financial Highlights(continued)
Selected Share Data for a Share Outstanding Throughout Each Period
| | | | | | | | | | | | | | |
| | | | | Goldman Sachs Small Cap Growth Insights Fund | |
| | | | | Class P Shares | |
| | | | | Six Months Ended
April 30, 2020
(Unaudited) | | | Year Ended
October 31, 2019 | | | Period Ended
October 31, 2018(a) | |
| | Per Share Data | | | | | | | | | | | | |
| | | | |
| | Net asset value, beginning of period | | $ | 41.94 | | | $ | 43.58 | | | $ | 44.33 | |
| | | | |
| | Net investment income(b) | | | 0.02 | | | | 0.01 | | | | 0.03 | (c) |
| | | | |
| | Net realized and unrealized gain (loss) | | | (5.87 | ) | | | 2.16 | | | | (0.78 | ) |
| | | | |
| | Total from investment operations | | | (5.85 | ) | | | 2.17 | | | | (0.75 | ) |
| | | | |
| | Distributions to shareholders from net investment income | | | — | (d) | | | — | | | | — | |
| | | | |
| | Distributions to shareholders from net realized gains | | | (0.49 | ) | | | (3.81 | ) | | | — | |
| | | | |
| | Total distributions | | | (0.49 | ) | | | (3.81 | ) | | | — | |
| | | | |
| | Net asset value, end of period | | $ | 35.60 | | | $ | 41.94 | | | $ | 43.58 | |
| | | | |
| | Total Return(e) | | | (14.17 | )% | | | 6.08 | % | | | (1.69 | )% |
| | | | |
| | Net assets, end of period (in 000’s) | | $ | 9,049 | | | $ | 12,534 | | | $ | 10,878 | |
| | | | |
| | Ratio of net expenses to average net assets | | | 0.83 | %(f) | | | 0.84 | % | | | 0.83 | %(f) |
| | | | |
| | Ratio of total expenses to average net assets | | | 0.90 | %(f) | | | 0.93 | % | | | 0.93 | %(f) |
| | | | |
| | Ratio of net investment income to average net assets | | | 0.10 | %(f) | | | 0.02 | % | | | 0.12 | %(c)(f) |
| | | | |
| | Portfolio turnover rate(g) | | | 60 | % | | | 140 | % | | | 127 | % |
| | (a) | | Commenced operations on April 16, 2018. |
| | (b) | | Calculated based on the average shares outstanding methodology. |
| | (c) | | Reflects income recognized from special dividends which amounted to $0.05 per share and 0.12% of average net assets. |
| | (d) | | Amount is less than $0.005 per share. |
| | (e) | | Assumes investment at the NAV at the beginning of the period, reinvestment of all dividends and distributions, a complete redemption of the investment at the NAV at the end of the period and no sales or redemption charges (if any). Total returns would be reduced if a sales or redemption charge was taken into account. Returns do not reflect the impact of taxes to shareholders relating to Fund distributions or the redemption of Fund shares. Total returns for periods less than one full year are not annualized. |
| | (g) | | The Fund’s portfolio turnover rate is calculated in accordance with regulatory requirements, without regard to transactions involving short term investments and certain derivatives. If such transactions were included, the Fund’s portfolio turnover rate may be higher. |
| | |
| 80 | | The accompanying notes are an integral part of these financial statements. |
GOLDMAN SACHS SMALL CAP GROWTH INSIGHTS FUND
Financial Highlights(continued)
Selected Share Data for a Share Outstanding Throughout Each Period
| | | | | | | | | | | | | | | | | | | | | | | | | | |
| | | | | Goldman Sachs Small Cap Growth Insights Fund | |
| | | | | Class R Shares | |
| | | | | Six Months Ended
April 30, 2020
(Unaudited) | | | Year Ended October 31, | |
| | | | | 2019 | | | 2018 | | | 2017 | | | 2016 | | | 2015 | |
| | Per Share Data | |
| | | | | | | |
| | Net asset value, beginning of period | | $ | 33.58 | | | $ | 35.90 | | | $ | 35.53 | | | $ | 27.49 | | | $ | 30.37 | | | $ | 30.51 | |
| | | | | | | |
| | Net investment loss(a) | | | (0.39 | ) | | | (0.20 | ) | | | (0.22 | )(b) | | | (0.16 | ) | | | (0.06 | ) | | | (0.18 | ) |
| | | | | | | |
| | Net realized and unrealized gain (loss) | | | (4.37 | ) | | | 1.69 | | | | 2.12 | | | | 8.20 | | | | (0.13 | )(c) | | | 1.83 | |
| | | | | | | |
| | Total from investment operations | | | (4.76 | ) | | | 1.49 | | | | 1.90 | | | | 8.04 | | | | (0.19 | ) | | | 1.65 | |
| | | | | | | |
| | Distributions to shareholders from net investment income | | | — | (d) | | | — | | | | — | | | | — | | | | — | | | | — | |
| | | | | | | |
| | Distributions to shareholders from net realized gains | | | (0.49 | ) | | | (3.81 | ) | | | (1.53 | ) | | | — | | | | (2.69 | ) | | | (1.79 | ) |
| | | | | | | |
| | Total distributions | | | (0.49 | ) | | | (3.81 | ) | | | — | | | | — | | | | — | | | | — | |
| | | | | | | |
| | Net asset value, end of period | | $ | 28.33 | | | $ | 33.58 | | | $ | 35.90 | | | $ | 35.53 | | | $ | 27.49 | | | $ | 30.37 | |
| | | | | | | |
| | Total Return(e) | | | (14.46 | )% | | | 5.42 | % | | | 5.58 | % | | | 29.25 | % | | | (0.63 | )% | | | 5.67 | % |
| | | | | | | |
| | Net assets, end of period (in 000’s) | | $ | 7,670 | | | $ | 19,707 | | | $ | 19,998 | | | $ | 12,113 | | | $ | 3,689 | | | $ | 2,299 | |
| | | | | | | |
| | Ratio of net expenses to average net assets | | | 1.47 | %(f) | | | 1.49 | % | | | 1.47 | % | | | 1.46 | % | | | 1.50 | % | | | 1.51 | % |
| | | | | | | |
| | Ratio of total expenses to average net assets | | | 1.54 | %(f) | | | 1.57 | % | | | 1.57 | % | | | 1.66 | % | | | 1.76 | % | | | 1.85 | % |
| | | | | | | |
| | Ratio of net investment loss to average net assets | | | (2.42 | )%(f) | | | (0.61 | )% | | | (0.59 | )%(b) | | | (0.50 | )% | | | (0.21 | )% | | | (0.60 | )% |
| | | | | | | |
| | Portfolio turnover rate(g) | | | 60 | % | | | 140 | % | | | 127 | % | | | 136 | % | | | 139 | % | | | 145 | % |
| | (a) | | Calculated based on the average shares outstanding methodology. |
| | (b) | | Reflects income recognized from special dividends which amounted to $0.05 per share and 0.12% of average net assets. |
| | (c) | | The amount shown for a share outstanding does not correspond with the aggregate net gain on investments for during the period due to the timing of sales and redemptions of Fund shares in relation to the fluctuating market values of the investments of the Fund. |
| | (d) | | Amount is less than $0.005 per share. |
| | (e) | | Assumes investment at the NAV at the beginning of the period, reinvestment of all dividends and distributions, a complete redemption of the investment at the NAV at the end of the period and no sales or redemption charges (if any). Total returns would be reduced if a sales or redemption charge was taken into account. Returns do not reflect the impact of taxes to shareholders relating to Fund distributions or the redemption of Fund shares. Total returns for periods less than one full year are not annualized. |
| | (g) | | The Fund’s portfolio turnover rate is calculated in accordance with regulatory requirements, without regard to transactions involving short term investments and certain derivatives. If such transactions were included, the Fund’s portfolio turnover rate may be higher. |
| | |
| The accompanying notes are an integral part of these financial statements. | | 81 |
GOLDMAN SACHS SMALL CAP GROWTH INSIGHTS FUND
Financial Highlights(continued)
Selected Share Data for a Share Outstanding Throughout Each Period
| | | | | | | | | | | | | | | | | | | | | | | | | | |
| | | | | Goldman Sachs Small Cap Growth Insights Fund | |
| | | | | Class R6 Shares | |
| | | | | Six Months Ended
April 30, 2020
(Unaudited) | | | Year Ended October 31, | | | Period Ended
October 31, 2015(a) | |
| | 2019 | | | 2018 | | | 2017 | | | 2016 | |
| | Per Share Data | |
| | | | | | | |
| | Net asset value, beginning of period | | $ | 41.95 | | | $ | 43.58 | | | $ | 42.54 | | | $ | 32.78 | | | $ | 35.46 | | | $ | 36.95 | |
| | | | | | | |
| | Net investment income (loss)(b) | | | 0.01 | | | | — | | | | 0.02 | (d) | | | 0.04 | | | | 0.13 | | | | (0.01 | ) |
| | | | | | | |
| | Net realized and unrealized gain (loss) | | | (5.87 | ) | | | 2.18 | | | | 2.55 | | | | 9.80 | | | | (0.12 | )(e) | | | (1.48 | ) |
| | | | | | | |
| | Total from investment operations | | | (5.86 | ) | | | 2.18 | | | | 2.57 | | | | 9.84 | | | | 0.01 | | | | (1.49 | ) |
| | | | | | | |
| | Distributions to shareholders from net investment income | | | — | (c) | | | — | | | | — | | | | (0.08 | ) | | | — | | | | — | |
| | | | | | | |
| | Distributions to shareholders from net realized gains | | | (0.49 | ) | | | (3.81 | ) | | | (1.53 | ) | | | — | | | | (2.69 | ) | | | — | |
| | | | | | | |
| | Total distributions | | | (0.49 | ) | | | (3.81 | ) | | | (1.53 | ) | | | (0.08 | ) | | | (2.69 | ) | | | — | |
| | | | | | | |
| | Net asset value, end of period | | $ | 35.60 | | | $ | 41.95 | | | $ | 43.58 | | | $ | 42.54 | | | $ | 32.78 | | | $ | 35.46 | |
| | | | | | | |
| | Total Return(f) | | | (14.15 | )% | | | 6.08 | % | | | 6.25 | % | | | 30.05 | % | | | 0.07 | % | | | (4.03 | )% |
| | | | | | | |
| | Net assets, end of period (in 000’s) | | $ | 266,967 | | | $ | 307,820 | | | $ | 118,729 | | | $ | 42,042 | | | $ | 6,667 | | | $ | 10 | |
| | | | | | | |
| | Ratio of net expenses to average net assets | | | 0.83 | %(g) | | | 0.84 | % | | | 0.83 | % | | | 0.83 | % | | | 0.83 | % | | | 0.85 | %(g) |
| | | | | | | |
| | Ratio of total expenses to average net assets | | | 0.90 | %(g) | | | 0.93 | % | | | 0.92 | % | | | 1.00 | % | | | 1.06 | % | | | 1.16 | %(g) |
| | | | | | | |
| | Ratio of net investment income (loss) to average net assets | | | 0.07 | %(g) | | | (0.01 | )% | | | 0.04 | %(d) | | | 0.09 | % | | | 0.40 | % | | | (0.07 | )%(g) |
| | | | | | | |
| | Portfolio turnover rate(h) | | | 60 | % | | | 140 | % | | | 127 | % | | | 136 | % | | | 139 | % | | | 145 | % |
| | (a) | | Commenced operations on July 31, 2015. |
| | (b) | | Calculated based on the average shares outstanding methodology. |
| | (c) | | Amount is less than $0.005 per share. |
| | (d) | | Reflects income recognized from special dividends which amounted to $0.05 per share and 0.12% of average net assets. |
| | (e) | | The amount shown for a share outstanding does not correspond with the aggregate net gain on investments for during the period due to the timing of sales and redemptions of Fund shares in relation to the fluctuating market values of the investments of the Fund. |
| | (f) | | Assumes investment at the NAV at the beginning of the period, reinvestment of all dividends and distributions, a complete redemption of the investment at the NAV at the end of the period and no sales or redemption charges (if any). Total returns would be reduced if a sales or redemption charge was taken into account. Returns do not reflect the impact of taxes to shareholders relating to Fund distributions or the redemption of Fund shares. Total returns for periods less than one full year are not annualized. |
| | (h) | | The Fund’s portfolio turnover rate is calculated in accordance with regulatory requirements, without regard to transactions involving short term investments and certain derivatives. If such transactions were included, the Fund’s portfolio turnover rate may be higher. |
| | |
| 82 | | The accompanying notes are an integral part of these financial statements. |
GOLDMAN SACHS SMALL CAP VALUE INSIGHTS FUND
Financial Highlights(continued)
Selected Share Data for a Share Outstanding Throughout Each Period
| | | | | | | | | | | | | | | | | | | | | | | | | | |
| | | | | Goldman Sachs Small Cap Value Insights Fund | |
| | | | | Class A Shares | |
| | | | | Six Months Ended
April 30, 2020
(Unaudited) | | | Year Ended October 31, | |
| | | | | 2019 | | | 2018 | | | 2017 | | | 2016 | | | 2015 | |
| | Per Share Data | |
| | | | | | | |
| | Net asset value, beginning of period | | $ | 39.69 | | | $ | 42.30 | | | $ | 46.29 | | | $ | 38.86 | | | $ | 38.37 | | | $ | 38.89 | |
| | | | | | | |
| | Net investment income(a) | | | 0.12 | | | | 0.25 | | | | 0.20 | | | | 0.23 | (b) | | | 0.28 | | | | 0.30 | |
| | | | | | | |
| | Net realized and unrealized gain (loss) | | | (9.90 | ) | | | 1.17 | | | | 0.70 | | | | 9.04 | | | | 2.55 | | | | (0.09 | ) |
| | | | | | | |
| | Total from investment operations | | | (9.78 | ) | | | 1.42 | | | | 0.90 | | | | 9.27 | | | | 2.83 | | | | 0.21 | |
| | | | | | | |
| | Distributions to shareholders from net investment income | | | (0.25 | ) | | | (0.19 | ) | | | (0.17 | ) | | | (0.25 | ) | | | (0.29 | ) | | | (0.14 | ) |
| | | | | | | |
| | Distributions to shareholders from net realized gains | | | — | | | | (3.84 | ) | | | (4.72 | ) | | | (1.59 | ) | | | (2.05 | ) | | | (0.59 | ) |
| | | | | | | |
| | Total distributions | | | (0.25 | ) | | | (4.03 | ) | | | (4.89 | ) | | | (1.84 | ) | | | (2.34 | ) | | | (0.73 | ) |
| | | | | | | |
| | Net asset value, end of period | | $ | 29.66 | | | $ | 39.69 | | | $ | 42.30 | | | $ | 46.29 | | | $ | 38.86 | | | $ | 38.37 | |
| | | | | | | |
| | Total Return(c) | | | (24.82 | )% | | | 4.40 | % | | | 2.08 | % | | | 23.98 | % | | | 7.99 | % | | | 0.53 | % |
| | | | | | | |
| | Net assets, end of period (in 000’s) | | $ | 94,427 | | | $ | 132,886 | | | $ | 112,219 | | | $ | 102,127 | | | $ | 91,210 | | | $ | 93,151 | |
| | | | | | | |
| | Ratio of net expenses to average net assets | | | 1.22 | %(d) | | | 1.25 | % | | | 1.23 | % | | | 1.24 | % | | | 1.25 | % | | | 1.25 | % |
| | | | | | | |
| | Ratio of total expenses to average net assets | | | 1.31 | %(d) | | | 1.39 | % | | | 1.40 | % | | | 1.49 | % | | | 1.54 | % | | | 1.52 | % |
| | | | | | | |
| | Ratio of net investment income to average net assets | | | 0.65 | %(d) | | | 0.67 | % | | | 0.44 | % | | | 0.53 | %(b) | | | 0.78 | % | | | 0.76 | % |
| | | | | | | |
| | Portfolio turnover rate(e) | | | 65 | % | | | 142 | % | | | 130 | % | | | 138 | % | | | 129 | % | | | 133 | % |
| | (a) | | Calculated based on the average shares outstanding methodology. |
| | (b) | | Reflects income recognized from special dividends which amounted to $0.03 per share and 0.07% of average net assets. |
| | (c) | | Assumes investment at the NAV at the beginning of the period, reinvestment of all dividends and distributions, a complete redemption of the investment at the NAV at the end of the period and no sales or redemption charges (if any). Total returns would be reduced if a sales or redemption charge was taken into account. Returns do not reflect the impact of taxes to shareholders relating to Fund distributions or the redemption of Fund shares. Total returns for periods less than one full year are not annualized. |
| | (e) | | The Fund’s portfolio turnover rate is calculated in accordance with regulatory requirements, without regard to transactions involving short term investments and certain derivatives. If such transactions were included, the Fund’s portfolio turnover rate may be higher. |
| | |
| The accompanying notes are an integral part of these financial statements. | | 83 |
GOLDMAN SACHS SMALL CAP VALUE INSIGHTS FUND
Financial Highlights(continued)
Selected Share Data for a Share Outstanding Throughout Each Period
| | | | | | | | | | | | | | | | | | | | | | | | | | |
| | | | | Goldman Sachs Small Cap Value Insights Fund | |
| | | | | Class C Shares | |
| | | | | Six Months Ended
April 30, 2020
(Unaudited) | | | Year Ended October 31, | |
| | | | | 2019 | | | 2018 | | | 2017 | | | 2016 | | | 2015 | |
| | Per Share Data | |
| | | | | | | |
| | Net asset value, beginning of period | | $ | 27.24 | | | $ | 30.35 | | | $ | 34.65 | | | $ | 29.53 | | | $ | 29.75 | | | $ | 30.40 | |
| | | | | | | |
| | Net investment income (loss)(a) | | | 0.01 | | | | (0.02 | ) | | | (0.10 | ) | | | (0.07 | )(b) | | | 0.01 | | | | — | |
| | | | | | | |
| | Net realized and unrealized gain (loss) | | | (6.82 | ) | | | 0.75 | | | | 0.52 | | | | 6.85 | | | | 1.92 | | | | (0.06 | ) |
| | | | | | | |
| | Total from investment operations | | | (6.81 | ) | | | 0.73 | | | | 0.42 | | | | 6.78 | | | | 1.93 | | | | (0.06 | ) |
| | | | | | | |
| | Distributions to shareholders from net investment income | | | (0.11 | ) | | | — | | | | — | | | | (0.07 | ) | | | (0.10 | ) | | | — | |
| | | | | | | |
| | Distributions to shareholders from net realized gains | | | — | | | | (3.84 | ) | | | (4.72 | ) | | | (1.59 | ) | | | (2.05 | ) | | | (0.59 | ) |
| | | | | | | |
| | Total distributions | | | (0.11 | ) | | | (3.84 | ) | | | (4.72 | ) | | | (1.66 | ) | | | (2.15 | ) | | | (0.59 | ) |
| | | | | | | |
| | Net asset value, end of period | | $ | 20.32 | | | $ | 27.24 | | | $ | 30.35 | | | $ | 34.65 | | | $ | 29.53 | | | $ | 29.75 | |
| | | | | | | |
| | Total Return(c) | | | (25.11 | )% | | | 3.67 | % | | | 1.31 | % | | | 23.09 | % | | | 7.15 | % | | | (0.21 | )% |
| | | | | | | |
| | Net assets, end of period (in 000’s) | | $ | 5,468 | | | $ | 7,961 | | | $ | 6,903 | | | $ | 17,037 | | | $ | 15,224 | | | $ | 16,416 | |
| | | | | | | |
| | Ratio of net expenses to average net assets | | | 1.97 | %(d) | | | 2.00 | % | | | 1.98 | % | | | 1.99 | % | | | 2.00 | % | | | 2.00 | % |
| | | | | | | |
| | Ratio of total expenses to average net assets | | | 2.06 | %(d) | | | 2.14 | % | | | 2.14 | % | | | 2.24 | % | | | 2.29 | % | | | 2.27 | % |
| | | | | | | |
| | Ratio of net investment income (loss) to average net assets | | | 0.10 | %(d) | | | (0.07 | )% | | | (0.31 | )% | | | (0.22 | )%(b) | | | 0.03 | % | | | 0.01 | % |
| | | | | | | |
| | Portfolio turnover rate(e) | | | 65 | % | | | 142 | % | | | 130 | % | | | 138 | % | | | 129 | % | | | 133 | % |
| | (a) | | Calculated based on the average shares outstanding methodology. |
| | (b) | | Reflects income recognized from special dividends which amounted to $0.03 per share and 0.07% of average net assets. |
| | (c) | | Assumes investment at the NAV at the beginning of the period, reinvestment of all dividends and distributions, a complete redemption of the investment at the NAV at the end of the period and no sales or redemption charges (if any). Total returns would be reduced if a sales or redemption charge was taken into account. Returns do not reflect the impact of taxes to shareholders relating to Fund distributions or the redemption of Fund shares. Total returns for periods less than one full year are not annualized. |
| | (e) | | The Fund’s portfolio turnover rate is calculated in accordance with regulatory requirements, without regard to transactions involving short term investments and certain derivatives. If such transactions were included, the Fund’s portfolio turnover rate may be higher. |
| | |
| 84 | | The accompanying notes are an integral part of these financial statements. |
GOLDMAN SACHS SMALL CAP VALUE INSIGHTS FUND
Financial Highlights(continued)
Selected Share Data for a Share Outstanding Throughout Each Period
| | | | | | | | | | | | | | | | | | | | | | | | | | |
| | | | | Goldman Sachs Small Cap Value Insights Fund | |
| | | | | Institutional Shares | |
| | | | | Six Months Ended
April 30, 2020
(Unaudited) | | | Year Ended October 31, | |
| | | | | 2019 | | | 2018 | | | 2017 | | | 2016 | | | 2015 | |
| | Per Share Data | |
| | | | | | | |
| | Net asset value, beginning of period | | $ | 53.74 | | | $ | 55.71 | | | $ | 59.38 | | | $ | 49.35 | | | $ | 48.06 | | | $ | 48.49 | |
| | | | | | | |
| | Net investment income(a) | | | 0.23 | | | | 0.47 | | | | 0.48 | | | | 0.50 | (b) | | | 0.55 | | | | 0.55 | |
| | | | | | | |
| | Net realized and unrealized gain (loss) | | | (13.38 | ) | | | 1.73 | | | | 0.90 | | | | 11.53 | | | | 3.23 | | | | (0.10 | ) |
| | | | | | | |
| | Total from investment operations | | | (13.15 | ) | | | 2.20 | | | | 1.38 | | | | 12.03 | | | | 3.78 | | | | 0.45 | |
| | | | | | | |
| | Distributions to shareholders from net investment income | | | (0.40 | ) | | | (0.33 | ) | | | (0.33 | ) | | | (0.41 | ) | | | (0.44 | ) | | | (0.29 | ) |
| | | | | | | |
| | Distributions to shareholders from net realized gains | | | — | | | | (3.84 | ) | | | (4.72 | ) | | | (1.59 | ) | | | (2.05 | ) | | | (0.59 | ) |
| | | | | | | |
| | Total distributions | | | (0.40 | ) | | | (4.17 | ) | | | (5.05 | ) | | | (2.00 | ) | | | (2.49 | ) | | | (0.88 | ) |
| | | | | | | |
| | Net asset value, end of period | | $ | 40.19 | | | $ | 53.74 | | | $ | 55.71 | | | $ | 59.38 | | | $ | 49.35 | | | $ | 48.06 | |
| | | | | | | |
| | Total Return(c) | | | (24.68 | )% | | | 4.81 | % | | | 2.47 | % | | | 24.49 | % | | | 8.41 | % | | | 0.93 | % |
| | | | | | | |
| | Net assets, end of period (in 000’s) | | $ | 153,561 | | | $ | 192,820 | | | $ | 60,516 | | | $ | 56,191 | | | $ | 21,717 | | | $ | 21,036 | |
| | | | | | | |
| | Ratio of net expenses to average net assets | | | 0.84 | %(d) | | | 0.87 | % | | | 0.84 | % | | | 0.84 | % | | | 0.85 | % | | | 0.85 | % |
| | | | | | | |
| | Ratio of total expenses to average net assets | | | 0.93 | %(d) | | | 1.02 | % | | | 1.00 | % | | | 1.09 | % | | | 1.14 | % | | | 1.12 | % |
| | | | | | | |
| | Ratio of net investment income to average net assets | | | 0.93 | %(d) | | | 0.96 | % | | | 0.82 | % | | | 0.90 | %(b) | | | 1.19 | % | | | 1.13 | % |
| | | | | | | |
| | Portfolio turnover rate(e) | | | 65 | % | | | 142 | % | | | 130 | % | | | 138 | % | | | 129 | % | | | 133 | % |
| | (a) | | Calculated based on the average shares outstanding methodology. |
| | (b) | | Reflects income recognized from special dividends which amounted to $0.03 per share and 0.07% of average net assets. |
| | (c) | | Assumes investment at the NAV at the beginning of the period, reinvestment of all dividends and distributions, a complete redemption of the investment at the NAV at the end of the period and no sales or redemption charges (if any). Total returns would be reduced if a sales or redemption charge was taken into account. Returns do not reflect the impact of taxes to shareholders relating to Fund distributions or the redemption of Fund shares. Total returns for periods less than one full year are not annualized. |
| | (e) | | The Fund’s portfolio turnover rate is calculated in accordance with regulatory requirements, without regard to transactions involving short term investments and certain derivatives. If such transactions were included, the Fund’s portfolio turnover rate may be higher. |
| | |
| The accompanying notes are an integral part of these financial statements. | | 85 |
GOLDMAN SACHS SMALL CAP VALUE INSIGHTS FUND
Financial Highlights(continued)
Selected Share Data for a Share Outstanding Throughout Each Period
| | | | | | | | | | | | | | | | | | | | | | | | | | |
| | | | | Goldman Sachs Small Cap Value Insights Fund | |
| | | | | Investor Shares | |
| | | | | Six Months Ended
April 30, 2020
(Unaudited) | | | Year Ended October 31, | |
| | | | | 2019 | | | 2018 | | | 2017 | | | 2016 | | | 2015 | |
| | Per Share Data | |
| | | | | | | |
| | Net asset value, beginning of period | | $ | 39.53 | | | $ | 42.18 | | | $ | 46.17 | | | $ | 38.78 | | | $ | 38.31 | | | $ | 38.84 | |
| | | | | | | |
| | Net investment income(a) | | | 0.12 | | | | 0.30 | | | | 0.31 | | | | 0.31 | (b) | | | 0.37 | | | | 0.39 | |
| | | | | | | |
| | Net realized and unrealized gain (loss) | | | (9.80 | ) | | | 1.20 | | | | 0.69 | | | | 9.05 | | | | 2.54 | | | | (0.10 | ) |
| | | | | | | |
| | Total from investment operations | | | (9.68 | ) | | | 1.50 | | | | 1.00 | | | | 9.36 | | | | 2.91 | | | | 0.29 | |
| | | | | | | |
| | Distributions to shareholders from net investment income | | | (0.37 | ) | | | (0.31 | ) | | | (0.27 | ) | | | (0.38 | ) | | | (0.39 | ) | | | (0.23 | ) |
| | | | | | | |
| | Distributions to shareholders from net realized gains | | | — | | | | (3.84 | ) | | | (4.72 | ) | | | (1.59 | ) | | | (2.05 | ) | | | (0.59 | ) |
| | | | | | | |
| | Total distributions | | | (0.37 | ) | | | (4.15 | ) | | | (4.99 | ) | | | (1.97 | ) | | | (2.44 | ) | | | (0.82 | ) |
| | | | | | | |
| | Net asset value, end of period | | $ | 29.48 | | | $ | 39.53 | | | $ | 42.18 | | | $ | 46.17 | | | $ | 38.78 | | | $ | 38.31 | |
| | | | | | | |
| | Total Return(c) | | | (24.76 | )% | | | 4.69 | % | | | 2.33 | % | | | 24.30 | % | | | 8.26 | % | | | 0.76 | % |
| | | | | | | |
| | Net assets, end of period (in 000’s) | | $ | 230,244 | | | $ | 59,800 | | | $ | 18,257 | | | $ | 5,695 | | | $ | 1,925 | | | $ | 1,774 | |
| | | | | | | |
| | Ratio of net expenses to average net assets | | | 0.97 | %(d) | | | 1.01 | % | | | 0.98 | % | | | 0.99 | % | | | 1.00 | % | | | 1.00 | % |
| | | | | | | |
| | Ratio of total expenses to average net assets | | | 1.06 | %(d) | | | 1.15 | % | | | 1.17 | % | | | 1.24 | % | | | 1.29 | % | | | 1.27 | % |
| | | | | | | |
| | Ratio of net investment income to average net assets | | | 0.72 | %(d) | | | 0.83 | % | | | 0.70 | % | | | 0.72 | %(b) | | | 1.02 | % | | | 1.00 | % |
| | | | | | | |
| | Portfolio turnover rate(e) | | | 65 | % | | | 142 | % | | | 130 | % | | | 138 | % | | | 129 | % | | | 133 | % |
| | (a) | | Calculated based on the average shares outstanding methodology. |
| | (b) | | Reflects income recognized from special dividends which amounted to $0.03 per share and 0.07% of average net assets. |
| | (c) | | Assumes investment at the NAV at the beginning of the period, reinvestment of all dividends and distributions, a complete redemption of the investment at the NAV at the end of the period and no sales or redemption charges (if any). Total returns would be reduced if a sales or redemption charge was taken into account. Returns do not reflect the impact of taxes to shareholders relating to Fund distributions or the redemption of Fund shares. Total returns for periods less than one full year are not annualized. |
| | (e) | | The Fund’s portfolio turnover rate is calculated in accordance with regulatory requirements, without regard to transactions involving short term investments and certain derivatives. If such transactions were included, the Fund’s portfolio turnover rate may be higher. |
| | |
| 86 | | The accompanying notes are an integral part of these financial statements. |
GOLDMAN SACHS SMALL CAP VALUE INSIGHTS FUND
Financial Highlights(continued)
Selected Share Data for a Share Outstanding Throughout Each Period
| | | | | | | | | | | | | | |
| | | | | Goldman Sachs Small Cap Value Insights Fund | |
| | | | | Class P Shares | |
| | | | | Six Months Ended
April 30, 2020
(Unaudited) | | | Year Ended
October 31, 2019 | | | Period Ended
October 31, 2018(a) | |
| | Per Share Data | | | | | | | | | | | | |
| | | | |
| | Net asset value, beginning of period | | $ | 53.72 | | | $ | 55.70 | | | $ | 57.05 | |
| | | | |
| | Net investment income(b) | | | 0.23 | | | | 0.54 | | | | 0.30 | |
| | | | |
| | Net realized and unrealized gain (loss) | | | (13.38 | ) | | | 1.66 | | | �� | (1.65 | ) |
| | | | |
| | Total from investment operations | | | (13.15 | ) | | | 2.20 | | | | (1.35 | ) |
| | | | |
| | Distributions to shareholders from net investment income | | | (0.40 | ) | | | (0.34 | ) | | | — | |
| | | | |
| | Distributions to shareholders from net realized gains | | | — | | | | (3.84 | ) | | | — | |
| | | | |
| | Total distributions | | | (0.40 | ) | | | (4.18 | ) | | | — | |
| | | | |
| | Net asset value, end of period | | $ | 40.17 | | | $ | 53.72 | | | $ | 55.70 | |
| | | | |
| | Total Return(c) | | | (24.69 | )% | | | 4.82 | % | | | (2.37 | )% |
| | | | |
| | Net assets, end of period (in 000’s) | | $ | 29,909 | | | $ | 47,977 | | | $ | 42,165 | |
| | | | |
| | Ratio of net expenses to average net assets | | | 0.83 | %(d) | | | 0.85 | % | | | 0.83 | %(d) |
| | | | |
| | Ratio of total expenses to average net assets | | | 0.92 | %(d) | | | 0.99 | % | | | 1.06 | %(d) |
| | | | |
| | Ratio of net investment income to average net assets | | | 0.95 | %(d) | | | 1.07 | % | | | 0.93 | %(d) |
| | | | |
| | Portfolio turnover rate(e) | | | 65 | % | | | 142 | % | | | 130 | % |
| | (a) | | Commenced operations on April 16, 2018. |
| | (b) | | Calculated based on the average shares outstanding methodology. |
| | (c) | | Assumes investment at the NAV at the beginning of the period, reinvestment of all dividends and distributions, a complete redemption of the investment at the NAV at the end of the period and no sales or redemption charges (if any). Total returns would be reduced if a sales or redemption charge was taken into account. Returns do not reflect the impact of taxes to shareholders relating to Fund distributions or the redemption of Fund shares. Total returns for periods less than one full year are not annualized. |
| | (e) | | The Fund’s portfolio turnover rate is calculated in accordance with regulatory requirements, without regard to transactions involving short term investments and certain derivatives. If such transactions were included, the Fund’s portfolio turnover rate may be higher. |
| | |
| The accompanying notes are an integral part of these financial statements. | | 87 |
GOLDMAN SACHS SMALL CAP VALUE INSIGHTS FUND
Financial Highlights(continued)
Selected Share Data for a Share Outstanding Throughout Each Period
| | | | | | | | | | | | | | | | | | | | | | | | | | |
| | | | | Goldman Sachs Small Cap Value Insights Fund | |
| | | | | Class R Shares | |
| | | | | Six Months Ended
April 30, 2020
(Unaudited) | | | Year Ended October 31, | |
| | | | | 2019 | | | 2018 | | | 2017 | | | 2016 | | | 2015 | |
| | Per Share Data | |
| | | | | | | |
| | Net asset value, beginning of period | | $ | 38.96 | | | $ | 41.63 | | | $ | 45.57 | | | $ | 38.32 | | | $ | 37.99 | | | $ | 38.50 | |
| | | | | | | |
| | Net investment income(a) | | | 0.08 | | | | 0.08 | | | | 0.09 | | | | 0.14 | (b) | | | 0.20 | | | | 0.14 | |
| | | | | | | |
| | Net realized and unrealized gain (loss) | | | (9.71 | ) | | | 1.22 | | | | 0.69 | | | | 8.89 | | | | 2.50 | | | | (0.04 | ) |
| | | | | | | |
| | Total from investment operations | | | (9.63 | ) | | | 1.30 | | | | 0.78 | | | | 9.03 | | | | 2.70 | | | | 0.10 | |
| | | | | | | |
| | Distributions to shareholders from net investment income | | | (0.29 | ) | | | (0.13 | ) | | | — | | | | (0.19 | ) | | | (0.32 | ) | | | (0.02 | ) |
| | | | | | | |
| | Distributions to shareholders from net realized gains | | | — | | | | (3.84 | ) | | | (4.72 | ) | | | (1.59 | ) | | | (2.05 | ) | | | (0.59 | ) |
| | | | | | | |
| | Total distributions | | | (0.29 | ) | | | (3.97 | ) | | | (4.72 | ) | | | (1.78 | ) | | | (2.37 | ) | | | (0.61 | ) |
| | | | | | | |
| | Net asset value, end of period | | $ | 29.04 | | | $ | 38.96 | | | $ | 41.63 | | | $ | 45.57 | | | $ | 38.32 | | | $ | 37.99 | |
| | | | | | | |
| | Total Return(c) | | | (24.94 | )% | | | 4.14 | % | | | 1.83 | % | | | 23.67 | % | | | 7.72 | % | | | 0.27 | % |
| | | | | | | |
| | Net assets, end of period (in 000’s) | | $ | 6,878 | | | $ | 8,514 | | | $ | 2,320 | | | $ | 1,621 | | | $ | 5,762 | | | $ | 4,992 | |
| | | | | | | |
| | Ratio of net expenses to average net assets | | | 1.47 | %(d) | | | 1.53 | % | | | 1.48 | % | | | 1.49 | % | | | 1.50 | % | | | 1.51 | % |
| | | | | | | |
| | Ratio of total expenses to average net assets | | | 1.56 | %(d) | | | 1.69 | % | | | 1.66 | % | | | 1.73 | % | | | 1.79 | % | | | 1.77 | % |
| | | | | | | |
| | Ratio of net investment income to average net assets | | | 0.47 | %(d) | | | 0.23 | % | | | 0.20 | % | | | 0.33 | %(b) | | | 0.55 | % | | | 0.36 | % |
| | | | | | | |
| | Portfolio turnover rate(e) | | | 65 | % | | | 142 | % | | | 130 | % | | | 138 | % | | | 129 | % | | | 133 | % |
| | (a) | | Calculated based on the average shares outstanding methodology. |
| | (b) | | Reflects income recognized from special dividends which amounted to $0.03 per share and 0.07% of average net assets. |
| | (c) | | Assumes investment at the NAV at the beginning of the period, reinvestment of all dividends and distributions, a complete redemption of the investment at the NAV at the end of the period and no sales or redemption charges (if any). Total returns would be reduced if a sales or redemption charge was taken into account. Returns do not reflect the impact of taxes to shareholders relating to Fund distributions or the redemption of Fund shares. Total returns for periods less than one full year are not annualized. |
| | (e) | | The Fund’s portfolio turnover rate is calculated in accordance with regulatory requirements, without regard to transactions involving short term investments and certain derivatives. If such transactions were included, the Fund’s portfolio turnover rate may be higher. |
| | |
| 88 | | The accompanying notes are an integral part of these financial statements. |
GOLDMAN SACHS SMALL CAP VALUE INSIGHTS FUND
Financial Highlights(continued)
Selected Share Data for a Share Outstanding Throughout Each Period
| | | | | | | | | | | | | | | | | | | | | | | | | | |
| | | | | Goldman Sachs Small Cap Value Insights Fund | |
| | | | | Class R6 Shares | |
| | | | | Six Months Ended
April 30, 2020
(Unaudited) | | | Year Ended October 31, | | | Period Ended
October 31, 2015(a) | |
| | | | | 2019 | | | 2018 | | | 2017 | | | 2016 | |
| | Per Share Data | |
| | | | | | | |
| | Net asset value, beginning of period | | $ | 53.73 | | | $ | 55.71 | | | $ | 59.38 | | | $ | 49.35 | | | $ | 48.07 | | | $ | 48.87 | |
| | | | | | | |
| | Net investment income(b) | | | 0.22 | | | | 0.45 | | | | 0.50 | | | | 0.46 | (c) | | | 0.55 | | | | 0.10 | |
| | | | | | | |
| | Net realized and unrealized gain (loss) | | | (13.37 | ) | | | 1.75 | | | | 0.90 | | | | 11.56 | | | | 3.23 | | | | (0.90 | ) |
| | | | | | | |
| | Total from investment operations | | | (13.15 | ) | | | 2.20 | | | | 1.40 | | | | 12.02 | | | | 3.78 | | | | (0.80 | ) |
| | | | | | | |
| | Distributions to shareholders from net investment income | | | (0.40 | ) | | | (0.34 | ) | | | (0.35 | ) | | | (0.40 | ) | | | (0.45 | ) | | | — | |
| | | | | | | |
| | Distributions to shareholders from net realized gains | | | — | | | | (3.84 | ) | | | (4.72 | ) | | | (1.59 | ) | | | (2.05 | ) | | | — | |
| | | | | | | |
| | Total distributions | | | (0.40 | ) | | | (4.18 | ) | | | (5.07 | ) | | | (1.99 | ) | | | (2.50 | ) | | | — | |
| | | | | | | |
| | Net asset value, end of period | | $ | 40.18 | | | $ | 53.73 | | | $ | 55.71 | | | $ | 59.38 | | | $ | 49.35 | | | $ | 48.07 | |
| | | | | | | |
| | Total Return(d) | | | (24.68 | )% | | | 4.83 | % | | | 2.49 | % | | | 24.49 | % | | | 8.41 | % | | | (1.64 | )% |
| | | | | | | |
| | Net assets, end of period (in 000’s) | | $ | 136,290 | | | $ | 118,331 | | | $ | 22,460 | | | $ | 4,542 | | | $ | 11 | | | $ | 10 | |
| | | | | | | |
| | Ratio of net expenses to average net assets | | | 0.83 | %(e) | | | 0.86 | % | | | 0.83 | % | | | 0.83 | % | | | 0.84 | % | | | 0.83 | %(e) |
| | | | | | | |
| | Ratio of total expenses to average net assets | | | 0.92 | %(e) | | | 1.00 | % | | | 1.02 | % | | | 1.11 | % | | | 1.14 | % | | | 1.09 | %(e) |
| | | | | | | |
| | Ratio of net investment income to average net assets | | | 0.94 | %(e) | | | 0.91 | % | | | 0.85 | % | | | 0.83 | %(c) | | | 1.18 | % | | | 0.83 | %(e) |
| | | | | | | |
| | Portfolio turnover rate(f) | | | 65 | % | | | 142 | % | | | 130 | % | | | 138 | % | | | 129 | % | | | 133 | % |
| | (a) | | Commenced operations on July 31, 2015. |
| | (b) | | Calculated based on the average shares outstanding methodology. |
| | (c) | | Reflects income recognized from special dividends which amounted to $0.03 per share and 0.07% of average net assets. |
| | (d) | | Assumes investment at the NAV at the beginning of the period, reinvestment of all dividends and distributions, a complete redemption of the investment at the NAV at the end of the period and no sales or redemption charges (if any). Total returns would be reduced if a sales or redemption charge was taken into account. Returns do not reflect the impact of taxes to shareholders relating to Fund distributions or the redemption of Fund shares. Total returns for periods less than one full year are not annualized. |
| | (f) | | The Fund’s portfolio turnover rate is calculated in accordance with regulatory requirements, without regard to transactions involving short term investments and certain derivatives. If such transactions were included, the Fund’s portfolio turnover rate may be higher. |
| | |
| The accompanying notes are an integral part of these financial statements. | | 89 |
GOLDMAN SACHS U.S. EQUITY INSIGHTS FUND
Financial Highlights(continued)
Selected Share Data for a Share Outstanding Throughout Each Period
| | | | | | | | | | | | | | | | | | | | | | | | | | |
| | | | | Goldman Sachs U.S. Equity Insights Fund | |
| | | | | Class A Shares | |
| | | | | Six Months Ended
April 30, 2020
(Unaudited) | | | Year Ended October 31, | |
| | | | | 2019 | | | 2018 | | | 2017 | | | 2016 | | | 2015 | |
| | Per Share Data | |
| | | | | | | |
| | Net asset value, beginning of period | | $ | 49.48 | | | $ | 47.72 | | | $ | 49.73 | | | $ | 40.76 | | | $ | 41.46 | | | $ | 40.20 | |
| | | | | | | |
| | Net investment income(a) | | | 0.20 | | | | 0.44 | | | | 0.36 | | | | 0.49 | | | | 0.38 | | | | 0.43 | |
| | | | | | | |
| | Net realized and unrealized gain (loss) | | | (1.72 | ) | | | 3.14 | | | | 2.46 | | | | 10.17 | | | | 0.49 | | | | 1.12 | |
| | | | | | | |
| | Total from investment operations | | | (1.52 | ) | | | 3.58 | | | | 2.82 | | | | 10.66 | | | | 0.87 | | | | 1.55 | |
| | | | | | | |
| | Distributions to shareholders from net investment income | | | (0.71 | ) | | | (0.17 | ) | | | (0.45 | ) | | | (0.31 | ) | | | (0.38 | ) | | | (0.29 | ) |
| | | | | | | |
| | Distributions to shareholders from net realized gains | | | — | | | | (1.65 | ) | | | (4.38 | ) | | | (1.38 | ) | | | (1.19 | ) | | | — | |
| | | | | | | |
| | Total distributions | | | (0.71 | ) | | | (1.82 | ) | | | (4.83 | ) | | | (1.69 | ) | | | (1.57 | ) | | | (0.29 | ) |
| | | | | | | |
| | Net asset value, end of period | | $ | 47.25 | | | $ | 49.48 | | | $ | 47.72 | | | $ | 49.73 | | | $ | 40.76 | | | $ | 41.46 | |
| | | | | | | |
| | Total Return(b) | | | (3.20 | )% | | | 7.98 | % | | | 5.93 | % | | | 26.89 | % | | | 2.25 | % | | | 3.86 | % |
| | | | | | | |
| | Net assets, end of period (in 000’s) | | $ | 269,242 | | | $ | 299,440 | | | $ | 301,934 | | | $ | 278,516 | | | $ | 251,466 | | | $ | 272,738 | |
| | | | | | | |
| | Ratio of net expenses to average net assets | | | 0.94 | %(c) | | | 0.94 | % | | | 0.95 | % | | | 0.96 | % | | | 0.96 | % | | | 0.96 | % |
| | | | | | | |
| | Ratio of total expenses to average net assets | | | 1.00 | %(c) | | | 1.01 | % | | | 1.00 | % | | | 1.14 | % | | | 1.18 | % | | | 1.17 | % |
| | | | | | | |
| | Ratio of net investment income to average net assets | | | 0.80 | %(c) | | | 0.93 | % | | | 0.73 | % | | | 1.08 | % | | | 0.96 | % | | | 1.04 | % |
| | | | | | | |
| | Portfolio turnover rate(d) | | | 105 | % | | | 199 | % | | | 168 | % | | | 193 | % | | | 213 | % | | | 224 | % |
| | (a) | | Calculated based on the average shares outstanding methodology. |
| | (b) | | Assumes investment at the NAV at the beginning of the period, reinvestment of all dividends and distributions, a complete redemption of the investment at the NAV at the end of the period and no sales or redemption charges (if any). Total returns would be reduced if a sales or redemption charge was taken into account. Returns do not reflect the impact of taxes to shareholders relating to Fund distributions or the redemption of Fund shares. Total returns for periods less than one full year are not annualized. |
| | (d) | | The Fund’s portfolio turnover rate is calculated in accordance with regulatory requirements, without regard to transactions involving short term investments and certain derivatives. If such transactions were included, the Fund’s portfolio turnover rate may be higher. |
| | |
| 90 | | The accompanying notes are an integral part of these financial statements. |
GOLDMAN SACHS U.S. EQUITY INSIGHTS FUND
Financial Highlights(continued)
Selected Share Data for a Share Outstanding Throughout Each Period
| | | | | | | | | | | | | | | | | | | | | | | | | | |
| | | | | Goldman Sachs U.S. Equity Insights Fund | |
| | | | | Class C Shares | |
| | | | | Six Months Ended
April 30, 2020
(Unaudited) | | | Year Ended October 31, | |
| | | | | 2019 | | | 2018 | | | 2017 | | | 2016 | | | 2015 | |
| | Per Share Data | |
| | | | | | | |
| | Net asset value, beginning of period | | $ | 44.04 | | | $ | 42.80 | | | $ | 45.08 | | | $ | 37.10 | | | $ | 37.88 | | | $ | 36.78 | |
| | | | | | | |
| | Net investment income(a) | | | 0.01 | | | | 0.08 | | | | 0.01 | | | | 0.13 | | | | 0.08 | | | | 0.11 | |
| | | | | | | |
| | Net realized and unrealized gain (loss) | | | (1.53 | ) | | | 2.81 | | | | 2.22 | | | | 9.25 | | | | 0.44 | | | | 1.03 | |
| | | | | | | |
| | Total from investment operations | | | (1.52 | ) | | | 2.89 | | | | 2.23 | | | | 9.38 | | | | 0.52 | | | | 1.14 | |
| | | | | | | |
| | Distributions to shareholders from net investment income | | | (0.40 | ) | | | — | | | | (0.13 | ) | | | (0.02 | ) | | | (0.11 | ) | | | (0.04 | ) |
| | | | | | | |
| | Distributions to shareholders from net realized gains | | | — | | | | (1.65 | ) | | | (4.38 | ) | | | (1.38 | ) | | | (1.19 | ) | | | — | |
| | | | | | | |
| | Total distributions | | | (0.40 | ) | | | (1.65 | ) | | | (4.51 | ) | | | (1.40 | ) | | | (1.30 | ) | | | (0.04 | ) |
| | | | | | | |
| | Net asset value, end of period | | $ | 42.12 | | | $ | 44.04 | | | $ | 42.80 | | | $ | 45.08 | | | $ | 37.10 | | | $ | 37.88 | |
| | | | | | | |
| | Total Return(b) | | | (3.53 | )% | | | 7.20 | % | | | 5.15 | % | | | 25.93 | % | | | 1.48 | % | | | 3.09 | % |
| | | | | | | |
| | Net assets, end of period (in 000’s) | | $ | 14,410 | | | $ | 15,854 | | | $ | 14,277 | | | $ | 28,756 | | | $ | 31,377 | | | $ | 37,811 | |
| | | | | | | |
| | Ratio of net expenses to average net assets | | | 1.69 | %(c) | | | 1.69 | % | | | 1.70 | % | | | 1.71 | % | | | 1.71 | % | | | 1.71 | % |
| | | | | | | |
| | Ratio of total expenses to average net assets | | | 1.75 | %(c) | | | 1.76 | % | | | 1.75 | % | | | 1.89 | % | | | 1.93 | % | | | 1.92 | % |
| | | | | | | |
| | Ratio of net investment income to average net assets | | | 0.07 | %(c) | | | 0.18 | % | | | 0.01 | % | | | 0.31 | % | | | 0.21 | % | | | 0.28 | % |
| | | | | | | |
| | Portfolio turnover rate(d) | | | 105 | % | | | 199 | % | | | 168 | % | | | 193 | % | | | 213 | % | | | 224 | % |
| | (a) | | Calculated based on the average shares outstanding methodology. |
| | (b) | | Assumes investment at the NAV at the beginning of the period, reinvestment of all dividends and distributions, a complete redemption of the investment at the NAV at the end of the period and no sales or redemption charges (if any). Total returns would be reduced if a sales or redemption charge was taken into account. Returns do not reflect the impact of taxes to shareholders relating to Fund distributions or the redemption of Fund shares. Total returns for periods less than one full year are not annualized. |
| | (d) | | The Fund’s portfolio turnover rate is calculated in accordance with regulatory requirements, without regard to transactions involving short term investments and certain derivatives. If such transactions were included, the Fund’s portfolio turnover rate may be higher. |
| | |
| The accompanying notes are an integral part of these financial statements. | | 91 |
GOLDMAN SACHS U.S. EQUITY INSIGHTS FUND
Financial Highlights(continued)
Selected Share Data for a Share Outstanding Throughout Each Period
| | | | | | | | | | | | | | | | | | | | | | | | | | |
| | | | | Goldman Sachs U.S. Equity Insights Fund | |
| | | | | Institutional Shares | |
| | | | | Six Months Ended
April 30, 2020
(Unaudited) | | | Year Ended October 31, | |
| | | | | 2019 | | | 2018 | | | 2017 | | | 2016 | | | 2015 | |
| | Per Share Data | |
| | | | | | | |
| | Net asset value, beginning of period | | $ | 51.16 | | | $ | 49.30 | | | $ | 51.21 | | | $ | 41.92 | | | $ | 42.60 | | | $ | 41.29 | |
| | | | | | | |
| | Net investment income(a) | | | 0.30 | | | | 0.72 | | | | 0.54 | | | | 0.70 | | | | 0.54 | | | | 0.60 | |
| | | | | | | |
| | Net realized and unrealized gain (loss) | | | (1.77 | ) | | | 3.14 | | | | 2.56 | | | | 10.45 | | | | 0.52 | | | | 1.16 | |
| | | | | | | |
| | Total from investment operations | | | (1.47 | ) | | | 3.86 | | | | 3.10 | | | | 11.15 | | | | 1.06 | | | | 1.76 | |
| | | | | | | |
| | Distributions to shareholders from net investment income | | | (0.88 | ) | | | (0.35 | ) | | | (0.63 | ) | | | (0.48 | ) | | | (0.55 | ) | | | (0.45 | ) |
| | | | | | | |
| | Distributions to shareholders from net realized gains | | | — | | | | (1.65 | ) | | | (4.38 | ) | | | (1.38 | ) | | | (1.19 | ) | | | — | |
| | | | | | | |
| | Total distributions | | | (0.88 | ) | | | (2.00 | ) | | | (5.01 | ) | | | (1.86 | ) | | | (1.74 | ) | | | (0.45 | ) |
| | | | | | | |
| | Net asset value, end of period | | $ | 48.81 | | | $ | 51.16 | | | $ | 49.30 | | | $ | 51.21 | | | $ | 41.92 | | | $ | 42.60 | |
| | | | | | | |
| | Total Return(b) | | | (2.99 | )% | | | 8.39 | % | | | 6.34 | % | | | 27.40 | % | | | 2.66 | % | | | 4.27 | % |
| | | | | | | |
| | Net assets, end of period (in 000’s) | | $ | 239,944 | | | $ | 295,408 | | | $ | 842,673 | | | $ | 249,034 | | | $ | 177,412 | | | $ | 121,863 | |
| | | | | | | |
| | Ratio of net expenses to average net assets | | | 0.56 | %(c) | | | 0.55 | % | | | 0.55 | % | | | 0.56 | % | | | 0.56 | % | | | 0.56 | % |
| | | | | | | |
| | Ratio of total expenses to average net assets | | | 0.62 | %(c) | | | 0.60 | % | | | 0.62 | % | | | 0.74 | % | | | 0.78 | % | | | 0.77 | % |
| | | | | | | |
| | Ratio of net investment income to average net assets | | | 1.17 | %(c) | | | 1.40 | % | | | 1.07 | % | | | 1.50 | % | | | 1.33 | % | | | 1.42 | % |
| | | | | | | |
| | Portfolio turnover rate(d) | | | 105 | % | | | 199 | % | | | 168 | % | | | 193 | % | | | 213 | % | | | 224 | % |
| | (a) | | Calculated based on the average shares outstanding methodology. |
| | (b) | | Assumes investment at the NAV at the beginning of the period, reinvestment of all dividends and distributions, a complete redemption of the investment at the NAV at the end of the period and no sales or redemption charges (if any). Total returns would be reduced if a sales or redemption charge was taken into account. Returns do not reflect the impact of taxes to shareholders relating to Fund distributions or the redemption of Fund shares. Total returns for periods less than one full year are not annualized. |
| | (d) | | The Fund’s portfolio turnover rate is calculated in accordance with regulatory requirements, without regard to transactions involving short term investments and certain derivatives. If such transactions were included, the Fund’s portfolio turnover rate may be higher. |
| | |
| 92 | | The accompanying notes are an integral part of these financial statements. |
GOLDMAN SACHS U.S. EQUITY INSIGHTS FUND
Financial Highlights(continued)
Selected Share Data for a Share Outstanding Throughout Each Period
| | | | | | | | | | | | | | | | | | | | | | | | | | |
| | | | | Goldman Sachs U.S. Equity Insights Fund | |
| | | | | Service Shares | |
| | | | | Six Months Ended
April 30, 2020
(Unaudited) | | | Year Ended October 31, | |
| | | | | 2019 | | | 2018 | | | 2017 | | | 2016 | | | 2015 | |
| | Per Share Data | |
| | | | | | | |
| | Net asset value, beginning of period | | $ | 49.19 | | | $ | 47.41 | | | $ | 49.47 | | | $ | 40.60 | | | $ | 41.37 | | | $ | 40.12 | |
| | | | | | | |
| | Net investment income(a) | | | 0.16 | | | | 0.38 | | | | 0.30 | | | | 0.43 | | | | 0.33 | | | | 0.36 | |
| | | | | | | |
| | Net realized and unrealized gain (loss) | | | (1.71 | ) | | | 3.13 | | | | 2.45 | | | | 10.14 | | | | 0.50 | | | | 1.15 | |
| | | | | | | |
| | Total from investment operations | | | (1.55 | ) | | | 3.51 | | | | 2.75 | | | | 10.57 | | | | 0.83 | | | | 1.51 | |
| | | | | | | |
| | Distributions to shareholders from net investment income | | | (0.67 | ) | | | (0.08 | ) | | | (0.43 | ) | | | (0.32 | ) | | | (0.41 | ) | | | (0.26 | ) |
| | | | | | | |
| | Distributions to shareholders from net realized gains | | | — | | | | (1.65 | ) | | | (4.38 | ) | | | (1.38 | ) | | | (1.19 | ) | | | — | |
| | | | | | | |
| | Total distributions | | | (0.67 | ) | | | (1.73 | ) | | | (4.81 | ) | | | (1.70 | ) | | | (1.60 | ) | | | (0.26 | ) |
| | | | | | | |
| | Net asset value, end of period | | $ | 46.97 | | | $ | 49.19 | | | $ | 47.41 | | | $ | 49.47 | | | $ | 40.60 | | | $ | 41.37 | |
| | | | | | | |
| | Total Return(b) | | | (3.25 | )% | | | 7.86 | % | | | 5.81 | % | | | 26.76 | % | | | 2.15 | % | | | 3.75 | % |
| | | | | | | |
| | Net assets, end of period (in 000’s) | | $ | 5,163 | | | $ | 6,700 | | | $ | 5,925 | | | $ | 6,739 | | | $ | 5,473 | | | $ | 3,344 | |
| | | | | | | |
| | Ratio of net expenses to average net assets | | | 1.06 | %(c) | | | 1.05 | % | | | 1.06 | % | | | 1.06 | % | | | 1.06 | % | | | 1.06 | % |
| | | | | | | |
| | Ratio of total expenses to average net assets | | | 1.12 | %(c) | | | 1.13 | % | | | 1.11 | % | | | 1.24 | % | | | 1.28 | % | | | 1.27 | % |
| | | | | | | |
| | Ratio of net investment income to average net assets | | | 0.67 | %(c) | | | 0.81 | % | | | 0.61 | % | | | 0.96 | % | | | 0.83 | % | | | 0.86 | % |
| | | | | | | |
| | Portfolio turnover rate(d) | | | 105 | % | | | 199 | % | | | 168 | % | | | 193 | % | | | 213 | % | | | 224 | % |
| | (a) | | Calculated based on the average shares outstanding methodology. |
| | (b) | | Assumes investment at the NAV at the beginning of the period, reinvestment of all dividends and distributions, a complete redemption of the investment at the NAV at the end of the period and no sales or redemption charges (if any). Total returns would be reduced if a sales or redemption charge was taken into account. Returns do not reflect the impact of taxes to shareholders relating to Fund distributions or the redemption of Fund shares. Total returns for periods less than one full year are not annualized. |
| | (d) | | The Fund’s portfolio turnover rate is calculated in accordance with regulatory requirements, without regard to transactions involving short term investments and certain derivatives. If such transactions were included, the Fund’s portfolio turnover rate may be higher. |
| | |
| The accompanying notes are an integral part of these financial statements. | | 93 |
GOLDMAN SACHS U.S. EQUITY INSIGHTS FUND
Financial Highlights(continued)
Selected Share Data for a Share Outstanding Throughout Each Period
| | | | | | | | | | | | | | | | | | | | | | | | | | |
| | | | | Goldman Sachs U.S. Equity Insights Fund | |
| | | | | Investor Shares | |
| | | | | Six Months Ended
April 30, 2020
(Unaudited) | | | Year Ended October 31, | |
| | | | | 2019 | | | 2018 | | | 2017 | | | 2016 | | | 2015 | |
| | Per Share Data | |
| | | | | | | |
| | Net asset value, beginning of period | | $ | 48.84 | | | $ | 47.17 | | | $ | 49.22 | | | $ | 40.39 | | | $ | 41.13 | | | $ | 39.89 | |
| | | | | | | |
| | Net investment income(a) | | | 0.25 | | | | 0.54 | | | | 0.46 | | | | 0.61 | | | | 0.45 | | | | 0.51 | |
| | | | | | | |
| | Net realized and unrealized gain (loss) | | | (1.69 | ) | | | 3.09 | | | | 2.45 | | | | 10.05 | | | | 0.50 | | | | 1.13 | |
| | | | | | | |
| | Total from investment operations | | | (1.44 | ) | | | 3.63 | | | | 2.91 | | | | 10.66 | | | | 0.95 | | | | 1.64 | |
| | | | | | | |
| | Distributions to shareholders from net investment income | | | (0.83 | ) | | | (0.31 | ) | | | (0.58 | ) | | | (0.45 | ) | | | (0.50 | ) | | | (0.40 | ) |
| | | | | | | |
| | Distributions to shareholders from net realized gains | | | — | | | | (1.65 | ) | | | (4.38 | ) | | | (1.38 | ) | | | (1.19 | ) | | | — | |
| | | | | | | |
| | Total distributions | | | (0.83 | ) | | | (1.96 | ) | | | (4.96 | ) | | | (1.83 | ) | | | (1.69 | ) | | | (0.40 | ) |
| | | | | | | |
| | Net asset value, end of period | | $ | 46.57 | | | $ | 48.84 | | | $ | 47.17 | | | $ | 49.22 | | | $ | 40.39 | | | $ | 41.13 | |
| | | | | | | |
| | Total Return(b) | | | (3.06 | )% | | | 8.25 | % | | | 6.20 | % | | | 27.21 | % | | | 2.48 | % | | | 4.12 | % |
| | | | | | | |
| | Net assets, end of period (in 000’s) | | $ | 83,066 | | | $ | 116,633 | | | $ | 103,230 | | | $ | 43,290 | | | $ | 18,322 | | | $ | 4,615 | |
| | | | | | | |
| | Ratio of net expenses to average net assets | | | 0.69 | %(c) | | | 0.69 | % | | | 0.70 | % | | | 0.71 | % | | | 0.71 | % | | | 0.71 | % |
| | | | | | | |
| | Ratio of total expenses to average net assets | | | 0.75 | %(c) | | | 0.76 | % | | | 0.76 | % | | | 0.89 | % | | | 0.93 | % | | | 0.92 | % |
| | | | | | | |
| | Ratio of net investment income to average net assets | | | 1.05 | %(c) | | | 1.17 | % | | | 0.95 | % | | | 1.36 | % | | | 1.13 | % | | | 1.24 | % |
| | | | | | | |
| | Portfolio turnover rate(d) | | | 105 | % | | | 199 | % | | | 168 | % | | | 193 | % | | | 213 | % | | | 224 | % |
| | (a) | | Calculated based on the average shares outstanding methodology. |
| | (b) | | Assumes investment at the NAV at the beginning of the period, reinvestment of all dividends and distributions, a complete redemption of the investment at the NAV at the end of the period and no sales or redemption charges (if any). Total returns would be reduced if a sales or redemption charge was taken into account. Returns do not reflect the impact of taxes to shareholders relating to Fund distributions or the redemption of Fund shares. Total returns for periods less than one full year are not annualized. |
| | (d) | | The Fund’s portfolio turnover rate is calculated in accordance with regulatory requirements, without regard to transactions involving short term investments and certain derivatives. If such transactions were included, the Fund’s portfolio turnover rate may be higher. |
| | |
| 94 | | The accompanying notes are an integral part of these financial statements. |
GOLDMAN SACHS U.S. EQUITY INSIGHTS FUND
Financial Highlights(continued)
Selected Share Data for a Share Outstanding Throughout Each Period
| | | | | | | | | | | | | | |
| | | | | Goldman Sachs U.S. Equity Insights Fund | |
| | | | | Class P Shares | |
| | | | | Six Months Ended
April 30, 2020
(Unaudited) | | | Year Ended
October 31, 2019 | | | Period Ended
October 31, 2018(a) | |
| | Per Share Data | | | | | | | | | | | | |
| | | | |
| | Net asset value, beginning of period | | $ | 51.14 | | | $ | 49.28 | | | $ | 49.09 | |
| | | | |
| | Net investment income(b) | | | 0.30 | | | | 0.65 | | | | 0.26 | |
| | | | |
| | Net realized and unrealized gain (loss) | | | (1.76 | ) | | | 3.21 | | | | (0.07 | ) |
| | | | |
| | Total from investment operations | | | (1.46 | ) | | | 3.86 | | | | 0.19 | |
| | | | |
| | Distributions to shareholders from net investment income | | | (0.91 | ) | | | (0.35 | ) | | | — | |
| | | | |
| | Distributions to shareholders from net realized gains | | | — | | | | (1.65 | ) | | | — | |
| | | | |
| | Total distributions | | | (0.91 | ) | | | (2.00 | ) | | | — | |
| | | | |
| | Net asset value, end of period | | $ | 48.77 | | | $ | 51.14 | | | $ | 49.28 | |
| | | | |
| | Total Return(c) | | | (3.00 | )% | | | 8.40 | % | | | 0.39 | % |
| | | | |
| | Net assets, end of period (in 000’s) | | $ | 210,355 | | | $ | 225,899 | | | $ | 203,525 | |
| | | | |
| | Ratio of net expenses to average net assets | | | 0.55 | %(d) | | | 0.54 | % | | | 0.54 | %(d) |
| | | | |
| | Ratio of total expenses to average net assets | | | 0.61 | %(d) | | | 0.62 | % | | | 0.62 | %(d) |
| | | | |
| | Ratio of net investment income to average net assets | | | 1.18 | %(d) | | | 1.33 | % | | | 0.93 | %(d) |
| | | | |
| | Portfolio turnover rate(e) | | | 105 | % | | | 199 | % | | | 168 | % |
| | (a) | | Commenced operations on April 16, 2018. |
| | (b) | | Calculated based on the average shares outstanding methodology. |
| | (c) | | Assumes investment at the NAV at the beginning of the period, reinvestment of all dividends and distributions, a complete redemption of the investment at the NAV at the end of the period and no sales or redemption charges (if any). Total returns would be reduced if a sales or redemption charge was taken into account. Returns do not reflect the impact of taxes to shareholders relating to Fund distributions or the redemption of Fund shares. Total returns for periods less than one full year are not annualized. |
| | (e) | | The Fund’s portfolio turnover rate is calculated in accordance with regulatory requirements, without regard to transactions involving short term investments and certain derivatives. If such transactions were included, the Fund’s portfolio turnover rate may be higher. |
| | |
| The accompanying notes are an integral part of these financial statements. | | 95 |
GOLDMAN SACHS U.S. EQUITY INSIGHTS FUND
Financial Highlights(continued)
Selected Share Data for a Share Outstanding Throughout Each Period
| | | | | | | | | | | | | | | | | | | | | | | | | | |
| | | | | Goldman Sachs U.S. Equity Insights Fund | |
| | | | | Class R Shares | |
| | | | | Six Months Ended
April 30, 2020
(Unaudited) | | | Year Ended October 31, | |
| | | | | 2019 | | | 2018 | | | 2017 | | | 2016 | | | 2015 | |
| | Per Share Data | |
| | | | | | | |
| | Net asset value, beginning of period | | $ | 48.47 | | | $ | 46.74 | | | $ | 48.89 | | | $ | 40.12 | | | $ | 40.91 | | | $ | 39.80 | |
| | | | | | | |
| | Net investment income(a) | | | 0.13 | | | | 0.32 | | | | 0.23 | | | | 0.37 | | | | 0.27 | | | | 0.26 | |
| | | | | | | |
| | Net realized and unrealized gain (loss) | | | (1.69 | ) | | | 3.08 | | | | 2.42 | | | | 10.01 | | | | 0.49 | | | | 1.18 | |
| | | | | | | |
| | Total from investment operations | | | (1.56 | ) | | | 3.40 | | | | 2.65 | | | | 10.38 | | | | 0.76 | | | | 1.44 | |
| | | | | | | |
| | Distributions to shareholders from net investment income | | | (0.57 | ) | | | (0.02 | ) | | | (0.42 | ) | | | (0.23 | ) | | | (0.36 | ) | | | (0.33 | ) |
| | | | | | | |
| | Distributions to shareholders from net realized gains | | | — | | | | (1.65 | ) | | | (4.38 | ) | | | (1.38 | ) | | | (1.19 | ) | | | — | |
| | | | | | | |
| | Total distributions | | | (0.57 | ) | | | (1.67 | ) | | | (4.80 | ) | | | (1.61 | ) | | | (1.55 | ) | | | (0.33 | ) |
| | | | | | | |
| | Net asset value, end of period | | $ | 46.34 | | | $ | 48.47 | | | $ | 46.74 | | | $ | 48.89 | | | $ | 40.12 | | | $ | 40.91 | |
| | | | | | | |
| | Total Return(b) | | | (3.30 | )% | | | 7.72 | % | | | 5.65 | % | | | 26.58 | % | | | 1.99 | % | | | 3.58 | % |
| | | | | | | |
| | Net assets, end of period (in 000’s) | | $ | 37,859 | | | $ | 44,555 | | | $ | 49,993 | | | $ | 51,263 | | | $ | 30,341 | | | $ | 27,685 | |
| | | | | | | |
| | Ratio of net expenses to average net assets | | | 1.19 | %(c) | | | 1.19 | % | | | 1.20 | % | | | 1.21 | % | | | 1.21 | % | | | 1.21 | % |
| | | | | | | |
| | Ratio of total expenses to average net assets | | | 1.25 | %(c) | | | 1.26 | % | | | 1.25 | % | | | 1.39 | % | | | 1.43 | % | | | 1.42 | % |
| | | | | | | |
| | Ratio of net investment income to average net assets | | | 0.56 | %(c) | | | 0.69 | % | | | 0.48 | % | | | 0.84 | % | | | 0.70 | % | | | 0.64 | % |
| | | | | | | |
| | Portfolio turnover rate(d) | | | 105 | % | | | 199 | % | | | 168 | % | | | 193 | % | | | 213 | % | | | 224 | % |
| | (a) | | Calculated based on the average shares outstanding methodology. |
| | (b) | | Assumes investment at the NAV at the beginning of the period, reinvestment of all dividends and distributions, a complete redemption of the investment at the NAV at the end of the period and no sales or redemption charges (if any). Total returns would be reduced if a sales or redemption charge was taken into account. Returns do not reflect the impact of taxes to shareholders relating to Fund distributions or the redemption of Fund shares. Total returns for periods less than one full year are not annualized. |
| | (d) | | The Fund’s portfolio turnover rate is calculated in accordance with regulatory requirements, without regard to transactions involving short term investments and certain derivatives. If such transactions were included, the Fund’s portfolio turnover rate may be higher. |
| | |
| 96 | | The accompanying notes are an integral part of these financial statements. |
GOLDMAN SACHS U.S. EQUITY INSIGHTS FUND
Financial Highlights(continued)
Selected Share Data for a Share Outstanding Throughout Each Period
| | | | | | | | | | | | | | | | | | | | | | | | | | |
| | | | | Goldman Sachs U.S. Equity Insights Fund | |
| | | | | Class R6 Shares | |
| | | | | Six Months Ended
April 30, 2020
(Unaudited) | | | Year Ended October 31, | | | Period Ended
October 31, 2015(a) | |
| | | | | 2019 | | | 2018 | | | 2017 | | | 2016 | |
| | Per Share Data | |
| | | | | | | |
| | Net asset value, beginning of period | | $ | 51.13 | | | $ | 49.27 | | | $ | 51.19 | | | $ | 41.91 | | | $ | 42.60 | | | $ | 43.19 | |
| | | | | | | |
| | Net investment income(b) | | | 0.30 | | | | 0.76 | | | | 0.42 | | | | 0.82 | | | | 0.56 | | | | 0.14 | |
| | | | | | | |
| | Net realized and unrealized gain (loss) | | | (1.76 | ) | | | 3.10 | | | | 2.68 | | | | 10.33 | | | | 0.50 | | | | (0.73 | ) |
| | | | | | | |
| | Total from investment operations | | | (1.46 | ) | | | 3.86 | | | | 3.10 | | | | 11.15 | | | | 1.06 | | | | (0.59 | ) |
| | | | | | | |
| | Distributions to shareholders from net investment income | | | (0.90 | ) | | | (0.35 | ) | | | (0.64 | ) | | | (0.49 | ) | | | (0.56 | ) | | | — | |
| | | | | | | |
| | Distributions to shareholders from net realized gains | | | — | | | | (1.65 | ) | | | (4.38 | ) | | | (1.38 | ) | | | (1.19 | ) | | | — | |
| | | | | | | |
| | Total distributions | | | (0.90 | ) | | | (2.00 | ) | | | (5.02 | ) | | | (1.87 | ) | | | (1.75 | ) | | | — | |
| | | | | | | |
| | Net asset value, end of period | | $ | 48.77 | | | $ | 51.13 | | | $ | 49.27 | | | $ | 51.19 | | | $ | 41.91 | | | $ | 42.60 | |
| | | | | | | |
| | Total Return(c) | | | (3.01 | )% | | | 8.38 | % | | | 6.37 | % | | | 27.41 | % | | | 2.66 | % | | | (1.37 | )% |
| | | | | | | |
| | Net assets, end of period (in 000’s) | | $ | 6,689 | | | $ | 12,068 | | | $ | 31,916 | | | $ | 2,557 | | | $ | 60 | | | $ | 10 | |
| | | | | | | |
| | Ratio of net expenses to average net assets | | | 0.55 | %(d) | | | 0.54 | % | | | 0.54 | % | | | 0.55 | % | | | 0.55 | % | | | 0.55 | %(d) |
| | | | | | | |
| | Ratio of total expenses to average net assets | | | 0.61 | %(d) | | | 0.59 | % | | | 0.63 | % | | | 0.71 | % | | | 0.77 | % | | | 0.74 | %(d) |
| | | | | | | |
| | Ratio of net investment income to average net assets | | | 1.19 | %(d) | | | 1.49 | % | | | 0.82 | % | | | 1.70 | % | | | 1.36 | % | | | 1.37 | %(d) |
| | | | | | | |
| | Portfolio turnover rate(e) | | | 105 | % | | | 199 | % | | | 168 | % | | | 193 | % | | | 213 | % | | | 224 | % |
| | (a) | | Commenced operations on July 31, 2015. |
| | (b) | | Calculated based on the average shares outstanding methodology. |
| | (c) | | Assumes investment at the NAV at the beginning of the period, reinvestment of all dividends and distributions, a complete redemption of the investment at the NAV at the end of the period and no sales or redemption charges (if any). Total returns would be reduced if a sales or redemption charge was taken into account. Returns do not reflect the impact of taxes to shareholders relating to Fund distributions or the redemption of Fund shares. Total returns for periods less than one full year are not annualized. |
| | (e) | | The Fund’s portfolio turnover rate is calculated in accordance with regulatory requirements, without regard to transactions involving short term investments and certain derivatives. If such transactions were included, the Fund’s portfolio turnover rate may be higher. |
| | |
| The accompanying notes are an integral part of these financial statements. | | 97 |
GOLDMAN SACHS DOMESTIC EQUITY INSIGHTS FUNDS
Notes to Financial Statements
April 30, 2020 (Unaudited)
Goldman Sachs Trust (the “Trust”) is a Delaware statutory trust registered under the Investment Company Act of 1940, as amended (the “Act”), as anopen-end management investment company. The following table lists those series of the Trust that are included in this report (collectively, the “Funds” or individually a “Fund”), along with their corresponding share classes and respective diversification status under the Act:
| | | | |
| Fund | | Share Classes Offered | | Diversified/
Non-diversified |
Large Cap Growth Insights | | A, C, Institutional, Service, Investor, P, R and R6 | | Non-diversified |
Large Cap Value Insights, Small Cap Equity Insights and U.S. Equity Insights | | A, C, Institutional, Service, Investor, P, R and R6 | | Diversified |
Small Cap Growth Insights and Small Cap Value Insights | | A, C, Institutional, Investor, P, R and R6 | | Diversified |
Class A Shares are sold with afront-end sales charge of up to 5.50%. Class C Shares are sold with a contingent deferred sales charge (“CDSC”) of 1.00%, which is imposed on redemptions made within 12 months of purchase. Institutional, Service, Investor, Class P, Class R and Class R6 Shares are not subject to a sales charge.
Goldman Sachs Asset Management, L.P. (“GSAM”), an affiliate of Goldman Sachs & Co. LLC (“Goldman Sachs”), serves as investment adviser to the Funds pursuant to a management agreement (the “Agreement”) with the Trust.
|
| 2. SIGNIFICANT ACCOUNTING POLICIES |
The financial statements have been prepared in accordance with accounting principles generally accepted in the United States of America (“GAAP”) and require management to make estimates and assumptions that may affect the reported amounts and disclosures. Actual results may differ from those estimates and assumptions. Each Fund is an investment company under GAAP and follows the accounting and reporting guidance applicable to investment companies.
A. Investment Valuation — The Funds’ valuation policy is to value investments at fair value.
B. Investment Income and Investments — Investment income includes interest income, dividend income, and securities lending income, if any. Interest income is accrued daily and adjusted for amortization of premiums and accretion of discounts. Dividend income is recognized onex-dividend date or, for certain foreign securities, as soon as such information is obtained subsequent to theex-dividend date.Non-cash dividends, if any, are recorded at the fair market value of the securities received. Investment transactions are reflected on trade date. Realized gains and losses are calculated using identified cost. Investment transactions are recorded on the following business day for daily net asset value (“NAV”) calculations. Investment income is recorded net of any foreign withholding taxes, less any amounts reclaimable. The Funds may file withholding tax reclaims in certain jurisdictions to recover a portion of amounts previously withheld. Any foreign capital gains tax is accrued daily based upon net unrealized gains, and is payable upon sale of such investments. Distributions received from the Funds’ investments in U.S. real estate investment trusts (“REITs”) may be characterized as ordinary income, net capital gain and/or a return of capital. A return of capital is recorded by the Funds as a reduction to the cost basis of the REIT.
For derivative contracts, realized gains and losses are recorded upon settlement of the contract.
C. Class Allocations and Expenses—Investment income, realized and unrealized gain (loss), if any, andnon-class specific expenses of each Fund are allocated daily based upon the proportion of net assets of each class.Non-class specific expenses directly incurred by a Fund are charged to that Fund, while such expenses incurred by the Trust are allocated across the applicable Funds on a straight-line and/orpro-rata basis depending upon the nature of the expenses. Class specific expenses, where applicable, are borne by the respective share classes and include Distribution and Service, Transfer Agency and Service and Shareholder Administration fees.
98
GOLDMAN SACHS DOMESTIC EQUITY INSIGHTS FUNDS
|
| 2. SIGNIFICANT ACCOUNTING POLICIES (continued) |
D. Federal Taxes and Distributions to Shareholders—It is each Fund’s policy to comply with the requirements of the Internal Revenue Code of 1986, as amended (the “Code”), applicable to regulated investment companies and to distribute each year substantially all of its investment company taxable income and capital gains to its shareholders. Accordingly, each Fund is not required to make any provisions for the payment of federal income tax. Distributions to shareholders are recorded on theex-dividend date. Income and capital gains distributions, if any, are declared and paid according to the following schedule:
| | | | | | |
| Fund | | | | Income Distributions
Declared/Paid | | Capital Gains Distributions
Declared/Pain |
Large Cap Value Insights | | | | Quarterly | | Annually |
Large Cap Growth Insights, Small Cap Equity Insights, Small Cap Growth Insights, Small Cap Value Insights and U.S. Equity Insights | | | | Annually | | Annually |
Net capital losses, if any, are carried forward to future fiscal years and may be used to the extent allowed by the Code to offset any future capital gains. Losses that are carried forward will retain their character as either short-term or long-term capital losses. Utilization of capital loss carryforwards will reduce the requirement of future capital gains distributions.
The characterization of distributions to shareholders for financial reporting purposes is determined in accordance with federal income tax rules, which may differ from GAAP. The source of each Fund’s distributions may be shown in the accompanying financial statements as either from distributable earnings or capital. Certain components of the Funds’ net assets on the Statements of Assets and Liabilities reflect permanent GAAP/tax differences based on the appropriate tax character.
| | |
| 3. INVESTMENTS AND FAIR VALUE MEASUREMENTS | | |
U.S. GAAP defines the fair value of a financial instrument as the amount that would be received to sell an asset or paid to transfer a liability in an orderly transaction between market participants at the measurement date (i.e., the exit price); the Funds’ policy is to use the market approach. GAAP establishes a fair value hierarchy that prioritizes the inputs to valuation techniques used to measure fair value. The hierarchy gives the highest priority to unadjusted quoted prices in active markets for identical assets or liabilities (Level 1 measurements) and the lowest priority to unobservable inputs (Level 3 measurements). The levels used for classifying investments are not necessarily an indication of the risk associated with investing in these investments. The three levels of the fair value hierarchy are described below:
Level 1 — Unadjusted quoted prices in active markets that are accessible at the measurement date for identical, unrestricted assets or liabilities;
Level 2 — Quoted prices in markets that are not active or financial instruments for which significant inputs are observable (including, but not limited to, quoted prices for similar investments, interest rates, foreign exchange rates, volatility and credit spreads), either directly or indirectly;
Level 3 — Prices or valuations that require significant unobservable inputs (including GSAM’s assumptions in determining fair value measurement).
The Board of Trustees (“Trustees”) has approved Valuation Procedures that govern the valuation of the portfolio investments held by the Funds, including investments for which market quotations are not readily available. The Trustees have delegated to GSAMday-to-day responsibility for implementing and maintaining internal controls and procedures related to the valuation of the Funds’ investments. To assess the continuing appropriateness of pricing sources and methodologies, GSAM regularly performs price verification procedures and issues challenges as necessary to third party pricing vendors or brokers, and any differences are reviewed in accordance with the Valuation Procedures.
99
GOLDMAN SACHS DOMESTIC EQUITY INSIGHTS FUNDS
Notes to Financial Statements(continued)
April 30, 2020 (Unaudited)
|
| 3. INVESTMENTS AND FAIR VALUE MEASUREMENTS (continued) |
A. Level 1 and Level 2 Fair Value Investments — The valuation techniques and significant inputs used in determining the fair values for investments classified as Level 1 and Level 2 are as follows:
Equity Securities — Equity securities traded on a United States (“U.S.”) securities exchange or the NASDAQ system, or those located on certain foreign exchanges, including but not limited to the Americas, are valued daily at their last sale price or official closing price on the principal exchange or system on which they are traded. If there is no sale or official closing price or such price is believed by GSAM to not represent fair value, equity securities may be valued at the closing bid price for long positions and at the closing ask price for short positions. To the extent these investments are actively traded, they are classified as Level 1 of the fair value hierarchy, otherwise they are generally classified as Level 2. Certain equity securities containing unique attributes may be classified as Level 2.
Unlisted equity securities for which market quotations are available are valued at the last sale price on the valuation date, or if no sale occurs, at the last bid price for long positions or the last ask price for short positions, and are generally classified as Level 2. Securities traded on certain foreign securities exchanges are valued daily at fair value determined by an independent fair value service (if available) under Valuation Procedures approved by the Trustees and consistent with applicable regulatory guidance. The independent fair value service takes into account multiple factors including, but not limited to, movements in the securities markets, certain depositary receipts, futures contracts and foreign currency exchange rates that have occurred subsequent to the close of the foreign securities exchange. These investments are generally classified as Level 2 of the fair value hierarchy.
Money Market Funds — Investments in the Goldman Sachs Financial Square Government Fund (“Underlying Fund”) are valued at the NAV per share of the Institutional Share class on the day of valuation. These investments are generally classified as Level 1 of the fair value hierarchy. For information regarding the Underlying Fund’s accounting policies and investment holdings, please see the Underlying Fund’s shareholder report.
Derivative Contracts — A derivative is an instrument whose value is derived from underlying assets, indices, reference rates or a combination of these factors. A Fund enters into derivative transactions to hedge against changes in interest rates, securities prices, and/or currency exchange rates, to increase total return, or to gain access to certain markets or attain exposure to other underliers. For financial reporting purposes, cash collateral that has been pledged to cover obligations of a Fund and cash collateral received, if any, is reported separately on the Statements of Assets and Liabilities as receivables/payables for collateral on certain derivatives contracts.Non-cash collateral pledged by a Fund, if any, is noted in the Schedules of Investments.
Exchange-traded derivatives, including futures and options contracts, are generally valued at the last sale or settlement price on the exchange where they are principally traded. Exchange-traded options without settlement prices are generally valued at the midpoint of the bid and ask prices on the exchange where they are principally traded (or, in the absence oftwo-way trading, at the last bid price for long positions and the last ask price for short positions). Exchange-traded derivatives typically fall within Level 1 of the fair value hierarchy.Over-the-counter (“OTC”) and centrally cleared derivatives are valued using market transactions and other market evidence, including market-based inputs to models, calibration to market-clearing transactions, broker or dealer quotations, or other alternative pricing sources. Where models are used, the selection of a particular model to value OTC and centrally cleared derivatives depends upon the contractual terms of, and specific risks inherent in, the instrument, as well as the availability of pricing information in the market. Valuation models require a variety of inputs, including contractual terms, market prices, yield curves, credit curves, measures of volatility, voluntary and involuntary prepayment rates, loss severity rates and correlations of such inputs. For OTC and centrally cleared derivatives that trade in liquid markets, model inputs can generally be verified and model selection does not involve significant management judgment. OTC and centrally cleared derivatives are classified within Level 2 of the fair value hierarchy when significant inputs are corroborated by market evidence.
i. Futures Contracts — Futures contracts are contracts to buy or sell a standardized quantity of a specified commodity or security. Upon entering into a futures contract, a Fund deposits cash or securities in an account on behalf of the broker in an amount sufficient to meet the initial margin requirement. Subsequent payments are made or received by a Fund equal to the daily change in the contract value and are recorded as variation margin receivable or payable with a corresponding offset to unrealized gains or losses.
100
GOLDMAN SACHS DOMESTIC EQUITY INSIGHTS FUNDS
|
| 3. INVESTMENTS AND FAIR VALUE MEASUREMENTS (continued) |
B. Level 3 Fair Value Investments — To the extent that significant inputs to valuation models and other alternative pricing sources are unobservable, or if quotations are not readily available, or if GSAM believes that such quotations do not accurately reflect fair value, the fair value of a Fund’s investments may be determined under Valuation Procedures approved by the Trustees. GSAM, consistent with its procedures and applicable regulatory guidance, may make an adjustment to the most recent valuation prices of either domestic or foreign securities in light of significant events to reflect what it believes to be the fair value of the securities at the time of determining a Fund’s NAV. To the extent investments are valued using single source broker quotations obtained directly from the broker or passed through from third party pricing vendors, such investments are classified as Level 3 investments.
C. Fair Value Hierarchy — The following is a summary of the Funds’ investments and derivatives classified in the fair value hierarchy as of April 30, 2020:
| | | | | | | | | | | | |
| |
| LARGE CAP GROWTH INSIGHTS | | | | |
| | | |
| Investment Type | | Level 1 | | | Level 2 | | | Level 3 | |
| | | |
| Assets | | | | | | | | | | | | |
| | | |
Common Stock and/or Other Equity Investments(a) | | | | | | | | | | | | |
| | | |
Asia | | $ | 2,721,320 | | | $ | — | | | $ | — | |
| | | |
Europe | | | 5,797,367 | | | | — | | | | — | |
| | | |
North America | | | 1,650,155,970 | | | | — | | | | — | |
| | | |
Securities Lending Reinvestment Vehicle | | | 424,340 | | | | — | | | | — | |
| | | |
| Total | | $ | 1,659,098,997 | | | $ | — | | | $ | — | |
| | | |
| LARGE CAP VALUE INSIGHTS | | | | | | | | | | | | |
| | | |
| Investment Type | | Level 1 | | | Level 2 | | | Level 3 | |
| | | |
| Assets | | | | | | | | | | | | |
| | | |
Common Stock and/or Other Equity Investments(a) | | | | | | | | | | | | |
| | | |
Europe | | $ | 3,862,737 | | | $ | — | | | $ | — | |
| | | |
North America | | | 339,653,009 | | | | — | | | | — | |
| | | |
South America | | | 86,874 | | | | — | | | | — | |
| | | |
Securities Lending Reinvestment Vehicle | | | 119,900 | | | | — | | | | — | |
| | | |
| Total | | $ | 343,722,520 | | | $ | — | | | $ | — | |
| | | |
| SMALL CAP EQUITY INSIGHTS | | | | | | | | | | | | |
| | | |
| Investment Type | | Level 1 | | | Level 2 | | | Level 3 | |
| | | |
| Assets | | | | | | | | | | | | |
| | | |
Common Stock and/or Other Equity Investments(a) | | | | | | | | | | | | |
| | | |
Asia | | $ | 396,831 | | | $ | — | | | $ | — | |
| | | |
Europe | | | 4,374,713 | | | | — | | | | — | |
| | | |
North America | | | 547,303,533 | | | | — | | | | — | |
| | | |
South America | | | 2,113,378 | | | | — | | | | — | |
| | | |
Securities Lending Reinvestment Vehicle | | | 4,716,670 | | | | — | | | | — | |
| | | |
| Total | | $ | 558,905,125 | | | $ | — | | | $ | — | |
| (a) | | Amounts are disclosed by continent to highlight the impact of time zone differences between local market close and the calculation of net asset value. Security valuations are based on the principal exchange or system on which they are traded, which may differ from country of domicile. |
| (b) | | Amount shown represents unrealized gain (loss) at period end. |
101
GOLDMAN SACHS DOMESTIC EQUITY INSIGHTS FUNDS
Notes to Financial Statements(continued)
April 30, 2020 (Unaudited)
|
| 3. INVESTMENTS AND FAIR VALUE MEASUREMENTS (continued) |
| | | | | | | | | | | | |
| | | |
| SMALL CAP EQUITY INSIGHTS (continued) | | | | | | | | | | | | |
| | | |
| Derivative Type | | Level 1 | | | Level 2 | | | Level 3 | |
| | | |
| Liabilities(b) | | | | | | | | | | | | |
| | | |
Futures Contracts | | $ | 81,677 | | | $ | — | | | $ | — | |
| | | |
| SMALL CAP GROWTH INSIGHTS | | | | | | | | | | | | |
| | | |
| Investment Type | | Level 1 | | | Level 2 | | | Level 3 | |
| | | |
| Assets | | | | | | | | | | | | |
| | | |
Common Stock and/or Other Equity Investments(a) | | | | | | | | | | | | |
| | | |
Asia | | $ | 2,260,569 | | | $ | — | | | $ | — | |
| | | |
Europe | | | 4,494,015 | | | | — | | | | — | |
| | | |
North America | | | 953,373,247 | | | | — | | | | — | |
| | | |
North America | | | 1,654,413 | | | | — | | | | — | |
| | | |
Securities Lending Reinvestment Vehicle | | | 7,572,066 | | | | — | | | | — | |
| | | |
| Total | | $ | 969,354,310 | | | $ | — | | | $ | | |
| | | |
| Derivative Type | | | | | | | | | |
| | | |
| Liabilities(b) | | | | | | | | | | | | |
| | | |
Futures Contracts | | $ | 874,071 | | | $ | — | | | $ | — | |
| | | |
| SMALL CAP VALUE INSIGHTS | | | | | | | | | | | | |
| | | |
| Investment Type | | Level 1 | | | Level 2 | | | Level 3 | |
| | | |
| Assets | | | | | | | | | | | | |
| | | |
Common Stock and/or Other Equity Investments(a) | | | | | | | | | | | | |
| | | |
Asia | | $ | 614,323 | | | $ | — | | | $ | — | |
| | | |
Europe | | | 6,489,167 | | | | — | | | | — | |
| | | |
North America | | | 627,769,537 | | | | — | | | | — | |
| | | |
South America | | | 4,573,521 | | | | — | | | | — | |
| | | |
Investment Company | | | 7,789,206 | | | | — | | | | — | |
| | | |
Securities Lending Reinvestment Vehicle | | | 13,122,270 | | | | — | | | | — | |
| | | |
| Total | | $ | 660,358,024 | | | $ | — | | | $ | — | |
| | | |
| Derivative Type | | | | | | | | | |
| | | |
| Liabilities(b) | | | | | | | | | | | | |
| | | |
Futures Contracts | | $ | 1,114,187 | | | $ | ��� | | | $ | — | |
| (a) | | Amounts are disclosed by continent to highlight the impact of time zone differences between local market close and the calculation of net asset value. Security valuations are based on the principal exchange or system on which they are traded, which may differ from country of domicile. |
| (b) | | Amount shown represents unrealized gain (loss) at period end. |
102
GOLDMAN SACHS DOMESTIC EQUITY INSIGHTS FUNDS
|
| 3. INVESTMENTS AND FAIR VALUE MEASUREMENTS (continued) |
| | | | | | | | | | | | |
| |
| U.S. EQUITY INSIGHTS | | | | |
| | | |
| Investment Type | | Level 1 | | | Level 2 | | | Level 3 | |
| | | |
| Assets | | | | | | | | | | | | |
| | | |
Common Stock and/or Other Equity Investments(a) | | | | | | | | | | | | |
| | | |
Asia | | $ | 150,759 | | | $ | — | | | $ | — | |
| | | |
Europe | | | 9,841,498 | | | | | | | | | |
| | | |
North America | | | 845,163,996 | | | | — | | | | — | |
| | | |
South America | | | 204,664 | | | | — | | | | — | |
| | | |
| Total | | $ | 855,360,917 | | | $ | — | | | $ | — | |
| (a) | | Amounts are disclosed by continent to highlight the impact of time zone differences between local market close and the calculation of net asset value. Security valuations are based on the principal exchange or system on which they are traded, which may differ from country of domicile. |
For further information regarding security characteristics, see the Schedules of Investments.
|
| 4. INVESTMENTS IN DERIVATIVES |
The following tables set forth, by certain risk types, the gross value of derivative contracts (not considered to be hedging instruments for accounting disclosure purposes) as of April 30, 2020. These instruments were used as part of the Funds’ investment strategies and to obtain and/or manage exposure related to the risks below. The values in the tables below exclude the effects of cash collateral received or posted pursuant to these derivative contracts, and therefore are not representative of the Funds’ net exposure.
| | | | | | | | | | | | | | | | | | | | |
| Risk | | | | Fund | | | | | Statement of Assets
and Liabilities | | | | | | Assets(a) | |
Equity | | | | Small Cap Equity Insights | | | | | | | Variation Margin on Futures Contracts | | | | | | | $ | 81,677 | |
Equity | | | | Small Cap Growth Insights | | | | | | | Variation Margin on Futures Contracts | | | | | | | | 874,071 | |
Equity | | | | Small Cap Value Insights | | | | | | | Variation Margin on Futures Contracts | | | | | | | | 1,114,187 | |
| (a) | | Includes unrealized gain (loss) on futures contracts described in the Additional Investment Information sections of the Schedules of Investments. Only the variation margin as of April 30, 2020 is reported within the Statements of Assets and Liabilities. |
The following tables set forth, by certain risk types, the Funds’ gains (losses) related to these derivatives and their indicative volumes for the six months ended April 30, 2020. These gains (losses) should be considered in the context that these derivative contracts may have been executed to create investment opportunities and/or economically hedge certain investments, and
103
GOLDMAN SACHS DOMESTIC EQUITY INSIGHTS FUNDS
Notes to Financial Statements(continued)
April 30, 2020 (Unaudited)
|
| 4. INVESTMENTS IN DERIVATIVES (continued) |
accordingly, certain gains (losses) on such derivative contracts may offset certain (losses) gains attributable to investments. These gains (losses) are included in “Net realized gain (loss)” or “Net change in unrealized gain (loss)” on the Statements of Operations:
| | | | | | | | | | | | | | | | | | |
| Risk | | | | | | Fund | | Net Realized
Gain (Loss) from
Futures Contracts | | | Net Change in
Unrealized
Gain (Loss) on
Futures Contracts | | | Average
Number of
Contracts(a) | |
| Equity | | | | | | Large Cap Growth Insights | | $ | (195,658 | ) | | $ | — | | | | 1 | |
| Equity | | | | | | Large Cap Value Insights | | | 309,441 | | | | — | | | | 5 | |
| Equity | | | | | | Small Cap Equity Insights | | | (2,707,251 | ) | | | 222,789 | | | | 103 | |
| Equity | | | | | | Small Cap Growth Insights | | | 3,386,152 | | | | 1,108,929 | | | | 175 | |
| Equity | | | | | | Small Cap Value Insights | | | (3,832,513 | ) | | | 705,986 | | | | 186 | |
| Equity | | | | | | U.S. Equity Insights | | | 255,674 | | | | — | | | | 19 | |
| (a) | | Average number of contracts is based on the month end balances for the six months ended April 30, 2020. |
|
| 5. AGREEMENTS AND AFFILIATED TRANSACTIONS |
A. Management Agreement — Under the Agreement, GSAM manages the Funds, subject to the general supervision of the Trustees.
As compensation for the services rendered pursuant to the Agreement, the assumption of the expenses related thereto and administration of the Funds’ business affairs, including providing facilities, GSAM is entitled to a management fee, accrued daily and paid monthly, equal to an annual percentage rate of each Fund’s average daily net assets.
For the six months ended April 30, 2020, contractual and effective net management fees with GSAM were at the following rates:
| | | | | | | | | | | | | | | | | | | | | | | | | | | | | | |
| | | | | Contractual Management Rate | | | Effective Net
Management
Rate^ | |
| Fund | | | | First
$1 billion | | | Next $1 billion | | | Next $3 billion | | | Next $3 billion | | | Over $8 billion | | | Effective
Rate | |
Large Cap Growth Insights | | | | | 0.52 | % | | | 0.47 | % | | | 0.44 | % | | | 0.44 | % | | | 0.43 | % | | | 0.50 | % | | | 0.50 | % |
Large Cap Value Insights | | | | | 0.52 | | | | 0.47 | | | | 0.44 | | | | 0.44 | | | | 0.43 | | | | 0.52 | | | | 0.52 | |
Small Cap Equity Insights | | | | | 0.80 | | | | 0.80 | | | | 0.72 | | | | 0.68 | | | | 0.67 | | | | 0.80 | | | | 0.80 | |
Small Cap Growth Insights | | | | | 0.80 | | | | 0.80 | | | | 0.72 | | | | 0.68 | | | | 0.67 | | | | 0.80 | | | | 0.80 | |
Small Cap Value Insights | | | | | 0.80 | | | | 0.80 | | | | 0.72 | | | | 0.68 | | | | 0.67 | | | | 0.80 | | | | 0.80 | |
U.S. Equity Insights | | | | | 0.52 | | | | 0.47 | | | | 0.44 | | | | 0.44 | | | | 0.43 | | | | 0.52 | | | | 0.52 | |
| ^ | | Effective Net Management Rate includes the impact of management fee waivers of affiliated underlying funds, if any. |
The Large Cap Growth Insights, Large Cap Value Insights, Small Cap Equity Insights, Small Cap Growth Insights, Small Cap Value Insights and U.S. Equity Insights Funds invest in Institutional Shares of the Government Money Market Fund, which is an affiliated Underlying Fund. GSAM has agreed to waive a portion of its management fee payable by the Funds in an amount equal to the management fee it earns as an investment adviser to the affiliated Underlying Funds in which the Funds invest, except those management fees it earns from the Fund’s investments of cash collateral received in connection with securities lending transactions
104
GOLDMAN SACHS DOMESTIC EQUITY INSIGHTS FUNDS
|
| 5. AGREEMENTS AND AFFILIATED TRANSACTIONS (continued) |
in the Underlying Fund. For the six months ended April 30, 2020, the management fee waived by GSAM for each Fund was as follows:
| | | | | | |
| Fund | | | | Management
Fee Waived | |
Large Cap Growth Insights | | | | $ | 269 | |
Large Cap Value Insights | | | | | 146 | |
Small Cap Equity Insights | | | | | 4,771 | |
Small Cap Growth Insights | | | | | 3,925 | |
Small Cap Value Insights | | | | | 8,399 | |
U.S. Equity Insights | | | | | 663 | |
B. Distribution and/or Service(12b-1) Plans — The Trust, on behalf of Class A and Class R Shares of each applicable Fund, has adopted Distribution and Service Plans subject to Rule12b-1 under the Act. Under the Distribution and Service Plans, Goldman Sachs, which serves as distributor (the “Distributor”), is entitled to a fee accrued daily and paid monthly for distribution services and personal and account maintenance services, which may then be paid by Goldman Sachs to authorized dealers. These fees are equal to an annual percentage rate of the average daily net assets attributable to Class A or Class R Shares of the Funds, as applicable, as set forth below.
The Trust, on behalf of Class C Shares of each applicable Fund, has adopted a Distribution Plan subject to Rule12b-1 under the Act. Under the Distribution Plan, Goldman Sachs as Distributor is entitled to a fee accrued daily and paid monthly for distribution services, which may then be paid by Goldman Sachs to authorized dealers. These fees are equal to an annual percentage rate of the average daily net assets attributable to Class C Shares of the Funds, as set forth below.
The Trust, on behalf of Service Shares of each applicable Fund, has adopted a Service Plan subject to Rule12b-1 under the Act to allow Service Shares to compensate service organizations (including Goldman Sachs) for providing personal and account maintenance services to their customers who are beneficial owners of such shares. The Service Plan provides for compensation to the service organizations equal to an annual percentage rate of the average daily net assets attributable to Service Shares of the Funds as set forth below.
| | | | | | | | | | | | | | | | |
| | | Distribution and/or Service Plan Rates | |
| | | Class A* | | | Class C | | | Class R* | | | Service Shares | |
Distribution and/or Service Plan | | | 0.25 | % | | | 0.75 | % | | | 0.50 | % | | | 0.25 | % |
| * | | With respect to Class A and Class R Shares, the Distributor at its discretion may use compensation for distribution services paid under the Distribution and/or Service Plan to compensate service organizations for personal and account maintenance services and expenses as long as such total compensation does not exceed the maximum cap on “service fees” imposed by the Financial Industry Regulatory Authority. |
105
GOLDMAN SACHS DOMESTIC EQUITY INSIGHTS FUNDS
Notes to Financial Statements(continued)
April 30, 2020 (Unaudited)
|
| 5. AGREEMENTS AND AFFILIATED TRANSACTIONS (continued) |
C. Distribution Agreement — Goldman Sachs, as Distributor of the shares of the Funds pursuant to a Distribution Agreement, may retain a portion of the Class A Shares’ front end sales charge and Class C Shares’ CDSC. For the six months ended April 30, 2020, Goldman Sachs retained the following amounts:
| | | | | | | | | | |
| | | | | Front End
Sales Charge | | | Contingent Deferred
Sales Charge | |
| Fund | | | | Class A | | | Class C | |
Large Cap Growth Insights | | | | $ | 12,257 | | | $ | 72 | |
Large Cap Value Insights | | | | | 2,858 | | | | 268 | |
Small Cap Equity Insights | | | | | 2,562 | | | | 169 | |
Small Cap Growth Insights | | | | | 2,706 | | | | 32 | |
Small Cap Value Insights | | | | | 3,797 | | | | 11 | |
U.S. Equity Insights | | | | | 6,699 | | | | 379 | |
D. Service and/or Shareholder Administration Plans—The Trust, on behalf of each applicable Fund, has adopted Service Plans to allow Class C Shares and Shareholder Administration Plans to allow Service Shares, respectively, to compensate service organizations (including Goldman Sachs) for providing varying levels of personal and account maintenance or shareholder administration services to their customers who are beneficial owners of such shares. The Service and Shareholder Administration Plans each provide for compensation to the service organizations equal to an annual percentage rate of 0.25% of the average daily net assets attributable to Class C and Service Shares of the Funds.
E. Transfer Agency Agreement — Goldman Sachs also serves as the transfer agent of the Funds for a fee pursuant to the Transfer Agency Agreement. The fees charged for such transfer agency services are accrued daily and paid monthly at annual rates as follows: 0.17% of the average daily net assets of Class A, Class C, Investor and Class R Shares; 0.03% of the average daily net assets of Class P and Class R6 Shares; and 0.04% of the average daily net assets of Institutional and Service Shares.
F. Other Expense Agreements and Affiliated Transactions — GSAM has agreed to reduce or limit certain “Other Expenses” of the Funds (excluding acquired fund fees and expenses, transfer agency fees and expenses, service fees and shareholder administration fees (as applicable), taxes, interest, brokerage fees, expenses of shareholder meetings, litigation and indemnification, and extraordinary expenses) to the extent such expenses exceed, on an annual basis, a percentage rate of the average daily net assets of each Fund. Such Other Expense reimbursements, if any, are accrued daily and paid monthly. In addition, the Funds are not obligated to reimburse GSAM for prior fiscal year expense reimbursements, if any. The Other Expense limitations as an annual percentage rate of average daily net assets are 0.004%. These Other Expense limitations will remain in place through at least February 28, 2021, and prior to such date GSAM may not terminate the arrangements without the approval of the Trustees. In addition, the Funds have entered into certain offset arrangements with the transfer agent, which may result in a reduction of the Funds’ expenses and are received irrespective of the application of the “Other Expense” limitations described above.
106
GOLDMAN SACHS DOMESTIC EQUITY INSIGHTS FUNDS
|
| 5. AGREEMENTS AND AFFILIATED TRANSACTIONS (continued) |
For the six months ended April 30, 2020, these expense reductions, including any fee waivers and Other Expense reimbursements, were as follows:
| | | | | | | | | | | | | | |
| Fund | | | | Management
Fee Waiver | | | Other
Expense
Reimbursements | | | Total
Expense
Reductions | |
Large Cap Growth Insights | | | | $ | 269 | | | $ | 293,160 | | | $ | 293,429 | |
Large Cap Value Insights | | | | | 146 | | | | 198,657 | | | | 198,803 | |
Small Cap Equity Insights | | | | | 4,771 | | | | 230,360 | | | | 235,131 | |
Small Cap Growth Insights | | | | | 3,925 | | | | 363,425 | | | | 367,350 | |
Small Cap Value Insights | | | | | 8,399 | | | | 247,042 | | | | 255,441 | |
U.S. Equity Insights | | | | | 663 | | | | 281,055 | | | | 281,718 | |
G. Line of Credit Facility — As of April 30, 2020, the Funds participated in a $700,000,000 committed, unsecured revolving line of credit facility (the “facility”) together with other funds of the Trust and certain registered investment companies having management agreements with GSAM or its affiliates. This facility is to be used for temporary emergency purposes, or to allow for an orderly liquidation of securities to meet redemption requests. The interest rate on borrowings is based on the federal funds rate. The facility also requires a fee to be paid by the Funds based on the amount of the commitment that has not been utilized. For the six months ended April 30, 2020, the Funds did not have any borrowings under the facility. Prior to April 28, 2020, the facility was $580,000,000
H. Other Transactions with Affiliates — As of April 30, 2020, the following Goldman Sachs Dynamic Global Equity Fund and Goldman Sachs Enhanced Dividend Global Equity Portfolio were beneficial owners of 5% or more of total outstanding shares of the following Funds:
| | | | | | | | | | | | | | |
| Fund | | | | | | | Goldman Sachs
Dynamic
Global Equity | | | Goldman Sachs
Enhanced
Dividend
Global Equity | |
Large Cap Value Insights | | | | | | | | | 12 | % | | | — | % |
Small Cap Equity Insights | | | | | | | | | — | | | | 6 | |
The following table provides information about the Funds’ investments in the Underlying Fund as of and for the six months ended April 30, 2020:
| | | | | | | | | | | | | | | | | | | | | | | | |
| Fund | | Market
Value as of
October 31, 2019 | | | Purchased
at Cost | | | Proceeds
from Sales | | | Market
Value as of
April 30, 2020 | | | Shares as of
April 30, 2020 | | | Dividend
Income from
Affiliated
Investment
Companies | |
Large Cap Growth Insights | | $ | — | | | $ | 61,417,899 | | | $ | (61,417,899) | | | $ | — | | | | — | | | $ | 763 | |
Large Cap Value Insights | | | — | | | | 3,435,987 | | | | (3,435,987 | ) | | | — | | | | — | | | | 1,521 | |
Small Cap Equity Insights | | | 7,203,961 | | | | 50,258,015 | | | | (57,461,976 | ) | | | — | | | | — | | | | 41,656 | |
Small Cap Growth Insights | | | 10,845,477 | | | | 53,355,938 | | | | (64,201,415 | ) | | | — | | | | — | | | | 31,915 | |
Small Cap Value Insights | | | 10,633,890 | | | | 160,592,923 | | | | (163,437,607 | ) | | | 7,789,206 | | | | 7,789,206 | | | | 69,867 | |
U.S. Equity Insights | | | — | | | | 32,747,745 | | | | (32,747,745 | ) | | | — | | | | — | | | | 7,969 | |
107
GOLDMAN SACHS DOMESTIC EQUITY INSIGHTS FUNDS
Notes to Financial Statements(continued)
April 30, 2020 (Unaudited)
|
| 6. PORTFOLIO SECURITIES TRANSACTIONS |
The cost of purchases and proceeds from sales and maturities of long-term securities for the six months ended April 30, 2020 were as follows:
| | | | | | | | | | |
| Fund | | | | Purchases | | | Sales and Maturities | |
Large Cap Growth Insights | | | | $ | 1,911,324,972 | | | $ | 2,238,678,426 | |
Large Cap Value Insights | | | | | 382,877,514 | | | | 423,580,824 | |
Small Cap Equity Insights | | | | | 412,113,453 | | | | 399,737,625 | |
Small Cap Growth Insights | | | | | 646,284,777 | | | | 654,099,018 | |
Small Cap Value Insights | | | | | 608,285,594 | | | | 367,292,831 | |
U.S. Equity Insights | | | | | 988,937,019 | | | | 1,106,052,945 | |
Pursuant to exemptive relief granted by the Securities and Exchange Commission (“SEC”) and the terms and conditions contained therein, the Large Cap Growth Insights, Large Cap Value Insights, Small Cap Equity Insights, Small Cap Growth Insights, Small Cap Value Insights and U.S. Equity Insights Funds may lend their securities through a securities lending agent, Goldman Sachs Agency Lending (“GSAL”), a wholly-owned subsidiary of Goldman Sachs, to certain qualified borrowers including Goldman Sachs and affiliates. In accordance with the Funds’ securities lending procedures, the Funds receive cash collateral at least equal to the market value of the securities on loan. The market value of the loaned securities is determined at the close of business of the Funds at their last sale price or official closing price on the principal exchange or system on which they are traded, and any additional required collateral is delivered to the Funds on the next business day. As with other extensions of credit, the Funds may experience delay in the recovery of their securities or incur a loss should the borrower of the securities breach its agreement with the Funds or become insolvent at a time when the collateral is insufficient to cover the cost of repurchasing securities on loan. Dividend income received from securities on loan may not be subject to withholding taxes and therefore withholding taxes paid may differ from the amounts listed in the Statements of Operations. Loans of securities are terminable at any time and as such 1) the remaining contractual maturities of the outstanding securities lending transactions are considered to be overnight and continuous and 2) the borrower, after notice, is required to return borrowed securities within the standard time period for settlement of securities transactions.
The Funds invest the cash collateral received in connection with securities lending transactions in the Goldman Sachs Financial Square Government Fund (“Government Money Market Fund”), an affiliated series of the Goldman Sachs Trust. The Government Money Market Fund is registered under the Act as an open end investment company, is subject to Rule2a-7 under the Act, and is managed by GSAM, for which GSAM may receive a management fee of up to 0.16% on an annualized basis of the average daily net assets of the Government Money Market Fund.
In the event of a default by a borrower with respect to any loan, GSAL will exercise any and all remedies provided under the applicable borrower agreement to make the Funds whole. These remedies include purchasing replacement securities by applying the collateral held from the defaulting broker against the purchase cost of the replacement securities. If GSAL is unable to purchase replacement securities, GSAL will indemnify the Funds by paying the Funds an amount equal to the market value of the securities loaned minus the value of cash collateral received from the borrower for the loan, subject to an exclusion for any shortfalls resulting from a loss of value in such cash collateral due to reinvestment risk. The Funds’ master netting agreements with certain borrowers provide the right, in the event of a default (including bankruptcy or insolvency), for thenon-defaulting party to liquidate the collateral and calculate net exposure to the defaulting party or request additional collateral. However, in the event of a default by a
108
GOLDMAN SACHS DOMESTIC EQUITY INSIGHTS FUNDS
|
| 7. SECURITIES LENDING (continued) |
borrower, a resolution authority could determine that such rights are not enforceable due to the restrictions or prohibitions against the right ofset-off that may be imposed in accordance with a particular jurisdiction’s bankruptcy or insolvency laws. The Funds’ loaned securities were all subject to enforceable Securities Lending Agreements and the value of the collateral was at least equal to the value of the cash received. The amounts of the Funds’ overnight and continuous agreements, which represent the gross amounts of recognized liabilities for securities lending transactions outstanding as of April 30, 2020, are disclosed as “Payable upon return of securities loaned” on the Statements of Assets and Liabilities, where applicable. The U.S. Equity Insights Fund did not have securities on loan as of April 30, 2020.
Both the Funds and GSAL received compensation relating to the lending of the Funds’ securities. The amounts earned by the Funds for the six months ended April 30, 2020, are reported under Investment Income on the Statements of Operations.
The table below details securities lending activity with affiliates of Goldman Sachs:
| | | | | | | | | | | | | | |
| | | | | For the Six Months Ended April 30, 2020 | | | Amounts Payable to
Goldman Sachs
Upon Return of
Securities Loaned as of
April 30, 2020 | |
| Fund | | | | Earnings of GSAL
Relating to
Securities
Loaned | | | Amounts Received
by the Funds
from Lending to
Goldman Sachs | |
Large Cap Growth Insights | | | | $ | 6,740 | | | $ | 11,795 | | | $ | — | |
Large Cap Value Insights | | | | | 152 | | | | — | | | | — | |
Small Cap Equity Insights | | | | | 4,685 | | | | 1,823 | | | | 500,575 | |
Small Cap Growth Insights | | | | | 6,460 | | | | 1,728 | | | | 237,925 | |
Small Cap Value Insights | | | | | 3,620 | | | | 1,983 | | | | 1,055,600 | |
U.S. Equity Insights | | | | | 512 | | | | — | | | | — | |
The following table provides information about the Funds’ investments in the Government Money Market Fund for the six months ended April 30, 2020.
| | | | | | | | | | | | | | | | | | |
| Fund | | | | Beginning
Value as of
October 31, 2019 | | | Purchases
at Cost | | | Proceeds
from Sales | | | Ending
value as of
April 30, 2020 | |
Large Cap Growth Insights | | | | $ | — | | | $ | 45,383,988 | | | $ | (44,959,648 | ) | | $ | 424,340 | |
Large Cap Value Insights | | | | | — | | | | 7,157,209 | | | | (7,037,309 | ) | | | 119,900 | |
Small Cap Equity Insights | | | | | 1,732,225 | | | | 18,231,923 | | | | (15,247,478 | ) | | | 4,716,670 | |
Small Cap Growth Insights | | | | | — | | | | 45,279,943 | | | | (37,707,877 | ) | | | 7,572,066 | |
Small Cap Value Insights | | | | | 2,300,481 | | | | 22,956,649 | | | | (12,134,860 | ) | | | 13,122,270 | |
U.S. Equity Insights | | | | | — | | | | 23,080,625 | | | | (23,080,625 | ) | | | — | |
109
GOLDMAN SACHS DOMESTIC EQUITY INSIGHTS FUNDS
Notes to Financial Statements(continued)
April 30, 2020 (Unaudited)
| | | | | | | | | | | | | | | | | | | | | | | | |
As of the Funds’ most recent fiscal year end, October 31, 2019, the Funds’ timing differences on a tax basis were as follows: | |
| | | Large Cap
Growth
Insights | | | Large Cap
Value
Insights | | | Small Cap
Equity
Insights | | | Small Cap
Growth
Insights | | | Small Cap
Value
Insights | | | U.S.
Equity
Insights | |
Capital loss carryforwards:
Perpetual Short-Term | | $ | — | | | $ | (4,163,332 | ) | | $ | (7,643,446 | ) | | $ | — | | | $ | (2,035,337 | ) | | $ | (8,201,432 | ) |
Timing differences (Qualified Late Year Loss Deferral) | | $ | — | | | $ | — | | | $ | — | | | $ | (801,682 | ) | | $ | — | | | $ | — | |
As of April 30, 2020, the Funds’ aggregate security unrealized gains and losses based on cost for U.S. federal income tax purposes were as follows:
| | | | | | | | | | | | | | | | | | | | | | | | |
| | | Large Cap
Growth
Insights | | | Large Cap
Value
Insights | | | Small Cap
Equity
Insights | | | Small Cap
Growth
Insights | | | Small Cap
Value
Insights | | | U.S.
Equity
Insights | |
Tax Cost | | $ | 1,219,530,457 | | | $ | 361,916,320 | | | $ | 631,996,704 | | | $ | 1,018,290,731 | | | $ | 740,919,003 | | | $ | 730,145,608 | |
Gross unrealized gain | | | 479,949,200 | | | | 21,728,916 | | | | 39,797,208 | | | | 101,854,408 | | | | 36,075,614 | | | | 166,020,291 | |
Gross unrealized loss | | | (40,380,660 | ) | | | (39,922,716 | ) | | | (112,888,787 | ) | | | (150,790,829 | ) | | | (116,636,593 | ) | | | (40,804,982 | ) |
Net unrealized gain (loss) | | $ | 439,568,540 | | | $ | (18,193,800 | ) | | $ | (73,091,579 | ) | | $ | (48,936,421 | ) | | $ | (80,560,979 | ) | | $ | 125,215,309 | |
The difference between GAAP-basis and tax basis unrealized gains (losses) is attributable primarily to wash sales, net mark to market gains (losses) on regulated futures contracts, and differences in the tax treatment of underlying fund investments.
GSAM has reviewed the Funds’ tax positions for all open tax years (the current and prior three years, as applicable) and has concluded that no provision for income tax is required in the Funds’ financial statements. Such open tax years remain subject to examination and adjustment by tax authorities.
The Funds’ risks include, but are not limited to, the following:
Derivatives Risk — The Funds’ use of derivatives may result in loss. Derivative instruments, which may pose risks in addition to and greater than those associated with investing directly in securities, currencies or other instruments, may be illiquid or less liquid, volatile, difficult to price and leveraged so that small changes in the value of the underlying instruments may produce disproportionate losses to the Funds. Derivatives are also subject to counterparty risk, which is the risk that the other party in the transaction will not fulfill its contractual obligation. The use of derivatives is a highly specialized activity that involves investment techniques and risks different from those associated with investments in more traditional securities and instruments. Losses from derivatives can also result from a lack of correlation between changes in the value of derivative instruments and the portfolio assets (if any) being hedged.
Large Shareholder Transactions Risk — A Fund may experience adverse effects when certain large shareholders, such as other funds, institutional investors (including those trading by use ofnon-discretionary mathematical formulas), financial intermediaries (who may make investment decisions on behalf of underlying clients and/or include a Fund in their investment model), individuals, accounts and Goldman Sachs affiliates, purchase or redeem large amounts of shares of a Fund. Such large shareholder redemptions, which may occur rapidly or unexpectedly, may cause a Fund to sell portfolio securities at times when it would not otherwise do so, which may negatively impact a Fund’s NAV and liquidity. These transactions may also accelerate the realization of taxable income to shareholders if such sales of investments resulted in gains, and may also increase transaction costs.
110
GOLDMAN SACHS DOMESTIC EQUITY INSIGHTS FUNDS
|
| 9. OTHER RISKS (continued) |
In addition, a large redemption could result in a Fund’s current expenses being allocated over a smaller asset base, leading to an increase in the Fund’s expense ratio. Similarly, large Fund share purchases may adversely affect a Fund’s performance to the extent that the Fund is delayed in investing new cash or otherwise maintains a larger cash position than it ordinarily would.
Liquidity Risk — A Fund may make investments that are illiquid or that may become less liquid in response to market developments or adverse investor perceptions. Illiquid investments may be more difficult to value. Liquidity risk may also refer to the risk that a Fund will not be able to pay redemption proceeds within the allowable time period or without significant dilution to remaining investors’ interests because of unusual market conditions, an unusually high volume of redemption requests, or other reasons. To meet redemption requests, a Fund may be forced to sell investments at an unfavorable time and/or under unfavorable conditions. If a Fund is forced to sell securities at an unfavorable time and/or under unfavorable conditions, such sales may adversely affect the Fund’s NAV and dilute remaining investors’ interests. Redemptions by large shareholders may have a negative impact on a Fund’s liquidity.
Market and Credit Risks — In the normal course of business, a Fund trades financial instruments and enters into financial transactions where risk of potential loss exists due to changes in the market (market risk). The value of the securities in which a Fund invests may go up or down in response to the prospects of individual companies, particular sectors or governments and/or general economic conditions throughout the world due to increasingly interconnected global economies and financial markets. Events such as war, acts of terrorism, social unrest, natural disasters, the spread of infectious illness or other public health threats could also significantly impact a Fund and its investments.
Additionally, a Fund may also be exposed to credit risk in the event that an issuer or guarantor fails to perform or that an institution or entity with which the Fund has unsettled or open transactions defaults.
Non-Diversification Risk — The Large Cap Growth Insights Fund is non-diversified, meaning that it is permitted to invest a larger percentage of its assets in fewer issuers than diversified mutual funds. Thus, the Fund may be more susceptible to adverse developments affecting any single issuer held in its portfolio, and may be more susceptible to greater losses because of these developments.
Under the Trust’s organizational documents, its Trustees, officers, employees and agents are indemnified, to the extent permitted by the Act and state law, against certain liabilities that may arise out of performance of their duties to the Funds. Additionally, in the course of business, the Funds enter into contracts that contain a variety of indemnification clauses. The Funds’ maximum exposure under these arrangements is unknown, as this would involve future claims that may be made against the Funds that have not yet occurred. However, GSAM believes the risk of loss under these arrangements to be remote.
Subsequent events after the Statements of Assets and Liabilities date have been evaluated, and GSAM has concluded that there is no impact requiring adjustment or disclosure in the financial statements.
111
GOLDMAN SACHS DOMESTIC EQUITY INSIGHTS FUNDS
Notes to Financial Statements(continued)
April 30, 2020 (Unaudited)
|
| 12. SUMMARY OF SHARE TRANSACTIONS |
| | | | | | | | | | | | | | | | |
| | | Large Cap Growth Insights Fund | |
| | | | |
| | | For the Six Months Ended
April 30, 2020
(Unaudited) | | | For the Fiscal Year Ended
October 31, 2019 | |
| | | | | | | | |
| | | Shares | | | Dollars | | | Shares | | | Dollars | |
| | | | |
| Class A Shares | | | | | | | | | | | | | | | | |
Shares sold | | | 829,921 | | | $ | 25,249,110 | | | | 2,578,365 | | | $ | 76,171,953 | |
Reinvestment of distributions | | | 290,606 | | | | 9,214,122 | | | | 839,624 | | | | 22,972,444 | |
Shares redeemed | | | (2,164,371 | ) | | | (66,917,142 | ) | | | (4,081,406 | ) | | | (121,582,504 | ) |
| | | | (1,043,844 | ) | | | (32,453,910 | ) | | | (663,418 | ) | | | (22,438,107 | ) |
| Class C Shares | | | | | | | | | | | | | | | | |
Shares sold | | | 92,861 | | | | 2,482,266 | | | | 353,072 | | | | 8,870,934 | |
Reinvestment of distributions | | | 55,088 | | | | 1,529,789 | | | | 171,082 | | | | 4,147,030 | |
Shares redeemed | | | (293,752 | ) | | | (7,852,899 | ) | | | (1,030,728 | ) | | | (26,741,128 | ) |
| | | | (145,803 | ) | | | (3,840,844 | ) | | | (506,574 | ) | | | (13,723,163 | ) |
| Institutional Shares | | | | | | | | | | | | | | | | |
Shares sold | | | 3,225,883 | | | | 102,307,261 | | | | 8,260,634 | | | | 249,994,999 | |
Reinvestment of distributions | | | 774,752 | | | | 25,568,185 | | | | 2,021,752 | | | | 57,355,849 | |
Shares redeemed | | | (7,246,751 | ) | | | (226,984,049 | ) | | | (12,141,151 | ) | | | (372,578,159 | ) |
| | | | (3,246,116 | ) | | | (99,108,603 | ) | | | (1,858,765 | ) | | | (65,227,311 | ) |
| Service Shares | | | | | | | | | | | | | | | | |
Shares sold | | | 118,235 | | | | 3,695,163 | | | | 706,347 | | | | 19,913,545 | |
Reinvestment of distributions | | | 47,340 | | | | 1,474,770 | | | | 158,528 | | | | 4,265,165 | |
Shares redeemed | | | (573,032 | ) | | | (17,367,485 | ) | | | (986,078 | ) | | | (28,691,006 | ) |
| | | | (407,457 | ) | | | (12,197,552 | ) | | | (121,203 | ) | | | (4,512,296 | ) |
| Investor Shares | | | | | | | | | | | | | | | | |
Shares sold | | | 1,141,233 | | | | 33,569,535 | | | | 4,093,644 | | | | 116,918,081 | |
Reinvestment of distributions | | | 531,837 | | | | 16,642,893 | | | | 1,328,599 | | | | 35,834,532 | |
Shares redeemed | | | (4,410,225 | ) | | | (133,249,970 | ) | | | (6,065,761 | ) | | | (177,715,416 | ) |
| | | | (2,737,155 | ) | | | (83,037,542 | ) | | | (643,518 | ) | | | (24,962,804 | ) |
| Class P Shares | | | | | | | | | | | | | | | | |
Shares sold | | | 238,367 | | | | 7,092,887 | | | | 457,690 | | | | 13,187,898 | |
Reinvestment of distributions | | | 62,937 | | | | 2,075,071 | | | | 117,890 | | | | 3,340,204 | |
Shares redeemed | | | (232,859 | ) | | | (6,975,234 | ) | | | (318,316 | ) | | | (9,349,058 | ) |
| | | | 68,445 | | | | 2,192,724 | | | | 257,264 | | | | 7,179,044 | |
| Class R Shares | | | | | | | | | | | | | | | | |
Shares sold | | | 147,906 | | | | 4,426,053 | | | | 778,072 | | | | 23,164,660 | |
Reinvestment of distributions | | | 27,541 | | | | 849,696 | | | | 24,918 | | | | 665,049 | |
Shares redeemed | | | (419,654 | ) | | | (12,808,084 | ) | | | (538,455 | ) | | | (15,874,791 | ) |
| | | | (244,207 | ) | | | (7,532,335 | ) | | | 264,535 | | | | 7,954,918 | |
| Class R6 Shares | | | | | | | | | | | | | | | | |
Shares sold | | | 1,689,118 | | | | 54,731,456 | | | | 5,501,572 | | | | 166,533,446 | |
Reinvestment of distributions | | | 375,798 | | | | 12,394,764 | | | | 1,076,243 | | | | 30,512,669 | |
Shares redeemed | | | (2,436,119 | ) | | | (76,581,735 | ) | | | (7,710,537 | ) | | | (238,369,630 | ) |
| | | | (371,203 | ) | | | (9,455,515 | ) | | | (1,132,722 | ) | | | (41,323,515 | ) |
| | | | |
NET DECREASE | | | (8,127,340 | ) | | $ | (245,433,577 | ) | | | (4,404,401 | ) | | $ | (157,053,234 | ) |
112
GOLDMAN SACHS DOMESTIC EQUITY INSIGHTS FUNDS
|
| 12. SUMMARY OF SHARE TRANSACTIONS (continued) |
| | | | | | | | | | | | | | | | |
| | | Large Cap Value Insights Fund | |
| | | | |
| | | For the Six Months Ended
April 30, 2020
(Unaudited) | | | For the Fiscal Year Ended
October 31, 2019 | |
| | | | | | | | |
| | | Shares | | | Dollars | | | Shares | | | Dollars | |
| | | | |
| Class A Shares | | | | | | | | | | | | | | | | |
Shares sold | | | 264,681 | | | $ | 5,113,725 | | | | 1,078,518 | | | $ | 21,990,269 | |
Reinvestment of distributions | | | 19,994 | | | | 381,849 | | | | 183,901 | | | | 3,664,611 | |
Shares redeemed | | | (525,897 | ) | | | (10,234,835 | ) | | | (1,068,564 | ) | | | (21,978,819 | ) |
| | | | (241,222 | ) | | | (4,739,261 | ) | | | 193,855 | | | | 3,676,061 | |
| Class C Shares | | | | | | | | | | | | | | | | |
Shares sold | | | 74,687 | | | | 1,435,646 | | | | 349,251 | | | | 6,992,702 | |
Reinvestment of distributions | | | 1,795 | | | | 33,846 | | | | 30,361 | | | | 597,860 | |
Shares redeemed | | | (119,890 | ) | | | (2,267,217 | ) | | | (247,041 | ) | | | (5,052,720 | ) |
| | | | (43,408 | ) | | | (797,725 | ) | | | 132,572 | | | | 2,537,842 | |
| Institutional Shares | | | | | | | | | | | | | | | | |
Shares sold | | | 876,932 | | | | 17,626,728 | | | | 5,286,811 | | | | 107,719,818 | |
Reinvestment of distributions | | | 49,335 | | | | 944,690 | | | | 351,295 | | | | 7,006,599 | |
Shares redeemed | | | (1,471,840 | ) | | | (29,065,698 | ) | | | (5,653,570 | ) | | | (114,141,291 | ) |
| | | | (545,573 | ) | | | (10,494,280 | ) | | | (15,465 | ) | | | 585,125 | |
| Service Shares | | | | | | | | | | | | | | | | |
Shares sold | | | 37,889 | | | | 756,395 | | | | 79,120 | | | | 1,644,632 | |
Reinvestment of distributions | | | 2,251 | | | | 43,388 | | | | 29,623 | | | | 591,853 | |
Shares redeemed | | | (77,045 | ) | | | (1,577,789 | ) | | | (225,687 | ) | | | (4,695,199 | ) |
| | | | (36,905 | ) | | | (778,006 | ) | | | (116,944 | ) | | | (2,458,714 | ) |
| Investor Shares | | | | | | | | | | | | | | | | |
Shares sold | | | 802,418 | | | | 16,003,013 | | | | 3,812,155 | | | | 78,553,524 | |
Reinvestment of distributions | | | 52,932 | | | | 1,011,484 | | | | 326,191 | | | | 6,496,411 | |
Shares redeemed | | | (2,125,819 | ) | | | (42,281,842 | ) | | | (1,755,954 | ) | | | (35,924,975 | ) |
| | | | (1,270,469 | ) | | | (25,267,345 | ) | | | 2,382,392 | | | | 49,124,961 | |
| Class P Shares | | | | | | | | | | | | | | | | |
Shares sold | | | 306,846 | | | | 5,164,429 | | | | 798,187 | | | | 15,252,281 | |
Reinvestment of distributions | | | 16,185 | | | | 307,857 | | | | 99,454 | | | | 1,984,309 | |
Shares redeemed | | | (348,488 | ) | | | (6,192,029 | ) | | | (612,512 | ) | | | (12,240,790 | ) |
| | | | (25,457 | ) | | | (719,743 | ) | | | 285,129 | | | | 4,995,800 | |
| Class R Shares | | | | | | | | | | | | | | | | |
Shares sold | | | 30,998 | | | | 567,200 | | | | 50,087 | | | | 1,018,472 | |
Reinvestment of distributions | | | 1,608 | | | | 30,313 | | | | 17,212 | | | | 340,328 | |
Shares redeemed | | | (26,187 | ) | | | (475,402 | ) | | | (85,121 | ) | | | (1,731,114 | ) |
| | | | 6,419 | | | | 122,111 | | | | (17,823 | ) | | | (372,314 | ) |
| Class R6 Shares | | | | | | | | | | | | | | | | |
Shares sold | | | 207,706 | | | | 4,066,876 | | | | 3,956,938 | | | | 80,014,855 | |
Reinvestment of distributions | | | 32,410 | | | | 617,471 | | | | 492,877 | | | | 9,780,671 | |
Shares redeemed | | | (253,175 | ) | | | (5,301,531 | ) | | | (7,888,267 | ) | | | (162,215,118 | ) |
| | | | (13,059 | ) | | | (617,184 | ) | | | (3,438,452 | ) | | | (72,419,592 | ) |
| | | | |
NET DECREASE | | | (2,169,674 | ) | | $ | (43,291,433 | ) | | | (594,736 | ) | | $ | (14,330,831 | ) |
113
GOLDMAN SACHS DOMESTIC EQUITY INSIGHTS FUNDS
Notes to Financial Statements(continued)
April 30, 2020 (Unaudited)
��
|
| 12. SUMMARY OF SHARE TRANSACTIONS (continued) |
| | | | | | | | | | | | | | | | |
| | | Small Cap Equity Insights Fund | |
| | | | |
| | | For the Six Months Ended
April 30, 2020
(Unaudited) | | | For the Fiscal Year Ended
October 31, 2019 | |
| | | | | | | | |
| | | Shares | | | Dollars | | | Shares | | | Dollars | |
| | | | |
| Class A Shares | | | | | | | | | | | | | | | | |
Shares sold | | | 176,250 | | | $ | 4,057,475 | | | | 568,989 | | | $ | 13,714,527 | |
Reinvestment of distributions | | | 3,912 | | | | 104,831 | | | | 125,799 | | | | 2,866,956 | |
Shares redeemed | | | (407,698 | ) | | | (8,623,217 | ) | | | (761,577 | ) | | | (18,374,675 | ) |
| | | | (227,536 | ) | | | (4,460,911 | ) | | | (66,789 | ) | | | (1,793,192 | ) |
| Class C Shares | | | | | | | | | | | | | | | | |
Shares sold | | | 49,029 | | | | 1,006,719 | | | | 177,041 | | | | 3,568,562 | |
Reinvestment of distributions | | | – | | | | – | | | | 23,381 | | | | 455,454 | |
Shares redeemed | | | (77,542 | ) | | | (1,473,567 | ) | | | (163,618 | ) | | | (3,359,695 | ) |
| | | | (28,513 | ) | | | (466,848 | ) | | | 36,803 | | | | 664,321 | |
| Institutional Shares | | | | | | | | | | | | | | | | |
Shares sold | | | 2,139,629 | | | | 49,149,326 | | | | 5,235,766 | | | | 131,485,651 | |
Reinvestment of distributions | | | 57,789 | | | | 1,611,728 | | | | 476,089 | | | | 11,287,686 | |
Shares redeemed | | | (1,776,481 | ) | | | (40,952,240 | ) | | | (2,771,991 | ) | | | (69,865,556 | ) |
| | | | 420,937 | | | | 9,808,814 | | | | 2,939,864 | | | | 72,907,780 | |
| Service Shares | | | | | | | | | | | | | | | | |
Shares sold | | | 33,623 | | | | 696,452 | | | | 91,926 | | | | 2,205,781 | |
Reinvestment of distributions | | | 109 | | | | 2,866 | | | | 4,673 | | | | 104,730 | |
Shares redeemed | | | (27,722 | ) | | | (655,373 | ) | | | (51,949 | ) | | | (1,230,710 | ) |
| | | | 6,010 | | | | 43,945 | | | | 44,650 | | | | 1,079,801 | |
| Investor Shares | | | | | | | | | | | | | | | | |
Shares sold | | | 1,301,709 | | | | 28,996,515 | | | | 2,111,112 | | | | 51,466,887 | |
Reinvestment of distributions | | | 14,081 | | | | 374,689 | | | | 107,128 | | | | 2,425,323 | |
Shares redeemed | | | (1,300,161 | ) | | | (25,568,946 | ) | | | (1,037,135 | ) | | | (25,425,896 | ) |
| | | | 15,629 | | | | 3,802,258 | | | | 1,181,105 | | | | 28,466,314 | |
| Class P Shares | | | | | | | | | | | | | | | | |
Shares sold | | | 1,629,060 | | | | 30,769,013 | | | | 2,896,062 | | | | 66,645,917 | |
Reinvestment of distributions | | | 21,405 | | | | 596,984 | | | | 138,422 | | | | 3,278,915 | |
Shares redeemed | | | (1,807,840 | ) | | | (35,879,274 | ) | | | (1,565,207 | ) | | | (38,912,996 | ) |
| | | | (157,375 | ) | | | (4,513,277 | ) | | | 1,469,277 | | | | 31,011,836 | |
| Class R Shares | | | | | | | | | | | | | | | | |
Shares sold | | | 101,332 | | | | 2,225,575 | | | | 271,701 | | | | 6,483,888 | |
Reinvestment of distributions | | | – | | | | – | | | | 33,918 | | | | 755,025 | |
Shares redeemed | | | (119,349 | ) | | | (2,834,400 | ) | | | (223,024 | ) | | | (5,325,434 | ) |
| | | | (18,017 | ) | | | (608,825 | ) | | | 82,595 | | | | 1,913,479 | |
| Class R6 Shares | | | | | | | | | | | | | | | | |
Shares sold | | | 783,060 | | | | 17,303,516 | | | | 4,301,945 | | | | 106,589,803 | |
Reinvestment of distributions | | | 28,665 | | | | 799,462 | | | | 399,759 | | | | 9,476,064 | |
Shares redeemed | | | (1,180,649 | ) | | | (26,031,386 | ) | | | (5,443,119 | ) | | | (138,390,631 | ) |
| | | | (368,924 | ) | | | (7,928,408 | ) | | | (741,416 | ) | | | (22,324,764 | ) |
| | | | |
NET INCREASE (DECREASE) | | | (357,789 | ) | | $ | (4,323,252 | ) | | | 4,946,088 | | | $ | 111,925,575 | |
114
GOLDMAN SACHS DOMESTIC EQUITY INSIGHTS FUNDS
|
| 12. SUMMARY OF SHARE TRANSACTIONS (continued) |
| | | | | | | | | | | | | | | | |
| | | Small Cap Growth Insights Fund | |
| | | | |
| | | For the Six Months Ended
April 30, 2020
(Unaudited) | | | For the Fiscal Year Ended
October 31, 2019 | |
| | | | | | | | |
| | | Shares | | | Dollars | | | Shares | | | Dollars | |
| | | | |
| Class A Shares | | | | | | | | | | | | | | | | |
Shares sold | | | 195,610 | | | $ | 6,237,721 | | | | 592,485 | | | $ | 20,113,596 | |
Reinvestment of distributions | | | 31,355 | | | | 1,142,271 | | | | 281,405 | | | | 8,799,529 | |
Shares redeemed | | | (952,066 | ) | | | (32,603,408 | ) | | | (834,841 | ) | | | (28,043,840 | ) |
| | | | (725,101 | ) | | | (25,223,416 | ) | | | 39,049 | | | | 869,285 | |
| Class C Shares | | | | | | | | | | | | | | | | |
Shares sold | | | 40,478 | | | | 943,239 | | | | 73,158 | | | | 1,836,124 | |
Reinvestment of distributions | | | 5,520 | | | | 149,101 | | | | 44,452 | | | | 1,043,280 | |
Shares redeemed | | | (58,141 | ) | | | (1,295,533 | ) | | | (82,422 | ) | | | (2,101,667 | ) |
| | | | (12,143 | ) | | | (203,193 | ) | | | 35,188 | | | | 777,737 | |
| Institutional Shares | | | | | | | | | | | | | | | | |
Shares sold | | | 1,294,119 | | | | 48,117,604 | | | | 3,227,816 | | | | 127,361,435 | |
Reinvestment of distributions | | | 89,256 | | | | 3,895,156 | | | | 718,806 | | | | 26,768,316 | |
Shares redeemed | | | (1,962,387 | ) | | | (71,102,402 | ) | | | (2,661,680 | ) | | | (106,449,391 | ) |
| | | | (579,012 | ) | | | (19,089,642 | ) | | | 1,284,942 | | | | 47,680,360 | |
| Investor Shares | | | | | | | | | | | | | | | | |
Shares sold | | | 2,565,043 | | | | 80,744,200 | | | | 3,840,487 | | | | 134,252,383 | |
Reinvestment of distributions | | | 136,767 | | | | 5,138,365 | | | | 964,429 | | | | 31,016,030 | |
Shares redeemed | | | (1,509,490 | ) | | | (48,432,469 | ) | | | (2,406,524 | ) | | | (83,691,568 | ) |
| | | | 1,192,320 | | | | 37,450,096 | | | | 2,398,392 | | | | 81,576,845 | |
| Class P Shares | | | | | | | | | | | | | | | | |
Shares sold | | | 31,201 | | | | 1,212,348 | | | | 146,086 | | | | 5,834,292 | |
Reinvestment of distributions | | | 3,337 | | | | 145,698 | | | | 20,911 | | | | 778,940 | |
Shares redeemed | | | (79,181 | ) | | | (2,528,156 | ) | | | (117,790 | ) | | | (4,759,537 | ) |
| | | | (44,643 | ) | | | (1,170,110 | ) | | | 49,207 | | | | 1,853,695 | |
| Class R Shares | | | | | | | | | | | | | | | | |
Shares sold | | | 57,998 | | | | 1,856,921 | | | | 191,155 | | | | 6,202,346 | |
Reinvestment of distributions | | | 7,390 | | | | 257,387 | | | | 59,954 | | | | 1,798,021 | |
Shares redeemed | | | (381,566 | ) | | | (12,589,389 | ) | | | (221,227 | ) | | | (7,312,754 | ) |
| | | | (316,178 | ) | | | (10,475,081 | ) | | | 29,882 | | | | 687,613 | |
| Class R6 Shares | | | | | | | | | | | | | | | | |
Shares sold | | | 1,406,560 | | | | 50,795,172 | | | | 6,482,593 | | | | 253,736,476 | |
Reinvestment of distributions | | | 76,050 | | | | 3,321,119 | | | | 378,454 | | | | 14,097,427 | |
Shares redeemed | | | (1,322,651 | ) | | | (50,248,819 | ) | | | (2,246,884 | ) | | | (88,998,158 | ) |
| | | | 159,959 | | | | 3,867,472 | | | | 4,614,163 | | | | 178,835,746 | |
| | | | |
NET INCREASE (DECREASE) | | | (324,798 | ) | | $ | (14,843,874 | ) | | | 8,450,821 | | | $ | 312,281,279 | |
115
GOLDMAN SACHS DOMESTIC EQUITY INSIGHTS FUNDS
Notes to Financial Statements(continued)
April 30, 2020 (Unaudited)
|
| 12. SUMMARY OF SHARE TRANSACTIONS (continued) |
| | | | | | | | | | | | | | | | |
| | | Small Cap Value Insights Fund | |
| | | | |
| | | For the Six Months Ended
April 30, 2020
(Unaudited) | | | For the Fiscal Year Ended
October 31, 2019 | |
| | | | | | | | |
| | | Shares | | | Dollars | | | Shares | | | Dollars | |
| | | | |
| Class A Shares | | | | | | | | | | | | | | | | |
Shares sold | | | 336,639 | | | $ | 11,019,719 | | | | 1,050,768 | | | $ | 38,541,581 | |
Reinvestment of distributions | | | 19,063 | | | | 787,894 | | | | 287,947 | | | | 10,340,127 | |
Shares redeemed | | | (519,454 | ) | | | (18,187,143 | ) | | | (644,168 | ) | | | (24,334,368 | ) |
| | | | (163,752 | ) | | | (6,379,530 | ) | | | 694,547 | | | | 24,547,339 | |
| Class C Shares | | | | | | | | | | | | | | | | |
Shares sold | | | 31,028 | | | | 816,209 | | | | 127,462 | | | | 3,310,457 | |
Reinvestment of distributions | | | 1,135 | | | | 32,225 | | | | 33,399 | | | | 826,636 | |
Shares redeemed | | | (55,292 | ) | | | (1,206,669 | ) | | | (96,061 | ) | | | (2,520,272 | ) |
| | | | (23,129 | ) | | | (358,235 | ) | | | 64,800 | | | | 1,616,820 | |
| Institutional Shares | | | | | | | | | | | | | | | | |
Shares sold | | | 1,392,339 | | | | 64,504,712 | | | | 3,054,255 | | | | 151,801,030 | |
Reinvestment of distributions | | | 24,938 | | | | 1,394,771 | | | | 97,074 | | | | 4,698,255 | |
Shares redeemed | | | (1,183,936 | ) | | | (48,662,816 | ) | | | (649,664 | ) | | | (32,690,060 | ) |
| | | | 233,341 | | | | 17,236,667 | | | | 2,501,666 | | | | 123,809,225 | |
| Investor Shares | | | | | | | | | | | | | | | | |
Shares sold | | | 7,019,574 | | | | 203,241,042 | | | | 1,447,937 | | | | 53,566,402 | |
Reinvestment of distributions | | | 16,896 | | | | 693,587 | | | | 53,407 | | | | 1,907,349 | |
Shares redeemed | | | (739,633 | ) | | | (24,363,356 | ) | | | (421,221 | ) | | | (15,930,853 | ) |
| | | | 6,296,837 | | | | 179,571,273 | | | | 1,080,123 | | | | 39,542,898 | |
| Class P Shares | | | | | | | | | | | | | | | | |
Shares sold | | | 221,443 | | | | 8,662,943 | | | | 393,971 | | | | 19,494,828 | |
Reinvestment of distributions | | | 6,414 | | | | 358,606 | | | | 59,484 | | | | 2,877,391 | |
Shares redeemed | | | (376,390 | ) | | | (14,262,290 | ) | | | (317,399 | ) | | | (15,579,917 | ) |
| | | | (148,533 | ) | | | (5,240,741 | ) | | | 136,056 | | | | 6,792,301 | |
| Class R Shares | | | | | | | | | | | | | | | | |
Shares sold | | | 62,092 | | | | 2,095,440 | | | | 193,684 | | | | 7,197,157 | |
Reinvestment of distributions | | | 1,459 | | | | 59,099 | | | | 4,075 | | | | 143,841 | |
Shares redeemed | | | (45,275 | ) | | | (1,666,379 | ) | | | (34,966 | ) | | | (1,291,159 | ) |
| | | | 18,276 | | | | 488,160 | | | | 162,792 | | | | 6,049,839 | |
| Class R6 Shares | | | | | | | | | | | | | | | | |
Shares sold | | | 1,502,996 | | | | 71,733,915 | | | | 2,033,658 | | | | 99,067,064 | |
Reinvestment of distributions | | | 15,950 | | | | 891,762 | | | | 39,496 | | | | 1,908,993 | |
Shares redeemed | | | (328,934 | ) | | | (15,441,676 | ) | | | (273,958 | ) | | | (14,003,900 | ) |
| | | | 1,190,012 | | | | 57,184,001 | | | | 1,799,196 | | | | 86,972,158 | |
| | | | |
NET INCREASE | | | 7,403,052 | | | $ | 242,501,595 | | | | 6,439,180 | | | $ | 289,330,581 | |
116
GOLDMAN SACHS DOMESTIC EQUITY INSIGHTS FUNDS
|
| 12. SUMMARY OF SHARE TRANSACTIONS (continued) |
| | | | | | | | | | | | | | | | |
| | | U.S. Equity Insights Fund | |
| | | | |
| | | For the Six Months Ended
April 30, 2020
(Unaudited) | | | For the Fiscal Year Ended
October 31, 2019 | |
| | | | | | | | |
| | | Shares | | | Dollars | | | Shares | | | Dollars | |
| | | | |
| Class A Shares | | | | | | | | | | | | | | | | |
Shares sold | | | 188,480 | | | $ | 8,570,267 | | | | 496,152 | | | $ | 22,850,036 | |
Reinvestment of distributions | | | 77,068 | | | | 3,932,787 | | | | 247,236 | | | | 10,881,031 | |
Shares redeemed | | | (619,278 | ) | | | (30,035,050 | ) | | | (1,018,418 | ) | | | (47,836,905 | ) |
| | | | (353,730 | ) | | | (17,531,996 | ) | | | (275,030 | ) | | | (14,105,838 | ) |
| Class C Shares | | | | | | | | | | | | | | | | |
Shares sold | | | 39,339 | | | | 1,685,736 | | | | 148,922 | | | | 5,994,935 | |
Reinvestment of distributions | | | 2,946 | | | | 134,360 | | | | 13,896 | | | | 548,621 | |
Shares redeemed | | | (60,138 | ) | | | (2,584,987 | ) | | | (136,446 | ) | | | (5,655,834 | ) |
| | | | (17,853 | ) | | | (764,891 | ) | | | 26,372 | | | | 887,721 | |
| Institutional Shares | | | | | | | | | | | | | | | | |
Shares sold | | | 550,786 | | | | 27,664,036 | | | | 5,561,162 | | | | 252,475,763 | |
Reinvestment of distributions | | | 88,673 | | | | 4,667,759 | | | | 755,380 | | | | 34,167,885 | |
Shares redeemed | | | (1,497,498 | ) | | | (76,921,314 | ) | | | (17,635,422 | ) | | | (854,571,457 | ) |
| | | | (858,039 | ) | | | (44,589,519 | ) | | | (11,318,880 | ) | | | (567,927,809 | ) |
| Service Shares | | | | | | | | | | | | | | | | |
Shares sold | | | 20,149 | | | | 983,279 | | | | 30,525 | | | | 1,372,351 | |
Reinvestment of distributions | | | 1,819 | | | | 92,349 | | | | 4,689 | | | | 205,533 | |
Shares redeemed | | | (48,266 | ) | | | (2,395,726 | ) | | | (23,962 | ) | | | (1,120,436 | ) |
| | | | (26,298 | ) | | | (1,320,098 | ) | | | 11,252 | | | | 457,449 | |
| Investor Shares | | | | | | | | | | | | | | | | |
Shares sold | | | 177,275 | | | | 8,435,772 | | | | 1,320,028 | | | | 60,005,258 | |
Reinvestment of distributions | | | 37,411 | | | | 1,879,914 | | | | 103,871 | | | | 4,499,108 | |
Shares redeemed | | | (819,124 | ) | | | (38,759,121 | ) | | | (1,224,326 | ) | | | (56,455,932 | ) |
| | | | (604,438 | ) | | | (28,443,435 | ) | | | 199,573 | | | | 8,048,435 | |
| Class P Shares | | | | | | | | | | | | | | | | |
Shares sold | | | 963,550 | | | | 48,035,684 | | | | 2,522,934 | | | | 114,163,961 | |
Reinvestment of distributions | | | 76,672 | | | | 4,032,946 | | | | 135,300 | | | | 6,101,132 | |
Shares redeemed | | | (1,143,776 | ) | | | (53,891,726 | ) | | | (2,371,343 | ) | | | (113,078,993 | ) |
| | | | (103,554 | ) | | | (1,823,096 | ) | | | 286,891 | | | | 7,186,100 | |
| Class R Shares | | | | | | | | | | | | | | | | |
Shares sold | | | 115,709 | | | | 5,496,436 | | | | 219,851 | | | | 10,041,364 | |
Reinvestment of distributions | | | 10,083 | | | | 505,157 | | | | 38,936 | | | | 1,684,599 | |
Shares redeemed | | | (228,032 | ) | | | (10,880,056 | ) | | | (409,091 | ) | | | (18,891,773 | ) |
| | | | (102,240 | ) | | | (4,878,463 | ) | | | (150,304 | ) | | | (7,165,810 | ) |
| Class R6 Shares | | | | | | | | | | | | | | | | |
Shares sold | | | 19,885 | | | | 988,790 | | | | 189,729 | | | | 8,892,870 | |
Reinvestment of distributions | | | 3,227 | | | | 169,754 | | | | 29,892 | | | | 1,352,886 | |
Shares redeemed | | | (121,967 | ) | | | (6,052,280 | ) | | | (631,325 | ) | | | (30,710,320 | ) |
| | | | (98,855 | ) | | | (4,893,736 | ) | | | (411,704 | ) | | | (20,464,563 | ) |
| | | | |
NET DECREASE | | | (2,165,007 | ) | | $ | (104,245,234 | ) | | | (11,631,830 | ) | | $ | (593,084,316 | ) |
117
GOLDMAN SACHS DOMESTIC EQUITY INSIGHTS FUNDS
Voting Results of Special Meeting of Shareholders (Unaudited)
A Special Meeting (the “Meeting”) of the Goldman Sachs Trust (“GST”) was held on January 23, 2020 to consider and act upon the proposals below. The Funds have amortized their respective share of the proxy, shareholder meeting and other related costs and GSAM has agreed to reimburse the Funds to the extent such expenses exceed a specified percentage of each Funds’ net assets.
At the Meeting, Dwight L. Bush, Kathryn A. Cassidy, Joaquin Delgado and Gregory G. Weaver were elected to the Trust’s Board of Trustees. In electing the trustees, the Trust’s shareholders voted as follows:
| | | | | | | | | | | | | | | | |
Proposal 1. Election of Trustees | | For | | | Against | | | Withheld | | | Broker Non-Votes | |
| | | | |
Dwight L. Bush | | | 94,278,961,728.065 | | | | 0 | | | | 349,026,343.365 | | | | 0 | |
| | | | |
Kathryn A. Cassidy | | | 94,310,850,789.164 | | | | 0 | | | | 317,137,282.266 | | | | 0 | |
| | | | |
Joaquin Delgado | | | 94,282,646,444.727 | | | | 0 | | | | 345,341,626.703 | | | | 0 | |
| | | | |
Gregory G. Weaver | | | 94,306,589,873.348 | | | | 0 | | | | 321,398,198.082 | | | | 0 | |
| | | | | | | | | | | | | | | | |
At the Meeting, the shareholders of the Goldman Sachs Large Cap Growth Insights Fund approved a change to the Fund’s sub-classification under the Act from “diversified” to “non-diversified”. The Trust’s shareholders voted as follows:
| | | | | | | | | | | | | | | | |
Proposal 2. To approve a change to the Fund’s sub-classification under
the Investment Company Act of 1940 from “diversified” to
“non-diversified’ and to eliminate a related fundamental
investment restriction. | | For | | | Against | | | Abstained | | | Broker Non-Votes | |
| | | | |
Large Cap Growth Insights Fund | | | 23,785,792.632 | | | | 250,521.921 | | | | 196,802.993 | | | | 9,592,467.322 | |
| | | | | | | | | | | | | | | | |
118
Liquidity Risk Management Program(Unaudited)
Each Fund has adopted and implemented a liquidity risk management program (the “Program”) in accordance with Rule22e-4 under the 1940 Act. The Program seeks to assess and manage each Fund’s liquidity risk, i.e., the risk that a Fund is unable to satisfy redemption requests without significantly diluting remaining investors’ interests in the Fund. The Board of Trustees of the Trust has designated GSAM, each Fund’s investment adviser, to administer the Program. Certain aspects of the Program rely on third parties to perform certain functions, including the provision of market data and application of models.
The Program is comprised of various components designed to support the assessment and/or management of liquidity risk, including: (1) the periodic assessment (no less frequently than annually) of certain factors that influence a Fund’s liquidity risk; (2) the periodic classification (no less frequently than monthly) of a Fund’s investments into one of four liquidity categories that reflect an estimate of their liquidity under current market conditions; (3) a 15% limit on the acquisition of “illiquid investments” (as defined under Rule22e-4); (4) for a Fund that does not invest primarily in “highly liquid investments” (as defined under Rule22e-4), the determination of a minimum percentage of the Fund’s assets that will generally be invested in highly liquid investments (a “Highly Liquid Investment Minimum”); and (5) periodic reporting to the Board of Trustees.
At a meeting of the Board of Trustees on February11-12, 2020, GSAM provided a written report to the Board addressing the operation, and the adequacy and effectiveness of the implementation, of the Program, including, as applicable, the operation of any Highly Liquid Investment Minimum and any material changes to the Program, for the initial period from December 1, 2018 through December 31, 2019 (the “Reporting Period”). Among other things, the annual report discussed: (1) the results of stress tests designed to assess liquidity under a hypothetical stressed scenario involving elevated redemptions; and (2) an assessment of the methodologies used to classify investments into one of four liquidity categories. The report concluded that the Program was reasonably designed to assess and manage liquidity risk and was adequately and effectively implemented during the Reporting Period.
There can be no assurance that the Program will achieve its objectives under all circumstances in the future. Please refer to your Fund’s prospectus for more information regarding the Fund’s exposure to liquidity risk and other risks to which it may be subject.
119
GOLDMAN SACHS DOMESTIC EQUITY INSIGHTS FUNDS
Fund Expenses — Six Month Period Ended April 30, 2020 (Unaudited)
As a shareholder of Class A, Class C, Institutional, Service, Investor, Class P, Class R and Class R6 Shares of a Fund, you incur two types of costs: (1) transaction costs, including sales charges on purchase payments (with respect to Class A Shares), contingent deferred sales charges on redemptions (with respect to Class C Shares), and (2) ongoing costs, including management fees; distribution and/or service(12b-1) fees (with respect to Class A, Class C, Service and Class R Shares); and other Fund expenses. This Example is intended to help you understand your ongoing costs (in dollars) of investing in Class A, Class C, Institutional, Service, Investor, Class P, Class R or Class R6 Shares of the Funds and to compare these costs with the ongoing costs of investing in other mutual funds.
The Example is based on an investment of $1,000 invested at the beginning of the period and held for the entire period from November 1, 2019 through April 30, 2020, which represents a period of 182 days in a 366 day year. This projection assumes that annualized expense ratios were in effect during the period.
ActualExpenses — The first line under each share class in the table below provides information about actual account values and actual expenses. You may use the information in this line, together with the amount you invested, to estimate the expenses that you paid over the period. Simply divide your account value by $1,000 (for example, an $8,600 account value divided by $1,000=8.6), then multiply the result by the number in the first line under the heading entitled “Expenses Paid” to estimate the expenses you paid on your account during this period.
HypotheticalExampleforComparisonPurposes — The second line under each share class in the table below provides information about hypothetical account values and hypothetical expenses based on the Funds’ actual net expense ratios and an assumed rate of return of 5% per year before expenses, which is not the Funds’ actual return. The hypothetical account values and expenses may not be used to estimate the actual ending account balance or expenses you paid for the period. You may use this information to compare the ongoing costs of investing in the Funds and other funds. To do so, compare this 5% hypothetical example with the 5% hypothetical examples that appear in the shareholder reports of the other funds.
Please note that the expenses shown in the table are meant to highlight your ongoing costs only and do not reflect any transactional costs, such as sales charges, redemption fees, or exchange fees. Therefore, the second line of the table is useful in comparing ongoing costs only, and will not help you determine the relative total costs of owning different funds. In addition, if these transactional costs were included, your costs would have been higher:
| | | | | | | | | | | | | | | | | | | | | | | | | | | | | | | | | | | | |
| | | Large Cap Growth Insights | | | Large Cap Value Insights | | | Small Cap Equity Insights | |
| Share Class | | Beginning
Account
Value
11/1/19 | | | Ending
Account
Value
4/30/20 | | | Expenses
Paid for the
6 months ended
4/30/2020* | | | Beginning
Account
Value
11/1/19 | | | Ending
Account
Value
4/30/20 | | | Expenses
Paid for the
6 months ended
4/30/2020* | | | Beginning
Account
Value
11/1/19 | | | Ending
Account
Value
4/30/20 | | | Expenses
Paid for the
6 months ended
4/30/2020* | |
| | | | | | | | | | |
| Class A | | | | | | | | | | | | | | | | | | | | | | | | | | | | | | | | | | | | |
Actual | | $ | 1,000.00 | | | $ | 1,026.75 | | | $ | 4.64 | | | $ | 1,000.00 | | | $ | 855.66 | | | $ | 4.34 | | | $ | 1,000.00 | | | $ | 798.18 | | | $ | 5.45 | |
Hypothetical 5% return | | | 1,000.00 | | | | 1,020.29 | + | | | 4.62 | | | | 1,000.00 | | | | 1,020.19 | + | | | 4.72 | | | | 1,000.00 | | | | 1,018.80 | + | | | 6.12 | |
| Class C | | | | | | | | | | | | | | | | | | | | | | | | | | | | | | | | | | | | |
Actual | | | 1,000.00 | | | | 1,023.36 | | | | 8.40 | | | | 1,000.00 | | | | 852.46 | | | | 7.83 | | | | 1,000.00 | | | | 794.94 | | | | 8.79 | |
Hypothetical 5% return | | | 1,000.00 | | | | 1,016.56 | + | | | 8.37 | | | | 1,000.00 | | | | 1,016.41 | + | | | 8.52 | | | | 1,000.00 | | | | 1,015.07 | + | | | 9.87 | |
| Institutional | | | | | | | | | | | | | | | | | | | | | | | | | | | | | | | | | | | | |
Actual | | | 1,000.00 | | | | 1,029.00 | | | | 2.72 | | | | 1,000.00 | | | | 857.30 | | | | 2.59 | | | | 1,000.00 | | | | 799.70 | | | | 3.76 | |
Hypothetical 5% return | | | 1,000.00 | | | | 1,022.18 | + | | | 2.72 | | | | 1,000.00 | | | | 1,022.08 | + | | | 2.82 | | | | 1,000.00 | | | | 1,020.69 | + | | | 4.22 | |
| Service | | | | | | | | | | | | | | | | | | | | | | | | | | | | | | | | | | | | |
Actual | | | 1,000.00 | | | | 1,026.35 | | | | 5.24 | | | | 1,000.00 | | | | 855.11 | | | | 4.89 | | | | 1,000.00 | | | | 797.76 | | | | 5.99 | |
Hypothetical 5% return | | | 1,000.00 | | | | 1,019.69 | + | | | 5.22 | | | | 1,000.00 | | | | 1,019.59 | + | | | 5.32 | | | | 1,000.00 | | | | 1,018.20 | + | | | 6.72 | |
| Investor | | | | | | | | | | | | | | | | | | | | | | | | | | | | | | | | | | | | |
Actual | | | 1,000.00 | | | | 1,028.19 | | | | 3.38 | | | | 1,000.00 | | | | 856.72 | | | | 3.19 | | | | 1,000.00 | | | | 798.99 | | | | 4.34 | |
Hypothetical 5% return | | | 1,000.00 | | | | 1,021.53 | + | | | 3.37 | | | | 1,000.00 | | | | 1,021.43 | + | | | 3.47 | | | | 1,000.00 | | | | 1,020.04 | + | | | 4.87 | |
| Class P | | | | | | | | | | | | | | | | | | | | | | | | | | | | | | | | | | | | |
Actual | | | 1,000.00 | | | | 1,028.86 | | | | 2.67 | | | | 1,000.00 | | | | 857.29 | | | | 2.54 | | | | 1,000.00 | | | | 799.74 | | | | 3.71 | |
Hypothetical 5% return | | | 1,000.00 | | | | 1,022.23 | + | | | 2.66 | | | | 1,000.00 | | | | 1,022.13 | + | | | 2.77 | | | | 1,000.00 | | | | 1,020.74 | + | | | 4.17 | |
| Class R | | | | | | | | | | | | | | | | | | | | | | | | | | | | | | | | | | | | |
Actual | | | 1,000.00 | | | | 1,025.64 | | | | 5.89 | | | | 1,000.00 | | | | 854.45 | | | | 5.49 | | | | 1,000.00 | | | | 797.28 | | | | 6.57 | |
Hypothetical 5% return | | | 1,000.00 | | | | 1,019.05 | + | | | 5.87 | | | | 1,000.00 | | | | 1,018.95 | + | | | 5.97 | | | | 1,000.00 | | | | 1,017.55 | + | | | 7.37 | |
| Class R6 | | | | | | | | | | | | | | | | | | | | | | | | | | | | | | | | | | | | |
Actual | | | 1,000.00 | | | | 1029.12 | | | | 2.67 | | | | 1,000.00 | | | | 857.36 | | | | 2.54 | | | | 1,000.00 | | | | 799.74 | | | | 3.71 | |
Hypothetical 5% return | | | 1,000.00 | | | | 1,022.23 | + | | | 2.66 | | | | 1,000.00 | | | | 1,022.13 | + | | | 2.77 | | | | 1,000.00 | | | | 1,020.74 | + | | | 4.17 | |
| * | | Expenses for each share class are calculated using each Fund’s annualized net expense ratio for each class, which represents the ongoing expenses as a percentage of net assets for the six months ended October 31, 2019. Expenses are calculated by multiplying the annualized net expense ratio by the average account value for the period; then multiplying the result by the number of days in the most recent fiscal half year; and then dividing that result by the number of days in the fiscal year. |
120
GOLDMAN SACHS DOMESTIC EQUITY INSIGHTS FUNDS
Fund Expenses — Six Month Period Ended April 30, 2020 (Unaudited) (continued)
| | | | | | | | | | | | | | | | | | | | | | | | | | | | | | | | | | | | |
| | | Small Cap Growth Insights | | | Small Cap Value Insights | | | U.S. Equity Insights | |
| Share Class | | Beginning
Account
Value
11/1/19 | | | Ending
Account
Value
4/30/20 | | | Expenses
Paid for the
6 months ended
4/30/2020* | | | Beginning
Account
Value
11/1/19 | | | Ending
Account
Value
4/30/20 | | | Expenses
Paid for the
6 months ended
4/30/2020* | | | Beginning
Account
Value
11/1/19 | | | Ending
Account
Value
4/30/20 | | | Expenses
Paid for the
6 months ended
4/30/2020* | |
| | | | | | | | | | |
| Class A | | | | | | | | | | | | | | | | | | | | | | | | | | | | | | | | | | | | |
Actual | | $ | 1,000.00 | | | $ | 856.77 | | | $ | 5.63 | | | $ | 1,000.00 | | | $ | 751.80 | | | $ | 5.31 | | | $ | 1,000.00 | | | $ | 967.95 | | | $ | 4.60 | |
Hypothetical 5% return | | | 1,000.00 | | | | 1,018.80 | + | | | 6.12 | | | | 1,000.00 | | | | 1,018.80 | + | | | 6.12 | | | | 1,000.00 | | | | 1,020.19 | + | | | 4.72 | |
| Class C | | | | | | | | | | | | | | | | | | | | | | | | | | | | | | | | | | | | |
Actual | | | 1,000.00 | | | | 853.38 | | | | 9.12 | | | | 1,000.00 | | | | 748.87 | | | | 8.57 | | | | 1,000.00 | | | | 964.69 | | | | 8.26 | |
Hypothetical 5% return | | | 1,000.00 | | | | 1,015.02 | + | | | 9.92 | | | | 1,000.00 | | | | 1,015.07 | + | | | 9.87 | | | | 1,000.00 | | | | 1,016.46 | + | | | 8.47 | |
| Institutional | | | | | | | | | | | | | | | | | | | | | | | | | | | | | | | | | | | | |
Actual | | | 1,000.00 | | | | 858.45 | | | | 3.88 | | | | 1,000.00 | | | | 753.16 | | | | 3.66 | | | | 1,000.00 | | | | 970.06 | | | | 2.74 | |
Hypothetical 5% return | | | 1,000.00 | | | | 1,020.69 | + | | | 4.22 | | | | 1,000.00 | | | | 1,020.69 | + | | | 4.22 | | | | 1,000.00 | | | | 1,022.08 | + | | | 2.82 | |
| Service | | | | | | | | | | | | | | | | | | | | | | | | | | | | | | | | | | | | |
Actual | | | — | | | | — | | | | — | | | | — | | | | — | | | | — | | | | 1,000.00 | | | | 967.54 | | | | 5.19 | |
Hypothetical 5% return | | | — | | | | — | | | | — | | | | — | | | | — | | | | — | | | | 1,000.00 | | | | 1,019.59 | + | | | 5.32 | |
| Investor | | | | | | | | | | | | | | | | | | | | | | | | | | | | | | | | | | | | |
Actual | | | 1,000.00 | | | | 857.74 | | | | 4.48 | | | | 1,000.00 | | | | 752.45 | | | | 4.23 | | | | 1,000.00 | | | | 969.36 | | | | 3.38 | |
Hypothetical 5% return | | | 1,000.00 | | | | 1,020.04 | + | | | 4.87 | | | | 1,000.00 | | | | 1,020.04 | + | | | 4.87 | | | | 1,000.00 | | | | 1,021.43 | + | | | 3.47 | |
| Class P | | | | | | | | | | | | | | | | | | | | | | | | | | | | | | | | | | | | |
Actual | | | 1,000.00 | | | | 858.28 | | | | 3.83 | | | | 1,000.00 | | | | 753.08 | | | | 3.62 | | | | 1,000.00 | | | | 969.97 | | | | 2.69 | |
Hypothetical 5% return | | | 1,000.00 | | | | 1,020.74 | + | | | 4.17 | | | | 1,000.00 | | | | 1,020.74 | + | | | 4.17 | | | | 1,000.00 | | | | 1,022.13 | + | | | 2.77 | |
| Class R | | | | | | | | | | | | | | | | | | | | | | | | | | | | | | | | | | | | |
Actual | | | 1,000.00 | | | | 855.43 | | | | 6.78 | | | | 1,000.00 | | | | 750.63 | | | | 6.40 | | | | 1,000.00 | | | | 966.96 | | | | 5.82 | |
Hypothetical 5% return | | | 1,000.00 | | | | 1,017.55 | + | | | 7.37 | | | | 1,000.00 | | | | 1,017.55 | + | | | 7.37 | | | | 1,000.00 | | | | 1,018.95 | + | | | 5.97 | |
| Class R6 | | | | | | | | | | | | | | | | | | | | | | | | | | | | | | | | | | | | |
Actual | | | 1,000.00 | | | | 858.52 | | | | 3.84 | | | | 1,000.00 | | | | 753.16 | | | | 3.62 | | | | 1,000.00 | | | | 969.93 | | | | 2.69 | |
Hypothetical 5% return | | | 1,000.00 | | | | 1,020.74 | + | | | 4.17 | | | | 1,000.00 | | | | 1,020.74 | + | | | 4.17 | | | | 1,000.00 | | | | 1,022.13 | + | | | 2.77 | |
| * | | Expenses for each share class are calculated using each Fund’s annualized net expense ratio for each class, which represents the ongoing expenses as a percentage of net assets for the six months ended April 30, 2020. Expenses are calculated by multiplying the annualized net expense ratio by the average account value for the period; then multiplying the result by the number of days in the most recent fiscal half year; and then dividing that result by the number of days in the fiscal year. The annualized net expense ratios for the period were as follows: |
| | | | | | | | | | | | | | | | | | | | | | | | | | | | | | | | |
| Fund | | Class A
Shares | | | Class C
Shares | | | Institutional
Shares | | | Service
Shares | | | Investor
Shares | | | Class P
Shares | | | Class R
Shares | | | Class R6
Shares | |
Large Cap Growth Insights+ | | | 0.92 | % | | | 1.67 | % | | | 0.54 | % | | | 1.04 | % | | | 0.67 | % | | | 0.53 | % | | | 1.17 | % | | | 0.53 | % |
Large Cap Value Insights+ | | | 0.94 | | | | 1.70 | | | | 0.56 | | | | 1.06 | | | | 0.69 | | | | 0.55 | | | | 1.19 | | | | 0.55 | |
Small Cap Equity Insights+ | | | 1.22 | | | | 1.97 | | | | 0.84 | | | | 1.34 | | | | 0.97 | | | | 0.83 | | | | 1.47 | | | | 0.83 | |
Small Cap Growth Insights+ | | | 1.22 | | | | 1.98 | | | | 0.84 | | | | — | | | | 0.97 | | | | 0.83 | | | | 1.47 | | | | 0.83 | |
Small Cap Value Insights+ | | | 1.22 | | | | 1.97 | | | | 0.84 | | | | — | | | | 0.97 | | | | 0.83 | | | | 1.47 | | | | 0.83 | |
U.S. Equity Insights+ | | | 0.94 | | | | 1.69 | | | | 0.56 | | | | 1.06 | | | | 0.69 | | | | 0.55 | | | | 1.19 | | | | 0.55 | |
| + | | Hypothetical expenses are based on each Fund’s actual annualized net expense ratios and an assumed rate of return of 5% per year before expenses. |
121
FUNDS PROFILE
Goldman Sachs Funds
Goldman Sachs is a premier financial services firm, known since 1869 for creating thoughtful and customized investment solutions in complex global markets.
Today, theConsumer and Investment Management Division of Goldman Sachs serves a diverse set of clients worldwide, including private institutions, public entities and individuals. With approximately $1.66 trillion in assets under supervision as of March 31, 2020, Goldman Sachs Asset Management (“GSAM”) has portfolio management teams located around the world and our investment professionals bring firsthand knowledge of local markets to every investment decision. Assets under supervision includes assets under management and other client assets for which Goldman Sachs does not have full discretion. GSAM leverages the resources of Goldman Sachs & Co. LLC subject to legal, internal and regulatory restrictions.
Money Market
Financial Square FundsSM
| ∎ | | Financial Square Treasury Solutions Fund1 |
| ∎ | | Financial Square Government Fund1 |
| ∎ | | Financial Square Money Market Fund2 |
| ∎ | | Financial Square Prime Obligations Fund2 |
| ∎ | | Financial Square Treasury Instruments Fund1 |
| ∎ | | Financial Square Treasury Obligations Fund1 |
| ∎ | | Financial Square Federal Instruments Fund1 |
Investor FundsSM
| ∎ | | Investor Money Market Fund3 |
| ∎ | | Investor Tax-Exempt Money Market Fund3 |
Fixed Income
Short Duration and Government
| ∎ | | High Quality Floating Rate Fund |
| ∎ | | Short-Term Conservative Income Fund |
| ∎ | | Short Duration Government Fund |
| ∎ | | Short Duration Income Fund |
| ∎ | | Inflation Protected Securities Fund |
Multi-Sector
| ∎ | | Global Core Fixed Income Fund4 |
Municipal and Tax-Free
| ∎ | | High Yield Municipal Fund |
| ∎ | | Dynamic Municipal Income Fund |
| ∎ | | Short Duration Tax-Free Fund |
| ∎ | | Municipal Income Completion Fund |
Single Sector
| ∎ | | Investment Grade Credit Fund |
| ∎ | | High Yield Floating Rate Fund |
| ∎ | | Emerging Markets Debt Fund |
| ∎ | | Local Emerging Markets Debt Fund |
Fixed Income Alternatives
| ∎ | | Long Short Credit Strategies Fund |
Fundamental Equity
| ∎ | | Small/Mid Cap Value Fund |
| ∎ | | Small/Mid Cap Growth Fund |
| ∎ | | Concentrated Growth Fund |
| ∎ | | Technology Opportunities Fund |
| ∎ | | Growth Opportunities Fund |
| ∎ | | Rising Dividend Growth Fund |
Tax-Advantaged Equity
| ∎ | | U.S. Tax-Managed Equity Fund |
| ∎ | | International Tax-Managed Equity Fund |
| ∎ | | U.S. Equity Dividend and Premium Fund |
| ∎ | | International Equity Dividend and Premium Fund |
Equity Insights
| ∎ | | Small Cap Equity Insights Fund |
| ∎ | | U.S. Equity Insights Fund |
| ∎ | | Small Cap Growth Insights Fund |
| ∎ | | Large Cap Growth Insights Fund |
| ∎ | | Large Cap Value Insights Fund |
| ∎ | | Small Cap Value Insights Fund |
| ∎ | | International Small Cap Insights Fund |
| ∎ | | International Equity Insights Fund |
| ∎ | | Emerging Markets Equity Insights Fund |
Fundamental Equity International
| ∎ | | International Equity Income Fund |
| ∎ | | International Equity ESG Fund |
| ∎ | | Emerging Markets Equity Fund |
| ∎ | | Imprint Emerging Markets Opportunities Fund6 |
| ∎ | | ESG Emerging Markets Equity Fund |
Alternative
| ∎ | | Real Estate Securities Fund |
| ∎ | | International Real Estate Securities Fund |
| ∎ | | Commodity Strategy Fund |
| ∎ | | Global Real Estate Securities Fund |
| ∎ | | Alternative Premia Fund |
| ∎ | | Absolute Return Tracker Fund |
| ∎ | | Managed Futures Strategy Fund |
| ∎ | | MLP Energy Infrastructure Fund |
| ∎ | | Multi-Manager Alternatives Fund |
| ∎ | | Global Infrastructure Fund |
Total Portfolio Solutions
| ∎ | | Global Managed Beta Fund |
| ∎ | | Multi-Manager Non-Core Fixed Income Fund |
| ∎ | | Multi-Manager U.S. Dynamic Equity Fund |
| ∎ | | Multi-Manager Global Equity Fund |
| ∎ | | Multi-Manager International Equity Fund |
| ∎ | | Tactical Tilt Overlay Fund |
| ∎ | | Balanced Strategy Portfolio |
| ∎ | | Multi-Manager U.S. Small Cap Equity Fund |
| ∎ | | Multi-Manager Real Assets Strategy Fund |
| ∎ | | Growth and Income Strategy Portfolio |
| ∎ | | Growth Strategy Portfolio |
| ∎ | | Dynamic Global Equity Fund |
| ∎ | | Satellite Strategies Portfolio |
| ∎ | | Enhanced Dividend Global Equity Portfolio |
| ∎ | | Tax-Advantaged Global Equity Portfolio |
| ∎ | | Strategic Factor Allocation Fund |
| ∎ | | Target Date Retirement Portfolio7 |
| ∎ | | Target Date 2025 Portfolio |
| ∎ | | Target Date 2030 Portfolio |
| ∎ | | Target Date 2035 Portfolio |
| ∎ | | Target Date 2040 Portfolio |
| ∎ | | Target Date 2045 Portfolio |
| ∎ | | Target Date 2050 Portfolio |
| ∎ | | Target Date 2055 Portfolio |
| ∎ | | Target Date 2060 Portfolio |
| ∎ | | GQG Partners International Opportunities Fund |
| 1 | | You could lose money by investing in the Fund. Although the Fund seeks to preserve the value of your investment at $1.00 per share, it cannot guarantee it will do so. An investment in the Fund is not a deposit of a bank and is not insured or guaranteed by the Federal Deposit Insurance Corporation or any other government agency. The Fund’s sponsor has no legal obligation to provide financial support to the Fund, and you should not expect that the sponsor will provide financial support to the Fund at any time. |
| 2 | | You could lose money by investing in the Fund. Because the share price of the Fund will fluctuate, when you sell your shares they may be worth more or less than what you originally paid for them. The Fund may impose a fee upon sale of your shares or may temporarily suspend your ability to sell shares if the Fund’s liquidity falls below required minimums because of market conditions or other factors. An investment in the Fund is not a deposit of a bank and is not insured or guaranteed by the Federal Deposit Insurance Corporation or any other government agency. The Fund’s sponsor has no legal obligation to provide financial support to the Fund, and you should not expect that the sponsor will provide financial support to the Fund at any time. |
| 3 | | You could lose money by investing in the Fund. Although the Fund seeks to preserve the value of your investment at $1.00 per share, it cannot guarantee it will do so. The Fund may impose a fee upon sale of your shares or may temporarily suspend your ability to sell shares if the Fund’s liquidity falls below required minimums because of market conditions or other factors. An investment in the Fund is not a deposit of a bank and is not insured or guaranteed by the Federal Deposit Insurance Corporation or any other government agency. The Fund’s sponsor has no legal obligation to provide financial support to the Fund, and you should not expect that the sponsor will provide financial support to the Fund at any time. |
| 4 | | Effective after the close of business on April 30, 2020, the Goldman Sachs Global Income Fund was renamed the Goldman Sachs Global Core Fixed Income Fund. |
| 5Effective | | after the close of business of November 20, 2019, the Goldman Sachs Asia Equity Fund was renamed the Goldman Sachs China Equity Fund. |
| 6Effective | | after the close of business on August 30, 2019, the Goldman Sachs N-11 Equity Fund was renamed the Goldman Sachs Imprint Emerging Markets Opportunities Fund. |
| 7Effective | | December 27, 2019, the Goldman Sachs Target Date 2020 Portfolio was renamed the Goldman Sachs Target Date Retirement Portfolio. |
| | | Financial Square FundsSM and Investor FundsSM are registered service marks of Goldman Sachs & Co. LLC. |
| * | | This list covers open-end funds only. Please visit our website at www.GSAMFUNDS.com to learn about our closed-end funds and exchange-traded funds. |
| | |
TRUSTEES Jessica Palmer,Chair Dwight L. Bush Kathryn A. Cassidy Diana M. Daniels Joaquin Delgado James A. McNamara Roy W. Templin Gregory G. Weaver | | OFFICERS James A. McNamara,President Joseph F. DiMaria,Principal Financial Officer, Principal Accounting Officer and Treasurer Caroline L. Kraus,Secretary |
| |
GOLDMAN SACHS & CO. LLC Distributor and Transfer Agent | | GOLDMAN SACHS ASSET MANAGEMENT, L.P. Investment Adviser |
Visit our web site atwww.GSAMFUNDS.com to obtain the most recentmonth-end returns.
Goldman Sachs Asset Management, L.P., 200 West Street, New York, New York 10282
The reports concerning the Funds included in this shareholder report may contain certain forward-looking statements about the factors that may affect the performance of the Funds in the future. These statements are based on Fund management’s predictions and expectations concerning certain future events and their expected impact on the Funds, such as performance of the economy as a whole and of specific industry sectors, changes in the levels of interest rates, the impact of developing world events, and other factors that may influence the future performance of the Funds. Management believes these forward-looking statements to be reasonable, although they are inherently uncertain and difficult to predict. Actual events may cause adjustments in portfolio management strategies from those currently expected to be employed.
A description of the policies and procedures that the Funds use to determine how to vote proxies relating to portfolio securities and information regarding how a Fund voted proxies relating to portfolio securities during the most recent12-month period ended June 30 is available (i) without charge, upon request by calling1-800-526-7384 (for Retail Shareholders) or1-800-621-2550 (for Institutional Shareholders); and (ii) on the Securities and Exchange Commission (“SEC”) web site at http://www.sec.gov.
The Funds will file their portfolio holdings for each month in a fiscal quarter within 60 days after the end of the relevant fiscal quarter on Form N-PORT. Portfolio holdings information for the third month of each fiscal quarter will be made available on the SEC’s web site at http://www.sec.gov. Portfolio holdings information may be obtained upon request and without charge by calling1-800-526-7384 (for Retail Shareholders) or1-800-621-2550 (for Institutional Shareholders).
Fund holdings and allocations shown are unaudited, and may not be representative of current or future investments. Fund holdings and allocations may not include the Fund’s entire investment portfolio, which may change at any time. Fund holdings should not be relied on in making investment decisions and should not be construed as research or investment advice regarding particular securities. Current and future holdings are subject to risk.
Economic and market forecasts presented herein reflect our judgment as of the date of this presentation and are subject to change without notice. These forecasts do not take into account the specific investment objectives, restrictions, tax and financial situation or other needs of any specific client. Actual data will vary and may not be reflected here. These forecasts are subject to high levels of uncertainty that may affect actual performance. Accordingly, these forecasts should be viewed as merely representative of a broad range of possible outcomes. These forecasts are estimated, based on assumptions, and are subject to significant revision and may change materially as economic and market conditions change. Goldman Sachs has no obligation to provide updates or changes to these forecasts. Case studies and examples are for illustrative purposes only.
The Global Industry Classification Standard (GICS) was developed by and is the exclusive property and a service mark of Morgan Stanley Capital International Inc. (MSCI) and Standard & Poor’s, a division of The McGraw-Hill Companies, Inc. (S&P) and is licensed for use by Goldman Sachs. Neither MSCI, S&P nor any other party involved in making or compiling the GICS or any GICS classifications makes any express or implied warranties or representations with respect to such standard or classification (or the results to be obtained by the use thereof), and all such parties hereby expressly disclaim all warranties of originality, accuracy, completeness, merchantability or fitness for a particular purpose with respect to any of such standard or classification. Without limiting any of the foregoing, in no event shall MSCI, S&P, any of their affiliates or any third party involved in making or compiling the GICS or any GICS classifications have any liability for any direct, indirect, special, punitive, consequential or any other damages (including lost profits) even if notified of the possibility of such damages.
The portfolio risk management process includes an effort to monitor and manage risk, but does not imply low risk.
This material is not authorized for distribution to prospective investors unless preceded or accompanied by a current prospectus or summary prospectus, if applicable. Investors should consider a Fund’s objective, risks, and charges and expenses, and read the summary prospectus, if available, and/or the prospectus carefully before investing or sending money. The summary prospectus, if available, and the prospectus contain this and other information about a Fund and may be obtained from your authorized dealer or from Goldman Sachs & Co. LLC by calling (retail –1-800-526-7384) (institutional –1-800-621-2550).
© 2020 Goldman Sachs. All rights reserved. 206043-OTU-1214524 DOMINSSAR-20
Goldman Sachs Funds

| | | | |
| | |
| Semi-Annual Report | | | | April 30, 2020 |
| | |
| | | | Fundamental Emerging Markets Equity Funds |
| | | | China Equity* |
| | | | Emerging Markets Equity |
| | | | ESG Emerging Markets Equity |
| | | | Imprint Emerging Markets Opportunities Fund** |
| | * | | Effective after the close of business on November 20, 2019, the Goldman Sachs Asia Equity Fund was renamed the Goldman Sachs China Equity Fund. | |
| | ** | | Effective after the close of business on August 30, 2019, The Goldman Sachs N-11 Equity Fund was renamed the Goldman Sachs Imprint Emerging Markets Opportunities Fund. | |
It is our intention that beginning on January 1, 2021, paper copies of the Funds’ annual and semi-annual shareholder reports will no longer be sent by mail, unless you specifically request paper copies of the reports from a Fund or from your financial intermediary. Instead, the reports will be made available on a website, and you will be notified by mail each time a report is posted and provided with a website link to access the report.
If you already elected to receive shareholder reports electronically, you will not be affected by this change and you need not take any action. At any time, you may elect to receive reports and certain communications from a Fund electronically by calling the applicable toll-free number below or by contacting your financial intermediary.
You may elect to receive all future shareholder reports in paper free of charge. If you hold shares of a Fund directly with the Fund’s transfer agent, you can inform the transfer agent that you wish to receive paper copies of reports by calling toll-free 800-621-2550 for Institutional, Service, Class R6 and Class P shareholders or 800-526-7384 for all other shareholders. If you hold shares of a Fund through a financial intermediary, please contact your financial intermediary to make this election. Your election to receive reports in paper will apply to all Goldman Sachs Funds held in your account if you invest through your financial intermediary or all Goldman Sachs Funds held with the Funds’ transfer agent if you invest directly with the transfer agent.

Goldman Sachs Fundamental Emerging Markets Equity Funds
| ∎ | | EMERGING MARKETS EQUITY |
| ∎ | | ESG EMERGING MARKETS EQUITY |
| ∎ | | IMPRINT EMERGING MARKETS OPPORTUNITIES |
| | | | |
| | | |
| NOT FDIC-INSURED | | May Lose Value | | No Bank Guarantee |
Goldman Sachs Fundamental Emerging Markets Equity Funds
Recent Market Events related to COVID-19
While this semi-annual report covers the six month period ended April 30, 2020, we want to describe some more recent events through the end of May.
An outbreak of a novel strain of coronavirus (COVID-19) has emerged globally. The outbreak of COVID-19 has prompted a number of measures to limit the spread, including travel and border restrictions, quarantines, curfews and restrictions on large gatherings. In turn, these resulted in lower consumer activity, diminished demand for a wide range of products and services, and disruption in manufacturing and supply chains. While governments have already taken unprecedented action to limit disruption to the financial system, global financial markets have experienced and may continue to experience significant volatility resulting from the spread of and subsequent intervening measures intended to limit the spread of COVID-19. The Fund could be negatively impacted if the value of a portfolio holding were harmed by such political or economic conditions, events, or actions. The full extent of the impact of COVID-19 on a Fund’s performance cannot be determined at this time and will depend on future developments, including the duration and the continued spread of the outbreak. Goldman Sachs Asset Management’s long-term commitment to you, our Fund shareholders, remains unchanged. We encourage you to maintain perspective and stay current with timely commentary and investment insights by visiting gsam.com.
i
FUND BASICS
China Equity Fund
as of April 30, 2020
| | | | | | | | | | |
| | PERFORMANCE REVIEW | |
| | | |
| | | November 1, 2019–April 30, 2020 | | Fund Total Return
(based on NAV)1 | | | MSCI® China All
Shares Index2 | |
| | Class A | | | 3.15 | % | | | 4.76 | % |
| | Class C | | | 2.77 | | | | 4.76 | |
| | Institutional | | | 3.35 | | | | 4.76 | |
| | Investor | | | 3.27 | | | | 4.76 | |
| | Class P | | | 3.34 | | | | 4.76 | |
| | | Class R6 | | | 3.34 | | | | 4.76 | |
| 1 | | The net asset value (“NAV”) represents the net assets of the class of the Fund(ex-dividend) divided by the total number of shares of the class outstanding. The Fund’s performance assumes the reinvestment of dividends and other distributions. The Fund’s performance does not reflect the deduction of any applicable sales charges. |
| 2 | | The MSCI China All Shares Index (Net, USD, Unhedged) captures large- and mid-cap representation across China A Shares, B Shares, H Shares, Red Chips, P-Chips and foreign listings. The MSCI China All Shares Index (Net, USD, Unhedged) aims to reflect the opportunity set of China share classes listed in Hong Kong, Shanghai, Shenzhen and outside of China. MSCI uses withholding tax rates applicable to Luxembourg holding companies, as Luxembourg applies the highest rates. The MSCI China All Shares Index (Net, USD, Unhedged) does not reflect any deductions of expenses associated with mutual funds such as management fees and other expenses. |
The returns set forth in the tables above represent past performance. Past performance does not guarantee future results. The Fund’s investment return and principal value will fluctuate so that an investor’s shares, when redeemed, may be worth more or less than their original cost. Current performance may be lower or higher than the performance quoted above. Please visit our web site at www.GSAMFUNDS.com to obtain the most recent month-end returns. Performance reflects applicable fee waivers and/or expense limitations in effect during the periods shown. In their absence, performance would be reduced. Returns do not reflect the deduction of taxes that a shareholder would pay on Fund distributions or the redemption of Fund shares.
| | | | | | | | | | |
| | TOP TEN HOLDINGS AS OF 4/30/203,4,5 |
| | | | |
| | | Holding | | % of Net
Assets | | | Line of Business | | Country |
| | | | |
| | Tencent Holdings Ltd. | | | 10.9 | % | | Media & Entertainment | | China |
| | Alibaba Group Holding Ltd. ADR | | | 6.9 | | | Retailing | | China |
| | Alibaba Group Holding Ltd. | | | 5.5 | | | Retailing | | China |
| | Kweichow Moutai Co. Ltd. Class A | | | 4.7 | | | Food Products | | China |
| | Ping An Insurance Group Co. of China Ltd. Class H | | | 3.6 | | | Insurance | | China |
| | China Merchants Bank Co. Ltd. Class H | | | 3.3 | | | Banks | | China |
| | Zhejiang Sanhua Intelligent Controls Co. Ltd. Class A | | | 2.3 | | | Capital Goods | | China |
| | Jiangsu Hengrui Medicine Co. Ltd. Class A | | | 2.2 | | | Pharmaceuticals, Biotechnology & Life Sciences | | China |
| | Shenzhen Inovance Technology Co. Ltd. Class A | | | 1.8 | | | Capital Goods | | China |
| | | CITIC Securities Co. Ltd. Class A | | | 1.6 | | | Diversified Financials | | China |
| 3 | | The top 10 holdings may not be representative of the Fund’s future investments. |
| 4 | | The Fund’s overall top 10 holdings differ from the table above due to the exclusion of the Goldman Sachs Financial Square Government Fund (a short-term investment fund), which represents approximately 2.3% of the Fund’s net assets as of 4/30/20. |
| 5 | | The line of business for each holding is reported at the industry or sub-industry level. |
1
FUND BASICS
|
| FUND VS. BENCHMARK SECTOR ALLOCATIONS6 |
|
| As of April 30, 2020 |
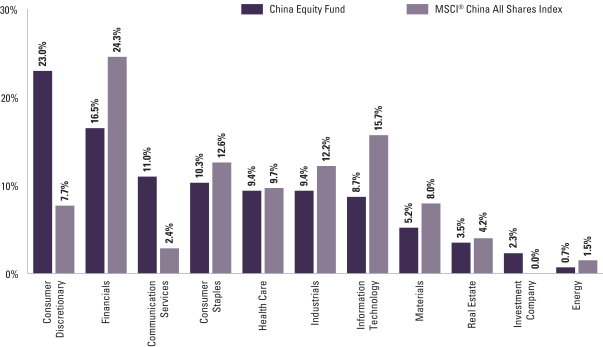
| 6 | | The Fund is actively managed and, as such, its composition may differ over time. Consequently, the Fund’s overall sector allocations may differ from percentages contained in the graph above. The graph categorizes investments using Global Industry Classification Standard (“GICS”); however, the sector classifications used by the portfolio management team may differ from GICS. The percentage shown for each investment category reflects the value of investments in that category as a percentage of market value. Underlying sector allocations of exchange traded funds and investment companies held by the Fund are not reflected in the graph above. |
For more information about your Fund, please refer to www.GSAMFUNDS.com. There, you can learn more about your Fund’s investment strategies, holdings, and performance.
2
FUND BASICS
Emerging Markets Equity Fund
as of April 30, 2020
| | | | | | | | | | |
| | PERFORMANCE REVIEW | |
| | | |
| | | November 1, 2019–April 30, 2020 | | Fund Total Return
(based on NAV)1 | | | MSCI® Emerging
Markets Index2 | |
| | | |
| | Class A | | | -9.24 | % | | | -10.50 | % |
| | Class C | | | -9.62 | | | | -10.50 | |
| | Institutional | | | -9.13 | | | | -10.50 | |
| | Service | | | -9.33 | | | | -10.50 | |
| | Investor | | | -9.15 | | | | -10.50 | |
| | Class P | | | -9.09 | | | | -10.50 | |
| | | Class R6 | | | -9.09 | | | | -10.50 | |
| 1 | | The net asset value (“NAV”) represents the net assets of the class of the Fund(ex-dividend) divided by the total number of shares of the class outstanding. The Fund’s performance assumes the reinvestment of dividends and other distributions. The Fund’s performance does not reflect the deduction of any applicable sales charges. |
| 2 | | The MSCI® Emerging Markets Index (Net, USD, Unhedged) is a free float-adjusted market capitalization index that is designed to measure equity market performance of emerging markets. As of April 30, 2020 the MSCI® Emerging Markets Index consists of the following 24 emerging market country indexes: Argentina, Brazil, Chile, China, Colombia, Czech Republic, Egypt, Greece, Hungary, India, Indonesia, Korea, Malaysia, Mexico, Pakistan, Peru, Philippines, Poland, Qatar, Russia, Saudi Arabia, South Africa, Taiwan, Thailand, Turkey and United Arab Emirates. For this Index, the dividend is reinvested after deduction of withholding tax, applying the rate to nonresident individuals who do not benefit from double taxation treaties. MSCI Barra uses withholding tax rates applicable to Luxembourg holding companies, as Luxembourg applies the highest rates. The MSCI Emerging Markets Index does not reflect any deductions of expenses associated with mutual funds such as management fees and other expenses. It is not possible to invest directly in an index. |
The returns set forth in the tables above represent past performance. Past performance does not guarantee future results. The Fund’s investment return and principal value will fluctuate so that an investor’s shares, when redeemed, may be worth more or less than their original cost. Current performance may be lower or higher than the performance quoted above. Please visit our web site at www.GSAMFUNDS.com to obtain the most recent month-end returns.Performance reflects applicable fee waivers and/or expense limitations in effect during the periods shown. In their absence, performance would be reduced. Returns do not reflect the deduction of taxes that a shareholder would pay on Fund distributions or the redemption of Fund shares.
| | | | | | | | | | |
| | TOP TEN HOLDINGS AS OF 4/30/203,4 |
| | | | |
| | | Holding | | % of Net
Assets | | | Line of Business | | Country |
| | | | |
| | Tencent Holdings Ltd. | | | 8.6 | % | | Media & Entertainment | | China |
| | Alibaba Group Holding Ltd. ADR | | | 7.4 | | | Retailing | | China |
| | Taiwan Semiconductor Manufacturing Co. Ltd. | | | 6.0 | | | Semiconductors & Semiconductor Equipment | | Taiwan |
| | Samsung Electronics Co. Ltd. | | | 4.5 | | | Technology Hardware & Equipment | | South Korea |
| | Kweichow Moutai Co. Ltd. Class A | | | 3.1 | | | Food Products | | China |
| | AIA Group Ltd. | | | 3.0 | | | Insurance | | Hong Kong |
| | Ping An Insurance Group Co. of China Ltd. Class H | | | 2.3 | | | Insurance | | China |
| | NCSoft Corp. | | | 1.9 | | | Media & Entertainment | | South Korea |
| | SK Hynix, Inc. | | | 1.8 | | | Semiconductors & Semiconductor Equipment | | South Korea |
| | | China Merchants Bank Co. Ltd. Class H | | | 1.7 | | | Banks | | China |
| 3 | | The top 10 holdings may not be representative of the Fund’s future investments. |
| 4 | | The line of business for each holding is reported at the industry or sub-industry level. |
3
FUND BASICS
|
| FUND VS. BENCHMARK SECTOR ALLOCATIONS5 |
|
| As of April 30, 2020 |
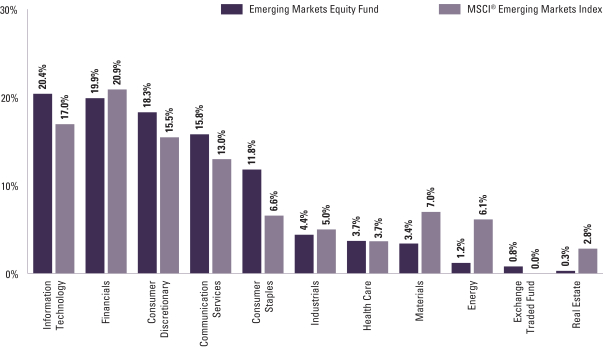
| 5 | | The Fund is actively managed and, as such, its composition may differ over time. Consequently, the Fund’s overall sector allocations may differ from percentages contained in the graph above. The graph categorizes investments using Global Industry Classification Standard (“GICS”); however, the sector classifications used by the portfolio management team may differ from GICS. The percentage shown for each investment category reflects the value of investments in that category as a percentage of market value. Underlying sector allocations of exchange traded funds and investment companies held by the Fund are not reflected in the graph above. |
For more information about your Fund, please refer to www.GSAMFUNDS.com. There, you can learn more about your Fund’s investment strategies, holdings, and performance.
4
FUND BASICS
ESG Emerging Markets Equity Fund
as of April 30, 2020
| | | | | | | | | | |
| | PERFORMANCE REVIEW | |
| | | |
| | | November 1, 2019–April 30, 2020 | | Fund Total Return
(based on NAV)1 | | | MSCI® Emerging
Markets Index2 | |
| | | |
| | Class A | | | -8.46 | % | | | -10.50 | % |
| | Class C | | | -8.81 | | | | -10.50 | |
| | Institutional | | | -8.32 | | | | -10.50 | |
| | Investor | | | -8.34 | | | | -10.50 | |
| | Class R | | | -8.65 | | | | -10.50 | |
| | | Class R6 | | | -8.31 | | | | -10.50 | |
| | | |
| | | January 21, 2020–April 30, 2020 | | | | | | |
| | | |
| | | Class P | | | -16.56 | | | | -17.53 | |
| 1 | | The net asset value (“NAV”) represents the net assets of the class of the Fund(ex-dividend) divided by the total number of shares of the class outstanding. The Fund’s performance assumes the reinvestment of dividends and other distributions. The Fund’s performance does not reflect the deduction of any applicable sales charges. |
| 2 | | The MSCI® Emerging Markets Index (Net, USD, Unhedged) is a free float-adjusted market capitalization index that is designed to measure equity market performance of emerging markets. As of April 30, 2020 the MSCI® Emerging Markets Index consists of the following 24 emerging market country indexes: Argentina, Brazil, Chile, China, Colombia, Czech Republic, Egypt, Greece, Hungary, India, Indonesia, Korea, Malaysia, Mexico, Pakistan, Peru, Philippines, Poland, Qatar, Russia, Saudi Arabia, South Africa, Taiwan, Thailand, Turkey and United Arab Emirates. For this Index, the dividend is reinvested after deduction of withholding tax, applying the rate to nonresident individuals who do not benefit from double taxation treaties. MSCI Barra uses withholding tax rates applicable to Luxembourg holding companies, as Luxembourg applies the highest rates. The MSCI Emerging Markets Index does not reflect any deductions of expenses associated with mutual funds such as management fees and other expenses. It is not possible to invest directly in an index. |
The returns set forth in the tables above represent past performance. Past performance does not guarantee future results. The Fund’s investment return and principal value will fluctuate so that an investor’s shares, when redeemed, may be worth more or less than their original cost. Current performance may be lower or higher than the performance quoted above. Please visit our web site at www.GSAMFUNDS.com to obtain the most recent month-end returns. Performance reflects applicable fee waivers and/or expense limitations in effect during the periods shown. In their absence, performance would be reduced. Returns do not reflect the deduction of taxes that a shareholder would pay on Fund distributions or the redemption of Fund shares.
| | | | | | | | | | |
| | TOP TEN HOLDINGS AS OF 4/30/203,4 |
| | | | |
| | | Holding | | % of Net Assets | | | Line of Business | | Country |
| | | | |
| | Tencent Holdings Ltd. | | | 9.1 | % | | Media & Entertainment | | China |
| | Alibaba Group Holding Ltd. ADR | | | 7.1 | | | Retailing | | China |
| | Taiwan Semiconductor Manufacturing Co. Ltd. | | | 6.3 | | | Semiconductors & Semiconductor Equipment | | Taiwan |
| | Samsung Electronics Co. Ltd. | | | 5.1 | | | Technology Hardware & Equipment | | South Korea |
| | AIA Group Ltd. | | | 3.3 | | | Insurance | | Hong Kong |
| | Ping An Insurance Group Co. of China Ltd. Class H | | | 3.2 | | | Insurance | | China |
| | Largan Precision Co. Ltd. | | | 2.0 | | | Technology Hardware & Equipment | | Taiwan |
| | MercadoLibre, Inc. | | | 1.9 | | | Retailing | | Argentina |
| | Sberbank of Russia PJSC ADR | | | 1.8 | | | Banks | | Russia |
| | | NAVER Corp. | | | 1.8 | | | Media & Entertainment | | South Korea |
| 3 | | The top 10 holdings may not be representative of the Fund’s future investments. |
| 4 | | The line of business for each holding is reported at the industry or sub-industry level. |
5
FUND BASICS
|
| FUND VS. BENCHMARK SECTOR ALLOCATIONS5 |
|
| As of April 30, 2020 |
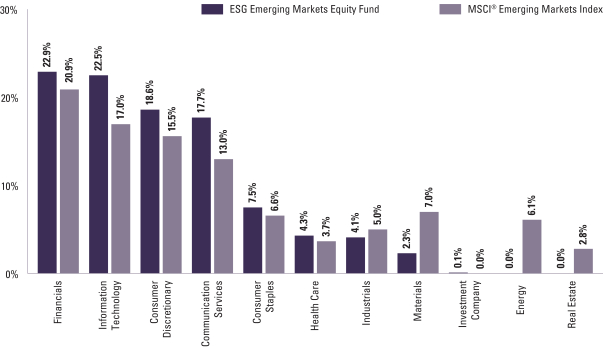
| 5 | | The Fund is actively managed and, as such, its composition may differ over time. Consequently, the Fund’s overall sector allocations may differ from percentages contained in the graph above. The graph categorizes investments using Global Industry Classification Standard (“GICS”); however, the sector classifications used by the portfolio management team may differ from GICS. The percentage shown for each investment category reflects the value of investments in that category as a percentage of market value. Underlying sector allocations of exchange traded funds and investment companies held by the Fund are not reflected in the graph above. |
For more information about your Fund, please refer to www.GSAMFUNDS.com. There, you can learn more about your Fund’s investment strategies, holdings, and performance.
6
FUND BASICS
Imprint Emerging Markets Opportunities Fund
as of April 30, 2020
| | | | | | | | | | |
| | PERFORMANCE REVIEW | |
| | | |
| | | November 1, 2019–April 30, 2020 | | Fund Total Return
(based on NAV)1 | | | MSCI® Emerging
Markets Index2 | |
| | | |
| | Class A | | | -17.95 | % | | | -10.50 | % |
| | Class C | | | -18.19 | | | | -10.50 | |
| | Institutional | | | -17.71 | | | | -10.50 | |
| | Investor | | | -17.85 | | | | -10.50 | |
| | Class P | | | -17.69 | | | | -10.50 | |
| | | Class R6 | | | -17.80 | | | | -10.50 | |
| 1 | | The net asset value (“NAV”) represents the net assets of the class of the Fund(ex-dividend) divided by the total number of shares of the class outstanding. The Fund’s performance assumes the reinvestment of dividends and other distributions. The Fund’s performance does not reflect the deduction of any applicable sales charges. |
| 2 | | The MSCI® Emerging Markets Index (Net, USD, Unhedged) is a free float-adjusted market capitalization index that is designed to measure equity market performance of emerging markets. As of April 30, 2020 the MSCI® Emerging Markets Index consists of the following 24 emerging market country indexes: Argentina, Brazil, Chile, China, Colombia, Czech Republic, Egypt, Greece, Hungary, India, Indonesia, Korea, Malaysia, Mexico, Pakistan, Peru, Philippines, Poland, Qatar, Russia, Saudi Arabia, South Africa, Taiwan, Thailand, Turkey and United Arab Emirates. For this Index, the dividend is reinvested after deduction of withholding tax, applying the rate to nonresident individuals who do not benefit from double taxation treaties. MSCI Barra uses withholding tax rates applicable to Luxembourg holding companies, as Luxembourg applies the highest rates. The MSCI Emerging Markets Index does not reflect any deductions of expenses associated with mutual funds such as management fees and other expenses. It is not possible to invest directly in an index. |
The returns set forth in the tables above represent past performance. Past performance does not guarantee future results. The Fund’s investment return and principal value will fluctuate so that an investor’s shares, when redeemed, may be worth more or less than their original cost. Current performance may be lower or higher than the performance quoted above. Please visit our web site at www.GSAMFUNDS.com to obtain the most recent month-end returns. Performance reflects applicable fee waivers and/or expense limitations in effect during the periods shown. In their absence, performance would be reduced. Returns do not reflect the deduction of taxes that a shareholder would pay on Fund distributions or the redemption of Fund shares.
| | | | | | | | | | |
| | TOP TEN HOLDINGS AS OF 4/30/203 |
| | | | |
| | | Holding | | % of Net Assets | | | Line of Business | | Country |
| | | | |
| | Naspers Ltd. Class N | | | 11.6 | % | | Retailing | | South Africa |
| | Emirates NBD Bank PJSC | | | 6.7 | | | Banks | | United Arab Emirates |
| | Delta Electronics, Inc. | | | 5.6 | | | Technology Hardware & Equipment | | Taiwan |
| | Shenzhen Inovance Technology Co. Ltd. Class A | | | 4.7 | | | Capital Goods | | China |
| | FPT Corp. | | | 4.6 | | | Technology Hardware & Equipment | | Vietnam |
| | Haier Smart Home Co. Ltd. Class A | | | 4.5 | | | Consumer Durables & Apparel | | China |
| | 58.com, Inc. ADR | | | 4.2 | | | Media & Entertainment | | China |
| | Suzuki Motor Corp. | | | 4.1 | | | Automobiles & Components | | Japan |
| | Cosmax, Inc. | | | 3.8 | | | Household & Personal Products | | South Korea |
| | | AIA Group Ltd. | | | 3.5 | | | Insurance | | Hong Kong |
| 3 | | The top 10 holdings may not be representative of the Fund’s future investments. |
7
FUND BASICS
|
| FUND VS. BENCHMARK SECTOR ALLOCATIONS4 |
|
| As of April 30, 2020 |
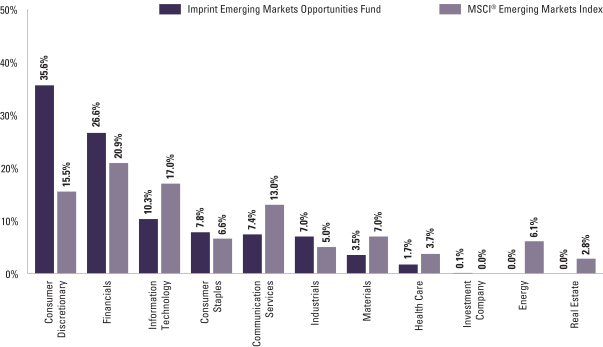
| 4 | | The Fund is actively managed and, as such, its composition may differ over time. Consequently, the Fund’s overall sector allocations may differ from percentages contained in the graph above. The graph categorizes investments using Global Industry Classification Standard (“GICS”); however, the sector classifications used by the portfolio management team may differ from GICS. The percentage shown for each investment category reflects the value of investments in that category as a percentage of market value (excluding investments in the securities lending reinvestment vehicle, if any). Underlying sector allocations of exchange traded funds and investment companies held by the Fund are not reflected in the graph above. Investments in the securities lending reinvestment vehicle represented 2.9% of the Fund’s net assets at April 30, 2020. |
For more information about your Fund, please refer to www.GSAMFUNDS.com. There, you can learn more about your Fund’s investment strategies, holdings, and performance.
8
GOLDMAN SACHS CHINA EQUITY FUND
Schedule of Investments
April 30, 2020 (Unaudited)
| | | | | | | | |
| Shares | | | Description | | Value | |
|
| Common Stocks – 96.8% | |
| China – 92.5% | |
| | 83,234 | | | Aier Eye Hospital Group Co. Ltd. Class A (Health Care Equipment & Services) | | $ | 515,902 | |
| | 133,100 | | | Alibaba Group Holding Ltd. (Retailing)* | | | 3,377,975 | |
| | 21,046 | | | Alibaba Group Holding Ltd. ADR (Retailing)* | | | 4,265,393 | |
| | 123,300 | | | Anhui Conch Cement Co. Ltd. Class H (Materials) | | | 972,267 | |
| | 270,256 | | | Bank of Ningbo Co. Ltd. Class A (Banks) | | | 987,309 | |
| | 484,000 | | | China Construction Bank Corp. Class H (Banks) | | | 388,489 | |
| | 32,025 | | | China International Travel Service Corp. Ltd. Class A (Retailing) | | | 410,519 | |
| | 389,000 | | | China Life Insurance Co. Ltd. Class H (Insurance) | | | 829,620 | |
| | 221,000 | | | China Mengniu Dairy Co. Ltd. (Food Products)* | | | 782,585 | |
| | 81,000 | | | China Merchants Bank Co. Ltd. Class A (Banks) | | | 398,923 | |
| | 429,500 | | | China Merchants Bank Co. Ltd. Class H (Banks) | | | 2,032,528 | |
| | 194,000 | | | China Oilfield Services Ltd. Class H (Energy) | | | 151,109 | |
| | 560,000 | | | China Resources Cement Holdings Ltd. (Materials) | | | 761,995 | |
| | 132,000 | | | China Resources Land Ltd. (Real Estate) | | | 545,451 | |
| | 265,400 | | | China Vanke Co. Ltd. Class A (Real Estate) | | | 995,910 | |
| | 195,600 | | | China Vanke Co. Ltd. Class H (Real Estate) | | | 657,359 | |
| | 305,359 | | | CITIC Securities Co. Ltd. Class A (Diversified Financials) | | | 1,010,207 | |
| | 40,198 | | | Contemporary Amperex Technology Co. Ltd. Class A (Capital Goods) | | | 797,782 | |
| | 422,000 | | | Geely Automobile Holdings Ltd. (Automobiles & Components) | | | 656,431 | |
| | 72,665 | | | Gree Electric Appliances, Inc. of Zhuhai Class A (Consumer Durables & Apparel) | | | 555,930 | |
| | 95,000 | | | Haidilao International Holding Ltd. (Consumer Services)(a) | | | 411,704 | |
| | 37,591 | | | Huami Corp. ADR (Technology Hardware & Equipment)* | | | 474,398 | |
| | 520,000 | | | Industrial & Commercial Bank of China Ltd. Class H (Banks) | | | 348,665 | |
| | 774,247 | | | Jiangsu Changshu Rural Commercial Bank Co. Ltd. Class A (Banks) | | | 777,679 | |
| | 103,038 | | | Jiangsu Hengrui Medicine Co. Ltd. Class A (Pharmaceuticals, Biotechnology & Life Sciences)* | | | 1,340,062 | |
| | 71,536 | | | Juewei Food Co. Ltd. Class A (Food, Beverage & Tobacco) | | | 532,754 | |
| | 16,240 | | | Kweichow Moutai Co. Ltd. Class A (Food, Beverage & Tobacco) | | | 2,893,057 | |
| | 558,000 | | | Lenovo Group Ltd. (Technology Hardware & Equipment) | | | 301,430 | |
| | |
|
| Common Stocks – (continued) | |
| China – (continued) | |
| | 47,503 | | | LexinFintech Holdings Ltd. ADR (Diversified Financials)* | | | 400,450 | |
| | 135,522 | | | Luxshare Precision Industry Co. Ltd. Class A (Technology Hardware & Equipment) | | | 893,628 | |
| | 51,100 | | | Meituan Dianping Class B (Retailing)* | | | 684,182 | |
| | 64,600 | | | Midea Group Co. Ltd. Class A (Consumer Durables & Apparel) | | | 484,075 | |
| | 264,000 | | | Minth Group Ltd. (Automobiles & Components) | | | 634,821 | |
| | 183,666 | | | NARI Technology Co. Ltd. Class A (Capital Goods) | | | 518,394 | |
| | 6,675 | | | New Oriental Education & Technology Group, Inc. ADR (Consumer Services)* | | | 852,131 | |
| | 10,200 | | | Ping An Insurance Group Co. of China Ltd. Class A (Insurance) | | | 106,277 | |
| | 216,000 | | | Ping An Insurance Group Co. of China Ltd. Class H (Insurance) | | | 2,198,072 | |
| | 196,800 | | | Sany Heavy Industry Co. Ltd. Class A (Capital Goods) | | | 540,291 | |
| | 43,200 | | | Shanghai International Airport Co. Ltd. Class A (Transportation) | | | 428,454 | |
| | 56,329 | | | Shanghai Putailai New Energy Technology Co. Ltd. Class A (Materials)* | | | 605,388 | |
| | 236,752 | | | Shenzhen Inovance Technology Co. Ltd. Class A (Capital Goods) | | | 1,087,208 | |
| | 38,900 | | | Shenzhen Kangtai Biological Products Co. Ltd. Class A (Pharmaceuticals, Biotechnology & Life Sciences) | | | 728,062 | |
| | 23,700 | | | Shenzhen MindrayBio-Medical Electronics Co. Ltd. Class A (Health Care Equipment & Services) | | | 849,123 | |
| | 104,174 | | | Shenzhen Sunway Communication Co. Ltd. Class A (Technology Hardware & Equipment) | | | 597,089 | |
| | 48,400 | | | Shenzhou International Group Holdings Ltd. (Consumer Durables & Apparel) | | | 558,615 | |
| | 142,703 | | | Songcheng Performance Development Co. Ltd. Class A (Consumer Services) | | | 598,817 | |
| | 15,400 | | | Sunny Optical Technology Group Co. Ltd. (Technology Hardware & Equipment) | | | 214,453 | |
| | 4,687 | | | TAL Education Group ADR (Consumer Services)* | | | 253,989 | |
| | 127,800 | | | Tencent Holdings Ltd. (Media & Entertainment) | | | 6,718,374 | |
| | 146,000 | | | Tsingtao Brewery Co. Ltd. Class H (Food, Beverage & Tobacco) | | | 886,939 | |
| | 241,506 | | | Universal Scientific Industrial Shanghai Co. Ltd. Class A (Technology Hardware & Equipment) | | | 601,337 | |
| | 533,000 | | | Weichai Power Co. Ltd. Class H (Capital Goods) | | | 936,486 | |
| | 131,400 | | | Wens Foodstuffs Group Co. Ltd. Class A (Food, Beverage & Tobacco) | | | 558,666 | |
| | |
| | |
| The accompanying notes are an integral part of these financial statements. | | 9 |
GOLDMAN SACHS CHINA EQUITY FUND
Schedule of Investments(continued)
April 30, 2020 (Unaudited)
| | | | | | | | |
| Shares | | | Description | | Value | |
|
| Common Stocks – (continued) | |
| China – (continued) | |
| | 44,300 | | | Wuhan Jingce Electronic Group Co. Ltd. Class A (Technology Hardware & Equipment) | | $ | 419,161 | |
| | 71,100 | | | WuXi AppTec Co. Ltd. Class H (Pharmaceuticals, Biotechnology & Life Sciences)(a) | | | 1,002,417 | |
| | 47,000 | | | Wuxi Biologics Cayman, Inc. (Pharmaceuticals, Biotechnology & Life Sciences)*(a) | | | 731,622 | |
| | 1,260,000 | | | Xinyi Solar Holdings Ltd. (Semiconductors & Semiconductor Equipment) | | | 799,661 | |
| | 79,600 | | | Yantai Jereh Oilfield Services Group Co. Ltd. Class A (Energy) | | | 278,471 | |
| | 51,200 | | | Yifeng Pharmacy Chain Co. Ltd. Class A (Food & Staples Retailing) | | | 684,045 | |
| | 108,120 | | | Yunnan Energy New Material Co. Ltd. (Materials) | | | 819,757 | |
| | 466,630 | | | Zhejiang Sanhua Intelligent Controls Co. Ltd. Class A (Capital Goods) | | | 1,430,252 | |
| | | | | | | | |
| | | | | | | 57,274,140 | |
| | |
| Hong Kong – 3.2% | | | |
| | 42,836 | | | AIA Group Ltd. (Insurance) | | | 393,139 | |
| | 31,600 | | | ASM Pacific Technology Ltd. (Semiconductors & Semiconductor Equipment) | | | 319,309 | |
| | 9,201 | | | Hong Kong Exchanges & Clearing Ltd. (Diversified Financials) | | | 295,004 | |
| | 419,000 | | | Sino Biopharmaceutical Ltd. (Pharmaceuticals, Biotechnology & Life Sciences) | | | 610,734 | |
| | 294,000 | | | Xinyi Glass Holdings Ltd. (Automobiles & Components) | | | 340,498 | |
| | | | | | | | |
| | | | | | | 1,958,684 | |
| | |
| Taiwan – 1.1% | |
| | 41,000 | | | MediaTek, Inc. (Semiconductors & Semiconductor Equipment)* | | | 566,146 | |
| | 23,000 | | | Novatek Microelectronics Corp. (Semiconductors & Semiconductor Equipment)* | | | 143,036 | |
| | | | | | | | |
| | | | | | | 709,182 | |
| | |
| Vietnam – 0.0% | | | |
| | 6 | | | Vietnam Dairy Products JSC (Food, Beverage & Tobacco) | | | 25 | |
| | |
| TOTAL COMMON STOCKS
(Cost $54,476,414) | | $ | 59,942,031 | |
| | |
| Shares | | | Dividend Rate | | Value | |
|
| Investment Company(b) – 2.3% | |
| Goldman Sachs Financial Square Government Fund –
Institutional Shares |
|
| | 1,399,012 | | | 0.233% | | $ | 1,399,012 | |
| | (Cost $1,399,012) | | | | |
| | |
| | TOTAL INVESTMENTS – 99.1% | | | | |
| | (Cost $55,875,426) | | $ | 61,341,043 | |
| | |
| OTHER ASSETS IN EXCESS OF
LIABILITIES – 0.9% | | | 572,468 | |
| | |
| | NET ASSETS – 100.0% | | $ | 61,913,511 | |
| | |
| | |
|
| The percentage shown for each investment category reflects the value of investments in that category as a percentage of net assets. |
| |
* | | Non-income producing security. |
| |
(a) | | Exempt from registration under Rule 144A of the Securities Act of 1933. |
| |
(b) | | Represents an Affiliated Issuer. |
| | | | |
|
Investment Abbreviation: |
ADR | | —American Depositary Receipt |
|
| | |
| 10 | | The accompanying notes are an integral part of these financial statements. |
GOLDMAN SACHS EMERGING MARKETS EQUITY FUND
Schedule of Investments
April 30, 2020 (Unaudited)
| | | | | | | | |
| Shares | | | Description | | Value | |
|
| Common Stocks – 99.1% | |
| Argentina – 1.3% | |
| | 40,885 | | | MercadoLibre, Inc. (Retailing)* | | $ | 23,856,806 | |
| | |
| Brazil – 4.2% | |
| | 2,835,800 | | | Atacadao SA (Food & Staples Retailing)* | | | 10,429,761 | |
| | 1,510,900 | | | B3 SA – Brasil Bolsa Balcao (Diversified Financials) | | | 10,674,852 | |
| | 304,430 | | | Banco Bradesco SA ADR (Banks) | | | 1,071,593 | |
| | 4,757,868 | | | Banco Bradesco SA (Preference) (Banks)(a) | | | 16,755,213 | |
| | 895,062 | | | Banco Pan SA (Preference) (Banks)*(a) | | | 827,923 | |
| | 2,234,100 | | | Fleury SA (Health Care Equipment & Services) | | | 9,367,123 | |
| | 287,766 | | | Pagseguro Digital Ltd. Class A (Software & Services)* | | | 7,289,113 | |
| | 2,992,500 | | | Sao Martinho SA (Food Products)* | | | 10,510,813 | |
| | 571,500 | | | TOTVS SA (Software & Services) | | | 6,216,412 | |
| | 2,895,783 | | | Wiz Solucoes e Corretagem de Seguros SA (Insurance) | | | 4,856,570 | |
| | | | | | | | |
| | | | | | | 77,999,373 | |
| | |
| China – 37.3% | |
| | 209,513 | | | 58.com, Inc. ADR (Media & Entertainment)* | | | 10,884,200 | |
| | 671,037 | | | Alibaba Group Holding Ltd. ADR (Retailing)* | | | 135,999,069 | |
| | 2,281,000 | | | Anhui Conch Cement Co. Ltd. Class H (Materials) | | | 17,986,553 | |
| | 1,813,000 | | | ANTA Sports Products Ltd. (Consumer Durables & Apparel) | | | 15,439,577 | |
| | 3,272,000 | | | China Mengniu Dairy Co. Ltd. (Food Products)* | | | 11,586,509 | |
| | 6,652,000 | | | China Merchants Bank Co. Ltd. Class H (Banks) | | | 31,479,342 | |
| | 385,779 | | | Contemporary Amperex Technology Co. Ltd. Class A (Capital Goods) | | | 7,656,287 | |
| | 1,119,977 | | | Gree Electric Appliances, Inc. of Zhuhai Class A (Consumer Durables & Apparel) | | | 8,568,482 | |
| | 743,324 | | | Huami Corp. ADR (Technology Hardware & Equipment)* | | | 9,380,749 | |
| | 321,281 | | | Kweichow Moutai Co. Ltd. Class A (Food, Beverage & Tobacco) | | | 57,234,258 | |
| | 876,060 | | | LexinFintech Holdings Ltd. ADR (Diversified Financials)* | | | 7,385,186 | |
| | 1,206,800 | | | Meituan Dianping Class B (Retailing)* | | | 16,157,951 | |
| | 3,958,000 | | | Minth Group Ltd. (Automobiles & Components) | | | 9,517,510 | |
| | 3,366,801 | | | NARI Technology Co. Ltd. Class A (Capital Goods) | | | 9,502,739 | |
| | 159,830 | | | New Oriental Education & Technology Group, Inc. ADR (Consumer Services)* | | | 20,403,898 | |
| | |
|
| Common Stocks – (continued) | |
| China – (continued) | |
| | 4,915,000 | | | Nexteer Automotive Group Ltd. (Automobiles & Components) | | | 2,525,978 | |
| | 4,876,000 | | | Ping An Insurance Group Co. of China Ltd. Class H (Insurance) | | | 49,726,657 | |
| | 1,086,867 | | | Shanghai International Airport Co. Ltd. Class A (Transportation) | | | 10,779,467 | |
| | 405,497 | | | Silergy Corp. (Semiconductors & Semiconductor Equipment) | | | 16,109,724 | |
| | 1,174,400 | | | Sunny Optical Technology Group Co. Ltd. (Technology Hardware & Equipment) | | | 16,354,141 | |
| | 282,526 | | | TAL Education Group ADR (Consumer Services)* | | | 15,310,084 | |
| | 3,016,200 | | | Tencent Holdings Ltd. (Media & Entertainment) | | | 158,559,939 | |
| | 7,527,000 | | | Topsports International Holdings Ltd. (Retailing)(b) | | | 9,515,356 | |
| | 1,224,580 | | | WuXi AppTec Co. Ltd. Class H (Pharmaceuticals, Biotechnology & Life Sciences)(b) | | | 17,264,973 | |
| | 14,362,000 | | | Xinyi Solar Holdings Ltd. (Semiconductors & Semiconductor Equipment) | | | 9,114,862 | |
| | 3,323,848 | | | Zhejiang Sanhua Intelligent Controls Co. Ltd. Class A (Capital Goods) | | | 10,187,817 | |
| | | | | | | | |
| | | | | | | 684,631,308 | |
| | |
| Colombia – 0.2% | |
| | 532,763 | | | Banco Davivienda SA (Preference) (Banks)(a) | | | 3,864,853 | |
| | |
| Czech Republic – 0.5% | |
| | 4,310,014 | | | Moneta Money Bank A/S (Banks)(b) | | | 8,953,891 | |
| | |
| Egypt – 0.4% | |
| | 1,693,572 | | | Commercial International Bank Egypt SAE (Registered) GDR (Banks) | | | 6,494,048 | |
| | |
| Greece – 1.2% | |
| | 979,358 | | | Hellenic Exchanges – Athens Stock Exchange SA (Diversified Financials)* | | | 3,650,228 | |
| | 596,724 | | | JUMBO SA (Retailing) | | | 9,338,685 | |
| | 1,082,523 | | | Sarantis SA (Household & Personal Products) | | | 9,253,006 | |
| | | | | | | | |
| | | | | | | 22,241,919 | |
| | |
| Hong Kong – 5.6% | |
| | 5,960,600 | | | AIA Group Ltd. (Insurance) | | | 54,705,012 | |
| | 620,713 | | | Hong Kong Exchanges & Clearing Ltd. (Diversified Financials) | | | 19,901,403 | |
| | 332,200 | | | IMAX China Holding, Inc. (Media & Entertainment)(b) | | | 500,496 | |
| | |
| | |
| The accompanying notes are an integral part of these financial statements. | | 11 |
GOLDMAN SACHS EMERGING MARKETS EQUITY FUND
Schedule of Investments(continued)
April 30, 2020 (Unaudited)
| | | | | | | | |
| Shares | | | Description | | Value | |
|
| Common Stocks – (continued) | |
| Hong Kong – (continued) | |
| | 11,168,000 | | | Sino Biopharmaceutical Ltd. (Pharmaceuticals, Biotechnology & Life Sciences) | | $ | 16,278,468 | |
| | 1,444,000 | | | Techtronic Industries Co. Ltd. (Capital Goods) | | | 10,949,146 | |
| | | | | | | | |
| | | | | | | 102,334,525 | |
| | |
| India – 11.4% | |
| | 28,850 | | | Abbott India Ltd. (Pharmaceuticals, Biotechnology & Life Sciences) | | | 6,758,656 | |
| | 644,565 | | | Aditya Birla Fashion and Retail Ltd. (Consumer Durables & Apparel)* | | | 984,043 | |
| | 400,891 | | | AIA Engineering Ltd. (Capital Goods) | | | 8,531,861 | |
| | 435,918 | | | Amber Enterprises India Ltd. (Consumer Durables & Apparel) | | | 6,179,705 | |
| | 97,517 | | | Atul Ltd. (Materials) | | | 6,282,688 | |
| | 487,147 | | | Avenue Supermarts Ltd. (Food & Staples Retailing)*(b) | | | 15,268,501 | |
| | 2,873,164 | | | Axis Bank Ltd. (Banks) | | | 16,786,330 | |
| | 233,715 | | | Bajaj Finance Ltd. (Diversified Financials) | | | 7,146,003 | |
| | 1,938,826 | | | Bharti Airtel Ltd. (Telecommunication Services)* | | | 13,203,650 | |
| | 2,146,286 | | | Crompton Greaves Consumer Electricals Ltd. (Consumer Durables & Apparel) | | | 6,307,034 | |
| | 584,090 | | | Dalmia Bharat Ltd. (Materials) | | | 4,027,807 | |
| | 584,921 | | | Divi’s Laboratories Ltd. (Pharmaceuticals, Biotechnology & Life Sciences) | | | 18,036,109 | |
| | 44,539 | | | Endurance Technologies Ltd. (Automobiles & Components)(b) | | | 396,966 | |
| | 826,579 | | | ICICI Lombard General Insurance Co. Ltd. (Insurance)(b) | | | 14,129,766 | |
| | 434,967 | | | Info Edge India Ltd. (Media & Entertainment) | | | 14,608,062 | |
| | 1,667,757 | | | Infosys Ltd. (Software & Services) | | | 15,588,745 | |
| | 403,559 | | | Infosys Ltd. ADR (Software & Services) | | | 3,724,849 | |
| | 257,852 | | | Larsen & Toubro Infotech Ltd. (Software & Services)(b) | | | 5,405,548 | |
| | 220,964 | | | Maruti Suzuki India Ltd. (Automobiles & Components) | | | 15,686,598 | |
| | 639,054 | | | Navin Fluorine International Ltd. (Materials) | | | 13,235,371 | |
| | 1,691,810 | | | Prestige Estates Projects Ltd. (Real Estate) | | | 3,863,033 | |
| | 621,244 | | | SBI Life Insurance Co. Ltd. (Insurance)*(b) | | | 5,971,611 | |
| | 342,202 | | | TeamLease Services Ltd. (Commercial & Professional Services)* | | | 7,215,929 | |
| | | | | | | | |
| | | | | | | 209,338,865 | |
| | |
|
| Common Stocks – (continued) | |
| Indonesia – 2.2% | |
| | 14,904,800 | | | Bank Central Asia Tbk. PT (Banks) | | | 25,817,948 | |
| | 122,564,400 | | | BFI Finance Indonesia Tbk. PT (Diversified Financials) | | | 2,697,539 | |
| | 11,974,200 | | | Map Aktif Adiperkasa PT (Retailing)* | | | 1,921,205 | |
| | 102,636,200 | | | Pakuwon Jati Tbk. PT (Real Estate) | | | 2,577,430 | |
| | 12,387,700 | | | Semen Indonesia Persero Tbk. PT (Materials) | | | 6,575,564 | |
| | | | | | | | |
| | | | | | | 39,589,686 | |
| | |
| Mexico – 1.6% | |
| | 911,800 | | | Arca Continental SAB de CV (Food Products) | | | 3,511,987 | |
| | 3,605,910 | | | Bolsa Mexicana de Valores SAB de CV (Diversified Financials) | | | 6,550,215 | |
| | 3,323,199 | | | Kimberly-Clark de Mexico SAB de CV Class A (Household & Personal Products) | | | 4,693,652 | |
| | 5,722,700 | | | Wal-Mart de Mexico SAB de CV (Food & Staples Retailing) | | | 13,764,778 | |
| | | | | | | | |
| | | | | | | 28,520,632 | |
| | |
| Peru – 1.3% | |
| | 2,416,454 | | | Alicorp SAA (Food, Beverage & Tobacco)* | | | 4,910,939 | |
| | 4,756,191 | | | Banco BBVA Peru SA (Banks)* | | | 3,367,589 | |
| | 30,896 | | | Credicorp Ltd. (Banks) | | | 4,604,122 | |
| | 425,560 | | | Intercorp Financial Services, Inc. (Banks) | | | 10,729,494 | |
| | | | | | | | |
| | | | | | | 23,612,144 | |
| | |
| Philippines – 0.5% | |
| | 2,988,300 | | | Jollibee Foods Corp. (Consumer Services) | | | 8,442,466 | |
| | |
| Poland – 1.1% | |
| | 363,568 | | | Dino Polska SA (Food & Staples Retailing)*(b) | | | 15,375,216 | |
| | 1,014,240 | | | Powszechna Kasa Oszczednosci Bank Polski SA (Banks) | | | 5,427,973 | |
| | | | | | | | |
| | | | | | | 20,803,189 | |
| | |
| Russia – 3.3% | |
| | 334,779 | | | LUKOIL PJSC (Energy) | | | 21,602,514 | |
| | 3,424,947 | | | Moscow ExchangeMICEX-RTS PJSC (Diversified Financials) | | | 5,536,132 | |
| | 7,800,843 | | | Sberbank of Russia PJSC (Banks) | | | 20,557,057 | |
| | 354,237 | | | Yandex NV Class A (Media & Entertainment)* | | | 13,383,074 | |
| | | | | | | | |
| | | | | | | 61,078,777 | |
| | |
| Saudi Arabia – 0.2% | |
| | 240,041 | | | United Electronics Co. (Retailing) | | | 4,340,083 | |
| | |
| | |
| 12 | | The accompanying notes are an integral part of these financial statements. |
GOLDMAN SACHS EMERGING MARKETS EQUITY FUND
| | | | | | | | |
| Shares | | | Description | | Value | |
|
| Common Stocks – (continued) | |
| South Africa – 1.5% | |
| | 310,633 | | | Bid Corp. Ltd. (Food & Staples Retailing) | | $ | 4,048,236 | |
| | 708,270 | | | Clicks Group Ltd. (Food & Staples Retailing) | | | 8,815,785 | |
| | 790,903 | | | JSE Ltd. (Diversified Financials) | | | 4,414,103 | |
| | 350,472 | | | Santam Ltd. (Insurance) | | | 5,200,497 | |
| | 6,796,685 | | | Transaction Capital Ltd. (Diversified Financials) | | | 5,559,374 | |
| | | | | | | | |
| | | | | | | 28,037,995 | |
| | |
| South Korea – 13.1% | |
| | 373,363 | | | Hankook Tire & Technology Co. Ltd. (Automobiles & Components) | | | 6,550,535 | |
| | 45,548 | | | LG Chem Ltd. (Materials) | | | 14,152,370 | |
| | 196,119 | | | LG Electronics, Inc. (Consumer Durables & Apparel) | | | 8,826,352 | |
| | 158,358 | | | NAVER Corp. (Media & Entertainment) | | | 25,674,673 | |
| | 65,095 | | | NCSoft Corp. (Media & Entertainment) | | | 34,490,548 | |
| | 170,958 | | | Orion Corp. (Food Products) | | | 17,514,023 | |
| | 40,588 | | | Pearl Abyss Corp. (Media & Entertainment)* | | | 6,419,769 | |
| | 109,967 | | | Samsung Electro-Mechanics Co. Ltd. (Technology Hardware & Equipment) | | | 10,280,916 | |
| | 2,027,479 | | | Samsung Electronics Co. Ltd. (Technology Hardware & Equipment) | | | 83,364,996 | |
| | 470,010 | | | SK Hynix, Inc. (Semiconductors & Semiconductor Equipment) | | | 32,344,940 | |
| | | | | | | | |
| | | | | | | 239,619,122 | |
| | |
| Taiwan – 9.7% | |
| | 14,171,000 | | | FIT Hon Teng Ltd. (Technology Hardware & Equipment)(b) | | | 3,063,921 | |
| | 1,080,700 | | | Kingpak Technology, Inc. (Technology Hardware & Equipment) | | | 5,170,244 | |
| | 144,000 | | | Largan Precision Co. Ltd. (Technology Hardware & Equipment) | | | 19,629,155 | |
| | 713,000 | | | Nien Made Enterprise Co. Ltd. (Consumer Durables & Apparel) | | | 5,470,960 | |
| | 1,756,000 | | | Novatek Microelectronics Corp. (Semiconductors & Semiconductor Equipment)* | | | 10,920,497 | |
| | 648,000 | | | President Chain Store Corp. (Food & Staples Retailing) | | | 6,700,794 | |
| | 203,211 | | | Sea Ltd. ADR (Media & Entertainment)* | | | 11,294,467 | |
| | 10,908,883 | | | Taiwan Semiconductor Manufacturing Co. Ltd. (Semiconductors & Semiconductor Equipment) | | | 110,046,629 | |
| | |
|
| Common Stocks – (continued) | |
| Taiwan – (continued) | |
| | 1,417,000 | | | Taiwan Union Technology Corp. (Technology Hardware & Equipment) | | | 6,388,313 | |
| | | | | | | | |
| | | | | | | 178,684,980 | |
| | |
| Thailand – 0.8% | |
| | 8,052,200 | | | Airports of Thailand PCL (Transportation) | | | 15,358,265 | |
| | |
| Turkey – 0.5% | |
| | 515,796 | | | Mavi Giyim Sanayi ve Ticaret A/S Class B (Consumer Durables & Apparel)*(b) | | | 3,064,049 | |
| | 3,414,508 | | | Sok Marketler Ticaret A/S (Food & Staples Retailing)* | | | 5,356,321 | |
| | | | | | | | |
| | | | | | | 8,420,370 | |
| | |
| United Arab Emirates – 0.2% | |
| | 760,367 | | | Network International Holdings plc (Software & Services)*(b) | | | 3,965,787 | |
| | |
| Vietnam – 1.0% | |
| | 4,180,903 | | | Vietnam Dairy Products JSC (Food, Beverage & Tobacco) | | | 17,682,222 | |
| | |
| TOTAL COMMON STOCKS
(Cost $1,829,867,796) | | $ | 1,817,871,306 | |
| | |
| | | | | | | | |
|
| Exchange Traded Fund – 0.8% | |
| | 398,097 | | | iShares MSCI Emerging Markets ETF | | $ | 14,586,274 | |
| | (Cost $19,569,202) | | | | |
| | |
| | TOTAL INVESTMENTS – 99.9% | | | | |
| | (Cost $1,849,436,998) | | $ | 1,832,457,580 | |
| | |
| OTHER ASSETS IN EXCESS OF
LIABILITIES – 0.1% | | | 1,325,970 | |
| | |
| | NET ASSETS – 100.0% | | $ | 1,833,783,550 | |
| | |
| | |
|
| The percentage shown for each investment category reflects the value of investments in that category as a percentage of net assets. |
| |
* | | Non-income producing security. |
| |
(a) | | Preference Shares are a special type of equity investment that shares in the earnings of the company, has limited voting rights, and receives a greater dividend than applicable Common Shares. |
| |
(b) | | Exempt from registration under Rule 144A of the Securities Act of 1933. |
| | | | |
|
Investment Abbreviations: |
ADR | | —American Depositary Receipt |
GDR | | —Global Depositary Receipt |
|
| | |
| The accompanying notes are an integral part of these financial statements. | | 13 |
GOLDMAN SACHS ESG EMERGING MARKETS EQUITY FUND
Schedule of Investments
April 30, 2020 (Unaudited)
| | | | | | | | |
| Shares | | | Description | | Value | |
|
| Common Stocks – 96.5% | |
| Argentina – 1.9% | |
| | 224 | | | MercadoLibre, Inc. (Retailing)* | | $ | 130,706 | |
| | |
| Brazil – 4.4% | |
| | 15,700 | | | Atacadao SA (Food & Staples Retailing)* | | | 57,743 | |
| | 6,200 | | | B3 SA – Brasil Bolsa Balcao (Diversified Financials) | | | 43,804 | |
| | 22,677 | | | Banco Bradesco SA ADR (Banks) | | | 79,823 | |
| | 8,100 | | | Fleury SA (Health Care Equipment & Services) | | | 33,962 | |
| | 2,280 | | | Pagseguro Digital Ltd. Class A (Software & Services)* | | | 57,752 | |
| | 9,600 | | | Sao Martinho SA (Food Products)* | | | 33,719 | |
| | | | | | | | |
| | | | | | | 306,803 | |
| | |
| China – 35.6% | |
| | 952 | | | 58.com, Inc. ADR (Media & Entertainment)* | | | 49,456 | |
| | 2,417 | | | Alibaba Group Holding Ltd. ADR (Retailing)* | | | 489,853 | |
| | 9,000 | | | Anhui Conch Cement Co. Ltd. Class H (Materials) | | | 70,968 | |
| | 8,000 | | | ANTA Sports Products Ltd. (Consumer Durables & Apparel) | | | 68,128 | |
| | 18,000 | | | China Mengniu Dairy Co. Ltd. (Food Products)* | | | 63,740 | |
| | 25,500 | | | China Merchants Bank Co. Ltd. Class H (Banks) | | | 120,674 | |
| | 1,700 | | | Contemporary Amperex Technology Co. Ltd. Class A (Capital Goods) | | | 33,739 | |
| | 4,500 | | | Gree Electric Appliances, Inc. of Zhuhai Class A (Consumer Durables & Apparel) | | | 34,428 | |
| | 4,500 | | | Meituan Dianping Class B (Retailing)* | | | 60,251 | |
| | 18,900 | | | NARI Technology Co. Ltd. Class A (Capital Goods) | | | 53,345 | |
| | 800 | | | New Oriental Education & Technology Group, Inc. ADR (Consumer Services)* | | | 102,128 | |
| | 20,000 | | | Nexteer Automotive Group Ltd. (Automobiles & Components) | | | 10,279 | |
| | 21,500 | | | Ping An Insurance Group Co. of China Ltd. Class H (Insurance) | | | 218,790 | |
| | 5,500 | | | Shanghai International Airport Co. Ltd. Class A (Transportation) | | | 54,549 | |
| | 2,000 | | | Silergy Corp. (Semiconductors & Semiconductor Equipment) | | | 79,457 | |
| | 6,100 | | | Sunny Optical Technology Group Co. Ltd. (Technology Hardware & Equipment) | | | 84,946 | |
| | 1,011 | | | TAL Education Group ADR (Consumer Services)* | | | 54,786 | |
| | 12,000 | | | Tencent Holdings Ltd. (Media & Entertainment) | | | 630,832 | |
| | 33,000 | | | Topsports International Holdings Ltd. (Retailing)(a) | | | 41,717 | |
| | 5,160 | | | WuXi AppTec Co. Ltd. Class H (Pharmaceuticals, Biotechnology & Life Sciences)(a) | | | 72,749 | |
| | |
|
| Common Stocks – (continued) | |
| China – (continued) | |
| | 50,000 | | | Xinyi Solar Holdings Ltd. (Semiconductors & Semiconductor Equipment) | | | 31,733 | |
| | 11,500 | | | Zhejiang Sanhua Intelligent Controls Co. Ltd. Class A (Capital Goods) | | | 35,248 | |
| | | | | | | | |
| | | | | | | 2,461,796 | |
| | |
| Colombia – 0.2% | |
| | 2,200 | | | Banco Davivienda SA (Preference) (Banks)(b) | | | 15,960 | |
| | |
| Czech Republic – 0.5% | |
| | 18,317 | | | Moneta Money Bank A/S (Banks)(a) | | | 38,053 | |
| | |
| Egypt – 0.3% | |
| | 6,159 | | | Commercial International Bank Egypt SAE (Registered) GDR (Banks) | | | 23,617 | |
| | |
| Greece – 0.8% | |
| | 3,488 | | | JUMBO SA (Retailing) | | | 54,587 | |
| | |
| Hong Kong – 6.3% | |
| | 24,800 | | | AIA Group Ltd. (Insurance) | | | 227,609 | |
| | 2,667 | | | Hong Kong Exchanges & Clearing Ltd. (Diversified Financials) | | | 85,510 | |
| | 51,000 | | | Sino Biopharmaceutical Ltd. (Pharmaceuticals, Biotechnology & Life Sciences) | | | 74,337 | |
| | 6,000 | | | Techtronic Industries Co. Ltd. (Capital Goods) | | | 45,495 | |
| | | | | | | | |
| | | | | | | 432,951 | |
| | |
| India – 11.5% | |
| | 1,737 | | | Avenue Supermarts Ltd. (Food & Staples Retailing)*(a) | | | 54,442 | |
| | 14,189 | | | Axis Bank Ltd. (Banks) | | | 82,899 | |
| | 1,313 | | | Bajaj Finance Ltd. (Diversified Financials) | | | 40,146 | |
| | 6,481 | | | Bharti Airtel Ltd. (Telecommunication Services)* | | | 44,137 | |
| | 3,819 | | | Dalmia Bharat Ltd. (Materials) | | | 26,335 | |
| | 3,425 | | | Divi’s Laboratories Ltd. (Pharmaceuticals, Biotechnology & Life Sciences) | | | 105,610 | |
| | 5,045 | | | ICICI Lombard General Insurance Co. Ltd. (Insurance)(a) | | | 86,241 | |
| | 2,383 | | | Info Edge India Ltd. (Media & Entertainment) | | | 80,031 | |
| | 8,862 | | | Infosys Ltd. (Software & Services) | | | 82,834 | |
| | 3,032 | | | Infosys Ltd. ADR (Software & Services) | | | 27,986 | |
| | 1,859 | | | Larsen & Toubro Infotech Ltd. (Software & Services)(a) | | | 38,972 | |
| | 1,410 | | | Maruti Suzuki India Ltd. (Automobiles & Components) | | | 100,098 | |
| | 2,367 | | | SBI Life Insurance Co. Ltd. (Insurance)*(a) | | | 22,752 | |
| | | | | | | | |
| | | | | | | 792,483 | |
| | |
| Indonesia – 1.6% | |
| | 64,100 | | | Bank Central Asia Tbk. PT (Banks) | | | 111,033 | |
| | |
| | |
| 14 | | The accompanying notes are an integral part of these financial statements. |
GOLDMAN SACHS ESG EMERGING MARKETS EQUITY FUND
| | | | | | | | |
| Shares | | | Description | | Value | |
|
| Common Stocks – (continued) | |
| Mexico – 2.2% | |
| | 6,400 | | | Arca Continental SAB de CV (Food Products) | | $ | 24,651 | |
| | 21,865 | | | Kimberly-Clark de Mexico SAB de CV Class A (Household & Personal Products) | | | 30,882 | |
| | 40,300 | | | Wal-Mart de Mexico SAB de CV (Food & Staples Retailing) | | | 96,933 | |
| | | | | | | | |
| | | | | | | 152,466 | |
| | |
| Peru – 1.4% | |
| | 336 | | | Credicorp Ltd. (Banks) | | | 50,071 | |
| | 1,753 | | | Intercorp Financial Services, Inc. (Banks) | | | 44,070 | |
| | | | | | | | |
| | | | | | | 94,141 | |
| | |
| Philippines – 0.3% | |
| | 8,820 | | | Jollibee Foods Corp. (Consumer Services) | | | 24,918 | |
| | |
| Poland – 0.6% | |
| | 7,470 | | | Powszechna Kasa Oszczednosci Bank Polski SA (Banks) | | | 39,978 | |
| | |
| Russia – 3.4% | |
| | 28,650 | | | Moscow ExchangeMICEX-RTS PJSC (Diversified Financials) | | | 46,311 | |
| | 11,875 | | | Sberbank of Russia PJSC ADR (Banks) | | | 124,806 | |
| | 1,623 | | | Yandex NV Class A (Media & Entertainment)* | | | 61,317 | |
| | | | | | | | |
| | | | | | | 232,434 | |
| | |
| Saudi Arabia – 0.3% | |
| | 1,019 | | | United Electronics Co. (Retailing) | | | 18,424 | |
| | |
| South Africa – 1.4% | |
| | 1,433 | | | Bid Corp. Ltd. (Food & Staples Retailing) | | | 18,675 | |
| | 4,132 | | | Clicks Group Ltd. (Food & Staples Retailing) | | | 51,431 | |
| | 1,767 | | | Santam Ltd. (Insurance) | | | 26,220 | |
| | | | | | | | |
| | | | | | | 96,326 | |
| | |
| South Korea – 13.1% | |
| | 182 | | | LG Chem Ltd. (Materials) | | | 56,550 | |
| | 716 | | | LG Electronics, Inc. (Consumer Durables & Apparel) | | | 32,224 | |
| | 757 | | | NAVER Corp. (Media & Entertainment) | | | 122,733 | |
| | 212 | | | NCSoft Corp. (Media & Entertainment) | | | 112,328 | |
| | 613 | | | Orion Corp. (Food Products) | | | 62,799 | |
| | 196 | | | Pearl Abyss Corp. (Media & Entertainment)* | | | 31,001 | |
| | 379 | | | Samsung Electro-Mechanics Co. Ltd. (Technology Hardware & Equipment) | | | 35,433 | |
| | 8,530 | | | Samsung Electronics Co. Ltd. (Technology Hardware & Equipment) | | | 350,733 | |
| | 1,535 | | | SK Hynix, Inc. (Semiconductors & Semiconductor Equipment) | | | 105,635 | |
| | | | | | | | |
| | | | | | | 909,436 | |
| | |
| Taiwan – 9.9% | |
| | 1,000 | | | Largan Precision Co. Ltd. (Technology Hardware & Equipment) | | | 136,314 | |
| | |
|
| Common Stocks – (continued) | |
| Taiwan – (continued) | |
| | 3,000 | | | Nien Made Enterprise Co. Ltd. (Consumer Durables & Apparel) | | | 23,019 | |
| | 6,000 | | | Novatek Microelectronics Corp. (Semiconductors & Semiconductor Equipment)* | | | 37,314 | |
| | 938 | | | Sea Ltd. ADR (Media & Entertainment)* | | | 52,134 | |
| | 43,000 | | | Taiwan Semiconductor Manufacturing Co. Ltd. (Semiconductors & Semiconductor Equipment) | | | 433,775 | |
| | | | | | | | |
| | | | | | | 682,556 | |
| | |
| Thailand – 0.8% | |
| | 28,500 | | | Airports of Thailand PCL (Transportation) | | | 54,359 | |
| | |
| TOTAL COMMON STOCKS
(Cost $6,819,212) | | $ | 6,673,027 | |
| | |
| | | | | | | | |
| Shares | | | Dividend Rate | | Value | |
|
| Investment Company(c) – 0.1% | |
| Goldman Sachs Financial Square Government Fund –
Institutional Shares |
|
| | 7,602 | | | 0.233% | | $ | 7,602 | |
| | (Cost $7,602) | | | | |
| | |
| | TOTAL INVESTMENTS – 96.6% | | | | |
| | (Cost $6,826,814) | | $ | 6,680,629 | |
| | |
| OTHER ASSETS IN EXCESS OF
LIABILITIES – 3.4% | | | 233,089 | |
| | |
| | NET ASSETS – 100.0% | | $ | 6,913,718 | |
| | |
| | |
|
| The percentage shown for each investment category reflects the value of investments in that category as a percentage of net assets. |
| |
* | | Non-income producing security. |
| |
(a) | | Exempt from registration under Rule 144A of the Securities Act of 1933. |
| |
(b) | | Preference Shares are a special type of equity investment that shares in the earnings of the company, has limited voting rights, and receives a greater dividend than applicable Common Shares. |
| |
(c) | | Represents an Affiliated Issuer. |
| | | | |
|
Investment Abbreviations: |
ADR | | —American Depositary Receipt |
GDR | | —Global Depositary Receipt |
|
| | |
| The accompanying notes are an integral part of these financial statements. | | 15 |
GOLDMAN SACHS IMPRINT EMERGING MARKETS OPPORTUNITIES FUND
Schedule of Investments
April 30, 2020 (Unaudited)
| | | | | | | | |
Shares | | | Description | | Value | |
|
| Common Stocks – 98.9% | |
| Bangladesh – 1.5% | |
| | 665,140 | | | BRAC Bank Ltd. (Banks)* | | $ | 249,476 | |
| | |
| Brazil – 2.9% | |
| | 90,400 | | | Atacadao SA (Food & Staples Retailing)* | | | 332,481 | |
| | 73,700 | | | IRB Brasil Resseguros S/A (Insurance) | | | 138,512 | |
| | | | | | | | |
| | | | | | | 470,993 | |
| | |
| China – 29.0% | |
| | 13,164 | | | 58.com, Inc. ADR (Media & Entertainment)* | | | 683,870 | |
| | 14,708 | | | Baozun, Inc. ADR (Retailing)*(a) | | | 468,303 | |
| | 340,700 | | | Haier Smart Home Co. Ltd. Class A (Consumer Durables & Apparel) | | | 735,372 | |
| | 30,357 | | | Huize Holding Ltd. (Insurance)* | | | 230,410 | |
| | 108,000 | | | Li Ning Co. Ltd. (Consumer Durables & Apparel) | | | 341,007 | |
| | 327,000 | | | Maoyan Entertainment (Retailing)*(b) | | | 440,963 | |
| | 165,979 | | | Shenzhen Inovance Technology Co. Ltd. Class A (Capital Goods) | | | 762,205 | |
| | 7,661 | | | TAL Education Group ADR (Consumer Services)* | | | 415,150 | |
| | 10,550 | | | Trip.com Group Ltd. ADR (Retailing)* | | | 271,768 | |
| | 118,800 | | | Zhuzhou CRRC Times Electric Co. Ltd. Class H (Capital Goods) | | | 363,425 | |
| | | | | | | | |
| | | | | | | 4,712,473 | |
| | |
| Egypt – 4.5% | |
| | 951,920 | | | Cleopatra Hospital (Health Care Equipment & Services)* | | | 259,285 | |
| | 115,247 | | | Commercial International Bank Egypt SAE (Banks) | | | 468,483 | |
| | | | | | | | |
| | | | | | | 727,768 | |
| | |
| Hong Kong – 3.5% | |
| | 62,600 | | | AIA Group Ltd. (Insurance) | | | 574,528 | |
| | |
| India – 3.5% | |
| | 13,026 | | | HDFC Bank Ltd. ADR (Banks) | | | 564,677 | |
| | |
| Indonesia – 2.0% | |
| | 295,900 | | | Map Aktif Adiperkasa PT (Retailing)* | | | 47,476 | |
| | 6,180,800 | | | Mitra Adiperkasa Tbk. PT (Retailing) | | | 270,011 | |
| | | | | | | | |
| | | | | | | 317,487 | |
| | |
| Japan – 4.1% | |
| | 20,900 | | | Suzuki Motor Corp. (Automobiles & Components) | | | 667,029 | |
| | |
| Philippines – 2.6% | |
| | 371,310 | | | Bank of the Philippine Islands (Banks) | | | 426,469 | |
| | |
| Poland – 1.9% | |
| | 7,401 | | | Dino Polska SA (Food & Staples Retailing)*(b) | | | 312,987 | |
| | |
| Russia – 3.2% | |
| | 13,511 | | | Yandex NV Class A (Media & Entertainment)* | | | 510,446 | |
| | |
|
| Common Stocks – (continued) | |
| Saudi Arabia – 1.0% | |
| | 10,163 | | | Leejam Sports Co. JSC (Consumer Services) | | | 167,487 | |
| | |
| Slovenia – 3.3% | |
| | 67,077 | | | Nova Ljubljanska Banka dd GDR (Banks) | | | 536,596 | |
| | |
| South Africa – 11.6% | |
| | 12,141 | | | Naspers Ltd. Class N (Retailing) | | | 1,889,729 | |
| | |
| South Korea – 7.2% | |
| | 8,346 | | | Cosmax, Inc. (Household & Personal Products) | | | 609,529 | |
| | 1,811 | | | LG Chem Ltd. (Materials) | | | 562,702 | |
| | | | | | | | |
| | | | | | | 1,172,231 | |
| | |
| Taiwan – 5.6% | |
| | 194,000 | | | Delta Electronics, Inc. (Technology Hardware & Equipment) | | | 904,856 | |
| | |
| United Arab Emirates – 6.8% | |
| | 467,470 | | | Emirates NBD Bank PJSC (Banks) | | | 1,086,105 | |
| | 35,803 | | | NMC Health plc (Health Care Equipment & Services) | | | 12,169 | |
| | | | | | | | |
| | | | | | | 1,098,274 | |
| | |
| Vietnam – 4.7% | |
| | 344,882 | | | FPT Corp. (Technology Hardware & Equipment) | | | 754,535 | |
| | |
| TOTAL COMMON STOCKS
(Cost $19,326,869) | | $ | 16,058,041 | |
| | |
| | | | | | | | |
| Shares | | | Dividend Rate | | Value | |
|
| Investment Company(c) – 0.1% | |
| Goldman Sachs Financial Square Government Fund –
Institutional Shares |
|
| | 13,673 | | | 0.233% | | $ | 13,673 | |
| | (Cost $13,673) | | | | |
| | |
| TOTAL INVESTMENTS BEFORE SECURITIES
LENDING REINVESTMENT VEHICLE
(Cost $19,340,542) | | $ | 16,071,714 | |
| | |
| | | | | | | | |
|
| Securities Lending Reinvestment Vehicle(c)–2.9% | |
| Goldman Sachs Financial Square Government Fund –
Institutional Shares |
|
| | 465,650 | | | 0.233% | | $ | 465,650 | |
| | (Cost $465,650) | | | | |
| | |
| | TOTAL INVESTMENTS – 101.9% | | | | |
| | (Cost $19,806,192) | | $ | 16,537,364 | |
| | |
| LIABILITIES IN EXCESS OF
OTHER ASSETS – (1.9)% | | | (308,474 | ) |
| | |
| | NET ASSETS – 100.0% | | $ | 16,228,890 | |
| | |
| | |
| 16 | | The accompanying notes are an integral part of these financial statements. |
GOLDMAN SACHS IMPRINT EMERGING MARKETS OPPORTUNITIES FUND
| | |
|
| The percentage shown for each investment category reflects the value of investments in that category as a percentage of net assets. |
| |
* | | Non-income producing security. |
| |
(a) | | All or a portion of security is on loan. |
| |
(b) | | Exempt from registration under Rule 144A of the Securities Act of 1933. |
| |
(c) | | Represents an Affiliated Issuer. |
| | | | |
|
Investment Abbreviations: |
ADR | | — American Depositary Receipt |
GDR | | — Global Depositary Receipt |
|
| | |
| The accompanying notes are an integral part of these financial statements. | | 17 |
GOLDMAN SACHS FUNDAMENTAL EMERGING MARKETS EQUITY FUNDS
Statements of Assets and Liabilities
April 30, 2020 (Unaudited)
| | | | | | | | | | | | | | | | | | |
| | | | | China
Equity Fund | | | Emerging
Markets Equity Fund | | | ESG Emerging
Markets Equity Fund | | | Imprint Emerging
Markets
Opportunities Fund | |
| | Assets: | | | | | | | | | | | | | | | | |
| | Investments in unaffiliated issuers, at value (cost $54,476,414, $1,849,436,998, $6,819,212 and $19,326,869)(a) | | $ | 59,942,031 | | | $ | 1,832,457,580 | | | $ | 6,673,027 | | | $ | 16,058,041 | |
| | Investments in affiliated issuers, at value (cost $1,399,012, $0, $7,602 and $13,673) | | | 1,399,012 | | | | — | | | | 7,602 | | | | 13,673 | |
| | Investments in affiliated securities lending reinvestment vehicle, at value (cost $0, $0, $0 and $465,650) | | | — | | | | — | | | | — | | | | 465,650 | |
| | Cash | | | 499,876 | | | | 2,713,640 | | | | 55,895 | | | | 98,648 | |
| | Foreign currencies, at value (cost $61,022, $2,575,309, $131,656 and $3,133) | | | 58,125 | | | | 2,541,696 | | | | 128,942 | | | | 2,998 | |
| | Receivables: | | | | | | | | | | | | | | | | |
| | Dividends | | | 50,991 | | | | 2,920,147 | | | | 10,097 | | | | 6,583 | |
| | Reimbursement from investment adviser | | | 26,005 | | | | — | | | | 24,628 | | | | 35,864 | |
| | Fund shares sold | | | 19,820 | | | | 2,372,217 | | | | 1,134 | | | | — | |
| | Securities lending income | | | 171 | | | | 23,708 | | | | — | | | | 701 | |
| | Investments sold | | | — | | | | 591,511 | | | | — | | | | 150,008 | |
| | Foreign tax reclaims | | | — | | | | 150,735 | | | | 1,524 | | | | 7,361 | |
| | Due from custodian | | | — | | | | — | | | | 2,153 | | | | — | |
| | Other assets | | | 59,040 | | | | 108,807 | | | | 71,521 | | | | 60,467 | |
| | Total assets | | | 62,055,071 | | | | 1,843,880,041 | | | | 6,976,523 | | | | 16,899,994 | |
| | | | | | | | | | | | | | | | | | |
| | Liabilities: | | | | | | | | | | | | | | | | |
| | Payables: | | | | | | | | | | | | | | | | |
| | Management fees | | | 48,335 | | | | 1,517,552 | | | | 5,201 | | | | 13,354 | |
| | Fund shares redeemed | | | 8,866 | | | | 8,034,078 | | | | — | | | | 7,771 | |
| | Distribution and Service fees and Transfer Agency fees | | | 5,675 | | | | 143,678 | | | | 340 | | | | 2,018 | |
| | Investments purchased | | | — | | | | 89 | | | | 4,305 | | | | 88,060 | |
| | Payable upon return of securities loaned | | | — | | | | — | | | | — | | | | 465,650 | |
| | Foreign capital gains taxes | | | — | | | | 59,831 | | | | 27 | | | | 7,373 | |
| | Accrued expenses | | | 78,684 | | | | 341,263 | | | | 52,932 | | | | 86,878 | |
| | Total liabilities | | | 141,560 | | | | 10,096,491 | | | | 62,805 | | | | 671,104 | |
| | | | | | | | | | | | | | | | | | |
| | Net Assets: | | | | | | | | | | | | | | | | |
| | Paid-in capital | | | 54,062,921 | | | | 2,078,933,084 | | | | 7,505,551 | | | | 79,233,265 | |
| | Total distributable earnings (loss) | | | 7,850,590 | | | | (245,149,534 | ) | | | (591,833 | ) | | | (63,004,375 | ) |
| | | NET ASSETS | | $ | 61,913,511 | | | $ | 1,833,783,550 | | | $ | 6,913,718 | | | $ | 16,228,890 | |
| | | Net Assets: | | | | | | | | | | | | | | | | |
| | | Class A | | $ | 13,640,517 | | | $ | 211,815,522 | | | $ | 46,905 | | | $ | 2,620,896 | |
| | | Class C | | | 905,583 | | | | 22,065,298 | | | | 44,996 | | | | 778,945 | |
| | | Institutional | | | 7,030,705 | | | | 1,093,127,948 | | | | 6,561,227 | | | | 2,722,825 | |
| | | Service | | | — | | | | 21,333,610 | | | | — | | | | — | |
| | | Investor | | | 264,972 | | | | 121,886,923 | | | | 45,867 | | | | 863,294 | |
| | | Class P | | | 39,790,142 | | | | 345,752,795 | | | | 8,348 | | | | 9,236,136 | |
| | | Class R | | | — | | | | — | | | | 160,384 | | | | — | |
| | | Class R6 | | | 281,592 | | | | 17,801,454 | | | | 45,991 | | | | 6,794 | |
| | | Total Net Assets | | $ | 61,913,511 | | | $ | 1,833,783,550 | | | $ | 6,913,718 | | | $ | 16,228,890 | |
| | | Shares outstanding $0.001 par value (unlimited shares authorized): | | | | | | | | | | | | | | | | |
| | | Class A | | | 514,086 | | | | 11,566,583 | | | | 5,177 | | | | 395,696 | |
| | | Class C | | | 38,078 | | | | 1,348,098 | | | | 5,000 | | | | 123,281 | |
| | | Institutional | | | 248,382 | | | | 55,634,457 | | | | 723,313 | | | | 410,311 | |
| | | Service | | | — | | | | 1,204,207 | | | | — | | | | — | |
| | | Investor | | | 9,416 | | | | 6,252,072 | | | | 5,058 | | | | 129,759 | |
| | | Class P | | | 1,409,938 | | | | 17,521,973 | | | | 920 | | | | 1,393,950 | |
| | | Class R | | | — | | | | — | | | | 17,762 | | | | — | |
| | | Class R6 | | | 9,981 | | | | 902,067 | | | | 5,069 | | | | 1,024 | |
| | | Net asset value, offering and redemption price per share:(b) | | | | | | | | | | | | | | | | |
| | | Class A | | | $26.53 | | | | $18.31 | | | | $9.06 | | | | $6.62 | |
| | | Class C | | | 23.78 | | | | 16.37 | | | | 9.00 | | | | 6.32 | |
| | | Institutional | | | 28.31 | | | | 19.65 | | | | 9.07 | | | | 6.64 | |
| | | Service | | | — | | | | 17.72 | | | | — | | | | — | |
| | | Investor | | | 28.14 | | | | 19.50 | | | | 9.07 | | | | 6.65 | |
| | | Class P | | | 28.22 | | | | 19.73 | | | | 9.07 | | | | 6.63 | |
| | | Class R | | | — | | | | — | | | | 9.03 | | | | — | |
| | | Class R6 | | | 28.21 | | | | 19.73 | | | | 9.07 | | | | 6.63 | |
| | (a) | | Includes loaned securities having a market value of $442,576 for Imprint Emerging Markets Opportunities Fund. |
| | (b) | | Maximum public offering price per share for Class A Shares of the China Equity, Emerging Markets Equity, ESG Emerging Markets Equity and Imprint Emerging Markets Opportunities Funds is $28.07, $19.38, $9.59 and $7.01, respectively. At redemption, Class C Shares may be subject to a contingent deferred sales charge assessed on the amount equal to the lesser of the current NAV or the original purchase price of the shares. |
| | |
| 18 | | The accompanying notes are an integral part of these financial statements. |
GOLDMAN SACHS FUNDAMENTAL EMERGING MARKETS EQUITY FUNDS
Statements of Operations
For the Six Months Ended April 30, 2020 (Unaudited)
| | | | | | | | | | | | | | | | | | |
| | | | | China
Equity Fund | | | Emerging
Markets Equity Fund | | | ESG Emerging
Markets
Equity Fund | | | Imprint Emerging
Markets
Opportunities Fund | |
| | Investment income: | | | | | | | | | | | | | | | | |
| | | | | |
| | Dividends — unaffiliated issuers (net of foreign taxes withheld of $4,526, $1,414,652, $5,556 and $8,764) | | $ | 65,099 | | | $ | 12,207,200 | | | $ | 41,233 | | | $ | 97,596 | |
| | | | | |
| | Dividends — affiliated issuers | | | 2,252 | | | | 116,626 | | | | 77 | | | | 118 | |
| | | | | |
| | Securities lending income — affiliated issuer | | | 963 | | | | 134,079 | | | | — | | | | 7,293 | |
| | | | | |
| | Total investment income | | | 68,314 | | | | 12,457,905 | | | | 41,310 | | | | 105,007 | |
| | | | | | | | | | | | | | | | | | |
| | Expenses: | | | | | | | | | | | | | | | | |
| | | | | |
| | Management fees | | | 336,744 | | | | 9,550,130 | | | | 35,564 | | | | 115,879 | |
| | | | | |
| | Professional fees | | | 55,950 | | | | 55,325 | | | | 47,291 | | | | 70,011 | |
| | | | | |
| | Custody, accounting and administrative services | | | 49,873 | | | | 405,523 | | | | 22,390 | | | | 60,196 | |
| | | | | |
| | Registration fees | | | 43,244 | | | | 97,769 | | | | 49,084 | | | | 43,460 | |
| | | | | |
| | Distribution and Service fees(a) | | | 21,731 | | | | 421,709 | | | | 732 | | | | 9,456 | |
| | | | | |
| | Transfer Agency fees(a) | | | 20,775 | | | | 612,439 | | | | 1,656 | | | | 7,389 | |
| | | | | |
| | Printing and mailing costs | | | 19,575 | | | | 105,839 | | | | 9,726 | | | | 18,179 | |
| | | | | |
| | Trustee fees | | | 9,140 | | | | 10,614 | | | | 9,085 | | | | 9,100 | |
| | | | | |
| | Service share fees — Service and Shareholder Administration Plan | | | — | | | | 58,646 | | | | — | | | | — | |
| | | | | |
| | Other | | | 21,480 | | | | 45,940 | | | | 4,335 | | | | 26,286 | |
| | | | | |
| | Total expenses | | | 578,512 | | | | 11,363,934 | | | | 179,863 | | | | 359,956 | |
| | | | | |
| | Less — expense reductions | | | (165,842 | ) | | | (50,486 | ) | | | (137,521 | ) | | | (209,524 | ) |
| | | | | |
| | Net expenses | | | 412,670 | | | | 11,313,448 | | | | 42,342 | | | | 150,432 | |
| | | | | |
| | NET INVESTMENT INCOME (LOSS) | | | (344,356 | ) | | | 1,144,457 | | | | (1,032 | ) | | | (45,425 | ) |
| | | | | | | | | | | | | | | | | | |
| | Realized and unrealized gain (loss): | | | | | | | | | | | | | | | | |
| | | | | |
| | Net realized gain (loss) from: | | | | | | | | | | | | | | | | |
| | | | | |
| | Investments — unaffiliated issuers | | | 4,457,460 | | | | (73,397,470 | ) | | | (161,483 | ) | | | (1,259,261 | ) |
| | | | | |
| | Foreign currency transactions | | | (59,646 | ) | | | (785,996 | ) | | | (7,863 | ) | | | (17,252 | ) |
| | | | | |
| | Net change in unrealized loss on: | | | | | | | | | | | | | | | | |
| | | | | |
| | Investments — unaffiliated issuers (including the effects of the net change in the foreign capital gains tax liability of $411,517, $2,937,756, $13,084 and $0) | | | (1,260,561 | ) | | | (101,107,234 | ) | | | (411,025 | ) | | | (3,474,591 | ) |
| | | | | |
| | Foreign currency translation | | | (160,058 | ) | | | (1,494,465 | ) | | | (9,336 | ) | | | (184 | ) |
| | | | | |
| | Net realized and unrealized gain (loss) | | | 2,977,195 | | | | (176,785,165 | ) | | | (589,707 | ) | | | (4,751,288 | ) |
| | | | | |
| | NET INCREASE (DECREASE) IN NET ASSETS RESULTING FROM OPERATIONS | | $ | 2,632,839 | | | $ | (175,640,708 | ) | | $ | (590,739 | ) | | $ | (4,796,713 | ) |
| | (a) | | Class specific Distribution and/or Service, and Transfer Agency fees were as follows: |
| | | | | | | | | | | | | | | | | | | | | | | | | | | | | | | | | | | | | | | | | | | | |
| | | Distribution and Service Fees | | | Transfer Agency Fees | |
Fund | | Class A | | | Class C | | | Class R | | | Class A | | | Class C | | | Institutional | | | Service | | | Investor | | | Class P | | | Class R | | | Class R6 | |
China Equity | | $ | 17,014 | | | $ | 4,717 | | | $ | — | | | $ | 11,569 | | | $ | 802 | | | $ | 1,231 | | | $ | — | | | $ | 215 | | | $ | 6,900 | | | $ | — | | | $ | 58 | |
Emerging Markets Equity | | | 281,927 | | | | 139,782 | | | | — | | | | 191,710 | | | | 23,763 | | | | 206,741 | | | | 4,692 | | | | 122,787 | | | | 59,356 | | | | — | | | | 3,390 | |
ESG Emerging Markets Equity | | | 62 | | | | 245 | | | | 425 | | | | 42 | | | | 42 | | | | 1,377 | | | | — | | | | 42 | | | | 1(b) | | | | 145 | | | | 7 | |
Imprint Emerging Markets Opportunities | | | 4,029 | | | | 5,427 | | | | — | | | | 2,740 | | | | 923 | | | | 709 | | | | — | | | | 1,073 | | | | 1,942 | | | | — | | | | 2 | |
| | (b) | | Commenced operations on January 21, 2020. |
| | |
| The accompanying notes are an integral part of these financial statements. | | 19 |
GOLDMAN SACHS FUNDAMENTAL EMERGING MARKETS EQUITY FUNDS
Statements of Changes in Net Assets
| | | | | | | | | | | | | | | | | | | | | | |
| | | | | China Equity Fund | | | | | | Emerging Markets Equity Fund | |
| | | | | For the
Six Months Ended
April 30, 2020
(Unaudited) | | | For the Fiscal
Year Ended
October 31, 2019 | | | | | | For the
Six Months Ended
April 30, 2020
(Unaudited) | | | For the Fiscal
Year Ended
October 31, 2019 | |
| | From operations: | | | | | | | | | | | | | |
| | | | | | |
| | Net investment income (loss) | | $ | (344,356 | ) | | $ | 331,276 | | | | | | | $ | 1,144,457 | | | $ | 11,647,844 | |
| | | | | | |
| | Net realized gain (loss) | | | 4,397,814 | | | | (1,370,912 | ) | | | | | | | (74,183,466 | ) | | | (45,923,674 | ) |
| | | | | | |
| | Net change in unrealized gain (loss) | | | (1,420,619 | ) | | | 13,831,545 | | | | | | | | (102,601,699 | ) | | | 301,566,373 | |
| | | | | | |
| | Net increase (decrease) in net assets resulting from operations | | | 2,632,839 | | | | 12,791,909 | | | | | | | | (175,640,708 | ) | | | 267,290,543 | |
| | | | | | | | | | | | | | | | | | | | | | |
| | Distributions to shareholders: | | | | | | | | | | | | | |
| | | | | | |
| | From distributable earnings: | | | | | | | | | | | | | | | | | | | | |
| | | | | | |
| | Class A Shares | | | (80,753 | ) | | | (889,921 | ) | | | | | | | (2,087,916 | ) | | | (673,495 | ) |
| | | | | | |
| | Class C Shares | | | — | | | | (72,137 | ) | | | | | | | (31,816 | ) | | | — | |
| | | | | | |
| | Institutional Shares | | | (54,582 | ) | | | (433,817 | ) | | | | | | | (11,063,936 | ) | | | (5,268,709 | ) |
| | | | | | |
| | Service Shares | | | — | | | | — | | | | | | | | (191,831 | ) | | | (49,751 | ) |
| | | | | | |
| | Investor Shares | | | (1,881 | ) | | | (17,126 | ) | | | | | | | (1,412,911 | ) | | | (901,707 | ) |
| | | | | | |
| | Class P Shares | | | (459,995 | ) | | | (3,162,940 | ) | | | | | | | (4,624,350 | ) | | | (2,644,053 | ) |
| | | | | | |
| | Class R6 Shares | | | (3,753 | ) | | | (539 | ) | | | | | | | (290,245 | ) | | | (296,454 | ) |
| | | | | | |
| | Total distributions to shareholders | | | (600,964 | ) | | | (4,576,480 | ) | | | | | | | (19,703,005 | ) | | | (9,834,169 | ) |
| | | | | | | | | | | | | | | | | | | | | | |
| | From share transactions: | | | | | | | | | | | | | |
| | | | | | |
| | Proceeds from sales of shares | | | 5,322,460 | | | | 5,319,738 | | | | | | | | 706,521,291 | | | | 780,205,137 | |
| | | | | | |
| | Reinvestment of distributions | | | 595,251 | | | | 4,525,522 | | | | | | | | 17,567,215 | | | | 8,902,639 | |
| | | | | | |
| | Cost of shares redeemed | | | (19,986,498 | ) | | | (14,323,926 | ) | | | | | | | (470,015,021 | ) | | | (644,514,588 | ) |
| | | | | | |
| | Net increase (decrease) in net assets resulting from share transactions | | | (14,068,787 | ) | | | (4,478,666 | ) | | | | | | | 254,073,485 | | | | 144,593,188 | |
| | | | | | |
| | TOTAL INCREASE (DECREASE) | | | (12,036,912 | ) | | | 3,736,763 | | | | | | | | 58,729,772 | | | | 402,049,562 | |
| | | | | | | | | | | | | | | | | | | | | | |
| | Net Assets: | | | | | | | | | | | | | |
| | | | | | |
| | Beginning of period | | | 73,950,423 | | | | 70,213,660 | | | | | | | | 1,775,053,778 | | | | 1,373,004,216 | |
| | | | | | |
| | End of period | | $ | 61,913,511 | | | $ | 73,950,423 | | | | | | | $ | 1,833,783,550 | | | $ | 1,775,053,778 | |
| | |
| 20 | | The accompanying notes are an integral part of these financial statements. |
GOLDMAN SACHS FUNDAMENTAL EMERGING MARKETS EQUITY FUNDS
Statements of Changes in Net Assets(continued)
| | | | | | | | | | | | | | | | | | | | | | |
| | | | | ESG Emerging Markets Equity Fund | | | | | | Imprint Emerging Markets Opportunities Fund | |
| | | | | For the
Six Months Ended
April 30, 2020
(Unaudited) | | | For the Fiscal Year Ended
October 31, 2019 | | | | | | For the
Six Months Ended
April 30, 2020
(Unaudited) | | | For the Fiscal Year Ended
October 31, 2019 | |
| | From operations: | | | | | | | | | | | | | |
| | | | | | |
| | Net investment income (loss) | | $ | (1,032 | ) | | $ | 59,539 | | | | | | | $ | (45,425 | ) | | $ | 1,290,158 | |
| | | | | | |
| | Net realized gain (loss) | | | (169,346 | ) | | | (138,804 | ) | | | | | | | (1,276,513 | ) | | | 2,721,312 | |
| | | | | | |
| | Net change in unrealized gain (loss) | | | (420,361 | ) | | | 1,276,626 | | | | | | | | (3,474,775 | ) | | | (1,640,699 | ) |
| | | | | | |
| | Net increase (decrease) in net assets resulting from operations | | | (590,739 | ) | | | 1,197,361 | | | | | | | | (4,796,713 | ) | | | 2,370,771 | |
| | | | | | | | | | | | | | | | | | | | | | |
| | Distributions to shareholders: | | | | | | | | | | | | | |
| | | | | | |
| | From distributable earnings: | | | | | | | | | | | | | | | | | | | | |
| | | | | | |
| | Class A Shares | | | (280 | ) | | | (100 | ) | | | | | | | (164,432 | ) | | | (43,316 | ) |
| | | | | | |
| | Class C Shares | | | — | | | | — | | | | | | | | (46,762 | ) | | | — | |
| | | | | | |
| | Institutional Shares | | | (64,061 | ) | | | (27,540 | ) | | | | | | | (204,776 | ) | | | (148,258 | ) |
| | | | | | |
| | Investor Shares | | | (400 | ) | | | (167 | ) | | | | | | | (72,847 | ) | | | (18,320 | ) |
| | | | | | |
| | Class P Shares | | | — | (a) | | | — | | | | | | | | (733,414 | ) | | | (211,532 | ) |
| | | | | | |
| | Class R Shares | | | (1,009 | ) | | | (34 | ) | | | | | | | — | | | | — | |
| | | | | | |
| | Class R6 Shares | | | (471 | ) | | | (206 | ) | | | | | | | (446 | ) | | | (117 | ) |
| | | | | | |
| | Total distributions to shareholders | | | (66,221 | ) | | | (28,047 | ) | | | | | | | (1,222,677 | ) | | | (421,543 | ) |
| | | | | | | | | | | | | | | | | | | | | | |
| | From share transactions: | | | | | | | | | | | | | |
| | | | | | |
| | Proceeds from sales of shares | | | 381,736 | | | | 1,219,951 | | | | | | | | 4,050,793 | | | | 1,128,191 | |
| | | | | | |
| | Reinvestment of distributions | | | 66,221 | | | | 28,047 | | | | | | | | 1,214,908 | | | | 414,427 | |
| | | | | | |
| | Cost of shares redeemed | | | (155,985 | ) | | | (1,027,311 | ) | | | | | | | (6,759,586 | ) | | | (20,612,037 | ) |
| | | | | | |
| | Net increase (decrease) in net assets resulting from share transactions | | | 291,972 | | | | 220,687 | | | | | | | | (1,493,885 | ) | | | (19,069,419 | ) |
| | | | | | |
| | TOTAL INCREASE (DECREASE) | | | (364,988 | ) | | | 1,390,001 | | | | | | | | (7,513,275 | ) | | | (17,120,191 | ) |
| | | | | | | | | | | | | | | | | | | | | | |
| | Net Assets: | | | | | | | | | | | | | |
| | | | | | |
| | Beginning of period | | | 7,278,706 | | | | 5,888,705 | | | | | | | | 23,742,165 | | | | 40,862,356 | |
| | | | | | |
| | End of period | | $ | 6,913,718 | | | $ | 7,278,706 | | | | | | | $ | 16,228,890 | | | $ | 23,742,165 | |
| | (a) | | Commenced operations on January 21, 2020. |
| | |
| The accompanying notes are an integral part of these financial statements. | | 21 |
GOLDMAN SACHS CHINA EQUITY FUND
Financial Highlights
Selected Data for a Share Outstanding Throughout Each Period
| | | | | | | | | | | | | | | | | | | | | | | | | | |
| | | | | Goldman Sachs China Equity Fund | |
| | | | | Class A Shares | |
| | | | | Six Months Ended
April 30, 2020
(Unaudited) | | | Year Ended October 31, | |
| | | | | 2019 | | | 2018 | | | 2017 | | | 2016 | | | 2015 | |
| | Per Share Data | | | | | | | | | | | | | | | | | | | | | | | | |
| | | | | | | |
| | Net asset value, beginning of period | | $ | 25.87 | | | $ | 23.13 | | | $ | 27.69 | | | $ | 21.08 | | | $ | 20.28 | | | $ | 20.04 | |
| | | | | | | |
| | Net investment income (loss)(a) | | | (0.17 | ) | | | 0.04 | | | | 0.05 | | | | (0.02 | )(b) | | | (0.02 | ) | | | (0.03 | ) |
| | | | | | | |
| | Net realized and unrealized gain (loss) | | | 0.99 | | | | 4.23 | | | | (4.22 | ) | | | 6.63 | | | | 0.82 | | | | 0.27 | |
| | | | | | | |
| | Total from investment operations | | | 0.82 | | | | 4.27 | | | | (4.17 | ) | | | 6.61 | | | | 0.80 | | | | 0.24 | |
| | | | | | | |
| | Distributions to shareholders from net investment income | | | (0.16 | ) | | | (0.04 | ) | | | — | | | | — | | | | — | | | | — | |
| | | | | | | |
| | Distributions to shareholders from net realized gains | | | — | | | | (1.49 | ) | | | (0.39 | ) | | | — | | | | — | | | | — | |
| | | | | | | |
| | Total distributions | | | (0.16 | ) | | | (1.53 | ) | | | (0.39 | ) | | | — | | | | — | | | | — | |
| | | | | | | |
| | Net asset value, end of period | | $ | 26.53 | | | $ | 25.87 | | | $ | 23.13 | | | $ | 27.69 | | | $ | 21.08 | | | $ | 20.28 | |
| | | | | | | |
| | Total return(c) | | | 3.15 | % | | | 19.54 | % | | | (15.32 | )% | | | 31.36 | % | | | 3.93 | % | | | 1.20 | % |
| | | | | | | |
| | Net assets, end of period (in 000s) | | $ | 13,641 | | | $ | 13,397 | | | $ | 13,598 | | | $ | 16,860 | | | $ | 14,975 | | | $ | 16,310 | |
| | | | | | | |
| | Ratio of net expenses to average net assets | | | 1.48 | %(d) | | | 1.51 | % | | | 1.54 | % | | | 1.55 | % | | | 1.60 | % | | | 1.69 | % |
| | | | | | | |
| | Ratio of total expenses to average net assets | | | 2.02 | %(d) | | | 2.10 | % | | | 1.91 | % | | | 2.03 | % | | | 2.18 | % | | | 1.99 | % |
| | | | | | | |
| | Ratio of net investment income (loss) to average net assets | | | (1.29 | )%(d) | | | 0.17 | % | | | 0.17 | % | | | (0.09 | )%(b) | | | (0.08 | )% | | | (0.16 | )% |
| | | | | | | |
| | Portfolio turnover rate(e) | | | 90 | % | | | 20 | % | | | 39 | % | | | 89 | % | | | 111 | % | | | 153 | % |
| | (a) | | Calculated based on the average shares outstanding methodology. |
| | (b) | | Reflects income recognized from special dividends which amounted to $0.04 per share and 0.17% of average net assets. |
| | (c) | | Assumes investment at the net asset value at the beginning of the period, reinvestment of all distributions, a complete redemption of the investment at the net asset value at the end of the period and no sales or redemption charges (if any). Total returns would be reduced if a sales or redemption charge was taken into account. Returns do not reflect the impact of taxes to shareholders relating to Fund distributions or the redemption of Fund shares. Total returns for periods less than one full year are not annualized. |
| | (e) | | The Fund’s portfolio turnover rate is calculated in accordance with regulatory requirements, without regard to transactions involving short term investments. If such transactions were included, the Fund’s portfolio turnover rate may be higher. |
| | |
| 22 | | The accompanying notes are an integral part of these financial statements. |
GOLDMAN SACHS CHINA EQUITY FUND
Financial Highlights(continued)
Selected Data for a Share Outstanding Throughout Each Period
| | | | | | | | | | | | | | | | | | | | | | | | | | |
| | | | | Goldman Sachs China Equity Fund | |
| | | | | Class C Shares | |
| | | | | Six Months Ended
April 30, 2020
(Unaudited) | | | Year Ended October 31, | |
| | | | | 2019 | | | 2018 | | | 2017 | | | 2016 | | | 2015 | |
| | Per Share Data | | | | | | | | | | | | | | | | | | | | | | | | |
| | | | | | | |
| | Net asset value, beginning of period | | $ | 23.14 | | | $ | 20.95 | | | $ | 25.31 | | | $ | 19.41 | | | $ | 18.81 | | | $ | 18.73 | |
| | | | | | | |
| | Net investment loss(a) | | | (0.24 | ) | | | (0.14 | ) | | | (0.13 | ) | | | (0.17 | )(b) | | | (0.15 | ) | | | (0.18 | ) |
| | | | | | | |
| | Net realized and unrealized gain (loss) | | | 0.88 | | | | 3.82 | | | | (3.84 | ) | | | 6.07 | | | | 0.75 | | | | 0.26 | |
| | | | | | | |
| | Total from investment operations | | | 0.64 | | | | 3.68 | | | | (3.97 | ) | | | 5.90 | | | | 0.60 | | | | 0.08 | |
| | | | | | | |
| | Distributions to shareholders from net realized gains | | | — | | | | (1.49 | ) | | | (0.39 | ) | | | — | | | | — | | | | — | |
| | | | | | | |
| | Net asset value, end of period | | $ | 23.78 | | | $ | 23.14 | | | $ | 20.95 | | | $ | 25.31 | | | $ | 19.41 | | | $ | 18.81 | |
| | | | | | | |
| | Total return(c) | | | 2.77 | % | | | 18.66 | % | | | (15.94 | )% | | | 30.35 | % | | | 3.18 | % | | | 0.43 | % |
| | | | | | | |
| | Net assets, end of period (in 000s) | | $ | 906 | | | $ | 896 | | | $ | 1,318 | | | $ | 1,732 | | | $ | 1,810 | | | $ | 1,951 | |
| | | | | | | |
| | Ratio of net expenses to average net assets | | | 2.23 | %(d) | | | 2.27 | % | | | 2.29 | % | | | 2.30 | % | | | 2.35 | % | | | 2.44 | % |
| | | | | | | |
| | Ratio of total expenses to average net assets | | | 2.77 | %(d) | | | 2.85 | % | | | 2.66 | % | | | 2.78 | % | | | 2.93 | % | | | 2.76 | % |
| | | | | | | |
| | Ratio of net investment loss to average net assets | | | (2.05 | )%(d) | | | (0.63 | )% | | | (0.52 | )% | | | (0.79 | )%(b) | | | (0.83 | )% | | | (0.91 | )% |
| | | | | | | |
| | Portfolio turnover rate(e) | | | 90 | % | | | 20 | % | | | 39 | % | | | 89 | % | | | 111 | % | | | 153 | % |
| | (a) | | Calculated based on the average shares outstanding methodology. |
| | (b) | | Reflects income recognized from special dividends which amounted to $0.04 per share and 0.17% of average net assets. |
| | (c) | | Assumes investment at the net asset value at the beginning of the period, reinvestment of all distributions, a complete redemption of the investment at the net asset value at the end of the period and no sales or redemption charges (if any). Total returns would be reduced if a sales or redemption charge was taken into account. Returns do not reflect the impact of taxes to shareholders relating to Fund distributions or the redemption of Fund shares. Total returns for periods less than one full year are not annualized. |
| | (e) | | The Fund’s portfolio turnover rate is calculated in accordance with regulatory requirements, without regard to transactions involving short term investments. If such transactions were included, the Fund’s portfolio turnover rate may be higher. |
| | |
| The accompanying notes are an integral part of these financial statements. | | 23 |
GOLDMAN SACHS CHINA EQUITY FUND
Financial Highlights(continued)
Selected Data for a Share Outstanding Throughout Each Period
| | | | | | | | | | | | | | | | | | | | | | | | | | |
| | | | | Goldman Sachs China Equity Fund | |
| | | | | Institutional Shares | |
| | | | | Six Months Ended
April 30, 2020
(Unaudited) | | | Year Ended October 31, | |
| | | | | 2019 | | | 2018 | | | 2017 | | | 2016 | | | 2015 | |
| | Per Share Data | | | | | | | | | | | | | | | | | | | | | | | | |
| | | | | | | |
| | Net asset value, beginning of period | | $ | 27.63 | | | $ | 24.56 | | | $ | 29.28 | | | $ | 22.20 | | | $ | 21.27 | | | $ | 20.99 | |
| | | | | | | |
| | Net investment income (loss)(a) | | | (0.14 | ) | | | 0.14 | | | | 0.19 | | | | 0.09 | (b) | | | 0.07 | | | | 0.05 | |
| | | | | | | |
| | Net realized and unrealized gain (loss) | | | 1.07 | | | | 4.50 | | | | (4.51 | ) | | | 6.99 | | | | 0.86 | | | | 0.29 | |
| | | | | | | |
| | Total from investment operations | | | 0.93 | | | | 4.64 | | | | (4.32 | ) | | | 7.08 | | | | 0.93 | | | | 0.34 | |
| | | | | | | |
| | Distributions to shareholders from net investment income | | | (0.25 | ) | | | (0.08 | ) | | | (0.01 | ) | | | — | | | | — | | | | (0.06 | ) |
| | | | | | | |
| | Distributions to shareholders from net realized gains | | | — | | | | (1.49 | ) | | | (0.39 | ) | | | — | | | | — | | | | — | |
| | | | | | | |
| | Total distributions | | | (0.25 | ) | | | (1.57 | ) | | | (0.40 | ) | | | — | | | | — | | | | (0.06 | ) |
| | | | | | | |
| | Net asset value, end of period | | $ | 28.31 | | | $ | 27.63 | | | $ | 24.56 | | | $ | 29.28 | | | $ | 22.20 | | | $ | 21.27 | |
| | | | | | | |
| | Total return(c) | | | 3.35 | % | | | 19.98 | % | | | (14.98 | )% | | | 31.91 | % | | | 4.31 | % | | | 1.60 | % |
| | | | | | | |
| | Net assets, end of period (in 000s) | | $ | 7,031 | | | $ | 6,327 | | | $ | 6,997 | | | $ | 62,843 | | | $ | 56,077 | | | $ | 58,967 | |
| | | | | | | |
| | Ratio of net expenses to average net assets | | | 1.15 | %(d) | | | 1.15 | % | | | 1.15 | % | | | 1.15 | % | | | 1.20 | % | | | 1.29 | % |
| | | | | | | |
| | Ratio of total expenses to average net assets | | | 1.64 | %(d) | | | 1.71 | % | | | 1.47 | % | | | 1.63 | % | | | 1.78 | % | | | 1.61 | % |
| | | | | | | |
| | Ratio of net investment income (loss) to average net assets | | | (0.96 | )%(d) | | | 0.54 | % | | | 0.63 | % | | | 0.36 | %(b) | | | 0.32 | % | | | 0.21 | % |
| | | | | | | |
| | Portfolio turnover rate(e) | | | 90 | % | | | 20 | % | | | 39 | % | | | 89 | % | | | 111 | % | | | 153 | % |
| | (a) | | Calculated based on the average shares outstanding methodology. |
| | (b) | | Reflects income recognized from special dividends which amounted to $0.04 per share and 0.17% of average net assets. |
| | (c) | | Assumes investment at the net asset value at the beginning of the period, reinvestment of all distributions, a complete redemption of the investment at the net asset value at the end of the period and no sales or redemption charges (if any). Total returns would be reduced if a sales or redemption charge was taken into account. Returns do not reflect the impact of taxes to shareholders relating to Fund distributions or the redemption of Fund shares. Total returns for periods less than one full year are not annualized. |
| | (e) | | The Fund’s portfolio turnover rate is calculated in accordance with regulatory requirements, without regard to transactions involving short term investments. If such transactions were included, the Fund’s portfolio turnover rate may be higher. |
| | |
| 24 | | The accompanying notes are an integral part of these financial statements. |
GOLDMAN SACHS CHINA EQUITY FUND
Financial Highlights(continued)
Selected Data for a Share Outstanding Throughout Each Period
| | | | | | | | | | | | | | | | | | | | | | | | | | |
| | | | | Goldman Sachs China Equity Fund | |
| | | | | Investor Shares(a) | |
| | | | | Six Months Ended
April 30, 2020
(Unaudited) | | | Year Ended October 31, | |
| | | | | 2019 | | | 2018 | | | 2017 | | | 2016 | | | 2015 | |
| | Per Share Data | | | | | | | | | | | | | | | | | | | | | | | | |
| | | | | | | |
| | Net asset value, beginning of period | | $ | 27.46 | | | $ | 24.41 | | | $ | 29.14 | | | $ | 22.12 | | | $ | 21.23 | | | $ | 20.98 | |
| | | | | | | |
| | Net investment income (loss)(b) | | | (0.15 | ) | | | 0.09 | | | | 0.15 | | | | 0.06 | (c) | | | 0.06 | | | | 0.01 | |
| | | | | | | |
| | Net realized and unrealized gain (loss) | | | 1.05 | | | | 4.50 | | | | (4.48 | ) | | | 6.96 | | | | 0.83 | | | | 0.29 | |
| | | | | | | |
| | Total from investment operations | | | 0.90 | | | | 4.59 | | | | (4.33 | ) | | | 7.02 | | | | 0.89 | | | | 0.30 | |
| | | | | | | |
| | Distributions to shareholders from net investment income | | | (0.22 | ) | | | (0.05 | ) | | | (0.01 | ) | | | — | | | | — | | | | (0.05 | ) |
| | | | | | | |
| | Distributions to shareholders from net realized gains | | | — | | | | (1.49 | ) | | | (0.39 | ) | | | — | | | | — | | | | — | |
| | | | | | | |
| | Total distributions | | | (0.22 | ) | | | (1.54 | ) | | | (0.40 | ) | | | — | | | | — | | | | (0.05 | ) |
| | | | | | | |
| | Net asset value, end of period | | $ | 28.14 | | | $ | 27.46 | | | $ | 24.41 | | | $ | 29.14 | | | $ | 22.12 | | | $ | 21.23 | |
| | | | | | | |
| | Total return(d) | | | 3.27 | % | | | 19.86 | % | | | (15.11 | )% | | | 31.74 | % | | | 4.18 | % | | | 1.46 | % |
| | | | | | | |
| | Net assets, end of period (in 000s) | | $ | 265 | | | $ | 226 | | | $ | 392 | | | $ | 136 | | | $ | 57 | | | $ | 52 | |
| | | | | | | |
| | Ratio of net expenses to average net assets | | | 1.23 | %(e) | | | 1.27 | % | | | 1.29 | % | | | 1.30 | % | | | 1.34 | % | | | 1.44 | % |
| | | | | | | |
| | Ratio of total expenses to average net assets | | | 1.77 | %(e) | | | 1.85 | % | | | 1.63 | % | | | 1.78 | % | | | 1.93 | % | | | 1.75 | % |
| | | | | | | |
| | Ratio of net investment income (loss) to average net assets | | | (1.06 | )%(e) | | | 0.35 | % | | | 0.52 | % | | | 0.24 | %(c) | | | 0.27 | % | | | 0.06 | % |
| | | | | | | |
| | Portfolio turnover rate(f) | | | 90 | % | | | 20 | % | | | 39 | % | | | 89 | % | | | 111 | % | | | 153 | % |
| | (a) | | Effective August 15, 2017, Class IR changed its name to Investor Shares. |
| | (b) | | Calculated based on the average shares outstanding methodology. |
| | (c) | | Reflects income recognized from special dividends which amounted to $0.04 per share and 0.17% of average net assets. |
| | (d) | | Assumes investment at the net asset value at the beginning of the period, reinvestment of all distributions, a complete redemption of the investment at the net asset value at the end of the period and no sales or redemption charges (if any). Total returns would be reduced if a sales or redemption charge was taken into account. Returns do not reflect the impact of taxes to shareholders relating to Fund distributions or the redemption of Fund shares. Total returns for periods less than one full year are not annualized. |
| | (f) | | The Fund’s portfolio turnover rate is calculated in accordance with regulatory requirements, without regard to transactions involving short term investments. If such transactions were included, the Fund’s portfolio turnover rate may be higher. |
| | |
| The accompanying notes are an integral part of these financial statements. | | 25 |
GOLDMAN SACHS CHINA EQUITY FUND
Financial Highlights(continued)
Selected Data for a Share Outstanding Throughout Each Period
| | | | | | | | | | | | | | |
| | | | | Goldman Sachs China Equity Fund | |
| | | | | Class P Shares | |
| | | | | Six Months Ended
April 30, 2020
(Unaudited) | | | Year Ended
October 31, 2019 | | | April 16, 2018*
to
October 31, 2018 | |
| | Per Share Data | | | | | | | | | | | | |
| | | | |
| | Net asset value, beginning of period | | $ | 27.55 | | | $ | 24.57 | | | $ | 30.61 | |
| | | | |
| | Net investment income (loss)(a) | | | (0.13 | ) | | | 0.14 | | | | 0.09 | |
| | | | |
| | Net realized and unrealized gain (loss) | | | 1.06 | | | | 4.49 | | | | (6.13 | ) |
| | | | |
| | Total from investment operations | | | 0.93 | | | | 4.63 | | | | (6.04 | ) |
| | | | |
| | Distributions to shareholders from net investment income | | | (0.26 | ) | | | (0.16 | ) | | | — | |
| | | | |
| | Distributions to shareholders from net realized gains | | | — | | | | (1.49 | ) | | | — | |
| | | | |
| | Total distributions | | | (0.26 | ) | | | (1.65 | ) | | | — | |
| | | | |
| | Net asset value, end of period | | $ | 28.22 | | | $ | 27.55 | | | $ | 24.57 | |
| | | | |
| | Total return(b) | | | 3.34 | % | | | 19.98 | % | | | (19.73 | )% |
| | | | |
| | Net assets, end of period (in 000s) | | $ | 39,790 | | | $ | 52,673 | | | $ | 47,901 | |
| | | | |
| | Ratio of net expenses to average net assets | | | 1.14 | %(c) | | | 1.15 | % | | | 1.14 | %(c) |
| | | | |
| | Ratio of total expenses to average net assets | | | 1.62 | %(c) | | | 1.70 | % | | | 1.77 | %(c) |
| | | | |
| | Ratio of net investment income (loss) to average net assets | | | (0.93 | )%(c) | | | 0.55 | % | | | 0.59 | %(c) |
| | | | |
| | Portfolio turnover rate(d) | | | 90 | % | | | 20 | % | | | 39 | % |
| | * | | Commencement of operations. |
| | (a) | | Calculated based on the average shares outstanding methodology. |
| | (b) | | Assumes investment at the net asset value at the beginning of the period, reinvestment of all distributions, a complete redemption of the investment at the net asset value at the end of the period and no sales or redemption charges (if any). Total returns would be reduced if a sales or redemption charge was taken into account. Returns do not reflect the impact of taxes to shareholders relating to Fund distributions or the redemption of Fund shares. Total returns for periods less than one full year are not annualized. |
| | (d) | | The Fund’s portfolio turnover rate is calculated in accordance with regulatory requirements, without regard to transactions involving short term investments. If such transactions were included, the Fund’s portfolio turnover rate may be higher. |
| | |
| 26 | | The accompanying notes are an integral part of these financial statements. |
GOLDMAN SACHS CHINA EQUITY FUND
Financial Highlights(continued)
Selected Data for a Share Outstanding Throughout Each Period
| | | | | | | | | | | | | | |
| | | | | Goldman Sachs China Equity Fund | |
| | | | | Class R6 Shares | |
| | | | | Six Months Ended
April 30, 2020
(Unaudited) | | | Year Ended
October 31, 2019 | | | February 28, 2018*
to
October 31, 2018 | |
| | Per Share Data | | | | | | | | | | | | |
| | | | |
| | Net asset value, beginning of period | | $ | 27.54 | | | $ | 24.56 | | | $ | 30.83 | |
| | | | |
| | Net investment income (loss)(a) | | | (0.13 | ) | | | 0.15 | | | | 0.19 | |
| | | | |
| | Net realized and unrealized gain (loss) | | | 1.06 | | | | 4.48 | | | | (6.46 | ) |
| | | | |
| | Total from investment operations | | | 0.93 | | | | 4.63 | | | | (6.27 | ) |
| | | | |
| | Distributions to shareholders from net investment income | | | (0.26 | ) | | | (0.16 | ) | | | — | |
| | | | |
| | Distributions to shareholders from net realized gains | | | — | | | | (1.49 | ) | | | — | |
| | | | |
| | Total distributions | | | (0.26 | ) | | | (1.65 | ) | | | — | |
| | | | |
| | Net asset value, end of period | | $ | 28.21 | | | $ | 27.54 | | | $ | 24.56 | |
| | | | |
| | Total return(b) | | | 3.34 | % | | | 19.96 | % | | | (20.34 | )% |
| | | | |
| | Net assets, end of period (in 000s) | | $ | 282 | | | $ | 432 | | | $ | 8 | |
| | | | |
| | Ratio of net expenses to average net assets | | | 1.14 | %(c) | | | 1.15 | % | | | 1.15 | %(c) |
| | | | |
| | Ratio of total expenses to average net assets | | | 1.62 | %(c) | | | 1.70 | % | | | 1.55 | %(c) |
| | | | |
| | Ratio of net investment income (loss) to average net assets | | | (0.94 | )%(c) | | | 0.57 | % | | | 1.00 | %(c) |
| | | | |
| | Portfolio turnover rate(d) | | | 90 | % | | | 20 | % | | | 39 | % |
| | * | | Commencement of operations. |
| | (a) | | Calculated based on the average shares outstanding methodology. |
| | (b) | | Assumes investment at the net asset value at the beginning of the period, reinvestment of all distributions, a complete redemption of the investment at the net asset value at the end of the period and no sales or redemption charges (if any). Total returns would be reduced if a sales or redemption charge was taken into account. Returns do not reflect the impact of taxes to shareholders relating to Fund distributions or the redemption of Fund shares. Total returns for periods less than one full year are not annualized. |
| | (d) | | The Fund’s portfolio turnover rate is calculated in accordance with regulatory requirements, without regard to transactions involving short term investments. If such transactions were included, the Fund’s portfolio turnover rate may be higher. |
| | |
| The accompanying notes are an integral part of these financial statements. | | 27 |
GOLDMAN SACHS EMERGING MARKETS EQUITY FUND
Financial Highlights(continued)
Selected Data for a Share Outstanding Throughout Each Period
| | | | | | | | | | | | | | | | | | | | | | | | | | |
| | | | | Goldman Sachs Emerging Markets Equity Fund | |
| | | | | Class A Shares | |
| | | | | Six Months Ended
April 30, 2020
(Unaudited) | | | Year Ended October 31, | |
| | | | | 2019 | | | 2018 | | | 2017 | | | 2016 | | | 2015 | |
| | Per Share Data | | | | | | | | | | | | | | | | | | | | | | | | |
| | | | | | | |
| | Net asset value, beginning of period | | $ | 20.35 | | | $ | 17.18 | | | $ | 20.91 | | | $ | 16.23 | | | $ | 14.75 | | | $ | 16.00 | |
| | | | | | | |
| | Net investment income (loss)(a) | | | (0.02 | ) | | | 0.07 | | | | 0.10 | | | | 0.05 | (b) | | | 0.04 | | | | 0.03 | |
| | | | | | | |
| | Net realized and unrealized gain (loss) | | | (1.83 | ) | | | 3.18 | | | | (3.69 | ) | | | 4.74 | | | | 1.44 | | | | (1.28 | ) |
| | | | | | | |
| | Total from investment operations | | | (1.85 | ) | | | 3.25 | | | | (3.59 | ) | | | 4.79 | | | | 1.48 | | | | (1.25 | ) |
| | | | | | | |
| | Distributions to shareholders from net investment income | | | (0.19 | ) | | | (0.08 | ) | | | (0.14 | ) | | | (0.11 | ) | | | — | | | | — | |
| | | | | | | |
| | Net asset value, end of period | | $ | 18.31 | | | $ | 20.35 | | | $ | 17.18 | | | $ | 20.91 | | | $ | 16.23 | | | $ | 14.75 | |
| | | | | | | |
| | Total return(c) | | | (9.24 | )% | | | 19.03 | % | | | (17.32 | )% | | | 29.78 | % | | | 10.01 | % | | | (7.81 | )% |
| | | | | | | |
| | Net assets, end of period (in 000s) | | $ | 211,816 | | | $ | 230,234 | | | $ | 152,596 | | | $ | 85,679 | | | $ | 59,593 | | | $ | 64,169 | |
| | | | | | | |
| | Ratio of net expenses to average net assets | | | 1.50 | %(d) | | | 1.55 | % | | | 1.56 | % | | | 1.57 | % | | | 1.65 | % | | | 1.67 | % |
| | | | | | | |
| | Ratio of total expenses to average net assets | | | 1.52 | %(d) | | | 1.58 | % | | | 1.64 | % | | | 1.75 | % | | | 1.90 | % | | | 1.91 | % |
| | | | | | | |
| | Ratio of net investment income (loss) to average net assets | | | (0.17 | )%(d) | | | 0.39 | % | | | 0.46 | % | | | 0.29 | %(b) | | | 0.27 | % | | | 0.17 | % |
| | | | | | | |
| | Portfolio turnover rate(e) | | | 17 | % | | | 33 | % | | | 52 | % | | | 113 | % | | | 92 | % | | | 118 | % |
| | (a) | | Calculated based on the average shares outstanding methodology. |
| | (b) | | Reflects income recognized from special dividends which amounted to $0.04 per share and 0.19% of average net assets. |
| | (c) | | Assumes investment at the net asset value at the beginning of the period, reinvestment of all distributions, a complete redemption of the investment at the net asset value at the end of the period and no sales or redemption charges (if any). Total returns would be reduced if a sales or redemption charge was taken into account. Returns do not reflect the impact of taxes to shareholders relating to Fund distributions or the redemption of Fund shares. Total returns for periods less than one full year are not annualized. |
| | (e) | | The Fund’s portfolio turnover rate is calculated in accordance with regulatory requirements, without regard to transactions involving short term investments. If such transactions were included, the Fund’s portfolio turnover rate may be higher. |
| | |
| 28 | | The accompanying notes are an integral part of these financial statements. |
GOLDMAN SACHS EMERGING MARKETS EQUITY FUND
Financial Highlights(continued)
Selected Data for a Share Outstanding Throughout Each Period
| | | | | | | | | | | | | | | | | | | | | | | | | | |
| | | | | Goldman Sachs Emerging Markets Equity Fund | |
| | | | | Class C Shares | |
| | | | | Six Months Ended
April 30, 2020
(Unaudited) | | | Year Ended October 31, | |
| | | | | 2019 | | | 2018 | | | 2017 | | | 2016 | | | 2015 | |
| | Per Share Data | | | | | | | | | | | | | | | | | | | | | | | | |
| | | | | | | |
| | Net asset value, beginning of period | | $ | 18.12 | | | $ | 15.34 | | | $ | 18.72 | | | $ | 14.53 | | | $ | 13.31 | | | $ | 14.55 | |
| | | | | | | |
| | Net investment loss(a) | | | (0.08 | ) | | | (0.06 | ) | | | (0.05 | ) | | | (0.09 | )(b) | | | (0.06 | ) | | | (0.10 | ) |
| | | | | | | |
| | Net realized and unrealized gain (loss) | | | (1.65 | ) | | | 2.84 | | | | (3.30 | ) | | | 4.28 | | | | 1.28 | | | | (1.14 | ) |
| | | | | | | |
| | Total from investment operations | | | (1.73 | ) | | | 2.78 | | | | (3.35 | ) | | | 4.19 | | | | 1.22 | | | | (1.24 | ) |
| | | | | | | |
| | Distributions to shareholders from net investment income | | | (0.02 | ) | | | — | | | | (0.03 | ) | | | — | | | | — | | | | — | |
| | | | | | | |
| | Net asset value, end of period | | $ | 16.37 | | | $ | 18.12 | | | $ | 15.34 | | | $ | 18.72 | | | $ | 14.53 | | | $ | 13.31 | |
| | | | | | | |
| | Total return(c) | | | (9.62 | )% | | | 18.12 | % | | | (17.91 | )% | | | 28.84 | % | | | 9.14 | % | | | (8.52 | )% |
| | | | | | | |
| | Net assets, end of period (in 000s) | | $ | 22,065 | | | $ | 30,115 | | | $ | 33,252 | | | $ | 36,286 | | | $ | 30,104 | | | $ | 35,927 | |
| | | | | | | |
| | Ratio of net expenses to average net assets | | | 2.25 | %(d) | | | 2.30 | % | | | 2.31 | % | | | 2.32 | % | | | 2.40 | % | | | 2.41 | % |
| | | | | | | |
| | Ratio of total expenses to average net assets | | | 2.27 | %(d) | | | 2.33 | % | | | 2.39 | % | | | 2.50 | % | | | 2.65 | % | | | 2.67 | % |
| | | | | | | |
| | Ratio of net investment loss to average net assets | | | (0.94 | )%(d) | | | (0.33 | )% | | | (0.25 | )% | | | (0.55 | )%(b) | | | (0.48 | )% | | | (0.68 | )% |
| | | | | | | |
| | Portfolio turnover rate(e) | | | 17 | % | | | 33 | % | | | 52 | % | | | 113 | % | | | 92 | % | | | 118 | % |
| | (a) | | Calculated based on the average shares outstanding methodology. |
| | (b) | | Reflects income recognized from special dividends which amounted to $0.04 per share and 0.19% of average net assets. |
| | (c) | | Assumes investment at the net asset value at the beginning of the period, reinvestment of all distributions, a complete redemption of the investment at the net asset value at the end of the period and no sales or redemption charges (if any). Total returns would be reduced if a sales or redemption charge was taken into account. Returns do not reflect the impact of taxes to shareholders relating to Fund distributions or the redemption of Fund shares. Total returns for periods less than one full year are not annualized. |
| | (e) | | The Fund’s portfolio turnover rate is calculated in accordance with regulatory requirements, without regard to transactions involving short term investments. If such transactions were included, the Fund’s portfolio turnover rate may be higher. |
| | |
| The accompanying notes are an integral part of these financial statements. | | 29 |
GOLDMAN SACHS EMERGING MARKETS EQUITY FUND
Financial Highlights(continued)
Selected Data for a Share Outstanding Throughout Each Period
| | | | | | | | | | | | | | | | | | | | | | | | | | |
| | | | | Goldman Sachs Emerging Markets Equity Fund | |
| | | | | Institutional Shares | |
| | | | | Six Months Ended
April 30, 2020
(Unaudited) | | | Year Ended October 31, | |
| | | | | 2019 | | | 2018 | | | 2017 | | | 2016 | | | 2015 | |
| | Per Share Data | | | | | | | | | | | | | | | | | | | | | | | | |
| | | | | | | |
| | Net asset value, beginning of period | | $ | 21.85 | | | $ | 18.43 | | | $ | 22.40 | | | $ | 17.38 | | | $ | 15.75 | | | $ | 17.08 | |
| | | | | | | |
| | Net investment income(a) | | | 0.02 | | | | 0.17 | | | | 0.20 | | | | 0.12 | (b) | | | 0.11 | | | | 0.08 | |
| | | | | | | |
| | Net realized and unrealized gain (loss) | | | (1.97 | ) | | | 3.40 | | | | (3.96 | ) | | | 5.07 | | | | 1.54 | | | | (1.36 | ) |
| | | | | | | |
| | Total from investment operations | | | (1.95 | ) | | | 3.57 | | | | (3.76 | ) | | | 5.19 | | | | 1.65 | | | | (1.28 | ) |
| | | | | | | |
| | Distributions to shareholders from net investment income | | | (0.25 | ) | | | (0.15 | ) | | | (0.21 | ) | | | (0.17 | ) | | | (0.02 | ) | | | (0.05 | ) |
| | | | | | | |
| | Net asset value, end of period | | $ | 19.65 | | | $ | 21.85 | | | $ | 18.43 | | | $ | 22.40 | | | $ | 17.38 | | | $ | 15.75 | |
| | | | | | | |
| | Total return(c) | | | (9.13 | )% | | | 19.51 | % | | | (16.99 | )% | | | 30.31 | % | | | 10.43 | % | | | (7.49 | )% |
| | | | | | | |
| | Net assets, end of period (in 000s) | | $ | 1,093,128 | | | $ | 940,632 | | | $ | 678,197 | | | $ | 664,085 | | | $ | 445,019 | | | $ | 326,068 | |
| | | | | | | |
| | Ratio of net expenses to average net assets | | | 1.14 | %(d) | | | 1.17 | % | | | 1.17 | % | | | 1.18 | % | | | 1.25 | % | | | 1.28 | % |
| | | | | | | |
| | Ratio of total expenses to average net assets | | | 1.14 | %(d) | | | 1.19 | % | | | 1.24 | % | | | 1.36 | % | | | 1.50 | % | | | 1.52 | % |
| | | | | | | |
| | Ratio of net investment income to average net assets | | | 0.21 | %(d) | | | 0.84 | % | | | 0.91 | % | | | 0.63 | %(b) | | | 0.69 | % | | | 0.48 | % |
| | | | | | | |
| | Portfolio turnover rate(e) | | | 17 | % | | | 33 | % | | | 52 | % | | | 113 | % | | | 92 | % | | | 118 | % |
| | (a) | | Calculated based on the average shares outstanding methodology. |
| | (b) | | Reflects income recognized from special dividends which amounted to $0.04 per share and 0.19% of average net assets. |
| | (c) | | Assumes investment at the net asset value at the beginning of the period, reinvestment of all distributions, a complete redemption of the investment at the net asset value at the end of the period and no sales or redemption charges (if any). Total returns would be reduced if a sales or redemption charge was taken into account. Returns do not reflect the impact of taxes to shareholders relating to Fund distributions or the redemption of Fund shares. Total returns for periods less than one full year are not annualized. |
| | (e) | | The Fund’s portfolio turnover rate is calculated in accordance with regulatory requirements, without regard to transactions involving short term investments. If such transactions were included, the Fund’s portfolio turnover rate may be higher. |
| | |
| 30 | | The accompanying notes are an integral part of these financial statements. |
GOLDMAN SACHS EMERGING MARKETS EQUITY FUND
Financial Highlights(continued)
Selected Data for a Share Outstanding Throughout Each Period
| | | | | | | | | | | | | | | | | | | | | | | | | | |
| | | | | Goldman Sachs Emerging Markets Equity Fund | |
| | | | | Service Shares | |
| | | | | Six Months Ended
April 30, 2020
(Unaudited) | | | Year Ended October 31, | |
| | | | | 2019 | | | 2018 | | | 2017 | | | 2016 | | | 2015 | |
| | Per Share Data | | | | | | | | | | | | | | | | | | | | | | | | |
| | | | | | | |
| | Net asset value, beginning of period | | $ | 19.68 | | | $ | 16.60 | | | $ | 20.21 | | | $ | 15.71 | | | $ | 14.29 | | | $ | 15.52 | |
| | | | | | | |
| | Net investment income (loss)(a) | | | (0.03 | ) | | | 0.06 | | | | 0.07 | | | | 0.02 | (b) | | | 0.02 | | | | — | (c) |
| | | | | | | |
| | Net realized and unrealized gain (loss) | | | (1.77 | ) | | | 3.06 | | | | (3.56 | ) | | | 4.59 | | | | 1.40 | | | | (1.23 | ) |
| | | | | | | |
| | Total from investment operations | | | (1.80 | ) | | | 3.12 | | | | (3.49 | ) | | | 4.61 | | | | 1.42 | | | | (1.23 | ) |
| | | | | | | |
| | Distributions to shareholders from net investment income | | | (0.16 | ) | | | (0.04 | ) | | | (0.12 | ) | | | (0.11 | ) | | | — | | | | — | |
| | | | | | | |
| | Net asset value, end of period | | $ | 17.72 | | | $ | 19.68 | | | $ | 16.60 | | | $ | 20.21 | | | $ | 15.71 | | | $ | 14.29 | |
| | | | | | | |
| | Total return(d) | | | (9.33 | )% | | | 18.85 | % | | | (17.38 | )% | | | 29.65 | % | | | 9.91 | % | | | (7.93 | )% |
| | | | | | | |
| | Net assets, end of period (in 000s) | | $ | 21,334 | | | $ | 24,183 | | | $ | 19,922 | | | $ | 26,049 | | | $ | 19,069 | | | $ | 15,759 | |
| | | | | | | |
| | Ratio of net expenses to average net assets | | | 1.64 | %(e) | | | 1.67 | % | | | 1.67 | % | | | 1.68 | % | | | 1.75 | % | | | 1.77 | % |
| | | | | | | |
| | Ratio of total expenses to average net assets | | | 1.64 | %(e) | | | 1.69 | % | | | 1.75 | % | | | 1.86 | % | | | 2.00 | % | | | 2.02 | % |
| | | | | | | |
| | Ratio of net investment income (loss) to average net assets | | | (0.31 | )%(e) | | | 0.32 | % | | | 0.36 | % | | | 0.11 | %(b) | | | 0.17 | % | | | 0.02 | % |
| | | | | | | |
| | Portfolio turnover rate(f) | | | 17 | % | | | 33 | % | | | 52 | % | | | 113 | % | | | 92 | % | | | 118 | % |
| | (a) | | Calculated based on the average shares outstanding methodology. |
| | (b) | | Reflects income recognized from special dividends which amounted to $0.04 per share and 0.19% of average net assets. |
| | (c) | | Amount is less than $0.005 per share. |
| | (d) | | Assumes investment at the net asset value at the beginning of the period, reinvestment of all distributions, a complete redemption of the investment at the net asset value at the end of the period and no sales or redemption charges (if any). Total returns would be reduced if a sales or redemption charge was taken into account. Returns do not reflect the impact of taxes to shareholders relating to Fund distributions or the redemption of Fund shares. Total returns for periods less than one full year are not annualized. |
| | (f) | | The Fund’s portfolio turnover rate is calculated in accordance with regulatory requirements, without regard to transactions involving short term investments. If such transactions were included, the Fund’s portfolio turnover rate may be higher. |
| | |
| The accompanying notes are an integral part of these financial statements. | | 31 |
GOLDMAN SACHS EMERGING MARKETS EQUITY FUND
Financial Highlights(continued)
Selected Data for a Share Outstanding Throughout Each Period
| | | | | | | | | | | | | | | | | | | | | | | | | | |
| | | | | Goldman Sachs Emerging Markets Equity Fund | |
| | | | | Investor Shares(a) | |
| | | | | Six Months Ended
April 30, 2020
(Unaudited) | | | Year Ended October 31, | |
| | | | | 2019 | | | 2018 | | | 2017 | | | 2016 | | | 2015 | |
| | Per Share Data | | | | | | | | | | | | | | | | | | | | | | | | |
| | | | | | | |
| | Net asset value, beginning of period | | $ | 21.66 | | | $ | 18.28 | | | $ | 22.24 | | | $ | 17.27 | | | $ | 15.67 | | | $ | 16.99 | |
| | | | | | | |
| | Net investment income(b) | | | — | (c) | | | 0.12 | | | | 0.17 | | | | 0.13 | (d) | | | 0.08 | | | | 0.01 | |
| | | | | | | |
| | Net realized and unrealized gain (loss) | | | (1.94 | ) | | | 3.38 | | | | (3.94 | ) | | | 5.01 | | | | 1.53 | | | | (1.30 | ) |
| | | | | | | |
| | Total from investment operations | | | (1.94 | ) | | | 3.50 | | | | (3.77 | ) | | | 5.14 | | | | 1.61 | | | | (1.29 | ) |
| | | | | | | |
| | Distributions to shareholders from net investment income | | | (0.22 | ) | | | (0.12 | ) | | | (0.19 | ) | | | (0.17 | ) | | | (0.01 | ) | | | (0.03 | ) |
| | | | | | | |
| | Net asset value, end of period | | $ | 19.50 | | | $ | 21.66 | | | $ | 18.28 | | | $ | 22.24 | | | $ | 17.27 | | | $ | 15.67 | |
| | | | | | | |
| | Total return(e) | | | (9.15 | )% | | | 19.31 | % | | | (17.07 | )% | | | 30.11 | % | | | 10.26 | % | | | (7.62 | )% |
| | | | | | | |
| | Net assets, end of period (in 000s) | | $ | 121,887 | | | $ | 135,484 | | | $ | 139,726 | | | $ | 62,974 | | | $ | 5,263 | | | $ | 1,424 | |
| | | | | | | |
| | Ratio of net expenses to average net assets | | | 1.25 | %(f) | | | 1.30 | % | | | 1.31 | % | | | 1.31 | % | | | 1.40 | % | | | 1.42 | % |
| | | | | | | |
| | Ratio of total expenses to average net assets | | | 1.27 | %(f) | | | 1.33 | % | | | 1.38 | % | | | 1.49 | % | | | 1.64 | % | | | 1.69 | % |
| | | | | | | |
| | Ratio of net investment income to average net assets | | | 0.02 | %(f) | | | 0.58 | % | | | 0.79 | % | | | 0.67 | %(d) | | | 0.52 | % | | | 0.04 | % |
| | | | | | | |
| | Portfolio turnover rate(g) | | | 17 | % | | | 33 | % | | | 52 | % | | | 113 | % | | | 92 | % | | | 118 | % |
| | (a) | | Effective August 15, 2017, Class IR changed its name to Investor Shares. |
| | (b) | | Calculated based on the average shares outstanding methodology. |
| | (c) | | Amount is less than $0.005 per share. |
| | (d) | | Reflects income recognized from special dividends which amounted to $0.04 per share and 0.19% of average net assets. |
| | (e) | | Assumes investment at the net asset value at the beginning of the period, reinvestment of all distributions, a complete redemption of the investment at the net asset value at the end of the period and no sales or redemption charges (if any). Total returns would be reduced if a sales or redemption charge was taken into account. Returns do not reflect the impact of taxes to shareholders relating to Fund distributions or the redemption of Fund shares. Total returns for periods less than one full year are not annualized. |
| | (g) | | The Fund’s portfolio turnover rate is calculated in accordance with regulatory requirements, without regard to transactions involving short term investments. If such transactions were included, the Fund’s portfolio turnover rate may be higher. |
| | |
| 32 | | The accompanying notes are an integral part of these financial statements. |
GOLDMAN SACHS EMERGING MARKETS EQUITY FUND
Financial Highlights(continued)
Selected Data for a Share Outstanding Throughout Each Period
| | | | | | | | | | | | | | |
| | | | | Goldman Sachs Emerging Markets Equity Fund | |
| | | | | Class P Shares | |
| | | | | Six Months Ended
April 30, 2020
(Unaudited) | | | Year Ended
October 31, 2019 | | | April 16, 2018*
to
October 31, 2018 | |
| | Per Share Data | | | | | | | | | | | | |
| | | | |
| | Net asset value, beginning of period | | $ | 21.94 | | | $ | 18.51 | | | $ | 23.46 | |
| | | | |
| | Net investment income(a) | | | 0.02 | | | | 0.17 | | | | 0.10 | |
| | | | |
| | Net realized and unrealized gain (loss) | | | (1.98 | ) | | | 3.41 | | | | (5.05 | ) |
| | | | |
| | Total from investment operations | | | (1.96 | ) | | | 3.58 | | | | (4.95 | ) |
| | | | |
| | Distributions to shareholders from net investment income | | | (0.25 | ) | | | (0.15 | ) | | | — | |
| | | | |
| | Net asset value, end of period | | $ | 19.73 | | | $ | 21.94 | | | $ | 18.51 | |
| | | | |
| | Total return(b) | | | (9.09 | )% | | | 19.47 | % | | | (21.06 | )% |
| | | | |
| | Net assets, end of period (in 000s) | | $ | 345,753 | | | $ | 389,019 | | | $ | 311,447 | |
| | | | |
| | Ratio of net expenses to average net assets | | | 1.13 | %(c) | | | 1.16 | % | | | 1.15 | %(c) |
| | | | |
| | Ratio of total expenses to average net assets | | | 1.13 | %(c) | | | 1.18 | % | | | 1.24 | %(c) |
| | | | |
| | Ratio of net investment income to average net assets | | | 0.18 | %(c) | | | 0.82 | % | | | 0.94 | %(c) |
| | | | |
| | Portfolio turnover rate(d) | | | 17 | % | | | 33 | % | | | 52 | % |
| | * | | Commencement of operations. |
| | (a) | | Calculated based on the average shares outstanding methodology. |
| | (b) | | Assumes investment at the net asset value at the beginning of the period, reinvestment of all distributions, a complete redemption of the investment at the net asset value at the end of the period and no sales or redemption charges (if any). Total returns would be reduced if a sales or redemption charge was taken into account. Returns do not reflect the impact of taxes to shareholders relating to Fund distributions or the redemption of Fund shares. Total returns for periods less than one full year are not annualized. |
| | (d) | | The Fund’s portfolio turnover rate is calculated in accordance with regulatory requirements, without regard to transactions involving short term investments. If such transactions were included, the Fund’s portfolio turnover rate may be higher. |
| | |
| The accompanying notes are an integral part of these financial statements. | | 33 |
GOLDMAN SACHS EMERGING MARKETS EQUITY FUND
Financial Highlights(continued)
Selected Data for a Share Outstanding Throughout Each Period
| | | | | | | | | | | | | | | | | | | | | | | | | | |
| | | | | Goldman Sachs Emerging Markets Equity Fund | |
| | | | | Class R6 Shares | |
| | | | | Six Months Ended
April 30, 2020
(Unaudited) | | | Year Ended October 31, | | | July 31, 2015* to October 31, 2015 | |
| | | | | 2019 | | | 2018 | | | 2017 | | | 2016 | |
| | Per Share Data | | | | | | | | | | | | | | | | | | | | | | | | |
| | | | | | | |
| | Net asset value, beginning of period | | $ | 21.94 | | | $ | 18.51 | | | $ | 22.41 | | | $ | 17.38 | | | $ | 15.74 | | | $ | 16.72 | |
| | | | | | | |
| | Net investment income(a) | | | 0.03 | | | | 0.17 | | | | 0.21 | | | | 0.16 | (b) | | | 0.10 | | | | 0.01 | |
| | | | | | | |
| | Net realized and unrealized gain (loss) | | | (1.99 | ) | | | 3.41 | | | | (4.00 | ) | | | 5.05 | | | | 1.56 | | | | (0.99 | ) |
| | | | | | | |
| | Total from investment operations | | | (1.96 | ) | | | 3.58 | | | | (3.79 | ) | | | 5.21 | | | | 1.66 | | | | (0.98 | ) |
| | | | | | | |
| | Distributions to shareholders from net investment income | | | (0.25 | ) | | | (0.15 | ) | | | (0.11 | ) | | | (0.18 | ) | | | (0.02 | ) | | | — | |
| | | | | | | |
| | Net asset value, end of period | | $ | 19.73 | | | $ | 21.94 | | | $ | 18.51 | | | $ | 22.41 | | | $ | 17.38 | | | $ | 15.74 | |
| | | | | | | |
| | Total return(c) | | | (9.09 | )% | | | 19.52 | % | | | (16.96 | )% | | | 30.35 | % | | | 10.52 | % | | | (5.86 | )% |
| | | | | | | |
| | Net assets, end of period (in 000s) | | $ | 17,801 | | | $ | 25,387 | | | $ | 37,865 | | | $ | 245 | | | $ | 5,012 | | | $ | 9 | |
| | | | | | | |
| | Ratio of net expenses to average net assets | | | 1.13 | %(d) | | | 1.16 | % | | | 1.16 | % | | | 1.17 | % | | | 1.23 | % | | | 1.24 | %(d) |
| | | | | | | |
| | Ratio of total expenses to average net assets | | | 1.13 | %(d) | | | 1.18 | % | | | 1.21 | % | | | 1.35 | % | | | 1.44 | % | | | 1.53 | %(d) |
| | | | | | | |
| | Ratio of net investment income to average net assets | | | 0.23 | %(d) | | | 0.82 | % | | | 0.99 | % | | | 0.88 | %(b) | | | 0.57 | % | | | 0.14 | %(d) |
| | | | | | | |
| | Portfolio turnover rate(e) | | | 17 | % | | | 33 | % | | | 52 | % | | | 113 | % | | | 92 | % | | | 118 | % |
| | * | | Commencement of operations. |
| | (a) | | Calculated based on the average shares outstanding methodology. |
| | (b) | | Reflects income recognized from special dividends which amounted to $0.04 per share and 0.19% of average net assets. |
| | (c) | | Assumes investment at the net asset value at the beginning of the period, reinvestment of all distributions, a complete redemption of the investment at the net asset value at the end of the period and no sales or redemption charges (if any). Total returns would be reduced if a sales or redemption charge was taken into account. Returns do not reflect the impact of taxes to shareholders relating to Fund distributions or the redemption of Fund shares. Total returns for periods less than one full year are not annualized. |
| | (e) | | The Fund’s portfolio turnover rate is calculated in accordance with regulatory requirements, without regard to transactions involving short term investments. If such transactions were included, the Fund’s portfolio turnover rate may be higher. |
| | |
| 34 | | The accompanying notes are an integral part of these financial statements. |
GOLDMAN SACHS ESG EMERGING MARKETS EQUITY FUND
Financial Highlights(continued)
Selected Data for a Share Outstanding Throughout Each Period
| | | | | | | | | | | | | | |
| | | | | Goldman Sachs ESG Emerging Markets Equity Fund | |
| | | | | Class A Shares | |
| | | | | Six Months Ended
April 30, 2020
(Unaudited) | | | Year Ended
October 31, 2019 | | | May 31, 2018*
to
October 31, 2018 | |
| | Per Share Data | | | | | | | | | | | | |
| | | | |
| | Net asset value, beginning of period | | $ | 9.95 | | | $ | 8.40 | | | $ | 10.00 | |
| | | | |
| | Net investment income (loss)(a) | | | (0.02 | ) | | | 0.04 | | | | 0.03 | |
| | | | |
| | Net realized and unrealized gain (loss) | | | (0.81 | ) | | | 1.53 | | | | (1.63 | ) |
| | | | |
| | Total from investment operations | | | (0.83 | ) | | | 1.57 | | | | (1.60 | ) |
| | | | |
| | Distributions to shareholders from net investment income | | | (0.06 | ) | | | (0.02 | ) | | | — | |
| | | | |
| | Net asset value, end of period | | $ | 9.06 | | | $ | 9.95 | | | $ | 8.40 | |
| | | | |
| | Total return(b) | | | (8.46 | )% | | | 18.74 | % | | | (16.00 | )% |
| | | | |
| | Net assets, end of period (in 000s) | | $ | 47 | | | $ | 50 | | | $ | 42 | |
| | | | |
| | Ratio of net expenses to average net assets | | | 1.51 | %(c) | | | 1.60 | % | | | 1.53 | %(c) |
| | | | |
| | Ratio of total expenses to average net assets | | | 5.32 | %(c) | | | 7.73 | % | | | 10.28 | %(c) |
| | | | |
| | Ratio of net investment income (loss) to average net assets | | | (0.37 | )%(c) | | | 0.44 | % | | | 0.64 | %(c) |
| | | | |
| | Portfolio turnover rate(d) | | | 14 | % | | | 57 | % | | | 23 | % |
| | * | | Commencement of operations. |
| | (a) | | Calculated based on the average shares outstanding methodology. |
| | (b) | | Assumes investment at the net asset value at the beginning of the period, reinvestment of all distributions, a complete redemption of the investment at the net asset value at the end of the period and no sales or redemption charges (if any). Total returns would be reduced if a sales or redemption charge was taken into account. Returns do not reflect the impact of taxes to shareholders relating to Fund distributions or the redemption of Fund shares. Total returns for periods less than one full year are not annualized. |
| | (d) | | The Fund’s portfolio turnover rate is calculated in accordance with regulatory requirements, without regard to transactions involving short term investments. If such transactions were included, the Fund’s portfolio turnover rate may be higher. |
| | |
| The accompanying notes are an integral part of these financial statements. | | 35 |
GOLDMAN SACHS ESG EMERGING MARKETS EQUITY FUND
Financial Highlights(continued)
Selected Data for a Share Outstanding Throughout Each Period
| | | | | | | | | | | | | | |
| | | | | Goldman Sachs ESG Emerging Markets Equity Fund | |
| | | | | Class C Shares | |
| | | | | Six Months Ended
April 30, 2020
(Unaudited) | | | Year Ended
October 31, 2019 | | | May 31, 2018*
to
October 31, 2018 | |
| | Per Share Data | | | | | | | | | | | | |
| | | | |
| | Net asset value, beginning of period | | $ | 9.87 | | | $ | 8.37 | | | $ | 10.00 | |
| | | | |
| | Net investment loss(a) | | | (0.06 | ) | | | (0.03 | ) | | | — | (b) |
| | | | |
| | Net realized and unrealized gain (loss) | | | (0.81 | ) | | | 1.53 | | | | (1.63 | ) |
| | | | |
| | Total from investment operations | | | (0.87 | ) | | | 1.50 | | | | (1.63 | ) |
| | | | |
| | Net asset value, end of period | | $ | 9.00 | | | $ | 9.87 | | | $ | 8.37 | |
| | | | |
| | Total return(c) | | | (8.81 | )% | | | 17.92 | % | | | (16.30 | )% |
| | | | |
| | Net assets, end of period (in 000s) | | $ | 45 | | | $ | 49 | | | $ | 42 | |
| | | | |
| | Ratio of net expenses to average net assets | | | 2.26 | %(d) | | | 2.35 | % | | | 2.28 | %(d) |
| | | | |
| | Ratio of total expenses to average net assets | | | 6.07 | %(d) | | | 8.49 | % | | | 11.03 | %(d) |
| | | | |
| | Ratio of net investment loss to average net assets | | | (1.13 | )%(d) | | | (0.31 | )% | | | (0.11 | )%(d) |
| | | | |
| | Portfolio turnover rate(e) | | | 14 | % | | | 57 | % | | | 23 | % |
| | * | | Commencement of operations. |
| | (a) | | Calculated based on the average shares outstanding methodology. |
| | (b) | | Amount is less than $0.005 per share. |
| | (c) | | Assumes investment at the net asset value at the beginning of the period, reinvestment of all distributions, a complete redemption of the investment at the net asset value at the end of the period and no sales or redemption charges (if any). Total returns would be reduced if a sales or redemption charge was taken into account. Returns do not reflect the impact of taxes to shareholders relating to Fund distributions or the redemption of Fund shares. Total returns for periods less than one full year are not annualized. |
| | (e) | | The Fund’s portfolio turnover rate is calculated in accordance with regulatory requirements, without regard to transactions involving short term investments. If such transactions were included, the Fund’s portfolio turnover rate may be higher. |
| | |
| 36 | | The accompanying notes are an integral part of these financial statements. |
GOLDMAN SACHS ESG EMERGING MARKETS EQUITY FUND
Financial Highlights(continued)
Selected Data for a Share Outstanding Throughout Each Period
| | | | | | | | | | | | | | |
| | | | | Goldman Sachs ESG Emerging Markets Equity Fund | |
| | | | | Institutional Shares | |
| | | | | Six Months Ended
April 30, 2020
(Unaudited) | | | Year Ended
October 31, 2019 | | | May 31, 2018*
to
October 31, 2018 | |
| | Per Share Data | | | | | | | | | | | | |
| | | | |
| | Net asset value, beginning of period | | $ | 9.98 | | | $ | 8.41 | | | $ | 10.00 | |
| | | | |
| | Net investment income(a) | | | — | (b) | | | 0.08 | | | | 0.04 | |
| | | | |
| | Net realized and unrealized gain (loss) | | | (0.82 | ) | | | 1.53 | | | | (1.63 | ) |
| | | | |
| | Total from investment operations | | | (0.82 | ) | | | 1.61 | | | | (1.59 | ) |
| | | | |
| | Distributions to shareholders from net investment income | | | (0.09 | ) | | | (0.04 | ) | | | — | |
| | | | |
| | Net asset value, end of period | | $ | 9.07 | | | $ | 9.98 | | | $ | 8.41 | |
| | | | |
| | Total return(c) | | | (8.32 | )% | | | 19.26 | % | | | (15.90 | )% |
| | | | |
| | Net assets, end of period (in 000s) | | $ | 6,561 | | | $ | 6,912 | | | $ | 5,679 | |
| | | | |
| | Ratio of net expenses to average net assets | | | 1.14 | %(d) | | | 1.21 | % | | | 1.14 | %(d) |
| | | | |
| | Ratio of total expenses to average net assets | | | 4.94 | %(d) | | | 7.31 | % | | | 9.89 | %(d) |
| | | | |
| | Ratio of net investment income to average net assets | | | — | %(d)(e) | | | 0.85 | % | | | 1.03 | %(d) |
| | | | |
| | Portfolio turnover rate(f) | | | 14 | % | | | 57 | % | | | 23 | % |
| | * | | Commencement of operations. |
| | (a) | | Calculated based on the average shares outstanding methodology. |
| | (b) | | Amount is less than $0.005 per share. |
| | (c) | | Assumes investment at the net asset value at the beginning of the period, reinvestment of all distributions, a complete redemption of the investment at the net asset value at the end of the period and no sales or redemption charges (if any). Total returns would be reduced if a sales or redemption charge was taken into account. Returns do not reflect the impact of taxes to shareholders relating to Fund distributions or the redemption of Fund shares. Total returns for periods less than one full year are not annualized. |
| | (e) | | Amount is less than 0.005%. |
| | (f) | | The Fund’s portfolio turnover rate is calculated in accordance with regulatory requirements, without regard to transactions involving short term investments. If such transactions were included, the Fund’s portfolio turnover rate may be higher. |
| | |
| The accompanying notes are an integral part of these financial statements. | | 37 |
GOLDMAN SACHS ESG EMERGING MARKETS EQUITY FUND
Financial Highlights(continued)
Selected Data for a Share Outstanding Throughout Each Period
| | | | | | | | | | | | | | |
| | | | | Goldman Sachs ESG Emerging Markets Equity Fund | |
| | | | | Investor Shares | |
| | | | | Six Months Ended
April 30, 2020
(Unaudited) | | | Year Ended
October 31, 2019 | | | May 31, 2018*
to
October 31, 2018 | |
| | Per Share Data | | | | | | | | | | | | |
| | | | |
| | Net asset value, beginning of period | | $ | 9.97 | | | $ | 8.41 | | | $ | 10.00 | |
| | | | |
| | Net investment income (loss)(a) | | | (0.01 | ) | | | 0.06 | | | | 0.03 | |
| | | | |
| | Net realized and unrealized gain (loss) | | | (0.81 | ) | | | 1.53 | | | | (1.62 | ) |
| | | | |
| | Total from investment operations | | | (0.82 | ) | | | 1.59 | | | | (1.59 | ) |
| | | | |
| | Distributions to shareholders from net investment income | | | (0.08 | ) | | | (0.03 | ) | | | — | |
| | | | |
| | Net asset value, end of period | | $ | 9.07 | | | $ | 9.97 | | | $ | 8.41 | |
| | | | |
| | Total return(b) | | | (8.34 | )% | | | 19.03 | % | | | (15.90 | )% |
| | | | |
| | Net assets, end of period (in 000s) | | $ | 46 | | | $ | 50 | | | $ | 42 | |
| | | | |
| | Ratio of net expenses to average net assets | | | 1.26 | %(c) | | | 1.35 | % | | | 1.28 | %(c) |
| | | | |
| | Ratio of total expenses to average net assets | | | 5.07 | %(c) | | | 7.49 | % | | | 10.03 | %(c) |
| | | | |
| | Ratio of net investment income (loss) to average net assets | | | (0.12 | )%(c) | | | 0.69 | % | | | 0.89 | %(c) |
| | | | |
| | Portfolio turnover rate(d) | | | 14 | % | | | 57 | % | | | 23 | % |
| | * | | Commencement of operations. |
| | (a) | | Calculated based on the average shares outstanding methodology. |
| | (b) | | Assumes investment at the net asset value at the beginning of the period, reinvestment of all distributions, a complete redemption of the investment at the net asset value at the end of the period and no sales or redemption charges (if any). Total returns would be reduced if a sales or redemption charge was taken into account. Returns do not reflect the impact of taxes to shareholders relating to Fund distributions or the redemption of Fund shares. Total returns for periods less than one full year are not annualized. |
| | (d) | | The Fund’s portfolio turnover rate is calculated in accordance with regulatory requirements, without regard to transactions involving short term investments. If such transactions were included, the Fund’s portfolio turnover rate may be higher. |
| | |
| 38 | | The accompanying notes are an integral part of these financial statements. |
GOLDMAN SACHS ESG EMERGING MARKETS EQUITY FUND
Financial Highlights(continued)
Selected Data for a Share Outstanding Throughout The Period
| | | | | | |
| | | | | Goldman Sachs
ESG Emerging Markets
Equity Fund | |
| | | | | Class P Shares | |
| | | | | January 21, 2020* to April 30, 2020
(Unaudited) | |
| | Per Share Data | | | | |
| | |
| | Net asset value, beginning of period | | $ | 10.87 | |
| | |
| | Net investment income(a) | | | — | (b) |
| | |
| | Net realized and unrealized loss | | | (1.80 | ) |
| | |
| | Total from investment operations | | | (1.80 | ) |
| | |
| | Net asset value, end of period | | $ | 9.07 | |
| | |
| | Total return(c) | | | (16.56 | )% |
| | |
| | Net assets, end of period (in 000s) | | $ | 8 | |
| | |
| | Ratio of net expenses to average net assets | | | 0.86 | %(d) |
| | |
| | Ratio of total expenses to average net assets | | | 4.85 | %(d) |
| | |
| | Ratio of net investment income to average net assets | | | 0.16 | %(d) |
| | |
| | Portfolio turnover rate(e) | | | 14 | % |
| | * | | Commencement of operations. |
| | (a) | | Calculated based on the average shares outstanding methodology. |
| | (b) | | Amount is less than $0.005 per share. |
| | (c) | | Assumes investment at the net asset value at the beginning of the period, reinvestment of all distributions, a complete redemption of the investment at the net asset value at the end of the period and no sales or redemption charges (if any). Total returns would be reduced if a sales or redemption charge was taken into account. Returns do not reflect the impact of taxes to shareholders relating to Fund distributions or the redemption of Fund shares. Total returns for periods less than one full year are not annualized. |
| | (e) | | The Fund’s portfolio turnover rate is calculated in accordance with regulatory requirements, without regard to transactions involving short term investments. If such transactions were included, the Fund’s portfolio turnover rate may be higher. |
| | |
| The accompanying notes are an integral part of these financial statements. | | 39 |
GOLDMAN SACHS ESG EMERGING MARKETS EQUITY FUND
Financial Highlights(continued)
Selected Data for a Share Outstanding Throughout Each Period
| | | | | | | | | | | | | | |
| | | | | Goldman Sachs ESG Emerging Markets Equity Fund | |
| | | | | Class R Shares | |
| | | | | Six Months Ended
April 30, 2020
(Unaudited) | | | Year Ended
October 31, 2019 | | | May 31, 2018*
to
October 31, 2018 | |
| | Per Share Data | | | | | | | | | | | | |
| | | | |
| | Net asset value, beginning of period | | $ | 9.94 | | | $ | 8.39 | | | $ | 10.00 | |
| | | | |
| | Net investment income (loss)(a) | | | (0.03 | ) | | | 0.01 | | | | 0.02 | |
| | | | |
| | Net realized and unrealized gain (loss) | | | (0.82 | ) | | | 1.55 | | | | (1.63 | ) |
| | | | |
| | Total from investment operations | | | (0.85 | ) | | | 1.56 | | | | (1.61 | ) |
| | | | |
| | Distributions to shareholders from net investment income | | | (0.06 | ) | | | (0.01 | ) | | | — | |
| | | | |
| | Net asset value, end of period | | $ | 9.03 | | | $ | 9.94 | | | $ | 8.39 | |
| | | | |
| | Total return(b) | | | (8.65 | )% | | | 18.57 | % | | | (16.10 | )% |
| | | | |
| | Net assets, end of period (in 000s) | | $ | 160 | | | $ | 167 | | | $ | 42 | |
| | | | |
| | Ratio of net expenses to average net assets | | | 1.76 | %(c) | | | 1.92 | % | | | 1.78 | %(c) |
| | | | |
| | Ratio of total expenses to average net assets | | | 5.57 | %(c) | | | 7.68 | % | | | 10.53 | %(c) |
| | | | |
| | Ratio of net investment income (loss) to average net assets | | | (0.62 | )%(c) | | | 0.06 | % | | | 0.39 | %(c) |
| | | | |
| | Portfolio turnover rate(d) | | | 14 | % | | | 57 | % | | | 23 | % |
| | * | | Commencement of operations. |
| | (a) | | Calculated based on the average shares outstanding methodology. |
| | (b) | | Assumes investment at the net asset value at the beginning of the period, reinvestment of all distributions, a complete redemption of the investment at the net asset value at the end of the period and no sales or redemption charges (if any). Total returns would be reduced if a sales or redemption charge was taken into account. Returns do not reflect the impact of taxes to shareholders relating to Fund distributions or the redemption of Fund shares. Total returns for periods less than one full year are not annualized. |
| | (d) | | The Fund’s portfolio turnover rate is calculated in accordance with regulatory requirements, without regard to transactions involving short term investments. If such transactions were included, the Fund’s portfolio turnover rate may be higher. |
| | |
| 40 | | The accompanying notes are an integral part of these financial statements. |
GOLDMAN SACHS ESG EMERGING MARKETS EQUITY FUND
Financial Highlights(continued)
Selected Data for a Share Outstanding Throughout Each Period
| | | | | | | | | | | | | | |
| | | | | Goldman Sachs ESG Emerging Markets Equity Fund | |
| | | | | Class R6 Shares | |
| | | | | Six Months Ended
April 30, 2020
(Unaudited) | | | Year Ended
October 31, 2019 | | | May 31, 2018*
to
October 31, 2018 | |
| | Per Share Data | | | | | | | | | | | | |
| | | | |
| | Net asset value, beginning of period | | $ | 9.98 | | | $ | 8.41 | | | $ | 10.00 | |
| | | | |
| | Net investment income(a) | | | — | (b) | | | 0.08 | | | | 0.04 | |
| | | | |
| | Net realized and unrealized gain (loss) | | | (0.82 | ) | | | 1.53 | | | | (1.63 | ) |
| | | | |
| | Total from investment operations | | | (0.82 | ) | | | 1.61 | | | | (1.59 | ) |
| | | | |
| | Distributions to shareholders from net investment income | | | (0.09 | ) | | | (0.04 | ) | | | — | |
| | | | |
| | Net asset value, end of period | | $ | 9.07 | | | $ | 9.98 | | | $ | 8.41 | |
| | | | |
| | Total return(c) | | | (8.31 | )% | | | 19.26 | % | | | (15.90 | )% |
| | | | |
| | Net assets, end of period (in 000s) | | $ | 46 | | | $ | 50 | | | $ | 42 | |
| | | | |
| | Ratio of net expenses to average net assets | | | 1.13 | %(d) | | | 1.20 | % | | | 1.13 | %(d) |
| | | | |
| | Ratio of total expenses to average net assets | | | 4.92 | %(d) | | | 7.34 | % | | | 9.88 | %(d) |
| | | | |
| | Ratio of net investment income to average net assets | | | 0.01 | %(d) | | | 0.84 | % | | | 1.04 | %(d) |
| | | | |
| | Portfolio turnover rate(e) | | | 14 | % | | | 57 | % | | | 23 | % |
| | * | | Commencement of operations. |
| | (a) | | Calculated based on the average shares outstanding methodology. |
| | (b) | | Amount is less than $0.005 per share. |
| | (c) | | Assumes investment at the net asset value at the beginning of the period, reinvestment of all distributions, a complete redemption of the investment at the net asset value at the end of the period and no sales or redemption charges (if any). Total returns would be reduced if a sales or redemption charge was taken into account. Returns do not reflect the impact of taxes to shareholders relating to Fund distributions or the redemption of Fund shares. Total returns for periods less than one full year are not annualized. |
| | (e) | | The Fund’s portfolio turnover rate is calculated in accordance with regulatory requirements, without regard to transactions involving short term investments. If such transactions were included, the Fund’s portfolio turnover rate may be higher. |
| | |
| The accompanying notes are an integral part of these financial statements. | | 41 |
GOLDMAN SACHS IMPRINT EMERGING MARKETS OPPORTUNITIES FUND
Financial Highlights(continued)
Selected Data for a Share Outstanding Throughout Each Period
| | | | | | | | | | | | | | | | | | | | | | | | | | |
| | | | | Goldman Sachs Imprint Emerging Markets Opportunities Fund | |
| | | | | Class A Shares | |
| | | | | Six Months Ended
April 30, 2020
(Unaudited) | | | Year Ended October 31, | |
| | | | | 2019 | | | 2018 | | | 2017 | | | 2016 | | | 2015 | |
| | Per Share Data | | | | | | | | | | | | | | | | | | | | | | | | |
| | | | | | | |
| | Net asset value, beginning of period | | $ | 8.44 | | | $ | 8.04 | | | $ | 9.93 | | | $ | 8.98 | | | $ | 9.26 | | | $ | 11.25 | |
| | | | | | | |
| | Net investment income (loss)(a) | | | (0.02 | ) | | | 0.28 | (b) | | | 0.07 | | | | 0.05 | | | | 0.06 | | | | 0.04 | |
| | | | | | | |
| | Net realized and unrealized gain (loss) | | | (1.40 | ) | | | 0.18 | | | | (1.96 | ) | | | 0.90 | | | | (0.32 | ) | | | (2.03 | ) |
| | | | | | | |
| | Total from investment operations | | | (1.42 | ) | | | 0.46 | | | | (1.89 | ) | | | 0.95 | | | | (0.26 | ) | | | (1.99 | ) |
| | | | | | | |
| | Distributions to shareholders from net investment income | | | (0.40 | ) | | | (0.06 | ) | | | — | (c) | | | — | | | | (0.02 | ) | | | — | (c) |
| | | | | | | |
| | Net asset value, end of period | | $ | 6.62 | | | $ | 8.44 | | | $ | 8.04 | | | $ | 9.93 | | | $ | 8.98 | | | $ | 9.26 | |
| | | | | | | |
| | Total return(d) | | | (17.95 | )% | | | 5.72 | % | | | (19.03 | )% | | | 10.58 | % | | | (2.84 | )% | | | (17.68 | )% |
| | | | | | | |
| | Net assets, end of period (in 000s) | | $ | 2,621 | | | $ | 3,563 | | | $ | 6,345 | | | $ | 16,496 | | | $ | 25,955 | | | $ | 54,045 | |
| | | | | | | |
| | Ratio of net expenses to average net assets | | | 1.63 | %(e) | | | 1.73 | % | | | 1.72 | % | | | 1.73 | % | | | 1.74 | % | | | 1.73 | % |
| | | | | | | |
| | Ratio of total expenses to average net assets | | | 3.56 | %(e) | | | 3.12 | % | | | 2.33 | % | | | 2.11 | % | | | 2.39 | % | | | 2.07 | % |
| | | | | | | |
| | Ratio of net investment income (loss) to average net assets | | | (0.62 | )%(e) | | | 3.24 | %(b) | | | 0.68 | % | | | 0.50 | % | | | 0.66 | % | | | 0.35 | % |
| | | | | | | |
| | Portfolio turnover rate(f) | | | 35 | % | | | 85 | % | | | 11 | % | | | 26 | % | | | 27 | % | | | 48 | % |
| | (a) | | Calculated based on the average shares outstanding methodology. |
| | (b) | | Reflects income recognized from a corporate action which amounted to $0.25 per share and 2.90% of average net assets. |
| | (c) | | Amount is less than $0.005 per share. |
| | (d) | | Assumes investment at the net asset value at the beginning of the period, reinvestment of all distributions, a complete redemption of the investment at the net asset value at the end of the period and no sales or redemption charges (if any). Total returns would be reduced if a sales or redemption charge was taken into account. Returns do not reflect the impact of taxes to shareholders relating to Fund distributions or the redemption of Fund shares. Total returns for periods less than one full year are not annualized. |
| | (f) | | The Fund’s portfolio turnover rate is calculated in accordance with regulatory requirements, without regard to transactions involving short term investments. If such transactions were included, the Fund’s portfolio turnover rate may be higher. |
| | |
| 42 | | The accompanying notes are an integral part of these financial statements. |
GOLDMAN SACHS IMPRINT EMERGING MARKETS OPPORTUNITIES FUND
Financial Highlights(continued)
Selected Data for a Share Outstanding Throughout Each Period
| | | | | | | | | | | | | | | | | | | | | | | | | | |
| | | | | Goldman Sachs Imprint Emerging Markets Opportunities Fund | |
| | | | | Class C Shares | |
| | | | | Six Months Ended
April 30, 2020
(Unaudited) | | | Year Ended October 31, | |
| | | | | 2019 | | | 2018 | | | 2017 | | | 2016 | | | 2015 | |
| | Per Share Data | | | | | | | | | | | | | | | | | | | | | | | | |
| | | | | | | |
| | Net asset value, beginning of period | | $ | 8.02 | | | $ | 7.64 | | | $ | 9.51 | | | $ | 8.66 | | | $ | 8.98 | | | $ | 10.99 | |
| | | | | | | |
| | Net investment income (loss)(a) | | | (0.05 | ) | | | 0.23 | (b) | | | (0.01 | ) | | | (0.01 | ) | | | (0.01 | ) | | | (0.04 | ) |
| | | | | | | |
| | Net realized and unrealized gain (loss) | | | (1.33 | ) | | | 0.15 | | | | (1.86 | ) | | | 0.86 | | | | (0.31 | ) | | | (1.97 | ) |
| | | | | | | |
| | Total from investment operations | | | (1.38 | ) | | | 0.38 | | | | (1.87 | ) | | | 0.85 | | | | (0.32 | ) | | | (2.01 | ) |
| | | | | | | |
| | Distributions to shareholders from net investment income | | | (0.32 | ) | | | — | | | | — | | | | — | | | | — | | | | — | |
| | | | | | | |
| | Net asset value, end of period | | $ | 6.32 | | | $ | 8.02 | | | $ | 7.64 | | | $ | 9.51 | | | $ | 8.66 | | | $ | 8.98 | |
| | | | | | | |
| | Total return(c) | | | (18.19 | )% | | | 4.97 | % | | | (19.66 | )% | | | 9.82 | % | | | (3.55 | )% | | | (18.29 | )% |
| | | | | | | |
| | Net assets, end of period (in 000s) | | $ | 779 | | | $ | 1,249 | | | $ | 2,082 | | | $ | 3,854 | | | $ | 5,642 | | | $ | 8,564 | |
| | | | | | | |
| | Ratio of net expenses to average net assets | | | 2.39 | %(d) | | | 2.48 | % | | | 2.47 | % | | | 2.48 | % | | | 2.49 | % | | | 2.48 | % |
| | | | | | | |
| | Ratio of total expenses to average net assets | | | 4.29 | %(d) | | | 3.87 | % | | | 3.10 | % | | | 2.84 | % | | | 3.14 | % | | | 2.82 | % |
| | | | | | | |
| | Ratio of net investment income (loss) to average net assets | | | (1.39 | )%(d) | | | 2.84 | %(b) | | | (0.11 | )% | | | (0.15 | )% | | | (0.07 | )% | | | (0.41 | )% |
| | | | | | | |
| | Portfolio turnover rate(e) | | | 35 | % | | | 85 | % | | | 11 | % | | | 26 | % | | | 27 | % | | | 48 | % |
| | (a) | | Calculated based on the average shares outstanding methodology. |
| | (b) | | Reflects income recognized from a corporate action which amounted to $0.25 per share and 2.90% of average net assets. |
| | (c) | | Assumes investment at the net asset value at the beginning of the period, reinvestment of all distributions, a complete redemption of the investment at the net asset value at the end of the period and no sales or redemption charges (if any). Total returns would be reduced if a sales or redemption charge was taken into account. Returns do not reflect the impact of taxes to shareholders relating to Fund distributions or the redemption of Fund shares. Total returns for periods less than one full year are not annualized. |
| | (e) | | The Fund’s portfolio turnover rate is calculated in accordance with regulatory requirements, without regard to transactions involving short term investments. If such transactions were included, the Fund’s portfolio turnover rate may be higher. |
| | |
| The accompanying notes are an integral part of these financial statements. | | 43 |
GOLDMAN SACHS IMPRINT EMERGING MARKETS OPPORTUNITIES FUND
Financial Highlights(continued)
Selected Data for a Share Outstanding Throughout Each Period
| | | | | | | | | | | | | | | | | | | | | | | | | | |
| | | | | Goldman Sachs Imprint Emerging Markets Opportunities Fund | |
| | | | | Institutional Shares | |
| | | | | Six Months Ended
April 30, 2020
(Unaudited) | | | Year Ended October 31, | |
| | | | | 2019 | | | 2018 | | | 2017 | | | 2016 | | | 2015 | |
| | Per Share Data | | | | | | | | | | | | | | | | | | | | | | | | |
| | | | | | | |
| | Net asset value, beginning of period | | $ | 8.49 | | | $ | 8.12 | | | $ | 10.02 | | | $ | 9.02 | | | $ | 9.33 | | | $ | 11.34 | |
| | | | | | | |
| | Net investment income (loss)(a) | | | (0.01 | ) | | | 0.28 | (b) | | | 0.12 | | | | 0.09 | | | | 0.10 | | | | 0.08 | |
| | | | | | | |
| | Net realized and unrealized gain (loss) | | | (1.39 | ) | | | 0.20 | | | | (1.99 | ) | | | 0.91 | | | | (0.33 | ) | | | (2.04 | ) |
| | | | | | | |
| | Total from investment operations | | | (1.40 | ) | | | 0.48 | | | | (1.87 | ) | | | 1.00 | | | | (0.23 | ) | | | (1.96 | ) |
| | | | | | | |
| | Distributions to shareholders from net investment income | | | (0.45 | ) | | | (0.11 | ) | | | (0.03 | ) | | | — | (c) | | | (0.08 | ) | | | (0.05 | ) |
| | | | | | | |
| | Net asset value, end of period | | $ | 6.64 | | | $ | 8.49 | | | $ | 8.12 | | | $ | 10.02 | | | $ | 9.02 | | | $ | 9.33 | |
| | | | | | | |
| | Total return(d) | | | (17.71 | )% | | | 6.02 | % | | | (18.62 | )% | | | 11.02 | % | | | (2.46 | )% | | | (17.34 | )% |
| | | | | | | |
| | Net assets, end of period (in 000s) | | $ | 2,723 | | | $ | 4,082 | | | $ | 12,270 | | | $ | 50,730 | | | $ | 58,958 | | | $ | 115,099 | |
| | | | | | | |
| | Ratio of net expenses to average net assets | | | 1.25 | %(e) | | | 1.34 | % | | | 1.33 | % | | | 1.33 | % | | | 1.33 | % | | | 1.33 | % |
| | | | | | | |
| | Ratio of total expenses to average net assets | | | 3.16 | %(e) | | | 2.71 | % | | | 1.91 | % | | | 1.67 | % | | | 1.99 | % | | | 1.68 | % |
| | | | | | | |
| | Ratio of net investment income (loss) to average net assets | | | (0.27 | )%(e) | | | 3.29 | %(b) | | | 1.24 | % | | | 0.94 | % | | | 1.08 | % | | | 0.78 | % |
| | | | | | | |
| | Portfolio turnover rate(f) | | | 35 | % | | | 85 | % | | | 11 | % | | | 26 | % | | | 27 | % | | | 48 | % |
| | (a) | | Calculated based on the average shares outstanding methodology. |
| | (b) | | Reflects income recognized from a corporate action which amounted to $0.25 per share and 2.90% of average net assets. |
| | (c) | | Amount is less than $0.005 per share. |
| | (d) | | Assumes investment at the net asset value at the beginning of the period, reinvestment of all distributions, a complete redemption of the investment at the net asset value at the end of the period and no sales or redemption charges (if any). Total returns would be reduced if a sales or redemption charge was taken into account. Returns do not reflect the impact of taxes to shareholders relating to Fund distributions or the redemption of Fund shares. Total returns for periods less than one full year are not annualized. |
| | (f) | | The Fund’s portfolio turnover rate is calculated in accordance with regulatory requirements, without regard to transactions involving short term investments. If such transactions were included, the Fund’s portfolio turnover rate may be higher. |
| | |
| 44 | | The accompanying notes are an integral part of these financial statements. |
GOLDMAN SACHS IMPRINT EMERGING MARKETS OPPORTUNITIES FUND
Financial Highlights(continued)
Selected Data for a Share Outstanding Throughout Each Period
| | | | | | | | | | | | | | | | | | | | | | | | | | |
| | | | | Goldman Sachs Imprint Emerging Markets Opportunities Fund | |
| | | | | Investor Shares(a) | |
| | | | | Six Months Ended
April 30, 2020
(Unaudited) | | | Year Ended October 31, | |
| | | | | 2019 | | | 2018 | | | 2017 | | | 2016 | | | 2015 | |
| | Per Share Data | | | | | | | | | | | | | | | | | | | | | | | | |
| | | | | | | |
| | Net asset value, beginning of period | | $ | 8.50 | | | $ | 8.09 | | | $ | 9.98 | | | $ | 9.00 | | | $ | 9.30 | | | $ | 11.30 | |
| | | | | | | |
| | Net investment income (loss)(b) | | | (0.02 | ) | | | 0.27 | (c) | | | 0.08 | | | | 0.08 | | | | 0.08 | | | | 0.06 | |
| | | | | | | |
| | Net realized and unrealized gain (loss) | | | (1.39 | ) | | | 0.21 | | | | (1.95 | ) | | | 0.90 | | | | (0.32 | ) | | | (2.03 | ) |
| | | | | | | |
| | Total from investment operations | | | (1.41 | ) | | | 0.48 | | | | (1.87 | ) | | | 0.98 | | | | (0.24 | ) | | | (1.97 | ) |
| | | | | | | |
| | Distributions to shareholders from net investment income | | | (0.44 | ) | | | (0.07 | ) | | | (0.02 | ) | | | — | | | | (0.06 | ) | | | (0.03 | ) |
| | | | | | | |
| | Net asset value, end of period | | $ | 6.65 | | | $ | 8.50 | | | $ | 8.09 | | | $ | 9.98 | | | $ | 9.00 | | | $ | 9.30 | |
| | | | | | | |
| | Total return(d) | | | (17.85 | )% | | | 6.00 | % | | | (18.82 | )% | | | 10.89 | % | | | (2.59 | )% | | | (17.45 | )% |
| | | | | | | |
| | Net assets, end of period (in 000s) | | $ | 863 | | | $ | 1,465 | | | $ | 5,633 | | | $ | 8,613 | | | $ | 9,436 | | | $ | 13,092 | |
| | | | | | | |
| | Ratio of net expenses to average net assets | | | 1.38 | %(e) | | | 1.49 | % | | | 1.47 | % | | | 1.48 | % | | | 1.48 | % | | | 1.48 | % |
| | | | | | | |
| | Ratio of total expenses to average net assets | | | 3.27 | %(e) | | | 2.85 | % | | | 2.11 | % | | | 1.80 | % | | | 2.14 | % | | | 1.82 | % |
| | | | | | | |
| | Ratio of net investment income (loss) to average net assets | | | (0.45 | )%(e) | | | 3.21 | %(c) | | | 0.86 | % | | | 0.91 | % | | | 0.90 | % | | | 0.59 | % |
| | | | | | | |
| | Portfolio turnover rate(f) | | | 35 | % | | | 85 | % | | | 11 | % | | | 26 | % | | | 27 | % | | | 48 | % |
| | (a) | | Effective August 15, 2017, Class IR changed its name to Investor Shares. |
| | (b) | | Calculated based on the average shares outstanding methodology. |
| | (c) | | Reflects income recognized from a corporate action which amounted to $0.25 per share and 2.90% of average net assets. |
| | (d) | | Assumes investment at the net asset value at the beginning of the period, reinvestment of all distributions, a complete redemption of the investment at the net asset value at the end of the period and no sales or redemption charges (if any). Total returns would be reduced if a sales or redemption charge was taken into account. Returns do not reflect the impact of taxes to shareholders relating to Fund distributions or the redemption of Fund shares. Total returns for periods less than one full year are not annualized. |
| | (f) | | The Fund’s portfolio turnover rate is calculated in accordance with regulatory requirements, without regard to transactions involving short term investments. If such transactions were included, the Fund’s portfolio turnover rate may be higher. |
| | |
| The accompanying notes are an integral part of these financial statements. | | 45 |
GOLDMAN SACHS IMPRINT EMERGING MARKETS OPPORTUNITIES FUND
Financial Highlights(continued)
Selected Data for a Share Outstanding Throughout Each Period
| | | | | | | | | | | | | | |
| | | | | Goldman Sachs Imprint Emerging Markets Opportunities Fund | |
| | | | | Class P Shares | |
| | | | | Six Months Ended
April 30, 2020
(Unaudited) | | | Year Ended
October 31, 2019 | | | April 16, 2018*
to
October 31, 2018 | |
| | Per Share Data | | | | | | | | | | | | |
| | | | |
| | Net asset value, beginning of period | | $ | 8.48 | | | $ | 8.11 | | | $ | 10.29 | |
| | | | |
| | Net investment income (loss)(a) | | | (0.01 | ) | | | 0.41 | (b) | | | (0.01 | ) |
| | | | |
| | Net realized and unrealized gain (loss) | | | (1.38 | ) | | | 0.08 | | | | (2.17 | ) |
| | | | |
| | Total from investment operations | | | (1.39 | ) | | | 0.49 | | | | (2.18 | ) |
| | | | |
| | Distributions to shareholders from net investment income | | | (0.46 | ) | | | (0.12 | ) | | | — | |
| | | | |
| | Net asset value, end of period | | $ | 6.63 | | | $ | 8.48 | | | $ | 8.11 | |
| | | | |
| | Total return(c) | | | (17.69 | )% | | | 6.15 | % | | | (21.19 | )% |
| | | | |
| | Net assets, end of period (in 000s) | | $ | 9,236 | | | $ | 13,375 | | | $ | 14,524 | |
| | | | |
| | Ratio of net expenses to average net assets | | | 1.24 | %(d) | | | 1.34 | % | | | 1.32 | %(d) |
| | | | |
| | Ratio of total expenses to average net assets | | | 3.14 | %(d) | | | 2.74 | % | | | 2.28 | %(d) |
| | | | |
| | Ratio of net investment income (loss) to average net assets | | | (0.31 | )%(d) | | | 4.79 | %(b) | | | (0.18 | )%(d) |
| | | | |
| | Portfolio turnover rate(e) | | | 35 | % | | | 85 | % | | | 11 | % |
| | * | | Commencement of operations. |
| | (a) | | Calculated based on the average shares outstanding methodology. |
| | (b) | | Reflects income recognized from a corporate action which amounted to $0.25 per share and 2.90% of average net assets. |
| | (c) | | Assumes investment at the net asset value at the beginning of the period, reinvestment of all distributions, a complete redemption of the investment at the net asset value at the end of the period and no sales or redemption charges (if any). Total returns would be reduced if a sales or redemption charge was taken into account. Returns do not reflect the impact of taxes to shareholders relating to Fund distributions or the redemption of Fund shares. Total returns for periods less than one full year are not annualized. |
| | (e) | | The Fund’s portfolio turnover rate is calculated in accordance with regulatory requirements, without regard to transactions involving short term investments. If such transactions were included, the Fund’s portfolio turnover rate may be higher. |
| | |
| 46 | | The accompanying notes are an integral part of these financial statements. |
GOLDMAN SACHS IMPRINT EMERGING MARKETS OPPORTUNITIES FUND
Financial Highlights(continued)
Selected Data for a Share Outstanding Throughout Each Period
| | | | | | | | | | | | | | |
| | | | | Goldman Sachs Imprint Emerging Markets Opportunities Fund | |
| | | | | Class R6 Shares | |
| | | | | Six Months Ended
April 30, 2020
(Unaudited) | | | Year Ended
October 31, 2019 | | | February 28, 2018*
to
October 31, 2018 | |
| | Per Share Data | | | | | | | | | | | | |
| | | | |
| | Net asset value, beginning of period | | $ | 8.49 | | | $ | 8.12 | | | $ | 10.43 | |
| | | | |
| | Net investment income (loss)(a) | | | (0.01 | ) | | | 0.44 | (b) | | | 0.08 | |
| | | | |
| | Net realized and unrealized gain (loss) | | | (1.39 | ) | | | 0.05 | | | | (2.39 | ) |
| | | | |
| | Total from investment operations | | | (1.40 | ) | | | 0.49 | | | | (2.31 | ) |
| | | | |
| | Distributions to shareholders from net investment income | | | (0.46 | ) | | | (0.12 | ) | | | — | |
| | | | |
| | Net asset value, end of period | | $ | 6.63 | | | $ | 8.49 | | | $ | 8.12 | |
| | | | |
| | Total return(c) | | | (17.80 | )% | | | 6.12 | % | | | (22.15 | )% |
| | | | |
| | Net assets, end of period (in 000s) | | $ | 7 | | | $ | 8 | | | $ | 8 | |
| | | | |
| | Ratio of net expenses to average net assets | | | 1.26 | %(d) | | | 1.35 | % | | | 1.34 | %(d) |
| | | | |
| | Ratio of total expenses to average net assets | | | 3.18 | %(d) | | | 2.76 | % | | | 2.00 | %(d) |
| | | | |
| | Ratio of net investment income (loss) to average net assets | | | (0.23 | )%(d) | | | 5.05 | %(b) | | | 1.33 | %(d) |
| | | | |
| | Portfolio turnover rate(e) | | | 35 | % | | | 85 | % | | | 11 | % |
| | * | | Commencement of operations. |
| | (a) | | Calculated based on the average shares outstanding methodology. |
| | (b) | | Reflects income recognized from a corporate action which amounted to $0.25 per share and 2.90% of average net assets. |
| | (c) | | Assumes investment at the net asset value at the beginning of the period, reinvestment of all distributions, a complete redemption of the investment at the net asset value at the end of the period and no sales or redemption charges (if any). Total returns would be reduced if a sales or redemption charge was taken into account. Returns do not reflect the impact of taxes to shareholders relating to Fund distributions or the redemption of Fund shares. Total returns for periods less than one full year are not annualized. |
| | (e) | | The Fund’s portfolio turnover rate is calculated in accordance with regulatory requirements, without regard to transactions involving short term investments. If such transactions were included, the Fund’s portfolio turnover rate may be higher. |
| | |
| The accompanying notes are an integral part of these financial statements. | | 47 |
GOLDMAN SACHS FUNDAMENTAL EMERGING MARKETS EQUITY FUNDS
Notes to Financial Statements
April 30, 2020 (Unaudited)
Goldman Sachs Trust (the “Trust”) is a Delaware statutory trust registered under the Investment Company Act of 1940, as amended (the “Act”), as anopen-end management investment company. The following table lists those series of the Trust that are included in this report (collectively, the “Funds” or individually a “Fund”), along with their corresponding share classes and respective diversification status under the Act:
| | | | |
| Fund | | Share Classes Offered | | Diversified/ Non-diversified |
China Equity(a) | | A, C, Institutional, Investor, P and R6 | | Diversified |
Emerging Markets Equity | | A, C, Institutional, Service, Investor, P and R6 | | Diversified |
ESG Emerging Markets Equity | | A, C, Institutional, Investor, P(b), R and R6 | | Diversified |
Imprint Emerging Markets Opportunities | | A, C, Institutional, Investor, P and R6 | | Diversified |
| (a) | | Formerly, the Goldman Sachs Asia Equity Fund. Effective at the close of business on November 20, 2019, the Fund’s name changed to Goldman Sachs China Equity Fund. |
| (b) | | Commenced operations on January 21, 2020. |
Class A Shares are sold with afront-end sales charge of up to 5.50%. Class C Shares are sold with a contingent deferred sales charge (“CDSC”) of 1.00%, which is imposed on redemptions made within 12 months of purchase. Institutional, Service, Investor, Class P, Class R and Class R6 Shares are not subject to a sales charge.
Goldman Sachs Asset Management, L.P. (“GSAM”), an affiliate of Goldman Sachs & Co. LLC (“Goldman Sachs”), serves as investment adviser to the Funds pursuant to management agreements (each, an “Agreement”) with the Trust.
|
| 2. SIGNIFICANT ACCOUNTING POLICIES |
The financial statements have been prepared in accordance with accounting principles generally accepted in the United States of America (“GAAP”) and require management to make estimates and assumptions that may affect the reported amounts and disclosures. Actual results may differ from those estimates and assumptions. Each Fund is an investment company under GAAP and follows the accounting and reporting guidance applicable to investment companies.
A. Investment Valuation — The Funds’ valuation policy is to value investments at fair value.
B. Investment Income and Investments — Investment income includes interest income, dividend income, and securities lending income, if any. Interest income is accrued daily and adjusted for amortization of premiums and accretion of discounts. Dividend income is recognized onex-dividend date or, for certain foreign securities, as soon as such information is obtained subsequent to theex-dividend date.Non-cash dividends, if any, are recorded at the fair market value of the securities received. Investment transactions are reflected on trade date. Realized gains and losses are calculated using identified cost. Investment transactions are recorded on the following business day for daily net asset value (“NAV”) calculations. Investment income is recorded net of any foreign withholding taxes, less any amounts reclaimable. The Funds may file withholding tax reclaims in certain jurisdictions to recover a portion of amounts previously withheld. Any foreign capital gains tax is accrued daily based upon net unrealized gains, and is payable upon sale of such investments.
C. Class Allocations and Expenses — Investment income, realized and unrealized gain (loss), if any, andnon-class specific expenses of each Fund are allocated daily based upon the proportion of net assets of each class.Non-class specific expenses directly incurred by a Fund are charged to that Fund, while such expenses incurred by the Trust are allocated across the applicable Funds on astraight-line and/orpro-rata basis depending upon the nature of the expenses. Class specific expenses, where applicable, are borne by the respective share classes and include Distribution and Service, Transfer Agency and Service and Shareholder Administration fees.
D. Federal Taxes and Distributions to Shareholders — It is each Fund’s policy to comply with the requirements of the Internal Revenue Code of 1986, as amended (the “Code”), applicable to regulated investment companies and to distribute each
48
GOLDMAN SACHS FUNDAMENTAL EMERGING MARKETS EQUITY FUNDS
|
| 2. SIGNIFICANT ACCOUNTING POLICIES (continued) |
year substantially all of its investment company taxable income and capital gains to its shareholders. Accordingly, each Fund is not required to make any provisions for the payment of federal income tax. Distributions to shareholders are recorded on theex-dividend date. Income and capital gains distributions, if any, are declared and paid at least annually.
Net capital losses, if any, are carried forward to future fiscal years and may be used to the extent allowed by the Code to offset any future capital gains. Losses that are carried forward will retain their character as either short-term or long-term capital losses. Utilization of capital loss carryforwards will reduce the requirement of future capital gains distributions.
The characterization of distributions to shareholders for financial reporting purposes is determined in accordance with federal income tax rules, which may differ from GAAP. The source of each Fund’s distributions may be shown in the accompanying financial statements as either from distributable earnings or capital. Certain components of the Funds’ net assets on the Statements of Assets and Liabilities reflect permanent GAAP/tax differences based on the appropriate tax character.
E. Foreign Currency Translation — The accounting records and reporting currency of a Fund are maintained in U.S. dollars. Assets and liabilities denominated in foreign currencies are translated into U.S. dollars using the current exchange rates at the close of each business day. The effect of changes in foreign currency exchange rates on investments is included within net realized and unrealized gain (loss) on investments. Changes in the value of other assets and liabilities as a result of fluctuations in foreign exchange rates are included in the Statements of Operations within net change in unrealized gain (loss) on foreign currency translation. Transactions denominated in foreign currencies are translated into U.S. dollars on the date the transaction occurred, the effects of which are included within net realized gain (loss) on foreign currency transactions.
| | |
| 3. INVESTMENTS AND FAIR VALUE MEASUREMENTS | | |
U.S. GAAP defines the fair value of a financial instrument as the amount that would be received to sell an asset or paid to transfer a liability in an orderly transaction between market participants at the measurement date (i.e., the exit price); the Funds’ policy is to use the market approach. GAAP establishes a fair value hierarchy that prioritizes the inputs to valuation techniques used to measure fair value. The hierarchy gives the highest priority to unadjusted quoted prices in active markets for identical assets or liabilities (Level 1 measurements) and the lowest priority to unobservable inputs (Level 3 measurements). The levels used for classifying investments are not necessarily an indication of the risk associated with investing in these investments. The three levels of the fair value hierarchy are described below:
Level 1 — Unadjusted quoted prices in active markets that are accessible at the measurement date for identical, unrestricted assets or liabilities;
Level 2 — Quoted prices in markets that are not active or financial instruments for which significant inputs are observable (including, but not limited to, quoted prices for similar investments, interest rates, foreign exchange rates, volatility and credit spreads), either directly or indirectly;
Level 3 — Prices or valuations that require significant unobservable inputs (including GSAM’s assumptions in determining fair value measurement).
The Board of Trustees (“Trustees”) has approved Valuation Procedures that govern the valuation of the portfolio investments held by the Funds, including investments for which market quotations are not readily available. The Trustees have delegated toGSAM day-to-day responsibility for implementing and maintaining internal controls and procedures related to the valuation of the Funds’ investments. To assess the continuing appropriateness of pricing sources and methodologies, GSAM regularly performs price verification procedures and issues challenges as necessary to third party pricing vendors or brokers, and any differences are reviewed in accordance with the Valuation Procedures.
A. Level 1 and Level 2 Fair Value Investments — The valuation techniques and significant inputs used in determining the fair values for investments classified as Level 1 and Level 2 are as follows:
Equity Securities — Equity securities traded on a United States (“U.S.”) securities exchange or the NASDAQ system, or those located on certain foreign exchanges, including but not limited to the Americas, are valued daily at their last sale price or official
49
GOLDMAN SACHS FUNDAMENTAL EMERGING MARKETS EQUITY FUNDS
Notes to Financial Statements(continued)
April 30, 2020 (Unaudited)
|
| 3. INVESTMENTS AND FAIR VALUE MEASUREMENTS (continued) |
closing price on the principal exchange or system on which they are traded. If there is no sale or official closing price or such price is believed by GSAM to not represent fair value, equity securities may be valued at the closing bid price for long positions and at the closing ask price for short positions. To the extent these investments are actively traded, they are classified as Level 1 of the fair value hierarchy, otherwise they are generally classified as Level 2. Certain equity securities containing unique attributes may be classified as Level 2.
Unlisted equity securities for which market quotations are available are valued at the last sale price on the valuation date, or if no sale occurs, at the last bid price for long positions or the last ask price for short positions, and are generally classified as Level 2. Securities traded on certain foreign securities exchanges are valued daily at fair value determined by an independent fair value service (if available) under Valuation Procedures approved by the Trustees and consistent with applicable regulatory guidance. The independent fair value service takes into account multiple factors including, but not limited to, movements in the securities markets, certain depositary receipts, futures contracts and foreign currency exchange rates that have occurred subsequent to the close of the foreign securities exchange. These investments are generally classified as Level 2 of the fair value hierarchy.
Underlying Funds (including Money Market Funds) — Underlying funds (“Underlying Funds”) include other investment companies and exchange-traded funds (“ETFs”). Investments in the Underlying Funds (except ETFs) are valued at the NAV per share on the day of valuation. ETFs are valued daily at the last sale price or official closing price on the principal exchange or system on which the investment is traded. Because the Funds invest in Underlying Funds that fluctuate in value, the Funds’ shares will correspondingly fluctuate in value. To the extent these investments are actively traded, they are classified as Level 1 of the fair value hierarchy, otherwise they are generally classified as Level 2. For information regarding an Underlying Fund’s accounting policies and investment holdings, please see the Underlying Fund’s shareholder report.
B. Level 3 Fair Value Investments — To the extent that significant inputs to valuation models and other alternative pricing sources are unobservable, or if quotations are not readily available, or if GSAM believes that such quotations do not accurately reflect fair value, the fair value of a Fund’s investments may be determined under Valuation Procedures approved by the Trustees. GSAM, consistent with its procedures and applicable regulatory guidance, may make an adjustment to the most recent valuation prices of either domestic or foreign securities in light of significant events to reflect what it believes to be the fair value of the securities at the time of determining a Fund’s NAV. To the extent investments are valued using single source broker quotations obtained directly from the broker or passed through from third party pricing vendors, such investments are classified as Level 3 investments.
C. Fair Value Hierarchy — The following is a summary of the Funds’ investments classified in the fair value hierarchy as of April 30, 2020:
| | | | | | | | | | | | |
| | | |
| CHINA EQUITY | | | | | | | | | | | | |
| | | |
| Investment Type | | Level 1 | | | Level 2 | | | Level 3 | |
| | | |
| Assets | | | | | | | | | | | | |
| | | |
Common Stock and/or Other Equity Investments(a) | | | | | | | | | | | | |
| | | |
Asia | | $ | 6,246,361 | | | $ | 53,695,670 | | | $ | — | |
| | | |
Investment Company | | | 1,399,012 | | | | — | | | | — | |
| | | |
| Total | | $ | 7,645,373 | | | $ | 53,695,670 | | | $ | — | |
| (a) | | Amounts are disclosed by continent to highlight the impact of time zone differences between local market close and the calculation of NAV. Security valuations are based on the principal exchange or system on which they are traded, which may differ from country of domicile. The Funds utilize fair value model prices provided by an independent fair value service for certain international equity securities, resulting in a Level 2 classification. |
50
GOLDMAN SACHS FUNDAMENTAL EMERGING MARKETS EQUITY FUNDS
|
| 3. INVESTMENTS AND FAIR VALUE MEASUREMENTS (continued) |
| | | | | | | | | | | | |
| | | |
| EMERGING MARKETS EQUITY | | | | | | | | | | | | |
| | | |
| Investment Type | | Level 1 | | | Level 2 | | | Level 3 | |
| | | |
| Assets | | | | | | | | | | | | |
| | | |
Common Stock and/or Other Equity Investments(a) | | | | | | | | | | | | |
| | | |
Africa | | $ | 14,016,282 | | | $ | 20,515,761 | | | $ | — | |
| | | |
Asia | | | 228,266,072 | | | | 1,345,220,384 | | | | — | |
| | | |
Europe | | | 9,253,006 | | | | 42,745,993 | | | | — | |
| | | |
North America | | | 28,520,632 | | | | — | | | | — | |
| | | |
South America | | | 107,885,187 | | | | 21,447,989 | | | | — | |
| | | |
Exchange Traded Fund | | | 14,586,274 | | | | — | | | | — | |
| | | |
| Total | | $ | 402,527,453 | | | $ | 1,429,930,127 | | | $ | — | |
| | | |
| ESG EMERGING MARKETS EQUITY | | | | | | | | | | | | |
| | | |
| Investment Type | | Level 1 | | | Level 2 | | | Level 3 | |
| | | |
| Assets | | | | | | | | | | | | |
| | | |
Common Stock and/or Other Equity Investments(a) | | | | | | | | | | | | |
| | | |
Africa | | $ | 77,651 | | | $ | 42,292 | | | $ | — | |
| | | |
Asia | | | 962,466 | | | | 4,757,924 | | | | — | |
| | | |
Europe | | | — | | | | 132,618 | | | | — | |
| | | |
North America | | | 152,466 | | | | — | | | | — | |
| | | |
South America | | | 531,650 | | | | 15,960 | | | | — | |
| | | |
Investment Company | | | 7,602 | | | | — | | | | — | |
| | | |
| Total | | $ | 1,731,835 | | | $ | 4,948,794 | | | $ | — | |
| | | |
| IMPRINT EMERGING MARKETS OPPORTUNITIES | | | | | | | | | | | | |
| | | |
| Investment Type | | Level 1 | | | Level 2 | | | Level 3 | |
| | | |
| Assets | | | | | | | | | | | | |
| | | |
Common Stock and/or Other Equity Investments(a) | | | | | | | | | | | | |
| | | |
Africa | | $ | 259,285 | | | $ | 2,358,212 | | | $ | — | |
| | | |
Asia | | | 3,394,100 | | | | 8,725,868 | | | | — | |
| | | |
Europe | | | 536,596 | | | | 312,987 | | | | — | |
| | | |
South America | | | 470,993 | | | | — | | | | — | |
| | | |
Investment Company | | | 13,673 | | | | — | | | | — | |
| | | |
Securities Lending Reinvestment Vehicle | | | 465,650 | | | | — | | | | — | |
| | | |
| Total | | $ | 5,140,297 | | | $ | 11,397,067 | | | $ | — | |
| (a) | | Amounts are disclosed by continent to highlight the impact of time zone differences between local market close and the calculation of NAV. Security valuations are based on the principal exchange or system on which they are traded, which may differ from country of domicile. The Funds utilize fair value model prices provided by an independent fair value service for certain international equity securities, resulting in a Level 2 classification. |
For further information regarding security characteristics, see the Schedules of Investments.
51
GOLDMAN SACHS FUNDAMENTAL EMERGING MARKETS EQUITY FUNDS
Notes to Financial Statements(continued)
April 30, 2020 (Unaudited)
|
| 4. AGREEMENTS AND AFFILIATED TRANSACTIONS |
A. Management Agreement — Under the Agreement, GSAM manages the Funds, subject to the general supervision of the Trustees.
As compensation for the services rendered pursuant to the Agreement, the assumption of the expenses related thereto and administration of the Funds’ business affairs, including providing facilities, GSAM is entitled to a management fee, accrued daily and paid monthly, equal to an annual percentage rate of each Fund’s average daily net assets.
For the six months ended April 30, 2020, contractual and effective net management fees with GSAM were at the following rates:
| | | | | | | | | | | | | | | | | | | | | | | | | | | | | | | | |
| | | | | | Contractual Management Rate | | | Effective
Rate | | | Effective Net
Management
Rate^ | |
| Fund | | | | | First
$1 billion | | | Next
$1 billion | | | Next
$3 billion | | | Next
$3 billion | | | Over
$8 billion | |
China Equity | | | | | | | 1.00 | % | | | 0.90 | % | | | 0.86 | % | | | 0.84 | % | | | 0.82 | % | | | 1.00 | % | | | 1.00 | % |
Emerging Markets Equity | | | | | | | 1.02 | | | | 1.02 | | | | 0.92 | | | | 0.87 | | | | 0.85 | | | | 1.02 | | | | 1.02 | |
ESG Emerging Markets Equity | | | | | | | 0.98 | | | | 0.98 | | | | 0.88 | | | | 0.84 | | | | 0.82 | | | | 0.98 | | | | 0.98 | |
Imprint Emerging Markets Opportunities | | | | | | | 1.05 | | | | 1.05 | | | | 0.95 | | | | 0.90 | | | | 0.88 | | | | 1.05 | | | | 1.05 | |
| ^ | | Effective Net Management Rate includes the impact of management fee waivers of affiliated underlying funds, if any. |
The China Equity, Emerging Markets Equity, ESG Emerging Markets Equity and Imprint Emerging Markets Opportunities Funds invest in Institutional Shares of the Goldman Sachs Financial Square Government Fund, which is an affiliated Underlying Fund. GSAM has agreed to waive a portion of its management fee payable by the Funds in an amount equal to the management fee it earns as an investment adviser to the affiliated Underlying Fund in which the Funds invest, except those management fees it earns from the Funds’ investments of cash collateral received in connection with securities lending transactions in the Goldman Sachs Financial Square Government Fund. For the six months ended April 30, 2020, GSAM waived $147, $964, $24 and $63 of the China Equity, Emerging Markets Equity, ESG Emerging Markets Equity and Imprint Emerging Markets Opportunities Funds’ management fees, respectively.
B. Distribution and/or Service(12b-1) Plans — The Trust, on behalf of Class A and Class R Shares of each applicable Fund, has adopted Distribution and Service Plans subject to Rule12b-1 under the Act. Under the Distribution and Service Plans, Goldman Sachs, which serves as distributor (the “Distributor”), is entitled to a fee accrued daily and paid monthly for distribution services and personal and account maintenance services, which may then be paid by Goldman Sachs to authorized dealers. These fees are equal to an annual percentage rate of the average daily net assets attributable to Class A or Class R Shares of the Funds, as applicable, as set forth below.
The Trust, on behalf of Class C Shares of each applicable Fund, has adopted a Distribution Plan subject to Rule12b-1 under the Act. Under the Distribution Plan, Goldman Sachs as Distributor is entitled to a fee accrued daily and paid monthly for distribution services, which may then be paid by Goldman Sachs to authorized dealers. These fees are equal to an annual percentage rate of the average daily net assets attributable to Class C Shares of the Funds, as set forth below.
The Trust, on behalf of Service Shares of each applicable Fund, has adopted a Service Plan subject to Rule12b-1 under the Act to allow Service Shares to compensate service organizations (including Goldman Sachs) for providing personal and account maintenance services to their customers who are beneficial owners of such shares. The Service Plan provides for compensation to the service organizations equal to an annual percentage rate of the average daily net assets attributable to Service Shares of the Funds, as set forth below.
| | | | | | | | | | | | | | | | |
| | | Distribution and/or Service Plan Rates | |
| | | Class A* | | | Class C | | | Class R* | | | Service | |
Distribution and/or Service Plan | | | 0.25 | % | | | 0.75 | % | | | 0.50 | % | | | 0.25 | % |
| * | | With respect to Class A and Class R Shares, the Distributor at its discretion may use compensation for distribution services paid under the Distribution and Service Plans to compensate service organizations for personal and account maintenance services and expenses as long as such total compensation does not exceed the maximum cap on “service fees” imposed by the Financial Industry Regulatory Authority. |
52
GOLDMAN SACHS FUNDAMENTAL EMERGING MARKETS EQUITY FUNDS
|
| 4. AGREEMENTS AND AFFILIATED TRANSACTIONS (continued) |
C. Distribution Agreement — Goldman Sachs, as Distributor of the shares of the Funds pursuant to a Distribution Agreement, may retain a portion of the Class A Shares’ front end sales charge and Class C Shares’ CDSC. During the six months ended April 30, 2020, Goldman Sachs retained the following amounts:
| | | | | | | | | | |
| | | | | Front End
Sales Charge | | | Contingent Deferred
Sales Charge | |
| Fund | | | | Class A | | | Class C | |
China Equity | | | | $ | 525 | | | $ | — | |
Emerging Markets Equity | | | | | 4,404 | | | | 1 | |
ESG Emerging Markets Equity | | | | | — | | | | — | |
Imprint Emerging Markets Opportunities | | | | | 3 | | | | — | |
D. Service and Shareholder Administration Plans — The Trust, on behalf of each applicable Fund, has adopted Service Plans to allow Class C Shares and Shareholder Administration Plans to allow Service Shares, respectively, to compensate service organizations (including Goldman Sachs) for providing varying levels of personal and account maintenance or shareholder administration services to their customers who are beneficial owners of such shares. The Service and Shareholder Administration Plans each provide for compensation to the service organizations equal to an annual percentage rate of 0.25% of the average daily net assets attributable to Class C and Service Shares of the Funds, respectively.
E. Transfer Agency Agreement —Goldman Sachs also serves as the transfer agent of the Funds for a fee pursuant to the Transfer Agency Agreement. The fees charged for such transfer agency services are accrued daily and paid monthly at annual rates as follows: 0.17% of the average daily net assets of Class A, Class C, Investor and Class R Shares; 0.03% of the average daily net assets of Class P and Class R6 Shares; and 0.04% of the average daily net assets of Institutional and Service Shares. Effective February 28, 2020, Goldman Sachs agreed to waive a portion of its transfer agency fee equal to 0.07%, 0.06% and 0.04% as an annual percentage rate of the average daily net assets attributable to Class A, Class C, Investor and Class R Shares, as applicable, of the China Equity Fund, Emerging Markets Equity Fund and ESG Emerging Markets Equity Fund, respectively, through at least February 28, 2021, and prior to such date Goldman Sachs may not terminate the arrangement without the approval of the Board of Trustees. Prior to February 28, 2020, Goldman Sachs agreed to waive a portion of the transfer agency fee equal to 0.04% as an annual percentage rate of the average daily net assets attributable to Class A, Class C and Investor Shares of the China Equity Fund.
F. Other Expense Agreements and Affiliated Transactions — GSAM has agreed to reduce or limit certain “Other Expenses” of the Funds (excluding acquired fund fees and expenses, transfer agency fees and expenses, service fees and shareholder administration fees (as applicable), taxes, interest, brokerage fees, expenses of shareholder meetings, litigation and indemnification, and extraordinary expenses) to the extent such expenses exceed, on an annual basis, a percentage rate of the average daily net assets of each Fund. Such Other Expense reimbursements, if any, are accrued daily and paid monthly. In addition, the Funds are not obligated to reimburse GSAM for prior fiscal year expense reimbursements, if any. The Other Expense limitations as an annual percentage rate of average daily net assets for the China Equity, Emerging Markets Equity, ESG Emerging Markets Equity and Imprint Emerging Markets Opportunities Funds are 0.114%, 0.104%, 0.124% and 0.164%, respectively. These Other Expense limitations will remain in place through at least February 28, 2021 and prior to such date GSAM may not terminate the arrangements without the approval of the Trustees. In addition, the Funds have entered into certain offset arrangements with the custodian and the transfer agent, which may result in a reduction of the Funds’ expenses and are received irrespective of the application of the “Other Expense” limitations described above.
53
GOLDMAN SACHS FUNDAMENTAL EMERGING MARKETS EQUITY FUNDS
Notes to Financial Statements(continued)
April 30, 2020 (Unaudited)
|
| 4. AGREEMENTS AND AFFILIATED TRANSACTIONS (continued) |
For the six months ended April 30, 2020, these expense reductions, including any fee waivers and Other Expense reimbursements, were as follows:
| | | | | | | | | | | | | | | | | | | | | | |
| Fund | | | | Management
Fee Waiver | | | Custody Fee
Credits | | | Transfer
Agency
Waiver/Credits | | | Other
Expense
Reimbursement | | | Total
Expense
Reductions | |
China Equity | | | | $ | 147 | | | $ | 1,097 | | | $ | 3,693 | | | $ | 160,905 | | | $ | 165,842 | |
Emerging Markets Equity | | | | | 964 | | | | 12,880 | | | | 36,642 | | | | — | | | | 50,486 | |
ESG Emerging Markets Equity | | | | | 24 | | | | 60 | | | | 20 | | | | 137,417 | | | | 137,521 | |
Imprint Emerging Markets Opportunities | | | | | 63 | | | | 285 | | | | — | | | | 209,176 | | | | 209,524 | |
G. Line of Credit Facility — As of April 30, 2020, the Funds participated in a $700,000,000 committed, unsecured revolving line of credit facility (the “facility”) together with other funds of the Trust and certain registered investment companies having management agreements with GSAM or its affiliates. This facility is to be used for temporary emergency purposes, or to allow for an orderly liquidation of securities to meet redemption requests. The interest rate on borrowings is based on the federal funds rate. The facility also requires a fee to be paid by the Funds based on the amount of the commitment that has not been utilized. For the six months ended April 30, 2020, the Funds did not have any borrowings under the facility. Prior to April 28, 2020, the facility was $580,000,000.
H. Other Transactions with Affiliates — For the six months ended April 30, 2020, Goldman Sachs earned $492 and $4 in brokerage commissions from portfolio transactions on behalf of the Emerging Markets Equity and ESG Emerging Markets Equity Funds, respectively.
The following table provides information about the Funds’ investments in the Goldman Sachs Financial Square Government Fund as of and for the six months ended April 30, 2020:
| | | | | | | | | | | | | | | | | | | | | | | | | | |
| Fund | | | | Beginning
Value as of
October 31, 2019 | | | Purchases
at Cost | | | Proceeds
from Sales | | | Ending
Value as of
April 30, 2020 | | | Shares as of
April 30, 2020 | | | Dividend
Income From
Affiliated
Investment
Company | |
China Equity | | | | $ | 461,147 | | | $ | 14,434,044 | | | $ | (13,496,179) | | | $ | 1,399,012 | | | | 1,399,012 | | | $ | 2,252 | |
Emerging Markets Equity | | | | | 6,059,064 | | | | 337,261,281 | | | | (343,320,345 | ) | | | — | | | | — | | | | 116,626 | |
ESG Emerging Markets Equity | | | | | — | | | | 517,017 | | | | (509,415 | ) | | | 7,602 | | | | 7,602 | | | | 77 | |
Imprint Emerging Markets Opportunities | | | | | — | | | | 779,570 | | | | (765,897 | ) | | | 13,673 | | | | 13,673 | | | | 118 | |
As of April 30, 2020, The Goldman Sachs Group, Inc. was the beneficial owner of the following Funds:
| | | | | | | | | | | | | | | | | | | | | | | | | | | | | | |
| Fund | | | | Class A | | | Class C | | | Institutional | | | Investor | | | Class P | | | Class R | | | Class R6 | |
China Equity | | | | | — | % | | | — | % | | | — | % | | | 14 | % | | | — | % | | | — | % | | | — | % |
ESG Emerging Markets Equity | | | | | 97 | | | | 100 | | | | 95 | | | | 100 | | | | 100 | | | | 28 | | | | 100 | |
Imprint Emerging Markets Opportunities | | | | | — | | | | — | | | | — | | | | — | | | | — | | | | — | | | | 100 | |
54
GOLDMAN SACHS FUNDAMENTAL EMERGING MARKETS EQUITY FUNDS
|
| 5. PORTFOLIO SECURITIES TRANSACTIONS |
The cost of purchases and proceeds from sales and maturities of long-term securities for the six months ended April 30, 2020, were as follows:
| | | | | | | | | | |
| Fund | | | | Purchases | | | Sales and Maturities | |
China Equity | | | | $ | 58,842,891 | | | $ | 75,110,337 | |
Emerging Markets Equity | | | | | 550,434,357 | | | | 302,059,037 | |
ESG Emerging Markets Equity | | | | | 1,027,904 | | | | 972,867 | |
Imprint Emerging Markets Opportunities | | | | | 7,413,350 | | | | 9,770,415 | |
Pursuant to exemptive relief granted by the Securities and Exchange Commission (“SEC”) and the terms and conditions contained therein the China Equity, Emerging Markets Equity and Imprint Emerging Markets Opportunities Funds may lend their securities through a securities lending agent, Goldman Sachs Agency Lending (“GSAL”), a wholly-owned subsidiary of Goldman Sachs, to certain qualified borrowers including Goldman Sachs and affiliates. In accordance with the Funds’ securities lending procedures, the Funds receive cash collateral at least equal to the market value of the securities on loan. The market value of the loaned securities is determined at the close of business of the Funds, at their last sale price or official closing price on the principal exchange or system on which they are traded, and any additional required collateral is delivered to the Funds on the next business day. As with other extensions of credit, the Funds may experience delay in the recovery of their securities or incur a loss should the borrower of the securities breach its agreement with the Funds or become insolvent at a time when the collateral is insufficient to cover the cost of repurchasing securities on loan. Dividend income received from securities on loan may not be subject to withholding taxes and therefore withholding taxes paid may differ from the amounts listed in the Statements of Operations. Loans of securities are terminable at any time and as such 1) the remaining contractual maturities of the outstanding securities lending transactions are considered to be overnight and continuous and 2) the borrower, after notice, is required to return borrowed securities within the standard time period for settlement of securities transactions.
The China Equity, Emerging Markets Equity and Imprint Emerging Markets Opportunities Funds invest the cash collateral received in connection with securities lending transactions in the Goldman Sachs Financial Square Government Fund (“Government Money Market Fund”), an affiliated series of the Goldman Sachs Trust. The Government Money Market Fund is registered under the Act as an open end investment company, is subject to Rule2a-7 under the Act, and is managed by GSAM, for which GSAM may receive a management fee of up to 0.16% on an annualized basis of the average daily net assets of the Government Money Market Fund.
In the event of a default by a borrower with respect to any loan, GSAL will exercise any and all remedies provided under the applicable borrower agreement to make the Funds whole. These remedies include purchasing replacement securities by applying the collateral held from the defaulting broker against the purchase cost of the replacement securities. If GSAL is unable to purchase replacement securities, GSAL will indemnify the Funds by paying the Funds an amount equal to the market value of the securities loaned minus the value of cash collateral received from the borrower for the loan, subject to an exclusion for any shortfalls resulting from a loss of value in such cash collateral due to reinvestment risk. The Funds’ master netting agreements with certain borrowers provide the right, in the event of a default (including bankruptcy or insolvency), for thenon-defaulting party to liquidate the collateral and calculate net exposure to the defaulting party or request additional collateral. However, in the event of a default by a borrower, a resolution authority could determine that such rights are not enforceable due to the restrictions or prohibitions against the right ofset-off that may be imposed in accordance with a particular jurisdiction’s bankruptcy or insolvency laws. The Funds’ loaned securities were all subject to enforceable Securities Lending Agreements and the value of the collateral was at least equal to the value of the cash received. The amounts of the Funds’ overnight and continuous agreements, which represent the gross amounts of recognized liabilities for securities lending transactions outstanding as of April 30, 2020 are disclosed as “Payable upon return of securities loaned” on the Statements of Assets and Liabilities, where applicable.
55
GOLDMAN SACHS FUNDAMENTAL EMERGING MARKETS EQUITY FUNDS
Notes to Financial Statements(continued)
April 30, 2020 (Unaudited)
|
| 6. SECURITIES LENDING (continued) |
Each of the China Equity, Emerging Markets Equity and Imprint Emerging Markets Opportunities Funds and GSAL received compensation relating to the lending of the Funds’ securities. The amounts earned, if any, by the Funds for the six months ended April 30, 2020, are reported under Investment Income on the Statements of Operations.
The table below details securities lending activity with affiliates of Goldman Sachs:
| | | | | | | | | | |
| | | | | For the six months ended April 30, 2020 | |
| Fund | | | | Earnings of GSAL
Relating to
Securites
Loaned | | | Amounts Received
by the Funds
from Lending to
Goldman Sachs | |
China Equity | | | | $ | 111 | | | $ | — | |
Emerging Markets Equity | | | | | 14,521 | | | | 55,404 | |
Imprint Emerging Markets Opportunities | | | | | 807 | | | | 1,775 | |
The following table provides information about the Funds’ investment in the Government Money Market Fund for the six months ended April 30, 2020.
| | | | | | | | | | | | | | | | | | |
| Fund | | | | Beginning
Value as of
October 31, 2019 | | | Purchases
at Cost | | | Proceeds
from Sales | | | Ending
Value as of
April 30, 2020 | |
China Equity | | | | $ | 1,018,700 | | | $ | 4,923,175 | | | $ | (5,941,875 | ) | | $ | — | |
Emerging Markets Equity | | | | | 43,343,504 | | | | 343,718,807 | | | | (387,062,311 | ) | | | — | |
Imprint Emerging Markets Opportunities | | | | | — | | | | 4,561,765 | | | | (4,096,115 | ) | | | 465,650 | |
As of the Funds’ most recent fiscal year ended October 31, 2019, the Funds’ capital loss carryforwards on a tax basis were as follows:
| | | | | | | | | | | | | | | | |
| | | China Equity | | | Emerging
Markets Equity | | | ESG Emerging
Markets Equity | | | Imprint
Emerging
Markets Equity | |
Capital loss carryforwards: | | | | | | | | | | | | | | | | |
Perpetual Long-term | | $ | (673,981 | ) | | $ | (53,722,196 | ) | | $ | (34,082 | ) | | $ | (26,604,715 | ) |
Perpetual Short-term | | | (705,172 | ) | | | (93,713,818 | ) | | | (210,270 | ) | | | (31,944,098 | ) |
Total capital loss carryforwards | | $ | (1,379,153 | ) | | $ | (147,436,014 | ) | | $ | (244,352 | ) | | $ | (58,548,813 | ) |
As of April 30, 2020, the Funds’ aggregate security unrealized gains and losses based on cost for U.S. federal income tax purposes were as follows:
| | | | | | | | | | | | | | | | |
| | | China Equity | | | Emerging
Markets Equity | | | ESG Emerging
Markets Equity | | | Imprint Emerging
Markets Opportunities | |
Tax cost | | $ | 56,176,154 | | | $ | 1,856,745,893 | | | $ | 6,843,200 | | | $ | 19,831,051 | |
Gross unrealized gain | | | 7,858,077 | | | | 206,231,568 | | | | 588,150 | | | | 1,002,874 | |
Gross unrealized loss | | | (2,693,188 | ) | | | (230,519,881 | ) | | | (750,721 | ) | | | (4,296,561 | ) |
Net unrealized gain (loss) | | $ | 5,164,889 | | | $ | (24,288,313 | ) | | $ | (162,571 | ) | | $ | (3,293,687 | ) |
56
GOLDMAN SACHS FUNDAMENTAL EMERGING MARKETS EQUITY FUNDS
|
| 7. TAX INFORMATION (continued) |
The difference between GAAP-basis andtax-basis unrealized gains (losses) is attributable primarily to wash sales and differences in the tax treatment of passive foreign investment company investments.
GSAM has reviewed the Funds’ tax positions for all open tax years (the current and prior three years, as applicable) and has concluded that no provision for income tax is required in the Funds’ financial statements. Such open tax years remain subject to examination and adjustment by tax authorities.
The Funds’ risks include, but are not limited to, the following:
ESG Standards Risk —The ESG Emerging Markets Equity Fund’s adherence to its environmental, social and governance (“ESG”) criteria and the application of GSAM’s supplemental ESG analysis when selecting investments may affect the Fund’s exposure to certain companies, sectors, regions, and countries and may affect the Fund’s performance depending on whether such investments are in or out of favor. For example, the Fund will not seek to invest in companies that GSAM believes have adverse social or environmental impacts (i.e., gambling, alcohol, tobacco, coal or weapons companies), and the Fund will not seek to invest in companies that GSAM believes show inadequate governance standards (e.g., certain state-owned enterprises).
Foreign and Emerging Countries Risk — Investing in foreign markets may involve special risks and considerations not typically associated with investing in the U.S. Foreign securities may be subject to risk of loss because of more or less foreign government regulation, less public information and less economic, political and social stability in the countries in which a Fund invests. The imposition of exchange controls (including repatriation restrictions), confiscation of assets and property, trade restrictions (including tariffs) and other government restrictions by the U.S. or other governments, or from problems in share registration, settlement or custody, may also result in losses. Foreign risk also involves the risk of negative foreign currency rate fluctuations, which may cause the value of securities denominated in such foreign currency (or other instruments through which a Fund has exposure to foreign currencies) to decline in value. Currency exchange rates may fluctuate significantly over short periods of time. To the extent that a Fund also invests in securities of issuers located in emerging markets, these risks may be more pronounced.
Foreign Custody Risk — If a Fund invests in foreign securities, the Fund may hold such securities and cash with foreign banks, agents, and securities depositories appointed by the Fund’s custodian (each a “Foreign Custodian”). Some foreign custodians may be recently organized or new to the foreign custody business. In some countries, Foreign Custodians may be subject to little or no regulatory oversight over, or independent evaluation of, their operations. Further, the laws of certain countries may place limitations on a Fund’s ability to recover its assets if a Foreign Custodian enters bankruptcy. Investments in emerging markets may be subject to even greater custody risks than investments in more developed markets. Custody services in emerging market countries are very often undeveloped and may be considerably less well regulated than in more developed countries, and thus may not afford the same level of investor protection as would apply in developed countries.
Geographic Risk — If a Fund focuses its investments in securities of issuers located in a particular country or geographic region, the Fund may be subjected, to a greater extent than if its investments were less focused, to the risks of volatile economic cycles and/or conditions and developments that may be particular to that country or region, such as: adverse securities markets; adverse exchange rates; adverse social, political, regulatory, economic, business, environmental or other developments; or natural disasters.
Investments in Other Investment Companies Risk — As a shareholder of another investment company, including an ETF, a Fund will indirectly bear its proportionate share of any net management fees and other expenses paid by such other investment companies, in addition to the fees and expenses regularly borne by the Fund. ETFs are subject to risks that do not apply to conventional mutual funds, including but not limited to the following: (i) the market price of the ETF’s shares may trade at a premium or a discount to their NAV; and (ii) an active trading market for an ETF’s shares may not develop or be maintained.
Large Shareholder Transactions Risk — A Fund may experience adverse effects when certain large shareholders, such as other funds, institutional investors (including those trading by use ofnon-discretionary mathematical formulas), financial intermediaries
57
GOLDMAN SACHS FUNDAMENTAL EMERGING MARKETS EQUITY FUNDS
Notes to Financial Statements(continued)
April 30, 2020 (Unaudited)
|
| 8. OTHER RISKS (continued) |
(who may make investment decisions on behalf of underlying clients and/or include a Fund in their investment model), individuals, accounts and Goldman Sachs affiliates, purchase or redeem large amounts of shares of a Fund. Such large shareholder redemptions, which may occur rapidly or unexpectedly, may cause a Fund to sell portfolio securities at times when it would not otherwise do so, which may negatively impact a Fund’s NAV and liquidity. These transactions may also accelerate the realization of taxable income to shareholders if such sales of investments resulted in gains, and may also increase transaction costs. In addition, a large redemption could result in a Fund’s current expenses being allocated over a smaller asset base, leading to an increase in the Fund’s expense ratio. Similarly, large Fund share purchases may adversely affect a Fund’s performance to the extent that the Fund is delayed in investing new cash or otherwise maintains a larger cash position than it ordinarily would.
Liquidity Risk — A Fund may make investments that are illiquid or that may become less liquid in response to market developments or adverse investor perceptions. Illiquid investments may be more difficult to value. Liquidity risk may also refer to the risk that a Fund will not be able to pay redemption proceeds within the allowable time period or without significant dilution to remaining investors’ interests because of unusual market conditions, an unusually high volume of redemption requests, or other reasons. To meet redemption requests, a Fund may be forced to sell investments at an unfavorable time and/or under unfavorable conditions. If a Fund is forced to sell securities at an unfavorable time and/or under unfavorable conditions, such sales may adversely affect the Fund’s NAV and dilute remaining investors’ interests. These risks may be more pronounced in connection with the Funds’ investments in securities of issuers located in emerging market countries. Redemptions by large shareholders may have a negative impact on a Fund’s liquidity.
Market and Credit Risks — In the normal course of business, a Fund trades financial instruments and enters into financial transactions where risk of potential loss exists due to changes in the market (market risk). The value of the securities in which a Fund invests may go up or down in response to the prospects of individual companies, particular sectors or governments and/or general economic conditions throughout the world due to increasingly interconnected global economies and financial markets. Events such as war, acts of terrorism, social unrest, natural disasters, the spread of infectious illness or other public health threats could also significantly impact a Fund and its investments. Additionally, a Fund may also be exposed to credit risk in the event that an issuer or guarantor fails to perform or that an institution or entity with which the Fund has unsettled or open transactions defaults.
Under the Trust’s organizational documents, its Trustees, officers, employees and agents are indemnified, to the extent permitted by the Act and state law, against certain liabilities that may arise out of performance of their duties to the Funds. Additionally, in the course of business, the Funds enter into contracts that contain a variety of indemnification clauses. The Funds’ maximum exposure under these arrangements is unknown, as this would involve future claims that may be made against the Funds that have not yet occurred. However, GSAM believes the risk of loss under these arrangements to be remote.
Subsequent events after the Statements of Assets and Liabilities date have been evaluated, and GSAM has concluded that there is no impact requiring adjustment or disclosure in the financial statements.
58
GOLDMAN SACHS FUNDAMENTAL EMERGING MARKETS EQUITY FUNDS
|
| 11. SUMMARY OF SHARE TRANSACTIONS |
Share activity is as follows:
| | | | | | | | | | | | | | | | |
| | | China Equity Fund | |
| | | | |
| | | For the Six Months Ended
April 30, 2020
(Unaudited) | | | For the Fiscal Year Ended
October 31, 2019 | |
| | | | |
| | | Shares | | | Dollars | | | Shares | | | Dollars | |
| | | | |
| Class A Shares | | | | | | | | | | | | | | | | |
Shares sold | | | 71,463 | | | $ | 1,900,272 | | | | 100,472 | | | $ | 2,465,209 | |
Reinvestment of distributions | | | 2,829 | | | | 77,404 | | | | 38,407 | | | | 858,528 | |
Shares redeemed | | | (78,063 | ) | | | (2,051,088 | ) | | | (208,987 | ) | | | (5,053,525 | ) |
| | | | |
| | | | (3,771 | ) | | | (73,412 | ) | | | (70,108 | ) | | | (1,729,788 | ) |
| Class C Shares | | | | | | | | | | | | | | | | |
Shares sold | | | 3,709 | | | | 94,494 | | | | 6,183 | | | | 131,992 | |
Reinvestment of distributions | | | — | | | | — | | | | 3,328 | | | | 66,890 | |
Shares redeemed | | | (4,347 | ) | | | (100,494 | ) | | | (33,688 | ) | | | (735,710 | ) |
| | | | |
| | | | (638 | ) | | | (6,000 | ) | | | (24,177 | ) | | | (536,828 | ) |
| Institutional Shares | | | | | | | | | | | | | | | | |
Shares sold | | | 94,517 | | | | 2,654,497 | | | | 56,003 | | | | 1,438,836 | |
Reinvestment of distributions | | | 1,791 | | | | 52,218 | | | | 17,609 | | | | 419,499 | |
Shares redeemed | | | (76,915 | ) | | | (2,192,922 | ) | | | (129,539 | ) | | | (3,261,359 | ) |
| | | | |
| | | | 19,393 | | | | 513,793 | | | | (55,927 | ) | | | (1,403,024 | ) |
| Investor Shares | | | | | | | | | | | | | | | | |
Shares sold | | | 1,808 | | | | 54,375 | | | | 2,795 | | | | 74,498 | |
Reinvestment of distributions | | | 65 | | | | 1,881 | | | | 724 | | | | 17,126 | |
Shares redeemed | | | (678 | ) | | | (16,591 | ) | | | (11,360 | ) | | | (283,760 | ) |
| | | | |
| | | | 1,195 | | | | 39,665 | | | | (7,841 | ) | | | (192,136 | ) |
| Class P Shares | | | | | | | | | | | | | | | | |
Shares sold | | | 18,818 | | | | 527,800 | | | | 23,591 | | | | 611,925 | |
Reinvestment of distributions | | | 15,824 | | | | 459,995 | | | | 132,977 | | | | 3,162,940 | |
Shares redeemed | | | (536,509 | ) | | | (15,371,536 | ) | | | (194,578 | ) | | | (4,752,501 | ) |
| | | | |
| | | | (501,867 | ) | | | (14,383,741 | ) | | | (38,010 | ) | | | (977,636 | ) |
| Class R6 Shares | | | | | | | | | | | | | | | | |
Shares sold | | | 3,328 | | | | 91,022 | | | | 24,436 | | | | 597,278 | |
Reinvestment of distributions | | | 129 | | | | 3,753 | | | | 23 | | | | 539 | |
Shares redeemed | | | (9,157 | ) | | | (253,867 | ) | | | (9,102 | ) | | | (237,071 | ) |
| | | | |
| | | | (5,700 | ) | | | (159,092 | ) | | | 15,357 | | | | 360,746 | |
| | | | |
NET DECREASE | | | (491,388 | ) | | $ | (14,068,787 | ) | | | (180,706 | ) | | $ | (4,478,666 | ) |
59
GOLDMAN SACHS FUNDAMENTAL EMERGING MARKETS EQUITY FUNDS
Notes to Financial Statements(continued)
April 30, 2020 (Unaudited)
|
| 11. SUMMARY OF SHARE TRANSACTIONS (continued) |
| | | | | | | | | | | | | | | | |
| | | Emerging Markets Equity Fund | |
| | | | |
| | | For the Six Months Ended
April 30, 2020
(Unaudited) | | | For the Fiscal Year Ended
October 31, 2019 | |
| | | | |
| | | Shares | | | Dollars | | | Shares | | | Dollars | |
| | | | |
| Class A Shares | | | | | | | | | | | | | | | | |
Shares sold | | | 1,713,323 | | | $ | 32,379,988 | | | | 6,814,401 | | | $ | 132,500,133 | |
Reinvestment of distributions | | | 93,742 | | | | 2,010,764 | | | | 37,945 | | | | 644,306 | |
Shares redeemed | | | (1,551,775 | ) | | | (30,322,917 | ) | | | (4,421,848 | ) | | | (82,650,999 | ) |
| | | | |
| | | | 255,290 | | | | 4,067,835 | | | | 2,430,498 | | | | 50,493,440 | |
| Class C Shares | | | | | | | | | | | | | | | | |
Shares sold | | | 111,844 | | | | 2,052,203 | | | | 475,915 | | | | 7,954,572 | |
Reinvestment of distributions | | | 1,430 | | | | 27,481 | | | | — | | | | — | |
Shares redeemed | | | (427,078 | ) | | | (7,364,347 | ) | | | (981,996 | ) | | | (16,512,774 | ) |
| | | | |
| | | | (313,804 | ) | | | (5,284,663 | ) | | | (506,081 | ) | | | (8,558,202 | ) |
| Institutional Shares | | | | | | | | | | | | | | | | |
Shares sold | | | 26,137,804 | | | | 521,420,357 | | | | 21,184,595 | | | | 429,740,047 | |
Reinvestment of distributions | | | 392,564 | | | | 9,021,135 | | | | 240,543 | | | | 4,370,669 | |
Shares redeemed | | | (13,949,588 | ) | | | (275,524,498 | ) | | | (15,168,077 | ) | | | (301,279,401 | ) |
| | | | |
| | | | 12,580,780 | | | | 254,916,994 | | | | 6,257,061 | | | | 132,831,315 | |
| Service Shares | | | | | | | | | | | | | | | | |
Shares sold | | | 73,179 | | | | 1,391,613 | | | | 265,718 | | | | 4,913,041 | |
Reinvestment of distributions | | | 9,144 | | | | 189,825 | | | | 2,995 | | | | 49,234 | |
Shares redeemed | | | (106,763 | ) | | | (2,081,128 | ) | | | (240,524 | ) | | | (4,530,984 | ) |
| | | | |
| | | | (24,440 | ) | | | (499,690 | ) | | | 28,189 | | | | 431,291 | |
| Investor Shares | | | | | | | | | | | | | | | | |
Shares sold | | | 2,446,988 | | | | 53,688,407 | | | | 4,372,238 | | | | 87,269,385 | |
Reinvestment of distributions | | | 61,914 | | | | 1,412,269 | | | | 49,984 | | | | 901,707 | |
Shares redeemed | | | (2,511,134 | ) | | | (50,022,260 | ) | | | (5,812,117 | ) | | | (118,938,935 | ) |
| | | | |
| | | | (2,232 | ) | | | 5,078,416 | | | | (1,389,895 | ) | | | (30,767,843 | ) |
| Class P Shares | | | | | | | | | | | | | | | | |
Shares sold | | | 4,610,154 | | | | 93,097,650 | | | | 5,473,674 | | | | 108,679,052 | |
Reinvestment of distributions | | | 200,362 | | | | 4,624,350 | | | | 144,959 | | | | 2,644,053 | |
Shares redeemed | | | (5,019,081 | ) | | | (96,058,959 | ) | | | (4,710,104 | ) | | | (93,985,135 | ) |
| | | | |
| | | | (208,565 | ) | | | 1,663,041 | | | | 908,529 | | | | 17,337,970 | |
| Class R6 Shares | | | | | | | | | | | | | | | | |
Shares sold | | | 120,088 | | | | 2,491,073 | | | | 456,009 | | | | 9,148,907 | |
Reinvestment of distributions | | | 12,192 | | | | 281,391 | | | | 16,045 | | | | 292,670 | |
Shares redeemed | | | (387,292 | ) | | | (8,640,912 | ) | | | (1,360,524 | ) | | | (26,616,360 | ) |
| | | | |
| | | | (255,012 | ) | | | (5,868,448 | ) | | | (888,470 | ) | | | (17,174,783 | ) |
| | | | |
NET INCREASE | | | 12,032,017 | | | $ | 254,073,485 | | | | 6,839,831 | | | $ | 144,593,188 | |
60
GOLDMAN SACHS FUNDAMENTAL EMERGING MARKETS EQUITY FUNDS
|
| 11. SUMMARY OF SHARE TRANSACTIONS (continued) |
| | | | | | | | | | | | | | | | |
| |
| | | ESG Emerging Markets Equity Fund | |
| | | | |
| | | For the Six Months Ended
April 30, 2020
(Unaudited) | | | For the Fiscal Year Ended
October 31, 2019 | |
| | | | |
| | | Shares | | | Dollars | | | Shares | | | Dollars | |
| | | | |
| Class A Shares | | | | | | | | | | | | | | | | |
Shares sold | | | 127 | | | $ | 1,134 | | | | 22 | | | $ | 209 | |
Reinvestment of distributions | | | 26 | | | | 280 | | | | 12 | | | | 100 | |
Shares redeemed | | | (10 | ) | | | (102 | ) | | | — | | | | — | |
| | | | |
| | | | 143 | | | | 1,312 | | | | 34 | | | | 309 | |
| Institutional Shares | | | | | | | | | | | | | | | | |
Shares sold | | | 40,696 | | | | 361,573 | | | | 118,634 | | | | 1,104,801 | |
Reinvestment of distributions | | | 6,049 | | | | 64,061 | | | | 3,343 | | | | 27,540 | |
Shares redeemed | | | (15,842 | ) | | | (154,890 | ) | | | (104,567 | ) | | | (1,027,258 | ) |
| | | | |
| | | | 30,903 | | | | 270,744 | | | | 17,410 | | | | 105,083 | |
| Investor Shares | | | | | | | | | | | | | | | | |
Reinvestment of distributions | | | 38 | | | | 400 | | | | 20 | | | | 167 | |
| | | | |
| | | | 38 | | | | 400 | | | | 20 | | | | 167 | |
| Class P Shares(a) | | | | | | | | | | | | | | | | |
Shares sold | | | 920 | | | | 10,000 | | | | — | | | | — | |
| | | | |
| | | | 920 | | | | 10,000 | | | | — | | | | — | |
| Class R Shares | | | | | | | | | | | | | | | | |
Shares sold | | | 921 | | | | 9,029 | | | | 11,843 | | | | 114,941 | |
Reinvestment of distributions | | | 96 | | | | 1,009 | | | | 4 | | | | 34 | |
Shares redeemed | | | (96 | ) | | | (993 | ) | | | (6 | ) | | | (53 | ) |
| | | | |
| | | | 921 | | | | 9,045 | | | | 11,841 | | | | 114,922 | |
| Class R6 Shares | | | | | | | | | | | | | | | | |
Reinvestment of distributions | | | 44 | | | | 471 | | | | 25 | | | | 206 | |
| | | | |
| | | | 44 | | | | 471 | | | | 25 | | | | 206 | |
| | | | |
NET INCREASE | | | 32,969 | | | $ | 291,972 | | | | 29,330 | | | $ | 220,687 | |
| (a) | | Commenced operations on January 21, 2020. |
61
GOLDMAN SACHS FUNDAMENTAL EMERGING MARKETS EQUITY FUNDS
Notes to Financial Statements(continued)
April 30, 2020 (Unaudited)
|
| 11. SUMMARY OF SHARE TRANSACTIONS (continued) |
| | | | | | | | | | | | | | | | |
| | | Imprint Emerging Markets Opportunities Fund | |
| | | | |
| | | For the Six Months Ended
April 30, 2020
(Unaudited) | | | For the Fiscal Year Ended
October 31, 2019 | |
| | | | |
| | | Shares | | | Dollars | | | Shares | | | Dollars | |
| | | | |
| Class A Shares | | | | | | | | | | | | | | | | |
Shares sold | | | 17,923 | | | $ | 144,627 | | | | 54,373 | | | $ | 462,086 | |
Reinvestment of distributions | | | 18,647 | | | | 162,419 | | | | 5,314 | | | | 43,152 | |
Shares redeemed | | | (62,836 | ) | | | (512,897 | ) | | | (426,689 | ) | | | (3,637,862 | ) |
| | | | |
| | | | (26,266 | ) | | | (205,851 | ) | | | (367,002 | ) | | | (3,132,624 | ) |
| Class C Shares | | | | | | | | | | | | | | | | |
Shares sold | | | 1,610 | | | | 12,978 | | | | 871 | | | | 7,085 | |
Reinvestment of distributions | | | 5,595 | | | | 46,603 | | | | — | | | | — | |
Shares redeemed | | | (39,549 | ) | | | (286,514 | ) | | | (117,652 | ) | | | (964,642 | ) |
| | | | |
| | | | (32,344 | ) | | | (226,933 | ) | | | (116,781 | ) | | | (957,557 | ) |
| Institutional Shares | | | | | | | | | | | | | | | | |
Shares sold | | | 15,524 | | | | 127,788 | | | | 43,062 | | | | 384,696 | |
Reinvestment of distributions | | | 22,841 | | | | 199,179 | | | | 17,360 | | | | 141,306 | |
Shares redeemed | | | (108,750 | ) | | | (859,932 | ) | | | (1,091,629 | ) | | | (9,349,452 | ) |
| | | | |
| | | | (70,385 | ) | | | (532,965 | ) | | | (1,031,207 | ) | | | (8,823,450 | ) |
| Investor Shares | | | | | | | | | | | | | | | | |
Shares sold | | | 317 | | | | 2,400 | | | | 6,747 | | | | 56,324 | |
Reinvestment of distributions | | | 8,335 | | | | 72,847 | | | | 2,245 | | | | 18,320 | |
Shares redeemed | | | (51,254 | ) | | | (404,197 | ) | | | (532,724 | ) | | | (4,404,839 | ) |
| | | | |
| | | | (42,602 | ) | | | (328,950 | ) | | | (523,732 | ) | | | (4,330,195 | ) |
| Class P Shares | | | | | | | | | | | | | | | | |
Shares sold | | | 441,327 | | | | 3,763,000 | | | | 25,721 | | | | 218,000 | |
Reinvestment of distributions | | | 84,204 | | | | 733,414 | | | | 26,019 | | | | 211,532 | |
Shares redeemed | | | (707,886 | ) | | | (4,696,046 | ) | | | (265,388 | ) | | | (2,255,242 | ) |
| | | | |
| | | | (182,355 | ) | | | (199,632 | ) | | | (213,648 | ) | | | (1,825,710 | ) |
| Class R6 Shares | | | | | | | | | | | | | | | | |
Reinvestment of distributions | | | 51 | | | | 446 | | | | 14 | | | | 117 | |
| | | | |
| | | | 51 | | | | 446 | | | | 14 | | | | 117 | |
| | | | |
NET DECREASE | | | (353,901 | ) | | $ | (1,493,885 | ) | | | (2,252,356 | ) | | $ | (19,069,419 | ) |
62
GOLDMAN SACHS FUNDAMENTAL EMERGING MARKETS EQUITY FUNDS
Voting Results of Special Meeting of Shareholders (Unaudited)
A Special Meeting (the “Meeting”) of the Goldman Sachs Trust (“GST”) was held on January 23, 2020 to consider and act upon the proposals below. The Funds have amortized their respective share of the proxy, shareholder meeting and other related costs and GSAM has agreed to reimburse each Fund to the extent such expenses exceed a specified percentage of the Fund’s net assets.
At the Meeting, Dwight L. Bush, Kathryn A. Cassidy, Joaquin Delgado and Gregory G. Weaver were elected to the Trust’s Board of Trustees. In electing trustees, the Trust’s shareholders voted as follows:
| | | | | | | | | | | | | | | | |
Proposal 1. Election of Trustees | | For | | | Against | | | Withheld | | | Broker Non-Votes | |
| | | | |
Dwight L. Bush | | | 94,278,961,728.065 | | | | 0 | | | | 349,026,343,365 | | | | 0 | |
| | | | |
Kathryn A. Cassidy | | | 94,310,850,789.164 | | | | 0 | | | | 317,137,282.266 | | | | 0 | |
| | | | |
Joaquin Delgado | | | 94,282,646,444.727 | | | | 0 | | | | 345,341,626.703 | | | | 0 | |
| | | | |
Gregory G. Weaver | | | 94,306,589,873.348 | | | | 0 | | | | 321,398,198.082 | | | | 0 | |
| | | | | | | | | | | | | | | | |
63
GOLDMAN SACHS FUNDAMENTAL EMERGING MARKETS EQUITY FUNDS
Liquidity Risk Management Program (Unaudited)
Each Fund has adopted and implemented a liquidity risk management program (the “Program”) in accordance with Rule22e-4 under the 1940 Act. The Program seeks to assess and manage each Fund’s liquidity risk,i.e., the risk that a Fund is unable to satisfy redemption requests without significantly diluting remaining investors’ interests in the Fund. The Board of Trustees of the Trust has designated GSAM, each Fund’s investment adviser, to administer the Program. Certain aspects of the Program rely on third parties to perform certain functions, including the provision of market data and application of models.
The Program is comprised of various components designed to support the assessment and/or management of liquidity risk, including: (1) the periodic assessment (no less frequently than annually) of certain factors that influence a Fund’s liquidity risk; (2) the periodic classification (no less frequently than monthly) of a Fund’s investments into one of four liquidity categories that reflect an estimate of their liquidity under current market conditions; (3) a 15% limit on the acquisition of “illiquid investments” (as defined under Rule22e-4); (4) for a Fund that does not invest primarily in “highly liquid investments” (as defined under Rule22e-4), the determination of a minimum percentage of the Fund’s assets that will generally be invested in highly liquid investments (a “Highly Liquid Investment Minimum”); and (5) periodic reporting to the Board of Trustees.
At a meeting of the Board of Trustees on February 11-12, 2020, GSAM provided a written report to the Board addressing the operation, and the adequacy and effectiveness of the implementation, of the Program, including, as applicable, the operation of any Highly Liquid Investment Minimum and any material changes to the Program, for the initial period from December 1, 2018 through December 31, 2019 (the “Reporting Period”). Among other things, the annual report discussed: (1) the results of stress tests designed to assess liquidity under a hypothetical stressed scenario involving elevated redemptions; and (2) an assessment of the methodologies used to classify investments into one of four liquidity categories. The report concluded that the Program was reasonably designed to assess and manage liquidity risk and was adequately and effectively implemented during the Reporting Period.
There can be no assurance that the Program will achieve its objectives under all circumstances in the future. Please refer to your Fund’s prospectus for more information regarding the Fund’s exposure to liquidity risk and other risks to which it may be subject.
64
GOLDMAN SACHS FUNDAMENTAL EMERGING MARKETS EQUITY FUNDS
Fund Expenses — Six Month Period Ended April 30, 2020 (Unaudited)
As a shareholder of Class A, Class C, Institutional, Service, Investor, Class P, Class R or Class R6 Shares of a Fund you incur two types of costs: (1) transaction costs, including sales charges on purchase payments (with respect to Class A Shares) and contingent deferred sales charges on redemptions (with respect to Class C Shares); and (2) ongoing costs, including management fees; distribution and/or service(12b-1) fees (with respect to Class A, Class C and Service Shares); and other Fund expenses. This example is intended to help you understand your ongoing costs (in dollars) of investing in Class A, Class C, Institutional, Service, Investor, Class P, Class R and Class R6 Shares of the Funds and to compare these costs with the ongoing costs of investing in other mutual funds.
The example is based on an investment of $1,000 invested at the beginning of the period and held for the entire period from November 1, 2019 through April 30, 2020, which represents a period of 182 days of a 366 day year. With respect to the ESG Emerging Markets Equity Fund, the Class P example is based on the period from January 21, 2020 through April 30, 2020, which represents a period of 100 out of 366 days.
Actual Expenses— The first line under each share class in the table below provides information about actual account values and actual expenses. You may use the information in this line, together with the amount you invested, to estimate the expenses that you paid over the period. Simply divide your account value by $1,000 (for example, an $8,600 account value divided by $1,000=8.6), then multiply the result by the number in the first line under the heading entitled “Expenses Paid” to estimate the expenses you paid on your account during this period.
Hypothetical Example for Comparison Purposes— The second line under each share class in the table below provides information about hypothetical account values and hypothetical expenses based on the Funds’ actual net expense ratio and an assumed rate of return of 5% per year before expenses, which is not the Funds’ actual return. The hypothetical account values and expenses may not be used to estimate the actual ending account balance or expenses you paid for the period. You may use this information to compare the ongoing costs of investing in the Funds and other funds. To do so, compare this 5% hypothetical example with the 5% hypothetical examples that appear in the shareholder reports of the other funds.
Please note that the expenses shown in the table are meant to highlight your ongoing costs only and do not reflect any transactional costs, such as sales charges, redemption fee or exchange fees. Therefore, the second line of the table is useful in comparing ongoing costs only, and will not help you determine the relative total costs of owning different funds. In addition, if these transactional costs were included, your costs would have been higher.
| | | | | | | | | | | | | | | | | | | | | | | | | | | | | | | | | | | | | | | | | | | | | | | | |
| | | China Equity Fund | | | Emerging Markets Equity Fund | | | ESG Emerging Markets Equity Fund | | | Imprint Emerging Markets Opportunities | |
| Share Class | | Beginning
Account
Value
11/01/2019 | | | Ending
Account
Value
04/30/2020 | | | Expenses
Paid for the
6 Months Ended
04/30/2020* | | | Beginning
Account
Value
11/01/2019 | | | Ending
Account
Value
04/30/2020 | | | Expenses
Paid for the
6 Months Ended
04/30/2020* | | | Beginning
Account
Value
11/01/2019 | | | Ending
Account
Value
04/30/2020 | | | Expenses
Paid for the
6 Months Ended
04/30/2020* | | | Beginning
Account
Value
11/01/2019 | | | Ending
Account
Value
04/30/2020 | | | Expenses
Paid for the
6 Months Ended
04/30/2020* | |
| Class A | | | | | | | | | | | | | | | | | | | | | | | | | | | | | | | | | | | | | | | | | | | | | | | | |
Actual | | $ | 1,000 | | | $ | 1,031.50 | | | $ | 7.48 | | | $ | 1,000 | | | $ | 907.60 | | | $ | 7.11 | | | $ | 1,000 | | | $ | 915.40 | | | $ | 7.19 | | | $ | 1,000 | | | $ | 820.50 | | | $ | 7.38 | |
Hypothetical 5% return | | | 1,000 | | | | 1,017.50 | + | | | 7.42 | | | | 1,000 | | | | 1,017.40 | + | | | 7.52 | | | | 1,000 | | | | 1,017.35 | + | | | 7.57 | | | | 1,000 | | | | 1,016.76 | + | | | 8.17 | |
| Class C | | | | | | | | | | | | | | | | | | | | | | | | | | | | | | | | | | | | | | | | | | | | | | | | |
Actual | | | 1,000 | | | | 1,027.70 | | | | 11.24 | | | | 1,000 | | | | 903.80 | | | | 10.65 | | | | 1,000 | | | | 911.90 | | | | 10.74 | | | | 1,000 | | | | 818.10 | | | | 10.80 | |
Hypothetical 5% return | | | 1,000 | | | | 1,013.77 | + | | | 11.17 | | | | 1,000 | | | | 1,013.67 | + | | | 11.27 | | | | 1,000 | | | | 1,013.63 | + | | | 11.31 | | | | 1,000 | | | | 1,012.98 | + | | | 11.96 | |
| Institutional | | | | | | | | | | | | | | | | | | | | | | | | | | | | | | | | | | | | | | | | | | | | | | | | |
Actual | | | 1,000 | | | | 1,033.50 | | | | 5.81 | | | | 1,000 | | | | 908.70 | | | | 5.41 | | | | 1,000 | | | | 916.80 | | | | 5.43 | | | | 1,000 | | | | 822.90 | | | | 5.67 | |
Hypothetical 5% return | | | 1,000 | | | | 1,019.14 | + | | | 5.77 | | | | 1,000 | | | | 1,019.19 | + | | | 5.72 | | | | 1,000 | | | | 1,019.19 | + | | | 5.72 | | | | 1,000 | | | | 1,018.65 | + | | | 6.27 | |
| Service | | | | | | | | | | | | | | | | | | | | | | | | | | | | | | | | | | | | | | | | | | | | | | | | |
Actual | | | N/A | | | | N/A | | | | N/A | | | | 1,000 | | | | 906.70 | | | | 7.77 | | | | N/A | | | | N/A | | | | N/A | | | | N/A | | | | N/A | | | | N/A | |
Hypothetical 5% return | | | N/A | | | | N/A | | | | N/A | | | | 1,000 | | | | 1,016.71 | + | | | 8.22 | | | | N/A | | | | N/A | | | | N/A | | | | N/A | | | | N/A | | | | N/A | |
| Investor | | | | | | | | | | | | | | | | | | | | | | | | | | | | | | | | | | | | | | | | | | | | | | | | |
Actual | | | 1,000 | | | | 1,032.70 | | | | 6.22 | | | | 1,000 | | | | 908.50 | | | | 5.93 | | | | 1,000 | | | | 916.60 | | | | 6.00 | | | | 1,000 | | | | 821.50 | | | | 6.25 | |
Hypothetical 5% return | | | 1,000 | | | | 1,018.75 | + | | | 6.17 | | | | 1,000 | | | | 1,018.65 | + | | | 6.27 | | | | 1,000 | | | | 1,018.60 | + | | | 6.32 | | | | 1,000 | | | | 1,018.00 | + | | | 6.92 | |
| Class P | | | | | | | | | | | | | | | | | | | | | | | | | | | | | | | | | | | | | | | | | | | | | | | | |
Actual | | | 1,000 | | | | 1,033.40 | | | | 5.76 | | | | 1,000 | | | | 909.10 | | | | 5.36 | | | | 1,000 | | | | 834.40 | | | | 2.16 | | | | 1,000 | | | | 823.10 | | | | 5.62 | |
Hypothetical 5% return | | | 1,000 | | | | 1,019.19 | + | | | 5.72 | | | | 1,000 | | | | 1,019.24 | + | | | 5.67 | | | | 1,000 | | | | 1,020.59 | + | | | 4.32 | | | | 1,000 | | | | 1,018.70 | + | | | 6.22 | |
| Class R | | | | | | | | | | | | | | | | | | | | | | | | | | | | | | | | | | | | | | | | | | | | | | | | |
Actual | | | N/A | | | | N/A | | | | N/A | | | | N/A | | | | N/A | | | | N/A | | | | 1,000 | | | | 913.50 | | | | 8.37 | | | | N/A | | | | N/A | | | | N/A | |
Hypothetical 5% return | | | N/A | | | | N/A | | | | N/A | | | | N/A | | | | N/A | | | | N/A | | | | 1,000 | | | | 1,016.11 | + | | | 8.82 | | | | N/A | | | | N/A | | | | N/A | |
| Class R6 | | | | | | | | | | | | | | | | | | | | | | | | | | | | | | | | | | | | | | | | | | | | | | | | |
Actual | | | 1,000 | | | | 1,033.40 | | | | 5.76 | | | | 1,000 | | | | 909.10 | | | | 5.36 | | | | 1,000 | | | | 916.90 | | | | 5.39 | | | | 1,000 | | | | 822.00 | | | | 5.71 | |
Hypothetical 5% return | | | 1,000 | | | | 1,019.19 | + | | | 5.72 | | | | 1,000 | | | | 1,019.24 | + | | | 5.67 | | | | 1,000 | | | | 1,019.24 | + | | | 5.67 | | | | 1,000 | | | | 1,018.60 | + | | | 6.32 | |
| + | | Hypothetical expenses are based on each Fund’s actual annualized net expense ratios and an assumed rate of return of 5% per year before expenses. |
| * | | Expenses are calculated using each Fund’s annualized net expense ratio for each class, which represents the ongoing expenses as a percentage of net assets for the six months ended April 30, 2020. Expenses are calculated by multiplying the annualized net expense ratio by the average account value for the period; then multiplying the result by the number of days in the most recent fiscal half year; and then dividing that result by the number of days in the fiscal year. The annualized net expense ratios for the period were as follows: |
| | | | | | | | | | | | | | | | | | | | | | | | | | | | | | | | |
| Fund | | Class A | | | Class C | | | Institutional | | | Service | | | Investor | | | Class P | | | Class R | | | Class R6 | |
China Equity | | | 1.48 | % | | | 2.23 | % | | | 1.15 | % | | | N/A | | | | 1.23 | % | | | 1.14 | % | | | N/A | | | | 1.14 | % |
Emerging Markets Equity | | | 1.50 | | | | 2.25 | | | | 1.14 | | | | 1.64 | % | | | 1.25 | | | | 1.13 | | | | N/A | | | | 1.13 | |
ESG Emerging Markets Equity | | | 1.51 | | | | 2.26 | | | | 1.14 | | | | N/A | | | | 1.26 | | | | 0.86 | (a) | | | 1.76 | % | | | 1.13 | |
Imprint Emerging Markets Opportunities | | | 1.63 | | | | 2.39 | | | | 1.25 | | | | N/A | | | | 1.38 | | | | 1.24 | | | | N/A | | | | 1.26 | |
| (a) | | Commenced operations on January 21, 2020. |
65
FUNDS PROFILE
Goldman Sachs Funds
Goldman Sachs is a premier financial services firm, known since 1869 for creating thoughtful and customized investment solutions in complex global markets.
Today, theConsumer and Investment Management Division of Goldman Sachs serves a diverse set of clients worldwide, including private institutions, public entities and individuals. With approximately $1.66 trillion in assets under supervision as of March 31, 2020, Goldman Sachs Asset Management (“GSAM”) has portfolio management teams located around the world and our investment professionals bring firsthand knowledge of local markets to every investment decision. Assets under supervision includes assets under management and other client assets for which Goldman Sachs does not have full discretion. GSAM leverages the resources of Goldman Sachs & Co. LLC subject to legal, internal and regulatory restrictions.
Money Market
Financial Square FundsSM
| ∎ | | Financial Square Treasury Solutions Fund1 |
| ∎ | | Financial Square Government Fund1 |
| ∎ | | Financial Square Money Market Fund2 |
| ∎ | | Financial Square Prime Obligations Fund2 |
| ∎ | | Financial Square Treasury Instruments Fund1 |
| ∎ | | Financial Square Treasury Obligations Fund1 |
| ∎ | | Financial Square Federal Instruments Fund1 |
Investor FundsSM
| ∎ | | Investor Money Market Fund3 |
| ∎ | | Investor Tax-Exempt Money Market Fund3 |
Fixed Income
Short Duration and Government
| ∎ | | High Quality Floating Rate Fund |
| ∎ | | Short-Term Conservative Income Fund |
| ∎ | | Short Duration Government Fund |
| ∎ | | Short Duration Income Fund |
| ∎ | | Inflation Protected Securities Fund |
Multi-Sector
| ∎ | | Global Core Fixed Income Fund4 |
Municipal and Tax-Free
| ∎ | | High Yield Municipal Fund |
| ∎ | | Dynamic Municipal Income Fund |
| ∎ | | Short Duration Tax-Free Fund |
| ∎ | | Municipal Income Completion Fund |
Single Sector
| ∎ | | Investment Grade Credit Fund |
| ∎ | | High Yield Floating Rate Fund |
| ∎ | | Emerging Markets Debt Fund |
| ∎ | | Local Emerging Markets Debt Fund |
Fixed Income Alternatives
| ∎ | | Long Short Credit Strategies Fund |
Fundamental Equity
| ∎ | | Small/Mid Cap Value Fund |
| ∎ | | Small/Mid Cap Growth Fund |
| ∎ | | Concentrated Growth Fund |
| ∎ | | Technology Opportunities Fund |
| ∎ | | Growth Opportunities Fund |
| ∎ | | Rising Dividend Growth Fund |
Tax-Advantaged Equity
| ∎ | | U.S. Tax-Managed Equity Fund |
| ∎ | | International Tax-Managed Equity Fund |
| ∎ | | U.S. Equity Dividend and Premium Fund |
| ∎ | | International Equity Dividend and Premium Fund |
Equity Insights
| ∎ | | Small Cap Equity Insights Fund |
| ∎ | | U.S. Equity Insights Fund |
| ∎ | | Small Cap Growth Insights Fund |
| ∎ | | Large Cap Growth Insights Fund |
| ∎ | | Large Cap Value Insights Fund |
| ∎ | | Small Cap Value Insights Fund |
| ∎ | | International Small Cap Insights Fund |
| ∎ | | International Equity Insights Fund |
| ∎ | | Emerging Markets Equity Insights Fund |
Fundamental Equity International
| ∎ | | International Equity Income Fund |
| ∎ | | International Equity ESG Fund |
| ∎ | | Emerging Markets Equity Fund |
| ∎ | | Imprint Emerging Markets Opportunities Fund6 |
| ∎ | | ESG Emerging Markets Equity Fund |
Alternative
| ∎ | | Real Estate Securities Fund |
| ∎ | | International Real Estate Securities Fund |
| ∎ | | Commodity Strategy Fund |
| ∎ | | Global Real Estate Securities Fund |
| ∎ | | Alternative Premia Fund |
| ∎ | | Absolute Return Tracker Fund |
| ∎ | | Managed Futures Strategy Fund |
| ∎ | | MLP Energy Infrastructure Fund |
| ∎ | | Multi-Manager Alternatives Fund |
| ∎ | | Global Infrastructure Fund |
Total Portfolio Solutions
| ∎ | | Global Managed Beta Fund |
| ∎ | | Multi-Manager Non-Core Fixed Income Fund |
| ∎ | | Multi-Manager U.S. Dynamic Equity Fund |
| ∎ | | Multi-Manager Global Equity Fund |
| ∎ | | Multi-Manager International Equity Fund |
| ∎ | | Tactical Tilt Overlay Fund |
| ∎ | | Balanced Strategy Portfolio |
| ∎ | | Multi-Manager U.S. Small Cap Equity Fund |
| ∎ | | Multi-Manager Real Assets Strategy Fund |
| ∎ | | Growth and Income Strategy Portfolio |
| ∎ | | Growth Strategy Portfolio |
| ∎ | | Dynamic Global Equity Fund |
| ∎ | | Satellite Strategies Portfolio |
| ∎ | | Enhanced Dividend Global Equity Portfolio |
| ∎ | | Tax-Advantaged Global Equity Portfolio |
| ∎ | | Strategic Factor Allocation Fund |
| ∎ | | Target Date Retirement Portfolio7 |
| ∎ | | Target Date 2025 Portfolio |
| ∎ | | Target Date 2030 Portfolio |
| ∎ | | Target Date 2035 Portfolio |
| ∎ | | Target Date 2040 Portfolio |
| ∎ | | Target Date 2045 Portfolio |
| ∎ | | Target Date 2050 Portfolio |
| ∎ | | Target Date 2055 Portfolio |
| ∎ | | Target Date 2060 Portfolio |
| ∎ | | GQG Partners International Opportunities Fund |
| 1 | | You could lose money by investing in the Fund. Although the Fund seeks to preserve the value of your investment at $1.00 per share, it cannot guarantee it will do so. An investment in the Fund is not a deposit of a bank and is not insured or guaranteed by the Federal Deposit Insurance Corporation or any other government agency. The Fund’s sponsor has no legal obligation to provide financial support to the Fund, and you should not expect that the sponsor will provide financial support to the Fund at any time. |
| 2 | | You could lose money by investing in the Fund. Because the share price of the Fund will fluctuate, when you sell your shares they may be worth more or less than what you originally paid for them. The Fund may impose a fee upon sale of your shares or may temporarily suspend your ability to sell shares if the Fund’s liquidity falls below required minimums because of market conditions or other factors. An investment in the Fund is not a deposit of a bank and is not insured or guaranteed by the Federal Deposit Insurance Corporation or any other government agency. The Fund’s sponsor has no legal obligation to provide financial support to the Fund, and you should not expect that the sponsor will provide financial support to the Fund at any time. |
| 3 | | You could lose money by investing in the Fund. Although the Fund seeks to preserve the value of your investment at $1.00 per share, it cannot guarantee it will do so. The Fund may impose a fee upon sale of your shares or may temporarily suspend your ability to sell shares if the Fund’s liquidity falls below required minimums because of market conditions or other factors. An investment in the Fund is not a deposit of a bank and is not insured or guaranteed by the Federal Deposit Insurance Corporation or any other government agency. The Fund’s sponsor has no legal obligation to provide financial support to the Fund, and you should not expect that the sponsor will provide financial support to the Fund at any time. |
| 4 | | Effective after the close of business on April 30, 2020, the Goldman Sachs Global Income Fund was renamed the Goldman Sachs Global Core Fixed Income Fund. |
| 5Effective | | after the close of business of November 20, 2019, the Goldman Sachs Asia Equity Fund was renamed the Goldman Sachs China Equity Fund. |
| 6Effective | | after the close of business on August 30, 2019, the Goldman Sachs N-11 Equity Fund was renamed the Goldman Sachs Imprint Emerging Markets Opportunities Fund. |
| 7Effective | | December 27, 2019, the Goldman Sachs Target Date 2020 Portfolio was renamed the Goldman Sachs Target Date Retirement Portfolio. |
| | | Financial Square FundsSM and Investor FundsSM are registered service marks of Goldman Sachs & Co. LLC. |
| * | | This list covers open-end funds only. Please visit our website at www.GSAMFUNDS.com to learn about our closed-end funds and exchange-traded funds. |
| | |
TRUSTEES Jessica Palmer,Chair Dwight L. Bush Kathryn A. Cassidy Diana M. Daniels Joaquin Delgado James A. McNamara Roy W. Templin Gregory G. Weaver | | OFFICERS James A. McNamara,President Joseph F. DiMaria,
Principal Financial Officer,
Principal Accounting Officer and Treasurer Caroline L. Kraus,Secretary |
| |
GOLDMAN SACHS & CO. LLC Distributor and Transfer Agent | | GOLDMAN SACHS ASSET MANAGEMENT, L.P. Investment Adviser |
Visit our website atwww.GSAMFUNDS.com to obtain the most recent month-end returns.
Goldman Sachs Asset Management, L.P., 200 West Street, New York, New York 10282
The reports concerning the Funds included in this shareholder report may contain certain forward-looking statements about the factors that may affect the performance of the Funds in the future. These statements are based on Fund management’s predictions and expectations concerning certain future events and their expected impact on the Funds, such as performance of the economy as a whole and of specific industry sectors, changes in the levels of interest rates, the impact of developing world events, and other factors that may influence the future performance of the Funds. Management believes these forward-looking statements to be reasonable, although they are inherently uncertain and difficult to predict. Actual events may cause adjustments in portfolio management strategies from those currently expected to be employed.
A description of the policies and procedures that the Funds use to determine how to vote proxies relating to portfolio securities and information regarding how a Fund voted proxies relating to portfolio securities during the most recent 12-month period ended June 30 is available (i) without charge, upon request by calling 1-800-526-7384 (for Retail Shareholders) or 1-800-621-2550 (for Institutional Shareholders); and (ii) on the Securities and Exchange Commission (the “SEC”) web site at http://www.sec.gov.
Economic and market forecasts presented herein reflect our judgment as of the date of this presentation and are subject to change without notice. These forecasts do not take into account the specific investment objectives, restrictions, tax and financial situation or other needs of any specific client. Actual data will vary and may not be reflected here. These forecasts are subject to high levels of uncertainty that may affect actual performance. Accordingly, these forecasts should be viewed as merely representative of a broad range of possible outcomes. These forecasts are estimated, based on assumptions, and are subject to significant revision and may change materially as economic and market conditions change. Goldman Sachs has no obligation to provide updates or changes to these forecasts. Case studies and examples are for illustrative purposes only.
The Global Industry Classification Standard (GICS) was developed by and is the exclusive property and a service mark of Morgan Stanley Capital International Inc. (MSCI) and Standard & Poor’s, a division of The McGraw-Hill Companies, Inc. (S&P) and is licensed for use by Goldman Sachs. Neither MSCI, S&P nor any other party involved in making or compiling the GICS or any GICS classifications makes any express or implied warranties or representations with respect to such standard or classification (or the results to be obtained by the use thereof), and all such parties hereby expressly disclaim all warranties of originality, accuracy, completeness, merchantability or fitness for a particular purpose with respect to any of such standard or classification. Without limiting any of the foregoing, in no event shall MSCI, S&P, any of their affiliates or any third party involved in making or compiling the GICS or any GICS classifications have any liability for any direct, indirect, special, punitive, consequential or any other damages (including lost profits) even if notified of the possibility of such damages.
The Funds will file portfolio holdings information for each month in a fiscal quarter within 60 days after the end of the relevant fiscal quarter on Form N-PORT. Portfolio holdings information for the third month of each fiscal quarter will be made available on the SEC’s web site at http://www.sec.gov. Portfolio holdings information may be obtained upon request and without charge by calling 1-800-526-7384 (for Retail Shareholders) or 1-800-621-2550 (for Institutional Shareholders).
Holdings and allocations shown are as of April 30, 2020 and may not be representative of future investments. Fund holdings should not be relied on in making investment decisions and should not be construed as research or investment advice regarding particular securities. Current and future holdings are subject to risk.
The portfolio risk management process includes an effort to monitor and manage risk, but does not imply low risk.
This material is not authorized for distribution to prospective investors unless preceded or accompanied by a current prospectus or summary prospectus, if applicable. Investors should consider a Fund’s objective, risks, and charges and expenses, and read the summary prospectus, if available, and/or the prospectus carefully before investing or sending money. The summary prospectus, if available, and the prospectus contain this and other information about a Fund and may be obtained from your authorized dealer or from Goldman Sachs & Co. LLC by calling (retail – 1-800-526-7384) (institutional – 1-800-621-2550).
© 2020 Goldman Sachs. All rights reserved. 07069-OTU-1215139 EMESAR-20
Goldman Sachs Funds

| | | | |
| | |
| Semi-Annual Report | | | | April 30, 2020 |
| | |
| | | | Fundamental International Equity Funds |
| | | | International Equity ESG |
| | | | International Equity Income |
It is our intention that beginning on January 1, 2021, paper copies of the Funds’ annual and semi-annual shareholder reports will no longer be sent by mail, unless you specifically request paper copies of the reports from a Fund or from your financial intermediary. Instead, the reports will be made available on a website, and you will be notified by mail each time a report is posted and provided with a website link to access the report.
If you already elected to receive shareholder reports electronically, you will not be affected by this change and you need not take any action. At any time, you may elect to receive reports and certain communications from a Fund electronically by calling the applicable toll-free number below or by contacting your financial intermediary.
You may elect to receive all future shareholder reports in paper free of charge. If you hold shares of a Fund directly with the Fund’s transfer agent, you can inform the transfer agent that you wish to receive paper copies of reports by callingtoll-free 800-621-2550 for Institutional, Service, Class R6 and Class P shareholders or 800-526-7384 for all other shareholders. If you hold shares of a Fund through a financial intermediary, please contact your financial intermediary to make this election. Your election to receive reports in paper will apply to all Goldman Sachs Funds held in your account if you invest through your financial intermediary or all Goldman Sachs Funds held with the Funds’ transfer agent if you invest directly with the transfer agent.

Goldman Sachs Fundamental International Equity Funds
| ∎ | | INTERNATIONAL EQUITY ESG |
| ∎ | | INTERNATIONAL EQUITY INCOME |
| | | | |
| | | |
| NOT FDIC-INSURED | | May Lose Value | | No Bank Guarantee |
Recent Market Events related to COVID-19
While this semi-annual report covers the six month period ended April 30, 2020, we want to describe some more recent events through the end of May.
An outbreak of a novel strain of coronavirus (COVID-19) has emerged globally. The outbreak of COVID-19 has prompted a number of measures to limit the spread, including travel and border restrictions, quarantines, curfews and restrictions on large gatherings. In turn, these resulted in lower consumer activity, diminished demand for a wide range of products and services, and disruption in manufacturing and supply chains. While governments have already taken unprecedented action to limit disruption to the financial system, global financial markets have experienced and may continue to experience significant volatility resulting from the spread of and subsequent intervening measures intended to limit the spread of COVID-19. A Fund could be negatively impacted if the value of a portfolio holding were harmed by such political or economic conditions, events, or actions. The full extent of the impact of COVID-19 on a Fund’s performance cannot be determined at this time and will depend on future developments, including the duration and the continued spread of the outbreak. Goldman Sachs Asset Management’s long-term commitment to you, our Fund shareholders, remains unchanged. We encourage you to maintain perspective and stay current with timely commentary and investment insights by visiting gsam.com.
i
FUND BASICS
International Equity ESG Fund
as of April 30, 2020
| | | | | | | | | | |
| | PERFORMANCE REVIEW | | | | | |
| | | |
| | | November 1, 2019 – April 30, 2020 | | Fund Total Return
(based on NAV)1 | | | MSCI® EAFE Index2 | |
| | | |
| | Class A | | | -11.60 | % | | | -14.21 | % |
| | Class C | | | -11.93 | | | | -14.21 | |
| | Institutional | | | -11.44 | | | | -14.21 | |
| | Service | | | -11.62 | | | | -14.21 | |
| | Investor | | | -11.43 | | | | -14.21 | |
| | Class P | | | -11.39 | | | | -14.21 | |
| | | Class R6 | | | -11.42 | | | | -14.21 | |
| 1 | | The net asset value (“NAV”) represents the net assets of the class of the Fund (ex-dividend) divided by the total number of shares of the class outstanding. The Fund’s performance assumes the reinvestment of dividends and other distributions. The Fund’s performance does not reflect the deduction of any applicable sales charges. |
| 2 | | The MSCI® EAFE Index is a market capitalization-weighted composite of securities in 21 developed markets. The MSCI® EAFE Index approximates the minimum possible dividend reinvestment. The dividend is reinvested after deduction for withholding tax, applying the rate to non-resident individuals who do not benefit from double taxation treaties. MSCI® Inc. uses withholding tax rates applicable to Luxembourg holding companies, as Luxembourg applies the highest rates. The MSCI® EAFE Index is unmanaged and the figures for the MSCI® EAFE Index do not include any deduction for fees or expenses. It is not possible to invest directly in an index. |
The returns set forth in the tables above represent past performance. Past performance does not guarantee future results. The Fund’s investment return and principal value will fluctuate so that an investor’s shares, when redeemed, may be worth more or less than their original cost. Current performance may be lower or higher than the performance quoted above. Please visit our web site at www.GSAMFUNDS.com to obtain the most recent month-end returns.Performance reflects applicable fee waivers and/or expense limitations in effect during the periods shown. In their absence, performance would be reduced. Returns do not reflect the deduction of taxes that a shareholder would pay on Fund distributions or the redemption of Fund shares.
| | | | | | | | | | |
| | TOP TEN HOLDINGS AS OF 4/30/203,4 |
| | | | |
| | | Holding | | % of
Net Assets | | | Line of Business | | Country |
| | | | |
| | Nestle SA (Registered) | | | 4.8 | % | | Food Products | | Switzerland |
| | | | |
| | AstraZeneca plc | | | 3.9 | | | Pharmaceuticals, Biotechnology & Life Sciences | | United Kingdom |
| | | | |
| | Rentokil Initial plc | | | 3.6 | | | Commercial & Professional Services | | United Kingdom |
| | | | |
| | Taiwan Semiconductor Manufacturing Co. Ltd. ADR | | | 3.3 | | | Semiconductors & Semiconductor Equipment | | Taiwan |
| | | | |
| | Obic Co. Ltd. | | | 3.3 | | | Software & Services | | Japan |
| | | | |
| | Hoya Corp. | | | 3.2 | | | Health Care Equipment & Services | | Japan |
| | | | |
| | Nidec Corp. | | | 3.2 | | | Capital Goods | | Japan |
| | | | |
| | Aalberts NV | | | 3.2 | | | Capital Goods | | Netherlands |
| | | | |
| | DS Smith plc | | | 3.1 | | | Materials | | United Kingdom |
| | | BNP Paribas SA | | | 3.1 | | | Banks | | France |
| 3 | | The top 10 holdings may not be representative of the Fund’s future investments. |
| 4 | | The line of business for each holding is reported at the industry or sub-industry level. |
1
FUND BASICS
|
| FUND VS. BENCHMARK SECTOR ALLOCATIONS5 |
|
| As of April 30, 2020 |
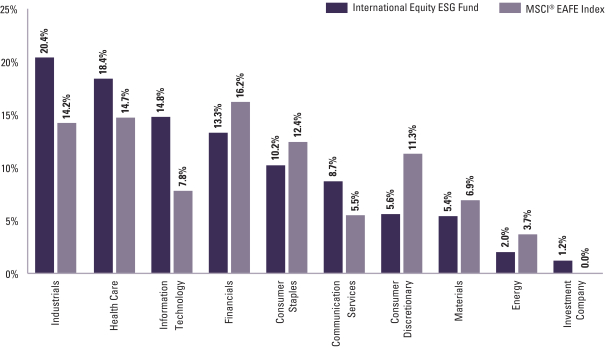
| 5 | | The Fund is actively managed and, as such, its composition may differ over time. Consequently, the Fund’s overall sector allocations may differ from percentages contained in the graph above. The graph categorizes investments using Global Industry Classification Standard (“GICS”); however, the sector classifications used by the portfolio management team may differ from GICS. The percentage shown for each investment category reflects the value of investments in that category as a percentage of market value. Underlying sector allocations of exchange traded funds and investment companies held by the Fund are not reflected in the graph above. |
For more information about the Fund, please refer to www.GSAMFUNDS.com. There, you can learn more about the Fund’s investment strategies, holdings, and performance.
2
FUND BASICS
International Equity Income Fund
as of April 30, 2020
| | | | | | | | | | |
| | PERFORMANCE REVIEW | |
| | | |
| | | November 1, 2019 – April 30, 2020 | | Fund Total Return
(based on NAV)1 | | | MSCI® EAFE Index2 | |
| | | |
| | Class A | | | -16.07 | % | | | -14.21 | % |
| | Class C | | | -16.29 | | | | -14.21 | |
| | Institutional | | | -15.90 | | | | -14.21 | |
| | Investor | | | -15.98 | | | | -14.21 | |
| | Class P | | | -15.87 | | | | -14.21 | |
| | Class R | | | -16.19 | | | | -14.21 | |
| | | Class R6 | | | -15.90 | | | | -14.21 | |
| 1 | | The net asset value (“NAV”) represents the net assets of the class of the Fund(ex-dividend) divided by the total number of shares of the class outstanding. The Fund’s performance assumes the reinvestment of dividends and other distributions. The Fund’s performance does not reflect the deduction of any applicable sales charges. |
| 2 | | The MSCI®EAFE Index is a market capitalization-weighted composite of securities in 21 developed markets. The MSCI®EAFE Index approximates the minimum possible dividend reinvestment. The dividend is reinvested after deduction for withholding tax, applying the rate tonon-resident individuals who do not benefit from double taxation treaties. MSCI®Inc. uses withholding tax rates applicable to Luxembourg holding companies, as Luxembourg applies the highest rates. The MSCI®EAFE Index is unmanaged and the figures for the MSCI®EAFE Index do not include any deduction for fees or expenses. It is not possible to invest directly in an index. |
The returns set forth in the tables above represent past performance. Past performance does not guarantee future results. The Fund’s investment return and principal value will fluctuate so that an investor’s shares, when redeemed, may be worth more or less than their original cost. Current performance may be lower or higher than the performance quoted above. Please visit our web site at www.GSAMFUNDS.com to obtain the most recentmonth-end returns.Performance reflects applicable fee waivers and/or expense limitations in effect during the periods shown. In their absence, performance would be reduced. Returns do not reflect the deduction of taxes that a shareholder would pay on Fund distributions or the redemption of Fund shares.
| | | | | | | | | | |
| | TOP TEN HOLDINGS AS OF 4/30/203,4 |
| | | | |
| | | Holding | | % of
Net Assets | | | Line of Business | | Country |
| | | | |
| | AstraZeneca plc | | | 4.8 | % | | Pharmaceuticals, Biotechnology & Life Sciences | | United Kingdom |
| | Nestle SA (Registered) | | | 4.7 | | | Food Products | | Switzerland |
| | Gecina SA (REIT) | | | 4.3 | | | Real Estate | | France |
| | Rio Tinto plc | | | 3.8 | | | Materials | | Australia |
| | Schneider Electric SE | | | 3.7 | | | Capital Goods | | France |
| | Taiwan Semiconductor Manufacturing Co. Ltd. | | | 3.5 | | | Semiconductors & Semiconductor Equipment | | Taiwan |
| | Vonovia SE | | | 3.4 | | | Real Estate | | Germany |
| | Novartis AG (Registered) | | | 3.3 | | | Pharmaceuticals, Biotechnology & Life Sciences | | Switzerland |
| | DS Smith plc | | | 3.2 | | | Materials | | United Kingdom |
| | | Ferguson plc | | | 3.2 | | | Capital Goods | | United States |
| 3 | | The top 10 holdings may not be representative of the Fund’s future investments. |
| 4 | | The line of business for each holding is reported at the industry or sub-industry level. |
3
FUND BASICS
|
| FUND VS. BENCHMARK SECTOR ALLOCATIONS5 |
|
| As of April 30, 2020 |
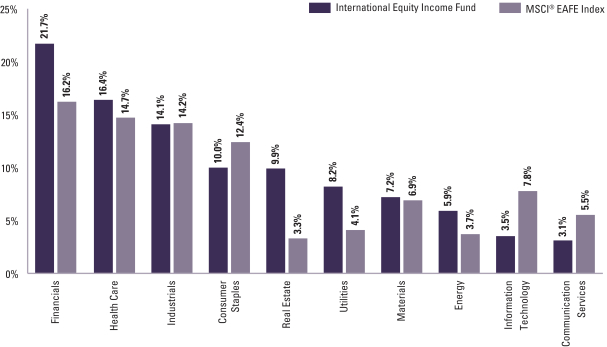
| 5 | | The Fund is actively managed and, as such, its composition may differ over time. Consequently, the Fund’s overall sector allocations may differ from percentages contained in the graph above. The graph categorizes investments using Global Industry Classification Standard (“GICS”); however, the sector classifications used by the portfolio management team may differ from GICS. The percentage shown for each investment category reflects the value of investments in that category as a percentage of market value. |
For more information about your Fund, please refer to www.GSAMFUNDS.com. There, you can learn more about your Fund’s investment strategies, holdings, and performance.
4
GOLDMAN SACHS INTERNATIONAL EQUITY ESG FUND
Schedule of Investments
April 30, 2020 (Unaudited)
| | | | | | | | |
| Shares | | | Description | |
Value | |
| |
| Common Stocks – 97.2% | | | |
| Denmark – 2.6% | | | |
| | 47,799 | | | Novo Nordisk A/S Class B (Pharmaceuticals, Biotechnology & Life Sciences) | | $ | 3,049,099 | |
| | |
| Finland – 2.0% | | | |
| | 66,305 | | | Neste OYJ (Energy) | | | 2,341,597 | |
| | |
| France – 8.2% | | | |
| | 336,729 | | | Adevinta ASA (Media & Entertainment)* | | | 2,796,773 | |
| | 115,208 | | | BNP Paribas SA (Banks) | | | 3,619,414 | |
| | 40,571 | | | Vinci SA (Capital Goods) | | | 3,323,658 | |
| | | | | | | | |
| | | | | | | 9,739,845 | |
| | |
| Germany – 5.1% | | | |
| | 63,002 | | | CTS Eventim AG & Co. KGaA (Media & Entertainment) | | | 2,619,107 | |
| | 182,355 | | | Infineon Technologies AG (Semiconductors & Semiconductor Equipment) | | | 3,390,150 | |
| | | | | | | | |
| | | | | | | 6,009,257 | |
| | |
| Japan – 18.8% | | | |
| | 42,200 | | | Hoya Corp. (Health Care Equipment & Services) | | | 3,848,359 | |
| | 6,700 | | | Keyence Corp. (Technology Hardware & Equipment) | | | 2,391,981 | |
| | 64,800 | | | Nidec Corp. (Capital Goods) | | | 3,772,273 | |
| | 26,300 | | | Obic Co. Ltd. (Software & Services) | | | 3,946,618 | |
| | 197,500 | | | ORIX Corp. (Diversified Financials) | | | 2,324,081 | |
| | 45,200 | | | Shiseido Co. Ltd. (Household & Personal Products) | | | 2,657,455 | |
| | 92,973 | | | Takeda Pharmaceutical Co. Ltd. (Pharmaceuticals, Biotechnology & Life Sciences) | | | 3,352,742 | |
| | | | | | | | |
| | | | | | | 22,293,509 | |
| | |
| Netherlands – 5.4% | | | |
| | 133,624 | | | Aalberts NV (Capital Goods) | | | 3,762,815 | |
| | 21,014 | | | Koninklijke DSM NV (Materials) | | | 2,575,516 | |
| | | | | | | | |
| | | | | | | 6,338,331 | |
| | |
| Singapore – 1.7% | | | |
| | 142,480 | | | DBS Group Holdings Ltd. (Banks) | | | 2,005,992 | |
| | |
| Spain – 6.6% | | | |
| | 800,790 | | | Banco Bilbao Vizcaya Argentaria SA (Banks) | | | 2,617,608 | |
| | 43,176 | | | Cellnex Telecom SA (Telecommunication Services)(a) | | | 2,258,312 | |
| | 87,310 | | | Grifols SA (Pharmaceuticals, Biotechnology & Life Sciences) | | | 2,979,619 | |
| | | | | | | | |
| | | | | | | 7,855,539 | |
| | |
| Sweden – 4.7% | | | |
| | 114,340 | | | Assa Abloy AB Class B (Capital Goods) | | | 2,046,908 | |
| | |
| |
| Common Stocks – (continued) | | | |
| Sweden – (continued) | | | |
| | 72,558 | | | Hexagon AB Class B (Technology Hardware & Equipment)* | | | 3,560,562 | |
| | | | | | | | |
| | | | | | | 5,607,470 | |
| | |
| Switzerland – 12.0% | | | |
| | 308,086 | | | Credit Suisse Group AG (Registered) (Diversified Financials)* | | | 2,813,022 | |
| | 53,824 | | | Nestle SA (Registered) (Food Products) | | | 5,700,501 | |
| | 41,656 | | | Novartis AG (Registered) (Pharmaceuticals, Biotechnology & Life Sciences) | | | 3,554,859 | |
| | 6,867 | | | Zurich Insurance Group AG (Insurance) | | | 2,177,212 | |
| | | | | | | | |
| | | | | | | 14,245,594 | |
| | |
| Taiwan – 3.3% | | | |
| | 74,688 | | | Taiwan Semiconductor Manufacturing Co. Ltd. ADR (Semiconductors & Semiconductor Equipment) | | | 3,968,173 | |
| | |
| United Kingdom – 24.1% | | | |
| | 44,284 | | | AstraZeneca plc (Pharmaceuticals, Biotechnology & Life Sciences) | | | 4,631,757 | |
| | 172,358 | | | Compass Group plc (Consumer Services) | | | 2,900,339 | |
| | 947,247 | | | DS Smith plc (Materials) | | | 3,714,114 | |
| | 118,318 | | | Experian plc (Commercial & Professional Services) | | | 3,553,133 | |
| | 439,015 | | | Informa plc (Media & Entertainment) | | | 2,425,058 | |
| | 78,517 | | | InterContinental Hotels Group plc (Consumer Services) | | | 3,576,662 | |
| | 42,411 | | | Reckitt Benckiser Group plc (Household & Personal Products) | | | 3,532,826 | |
| | 714,424 | | | Rentokil Initial plc (Commercial & Professional Services) | | | 4,250,548 | |
| | | | | | | | |
| | | | | | | 28,584,437 | |
| | |
| United States – 2.7% | | | |
| | 43,728 | | | Ferguson plc (Capital Goods) | | | 3,152,889 | |
| | |
| | TOTAL COMMON STOCKS | | | | |
| | (Cost $123,713,245) | | $ | 115,191,732 | |
| | |
| | | | | | | | |
| Shares | | | Dividend Rate | | Value | |
|
| Investment Company(b) – 1.2% | |
| Goldman Sachs Financial Square Government Fund –
Institutional Shares |
|
| | 1,369,428 | | | 0.233% | | $ | 1,369,428 | |
| | (Cost $ $1,369,428) | | | | |
| | |
| | TOTAL INVESTMENTS – 98.4% | | | | |
| | (Cost $125,082,673) | | $ | 116,561,160 | |
| | |
| OTHER ASSETS IN EXCESS OF
LIABILITIES – 1.6% | | | 1,936,221 | |
| | |
| | NET ASSETS – 100.0% | | $ | 118,497,381 | |
| | |
| | |
| The accompanying notes are an integral part of these financial statements. | | 5 |
GOLDMAN SACHS INTERNATIONAL EQUITY ESG FUND
Schedule of Investments(continued)
April 30, 2020 (Unaudited)
| | |
|
| The percentage shown for each investment category reflects the value of investments in that category as a percentage of net assets. |
| |
* | | Non-income producing security. |
| |
(a) | | Exempt from registration under Rule 144A of the Securities Act of 1933. |
| |
(b) | | Represents an Affiliated Issuer. |
| | | | |
|
Investment Abbreviation: |
ADR | | —American Depositary Receipt |
|
| | |
| 6 | | The accompanying notes are an integral part of these financial statements. |
GOLDMAN SACHS INTERNATIONAL EQUITY INCOME FUND
Schedule of Investments
April 30, 2020 (Unaudited)
| | | | | | | | |
| Shares | | | Description | |
Value | |
| |
| Common Stocks – 97.8% | | | |
| Australia – 5.6% | | | |
| | 49,596 | | | Rio Tinto plc (Materials) | | $ | 2,302,180 | |
| | 268,089 | | | Sydney Airport (Transportation) | | | 1,092,031 | |
| | | | | | | | |
| | | | | | | 3,394,211 | |
| | |
| Denmark – 2.7% | | | |
| | 26,097 | | | Novo Nordisk A/S Class B (Pharmaceuticals, Biotechnology & Life Sciences) | | | 1,664,728 | |
| | |
| Finland – 2.1% | | | |
| | 201,785 | | | Nordea Bank Abp (Banks) | | | 1,294,236 | |
| | |
| France – 14.9% | | | |
| | 35,689 | | | BNP Paribas SA (Banks) | | | 1,121,218 | |
| | 19,915 | | | Gecina SA (REIT) | | | 2,613,067 | |
| | 59,718 | | | Klepierre SA (REIT) | | | 1,212,330 | |
| | 24,260 | | | Schneider Electric SE (Capital Goods)* | | | 2,241,925 | |
| | 23,363 | | | Vinci SA (Capital Goods) | | | 1,913,944 | |
| | | | | | | | |
| | | | | | | 9,102,484 | |
| | |
| Germany – 3.4% | | | |
| | 42,307 | | | Vonovia SE (Real Estate) | | | 2,092,033 | |
| | |
| Italy – 3.0% | | | |
| | 268,562 | | | Enel SpA (Utilities) | | | 1,834,400 | |
| | |
| Japan – 4.6% | | | |
| | 96,000 | | | ORIX Corp. (Diversified Financials) | | | 1,129,680 | |
| | 47,300 | | | Takeda Pharmaceutical Co. Ltd. (Pharmaceuticals, Biotechnology & Life Sciences) | | | 1,705,707 | |
| | | | | | | | |
| | | | | | | 2,835,387 | |
| | |
| Netherlands – 7.7% | | | |
| | 165,978 | | | ING Groep NV (Banks) | | | 929,939 | |
| | 809,265 | | | Koninklijke KPN NV (Telecommunication Services) | | | 1,864,014 | |
| | 114,090 | | | Royal Dutch Shell plc Class A (Energy) | | | 1,878,408 | |
| | | | | | | | |
| | | | | | | 4,672,361 | |
| | |
| Singapore – 3.7% | | | |
| | 72,500 | | | DBS Group Holdings Ltd. (Banks) | | | 1,020,736 | |
| | 181,000 | | | Singapore Exchange Ltd. (Diversified Financials) | | | 1,234,258 | |
| | | | | | | | |
| | | | | | | 2,254,994 | |
| | |
| Spain – 4.8% | | | |
| | 47,566 | | | Ferrovial SA (Capital Goods) | | | 1,191,045 | |
| | 172,164 | | | Iberdrola SA (Utilities) | | | 1,712,651 | |
| | | | | | | | |
| | | | | | | 2,903,696 | |
| | |
| Switzerland – 16.3% | | | |
| | 26,983 | | | Nestle SA (Registered) (Food Products) | | | 2,857,770 | |
| | 23,398 | | | Novartis AG (Registered) (Pharmaceuticals, Biotechnology & Life Sciences) | | | 1,996,750 | |
| | 19,575 | | | Swiss Re AG (Insurance) | | | 1,422,444 | |
| | |
| |
| Common Stocks – (continued) | | | |
| Switzerland – (continued) | | | |
| | 161,700 | | | UBS Group AG (Registered) (Diversified Financials)* | | | 1,731,402 | |
| | 6,076 | | | Zurich Insurance Group AG (Insurance) | | | 1,926,422 | |
| | | | | | | | |
| | | | | | | 9,934,788 | |
| | |
| Taiwan – 3.5% | | | |
| | 209,000 | | | Taiwan Semiconductor Manufacturing Co. Ltd. (Semiconductors & Semiconductor Equipment) | | | 2,108,350 | |
| | |
| United Kingdom – 22.3% | | | |
| | 28,152 | | | AstraZeneca plc (Pharmaceuticals, Biotechnology & Life Sciences) | | | 2,944,477 | |
| | 415,484 | | | BP plc (Energy) | | | 1,637,180 | |
| | 503,681 | | | DS Smith plc (Materials) | | | 1,974,911 | |
| | 71,639 | | | GlaxoSmithKline plc (Pharmaceuticals, Biotechnology & Life Sciences) | | | 1,494,576 | |
| | 2,734,781 | | | Lloyds Banking Group plc (Banks) | | | 1,106,515 | |
| | 115,403 | | | National Grid plc (Utilities) | | | 1,352,379 | |
| | 15,136 | | | Reckitt Benckiser Group plc (Household & Personal Products) | | | 1,260,825 | |
| | 35,897 | | | Unilever plc (Household & Personal Products) | | | 1,848,415 | |
| | | | | | | | |
| | | | | | | 13,619,278 | |
| | |
| United States – 3.2% | | | |
| | 27,262 | | | Ferguson plc (Capital Goods) | | | 1,965,652 | |
| | |
| | TOTAL INVESTMENTS – 97.8% | | | | |
| | (Cost $69,741,416) | | $ | 59,676,598 | |
| | |
| OTHER ASSETS IN EXCESS OF
LIABILITIES – 2.2% | | | 1,311,351 | |
| | |
| | NET ASSETS – 100.0% | | $ | 60,987,949 | |
| | |
| | |
|
| The percentage shown for each investment category reflects the value of investments in that category as a percentage of net assets. |
| |
* | | Non-income producing security. |
| | | | |
|
Investment Abbreviation: |
REIT | | —Real Estate Investment Trust |
|
| | |
| The accompanying notes are an integral part of these financial statements. | | 7 |
GOLDMAN SACHS FUNDAMENTAL INTERNATIONAL EQUITY FUNDS
Statements of Assets and Liabilities
April 30, 2020 (Unaudited)
| | | | | | | | | | |
| | | | | International
Equity ESG Fund | | | International
Equity Income Fund | |
| | Assets: | |
| | Investments in unaffiliated issuers, at value (cost $123,713,245 and $69,741,416) | | $ | 115,191,732 | | | $ | 59,676,598 | |
| | Investments in affiliated issuers, at value (cost $1,369,428 and $0) | | | 1,369,428 | | | | — | |
| | Cash | | | 499,768 | | | | — | |
| | Foreign currencies, at value (cost $100,321 and $6,563,668) | | | 99,359 | | | | 6,563,530 | |
| | Receivables: | | | | | | | | |
| | Investments sold | | | 880,205 | | | | 1,315,284 | |
| | Foreign tax reclaims | | | 346,147 | | | | 280,166 | |
| | Dividends | | | 310,507 | | | | 119,372 | |
| | Fund shares sold | | | 95,020 | | | | 25,304 | |
| | Reimbursement from investment adviser | | | 36,410 | | | | 31,363 | |
| | Other assets | | | 82,492 | | | | 81,185 | |
| | Total assets | | | 118,911,068 | | | | 68,092,802 | |
| | | | | | | | | | |
| | Liabilities: | | | | | | | | |
| | Payables: | | | | | | | | |
| | Fund shares redeemed | | | 100,742 | | | | 882,937 | |
| | Management fees | | | 76,009 | | | | 44,520 | |
| | Distribution and Service fees and Transfer Agency fees | | | 18,191 | | | | 8,607 | |
| | Due to custodian | | | — | | | | 3,902,686 | |
| | Investments purchased | | | — | | | | 2,134,954 | |
| | Accrued expenses | | | 218,745 | | | | 131,149 | |
| | Total liabilities | | | 413,687 | | | | 7,104,853 | |
| | | | | | | | | | |
| | Net Assets: | | | | | | | | |
| | Paid-in capital | | | 140,219,317 | | | | 73,255,921 | |
| | Total distributable earnings (loss) | | | (21,721,936 | ) | | | (12,267,972 | ) |
| | | NET ASSETS | | $ | 118,497,381 | | | $ | 60,987,949 | |
| | | Net Assets: | | | | | | | | |
| | | Class A | | $ | 29,864,584 | | | $ | 13,847,244 | |
| | | Class C | | | 8,593,402 | | | | 1,616,873 | |
| | | Institutional | | | 21,703,741 | | | | 10,456,889 | |
| | | Service | | | 3,643 | | | | — | |
| | | Investor | | | 617,939 | | | | 9,785,029 | |
| | | Class P | | | 56,395,461 | | | | 23,590,037 | |
| | | Class R | | | — | | | | 218,372 | |
| | | Class R6 | | | 1,318,611 | | | | 1,473,505 | |
| | | Total Net Assets | | $ | 118,497,381 | | | $ | 60,987,949 | |
| | | Shares outstanding $0.001 par value (unlimited shares authorized): | | | | | | | | |
| | | Class A | | | 1,661,520 | | | | 1,253,622 | |
| | | Class C | | | 514,889 | | | | 166,222 | |
| | | Institutional | | | 1,180,134 | | | | 896,388 | |
| | | Service | | | 194 | | | | — | |
| | | Investor | | | 33,776 | | | | 887,708 | |
| | | Class P | | | 3,084,151 | | | | 2,026,649 | |
| | | Class R | | | — | | | | 19,664 | |
| | | Class R6 | | | 72,095 | | | | 126,503 | |
| | | Net asset value, offering and redemption price per share:(a) | | | | | | | | |
| | | Class A | | | $17.97 | | | | $11.05 | |
| | | Class C | | | 16.69 | | | | 9.73 | |
| | | Institutional | | | 18.39 | | | | 11.67 | |
| | | Service | | | 18.83 | (b) | | | — | |
| | | Investor | | | 18.30 | | | | 11.02 | |
| | | Class P | | | 18.29 | | | | 11.64 | |
| | | Class R | | | — | | | | 11.10 | (b) |
| | | Class R6 | | | 18.29 | | | | 11.65 | |
| | (a) | | Maximum public offering price per share for Class A Shares of the International Equity ESG and International Equity Income Funds is $19.02 and $11.69, respectively. At redemption, Class C Shares may be subject to a contingent deferred sales charge assessed on the amount equal to the lesser of the current NAV or the original purchase price of the shares. |
| | (b) | | Net asset value may not recalculate due to rounding of fractional shares. |
| | |
| 8 | | The accompanying notes are an integral part of these financial statements. |
GOLDMAN SACHS FUNDAMENTAL INTERNATIONAL EQUITY FUNDS
Statements of Operations
For the Six Months Ended April 30, 2020 (Unaudited)
| | | | | | | | | | |
| | | | | International
Equity ESG Fund | | | International
Equity Income Fund | |
| | Investment income: | |
| | | |
| | Dividends — unaffiliated issuers (net of foreign taxes withheld of $280,904 and $227,863) | | $ | 935,256 | | | $ | 1,120,982 | |
| | | |
| | Dividends — affiliated issuers | | | 19,785 | | | | 13,722 | |
| | | |
| | Securities lending income — affiliated issuer | | | 471 | | | | 825 | |
| | | |
| | Total investment income | | | 955,512 | | | | 1,135,529 | |
| | | | | | | | | | |
| | Expenses: | |
| | | |
| | Management fees | | | 512,000 | | | | 266,707 | |
| | | |
| | Distribution and Service fees(a) | | | 90,585 | | | | 28,549 | |
| | | |
| | Professional fees | | | 66,603 | | | | 61,973 | |
| | | |
| | Registration fees | | | 51,106 | | | | 50,862 | |
| | | |
| | Transfer Agency fees(a) | | | 49,376 | | | | 27,475 | |
| | | |
| | Printing and mailing costs | | | 42,788 | | | | 28,218 | |
| | | |
| | Custody, accounting and administrative services | | | 38,429 | | | | 34,155 | |
| | | |
| | Trustee fees | | | 9,190 | | | | 9,131 | |
| | | |
| | Service share fees — Service and Shareholder Administration Plan | | | 10 | | | | — | |
| | | |
| | Other | | | 19,148 | | | | 9,810 | |
| | | |
| | Total expenses | | | 879,235 | | | | 516,880 | |
| | | |
| | Less — expense reductions | | | (238,801 | ) | | | (189,958 | ) |
| | | |
| | Net expenses | | | 640,434 | | | | 326,922 | |
| | | |
| | NET INVESTMENT INCOME | | | 315,078 | | | | 808,607 | |
| | | |
| | | | | | | | | | |
| | Realized and unrealized gain: | |
| | | |
| | Net realized gain from: | | | | | | | | |
| | | |
| | Investments — unaffiliated issuers | | | 769,585 | | | | 157,740 | |
| | | |
| | Foreign currency transactions | | | 19,793 | | | | 66,347 | |
| | | |
| | Net change in unrealized loss on: | | | | | | | | |
| | | |
| | Investments — unaffiliated issuers | | | (14,704,487 | ) | | | (13,221,216 | ) |
| | | |
| | Foreign currency translation | | | (5,989 | ) | | | (67,247 | ) |
| | | |
| | Net realized and unrealized loss | | | (13,921,098 | ) | | | (13,064,376 | ) |
| | | |
| | NET DECREASE IN NET ASSETS RESULTING FROM OPERATIONS | | $ | (13,606,020 | ) | | $ | (12,255,769 | ) |
| | (a) | | Class specific Distribution and/or Service, and Transfer Agency fees were as follows: |
| | | | | | | | | | | | | | | | | | | | | | | | | | | | | | | | | | | | | | | | |
| | | Distribution and/or Service Fees | | | Transfer Agency Fees | |
Fund | | Class A | | | Class C | | | Class R | | | Class A | | | Class C | | | Institutional | | | Investor | | | Class P | | | Class R | | | Class R6 | |
International Equity ESG | | $ | 41,984 | | | $ | 48,601 | | | $ | — | | | $ | 28,549 | | | $ | 8,262 | | | $ | 2,069 | | | $ | 575 | | | $ | 9,821 | | | $ | — | | | $ | 100 | |
International Equity Income | | | 19,740 | | | | 8,510 | | | | 299 | | | | 13,424 | | | | 1,447 | | | | 1,935 | | | | 5,658 | | | | 4,804 | | | | 102 | | | | 105 | |
| | |
| The accompanying notes are an integral part of these financial statements. | | 9 |
GOLDMAN SACHS FUNDAMENTAL INTERNATIONAL EQUITY FUNDS
Statements of Changes in Net Assets
| | | | | | | | | | | | | | | | | | | | | | |
| | | | | International Equity ESG Fund | | | | | | International Equity Income Fund | |
| | | | | For the
Six Months Ended
April 30, 2020
(Unaudited) | | | For the Fiscal
Year Ended
October 31, 2019 | | | | | | For the
Six Months Ended
April 30, 2020
(Unaudited) | | | For the Fiscal
Year Ended
October 31, 2019 | |
| | From operations: | | | | | | | | | | | | | |
| | | | | | |
| | Net investment income | | $ | 315,078 | | | $ | 2,251,874 | | | | | | | $ | 808,607 | | | $ | 1,651,593 | |
| | | | | | |
| | Net realized gain (loss) | | | 789,378 | | | | (5,757,963 | ) | | | | | | | 224,087 | | | | (2,811,033 | ) |
| | | | | | |
| | Net change in unrealized gain (loss) | | | (14,710,476 | ) | | | 24,154,912 | | | | | | | | (13,288,463 | ) | | | 9,472,790 | |
| | | | | | |
| | Net increase (decrease) in net assets resulting from operations | | | (13,606,020 | ) | | | 20,648,823 | | | | | | | | (12,255,769 | ) | | | 8,313,350 | |
| | | | | | | | | | | | | | | | | | | | | | |
| | Distributions to shareholders: | | | | | | | | | | | | | |
| | From distributable earnings: | | | | | | | | | | | | | | | | | | | | |
| | | | | | |
| | Class A Shares | | | (607,729 | ) | | | (465,302 | ) | | | | | | | (442,383 | ) | | | (1,987,104 | ) |
| | | | | | |
| | Class C Shares | | | (117,372 | ) | | | (23,970 | ) | | | | | | | (38,544 | ) | | | (225,027 | ) |
| | | | | | |
| | Institutional Shares | | | (161,245 | ) | | | (86,276 | ) | | | | | | | (207,334 | ) | | | (318,215 | ) |
| | | | | | |
| | Service Shares | | | (65 | ) | | | (43 | ) | | | | | | | — | | | | — | |
| | | | | | |
| | Investor Shares | | | (12,522 | ) | | | (5,613 | ) | | | | | | | (131,054 | ) | | | (47,321 | ) |
| | | | | | |
| | Class P Shares | | | (1,391,936 | ) | | | (1,603,197 | ) | | | | | | | (950,865 | ) | | | (3,790,562 | ) |
| | | | | | |
| | Class R Shares | | | — | | | | — | | | | | | | | (1,758 | ) | | | (10,840 | ) |
| | | | | | |
| | Class R6 Shares | | | (9,509 | ) | | | (196 | ) | | | | | | | (12,488 | ) | | | (8,522 | ) |
| | | | | | |
| | Total distributions to shareholders | | | (2,300,378 | ) | | | (2,184,597 | ) | | | | | | | (1,784,426 | ) | | | (6,387,591 | ) |
| | | | | | | | | | | | | | | | | | | | | | |
| | From share transactions: | | | | | | | | | | | | | |
| | | | | | |
| | Proceeds from sales of shares | | | 19,643,451 | | | | 29,120,933 | | | | | | | | 33,278,590 | | | | 9,295,378 | |
| | | | | | |
| | Reinvestment of distributions | | | 2,269,282 | | | | 2,160,928 | | | | | | | | 1,767,717 | | | | 6,309,522 | |
| | | | | | |
| | Cost of shares redeemed | | | (10,703,938 | ) | | | (73,381,271 | ) | | | | | | | (20,162,179 | ) | | | (9,001,452 | ) |
| | | | | | |
| | Net increase (decrease) in net assets resulting from share transactions | | | 11,208,795 | | | | (42,099,410 | ) | | | | | | | 14,884,128 | | | | 6,603,448 | |
| | | | | | |
| | TOTAL INCREASE (DECREASE) | | | (4,697,603 | ) | | | (23,635,184 | ) | | | | | | | 843,933 | | | | 8,529,207 | |
| | | | | | | | | | | | | | | | | | | | | | |
| | Net Assets: | | | | | | | | | | | | | |
| | | | | | |
| | Beginning of period | | | 123,194,984 | | | | 146,830,168 | | | | | | | | 60,144,016 | | | | 51,614,809 | |
| | | | | | |
| | End of period | | $ | 118,497,381 | | | $ | 123,194,984 | | | | | | | $ | 60,987,949 | | | $ | 60,144,016 | |
| | |
| 10 | | The accompanying notes are an integral part of these financial statements. |
GOLDMAN SACHS INTERNATIONAL EQUITY ESG FUND
Financial Highlights
Selected Data for a Share Outstanding Throughout Each Period
| | | | | | | | | | | | | | | | | | | | | | | | | | |
| | | | | Goldman Sachs International Equity ESG Fund | |
| | | | | Class A Shares | |
| | | | | Six Months Ended
April 30, 2020
(Unaudited) | | | Year Ended October 31, | |
| | | | | 2019 | | | 2018 | | | 2017 | | | 2016 | | | 2015 | |
| | Per Share Data | | | | | | | | | | | | | | | | | | | | | | | | |
| | | | | | | |
| | Net asset value, beginning of period | | $ | 20.67 | | | $ | 17.88 | | | $ | 19.92 | | | $ | 16.61 | | | $ | 17.98 | | | $ | 18.49 | |
| | | | | | | |
| | Net investment income(a) | | | 0.03 | | | | 0.28 | | | | 0.22 | | | | 0.14 | | | | 0.48 | (b) | | | 0.21 | |
| | | | | | | |
| | Net realized and unrealized gain (loss) | | | (2.37 | ) | | | 2.76 | | | | (2.01 | ) | | | 3.63 | | | | (1.65 | ) | | | (0.16 | ) |
| | | | | | | |
| | Total from investment operations | | | (2.34 | ) | | | 3.04 | | | | (1.79 | ) | | | 3.77 | | | | (1.17 | ) | | | 0.05 | |
| | | | | | | |
| | Distributions to shareholders from net investment income | | | (0.36 | ) | | | (0.25 | ) | | | (0.25 | ) | | | (0.46 | ) | | | (0.20 | ) | | | (0.56 | ) |
| | | | | | | |
| | Net asset value, end of period | | $ | 17.97 | | | $ | 20.67 | | | $ | 17.88 | | | $ | 19.92 | | | $ | 16.61 | | | $ | 17.98 | |
| | | | | | | |
| | Total return(c) | | | (11.60 | )% | | | 17.33 | % | | | (9.11 | )% | | | 23.29 | % | | | (6.54 | )% | | | 0.34 | % |
| | | | | | | |
| | Net assets, end of period (in 000s) | | $ | 29,865 | | | $ | 35,181 | | | $ | 34,602 | | | $ | 38,330 | | | $ | 38,152 | | | $ | 48,772 | |
| | | | | | | |
| | Ratio of net expenses to average net assets | | | 1.22 | %(d) | | | 1.26 | % | | | 1.29 | % | | | 1.30 | % | | | 1.30 | % | | | 1.30 | % |
| | | | | | | |
| | Ratio of total expenses to average net assets | | | 1.65 | %(d) | | | 1.69 | % | | | 1.58 | % | | | 1.63 | % | | | 1.62 | % | | | 1.64 | % |
| | | | | | | |
| | Ratio of net investment income to average net assets | | | 0.30 | %(d) | | | 1.52 | % | | | 1.11 | % | | | 0.78 | % | | | 2.86 | %(b) | | | 1.18 | % |
| | | | | | | |
| | Portfolio turnover rate(e) | | | 33 | % | | | 41 | % | | | 38 | % | | | 116 | % | | | 78 | % | | | 105 | % |
| | (a) | | Calculated based on the average shares outstanding methodology. |
| | (b) | | Reflects income recognized from a corporate action which amounted to $0.28 per share and 1.63% of average net assets. |
| | (c) | | Assumes investment at the net asset value at the beginning of the period, reinvestment of all distributions, a complete redemption of the investment at the net asset value at the end of the period and no sales or redemption charges (if any). Total returns would be reduced if a sales or redemption charge was taken into account. Returns do not reflect the impact of taxes to shareholders relating to Fund distributions or the redemption of Fund shares. Total returns for periods less than one full year are not annualized. |
| | (e) | | The Fund’s portfolio turnover rate is calculated in accordance with regulatory requirements, without regard to transactions involving short term investments. If such transactions were included, the Fund’s portfolio turnover rate may be higher. |
| | |
| The accompanying notes are an integral part of these financial statements. | | 11 |
GOLDMAN SACHS INTERNATIONAL EQUITY ESG FUND
Financial Highlights(continued)
Selected Data for a Share Outstanding Throughout Each Period
| | | | | | | | | | | | | | | | | | | | | | | | | | |
| | | | | Goldman Sachs International Equity ESG Fund | |
| | | | | Class C Shares | |
| | | | | Six Months Ended
April 30, 2020
(Unaudited) | | | Year Ended October 31, | |
| | | | | 2019 | | | 2018 | | | 2017 | | | 2016 | | | 2015 | |
| | Per Share Data | | | | | | | | | | | | | | | | | | | | | | | | |
| | | | | | | |
| | Net asset value, beginning of period | | $ | 19.16 | | | $ | 16.49 | | | $ | 18.39 | | | $ | 15.37 | | | $ | 16.67 | | | $ | 17.18 | |
| | | | | | | |
| | Net investment income (loss)(a) | | | (0.04 | ) | | | 0.13 | | | | 0.07 | | | | 0.02 | | | | 0.32 | (b) | | | 0.08 | |
| | | | | | | |
| | Net realized and unrealized gain (loss) | | | (2.21 | ) | | | 2.58 | | | | (1.86 | ) | | | 3.35 | | | | (1.53 | ) | | | (0.16 | ) |
| | | | | | | |
| | Total from investment operations | | | (2.25 | ) | | | 2.71 | | | | (1.79 | ) | | | 3.37 | | | | (1.21 | ) | | | (0.08 | ) |
| | | | | | | |
| | Distributions to shareholders from net investment income | | | (0.22 | ) | | | (0.04 | ) | | | (0.11 | ) | | | (0.35 | ) | | | (0.09 | ) | | | (0.43 | ) |
| | | | | | | |
| | Net asset value, end of period | | $ | 16.69 | | | $ | 19.16 | | | $ | 16.49 | | | $ | 18.39 | | | $ | 15.37 | | | $ | 16.67 | |
| | | | | | | |
| | Total return(c) | | | (11.93 | )% | | | 16.49 | % | | | (9.79 | )% | | | 22.40 | % | | | (7.27 | )% | | | (0.42 | )% |
| | | | | | | |
| | Net assets, end of period (in 000s) | | $ | 8,593 | | | $ | 10,400 | | | $ | 9,985 | | | $ | 15,681 | | | $ | 15,577 | | | $ | 18,415 | |
| | | | | | | |
| | Ratio of net expenses to average net assets | | | 1.97 | %(d) | | | 2.01 | % | | | 2.04 | % | | | 2.05 | % | | | 2.05 | % | | | 2.05 | % |
| | | | | | | |
| | Ratio of total expenses to average net assets | | | 2.40 | %(d) | | | 2.44 | % | | | 2.33 | % | | | 2.37 | % | | | 2.37 | % | | | 2.39 | % |
| | | | | | | |
| | Ratio of net investment income (loss) to average net assets | | | (0.47 | )%(d) | | | 0.78 | % | | | 0.40 | % | | | 0.12 | % | | | 2.05 | %(b) | | | 0.44 | % |
| | | | | | | |
| | Portfolio turnover rate(e) | | | 33 | % | | | 41 | % | | | 38 | % | | | 116 | % | | | 78 | % | | | 105 | % |
| | (a) | | Calculated based on the average shares outstanding methodology. |
| | (b) | | Reflects income recognized from a corporate action which amounted to $0.28 per share and 1.63% of average net assets. |
| | (c) | | Assumes investment at the net asset value at the beginning of the period, reinvestment of all distributions, a complete redemption of the investment at the net asset value at the end of the period and no sales or redemption charges (if any). Total returns would be reduced if a sales or redemption charge was taken into account. Returns do not reflect the impact of taxes to shareholders relating to Fund distributions or the redemption of Fund shares. Total returns for periods less than one full year are not annualized. |
| | (e) | | The Fund’s portfolio turnover rate is calculated in accordance with regulatory requirements, without regard to transactions involving short term investments. If such transactions were included, the Fund’s portfolio turnover rate may be higher. |
| | |
| 12 | | The accompanying notes are an integral part of these financial statements. |
GOLDMAN SACHS INTERNATIONAL EQUITY ESG FUND
Financial Highlights(continued)
Selected Data for a Share Outstanding Throughout Each Period
| | | | | | | | | | | | | | | | | | | | | | | | | | |
| | | | | Goldman Sachs International Equity ESG Fund | |
| | | | | Institutional Shares | |
| | | | | Six Months Ended
April 30, 2020
(Unaudited) | | | Year Ended October 31, | |
| | | | | 2019 | | | 2018 | | | 2017 | | | 2016 | | | 2015 | |
| | Per Share Data | | | | | | | | | | | | | | | | | | | | | | | | |
| | | | | | | |
| | Net asset value, beginning of period | | $ | 21.17 | | | $ | 18.23 | | | $ | 20.30 | | | $ | 16.93 | | | $ | 18.34 | | | $ | 18.86 | |
| | | | | | | |
| | Net investment income(a) | | | 0.14 | | | | 0.29 | | | | 0.40 | | | | 0.22 | | | | 0.47 | (b) | | | 0.29 | |
| | | | | | | |
| | Net realized and unrealized gain (loss) | | | (2.50 | ) | | | 2.89 | | | | (2.14 | ) | | | 3.69 | | | | (1.60 | ) | | | (0.16 | ) |
| | | | | | | |
| | Total from investment operations | | | (2.36 | ) | | | 3.18 | | | | (1.74 | ) | | | 3.91 | | | | (1.13 | ) | | | 0.13 | |
| | | | | | | |
| | Distributions to shareholders from net investment income | | | (0.42 | ) | | | (0.24 | ) | | | (0.33 | ) | | | (0.54 | ) | | | (0.28 | ) | | | (0.65 | ) |
| | | | | | | |
| | Net asset value, end of period | | $ | 18.39 | | | $ | 21.17 | | | $ | 18.23 | | | $ | 20.30 | | | $ | 16.93 | | | $ | 18.34 | |
| | | | | | | |
| | Total return(c) | | | (11.44 | )% | | | 17.76 | % | | | (8.76 | )% | | | 23.78 | % | | | (6.21 | )% | | | 0.74 | % |
| | | | | | | |
| | Net assets, end of period (in 000s) | | $ | 21,704 | | | $ | 7,660 | | | $ | 6,835 | | | $ | 127,403 | | | $ | 201,746 | | | $ | 151,755 | |
| | | | | | | |
| | Ratio of net expenses to average net assets | | | 0.88 | %(d) | | | 0.90 | % | | | 0.90 | % | | | 0.90 | % | | | 0.90 | % | | | 0.90 | % |
| | | | | | | |
| | Ratio of total expenses to average net assets | | | 1.27 | %(d) | | | 1.31 | % | | | 1.17 | % | | | 1.22 | % | | | 1.21 | % | | | 1.24 | % |
| | | | | | | |
| | Ratio of net investment income to average net assets | | | 1.46 | %(d) | | | 1.49 | % | | | 1.94 | % | | | 1.22 | % | | | 2.76 | %(b) | | | 1.56 | % |
| | | | | | | |
| | Portfolio turnover rate(e) | | | 33 | % | | | 41 | % | | | 38 | % | | | 116 | % | | | 78 | % | | | 105 | % |
| | (a) | | Calculated based on the average shares outstanding methodology. |
| | (b) | | Reflects income recognized from a corporate action which amounted to $0.28 per share and 1.63% of average net assets. |
| | (c) | | Assumes investment at the net asset value at the beginning of the period, reinvestment of all distributions, a complete redemption of the investment at the net asset value at the end of the period and no sales or redemption charges if any. Total returns would be reduced if a sales or redemption charge was taken into account. Returns do not reflect the impact of taxes to shareholders relating to Fund distributions or the redemption of Fund shares. Total returns for periods less than one full year are not annualized. |
| | (e) | | The Fund’s portfolio turnover rate is calculated in accordance with regulatory requirements, without regard to transactions involving short term investments and certain derivatives. If such transactions were included, the Fund’s portfolio turnover rate may be higher. |
| | |
| The accompanying notes are an integral part of these financial statements. | | 13 |
GOLDMAN SACHS INTERNATIONAL EQUITY ESG FUND
Financial Highlights(continued)
Selected Data for a Share Outstanding Throughout Each Period
| | | | | | | | | | | | | | | | | | | | | | | | | | |
| | | | | Goldman Sachs International Equity ESG Fund | |
| | | | | Service Shares | |
| | | | | Six Months Ended
April 30, 2020
(Unaudited) | | | Year Ended October 31, | |
| | | | | 2019 | | | 2018 | | | 2017 | | | 2016 | | | 2015 | |
| | Per Share Data | | | | | | | | | | | | | | | | | | | | | | | | |
| | | | | | | |
| | Net asset value, beginning of period | | $ | 21.63 | | | $ | 18.70 | | | $ | 20.68 | | | $ | 16.79 | | | $ | 18.05 | | | $ | 18.57 | |
| | | | | | | |
| | Net investment income(a) | | | 0.02 | | | | 0.28 | | | | 0.22 | | | | 0.13 | | | | 0.47 | (b) | | | 0.14 | |
| | | | | | | |
| | Net realized and unrealized gain (loss) | | | (2.48 | ) | | | 2.88 | | | | (2.10 | ) | | | 3.76 | | | | (1.67 | ) | | | (0.11 | ) |
| | | | | | | |
| | Total from investment operations | | | (2.46 | ) | | | 3.16 | | | | (1.88 | ) | | | 3.89 | | | | (1.20 | ) | | | 0.03 | |
| | | | | | | |
| | Distributions to shareholders from net investment income | | | (0.34 | ) | | | (0.23 | ) | | | (0.10 | ) | | | — | | | | (0.06 | ) | | | (0.55 | ) |
| | | | | | | |
| | Net asset value, end of period | | $ | 18.83 | | | $ | 21.63 | | | $ | 18.70 | | | $ | 20.68 | | | $ | 16.79 | | | $ | 18.05 | |
| | | | | | | |
| | Total return(c) | | | (11.62 | )% | | | 17.20 | % | | | (9.14 | )% | | | 23.17 | % | | | (6.66 | )% | | | 0.19 | % |
| | | | | | | |
| | Net assets, end of period (in 000s) | | $ | 4 | | | $ | 4 | | | $ | 4 | | | $ | 4 | | | $ | 32 | | | $ | 37 | |
| | | | | | | |
| | Ratio of net expenses to average net assets | | | 1.37 | %(d) | | | 1.36 | % | | | 1.34 | % | | | 1.39 | % | | | 1.41 | % | | | 1.40 | % |
| | | | | | | |
| | Ratio of total expenses to average net assets | | | 1.74 | %(d) | | | 1.75 | % | | | 1.58 | % | | | 1.66 | % | | | 1.72 | % | | | 1.73 | % |
| | | | | | | |
| | Ratio of net investment income to average net assets | | | 0.16 | %(d) | | | 1.44 | % | | | 1.07 | % | | | 0.71 | % | | | 2.77 | %(b) | | | 0.76 | % |
| | | | | | | |
| | Portfolio turnover rate(e) | | | 33 | % | | | 41 | % | | | 38 | % | | | 116 | % | | | 78 | % | | | 105 | % |
| | (a) | | Calculated based on the average shares outstanding methodology. |
| | (b) | | Reflects income recognized from a corporate action which amounted to $0.28 per share and 1.63% of average net assets. |
| | (c) | | Assumes investment at the net asset value at the beginning of the period, reinvestment of all distributions, a complete redemption of the investment at the net asset value at the end of the period and no sales or redemption charges (if any). Total returns would be reduced if a sales or redemption charge was taken into account. Returns do not reflect the impact of taxes to shareholders relating to Fund distributions or the redemption of Fund shares. Total returns for periods less than one full year are not annualized. |
| | (e) | | The Fund’s portfolio turnover rate is calculated in accordance with regulatory requirements, without regard to transactions involving short term investments. If such transactions were included, the Fund’s portfolio turnover rate may be higher. |
| | |
| 14 | | The accompanying notes are an integral part of these financial statements. |
GOLDMAN SACHS INTERNATIONAL EQUITY ESG FUND
Financial Highlights(continued)
Selected Data for a Share Outstanding Throughout Each Period
| | | | | | | | | | | | | | | | | | | | | | | | | | |
| | | | | Goldman Sachs International Equity ESG Fund | |
| | | | | Investor Shares(a) | |
| | | | | Six Months Ended
April 30, 2020
(Unaudited) | | | Year Ended October 31, | |
| | | | | 2019 | | | 2018 | | | 2017 | | | 2016 | | | 2015 | |
| | Per Share Data | | | | | | | | | | | | | | | | | | | | | | | | |
| | | | | | | |
| | Net asset value, beginning of period | | $ | 21.06 | | | $ | 18.20 | | | $ | 20.23 | | | $ | 16.86 | | | $ | 18.25 | | | $ | 18.76 | |
| | | | | | | |
| | Net investment income(b) | | | 0.06 | | | | 0.36 | | | | 0.24 | | | | 0.27 | | | | 0.45 | (c) | | | 0.26 | |
| | | | | | | |
| | Net realized and unrealized gain (loss) | | | (2.40 | ) | | | 2.78 | | | | (2.02 | ) | | | 3.60 | | | | (1.60 | ) | | | (0.17 | ) |
| | | | | | | |
| | Total from investment operations | | | (2.34 | ) | | | 3.14 | | | | (1.78 | ) | | | 3.87 | | | | (1.15 | ) | | | 0.09 | |
| | | | | | | |
| | Distributions to shareholders from net investment income | | | (0.42 | ) | | | (0.28 | ) | | | (0.25 | ) | | | (0.50 | ) | | | (0.24 | ) | | | (0.60 | ) |
| | | | | | | |
| | Net asset value, end of period | | $ | 18.30 | | | $ | 21.06 | | | $ | 18.20 | | | $ | 20.23 | | | $ | 16.86 | | | $ | 18.25 | |
| | | | | | | |
| | Total return(d) | | | (11.43 | )% | | | 17.64 | % | | | (8.92 | )% | | | 23.63 | % | | | (6.34 | )% | | | 0.56 | % |
| | | | | | | |
| | Net assets, end of period (in 000s) | | $ | 618 | | | $ | 492 | | | $ | 421 | | | $ | 1,009 | | | $ | 749 | | | $ | 1,268 | |
| | | | | | | |
| | Ratio of net expenses to average net assets | | | 0.97 | %(e) | | | 1.00 | % | | | 1.04 | % | | | 1.05 | % | | | 1.05 | % | | | 1.05 | % |
| | | | | | | |
| | Ratio of total expenses to average net assets | | | 1.40 | %(e) | | | 1.44 | % | | | 1.34 | % | | | 1.39 | % | | | 1.36 | % | | | 1.39 | % |
| | | | | | | |
| | Ratio of net investment income to average net assets | | | 0.56 | %(e) | | | 1.87 | % | | | 1.20 | % | | | 1.50 | % | | | 2.62 | %(c) | | | 1.38 | % |
| | | | | | | |
| | Portfolio turnover rate(f) | | | 33 | % | | | 41 | % | | | 38 | % | | | 116 | % | | | 78 | % | | | 105 | % |
| | (a) | | Effective August 15, 2017, Class IR changed its name to Investor Shares. |
| | (b) | | Calculated based on the average shares outstanding methodology. |
| | (c) | | Reflects income recognized from a corporate action which amounted to $0.28 per share and 1.63% of average net assets. |
| | (d) | | Assumes investment at the net asset value at the beginning of the period, reinvestment of all distributions, a complete redemption of the investment at the net asset value at the end of the period and no sales or redemption charges (if any). Total returns would be reduced if a sales or redemption charge was taken into account. Returns do not reflect the impact of taxes to shareholders relating to Fund distributions or the redemption of Fund shares. Total returns for periods less than one full year are not annualized. |
| | (f) | | The Fund’s portfolio turnover rate is calculated in accordance with regulatory requirements, without regard to transactions involving short term investments. If such transactions were included, the Fund’s portfolio turnover rate may be higher. |
| | |
| The accompanying notes are an integral part of these financial statements. | | 15 |
GOLDMAN SACHS INTERNATIONAL EQUITY ESG FUND
Financial Highlights(continued)
Selected Data for a Share Outstanding Throughout Each Period
| | | | | | | | | | | | | | |
| | | | | Goldman Sachs International Equity ESG Fund | |
| | | | | Class P Shares | |
| | | | | Six Months Ended
April 30, 2020
(Unaudited) | | | Year Ended
October 31, 2019 | | | April 16, 2018*
to
October 31, 2018 | |
| | Per Share Data | | | | | | | | | | | | |
| | | | |
| | Net asset value, beginning of period | | $ | 21.05 | | | $ | 18.23 | | | $ | 20.84 | |
| | | | |
| | Net investment income(a) | | | 0.06 | | | | 0.36 | | | | 0.06 | |
| | | | |
| | Net realized and unrealized gain (loss) | | | (2.39 | ) | | | 2.79 | | | | (2.67 | ) |
| | | | |
| | Total from investment operations | | | (2.33 | ) | | | 3.15 | | | | (2.61 | ) |
| | | | |
| | Distributions to shareholders from net investment income | | | (0.43 | ) | | | (0.33 | ) | | | — | |
| | | | |
| | Net asset value, end of period | | $ | 18.29 | | | $ | 21.05 | | | $ | 18.23 | |
| | | | |
| | Total return(b) | | | (11.39 | )% | | | 17.73 | % | | | (12.52 | )% |
| | | | |
| | Net assets, end of period (in 000s) | | $ | 56,395 | | | $ | 68,987 | | | $ | 94,972 | |
| | | | |
| | Ratio of net expenses to average net assets | | | 0.88 | %(c) | | | 0.89 | % | | | 0.89 | %(c) |
| | | | |
| | Ratio of total expenses to average net assets | | | 1.26 | %(c) | | | 1.29 | % | | | 1.22 | %(c) |
| | | | |
| | Ratio of net investment income to average net assets | | | 0.63 | %(c) | | | 1.88 | % | | | 0.59 | %(c) |
| | | | |
| | Portfolio turnover rate(d) | | | 33 | % | | | 41 | % | | | 38 | % |
| | * | | Commencement of operations. |
| | (a) | | Calculated based on the average shares outstanding methodology. |
| | (b) | | Assumes investment at the net asset value at the beginning of the period, reinvestment of all distributions, a complete redemption of the investment at the net asset value at the end of the period and no sales or redemption charges (if any). Total returns would be reduced if a sales or redemption charge was taken into account. Returns do not reflect the impact of taxes to shareholders relating to Fund distributions or the redemption of Fund shares. Total returns for periods less than one full year are not annualized. |
| | (d) | | The Fund’s portfolio turnover rate is calculated in accordance with regulatory requirements, without regard to transactions involving short term investments. If such transactions were included, the Fund’s portfolio turnover rate may be higher. |
| | |
| 16 | | The accompanying notes are an integral part of these financial statements. |
GOLDMAN SACHS INTERNATIONAL EQUITY ESG FUND
Financial Highlights(continued)
Selected Data for a Share Outstanding Throughout Each Period
| | | | | | | | | | | | | | | | | | | | | | |
| | | | | Goldman Sachs International Equity ESG Fund | |
| | | | | Class R6 Shares | |
| | | | | Six Months Ended
April 30, 2020
(Unaudited) | | | Year Ended October 31, | | | February 26, 2016*
to
October 31, 2016 | |
| | | | | 2019 | | | 2018 | | | 2017 | |
| | Per Share Data | | | | | | | | | | | | | | | | | | | | |
| | | | | | |
| | Net asset value, beginning of period | | $ | 21.06 | | | $ | 18.23 | | | $ | 20.30 | | | $ | 16.93 | | | $ | 15.87 | |
| | | | | | |
| | Net investment income(a) | | | 0.14 | | | | 0.45 | | | | 0.31 | | | | 0.22 | | | | 0.21 | (b) |
| | | | | | |
| | Net realized and unrealized gain (loss) | | | (2.48 | ) | | | 2.71 | | | | (2.05 | ) | | | 3.69 | | | | 0.85 | |
| | | | | | |
| | Total from investment operations | | | (2.34 | ) | | | 3.16 | | | | (1.74 | ) | | | 3.91 | | | | 1.06 | |
| | | | | | |
| | Distributions to shareholders from net investment income | | | (0.43 | ) | | | (0.33 | ) | | | (0.33 | ) | | | (0.54 | ) | | | — | |
| | | | | | |
| | Net asset value, end of period | | $ | 18.29 | | | $ | 21.06 | | | $ | 18.23 | | | $ | 20.30 | | | $ | 16.93 | |
| | | | | | |
| | Total return(c) | | | (11.42 | )% | | | 17.76 | % | | | (8.74 | )% | | | 23.80 | % | | | 6.68 | % |
| | | | | | |
| | Net assets, end of period (in 000s) | | $ | 1,319 | | | $ | 470 | | | $ | 11 | | | $ | 12 | | | $ | 11 | |
| | | | | | |
| | Ratio of net expenses to average net assets | | | 0.87 | %(d) | | | 0.90 | % | | | 0.89 | % | | | 0.89 | % | | | 0.89 | %(d) |
| | | | | | |
| | Ratio of total expenses to average net assets | | | 1.27 | %(d) | | | 1.31 | % | | | 1.18 | % | | | 1.22 | % | | | 1.19 | %(d) |
| | | | | | |
| | Ratio of net investment income to average net assets | | | 1.44 | %(d) | | | 2.35 | % | | | 1.53 | % | | | 1.21 | % | | | 1.83 | %(b)(d) |
| | | | | | |
| | Portfolio turnover rate(e) | | | 33 | % | | | 41 | % | | | 38 | % | | | 116 | % | | | 78 | % |
| | * | | Commencement of operations. |
| | (a) | | Calculated based on the average shares outstanding methodology. |
| | (b) | | Reflects income recognized from a corporate action which amounted to $0.28 per share and 1.63% of average net assets. |
| | (c) | | Assumes investment at the net asset value at the beginning of the period, reinvestment of all distributions, a complete redemption of the investment at the net asset value at the end of the period and no sales or redemption charges (if any). Total returns would be reduced if a sales or redemption charge was taken into account. Returns do not reflect the impact of taxes to shareholders relating to Fund distributions or the redemption of Fund shares. Total returns for periods less than one full year are not annualized. |
| | (e) | | The Fund’s portfolio turnover rate is calculated in accordance with regulatory requirements, without regard to transactions involving short term investments. If such transactions were included, the Fund’s portfolio turnover rate may be higher. |
| | |
| The accompanying notes are an integral part of these financial statements. | | 17 |
GOLDMAN SACHS INTERNATIONAL EQUITY INCOME FUND
Financial Highlights(continued)
Selected Data for a Share Outstanding Throughout Each Period
| | | | | | | | | | | | | | | | | | | | | | | | | | |
| | | | | Goldman Sachs International Equity Income Fund | |
| | | | | Class A Shares | |
| | | | | Six Months Ended
April 30, 2020
(Unaudited) | | | Year Ended October 31, | |
| | | 2019 | | | 2018 | | | 2017 | | | 2016 | | | 2015 | |
| | Per Share Data | | | | | | | | | | | | | | | | | | | | | | | | |
| | | | | | | |
| | Net asset value, beginning of period | | $ | 13.50 | | | $ | 13.25 | | | $ | 14.50 | | | $ | 11.99 | | | $ | 12.95 | | | $ | 13.52 | |
| | | | | | | |
| | Net investment income(a) | | | 0.12 | | | | 0.37 | | | | 0.37 | | | | 0.17 | | | | 0.18 | | | | 0.15 | |
| | | | | | | |
| | Net realized and unrealized gain (loss) | | | (2.21 | ) | | | 1.53 | | | | (1.36 | ) | | | 2.58 | | | | (1.04 | ) | | | (0.23 | ) |
| | | | | | | |
| | Total from investment operations | | | (2.09 | ) | | | 1.90 | | | | (0.99 | ) | | | 2.75 | | | | (0.86 | ) | | | (0.08 | ) |
| | | | | | | |
| | Distributions to shareholders from net investment income | | | (0.36 | ) | | | (0.36 | ) | | | (0.26 | ) | | | (0.24 | ) | | | (0.10 | ) | | | (0.49 | ) |
| | | | | | | |
| | Distributions to shareholders from net realized gains | | | — | | | | (1.29 | ) | | | — | | | | — | | | | — | | | | — | |
| | | | | | | |
| | Total distributions | | | (0.36 | ) | | | (1.65 | ) | | | (0.26 | ) | | | (0.24 | ) | | | (0.10 | ) | | | (0.49 | ) |
| | | | | | | |
| | Net asset value, end of period | | $ | 11.05 | | | $ | 13.50 | | | $ | 13.25 | | | $ | 14.50 | | | $ | 11.99 | | | $ | 12.95 | |
| | | | | | | |
| | Total return(b) | | | (16.07 | )% | | | 16.95 | % | | | (6.98 | )% | | | 23.38 | % | | | (6.69 | )% | | | (0.57 | )% |
| | | | | | | |
| | Net assets, end of period (in 000s) | | $ | 13,847 | | | $ | 16,711 | | | $ | 15,844 | | | $ | 17,937 | | | $ | 18,301 | | | $ | 23,111 | |
| | | | | | | |
| | Ratio of net expenses to average net assets | | | 1.24 | %(c) | | | 1.25 | % | | | 1.26 | % | | | 1.30 | % | | | 1.30 | % | | | 1.30 | % |
| | | | | | | |
| | Ratio of total expenses to average net assets | | | 1.81 | %(c) | | | 2.16 | % | | | 1.90 | % | | | 1.88 | % | | | 1.76 | % | | | 1.82 | % |
| | | | | | | |
| | Ratio of net investment income to average net assets | | | 1.98 | %(c) | | | 2.99 | % | | | 2.54 | % | | | 1.32 | % | | | 1.47 | % | | | 1.11 | % |
| | | | | | | |
| | Portfolio turnover rate(d) | | | 32 | % | | | 27 | % | | | 87 | % | | | 32 | % | | | 68 | % | | | 83 | % |
| | (a) | | Calculated based on the average shares outstanding methodology. |
| | (b) | | Assumes investment at the net asset value at the beginning of the period, reinvestment of all distributions, a complete redemption of the investment at the net asset value at the end of the period and no sales or redemption charges (if any). Total returns would be reduced if a sales or redemption charge was taken into account. Returns do not reflect the impact of taxes to shareholders relating to Fund distributions or the redemption of Fund shares. Total returns for periods less than one full year are not annualized. |
| | (d) | | The Fund’s portfolio turnover rate is calculated in accordance with regulatory requirements, without regard to transactions involving short term investments. If such transactions were included, the Fund’s portfolio turnover rate may be higher. |
| | |
| 18 | | The accompanying notes are an integral part of these financial statements. |
GOLDMAN SACHS INTERNATIONAL EQUITY INCOME FUND
Financial Highlights(continued)
Selected Data for a Share Outstanding Throughout Each Period
| | | | | | | | | | | | | | | | | | | | | | | | | | |
| | | | | Goldman Sachs International Equity Income Fund | |
| | | | | Class C Shares | |
| | | | | Six Months Ended
April 30, 2020
(Unaudited) | | | Year Ended October 31, | |
| | | 2019 | | | 2018 | | | 2017 | | | 2016 | | | 2015 | |
| | Per Share Data | | | | | | | | | | | | | | | | | | | | | | | | |
| | | | | | | |
| | Net asset value, beginning of period | | $ | 11.89 | | | $ | 11.88 | | | $ | 12.98 | | | $ | 10.75 | | | $ | 11.62 | | | $ | 12.17 | |
| | | | | | | |
| | Net investment income(a) | | | 0.08 | | | | 0.25 | | | | 0.25 | | | | 0.07 | | | | 0.08 | | | | 0.04 | |
| | | | | | | |
| | Net realized and unrealized gain (loss) | | | (1.96 | ) | | | 1.34 | | | | (1.22 | ) | | | 2.31 | | | | (0.94 | ) | | | (0.20 | ) |
| | | | | | | |
| | Total from investment operations | | | (1.88 | ) | | | 1.59 | | | | (0.97 | ) | | | 2.38 | | | | (0.86 | ) | | | (0.16 | ) |
| | | | | | | |
| | Distributions to shareholders from net investment income | | | (0.28 | ) | | | (0.29 | ) | | | (0.13 | ) | | | (0.15 | ) | | | (0.01 | ) | | | (0.39 | ) |
| | | | | | | |
| | Distributions to shareholders from net realized gains | | | — | | | | (1.29 | ) | | | — | | | | — | | | | — | | | | — | |
| | | | | | | |
| | Total distributions | | | (0.28 | ) | | | (1.58 | ) | | | (0.13 | ) | | | (0.15 | ) | | | (0.01 | ) | | | (0.39 | ) |
| | | | | | | |
| | Net asset value, end of period | | $ | 9.73 | | | $ | 11.89 | | | $ | 11.88 | | | $ | 12.98 | | | $ | 10.75 | | | $ | 11.62 | |
| | | | | | | |
| | Total return(b) | | | (16.29 | )% | | | 16.01 | % | | | (7.59 | )% | | | 22.44 | % | | | (7.37 | )% | | | (1.33 | )% |
| | | | | | | |
| | Net assets, end of period (in 000s) | | $ | 1,617 | | | $ | 1,638 | | | $ | 1,673 | | | $ | 3,770 | | | $ | 3,974 | | | $ | 4,841 | |
| | | | | | | |
| | Ratio of net expenses to average net assets | | | 1.99 | %(c) | | | 2.00 | % | | | 2.01 | % | | | 2.05 | % | | | 2.05 | % | | | 2.05 | % |
| | | | | | | |
| | Ratio of total expenses to average net assets | | | 2.56 | %(c) | | | 2.91 | % | | | 2.63 | % | | | 2.63 | % | | | 2.51 | % | | | 2.57 | % |
| | | | | | | |
| | Ratio of net investment income to average net assets | | | 1.41 | %(c) | | | 2.24 | % | | | 1.89 | % | | | 0.58 | % | | | 0.74 | % | | | 0.35 | % |
| | | | | | | |
| | Portfolio turnover rate(d) | | | 32 | % | | | 27 | % | | | 87 | % | | | 32 | % | | | 68 | % | | | 83 | % |
| | (a) | | Calculated based on the average shares outstanding methodology. |
| | (b) | | Assumes investment at the net asset value at the beginning of the period, reinvestment of all distributions, a complete redemption of the investment at the net asset value at the end of the period and no sales or redemption charges (if any). Total returns would be reduced if a sales or redemption charge was taken into account. Returns do not reflect the impact of taxes to shareholders relating to Fund distributions or the redemption of Fund shares. Total returns for periods less than one full year are not annualized. |
| | (d) | | The Fund’s portfolio turnover rate is calculated in accordance with regulatory requirements, without regard to transactions involving short term investments. If such transactions were included, the Fund’s portfolio turnover rate may be higher. |
| | |
| The accompanying notes are an integral part of these financial statements. | | 19 |
GOLDMAN SACHS INTERNATIONAL EQUITY INCOME FUND
Financial Highlights(continued)
Selected Data for a Share Outstanding Throughout Each Period
| | | | | | | | | | | | | | | | | | | | | | | | | | |
| | | | | Goldman Sachs International Equity Income Fund | |
| | | | | Institutional Shares | |
| | | | | Six Months Ended
April 30, 2020
(Unaudited) | | | Year Ended October 31, | |
| | | 2019 | | | 2018 | | | 2017 | | | 2016 | | | 2015 | |
| | Per Share Data | | | | | | | | | | | | | | | | | | | | | | | | |
| | | | | | | |
| | Net asset value, beginning of period | | $ | 14.26 | | | $ | 13.88 | | | $ | 15.20 | | | $ | 12.56 | | | $ | 13.56 | | | $ | 14.13 | |
| | | | | | | |
| | Net investment income(a) | | | 0.17 | | | | 0.42 | | | | 0.49 | | | | 0.23 | | | | 0.23 | | | | 0.20 | |
| | | | | | | |
| | Net realized and unrealized gain (loss) | | | (2.35 | ) | | | 1.63 | | | | (1.46 | ) | | | 2.70 | | | | (1.08 | ) | | | (0.23 | ) |
| | | | | | | |
| | Total from investment operations | | | (2.18 | ) | | | 2.05 | | | | (0.97 | ) | | | 2.93 | | | | (0.85 | ) | | | (0.03 | ) |
| | | | | | | |
| | Distributions to shareholders from net investment income | | | (0.41 | ) | | | (0.38 | ) | | | (0.35 | ) | | | (0.29 | ) | | | (0.15 | ) | | | (0.54 | ) |
| | | | | | | |
| | Distributions to shareholders from net realized gains | | | — | | | | (1.29 | ) | | | — | | | | — | | | | — | | | | — | |
| | | | | | | |
| | Total distributions | | | (0.41 | ) | | | (1.67 | ) | | | (0.35 | ) | | | (0.29 | ) | | | (0.15 | ) | | | (0.54 | ) |
| | | | | | | |
| | Net asset value, end of period | | $ | 11.67 | | | $ | 14.26 | | | $ | 13.88 | | | $ | 15.20 | | | $ | 12.56 | | | $ | 13.56 | |
| | | | | | | |
| | Total return(b) | | | (15.90 | )% | | | 17.29 | % | | | (6.59 | )% | | | 23.88 | % | | | (6.31 | )% | | | (0.15 | )% |
| | | | | | | |
| | Net assets, end of period (in 000s) | | $ | 10,457 | | | $ | 5,232 | | | $ | 2,666 | | | $ | 40,667 | | | $ | 42,191 | | | $ | 45,795 | |
| | | | | | | |
| | Ratio of net expenses to average net assets | | | 0.86 | %(c) | | | 0.88 | % | | | 0.87 | % | | | 0.90 | % | | | 0.90 | % | | | 0.90 | % |
| | | | | | | |
| | Ratio of total expenses to average net assets | | | 1.42 | %(c) | | | 1.79 | % | | | 1.42 | % | | | 1.49 | % | | | 1.36 | % | | | 1.42 | % |
| | | | | | | |
| | Ratio of net investment income to average net assets | | | 2.63 | %(c) | | | 3.13 | % | | | 3.19 | % | | | 1.71 | % | | | 1.84 | % | | | 1.47 | % |
| | | | | | | |
| | Portfolio turnover rate(d) | | | 32 | % | | | 27 | % | | | 87 | % | | | 32 | % | | | 68 | % | | | 83 | % |
| | (a) | | Calculated based on the average shares outstanding methodology. |
| | (b) | | Assumes investment at the net asset value at the beginning of the period, reinvestment of all distributions, a complete redemption of the investment at the net asset value at the end of the period and no sales or redemption charges (if any). Total returns would be reduced if a sales or redemption charge was taken into account. Returns do not reflect the impact of taxes to shareholders relating to Fund distributions or the redemption of Fund shares. Total returns for periods less than one full year are not annualized. |
| | (d) | | The Fund’s portfolio turnover rate is calculated in accordance with regulatory requirements, without regard to transactions involving short term investments. If such transactions were included, the Fund’s portfolio turnover rate may be higher. |
| | |
| 20 | | The accompanying notes are an integral part of these financial statements. |
GOLDMAN SACHS INTERNATIONAL EQUITY INCOME FUND
Financial Highlights(continued)
Selected Data for a Share Outstanding Throughout Each Period
| | | | | | | | | | | | | | | | | | | | | | | | | | |
| | | | | Goldman Sachs International Equity Income Fund | |
| | | | | Investor Shares(a) | |
| | | | | Six Months Ended
April 30, 2020
(Unaudited) | | | Year Ended October 31, | |
| | | 2019 | | | 2018 | | | 2017 | | | 2016 | | | 2015 | |
| | Per Share Data | | | | | | | | | | | | | | | | | | | | | | | | |
| | | | | | | |
| | Net asset value, beginning of period | | $ | 13.51 | | | $ | 13.25 | | | $ | 14.51 | | | $ | 12.00 | | | $ | 12.97 | | | $ | 13.55 | |
| | | | | | | |
| | Net investment income(b) | | | 0.20 | | | | 0.34 | | | | 0.40 | | | | 0.24 | | | | 0.21 | | | | 0.15 | |
| | | | | | | |
| | Net realized and unrealized gain (loss) | | | (2.28 | ) | | | 1.59 | | | | (1.35 | ) | | | 2.54 | | | | (1.04 | ) | | | (0.20 | ) |
| | | | | | | |
| | Total from investment operations | | | (2.08 | ) | | | 1.93 | | | | (0.95 | ) | | | 2.78 | | | | (0.83 | ) | | | (0.05 | ) |
| | | | | | | |
| | Distributions to shareholders from net investment income | | | (0.41 | ) | | | (0.38 | ) | | | (0.31 | ) | | | (0.27 | ) | | | (0.14 | ) | | | (0.53 | ) |
| | | | | | | |
| | Distributions to shareholders from net realized gains | | | — | | | | (1.29 | ) | | | — | | | | — | | | | — | | | | — | |
| | | | | | | |
| | Total distributions | | | (0.41 | ) | | | (1.67 | ) | | | (0.31 | ) | | | (0.27 | ) | | | (0.14 | ) | | | (0.53 | ) |
| | | | | | | |
| | Net asset value, end of period | | $ | 11.02 | | | $ | 13.51 | | | $ | 13.25 | | | $ | 14.51 | | | $ | 12.00 | | | $ | 12.97 | |
| | | | | | | |
| | Total return(c) | | | (15.98 | )% | | | 17.21 | % | | | (6.74 | )% | | | 23.75 | % | | | (6.43 | )% | | | (0.32 | )% |
| | | | | | | |
| | Net assets, end of period (in 000s) | | $ | 9,785 | | | $ | 3,515 | | | $ | 349 | | | $ | 426 | | | $ | 471 | | | $ | 355 | |
| | | | | | | |
| | Ratio of net expenses to average net assets | | | 0.99 | %(d) | | | 1.09 | % | | | 1.01 | % | | | 1.05 | % | | | 1.05 | % | | | 1.05 | % |
| | | | | | | |
| | Ratio of total expenses to average net assets | | | 1.55 | %(d) | | | 1.98 | % | | | 1.65 | % | | | 1.64 | % | | | 1.51 | % | | | 1.56 | % |
| | | | | | | |
| | Ratio of net investment income to average net assets | | | 3.30 | %(d) | | | 2.67 | % | | | 2.78 | % | | | 1.85 | % | | | 1.71 | % | | | 1.17 | % |
| | | | | | | |
| | Portfolio turnover rate(e) | | | 32 | % | | | 27 | % | | | 87 | % | | | 32 | % | | | 68 | % | | | 83 | % |
| | (a) | | Effective August 15, 2017, Class IR changed its name to Investor Shares. |
| | (b) | | Calculated based on the average shares outstanding methodology. |
| | (c) | | Assumes investment at the net asset value at the beginning of the period, reinvestment of all distributions, a complete redemption of the investment at the net asset value at the end of the period and no sales or redemption charges (if any). Total returns would be reduced if a sales or redemption charge was taken into account. Returns do not reflect the impact of taxes to shareholders relating to Fund distributions or the redemption of Fund shares. Total returns for periods less than one full year are not annualized. |
| | (e) | | The Fund’s portfolio turnover rate is calculated in accordance with regulatory requirements, without regard to transactions involving short term investments. If such transactions were included, the Fund’s portfolio turnover rate may be higher. |
| | |
| The accompanying notes are an integral part of these financial statements. | | 21 |
GOLDMAN SACHS INTERNATIONAL EQUITY INCOME FUND
Financial Highlights(continued)
Selected Data for a Share Outstanding Throughout Each Period
| | | | | | | | | | | | | | |
| | | | | Goldman Sachs International Equity Income Fund | |
| | | | | Class P Shares | |
| | | | | Six Months Ended
April 30, 2020
(Unaudited) | | | Year Ended
October 31, 2019 | | | April 16, 2018*
to
October 31, 2018 | |
| | Per Share Data | | | | | | | | | | | | |
| | | | |
| | Net asset value, beginning of period | | $ | 14.23 | | | $ | 13.86 | | | $ | 15.62 | |
| | | | |
| | Net investment income(a) | | | 0.16 | | | | 0.44 | | | | 0.16 | |
| | | | |
| | Net realized and unrealized gain (loss) | | | (2.34 | ) | | | 1.61 | | | | (1.84 | ) |
| | | | |
| | Total from investment operations | | | (2.18 | ) | | | 2.05 | | | | (1.68 | ) |
| | | | |
| | Distributions to shareholders from net investment income | | | (0.41 | ) | | | (0.39 | ) | | | (0.08 | ) |
| | | | |
| | Distributions to shareholders from net realized gains | | | — | | | | (1.29 | ) | | | — | |
| | | | |
| | Total distributions | | | (0.41 | ) | | | (1.68 | ) | | | (0.08 | ) |
| | | | |
| | Net asset value, end of period | | $ | 11.64 | | | $ | 14.23 | | | $ | 13.86 | |
| | | | |
| | Total return(b) | | | (15.87 | )% | | | 17.34 | % | | | (10.76 | )% |
| | | | |
| | Net assets, end of period (in 000s) | | $ | 23,590 | | | $ | 32,643 | | | $ | 30,930 | |
| | | | |
| | Ratio of net expenses to average net assets | | | 0.84 | %(c) | | | 0.85 | % | | | 0.84 | %(c) |
| | | | |
| | Ratio of total expenses to average net assets | | | 1.42 | %(c) | | | 1.76 | % | | | 1.84 | %(c) |
| | | | |
| | Ratio of net investment income to average net assets | | | 2.45 | %(c) | | | 3.37 | % | | | 2.00 | %(c) |
| | | | |
| | Portfolio turnover rate(d) | | | 32 | % | | | 27 | % | | | 87 | % |
| | * | | Commencement of operations. |
| | (a) | | Calculated based on the average shares outstanding methodology. |
| | (b) | | Assumes investment at the net asset value at the beginning of the period, reinvestment of all distributions, a complete redemption of the investment at the net asset value at the end of the period and no sales or redemption charges (if any). Total returns would be reduced if a sales or redemption charge was taken into account. Returns do not reflect the impact of taxes to shareholders relating to Fund distributions or the redemption of Fund shares. Total returns for periods less than one full year are not annualized. |
| | (d) | | The Fund’s portfolio turnover rate is calculated in accordance with regulatory requirements, without regard to transactions involving short term investments. If such transactions were included, the Fund’s portfolio turnover rate may be higher. |
| | |
| 22 | | The accompanying notes are an integral part of these financial statements. |
GOLDMAN SACHS INTERNATIONAL EQUITY INCOME FUND
Financial Highlights(continued)
Selected Data for a Share Outstanding Throughout Each Period
| | | | | | | | | | | | | | | | | | | | | | | | | | |
| | | | | Goldman Sachs International Equity Income Fund | |
| | | | | Class R Shares | |
| | | | | Six Months Ended
April 30, 2020
(Unaudited) | | | Year Ended October 31, | |
| | | 2019 | | | 2018 | | | 2017 | | | 2016 | | | 2015 | |
| | Per Share Data | | | | | | | | | | | | | | | | | | | | | | | | |
| | | | | | | |
| | Net asset value, beginning of period | | $ | 13.55 | | | $ | 13.32 | | | $ | 14.59 | | | $ | 12.08 | | | $ | 13.00 | | | $ | 13.57 | |
| | | | | | | |
| | Net investment income(a) | | | 0.15 | | | | 0.36 | | | | 0.34 | | | | 0.14 | | | | 0.12 | | | | 0.11 | |
| | | | | | | |
| | Net realized and unrealized gain (loss) | | | (2.28 | ) | | | 1.52 | | | | (1.37 | ) | | | 2.59 | | | | (1.01 | ) | | | (0.23 | ) |
| | | | | | | |
| | Total from investment operations | | | (2.13 | ) | | | 1.88 | | | | (1.03 | ) | | | 2.73 | | | | (0.89 | ) | | | (0.12 | ) |
| | | | | | | |
| | Distributions to shareholders from net investment income | | | (0.32 | ) | | | (0.36 | ) | | | (0.24 | ) | | | (0.22 | ) | | | (0.03 | ) | | | (0.45 | ) |
| | | | | | | |
| | Distributions to shareholders from net realized gains | | | — | | | | (1.29 | ) | | | — | | | | — | | | | — | | | | — | |
| | | | | | | |
| | Total distributions | | | (0.32 | ) | | | (1.65 | ) | | | (0.24 | ) | | | (0.22 | ) | | | (0.03 | ) | | | (0.45 | ) |
| | | | | | | |
| | Net asset value, end of period | | $ | 11.10 | | | $ | 13.55 | | | $ | 13.32 | | | $ | 14.59 | | | $ | 12.08 | | | $ | 13.00 | |
| | | | | | | |
| | Total return(b) | | | (16.19 | )% | | | 16.63 | % | | | (7.19 | )% | | | 22.99 | % | | | (6.87 | )% | | | (0.84 | )% |
| | | | | | | |
| | Net assets, end of period (in 000s) | | $ | 218 | | | $ | 73 | | | $ | 84 | | | $ | 44 | | | $ | 28 | | | $ | 17 | |
| | | | | | | |
| | Ratio of net expenses to average net assets | | | 1.48 | %(c) | | | 1.50 | % | | | 1.51 | % | | | 1.55 | % | | | 1.55 | % | | | 1.55 | % |
| | | | | | | |
| | Ratio of total expenses to average net assets | | | 2.06 | %(c) | | | 2.40 | % | | | 2.18 | % | | | 2.12 | % | | | 2.01 | % | | | 2.07 | % |
| | | | | | | |
| | Ratio of net investment income to average net assets | | | 2.58 | %(c) | | | 2.90 | % | | | 2.38 | % | | | 1.05 | % | | | 0.99 | % | | | 0.86 | % |
| | | | | | | |
| | Portfolio turnover rate(d) | | | 32 | % | | | 27 | % | | | 87 | % | | | 32 | % | | | 68 | % | | | 83 | % |
| | (a) | | Calculated based on the average shares outstanding methodology. |
| | (b) | | Assumes investment at the net asset value at the beginning of the period, reinvestment of all distributions, a complete redemption of the investment at the net asset value at the end of the period and no sales or redemption charges (if any). Total returns would be reduced if a sales or redemption charge was taken into account. Returns do not reflect the impact of taxes to shareholders relating to Fund distributions or the redemption of Fund shares. Total returns for periods less than one full year are not annualized. |
| | (d) | | The Fund’s portfolio turnover rate is calculated in accordance with regulatory requirements, without regard to transactions involving short term investments. If such transactions were included, the Fund’s portfolio turnover rate may be higher. |
| | |
| The accompanying notes are an integral part of these financial statements. | | 23 |
GOLDMAN SACHS INTERNATIONAL EQUITY INCOME FUND
Financial Highlights(continued)
Selected Data for a Share Outstanding Throughout Each Period
| | | | | | | | | | | | | | | | | | | | | | |
| | | | | Goldman Sachs International Equity Income Fund | |
| | | | | Class R6 Shares | |
| | | | | Six Months Ended
April 30, 2020
(Unaudited) | | | Year Ended October 31, | | | February 26, 2016*
to
October 31, 2016 | |
| | | 2019 | | | 2018 | | | 2017 | |
| | Per Share Data | | | | | | | | | | | | | | | | | | | | |
| | | | | | |
| | Net asset value, beginning of period | | $ | 14.25 | | | $ | 13.87 | | | $ | 15.20 | | | $ | 12.56 | | | $ | 11.85 | |
| | | | | | |
| | Net investment income(a) | | | 0.20 | | | | 0.49 | | | | 0.45 | | | | 0.16 | | | | 0.20 | |
| | | | | | |
| | Net realized and unrealized gain (loss) | | | (2.39 | ) | | | 1.57 | | | | (1.43 | ) | | | 2.77 | | | | 0.51 | |
| | | | | | |
| | Total from investment operations | | | (2.19 | ) | | | 2.06 | | | | (0.98 | ) | | | 2.93 | | | | 0.71 | |
| | | | | | |
| | Distributions to shareholders from net investment income | | | (0.41 | ) | | | (0.39 | ) | | | (0.35 | ) | | | (0.29 | ) | | | — | |
| | | | | | |
| | Distributions to shareholders from net realized gains | | | — | | | | (1.29 | ) | | | — | | | | — | | | | — | |
| | | | | | |
| | Total distributions | | | (0.41 | ) | | | (1.68 | ) | | | (0.35 | ) | | | (0.29 | ) | | | — | |
| | | | | | |
| | Net asset value, end of period | | $ | 11.65 | | | $ | 14.25 | | | $ | 13.87 | | | $ | 15.20 | | | $ | 12.56 | |
| | | | | | |
| | Total return(b) | | | (15.90 | )% | | | 17.41 | % | | | (6.62 | )% | | | 23.91 | % | | | 5.99 | % |
| | | | | | |
| | Net assets, end of period (in 000s) | | $ | 1,474 | | | $ | 332 | | | $ | 68 | | | $ | 72 | | | $ | 11 | |
| | | | | | |
| | Ratio of net expenses to average net assets | | | 0.84 | %(c) | | | 0.86 | % | | | 0.86 | % | | | 0.89 | % | | | 0.89 | %(c) |
| | | | | | |
| | Ratio of total expenses to average net assets | | | 1.42 | %(c) | | | 1.80 | % | | | 1.51 | % | | | 1.43 | % | | | 1.35 | %(c) |
| | | | | | |
| | Ratio of net investment income to average net assets | | | 3.17 | %(c) | | | 3.74 | % | | | 2.99 | % | | | 1.16 | % | | | 2.33 | %(c) |
| | | | | | |
| | Portfolio turnover rate(d) | | | 32 | % | | | 27 | % | | | 87 | % | | | 32 | % | | | 68 | % |
| | * | | Commencement of operations. |
| | (a) | | Calculated based on the average shares outstanding methodology. |
| | (b) | | Assumes investment at the net asset value at the beginning of the period, reinvestment of all distributions, a complete redemption of the investment at the net asset value at the end of the period and no sales or redemption charges (if any). Total returns would be reduced if a sales or redemption charge was taken into account. Returns do not reflect the impact of taxes to shareholders relating to Fund distributions or the redemption of Fund shares. Total returns for periods less than one full year are not annualized. |
| | (d) | | The Fund’s portfolio turnover rate is calculated in accordance with regulatory requirements, without regard to transactions involving short term investments. If such transactions were included, the Fund’s portfolio turnover rate may be higher. |
| | |
| 24 | | The accompanying notes are an integral part of these financial statements. |
GOLDMAN SACHS FUNDAMENTAL INTERNATIONAL EQUITY FUNDS
Notes to Financial Statements
April 30, 2020 (Unaudited)
Goldman Sachs Trust (the “Trust”) is a Delaware statutory trust registered under the Investment Company Act of 1940, as amended (the “Act”), as anopen-end management investment company. The following table lists those series of the Trust that are included in this report (collectively, the “Funds” or individually a “Fund”), along with their corresponding share classes and respective diversification status under the Act:
| | | | |
| | |
| Fund | | Share Classes Offered | | Diversified/
Non-diversified |
International Equity ESG | | A, C, Institutional, Service, Investor, P and R6 | | Diversified |
International Equity Income | | A, C, Institutional, Investor, P, R and R6 | | Diversified |
Class A Shares are sold with afront-end sales charge of up to 5.50%. Class C Shares are sold with a contingent deferred sales charge (“CDSC”) of 1.00%, which is imposed on redemptions made within 12 months of purchase. Institutional, Service, Investor, Class P, Class R and Class R6 Shares are not subject to a sales charge.
Goldman Sachs Asset Management, L.P. (“GSAM”), an affiliate of Goldman Sachs & Co. LLC (“Goldman Sachs”), serves as investment adviser to the Funds pursuant to management agreements (each, an “Agreement”) with the Trust.
|
| 2. SIGNIFICANT ACCOUNTING POLICIES |
The financial statements have been prepared in accordance with accounting principles generally accepted in the United States of America (“GAAP”) and require management to make estimates and assumptions that may affect the reported amounts and disclosures. Actual results may differ from those estimates and assumptions. Each Fund is an investment company under GAAP and follows the accounting and reporting guidance applicable to investment companies.
A. Investment Valuation — The Funds’ valuation policy is to value investments at fair value.
B. Investment Income and Investments — Investment income includes interest income, dividend income, and securities lending income, if any. Interest income is accrued daily and adjusted for amortization of premiums and accretion of discounts. Dividend income is recognized onex-dividend date or, for certain foreign securities, as soon as such information is obtained subsequent to theex-dividend date.Non-cash dividends, if any, are recorded at the fair market value of the securities received. Investment transactions are reflected on trade date. Realized gains and losses are calculated using identified cost. Investment transactions are recorded on the following business day for daily net asset value (“NAV”) calculations. Investment income is recorded net of any foreign withholding taxes, less any amounts reclaimable. The Funds may file withholding tax reclaims in certain jurisdictions to recover a portion of amounts previously withheld. Any foreign capital gains tax is accrued daily based upon net unrealized gains, and is payable upon sale of such investments.
C. Class Allocations and Expenses — Investment income, realized and unrealized gain (loss), if any, andnon-class specific expenses of each Fund are allocated daily based upon the proportion of net assets of each class.Non-class specific expenses directly incurred by a Fund are charged to that Fund, while such expenses incurred by the Trust are allocated across the applicable Funds on astraight-line and/orpro-rata basis depending upon the nature of the expenses. Class specific expenses, where applicable, are borne by the respective share classes and include Distribution and Service, Transfer Agency and Service and Shareholder Administration fees.
D. Federal Taxes and Distributions to Shareholders — It is each Fund’s policy to comply with the requirements of the Internal Revenue Code of 1986, as amended (the “Code”), applicable to regulated investment companies and to distribute each year substantially all of its investment company taxable income and capital gains to its shareholders. Accordingly, each Fund is not
25
GOLDMAN SACHS FUNDAMENTAL INTERNATIONAL EQUITY FUNDS
Notes to Financial Statements(continued)
April 30, 2020 (Unaudited)
|
| 2. SIGNIFICANT ACCOUNTING POLICIES (continued) |
required to make any provisions for the payment of federal income tax. Distributions to shareholders are recorded on theex-dividend date. Income and capital gains distributions, if any, are declared and paid according to the following schedule:
| | | | | | |
| Portfolio | | | | Income Distributions Declared/Paid | | Capital Gains Distributions
Declared/Paid |
International Equity ESG | | | | Annually | | Annually |
International Equity Income | | | | Semi-Annually | | Annually |
Net capital losses, if any, are carried forward to future fiscal years and may be used to the extent allowed by the Code to offset any future capital gains. Losses that are carried forward will retain their character as either short-term or long-term capital losses. Utilization of capital loss carryforwards will reduce the requirement of future capital gains distributions.
The characterization of distributions to shareholders for financial reporting purposes is determined in accordance with federal income tax rules, which may differ from GAAP. The source of each Fund’s distributions may be shown in the accompanying financial statements as either from distributable earnings or capital. Certain components of the Funds’ net assets on the Statements of Assets and Liabilities reflect permanent GAAP/tax differences based on the appropriate tax character.
E. Foreign Currency Translation — The accounting records and reporting currency of a Fund are maintained in U.S. dollars. Assets and liabilities denominated in foreign currencies are translated into U.S. dollars using the current exchange rates at the close of each business day. The effect of changes in foreign currency exchange rates on investments is included within net realized and unrealized gain (loss) on investments. Changes in the value of other assets and liabilities as a result of fluctuations in foreign exchange rates are included in the Statements of Operations within net change in unrealized gain (loss) on foreign currency translation. Transactions denominated in foreign currencies are translated into U.S. dollars on the date the transaction occurred, the effects of which are included within net realized gain (loss) on foreign currency transactions.
| | |
| 3. INVESTMENTS AND FAIR VALUE MEASUREMENTS | | |
U.S. GAAP defines the fair value of a financial instrument as the amount that would be received to sell an asset or paid to transfer a liability in an orderly transaction between market participants at the measurement date (i.e., the exit price); the Funds’ policy is to use the market approach. GAAP establishes a fair value hierarchy that prioritizes the inputs to valuation techniques used to measure fair value. The hierarchy gives the highest priority to unadjusted quoted prices in active markets for identical assets or liabilities (Level 1 measurements) and the lowest priority to unobservable inputs (Level 3 measurements). The levels used for classifying investments are not necessarily an indication of the risk associated with investing in these investments. The three levels of the fair value hierarchy are described below:
Level 1 — Unadjusted quoted prices in active markets that are accessible at the measurement date for identical, unrestricted assets or liabilities;
Level 2 — Quoted prices in markets that are not active or financial instruments for which significant inputs are observable (including, but not limited to, quoted prices for similar investments, interest rates, foreign exchange rates, volatility and credit spreads), either directly or indirectly;
Level 3 — Prices or valuations that require significant unobservable inputs (including GSAM’s assumptions in determining fair value measurement).
The Board of Trustees (“Trustees”) has approved Valuation Procedures that govern the valuation of the portfolio investments held by the Funds, including investments for which market quotations are not readily available. The Trustees have delegated to GSAMday-to-day responsibility for implementing and maintaining internal controls and procedures related to the valuation of the Funds’ investments. To assess the continuing appropriateness of pricing sources and methodologies, GSAM regularly performs price verification procedures and issues challenges as necessary to third party pricing vendors or brokers, and any differences are reviewed in accordance with the Valuation Procedures.
26
GOLDMAN SACHS FUNDAMENTAL INTERNATIONAL EQUITY FUNDS
|
| 3. INVESTMENTS AND FAIR VALUE MEASUREMENTS (continued) |
A. Level 1 and Level 2 Fair Value Investments — The valuation techniques and significant inputs used in determining the fair values for investments classified as Level 1 and Level 2 are as follows:
Equity Securities — Equity securities traded on a United States (“U.S.”) securities exchange or the NASDAQ system, or those located on certain foreign exchanges, including but not limited to the Americas, are valued daily at their last sale price or official closing price on the principal exchange or system on which they are traded. If there is no sale or official closing price or such price is believed by GSAM to not represent fair value, equity securities may be valued at the closing bid price for long positions and at the closing ask price for short positions. To the extent these investments are actively traded, they are classified as Level 1 of the fair value hierarchy, otherwise they are generally classified as Level 2. Certain equity securities containing unique attributes may be classified as Level 2.
Unlisted equity securities for which market quotations are available are valued at the last sale price on the valuation date, or if no sale occurs, at the last bid price for long positions or the last ask price for short positions, and are generally classified as Level 2. Securities traded on certain foreign securities exchanges are valued daily at fair value determined by an independent fair value service (if available) under Valuation Procedures approved by the Trustees and consistent with applicable regulatory guidance. The independent fair value service takes into account multiple factors including, but not limited to, movements in the securities markets, certain depositary receipts, futures contracts and foreign currency exchange rates that have occurred subsequent to the close of the foreign securities exchange. These investments are generally classified as Level 2 of the fair value hierarchy.
Money Market Funds — Investments in the Goldman Sachs Financial Square Government Fund (“Underlying Fund”) are valued at the NAV per share of the Institutional Share class on the day of valuation. These investments are generally classified as Level 1 of the fair value hierarchy. For information regarding the Underlying Fund’s accounting policies and investment holdings, please see the Underlying Fund’s shareholder report.
B. Level 3 Fair Value Investments — To the extent that significant inputs to valuation models and other alternative pricing sources are unobservable, or if quotations are not readily available, or if GSAM believes that such quotations do not accurately reflect fair value, the fair value of a Fund’s investments may be determined under Valuation Procedures approved by the Trustees. GSAM, consistent with its procedures and applicable regulatory guidance, may make an adjustment to the most recent valuation prices of either domestic or foreign securities in light of significant events to reflect what it believes to be the fair value of the securities at the time of determining a Fund’s NAV. To the extent investments are valued using single source broker quotations obtained directly from the broker or passed through from third party pricing vendors, such investments are classified as Level 3 investments.
C. Fair Value Hierarchy — The following is a summary of the Funds’ investments classified in the fair value hierarchy as of April 30, 2020:
| | | | | | | | | | | | |
| | | |
| INTERNATIONAL EQUITY ESG | | | | | | | | | | | | |
| | | |
| Investment Type | | Level 1 | | | Level 2 | | | Level 3 | |
| | | |
| Assets | | | | | | | | | | | | |
| | | |
Common Stock and/or Other Equity Investments(a) | | | | | | | | | | | | |
| | | |
Asia | | $ | 3,968,173 | | | $ | 24,299,501 | | | $ | — | |
| | | |
Europe | | | — | | | | 83,771,169 | | | | — | |
| | | |
North America | | | — | | | | 3,152,889 | | | | — | |
| | | |
Investment Company | | | 1,369,428 | | | | — | | | | — | |
| | | |
| Total | | $ | 5,337,601 | | | $ | 111,223,559 | | | $ | — | |
| (a) | | Amounts are disclosed by continent to highlight the impact of time zone differences between local market close and the calculation of NAV. Security valuations are based on the principal exchange or system on which they are traded, which may differ from country of domicile. The Funds utilize fair value model prices provided by an independent fair value service for certain international equity securities, resulting in a Level 2 classification. |
27
GOLDMAN SACHS FUNDAMENTAL INTERNATIONAL EQUITY FUNDS
Notes to Financial Statements(continued)
April 30, 2020 (Unaudited)
|
| 3. INVESTMENTS AND FAIR VALUE MEASUREMENTS (continued) |
| | | | | | | | | | | | |
| | | |
| INTERNATIONAL EQUITY INCOME | | | | | | | | | | | | |
| | | |
| Investment Type | | Level 1 | | | Level 2 | | | Level 3 | |
| | | |
| Assets | | | | | | | | | | | | |
| | | |
Common Stock and/or Other Equity Investments(a) | | | | | | | | | | | | |
| | | |
Asia | | $ | — | | | $ | 7,198,731 | | | $ | — | |
| | | |
Australia and Oceania | | | — | | | | 3,394,211 | | | | — | |
| | | |
Europe | | | — | | | | 47,118,004 | | | | — | |
| | | |
North America | | | — | | | | 1,965,652 | | | | — | |
| | | |
| Total | | $ | — | | | $ | 59,676,598 | | | $ | — | |
| (a) | | Amounts are disclosed by continent to highlight the impact of time zone differences between local market close and the calculation of NAV. Security valuations are based on the principal exchange or system on which they are traded, which may differ from country of domicile. The Funds utilize fair value model prices provided by an independent fair value service for certain international equity securities, resulting in a Level 2 classification. |
For further information regarding security characteristics, see the Schedules of Investments.
|
| 4. AGREEMENTS AND AFFILIATED TRANSACTIONS |
A. Management Agreement — Under the Agreement, GSAM manages the Funds, subject to the general supervision of the Trustees.
As compensation for the services rendered pursuant to the Agreement, the assumption of the expenses related thereto and administration of the Funds’ business affairs, including providing facilities, GSAM is entitled to a management fee, accrued daily and paid monthly, equal to an annual percentage rate of each Fund’s average daily net assets.
For the six months ended April 30, 2020, contractual and effective net management fees with GSAM were at the following rates:
| | | | | | | | | | | | | | | | | | | | | | | | | | | | | | | | |
| | | | | | Contractual Management Rate | | | Effective Net
Management
Rate^ | |
| Fund | | | | | First $1 billion | | | Next $1 billion | | | Next $3 billion | | | Next $3 billion | | | Over $8 billion | | | Effective
Rate | |
International Equity ESG | | | | | | | 0.85 | % | | | 0.77 | % | | | 0.73 | % | | | 0.71 | % | | | 0.70 | % | | | 0.85 | % | | | 0.84 | %(1) |
International Equity Income | | | | | | | 0.80 | | | | 0.72 | | | | 0.68 | | | | 0.67 | | | | 0.66 | | | | 0.80 | | | | 0.80 | |
| ^ | | Effective Net Management Rate includes the impact of management fee waivers of affiliated underlying funds, if any. |
| (1) | | GSAM agreed to waive a portion of its management fee equal to 0.03% as an annual percentage of average daily net assets of the Fund. This waiver will be effective through at least February 28, 2021, and prior to such date GSAM may not terminate the arrangement without approval of the Trustees. |
The International Equity ESG and International Equity Income Funds invest in Institutional Shares of the Goldman Sachs Financial Square Government Fund, which is an affiliated Underlying Fund. GSAM has agreed to waive a portion of its management fee payable by the Funds in an amount equal to the management fee it earns as an investment adviser to the affiliated Underlying Fund in which the Funds invest, except those management fees it earns from the Funds’ investments of cash collateral received in connection with securities lending transactions in the Goldman Sachs Financial Square Government Fund. For the six months ended April 30, 2020, GSAM waived $362 and $325 of the International Equity ESG and International Equity Income Funds’ management fees, respectively.
B. Distribution and/or Service(12b-1) Plans — The Trust, on behalf of Class A and Class R Shares of each applicable Fund, has adopted Distribution and Service Plans subject to Rule12b-1 under the Act. Under the Distribution and Service Plans, Goldman Sachs, which serves as distributor (the “Distributor”), is entitled to a fee accrued daily and paid monthly for distribution services and personal and account maintenance services, which may then be paid by Goldman Sachs to authorized dealers. These fees are equal to an annual percentage rate of the average daily net assets attributable to Class A or Class R Shares of the Funds, as applicable, as set forth below.
28
GOLDMAN SACHS FUNDAMENTAL INTERNATIONAL EQUITY FUNDS
|
| 4. AGREEMENTS AND AFFILIATED TRANSACTIONS (continued) |
The Trust, on behalf of Class C Shares of each applicable Fund, has adopted a Distribution Plan subject to Rule12b-1 under the Act. Under the Distribution Plan, Goldman Sachs as Distributor is entitled to a fee accrued daily and paid monthly for distribution services, which may then be paid by Goldman Sachs to authorized dealers. These fees are equal to an annual percentage rate of the average daily net assets attributable to Class C Shares of the Funds, as set forth below.
The Trust, on behalf of Service Shares of each applicable Fund, has adopted a Service Plan subject to Rule12b-1 under the Act to allow Service Shares to compensate service organizations (including Goldman Sachs) for providing personal and account maintenance services to their customers who are beneficial owners of such shares. The Service Plan provides for compensation to the service organizations equal to an annual percentage rate of the average daily net assets attributable to Service Shares of the Funds, as set forth below.
| | | | | | | | | | | | | | | | |
| | | Distribution and/or Service Plan Rates | |
| | | Class A* | | | Class C | | | Class R* | | | Service | |
Distribution and/or Service Plan | | | 0.25 | % | | | 0.75 | % | | | 0.50 | % | | | 0.25 | % |
| * | | With respect to Class A and Class R Shares, the Distributor at its discretion may use compensation for distribution services paid under the Distribution and Service Plans to compensate service organizations for personal and account maintenance services and expenses as long as such total compensation does not exceed the maximum cap on “service fees” imposed by the Financial Industry Regulatory Authority. |
C. Distribution Agreement — Goldman Sachs, as Distributor of the shares of the Funds pursuant to a Distribution Agreement, may retain a portion of the Class A Shares’ front end sales charge and Class C Shares’ CDSC. During the six months ended April 30, 2020, Goldman Sachs retained the following amounts:
| | | | | | | | | | |
| | | | | Front End
Sales Charge | | | Contingent Deferred
Sales Charge | |
| Fund | | | | Class A | | | Class C | |
International Equity ESG | | | | $ | 591 | | | $ | 129 | |
International Equity Income | | | | | 571 | | | | 9 | |
D. Service and Shareholder Administration Plans — The Trust, on behalf of each applicable Fund, has adopted Service Plans to allow Class C Shares and Shareholder Administration Plans to allow Service Shares, respectively, to compensate service organizations (including Goldman Sachs) for providing varying levels of personal and account maintenance or shareholder administration services to their customers who are beneficial owners of such shares. The Service and Shareholder Administration Plans each provide for compensation to the service organizations equal to an annual percentage rate of 0.25% of the average daily net assets attributable to Class C and Service Shares of the Funds, respectively.
E. Transfer Agency Agreement — Goldman Sachs also serves as the transfer agent of the Funds for a fee pursuant to the Transfer Agency Agreement. The fees charged for such transfer agency services are accrued daily and paid monthly at annual rates as follows: 0.17% of the average daily net assets of Class A, Class C, Investor and Class R Shares; 0.03% of the average daily net assets of Class P and Class R6 Shares; and 0.04% of the average daily net assets of Institutional and Service Shares. Goldman Sachs has agreed to waive a portion of its transfer agency fee equal to 0.05% as an annual percentage rate of the average daily net assets attributable to Class A, Class C and Investor Shares of the International Equity ESG Fund through at least February 28, 2021, and prior to such date, Goldman Sachs may not terminate the arrangement without the approval of the Board of Trustees.
F. Other Expense Agreements and Affiliated Transactions — GSAM has agreed to reduce or limit certain “Other Expenses” of the Funds (excluding acquired fund fees and expenses, transfer agency fees and expenses, service fees and shareholder administration fees (as applicable), taxes, interest, brokerage fees, expenses of shareholder meetings, litigation and indemnification, and extraordinary expenses) to the extent such expenses exceed, on an annual basis, a percentage rate of the average daily net assets of each Fund. Such Other Expense reimbursements, if any, are accrued daily and paid monthly. In addition, the Funds are not obligated to reimburse GSAM for prior fiscal year expense reimbursements, if any. The Other Expense
29
GOLDMAN SACHS FUNDAMENTAL INTERNATIONAL EQUITY FUNDS
Notes to Financial Statements(continued)
April 30, 2020 (Unaudited)
|
| 4. AGREEMENTS AND AFFILIATED TRANSACTIONS (continued) |
limitations as an annual percentage rate of average daily net assets for the International Equity ESG and International Equity Income Funds are 0.004% and 0.014%, respectively. Prior to February 28, 2020, the Other Expense limitation was 0.014% for the International Equity ESG Fund. These Other Expense limitations will remain in place through at least February 28, 2021, and prior to such date GSAM may not terminate the arrangements without the approval of the Trustees. In addition, the Funds have entered into certain offset arrangements with the custodian and the transfer agent, which may result in a reduction of the Funds’ expenses and are received irrespective of the application of the “Other Expense” limitations described above.
For the six months ended April 30, 2020, these expense reductions, including any fee waivers and Other Expense reimbursements, were as follows:
| | | | | | | | | | | | | | | | | | | | | | |
| Fund | | | | Management
Fee Waiver | | | Custody Fee
Credits | | | Transfer
Agency
Waiver/Credits | | | Other
Expense
Reimbursement | | | Total
Expense
Reductions | |
International Equity ESG | | | | $ | 5,966 | | | $ | 1,130 | | | $ | 10,996 | | | $ | 220,709 | | | $ | 238,801 | |
International Equity Income | | | | | 325 | | | | 141 | | | | — | | | | 189,492 | | | | 189,958 | |
G. Line of Credit Facility — As of April 30, 2020, the Funds participated in a $700,000,000 committed, unsecured revolving line of credit facility (the “facility”) together with other funds of the Trust and certain registered investment companies having management agreements with GSAM or its affiliates. This facility is to be used for temporary emergency purposes, or to allow for an orderly liquidation of securities to meet redemption requests. The interest rate on borrowings is based on the federal funds rate. The facility also requires a fee to be paid by the Funds based on the amount of the commitment that has not been utilized. For the six months ended April 30, 2020, the Funds did not have any borrowings under the facility. Prior to April 28, 2020, the facility was $580,000,000.
H. Other Transactions with Affiliates — As of April 30, 2020, The Goldman Sachs Group, Inc. was the beneficial owner of the following Funds:
| | | | | | | | | | | | | | | | | | | | | | | | | | |
| Fund | | | | Beginning
Value as of
October 31, 2019 | | | Purchases
at Cost | | | Proceeds
from Sales | | | Ending
Value as of
April 30, 2020 | | | Shares as of
April 30, 2020 | | | Dividend
Income from
Affiliated
Investment
Company | |
International Equity ESG | | | | $ | 992,989 | | | $ | 23,107,220 | | | $ | (22,730,781 | ) | | $ | 1,369,428 | | | | 1,369,428 | | | $ | 19,785 | |
International Equity Income | | | | | 1,609,740 | | | | 21,751,212 | | | | (23,360,952 | ) | | | — | | | | — | | | | 13,722 | |
|
| 5. PORTFOLIO SECURITIES TRANSACTIONS |
The cost of purchases and proceeds from sales and maturities of long-term securities for the six months ended April 30, 2020, were as follows:
| | | | | | | | | | |
| Fund | | | | Purchases | | | Sales and Maturities | |
International Equity ESG | | | | $ | 47,378,340 | | | $ | 38,986,947 | |
International Equity Income | | | | | 35,659,394 | | | | 20,635,851 | |
30
GOLDMAN SACHS FUNDAMENTAL INTERNATIONAL EQUITY FUNDS
Pursuant to exemptive relief granted by the Securities and Exchange Commission (“SEC”) and the terms and conditions contained therein, the Funds may lend their securities through a securities lending agent, Goldman Sachs Agency Lending (“GSAL”), a wholly-owned subsidiary of Goldman Sachs, to certain qualified borrowers including Goldman Sachs and affiliates. In accordance with the Funds’ securities lending procedures, the Funds receive cash collateral at least equal to the market value of the securities on loan. The market value of the loaned securities is determined at the close of business of the Funds, at their last sale price or official closing price on the principal exchange or system on which they are traded, and any additional required collateral is delivered to the Funds on the next business day. As with other extensions of credit, the Funds may experience delay in the recovery of their securities or incur a loss should the borrower of the securities breach its agreement with the Funds or become insolvent at a time when the collateral is insufficient to cover the cost of repurchasing securities on loan. Dividend income received from securities on loan may not be subject to withholding taxes and therefore withholding taxes paid may differ from the amounts listed in the Statements of Operations. Loans of securities are terminable at any time and as such 1) the remaining contractual maturities of the outstanding securities lending transactions are considered to be overnight and continuous and 2) the borrower, after notice, is required to return borrowed securities within the standard time period for settlement of securities transactions.
The Funds invest the cash collateral received in connection with securities lending transactions in the Goldman Sachs Financial Square Government Fund (“Government Money Market Fund”), an affiliated series of the Goldman Sachs Trust. The Government Money Market Fund is registered under the Act as an open end investment company, is subject to Rule2a-7 under the Act, and is managed by GSAM, for which GSAM may receive a management fee of up to 0.16% on an annualized basis of the average daily net assets of the Government Money Market Fund.
In the event of a default by a borrower with respect to any loan, GSAL will exercise any and all remedies provided under the applicable borrower agreement to make the Funds whole. These remedies include purchasing replacement securities by applying the collateral held from the defaulting broker against the purchase cost of the replacement securities. If GSAL is unable to purchase replacement securities, GSAL will indemnify the Funds by paying the Funds an amount equal to the market value of the securities loaned minus the value of cash collateral received from the borrower for the loan, subject to an exclusion for any shortfalls resulting from a loss of value in such cash collateral due to reinvestment risk. The Funds’ master netting agreements with certain borrowers provide the right, in the event of a default (including bankruptcy or insolvency), for thenon-defaulting party to liquidate the collateral and calculate net exposure to the defaulting party or request additional collateral. However, in the event of a default by a borrower, a resolution authority could determine that such rights are not enforceable due to the restrictions or prohibitions against the right ofset-off that may be imposed in accordance with a particular jurisdiction’s bankruptcy or insolvency laws. The Funds’ loaned securities were all subject to enforceable Securities Lending Agreements and the value of the collateral was at least equal to the value of the cash received. The amounts of the Funds’ overnight and continuous agreements, which represent the gross amounts of recognized liabilities for securities lending transactions outstanding as of April 30, 2020 are disclosed as “Payable upon return of securities loaned” on the Statements of Assets and Liabilities, where applicable.
Each of the Funds and GSAL received compensation relating to the lending of the Funds’ securities. The amounts earned, if any, by the Funds for the six months ended April 30, 2020, are reported under Investment Income on the Statements of Operations.
The table below details securities lending activity with affiliates of Goldman Sachs:
| | | | | | | | | | |
| | | | | For the six months ended April 30, 2020 | |
| Fund | | | | Earnings of GSAL
Relating to
Securities
Loaned | | | Amounts Received
by the Funds
from Lending to
Goldman Sachs | |
International Equity ESG | | | | $ | 52 | | | $ | — | |
International Equity Income | | | | | 92 | | | | 825 | |
31
GOLDMAN SACHS FUNDAMENTAL INTERNATIONAL EQUITY FUNDS
Notes to Financial Statements(continued)
April 30, 2020 (Unaudited)
|
| 6. SECURITIES LENDING (continued) |
The following table provides information about the Funds’ investment in the Government Money Market Fund for the six months ended April 30, 2020:
| | | | | | | | | | | | | | | | | | |
| Fund | | | | Beginning
Value as of
October 31, 2019 | | | Purchases
at Cost | | | Proceeds
from Sales | | | Ending
Value as of
April 30, 2020 | |
International Equity ESG | | | | $ | — | | | $ | 2,725,842 | | | $ | (2,725,842 | ) | | $ | — | |
International Equity Income | | | | | — | | | | 1,127,250 | | | | (1,127,250 | ) | | | — | |
As of the Funds’ most recent fiscal year ended October 31, 2019, the Funds’ capital loss carryforwards on a tax basis were as follows:
| | | | | | | | |
| | | International
Equity ESG | | | International
Equity Income | |
Capital loss carryforwards: | | | | | | | | |
Perpetual Long-term | | $ | (13,797,006 | ) | | $ | (1,921,941 | ) |
Perpetual Short-term | | | (129,400 | ) | | | (912,994 | ) |
Total capital loss carryforwards: | | $ | (13,926,406 | ) | | $ | (2,834,935 | ) |
As of April 30, 2020, the Funds’ aggregate security unrealized gains and losses based on cost for U.S. federal income tax purposes were as follows:
| | | | | | | | |
| | | International
Equity ESG | | | International
Equity Income | |
Tax cost | | $ | 125,385,639 | | | $ | 69,875,297 | |
Gross unrealized gain | | | 8,872,423 | | | | 1,912,239 | |
Gross unrealized loss | | | (17,696,902 | ) | | | (12,110,938 | ) |
Net unrealized loss | | $ | (8,824,479 | ) | | $ | (10,198,699 | ) |
The difference between GAAP-basis andtax-basis unrealized gains (losses) is attributable primarily to wash sales and differences related to the tax treatment of passive foreign investment company investments.
GSAM has reviewed the Funds’ tax positions for all open tax years (the current and prior three years, as applicable) and has concluded that no provision for income tax is required in the Funds’ financial statements. Such open tax years remain subject to examination and adjustment by tax authorities.
The Funds’ risks include, but are not limited to, the following:
Dividend-Paying Investments Risk — A Fund’s investments in dividend-paying securities could cause a Fund to underperform other funds. Securities that pay dividends, as a group, can fall out of favor with the market, causing such securities to underperform securities that do not pay dividends. Depending upon market conditions and political and legislative responses to such conditions, dividend-paying securities that meet a Fund’s investment criteria may not be widely available and/or may be highly concentrated in
32
GOLDMAN SACHS FUNDAMENTAL INTERNATIONAL EQUITY FUNDS
|
| 8. OTHER RISKS (continued) |
only a few market sectors. In addition, issuers that have paid regular dividends or distributions to shareholders may not continue to do so at the same level or at all in the future. This may limit the ability of a Fund to produce current income.
ESG Standards Risk — The International Equity ESG’s adherence to its environmental, social and governance (“ESG”) criteria and the application of GSAM’s supplemental ESG analysis when selecting investments may affect the Fund’s exposure to certain companies, sectors, regions, and countries and may affect the Fund’s performance depending on whether such investments are in or out of favor. For example, the Fund will not seek to invest in companies that GSAM believes have adverse social or environmental impacts (i.e., gambling, alcohol, tobacco, coal or weapons companies), and the Fund will not seek to invest in companies that GSAM believes show inadequate governance standards (e.g., certain state-owned enterprises).
Foreign and Emerging Countries Risk — Investing in foreign markets may involve special risks and considerations not typically associated with investing in the U.S. Foreign securities may be subject to risk of loss because of more or less foreign government regulation, less public information and less economic, political and social stability in the countries in which a Fund invests. The imposition of exchange controls (including repatriation restrictions), confiscation of assets and property, trade restrictions (including tariffs) and other government restrictions by the U.S. or other governments, or from problems in share registration, settlement or custody, may also result in losses. Foreign risk also involves the risk of negative foreign currency rate fluctuations, which may cause the value of securities denominated in such foreign currency (or other instruments through which a Fund has exposure to foreign currencies) to decline in value. Currency exchange rates may fluctuate significantly over short periods of time. To the extent that a Fund also invests in securities of issuers located in emerging markets, these risks may be more pronounced.
Foreign Custody Risk — If a Fund invests in foreign securities, the Fund may hold such securities and cash with foreign banks, agents, and securities depositories appointed by the Fund’s custodian (each a “Foreign Custodian”). Some foreign custodians may be recently organized or new to the foreign custody business. In some countries, Foreign Custodians may be subject to little or no regulatory oversight over, or independent evaluation of, their operations. Further, the laws of certain countries may place limitations on a Fund’s ability to recover its assets if a Foreign Custodian enters bankruptcy. Investments in emerging markets may be subject to even greater custody risks than investments in more developed markets. Custody services in emerging market countries are very often undeveloped and may be considerably less well regulated than in more developed countries, and thus may not afford the same level of investor protection as would apply in developed countries.
Geographic Risk — If a Fund focuses its investments in securities of issuers located in a particular country or geographic region, the Fund may be subjected, to a greater extent than if its investments were less focused, to the risks of volatile economic cycles and/or conditions and developments that may be particular to that country or region, such as: adverse securities markets; adverse exchange rates; adverse social, political, regulatory, economic, business, environmental or other developments; or natural disasters.
Investments in Other Investment Companies Risk — As a shareholder of another investment company, a Fund will indirectly bear its proportionate share of any net management fees and other expenses paid by such other investment companies, in addition to the fees and expenses regularly borne by the Fund.
Issuer Concentration Risk — The Funds may invest in a relatively small number of issuers. As a result, they may be subject to greater risks than a fund that invests in a greater number of issuers. A change in the value of any single investment held by the Funds may affect the overall value of the Funds more than it would affect a mutual fund that holds more investments. In particular, the Funds may be more susceptible to adverse developments affecting any single issuer in the Funds and may be susceptible to greater losses because of these developments.
Large Shareholder Transactions Risk — A Fund may experience adverse effects when certain large shareholders, such as other funds, institutional investors (including those trading by use ofnon-discretionary mathematical formulas), financial intermediaries (who may make investment decisions on behalf of underlying clients and/or include a Fund in their investment model), individuals, accounts and Goldman Sachs affiliates, purchase or redeem large amounts of shares of a Fund. Such large shareholder redemptions, which may occur rapidly or unexpectedly, may cause a Fund to sell portfolio securities at times when it would not otherwise do so, which may negatively impact a Fund’s NAV and liquidity. These transactions may also accelerate the
33
GOLDMAN SACHS FUNDAMENTAL INTERNATIONAL EQUITY FUNDS
Notes to Financial Statements(continued)
April 30, 2020 (Unaudited)
|
| 8. OTHER RISKS (continued) |
realization of taxable income to shareholders if such sales of investments resulted in gains, and may also increase transaction costs. In addition, a large redemption could result in a Fund’s current expenses being allocated over a smaller asset base, leading to an increase in the Fund’s expense ratio. Similarly, large Fund share purchases may adversely affect a Fund’s performance to the extent that the Fund is delayed in investing new cash or otherwise maintains a larger cash position than it ordinarily would.
Liquidity Risk — A Fund may make investments that are illiquid or that may become less liquid in response to market developments or adverse investor perceptions. Illiquid investments may be more difficult to value. Liquidity risk may also refer to the risk that a Fund will not be able to pay redemption proceeds within the allowable time period or without significant dilution to remaining investors’ interests because of unusual market conditions, an unusually high volume of redemption requests, or other reasons. To meet redemption requests, a Fund may be forced to sell investments at an unfavorable time and/or under unfavorable conditions. If a Fund is forced to sell securities at an unfavorable time and/or under unfavorable conditions, such sales may adversely affect the Fund’s NAV and dilute remaining investors’ interests. These risks may be more pronounced in connection with the Funds’ investments in securities of issuers located in emerging market countries. Redemptions by large shareholders may have a negative impact on a Fund’s liquidity.
Market and Credit Risks — In the normal course of business, a Fund trades financial instruments and enters into financial transactions where risk of potential loss exists due to changes in the market (market risk). The value of the securities in which a Fund invests may go up or down in response to the prospects of individual companies, particular sectors or governments and/or general economic conditions throughout the world due to increasingly interconnected global economies and financial markets. Events such as war, acts of terrorism, social unrest, natural disasters, the spread of infectious illness or other public health threats could also significantly impact a Fund and its investments. Additionally, a Fund may also be exposed to credit risk in the event that an issuer or guarantor fails to perform or that an institution or entity with which the Fund has unsettled or open transactions defaults.
Under the Trust’s organizational documents, its Trustees, officers, employees and agents are indemnified, to the extent permitted by the Act and state law, against certain liabilities that may arise out of performance of their duties to the Funds. Additionally, in the course of business, the Funds enter into contracts that contain a variety of indemnification clauses. The Funds’ maximum exposure under these arrangements is unknown, as this would involve future claims that may be made against the Funds that have not yet occurred. However, GSAM believes the risk of loss under these arrangements to be remote.
Subsequent events after the Statements of Assets and Liabilities date have been evaluated, and GSAM has concluded that there is no impact requiring adjustment or disclosure in the financial statements.
34
GOLDMAN SACHS FUNDAMENTAL INTERNATIONAL EQUITY FUNDS
|
| 11. SUMMARY OF SHARE TRANSACTIONS |
Share activity is as follows:
| | | | | | | | | | | | | | | | |
| | | International Equity ESG Fund | |
| | | | |
| | | For the Six Months Ended
April 30, 2020
(Unaudited) | | | For the Fiscal Year Ended
October 31, 2019 | |
| | | | |
| | | Shares | | | Dollars | | | Shares | | | Dollars | |
| | | | |
| Class A Shares | | | | | | | | | | | | | | | | |
Shares sold | | | 66,020 | | | $ | 1,337,286 | | | | 64,610 | | | $ | 1,182,838 | |
Reinvestment of distributions | | | 27,677 | | | | 588,137 | | | | 27,075 | | | | 449,717 | |
Shares redeemed | | | (134,221 | ) | | | (2,565,570 | ) | | | (325,180 | ) | | | (6,007,245 | ) |
| | | | (40,524 | ) | | | (640,147 | ) | | | (233,495 | ) | | | (4,374,690 | ) |
| Class C Shares | | | | | | | | | | | | | | | | |
Shares sold | | | 5,665 | | | | 104,125 | | | | 46,331 | | | | 788,954 | |
Reinvestment of distributions | | | 5,908 | | | | 116,869 | | | | 1,542 | | | | 23,885 | |
Shares redeemed | | | (39,597 | ) | | | (743,934 | ) | | | (110,589 | ) | | | (1,926,146 | ) |
| | | | (28,024 | ) | | | (522,940 | ) | | | (62,716 | ) | | | (1,113,307 | ) |
| Institutional Shares | | | | | | | | | | | | | | | | |
Shares sold | | | 845,762 | | | | 14,597,721 | | | | 1,084,979 | | | | 20,862,777 | |
Reinvestment of distributions | | | 6,917 | | | | 150,244 | | | | 4,615 | | | | 78,277 | |
Shares redeemed | | | (34,361 | ) | | | (604,176 | ) | | | (1,102,693 | ) | | | (22,012,585 | ) |
| | | | 818,318 | | | | 14,143,789 | | | | (13,099 | ) | | | (1,071,531 | ) |
| Service Shares | | | | | | | | | | | | | | | | |
Reinvestment of distributions | | | 3 | | | | 65 | | | | 3 | | | | 43 | |
| | | | 3 | | | | 65 | | | | 3 | | | | 43 | |
| Investor Shares | | | | | | | | | | | | | | | | |
Shares sold | | | 27,906 | | | | 560,058 | | | | 18,990 | | | | 370,134 | |
Reinvestment of distributions | | | 580 | | | | 12,522 | | | | 332 | | | | 5,613 | |
Shares redeemed | | | (18,055 | ) | | | (289,104 | ) | | | (19,093 | ) | | | (366,160 | ) |
| | | | 10,431 | | | | 283,476 | | | | 229 | | | | 9,587 | |
| Class P Shares | | | | | | | | | | | | | | | | |
Shares sold | | | 107,701 | | | | 2,129,583 | | | | 293,748 | | | | 5,446,526 | |
Reinvestment of distributions | | | 64,471 | | | | 1,391,936 | | | | 95,089 | | | | 1,603,197 | |
Shares redeemed | | | (364,556 | ) | | | (6,436,220 | ) | | | (2,322,307 | ) | | | (42,986,970 | ) |
| | | | (192,384 | ) | | | (2,914,701 | ) | | | (1,933,470 | ) | | | (35,937,247 | ) |
| Class R6 Shares | | | | | | | | | | | | | | | | |
Shares sold | | | 52,701 | | | | 914,678 | | | | 25,890 | | | | 469,704 | |
Reinvestment of distributions | | | 441 | | | | 9,509 | | | | 12 | | | | 196 | |
Shares redeemed | | | (3,384 | ) | | | (64,934 | ) | | | (4,165 | ) | | | (82,165 | ) |
| | | | 49,758 | | | | 859,253 | | | | 21,737 | | | | 387,735 | |
| | | | |
NET INCREASE (DECREASE) | | | 617,578 | | | $ | 11,208,795 | | | | (2,220,811 | ) | | $ | (42,099,410 | ) |
35
GOLDMAN SACHS FUNDAMENTAL INTERNATIONAL EQUITY FUNDS
Notes to Financial Statements(continued)
April 30, 2020 (Unaudited)
|
| 11. SUMMARY OF SHARE TRANSACTIONS (continued) |
| | | | | | | | | | | | | | | | |
| |
| | | International Equity Income Fund | |
| | | | |
| | | For the Six Months Ended
April 30, 2020
(Unaudited) | | | For the Fiscal Year Ended
October 31, 2019 | |
| | | | |
| | | Shares | | | Dollars | | | Shares | | | Dollars | |
| | | | |
| Class A Shares | | | | | | | | | | | | | | | | |
Shares sold | | | 142,125 | | | $ | 1,821,177 | | | | 125,432 | | | $ | 1,595,783 | |
Reinvestment of distributions | | | 31,270 | | | | 428,400 | | | | 167,381 | | | | 1,917,576 | |
Shares redeemed | | | (157,505 | ) | | | (1,975,851 | ) | | | (250,762 | ) | | | (3,126,327 | ) |
| | | | 15,890 | | | | 273,726 | | | | 42,051 | | | | 387,032 | |
| Class C Shares | | | | | | | | | | | | | | | | |
Shares sold | | | 48,642 | | | | 569,378 | | | | 14,593 | | | | 159,836 | |
Reinvestment of distributions | | | 3,057 | | | | 36,954 | | | | 21,731 | | | | 220,807 | |
Shares redeemed | | | (23,254 | ) | | | (231,824 | ) | | | (39,466 | ) | | | (432,297 | ) |
| | | | 28,445 | | | | 374,508 | | | | (3,142 | ) | | | (51,654 | ) |
| Institutional Shares | | | | | | | | | | | | | | | | |
Shares sold | | | 830,093 | | | | 11,341,694 | | | | 220,491 | | | | 2,992,011 | |
Reinvestment of distributions | | | 14,302 | | | | 206,666 | | | | 26,135 | | | | 315,581 | |
Shares redeemed | | | (314,792 | ) | | | (3,864,308 | ) | | | (71,950 | ) | | | (902,125 | ) |
| | | | 529,603 | | | | 7,684,052 | | | | 174,676 | | | | 2,405,467 | |
| Investor Shares | | | | | | | | | | | | | | | | |
Shares sold | | | 699,518 | | | | 9,192,932 | | | | 247,942 | | | | 3,267,774 | |
Reinvestment of distributions | | | 9,594 | | | | 131,054 | | | | 4,131 | | | | 47,320 | |
Shares redeemed | | | (81,695 | ) | | | (866,207 | ) | | | (18,145 | ) | | | (229,025 | ) |
| | | | 627,417 | | | | 8,457,779 | | | | 233,928 | | | | 3,086,069 | |
| Class P Shares | | | | | | | | | | | | | | | | |
Shares sold | | | 789,220 | | | | 8,882,157 | | | | 76,129 | | | | 976,161 | |
Reinvestment of distributions | | | 65,941 | | | | 950,865 | | | | 314,791 | | | | 3,790,562 | |
Shares redeemed | | | (1,121,889 | ) | | | (13,080,477 | ) | | | (329,004 | ) | | | (4,214,711 | ) |
| | | | (266,728 | ) | | | (3,247,455 | ) | | | 61,916 | | | | 552,012 | |
| Class R Shares | | | | | | | | | | | | | | | | |
Shares sold | | | 16,079 | | | | 170,807 | | | | 2,282 | | | | 28,441 | |
Reinvestment of distributions | | | 94 | | | | 1,290 | | | | 794 | | | | 9,154 | |
Shares redeemed | | | (1,880 | ) | | | (21,153 | ) | | | (4,006 | ) | | | (50,618 | ) |
| | | | 14,293 | | | | 150,944 | | | | (930 | ) | | | (13,023 | ) |
| Class R6 Shares | | | | | | | | | | | | | | | | |
Shares sold | | | 112,359 | | | | 1,300,445 | | | | 21,177 | | | | 275,372 | |
Reinvestment of distributions | | | 865 | | | | 12,488 | | | | 708 | | | | 8,522 | |
Shares redeemed | | | (9,993 | ) | | | (122,359 | ) | | | (3,528 | ) | | | (46,349 | ) |
| | | | 103,231 | | | | 1,190,574 | | | | 18,357 | | | | 237,545 | |
| | | | |
NET INCREASE | | | 1,052,151 | | | $ | 14,884,128 | | | | 526,856 | | | $ | 6,603,448 | |
36
GOLDMAN SACHS FUNDAMENTAL INTERNATIONAL EQUITY FUNDS
Voting Results of Special Meeting of Shareholders (Unaudited)
A Special Meeting (the “Meeting”) of the Goldman Sachs Trust (“GST”) was held on January 23, 2020 to consider and act upon the proposals below. The Funds have amortized their respective share of the proxy, shareholder meeting and other related costs and GSAM has agreed to reimburse each Fund to the extent such expenses exceed a specified percentage of the Fund’s net assets.
At the Meeting, Dwight L. Bush, Kathryn A. Cassidy, Joaquin Delgado and Gregory G. Weaver were elected to the Trust’s Board of Trustees. In electing trustees, the Trust’s shareholders voted as follows:
| | | | | | | | | | | | | | | | |
Proposal 1. Election of Trustees | | For | | | Against | | | Withheld | | | Broker Non-Votes | |
| | | | |
Dwight L. Bush | | | 94,278,961,728.065 | | | | 0 | | | | 349,026,343,365 | | | | 0 | |
| | | | |
Kathryn A. Cassidy | | | 94,310,850,789.164 | | | | 0 | | | | 317,137,282.266 | | | | 0 | |
| | | | |
Joaquin Delgado | | | 94,282,646,444.727 | | | | 0 | | | | 345,341,626.703 | | | | 0 | |
| | | | |
Gregory G. Weaver | | | 94,306,589,873.348 | | | | 0 | | | | 321,398,198.082 | | | | 0 | |
| | | | | | | | | | | | | | | | |
37
GOLDMAN SACHS FUNDAMENTAL INTERNATIONAL EQUITY FUNDS
Liquidity Risk Management Program (Unaudited)
Each Fund has adopted and implemented a liquidity risk management program (the “Program”) in accordance with Rule22e-4 under the 1940 Act. The Program seeks to assess and manage each Fund’s liquidity risk,i.e., the risk that a Fund is unable to satisfy redemption requests without significantly diluting remaining investors’ interests in the Fund. The Board of Trustees of the Trust has designated GSAM, each Fund’s investment adviser, to administer the Program. Certain aspects of the Program rely on third parties to perform certain functions, including the provision of market data and application of models.
The Program is comprised of various components designed to support the assessment and/or management of liquidity risk, including: (1) the periodic assessment (no less frequently than annually) of certain factors that influence a Fund’s liquidity risk; (2) the periodic classification (no less frequently than monthly) of a Fund’s investments into one of four liquidity categories that reflect an estimate of their liquidity under current market conditions; (3) a 15% limit on the acquisition of “illiquid investments” (as defined under Rule22e-4); (4) for a Fund that does not invest primarily in “highly liquid investments” (as defined under Rule22e-4), the determination of a minimum percentage of the Fund’s assets that will generally be invested in highly liquid investments (a “Highly Liquid Investment Minimum”); and (5) periodic reporting to the Board of Trustees.
At a meeting of the Board of Trustees on February 11-12, 2020, GSAM provided a written report to the Board addressing the operation, and the adequacy and effectiveness of the implementation, of the Program, including, as applicable, the operation of any Highly Liquid Investment Minimum and any material changes to the Program, for the initial period from December 1, 2018 through December 31, 2019 (the “Reporting Period”). Among other things, the annual report discussed: (1) the results of stress tests designed to assess liquidity under a hypothetical stressed scenario involving elevated redemptions; and (2) an assessment of the methodologies used to classify investments into one of four liquidity categories. The report concluded that the Program was reasonably designed to assess and manage liquidity risk and was adequately and effectively implemented during the Reporting Period.
There can be no assurance that the Program will achieve its objectives under all circumstances in the future. Please refer to your Fund’s prospectus for more information regarding the Fund’s exposure to liquidity risk and other risks to which it may be subject.
38
GOLDMAN SACHS FUNDAMENTAL INTERNATIONAL EQUITY FUNDS
| | |
| | |
Fund Expenses — Six Month Period Ended April 30, 2020 (Unaudited) | | |
As a shareholder of Class A, Class C, Institutional, Service, Investor, Class P, Class R or Class R6 Shares of a Fund you incur two types of costs: (1) transaction costs, including sales charges on purchase payments (with respect to Class A Shares) and contingent deferred sales charges on redemptions (with respect to Class C Shares); and (2) ongoing costs, including management fees; distribution and/or service(12b-1) fees (with respect to Class A, Class C, Service and Class R Shares); and other Fund expenses. This example is intended to help you understand your ongoing costs (in dollars) of investing in Class A, Class C, Institutional, Service, Investor, Class P, Class R and Class R6 Shares of the Funds and to compare these costs with the ongoing costs of investing in other mutual funds.
The example is based on an investment of $1,000 invested at the beginning of the period and held for the entire period from November 1, 2019 through April 30, 2020, which represents a period of 182 days of a 366 day year.
Actual Expenses— The first line under each share class in the table below provides information about actual account values and actual expenses. You may use the information in this line, together with the amount you invested, to estimate the expenses that you paid over the period. Simply divide your account value by $1,000 (for example, an $8,600 account value divided by $1,000=8.6), then multiply the result by the number in the first line under the heading entitled “Expenses Paid” to estimate the expenses you paid on your account during this period.
Hypothetical Example for Comparison Purposes— The second line under each share class in the table below provides information about hypothetical account values and hypothetical expenses based on the Funds’ actual net expense ratio and an assumed rate of return of 5% per year before expenses, which is not the Funds’ actual return. The hypothetical account values and expenses may not be used to estimate the actual ending account balance or expenses you paid for the period. You may use this information to compare the ongoing costs of investing in the Funds and other funds. To do so, compare this 5% hypothetical example with the 5% hypothetical examples that appear in the shareholder reports of the other funds.
Please note that the expenses shown in the table are meant to highlight your ongoing costs only and do not reflect any transactional costs, such as sales charges, redemption fee or exchange fees. Therefore, the second line of the table is useful in comparing ongoing costs only, and will not help you determine the relative total costs of owning different funds. In addition, if these transactional costs were included, your costs would have been higher.
| | | | | | | | | | | | | | | | | | | | | | | | |
| | | International Equity ESG Fund | | | International Equity Income Fund | |
| Share Class | | Beginning
Account Value
11/01/19 | | | Ending
Account Value
04/30/20 | | | Expenses
Paid for the
6 Months
Ended
04/30/20* | | | Beginning
Account Value
11/01/19 | | | Ending
Account Value
04/30/20 | | | Expenses
Paid for the
6 Months
Ended
04/30/20* | |
| Class A | | | | | | | | | | | | | | | | | | | | | | | | |
Actual | | $ | 1,000 | | | $ | 884.00 | | | $ | 5.71 | | | $ | 1,000 | | | $ | 839.30 | | | $ | 5.67 | |
Hypothetical 5% return | | | 1,000 | | | | 1,018.80 | + | | | 6.12 | | | | 1,000 | | | | 1,018.70 | + | | | 6.22 | |
| Class C | | | | | | | | | | | | | | | | | | | | | | | | |
Actual | | | 1,000 | | | | 880.70 | | | | 9.21 | | | | 1,000 | | | | 837.10 | | | | 9.09 | |
Hypothetical 5% return | | | 1,000 | | | | 1,015.07 | + | | | 9.87 | | | | 1,000 | | | | 1,014.97 | + | | | 9.97 | |
| Institutional | | | | | | | | | | | | | | | | | | | | | | | | |
Actual | | | 1,000 | | | | 885.60 | | | | 4.13 | | | | 1,000 | | | | 841.00 | | | | 3.94 | |
Hypothetical 5% return | | | 1,000 | | | | 1,020.49 | + | | | 4.42 | | | | 1,000 | | | | 1,020.59 | + | | | 4.32 | |
| Service | | | | | | | | | | | | | | | | | | | | | | | | |
Actual | | | 1,000 | | | | 883.80 | | | | 6.42 | | | | N/A | | | | N/A | | | | N/A | |
Hypothetical 5% return | | | 1,000 | | | | 1,018.05 | + | | | 6.87 | | | | N/A | | | | N/A | | | | N/A | |
| Investor | | | | | | | | | | | | | | | | | | | | | | | | |
Actual | | | 1,000 | | | | 885.70 | | | | 4.55 | | | | 1,000 | | | | 840.20 | | | | 4.53 | |
Hypothetical 5% return | | | 1,000 | | | | 1,020.04 | + | | | 4.87 | | | | 1,000 | | | | 1,019.94 | + | | | 4.97 | |
| Class P | | | | | | | | | | | | | | | | | | | | | | | | |
Actual | | | 1,000 | | | | 886.10 | | | | 4.13 | | | | 1,000 | | | | 841.30 | | | | 3.85 | |
Hypothetical 5% return | | | 1,000 | | | | 1,020.49 | + | | | 4.42 | | | | 1,000 | | | | 1,020.69 | + | | | 4.22 | |
| Class R | | | | | | | | | | | | | | | | | | | | | | | | |
Actual | | | N/A | | | | N/A | | | | N/A | | | | 1,000 | | | | 838.10 | | | | 6.76 | |
Hypothetical 5% return | | | N/A | | | | N/A | | | | N/A | | | | 1,000 | | | | 1,017.50 | + | | | 7.42 | |
| Class R6 | | | | | | | | | | | | | | | | | | | | | | | | |
Actual | | | 1,000 | | | | 885.80 | | | | 4.08 | | | | 1,000 | | | | 841.00 | | | | 3.84 | |
Hypothetical 5% return | | | 1,000 | | | | 1,020.54 | + | | | 4.37 | | | | 1,000 | | | | 1,020.69 | + | | | 4.22 | |
| | + | | Hypothetical expenses are based on each Fund’s actual annualized net expense ratios and an assumed rate of return of 5% per year before expenses. | |
| | * | | Expenses are calculated using each Fund’s annualized net expense ratio for each class, which represents the ongoing expenses as a percentage of net assets for the six months ended April 30, 2020. Expenses are calculated by multiplying the annualized net expense ratio by the average account value for the period; then multiplying the result by the number of days in the most recent fiscal half year; and then dividing that result by the number of days in the fiscal year. The annualized net expense ratios for the period were as follows: | |
| | | | | | | | | | | | | | | | | | | | | | | | | | | | | | | | |
| Fund | | Class A | | | Class C | | | Institutional | | | Service | | | Investor | | | Class P | | | Class R | | | Class R6 | |
International Equity ESG | | | 1.22 | % | | | 1.97 | % | | | 0.88 | % | | | 1.37 | % | | | 0.97 | % | | | 0.88 | % | | | N/A | | | | 0.87 | % |
| | | | | | | | |
International Equity Income | | | 1.24 | | | | 1.99 | | | | 0.86 | | | | N/A | | | | 0.99 | | | | 0.84 | | | | 1.48 | % | | | 0.84 | |
39
FUNDS PROFILE
Goldman Sachs Funds
Goldman Sachs is a premier financial services firm, known since 1869 for creating thoughtful and customized investment solutions in complex global markets.
Today, theConsumer and Investment Management Division of Goldman Sachs serves a diverse set of clients worldwide, including private institutions, public entities and individuals. With approximately $1.66 trillion in assets under supervision as of March 31, 2020, Goldman Sachs Asset Management (“GSAM”) has portfolio management teams located around the world and our investment professionals bring firsthand knowledge of local markets to every investment decision. Assets under supervision includes assets under management and other client assets for which Goldman Sachs does not have full discretion. GSAM leverages the resources of Goldman Sachs & Co. LLC subject to legal, internal and regulatory restrictions.
Money Market
Financial Square FundsSM
| ∎ | | Financial Square Treasury Solutions Fund1 |
| ∎ | | Financial Square Government Fund1 |
| ∎ | | Financial Square Money Market Fund2 |
| ∎ | | Financial Square Prime Obligations Fund2 |
| ∎ | | Financial Square Treasury Instruments Fund1 |
| ∎ | | Financial Square Treasury Obligations Fund1 |
| ∎ | | Financial Square Federal Instruments Fund1 |
Investor FundsSM
| ∎ | | Investor Money Market Fund3 |
| ∎ | | Investor Tax-Exempt Money Market Fund3 |
Fixed Income
Short Duration and Government
| ∎ | | High Quality Floating Rate Fund |
| ∎ | | Short-Term Conservative Income Fund |
| ∎ | | Short Duration Government Fund |
| ∎ | | Short Duration Income Fund |
| ∎ | | Inflation Protected Securities Fund |
Multi-Sector
| ∎ | | Global Core Fixed Income Fund4 |
Municipal and Tax-Free
| ∎ | | High Yield Municipal Fund |
| ∎ | | Dynamic Municipal Income Fund |
| ∎ | | Short Duration Tax-Free Fund |
| ∎ | | Municipal Income Completion Fund |
Single Sector
| ∎ | | Investment Grade Credit Fund |
| ∎ | | High Yield Floating Rate Fund |
| ∎ | | Emerging Markets Debt Fund |
| ∎ | | Local Emerging Markets Debt Fund |
Fixed Income Alternatives
| ∎ | | Long Short Credit Strategies Fund |
Fundamental Equity
| ∎ | | Small/Mid Cap Value Fund |
| ∎ | | Small/Mid Cap Growth Fund |
| ∎ | | Concentrated Growth Fund |
| ∎ | | Technology Opportunities Fund |
| ∎ | | Growth Opportunities Fund |
| ∎ | | Rising Dividend Growth Fund |
Tax-Advantaged Equity
| ∎ | | U.S. Tax-Managed Equity Fund |
| ∎ | | International Tax-Managed Equity Fund |
| ∎ | | U.S. Equity Dividend and Premium Fund |
| ∎ | | International Equity Dividend and Premium Fund |
Equity Insights
| ∎ | | Small Cap Equity Insights Fund |
| ∎ | | U.S. Equity Insights Fund |
| ∎ | | Small Cap Growth Insights Fund |
| ∎ | | Large Cap Growth Insights Fund |
| ∎ | | Large Cap Value Insights Fund |
| ∎ | | Small Cap Value Insights Fund |
| ∎ | | International Small Cap Insights Fund |
| ∎ | | International Equity Insights Fund |
| ∎ | | Emerging Markets Equity Insights Fund |
Fundamental Equity International
| ∎ | | International Equity Income Fund |
| ∎ | | International Equity ESG Fund |
| ∎ | | Emerging Markets Equity Fund |
| ∎ | | Imprint Emerging Markets Opportunities Fund6 |
| ∎ | | ESG Emerging Markets Equity Fund |
Alternative
| ∎ | | Real Estate Securities Fund |
| ∎ | | International Real Estate Securities Fund |
| ∎ | | Commodity Strategy Fund |
| ∎ | | Global Real Estate Securities Fund |
| ∎ | | Alternative Premia Fund |
| ∎ | | Absolute Return Tracker Fund |
| ∎ | | Managed Futures Strategy Fund |
| ∎ | | MLP Energy Infrastructure Fund |
| ∎ | | Multi-Manager Alternatives Fund |
| ∎ | | Global Infrastructure Fund |
Total Portfolio Solutions
| ∎ | | Global Managed Beta Fund |
| ∎ | | Multi-Manager Non-Core Fixed Income Fund |
| ∎ | | Multi-Manager U.S. Dynamic Equity Fund |
| ∎ | | Multi-Manager Global Equity Fund |
| ∎ | | Multi-Manager International Equity Fund |
| ∎ | | Tactical Tilt Overlay Fund |
| ∎ | | Balanced Strategy Portfolio |
| ∎ | | Multi-Manager U.S. Small Cap Equity Fund |
| ∎ | | Multi-Manager Real Assets Strategy Fund |
| ∎ | | Growth and Income Strategy Portfolio |
| ∎ | | Growth Strategy Portfolio |
| ∎ | | Dynamic Global Equity Fund |
| ∎ | | Satellite Strategies Portfolio |
| ∎ | | Enhanced Dividend Global Equity Portfolio |
| ∎ | | Tax-Advantaged Global Equity Portfolio |
| ∎ | | Strategic Factor Allocation Fund |
| ∎ | | Target Date Retirement Portfolio7 |
| ∎ | | Target Date 2025 Portfolio |
| ∎ | | Target Date 2030 Portfolio |
| ∎ | | Target Date 2035 Portfolio |
| ∎ | | Target Date 2040 Portfolio |
| ∎ | | Target Date 2045 Portfolio |
| ∎ | | Target Date 2050 Portfolio |
| ∎ | | Target Date 2055 Portfolio |
| ∎ | | Target Date 2060 Portfolio |
| ∎ | | GQG Partners International Opportunities Fund |
| 1 | | You could lose money by investing in the Fund. Although the Fund seeks to preserve the value of your investment at $1.00 per share, it cannot guarantee it will do so. An investment in the Fund is not a deposit of a bank and is not insured or guaranteed by the Federal Deposit Insurance Corporation or any other government agency. The Fund’s sponsor has no legal obligation to provide financial support to the Fund, and you should not expect that the sponsor will provide financial support to the Fund at any time. |
| 2 | | You could lose money by investing in the Fund. Because the share price of the Fund will fluctuate, when you sell your shares they may be worth more or less than what you originally paid for them. The Fund may impose a fee upon sale of your shares or may temporarily suspend your ability to sell shares if the Fund’s liquidity falls below required minimums because of market conditions or other factors. An investment in the Fund is not a deposit of a bank and is not insured or guaranteed by the Federal Deposit Insurance Corporation or any other government agency. The Fund’s sponsor has no legal obligation to provide financial support to the Fund, and you should not expect that the sponsor will provide financial support to the Fund at any time. |
| 3 | | You could lose money by investing in the Fund. Although the Fund seeks to preserve the value of your investment at $1.00 per share, it cannot guarantee it will do so. The Fund may impose a fee upon sale of your shares or may temporarily suspend your ability to sell shares if the Fund’s liquidity falls below required minimums because of market conditions or other factors. An investment in the Fund is not a deposit of a bank and is not insured or guaranteed by the Federal Deposit Insurance Corporation or any other government agency. The Fund’s sponsor has no legal obligation to provide financial support to the Fund, and you should not expect that the sponsor will provide financial support to the Fund at any time. |
| 4 | | Effective after the close of business on April 30, 2020, the Goldman Sachs Global Income Fund was renamed the Goldman Sachs Global Core Fixed Income Fund. |
| 5 | | Effective after the close of business of November 20, 2019, the Goldman Sachs Asia Equity Fund was renamed the Goldman Sachs China Equity Fund. |
| 6 | | Effective after the close of business on August 30, 2019, the Goldman Sachs N-11 Equity Fund was renamed the Goldman Sachs Imprint Emerging Markets Opportunities Fund. |
| 7 | | Effective December 27, 2019, the Goldman Sachs Target Date 2020 Portfolio was renamed the Goldman Sachs Target Date Retirement Portfolio. |
| | | Financial Square FundsSM and Investor FundsSM are registered service marks of Goldman Sachs & Co. LLC. |
| * | | This list covers open-end funds only. Please visit our website at www.GSAMFUNDS.com to learn about our closed-end funds and exchange-traded funds. |
| | |
TRUSTEES Jessica Palmer,Chair Dwight L. Bush Kathryn A. Cassidy Diana M. Daniels Joaquin Delgado James A. McNamara Roy W. Templin Gregory G. Weaver | | OFFICERS James A. McNamara, President Joseph F. DiMaria,Principal Financial Officer, Principal Accounting Officer and Treasurer Caroline L. Kraus,Secretary |
| |
GOLDMAN SACHS & CO. LLC Distributor and Transfer Agent | | GOLDMAN SACHS ASSET MANAGEMENT, L.P. Investment Adviser |
Visit our website atwww.GSAMFUNDS.com to obtain the most recent month-end returns.
Goldman Sachs Asset Management, L.P., 200 West Street, New York, New York 10282
The reports concerning the Funds included in this shareholder report may contain certain forward-looking statements about the factors that may affect the performance of the Funds in the future. These statements are based on Fund management’s predictions and expectations concerning certain future events and their expected impact on the Funds, such as performance of the economy as a whole and of specific industry sectors, changes in the levels of interest rates, the impact of developing world events, and other factors that may influence the future performance of the Funds. Management believes these forward-looking statements to be reasonable, although they are inherently uncertain and difficult to predict. Actual events may cause adjustments in portfolio management strategies from those currently expected to be employed.
A description of the policies and procedures that the Funds use to determine how to vote proxies relating to portfolio securities and information regarding how a Fund voted proxies relating to portfolio securities during the most recent 12-month period ended June 30 is available (i) without charge, upon request by calling 1-800-526-7384 (for Retail Shareholders) or 1-800-621-2550 (for Institutional Shareholders); and (ii) on the Securities and Exchange Commission (“SEC”) web site at http://www.sec.gov.
The Funds will file portfolio holdings information for each month in a fiscal quarter within 60 days after the end of the relevant fiscal quarter on Form N-PORT. Portfolio holdings information for the third month of each fiscal quarter will be made available on the SEC’s web site at http://www.sec.gov. Portfolio holdings information may be obtained upon request and without charge by calling 1-800-526-7384 (for Retail Shareholders) or 1-800-621-2550 (for Institutional Shareholders).
Fund holdings and allocations shown are as of April 30, 2020 and may not be representative of future investments. Fund holdings should not be relied on in making investment decisions and should not be construed as research or investment advice regarding particular securities. Current and future holdings are subject to risk.
The Global Industry Classification Standard (GICS) was developed by and is the exclusive property and a service mark of Morgan Stanley Capital International Inc. (MSCI) and Standard & Poor’s, a division of The McGraw-Hill Companies, Inc. (S&P) and is licensed for use by Goldman Sachs. Neither MSCI, S&P nor any other party involved in making or compiling the GICS or any GICS classifications makes any express or implied warranties or representations with respect to such standard or classification (or the results to be obtained by the use thereof), and all such parties hereby expressly disclaim all warranties of originality, accuracy, completeness, merchantability or fitness for a particular purpose with respect to any of such standard or classification. Without limiting any of the foregoing, in no event shall MSCI, S&P, any of their affiliates or any third party involved in making or compiling the GICS or any GICS classifications have any liability for any direct, indirect, special, punitive, consequential or any other damages (including lost profits) even if notified of the possibility of such damages.
The portfolio risk management process includes an effort to monitor and manage risk, but does not imply low risk.
This material is not authorized for distribution to prospective investors unless preceded or accompanied by a current Prospectus or summary prospectus, if applicable. Investors should consider a Fund’s objective, risks, and charges and expenses, and read the summary prospectus, if available, and/or the Prospectus carefully before investing or sending money. The summary prospectus, if available, and the Prospectus contain this and other information about a Fund and may be obtained from your authorized dealer or from Goldman Sachs & Co. LLC by calling (retail – 1-800-526-7384) (institutional – 1-800-621-2550).
© 2020 Goldman Sachs. All rights reserved. 206030-OTU-1214525 EQINTSAR-20
Goldman Sachs Funds

| | | | |
| | |
| Semi-Annual Report | | | | April 30, 2020 |
| | |
| | | | International Equity Insights Funds |
| | | | Emerging Markets Equity Insights |
| | | | International Equity Insights |
| | | | International Small Cap Insights |
It is our intention that beginning on January 1, 2021, paper copies of the Funds’ annual and semi-annual shareholder reports will no longer be sent by mail, unless you specifically request paper copies of the reports from a Fund or from your financial intermediary. Instead, the reports will be made available on a website, and you will be notified by mail each time a report is posted and provided with a website link to access the report.
If you already elected to receive shareholder reports electronically, you will not be affected by this change and you need not take any action. At any time, you may elect to receive reports and certain communications from a Fund electronically by calling the applicable toll-free number below or by contacting your financial intermediary.
You may elect to receive all future shareholder reports in paper free of charge. If you hold shares of a Fund directly with the Fund’s transfer agent, you can inform the transfer agent that you wish to receive paper copies of reports by callingtoll-free 800-621-2550 for Institutional, Service, Class R6 and Class P shareholders or 800-526-7384 for all other shareholders. If you hold shares of a Fund through a financial intermediary, please contact your financial intermediary to make this election. Your election to receive reports in paper will apply to all Goldman Sachs Funds held in your account if you invest through your financial intermediary or all Goldman Sachs Funds held with the Funds’ transfer agent if you invest directly with the transfer agent.

Goldman Sachs International Equity
Insights Funds
| ∎ | | EMERGING MARKETS EQUITY INSIGHTS |
| ∎ | | INTERNATIONAL EQUITY INSIGHTS |
| ∎ | | INTERNATIONAL SMALL CAP INSIGHTS |
| | | | |
| | | |
| NOT FDIC-INSURED | | May Lose Value | | No Bank Guarantee |
Recent Market Events related to COVID-19
While this semi-annual report covers the six month period ended April 30, 2020, we want to describe some more recent events through the end of May.
An outbreak of a novel strain of coronavirus (COVID-19) has emerged globally. The outbreak of COVID-19 has prompted a number of measures to limit the spread, including travel and border restrictions, quarantines, curfews and restrictions on large gatherings. In turn, these resulted in lower consumer activity, diminished demand for a wide range of products and services, and disruption in manufacturing and supply chains. While governments have already taken unprecedented action to limit disruption to the financial system, global financial markets have experienced and may continue to experience significant volatility resulting from the spread of and subsequent intervening measures intended to limit the spread of COVID-19. A Fund could be negatively impacted if the value of a portfolio holding were harmed by such political or economic conditions, events, or actions. The full extent of the impact of COVID-19 on a Fund’s performance cannot be determined at this time and will depend on future developments, including the duration and the continued spread of the outbreak. Goldman Sachs Asset Management’s long-term commitment to you, our Fund shareholders, remains unchanged. We encourage you to maintain perspective and stay current with timely commentary and investment insights by visiting gsam.com.
i
FUND BASICS
Emerging Markets Equity Insights Fund
as of April 30, 2020
| | | | | | | | | | |
| | PERFORMANCE REVIEW | |
| | | |
| | | November 1, 2019–April 30, 2020 | | Fund Total Return
(based on NAV)1 | | | MSCI Emerging Markets
Standard Index (Net, USD, Unhedged)2 | |
| | | |
| | Class A | | | -11.60 | % | | | -10.50 | % |
| | Class C | | | -12.01 | | | | -10.50 | |
| | Institutional | | | -11.46 | | | | -10.50 | |
| | Investor | | | -11.51 | | | | -10.50 | |
| | Class P | | | -11.56 | | | | -10.50 | |
| | Class R | | | -11.73 | | | | -10.50 | |
| | | Class R6 | | | -11.56 | | | | -10.50 | |
| 1 | | The net asset value (NAV) represents the net assets of the class of the Fund (ex-dividend) divided by the total number of shares of the class outstanding. The Fund’s performance assumes the reinvestment of dividends and other distributions. The Fund’s performance does not reflect the deduction of any applicable sales charges. |
| 2 | | The MSCI Emerging Markets Standard Index (Net, USD, Unhedged) is a free float-adjusted market capitalization index that is designed to measure equity market performance of emerging markets. As of April 30, 2020, the MSCI® Emerging Markets Standard Index (Net, USD, Unhedged) consists of the following 26 emerging market country indices: Argentina, Brazil, Chile, China, Colombia, Czech Republic, Egypt, Greece, Hungary, India, Indonesia, Malaysia, Mexico, Pakistan, Peru, the Philippines, Poland, Qatar, Russia, Saudi Arabia, South Africa, South Korea, Taiwan, Thailand, Turkey and the United Arab Emirates. The MSCI® Emerging Markets Standard Index (Net, USD, Unhedged) figures do not reflect any deduction for fees, expenses or taxes. It is not possible to invest directly in an index. |
The returns set forth in the tables above represent past performance. Past performance does not guarantee future results. The Fund’s investment return and principal value will fluctuate so that an investor’s shares, when redeemed, may be worth more or less than their original cost. Current performance may be lower or higher than the performance quoted above. Please visit our web site at www.GSAMFUNDS.com to obtain the most recent month-end returns.Performance reflects applicable fee waivers and/or expense limitations in effect during the periods shown. In their absence, performance would be reduced. Returns do not reflect the deduction of taxes that a shareholder would pay on Fund distributions or the redemption of Fund shares.
| | | | | | | | | | |
| | TOP TEN HOLDINGS AS OF 4/30/201 |
| | | | |
| | | Holding | | % of Net Assets | | | Line of Business | | Country |
| | | | |
| | Alibaba Group Holding Ltd. ADR | | | 8.6 | % | | Retailing | | China |
| | Taiwan Semiconductor Manufacturing Co. Ltd. ADR | | | 6.2 | | | Semiconductors & Semiconductor
Equipment | | Taiwan |
| | Tencent Holdings Ltd. | | | 4.7 | | | Media & Entertainment | | China |
| | Samsung Electronics Co. Ltd. | | | 4.3 | | | Technology Hardware & Equipment | | South Korea |
| | NAVER Corp. | | | 1.9 | | | Media & Entertainment | | South Korea |
| | NetEase, Inc. ADR | | | 1.9 | | | Media & Entertainment | | China |
| | Industrial & Commercial Bank of China Ltd. Class H | | | 1.9 | | | Banks | | China |
| | Infosys Ltd. ADR | | | 1.8 | | | Software & Services | | India |
| | New Oriental Education & Technology Group, Inc. ADR | | | 1.8 | | | Consumer Services | | China |
| | | Hindustan Unilever Ltd. | | | 1.6 | | | Household & Personal Products | | India |
| 1 | | The top 10 holdings may not be representative of the Fund’s future investments. |
1
FUND BASICS
|
| FUND VS. BENCHMARK SECTOR ALLOCATIONS2 |
|
| As of April 30, 2020 |
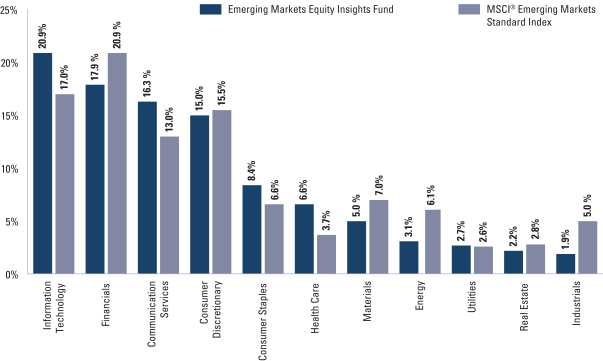
| 2 | | The Fund is actively managed and, as such, its composition may differ over time. Consequently, the Fund’s overall sector allocations may differ from percentages contained in the graph above. The graph categorizes investments using Global Industry Classification Standard (“GICS”); however, the sector classifications used by the portfolio management team may differ from GICS. The percentage shown for each investment category reflects the value of investments in that category as a percentage of market value (excluding investments in the securities lending reinvestment vehicle, if any). Investments in the securities lending reinvestment vehicle represented 0.2% of the Fund’s net assets at April 30, 2020. Percentages may not sum to 100% due to rounding. |
For more information about the Fund, please refer to www.GSAMFUNDS.com. There, you can learn more about the Fund’s investment strategies, holdings, and performance.
2
FUND BASICS
International Equity Insights Fund
as of April 30, 2020
| | | | | | | | | | |
| | PERFORMANCE REVIEW | |
| | | |
| | | November 1, 2019–April 30, 2020 | | Fund Total Return
(based on NAV)1 | | | MSCI® EAFE Standard Index
(Net, USD, Unhedged)2 | |
| | | |
| | Class A | | | -16.06 | % | | | -14.21 | % |
| | Class C | | | -16.37 | | | | -14.21 | |
| | Institutional | | | -15.90 | | | | -14.21 | |
| | Service | | | -16.09 | | | | -14.21 | |
| | Investor | | | -15.95 | | | | -14.21 | |
| | Class P | | | -15.84 | | | | -14.21 | |
| | Class R | | | -16.15 | | | | -14.21 | |
| | | Class R6 | | | -15.91 | | | | -14.21 | |
| 1 | | The net asset value (NAV) represents the net assets of the class of the Fund(ex-dividend) divided by the total number of shares of the class outstanding. The Fund’s performance assumes the reinvestment of dividends and other distributions. The Fund’s performance does not reflect the deduction of any applicable sales charges. |
| 2 | | The unmanaged MSCI® EAFE Standard Index (Net, USD, Unhedged) is a market capitalization-weighted composite of securities in 21 developed markets. As of April 30, 2020, the MSCI® EAFE Standard Index (Net, USD, Unhedged) consists of the following 21 developed countries: Australia, Austria, Belgium, Denmark, Finland, France, Germany, Hong Kong, Ireland, Israel, Italy, Japan, the Netherlands, New Zealand, Norway, Portugal, Singapore, Spain, Sweden, Switzerland and the United Kingdom. The MSCI® EAFE Standard Index (Net, USD, Unhedged) figures do not reflect any deduction for fees, expenses or taxes. It is not possible to invest directly in an index. |
The returns set forth in the tables above represent past performance. Past performance does not guarantee future results. The Fund’s investment return and principal value will fluctuate so that an investor’s shares, when redeemed, may be worth more or less than their original cost. Current performance may be lower or higher than the performance quoted above. Please visit our web site at www.GSAMFUNDS.com to obtain the most recentmonth-end returns.Performance reflects applicable fee waivers and/or expense limitations in effect during the periods shown. In their absence, performance would be reduced. Returns do not reflect the deduction of taxes that a shareholder would pay on Fund distributions or the redemption of Fund shares.
| | | | | | | | | | |
| | TOP TEN HOLDINGS AS OF 4/30/201,2 |
| | | | |
| | | Holding | | % of Net Assets | | | Line of Business | | Country |
| | | | |
| | Nestle SA (Registered) | | | 3.2 | % | | Food, Beverage & Tobacco | | Switzerland |
| | Roche Holding AG | | | 2.7 | | | Pharmaceuticals, Biotechnology &
Life Sciences | | Switzerland |
| | Novo Nordisk A/S Class B | | | 1.9 | | | Pharmaceuticals, Biotechnology &
Life Sciences | | Denmark |
| | Novartis AG (Registered) | | | 1.8 | | | Pharmaceuticals, Biotechnology &
Life Sciences | | Switzerland |
| | Sanofi | | | 1.6 | | | Pharmaceuticals, Biotechnology &
Life Sciences | | France |
| | LVMH Moet Hennessy Louis Vuitton SE | | | 1.5 | | | Consumer Durables & Apparel | | France |
| | Schneider Electric SE | | | 1.3 | | | Capital Goods | | France |
| | Diageo plc | | | 1.1 | | | Food, Beverage & Tobacco | | United Kingdom |
| | Danone SA | | | 1.0 | | | Food, Beverage & Tobacco | | France |
| | | Deutsche Boerse AG | | | 1.0 | | | Diversified Financials | | Germany |
| 1 | | The top 10 holdings may not be representative of the Fund’s future investments. |
| 2 | | The Fund’s overall top 10 holdings differ from the table above due to the exclusion of the Goldman Sachs Financial Square Government Fund (a short-term investment fund), which represents approximately 1.2% of the Fund’s net assets as of 4/30/20. |
3
FUND BASICS
|
| FUND VS. BENCHMARK SECTOR ALLOCATIONS3 |
|
| As of April 30, 2020 |
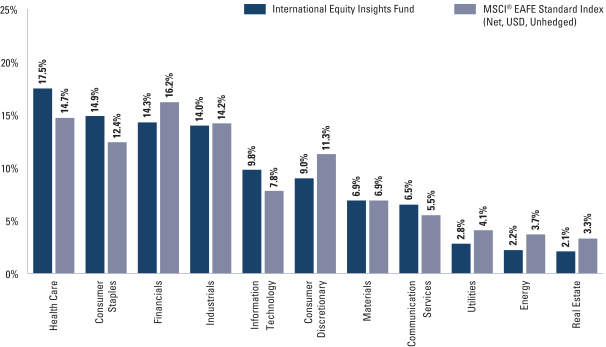
| 3 | | The Fund is actively managed and, as such, its composition may differ over time. Consequently, the Fund’s overall sector allocations may differ from percentages contained in the graph above. The graph categorizes investments using Global Industry Classification Standard (“GICS”); however, the sector classifications used by the portfolio management team may differ from GICS. The percentage shown for each investment category reflects the value of investments in that category as a percentage of market value (excluding investments in the securities lending reinvestment vehicle, if any). Investments in the securities lending reinvestment vehicle represented 1.2% of the Fund’s net assets at April 30, 2020. The graph depicts the Fund’s investments but may not represent the Fund’s market exposure due to the exclusion of certain derivatives, if any, as listed in the Additional Investment Information section of the Schedule of Investments. Percentages may not sum to 100% due to rounding. |
For more information about the Fund, please refer to www.GSAMFUNDS.com. There, you can learn more about the Fund’s investment strategies, holdings, and performance.
4
FUND BASICS
International Small Cap Insights Fund
as of April 30, 2020
| | | | | | | | | | |
| | PERFORMANCE REVIEW | |
| | | |
| | | November 1, 2019–April 30, 2020 | | Fund Total Return
(based on NAV)1 | | | MSCI® EAFE Small Cap Index
(Net, USD, Unhedged)2 | |
| | | |
| | Class A | | | -17.04 | % | | | -14.65 | % |
| | Class C | | | -17.44 | | | | -14.65 | |
| | Institutional | | | -16.89 | | | | -14.65 | |
| | Investor | | | -16.95 | | | | -14.65 | |
| | Class P | | | -16.85 | | | | -14.65 | |
| | | |
| | | Class R6 | | | -16.85 | | | | -14.65 | |
| 1 | | The net asset value (NAV) represents the net assets of the class of the Fund(ex-dividend) divided by the total number of shares of the class outstanding. The Fund’s performance assumes the reinvestment of dividends and other distributions. The Fund’s performance does not reflect the deduction of any applicable sales charges. |
| 2 | | The MSCI® EAFE Small Cap Index (Net, USD, Unhedged) is a freefloat-adjusted market capitalization index that is designed to measure developed market equity performance, excluding the U.S. and Canada. The MSCI® EAFE Small Cap Index (Net, USD, Unhedged) selects the most liquid securities across developed markets relative to their market capitalization, and targets for index inclusion 40% of the full market capitalization of the eligible small cap universe within each industry group, within each country. Its returns include net reinvested dividends but, unlike Fund returns, do not reflect the payment of sales commissions or other expenses incurred in the purchase or sale of the securities included in the MSCI® EAFE Small Cap Index (Net, USD, Unhedged). It is not possible to invest directly in an index. |
The returns set forth in the tables above represent past performance. Past performance does not guarantee future results. The Fund’s investment return and principal value will fluctuate so that an investor’s shares, when redeemed, may be worth more or less than their original cost. Current performance may be lower or higher than the performance quoted above. Please visit our web site at www.GSAMFUNDS.com to obtain the most recentmonth-end returns.Performance reflects applicable fee waivers and/or expense limitations in effect during the periods shown. In their absence, performance would be reduced. Returns do not reflect the deduction of taxes that a shareholder would pay on Fund distributions or the redemption of Fund shares.
| | | | | | | | | | |
| | TOP TEN HOLDINGS AS OF 4/30/201,2 |
| | | | |
| | | Holding | | % of Net Assets | | | Line of Business | | Country |
| | | | |
| | TIS, Inc. | | | 1.2 | % | | Software & Services | | Japan |
| | Euronext NV | | | 1.2 | | | Diversified Financials | | Netherlands |
| | Tecan Group AG (Registered) | | | 1.2 | | | Pharmaceuticals, Biotechnology &
Life Sciences | | Switzerland |
| | Gerresheimer AG | | | 1.2 | | | Pharmaceuticals, Biotechnology &
Life Sciences | | Germany |
| | VAT Group AG | | | 1.2 | | | Capital Goods | | Switzerland |
| | IG Group Holdings plc | | | 1.1 | | | Diversified Financials | | United Kingdom |
| | ASM International NV | | | 1.1 | | | Semiconductors & Semiconductor
Equipment | | Netherlands |
| | Signify NV | | | 1.1 | | | Capital Goods | | Netherlands |
| | boohoo Group plc | | | 1.1 | | | Retailing | | United Kingdom |
| | | DeNA Co. Ltd. | | | 1.0 | | | Media & Entertainment | | Japan |
| 1 | | The top 10 holdings may not be representative of the Fund’s future investments. |
| 2 | | The Fund’s overall top 10 holdings differ from the table above due to the exclusion of the Goldman Sachs Financial Square Government Fund (a short-term investment fund), which represents approximately 1.4% of the Fund’s net assets as of 4/30/20. |
5
FUND BASICS
|
| FUND VS. BENCHMARK SECTOR ALLOCATIONS3 |
|
| As of April 30, 2020 |
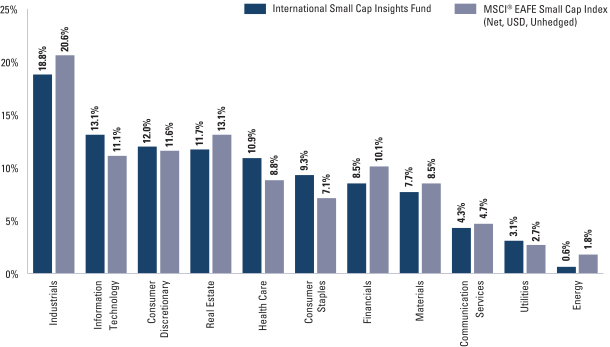
| 3 | | The Fund is actively managed and, as such, its composition may differ over time. Consequently, the Fund’s overall sector allocations may differ from percentages contained in the graph above. The graph categorizes investments using Global Industry Classification Standard (“GICS”); however, the sector classifications used by the portfolio management team may differ from GICS. The percentage shown for each investment category reflects the value of investments in that category as a percentage of market value (excluding investments in the securities lending reinvestment vehicle, if any). Investments in the securities lending reinvestment vehicle represented 1.4% of the Fund’s net assets at April 30, 2020. The graph depicts the Fund’s investments but may not represent the Fund’s market exposure due to the exclusion of certain derivatives, if any, as listed in the Additional Investment Information section of the Schedule of Investments. Percentages may not sum to 100% due to rounding. |
For more information about the Fund, please refer to www.GSAMFUNDS.com. There, you can learn more about the Fund’s investment strategies, holdings, and performance.
6
GOLDMAN SACHS EMERGING MARKETS EQUITY INSIGHTS FUND
Schedule of Investments
April 30, 2020 (Unaudited)
| | | | | | | | |
| Shares | | |
Description | | Value | |
|
| Common Stocks – 99.4% | |
| Brazil – 4.7% | |
| | 87,600 | | | AES Tiete Energia SA (Utilities)* | | $ | 233,583 | |
| | 2,958,900 | | | B3 SA – Brasil Bolsa Balcao (Diversified Financials) | | | 20,905,301 | |
| | 1,344,200 | | | BB Seguridade Participacoes SA (Insurance) | | | 6,562,921 | |
| | 33,100 | | | Cia de Saneamento de Minas Gerais-COPASA (Utilities)* | | | 292,172 | |
| | 114,600 | | | Cia de Saneamento do Parana (Utilities)* | | | 541,610 | |
| | 225,262 | | | Cia de Transmissao de Energia Eletrica Paulista (Preference) (Utilities)(a) | | | 804,877 | |
| | 628,300 | | | Cia Paranaense de Energia (Preference) (Utilities)*(a) | | | 6,285,426 | |
| | 259,000 | | | Cosan Ltd. Class A (Energy)* | | | 3,455,060 | |
| | 72,500 | | | Cyrela Brazil Realty SA Empreendimentos e Participacoes (Consumer Durables & Apparel) | | | 212,118 | |
| | 253,200 | | | Hypera SA (Pharmaceuticals, Biotechnology & Life Sciences)* | | | 1,354,026 | |
| | 727,300 | | | Itau Unibanco Holding SA (Preference) (Banks)(a) | | | 3,045,407 | |
| | 1,265,590 | | | Itausa – Investimentos Itau SA (Preference) (Banks)(a) | | | 2,094,616 | |
| | 4,190,928 | | | Petrobras Distribuidora SA (Retailing)* | | | 15,051,550 | |
| | 829,900 | | | Sao Martinho SA (Food, Beverage & Tobacco)* | | | 2,914,928 | |
| | 51,500 | | | Telefonica Brasil SA ADR (Telecommunication Services) | | | 432,600 | |
| | 144,500 | | | WEG SA (Capital Goods) | | | 1,061,316 | |
| | | | | | | | |
| | | | | | | 65,247,511 | |
| | |
| China – 40.2% | |
| | 2,375,000 | | | Agricultural Bank of China Ltd. Class H (Banks) | | | 987,957 | |
| | 585,800 | | | Alibaba Group Holding Ltd. ADR (Retailing)* | | | 118,724,086 | |
| | 3,649,000 | | | Asia Cement China Holdings Corp. (Materials) | | | 4,224,153 | |
| | 29,238,000 | | | Bank of Communications Co. Ltd. Class H (Banks) | | | 18,528,308 | |
| | 8,076,596 | | | Bank of Nanjing Co. Ltd. Class A (Banks) | | | 8,747,692 | |
| | 2,440,000 | | | China Aoyuan Group Ltd. (Real Estate) | | | 2,866,832 | |
| | 2,125,000 | | | China CITIC Bank Corp. Ltd. Class H (Banks) | | | 1,038,136 | |
| | 4,997,000 | | | China Construction Bank Corp. Class H (Banks) | | | 4,010,910 | |
| | 530,000 | | | China Maple Leaf Educational Systems Ltd. (Consumer Services) | | | 155,810 | |
| | 10,621,000 | | | China Medical System Holdings Ltd. (Pharmaceuticals, Biotechnology & Life Sciences) | | | 12,502,741 | |
| | |
|
| Common Stocks – (continued) | |
| China – (continued) | |
| | 7,194,500 | | | China Minsheng Banking Corp. Ltd. Class H (Banks) | | | 5,359,187 | |
| | 1,362,000 | | | China Mobile Ltd. (Telecommunication Services) | | | 10,949,200 | |
| | 60,000 | | | China National Software & Service Co. Ltd. Class A (Software & Services) | | | 691,054 | |
| | 3,705,400 | | | China Pacific Insurance Group Co. Ltd. Class H (Insurance) | | | 12,259,066 | |
| | 1,341,800 | | | China Railway Construction Corp. Ltd. Class A (Capital Goods) | | | 1,838,116 | |
| | 2,345,000 | | | China Railway Construction Corp. Ltd. Class H (Capital Goods) | | | 2,574,828 | |
| | 3,706,000 | | | China Resources Cement Holdings Ltd. (Materials) | | | 5,042,773 | |
| | 1,471,232 | | | China Shenhua Energy Co. Ltd. Class A (Energy) | | | 3,305,655 | |
| | 7,297,500 | | | China Shenhua Energy Co. Ltd. Class H (Energy) | | | 12,928,165 | |
| | 3,017,359 | | | China Yangtze Power Co. Ltd. Class A (Utilities) | | | 7,432,538 | |
| | 1,156,000 | | | CITIC Telecom International Holdings Ltd. (Telecommunication Services) | | | 427,761 | |
| | 399,963 | | | East Money Information Co. Ltd. Class A (Diversified Financials) | | | 1,017,906 | |
| | 190,000 | | | Far East Horizon Ltd. (Diversified Financials) | | | 153,812 | |
| | 1,056,994 | | | Fujian Sunner Development Co. Ltd. Class A (Food, Beverage & Tobacco) | | | 3,225,898 | |
| | 158,473 | | | G-bits Network Technology Xiamen Co. Ltd. Class A (Media & Entertainment) | | | 8,448,289 | |
| | 161,639 | | | Gree Electric Appliances, Inc. of Zhuhai Class A (Consumer Durables & Apparel) | | | 1,236,633 | |
| | 39,115,000 | | | Industrial & Commercial Bank of China Ltd. Class H (Banks) | | | 26,226,975 | |
| | 349,600 | | | Industrial Bank Co. Ltd. Class A (Banks) | | | 816,650 | |
| | 498,700 | | | JD.com, Inc. ADR (Retailing)* | | | 21,493,970 | |
| | 215,317 | | | Jiangsu Hengrui Medicine Co. Ltd. Class A (Pharmaceuticals, Biotechnology & Life Sciences)* | | | 2,800,307 | |
| | 667,338 | | | Jiangsu Yuyue Medical Equipment & Supply Co. Ltd. Class A (Health Care Equipment & Services) | | | 3,283,650 | |
| | 8,857,000 | | | KWG Group Holdings Ltd. (Real Estate)* | | | 13,102,113 | |
| | 5,318,000 | | | Logan Property Holdings Co. Ltd. (Real Estate) | | | 8,383,218 | |
| | 1,262,000 | | | Luye Pharma Group Ltd. (Pharmaceuticals, Biotechnology & Life Sciences)(b) | | | 612,798 | |
| | |
| | |
| The accompanying notes are an integral part of these financial statements. | | 7 |
GOLDMAN SACHS EMERGING MARKETS EQUITY INSIGHTS FUND
Schedule of Investments(continued)
April 30, 2020 (Unaudited)
| | | | | | | | |
| Shares | | |
Description | | Value | |
|
| Common Stocks – (continued) | |
| China – (continued) | |
| | 342,200 | | | Momo, Inc. ADR (Media & Entertainment) | | $ | 8,240,176 | |
| | 334,155 | | | Muyuan Foodstuff Co. Ltd. Class A (Food, Beverage & Tobacco) | | | 5,981,552 | |
| | 76,400 | | | NetEase, Inc. ADR (Media & Entertainment) | | | 26,354,944 | |
| | 195,600 | | | New Oriental Education & Technology Group, Inc. ADR (Consumer Services)* | | | 24,970,296 | |
| | 13,618,000 | | | People’s Insurance Co. Group of China Ltd. (The) Class H (Insurance) | | | 4,456,909 | |
| | 110,714 | | | Perfect World Co. Ltd. Class A (Media & Entertainment) | | | 734,693 | |
| | 22,596,000 | | | PICC Property & Casualty Co. Ltd. Class H (Insurance) | | | 21,623,158 | |
| | 14,834,000 | | | Postal Savings Bank of China Co. Ltd. Class H (Banks)(b) | | | 8,864,096 | |
| | 2,644,000 | | | Powerlong Real Estate Holdings Ltd. (Real Estate) | | | 1,614,867 | |
| | 174,120 | | | Shaanxi Coal Industry Co. Ltd. Class A (Energy) | | | 184,986 | |
| | 2,289,661 | | | Shandong Buchang Pharmaceuticals Co. Ltd. Class A (Pharmaceuticals, Biotechnology & Life Sciences) | | | 7,063,119 | |
| | 2,512,487 | | | Shanghai Pharmaceuticals Holding Co. Ltd. Class A (Health Care Equipment & Services) | | | 6,559,760 | |
| | 2,236,000 | | | Shenzhen Expressway Co. Ltd. Class H (Transportation) | | | 2,563,687 | |
| | 959,500 | | | Shimao Property Holdings Ltd. (Real Estate) | | | 3,900,249 | |
| | 1,219,500 | | | Tencent Holdings Ltd. (Media & Entertainment) | | | 64,108,430 | |
| | 3,098,000 | | | Tingyi Cayman Islands Holding Corp. (Food, Beverage & Tobacco) | | | 5,499,262 | |
| | 243,000 | | | Uni-President China Holdings Ltd. (Food, Beverage & Tobacco) | | | 243,957 | |
| | 382,700 | | | Vipshop Holdings Ltd. ADR (Retailing)* | | | 6,096,411 | |
| | 14,638,000 | | | Want Want China Holdings Ltd. (Food, Beverage & Tobacco) | | | 10,433,115 | |
| | 797,804 | | | Wuhu Sanqi Interactive Entertainment Network Technology Group Co. Ltd. Class A (Media & Entertainment) | | | 4,049,106 | |
| | 3,290,118 | | | Yanzhou Coal Mining Co. Ltd. Class A (Energy) | | | 3,841,532 | |
| | 99,533 | | | Yealink Network Technology Corp. Ltd. Class A (Technology Hardware & Equipment) | | | 1,264,055 | |
| | 1,776,800 | | | YiChang HEC ChangJiang Pharmaceutical Co. Ltd. Class H (Pharmaceuticals, Biotechnology & Life Sciences)(b) | | | 6,700,589 | |
| | |
|
| Common Stocks – (continued) | |
| China – (continued) | |
| | 752,000 | | | Zijin Mining Group Co. Ltd. Class H (Materials) | | | 307,018 | |
| | 108,100 | | | ZTO Express Cayman, Inc. ADR (Transportation) | | | 3,217,056 | |
| | | | | | | | |
| | | | | | | 554,270,210 | |
| | |
| Greece – 0.1% | |
| | 66,518 | | | Hellenic Telecommunications Organization SA (Telecommunication Services) | | | 878,803 | |
| | |
| Hong Kong – 0.1% | |
| | 199,000 | | | Nine Dragons Paper Holdings Ltd. (Materials) | | | 190,388 | |
| | 983,000 | | | WH Group Ltd. (Food, Beverage & Tobacco)(b) | | | 937,539 | |
| | | | | | | | |
| | | | | | | 1,127,927 | |
| | |
| Hungary – 0.2% | |
| | 85,382 | | | OTP Bank Nyrt. (Banks) | | | 2,528,673 | |
| | |
| India – 10.1% | |
| | 1,486,234 | | | Adani Ports & Special Economic Zone Ltd. (Transportation) | | | 5,706,459 | |
| | 9,231 | | | Ajanta Pharma Ltd. (Pharmaceuticals, Biotechnology & Life Sciences) | | | 181,046 | |
| | 77,877 | | | Bajaj Holdings & Investment Ltd. (Diversified Financials) | | | 2,098,081 | |
| | 403,704 | | | Bharti Infratel Ltd. (Telecommunication Services) | | | 934,018 | |
| | 14,913 | | | Dr Lal PathLabs Ltd. (Health Care Equipment & Services)(b) | | | 310,123 | |
| | 278,132 | | | Dr Reddy’s Laboratories Ltd. ADR (Pharmaceuticals, Biotechnology & Life Sciences) | | | 14,237,577 | |
| | 22,422 | | | Godfrey Phillips India Ltd. (Food, Beverage & Tobacco) | | | 297,588 | |
| | 163,874 | | | Gujarat State Petronet Ltd. (Utilities) | | | 452,266 | |
| | 1,308,212 | | | HCL Technologies Ltd. (Software & Services) | | | 9,382,364 | |
| | 774,292 | | | Hindustan Unilever Ltd. (Household & Personal Products) | | | 22,420,037 | |
| | 36,550 | | | ICICI Bank Ltd. ADR (Banks) | | | 356,728 | |
| | 10,359 | | | ICICI Lombard General Insurance Co. Ltd. (Insurance)(b) | | | 177,080 | |
| | 275,353 | | | Indraprastha Gas Ltd. (Utilities) | | | 1,744,178 | |
| | 2,726,617 | | | Infosys Ltd. ADR (Software & Services) | | | 25,166,675 | |
| | 51,326 | | | Ipca Laboratories Ltd. (Pharmaceuticals, Biotechnology & Life Sciences) | | | 1,094,314 | |
| | 57,497 | | | Nestle India Ltd. (Food, Beverage & Tobacco) | | | 13,638,356 | |
| | 1,997,055 | | | Petronet LNG Ltd. (Energy) | | | 6,433,771 | |
| | |
| | |
| 8 | | The accompanying notes are an integral part of these financial statements. |
GOLDMAN SACHS EMERGING MARKETS EQUITY INSIGHTS FUND
| | | | | | | | |
| Shares | | |
Description | | Value | |
|
| Common Stocks – (continued) | |
| India – (continued) | |
| | 5,834 | | | Pfizer Ltd. (Pharmaceuticals, Biotechnology & Life Sciences) | | $ | 378,634 | |
| | 7,898,898 | | | REC Ltd. (Diversified Financials) | | | 9,966,757 | |
| | 71,311 | | | Reliance Industries Ltd. (Energy) | | | 1,386,501 | |
| | 32,734 | | | Strides Pharma Science Ltd. (Pharmaceuticals, Biotechnology & Life Sciences) | | | 189,598 | |
| | 232,904 | | | Torrent Pharmaceuticals Ltd. (Pharmaceuticals, Biotechnology & Life Sciences) | | | 7,234,562 | |
| | 1,441,309 | | | Torrent Power Ltd. (Utilities) | | | 6,327,138 | |
| | 2,077,916 | | | Wipro Ltd. (Software & Services) | | | 5,275,514 | |
| | 78,300 | | | WNS Holdings Ltd. ADR (Software & Services)* | | | 3,824,955 | |
| | | | | | | | |
| | | | | | | 139,214,320 | |
| | |
| Indonesia – 3.9% | |
| | 4,288,300 | | | Bank Central Asia Tbk. PT (Banks) | | | 7,428,151 | |
| | 10,514,800 | | | Bank Mandiri Persero Tbk. PT (Banks) | | | 3,125,644 | |
| | 93,956,300 | | | Bank Rakyat Indonesia Persero Tbk. PT (Banks) | | | 17,089,477 | |
| | 3,561,200 | | | Indofood CBP Sukses Makmur Tbk. PT (Food, Beverage & Tobacco) | | | 2,356,276 | |
| | 7,247,300 | | | Indofood Sukses Makmur Tbk. PT (Food, Beverage & Tobacco) | | | 3,162,097 | |
| | 89,363,500 | | | Telekomunikasi Indonesia Persero Tbk. PT (Telecommunication Services) | | | 20,549,322 | |
| | | | | | | | |
| | | | | | | 53,710,967 | |
| | |
| Mexico – 1.5% | |
| | 236,985 | | | America Movil SAB de CV Class L ADR (Telecommunication Services) | | | 2,853,299 | |
| | 11,505,676 | | | Kimberly-Clark de Mexico SAB de CV Class A (Household & Personal Products) | | | 16,250,496 | |
| | 708,600 | | | Wal-Mart de Mexico SAB de CV (Food & Staples Retailing) | | | 1,704,392 | |
| | | | | | | | |
| | | | | | | 20,808,187 | |
| | |
| Philippines – 0.2% | �� |
| | 703,300 | | | First Gen Corp. (Utilities) | | | 263,443 | |
| | 62,630 | | | Globe Telecom, Inc. (Telecommunication Services) | | | 2,716,909 | |
| | | | | | | | |
| | | | | | | 2,980,352 | |
| | |
| Poland – 1.7% | |
| | 149,940 | | | Asseco Poland SA (Software & Services) | | | 2,423,009 | |
| | 202,558 | | | CD Projekt SA (Media & Entertainment) | | | 17,733,669 | |
| | 40,528 | | | Dino Polska SA (Food & Staples Retailing)*(b) | | | 1,713,921 | |
| | |
|
| Common Stocks – (continued) | |
| Poland – (continued) | |
| | 217,146 | | | Eurocash SA (Food & Staples Retailing) | | | 1,126,734 | |
| | | | | | | | |
| | | | | | | 22,997,333 | |
| | |
| Qatar – 0.2% | |
| | 1,223,207 | | | Commercial Bank PSQC (The) (Banks) | | | 1,346,827 | |
| | 45,413 | | | Masraf Al Rayan QSC (Banks) | | | 47,523 | |
| | 251,429 | | | Qatar National Bank QPSC (Banks) | | | 1,185,900 | |
| | | | | | | | |
| | | | | | | 2,580,250 | |
| | |
| Russia – 4.4% | |
| | 69,450,000 | | | Inter RAO UES PJSC (Utilities) | | | 4,652,513 | |
| | 168,643 | | | LUKOIL PJSC ADR (Energy) | | | 10,889,278 | |
| | 70,600 | | | MMC Norilsk Nickel PJSC ADR (Materials) | | | 1,930,204 | |
| | 792,525 | | | Mobile TeleSystems PJSC ADR (Telecommunication Services) | | | 6,791,939 | |
| | 6,913,910 | | | Moscow Exchange MICEX-RTS PJSC (Diversified Financials) | | | 11,175,741 | |
| | 109,117 | | | Polyus PJSC (Materials) | | | 17,732,562 | |
| | 2,863,400 | | | Sberbank of Russia PJSC (Banks) | | | 7,545,733 | |
| | | | | | | | |
| | | | | | | 60,717,970 | |
| | |
| Saudi Arabia – 1.1% | |
| | 58,689 | | | Abdullah Al Othaim Markets Co. (Food & Staples Retailing) | | | 1,556,201 | |
| | 457,786 | | | Bank AlBilad (Banks) | | | 2,759,224 | |
| | 1,911,065 | | | Riyad Bank (Banks) | | | 8,639,551 | |
| | 383,127 | | | Saudi Electricity Co. (Utilities) | | | 1,734,790 | |
| | 2,195 | | | Saudia Dairy & Foodstuff Co. (Food, Beverage & Tobacco) | | | 87,845 | |
| | 28,768 | | | Savola Group (The) (Food, Beverage & Tobacco) | | | 309,777 | |
| | | | | | | | |
| | | | | | | 15,087,388 | |
| | |
| South Africa – 2.6% | |
| | 33,204 | | | African Rainbow Minerals Ltd. (Materials) | | | 243,028 | |
| | 317,098 | | | Anglo American Platinum Ltd. (Materials) | | | 16,641,311 | |
| | 774,398 | | | Clicks Group Ltd. (Food & Staples Retailing) | | | 9,638,875 | |
| | 48,497 | | | Kumba Iron Ore Ltd. (Materials) | | | 912,749 | |
| | 398,512 | | | Liberty Holdings Ltd. (Insurance) | | | 1,511,218 | |
| | 19,860 | | | Naspers Ltd. Class N (Retailing) | | | 3,091,180 | |
| | 3,138,551 | | | Netcare Ltd. (Health Care Equipment & Services) | | | 2,624,560 | |
| | 1,421,355 | | | Old Mutual Ltd. (Insurance)(c) | | | 1,012,342 | |
| | | | | | | | |
| | | | | | | 35,675,263 | |
| | |
| South Korea – 11.3% | |
| | 48,838 | | | AfreecaTV Co. Ltd. (Media & Entertainment) | | | 2,422,818 | |
| | 49,986 | | | Celltrion, Inc. (Pharmaceuticals, Biotechnology & Life Sciences)* | | | 8,639,387 | |
| | |
| | |
| The accompanying notes are an integral part of these financial statements. | | 9 |
GOLDMAN SACHS EMERGING MARKETS EQUITY INSIGHTS FUND
Schedule of Investments(continued)
April 30, 2020 (Unaudited)
| | | | | | | | |
| Shares | | |
Description | | Value | |
|
| Common Stocks – (continued) | |
| South Korea – (continued) | |
| | 37,135 | | | Chongkundang Holdings Corp. (Pharmaceuticals, Biotechnology & Life Sciences) | | $ | 3,481,306 | |
| | 9,361 | | | CJ Logistics Corp. (Transportation)* | | | 1,136,870 | |
| | 55,952 | | | Com2uSCorp (Media & Entertainment) | | | 4,927,147 | |
| | 177,111 | | | DB HiTek Co. Ltd. (Semiconductors & Semiconductor Equipment) | | | 3,893,893 | |
| | 15,733 | | | DongKook Pharmaceutical Co. Ltd. (Pharmaceuticals, Biotechnology & Life Sciences) | | | 1,222,619 | |
| | 52,125 | | | Hanwha Aerospace Co. Ltd. (Capital Goods)* | | | 1,148,027 | |
| | 1,669 | | | Hugel, Inc. (Pharmaceuticals, Biotechnology & Life Sciences)* | | | 523,648 | |
| | 54,471 | | | Huons Global Co. Ltd. (Pharmaceuticals, Biotechnology & Life Sciences) | | | 1,412,512 | |
| | 11,355 | | | i-SENS, Inc. (Health Care Equipment & Services) | | | 219,763 | |
| | 27,010 | | | KB Financial Group, Inc. (Banks) | | | 772,792 | |
| | 10,884 | | | Kginicis Co. Ltd. (Software & Services) | | | 196,733 | |
| | 379,560 | | | Kia Motors Corp. (Automobiles & Components) | | | 9,270,641 | |
| | 144,613 | | | Korea Investment Holdings Co. Ltd. (Diversified Financials) | | | 5,987,171 | |
| | 129,552 | | | MegaStudyEdu Co. Ltd. (Consumer Services) | | | 4,783,777 | |
| | 32,057 | | | Mirae Asset Daewoo Co. Ltd. (Diversified Financials) | | | 147,783 | |
| | 164,196 | | | NAVER Corp. (Media & Entertainment) | | | 26,621,191 | |
| | 3,754 | | | Samsung Biologics Co. Ltd. (Pharmaceuticals, Biotechnology & Life Sciences)*(b) | | | 1,793,221 | |
| | 1,433,455 | | | Samsung Electronics Co. Ltd. (Technology Hardware & Equipment) | | | 58,940,177 | |
| | 240,463 | | | Samsung Electronics Co. Ltd. (Preference) (Technology Hardware & Equipment)(a) | | | 8,335,799 | |
| | 167,913 | | | Samsung Securities Co. Ltd. (Diversified Financials) | | | 4,160,607 | |
| | 40,625 | | | Seegene, Inc. (Pharmaceuticals, Biotechnology & Life Sciences)(c) | | | 3,059,787 | |
| | 28,365 | | | Soulbrain Co. Ltd. (Materials) | | | 1,707,222 | |
| | 15,036 | | | UniTest, Inc. (Semiconductors & Semiconductor Equipment) | | | 159,058 | |
| | 52,803 | | | Value Added Technology Co. Ltd. (Health Care Equipment & Services) | | | 1,103,591 | |
| | 861 | | | Yuhan Corp. (Pharmaceuticals, Biotechnology & Life Sciences) | | | 33,450 | |
| | | | | | | | |
| | | | | | | 156,100,990 | |
| | |
|
| Common Stocks – (continued) | |
| Taiwan – 14.8% | |
| | 13,117,000 | | | Asia Cement Corp. (Materials) | | | 19,270,192 | |
| | 344,000 | | | Bioteque Corp. (Health Care Equipment & Services) | | | 1,306,684 | |
| | 702,000 | | | Cheng Loong Corp. (Materials) | | | 499,481 | |
| | 157,000 | | | Chicony Electronics Co. Ltd. (Technology Hardware & Equipment) | | | 442,242 | |
| | 74,000 | | | Chicony Power Technology Co. Ltd. (Capital Goods) | | | 144,593 | |
| | 2,956,000 | | | ChipMOS Technologies, Inc. (Semiconductors & Semiconductor Equipment) | | | 3,021,510 | |
| | 294,000 | | | Dynapack International Technology Corp. (Technology Hardware & Equipment) | | | 699,931 | |
| | 817,000 | | | Fubon Financial Holding Co. Ltd. (Insurance) | | | 1,155,221 | |
| | 1,073,000 | | | Great Wall Enterprise Co. Ltd. (Food, Beverage & Tobacco) | | | 1,484,566 | |
| | 164,000 | | | International Games System Co. Ltd. (Media & Entertainment) | | | 3,054,026 | |
| | 4,113,000 | | | King Yuan Electronics Co. Ltd. (Semiconductors & Semiconductor Equipment)* | | | 4,930,178 | |
| | 164,000 | | | King’s Town Bank Co. Ltd. (Banks) | | | 175,300 | |
| | 4,764,000 | | | Lite-On Technology Corp. (Technology Hardware & Equipment) | | | 7,403,014 | |
| | 835,000 | | | Quanta Computer, Inc. (Technology Hardware & Equipment) | | | 1,804,159 | |
| | 1,572,000 | | | Realtek Semiconductor Corp. (Semiconductors & Semiconductor Equipment)* | | | 13,461,546 | |
| | 873,000 | | | Simplo Technology Co. Ltd. (Technology Hardware & Equipment) | | | 9,066,620 | |
| | 690,000 | | | Sitronix Technology Corp. (Semiconductors & Semiconductor Equipment) | | | 3,354,745 | |
| | 1,859,000 | | | Standard Foods Corp. (Food, Beverage & Tobacco) | | | 4,189,897 | |
| | 528,000 | | | Synnex Technology International Corp. (Technology Hardware & Equipment) | | | 704,665 | |
| | 1,342,000 | | | Taiflex Scientific Co. Ltd. (Technology Hardware & Equipment)* | | | 2,085,880 | |
| | 1,654,600 | | | Taiwan Semiconductor Manufacturing Co. Ltd. ADR (Semiconductors & Semiconductor Equipment) | | | 87,908,898 | |
| | 1,222,000 | | | Taiwan Surface Mounting Technology Corp. (Semiconductors & Semiconductor Equipment) | | | 3,665,518 | |
| | |
| | |
| 10 | | The accompanying notes are an integral part of these financial statements. |
GOLDMAN SACHS EMERGING MARKETS EQUITY INSIGHTS FUND
| | | | | | | | |
| Shares | | |
Description | | Value | |
|
| Common Stocks – (continued) | |
| Taiwan – (continued) | |
| | 43,000 | | | Thinking Electronic Industrial Co. Ltd. (Technology Hardware & Equipment) | | $ | 120,845 | |
| | 21,000 | | | Topco Scientific Co. Ltd. (Semiconductors & Semiconductor Equipment) | | | 72,192 | |
| | 2,409,000 | | | Tripod Technology Corp. (Technology Hardware & Equipment) | | | 8,511,959 | |
| | 949,000 | | | United Integrated Services Co. Ltd. (Capital Goods) | | | 5,991,068 | |
| | 16,358,000 | | | United Microelectronics Corp. (Semiconductors & Semiconductor Equipment) | | | 8,463,058 | |
| | 35,000 | | | Win Semiconductors Corp. (Semiconductors & Semiconductor Equipment) | | | 312,885 | |
| | 11,713,000 | | | Wistron Corp. (Technology Hardware & Equipment) | | | 10,983,777 | |
| | 227,000 | | | Youngtek Electronics Corp. (Semiconductors & Semiconductor Equipment) | | | 383,815 | |
| | | | | | | | |
| | | | | | | 204,668,465 | |
| | |
| Thailand – 1.7% | |
| | 1,668,200 | | | Advanced Info Service PCL (Telecommunication Services) | | | 10,160,831 | |
| | 543,900 | | | Charoen Pokphand Foods PCL (Food, Beverage & Tobacco) | | | 450,547 | |
| | 726,700 | | | Electricity Generating PCL (Utilities) | | | 6,357,052 | |
| | 443,800 | | | Kiatnakin Bank PCL (Banks) | | | 571,943 | |
| | 269,800 | | | SPCG PCL (Utilities) | | | 144,032 | |
| | 5,132,700 | | | Thanachart Capital PCL (Banks) | | | 5,789,620 | |
| | 381,100 | | | TTW PCL (Utilities) | | | 157,512 | |
| | | | | | | | |
| | | | | | | 23,631,537 | |
| | |
| Turkey – 0.4% | |
| | 363,374 | | | BIM Birlesik Magazalar A/S (Food & Staples Retailing) | | | 2,877,566 | |
| | 367,460 | | | Coca-Cola Icecek A/S (Food, Beverage & Tobacco) | | | 1,943,965 | |
| | 41,062 | | | Enerjisa Enerji A/S (Utilities)(b) | | | 45,236 | |
| | 691,646 | | | Enka Insaat ve Sanayi A/S (Capital Goods) | | | 598,678 | |
| | | | | | | | |
| | | | | | | 5,465,445 | |
| | |
| United Arab Emirates – 0.1% | |
| | 150,395 | | | Abu Dhabi Islamic Bank PJSC (Banks) | | | 146,190 | |
| | 483,002 | | | Emaar Properties PJSC (Real Estate) | | | 354,219 | |
| | 530,653 | | | Emirates NBD Bank PJSC (Banks) | | | 1,232,902 | |
| | | | | | | | |
| | | | | | | 1,733,311 | |
| | |
|
| Common Stocks – (continued) | |
| United States – 0.1% | |
| | 263,500 | | | JBS SA (Food, Beverage & Tobacco) | | | 1,155,196 | |
| | |
| | TOTAL COMMON STOCKS | |
| | (Cost $1,302,045,937) | | $ | 1,370,580,098 | |
| | |
| | | | | | | | |
| Units | | | Description | | Value | |
| |
| Right*(d) – 0.0% | | | |
| Taiwan – 0.0% | | | |
| | 30,639 | | | Simplo Technology Co. Ltd. (Technology Hardware & Equipment) | | $ | — | |
| | (Cost $0) | | | | |
| | |
| TOTAL INVESTMENTS BEFORE SECURITIES LENDING
REINVESTMENT VEHICLE |
|
| | (Cost $1,302,045,937) | | $ | 1,370,580,098 | |
| | |
| | | | | | | | |
| Shares | | Dividend
Rate | | | Value | |
|
| Securities Lending Reinvestment Vehicle(e) – 0.2% | |
Goldman Sachs Financial Square Government Fund – Institutional Shares | |
| 2,348,900 | | | 0.233 | % | | $ | 2,348,900 | |
| (Cost $2,348,900) | | | | | |
| |
| TOTAL INVESTMENTS – 99.6% | |
| (Cost $1,304,394,837) | | | $ | 1,372,928,998 | |
| |
OTHER ASSETS IN EXCESS OF LIABILITIES – 0.4% | | | | 4,900,317 | |
| |
| NET ASSETS – 100.0% | | | $ | 1,377,829,315 | |
| |
| | |
|
| The percentage shown for each investment category reflects the value of investments in that category as a percentage of net assets. |
| |
* | | Non-income producing security. |
| |
(a) | | Preference Shares are a special type of equity investment that shares in the earnings of the company, has limited voting rights, and receives a greater dividend than applicable Common Shares. |
| |
(b) | | Exempt from registration under Rule 144A of the Securities Act of 1933. |
| |
(c) | | All or a portion of security is on loan. |
| |
(d) | | Significant unobservable inputs were used in the valuation of this portfolio security; i.e. Level 3. |
| |
(e) | | Represents an Affiliated Issuer. |
| | |
|
Investment Abbreviation: |
ADR | | —American Depositary Receipt |
|
| | |
| The accompanying notes are an integral part of these financial statements. | | 11 |
GOLDMAN SACHS INTERNATIONAL EQUITY INSIGHTS FUND
Schedule of Investments
April 30, 2020 (Unaudited)
| | | | | | | | |
| Shares | | |
Description | | Value | |
|
| Common Stocks – 98.6% | |
| Australia – 8.6% | |
| | 378,666 | | | ASX Ltd. (Diversified Financials) | | $ | 19,965,353 | |
| | 3,150,347 | | | Aurizon Holdings Ltd. (Transportation) | | | 9,570,291 | |
| | 2,284,907 | | | Beach Energy Ltd. (Energy) | | | 2,227,214 | |
| | 438,043 | | | BHP Group Ltd. (Materials) | | | 8,942,346 | |
| | 1,126,582 | | | BHP Group plc (Materials) | | | 18,909,654 | |
| | 434,616 | | | Brambles Ltd. (Commercial & Professional Services) | | | 3,106,446 | |
| | 776,510 | | | Coca-Cola Amatil Ltd. (Food, Beverage & Tobacco) | | | 4,323,293 | |
| | 344,093 | | | Commonwealth Bank of Australia (Banks) | | | 13,900,150 | |
| | 49,560 | | | CSL Ltd. (Pharmaceuticals, Biotechnology & Life Sciences) | | | 9,878,665 | |
| | 1,716,219 | | | Evolution Mining Ltd. (Materials) | | | 5,588,935 | |
| | 1,762,302 | | | Fortescue Metals Group Ltd. (Materials) | | | 13,467,953 | |
| | 603,436 | | | Genworth Mortgage Insurance Australia Ltd. (Banks) | | | 834,224 | |
| | 1,411,532 | | | Goodman Group (REIT) | | | 12,022,350 | |
| | 1,465,135 | | | Harvey Norman Holdings Ltd. (Retailing)(a) | | | 2,628,771 | |
| | 189,692 | | | IGO Ltd. (Materials) | | | 575,464 | |
| | 196,344 | | | Magellan Financial Group Ltd. (Diversified Financials) | | | 6,431,570 | |
| | 1,506,447 | | | QBE Insurance Group Ltd. (Insurance) | | | 8,157,197 | |
| | 1,877,696 | | | Regis Resources Ltd. (Materials) | | | 5,369,028 | |
| | 281,203 | | | Rio Tinto Ltd. (Materials) | | | 15,848,935 | |
| | 208,251 | | | Rio Tinto plc ADR (Materials) | | | 9,619,114 | |
| | 1,667,707 | | | Santos Ltd. (Energy) | | | 5,302,973 | |
| | 330,602 | | | Sonic Healthcare Ltd. (Health Care Equipment & Services) | | | 5,838,513 | |
| | 282,957 | | | Stockland (REIT) | | | 525,425 | |
| | 772,378 | | | Wesfarmers Ltd. (Retailing) | | | 18,760,641 | |
| | 306,546 | | | Westgold Resources Ltd. (Materials)* | | | 402,718 | |
| | | | | | | | |
| | | | | | | 202,197,223 | |
| | |
| Belgium – 0.9% | |
| | 10,162 | | | Colruyt SA (Food & Staples Retailing) | | | 609,025 | |
| | 9,439 | | | D’ieteren SA/NV (Retailing) | | | 473,030 | |
| | 32,442 | | | Galapagos NV (Pharmaceuticals, Biotechnology & Life Sciences)* | | | 7,167,324 | |
| | 3,197 | | | Groupe Bruxelles Lambert SA (Diversified Financials)* | | | 255,747 | |
| | 129,013 | | | UCB SA (Pharmaceuticals, Biotechnology & Life Sciences)* | | | 11,822,625 | |
| | | | | | | | |
| | | | | | | 20,327,751 | |
| | |
| Cambodia – 0.0% | |
| | 970,000 | | | NagaCorp Ltd. (Consumer Services) | | | 1,144,835 | |
| | |
| China – 0.8% | |
| | 133,000 | | | China Mengniu Dairy Co. Ltd. (Food, Beverage & Tobacco)* | | | 470,968 | |
| | |
|
| Common Stocks – (continued) | |
| China – (continued) | |
| | 542,700 | | | ENN Energy Holdings Ltd. (Utilities) | | | 6,117,566 | |
| | 4,523,500 | | | Fosun International Ltd. (Capital Goods) | | | 5,679,106 | |
| | 2,680,000 | | | Tingyi Cayman Islands Holding Corp. (Food, Beverage & Tobacco) | | | 4,757,269 | |
| | 766,000 | | | Towngas China Co. Ltd. (Utilities)* | | | 385,051 | |
| | 1,393,000 | | | Uni-President China Holdings Ltd. (Food, Beverage & Tobacco) | | | 1,398,486 | |
| | | | | | | | |
| | | | | | | 18,808,446 | |
| | |
| Denmark – 2.6% | |
| | 715,820 | | | Novo Nordisk A/S Class B (Pharmaceuticals, Biotechnology & Life Sciences) | | | 45,662,177 | |
| | 35,630 | | | Novozymes A/S Class B (Materials) | | | 1,747,888 | |
| | 164,137 | | | Vestas Wind Systems A/S (Capital Goods) | | | 14,094,964 | |
| | | | | | | | |
| | | | | | | 61,505,029 | |
| | |
| Finland – 0.7% | |
| | 64,776 | | | Fortum OYJ (Utilities)(a) | | | 1,073,349 | |
| | 28,120 | | | Kesko OYJ Class B (Food & Staples Retailing) | | | 458,190 | |
| | 268,097 | | | Neste OYJ (Energy) | | | 9,467,992 | |
| | 1,620,294 | | | Nokia OYJ (Technology Hardware & Equipment) | | | 5,841,059 | |
| | | | | | | | |
| | | | | | | 16,840,590 | |
| | |
| France – 11.4% | |
| | 79,214 | | | Airbus SE (Capital Goods)* | | | 5,015,716 | |
| | 426,753 | | | BNP Paribas SA (Banks) | | | 13,407,019 | |
| | 102,658 | | | Bouygues SA (Capital Goods)* | | | 3,158,601 | |
| | 193,764 | | | Capgemini SE (Software & Services) | | | 18,215,908 | |
| | 140,088 | | | Carrefour SA (Food & Staples Retailing) | | | 2,080,481 | |
| | 4,643 | | | Christian Dior SE (Consumer Durables & Apparel) | | | 1,806,608 | |
| | 18,622 | | | Cie Generale des Etablissements Michelin SCA (Automobiles & Components) | | | 1,799,279 | |
| | 345,419 | | | Danone SA (Food, Beverage & Tobacco) | | | 24,074,699 | |
| | 114,537 | | | Eiffage SA (Capital Goods) | | | 9,360,171 | |
| | 16,082 | | | Gaztransport Et Technigaz SA (Energy) | | | 1,165,898 | |
| | 25,987 | | | Hermes International (Consumer Durables & Apparel) | | | 18,998,332 | |
| | 288,440 | | | Legrand SA (Capital Goods) | | | 19,337,784 | |
| | 93,701 | | | LVMH Moet Hennessy Louis Vuitton SE (Consumer Durables & Apparel) | | | 36,224,147 | |
| | 97,865 | | | Peugeot SA (Automobiles & Components) | | | 1,387,300 | |
| | 229,190 | | | Publicis Groupe SA (Media & Entertainment) | | | 6,765,454 | |
| | |
| | |
| 12 | | The accompanying notes are an integral part of these financial statements. |
GOLDMAN SACHS INTERNATIONAL EQUITY INSIGHTS FUND
| | | | | | | | |
| Shares | | |
Description | | Value | |
|
| Common Stocks – (continued) | |
| France – (continued) | |
| | 54,984 | | | Safran SA (Capital Goods) | | $ | 5,111,925 | |
| | 381,520 | | | Sanofi (Pharmaceuticals, Biotechnology & Life Sciences) | | | 37,264,495 | |
| | 52,234 | | | Sartorius Stedim Biotech (Pharmaceuticals, Biotechnology & Life Sciences) | | | 12,524,315 | |
| | 327,730 | | | Schneider Electric SE (Capital Goods)* | | | 30,286,317 | |
| | 325,423 | | | SCOR SE (Insurance) | | | 9,168,696 | |
| | 2,107 | | | SEB SA (Consumer Durables & Apparel) | | | 252,688 | |
| | 9,404 | | | Sodexo SA (Consumer Services) | | | 751,808 | |
| | 19,971 | | | TOTAL SA (Energy) | | | 708,819 | |
| | 144,259 | | | Valeo SA (Automobiles & Components) | | | 3,306,836 | |
| | 365,409 | | | Vivendi SA (Media & Entertainment) | | | 7,897,643 | |
| | | | | | | | |
| | | | | | | 270,070,939 | |
| | |
| Germany – 7.3% | |
| | 95,242 | | | 1&1 Drillisch AG (Telecommunication Services) | | | 2,216,111 | |
| | 9,860 | | | Aurubis AG (Materials) | | | 511,148 | |
| | 414,120 | | | BASF SE (Materials) | | | 21,193,217 | |
| | 6,873 | | | Bechtle AG (Software & Services) | | | 993,957 | |
| | 26,886 | | | Beiersdorf AG (Household & Personal Products) | | | 2,813,040 | |
| | 45,519 | | | CANCOM SE (Software & Services) | | | 2,317,415 | |
| | 150,943 | | | Deutsche Boerse AG (Diversified Financials) | | | 23,401,975 | |
| | 758,794 | | | Deutsche Post AG (Registered) (Transportation) | | | 22,541,642 | |
| | 692,362 | | | Deutsche Telekom AG (Registered) (Telecommunication Services) | | | 10,122,080 | |
| | 368,504 | | | Evonik Industries AG (Materials) | | | 9,065,360 | |
| | 92,397 | | | Freenet AG (Telecommunication Services) | | | 1,752,835 | |
| | 97,201 | | | Fresenius Medical Care AG & Co. KGaA (Health Care Equipment & Services) | | | 7,617,700 | |
| | 40,213 | | | Gerresheimer AG (Pharmaceuticals, Biotechnology & Life Sciences) | | | 3,198,113 | |
| | 30,856 | | | HelloFresh SE (Retailing)* | | | 1,099,807 | |
| | 3,940 | | | Henkel AG & Co. KGaA (Household & Personal Products) | | | 307,136 | |
| | 191,466 | | | Henkel AG & Co. KGaA (Preference) (Household & Personal Products)(b) | | | 16,999,609 | |
| | 89,109 | | | Nemetschek SE (Software & Services) | | | 5,606,286 | |
| | 488,486 | | | Schaeffler AG (Preference) (Automobiles & Components)(b) | | | 3,298,469 | |
| | 209,994 | | | Siemens AG (Registered) (Capital Goods) | | | 19,378,910 | |
| | 75,682 | | | Siltronic AG (Semiconductors & Semiconductor Equipment) | | | 6,479,136 | |
| | 116,570 | | | Software AG (Software & Services) | | | 4,139,270 | |
| | 17,390 | | | Symrise AG (Materials) | | | 1,761,775 | |
| | 30,801 | | | Talanx AG (Insurance) | | | 1,093,832 | |
| | |
|
| Common Stocks – (continued) | |
| Germany – (continued) | |
| | 48,318 | | | United Internet AG (Registered) (Telecommunication Services) | | | 1,662,553 | |
| | 2,086 | | | Volkswagen AG (Automobiles & Components) | | | 308,402 | |
| | 19,568 | | | Volkswagen AG (Preference) (Automobiles & Components)(b) | | | 2,722,521 | |
| | | | | | | | |
| | | | | | | 172,602,299 | |
| | |
| Hong Kong – 1.3% | |
| | 115,000 | | | CLP Holdings Ltd. (Utilities) | | | 1,230,974 | |
| | 467,000 | | | Hang Lung Properties Ltd. (Real Estate) | | | 999,010 | |
| | 369,600 | | | Hong Kong Exchanges & Clearing Ltd. (Diversified Financials) | | | 11,850,176 | |
| | 192,000 | | | Link REIT (REIT) | | | 1,711,536 | |
| | 41,000 | | | Power Assets Holdings Ltd. (Utilities) | | | 274,711 | |
| | 347,000 | | | Sun Hung Kai Properties Ltd. (Real Estate) | | | 4,744,819 | |
| | 7,738,000 | | | WH Group Ltd. (Food, Beverage & Tobacco)(c) | | | 7,380,143 | |
| | 1,204,000 | | | Xinyi Glass Holdings Ltd. (Automobiles & Components) | | | 1,394,421 | |
| | 531,000 | | | Yue Yuen Industrial Holdings Ltd. (Consumer Durables & Apparel) | | | 847,029 | |
| | | | | | | | |
| | | | | | | 30,432,819 | |
| | |
| Ireland – 0.1% | |
| | 321,069 | | | Greencore Group plc (Food, Beverage & Tobacco) | | | 735,335 | |
| | 26,799 | | | Smurfit Kappa Group plc (Materials) | | | 839,512 | |
| | | | | | | | |
| | | | | | | 1,574,847 | |
| | |
| Israel – 0.1% | |
| | 216,088 | | | Plus500 Ltd. (Diversified Financials) | | | 3,386,811 | |
| | |
| Italy – 3.6% | |
| | 5,794,723 | | | A2A SpA (Utilities) | | | 7,899,418 | |
| | 323,747 | | | Azimut Holding SpA (Diversified Financials) | | | 5,517,206 | |
| | 249,815 | | | Banca Generali SpA (Diversified Financials) | | | 6,210,533 | |
| | 13,661 | | | Buzzi Unicem SpA (Materials) | | | 268,015 | |
| | 35,862 | | | DiaSorin SpA (Health Care Equipment & Services) | | | 6,115,253 | |
| | 258,081 | | | Eni SpA (Energy) | | | 2,458,566 | |
| | 63,268 | | | Ferrari NV (Automobiles & Components) | | | 9,888,497 | |
| | 1,717,801 | | | Hera SpA (Utilities) | | | 6,358,860 | |
| | 12,139,099 | | | Intesa Sanpaolo SpA (Banks) | | | 18,955,252 | |
| | 306,675 | | | Iren SpA (Utilities) | | | 756,221 | |
| | 273,604 | | | Italgas SpA (Utilities) | | | 1,532,955 | |
| | 1,305,858 | | | Mediobanca Banca di Credito Finanziario SpA (Banks) | | | 7,591,619 | |
| | |
| | |
| The accompanying notes are an integral part of these financial statements. | | 13 |
GOLDMAN SACHS INTERNATIONAL EQUITY INSIGHTS FUND
Schedule of Investments(continued)
April 30, 2020 (Unaudited)
| | | | | | | | |
| Shares | | |
Description | | Value | |
|
| Common Stocks – (continued) | |
| Italy – (continued) | |
| | 784,236 | | | Poste Italiane SpA (Insurance)(c) | | $ | 6,671,418 | |
| | 213,995 | | | Prysmian SpA (Capital Goods) | | | 4,037,660 | |
| | 7,000 | | | Reply SpA (Software & Services) | | | 490,027 | |
| | | | | | | | |
| | | | | | | 84,751,500 | |
| | |
| Japan – 23.4% | |
| | 234,200 | | | AEON Financial Service Co. Ltd. (Diversified Financials) | | | 2,435,506 | |
| | 142,300 | | | Ajinomoto Co., Inc. (Food, Beverage & Tobacco) | | | 2,534,474 | |
| | 1,356,700 | | | Astellas Pharma, Inc. (Pharmaceuticals, Biotechnology & Life Sciences) | | | 22,438,666 | |
| | 251,700 | | | Benesse Holdings, Inc. (Consumer Services) | | | 7,167,763 | |
| | 263,900 | | | Bridgestone Corp. (Automobiles & Components) | | | 8,214,498 | |
| | 252,100 | | | Chubu Electric Power Co., Inc. (Utilities) | | | 3,409,395 | |
| | 133,500 | | | Chugai Pharmaceutical Co. Ltd. (Pharmaceuticals, Biotechnology & Life Sciences) | | | 15,913,430 | |
| | 725,900 | | | Dai Nippon Printing Co. Ltd. (Commercial & Professional Services) | | | 15,304,967 | |
| | 38,200 | | | Daito Trust Construction Co. Ltd. (Real Estate) | | | 3,632,264 | |
| | 672,400 | | | Daiwa House Industry Co. Ltd. (Real Estate) | | | 17,038,837 | |
| | 39,500 | | | DCM Holdings Co. Ltd. (Retailing) | | | 385,960 | |
| | 936,400 | | | DeNA Co. Ltd. (Media & Entertainment) | | | 11,527,171 | |
| | 218,400 | | | Dentsu Group, Inc. (Media & Entertainment) | | | 4,561,035 | |
| | 9,000 | | | Dowa Holdings Co. Ltd. (Materials) | | | 248,923 | |
| | 12,400 | | | Ebara Corp. (Capital Goods) | | | 273,376 | |
| | 63,700 | | | Eisai Co. Ltd. (Pharmaceuticals, Biotechnology & Life Sciences) | | | 4,446,958 | |
| | 57,000 | | | Electric Power Development Co. Ltd. (Utilities) | | | 1,140,806 | |
| | 189,500 | | | FamilyMart Co. Ltd. (Food & Staples Retailing) | | | 3,213,471 | |
| | 25,200 | | | Fancl Corp. (Household & Personal Products) | | | 604,125 | |
| | 219,900 | | | FUJIFILM Holdings Corp. (Technology Hardware & Equipment) | | | 10,474,400 | |
| | 226,100 | | | Fujitsu Ltd. (Software & Services) | | | 21,965,268 | |
| | 119,300 | | | Hitachi Ltd. (Technology Hardware & Equipment) | | | 3,540,755 | |
| | 30,100 | | | House Foods Group, Inc. (Food, Beverage & Tobacco) | | | 947,997 | |
| | 326,700 | | | Ibiden Co. Ltd. (Technology Hardware & Equipment) | | | 8,350,461 | |
| | 220,300 | | | Isuzu Motors Ltd. (Automobiles & Components) | | | 1,674,182 | |
| | |
|
| Common Stocks – (continued) | |
| Japan – (continued) | |
| | 17,600 | | | Izumi Co. Ltd. (Retailing) | | | 515,196 | |
| | 18,200 | | | Kaken Pharmaceutical Co. Ltd. (Pharmaceuticals, Biotechnology & Life Sciences) | | | 1,001,755 | |
| | 29,400 | | | Kamigumi Co. Ltd. (Transportation) | | | 517,601 | |
| | 128,400 | | | Kansai Electric Power Co., Inc. (The) (Utilities) | | | 1,315,736 | |
| | 525,800 | | | KDDI Corp. (Telecommunication Services) | | | 15,229,426 | |
| | 492,400 | | | Konami Holdings Corp. (Media & Entertainment) | | | 15,460,989 | |
| | 179,500 | | | K’s Holdings Corp. (Retailing) | | | 1,955,577 | |
| | 18,000 | | | KYORIN Holdings, Inc. (Pharmaceuticals, Biotechnology & Life Sciences) | | | 374,055 | |
| | 44,300 | | | Lion Corp. (Household & Personal Products) | | | 931,288 | |
| | 1,075,100 | | | LIXIL Group Corp. (Capital Goods) | | | 12,896,603 | |
| | 135,400 | | | Matsumotokiyoshi Holdings Co. Ltd. (Food & Staples Retailing) | | | 4,660,283 | |
| | 563,900 | | | Mazda Motor Corp. (Automobiles & Components) | | | 3,187,926 | |
| | 274,400 | | | Mitsubishi Heavy Industries Ltd. (Capital Goods) | | | 7,036,613 | |
| | 152,800 | | | Mitsubishi Materials Corp. (Materials) | | | 3,129,705 | |
| | 602,100 | | | Mizuho Financial Group, Inc. (Banks) | | | 701,097 | |
| | 130,000 | | | MS&AD Insurance Group Holdings, Inc. (Insurance) | | | 3,745,312 | |
| | 308,300 | | | Nexon Co. Ltd. (Media & Entertainment) | | | 4,977,809 | |
| | 46,400 | | | NGK Insulators Ltd. (Capital Goods) | | | 607,043 | |
| | 33,600 | | | Nihon Unisys Ltd. (Software & Services) | | | 971,742 | |
| | 426,500 | | | Nikon Corp. (Consumer Durables & Apparel) | | | 3,967,227 | |
| | 526,400 | | | Nippon Telegraph & Telephone Corp. (Telecommunication Services) | | | 11,988,042 | |
| | 995,900 | | | Nippon Yusen KK (Transportation) | | | 13,109,550 | |
| | 7,700 | | | Nissan Chemical Corp. (Materials) | | | 295,439 | |
| | 54,700 | | | Nisshin Seifun Group, Inc. (Food, Beverage & Tobacco) | | | 849,933 | |
| | 2,800 | | | Nitori Holdings Co. Ltd. (Retailing) | | | 429,172 | |
| | 161,000 | | | Nitto Denko Corp. (Materials) | | | 8,042,504 | |
| | 55,100 | | | NOK Corp. (Automobiles & Components) | | | 641,687 | |
| | 475,100 | | | Nomura Holdings, Inc. (Diversified Financials) | | | 1,971,484 | |
| | 643,600 | | | Nomura Research Institute Ltd. (Software & Services) | | | 15,755,987 | |
| | 1,255,800 | | | NTT Data Corp. (Software & Services) | | | 12,814,407 | |
| | 434,400 | | | NTT DOCOMO, Inc. (Telecommunication Services) | | | 12,802,299 | |
| | |
| | |
| 14 | | The accompanying notes are an integral part of these financial statements. |
GOLDMAN SACHS INTERNATIONAL EQUITY INSIGHTS FUND
| | | | | | | | |
| Shares | | |
Description | | Value | |
|
| Common Stocks – (continued) | |
| Japan – (continued) | |
| | 104,600 | | | Ono Pharmaceutical Co. Ltd. (Pharmaceuticals, Biotechnology & Life Sciences) | | $ | 2,520,055 | |
| | 1,259,300 | | | ORIX Corp. (Diversified Financials) | | | 14,818,812 | |
| | 566,900 | | | Osaka Gas Co. Ltd. (Utilities) | | | 10,556,706 | |
| | 28,700 | | | Otsuka Corp. (Software & Services) | | | 1,299,470 | |
| | 291,700 | | | Otsuka Holdings Co. Ltd. (Pharmaceuticals, Biotechnology & Life Sciences) | | | 11,464,996 | |
| | 244,200 | | | Panasonic Corp. (Consumer Durables & Apparel) | | | 1,861,534 | |
| | 18,500 | | | Rohto Pharmaceutical Co. Ltd. (Household & Personal Products) | | | 538,268 | |
| | 34,000 | | | SAMTY Co. Ltd. (Real Estate) | | | 439,853 | |
| | 16,400 | | | Sankyo Co. Ltd. (Consumer Durables & Apparel) | | | 450,287 | |
| | 65,400 | | | Santen Pharmaceutical Co. Ltd. (Pharmaceuticals, Biotechnology & Life Sciences) | | | 1,157,686 | |
| | 34,500 | | | Sawai Pharmaceutical Co. Ltd. (Pharmaceuticals, Biotechnology & Life Sciences) | | | 1,883,849 | |
| | 164,500 | | | Secom Co. Ltd. (Commercial & Professional Services) | | | 13,689,577 | |
| | 1,474,800 | | | Sega Sammy Holdings, Inc. (Consumer Durables & Apparel) | | | 17,864,004 | |
| | 56,500 | | | Seiko Epson Corp. (Technology Hardware & Equipment) | | | 641,590 | |
| | 26,000 | | | Seino Holdings Co. Ltd. (Transportation) | | | 309,532 | |
| | 189,300 | | | Sekisui Chemical Co. Ltd. (Consumer Durables & Apparel) | | | 2,399,207 | |
| | 82,400 | | | Sekisui House Ltd. (Consumer Durables & Apparel) | | | 1,413,548 | |
| | 560,700 | | | Seven & i Holdings Co. Ltd. (Food & Staples Retailing) | | | 18,568,731 | |
| | 368,700 | | | Shionogi & Co. Ltd. (Pharmaceuticals, Biotechnology & Life Sciences) | | | 20,362,388 | |
| | 418,900 | | | SoftBank Group Corp. (Telecommunication Services) | | | 17,955,159 | |
| | 521,000 | | | Subaru Corp. (Automobiles & Components) | | | 10,427,558 | |
| | 124,800 | | | Sugi Holdings Co. Ltd. (Food & Staples Retailing) | | | 7,525,693 | |
| | 96,600 | | | Sumitomo Realty & Development Co. Ltd. (Real Estate) | | | 2,587,194 | |
| | 210,400 | | | Sumitomo Rubber Industries Ltd. (Automobiles & Components) | | | 2,042,256 | |
| | 79,300 | | | Sundrug Co. Ltd. (Food & Staples Retailing) | | | 2,715,111 | |
| | 651,000 | | | TIS, Inc. (Software & Services) | | | 12,414,170 | |
| | 132,500 | | | Tokio Marine Holdings, Inc. (Insurance) | | | 6,216,336 | |
| | 75,200 | | | Tokyo Electron Ltd. (Semiconductors & Semiconductor Equipment) | | | 16,016,173 | |
| | |
|
| Common Stocks – (continued) | |
| Japan – (continued) | |
| | 813,200 | | | Toppan Printing Co. Ltd. (Commercial & Professional Services) | | | 12,080,183 | |
| | 24,500 | | | Tosoh Corp. (Materials) | | | 299,433 | |
| | 19,400 | | | Unicharm Corp. (Household & Personal Products) | | | 714,959 | |
| | 1,130,900 | | | Yamada Denki Co. Ltd. (Retailing) | | | 5,362,901 | |
| | 34,300 | | | Yokohama Rubber Co. Ltd. (The) (Automobiles & Components) | | | 436,259 | |
| | | | | | | | |
| | | | | | | 552,361,653 | |
| | |
| Luxembourg – 0.1% | |
| | 4,910 | | | Eurofins Scientific SE (Pharmaceuticals, Biotechnology & Life Sciences) | | | 2,716,069 | |
| | |
| Macau – 0.1% | |
| | 148,400 | | | Sands China Ltd. (Consumer Services) | | | 600,797 | |
| | 1,336,000 | | | SJM Holdings Ltd. (Consumer Services) | | | 1,319,090 | |
| | | | | | | | |
| | | | | | | 1,919,887 | |
| | |
| Netherlands – 5.8% | |
| | 122,486 | | | ASM International NV (Semiconductors & Semiconductor Equipment) | | | 13,483,030 | |
| | 74,215 | | | ASML Holding NV (Semiconductors & Semiconductor Equipment) | | | 21,677,126 | |
| | 322,076 | | | BE Semiconductor Industries NV (Semiconductors & Semiconductor Equipment)* | | | 13,329,382 | |
| | 44,686 | | | Euronext NV (Diversified Financials)(c) | | | 3,751,570 | |
| | 632,645 | | | Koninklijke Ahold Delhaize NV (Food & Staples Retailing) | | | 15,360,851 | |
| | 83,985 | | | Koninklijke DSM NV (Materials) | | | 10,293,362 | |
| | 49,009 | | | NXP Semiconductors NV (Semiconductors & Semiconductor Equipment) | | | 4,879,826 | |
| | 765,905 | | | Royal Dutch Shell plc Class A (Energy) | | | 12,801,678 | |
| | 196,028 | | | Royal Dutch Shell plc Class B (Energy) | | | 3,138,144 | |
| | 239,053 | | | Royal Dutch Shell plc Class B ADR (Energy) | | | 7,642,525 | |
| | 553,549 | | | Signify NV (Capital Goods)(c) | | | 11,268,244 | |
| | 261,988 | | | Wolters Kluwer NV (Commercial & Professional Services) | | | 19,270,122 | |
| | | | | | | | |
| | | | | | | 136,895,860 | |
| | |
| New Zealand – 0.2% | |
| | 269,869 | | | a2 Milk Co. Ltd. (Food, Beverage & Tobacco)* | | | 3,211,964 | |
| | |
| | |
| The accompanying notes are an integral part of these financial statements. | | 15 |
GOLDMAN SACHS INTERNATIONAL EQUITY INSIGHTS FUND
Schedule of Investments(continued)
April 30, 2020 (Unaudited)
| | | | | | | | |
| Shares | | |
Description | | Value | |
|
| Common Stocks – (continued) | |
| New Zealand – (continued) | |
| | 89,720 | | | Fisher & Paykel Healthcare Corp. Ltd. (Health Care Equipment & Services) | | $ | 1,498,929 | |
| | | | | | | | |
| | | | | | | 4,710,893 | |
| | |
| Norway – 2.2% | |
| | 138,253 | | | Austevoll Seafood ASA (Food, Beverage & Tobacco) | | | 1,076,967 | |
| | 1,416,983 | | | DNB ASA (Banks) | | | 17,156,702 | |
| | 26,545 | | | Grieg Seafood ASA (Food, Beverage & Tobacco) | | | 260,334 | |
| | 1,068,058 | | | Leroy Seafood Group ASA (Food, Beverage & Tobacco) | | | 5,672,142 | |
| | 1,639,623 | | | Orkla ASA (Food, Beverage & Tobacco) | | | 14,810,518 | |
| | 153,893 | | | Salmar ASA (Food, Beverage & Tobacco) | | | 5,997,673 | |
| | 183,990 | | | Yara International ASA (Materials)(a) | | | 6,249,120 | |
| | | | | | | | |
| | | | | | | 51,223,456 | |
| | |
| Singapore – 0.9% | |
| | 327,100 | | | AIMS APAC REIT (REIT) | | | 265,403 | |
| | 791,100 | | | Frasers Logistics & Industrial Trust (REIT) | | | 592,079 | |
| | 2,242,300 | | | Singapore Exchange Ltd. (Diversified Financials) | | | 15,290,478 | |
| | 217,600 | | | Singapore Telecommunications Ltd. (Telecommunication Services) | | | 434,817 | |
| | 96,200 | | | Venture Corp. Ltd. (Technology Hardware & Equipment) | | | 1,075,101 | |
| | 1,585,800 | | | Wilmar International Ltd. (Food, Beverage & Tobacco) | | | 3,993,493 | |
| | | | | | | | |
| | | | | | | 21,651,371 | |
| | |
| South Africa – 0.2% | |
| | 233,578 | | | Anglo American plc (Materials) | | | 4,154,200 | |
| | |
| Spain – 1.3% | |
| | 477,649 | | | ACS Actividades de Construccion y Servicios SA (Capital Goods) | | | 11,944,297 | |
| | 15,361 | | | Aena SME SA (Transportation)*(c) | | | 1,944,479 | |
| | 39,057 | | | Almirall SA (Pharmaceuticals, Biotechnology & Life Sciences) | | | 503,683 | |
| | 2,389,986 | | | Banco Santander SA (Banks) | | | 5,340,161 | |
| | 216,323 | | | Cellnex Telecom SA (Telecommunication Services)(c) | | | 11,314,729 | |
| | 53,048 | | | Solaria Energia y Medio Ambiente SA (Utilities)* | | | 541,269 | |
| | | | | | | | |
| | | | | | | 31,588,618 | |
| | |
| Sweden – 4.3% | |
| | 389,838 | | | Boliden AB (Materials)(a) | | | 7,858,123 | |
| | 166,245 | | | Cloetta AB Class B (Food, Beverage & Tobacco)* | | | 382,828 | |
| | 281,806 | | | Electrolux ABSeries B (Consumer Durables & Apparel) | | | 3,853,379 | |
| | |
|
| Common Stocks – (continued) | |
| Sweden – (continued) | |
| | 571,543 | | | Essity AB Class B (Household & Personal Products)* | | | 18,514,208 | |
| | 265,343 | | | Getinge AB Class B (Health Care Equipment & Services) | | | 5,085,909 | |
| | 33,244 | | | Investor AB Class A (Diversified Financials) | | | 1,640,046 | |
| | 360,223 | | | Investor AB Class B (Diversified Financials) | | | 17,902,436 | |
| | 389,283 | | | Kinnevik AB Class B (Diversified Financials) | | | 8,000,921 | |
| | 545,012 | | | Sandvik AB (Capital Goods)* | | | 8,384,150 | |
| | 23,443 | | | SKF AB Class B (Capital Goods) | | | 370,016 | |
| | 283,485 | | | Swedish Match AB (Food, Beverage & Tobacco) | | | 17,518,374 | |
| | 3,263,609 | | | Telia Co. AB (Telecommunication Services)(a) | | | 11,347,454 | |
| | | | | | | | |
| | | | | | | 100,857,844 | |
| | |
| Switzerland – 9.9% | |
| | 6,862 | | | Bachem Holding AG (Registered) Class B (Pharmaceuticals, Biotechnology & Life Sciences) | | | 1,621,010 | |
| | 706,254 | | | Nestle SA (Registered) (Food, Beverage & Tobacco) | | | 74,799,383 | |
| | 489,273 | | | Novartis AG (Registered) (Pharmaceuticals, Biotechnology & Life Sciences) | | | 41,753,810 | |
| | 184,779 | | | Roche Holding AG (Pharmaceuticals, Biotechnology & Life Sciences) | | | 63,992,743 | |
| | 60,588 | | | Sonova Holding AG (Registered) (Health Care Equipment & Services) | | | 10,943,025 | |
| | 433,205 | | | STMicroelectronics NV (Semiconductors & Semiconductor Equipment) | | | 11,152,644 | |
| | 44,355 | | | Swiss Life Holding AG (Registered) (Insurance) | | | 15,729,324 | |
| | 21,054 | | | Tecan Group AG (Registered) (Pharmaceuticals, Biotechnology & Life Sciences) | | | 6,778,172 | |
| | 18,072 | | | Zurich Insurance Group AG (Insurance) | | | 5,729,806 | |
| | | | | | | | |
| | | | | | | 232,499,917 | |
| | |
| United Kingdom – 12.2% | |
| | 1,324,297 | | | 3i Group plc (Diversified Financials) | | | 13,009,716 | |
| | 398,344 | | | AstraZeneca plc ADR (Pharmaceuticals, Biotechnology & Life Sciences) | | | 20,825,424 | |
| | 4,100,455 | | | Aviva plc (Insurance) | | | 12,400,304 | |
| | 948,056 | | | Barratt Developments plc (Consumer Durables & Apparel) | | | 6,180,717 | |
| | 733,193 | | | boohoo Group plc (Retailing)* | | | 2,979,277 | |
| | 235,661 | | | BP plc ADR (Energy) | | | 5,608,732 | |
| | 386,003 | | | British American Tobacco plc (Food, Beverage & Tobacco) | | | 14,878,196 | |
| | |
| | |
| 16 | | The accompanying notes are an integral part of these financial statements. |
GOLDMAN SACHS INTERNATIONAL EQUITY INSIGHTS FUND
| | | | | | | | |
| Shares | | |
Description | | Value | |
|
| Common Stocks – (continued) | |
| United Kingdom – (continued) | |
| | 1,309,537 | | | BT Group plc (Telecommunication Services) | | $ | 1,908,680 | |
| | 557,000 | | | CK Hutchison Holdings Ltd. (Capital Goods) | | | 4,128,583 | |
| | 56,444 | | | Compass Group plc (Consumer Services) | | | 949,806 | |
| | 511,525 | | | ConvaTec Group plc (Health Care Equipment & Services)(c) | | | 1,366,245 | |
| | 15,154 | | | Croda International plc (Materials) | | | 929,239 | |
| | 749,486 | | | Diageo plc (Food, Beverage & Tobacco) | | | 25,804,693 | |
| | 91,850 | | | Dialog Semiconductor plc (Semiconductors & Semiconductor Equipment)* | | | 2,884,539 | |
| | 2,639,882 | | | Direct Line Insurance Group plc (Insurance) | | | 8,994,182 | |
| | 593,731 | | | Experian plc (Commercial & Professional Services) | | | 17,829,962 | |
| | 284,486 | | | Fiat Chrysler Automobiles NV (Automobiles & Components) | | | 2,467,617 | |
| | 138,306 | | | GlaxoSmithKline plc ADR (Pharmaceuticals, Biotechnology & Life Sciences)(d) | | | 5,818,533 | |
| | 343,720 | | | Great Portland Estates plc (REIT) | | | 2,927,566 | |
| | 92,792 | | | Greggs plc (Consumer Services) | | | 2,134,326 | |
| | 413,363 | | | Halma plc (Technology Hardware & Equipment) | | | 10,867,475 | |
| | 1,569,258 | | | HSBC Holdings plc (Banks) | | | 8,065,928 | |
| | 91,437 | | | IG Group Holdings plc (Diversified Financials) | | | 866,662 | |
| | 939,844 | | | Imperial Brands plc (Food, Beverage & Tobacco) | | | 19,772,884 | |
| | 79,667 | | | Intertek Group plc (Commercial & Professional Services) | | | 4,754,468 | |
| | 254,729 | | | Legal & General Group plc (Insurance) | | | 654,909 | |
| | 6,855,231 | | | Lloyds Banking Group plc (Banks) | | | 2,773,682 | |
| | 101,802 | | | London Stock Exchange Group plc (Diversified Financials) | | | 9,528,348 | |
| | 71,398 | | | Micro Focus International plc (Software & Services) | | | 423,304 | |
| | 230,734 | | | Mondi plc (Materials) | | | 4,074,604 | |
| | 358,823 | | | Moneysupermarket.com Group plc (Retailing) | | | 1,429,653 | |
| | 882,453 | | | National Grid plc (Utilities) | | | 10,341,250 | |
| | 33,715 | | | Reckitt Benckiser Group plc (Household & Personal Products) | | | 2,808,452 | |
| | 673,087 | | | RELX plc (Commercial & Professional Services) | | | 15,186,059 | |
| | 561,454 | | | Rentokil Initial plc (Commercial & Professional Services) | | | 3,340,435 | |
| | 45,024 | | | Sage Group plc (The) (Software & Services) | | | 362,105 | |
| | 187,983 | | | Segro plc (REIT) | | | 1,970,350 | |
| | 92,223 | | | Severn Trent plc (Utilities) | | | 2,767,385 | |
| | 195,461 | | | Smith & Nephew plc (Health Care Equipment & Services) | | | 3,824,996 | |
| | 601,257 | | | SSE plc (Utilities) | | | 9,430,943 | |
| | |
|
| Common Stocks – (continued) | |
| United Kingdom – (continued) | |
| | 3,888,614 | | | Taylor Wimpey plc (Consumer Durables & Apparel) | | | 7,181,653 | |
| | 236,997 | | | Unilever plc ADR (Household & Personal Products)(a)(d) | | | 12,293,034 | |
| | 39,489 | | | Vistry Group plc (Consumer Durables & Apparel) | | | 401,033 | |
| | 19,313 | | | Vodafone Group plc ADR (Telecommunication Services) | | | 273,086 | |
| | | | | | | | |
| | | | | | | 287,419,035 | |
| | |
| United States – 0.6% | |
| | 184,658 | | | Carnival plc ADR (Consumer Services) | | | 2,570,440 | |
| | 251,165 | | | QIAGEN NV (Pharmaceuticals, Biotechnology & Life Sciences)* | | | 10,459,088 | |
| | | | | | | | |
| | | | | | | 13,029,528 | |
| | |
| TOTAL INVESTMENTS BEFORE SECURITIES LENDING
REINVESTMENT VEHICLE |
|
| | (Cost $2,381,371,400) | | $ | 2,324,671,420 | |
| | |
| | | | | | | | |
| Shares | | Dividend
Rate | | | Value | |
|
| Securities Lending Reinvestment Vehicle(e) – 1.2% | |
Goldman Sachs Financial Square Government Fund – Institutional Shares | |
| 28,790,720 | | | 0.233 | % | | $ | 28,790,720 | |
| (Cost $28,790,720) | | | | | |
| |
| TOTAL INVESTMENTS – 99.8% | |
| (Cost $2,410,162,120) | | | $ | 2,353,462,140 | |
| |
| OTHER ASSETS IN EXCESS OF LIABILITIES – 0.2% | | | | 5,413,074 | |
| |
| NET ASSETS – 100.0% | | | $ | 2,358,875,214 | |
| |
| | |
|
| The percentage shown for each investment category reflects the value of investments in that category as a percentage of net assets. |
| |
* | | Non-income producing security. |
| |
(a) | | All or a portion of security is on loan. |
| |
(b) | | Preference Shares are a special type of equity investment that shares in the earnings of the company, has limited voting rights, and receives a greater dividend than applicable Common Shares. |
| |
(c) | | Exempt from registration under Rule 144A of the Securities Act of 1933. |
| |
(d) | | All or a portion of security is segregated as collateral for initial margin requirements on futures transactions. |
| |
(e) | | Represents an Affiliated Issuer. |
| | |
|
Investment Abbreviations: |
ADR | | —American Depositary Receipt |
REIT | | —Real Estate Investment Trust |
|
| | |
| The accompanying notes are an integral part of these financial statements. | | 17 |
GOLDMAN SACHS INTERNATIONAL EQUITY INSIGHTS FUND
Schedule of Investments(continued)
April 30, 2020 (Unaudited)
|
| ADDITIONAL INVESTMENT INFORMATION |
FUTURES CONTRACTS — At April 30, 2020, the Fund had the following futures contracts:
| | | | | | | | | | | | | | | | |
| Description | | Number of
Contracts | | | Expiration
Date | | | Notional
Amount | | | Unrealized
Appreciation/
(Depreciation) | |
Long position contracts: | | | | | | | | | | | | | | | | |
Hang Seng Index | | | 11 | | | | 05/28/2020 | | | $ | 1,738,291 | | | $ | 24,967 | |
SPI 200 Index | | | 36 | | | | 06/18/2020 | | | | 3,249,127 | | | | 332,791 | |
| | | | |
| Total Futures Contracts | | | | | | | | | | | | | | $ | 357,758 | |
| | |
| 18 | | The accompanying notes are an integral part of these financial statements. |
GOLDMAN SACHS INTERNATIONAL SMALL CAP INSIGHTS FUND
Schedule of Investments
April 30, 2020 (Unaudited)
| | | | | | | | |
| Shares | | |
Description | | Value | |
|
| Common Stocks – 98.7% | |
| Australia – 7.6% | |
| | 4,296,141 | | | Austal Ltd. (Capital Goods) | | $ | 9,323,299 | |
| | 11,047,383 | | | Beach Energy Ltd. (Energy) | | | 10,768,442 | |
| | 73,479 | | | Bingo Industries Ltd. (Commercial & Professional Services) | | | 111,284 | |
| | 710,630 | | | Breville Group Ltd. (Consumer Durables & Apparel) | | | 8,041,653 | |
| | 2,383,849 | | | BWP Trust (REIT) | | | 5,447,747 | |
| | 107,371 | | | Centuria Industrial REIT (REIT) | | | 184,139 | |
| | 3,726,774 | | | Charter Hall Group (REIT) | | | 18,416,035 | |
| | 5,472,139 | | | Evolution Mining Ltd. (Materials) | | | 17,820,236 | |
| | 5,420,902 | | | Genworth Mortgage Insurance Australia Ltd. (Banks) | | | 7,494,165 | |
| | 940,007 | | | Gold Road Resources Ltd. (Materials)* | | | 959,887 | |
| | 157,899 | | | Hansen Technologies Ltd. (Software & Services) | | | 287,122 | |
| | 18,712 | | | IDP Education Ltd. (Consumer Services) | | | 177,375 | |
| | 5,256,586 | | | IGO Ltd. (Materials) | | | 15,946,778 | |
| | 214,167 | | | Integrated Research Ltd. (Software & Services) | | | 436,407 | |
| | 4,623,247 | | | IPH Ltd. (Commercial & Professional Services) | | | 22,112,476 | |
| | 612,864 | | | Kogan.com Ltd. (Retailing)(a) | | | 3,161,966 | |
| | 134,807 | | | Megaport Ltd. (Software & Services)* | | | 1,037,379 | |
| | 218,813 | | | Mineral Resources Ltd. (Materials) | | | 2,358,333 | |
| | 281,876 | | | National Storage REIT (REIT) | | | 316,598 | |
| | 688,715 | | | Orora Ltd. (Materials) | | | 1,144,550 | |
| | 311,797 | | | Perpetual Ltd. (Diversified Financials) | | | 6,060,901 | |
| | 8,771,819 | | | Perseus Mining Ltd. (Materials)* | | | 5,301,123 | |
| | 1,004,422 | | | Pro Medicus Ltd. (Health Care Equipment & Services) | | | 16,905,818 | |
| | 3,446,668 | | | Ramelius Resources Ltd. (Materials) | | | 2,928,697 | |
| | 9,520,110 | | | Regis Resources Ltd. (Materials) | | | 27,221,521 | |
| | 691,797 | | | Rural Funds Group (REIT) | | | 873,570 | |
| | 1,938,773 | | | Saracen Mineral Holdings Ltd. (Materials)* | | | 5,317,271 | |
| | 1,417,949 | | | Select Harvests Ltd. (Food, Beverage & Tobacco) | | | 6,665,147 | |
| | 87,901 | | | Service Stream Ltd. (Capital Goods) | | | 111,842 | |
| | 5,766,663 | | | Silver Lake Resources Ltd. (Materials)* | | | 7,122,595 | |
| | 299,408 | | | SmartGroup Corp. Ltd. (Commercial & Professional Services) | | | 1,046,569 | |
| | 63,560 | | | Webjet Ltd. (Retailing) | | | 124,622 | |
| | 2,849,968 | | | Westgold Resources Ltd. (Materials)* | | | 3,744,082 | |
| | | | | | | | |
| | | | | | | 208,969,629 | |
| | |
|
| Common Stocks – (continued) | |
| Austria – 0.8% | |
| | 55,790 | | | AT&S Austria Technologie & Systemtechnik AG (Technology Hardware & Equipment) | | | 961,605 | |
| | 25,268 | | | CA Immobilien Anlagen AG (Real Estate) | | | 802,192 | |
| | 44,863 | | | EVN AG (Utilities) | | | 701,035 | |
| | 139,708 | | | IMMOFINANZ AG (Real Estate)* | | | 2,579,809 | |
| | 39,161 | | | Oesterreichische Post AG (Transportation)* | | | 1,475,806 | |
| | 32,063 | | | S IMMO AG (Real Estate) | | | 595,911 | |
| | 117,191 | | | Telekom Austria AG (Telecommunication Services) | | | 824,480 | |
| | 521,071 | | | UNIQA Insurance Group AG (Insurance) | | | 3,513,070 | |
| | 616,061 | | | Wienerberger AG (Materials) | | | 11,538,406 | |
| | 29,414 | | | Zumtobel Group AG (Capital Goods)* | | | 190,004 | |
| | | | | | | | |
| | | | | | | 23,182,318 | |
| | |
| Belgium – 1.0% | |
| | 56,925 | | | Bekaert SA (Materials) | | | 1,203,441 | |
| | 286,365 | | | bpost SA (Transportation) | | | 1,998,131 | |
| | 197,853 | | | D’ieteren SA/NV (Retailing) | | | 9,915,288 | |
| | 54,849 | | | Gimv NV (Diversified Financials) | | | 3,013,393 | |
| | 13,315 | | | Ion Beam Applications (Health Care Equipment & Services)* | | | 110,456 | |
| | 164,247 | | | KBC Ancora (Diversified Financials) | | | 5,767,098 | |
| | 3,326 | | | Melexis NV (Semiconductors & Semiconductor Equipment) | | | 202,298 | |
| | 3,168 | | | Montea C.V.A (REIT)* | | | 278,449 | |
| | 144,520 | | | Orange Belgium SA (Telecommunication Services) | | | 2,404,040 | |
| | 3,666 | | | Tessenderlo Group SA (Materials)* | | | 102,365 | |
| | 107,037 | | | Warehouses De Pauw CV (REIT)* | | | 2,936,407 | |
| | | | | | | | |
| | | | | | | 27,931,366 | |
| | |
| China – 0.3% | |
| | 17,686,000 | | | CITIC Telecom International Holdings Ltd. (Telecommunication Services) | | | 6,544,452 | |
| | 1,736,000 | | | FIH Mobile Ltd. (Technology Hardware & Equipment)* | | | 194,023 | |
| | 2,050,000 | | | SITC International Holdings Co. Ltd. (Transportation) | | | 2,025,116 | |
| | | | | | | | |
| | | | | | | 8,763,591 | |
| | |
| Denmark – 0.2% | |
| | 35,975 | | | D/S Norden A/S (Transportation)* | | | 505,629 | |
| | 105,370 | | | Per Aarsleff Holding A/S (Capital Goods) | | | 3,093,775 | |
| | 225,410 | | | Scandinavian Tobacco Group A/S (Food, Beverage & Tobacco)(b) | | | 2,590,384 | |
| | | | | | | | |
| | | | | | | 6,189,788 | |
| | |
| | |
| The accompanying notes are an integral part of these financial statements. | | 19 |
GOLDMAN SACHS INTERNATIONAL SMALL CAP INSIGHTS FUND
Schedule of Investments(continued)
April 30, 2020 (Unaudited)
| | | | | | | | |
| Shares | | |
Description | | Value | |
|
| Common Stocks – (continued) | |
| Finland – 1.0% | |
| | 861,280 | | | Kesko OYJ Class B (Food & Staples Retailing) | | $ | 14,033,789 | |
| | 352,567 | | | Uponor OYJ (Capital Goods) | | | 3,953,313 | |
| | 421,792 | | | Valmet OYJ (Capital Goods) | | | 9,645,998 | |
| | | | | | | | |
| | | | | | | 27,633,100 | |
| | |
| France – 2.2% | |
| | 7,505 | | | Akka Technologies (Commercial & Professional Services) | | | 238,891 | |
| | 8,206 | | | Albioma SA (Utilities) | | | 271,782 | |
| | 16,664 | | | Beneteau SA (Consumer Durables & Apparel) | | | 105,516 | |
| | 21,192 | | | Carmila SA (REIT) | | | 272,269 | |
| | 1,261,631 | | | Coface SA (Insurance) | | | 7,420,506 | |
| | 446,687 | | | Derichebourg SA (Commercial & Professional Services) | | | 1,253,406 | |
| | 4,994 | | | Devoteam SA (Software & Services) | | | 380,133 | |
| | 64,881 | | | Elior Group SA (Consumer Services)(b) | | | 428,524 | |
| | 304,886 | | | Elis SA (Commercial & Professional Services) | | | 3,758,055 | |
| | 67,158 | | | Gaztransport Et Technigaz SA (Energy) | | | 4,868,760 | |
| | 49,371 | | | Innate Pharma SA (Pharmaceuticals, Biotechnology & Life Sciences)* | | | 347,403 | |
| | 82,182 | | | Kaufman & Broad SA (Consumer Durables & Apparel) | | | 2,970,016 | |
| | 69,821 | | | Maisons du Monde SA (Retailing)(b) | | | 628,131 | |
| | 16,391 | | | Nexans SA (Capital Goods) | | | 583,818 | |
| | 340,666 | | | Quadient (Technology Hardware & Equipment) | | | 4,704,528 | |
| | 1,997,549 | | | Rexel SA (Capital Goods) | | | 18,656,682 | |
| | 176,436 | | | Societe BIC SA (Commercial & Professional Services) | | | 8,825,851 | |
| | 43,372 | | | Sopra Steria Group (Software & Services) | | | 5,135,274 | |
| | 2,413 | | | Virbac SA (Pharmaceuticals, Biotechnology & Life Sciences)* | | | 475,831 | |
| | | | | | | | |
| | | | | | | 61,325,376 | |
| | |
| Germany – 6.5% | |
| | 137,385 | | | ADVA Optical Networking SE (Technology Hardware & Equipment)* | | | 898,703 | |
| | 1,309,342 | | | alstria office REIT-AG (REIT) | | | 19,626,649 | |
| | 103,127 | | | Aurubis AG (Materials) | | | 5,346,161 | |
| | 147,197 | | | Bechtle AG (Software & Services) | | | 21,287,283 | |
| | 325,951 | | | CANCOM SE (Software & Services) | | | 16,594,469 | |
| | 11,239 | | | CropEnergies AG (Energy) | | | 88,720 | |
| | 914,128 | | | Deutsche Pfandbriefbank AG (Banks)(b) | | | 6,718,954 | |
| | 1,190,443 | | | Deutz AG (Capital Goods) | | | 4,575,740 | |
| | 42,878 | | | Eckert & Ziegler Strahlen- und Medizintechnik AG (Health Care Equipment & Services) | | | 6,170,690 | |
| | |
|
| Common Stocks – (continued) | |
| Germany – (continued) | |
| | 12,880 | | | Elmos Semiconductor AG (Semiconductors & Semiconductor Equipment) | | | 256,549 | |
| | 967,979 | | | Freenet AG (Telecommunication Services) | | | 18,363,227 | |
| | 405,136 | | | Gerresheimer AG (Pharmaceuticals, Biotechnology & Life Sciences) | | | 32,220,192 | |
| | 188,689 | | | Hamburger Hafen und Logistik AG (Transportation) | | | 3,070,082 | |
| | 83,345 | | | HelloFresh SE (Retailing)* | | | 2,970,685 | |
| | 4,094 | | | Indus Holding AG (Capital Goods) | | | 126,010 | |
| | 579,981 | | | Jungheinrich AG (Preference) (Capital Goods)(c) | | | 10,473,534 | |
| | 951 | | | MBB SE (Capital Goods) | | | 67,172 | |
| | 33,820 | | | Nemetschek SE (Software & Services) | | | 2,127,783 | |
| | 18,754 | | | New Work SE (Media & Entertainment) | | | 4,457,283 | |
| | 24,332 | | | Rheinmetall AG (Capital Goods) | | | 1,646,771 | |
| | 37,333 | | | Rocket Internet SE (Retailing)*(b) | | | 785,321 | |
| | 105,043 | | | Siltronic AG (Semiconductors & Semiconductor Equipment) | | | 8,992,732 | |
| | 215,257 | | | Software AG (Software & Services) | | | 7,643,535 | |
| | 2,140 | | | STO SE & Co. KGaA (Preference) (Materials)(c) | | | 215,751 | |
| | 388,329 | | | Takkt AG (Retailing) | | | 3,155,300 | |
| | | | | | | | |
| | | | | | | 177,879,296 | |
| | |
| Guernsey – 0.0% | |
| | 115,865 | | | Picton Property Income Ltd. (The) (REIT) | | | 99,963 | |
| | 311,801 | | | UK Commercial Property REIT Ltd. (REIT) | | | 265,567 | |
| | | | | | | | |
| | | | | | | 365,530 | |
| | |
| Hong Kong – 1.0% | |
| | 130,000 | | | Cafe de Coral Holdings Ltd. (Consumer Services) | | | 268,185 | |
| | 125,000 | | | Hang Lung Group Ltd. (Real Estate) | | | 285,508 | |
| | 2,372,000 | | | Hutchison Telecommunications Hong Kong Holdings Ltd. (Telecommunication Services) | | | 409,942 | |
| | 988,000 | | | Hysan Development Co. Ltd. (Real Estate) | | | 3,296,125 | |
| | 3,972,000 | | | K Wah International Holdings Ltd. (Real Estate) | | | 1,820,077 | |
| | 5,029,000 | | | Melco International Development Ltd. (Consumer Services) | | | 9,400,784 | |
| | 424,000 | | | Nissin Foods Co. Ltd. (Food, Beverage & Tobacco) | | | 348,469 | |
| | 9,638,000 | | | Shun Tak Holdings Ltd. (Capital Goods) | | | 3,370,836 | |
| | 653,000 | | | Sun Hung Kai & Co. Ltd. (Diversified Financials) | | | 268,399 | |
| | 370,000 | | | Sunlight REIT (REIT) | | | 190,611 | |
| | |
| | |
| 20 | | The accompanying notes are an integral part of these financial statements. |
GOLDMAN SACHS INTERNATIONAL SMALL CAP INSIGHTS FUND
| | | | | | | | |
| Shares | | |
Description | | Value | |
|
| Common Stocks – (continued) | |
| Hong Kong – (continued) | |
| | 2,926,000 | | | United Laboratories International Holdings Ltd. (The) (Pharmaceuticals, Biotechnology & Life Sciences)(a) | | $ | 2,527,396 | |
| | 11,401,000 | | | Value Partners Group Ltd. (Diversified Financials) | | | 4,525,209 | |
| | | | | | | | |
| | | | | | | 26,711,541 | |
| | |
| Ireland – 0.2% | |
| | 67,195 | | | Glanbia plc (Food, Beverage & Tobacco) | | | 715,111 | |
| | 1,923,846 | | | Greencore Group plc (Food, Beverage & Tobacco) | | | 4,406,126 | |
| | 716,218 | | | Hibernia REIT plc (REIT) | | | 931,639 | |
| | | | | | | | |
| | | | | | | 6,052,876 | |
| | |
| Israel – 0.9% | |
| | 3,010 | | | AFI Properties Ltd. (Real Estate)* | | | 91,598 | |
| | 720,528 | | | Bezeq The Israeli Telecommunication Corp. Ltd. (Telecommunication Services)* | | | 514,091 | |
| | 1,038 | | | Big Shopping Centers Ltd. (Real Estate) | | | 83,038 | |
| | 2,054 | | | Blue Square Real Estate Ltd. (Real Estate) | | | 94,372 | |
| | 25,787 | | | Cellcom Israel Ltd. (Telecommunication Services)* | | | 94,956 | |
| | 244 | | | Electra Ltd. (Capital Goods) | | | 111,920 | |
| | 1,204 | | | Fattal Holdings 1998 Ltd. (Consumer Services) | | | 82,482 | |
| | 73,166 | | | Gazit-Globe Ltd. (Real Estate) | | | 541,713 | |
| | 1,784 | | | Hilan Ltd. (Software & Services)* | | | 70,332 | |
| | 15,375 | | | Melisron Ltd. (Real Estate) | | | 618,856 | |
| | 212,549 | | | Mivne Real Estate KD Ltd. (Real Estate)* | | | 456,565 | |
| | 1,372,623 | | | Plus500 Ltd. (Diversified Financials) | | | 21,513,527 | |
| | 1,133 | | | Property & Building Corp. Ltd. (Real Estate) | | | 83,643 | |
| | 8,948 | | | Sapiens International Corp. NV (Software & Services) | | | 223,237 | |
| | 16,858 | | | Summit Real Estate Holdings Ltd. (Real Estate) | | | 210,593 | |
| | | | | | | | |
| | | | | | | 24,790,923 | |
| | |
| Italy – 4.6% | |
| | 10,853,195 | | | A2A SpA (Utilities) | | | 14,795,172 | |
| | 45,519 | | | ACEA SpA (Utilities) | | | 760,831 | |
| | 30,394 | | | Ascopiave SpA (Utilities) | | | 111,269 | |
| | 368,475 | | | ASTM SpA (Transportation) | | | 7,206,266 | |
| | 684,277 | | | Azimut Holding SpA (Diversified Financials) | | | 11,661,258 | |
| | 883,088 | | | Banca Generali SpA (Diversified Financials) | | | 21,954,034 | |
| | 540,669 | | | Buzzi Unicem SpA (Materials) | | | 10,607,399 | |
| | 316,363 | | | Cerved Group SpA (Diversified Financials) | | | 2,155,217 | |
| | |
|
| Common Stocks – (continued) | |
| Italy – (continued) | |
| | 23,593 | | | De’ Longhi SpA (Consumer Durables & Apparel) | | | 426,425 | |
| | 138,209 | | | DiaSorin SpA (Health Care Equipment & Services) | | | 23,567,648 | |
| | 360,347 | | | Falck Renewables SpA (Utilities) | | | 1,771,113 | |
| | 2,259,177 | | | Hera SpA (Utilities) | | | 8,362,895 | |
| | 2,858,816 | | | Iren SpA (Utilities) | | | 7,049,467 | |
| | 1,980,020 | | | Italgas SpA (Utilities) | | | 11,093,703 | |
| | 7,105 | | | MARR SpA (Food & Staples Retailing) | | | 93,607 | |
| | 74,426 | | | Piaggio & C SpA (Automobiles & Components) | | | 170,632 | |
| | 44,633 | | | Reply SpA (Software & Services) | | | 3,124,480 | |
| | 68,914 | | | Saras SpA (Energy) | | | 65,080 | |
| | 78,774 | | | Tinexta Spa (Commercial & Professional Services) | | | 1,047,979 | |
| | 104,917 | | | Unipol Gruppo SpA (Insurance) | | | 362,005 | |
| | | | | | | | |
| | | | | | | 126,386,480 | |
| | |
| Japan – 33.6% | |
| | 127,800 | | | ADEKA Corp. (Materials) | | | 1,604,805 | |
| | 100 | | | Advance Residence Investment Corp. (REIT) | | | 306,826 | |
| | 1,400 | | | Ain Holdings, Inc. (Food & Staples Retailing) | | | 78,532 | |
| | 49,400 | | | Alpen Co. Ltd. (Retailing) | | | 757,523 | |
| | 158,100 | | | AOKI Holdings, Inc. (Retailing) | | | 960,531 | |
| | 8,600 | | | Arata Corp. (Retailing) | | | 355,183 | |
| | 185,300 | | | Arcland Sakamoto Co. Ltd. (Retailing) | | | 1,766,968 | |
| | 33,400 | | | Argo Graphics, Inc. (Software & Services) | | | 1,046,096 | |
| | 121,400 | | | Asahi Holdings, Inc. (Materials) | | | 2,743,154 | |
| | 46,400 | | | ASKUL Corp. (Retailing) | | | 1,324,774 | |
| | 155,500 | | | Autobacs Seven Co. Ltd. (Retailing) | | | 1,815,850 | |
| | 169,100 | | | BayCurrent Consulting, Inc. (Commercial & Professional Services) | | | 9,582,667 | |
| | 11,600 | | | BML, Inc. (Health Care Equipment & Services) | | | 297,583 | |
| | 660,800 | | | Bunka Shutter Co. Ltd. (Capital Goods) | | | 4,824,219 | |
| | 175,100 | | | Central Glass Co. Ltd. (Capital Goods) | | | 3,000,921 | |
| | 18,800 | | | Chiyoda Integre Co. Ltd. (Capital Goods) | | | 306,048 | |
| | 128,700 | | | cocokara fine, Inc. (Food & Staples Retailing) | | | 6,069,650 | |
| | 234,500 | | | Computer Engineering & Consulting Ltd. (Software & Services) | | | 3,587,494 | |
| | 46,600 | | | CONEXIO Corp. (Technology Hardware & Equipment) | | | 626,758 | |
| | 15,700 | | | Create SD Holdings Co. Ltd. (Food & Staples Retailing) | | | 447,344 | |
| | 39,200 | | | Daiichi Jitsugyo Co. Ltd. (Capital Goods) | | | 1,325,337 | |
| | |
| | |
| The accompanying notes are an integral part of these financial statements. | | 21 |
GOLDMAN SACHS INTERNATIONAL SMALL CAP INSIGHTS FUND
Schedule of Investments(continued)
April 30, 2020 (Unaudited)
| | | | | | | | |
| Shares | | |
Description | | Value | |
|
| Common Stocks – (continued) | |
| Japan – (continued) | |
| | 267,000 | | | Daiichikosho Co. Ltd. (Media & Entertainment) | | $ | 8,013,796 | |
| | 118,900 | | | Daiseki Co. Ltd. (Commercial & Professional Services) | | | 2,626,801 | |
| | 1,974,900 | | | DCM Holdings Co. Ltd. (Retailing) | | | 19,297,023 | |
| | 71,500 | | | Demae-Can Co. Ltd. (Retailing) | | | 953,414 | |
| | 2,285,100 | | | DeNA Co. Ltd. (Media & Entertainment) | | | 28,129,793 | |
| | 230,300 | | | Dexerials Corp. (Technology Hardware & Equipment) | | | 1,512,251 | |
| | 19,400 | | | Doshisha Co. Ltd. (Retailing) | | | 238,685 | |
| | 95,100 | | | Doutor Nichires Holdings Co. Ltd. (Consumer Services) | | | 1,439,225 | |
| | 13,200 | | | Dowa Holdings Co. Ltd. (Materials) | | | 365,086 | |
| | 543,100 | | | DTS Corp. (Software & Services) | | | 10,408,982 | |
| | 2,700 | | | Duskin Co. Ltd. (Commercial & Professional Services) | | | 69,771 | |
| | 17,100 | | | Earth Corp. (Household & Personal Products) | | | 991,872 | |
| | 23,600 | | | Ebara Corp. (Capital Goods) | | | 520,297 | |
| | 674,400 | | | EDION Corp. (Retailing) | | | 5,862,066 | |
| | 305,300 | | | EPS Holdings, Inc. (Pharmaceuticals, Biotechnology & Life Sciences) | | | 3,175,181 | |
| | 39,500 | | | Ezaki Glico Co. Ltd. (Food, Beverage & Tobacco) | | | 1,734,841 | |
| | 23,600 | | | FAN Communications, Inc. (Media & Entertainment) | | | 99,164 | |
| | 55,500 | | | Fancl Corp. (Household & Personal Products) | | | 1,330,514 | |
| | 562,600 | | | Fuji Oil Holdings, Inc. (Food, Beverage & Tobacco) | | | 13,125,294 | |
| | 105,300 | | | Fujibo Holdings, Inc. (Consumer Durables & Apparel) | | | 2,815,273 | |
| | 9,700 | | | Fujicco Co. Ltd. (Food, Beverage & Tobacco) | | | 174,359 | |
| | 1,027 | | | Fukuoka REIT Corp. (REIT) | | | 1,032,918 | |
| | 57,000 | | | Fuyo General Lease Co. Ltd. (Diversified Financials) | | | 2,849,959 | |
| | 541,200 | | | Glory Ltd. (Capital Goods) | | | 12,163,051 | |
| | 437,000 | | | Goldcrest Co. Ltd. (Real Estate) | | | 6,592,171 | |
| | 2,170,100 | | | Gree, Inc. (Media & Entertainment) | | | 8,531,323 | |
| | 805,500 | | | Hachijuni Bank Ltd. (The) (Banks) | | | 2,876,322 | |
| | 48,700 | | | Hamakyorex Co. Ltd. (Transportation) | | | 1,331,205 | |
| | 12,207 | | | Heiwa Real Estate REIT, Inc. (REIT) | | | 10,766,485 | |
| | 13,600 | | | HIS Co. Ltd. (Consumer Services) | | | 179,073 | |
| | 277,700 | | | Hogy Medical Co. Ltd. (Health Care Equipment & Services) | | | 8,683,488 | |
| | 1,929,100 | | | Hokuetsu Corp. (Materials) | | | 7,618,123 | |
| | 462 | | | Hoshino Resorts REIT, Inc. (REIT) | | | 1,571,215 | |
| | 91,800 | | | House Foods Group, Inc. (Food, Beverage & Tobacco) | | | 2,891,232 | |
| | 861,700 | | | Ibiden Co. Ltd. (Technology Hardware & Equipment) | | | 22,025,075 | |
| | |
|
| Common Stocks – (continued) | |
| Japan – (continued) | |
| | 11,305 | | | Ichigo Office REIT Investment Corp. (REIT) | | | 7,126,756 | |
| | 87,900 | | | Inabata & Co. Ltd. (Capital Goods) | | | 974,954 | |
| | 326,600 | | | Ines Corp. (Software & Services) | | | 4,282,314 | |
| | 6,300 | | | Infocom Corp. (Software & Services) | | | 150,854 | |
| | 34,803 | | | Invincible Investment Corp. (REIT) | | | 8,904,767 | |
| | 43,500 | | | Itochu Enex Co. Ltd. (Energy) | | | 322,978 | |
| | 99,100 | | | Izumi Co. Ltd. (Retailing) | | | 2,900,903 | |
| | 407,900 | | | Japan Aviation Electronics Industry Ltd. (Technology Hardware & Equipment) | | | 5,291,568 | |
| | 828,700 | | | Japan Lifeline Co. Ltd. (Health Care Equipment & Services) | | | 9,745,572 | |
| | 4,065,900 | | | JVCKenwood Corp. (Consumer Durables & Apparel) | | | 6,462,579 | |
| | 9,100 | | | Kaga Electronics Co. Ltd. (Technology Hardware & Equipment) | | | 164,554 | |
| | 116,300 | | | Kaken Pharmaceutical Co. Ltd. (Pharmaceuticals, Biotechnology & Life Sciences) | | | 6,401,322 | |
| | 1,410,100 | | | Kandenko Co. Ltd. (Capital Goods) | | | 11,799,793 | |
| | 42,100 | | | Kanematsu Electronics Ltd. (Software & Services) | | | 1,427,675 | |
| | 10,144 | | | Kenedix Retail REIT Corp. (REIT) | | | 15,902,072 | |
| | 318,800 | | | Kenedix, Inc. (Real Estate) | | | 1,440,629 | |
| | 86,700 | | | Kinden Corp. (Capital Goods) | | | 1,395,098 | |
| | 887,400 | | | Kitz Corp. (Capital Goods) | | | 5,443,437 | |
| | 524,200 | | | KLab, Inc. (Media & Entertainment)*(a) | | | 3,547,554 | |
| | 29,500 | | | Koei Tecmo Holdings Co. Ltd. (Media & Entertainment) | | | 776,027 | |
| | 529,100 | | | Kohnan Shoji Co. Ltd. (Retailing) | | | 12,280,247 | |
| | 973,800 | | | Kokuyo Co. Ltd. (Commercial & Professional Services) | | | 11,905,468 | |
| | 73,300 | | | Komeri Co. Ltd. (Retailing) | | | 1,423,739 | |
| | 45,900 | | | Konoike Transport Co. Ltd. (Transportation) | | | 494,800 | |
| | 2,050,800 | | | K’s Holdings Corp. (Retailing) | | | 22,342,599 | |
| | 209,500 | | | Kureha Corp. (Materials) | | | 8,449,702 | |
| | 178,600 | | | Kyokuto Kaihatsu Kogyo Co. Ltd. (Capital Goods) | | | 2,083,052 | |
| | 462,500 | | | KYORIN Holdings, Inc. (Pharmaceuticals, Biotechnology & Life Sciences) | | | 9,611,124 | |
| | 392,700 | | | Macnica Fuji Electronics Holdings, Inc. (Technology Hardware & Equipment) | | | 5,345,589 | |
| | 278,500 | | | Mandom Corp. (Household & Personal Products) | | | 5,351,848 | |
| | 31,400 | | | Marvelous, Inc. (Media & Entertainment) | | | 156,515 | |
| | 799,100 | | | Matsumotokiyoshi Holdings Co. Ltd. (Food & Staples Retailing) | | | 27,503,929 | |
| | 12,333 | | | MCUBS MidCity Investment Corp. (REIT) | | | 8,559,939 | |
| | |
| | |
| 22 | | The accompanying notes are an integral part of these financial statements. |
GOLDMAN SACHS INTERNATIONAL SMALL CAP INSIGHTS FUND
| | | | | | | | |
| Shares | | |
Description | | Value | |
|
| Common Stocks – (continued) | |
| Japan – (continued) | |
| | 21,100 | | | Megmilk Snow Brand Co. Ltd. (Food, Beverage & Tobacco) | | $ | 481,430 | |
| | 326,100 | | | Meiko Network Japan Co. Ltd. (Consumer Services) | | | 2,369,327 | |
| | 472,700 | | | Mirait Holdings Corp. (Capital Goods) | | | 6,106,236 | |
| | 101,600 | | | Mitsubishi Logistics Corp. (Transportation) | | | 2,243,246 | |
| | 87,800 | | | Mitsubishi Pencil Co. Ltd. (Commercial & Professional Services) | | | 1,098,882 | |
| | 39,100 | | | Mitsubishi Research Institute, Inc. (Software & Services) | | | 1,324,937 | |
| | 136,400 | | | Mitsui Mining & Smelting Co. Ltd. (Materials) | | | 2,544,845 | |
| | 162,800 | | | Mitsui Sugar Co. Ltd. (Food, Beverage & Tobacco) | | | 3,248,079 | |
| | 155,200 | | | Mixi, Inc. (Media & Entertainment) | | | 2,677,845 | |
| | 610 | | | Mori Trust Hotel Reit, Inc. (REIT) | | | 469,648 | |
| | 102,100 | | | Morinaga Milk Industry Co. Ltd. (Food, Beverage & Tobacco) | | | 3,957,197 | |
| | 69,700 | | | Nagase & Co. Ltd. (Capital Goods) | | | 838,397 | |
| | 521,200 | | | NEC Networks & System Integration Corp. (Software & Services) | | | 22,428,183 | |
| | 73,800 | | | Nichiha Corp. (Capital Goods) | | | 1,348,097 | |
| | 990,200 | | | Nichi-iko Pharmaceutical Co. Ltd. (Pharmaceuticals, Biotechnology & Life Sciences) | | | 12,874,421 | |
| | 200,600 | | | Nihon Chouzai Co. Ltd. (Food & Staples Retailing) | | | 3,318,512 | |
| | 495,400 | | | Nihon Unisys Ltd. (Software & Services) | | | 14,327,412 | |
| | 156,000 | | | Nikkiso Co. Ltd. (Capital Goods) | | | 1,213,831 | |
| | 406,700 | | | Nikkon Holdings Co. Ltd. (Transportation) | | | 7,897,096 | |
| | 408,100 | | | Nippon Electric Glass Co. Ltd. (Technology Hardware & Equipment) | | | 5,945,093 | |
| | 423,300 | | | Nippon Flour Mills Co. Ltd. (Food, Beverage & Tobacco) | | | 6,663,672 | |
| | 33,500 | | | Nippon Kayaku Co. Ltd. (Materials) | | | 324,078 | |
| | 12,049,200 | | | Nippon Light Metal Holdings Co. Ltd. (Materials) | | | 18,976,504 | |
| | 497 | | | NIPPON REIT Investment Corp. (REIT) | | | 1,480,353 | |
| | 888,100 | | | Nippon Suisan Kaisha Ltd. (Food, Beverage & Tobacco) | | | 3,951,569 | |
| | 36,700 | | | Nishio Rent All Co. Ltd. (Capital Goods) | | | 755,688 | |
| | 383,200 | | | Nisshin Oillio Group Ltd. (The) (Food, Beverage & Tobacco) | | | 12,601,889 | |
| | 54,300 | | | Nitto Kogyo Corp. (Capital Goods) | | | 914,775 | |
| | 6,400 | | | Noevir Holdings Co. Ltd. (Household & Personal Products) | | | 299,802 | |
| | |
|
| Common Stocks – (continued) | |
| Japan – (continued) | |
| | 102,300 | | | Nojima Corp. (Retailing) | | | 1,773,167 | |
| | 194,500 | | | Nomura Co. Ltd. (Commercial & Professional Services) | | | 1,473,399 | |
| | 29,900 | | | Noritake Co. Ltd. (Capital Goods) | | | 979,244 | |
| | 520,100 | | | NSD Co. Ltd. (Software & Services) | | | 7,364,770 | |
| | 83,500 | | | OBIC Business Consultants Co. Ltd. (Software & Services) | | | 3,733,638 | |
| | 5,500 | | | Ohsho Food Service Corp. (Consumer Services) | | | 292,605 | |
| | 13,600 | | | Okamura Corp. (Commercial & Professional Services) | | | 98,288 | |
| | 187,500 | | | Oki Electric Industry Co. Ltd. (Technology Hardware & Equipment) | | | 1,803,567 | |
| | 336,450 | | | Okinawa Electric Power Co., Inc. (The) (Utilities) | | | 6,135,496 | |
| | 29 | | | One REIT, Inc. (REIT) | | | 63,357 | |
| | 307,000 | | | Open House Co. Ltd. (Real Estate) | | | 6,692,020 | |
| | 17,300 | | | Organo Corp. (Capital Goods) | | | 918,851 | |
| | 148,000 | | | Paramount Bed Holdings Co. Ltd. (Health Care Equipment & Services) | | | 6,105,562 | |
| | 14,263 | | | Premier Investment Corp. (REIT) | | | 14,322,783 | |
| | 221,400 | | | Prima Meat Packers Ltd. (Food, Beverage & Tobacco) | | | 5,020,148 | |
| | 14,100 | | | Qol Holdings Co. Ltd. (Food & Staples Retailing) | | | 155,889 | |
| | 288,000 | | | Relia, Inc. (Commercial & Professional Services) | | | 3,035,846 | |
| | 403,000 | | | Rengo Co. Ltd. (Materials) | | | 3,139,644 | |
| | 45,900 | | | Riken Vitamin Co. Ltd. (Food, Beverage & Tobacco) | | | 882,471 | |
| | 1,776,000 | | | Riso Kyoiku Co. Ltd. (Consumer Services) | | | 4,219,440 | |
| | 50,500 | | | Rohto Pharmaceutical Co. Ltd. (Household & Personal Products) | | | 1,469,327 | |
| | 25,500 | | | Saizeriya Co. Ltd. (Consumer Services) | | | 505,486 | |
| | 796,800 | | | SAMTY Co. Ltd. (Real Estate)(a) | | | 10,308,092 | |
| | 309,600 | | | Sanki Engineering Co. Ltd. (Capital Goods) | | | 3,490,981 | |
| | 343,000 | | | Sato Holdings Corp. (Commercial & Professional Services) | | | 7,053,380 | |
| | 481,000 | | | Sawai Pharmaceutical Co. Ltd. (Pharmaceuticals, Biotechnology & Life Sciences) | | | 26,264,671 | |
| | 346,800 | | | SCSK Corp. (Software & Services) | | | 15,699,426 | |
| | 764,300 | | | Seiko Holdings Corp. (Consumer Durables & Apparel) | | | 12,690,099 | |
| | 598,600 | | | Seino Holdings Co. Ltd. (Transportation) | | | 7,126,388 | |
| | 19,400 | | | Seiren Co. Ltd. (Consumer Durables & Apparel) | | | 229,696 | |
| | 627,100 | | | Senko Group Holdings Co. Ltd. (Transportation) | | | 5,110,773 | |
| | 269,000 | | | Shimachu Co. Ltd. (Retailing) | | | 6,717,980 | |
| | |
| | |
| The accompanying notes are an integral part of these financial statements. | | 23 |
GOLDMAN SACHS INTERNATIONAL SMALL CAP INSIGHTS FUND
Schedule of Investments(continued)
April 30, 2020 (Unaudited)
| | | | | | | | |
| Shares | | |
Description | | Value | |
|
| Common Stocks – (continued) | |
| Japan – (continued) | |
| | 877,100 | | | Shinko Electric Industries Co. Ltd. (Semiconductors & Semiconductor Equipment) | | $ | 10,948,115 | |
| | 8,200 | | | Showa Sangyo Co. Ltd. (Food, Beverage & Tobacco) | | | 245,562 | |
| | 147,900 | | | Sintokogio Ltd. (Capital Goods) | | | 1,022,394 | |
| | 1,849,200 | | | SKY Perfect JSAT Holdings, Inc. (Media & Entertainment) | | | 6,951,805 | |
| | 114,100 | | | St Marc Holdings Co. Ltd. (Consumer Services) | | | 1,905,174 | |
| | 1,942 | | | Star Asia Investment Corp. (REIT)(a) | | | 1,537,184 | |
| | 38,000 | | | Starts Corp., Inc. (Consumer Durables & Apparel) | | | 735,117 | |
| | 2,000 | | | Strike Co. Ltd. (Diversified Financials) | | | 80,877 | |
| | 240,100 | | | Sugi Holdings Co. Ltd. (Food & Staples Retailing) | | | 14,478,517 | |
| | 219,600 | | | Sumitomo Osaka Cement Co. Ltd. (Materials) | | | 7,146,009 | |
| | 559,600 | | | Sumitomo Warehouse Co. Ltd. (The) (Transportation) | | | 6,387,704 | |
| | 5,000 | | | T Hasegawa Co. Ltd. (Materials) | | | 100,258 | |
| | 22,500 | | | Taikisha Ltd. (Capital Goods) | | | 655,275 | |
| | 2,589,800 | | | Takara Leben Co. Ltd. (Real Estate) | | | 8,480,952 | |
| | 456,600 | | | Takuma Co. Ltd. (Capital Goods) | | | 4,936,595 | |
| | 445,300 | | | Tanseisha Co. Ltd. (Commercial & Professional Services) | | | 2,855,916 | |
| | 28,800 | | | T-Gaia Corp. (Retailing) | | | 572,140 | |
| | 1,733,300 | | | TIS, Inc. (Software & Services) | | | 33,052,967 | |
| | 12,500 | | | TKC Corp. (Software & Services) | | | 617,307 | |
| | 21,100 | | | Toa Corp. (Capital Goods)(a) | | | 276,706 | |
| | 431,900 | | | Toho Holdings Co. Ltd. (Health Care Equipment & Services) | | | 8,944,639 | |
| | 6,400 | | | TOKAI Holdings Corp. (Capital Goods) | | | 57,843 | |
| | 81,300 | | | Tokyo Seimitsu Co. Ltd. (Semiconductors & Semiconductor Equipment) | | | 2,629,802 | |
| | 1,043,100 | | | Tosei Corp. (Real Estate) | | | 10,123,152 | |
| | 508,900 | | | Towa Pharmaceutical Co. Ltd. (Pharmaceuticals, Biotechnology & Life Sciences) | | | 10,492,115 | |
| | 343,100 | | | Toyo Tanso Co. Ltd. (Capital Goods) | | | 4,711,820 | |
| | 219,100 | | | Transcosmos, Inc. (Software & Services) | | | 4,371,840 | |
| | 304,000 | | | Universal Entertainment Corp. (Consumer Durables & Apparel) | | | 4,985,649 | |
| | 617,900 | | | Ushio, Inc. (Capital Goods) | | | 6,515,547 | |
| | 33,200 | | | Valor Holdings Co. Ltd. (Food & Staples Retailing) | | | 616,606 | |
| | 16,700 | | | Vision, Inc. (Telecommunication Services)* | | | 115,062 | |
| | 11,800 | | | Wacoal Holdings Corp. (Consumer Durables & Apparel) | | | 237,993 | |
| | 246,700 | | | Wakita & Co. Ltd. (Capital Goods) | | | 2,273,059 | |
| | |
|
| Common Stocks – (continued) | |
| Japan – (continued) | |
| | 397,000 | | | Yellow Hat Ltd. (Retailing) | | | 5,516,000 | |
| | 263,000 | | | Zenrin Co. Ltd. (Media & Entertainment) | | | 2,772,321 | |
| | | | | | | | |
| | | | | | | 919,701,098 | |
| | |
| Jersey – 0.1% | |
| | 187,922 | | | Sanne Group plc (Diversified Financials) | | | 1,531,539 | |
| | |
| Malaysia – 0.0% | |
| | 50,500 | | | Wing Tai Holdings Ltd. (Real Estate) | | | 61,739 | |
| | |
| Netherlands – 5.0% | |
| | 279,402 | | | ASM International NV (Semiconductors & Semiconductor Equipment) | | | 30,756,050 | |
| | 477,256 | | | BE Semiconductor Industries NV (Semiconductors & Semiconductor Equipment)* | | | 19,751,634 | |
| | 392,329 | | | Euronext NV (Diversified Financials)(b) | | | 32,937,604 | |
| | 35,513 | | | ForFarmers NV (Food, Beverage & Tobacco) | | | 236,615 | |
| | 37,072 | | | NSI NV (REIT)(a) | | | 1,493,305 | |
| | 7,564,859 | | | Pharming Group NV (Pharmaceuticals, Biotechnology & Life Sciences)*(a) | | | 11,158,274 | |
| | 1,461,964 | | | Signify NV (Capital Goods)(b) | | | 29,760,270 | |
| | 164,589 | | | TKH Group NV CVA (Capital Goods) | | | 5,774,364 | |
| | 463,070 | | | TomTom NV (Consumer Durables & Apparel)* | | | 3,645,985 | |
| | | | | | | | |
| | | | | | | 135,514,101 | |
| | |
| New Zealand – 0.2% | |
| | 1,176,763 | | | Contact Energy Ltd. (Utilities) | | | 4,487,896 | |
| | |
| Norway – 4.4% | |
| | 277,944 | | | Atea ASA (Software & Services)* | | | 2,433,203 | |
| | 1,136,960 | | | Austevoll Seafood ASA (Food, Beverage & Tobacco) | | | 8,856,718 | |
| | 4,588,582 | | | Elkem ASA (Materials)(b) | | | 7,632,613 | |
| | 1,222,597 | | | Entra ASA (Real Estate)(a)(b) | | | 15,393,512 | |
| | 2,013,539 | | | Europris ASA (Retailing)(a)(b) | | | 7,390,354 | |
| | 54,028 | | | Fjordkraft Holding ASA (Utilities)(b) | | | 362,769 | |
| | 893,648 | | | Grieg Seafood ASA (Food, Beverage & Tobacco) | | | 8,764,253 | |
| | 4,237,500 | | | Leroy Seafood Group ASA (Food, Beverage & Tobacco) | | | 22,504,116 | |
| | 10,912 | | | Norway Royal Salmon ASA (Food, Beverage & Tobacco) | | | 221,288 | |
| | 660,071 | | | Salmar ASA (Food, Beverage & Tobacco) | | | 25,724,951 | |
| | 24,767 | | | Scatec Solar ASA (Utilities)(b) | | | 360,570 | |
| | 221,836 | | | Selvaag Bolig ASA (Real Estate) | | | 919,247 | |
| | 542,911 | | | SpareBank 1 SMN (Banks) | | | 3,944,657 | |
| | |
| | |
| 24 | | The accompanying notes are an integral part of these financial statements. |
GOLDMAN SACHS INTERNATIONAL SMALL CAP INSIGHTS FUND
| | | | | | | | |
| Shares | | |
Description | | Value | |
|
| Common Stocks – (continued) | |
| Norway – (continued) | |
| | 364,861 | | | TOMRA Systems ASA (Commercial & Professional Services) | | $ | 12,123,169 | |
| | 367,132 | | | Veidekke ASA (Capital Goods) | | | 3,259,556 | |
| | | | | | | | |
| | | | | | | 119,890,976 | |
| | |
| Portugal – 0.1% | |
| | 245,517 | | | CTT-Correios de Portugal SA (Transportation) | | | 578,457 | |
| | 551,618 | | | REN – Redes Energeticas Nacionais SGPS SA (Utilities) | | | 1,494,143 | |
| | | | | | | | |
| | | | | | | 2,072,600 | |
| | |
| Singapore – 1.5% | |
| | 578,300 | | | ARA LOGOS Logistics Trust (REIT) | | | 219,952 | |
| | 1,438,500 | | | China Aviation Oil Singapore Corp. Ltd. (Energy) | | | 1,045,876 | |
| | 7,683,700 | | | ESR-REIT (REIT) | | | 1,841,086 | |
| | 175,900 | | | First REIT (REIT) | | | 99,252 | |
| | 5,906,661 | | | Frasers Logistics & Industrial Trust (REIT) | | | 4,420,695 | |
| | 6,516,000 | | | Golden Agri-Resources Ltd. (Food, Beverage & Tobacco)* | | | 716,554 | |
| | 3,787,100 | | | Keppel DC REIT (REIT) | | | 6,279,974 | |
| | 2,549,100 | | | Keppel REIT (REIT) | | | 1,903,950 | |
| | 1,267,700 | | | Manulife US REIT (REIT) | | | 911,598 | |
| | 1,104,200 | | | Mapletree Industrial Trust (REIT) | | | 1,982,433 | |
| | 4,193,100 | | | Mapletree Logistics Trust (REIT) | | | 5,311,519 | |
| | 4,706,600 | | | Mapletree North Asia Commercial Trust (REIT) | | | 3,125,858 | |
| | 1,011,700 | | | Parkway Life REIT (REIT) | | | 2,363,718 | |
| | 556,300 | | | Sabana Shari’ah Compliant Industrial REIT (REIT) | | | 127,701 | |
| | 3,525,600 | | | Sheng Siong Group Ltd. (Food & Staples Retailing) | | | 3,694,333 | |
| | 1,591,500 | | | Singapore Post Ltd. (Transportation) | | | 820,090 | |
| | 6,550,310 | | | Yanlord Land Group Ltd. (Real Estate) | | | 4,896,588 | |
| | | | | | | | |
| | | | | | | 39,761,177 | |
| | |
| Spain – 1.9% | |
| | 155,503 | | | Almirall SA (Pharmaceuticals, Biotechnology & Life Sciences) | | | 2,005,381 | |
| | 888,806 | | | Applus Services SA (Commercial & Professional Services) | | | 5,831,246 | |
| | 595,286 | | | Cia de Distribucion Integral Logista Holdings SA (Transportation) | | | 10,626,034 | |
| | 21,265 | | | Construcciones y Auxiliar de Ferrocarriles SA (Capital Goods) | | | 728,045 | |
| | 10,672 | | | Corp. Financiera Alba SA (Diversified Financials) | | | 397,699 | |
| | 60,169 | | | Euskaltel SA (Telecommunication Services)(b) | | | 480,016 | |
| | 1,068,626 | | | Faes Farma SA (Pharmaceuticals, Biotechnology & Life Sciences) | | | 4,672,560 | |
| | |
|
| Common Stocks – (continued) | |
| Spain – (continued) | |
| | 675,600 | | | Global Dominion Access SA (Software & Services)*(b) | | | 2,078,518 | |
| | 549,433 | | | Inmobiliaria Colonial SOCIMI SA (REIT) | | | 5,306,941 | |
| | 259,049 | | | Lar Espana Real Estate Socimi SA (REIT) | | | 1,063,126 | |
| | 63,495 | | | Masmovil Ibercom SA (Telecommunication Services)* | | | 1,198,901 | |
| | 592,811 | | | Merlin Properties Socimi SA (REIT) | | | 5,501,357 | |
| | 509,719 | | | Neinor Homes SA (Consumer Durables & Apparel)*(b) | | | 4,466,034 | |
| | 479,535 | | | Solaria Energia y Medio Ambiente SA (Utilities)*(a) | | | 4,892,878 | |
| | 29,057 | | | Viscofan SA (Food, Beverage & Tobacco) | | | 1,862,213 | |
| | 114,043 | | | Zardoya Otis SA (Capital Goods) | | | 793,690 | |
| | | | | | | | |
| | | | | | | 51,904,639 | |
| | |
| Sweden – 5.1% | |
| | 10,146 | | | AF Poyry AB (Commercial & Professional Services)* | | | 184,333 | |
| | 2,209,566 | | | Arjo AB Class B (Health Care Equipment & Services) | | | 10,912,995 | |
| | 489,347 | | | Axfood AB (Food & Staples Retailing) | | | 10,409,795 | |
| | 1,877,907 | | | Betsson AB (Consumer Services)* | | | 10,582,369 | |
| | 79,094 | | | Bilia AB Class A (Retailing) | | | 536,399 | |
| | 567,633 | | | BillerudKorsnas AB (Materials) | | | 7,156,160 | |
| | 21,082 | | | BioArctic AB (Pharmaceuticals, Biotechnology & Life Sciences)(b) | | | 148,217 | |
| | 19,993 | | | BioGaia AB Class B (Pharmaceuticals, Biotechnology & Life Sciences) | | | 963,412 | |
| | 534,138 | | | Biotage AB (Pharmaceuticals, Biotechnology & Life Sciences) | | | 6,602,833 | |
| | 546,169 | | | Bure Equity AB (Diversified Financials) | | | 9,972,439 | |
| | 38,453 | | | Clas Ohlson AB Class B (Retailing) | | | 337,476 | |
| | 1,484,758 | | | Cloetta AB Class B (Food, Beverage & Tobacco)* | | | 3,419,088 | |
| | 1,491,391 | | | Dios Fastigheter AB (Real Estate) | | | 9,183,654 | |
| | 72,757 | | | Dustin Group AB (Retailing)(b) | | | 371,345 | |
| | 122,337 | | | Evolution Gaming Group AB (Consumer Services)(b) | | | 5,602,615 | |
| | 52,888 | | | Fortnox AB (Software & Services) | | | 1,214,358 | |
| | 898,243 | | | Getinge AB Class B (Health Care Equipment & Services) | | | 17,216,892 | |
| | 947,281 | | | Hexpol AB (Materials)* | | | 6,805,494 | |
| | 728,226 | | | Inwido AB (Capital Goods) | | | 4,186,418 | |
| | 1,228,930 | | | Kungsleden AB (Real Estate) | | | 9,358,864 | |
| | 971,054 | | | Lindab International AB (Capital Goods) | | | 8,897,757 | |
| | 228,333 | | | Nobia AB (Consumer Durables & Apparel) | | | 853,720 | |
| | 145,809 | | | Nolato AB Class B (Capital Goods) | | | 7,663,652 | |
| | |
| | |
| The accompanying notes are an integral part of these financial statements. | | 25 |
GOLDMAN SACHS INTERNATIONAL SMALL CAP INSIGHTS FUND
Schedule of Investments(continued)
April 30, 2020 (Unaudited)
| | | | | | | | |
| Shares | | |
Description | | Value | |
|
| Common Stocks – (continued) | |
| Sweden – (continued) | |
| | 72,521 | | | Paradox Interactive AB (Media & Entertainment) | | $ | 1,405,426 | |
| | 69,303 | | | RaySearch Laboratories AB (Health Care Equipment & Services)* | | | 526,856 | |
| | 11,017 | | | Scandi Standard AB (Food, Beverage & Tobacco) | | | 72,025 | |
| | 68,215 | | | Stillfront Group AB (Media & Entertainment)* | | | 4,053,069 | |
| | | | | | | | |
| | | | | | | 138,637,661 | |
| | |
| Switzerland – 5.7% | |
| | 57,270 | | | Allreal Holding AG (Registered) (Real Estate) | | | 10,637,440 | |
| | 48,016 | | | ALSO Holding AG (Registered) (Technology Hardware & Equipment)* | | | 9,878,123 | |
| | 15,268 | | | Bachem Holding AG (Registered) Class B (Pharmaceuticals, Biotechnology & Life Sciences) | | | 3,606,758 | |
| | 241 | | | Belimo Holding AG (Registered) (Capital Goods) | | | 1,604,481 | |
| | 5,079 | | | BKW AG (Utilities) | | | 411,987 | |
| | 58,104 | | | Bucher Industries AG (Registered) (Capital Goods)(a) | | | 16,387,376 | |
| | 66,525 | | | DKSH Holding AG (Commercial & Professional Services) | | | 3,746,084 | |
| | 817 | | | dormakaba Holding AG (Capital Goods)* | | | 407,717 | |
| | 236,715 | | | Huber + Suhner AG (Registered) (Capital Goods) | | | 15,116,455 | |
| | 1,729 | | | Implenia AG (Registered) (Capital Goods) | | | 70,720 | |
| | 2,888 | | | Interroll Holding AG (Registered) (Capital Goods) | | | 5,491,143 | |
| | 704 | | | Intershop Holding AG (Real Estate) | | | 361,408 | |
| | 866,336 | | | IWG plc (Real Estate) | | | 2,590,636 | |
| | 20,732 | | | Kardex AG (Registered) (Capital Goods) | | | 2,994,203 | |
| | 3,010 | | | SFS Group AG (Capital Goods) | | | 238,186 | |
| | 13,407 | | | Siegfried Holding AG (Registered) (Pharmaceuticals, Biotechnology & Life Sciences)* | | | 6,111,099 | |
| | 132,361 | | | Sunrise Communications Group AG (Telecommunication Services)*(b) | | | 10,602,326 | |
| | 100,095 | | | Tecan Group AG (Registered) (Pharmaceuticals, Biotechnology & Life Sciences) | | | 32,224,812 | |
| | 192,462 | | | VAT Group AG (Capital Goods)*(b) | | | 31,764,205 | |
| | 8,955 | | | VZ Holding AG (Diversified Financials) | | | 625,147 | |
| | 8,174 | | | Zur Rose Group AG (Food & Staples Retailing)* | | | 1,344,702 | |
| | | | | | | | |
| | | | | | | 156,215,008 | |
| | |
|
| Common Stocks – (continued) | |
| United Kingdom – 14.8% | |
| | 471,430 | | | Abcam plc (Pharmaceuticals, Biotechnology & Life Sciences) | | | 7,540,829 | |
| | 69,175 | | | AG Barr plc (Food, Beverage & Tobacco) | | | 429,709 | |
| | 587,181 | | | Aggreko plc (Commercial & Professional Services) | | | 3,386,074 | |
| | 154,013 | | | Airtel Africa plc (Telecommunication Services)(b) | | | 77,689 | |
| | 59,689 | | | Arrow Global Group plc (Diversified Financials) | | | 75,789 | |
| | 794,685 | | | Assura plc (REIT) | | | 762,225 | |
| | 260,804 | | | Avast plc (Software & Services)(b) | | | 1,502,222 | |
| | 828,370 | | | B&M European Value Retail SA (Retailing) | | | 3,464,199 | |
| | 1,224,486 | | | Beazley plc (Insurance) | | | 6,054,526 | |
| | 658,717 | | | Bellway plc (Consumer Durables & Apparel) | | | 22,041,567 | |
| | 121,365 | | | Blue Prism Group plc (Software & Services)*(a) | | | 1,983,637 | |
| | 1,217,628 | | | Bodycote plc (Capital Goods) | | | 8,908,016 | |
| | 7,178,915 | | | boohoo Group plc (Retailing)* | | | 29,171,004 | |
| | 145,940 | | | Capital & Counties Properties plc (REIT) | | | 304,781 | |
| | 253,629 | | | Card Factory plc (Retailing) | | | 133,654 | |
| | 2,073,317 | | | Cineworld Group plc (Media & Entertainment) | | | 1,709,325 | |
| | 440,380 | | | Computacenter plc (Software & Services) | | | 8,048,386 | |
| | 2,133,856 | | | ConvaTec Group plc (Health Care Equipment & Services)(b) | | | 5,699,371 | |
| | 11,368 | | | Derwent London plc (REIT) | | | 444,196 | |
| | 356,245 | | | Dialog Semiconductor plc (Semiconductors & Semiconductor Equipment)* | | | 11,187,834 | |
| | 368,212 | | | Diploma plc (Capital Goods) | | | 7,980,885 | |
| | 1,505,711 | | | Drax Group plc (Utilities) | | | 3,947,374 | |
| | 77,306 | | | DS Smith plc (Materials) | | | 303,113 | |
| | 378,301 | | | Dunelm Group plc (Retailing) | | | 4,370,815 | |
| | 63,385 | | | Elementis plc (Materials) | | | 55,883 | |
| | 138,575 | | | Euromoney Institutional Investor plc (Media & Entertainment) | | | 1,439,916 | |
| | 31,905 | | | Fevertree Drinks plc (Food, Beverage & Tobacco) | | | 696,365 | |
| | 1,231 | | | First Derivatives plc (Software & Services) | | | 40,157 | |
| | 596,410 | | | Firstgroup plc (Transportation)* | | | 502,215 | |
| | 81,074 | | | Frasers Group plc (Retailing)* | | | 265,326 | |
| | 81,256 | | | Games Workshop Group plc (Consumer Durables & Apparel) | | | 6,149,827 | |
| | 277,951 | | | GCP Student Living plc (REIT) | | | 469,067 | |
| | 85,302 | | | Go-Ahead Group plc (The) (Transportation) | | | 1,439,552 | |
| | 3,153,789 | | | Great Portland Estates plc (REIT) | | | 26,861,762 | |
| | 1,018,836 | | | Greggs plc (Consumer Services) | | | 23,434,439 | |
| | 1,695,110 | | | HomeServe plc (Commercial & Professional Services) | | | 23,744,536 | |
| | |
| | |
| 26 | | The accompanying notes are an integral part of these financial statements. |
GOLDMAN SACHS INTERNATIONAL SMALL CAP INSIGHTS FUND
| | | | | | | | |
| Shares | | |
Description | | Value | |
|
| Common Stocks – (continued) | |
| United Kingdom – (continued) | |
| | 2,452,717 | | | Ibstock plc (Materials)(b) | | $ | 6,204,031 | |
| | 3,258,459 | | | IG Group Holdings plc (Diversified Financials) | | | 30,884,465 | |
| | 244,480 | | | IMI plc (Capital Goods) | | | 2,542,123 | |
| | 227,338 | | | Inchcape plc (Retailing) | | | 1,432,024 | |
| | 730,810 | | | Indivior plc (Pharmaceuticals, Biotechnology & Life Sciences)* | | | 453,969 | |
| | 2,766,595 | | | Jupiter Fund Management plc (Diversified Financials) | | | 7,605,317 | |
| | 8,577 | | | Keller Group plc (Capital Goods) | | | 66,262 | |
| | 10,318,029 | | | Man Group plc (Diversified Financials) | | | 17,286,912 | |
| | 995,891 | | | Marshalls plc (Materials) | | | 7,976,243 | |
| | 326,457 | | | Marston’s plc (Consumer Services) | | | 155,259 | |
| | 5,968,995 | | | Moneysupermarket.com Group plc (Retailing) | | | 23,782,183 | |
| | 100,952 | | | Morgan Sindall Group plc (Capital Goods) | | | 1,626,671 | |
| | 792,710 | | | National Express Group plc (Transportation) | | | 2,727,825 | |
| | 149,925 | | | NCC Group plc (Software & Services) | | | 309,720 | |
| | 27,484 | | | On the Beach Group plc (Retailing)(b) | | | 96,165 | |
| | 746,753 | | | Pagegroup plc (Commercial & Professional Services) | | | 3,536,413 | |
| | 1,446,917 | | | Paragon Banking Group plc (Banks) | | | 6,057,881 | |
| | 1,119,799 | | | Pennon Group plc (Utilities) | | | 15,419,459 | |
| | 529,965 | | | Phoenix Group Holdings plc (Insurance) | | | 4,021,546 | |
| | 26,968 | | | Playtech plc (Consumer Services) | | | 79,118 | |
| | 11,260 | | | Polypipe Group plc (Capital Goods) | | | 70,634 | |
| | 175,891 | | | PZ Cussons plc (Household & Personal Products) | | | 414,270 | |
| | 38,825 | | | Rightmove plc (Media & Entertainment) | | | 242,751 | |
| | 1,939,685 | | | Rotork plc (Capital Goods) | | | 6,046,820 | |
| | 527,854 | | | RWS Holdings plc (Commercial & Professional Services) | | | 3,565,249 | |
| | 1,305,882 | | | Safestore Holdings plc (REIT) | | | 11,813,035 | |
| | 133,270 | | | Spectris plc (Technology Hardware & Equipment) | | | 4,493,959 | |
| | 1,799,632 | | | Spirent Communications plc (Technology Hardware & Equipment) | | | 5,443,840 | |
| | 38,643 | | | St Modwen Properties plc (Real Estate) | | | 179,078 | |
| | 443,036 | | | Stagecoach Group plc (Transportation) | | | 415,401 | |
| | 155,516 | | | TalkTalk Telecom Group plc (Telecommunication Services) | | | 161,500 | |
| | 1,708,997 | | | Tate & Lyle plc (Food, Beverage & Tobacco) | | | 15,313,246 | |
| | 11,170 | | | Telecom Plus plc (Utilities) | | | 186,268 | |
| | |
|
| Common Stocks – (continued) | |
| United Kingdom – (continued) | |
| | 1,446,682 | | | Tritax Big Box REIT plc (REIT) | | | 2,195,799 | |
| | 54,223 | | | UNITE Group plc (The) (REIT) | | | 598,742 | |
| | 676,627 | | | Vistry Group plc (Consumer Durables & Apparel) | | | 6,871,534 | |
| | 61,436 | | | Watkin Jones plc (Real Estate) | | | 133,269 | |
| | 51,896 | | | Workspace Group plc (REIT) | | | 511,150 | |
| | | | | | | | |
| | | | | | | 405,546,396 | |
| | |
| TOTAL INVESTMENTS BEFORE SECURITIES LENDING
REINVESTMENT VEHICLE |
|
| | (Cost $2,846,266,945) | | $ | 2,701,506,644 | |
| | |
| | | | | | |
| Shares | | Dividend
Rate | | Value | |
|
| Securities Lending Reinvestment Vehicle(d) – 1.4% | |
Goldman Sachs Financial Square Government Fund – Institutional Shares | |
| 38,959,357 | | 0.233% | | $ | 38,959,357 | |
| (Cost $38,959,357) | | | | |
| |
| TOTAL INVESTMENTS – 100.1% | |
| (Cost $2,885,226,302) | | $ | 2,740,466,001 | |
| |
LIABILITIES IN EXCESS OF OTHER ASSETS – (0.1)% | | | (2,113,858 | ) |
| |
| NET ASSETS – 100.0% | | $ | 2,738,352,143 | |
| |
| | |
|
| The percentage shown for each investment category reflects the value of investments in that category as a percentage of net assets. |
| |
* | | Non-income producing security. |
| |
(a) | | All or a portion of security is on loan. |
| |
(b) | | Exempt from registration under Rule 144A of the Securities Act of 1933. |
| |
(c) | | Preference Shares are a special type of equity investment that shares in the earnings of the company, has limited voting rights, and receives a greater dividend than applicable Common Shares. |
| |
(d) | | Represents an Affiliated Issuer. |
| | |
|
Investment Abbreviations: |
CVA | | —Dutch Certification |
REIT | | —Real Estate Investment Trust |
|
| | |
| The accompanying notes are an integral part of these financial statements. | | 27 |
GOLDMAN SACHS INTERNATIONAL SMALL CAP INSIGHTS FUND
Schedule of Investments(continued)
April 30, 2020 (Unaudited)
|
| ADDITIONAL INVESTMENT INFORMATION |
FUTURES CONTRACTS — At April 30, 2020, the Fund had the following futures contracts:
| | | | | | | | | | | | | | | | |
| Description | | Number of
Contracts | | | Expiration
Date | | | Notional
Amount | | | Unrealized
Appreciation/
(Depreciation) | |
Long position contracts: | | | | | | | | | | | | | | | | |
EURO STOXX 50 Index | | | 221 | | | | 06/19/2020 | | | $ | 6,991,819 | | | $ | 598,027 | |
FTSE 100 Index | | | 43 | | | | 06/19/2020 | | | | 3,187,228 | | | | 252,041 | |
Hang Seng Index | | | 2 | | | | 05/28/2020 | | | | 316,053 | | | | 4,536 | |
MSCI Singapore Index | | | 16 | | | | 05/28/2020 | | | | 338,347 | | | | 11,112 | |
SPI 200 Index | | | 19 | | | | 06/18/2020 | | | | 1,714,817 | | | | 132,865 | |
TOPIX Index | | | 41 | | | | 06/11/2020 | | | | 5,555,048 | | | | 519,328 | |
| | | | |
| Total Futures Contracts | | | | | | | | | | | | | | $ | 1,517,909 | |
| | |
| 28 | | The accompanying notes are an integral part of these financial statements. |
GOLDMAN SACHS INTERNATIONAL EQUITY INSIGHTS FUNDS
Statements of Assets and Liabilities
April 30, 2020 (Unaudited)
| | | | | | | | | | | | | | |
| | | | | Emerging Markets
Equity Insights
Fund | | | International
Equity Insights
Fund | | | International
Small Cap Insights
Fund | |
| | Assets: | |
| | Investments in unaffiliated issuers, at value (cost $1,302,045,937, $2,381,371,400 and $2,846,266,945)(a) | | $ | 1,370,580,098 | | | $ | 2,324,671,420 | | | $ | 2,701,506,644 | |
| | Investments in affiliated securities lending reinvestment vehicle, at value (cost $2,348,900, $28,790,720 and $38,959,357) | | | 2,348,900 | | | | 28,790,720 | | | | 38,959,357 | |
| | Cash | | | — | | | | 2,029,252 | | | | — | |
| | Foreign currencies, at value (cost $3,050,894, $6,851,182 and $15,380,833) | | | 3,076,504 | | | | 6,970,642 | | | | 15,522,667 | |
| | Receivables: | | | | | | | | | | | | |
| | Investments sold | | | 24,598,146 | | | | 63,548,120 | | | | 26,164,424 | |
| | Dividends | | | 4,332,206 | | | | 9,043,808 | | | | 16,723,055 | |
| | Fund shares sold | | | 2,231,737 | | | | 3,171,526 | | | | 1,942,577 | |
| | Foreign tax reclaims | | | 83,182 | | | | 4,330,979 | | | | 5,625,415 | |
| | Reimbursement from investment adviser | | | 28,338 | | | | 90,822 | | | | 124,297 | |
| | Securities lending income | | | 7,553 | | | | 65,833 | | | | 48,003 | |
| | Collateral on certain derivative contracts(b) | | | — | | | | — | | | | 2,176,418 | |
| | Variation margin on futures | | | — | | | | 132,299 | | | | 17,645 | |
| | Other assets | | | 68,887 | | | | 101,978 | | | | 80,233 | |
| | Total assets | | | 1,407,355,551 | | | | 2,442,947,399 | | | | 2,808,890,735 | |
| | | | | | | | | | | | | | |
| | Liabilities: | | | | | | | | | | | | |
| | Payables: | | | | | | | | | | | | |
| | Due to custodian | | | 16,098,127 | | | | — | | | | 4,524,723 | |
| | Investments purchased | | | 4,922,401 | | | | 46,921,814 | | | | 19,481,769 | |
| | Fund shares redeemed | | | 4,417,090 | | | | 6,391,403 | | | | 4,690,796 | |
| | Payable upon return of securities loaned | | | 2,348,900 | | | | 28,790,720 | | | | 38,959,357 | |
| | Management fees | | | 1,107,071 | | | | 1,437,765 | | | | 1,784,522 | |
| | Distribution and Service fees and Transfer Agency fees | | | 82,665 | | | | 198,242 | | | | 158,112 | |
| | Foreign capital gains taxes | | | 37,085 | | | | — | | | | — | |
| | Accrued expenses | | | 512,897 | | | | 332,241 | | | | 939,313 | |
| | Total liabilities | | | 29,526,236 | | | | 84,072,185 | | | | 70,538,592 | |
| | | | | | | | | | | | | | |
| | Net Assets: | | | | | | | | | | | | |
| | Paid-in capital | | | 1,613,672,343 | | | | 2,853,820,661 | | | | 3,524,716,551 | |
| | Total distributable earnings (loss) | | | (235,843,028 | ) | | | (494,945,447 | ) | | | (786,364,408 | ) |
| | | NET ASSETS | | $ | 1,377,829,315 | | | $ | 2,358,875,214 | | | $ | 2,738,352,143 | |
| | | Net Assets: | | | | | | | | | | | | |
| | | Class A | | $ | 53,168,043 | | | $ | 197,987,329 | | | $ | 114,438,119 | |
| | | Class C | | | 5,883,175 | | | | 15,389,667 | | | | 33,434,520 | |
| | | Institutional | | | 765,894,006 | | | | 835,710,845 | | | | 1,400,385,405 | |
| | | Service | | | — | | | | 3,631,812 | | | | — | |
| | | Investor | | | 80,242,000 | | | | 427,571,517 | | | | 151,651,548 | |
| | | Class P | | | 83,997,358 | | | | 371,048,029 | | | | 44,454,509 | |
| | | Class R | | | 23,848,925 | | | | 8,309,737 | | | | — | |
| | | Class R6 | | | 364,795,808 | | | | 499,226,278 | | | | 993,988,042 | |
| | | Total Net Assets | | $ | 1,377,829,315 | | | $ | 2,358,875,214 | | | $ | 2,738,352,143 | |
| | | Shares outstanding $0.001 par value (unlimited shares authorized): | | | | | | | | | | | | |
| | | Class A | | | 6,546,027 | | | | 19,346,486 | | | | 12,089,741 | |
| | | Class C | | | 732,365 | | | | 1,535,215 | | | | 3,652,637 | |
| | | Institutional | | | 94,522,574 | | | | 79,352,192 | | | | 148,104,048 | |
| | | Service | | | — | | | | 351,184 | | | | — | |
| | | Investor | | | 9,915,470 | | | | 42,626,562 | | | | 16,104,987 | |
| | | Class P | | | 10,375,265 | | | | 35,286,872 | | | | 4,691,671 | |
| | | Class R | | | 2,980,732 | | | | 835,063 | | | | — | |
| | | Class R6 | | | 45,061,956 | | | | 47,441,011 | | | | 104,901,458 | |
| | | Net asset value, offering and redemption price per share:(c) | | | | | | | | | | | | |
| | | Class A | | | $8.12 | | | | $10.23 | | | | $9.47 | |
| | | Class C | | | 8.03 | | | | 10.02 | | | | 9.15 | |
| | | Institutional | | | 8.10 | | | | 10.53 | | | | 9.46 | |
| | | Service | | | — | | | | 10.34 | | | | — | |
| | | Investor | | | 8.09 | | | | 10.03 | | | | 9.42 | |
| | | Class P | | | 8.10 | | | | 10.52 | | | | 9.48 | |
| | | Class R | | | 8.00 | | | | 9.95 | | | | — | |
| | | Class R6 | | | 8.10 | | | | 10.52 | | | | 9.48 | |
| | (a) | | Includes loaned securities having a market value of $2,232,401, $27,518,349 and $37,637,116, for the Emerging Markets Equity Insights, International Equity Insights and International Small Cap Insights Funds, respectively. |
| | (b) | | Includes amount segregated for initial margin and/or collateral on futures transactions for the International Small Cap Insights Fund. |
| | (c) | | Maximum public offering price per share for Class A Shares of the Emerging Markets Equity Insights, International Equity Insights and International Small Cap Insights Funds is $8.59, $10.83 and $10.02, respectively. At redemption, Class C Shares may be subject to a contingent deferred sales charge assessed on the amount equal to the lesser of the current NAV or the original purchase price of the shares. |
| | |
| The accompanying notes are an integral part of these financial statements. | | 29 |
GOLDMAN SACHS INTERNATIONAL EQUITY INSIGHTS FUNDS
Statements of Operations
For the Six Months Ended April 30, 2020 (Unaudited)
| | | | | | | | | | | | | | |
| | | | | Emerging Markets
Equity Insights
Fund | | | International
Equity Insights
Fund | | | International
Small Cap Insights
Fund | |
| | Investment income: | |
| | | | |
| | Dividends — unaffiliated issuers (net of foreign taxes withheld of $1,812,215, $2,940,087 and $3,007,395) | | $ | 19,986,936 | | | $ | 29,571,323 | | | $ | 33,370,486 | |
| | | | |
| | Securities lending income — affiliated issuer | | | 48,064 | | | | 127,169 | | | | 274,805 | |
| | | | |
| | Dividends — affiliated issuers | | | 11,390 | | | | 28,783 | | | | 599 | |
| | | | |
| | Total investment income | | | 20,046,390 | | | | 29,727,275 | | | | 33,645,890 | |
| | | | | | | | | | | | | | |
| | Expenses: | |
| | | | |
| | Management fees | | | 8,424,024 | | | | 10,541,383 | | | | 14,360,898 | |
| | | | |
| | Custody, accounting and administrative services | | | 534,728 | | | | 305,480 | | | | 507,261 | |
| | | | |
| | Transfer Agency fees(a) | | | 442,664 | | | | 1,041,462 | | | | 913,234 | |
| | | | |
| | Distribution and Service fees(a) | | | 184,143 | | | | 432,423 | | | | 405,527 | |
| | | | |
| | Printing and mailing costs | | | 93,303 | | | | 132,759 | | | | 393,270 | |
| | | | |
| | Registration fees | | | 85,034 | | | | 114,863 | | | | 81,372 | |
| | | | |
| | Professional fees | | | 54,149 | | | | 54,454 | | | | 53,029 | |
| | | | |
| | Trustee fees | | | 10,671 | | | | 11,758 | | | | 12,546 | |
| | | | |
| | Service share fees — Service and Shareholder Administration Plan | | | — | | | | 11,660 | | | | — | |
| | | | |
| | Other | | | 68,132 | | | | 32,654 | | | | 55,181 | |
| | | | |
| | Total expenses | | | 9,896,848 | | | | 12,678,896 | | | | 16,782,318 | |
| | | | |
| | Less — expense reductions | | | (415,433 | ) | | | (642,800 | ) | | | (870,448 | ) |
| | | | |
| | Net expenses | | | 9,481,415 | | | | 12,036,096 | | | | 15,911,870 | |
| | | | |
| | NET INVESTMENT INCOME | | | 10,564,975 | | | | 17,691,179 | | | | 17,734,020 | |
| | | | |
| | | | | | | | | | | | | | |
| | Realized and unrealized gain (loss): | |
| | | | |
| | Net realized gain (loss) from: | | | | | | | | | | | | |
| | | | |
| | Investments — unaffiliated issuers | | | (118,805,322 | ) | | | (223,353,770 | ) | | | (291,705,363 | ) |
| | | | |
| | Futures contracts | | | (239,504 | ) | | | 7,234,263 | | | | (11,346 | ) |
| | | | |
| | Foreign currency transactions | | | (1,810,464 | ) | | | 959,475 | | | | (3,101,826 | ) |
| | | | |
| | Net change in unrealized gain (loss) on: | | | | | | | | | | | | |
| | | | |
| | Investments — unaffiliated issuers (including the effects of the net change in the foreign capital gains tax liability of $421,879, $0 and $0) | | | (90,682,783 | ) | | | (239,264,337 | ) | | | (377,825,079 | ) |
| | | | |
| | Futures contracts | | | — | | | | 357,758 | | | | 1,509,678 | |
| | | | |
| | Foreign currency translation | | | 533,330 | | | | 107,571 | | | | (78,698 | ) |
| | | | |
| | Net realized and unrealized loss | | | (211,004,743 | ) | | | (453,959,040 | ) | | | (671,212,634 | ) |
| | | | |
| | NET DECREASE IN NET ASSETS RESULTING FROM OPERATIONS | | $ | (200,439,768 | ) | | $ | (436,267,861 | ) | | $ | (653,478,614 | ) |
| | (a) | | Class specific Distribution and/or Service, and Transfer Agency fees were as follows: |
| | | | | | | | | | | | | | | | | | | | | | | | | | | | | | | | | | | | | | | | | | | | |
| | | Distribution and/or Service Fees | | | Transfer Agency Fees | |
Fund | | Class A | | | Class C | | | Class R | | | Class A | | | Class C | | | Institutional | | | Service | | | Investor | | | Class P | | | Class R | | | Class R6 | |
Emerging Markets Equity Insights | | $ | 81,263 | | | $ | 36,255 | | | $ | 66,625 | | | $ | 55,259 | | | $ | 6,163 | | | $ | 184,011 | | | $ | — | | | $ | 90,709 | | | $ | 17,099 | | | $ | 22,652 | | | $ | 66,771 | |
International Equity Insights | | | 312,389 | | | | 98,860 | | | | 21,174 | | | | 212,424 | | | | 16,806 | | | | 218,652 | | | | 933 | | | | 447,028 | | | | 52,475 | | | | 7,199 | | | | 85,945 | |
International Small Cap Insights | | | 182,837 | | | | 222,690 | | | | — | | | | 124,329 | | | | 37,857 | | | | 386,562 | | | | — | | | | 187,651 | | | | 10,163 | | | | — | | | | 166,672 | |
| | |
| 30 | | The accompanying notes are an integral part of these financial statements. |
GOLDMAN SACHS INTERNATIONAL EQUITY INSIGHTS FUNDS
Statements of Changes in Net Assets
| | | | | | | | | | | | | | | | | | | | | | |
| | | | | Emerging Markets Equity Insights Fund | | | | | | International Equity Insights Fund | |
| | | | | For the
Six Months Ended
April 30, 2020
(Unaudited) | | | For the Fiscal
Year Ended
October 31, 2019 | | | | | | For the
Six Months Ended
April 30, 2020
(Unaudited) | | | For the Fiscal
Year Ended
October 31, 2019 | |
| | From operations: | | | | | | | | | | | | | |
| | Net investment income | | $ | 10,564,975 | | | $ | 37,179,379 | | | | | | | $ | 17,691,179 | | | $ | 68,116,968 | |
| | Net realized loss | | | (120,855,290 | ) | | | (155,271,349 | ) | | | | | | | (215,160,032 | ) | | | (211,846,876 | ) |
| | Net change in unrealized gain (loss) | | | (90,149,453 | ) | | | 228,850,921 | | | | | | | | (238,799,008 | ) | | | 344,013,406 | |
| | Net increase (decrease) in net assets resulting from operations | | | (200,439,768 | ) | | | 110,758,951 | | | | | | | | (436,267,861 | ) | | | 200,283,498 | |
| | | | | | | | | | | | | | | | | | | | | | |
| | Distributions to shareholders: | | | | | | | | | | | | | |
| | From distributable earnings: | | | | | | | | | | | | | | | | | | | | |
| | Class A Shares | | | (1,170,011 | ) | | | (1,382,695 | ) | | | | | | | (6,053,941 | ) | | | (2,441,498 | ) |
| | Class C Shares | | | (56,474 | ) | | | (82,497 | ) | | | | | | | (273,424 | ) | | | (230,590 | ) |
| | Institutional Shares | | | (19,988,850 | ) | | | (21,025,697 | ) | | | | | | | (30,508,959 | ) | | | (21,903,837 | ) |
| | Service Shares | | | — | | | | — | | | | | | | | (105,545 | ) | | | (64,202 | ) |
| | Investor Shares | | | (2,202,457 | ) | | | (2,145,536 | ) | | | | | | | (14,717,983 | ) | | | (7,168,724 | ) |
| | Class P Shares | | | (2,563,794 | ) | | | (3,090,275 | ) | | | | | | | (9,256,226 | ) | | | (5,642,654 | ) |
| | Class R Shares | | | (438,620 | ) | | | (318,449 | ) | | | | | | | (176,443 | ) | | | (107,227 | ) |
| | Class R6 Shares | | | (9,800,344 | ) | | | (11,923,948 | ) | | | | | | | (15,101,395 | ) | | | (8,467,600 | ) |
| | Total distributions to shareholders | | | (36,220,550 | ) | | | (39,969,097 | ) | | | | | | | (76,193,916 | ) | | | (46,026,332 | ) |
| | | | | | | | | | | | | | | | | | | | | | |
| | From share transactions: | | | | | | | | | | | | | |
| | Proceeds from sales of shares | | | 297,174,611 | | | | 878,269,720 | | | | | | | | 711,549,202 | | | | 1,976,021,453 | |
| | Reinvestment of distributions | | | 33,859,110 | | | | 37,448,911 | | | | | | | | 61,919,453 | | | | 36,692,122 | |
| | Cost of shares redeemed | | | (499,140,806 | ) | | | (1,146,688,181 | ) | | | | | | | (951,436,555 | ) | | | (1,724,995,996 | ) |
| | Net increase (decrease) in net assets resulting from share transactions | | | (168,107,085 | ) | | | (230,969,550 | ) | | | | | | | (177,967,900 | ) | | | 287,717,579 | |
| | TOTAL INCREASE (DECREASE) | | | (404,767,403 | ) | | | (160,179,696 | ) | | | | | | | (690,429,677 | ) | | | 441,974,745 | |
| | | | | | | | | | | | | | | | | | | | | | |
| | Net Assets: | | | | | | | | | | | | | |
| | Beginning of period | | | 1,782,596,718 | | | | 1,942,776,414 | | | | | | | | 3,049,304,891 | | | | 2,607,330,146 | |
| | End of period | | $ | 1,377,829,315 | | | $ | 1,782,596,718 | | | | | | | $ | 2,358,875,214 | | | $ | 3,049,304,891 | |
| | |
| The accompanying notes are an integral part of these financial statements. | | 31 |
GOLDMAN SACHS INTERNATIONAL EQUITY INSIGHTS FUNDS
Statements of Changes in Net Assets(continued)
| | | | | | | | | | |
| | | | | International Small Cap Insights Fund | |
| | | | | For the
Six Months Ended
April 30, 2020
(Unaudited) | | | For the Fiscal
Year Ended
October 31, 2019 | |
| | From operations: | |
| | | |
| | Net investment income | | $ | 17,734,020 | | | $ | 75,247,934 | |
| | | |
| | Net realized loss | | | (294,818,535 | ) | | | (264,294,218 | ) |
| | | |
| | Net change in unrealized gain (loss) | | | (376,394,099 | ) | | | 427,695,952 | |
| | | |
| | Net increase (decrease) in net assets resulting from operations | | | (653,478,614 | ) | | | 238,649,668 | |
| | | | | | | | | | |
| | Distributions to shareholders: | | | | | | | | |
| | | |
| | From distributable earnings: | | | | | | | | |
| | | |
| | Class A Shares | | | (5,023,326 | ) | | | (1,847,569 | ) |
| | | |
| | Class C Shares | | | (1,160,269 | ) | | | (140,227 | ) |
| | | |
| | Institutional Shares | | | (75,418,332 | ) | | | (35,596,707 | ) |
| | | |
| | Investor Shares | | | (8,589,904 | ) | | | (5,911,450 | ) |
| | | |
| | Class P Shares | | | (2,779,660 | ) | | | (1,347,821 | ) |
| | | |
| | Class R6 Shares | | | (41,125,645 | ) | | | (16,511,878 | ) |
| | | |
| | Total distributions to shareholders | | | (134,097,136 | ) | | | (61,355,652 | ) |
| | | | | | | | | | |
| | From share transactions: | | | | | | | | |
| | | |
| | Proceeds from sales of shares | | | 499,347,899 | | | | 1,411,878,385 | |
| | | |
| | Reinvestment of distributions | | | 123,448,591 | | | | 56,353,633 | |
| | | |
| | Cost of shares redeemed | | | (993,552,736 | ) | | | (1,960,823,746 | ) |
| | | |
| | Net decrease in net assets resulting from share transactions | | | (370,756,246 | ) | | | (492,591,728 | ) |
| | | |
| | TOTAL DECREASE | | | (1,158,331,996 | ) | | | (315,297,712 | ) |
| | | | | | | | | | |
| | Net Assets: | | | | | | | | |
| | | |
| | Beginning of period | | | 3,896,684,139 | | | | 4,211,981,851 | |
| | | |
| | End of period | | $ | 2,738,352,143 | | | $ | 3,896,684,139 | |
| | |
| 32 | | The accompanying notes are an integral part of these financial statements. |
GOLDMAN SACHS EMERGING MARKETS EQUITY INSIGHTS FUND
Financial Highlights
Selected Data for a Share Outstanding Throughout Each Period
| | | | | | | | | | | | | | | | | | | | | | | | | | |
| | | | | Goldman Sachs Emerging Markets Equity Insights Fund | |
| | | | | Class A Shares | |
| | | | | Six Months Ended
April 30, 2020 (Unaudited) | | | Year Ended October 31, | |
| | | | | 2019 | | | 2018 | | | 2017 | | | 2016 | | | 2015 | |
| | Per Share Data | | | | | | | | | | | | | | | | | | | | | | | | |
| | | | | | | |
| | Net asset value, beginning of period | | $ | 9.34 | | | $ | 8.98 | | | $ | 11.00 | | | $ | 8.54 | | | $ | 7.92 | | | $ | 8.99 | |
| | | | | | | |
| | Net investment income(a) | | | 0.04 | | | | 0.15 | | | | 0.18 | | | | 0.13 | | | | 0.10 | | | | 0.11 | |
| | | | | | | |
| | Net realized and unrealized gain (loss) | | | (1.11 | ) | | | 0.36 | | | | (1.66 | ) | | | 2.41 | | | | 0.59 | | | | (0.98 | ) |
| | | | | | | |
| | Total from investment operations | | | (1.07 | ) | | | 0.51 | | | | (1.48 | ) | | | 2.54 | | | | 0.69 | | | | (0.87 | ) |
| | | | | | | |
| | Distributions to shareholders from net investment income | | | (0.15 | ) | | | (0.15 | ) | | | (0.12 | ) | | | (0.08 | ) | | | (0.07 | ) | | | (0.13 | ) |
| | | | | | | |
| | Distributions to shareholders from net realized gains | | | — | | | | — | | | | (0.42 | ) | | | — | | | | — | | | | (0.07 | ) |
| | | | | | | |
| | Total distributions | | | (0.15 | ) | | | (0.15 | ) | | | (0.54 | ) | | | (0.08 | ) | | | (0.07 | ) | | | (0.20 | ) |
| | | | | | | |
| | Net asset value, end of period | | $ | 8.12 | | | $ | 9.34 | | | $ | 8.98 | | | $ | 11.00 | | | $ | 8.54 | | | $ | 7.92 | |
| | | | | | | |
| | Total return(b) | | | (11.60 | )% | | | 5.74 | % | | | (14.11 | )% | | | 30.15 | % | | | 8.79 | % | | | (9.84 | )% |
| | | | | | | |
| | Net assets, end of period (in 000s) | | $ | 53,168 | | | $ | 72,886 | | | $ | 82,726 | | | $ | 95,930 | | | $ | 50,289 | | | $ | 37,307 | |
| | | | | | | |
| | Ratio of net expenses to average net assets | | | 1.47 | %(c) | | | 1.48 | % | | | 1.48 | % | | | 1.52 | % | | | 1.56 | % | | | 1.58 | % |
| | | | | | | |
| | Ratio of total expenses to average net assets | | | 1.52 | %(c) | | | 1.56 | % | | | 1.54 | % | | | 1.55 | % | | | 1.63 | % | | | 1.67 | % |
| | | | | | | |
| | Ratio of net investment income to average net assets | | | 0.91 | %(c) | | | 1.61 | % | | | 1.72 | % | | | 1.36 | % | | | 1.24 | % | | | 1.30 | % |
| | | | | | | |
| | Portfolio turnover rate(d) | | | 86 | % | | | 165 | % | | | 147 | % | | | 172 | % | | | 216 | % | | | 199 | % |
| | (a) | | Calculated based on the average shares outstanding methodology. |
| | (b) | | Assumes investment at the net asset value at the beginning of the period, reinvestment of all distributions, a complete redemption of the investment at the net asset value at the end of the period and no sales or redemption charges (if any). Total returns would be reduced if a sales or redemption charge was taken into account. Returns do not reflect the impact of taxes to shareholders relating to Fund distributions or the redemption of Fund shares. Total returns for periods less than one full year are not annualized. |
| | (d) | | The Fund’s portfolio turnover rate is calculated in accordance with regulatory requirements, without regard to transactions involving short term investments and certain derivatives. If such transactions were included, the Fund’s portfolio turnover rate may be higher. |
| | |
| The accompanying notes are an integral part of these financial statements. | | 33 |
GOLDMAN SACHS EMERGING MARKETS EQUITY INSIGHTS FUND
Financial Highlights(continued)
Selected Data for a Share Outstanding Throughout Each Period
| | | | | | | | | | | | | | | | | | | | | | | | | | |
| | | | | Goldman Sachs Emerging Markets Equity Insights Fund | |
| | | | | Class C Shares | |
| | | | | Six Months Ended
April 30, 2020 (Unaudited) | | | Year Ended October 31, | |
| | | | | 2019 | | | 2018 | | | 2017 | | | 2016 | | | 2015 | |
| | Per Share Data | | | | | | | | | | | | | | | | | | | | | | | | |
| | | | | | | |
| | Net asset value, beginning of period | | $ | 9.19 | | | $ | 8.83 | | | $ | 10.88 | | | $ | 8.45 | | | $ | 7.84 | | | $ | 8.88 | |
| | | | | | | |
| | Net investment income(a) | | | 0.01 | | | | 0.08 | | | | 0.10 | | | | 0.07 | | | | 0.04 | | | | 0.05 | |
| | | | | | | |
| | Net realized and unrealized gain (loss) | | | (1.10 | ) | | | 0.36 | | | | (1.64 | ) | | | 2.39 | | | | 0.58 | | | | (0.98 | ) |
| | | | | | | |
| | Total from investment operations | | | (1.09 | ) | | | 0.44 | | | | (1.54 | ) | | | 2.46 | | | | 0.62 | | | | (0.93 | ) |
| | | | | | | |
| | Distributions to shareholders from net investment income | | | (0.07 | ) | | | (0.08 | ) | | | (0.09 | ) | | | (0.03 | ) | | | (0.01 | ) | | | (0.04 | ) |
| | | | | | | |
| | Distributions to shareholders from net realized gains | | | — | | | | — | | | | (0.42 | ) | | | — | | | | — | | | | (0.07 | ) |
| | | | | | | |
| | Total distributions | | | (0.07 | ) | | | (0.08 | ) | | | (0.51 | ) | | | (0.03 | ) | | | (0.01 | ) | | | (0.11 | ) |
| | | | | | | |
| | Net asset value, end of period | | $ | 8.03 | | | $ | 9.19 | | | $ | 8.83 | | | $ | 10.88 | | | $ | 8.45 | | | $ | 7.84 | |
| | | | | | | |
| | Total return(b) | | | (12.01 | )% | | | 5.09 | % | | | (14.80 | )% | | | 29.20 | % | | | 7.97 | % | | | (10.50 | )% |
| | | | | | | |
| | Net assets, end of period (in 000s) | | $ | 5,883 | | | $ | 8,303 | | | $ | 8,975 | | | $ | 7,563 | | | $ | 1,132 | | | $ | 1,053 | |
| | | | | | | |
| | Ratio of net expenses to average net assets | | | 2.22 | %(c) | | | 2.23 | % | | | 2.23 | % | | | 2.26 | % | | | 2.31 | % | | | 2.33 | % |
| | | | | | | |
| | Ratio of total expenses to average net assets | | | 2.27 | %(c) | | | 2.31 | % | | | 2.29 | % | | | 2.29 | % | | | 2.39 | % | | | 2.42 | % |
| | | | | | | |
| | Ratio of net investment income to average net assets | | | 0.15 | %(c) | | | 0.85 | % | | | 0.98 | % | | | 0.72 | % | | | 0.47 | % | | | 0.60 | % |
| | | | | | | |
| | Portfolio turnover rate(d) | | | 86 | % | | | 165 | % | | | 147 | % | | | 172 | % | | | 216 | % | | | 199 | % |
| | (a) | | Calculated based on the average shares outstanding methodology. |
| | (b) | | Assumes investment at the net asset value at the beginning of the period, reinvestment of all distributions, a complete redemption of the investment at the net asset value at the end of the period and no sales or redemption charges (if any). Total returns would be reduced if a sales or redemption charge was taken into account. Returns do not reflect the impact of taxes to shareholders relating to Fund distributions or the redemption of Fund shares. Total returns for periods less than one full year are not annualized. |
| | (d) | | The Fund’s portfolio turnover rate is calculated in accordance with regulatory requirements, without regard to transactions involving short term investments and certain derivatives. If such transactions were included, the Fund’s portfolio turnover rate may be higher. |
| | |
| 34 | | The accompanying notes are an integral part of these financial statements. |
GOLDMAN SACHS EMERGING MARKETS EQUITY INSIGHTS FUND
Financial Highlights(continued)
Selected Data for a Share Outstanding Throughout Each Period
| | | | | | | | | | | | | | | | | | | | | | | | | | |
| | | | | Goldman Sachs Emerging Markets Equity Insights Fund | |
| | | | | Institutional Shares | |
| | | | | Six Months Ended
April 30, 2020 (Unaudited) | | | Year Ended October 31, | |
| | | | | 2019 | | | 2018 | | | 2017 | | | 2016 | | | 2015 | |
| | Per Share Data | | | | | | | | | | | | | | | | | | | | | | | | |
| | | | | | | |
| | Net asset value, beginning of period | | $ | 9.33 | | | $ | 8.99 | | | $ | 11.01 | | | $ | 8.54 | | | $ | 7.91 | | | $ | 8.98 | |
| | | | | | | |
| | Net investment income(a) | | | 0.06 | | | | 0.19 | | | | 0.19 | | | | 0.17 | | | | 0.13 | | | | 0.14 | |
| | | | | | | |
| | Net realized and unrealized gain (loss) | | | (1.10 | ) | | | 0.35 | | | | (1.64 | ) | | | 2.41 | | | | 0.60 | | | | (0.98 | ) |
| | | | | | | |
| | Total from investment operations | | | (1.04 | ) | | | 0.54 | | | | (1.45 | ) | | | 2.58 | | | | 0.73 | | | | (0.84 | ) |
| | | | | | | |
| | Distributions to shareholders from net investment income | | | (0.19 | ) | | | (0.20 | ) | | | (0.15 | ) | | | (0.11 | ) | | | (0.10 | ) | | | (0.16 | ) |
| | | | | | | |
| | Distributions to shareholders from net realized gains | | | — | | | | — | | | | (0.42 | ) | | | — | | | | — | | | | (0.07 | ) |
| | | | | | | |
| | Total distributions | | | (0.19 | ) | | | (0.20 | ) | | | (0.57 | ) | | | (0.11 | ) | | | (0.10 | ) | | | (0.23 | ) |
| | | | | | | |
| | Net asset value, end of period | | $ | 8.10 | | | $ | 9.33 | | | $ | 8.99 | | | $ | 11.01 | | | $ | 8.54 | | | $ | 7.91 | |
| | | | | | | |
| | Total return(b) | | | (11.46 | )% | | | 6.18 | % | | | (13.83 | )% | | | 30.67 | % | | | 9.35 | % | | | (9.52 | )% |
| | | | | | | |
| | Net assets, end of period (in 000s) | | $ | 765,894 | | | $ | 938,157 | | | $ | 981,091 | | | $ | 1,488,246 | | | $ | 852,853 | | | $ | 508,685 | |
| | | | | | | |
| | Ratio of net expenses to average net assets | | | 1.09 | %(c) | | | 1.10 | % | | | 1.10 | % | | | 1.15 | % | | | 1.16 | % | | | 1.18 | % |
| | | | | | | |
| | Ratio of total expenses to average net assets | | | 1.14 | %(c) | | | 1.18 | % | | | 1.14 | % | | | 1.15 | % | | | 1.22 | % | | | 1.27 | % |
| | | | | | | |
| | Ratio of net investment income to average net assets | | | 1.29 | %(c) | | | 2.01 | % | | | 1.84 | % | | | 1.74 | % | | | 1.70 | % | | | 1.69 | % |
| | | | | | | |
| | Portfolio turnover rate(d) | | | 86 | % | | | 165 | % | | | 147 | % | | | 172 | % | | | 216 | % | | | 199 | % |
| | (a) | | Calculated based on the average shares outstanding methodology. |
| | (b) | | Assumes investment at the net asset value at the beginning of the period, reinvestment of all distributions, a complete redemption of the investment at the net asset value at the end of the period and no sales or redemption charges (if any). Total returns would be reduced if a sales or redemption charge was taken into account. Returns do not reflect the impact of taxes to shareholders relating to Fund distributions or the redemption of Fund shares. Total returns for periods less than one full year are not annualized. |
| | (d) | | The Fund’s portfolio turnover rate is calculated in accordance with regulatory requirements, without regard to transactions involving short term investments and certain derivatives. If such transactions were included, the Fund’s portfolio turnover rate may be higher. |
| | |
| The accompanying notes are an integral part of these financial statements. | | 35 |
GOLDMAN SACHS EMERGING MARKETS EQUITY INSIGHTS FUND
Financial Highlights(continued)
Selected Data for a Share Outstanding Throughout Each Period
| | | | | | | | | | | | | | | | | | | | | | | | | | |
| | | | | Goldman Sachs Emerging Markets Equity Insights Fund | |
| | | | | Investor Shares(a) | |
| | | | | Six Months Ended
April 30, 2020 (Unaudited) | | | Year Ended October 31, | |
| | | | | 2019 | | | 2018 | | | 2017 | | | 2016 | | | 2015 | |
| | Per Share Data | | | | | | | | | | | | | | | | | | | | | | | | |
| | | | | | | |
| | Net asset value, beginning of period | | $ | 9.32 | | | $ | 8.97 | | | $ | 10.99 | | | $ | 8.53 | | | $ | 7.91 | | | $ | 8.97 | |
| | | | | | | |
| | Net investment income(b) | | | 0.05 | | | | 0.18 | | | | 0.21 | | | | 0.18 | | | | 0.12 | | | | 0.14 | |
| | | | | | | |
| | Net realized and unrealized gain (loss) | | | (1.10 | ) | | | 0.36 | | | | (1.66 | ) | | | 2.38 | | | | 0.59 | | | | (0.99 | ) |
| | | | | | | |
| | Total from investment operations | | | (1.05 | ) | | | 0.54 | | | | (1.45 | ) | | | 2.56 | | | | 0.71 | | | | (0.85 | ) |
| | | | | | | |
| | Distributions to shareholders from net investment income | | | (0.18 | ) | | | (0.19 | ) | | | (0.15 | ) | | | (0.10 | ) | | | (0.09 | ) | | | (0.14 | ) |
| | | | | | | |
| | Distributions to shareholders from net realized gains | | | — | | | | — | | | | (0.42 | ) | | | — | | | | — | | | | (0.07 | ) |
| | | | | | | |
| | Total distributions | | | (0.18 | ) | | | (0.19 | ) | | | (0.57 | ) | | | (0.10 | ) | | | (0.09 | ) | | | (0.21 | ) |
| | | | | | | |
| | Net asset value, end of period | | $ | 8.09 | | | $ | 9.32 | | | $ | 8.97 | | | $ | 10.99 | | | $ | 8.53 | | | $ | 7.91 | |
| | | | | | | |
| | Total return(c) | | | (11.51 | )% | | | 6.06 | % | | | (13.90 | )% | | | 30.47 | % | | | 9.13 | % | | | (9.63 | )% |
| | | | | | | |
| | Net assets, end of period (in 000s) | | $ | 80,242 | | | $ | 118,727 | | | $ | 96,779 | | | $ | 67,068 | | | $ | 2,565 | | | $ | 798 | |
| | | | | | | |
| | Ratio of net expenses to average net assets | | | 1.22 | %(d) | | | 1.23 | % | | | 1.23 | % | | | 1.26 | % | | | 1.31 | % | | | 1.33 | % |
| | | | | | | |
| | Ratio of total expenses to average net assets | | | 1.27 | %(d) | | | 1.31 | % | | | 1.29 | % | | | 1.29 | % | | | 1.37 | % | | | 1.42 | % |
| | | | | | | |
| | Ratio of net investment income to average net assets | | | 1.15 | %(d) | | | 1.92 | % | | | 1.99 | % | | | 1.81 | % | | | 1.53 | % | | | 1.63 | % |
| | | | | | | |
| | Portfolio turnover rate(e) | | | 86 | % | | | 165 | % | | | 147 | % | | | 172 | % | | | 216 | % | | | 199 | % |
| | (a) | | Effective August 15, 2017, Class IR changed its name to Investor Shares. |
| | (b) | | Calculated based on the average shares outstanding methodology. |
| | (c) | | Assumes investment at the net asset value at the beginning of the period, reinvestment of all distributions, a complete redemption of the investment at the net asset value at the end of the period and no sales or redemption charges (if any). Total returns would be reduced if a sales or redemption charge was taken into account. Returns do not reflect the impact of taxes to shareholders relating to Fund distributions or the redemption of Fund shares. Total returns for periods less than one full year are not annualized. |
| | (e) | | The Fund’s portfolio turnover rate is calculated in accordance with regulatory requirements, without regard to transactions involving short term investments and certain derivatives. If such transactions were included, the Fund’s portfolio turnover rate may be higher. |
| | |
| 36 | | The accompanying notes are an integral part of these financial statements. |
GOLDMAN SACHS EMERGING MARKETS EQUITY INSIGHTS FUND
Financial Highlights(continued)
Selected Data for a Share Outstanding Throughout Each Period
| | | | | | | | | | | | | | |
| | | | | Goldman Sachs Emerging Markets Equity Insights Fund | |
| | | | | Class P Shares | |
| | | | | Six Months Ended
April 30, 2020
(Unaudited) | | | Year Ended
October 31, 2019 | | | April 16, 2018*
to
October 31, 2018 | |
| | Per Share Data | | | | | | | | | | | | |
| | | | |
| | Net asset value, beginning of period | | $ | 9.33 | | | $ | 8.98 | | | $ | 10.84 | |
| | | | |
| | Net investment income(a) | | | 0.06 | | | | 0.18 | | | | 0.18 | |
| | | | |
| | Net realized and unrealized gain (loss) | | | (1.10 | ) | | | 0.37 | | | | (2.04 | ) |
| | | | |
| | Total from investment operations | | | (1.04 | ) | | | 0.55 | | | | (1.86 | ) |
| | | | |
| | Distributions to shareholders from net investment income | | | (0.19 | ) | | | (0.20 | ) | | | — | |
| | | | |
| | Net asset value, end of period | | $ | 8.10 | | | $ | 9.33 | | | $ | 8.98 | |
| | | | |
| | Total return(b) | | | (11.56 | )% | | | 6.33 | % | | | (17.16 | )% |
| | | | |
| | Net assets, end of period (in 000s) | | $ | 83,997 | | | $ | 125,429 | | | $ | 130,763 | |
| | | | |
| | Ratio of net expenses to average net assets | | | 1.08 | %(c) | | | 1.09 | % | | | 1.08 | %(c) |
| | | | |
| | Ratio of total expenses to average net assets | | | 1.13 | %(c) | | | 1.17 | % | | | 1.17 | %(c) |
| | | | |
| | Ratio of net investment income to average net assets | | | 1.28 | %(c) | | | 1.96 | % | | | 3.36 | %(c) |
| | | | |
| | Portfolio turnover rate(d) | | | 86 | % | | | 165 | % | | | 147 | % |
| | * | | Commencement of operations. |
| | (a) | | Calculated based on the average shares outstanding methodology. |
| | (b) | | Assumes investment at the net asset value at the beginning of the period, reinvestment of all distributions, a complete redemption of the investment at the net asset value at the end of the period and no sales or redemption charges (if any). Total returns would be reduced if a sales or redemption charge was taken into account. Returns do not reflect the impact of taxes to shareholders relating to Fund distributions or the redemption of Fund shares. Total returns for periods less than one full year are not annualized. |
| | (d) | | The Fund’s portfolio turnover rate is calculated in accordance with regulatory requirements, without regard to transactions involving short term investments and certain derivatives. If such transactions were included, the Fund’s portfolio turnover rate may be higher. |
| | |
| The accompanying notes are an integral part of these financial statements. | | 37 |
GOLDMAN SACHS EMERGING MARKETS EQUITY INSIGHTS FUND
Financial Highlights(continued)
Selected Data for a Share Outstanding Throughout Each Period
| | | | | | | | | | | | | | | | | | | | | | | | | | |
| | | | | Goldman Sachs Emerging Markets Equity Insights Fund | |
| | | | | Class R Shares | |
| | | | | Six Months Ended
April 30, 2020 (Unaudited) | | | Year Ended October 31, | |
| | | | | 2019 | | | 2018 | | | 2017 | | | 2016 | | | 2015 | |
| | Per Share Data | | | | | | | | | | | | | | | | | | | | | | | | |
| | | | | | | |
| | Net asset value, beginning of period | | $ | 9.20 | | | $ | 8.86 | | | $ | 10.87 | | | $ | 8.44 | | | $ | 7.84 | | | $ | 8.94 | |
| | | | | | | |
| | Net investment income(a) | | | 0.03 | | | | 0.12 | | | | 0.15 | | | | 0.10 | | | | 0.08 | | | | 0.09 | |
| | | | | | | |
| | Net realized and unrealized gain (loss) | | | (1.08 | ) | | | 0.36 | | | | (1.64 | ) | | | 2.40 | | | | 0.59 | | | | (0.98 | ) |
| | | | | | | |
| | Total from investment operations | | | (1.05 | ) | | | 0.48 | | | | (1.49 | ) | | | 2.50 | | | | 0.67 | | | | (0.89 | ) |
| | | | | | | |
| | Distributions to shareholders from net investment income | | | (0.15 | ) | | | (0.14 | ) | | | (0.10 | ) | | | (0.07 | ) | | | (0.07 | ) | | | (0.14 | ) |
| | | | | | | |
| | Distributions to shareholders from net realized gains | | | — | | | | — | | | | (0.42 | ) | | | — | | | | — | | | | (0.07 | ) |
| | | | | | | |
| | Total distributions | | | (0.15 | ) | | | (0.14 | ) | | | (0.52 | ) | | | (0.07 | ) | | | (0.07 | ) | | | (0.21 | ) |
| | | | | | | |
| | Net asset value, end of period | | $ | 8.00 | | | $ | 9.20 | | | $ | 8.86 | | | $ | 10.87 | | | $ | 8.44 | | | $ | 7.84 | |
| | | | | | | |
| | Total return(b) | | | (11.73 | )% | | | 5.52 | % | | | (14.34 | )% | | | 29.86 | % | | | 8.57 | % | | | (10.06 | )% |
| | | | | | | |
| | Net assets, end of period (in 000s) | | $ | 23,849 | | | $ | 27,790 | | | $ | 20,852 | | | $ | 19,243 | | | $ | 9,363 | | | $ | 4,547 | |
| | | | | | | |
| | Ratio of net expenses to average net assets | | | 1.72 | %(c) | | | 1.73 | % | | | 1.73 | % | | | 1.77 | % | | | 1.81 | % | | | 1.83 | % |
| | | | | | | |
| | Ratio of total expenses to average net assets | | | 1.77 | %(c) | | | 1.82 | % | | | 1.79 | % | | | 1.79 | % | | | 1.88 | % | | | 1.93 | % |
| | | | | | | |
| | Ratio of net investment income to average net assets | | | 0.67 | %(c) | | | 1.27 | % | | | 1.46 | % | | | 1.06 | % | | | 1.01 | % | | | 1.10 | % |
| | | | | | | |
| | Portfolio turnover rate(d) | | | 86 | % | | | 165 | % | | | 147 | % | | | 172 | % | | | 216 | % | | | 199 | % |
| | (a) | | Calculated based on the average shares outstanding methodology. |
| | (b) | | Assumes investment at the net asset value at the beginning of the period, reinvestment of all distributions, a complete redemption of the investment at the net asset value at the end of the period and no sales or redemption charges (if any). Total returns would be reduced if a sales or redemption charge was taken into account. Returns do not reflect the impact of taxes to shareholders relating to Fund distributions or the redemption of Fund shares. Total returns for periods less than one full year are not annualized. |
| | (d) | | The Fund’s portfolio turnover rate is calculated in accordance with regulatory requirements, without regard to transactions involving short term investments and certain derivatives. If such transactions were included, the Fund’s portfolio turnover rate may be higher. |
| | |
| 38 | | The accompanying notes are an integral part of these financial statements. |
GOLDMAN SACHS EMERGING MARKETS EQUITY INSIGHTS FUND
Financial Highlights(continued)
Selected Data for a Share Outstanding Throughout Each Period
| | | | | | | | | | | | | | | | | | | | | | | | | | |
| | | | | Goldman Sachs Emerging Markets Equity Insights Fund | |
| | | | | Class R6 Shares | |
| | | | | Six Months Ended
April 30, 2020 (Unaudited) | | | Year Ended October 31, | | | July 31, 2015*
to
October 31, 2015 | |
| | | | | 2019 | | | 2018 | | | 2017 | | | 2016 | |
| | Per Share Data | | | | | | | | | | | | | | | | | | | | | | | | |
| | | | | | | |
| | Net asset value, beginning of period | | $ | 9.33 | | | $ | 8.98 | | | $ | 11.00 | | | $ | 8.53 | | | $ | 7.91 | | | $ | 8.40 | |
| | | | | | | |
| | Net investment income(a) | | | 0.06 | | | | 0.17 | | | | 0.29 | | | | 0.19 | | | | 0.10 | | | | 0.01 | |
| | | | | | | |
| | Net realized and unrealized gain (loss) | | | (1.10 | ) | | | 0.38 | | | | (1.73 | ) | | | 2.39 | | | | 0.62 | | | | (0.50 | ) |
| | | | | | | |
| | Total from investment operations | | | (1.04 | ) | | | 0.55 | | | | (1.44 | ) | | | 2.58 | | | | 0.72 | | | | (0.49 | ) |
| | | | | | | |
| | Distributions to shareholders from net investment income | | | (0.19 | ) | | | (0.20 | ) | | | (0.16 | ) | | | (0.11 | ) | | | (0.10 | ) | | | — | |
| | | | | | | |
| | Distributions to shareholders from net realized gains | | | — | | | | — | | | | (0.42 | ) | | | — | | | | — | | | | — | |
| | | | | | | |
| | Total distributions | | | (0.19 | ) | | | (0.20 | ) | | | (0.58 | ) | | | (0.11 | ) | | | (0.10 | ) | | | — | |
| | | | | | | |
| | Net asset value, end of period | | $ | 8.10 | | | $ | 9.33 | | | $ | 8.98 | | | $ | 11.00 | | | $ | 8.53 | | | $ | 7.91 | |
| | | | | | | |
| | Total return(b) | | | (11.56 | )% | | | 6.32 | % | | | (13.84 | )% | | | 30.74 | % | | | 9.27 | % | | | (5.83 | )% |
| | | | | | | |
| | Net assets, end of period (in 000s) | | $ | 364,796 | | | $ | 491,306 | | | $ | 621,590 | | | $ | 13,164 | | | $ | 1,637 | | | $ | 9 | |
| | | | | | | |
| | Ratio of net expenses to average net assets | | | 1.08 | %(c) | | | 1.09 | % | | | 1.08 | % | | | 1.13 | % | | | 1.13 | % | | | 1.17 | %(c) |
| | | | | | | |
| | Ratio of total expenses to average net assets | | | 1.13 | %(c) | | | 1.17 | % | | | 1.15 | % | | | 1.13 | % | | | 1.16 | % | | | 1.28 | %(c) |
| | | | | | | |
| | Ratio of net investment income to average net assets | | | 1.30 | %(c) | | | 1.89 | % | | | 2.78 | % | | | 1.87 | % | | | 1.26 | % | | | 0.59 | %(c) |
| | | | | | | |
| | Portfolio turnover rate(d) | | | 86 | % | | | 165 | % | | | 147 | % | | | 172 | % | | | 216 | % | | | 199 | % |
| | * | | Commencement of operations. |
| | (a) | | Calculated based on the average shares outstanding methodology. |
| | (b) | | Assumes investment at the net asset value at the beginning of the period, reinvestment of all distributions, a complete redemption of the investment at the net asset value at the end of the period and no sales or redemption charges (if any). Total returns would be reduced if a sales or redemption charge was taken into account. Returns do not reflect the impact of taxes to shareholders relating to Fund distributions or the redemption of Fund shares. Total returns for periods less than one full year are not annualized. |
| | (d) | | The Fund’s portfolio turnover rate is calculated in accordance with regulatory requirements, without regard to transactions involving short term investments and certain derivatives. If such transactions were included, the Fund’s portfolio turnover rate may be higher. |
| | |
| The accompanying notes are an integral part of these financial statements. | | 39 |
GOLDMAN SACHS INTERNATIONAL EQUITY INSIGHTS FUND
Financial Highlights(continued)
Selected Data for a Share Outstanding Throughout Each Period
| | | | | | | | | | | | | | | | | | | | | | | | | | |
| | | | | Goldman Sachs International Equity Insights Fund | |
| | | | | Class A Shares | |
| | | | | Six Months Ended
April 30, 2020 (Unaudited) | | | Year Ended October 31, | |
| | | | | 2019 | | | 2018 | | | 2017 | | | 2016 | | | 2015 | |
| | Per Share Data | | | | | | | | | | | | | | | | | | | | | | | | |
| | | | | | | |
| | Net asset value, beginning of period | | $ | 12.46 | | | $ | 11.88 | | | $ | 13.19 | | | $ | 10.53 | | | $ | 10.54 | | | $ | 10.69 | |
| | | | | | | |
| | Net investment income(a) | | | 0.06 | | | | 0.23 | | | | 0.23 | | | | 0.18 | | | | 0.18 | | | | 0.18 | |
| | | | | | | |
| | Net realized and unrealized gain (loss) | | | (2.01 | ) | | | 0.52 | | | | (1.36 | ) | | | 2.71 | | | | (0.08 | ) | | | 0.08 | |
| | | | | | | |
| | Total from investment operations | | | (1.95 | ) | | | 0.75 | | | | (1.13 | ) | | | 2.89 | | | | 0.10 | | | | 0.26 | |
| | | | | | | |
| | Distributions to shareholders from net investment income | | | (0.28 | ) | | | (0.17 | ) | | | (0.18 | ) | | | (0.23 | ) | | | (0.11 | ) | | | (0.41 | ) |
| | | | | | | |
| | Net asset value, end of period | | $ | 10.23 | | | $ | 12.46 | | | $ | 11.88 | | | $ | 13.19 | | | $ | 10.53 | | | $ | 10.54 | |
| | | | | | | |
| | Total return(b) | | | (16.06 | )% | | | 6.58 | % | | | (8.71 | )% | | | 28.07 | % | | | 0.97 | % | | | 2.58 | % |
| | | | | | | |
| | Net assets, end of period (in 000s) | | $ | 197,987 | | | $ | 237,898 | | | $ | 184,222 | | | $ | 138,267 | | | $ | 104,736 | | | $ | 78,527 | |
| | | | | | | |
| | Ratio of net expenses to average net assets | | | 1.17 | %(c) | | | 1.16 | % | | | 1.14 | % | | | 1.21 | % | | | 1.25 | % | | | 1.27 | % |
| | | | | | | |
| | Ratio of total expenses to average net assets | | | 1.22 | %(c) | | | 1.24 | % | | | 1.26 | % | | | 1.35 | % | | | 1.39 | % | | | 1.37 | % |
| | | | | | | |
| | Ratio of net investment income to average net assets | | | 0.99 | %(c) | | | 1.97 | % | | | 1.76 | % | | | 1.54 | % | | | 1.77 | % | | | 1.70 | % |
| | | | | | | |
| | Portfolio turnover rate(d) | | | 80 | % | | | 136 | % | | | 124 | % | | | 161 | % | | | 176 | % | | | 154 | % |
| | (a) | | Calculated based on the average shares outstanding methodology. |
| | (b) | | Assumes investment at the net asset value at the beginning of the period, reinvestment of all distributions, a complete redemption of the investment at the net asset value at the end of the period and no sales or redemption charges (if any). Total returns would be reduced if a sales or redemption charge was taken into account. Returns do not reflect the impact of taxes to shareholders relating to Fund distributions or the redemption of Fund shares. Total returns for periods less than one full year are not annualized. |
| | (d) | | The Fund’s portfolio turnover rate is calculated in accordance with regulatory requirements, without regard to transactions involving short term investments and certain derivatives. If such transactions were included, the Fund’s portfolio turnover rate may be higher. |
| | |
| 40 | | The accompanying notes are an integral part of these financial statements. |
GOLDMAN SACHS INTERNATIONAL EQUITY INSIGHTS FUND
Financial Highlights(continued)
Selected Data for a Share Outstanding Throughout Each Period
| | | | | | | | | | | | | | | | | | | | | | | | | | |
| | | | | Goldman Sachs International Equity Insights Fund | |
| | | | | Class C Shares | |
| | | | | Six Months Ended
April 30, 2020 (Unaudited) | | | Year Ended October 31, | |
| | | | | 2019 | | | 2018 | | | 2017 | | | 2016 | | | 2015 | |
| | Per Share Data | | | | | | | | | | | | | | | | | | | | | | | | |
| | | | | | | |
| | Net asset value, beginning of period | | $ | 12.13 | | | $ | 11.56 | | | $ | 12.91 | | | $ | 10.32 | | | $ | 10.36 | | | $ | 10.51 | |
| | | | | | | |
| | Net investment income(a) | | | 0.01 | | | | 0.14 | | | | 0.14 | | | | 0.09 | | | | 0.10 | | | | 0.10 | |
| | | | | | | |
| | Net realized and unrealized gain (loss) | | | (1.97 | ) | | | 0.52 | | | | (1.34 | ) | | | 2.66 | | | | (0.08 | ) | | | 0.08 | |
| | | | | | | |
| | Total from investment operations | | | (1.96 | ) | | | 0.66 | | | | (1.20 | ) | | | 2.75 | | | | 0.02 | | | | 0.18 | |
| | | | | | | |
| | Distributions to shareholders from net investment income | | | (0.15 | ) | | | (0.09 | ) | | | (0.15 | ) | | | (0.16 | ) | | | (0.06 | ) | | | (0.33 | ) |
| | | | | | | |
| | Net asset value, end of period | | $ | 10.02 | | | $ | 12.13 | | | $ | 11.56 | | | $ | 12.91 | | | $ | 10.32 | | | $ | 10.36 | |
| | | | | | | |
| | Total return(b) | | | (16.37 | )% | | | 5.79 | % | | | (9.45 | )% | | | 27.11 | % | | | 0.22 | % | | | 1.82 | % |
| | | | | | | |
| | Net assets, end of period (in 000s) | | $ | 15,390 | | | $ | 22,427 | | | $ | 32,338 | | | $ | 14,886 | | | $ | 6,164 | | | $ | 4,409 | |
| | | | | | | |
| | Ratio of net expenses to average net assets | | | 1.92 | %(c) | | | 1.91 | % | | | 1.89 | % | | | 1.95 | % | | | 2.00 | % | | | 2.01 | % |
| | | | | | | |
| | Ratio of total expenses to average net assets | | | 1.97 | %(c) | | | 1.99 | % | | | 2.01 | % | | | 2.09 | % | | | 2.14 | % | | | 2.12 | % |
| | | | | | | |
| | Ratio of net investment income to average net assets | | | 0.17 | %(c) | | | 1.25 | % | | | 1.11 | % | | | 0.79 | % | | | 1.02 | % | | | 0.93 | % |
| | | | | | | |
| | Portfolio turnover rate(d) | | | 80 | % | | | 136 | % | | | 124 | % | | | 161 | % | | | 176 | % | | | 154 | % |
| | (a) | | Calculated based on the average shares outstanding methodology. |
| | (b) | | Assumes investment at the net asset value at the beginning of the period, reinvestment of all distributions, a complete redemption of the investment at the net asset value at the end of the period and no sales or redemption charges (if any). Total returns would be reduced if a sales or redemption charge was taken into account. Returns do not reflect the impact of taxes to shareholders relating to Fund distributions or the redemption of Fund shares. Total returns for periods less than one full year are not annualized. |
| | (d) | | The Fund’s portfolio turnover rate is calculated in accordance with regulatory requirements, without regard to transactions involving short term investments and certain derivatives. If such transactions were included, the Fund’s portfolio turnover rate may be higher. |
| | |
| The accompanying notes are an integral part of these financial statements. | | 41 |
GOLDMAN SACHS INTERNATIONAL EQUITY INSIGHTS FUND
Financial Highlights(continued)
Selected Data for a Share Outstanding Throughout Each Period
| | | | | | | | | | | | | | | | | | | | | | | | | | |
| | | | | Goldman Sachs International Equity Insights Fund | |
| | | | | Institutional Shares | |
| | | | | Six Months Ended
April 30, 2020 (Unaudited) | | | Year Ended October 31, | |
| | | | | 2019 | | | 2018 | | | 2017 | | | 2016 | | | 2015 | |
| | Per Share Data | | | | | | | | | | | | | | | | | | | | | | | | |
| | | | | | | |
| | Net asset value, beginning of period | | $ | 12.83 | | | $ | 12.22 | | | $ | 13.57 | | | $ | 10.82 | | | $ | 10.83 | | | $ | 10.97 | |
| | | | | | | |
| | Net investment income(a) | | | 0.08 | | | | 0.29 | | | | 0.28 | | | | 0.23 | | | | 0.24 | | | | 0.22 | |
| | | | | | | |
| | Net realized and unrealized gain (loss) | | | (2.06 | ) | | | 0.54 | | | | (1.41 | ) | | | 2.79 | | | | (0.10 | ) | | | 0.09 | |
| | | | | | | |
| | Total from investment operations | | | (1.98 | ) | | | 0.83 | | | | (1.13 | ) | | | 3.02 | | | | 0.14 | | | | 0.31 | |
| | | | | | | |
| | Distributions to shareholders from net investment income | | | (0.32 | ) | | | (0.22 | ) | | | (0.22 | ) | | | (0.27 | ) | | | (0.15 | ) | | | (0.45 | ) |
| | | | | | | |
| | Net asset value, end of period | | $ | 10.53 | | | $ | 12.83 | | | $ | 12.22 | | | $ | 13.57 | | | $ | 10.82 | | | $ | 10.83 | |
| | | | | | | |
| | Total return(b) | | | (15.90 | )% | | | 7.07 | % | | | (8.48 | )% | | | 28.57 | % | | | 1.34 | % | | | 3.05 | % |
| | | | | | | |
| | Net assets, end of period (in 000s) | | $ | 835,711 | | | $ | 1,256,782 | | | $ | 1,323,745 | | | $ | 1,012,010 | | | $ | 500,930 | | | $ | 642,473 | |
| | | | | | | |
| | Ratio of net expenses to average net assets | | | 0.79 | %(c) | | | 0.79 | % | | | 0.81 | % | | | 0.85 | % | | | 0.85 | % | | | 0.87 | % |
| | | | | | | |
| | Ratio of total expenses to average net assets | | | 0.83 | %(c) | | | 0.85 | % | | | 0.87 | % | | | 0.94 | % | | | 0.99 | % | | | 0.97 | % |
| | | | | | | |
| | Ratio of net investment income to average net assets | | | 1.29 | %(c) | | | 2.41 | % | | | 2.08 | % | | | 1.92 | % | | | 2.25 | % | | | 2.08 | % |
| | | | | | | |
| | Portfolio turnover rate(d) | | | 80 | % | | | 136 | % | | | 124 | % | | | 161 | % | | | 176 | % | | | 154 | % |
| | (a) | | Calculated based on the average shares outstanding methodology. |
| | (b) | | Assumes investment at the net asset value at the beginning of the period, reinvestment of all distributions, a complete redemption of the investment at the net asset value at the end of the period and no sales or redemption charges (if any). Total returns would be reduced if a sales or redemption charge was taken into account. Returns do not reflect the impact of taxes to shareholders relating to Fund distributions or the redemption of Fund shares. Total returns for periods less than one full year are not annualized. |
| | (d) | | The Fund’s portfolio turnover rate is calculated in accordance with regulatory requirements, without regard to transactions involving short term investments and certain derivatives. If such transactions were included, the Fund’s portfolio turnover rate may be higher. |
| | |
| 42 | | The accompanying notes are an integral part of these financial statements. |
GOLDMAN SACHS INTERNATIONAL EQUITY INSIGHTS FUND
Financial Highlights(continued)
Selected Data for a Share Outstanding Throughout Each Period
| | | | | | | | | | | | | | | | | | | | | | | | | | |
| | | | | Goldman Sachs International Equity Insights Fund | |
| | | | | Service Shares | |
| | | | | Six Months Ended
April 30, 2020 (Unaudited) | | | Year Ended October 31, | |
| | | | | 2019 | | | 2018 | | | 2017 | | | 2016 | | | 2015 | |
| | Per Share Data | | | | | | | | | | | | | | | | | | | | | | | | |
| | | | | | | |
| | Net asset value, beginning of period | | $ | 12.57 | | | $ | 11.98 | | | $ | 13.32 | | | $ | 10.63 | | | $ | 10.64 | | | $ | 10.76 | |
| | | | | | | |
| | Net investment income(a) | | | 0.04 | | | | 0.23 | | | | 0.21 | | | | 0.18 | | | | 0.17 | | | | 0.16 | |
| | | | | | | |
| | Net realized and unrealized gain (loss) | | | (2.01 | ) | | | 0.52 | | | | (1.38 | ) | | | 2.73 | | | | (0.08 | ) | | | 0.09 | |
| | | | | | | |
| | Total from investment operations | | | (1.97 | ) | | | 0.75 | | | | (1.17 | ) | | | 2.91 | | | | 0.09 | | | | 0.25 | |
| | | | | | | |
| | Distributions to shareholders from net investment income | | | (0.26 | ) | | | (0.16 | ) | | | (0.17 | ) | | | (0.22 | ) | | | (0.10 | ) | | | (0.37 | ) |
| | | | | | | |
| | Net asset value, end of period | | $ | 10.34 | | | $ | 12.57 | | | $ | 11.98 | | | $ | 13.32 | | | $ | 10.63 | | | $ | 10.64 | |
| | | | | | | |
| | Total return(b) | | | (16.09 | )% | | | 6.45 | % | | | (8.92 | )% | | | 27.89 | % | | | 0.87 | % | | | 2.48 | % |
| | | | | | | |
| | Net assets, end of period (in 000s) | | $ | 3,632 | | | $ | 5,386 | | | $ | 4,538 | | | $ | 4,073 | | | $ | 1,898 | | | $ | 1,641 | |
| | | | | | | |
| | Ratio of net expenses to average net assets | | | 1.29 | %(c) | | | 1.29 | % | | | 1.31 | % | | | 1.35 | % | | | 1.35 | % | | | 1.37 | % |
| | | | | | | |
| | Ratio of total expenses to average net assets | | | 1.33 | %(c) | | | 1.35 | % | | | 1.37 | % | | | 1.45 | % | | | 1.49 | % | | | 1.47 | % |
| | | | | | | |
| | Ratio of net investment income to average net assets | | | 0.75 | %(c) | | | 1.93 | % | | | 1.57 | % | | | 1.51 | % | | | 1.60 | % | | | 1.51 | % |
| | | | | | | |
| | Portfolio turnover rate(d) | | | 80 | % | | | 136 | % | | | 124 | % | | | 161 | % | | | 176 | % | | | 154 | % |
| | (a) | | Calculated based on the average shares outstanding methodology. |
| | (b) | | Assumes investment at the net asset value at the beginning of the period, reinvestment of all distributions, a complete redemption of the investment at the net asset value at the end of the period and no sales or redemption charges (if any). Total returns would be reduced if a sales or redemption charge was taken into account. Returns do not reflect the impact of taxes to shareholders relating to Fund distributions or the redemption of Fund shares. Total returns for periods less than one full year are not annualized. |
| | (d) | | The Fund’s portfolio turnover rate is calculated in accordance with regulatory requirements, without regard to transactions involving short term investments and certain derivatives. If such transactions were included, the Fund’s portfolio turnover rate may be higher. |
| | |
| The accompanying notes are an integral part of these financial statements. | | 43 |
GOLDMAN SACHS INTERNATIONAL EQUITY INSIGHTS FUND
Financial Highlights(continued)
Selected Data for a Share Outstanding Throughout Each Period
| | | | | | | | | | | | | | | | | | | | | | | | | | |
| | | | | Goldman Sachs International Equity Insights Fund | |
| | | | | Investor Shares(a) | |
| | | | | Six Months Ended
April 30, 2020 (Unaudited) | | | Year Ended October 31, | |
| | | | | 2019 | | | 2018 | | | 2017 | | | 2016 | | | 2015 | |
| | Per Share Data | | | | | | | | | | | | | | | | | | | | | | | | |
| | | | | | | |
| | Net asset value, beginning of period | | $ | 12.23 | | | $ | 11.67 | | | $ | 12.97 | | | $ | 10.36 | | | $ | 10.38 | | | $ | 10.53 | |
| | | | | | | |
| | Net investment income(b) | | | 0.07 | | | | 0.27 | | | | 0.27 | | | | 0.23 | | | | 0.17 | | | | 0.16 | |
| | | | | | | |
| | Net realized and unrealized gain (loss) | | | (1.96 | ) | | | 0.50 | | | | (1.35 | ) | | | 2.64 | | | | (0.05 | ) | | | 0.12 | |
| | | | | | | |
| | Total from investment operations | | | (1.89 | ) | | | 0.77 | | | | (1.08 | ) | | | 2.87 | | | | 0.12 | | | | 0.28 | |
| | | | | | | |
| | Distributions to shareholders from net investment income | | | (0.31 | ) | | | (0.21 | ) | | | (0.22 | ) | | | (0.26 | ) | | | (0.14 | ) | | | (0.43 | ) |
| | | | | | | |
| | Net asset value, end of period | | $ | 10.03 | | | $ | 12.23 | | | $ | 11.67 | | | $ | 12.97 | | | $ | 10.36 | | | $ | 10.38 | |
| | | | | | | |
| | Total return(c) | | | (15.95 | )% | | | 6.90 | % | | | (8.52 | )% | | | 28.44 | % | | | 1.22 | % | | | 2.85 | % |
| | | | | | | |
| | Net assets, end of period (in 000s) | | $ | 427,572 | | | $ | 549,732 | | | $ | 393,993 | | | $ | 147,186 | | | $ | 6,639 | | | $ | 1,666 | |
| | | | | | | |
| | Ratio of net expenses to average net assets | | | 0.92 | %(d) | | | 0.91 | % | | | 0.89 | % | | | 0.94 | % | | | 1.00 | % | | | 1.01 | % |
| | | | | | | |
| | Ratio of total expenses to average net assets | | | 0.96 | %(d) | | | 0.99 | % | | | 1.01 | % | | | 1.07 | % | | | 1.14 | % | | | 1.13 | % |
| | | | | | | |
| | Ratio of net investment income to average net assets | | | 1.19 | %(d) | | | 2.29 | % | | | 2.09 | % | | | 1.87 | % | | | 1.65 | % | | | 1.54 | % |
| | | | | | | |
| | Portfolio turnover rate(e) | | | 80 | % | | | 136 | % | | | 124 | % | | | 161 | % | | | 176 | % | | | 154 | % |
| | (a) | | Effective August 15, 2017, Class IR changed its name to Investor Shares. |
| | (b) | | Calculated based on the average shares outstanding methodology. |
| | (c) | | Assumes investment at the net asset value at the beginning of the period, reinvestment of all distributions, a complete redemption of the investment at the net asset value at the end of the period and no sales or redemption charges (if any). Total returns would be reduced if a sales or redemption charge was taken into account. Returns do not reflect the impact of taxes to shareholders relating to Fund distributions or the redemption of Fund shares. Total returns for periods less than one full year are not annualized. |
| | (e) | | The Fund’s portfolio turnover rate is calculated in accordance with regulatory requirements, without regard to transactions involving short term investments and certain derivatives. If such transactions were included, the Fund’s portfolio turnover rate may be higher. |
| | |
| 44 | | The accompanying notes are an integral part of these financial statements. |
GOLDMAN SACHS INTERNATIONAL EQUITY INSIGHTS FUND
Financial Highlights(continued)
Selected Data for a Share Outstanding Throughout Each Period
| | | | | | | | | | | | | | |
| | | | | Goldman Sachs International Equity Insights Fund | |
| | | | | Class P Shares | |
| | | | | Six Months Ended
April 30, 2020
(Unaudited) | | | Year Ended
October 31, 2019 | | | April 16, 2018*
to
October 31, 2018 | |
| | Per Share Data | | | | | | | | | | | | |
| | | | |
| | Net asset value, beginning of period | | $ | 12.81 | | | $ | 12.21 | | | $ | 13.79 | |
| | | | |
| | Net investment income(a) | | | 0.08 | | | | 0.30 | | | | 0.12 | |
| | | | |
| | Net realized and unrealized gain (loss) | | | (2.05 | ) | | | 0.52 | | | | (1.70 | ) |
| | | | |
| | Total from investment operations | | | (1.97 | ) | | | 0.82 | | | | (1.58 | ) |
| | | | |
| | Distributions to shareholders from net investment income | | | (0.32 | ) | | | (0.22 | ) | | | — | |
| | | | |
| | Net asset value, end of period | | $ | 10.52 | | | $ | 12.81 | | | $ | 12.21 | |
| | | | |
| | Total return(b) | | | (15.84 | )% | | | 7.03 | % | | | (11.46 | )% |
| | | | |
| | Net assets, end of period (in 000s) | | $ | 371,048 | | | $ | 372,536 | | | $ | 245,618 | |
| | | | |
| | Ratio of net expenses to average net assets | | | 0.78 | %(c) | | | 0.78 | % | | | 0.78 | %(c) |
| | | | |
| | Ratio of total expenses to average net assets | | | 0.82 | %(c) | | | 0.84 | % | | | 0.87 | %(c) |
| | | | |
| | Ratio of net investment income to average net assets | | | 1.35 | %(c) | | | 2.43 | % | | | 1.65 | %(c) |
| | | | |
| | Portfolio turnover rate(d) | | | 80 | % | | | 136 | % | | | 124 | % |
| | * | | Commencement of operations. |
| | (a) | | Calculated based on the average shares outstanding methodology. |
| | (b) | | Assumes investment at the net asset value at the beginning of the period, reinvestment of all distributions, a complete redemption of the investment at the net asset value at the end of the period and no sales or redemption charges (if any). Total returns would be reduced if a sales or redemption charge was taken into account. Returns do not reflect the impact of taxes to shareholders relating to Fund distributions or the redemption of Fund shares. Total returns for periods less than one full year are not annualized. |
| | (d) | | The Fund’s portfolio turnover rate is calculated in accordance with regulatory requirements, without regard to transactions involving short term investments and certain derivatives. If such transactions were included, the Fund’s portfolio turnover rate may be higher. |
| | |
| The accompanying notes are an integral part of these financial statements. | | 45 |
GOLDMAN SACHS INTERNATIONAL EQUITY INSIGHTS FUND
Financial Highlights(continued)
Selected Data for a Share Outstanding Throughout Each Period
| | | | | | | | | | | | | | | | | | | | | | | | | | |
| | | | | Goldman Sachs International Equity Insights Fund | |
| | | | | Class R Shares | |
| | | | | Six Months Ended
April 30, 2020 (Unaudited) | | | Year Ended October 31, | |
| | | | | 2019 | | | 2018 | | | 2017 | | | 2016 | | | 2015 | |
| | Per Share Data | | | | | | | | | | | | | | | | | | | | | | | | |
| | | | | | | |
| | Net asset value, beginning of period | | $ | 12.10 | | | $ | 11.54 | | | $ | 12.85 | | | $ | 10.29 | | | $ | 10.34 | | | $ | 10.52 | |
| | | | | | | |
| | Net investment income(a) | | | 0.04 | | | | 0.21 | | | | 0.19 | | | | 0.16 | | | | 0.13 | | | | 0.14 | |
| | | | | | | |
| | Net realized and unrealized gain (loss) | | | (1.95 | ) | | | 0.50 | | | | (1.33 | ) | | | 2.64 | | | | (0.06 | ) | | | 0.09 | |
| | | | | | | |
| | Total from investment operations | | | (1.91 | ) | | | 0.71 | | | | (1.14 | ) | | | 2.80 | | | | 0.07 | | | | 0.23 | |
| | | | | | | |
| | Distributions to shareholders from net investment income | | | (0.24 | ) | | | (0.15 | ) | | | (0.17 | ) | | | (0.24 | ) | | | (0.12 | ) | | | (0.41 | ) |
| | | | | | | |
| | Net asset value, end of period | | $ | 9.95 | | | $ | 12.10 | | | $ | 11.54 | | | $ | 12.85 | | | $ | 10.29 | | | $ | 10.34 | |
| | | | | | | |
| | Total return(b) | | | (16.15 | )% | | | 6.36 | % | | | (9.01 | )% | | | 27.81 | % | | | 0.67 | % | | | 2.32 | % |
| | | | | | | |
| | Net assets, end of period (in 000s) | | $ | 8,310 | | | $ | 9,281 | | | $ | 7,548 | | | $ | 7,071 | | | $ | 2,152 | | | $ | 186 | |
| | | | | | | |
| | Ratio of net expenses to average net assets | | | 1.42 | %(c) | | | 1.41 | % | | | 1.40 | % | | | 1.45 | % | | | 1.50 | % | | | 1.52 | % |
| | | | | | | |
| | Ratio of total expenses to average net assets | | | 1.47 | %(c) | | | 1.49 | % | | | 1.51 | % | | | 1.59 | % | | | 1.64 | % | | | 1.62 | % |
| | | | | | | |
| | Ratio of net investment income to average net assets | | | 0.74 | %(c) | | | 1.79 | % | | | 1.49 | % | | | 1.39 | % | | | 1.28 | % | | | 1.33 | % |
| | | | | | | |
| | Portfolio turnover rate(d) | | | 80 | % | | | 136 | % | | | 124 | % | | | 161 | % | | | 176 | % | | | 154 | % |
| | (a) | | Calculated based on the average shares outstanding methodology. |
| | (b) | | Assumes investment at the net asset value at the beginning of the period, reinvestment of all distributions, a complete redemption of the investment at the net asset value at the end of the period and no sales or redemption charges (if any). Total returns would be reduced if a sales or redemption charge was taken into account. Returns do not reflect the impact of taxes to shareholders relating to Fund distributions or the redemption of Fund shares. Total returns for periods less than one full year are not annualized. |
| | (d) | | The Fund’s portfolio turnover rate is calculated in accordance with regulatory requirements, without regard to transactions involving short term investments and certain derivatives. If such transactions were included, the Fund’s portfolio turnover rate may be higher. |
| | |
| 46 | | The accompanying notes are an integral part of these financial statements. |
GOLDMAN SACHS INTERNATIONAL EQUITY INSIGHTS FUND
Financial Highlights(continued)
Selected Data for a Share Outstanding Throughout Each Period
| | | | | | | | | | | | | | | | | | | | | | | | | | |
| | | | | Goldman Sachs International Equity Insights Fund | |
| | | | | Class R6 Shares | |
| | | | | Six Months Ended
April 30, 2020 (Unaudited) | | | Year Ended October 31, | | | July 31, 2015*
to
October 31, 2015 | |
| | | | | 2019 | | | 2018 | | | 2017 | | | 2016 | |
| | Per Share Data | | | | | | | | | | | | | | | | | | | | | | | | |
| | | | | | | |
| | Net asset value, beginning of period | | $ | 12.82 | | | $ | 12.22 | | | $ | 13.56 | | | $ | 10.82 | | | $ | 10.83 | | | $ | 11.23 | |
| | | | | | | |
| | Net investment income(a) | | | 0.08 | | | | 0.30 | | | | 0.33 | | | | 0.23 | | | | 0.14 | | | | 0.04 | |
| | | | | | | |
| | Net realized and unrealized gain (loss) | | | (2.06 | ) | | | 0.52 | | | | (1.45 | ) | | | 2.78 | | | | 0.01 | | | | (0.44 | ) |
| | | | | | | |
| | Total from investment operations | | | (1.98 | ) | | | 0.82 | | | | (1.12 | ) | | | 3.01 | | | | 0.15 | | | | (0.40 | ) |
| | | | | | | |
| | Distributions to shareholders from net investment income | | | (0.32 | ) | | | (0.22 | ) | | | (0.22 | ) | | | (0.27 | ) | | | (0.16 | ) | | | — | |
| | | | | | | |
| | Net asset value, end of period | | $ | 10.52 | | | $ | 12.82 | | | $ | 12.22 | | | $ | 13.56 | | | $ | 10.82 | | | $ | 10.83 | |
| | | | | | | |
| | Total return(b) | | | (15.91 | )% | | | 7.10 | % | | | (8.48 | )% | | | 28.51 | % | | | 1.37 | % | | | (3.56 | )% |
| | | | | | | |
| | Net assets, end of period (in 000s) | | $ | 499,226 | | | $ | 595,264 | | | $ | 415,327 | | | $ | 80,686 | | | $ | 46,707 | | | $ | 10 | |
| | | | | | | |
| | Ratio of net expenses to average net assets | | | 0.78 | %(c) | | | 0.78 | % | | | 0.79 | % | | | 0.83 | % | | | 0.83 | % | | | 0.84 | %(c) |
| | | | | | | |
| | Ratio of total expenses to average net assets | | | 0.82 | %(c) | | | 0.84 | % | | | 0.86 | % | | | 0.93 | % | | | 0.96 | % | | | 0.93 | %(c) |
| | | | | | | |
| | Ratio of net investment income to average net assets | | | 1.36 | %(c) | | | 2.49 | % | | | 2.45 | % | | | 1.96 | % | | | 1.32 | % | | | 1.56 | %(c) |
| | | | | | | |
| | Portfolio turnover rate(d) | | | 80 | % | | | 136 | % | | | 124 | % | | | 161 | % | | | 176 | % | | | 154 | % |
| | * | | Commencement of operations. |
| | (a) | | Calculated based on the average shares outstanding methodology. |
| | (b) | | Assumes investment at the net asset value at the beginning of the period, reinvestment of all distributions, a complete redemption of the investment at the net asset value at the end of the period and no sales or redemption charges (if any). Total returns would be reduced if a sales or redemption charge was taken into account. Returns do not reflect the impact of taxes to shareholders relating to Fund distributions or the redemption of Fund shares. Total returns for periods less than one full year are not annualized. |
| | (d) | | The Fund’s portfolio turnover rate is calculated in accordance with regulatory requirements, without regard to transactions involving short term investments and certain derivatives. If such transactions were included, the Fund’s portfolio turnover rate may be higher. |
| | |
| The accompanying notes are an integral part of these financial statements. | | 47 |
GOLDMAN SACHS INTERNATIONAL SMALL CAP INSIGHTS FUND
Financial Highlights(continued)
Selected Data for a Share Outstanding Throughout Each Period
| | | | | | | | | | | | | | | | | | | | | | | | | | |
| | | | | Goldman Sachs International Small Cap Insights Fund | |
| | | | | Class A Shares | |
| | | | | Six Months Ended
April 30, 2020 (Unaudited) | | | Year Ended October 31, | |
| | | | | 2019 | | | 2018 | | | 2017 | | | 2016 | | | 2015 | |
| | Per Share Data | | | | | | | | | | | | | | | | | | | | | | | | |
| | | | | | | |
| | Net asset value, beginning of period | | $ | 11.77 | | | $ | 11.16 | | | $ | 13.39 | | | $ | 10.71 | | | $ | 10.42 | | | $ | 10.03 | |
| | | | | | | |
| | Net investment income(a) | | | 0.04 | | | | 0.17 | | | | 0.17 | | | | 0.14 | | | | 0.16 | | | | 0.16 | |
| | | | | | | |
| | Net realized and unrealized gain (loss) | | | (1.97 | ) | | | 0.55 | | | | (1.39 | ) | | | 2.79 | | | | 0.27 | | | | 0.49 | |
| | | | | | | |
| | Total from investment operations | | | (1.93 | ) | | | 0.72 | | | | (1.22 | ) | | | 2.93 | | | | 0.43 | | | | 0.65 | |
| | | | | | | |
| | Distributions to shareholders from net investment income | | | (0.37 | ) | | | (0.11 | ) | | | (0.18 | ) | | | (0.25 | ) | | | (0.14 | ) | | | (0.16 | ) |
| | | | | | | |
| | Distributions to shareholders from net realized gains | | | — | | | | — | | | | (0.83 | ) | | | — | | | | — | | | | (0.10 | ) |
| | | | | | | |
| | Total distributions | | | (0.37 | ) | | | (0.11 | ) | | | (1.01 | ) | | | (0.25 | ) | | | (0.14 | ) | | | (0.26 | ) |
| | | | | | | |
| | Net asset value, end of period | | $ | 9.47 | | | $ | 11.77 | | | $ | 11.16 | | | $ | 13.39 | | | $ | 10.71 | | | $ | 10.42 | |
| | | | | | | |
| | Total return(b) | | | (17.04 | )% | | | 6.68 | % | | | (9.88 | )% | | | 28.01 | % | | | 4.17 | % | | | 6.70 | % |
| | | | | | | |
| | Net assets, end of period (in 000s) | | $ | 114,438 | | | $ | 163,427 | | | $ | 193,465 | | | $ | 211,268 | | | $ | 242,383 | | | $ | 204,067 | |
| | | | | | | |
| | Ratio of net expenses to average net assets | | | 1.25 | %(c) | | | 1.26 | % | | | 1.26 | % | | | 1.29 | % | | | 1.30 | % | | | 1.30 | % |
| | | | | | | |
| | Ratio of total expenses to average net assets | | | 1.30 | %(c) | | | 1.33 | % | | | 1.31 | % | | | 1.34 | % | | | 1.39 | % | | | 1.39 | % |
| | | | | | | |
| | Ratio of net investment income to average net assets | | | 0.65 | %(c) | | | 1.52 | % | | | 1.34 | % | | | 1.18 | % | | | 1.55 | % | | | 1.58 | % |
| | | | | | | |
| | Portfolio turnover rate(d) | | | 67 | % | | | 131 | % | | | 110 | % | | | 129 | % | | | 140 | % | | | 131 | % |
| | (a) | | Calculated based on the average shares outstanding methodology. |
| | (b) | | Assumes investment at the net asset value at the beginning of the period, reinvestment of all distributions, a complete redemption of the investment at the net asset value at the end of the period and no sales or redemption charges (if any). Total returns would be reduced if a sales or redemption charge was taken into account. Returns do not reflect the impact of taxes to shareholders relating to Fund distributions or the redemption of Fund shares. Total returns for periods less than one full year are not annualized. |
| | (d) | | The Fund’s portfolio turnover rate is calculated in accordance with regulatory requirements, without regard to transactions involving short term investments and certain derivatives. If such transactions were included, the Fund’s portfolio turnover rate may be higher. |
| | |
| 48 | | The accompanying notes are an integral part of these financial statements. |
GOLDMAN SACHS INTERNATIONAL SMALL CAP INSIGHTS FUND
Financial Highlights(continued)
Selected Data for a Share Outstanding Throughout Each Period
| | | | | | | | | | | | | | | | | | | | | | | | | | |
| | | | | Goldman Sachs International Small Cap Insights Fund | |
| | | | | Class C Shares | |
| | | | | Six Months Ended
April 30, 2020 (Unaudited) | | | Year Ended October 31, | |
| | | | | 2019 | | | 2018 | | | 2017 | | | 2016 | | | 2015 | |
| | Per Share Data | | | | | | | | | | | | | | | | | | | | | | | | |
| | | | | | | |
| | Net asset value, beginning of period | | $ | 11.34 | | | $ | 10.73 | | | $ | 12.95 | | | $ | 10.35 | | | $ | 10.11 | | | $ | 9.76 | |
| | | | | | | |
| | Net investment income (loss)(a) | | | (0.01 | ) | | | 0.09 | | | | 0.08 | | | | 0.07 | | | | 0.08 | | | | 0.08 | |
| | | | | | | |
| | Net realized and unrealized gain (loss) | | | (1.91 | ) | | | 0.54 | | | | (1.35 | ) | | | 2.70 | | | | 0.25 | | | | 0.49 | |
| | | | | | | |
| | Total from investment operations | | | (1.92 | ) | | | 0.63 | | | | (1.27 | ) | | | 2.77 | | | | 0.33 | | | | 0.57 | |
| | | | | | | |
| | Distributions to shareholders from net investment income | | | (0.27 | ) | | | (0.02 | ) | | | (0.12 | ) | | | (0.17 | ) | | | (0.09 | ) | | | (0.12 | ) |
| | | | | | | |
| | Distributions to shareholders from net realized gains | | | — | | | | — | | | | (0.83 | ) | | | — | | | | — | | | | (0.10 | ) |
| | | | | | | |
| | Total distributions | | | (0.27 | ) | | | (0.02 | ) | | | (0.95 | ) | | | (0.17 | ) | | | (0.09 | ) | | | (0.22 | ) |
| | | | | | | |
| | Net asset value, end of period | | $ | 9.15 | | | $ | 11.34 | | | $ | 10.73 | | | $ | 12.95 | | | $ | 10.35 | | | $ | 10.11 | |
| | | | | | | |
| | Total return(b) | | | (17.44 | )% | | | 5.94 | % | | | (10.59 | )% | | | 27.20 | % | | | 3.27 | % | | | 5.96 | % |
| | | | | | | |
| | Net assets, end of period (in 000s) | | $ | 33,435 | | | $ | 51,728 | | | $ | 68,767 | | | $ | 65,194 | | | $ | 44,643 | | | $ | 38,777 | |
| | | | | | | |
| | Ratio of net expenses to average net assets | | | 2.00 | %(c) | | | 2.01 | % | | | 2.01 | % | | | 2.04 | % | | | 2.05 | % | | | 2.05 | % |
| | | | | | | |
| | Ratio of total expenses to average net assets | | | 2.05 | %(c) | | | 2.08 | % | | | 2.06 | % | | | 2.09 | % | | | 2.14 | % | | | 2.14 | % |
| | | | | | | |
| | Ratio of net investment income (loss) to average net assets | | | (0.13 | )%(c) | | | 0.82 | % | | | 0.61 | % | | | 0.60 | % | | | 0.83 | % | | | 0.82 | % |
| | | | | | | |
| | Portfolio turnover rate(d) | | | 67 | % | | | 131 | % | | | 110 | % | | | 129 | % | | | 140 | % | | | 131 | % |
| | (a) | | Calculated based on the average shares outstanding methodology. |
| | (b) | | Assumes investment at the net asset value at the beginning of the period, reinvestment of all distributions, a complete redemption of the investment at the net asset value at the end of the period and no sales or redemption charges (if any). Total returns would be reduced if a sales or redemption charge was taken into account. Returns do not reflect the impact of taxes to shareholders relating to Fund distributions or the redemption of Fund shares. Total returns for periods less than one full year are not annualized. |
| | (d) | | The Fund’s portfolio turnover rate is calculated in accordance with regulatory requirements, without regard to transactions involving short term investments and certain derivatives. If such transactions were included, the Fund’s portfolio turnover rate may be higher. |
| | |
| The accompanying notes are an integral part of these financial statements. | | 49 |
GOLDMAN SACHS INTERNATIONAL SMALL CAP INSIGHTS FUND
Financial Highlights(continued)
Selected Data for a Share Outstanding Throughout Each Period
| | | | | | | | | | | | | | | | | | | | | | | | | | |
| | | | | Goldman Sachs International Small Cap Insights Fund | |
| | | | | Institutional Shares | |
| | | | | Six Months Ended
April 30, 2020 (Unaudited) | | | Year Ended October 31, | |
| | | | | 2019 | | | 2018 | | | 2017 | | | 2016 | | | 2015 | |
| | Per Share Data | | | | | | | | | | | | | | | | | | | | | | | | |
| | | | | | | |
| | Net asset value, beginning of period | | $ | 11.78 | | | $ | 11.19 | | | $ | 13.42 | | | $ | 10.73 | | | $ | 10.44 | | | $ | 10.05 | |
| | | | | | | |
| | Net investment income(a) | | | 0.06 | | | | 0.22 | | | | 0.21 | | | | 0.21 | | | | 0.21 | | | | 0.20 | |
| | | | | | | |
| | Net realized and unrealized gain (loss) | | | (1.97 | ) | | | 0.54 | | | | (1.38 | ) | | | 2.77 | | | | 0.26 | | | | 0.49 | |
| | | | | | | |
| | Total from investment operations | | | (1.91 | ) | | | 0.76 | | | | (1.17 | ) | | | 2.98 | | | | 0.47 | | | | 0.69 | |
| | | | | | | |
| | Distributions to shareholders from net investment income | | | (0.41 | ) | | | (0.17 | ) | | | (0.23 | ) | | | (0.29 | ) | | | (0.18 | ) | | | (0.20 | ) |
| | | | | | | |
| | Distributions to shareholders from net realized gains | | | — | | | | — | | | | (0.83 | ) | | | — | | | | — | | | | (0.10 | ) |
| | | | | | | |
| | Total distributions | | | (0.41 | ) | | | (0.17 | ) | | | (1.06 | ) | | | (0.29 | ) | | | (0.18 | ) | | | (0.30 | ) |
| | | | | | | |
| | Net asset value, end of period | | $ | 9.46 | | | $ | 11.78 | | | $ | 11.19 | | | $ | 13.42 | | | $ | 10.73 | | | $ | 10.44 | |
| | | | | | | |
| | Total return(b) | | | (16.89 | )% | | | 7.10 | % | | | (9.53 | )% | | | 28.59 | % | | | 4.50 | % | | | 7.11 | % |
| | | | | | | |
| | Net assets, end of period (in 000s) | | $ | 1,400,385 | | | $ | 2,134,382 | | | $ | 2,250,288 | | | $ | 1,796,887 | | | $ | 1,118,478 | | | $ | 888,071 | |
| | | | | | | |
| | Ratio of net expenses to average net assets | | | 0.87 | %(c) | | | 0.87 | % | | | 0.87 | % | | | 0.90 | % | | | 0.90 | % | | | 0.90 | % |
| | | | | | | |
| | Ratio of total expenses to average net assets | | | 0.92 | %(c) | | | 0.95 | % | | | 0.92 | % | | | 0.94 | % | | | 0.98 | % | | | 0.99 | % |
| | | | | | | |
| | Ratio of net investment income to average net assets | | | 1.02 | %(c) | | | 1.96 | % | | | 1.67 | % | | | 1.77 | % | | | 1.98 | % | | | 1.97 | % |
| | | | | | | |
| | Portfolio turnover rate(d) | | | 67 | % | | | 131 | % | | | 110 | % | | | 129 | % | | | 140 | % | | | 131 | % |
| | (a) | | Calculated based on the average shares outstanding methodology. |
| | (b) | | Assumes investment at the net asset value at the beginning of the period, reinvestment of all distributions, a complete redemption of the investment at the net asset value at the end of the period and no sales or redemption charges (if any). Total returns would be reduced if a sales or redemption charge was taken into account. Returns do not reflect the impact of taxes to shareholders relating to Fund distributions or the redemption of Fund shares. Total returns for periods less than one full year are not annualized. |
| | (d) | | The Fund’s portfolio turnover rate is calculated in accordance with regulatory requirements, without regard to transactions involving short term investments and certain derivatives. If such transactions were included, the Fund’s portfolio turnover rate may be higher. |
| | |
| 50 | | The accompanying notes are an integral part of these financial statements. |
GOLDMAN SACHS INTERNATIONAL SMALL CAP INSIGHTS FUND
Financial Highlights(continued)
Selected Data for a Share Outstanding Throughout Each Period
| | | | | | | | | | | | | | | | | | | | | | | | | | |
| | | | | Goldman Sachs International Small Cap Insights Fund | |
| | | | | Investor Shares(a) | |
| | | | | Six Months Ended
April 30, 2020 (Unaudited) | | | Year Ended October 31, | |
| | | | | 2019 | | | 2018 | | | 2017 | | | 2016 | | | 2015 | |
| | Per Share Data | | | | | | | | | | | | | | | | | | | | | | | | |
| | | | | | | |
| | Net asset value, beginning of period | | $ | 11.72 | | | $ | 11.12 | | | $ | 13.36 | | | $ | 10.68 | | | $ | 10.40 | | | $ | 10.01 | |
| | | | | | | |
| | Net investment income(b) | | | 0.04 | | | | 0.19 | | | | 0.21 | | | | 0.21 | | | | 0.19 | | | | 0.19 | |
| | | | | | | |
| | Net realized and unrealized gain (loss) | | | (1.95 | ) | | | 0.56 | | | | (1.40 | ) | | | 2.75 | | | | 0.26 | | | | 0.49 | |
| | | | | | | |
| | Total from investment operations | | | (1.91 | ) | | | 0.75 | | | | (1.19 | ) | | | 2.96 | | | | 0.45 | | | | 0.68 | |
| | | | | | | |
| | Distributions to shareholders from net investment income | | | (0.39 | ) | | | (0.15 | ) | | | (0.22 | ) | | | (0.28 | ) | | | (0.17 | ) | | | (0.19 | ) |
| | | | | | | |
| | Distributions to shareholders from net realized gains | | | — | | | | — | | | | (0.83 | ) | | | — | | | | — | | | | (0.10 | ) |
| | | | | | | |
| | Total distributions | | | (0.39 | ) | | | (0.15 | ) | | | (1.05 | ) | | | (0.28 | ) | | | (0.17 | ) | | | (0.29 | ) |
| | | | | | | |
| | Net asset value, end of period | | $ | 9.42 | | | $ | 11.72 | | | $ | 11.12 | | | $ | 13.36 | | | $ | 10.68 | | | $ | 10.40 | |
| | | | | | | |
| | Total return(c) | | | (16.95 | )% | | | 7.01 | % | | | (9.72 | )% | | | 28.48 | % | | | 4.33 | % | | | 7.00 | % |
| | | | | | | |
| | Net assets, end of period (in 000s) | | $ | 151,652 | | | $ | 274,079 | | | $ | 532,484 | | | $ | 344,700 | | | $ | 99,365 | | | $ | 40,890 | |
| | | | | | | |
| | Ratio of net expenses to average net assets | | | 1.00 | %(d) | | | 1.01 | % | | | 1.01 | % | | | 1.04 | % | | | 1.05 | % | | | 1.05 | % |
| | | | | | | |
| | Ratio of total expenses to average net assets | | | 1.05 | %(d) | | | 1.08 | % | | | 1.06 | % | | | 1.09 | % | | | 1.13 | % | | | 1.14 | % |
| | | | | | | |
| | Ratio of net investment income to average net assets | | | 0.82 | %(d) | | | 1.74 | % | | | 1.68 | % | | | 1.76 | % | | | 1.83 | % | | | 1.83 | % |
| | | | | | | |
| | Portfolio turnover rate(e) | | | 67 | % | | | 131 | % | | | 110 | % | | | 129 | % | | | 140 | % | | | 131 | % |
| | (a) | | Effective August 15, 2017, Class IR changed its name to Investor Shares. |
| | (b) | | Calculated based on the average shares outstanding methodology. |
| | (c) | | Assumes investment at the net asset value at the beginning of the period, reinvestment of all distributions, a complete redemption of the investment at the net asset value at the end of the period and no sales or redemption charges (if any). Total returns would be reduced if a sales or redemption charge was taken into account. Returns do not reflect the impact of taxes to shareholders relating to Fund distributions or the redemption of Fund shares. Total returns for periods less than one full year are not annualized. |
| | (e) | | The Fund’s portfolio turnover rate is calculated in accordance with regulatory requirements, without regard to transactions involving short term investments and certain derivatives. If such transactions were included, the Fund’s portfolio turnover rate may be higher. |
| | |
| The accompanying notes are an integral part of these financial statements. | | 51 |
GOLDMAN SACHS INTERNATIONAL SMALL CAP INSIGHTS FUND
Financial Highlights(continued)
Selected Data for a Share Outstanding Throughout Each Period
| | | | | | | | | | | | | | |
| | | | | Goldman Sachs International Small Cap Insights Fund | |
| | | | | Class P Shares | |
| | | | | Six Months Ended
April 30, 2020
(Unaudited) | | | Year Ended
October 31, 2019 | | | April 16, 2018*
to
October 31, 2018 | |
| | Per Share Data | | | | | | | | | | | | |
| | | | |
| | Net asset value, beginning of period | | $ | 11.80 | | | $ | 11.21 | | | $ | 13.08 | |
| | | | |
| | Net investment income(a) | | | 0.05 | | | | 0.22 | | | | 0.08 | |
| | | | |
| | Net realized and unrealized gain (loss) | | | (1.95 | ) | | | 0.54 | | | | (1.95 | ) |
| | | | |
| | Total from investment operations | | | (1.90 | ) | | | 0.76 | | | | (1.87 | ) |
| | | | |
| | Distributions to shareholders from net investment income | | | (0.42 | ) | | | (0.17 | ) | | | — | |
| | | | |
| | Net asset value, end of period | | $ | 9.48 | | | $ | 11.80 | | | $ | 11.21 | |
| | | | |
| | Total return(b) | | | (16.85 | )% | | | 7.11 | % | | | (14.30 | )% |
| | | | |
| | Net assets, end of period (in 000s) | | $ | 44,455 | | | $ | 80,926 | | | $ | 90,943 | |
| | | | |
| | Ratio of net expenses to average net assets | | | 0.86 | %(c) | | | 0.86 | % | | | 0.85 | %(c) |
| | | | |
| | Ratio of total expenses to average net assets | | | 0.91 | %(c) | | | 0.94 | % | | | 0.93 | %(c) |
| | | | |
| | Ratio of net investment income to average net assets | | | 0.94 | %(c) | | | 1.96 | % | | | 1.20 | %(c) |
| | | | |
| | Portfolio turnover rate(d) | | | 67 | % | | | 131 | % | | | 110 | % |
| | * | | Commencement of operations. |
| | (a) | | Calculated based on the average shares outstanding methodology. |
| | (b) | | Assumes investment at the net asset value at the beginning of the period, reinvestment of all distributions, a complete redemption of the investment at the net asset value at the end of the period and no sales or redemption charges (if any). Total returns would be reduced if a sales or redemption charge was taken into account. Returns do not reflect the impact of taxes to shareholders relating to Fund distributions or the redemption of Fund shares. Total returns for periods less than one full year are not annualized. |
| | (d) | | The Fund’s portfolio turnover rate is calculated in accordance with regulatory requirements, without regard to transactions involving short term investments and certain derivatives. If such transactions were included, the Fund’s portfolio turnover rate may be higher. |
| | |
| 52 | | The accompanying notes are an integral part of these financial statements. |
GOLDMAN SACHS INTERNATIONAL SMALL CAP INSIGHTS FUND
Financial Highlights(continued)
Selected Data for a Share Outstanding Throughout Each Period
| | | | | | | | | | | | | | | | | | | | | | | | | | |
| | | | | Goldman Sachs International Small Cap Insights Fund | |
| | | | | Class R6 Shares | |
| | | | | Six Months Ended
April 30, 2020 (Unaudited) | | | Year Ended October 31, | | | July 31, 2015*
to
October 31, 2015 | |
| | | | | 2019 | | | 2018 | | | 2017 | | | 2016 | |
| | Per Share Data | | | | | | | | | | | | | | | | | | | | | | | | |
| | | | | | | |
| | Net asset value, beginning of period | | $ | 11.80 | | | $ | 11.21 | | | $ | 13.45 | | | $ | 10.75 | | | $ | 10.44 | | | $ | 10.75 | |
| | | | | | | |
| | Net investment income(a) | | | 0.06 | | | | 0.22 | | | | 0.22 | | | | 0.20 | | | | 0.26 | | | | 0.05 | |
| | | | | | | |
| | Net realized and unrealized gain (loss) | | | (1.96 | ) | | | 0.54 | | | | (1.40 | ) | | | 2.79 | | | | 0.23 | | | | (0.36 | ) |
| | | | | | | |
| | Total from investment operations | | | (1.90 | ) | | | 0.76 | | | | (1.18 | ) | | | 2.99 | | | | 0.49 | | | | (0.31 | ) |
| | | | | | | |
| | Distributions to shareholders from net investment income | | | (0.42 | ) | | | (0.17 | ) | | | (0.23 | ) | | | (0.29 | ) | | | (0.18 | ) | | | — | |
| | | | | | | |
| | Distributions to shareholders from net realized gains | | | — | | | | — | | | | (0.83 | ) | | | — | | | | — | | | | — | |
| | | | | | | |
| | Total distributions | | | (0.42 | ) | | | (0.17 | ) | | | (1.06 | ) | | | (0.29 | ) | | | (0.18 | ) | | | — | |
| | | | | | | |
| | Net asset value, end of period | | $ | 9.48 | | | $ | 11.80 | | | $ | 11.21 | | | $ | 13.45 | | | $ | 10.75 | | | $ | 10.44 | |
| | | | | | | |
| | Total return(b) | | | (16.85 | )% | | | 7.11 | % | | | (9.57 | )% | | | 28.67 | % | | | 4.72 | % | | | (2.88 | )% |
| | | | | | | |
| | Net assets, end of period (in 000s) | | $ | 993,988 | | | $ | 1,192,142 | | | $ | 1,076,035 | | | $ | 116,788 | | | $ | 18,566 | | | $ | 10 | |
| | | | | | | |
| | Ratio of net expenses to average net assets | | | 0.86 | %(c) | | | 0.86 | % | | | 0.85 | % | | | 0.88 | % | | | 0.88 | % | | | 0.90 | %(c) |
| | | | | | | |
| | Ratio of total expenses to average net assets | | | 0.91 | %(c) | | | 0.94 | % | | | 0.92 | % | | | 0.92 | % | | | 0.97 | % | | | 0.96 | %(c) |
| | | | | | | |
| | Ratio of net investment income to average net assets | | | 1.12 | %(c) | | | 2.01 | % | | | 1.72 | % | | | 1.58 | % | | | 2.39 | % | | | 1.94 | %(c) |
| | | | | | | |
| | Portfolio turnover rate(d) | | | 67 | % | | | 131 | % | | | 110 | % | | | 129 | % | | | 140 | % | | | 131 | % |
| | * | | Commencement of operations. |
| | (a) | | Calculated based on the average shares outstanding methodology. |
| | (b) | | Assumes investment at the net asset value at the beginning of the period, reinvestment of all distributions, a complete redemption of the investment at the net asset value at the end of the period and no sales or redemption charges (if any). Total returns would be reduced if a sales or redemption charge was taken into account. Returns do not reflect the impact of taxes to shareholders relating to Fund distributions or the redemption of Fund shares. Total returns for periods less than one full year are not annualized. |
| | (d) | | The Fund’s portfolio turnover rate is calculated in accordance with regulatory requirements, without regard to transactions involving short term investments and certain derivatives. If such transactions were included, the Fund’s portfolio turnover rate may be higher. |
| | |
| The accompanying notes are an integral part of these financial statements. | | 53 |
GOLDMAN SACHS INTERNATIONAL EQUITY INSIGHTS FUNDS
Notes to Financial Statements
April 30, 2020 (Unaudited)
Goldman Sachs Trust (the “Trust”) is a Delaware statutory trust registered under the Investment Company Act of 1940, as amended (the “Act”), as an open-end management investment company. The following table lists those series of the Trust that are included in this report (collectively, the “Funds” or individually a “Fund”), along with their corresponding share classes and respective diversification status under the Act:
| | | | |
| Fund | | Share Classes Offered | | Diversified/
Non-diversified |
Emerging Markets Equity Insights | | A, C, Institutional, Investor, P, R and R6 | | Diversified |
International Equity Insights | | A, C, Institutional, Service, Investor, P, R and R6 | | Diversified |
International Small Cap Insights | | A, C, Institutional, Investor, P and R6 | | Diversified |
Class A Shares are sold with a front-end sales charge of up to 5.50%. Class C Shares are sold with a contingent deferred sales charge (“CDSC”) of 1.00%, which is imposed on redemptions made within 12 months of purchase. Institutional, Service, Investor, Class P, Class R and Class R6 Shares are not subject to a sales charge.
Goldman Sachs Asset Management, L.P. (“GSAM”), an affiliate of Goldman Sachs & Co. LLC (“Goldman Sachs”), serves as investment adviser to the Funds pursuant to a management agreement (the “Agreement”) with the Trust.
|
| 2. SIGNIFICANT ACCOUNTING POLICIES |
The financial statements have been prepared in accordance with accounting principles generally accepted in the United States of America (“GAAP”) and require management to make estimates and assumptions that may affect the reported amounts and disclosures. Actual results may differ from those estimates and assumptions. Each Fund is an investment company under GAAP and follows the accounting and reporting guidance applicable to investment companies.
A. Investment Valuation — The Funds’ valuation policy is to value investments at fair value.
B. Investment Income and Investments — Investment income includes interest income, dividend income, and securities lending income, if any. Interest income is accrued daily and adjusted for amortization of premiums and accretion of discounts. Dividend income is recognized on ex-dividend date or, for certain foreign securities, as soon as such information is obtained subsequent to the ex-dividend date. Non-cash dividends, if any, are recorded at the fair market value of the securities received. Investment transactions are reflected on trade date. Realized gains and losses are calculated using identified cost. Investment transactions are recorded on the following business day for daily net asset value (“NAV”) calculations. Investment income is recorded net of any foreign withholding taxes, less any amounts reclaimable. The Funds may file withholding tax reclaims in certain jurisdictions to recover a portion of amounts previously withheld. Any foreign capital gains tax is accrued daily based upon net unrealized gains, and is payable upon sale of such investments.
For derivative contracts, realized gains and losses are recorded upon settlement of the contract.
C. Class Allocations and Expenses — Investment income, realized and unrealized gain (loss), if any, and non-class specific expenses of each Fund are allocated daily based upon the proportion of net assets of each class. Non-class specific expenses directly incurred by a Fund are charged to that Fund, while such expenses incurred by the Trust are allocated across the applicable Funds on a straight-line and/or pro-rata basis depending upon the nature of the expenses. Class specific expenses, where applicable, are borne by the respective share classes and include Distribution and Service, Transfer Agency and Service and Shareholder Administration fees.
D. Federal Taxes and Distributions to Shareholders — It is each Fund’s policy to comply with the requirements of the Internal Revenue Code of 1986, as amended (the “Code”), applicable to regulated investment companies and to distribute each year substantially all of its investment company taxable income and capital gains to its shareholders. Accordingly, each Fund is not required to make any provisions for the payment of federal income tax. Distributions to shareholders are recorded on the ex-dividend date. Income and capital gains distributions, if any, are declared and paid at least annually.
54
GOLDMAN SACHS INTERNATIONAL EQUITY INSIGHTS FUNDS
|
| 2. SIGNIFICANT ACCOUNTING POLICIES (continued) |
Net capital losses, if any, are carried forward to future fiscal years and may be used to the extent allowed by the Code to offset any future capital gains. Losses that are carried forward will retain their character as either short-term or long-term capital losses. Utilization of capital loss carryforwards will reduce the requirement of future capital gains distributions.
The characterization of distributions to shareholders for financial reporting purposes is determined in accordance with federal income tax rules, which may differ from GAAP. The source of each Fund’s distributions may be shown in the accompanying financial statements as either from distributable earnings or capital. Certain components of the Funds’ net assets on the Statements of Assets and Liabilities reflect permanent GAAP/tax differences based on the appropriate tax character.
E. Foreign Currency Translation — The accounting records and reporting currency of a Fund are maintained in U.S. dollars. Assets and liabilities denominated in foreign currencies are translated into U.S. dollars using the current exchange rates at the close of each business day. The effect of changes in foreign currency exchange rates on investments is included within net realized and unrealized gain (loss) on investments. Changes in the value of other assets and liabilities as a result of fluctuations in foreign exchange rates are included in the Statements of Operations within net change in unrealized gain (loss) on foreign currency translation. Transactions denominated in foreign currencies are translated into U.S. dollars on the date the transaction occurred, the effects of which are included within net realized gain (loss) on foreign currency transactions.
|
| 3. INVESTMENTS AND FAIR VALUE MEASUREMENTS |
U.S. GAAP defines the fair value of a financial instrument as the amount that would be received to sell an asset or paid to transfer a liability in an orderly transaction between market participants at the measurement date (i.e., the exit price); the Funds’ policy is to use the market approach. GAAP establishes a fair value hierarchy that prioritizes the inputs to valuation techniques used to measure fair value. The hierarchy gives the highest priority to unadjusted quoted prices in active markets for identical assets or liabilities (Level 1 measurements) and the lowest priority to unobservable inputs (Level 3 measurements). The levels used for classifying investments are not necessarily an indication of the risk associated with investing in these investments. The three levels of the fair value hierarchy are described below:
Level 1 — Unadjusted quoted prices in active markets that are accessible at the measurement date for identical, unrestricted assets or liabilities;
Level 2 — Quoted prices in markets that are not active or financial instruments for which significant inputs are observable (including, but not limited to, quoted prices for similar investments, interest rates, foreign exchange rates, volatility and credit spreads), either directly or indirectly;
Level 3 — Prices or valuations that require significant unobservable inputs (including GSAM’s assumptions in determining fair value measurement).
The Board of Trustees (“Trustees”) has approved Valuation Procedures that govern the valuation of the portfolio investments held by the Funds, including investments for which market quotations are not readily available. The Trustees have delegated to GSAM day-to-day responsibility for implementing and maintaining internal controls and procedures related to the valuation of the Funds’ investments. To assess the continuing appropriateness of pricing sources and methodologies, GSAM regularly performs price verification procedures and issues challenges as necessary to third party pricing vendors or brokers, and any differences are reviewed in accordance with the Valuation Procedures.
A. Level 1 and Level 2 Fair Value Investments— The valuation techniques and significant inputs used in determining the fair values for investments classified as Level 1 and Level 2 are as follows:
Equity Securities — Equity securities traded on a United States (“U.S.”) securities exchange or the NASDAQ system, or those located on certain foreign exchanges, including but not limited to the Americas, are valued daily at their last sale price or official closing price on the principal exchange or system on which they are traded. If there is no sale or official closing price or such price is believed by GSAM to not represent fair value, equity securities may be valued at the closing bid price for long positions and at the closing ask price for short positions. To the extent these investments are actively traded, they are classified as Level 1 of the
55
GOLDMAN SACHS INTERNATIONAL EQUITY INSIGHTS FUNDS
Notes to Financial Statements(continued)
April 30, 2020 (Unaudited)
|
| 3. INVESTMENTS AND FAIR VALUE MEASUREMENTS (continued) |
fair value hierarchy, otherwise they are generally classified as Level 2. Certain equity securities containing unique attributes may be classified as Level 2.
Unlisted equity securities for which market quotations are available are valued at the last sale price on the valuation date, or if no sale occurs, at the last bid price for long positions or the last ask price for short positions, and are generally classified as Level 2. Securities traded on certain foreign securities exchanges are valued daily at fair value determined by an independent fair value service (if available) under Valuation Procedures approved by the Trustees and consistent with applicable regulatory guidance. The independent fair value service takes into account multiple factors including, but not limited to, movements in the securities markets, certain depositary receipts, futures contracts and foreign currency exchange rates that have occurred subsequent to the close of the foreign securities exchange. These investments are generally classified as Level 2 of the fair value hierarchy.
Money Market Funds— Investments in the Goldman Sachs Financial Square Government Fund (“Underlying Fund”) are valued at the NAV per share of the Institutional Share class on the day of valuation. These investments are generally classified as Level 1 of the fair value hierarchy. For information regarding the Underlying Fund’s accounting policies and investment holdings, please see the Underlying Fund’s shareholder report.
Derivative Contracts— A derivative is an instrument whose value is derived from underlying assets, indices, reference rates or a combination of these factors. A Fund enters into derivative transactions to hedge against changes in interest rates, securities prices, and/or currency exchange rates, to increase total return, or to gain access to certain markets or attain exposure to other underliers. For financial reporting purposes, cash collateral that has been pledged to cover obligations of a Fund and cash collateral received, if any is reported separately on the Statements of Assets and Liabilities as receivables/payables for collateral on certain derivatives contracts. Non-cash collateral pledged by a Fund, if any, is noted in the Schedules of Investments.
Exchange-traded derivatives, including futures and options contracts, are generally valued at the last sale or settlement price on the exchange where they are principally traded. Exchange-traded options without settlement prices are generally valued at the midpoint of the bid and ask prices on the exchange where they are principally traded (or, in the absence of two-way trading, at the last bid price for long positions and the last ask price for short positions). Exchange-traded derivatives typically fall within Level 1 of the fair value hierarchy. Over-the-counter (“OTC”) and centrally cleared derivatives are valued using market transactions and other market evidence, including market-based inputs to models, calibration to market-clearing transactions, broker or dealer quotations, or other alternative pricing sources. Where models are used, the selection of a particular model to value OTC and centrally cleared derivatives depends upon the contractual terms of, and specific risks inherent in, the instrument, as well as the availability of pricing information in the market. Valuation models require a variety of inputs, including contractual terms, market prices, yield curves, credit curves, measures of volatility, voluntary and involuntary prepayment rates, loss severity rates and correlations of such inputs. For OTC and centrally cleared derivatives that trade in liquid markets, model inputs can generally be verified and model selection does not involve significant management judgment. OTC and centrally cleared derivatives are classified within Level 2 of the fair value hierarchy when significant inputs are corroborated by market evidence.
i. Futures Contracts— Futures contracts are contracts to buy or sell a standardized quantity of a specified commodity or security. Upon entering into a futures contract, a Fund deposits cash or securities in an account on behalf of the broker in an amount sufficient to meet the initial margin requirement. Subsequent payments are made or received by a Fund equal to the daily change in the contract value and are recorded as variation margin receivable or payable with a corresponding offset to unrealized gains or losses.
B. Level 3 Fair Value Investments — To the extent that significant inputs to valuation models and other alternative pricing sources are unobservable, or if quotations are not readily available, or if GSAM believes that such quotations do not accurately reflect fair value, the fair value of a Fund’s investments may be determined under Valuation Procedures approved by the Trustees. GSAM, consistent with its procedures and applicable regulatory guidance, may make an adjustment to the most recent valuation prices of either domestic or foreign securities in light of significant events to reflect what it believes to be the fair value of the securities at the time of determining a Fund’s NAV. To the extent investments are valued using single source broker quotations obtained directly from the broker or passed through from third party pricing vendors, such investments are classified as Level 3 investments. GSAM did not develop the unobservable inputs for valuation of Level 3 Assets and Liabilities.
56
GOLDMAN SACHS INTERNATIONAL EQUITY INSIGHTS FUNDS
|
| 3. INVESTMENTS AND FAIR VALUE MEASUREMENTS (continued) |
C. Fair Value Hierarchy — The following is a summary of the Funds’ investments and derivatives classified in the fair value hierarchy as of April 30, 2020:
| | | | | | | | | | | | |
| | | |
| EMERGING MARKETS EQUITY INSIGHTS | | | | | | | | | | | | |
| | | |
| Investment Type | | Level 1 | | | Level 2 | | | Level 3 | |
| | | |
| Assets | | | | | | | | | | | | |
| | | |
Common Stock and/or Other Equity Investments(a) | | | | | | | | | | | | |
| | | |
Africa | | $ | 12,263,435 | | | $ | 23,411,828 | | | $ | — | |
| | | |
Asia | | | 367,460,589 | | | | 853,828,543 | | | | — | |
| | | |
Europe | | | — | | | | 26,404,809 | | | | — | |
| | | |
North America | | | 21,963,383 | | | | — | | | | — | |
| | | |
South America | | | 53,017,185 | | | | 12,230,326 | | | | — | |
| | | |
Securities Lending Reinvestment Vehicle | | | 2,348,900 | | | | — | | | | — | |
| | | |
| Total | | $ | 457,053,492 | | | $ | 915,875,506 | | | $ | — | |
| | | |
| INTERNATIONAL EQUITY INSIGHTS | | | | | | | | | | | | |
| | | |
| Investment Type | | Level 1 | | | Level 2 | | | Level 3 | |
| | | |
| Assets | | | | | | | | | | | | |
| | | |
Common Stock and/or Other Equity Investments(a) | | | | | | | | | | | | |
| | | |
Africa | | $ | — | | | $ | 4,154,200 | | | $ | — | |
| | | |
Asia | | | — | | | | 629,705,822 | | | | — | |
| | | |
Australia and Oceania | | | 9,619,114 | | | | 197,289,002 | | | | — | |
| | | |
Europe | | | 90,094,312 | | | | 1,380,779,442 | | | | — | |
| | | |
North America | | | 13,029,528 | | | | — | | | | — | |
| | | |
Securities Lending Reinvestment Vehicle | | | 28,790,720 | | | | — | | | | — | |
| | | |
| Total | | $ | 141,533,674 | | | $ | 2,211,928,466 | | | $ | — | |
| | | |
| Derivative Type | | | | | | | | | |
| | | |
| Assets(b) | | | | | | | | | | | | |
| | | |
Futures Contracts | | $ | 357,758 | | | $ | — | | | $ | — | |
| (a) | | Amounts are disclosed by continent to highlight the impact of time zone differences between local market close and the calculation of NAV. Security valuations are based on the principal exchange or system on which they are traded, which may differ from country of domicile. The Funds utilize fair value model prices provided by an independent fair value service for certain international equity securities, resulting in a Level 2 classification. |
| (b) | | Amount shown represents unrealized gain (loss) at period end. |
57
GOLDMAN SACHS INTERNATIONAL EQUITY INSIGHTS FUNDS
Notes to Financial Statements(continued)
April 30, 2020 (Unaudited)
|
| 3. INVESTMENTS AND FAIR VALUE MEASUREMENTS (continued) |
| | | | | | | | | | | | |
| | | |
| INTERNATIONAL SMALL CAP INSIGHTS | | | | | | | | | | | | |
| | | |
| Investment Type | | Level 1 | | | Level 2 | | | Level 3 | |
| | | |
| Assets | | | | | | | | | | | | |
| | | |
Common Stock and/or Other Equity Investments(a) | | | | | | | | | | | | |
| | | |
Asia | | $ | — | | | $ | 1,019,790,069 | | | $ | — | |
| | | |
Australia and Oceania | | | 9,323,299 | | | | 204,134,226 | | | | — | |
| | | |
Europe | | | 61,988,649 | | | | 1,406,270,401 | | | | — | |
| | | |
Securities Lending Reinvestment Vehicle | | | 38,959,357 | | | | — | | | | — | |
| | | |
| Total | | $ | 110,271,305 | | | $ | 2,630,194,696 | | | $ | — | |
| | | |
| Derivative Type | | | | | | | | | |
| | | |
| Assets(b) | | | | | | | | | | | | |
| | | |
Futures Contracts | | $ | 1,517,909 | | | $ | — | | | $ | — | |
| (a) | | Amounts are disclosed by continent to highlight the impact of time zone differences between local market close and the calculation of NAV. Security valuations are based on the principal exchange or system on which they are traded, which may differ from country of domicile. The Funds utilize fair value model prices provided by an independent fair value service for certain international equity securities, resulting in a Level 2 classification. |
| (b) | | Amount shown represents unrealized gain (loss) at period end. |
For further information regarding security characteristics, see the Schedules of Investments.
|
| 4. INVESTMENTS IN DERIVATIVES |
The following table sets forth, by certain risk types, the gross value of derivative contracts (not considered to be hedging instruments for accounting disclosure purposes) as of April 30, 2020. These instruments were used as part of the Funds’ investment strategies and to obtain and/or manage exposure related to the risks below. The values in the tables below exclude the effects of cash collateral received or posted pursuant to these derivative contracts, and therefore are not representative of the Funds’ net exposure:
| | | | | | | | | | | | | | |
| Fund | | Risk | | Statements of Assets
and Liabilities | | Assets(a) | | | Statements of Assets
and Liabilities | | Liabilities | |
International Equity Insights | | Equity | | Variation margin on futures contracts | | $ | 357,758 | | | — | | $ | — | |
International Small Cap Insights | | Equity | | Variation margin on futures contracts | | | 1,517,909 | | | — | | | — | |
| (a) | | Includes unrealized gain (loss) on futures contracts described in the Additional Investment Information sections of the Schedules of Investments. Only the variation margin as of April 30, 2020 is reported within the Statements of Assets and Liabilities. |
58
GOLDMAN SACHS INTERNATIONAL EQUITY INSIGHTS FUNDS
|
| 4. INVESTMENTS IN DERIVATIVES (continued) |
The following table sets forth, by certain risk types, the Funds’ gains (losses) related to these derivatives and their indicative volumes for the six months ended April 30, 2020. These gains (losses) should be considered in the context that these derivative contracts may have been executed to create investment opportunities and/or economically hedge certain investments, and accordingly, certain gains (losses) on such derivative contracts may offset certain (losses) gains attributable to investments. These gains (losses) are included in “Net realized gain (loss)” or “Net change in unrealized gain (loss)” on the Statements of Operations:
| | | | | | | | | | | | | | | | |
| Fund | | Risk | | Statements of Operations | | Net Realized
Gain (Loss) | | | Net Change in
Unrealized
Gain (Loss) | | | Average
Number of
Contracts(a) | |
Emerging Markets Equity Insights | | Equity | | Net realized gain (loss) from futures contracts/Net change in unrealized gain (loss) on futures contracts | | $ | (239,504 | ) | | $ | — | | | | 193 | |
International Equity Insights | | Equity | | Net realized gain (loss) from futures contracts/Net change in unrealized gain (loss) on futures contracts | | | 7,234,263 | | | | 357,758 | | | | 398 | |
International Small Cap Insights | | Equity | | Net realized gain (loss) from futures contracts/Net change in unrealized gain (loss) on futures contracts | | | (11,346 | ) | | | 1,509,678 | | | | 358 | |
| (a) | | Average number of contracts is based on the average of month end balances for the six months ended April 30, 2020. |
|
| 5. AGREEMENTS AND AFFILIATED TRANSACTIONS |
A. Management Agreement — Under the Agreement, GSAM manages the Funds, subject to the general supervision of the Trustees.
As compensation for the services rendered pursuant to the Agreement, the assumption of the expenses related thereto and administration of the Funds’ business affairs, including providing facilities, GSAM is entitled to a management fee, accrued daily and paid monthly, equal to an annual percentage rate of each Fund’s average daily net assets.
For the six months ended April 30, 2020, contractual and effective net management fees with GSAM were at the following rates:
| | | | | | | | | | | | | | | | | | | | | | | | | | | | | | |
| | | | | Contractual Management Rate | | | | | | Effective Net
Management Rate^ | |
| Fund | | | | First $1 billion | | | Next $1 billion | | | Next $3 billion | | | Next $3 billion | | | Over $8 billion | | | Effective
Rate | |
Emerging Markets Equity Insights | | | | | 1.00 | % | | | 1.00 | % | | | 0.90 | % | | | 0.86 | % | | | 0.84 | % | | | 1.00 | % | | | 1.00 | % |
International Equity Insights | | | | | 0.81 | | | | 0.73 | | | | 0.69 | | | | 0.68 | | | | 0.67 | | | | 0.75 | | | | 0.75 | |
International Small Cap Insights | | | | | 0.85 | | | | 0.85 | | | | 0.77 | | | | 0.73 | | | | 0.72 | | | | 0.82 | | | | 0.82 | |
| ^ | | Effective Net Management Rate includes the impact of management fee waivers of affiliated underlying funds, if any. |
The Emerging Markets Equity Insights, International Equity Insights and International Small Cap Insights Funds invest in Institutional Shares of the Goldman Sachs Financial Square Government Fund, which is an affiliated Underlying Fund. GSAM has agreed to waive a portion of its management fee payable by the Funds in an amount equal to the management fee it earns as an investment adviser to the affiliated Underlying Fund in which the Funds invest, except those management fees it earns from the Funds’ investments of cash collateral received in connection with securities lending transactions in the Goldman Sachs Financial Square Government Fund. For the six months ended April 30, 2020, GSAM waived $2,583, $332 and $665 of the Emerging Markets Equity Insights, International Equity Insights and International Small Cap Insights Funds’ management fees, respectively.
59
GOLDMAN SACHS INTERNATIONAL EQUITY INSIGHTS FUNDS
Notes to Financial Statements(continued)
April 30, 2020 (Unaudited)
|
| 5. AGREEMENTS AND AFFILIATED TRANSACTIONS (continued) |
B. Distribution and/or Service (12b-1) Plans — The Trust, on behalf of Class A and Class R Shares of each applicable Fund, has adopted Distribution and Service Plans subject to Rule 12b-1 under the Act. Under the Distribution and Service Plans, Goldman Sachs, which serves as distributor (the “Distributor”), is entitled to a fee accrued daily and paid monthly for distribution services and personal and account maintenance services, which may then be paid by Goldman Sachs to authorized dealers. These fees are equal to an annual percentage rate of the average daily net assets attributable to Class A or Class R Shares of the Funds, as applicable, as set forth below.
The Trust, on behalf of Class C Shares of each applicable Fund, has adopted a Distribution Plan subject to Rule 12b-1 under the Act. Under the Distribution Plan, Goldman Sachs as Distributor is entitled to a fee accrued daily and paid monthly for distribution services, which may then be paid by Goldman Sachs to authorized dealers. These fees are equal to an annual percentage rate of the average daily net assets attributable to Class C Shares of the Funds, as set forth below.
The Trust, on behalf of Service Shares of each applicable Fund, has adopted a Service Plan subject to Rule 12b-1 under the Act to allow Service Shares to compensate service organizations (including Goldman Sachs) for providing personal and account maintenance services to their customers who are beneficial owners of such shares. The Service Plan provides for compensation to the service organizations equal to an annual percentage rate of the average daily net assets attributable to Service Shares of the Funds, as set forth below.
| | | | | | | | | | | | | | | | |
| | | Distribution and/or Service Plan Rates | |
| | | Class A* | | | Class C | | | Class R* | | | Service | |
Distribution and/or Service Plan | | | 0.25 | % | | | 0.75 | % | | | 0.50 | % | | | 0.25 | % |
| * | | With respect to Class A and Class R Shares, the Distributor at its discretion may use compensation for distribution services paid under the Distribution and Service Plans to compensate service organizations for personal and account maintenance services and expenses as long as such total compensation does not exceed the maximum cap on “service fees” imposed by the Financial Industry Regulatory Authority. |
C. Distribution Agreement — Goldman Sachs, as Distributor of the shares of the Funds pursuant to a Distribution Agreement, may retain a portion of the Class A Shares’ front end sales charge and Class C Shares’ CDSC. During the six months ended April 30, 2020, Goldman Sachs retained the following amounts:
| | | | | | | | | | |
| | | | | Front End
Sales Charge | | | Contingent Deferred
Sales Charge | |
| Fund | | | | Class A | | | Class C | |
Emerging Markets Equity Insights | | | | $ | 1,192 | | | $ | — | |
International Equity Insights | | | | | 2,725 | | | | 21 | |
International Small Cap Insights | | | | | 642 | | | | — | |
D. Service and Shareholder Administration Plans — The Trust, on behalf of each applicable Fund, has adopted Service Plans to allow Class C Shares and Shareholder Administration Plans to allow Service Shares, respectively, to compensate service organizations (including Goldman Sachs) for providing varying levels of personal and account maintenance or shareholder administration services to their customers who are beneficial owners of such shares. The Service and Shareholder Administration Plans each provide for compensation to the service organizations equal to an annual percentage rate of 0.25% of the average daily net assets attributable to Class C and Service Shares of the Funds, respectively.
E. Transfer Agency Agreement — Goldman Sachs also serves as the transfer agent of the Funds for a fee pursuant to the Transfer Agency Agreement. The fees charged for such transfer agency services are accrued daily and paid monthly at annual rates as follows: 0.17% of the average daily net assets of Class A, Class C, Investor and Class R Shares; 0.03% of the average daily net assets of Class P and Class R6 Shares; and 0.04% of the average daily net assets of Institutional and Service Shares.
F. Other Expense Agreements and Affiliated Transactions — GSAM has agreed to reduce or limit certain “Other Expenses” of the Funds (excluding acquired fund fees and expenses, transfer agency fees and expenses, service fees and
60
GOLDMAN SACHS INTERNATIONAL EQUITY INSIGHTS FUNDS
|
| 5. AGREEMENTS AND AFFILIATED TRANSACTIONS (continued) |
shareholder administration fees (as applicable), taxes, interest, brokerage fees, expenses of shareholder meetings, litigation and indemnification, and extraordinary expenses) to the extent such expenses exceed, on an annual basis, a percentage rate of the average daily net assets of each Fund. Such Other Expense reimbursements, if any, are accrued daily and paid monthly. In addition, the Funds are not obligated to reimburse GSAM for prior fiscal year expense reimbursements, if any. The Other Expense limitations as an annual percentage rate of average daily net assets for Emerging Markets Equity Insights, International Equity Insights and International Small Cap Insights Funds are 0.054%, 0.004% and 0.014%, respectively. These Other Expense limitations will remain in place through at least February 28, 2021, and prior to such date GSAM may not terminate the arrangements without the approval of the Trustees. In addition, the Funds have entered into certain offset arrangements with the custodian and the transfer agent, which may result in a reduction of the Funds’ expenses and are received irrespective of the application of the “Other Expense” limitations described above.
For the six months ended April 30, 2020, these expense reductions, including any fee waivers and Other Expense reimbursements, were as follows:
| | | | | | | | | | | | | | | | | | |
| Fund | | | | Management
Fee Waiver | | | Custody Fee
Credits | | | Other Expense
Reimbursement | | | Total Expense
Reductions | |
Emerging Markets Equity Insights | | | | $ | 2,583 | | | $ | 20,954 | | | $ | 391,896 | | | $ | 415,433 | |
International Equity Insights | | | | | 332 | | | | 46,888 | | | | 595,580 | | | | 642,800 | |
International Small Cap Insights | | | | | 665 | | | | 13,214 | | | | 856,569 | | | | 870,448 | |
G. Line of Credit Facility — As of April 30, 2020, the Funds participated in a $700,000,000 committed, unsecured revolving line of credit facility (the “facility”) together with other funds of the Trust and certain registered investment companies having management agreements with GSAM or its affiliates. This facility is to be used for temporary emergency purposes, or to allow for an orderly liquidation of securities to meet redemption requests. The interest rate on borrowings is based on the federal funds rate. The facility also requires a fee to be paid by the Funds based on the amount of the commitment that has not been utilized. For the six months ended April 30, 2020, the Funds did not have any borrowings under the facility. Prior to April 28, 2020, the facility was $580,000,000.
H. Other Transactions with Affiliates — For the six months ended April 30, 2020, Goldman Sachs earned $800 and $1,046 in brokerage commissions from portfolio transactions, including futures transactions executed with Goldman Sachs as the Futures Commission Merchant, on behalf of the International Equity Insights and International Small Cap Insights Funds, respectively.
The following table provides information about the Funds’ investments in the Goldman Sachs Financial Square Government Fund as of and for the six months ended April 30, 2020:
| | | | | | | | | | | | | | | | | | | | | | | | |
| Fund | | | | Beginning Value as of
October 31, 2019 | | Purchases
at Cost | | | Proceeds
from Sales | | | Ending
Value as of
April 30, 2020 | | | Shares as of
April 30, 2020 | | | Dividend Income from
Affiliated
Investment Company | |
Emerging Markets Equity Insights | | | | $— | | $ | 60,404,506 | | | $ | (60,404,506 | ) | | $ | — | | | | — | | | $ | 11,390 | |
International Equity Insights | | | | — | | | 141,962,756 | | | | (141,962,756 | ) | | | — | | | | — | | | | 28,783 | |
International Small Cap Insights | | | | — | | | 34,870,207 | | | | (34,870,207 | ) | | | — | | | | — | | | | 599 | |
61
GOLDMAN SACHS INTERNATIONAL EQUITY INSIGHTS FUNDS
Notes to Financial Statements(continued)
April 30, 2020 (Unaudited)
|
| 5. AGREEMENTS AND AFFILIATED TRANSACTIONS (continued) |
As of April 30, 2020, the following Goldman Sachs Global Tax-Aware Equity Portfolio was a beneficial owner of 5% or more of total outstanding shares of the following Fund:
| | | | | | |
| Fund | | | | Goldman Sachs
Tax-Advantaged
Global Equity
Portfolio | |
Emerging Markets Equity Insights | | | | | 9 | % |
|
| 6. PORTFOLIO SECURITIES TRANSACTIONS |
The cost of purchases and proceeds from sales and maturities of long-term securities for the six months ended April 30, 2020, were as follows:
| | | | | | | | | | |
| Fund | | | | Purchases | | | Sales and Maturities | |
Emerging Markets Equity Insights | | | | $ | 1,411,720,373 | | | $ | 1,611,445,393 | |
International Equity Insights | | | | | 2,198,296,047 | | | | 2,417,878,185 | |
International Small Cap Insights | | | | | 2,323,250,951 | | | | 2,796,932,452 | |
Pursuant to exemptive relief granted by the Securities and Exchange Commission (“SEC”) and the terms and conditions contained therein, the Funds may lend their securities through a securities lending agent, Goldman Sachs Agency Lending (“GSAL”), a wholly-owned subsidiary of Goldman Sachs, to certain qualified borrowers including Goldman Sachs and affiliates. In accordance with the Funds’ securities lending procedures, the Funds receive cash collateral at least equal to the market value of the securities on loan. The market value of the loaned securities is determined at the close of business of the Funds, at their last sale price or official closing price on the principal exchange or system on which they are traded, and any additional required collateral is delivered to the Funds on the next business day. As with other extensions of credit, the Funds may experience delay in the recovery of their securities or incur a loss should the borrower of the securities breach its agreement with the Funds or become insolvent at a time when the collateral is insufficient to cover the cost of repurchasing securities on loan. Dividend income received from securities on loan may not be subject to withholding taxes and therefore withholding taxes paid may differ from the amounts listed in the Statements of Operations. Loans of securities are terminable at any time and as such 1) the remaining contractual maturities of the outstanding securities lending transactions are considered to be overnight and continuous and 2) the borrower, after notice, is required to return borrowed securities within the standard time period for settlement of securities transactions.
The Funds invest the cash collateral received in connection with securities lending transactions in the Goldman Sachs Financial Square Government Fund (“Government Money Market Fund”), an affiliated series of the Goldman Sachs Trust. The Government Money Market Fund is registered under the Act as an open end investment company, is subject to Rule 2a-7 under the Act, and is managed by GSAM, for which GSAM may receive a management fee of up to 0.16% on an annualized basis of the average daily net assets of the Government Money Market Fund.
In the event of a default by a borrower with respect to any loan, GSAL will exercise any and all remedies provided under the applicable borrower agreement to make the Funds whole. These remedies include purchasing replacement securities by applying the collateral held from the defaulting broker against the purchase cost of the replacement securities. If GSAL is unable to purchase replacement securities, GSAL will indemnify the Funds by paying the Funds an amount equal to the market value of the securities loaned minus the value of cash collateral received from the borrower for the loan, subject to an exclusion for any shortfalls resulting from a loss of value in such cash collateral due to reinvestment risk. The Funds’ master netting agreements with certain
62
GOLDMAN SACHS INTERNATIONAL EQUITY INSIGHTS FUNDS
|
| 7. SECURITIES LENDING (continued) |
borrowers provide the right, in the event of a default (including bankruptcy or insolvency), for the non-defaulting party to liquidate the collateral and calculate net exposure to the defaulting party or request additional collateral. However, in the event of a default by a borrower, a resolution authority could determine that such rights are not enforceable due to the restrictions or prohibitions against the right of set-off that may be imposed in accordance with a particular jurisdiction’s bankruptcy or insolvency laws. The Funds’ loaned securities were all subject to enforceable Securities Lending Agreements and the value of the collateral was at least equal to the value of the cash received. The amounts of the Funds’ overnight and continuous agreements, which represent the gross amounts of recognized liabilities for securities lending transactions outstanding as of April 30, 2020 are disclosed as “Payable upon return of securities loaned” on the Statements of Assets and Liabilities, where applicable.
Each of the Funds and GSAL received compensation relating to the lending of the Funds’ securities. The amounts earned, if any, by the Funds for the six months ended April 30, 2020, are reported under Investment Income on the Statements of Operations.
The table below details securities lending activity with affiliates of Goldman Sachs:
| | | | | | | | | | | | | | |
| | | | | For the six months ended April 30, 2020 | | | Amount Payable to
Goldman Sachs
upon Return of
Securities Loaned as of
April 30, 2020 | |
| Fund | | | | Earnings of GSAL
Relating to
Securities
Loaned | | | Amounts Received
by the Funds from Lending to
Goldman Sachs | |
Emerging Markets Equity Insights | | | | $ | 5,409 | | | $ | 6,292 | | | $ | — | |
International Equity Insights | | | | | 14,270 | | | | 2,143 | | | | — | |
International Small Cap Insights | | | | | 31,381 | | | | 59,279 | | | | 1,723,140 | |
The following table provides information about the Funds’ investment in the Government Money Market Fund for the six months ended April 30, 2020:
| | | | | | | | | | | | | | | | | | |
| Fund | | | | Beginning
Value as of
October 31, 2019 | | | Purchases
at Cost | | | Proceeds
from Sales | | | Ending
Value as of
April 30, 2020 | |
Emerging Markets Equity Insights | | | | $ | 121,709 | | | $ | 85,054,669 | | | $ | (82,827,478 | ) | | $ | 2,348,900 | |
International Equity Insights | | | | | 30,387,872 | | | | 171,393,397 | | | | (172,990,549 | ) | | | 28,790,720 | |
International Small Cap Insights | | | | | 32,107,743 | | | | 226,122,341 | | | | (219,270,727 | ) | | | 38,959,357 | |
As of the Funds’ most recent fiscal year ended, October 31, 2019, the Funds’ capital loss carryforwards on a tax-basis were as follows:
| | | | | | | | | | | | |
| | | Emerging Markets
Equity Insights | | | International
Equity Insights | | | International Small Cap Insights | |
Capital loss carryforwards: | | | | | | | | | | | | |
Perpetual Long-term | | $ | — | | | $ | (34,611,262 | ) | | $ | (18,187,000 | ) |
Perpetual Short-term | | | (177,999,895 | ) | | | (177,052,399 | ) | | | (278,049,826 | ) |
Total capital loss carryforwards | | $ | (177,999,895 | ) | | $ | (211,663,661 | ) | | $ | (296,236,826 | ) |
63
GOLDMAN SACHS INTERNATIONAL EQUITY INSIGHTS FUNDS
Notes to Financial Statements(continued)
April 30, 2020 (Unaudited)
|
| 8. TAX INFORMATION (continued) |
As of April 30, 2020, the Funds’ aggregate security unrealized gains and losses based on cost for U.S. federal income tax purposes were as follows:
| | | | | | | | | | | | |
| | | Emerging Markets
Equity Insights | | | International
Equity Insights | | | International
Small Cap Insights | |
Tax cost | | $ | 1,317,050,411 | | | $ | 2,435,442,326 | | | $ | 2,954,036,346 | |
Gross unrealized gain | | | 189,255,284 | | | | 156,706,566 | | | | 206,426,052 | |
Gross unrealized loss | | | (133,376,697 | ) | | | (238,686,752 | ) | | | (419,996,397 | ) |
Net unrealized gain (loss) | | $ | 55,878,587 | | | $ | (81,980,186 | ) | | $ | (213,570,345 | ) |
The difference between GAAP-basis and tax-basis unrealized gains (losses) is attributable primarily to wash sales, net mark to market gains (losses) on regulated futures, net mark to market gains (losses) on foreign currency contracts and differences in the tax treatment of passive foreign investment company investments.
GSAM has reviewed the Funds’ tax positions for all open tax years (the current and prior three years, as applicable) and has concluded that no provision for income tax is required in the Funds’ financial statements. Such open tax years remain subject to examination and adjustment by tax authorities.
The Funds’ risks include, but are not limited to, the following:
Derivatives Risk — The Funds’ use of derivatives may result in loss. Derivative instruments, which may pose risks in addition to and greater than those associated with investing directly in securities, currencies or other instruments, may be illiquid or less liquid, volatile, difficult to price and leveraged so that small changes in the value of the underlying instruments may produce disproportionate losses to the Funds. Derivatives are also subject to counterparty risk, which is the risk that the other party in the transaction will not fulfill its contractual obligation. The use of derivatives is a highly specialized activity that involves investment techniques and risks different from those associated with investments in more traditional securities and instruments. Losses from derivatives can also result from a lack of correlation between changes in the value of derivative instruments and the portfolio assets (if any) being hedged.
Foreign and Emerging Countries Risk — Investing in foreign markets may involve special risks and considerations not typically associated with investing in the U.S. Foreign securities may be subject to risk of loss because of more or less foreign government regulation, less public information and less economic, political and social stability in the countries in which a Fund invests. The imposition of exchange controls (including repatriation restrictions), confiscation of assets and property, trade restrictions (including tariffs) and other government restrictions by the U.S. or other governments, or from problems in share registration, settlement or custody, may also result in losses. Foreign risk also involves the risk of negative foreign currency rate fluctuations, which may cause the value of securities denominated in such foreign currency (or other instruments through which a Fund has exposure to foreign currencies) to decline in value. Currency exchange rates may fluctuate significantly over short periods of time. To the extent that a Fund also invests in securities of issuers located in emerging markets, these risks may be more pronounced.
Foreign Custody Risk — If a Fund invests in foreign securities, the Fund may hold such securities and cash with foreign banks, agents, and securities depositories appointed by the Fund’s custodian (each a “Foreign Custodian”). Some foreign custodians may be recently organized or new to the foreign custody business. In some countries, Foreign Custodians may be subject to little or no regulatory oversight over, or independent evaluation of, their operations. Further, the laws of certain countries may place limitations on a Fund’s ability to recover its assets if a Foreign Custodian enters bankruptcy. Investments in emerging markets may be subject to even greater custody risks than investments in more developed markets. Custody services in emerging market
64
GOLDMAN SACHS INTERNATIONAL EQUITY INSIGHTS FUNDS
|
| 9. OTHER RISKS (continued) |
countries are very often undeveloped and may be considerably less well regulated than in more developed countries, and thus may not afford the same level of investor protection as would apply in developed countries.
Investments in Other Investment Companies Risk — As a shareholder of another investment company, a Fund will indirectly bear its proportionate share of any net management fees and other expenses paid by such other investment companies, in addition to the fees and expenses regularly borne by the Fund.
Large Shareholder Transactions Risk — A Fund may experience adverse effects when certain large shareholders, such as other funds, institutional investors (including those trading by use of non-discretionary mathematical formulas), financial intermediaries (who may make investment decisions on behalf of underlying clients and/or include a Fund in their investment model), individuals, accounts and Goldman Sachs affiliates, purchase or redeem large amounts of shares of a Fund. Such large shareholder redemptions, which may occur rapidly or unexpectedly, may cause a Fund to sell portfolio securities at times when it would not otherwise do so, which may negatively impact a Fund’s NAV and liquidity. These transactions may also accelerate the realization of taxable income to shareholders if such sales of investments resulted in gains, and may also increase transaction costs. In addition, a large redemption could result in a Fund’s current expenses being allocated over a smaller asset base, leading to an increase in the Fund’s expense ratio. Similarly, large Fund share purchases may adversely affect a Fund’s performance to the extent that the Fund is delayed in investing new cash or otherwise maintains a larger cash position than it ordinarily would.
Liquidity Risk — A Fund may make investments that are illiquid or that may become less liquid in response to market developments or adverse investor perceptions. Illiquid investments may be more difficult to value. Liquidity risk may also refer to the risk that a Fund will not be able to pay redemption proceeds within the allowable time period or without significant dilution to remaining investors’ interests because of unusual market conditions, an unusually high volume of redemption requests, or other reasons. To meet redemption requests, a Fund may be forced to sell investments at an unfavorable time and/or under unfavorable conditions. If a Fund is forced to sell securities at an unfavorable time and/or under unfavorable conditions, such sales may adversely affect the Fund’s NAV and dilute remaining investors’ interests. These risks may be more pronounced in connection with the Funds’ investments in securities of issuers located in emerging market countries. Redemptions by large shareholders may have a negative impact on a Fund’s liquidity.
Market and Credit Risks — In the normal course of business, a Fund trades financial instruments and enters into financial transactions where risk of potential loss exists due to changes in the market (market risk). The value of the securities in which a Fund invests may go up or down in response to the prospects of individual companies, particular sectors or governments and/or general economic conditions throughout the world due to increasingly interconnected global economies and financial markets. Events such as war, acts of terrorism, social unrest, natural disasters, the spread of infectious illness or other public health threats could also significantly impact a Fund and its investments. Additionally, a Fund may also be exposed to credit risk in the event that an issuer or guarantor fails to perform or that an institution or entity with which the Fund has unsettled or open transactions defaults.
Under the Trust’s organizational documents, its Trustees, officers, employees and agents are indemnified, to the extent permitted by the Act and state law, against certain liabilities that may arise out of performance of their duties to the Funds. Additionally, in the course of business, the Funds enter into contracts that contain a variety of indemnification clauses. The Funds’ maximum exposure under these arrangements is unknown, as this would involve future claims that may be made against the Funds that have not yet occurred. However, GSAM believes the risk of loss under these arrangements to be remote.
Subsequent events after the Statements of Assets and Liabilities date have been evaluated, and GSAM has concluded that there is no impact requiring adjustment or disclosure in the financial statements.
65
GOLDMAN SACHS INTERNATIONAL EQUITY INSIGHTS FUNDS
Notes to Financial Statements(continued)
April 30, 2020 (Unaudited)
|
| 12. SUMMARY OF SHARE TRANSACTIONS |
Share activity is as follows:
| | | | | | | | | | | | | | | | |
| | | Emerging Markets Equity Insights Fund | |
| | | | |
| | | For the Six Months Ended
April 30, 2020
(Unaudited) | | | For the Fiscal Year Ended
October 31, 2019 | |
| | | | |
| | | Shares | | | Dollars | | | Shares | | | Dollars | |
| | | | |
| Class A Shares | | | | | | | | | | | | | | | | |
Shares sold | | | 863,580 | | | $ | 7,726,154 | | | | 2,966,653 | | | $ | 27,441,781 | |
Reinvestment of distributions | | | 118,920 | | | | 1,159,473 | | | | 158,620 | | | | 1,368,888 | |
Shares redeemed | | | (2,243,155 | ) | | | (20,440,630 | ) | | | (4,534,826 | ) | | | (41,438,386 | ) |
| | | | (1,260,655 | ) | | | (11,555,003 | ) | | | (1,409,553 | ) | | | (12,627,717 | ) |
| Class C Shares | | | | | | | | | | | | | | | | |
Shares sold | | | 39,399 | | | | 371,695 | | | | 256,648 | | | | 2,349,700 | |
Reinvestment of distributions | | | 5,799 | | | | 56,080 | | | | 9,579 | | | | 81,900 | |
Shares redeemed | | | (216,349 | ) | | | (1,914,000 | ) | | | (379,019 | ) | | | (3,461,810 | ) |
| | | | (171,151 | ) | | | (1,486,225 | ) | | | (112,792 | ) | | | (1,030,210 | ) |
| Institutional Shares | | | | | | | | | | | | | | | | |
Shares sold | | | 22,306,638 | | | | 199,331,200 | | | | 52,061,873 | | | | 482,572,337 | |
Reinvestment of distributions | | | 1,872,307 | | | | 18,180,104 | | | | 2,189,583 | | | | 18,830,413 | |
Shares redeemed | | | (30,166,626 | ) | | | (256,504,180 | ) | | | (62,919,172 | ) | | | (577,944,922 | ) |
| | | | (5,987,681 | ) | | | (38,992,876 | ) | | | (8,667,716 | ) | | | (76,542,172 | ) |
| Investor Shares | | | | | | | | | | | | | | | | |
Shares sold | | | 1,415,758 | | | | 12,363,273 | | | | 10,841,603 | | | | 100,200,063 | |
Reinvestment of distributions | | | 226,625 | | | | 2,198,257 | | | | 249,709 | | | | 2,145,005 | |
Shares redeemed | | | (4,472,644 | ) | | | (38,410,751 | ) | | | (9,135,724 | ) | | | (84,201,328 | ) |
| | | | (2,830,261 | ) | | | (23,849,221 | ) | | | 1,955,588 | | | | 18,143,740 | |
| Class P Shares | | | | | | | | | | | | | | | | |
Shares sold | | | 2,381,517 | | | | 18,656,187 | | | | 6,605,230 | | | | 59,494,143 | |
Reinvestment of distributions | | | 264,309 | | | | 2,563,794 | | | | 359,752 | | | | 3,090,275 | |
Shares redeemed | | | (5,718,736 | ) | | | (46,585,550 | ) | | | (8,075,477 | ) | | | (73,381,775 | ) |
| | | | (3,072,910 | ) | | | (25,365,569 | ) | | | (1,110,495 | ) | | | (10,797,357 | ) |
| Class R Shares | | | | | | | | | | | | | | | | |
Shares sold | | | 389,521 | | | | 3,375,141 | | | | 1,277,600 | | | | 11,619,066 | |
Reinvestment of distributions | | | 45,642 | | | | 438,620 | | | | 37,333 | | | | 318,449 | |
Shares redeemed | | | (474,132 | ) | | | (4,224,738 | ) | | | (649,444 | ) | | | (5,943,448 | ) |
| | | | (38,969 | ) | | | (410,977 | ) | | | 665,489 | | | | 5,994,067 | |
| Class R6 Shares | | | | | | | | | | | | | | | | |
Shares sold | | | 6,295,567 | | | | 55,350,961 | | | | 21,229,915 | | | | 194,592,630 | |
Reinvestment of distributions | | | 954,926 | | | | 9,262,782 | | | | 1,352,035 | | | | 11,613,981 | |
Shares redeemed | | | (14,866,541 | ) | | | (131,060,957 | ) | | | (39,121,967 | ) | | | (360,316,512 | ) |
| | | | (7,616,048 | ) | | | (66,447,214 | ) | | | (16,540,017 | ) | | | (154,109,901 | ) |
| | | | |
NET DECREASE | | | (20,977,675 | ) | | $ | (168,107,085 | ) | | | (25,219,496 | ) | | $ | (230,969,550 | ) |
66
GOLDMAN SACHS INTERNATIONAL EQUITY INSIGHTS FUNDS
|
| 12. SUMMARY OF SHARE TRANSACTIONS (continued) |
| | | | | | | | | | | | | | | | |
| | | International Equity Insights Fund | |
| | | | |
| | | For the Six Months Ended
April 30, 2020
(Unaudited) | | | For the Fiscal Year Ended
October 31, 2019 | |
| | | | |
| | | Shares | | | Dollars | | | Shares | | | Dollars | |
| | | | |
| Class A Shares | | | | | | | | | | | | | | | | |
Shares sold | | | 6,194,372 | | | $ | 69,735,847 | | | | 13,259,688 | | | $ | 159,153,653 | |
Reinvestment of distributions | | | 440,242 | | | | 5,547,046 | | | | 204,537 | | | | 2,186,506 | |
Shares redeemed | | | (6,382,946 | ) | | | (67,239,484 | ) | | | (9,882,575 | ) | | | (116,821,278 | ) |
| | | | 251,668 | | | | 8,043,409 | | | | 3,581,650 | | | | 44,518,881 | |
| Class C Shares | | | | | | | | | | | | | | | | |
Shares sold | | | 94,403 | | | | 1,095,597 | | | | 456,513 | | | | 5,141,424 | |
Reinvestment of distributions | | | 19,114 | | | | 236,629 | | | | 19,962 | | | | 209,198 | |
Shares redeemed | | | (427,075 | ) | | | (4,691,771 | ) | | | (1,425,650 | ) | | | (16,400,371 | ) |
| | | | (313,558 | ) | | | (3,359,545 | ) | | | (949,175 | ) | | | (11,049,749 | ) |
| Institutional Shares | | | | | | | | | | | | | | | | |
Shares sold | | | 15,691,912 | | | | 181,546,341 | | | | 54,720,178 | | | | 657,831,323 | |
Reinvestment of distributions | | | 1,453,083 | | | | 18,817,424 | | | | 1,221,357 | | | | 13,398,286 | |
Shares redeemed | | | (35,787,006 | ) | | | (418,497,865 | ) | | | (66,250,331 | ) | | | (798,357,316 | ) |
| | | | (18,642,011 | ) | | | (218,134,100 | ) | | | (10,308,796 | ) | | | (127,127,707 | ) |
| Service Shares | | | | | | | | | | | | | | | | |
Shares sold | | | 25,376 | | | | 291,285 | | | | 142,546 | | | | 1,698,529 | |
Reinvestment of distributions | | | 7,944 | | | | 101,205 | | | | 5,670 | | | | 61,236 | |
Shares redeemed | | | (110,612 | ) | | | (1,333,927 | ) | | | (98,679 | ) | | | (1,177,739 | ) |
| | | | (77,292 | ) | | | (941,437 | ) | | | 49,537 | | | | 582,026 | |
| Investor Shares | | | | | | | | | | | | | | | | |
Shares sold | | | 16,489,277 | | | | 179,578,890 | | | | 38,817,614 | | | | 453,063,492 | |
Reinvestment of distributions | | | 1,192,705 | | | | 14,717,983 | | | | 684,659 | | | | 7,168,380 | |
Shares redeemed | | | (20,020,685 | ) | | | (222,607,965 | ) | | | (28,303,390 | ) | | | (326,016,478 | ) |
| | | | (2,338,703 | ) | | | (28,311,092 | ) | | | 11,198,883 | | | | 134,215,394 | |
| Class P Shares | | | | | | | | | | | | | | | | |
Shares sold | | | 18,826,003 | | | | 181,976,736 | | | | 24,463,775 | | | | 282,043,576 | |
Reinvestment of distributions | | | 715,872 | | | | 9,256,225 | | | | 514,841 | | | | 5,642,654 | |
Shares redeemed | | | (13,344,549 | ) | | | (140,875,509 | ) | | | (16,007,445 | ) | | | (190,246,857 | ) |
| | | | 6,197,326 | | | | 50,357,452 | | | | 8,971,171 | | | | 97,439,373 | |
| Class R Shares | | | | | | | | | | | | | | | | |
Shares sold | | | 199,653 | | | | 1,962,093 | | | | 363,618 | | | | 4,188,056 | |
Reinvestment of distributions | | | 13,067 | | | | 160,204 | | | | 7,899 | | | | 82,224 | |
Shares redeemed | | | (144,755 | ) | | | (1,678,376 | ) | | | (258,509 | ) | | | (2,987,023 | ) |
| | | | 67,965 | | | | 443,921 | | | | 113,008 | | | | 1,283,257 | |
| Class R6 Shares | | | | | | | | | | | | | | | | |
Shares sold | | | 7,770,602 | | | | 95,362,413 | | | | 34,080,931 | | | | 412,901,400 | |
Reinvestment of distributions | | | 1,011,030 | | | | 13,082,737 | | | | 724,784 | | | | 7,943,638 | |
Shares redeemed | | | (7,787,514 | ) | | | (94,511,658 | ) | | | (22,360,220 | ) | | | (272,988,934 | ) |
| | | | 994,118 | | | | 13,933,492 | | | | 12,445,495 | | | | 147,856,104 | |
| | | | |
NET INCREASE (DECREASE) | | | (13,860,487 | ) | | $ | (177,967,900 | ) | | | 25,101,773 | | | $ | 287,717,579 | |
67
GOLDMAN SACHS INTERNATIONAL EQUITY INSIGHTS FUNDS
Notes to Financial Statements(continued)
April 30, 2020 (Unaudited)
|
| 12. SUMMARY OF SHARE TRANSACTIONS (continued) |
| | | | | | | | | | | | | | | | |
| | | International Small Cap Insights Fund | |
| | | | |
| | | For the Six Months Ended
April 30, 2020
(Unaudited) | | | For the Fiscal Year Ended
October 31, 2019 | |
| | | | |
| | | Shares | | | Dollars | | | Shares | | | Dollars | |
| | | | |
| Class A Shares | | | | | | | | | | | | | | | | |
Shares sold | | | 1,671,406 | | | $ | 16,455,601 | | | | 5,084,350 | | | $ | 57,542,690 | |
Reinvestment of distributions | | | 391,583 | | | | 4,659,839 | | | | 174,144 | | | | 1,724,026 | |
Shares redeemed | | | (3,859,288 | ) | | | (38,847,308 | ) | | | (8,714,983 | ) | | | (95,912,370 | ) |
| | | | (1,796,299 | ) | | | (17,731,868 | ) | | | (3,456,489 | ) | | | (36,645,654 | ) |
| Class C Shares | | | | | | | | | | | | | | | | |
Shares sold | | | 50,401 | | | | 548,112 | | | | 166,083 | | | | 1,768,839 | |
Reinvestment of distributions | | | 96,844 | | | | 1,117,582 | | | | 14,011 | | | | 134,359 | |
Shares redeemed | | | (1,057,648 | ) | | | (10,639,592 | ) | | | (2,026,719 | ) | | | (21,560,049 | ) |
| | | | (910,403 | ) | | | (8,973,898 | ) | | | (1,846,625 | ) | | | (19,656,851 | ) |
| Institutional Shares | | | | | | | | | | | | | | | | |
Shares sold | | | 30,613,262 | | | | 306,875,429 | | | | 88,905,949 | | | | 988,567,614 | |
Reinvestment of distributions | | | 5,638,318 | | | | 66,926,830 | | | | 3,192,108 | | | | 31,506,109 | |
Shares redeemed | | | (69,358,814 | ) | | | (658,897,512 | ) | | | (112,062,966 | ) | | | (1,226,702,768 | ) |
| | | | (33,107,234 | ) | | | (285,095,253 | ) | | | (19,964,909 | ) | | | (206,629,045 | ) |
| Investor Shares | | | | | | | | | | | | | | | | |
Shares sold | | | 1,215,594 | | | | 12,391,676 | | | | 6,007,193 | | | | 66,017,326 | |
Reinvestment of distributions | | | 726,038 | | | | 8,589,026 | | | | 601,289 | | | | 5,910,668 | |
Shares redeemed | | | (9,224,442 | ) | | | (96,375,998 | ) | | | (31,099,022 | ) | �� | | (340,121,004 | ) |
| | | | (7,282,810 | ) | | | (75,395,296 | ) | | | (24,490,540 | ) | | | (268,193,010 | ) |
| Class P Shares | | | | | | | | | | | | | | | | |
Shares sold | | | 154,480 | | | | 1,797,198 | | | | 593,597 | | | | 6,725,342 | |
Reinvestment of distributions | | | 233,781 | | | | 2,779,660 | | | | 136,281 | | | | 1,347,821 | |
Shares redeemed | | | (2,553,375 | ) | | | (24,929,908 | ) | | | (1,986,467 | ) | | | (21,379,469 | ) |
| | | | (2,165,114 | ) | | | (20,353,050 | ) | | | (1,256,589 | ) | | | (13,306,306 | ) |
| Class R6 Shares | | | | | | | | | | | | | | | | |
Shares sold | | | 16,005,482 | | | | 161,279,883 | | | | 26,323,470 | | | | 291,256,574 | |
Reinvestment of distributions | | | 3,311,662 | | | | 39,375,654 | | | | 1,590,561 | | | | 15,730,650 | |
Shares redeemed | | | (15,414,695 | ) | | | (163,862,418 | ) | | | (22,908,629 | ) | | | (255,148,086 | ) |
| | | | 3,902,449 | | | | 36,793,119 | | | | 5,005,402 | | | | 51,839,138 | |
| | | | |
NET DECREASE | | | (41,359,411 | ) | | $ | (370,756,246 | ) | | | (46,009,750 | ) | | $ | (492,591,728 | ) |
68
GOLDMAN SACHS INTERNATIONAL EQUITY INSIGHTS FUNDS
Voting Results of Special Meeting of Shareholders (Unaudited)
A Special Meeting (the “Meeting”) of the Goldman Sachs Trust (“GST”) was held on January 23, 2020 to consider and act upon the proposals below. The Funds have amortized their respective share of the proxy, shareholder meeting and other related costs and GSAM has agreed to reimburse each Fund to the extent such expenses exceed a specified percentage of the Fund’s net assets.
At the Meeting, Dwight L. Bush, Kathryn A. Cassidy, Joaquin Delgado and Gregory G. Weaver were elected to the Trust’s Board of Trustees. In electing trustees, the Trust’s shareholders voted as follows:
| | | | | | | | | | | | | | | | |
Proposal 1. Election of Trustees | | For | | | Against | | | Withheld | | | Broker Non-Votes | |
| | | | |
Dwight L. Bush | | | 94,278,961,728.065 | | | | 0 | | | | 349,026,343,365 | | | | 0 | |
| | | | |
Kathryn A. Cassidy | | | 94,310,850,789.164 | | | | 0 | | | | 317,137,282.266 | | | | 0 | |
| | | | |
Joaquin Delgado | | | 94,282,646,444.727 | | | | 0 | | | | 345,341,626.703 | | | | 0 | |
| | | | |
Gregory G. Weaver | | | 94,306,589,873.348 | | | | 0 | | | | 321,398,198.082 | | | | 0 | |
| | | | | | | | | | | | | | | | |
69
GOLDMAN SACHS INTERNATIONAL EQUITY INSIGHTS FUNDS
Liquidity Risk Management Program (Unaudited)
Each Fund has adopted and implemented a liquidity risk management program (the “Program”) in accordance with Rule22e-4 under the 1940 Act. The Program seeks to assess and manage each Fund’s liquidity risk,i.e., the risk that a Fund is unable to satisfy redemption requests without significantly diluting remaining investors’ interests in the Fund. The Board of Trustees of the Trust has designated GSAM, each Fund’s investment adviser, to administer the Program. Certain aspects of the Program rely on third parties to perform certain functions, including the provision of market data and application of models.
The Program is comprised of various components designed to support the assessment and/or management of liquidity risk, including: (1) the periodic assessment (no less frequently than annually) of certain factors that influence a Fund’s liquidity risk; (2) the periodic classification (no less frequently than monthly) of a Fund’s investments into one of four liquidity categories that reflect an estimate of their liquidity under current market conditions; (3) a 15% limit on the acquisition of “illiquid investments” (as defined under Rule22e-4); (4) for a Fund that does not invest primarily in “highly liquid investments” (as defined under Rule22e-4), the determination of a minimum percentage of the Fund’s assets that will generally be invested in highly liquid investments (a “Highly Liquid Investment Minimum”); and (5) periodic reporting to the Board of Trustees.
At a meeting of the Board of Trustees on February 11-12, 2020, GSAM provided a written report to the Board addressing the operation, and the adequacy and effectiveness of the implementation, of the Program, including, as applicable, the operation of any Highly Liquid Investment Minimum and any material changes to the Program, for the initial period from December 1, 2018 through December 31, 2019 (the “Reporting Period”). Among other things, the annual report discussed: (1) the results of stress tests designed to assess liquidity under a hypothetical stressed scenario involving elevated redemptions; and (2) an assessment of the methodologies used to classify investments into one of four liquidity categories. The report concluded that the Program was reasonably designed to assess and manage liquidity risk and was adequately and effectively implemented during the Reporting Period.
There can be no assurance that the Program will achieve its objectives under all circumstances in the future. Please refer to your Fund’s prospectus for more information regarding the Fund’s exposure to liquidity risk and other risks to which it may be subject.
70
GOLDMAN SACHS INTERNATIONAL EQUITY INSIGHTS FUNDS
Fund Expenses — Six Month Period Ended April 30, 2020 (Unaudited)
As a shareholder of Class A, Class C, Institutional, Service, Investor, Class P, Class R or Class R6 Shares of a Fund you incur two types of costs: (1) transaction costs, including sales charges on purchase payments (with respect to Class A Shares) and contingent deferred sales charges on redemptions (with respect to Class C Shares); and (2) ongoing costs, including management fees; distribution and/or service (12b-1) fees (with respect to Class A, Class C, Service and Class R Shares); and other Fund expenses. This example is intended to help you understand your ongoing costs (in dollars) of investing in Class A, Class C, Institutional, Service, Investor, Class P, Class R and Class R6 Shares of the Funds and to compare these costs with the ongoing costs of investing in other mutual funds.
The example is based on an investment of $1,000 invested at the beginning of the period and held for the entire period from November 1, 2019 through April 30, 2020, which represents a period of 182 days of a 366 day year.
Actual Expenses — The first line under each share class in the table below provides information about actual account values and actual expenses. You may use the information in this line, together with the amount you invested, to estimate the expenses that you paid over the period. Simply divide your account value by $1,000 (for example, an $8,600 account value divided by $1,000=8.6), then multiply the result by the number in the first line under the heading entitled “Expenses Paid” to estimate the expenses you paid on your account during this period.
Hypothetical Example for Comparison Purposes — The second line under each share class in the table below provides information about hypothetical account values and hypothetical expenses based on the Funds’ actual net expense ratio and an assumed rate of return of 5% per year before expenses, which is not the Funds’ actual return. The hypothetical account values and expenses may not be used to estimate the actual ending account balance or expenses you paid for the period. You may use this information to compare the ongoing costs of investing in the Funds and other funds. To do so, compare this 5% hypothetical example with the 5% hypothetical examples that appear in the shareholder reports of the other funds.
Please note that the expenses shown in the table are meant to highlight your ongoing costs only and do not reflect any transactional costs, such as sales charges, redemption fees or exchange fees. Therefore, the second line of the table is useful in comparing ongoing costs only, and will not help you determine the relative total costs of owning different funds. In addition, if these transactional costs were included, your costs would have been higher.
| | | | | | | | | | | | | | | | | | | | | | | | | | | | | | | | | | | | |
| | | Emerging Markets Equity Insights Fund | | | International Equity Insights Fund | | | International Small Cap Insights Fund | |
| Share Class | | Beginning
Account
Value
11/01/19 | | | Ending
Account
Value
04/30/20 | | | Expenses
Paid for the
6 Months Ended
04/30/20* | | | Beginning
Account
Value
11/01/19 | | | Ending
Account
Value
04/30/20 | | | Expenses
Paid for the
6 Months Ended
04/30/20* | | | Beginning
Account
Value
11/01/19 | | | Ending
Account
Value
04/30/20 | | | Expenses
Paid for the
6 Months Ended
04/30/20* | |
| Class A | | | | | | | | | | | | | | | | | | | | | | | | | | | | | | | | | | | | |
Actual | | $ | 1,000 | | | $ | 884.00 | | | $ | 6.89 | | | $ | 1,000 | | | $ | 839.40 | | | $ | 5.35 | | | $ | 1,000 | | | $ | 829.60 | | | $ | 5.69 | |
Hypothetical 5% return | | | 1,000 | | | | 1,017.55 | + | | | 7.37 | | | | 1,000 | | | | 1,019.05 | + | | | 5.87 | | | | 1,000 | | | | 1,018.65 | + | | | 6.27 | |
| Class C | | | | | | | | | | | | | | | | | | | | | | | | | | | | | | | | | | | | |
Actual | | | 1,000 | | | | 879.90 | | | | 10.38 | | | | 1,000 | | | | 836.30 | | | | 8.77 | | | | 1,000 | | | | 825.60 | | | | 9.08 | |
Hypothetical 5% return | | | 1,000 | | | | 1,013.82 | + | | | 11.12 | | | | 1,000 | | | | 1,015.32 | + | | | 9.62 | | | | 1,000 | | | | 1,014.92 | + | | | 10.02 | |
| Institutional | | | | | | | | | | | | | | | | | | | | | | | | | | | | | | | | | | | | |
Actual | | | 1,000 | | | | 885.40 | | | | 5.11 | | | | 1,000 | | | | 841.00 | | | | 3.62 | | | | 1,000 | | | | 831.10 | | | | 3.96 | |
Hypothetical 5% return | | | 1,000 | | | | 1,019.44 | + | | | 5.47 | | | | 1,000 | | | | 1,020.93 | + | | | 3.97 | | | | 1,000 | | | | 1,020.54 | + | | | 4.37 | |
| Service | | | | | | | | | | | | | | | | | | | | | | | | | | | | | | | | | | | | |
Actual | | | N/A | | | | N/A | | | | N/A | | | | 1,000 | | | | 839.10 | | | | 5.90 | | | | N/A | | | | N/A | | | | N/A | |
Hypothetical 5% return | | | N/A | | | | N/A | | | | N/A | | | | 1,000 | | | | 1,018.45 | + | | | 6.47 | | | | N/A | | | | N/A | | | | N/A | |
| Investor | | | | | | | | | | | | | | | | | | | | | | | | | | | | | | | | | | | | |
Actual | | | 1,000 | | | | 884.90 | | | | 5.72 | | | | 1,000 | | | | 840.50 | | | | 4.21 | | | | 1,000 | | | | 830.50 | | | | 4.55 | |
Hypothetical 5% return | | | 1,000 | | | | 1,018.80 | + | | | 6.12 | | | | 1,000 | | | | 1,020.29 | + | | | 4.62 | | | | 1,000 | | | | 1,019.89 | + | | | 5.02 | |
| Class P | | | | | | | | | | | | | | | | | | | | | | | | | | | | | | | | | | | | |
Actual | | | 1,000 | | | | 884.40 | | | | 5.06 | | | | 1,000 | | | | 841.60 | | | | 3.57 | | | | 1,000 | | | | 831.50 | | | | 3.92 | |
Hypothetical 5% return | | | 1,000 | | | | 1,019.49 | + | | | 5.42 | | | | 1,000 | | | | 1,020.98 | + | | | 3.92 | | | | 1,000 | | | | 1,020.59 | + | | | 4.32 | |
| Class R | | | | | | | | | | | | | | | | | | | | | | | | | | | | | | | | | | | | |
Actual | | | 1,000 | | | | 882.70 | | | | 8.05 | | | | 1,000 | | | | 838.50 | | | | 6.49 | | | | N/A | | | | N/A | | | | N/A | |
Hypothetical 5% return | | | 1,000 | | | | 1,016.31 | + | | | 8.62 | | | | 1,000 | | | | 1,017.80 | + | | | 7.12 | | | | N/A | | | | N/A | | | | N/A | |
| Class R6 | | | | | | | | | | | | | | | | | | | | | | | | | | | | | | | | | | | | |
Actual | | | 1,000 | | | | 884.40 | | | | 5.06 | | | | 1,000 | | | | 840.90 | | | | 3.57 | | | | 1,000 | | | | 831.50 | | | | 3.92 | |
Hypothetical 5% return | | | 1,000 | | | | 1,019.49 | + | | | 5.42 | | | | 1,000 | | | | 1,020.98 | + | | | 3.92 | | | | 1,000 | | | | 1,020.59 | + | | | 4.32 | |
| + | | Hypothetical expenses are based on each Fund’s actual annualized net expense ratios and an assumed rate of return of 5% per year before expenses. |
| * | | Expenses are calculated using each Fund’s annualized net expense ratio for each class, which represents the ongoing expenses as a percentage of net assets for the six months ended April 30, 2020. Expenses are calculated by multiplying the annualized net expense ratio by the average account value for the period; then multiplying the result by the number of days in the most recent fiscal half year; and then dividing that result by the number of days in the fiscal year. The annualized net expense ratios for the period were as follows: |
| | | | | | | | | | | | | | | | | | | | | | | | | | | | | | | | |
| Fund | | Class A | | | Class C | | | Institutional | | | Service | | | Investor | | | Class P | | | Class R | | | Class R6 | |
Emerging Markets Equity Insights | | | 1.47 | % | | | 2.22 | % | | | 1.09 | % | | | N/A | | | | 1.22 | % | | | 1.08 | % | | | 1.72 | % | | | 1.08 | % |
International Equity Insights | | | 1.17 | | | | 1.92 | | | | 0.79 | | | | 1.29 | % | | | 0.92 | | | | 0.78 | | | | 1.42 | | | | 0.78 | |
International Small Cap Insights | | | 1.25 | | | | 2.00 | | | | 0.87 | | | | N/A | | | | 1.00 | | | | 0.86 | | | | N/A | | | | 0.86 | |
71
FUNDS PROFILE
Goldman Sachs Funds
Goldman Sachs is a premier financial services firm, known since 1869 for creating thoughtful and customized investment solutions in complex global markets.
Today, theConsumer and Investment Management Division of Goldman Sachs serves a diverse set of clients worldwide, including private institutions, public entities and individuals. With approximately $1.66 trillion in assets under supervision as of March 31, 2020, Goldman Sachs Asset Management (“GSAM”) has portfolio management teams located around the world and our investment professionals bring firsthand knowledge of local markets to every investment decision. Assets under supervision includes assets under management and other client assets for which Goldman Sachs does not have full discretion. GSAM leverages the resources of Goldman Sachs & Co. LLC subject to legal, internal and regulatory restrictions.
Money Market
Financial Square FundsSM
| ∎ | | Financial Square Treasury Solutions Fund1 |
| ∎ | | Financial Square Government Fund1 |
| ∎ | | Financial Square Money Market Fund2 |
| ∎ | | Financial Square Prime Obligations Fund2 |
| ∎ | | Financial Square Treasury Instruments Fund1 |
| ∎ | | Financial Square Treasury Obligations Fund1 |
| ∎ | | Financial Square Federal Instruments Fund1 |
Investor FundsSM
| ∎ | | Investor Money Market Fund3 |
| ∎ | | Investor Tax-Exempt Money Market Fund3 |
Fixed Income
Short Duration and Government
| ∎ | | High Quality Floating Rate Fund |
| ∎ | | Short-Term Conservative Income Fund |
| ∎ | | Short Duration Government Fund |
| ∎ | | Short Duration Income Fund |
| ∎ | | Inflation Protected Securities Fund |
Multi-Sector
| ∎ | | Global Core Fixed Income Fund4 |
Municipal and Tax-Free
| ∎ | | High Yield Municipal Fund |
| ∎ | | Dynamic Municipal Income Fund |
| ∎ | | Short Duration Tax-Free Fund |
| ∎ | | Municipal Income Completion Fund |
Single Sector
| ∎ | | Investment Grade Credit Fund |
| ∎ | | High Yield Floating Rate Fund |
| ∎ | | Emerging Markets Debt Fund |
| ∎ | | Local Emerging Markets Debt Fund |
Fixed Income Alternatives
| ∎ | | Long Short Credit Strategies Fund |
Fundamental Equity
| ∎ | | Small/Mid Cap Value Fund |
| ∎ | | Small/Mid Cap Growth Fund |
| ∎ | | Concentrated Growth Fund |
| ∎ | | Technology Opportunities Fund |
| ∎ | | Growth Opportunities Fund |
| ∎ | | Rising Dividend Growth Fund |
Tax-Advantaged Equity
| ∎ | | U.S. Tax-Managed Equity Fund |
| ∎ | | International Tax-Managed Equity Fund |
| ∎ | | U.S. Equity Dividend and Premium Fund |
| ∎ | | International Equity Dividend and Premium Fund |
Equity Insights
| ∎ | | Small Cap Equity Insights Fund |
| ∎ | | U.S. Equity Insights Fund |
| ∎ | | Small Cap Growth Insights Fund |
| ∎ | | Large Cap Growth Insights Fund |
| ∎ | | Large Cap Value Insights Fund |
| ∎ | | Small Cap Value Insights Fund |
| ∎ | | International Small Cap Insights Fund |
| ∎ | | International Equity Insights Fund |
| ∎ | | Emerging Markets Equity Insights Fund |
Fundamental Equity International
| ∎ | | International Equity Income Fund |
| ∎ | | International Equity ESG Fund |
| ∎ | | Emerging Markets Equity Fund |
| ∎ | | Imprint Emerging Markets Opportunities Fund6 |
| ∎ | | ESG Emerging Markets Equity Fund |
Alternative
| ∎ | | Real Estate Securities Fund |
| ∎ | | International Real Estate Securities Fund |
| ∎ | | Commodity Strategy Fund |
| ∎ | | Global Real Estate Securities Fund |
| ∎ | | Alternative Premia Fund |
| ∎ | | Absolute Return Tracker Fund |
| ∎ | | Managed Futures Strategy Fund |
| ∎ | | MLP Energy Infrastructure Fund |
| ∎ | | Multi-Manager Alternatives Fund |
| ∎ | | Global Infrastructure Fund |
Total Portfolio Solutions
| ∎ | | Global Managed Beta Fund |
| ∎ | | Multi-Manager Non-Core Fixed Income Fund |
| ∎ | | Multi-Manager U.S. Dynamic Equity Fund |
| ∎ | | Multi-Manager Global Equity Fund |
| ∎ | | Multi-Manager International Equity Fund |
| ∎ | | Tactical Tilt Overlay Fund |
| ∎ | | Balanced Strategy Portfolio |
| ∎ | | Multi-Manager U.S. Small Cap Equity Fund |
| ∎ | | Multi-Manager Real Assets Strategy Fund |
| ∎ | | Growth and Income Strategy Portfolio |
| ∎ | | Growth Strategy Portfolio |
| ∎ | | Dynamic Global Equity Fund |
| ∎ | | Satellite Strategies Portfolio |
| ∎ | | Enhanced Dividend Global Equity Portfolio |
| ∎ | | Tax-Advantaged Global Equity Portfolio |
| ∎ | | Strategic Factor Allocation Fund |
| ∎ | | Target Date Retirement Portfolio7 |
| ∎ | | Target Date 2025 Portfolio |
| ∎ | | Target Date 2030 Portfolio |
| ∎ | | Target Date 2035 Portfolio |
| ∎ | | Target Date 2040 Portfolio |
| ∎ | | Target Date 2045 Portfolio |
| ∎ | | Target Date 2050 Portfolio |
| ∎ | | Target Date 2055 Portfolio |
| ∎ | | Target Date 2060 Portfolio |
| ∎ | | GQG Partners International Opportunities Fund |
| 1 | | You could lose money by investing in the Fund. Although the Fund seeks to preserve the value of your investment at $1.00 per share, it cannot guarantee it will do so. An investment in the Fund is not a deposit of a bank and is not insured or guaranteed by the Federal Deposit Insurance Corporation or any other government agency. The Fund’s sponsor has no legal obligation to provide financial support to the Fund, and you should not expect that the sponsor will provide financial support to the Fund at any time. |
| 2 | | You could lose money by investing in the Fund. Because the share price of the Fund will fluctuate, when you sell your shares they may be worth more or less than what you originally paid for them. The Fund may impose a fee upon sale of your shares or may temporarily suspend your ability to sell shares if the Fund’s liquidity falls below required minimums because of market conditions or other factors. An investment in the Fund is not a deposit of a bank and is not insured or guaranteed by the Federal Deposit Insurance Corporation or any other government agency. The Fund’s sponsor has no legal obligation to provide financial support to the Fund, and you should not expect that the sponsor will provide financial support to the Fund at any time. |
| 3 | | You could lose money by investing in the Fund. Although the Fund seeks to preserve the value of your investment at $1.00 per share, it cannot guarantee it will do so. The Fund may impose a fee upon sale of your shares or may temporarily suspend your ability to sell shares if the Fund’s liquidity falls below required minimums because of market conditions or other factors. An investment in the Fund is not a deposit of a bank and is not insured or guaranteed by the Federal Deposit Insurance Corporation or any other government agency. The Fund’s sponsor has no legal obligation to provide financial support to the Fund, and you should not expect that the sponsor will provide financial support to the Fund at any time. |
| 4 | | Effective after the close of business on April 30, 2020, the Goldman Sachs Global Income Fund was renamed the Goldman Sachs Global Core Fixed Income Fund. |
| 5 | | Effective after the close of business of November 20, 2019, the Goldman Sachs Asia Equity Fund was renamed the Goldman Sachs China Equity Fund. |
| 6 | | Effective after the close of business on August 30, 2019, the Goldman Sachs N-11 Equity Fund was renamed the Goldman Sachs Imprint Emerging Markets Opportunities Fund. |
| 7 | | Effective December 27, 2019, the Goldman Sachs Target Date 2020 Portfolio was renamed the Goldman Sachs Target Date Retirement Portfolio. |
| | | Financial Square FundsSM and Investor FundsSM are registered service marks of Goldman Sachs & Co. LLC. |
| * | | This list covers open-end funds only. Please visit our website at www.GSAMFUNDS.com to learn about our closed-end funds and exchange-traded funds. |
| | |
TRUSTEES Jessica Palmer,Chair Dwight L. Bush Kathryn A. Cassidy Diana M. Daniels Joaquin Delgado James A. McNamara Roy W. Templin Gregory G. Weaver | | OFFICERS James A. McNamara,President Joseph F. DiMaria,Principal Financial Officer, Principal Accounting Officer and Treasurer Caroline L. Kraus,Secretary |
| |
GOLDMAN SACHS & CO. LLC
Distributor and Transfer Agent | | GOLDMAN SACHS ASSET MANAGEMENT, L.P.
Investment Adviser |
Visit our Website atwww.GSAMFUNDS.com to obtain the most recent month-end returns.
Goldman Sachs Asset Management, L.P., 200 West Street, New York, New York 10282
The reports concerning the Funds included in this shareholder report may contain certain forward-looking statements about the factors that may affect the performance of the Funds in the future. These statements are based on Fund management’s predictions and expectations concerning certain future events and their expected impact on the Funds, such as performance of the economy as a whole and of specific industry sectors, changes in the levels of interest rates, the impact of developing world events, and other factors that may influence the future performance of the Funds. Management believes these forward-looking statements to be reasonable, although they are inherently uncertain and difficult to predict. Actual events may cause adjustments in portfolio management strategies from those currently expected to be employed.
A description of the policies and procedures that the Funds use to determine how to vote proxies relating to portfolio securities and information regarding how a Fund voted proxies relating to portfolio securities during the most recent 12-month period ended June 30 is available (i) without charge, upon request by calling 1-800-526-7384 (for Retail Shareholders) or 1-800-621-2550 (for Institutional Shareholders); and (ii) on the Securities and Exchange Commission web site at http://www.sec.gov.
Economic and market forecasts presented herein reflect a series of assumptions and judgments as of the date of this presentation and are subject to change without notice. These forecasts do not take into account the specific investment objectives, restrictions, tax and financial situation or other needs of any specific client. Actual data will vary and may not be reflected here. These forecasts are subject to high levels of uncertainty that may affect actual performance. Accordingly, these forecasts should be viewed as merely representative of a broad range of possible outcomes. These forecasts are estimated, based on assumptions, and are subject to significant revision and may change materially as economic and market conditions change. Goldman Sachs has no obligation to provide updates or changes to these forecasts. Case studies and examples are for illustrative purposes only.
The Global Industry Classification Standard (GICS) was developed by and is the exclusive property and a service mark of Morgan Stanley Capital International Inc. (MSCI) and Standard & Poor’s, a division of The McGraw-Hill Companies, Inc. (S&P) and is licensed for use by Goldman Sachs. Neither MSCI, S&P nor any other party involved in making or compiling the GICS or any GICS classifications makes any express or implied warranties or representations with respect to such standard or classification (or the results to be obtained by the use thereof), and all such parties hereby expressly disclaim all warranties of originality, accuracy, completeness, merchantability or fitness for a particular purpose with respect to any of such standard or classification. Without limiting any of the foregoing, in no event shall MSCI, S&P, any of their affiliates or any third party involved in making or compiling the GICS or any GICS classifications have any liability for any direct, indirect, special, punitive, consequential or any other damages (including lost profits) even if notified of the possibility of such damages.
The Funds will file their portfolio holdings for each month in a fiscal quarter within 60 days after the end of the relevant fiscal quarter on Form N-PORT. Portfolio holdings information for the third month of each fiscal quarter will be made available on the SEC’s web site at http://www.sec.gov. Portfolio holdings information may be obtained upon request and without charge by calling 1-800-526-7384 (for Retail Shareholders) or 1-800-621-2550 (for Institutional Shareholders).
Fund holdings and allocations shown are unaudited, and may not be representative of current or future investments. Fund holdings and allocations may not include the Fund’s entire investment portfolio, which may change at any time. Fund holdings should not be relied on in making investment decisions and should not be construed as research or investment advice regarding particular securities. Current and future holdings are subject to risk.
The portfolio risk management process includes an effort to monitor and manage risk, but does not imply low risk. Diversification does not protect an investor from market risk and does not ensure a profit.
This material is not authorized for distribution to prospective investors unless preceded or accompanied by a current Prospectus or summary prospectus, if applicable. Investors should consider a Fund’s objective, risks, and charges and expenses, and read the summary prospectus, if available, and/or the Prospectus carefully before investing or sending money. The summary prospectus, if available, and the Prospectus contain this and other information about a Fund and may be obtained from your authorized dealer or from Goldman Sachs & Co. LLC by calling (retail – 1-800-526-7384) (institutional – 1-800-621-2550).
© 2020 Goldman Sachs. All rights reserved. 206026-OTU-1214528 INTINSSAR-20
(a) As of the end of the period covered by this report, the registrant has adopted a code of ethics that applies to the registrant’s principal executive officer, principal financial officer, principal accounting officer or controller, or persons performing similar functions, regardless of whether these individuals are employed by the registrant or a third party (the “Code of Ethics”).
(b) During the period covered by this report, no amendments were made to the provisions of the Code of Ethics.
(c) During the period covered by this report, the registrant did not grant any waivers, including an implicit waiver, from any provision of the Code of Ethics.
(d) A copy of the Code of Ethics is available as provided in Item 13(a)(1) of this report.
| ITEM 3. | AUDIT COMMITTEE FINANCIAL EXPERT. |
The registrant’s board of trustees has determined that the registrant has at least one “audit committee financial expert” (as defined in Item 3 of Form N-CSR) serving on its audit committee. Gregory G. Weaver is the “audit committee financial expert” and is “independent” (as each term is defined in Item 3 of Form N-CSR).
| ITEM 4. | PRINCIPAL ACCOUNTANT FEES AND SERVICES. |
The information required by this Item is only required in an annual report on this Form N-CSR.
| ITEM 5. | AUDIT COMMITTEE OF LISTED REGISTRANTS. |
| ITEM 6. | SCHEDULE OF INVESTMENTS. |
| | Schedule of Investments is included as part of the Report to Shareholders filed under Item 1. |
| ITEM 7. | DISCLOSURE OF PROXY VOTING POLICIES AND PROCEDURES FORCLOSED-END MANAGEMENT INVESTMENT COMPANIES. |
| ITEM 8. | PORTFOLIO MANAGERS OFCLOSED-END MANAGEMENT INVESTMENT COMPANIES. |
| ITEM 9. | PURCHASES OF EQUITY SECURITIES BYCLOSED-END MANAGEMENT INVESTMENT COMPANY AND AFFILIATED PURCHASERS. |
| ITEM 10. | SUBMISSION OF MATTERS TO A VOTE OF SECURITY HOLDERS. |
| | There have been no material changes to the procedures by which shareholders may recommend nominees to the registrant’s board of trustees. |
| ITEM 11. | CONTROLS AND PROCEDURES. |
| | (a) | The registrant’s principal executive and principal financial officers, or persons performing similar functions have concluded that the registrant’s disclosure controls and procedures (as defined in Rule30a-3(c) under the Investment Company Act of 1940, as amended (the “1940 Act”)) are effective as of a date within 90 days of the filing of this report that includes the disclosure required by this paragraph, based on the evaluation of these controls and procedures required by Rule30a-3(b) under the 1940 Act and15d-15(b) under the Securities Exchange Act of 1934, as amended. |
| | (b) | There were no changes in the registrant’s internal control over financial reporting (as defined in Rule30a-3(d) under the 1940 Act) that occurred during the period covered by this report that have materially affected, or are reasonably likely to materially affect, the registrant’s internal control over financial reporting. |
| ITEM 12. | DISCLOSURE OF SECURITIES LENDING ACTIVITIES FOR CLOSED-END MANAGEMENT INVESTMENT COMPANIES |
Not applicable.
SIGNATURES
Pursuant to the requirements of the Securities Exchange Act of 1934 and the Investment Company Act of 1940, the registrant has duly caused this report to be signed on its behalf by the undersigned, thereunto duly authorized.
| | |
| | | Goldman Sachs Trust |
| |
| By: | | /s/ James A. McNamara |
| |
| | |
| | James A. McNamara |
| | President/Chief Executive Officer |
| | Goldman Sachs Trust |
| |
| Date: | | June 29, 2020 |
Pursuant to the requirements of the Securities Exchange Act of 1934 and the Investment Company Act of 1940, this report has been signed below by the following persons on behalf of the registrant and in the capacities and on the dates indicated.
| | |
| By: | | /s/ James A. McNamara |
| |
| | |
| | James A. McNamara |
| | President/Chief Executive Officer |
| | Goldman Sachs Trust |
| |
| Date: | | June 29, 2020 |
| |
| By: | | /s/ Joseph F. DiMaria |
| |
| | |
| | Joseph F. DiMaria |
| | Principal Financial Officer |
| | Goldman Sachs Trust |
| |
| Date: | | June 29, 2020 |