UNITED STATES
SECURITIES AND EXCHANGE COMMISSION
Washington, D.C. 20549
FORMN-CSR
CERTIFIED SHAREHOLDER REPORT OF REGISTERED
MANAGEMENT INVESTMENT COMPANIES
Investment Company Act file number811-05349
Goldman Sachs Trust
(Exact name of registrant as specified in charter)
71 South Wacker Drive, Chicago, Illinois 60606
(Address of principal executive offices) (Zip code)
| Caroline Kraus, Esq. | Copies to: | |
| Goldman Sachs & Co. LLC | Geoffrey R.T. Kenyon, Esq. | |
| 200 West Street | Dechert LLP | |
| New York, New York 10282 | 100 Oliver Street | |
| 40th Floor | ||
| Boston, MA 02110-2605 |
(Name and address of agents for service)
Registrant’s telephone number, including area code:(312) 655-4400
Date of fiscal year end: October 31
Date of reporting period: October 31, 2019
| ITEM 1. | REPORTS TO STOCKHOLDERS. |
The Annual Report to Shareholders is filed herewith. |
Goldman Sachs Funds

| Annual Report | October 31, 2019 | |||
Dividend Focus Funds | ||||
Income Builder | ||||
Rising Dividend Growth | ||||
It is our intention that beginning on January 1, 2021, paper copies of the Funds’ annual and semi-annual shareholder reports will no longer be sent by mail, unless you specifically request paper copies of the reports from a Fund or from your financial intermediary. Instead, the reports will be made available on a website, and you will be notified by mail each time a report is posted and provided with a website link to access the report.
If you already elected to receive shareholder reports electronically, you will not be affected by this change and you need not take any action. At any time, you may elect to receive reports and certain communications from a Fund electronically by calling the applicable toll-free number below or by contacting your financial intermediary.
You may elect to receive all future shareholder reports in paper free of charge. If you hold shares of a Fund directly with the Fund’s transfer agent, you can inform the transfer agent that you wish to receive paper copies of reports by callingtoll-free 800-621-2550 for Institutional, Class R6 and Class P shareholders or800-526-7384 for all other shareholders. If you hold shares of a Fund through a financial intermediary, please contact your financial intermediary to make this election. Your election to receive reports in paper will apply to all Goldman Sachs Funds held in your account if you invest through your financial intermediary or all Goldman Sachs Funds held with the Funds’ transfer agent if you invest directly with the transfer agent.

Goldman Sachs Dividend Focus Funds
| ∎ | INCOME BUILDER |
| ∎ | RISING DIVIDEND GROWTH |
| 1 | ||||
Portfolio Management Discussion and Performance Summary — Income Builder | 2 | |||
Portfolio Management Discussion and Performance Summary — Rising Dividend Growth | 11 | |||
| 20 | ||||
| 36 | ||||
| 39 | ||||
| 39 | ||||
| 45 | ||||
| 52 | ||||
| 72 | ||||
| 73 | ||||
| NOT FDIC-INSURED | May Lose Value | No Bank Guarantee | ||
GOLDMAN SACHS INCOME BUILDER FUND
What Differentiates Goldman Sachs’
Income Builder Fund Investment Process?
Income Builder Fund is a broadly diversified portfolio that seeks to provide income and capital appreciation.
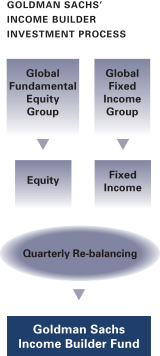

The Goldman Sachs Income Builder Fund provides exposure to the wealth-building opportunities of stocks and the regular income potential of bonds. The Fund invests in both equity and fixed income securities with a focus on yield enhancing strategies to earn a monthly income stream. The Fund seeks to maintain broad exposure to equities with lower than general equity market volatility.

We believe that similar themes can perform differently across asset classes. The Fund can potentially take advantage of these cross-asset class opportunities as it is a dynamic portfolio that allows the flexibility to allocate across equities and fixed income from a top-down perspective, given our views on macro opportunities and valuations.

In our risk management process, we identify, monitor and measure a fund’s risk profile. We consider the risk relative to the benchmark and the Fund’s investment goal to seek income stability and capital growth.

The Fund’s portfolio comprises the ideas of three experienced Goldman Sachs investment groups:
Global Fundamental Equity Group: A group of investment professionals averaging over 15 years of investment experience and with a strong commitment to fundamental research.
Global Fixed Income Group: Broad, deep capabilities across global fixed income markets, with a total return investment philosophy.
Global Portfolio Solutions Group: The team is comprised of over 135* professionals with significant academic and practitioner experience.
| * | As of September 2019 |
1
FUND RESULTS
Goldman Sachs Income Builder Fund
Investment Objective
The Fund seeks to provide income and capital appreciation.
Portfolio Management Discussion and Analysis
Below, the Goldman Sachs Fundamental Equity Team, the Goldman Sachs Fixed Income Investment Management Team, and the Goldman Sachs Global Portfolio Solutions Team, collectively the Goldman Sachs Income Builder Team (the “Income Builder Team”), discuss the Goldman Sachs Income Builder Fund’s (the “Fund”) performance and positioning for the12-month period ended October 31, 2019 (the “Reporting Period”).
| Q | How did the Fund perform during the Reporting Period? |
| A | During the Reporting Period, the Fund’s Class A, Class C, Institutional, Investor, Class P and Class R6 Shares generated average annual total returns, without sales charges, of 13.34%, 12.44%, 13.76%, 13.59%, 13.77% and 13.72%, respectively. These returns compare to the 11.21% and 9.84% average annual total returns of the Russell 1000® Value Index (with dividends reinvested) (the “Russell Index”) and the ICE BofAML BB to B U.S. High Yield Constrained Index (the “ICE BofAML Index”), respectively, during the same period. |
| Q | What economic and market factors most influenced the Fund during the Reporting Period? |
| A | During the Reporting Period, Federal Reserve (“Fed”) monetary policy, economic growth expectations and geopolitics most influenced the financial markets and the Fund. |
| When the Reporting Period began in November 2018, U.S. stocks gained on dovish comments from Fed Chair Jerome Powell and seemingly encouraging progress in U.S.-China trade talks. (Dovish language tends to suggest lower interest rates; opposite of hawkish.) Within fixed income, U.S. Treasury yields fell, as investors grew fearful about the possible end of the global economic cycle and as their expectations for Fed rate hikes diminished. U.S. high yield corporate bonds experienced a modest loss amid pressure on corporate profit margins, company-specific events and lower crude oil prices. In December 2018, Fed policymakers raised short-term interest rates, much as the markets had expected, but lowered their projection for 2019 monetary policy tightening from three rate hikes to two. The10-year U.S. Treasury yield fell on a combination of market-perceived safe-haven demand and lower crude oil prices. For similar reasons, U.S. high yield corporate credit posted its worst monthly total return since 2015. Meanwhile, U.S. equities plunged on renewed investor fears sparked by the partial U.S. federal government shutdown, the U.S. President’s criticism of Fed Chair Powell and reignited corporate earnings growth concerns. |
During the first quarter of 2019, U.S. stocks posted double-digit gains. The Fed kept its monetary policy unchanged, with its dot plot projecting no interest rate hikes at all during 2019. (The “dot plot” shows interest rate projections of the members of the Federal Open Market Committee.) Largely as a result, U.S. Treasury yields fell. U.S. high yield corporate bonds logged their strongest start to a calendar year on record, due in part to better than market expected corporate earnings and improved investor risk sentiment. |
U.S. stocks continued to rally in the second quarter of 2019. Trade tensions between the U.S. and China dominated headlines and broadly added noise to the equity markets. (Noise refers to market activity that can confuse or misrepresent genuine underlying trends.) In April 2019, investors grew optimistic about a possible U.S.-China trade deal, but this optimism faded in May when the U.S. President threatened to raise current tariffs and impose new duties on $300 billion of additional Chinese imports. Also in May 2019, investor speculation about possible 2019 Fed rate cuts increased due to an accumulation of factors, including soft inflation and weakness in U.S. economic data, continued U.S. growth headwinds from unresolved U.S.-China trade negotiations and subdued global economic activity, particularly in the manufacturing sector. At its June 2019 meeting, the Fed left interest rates unchanged, but eight of the 12 members of the Federal Open Market Committee projected rate cuts during the 2019 calendar year. In fixed income, U.S. Treasury yields fell during the second quarter of 2019. U.S. |
2
FUND RESULTS
| high yield corporate bonds delivered positive returns amid better than market expected corporate earnings, muted inflation pressures and supportive Fed monetary policy. |
In the third quarter of 2019, U.S. stocks and U.S. high yield corporate bonds recorded slightly positive returns, as market volatility broadly challenged riskier asset classes. Global economic data weakened, and U.S. economic data was largely mixed, prompting the Fed to cut short-term interest rates in both July and September — its first interest rate cuts since 2008 — in an effort to prolong the U.S. economic expansion. Largely in response, U.S. Treasury yields declined. |
During October 2019, U.S. stocks posted a modest gain, benefiting from signs the U.S. and China were moving closer to a partial trade agreement and the U.K. was edging away from ano-deal Brexit. (Brexit refers to the U.K.’s efforts to leave the European Union.) U.S. economic data continued to soften, with most of the weakness manifesting in the trade-sensitive manufacturing sector. The Fed delivered its third interest rate cut of 2019 and indicated its future monetary policy path would be dependent on the evolution of macro data and on trade developments. In fixed income, U.S. Treasury yields edged up. U.S. high yield corporate bonds eked out a gain in October 2019, as slowing corporate earnings, company-specific events and manufacturing weakness weighed on performance. |
| Q | What was the Fund’s asset allocation positioning during the Reporting Period? |
| A | As part of its principal investment strategies, the Fund has a baseline allocation of 60% to fixed income securities and 40% to equity securities, though in seeking to meet its investment objective, the Fund has the flexibility to opportunistically tilt the allocation to fixed income and equity securities up to 15% above or below that baseline allocation. The Fund seeks to provide a high and stable income stream plus capital appreciation, with lower volatility than the equity market. The percentage of the portfolio invested in equity and fixed income securities will vary from time to time as the Income Builder Team evaluates such securities’ relative attractiveness based on, among other factors, income opportunities, market valuations, economic growth and inflation prospects. Because of these stated goals of the Fund, the Income Builder Team believes the returns of the Russell Index and the ICE BofAML Index should be considered for reference only. |
At the beginning of the Reporting Period, the Fund was invested 39.9% in equities and 55.7% in fixed income, with the balance of 4.4% in cash and cash equivalents. During the Reporting Period overall, we lengthened the Fund’s duration position using interest rate swaps, as we sought to mitigate potential risk within high yield corporate credit and equities. (Duration is a measure of the Fund’s sensitivity to changes in interest rates.) Within equities, we eliminated the Fund’s allocation to emerging markets stocks during January 2019 amidst lowered investor expectations for global economic growth and as U.S.-China trade negotiations dragged on. Over the course of the first quarter of 2019, as equities outperformed our expectations, we reduced the Fund’s exposure to stocks and sold equity call options to mitigate potential downside risk. Within fixed income, we removed the Fund’s allocation to local emerging markets debt in August 2019, as we saw near-term risks to the asset class, including the potential of further escalation in the U.S.-China trade conflict and the possibility U.S. bond yields would continue to rise. Within the Fund overall, during September 2019, we eliminated our volatility-selling strategy, increased the Fund’s allocation to fixed income and reduced investments in defensive-oriented value stocks in favor of increased exposure to equities broadly. (Volatility selling seeks to benefit from changes in the level of market implied volatility (i.e., expectations of future volatility) in equity markets.) We made these changes to put the Fund’s cash holdings to work and to position the Fund for a possible sustained recovery in the performance of cyclically-oriented sectors. At the end of the Reporting Period, the Fund was invested 37.5% in equities and 57% in fixed income, with the balance of 5.5% in cash and cash equivalents. |
| Q | What was the Fund’s12-month distribution rate and what was its30-day SEC yield during the Reporting Period? |
| A | During the Reporting Period, the Fund’s Class A, Class C, Institutional, Investor, Class R6 and Class P Shares provided12-month distribution rates of 3.54%, 2.88%, 3.82%, 3.71%, 3.84% and 3.83%, respectively. (The 12-month distribution rate is calculated by taking the sum of all cash distributions to shareholders over the past 12 months and dividing this sum by the Fund’s month-end NAV for the last month of the period. This rate includes capital gain/loss distributions, if any. This is not a SEC Yield.) On October 31, 2019, the Fund’s 30-Day Standardized Subsidized Yield for its Class A, Class C, Institutional, Investor, Class R6 and |
3
FUND RESULTS
| Class P Shares were 2.76%, 2.18%, 3.30%, 3.17%, 3.31% and 3.31%, respectively. (The 30-Day Standardized Subsidized Yield is calculated in accordance with SEC regulations and is determined by dividing the Fund’s net investment income per share earned over the 30-day period by the Fund’s maximum public offering price per share on the last day of such period, which figure is then annualized. The 30-Day Standardized Subsidized Yield may differ from the distribution rate because of the exclusion of distributed capital gains. The 30-Day Standardized Subsidized Yield reflects any fee waivers and/or expense reimbursements in effect during the period, without which the yield would be reduced.) |
| Q | What key factors had the greatest impact on the performance of the Fund’s equity allocation during the Reporting Period? |
| A | Relative to the Russell Index, stock selection had the greatest positive impact on the Fund’s equity allocation during the Reporting Period. The Fund’s call writing strategy, which seeks to generate additional cash flow and potentially reduce volatility by sales of call options on the S&P 500® Index or other regional stock market indices (or related ETFs), had a negative impact on its performance during the Reporting Period. |
| Q | Which equity market sectors most significantly affected Fund performance during the Reporting Period? |
| A | During the Reporting Period, the Fund’s overweight positions compared to the Russell Index in the information technology, utilities and industrials sectors added to its returns. Stock selection in all three of these sectors also contributed positively as did stock selection in energy. Conversely, the Fund was hindered by an underweight in the consumer staples sector and an overweight in the energy sector. Stock selection in consumer staples and health care also detracted from relative results. |
| Q | Which stocks contributed significantly to the Fund’s relative performance during the Reporting Period? |
| A | Compared to the Russell Index, the Fund’s positioning in Microsoft, Enel and Exxon Mobil bolstered returns during the Reporting Period. |
An investment in Microsoft added most to relative returns. The developer and marketer of software and hardware services posted favorable earnings results in the first and second quarters of 2019, with outperformance across all of its business segments, including continued robust demand for its cloud computing service, Azure. Investor concerns around slowing hardware purchases, which caused Microsoft to underperform in early 2019, eased in the second half of the Reporting Period. When the Reporting Period concluded, we held a favorable view of the company’s ongoing progress in migrating enterprise customers to Azure, as Microsoft remains a major player in the public cloud market. We also continued to believe Microsoft was a well-diversified, high quality company led by an excellent management team. |
Enel is a European utility company. Along with other utilities stocks, Enel benefited from the falling interest rate environment. At the end of the Reporting Period, we remained positive about the company, as we believed it had achieved increased efficiency and was boosting its profits. |
Having an underweight in Exxon Mobil, which engages in the exploration, development and distribution of oil, gas and petroleum products, also contributed positively to the Fund’s performance during the Reporting Period. Shares of Exxon Mobil sold off, along with the energy sector overall, during December 2018 due to widespread market concerns about global supply and demand. In our view, these concerns were driven by increased U.S. and Saudi Arabian oil production, which led to higher inventory levels. Meanwhile, slowing global economic growth and the resulting lower demand for oil exerted downward pressure on crude oil prices. Also weighing on investor sentiment during the Reporting Period was Exxon Mobil’s announcement that one of its ships had experienced a confrontation with the Venezuelan navy during an exploratory mission off the coast of Guyana, causing it to abruptly halt operations. We sold the Fund’s position in the stock during the Reporting Period to invest in higher conviction ideas. |
| Q | Which stocks detracted significantly from the Fund’s relative performance during the Reporting Period? |
| A | During the Reporting Period, the largest detractors from the Fund’s performance relative to the Russell Index were Altria Group, Royal Dutch Shell and AT&T. |
Altria Group, which produces and markets tobacco products, saw its share price negatively impacted by lower than market expected second quarter 2019 earnings and a proposed new regulation from the Food and Drug Administration (“FDA”) regarding health warnings on tobacco products. During August 2019, we sold the Fund’s position in Altria Group |
4
FUND RESULTS
| because of our increased concerns around FDA regulation of the company’s electronic cigarette subsidiary Juul Labs and because of declining cigarette volumes overall. We used the proceeds to establish a position in Philip Morris International, which we favored for its geographical diversity and for what we considered to be its attractive valuation relative to its peers. |
Royal Dutch Shell is a multinational oil and gas company headquartered in the Netherlands and incorporated in the U.K. In addition to its core businesses of oil and gas production, refining and marketing, and petrochemicals manufacturing, Royal Dutch Shell has some exposure to alternative fuels and other renewable energies. The company’s shares declined on worse than market expected second quarter 2019 earnings, driven by a drop in crude oil prices. At the end of the Reporting Period, we remained positive on Royal Dutch Shell, as we believed the company continued to reprioritize its investments and reduce potential risks to its dividend. New projects were widely expected to deliver $5 billion in incremental cash on a net basis, and the company was focusing on small projects that we believe could add value. Royal Dutch Shell is also attractive, in our view, because of its continued share buybacks, attractive dividend yield and exposure to the liquefied natural gas market. |
AT&T detracted because the Fund was underweight relative to the Russell Index and its stock performed well. The multinational telecommunications provider benefited from efforts to refocus on its core business, driven by pressure from activist investor Elliott Management. By the end of the Reporting Period, we had exited the Fund’s position in AT&T because we considered Verizon Communications more attractive due to its competitive pricing and fifth-generation, or 5G, network trials. |
| Q | Were any significant purchases or sales made within the equity allocation of the Fund during the Reporting Period? |
| A | During the Reporting Period, the Fund initiated a position in The Home Depot, a retailer of building materials and home improvement products. In our view, sales trends are likely to be positive, as the company has benefited from increasing activity in home remodeling. We considered the stock’s valuation attractive and believed an excellent management team was in place. |
Another key purchase was Eli Lilly and Company, a leading pharmaceutical maker with a history of innovation and what we consider to be a strong drug pipeline. We are optimistic about the company, as we see acceleratingtop-line revenue growth due to drug launches, increased profit margin growth and earnings per share growth. In our opinion, Eli Lilly and Company is likely to outperform market expectations. |
Among sales completed during the Reporting Period was the Fund’s position in SunTrust Banks. We considered SunTrust a high quality company with favorable growth prospects, but after it announced a merger with bank holding company BB&T, we decided to eliminate the position to pursue what we felt were more attractive ideas in the financials sector. |
We exited the Fund’s investment in global biopharmaceutical company Pfizer. When the stock was purchased, we were positive about the company’s strong balance sheet and potential to grow by improving market share. However, the market reacted negatively to Pfizer’s second quarter 2019 earnings release, hurting its share price, and we decided to sell the Fund’s position in favor of other pharmaceutical stocks. |
| Q | What changes were made to the Fund’s equity market sector and industry weightings during the Reporting Period? |
| A | During the Reporting Period, we reduced the Fund’s exposures to the health care, energy and communication services sectors. We increased its exposures to the consumer discretionary, industrials and materials sectors. At the end of the Reporting Period, the Fund was overweight relative to the Russell Index in the information technology, industrials, energy, and materials sectors. The Fund was underweight compared to the Russell Index in the financials, communication services, and utilities sectors. Relative to the Russell Index, the Fund was rather neutrally weighted in the consumer discretionary, health care, consumer staples and real estate sectors at the end of the Reporting Period. |
| Q | Which fixed income market segments significantly affected the Fund’s performance during the Reporting Period? |
| A | Relative to the ICE BofAML Index, an overweight position in energy-related high yield corporate bonds boosted the Fund’s results. In addition, the Fund benefited from its exposure toBBB-rated investment grade credits. Conversely, selection of industrial-related high yield corporate bonds detracted from the Fund’s performance. An underweight in consumer cyclical high yield corporate bonds, as well as a slight overweight in emerging markets debt, further diminished the Fund’s relative results. |
5
FUND RESULTS
| Q | How did the Fund’s tactical duration strategy and yield curve positioning affect performance during the Reporting Period? |
| A | During the Reporting Period, the Fund’s tactical duration strategy added to returns. Specifically, our decision to lengthen the Fund’s duration position through interest rate swaps contributed positively, as interest rates fell during the Reporting Period. We do not actively manage the Fund’s yield curve positioning as part of our investment process. (Yield curve is a spectrum of interest rates based on maturities of varying lengths.) |
| Q | What changes were made to the Fund’s fixed income weightings during the Reporting Period? |
| A | During the Reporting Period, we increased the Fund’s exposures to metals and mining and to packaging by decreasing its underweight positions versus the ICE BofAML Index in those two market segments. We increased the Fund’s overweight in the technology market segment, and we reduced the Fund’s overweight in cellular telecommunications. We shifted the Fund from an overweight in the health care market segment to a relatively neutral position and moved its overweight in the non-cable media market segment to an underweight position. At the end of the Reporting Period, the Fund’s largest overweights relative to the ICE BofAML Index were in the technology and banking market segments, while its largest underweight positions were in the gaming and lodging and the energy market segments. |
| Q | How did the Fund use derivatives and similar instruments during the Reporting Period? |
| A | As mentioned previously, the Income Builder Team wrote equity index options on a portion of the Fund’s equity allocation in an effort to generate additional cash flow and potentially reduce volatility (negative impact on performance). In addition, total return swaps were employed as part of the systematic strategy to buy and sell equity index options (negative impact). Within the Fund’s fixed income allocation, the Income Builder Team used interest rates swaps and U.S. Treasury futures as cost-efficient instruments to provide greater precision and versatility in the management of duration (both had a positive impact). To hedge against currency risk (that is, the risk that certain currencies might fluctuate in value), the Fund employed currency forwards to express our views on a given currency (neutral impact). Finally, equity futures were utilized within the Fund overall to help manage cash balances during the Reporting Period (positive impact). |
| Q | Were there any changes to the Fund’s portfolio management team during the Reporting Period? |
| A | Effective February 19, 2019, Raymond Chan no longer served as a portfolio manager of the Fund, and Christopher Lvoff became a portfolio manager of the Fund. As of March 1, 2019, David Beers no longer served as a portfolio manager of the Fund, and Ashish Shah became a portfolio manager of the Fund. Effective July 17, 2019, Daniel Lochner no longer served as a portfolio manager of the Fund. By design, all investment decisions for the Fund are performed within aco-lead or team structure, with multiple subject matter experts. This strategic decision making has been the cornerstone of our approach and ensures continuity in the Fund. At the end of the Reporting Period, the portfolio managers for the Fund were Ashish Shah, Ron Arons, Collin Bell, Charles “Brook” Dane and Christopher Lvoff. |
| Q | What is the Income Builder Team’s tactical view and strategy for the months ahead? |
| A | The U.S. equity market experienced robust performance from January 2019 through the end of the Reporting Period, with falling interest rates and the dovish shift in Fed monetary policy helping to boost U.S. equity prices. That said, volatility increased during the third calendar quarter, stemming from ongoing geopolitical and trade tensions as well as from heightened investor fears of a potential U.S. recession. In addition, the Income Builder Team saw more signs the economic cycle was aging. Accordingly, at the end of the Reporting Period, we expected choppy equity market conditions in the near term, though without clearer indications of deteriorating fundamentals, we thought it was too early to position the Fund for a downturn in global economic growth or corporate earnings. We planned to maintain our focus on what we believe are high quality companies with strong market positions and experienced management teams. In our opinion, emphasizing these durable businesses can potentially set the stage for outperformance amidst heightened volatility. Fundamental,bottom-up stock selection will continue to drive our process, not headlines or investor sentiment, regardless of the market direction. We maintained high conviction in the companies owned by the equity portion of the Fund at the end of the Reporting Period, and we believed they have the potential to outperform relative to the broader market regardless of the growth environment. Overall, we expected to continue focusing on undervalued companies we believe are in control of their own future, such as innovators with differentiated products, companies withlow-cost structures and firms that |
6
FUND RESULTS
| have been investing in their own businesses and are poised to gain market share. We planned to maintain our discipline in identifying companies with what we consider to be strong or improving balance sheets, led by quality management teams and trading at discounted valuations, seeking to generate long-term outperformance. |
Within the fixed income allocation, the Fund remained overweight U.S. high yield corporate bonds at the end of Reporting Period. Fundamentals had stopped improving, in our view, but corporate leverage had decreased and interest coverage ratios had improved even thoughtop-line revenue gains had slowed. (Interest coverage ratios measure a company’s ability to fulfill its obligations to make interest payments on its outstanding debt.) We also saw indications of profit margin pressure. Nevertheless, we believed the macroeconomic environment remained healthy enough to support revenues, and we expected central bank stimulus to support continued access to the debt markets for better-quality high yield corporate bond issuers, as investor demand for higher-yielding assets persisted. With the Fed’s more dovish stance, we anticipated easier financial conditions and saw a lower near-term risk of recession and crude oil price shocks. However, there remained potential for ongoing interest rate volatility, including a more aggressive than market anticipated unwinding of Fed monetary policy or an inflation shock, higher risk premiums on the contagion from idiosyncratic risks or an escalation of geopolitical tensions. Market volatility in response to U.S.-China trade tensions may also continue in the face of prolonged uncertainty, in our opinion. Increased volatility in the equity market could also increase risk, as equity market volatility has historically been a headwind for high yield spreads (or yield differentials versus U.S. Treasuries). While not our base case, a further downshift in global economic growth poses another potential risk. In terms of its positioning at the end of the Reporting Period, the Fund was materially underweight energy-related high yield corporate bonds due to elevated levels of distress. Between January 2019 and the end of the Reporting Period, the energy market segment provided more than a third of the total number of defaults, as companies struggled to raise capital. Going forward, we planned to focus the Fund on U.S.-oriented market segments, including consumernon-cyclicals, cable and building materials. We expected to limit its exposure to autos and metals and mining, as these market segments tend to be more vulnerable to market volatility driven by trade tensions and slowing economic growth. From a ratings perspective, we favoredB-rated high yield corporate bonds overBB-rated high yield corporate bonds, asBB-rated spreads had reached historically tight levels during the Reporting Period. In terms of maturities, we had a preference at the end of the Reporting Period for intermediate-term bonds, as we believed they offered the best carry and roll-down opportunities. (Carry involves borrowing at a low interest rate and investing in an asset that provides a higher rate of return. Roll-down opportunities arise when the value of a bond converges to par as maturity is approached.) In our view, the valuations of longer-maturity, higher quality bonds appeared extended at the end of the Reporting Period. |
7
FUND BASICS
Income Builder Fund
as of October 31, 2019
| TOP TEN EQUITY HOLDINGS AS OF 10/31/191 | ||||||||
| Holding | % of Net Assets | Line of Business | ||||||
Johnson & Johnson | 1.2 | % | Pharmaceuticals | |||||
Chevron Corp. | 1.1 | Oil, Gas & Consumable Fuels | ||||||
Medtronic PLC | 1.0 | Health Care Equipment & Supplies | ||||||
Royal Dutch Shell PLC ADR Class A | 1.0 | Oil, Gas & Consumable Fuels | ||||||
Cisco Systems, Inc. | 0.9 | Communications Equipment | ||||||
The Home Depot, Inc. | 0.9 | Specialty Retail | ||||||
JPMorgan Chase & Co. | 0.8 | Banks | ||||||
Verizon Communications, Inc. | 0.8 | Diversified Telecommunication Services | ||||||
Comcast Corp. Class A | 0.8 | Media | ||||||
Honeywell International, Inc. | 0.7 | Industrial Conglomerates | ||||||
| 1 | The top 10 holdings may not be representative of the Fund’s future investments. |
| FUND’S EQUITY SECTOR ALLOCATIONS VS. BENCHMARK2 | ||||||
| As of October 31, 2019 | ||||||
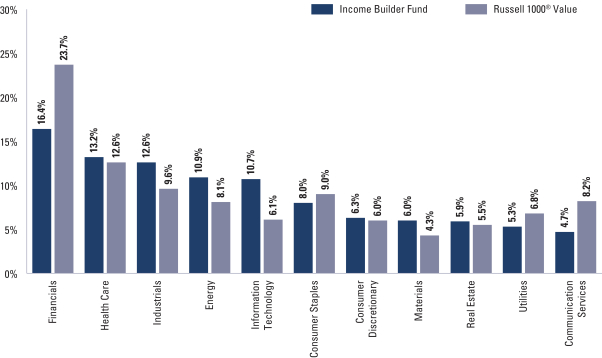
| 2 | The Fund is actively managed and, as such, its composition may differ over time. Consequently, the Fund’s overall sector allocations may differ from the percentages contained in the graph above. The graph categorizes investments using the Global Industry Classification Standard (“GICS”), however, the sector classifications used by the portfolio management team may differ from GICS. The percentage shown for each investment category reflects the value of investments in that category as a percentage of the total value of the Fund’s Equity investments market value (excluding investments in the securities lending reinvestment vehicle, if any). Investments in the securities lending reinvestment vehicle represented 0.0% of the Fund’s net assets as of October 31, 2019. The graph depicts the Fund’s investments but may not represent the Fund’s market exposure due to the exclusion of certain derivatives, if any, as listed in the Additional Investment Information section of the Schedule of Investments. |
8
FUND BASICS
| FUND’S FIXED INCOME FUND COMPOSITION3 |
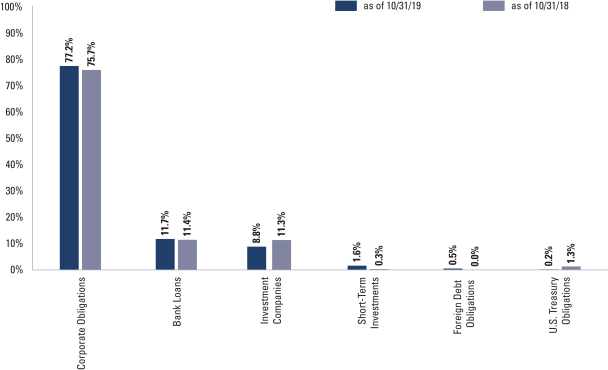
| 3 | The percentage shown for each investment category reflects the value of investments in that category as a percentage of the Fund’s Fixed Income investments. Short-term investments represent commercial papers. The graph depicts the Fund’s investments but may not represent the Fund’s market exposure due to the exclusion of certain derivatives, if any, as listed in the Additional Investment Information section of the Schedule of Investments. |
For more information about your Fund, please refer to www.GSAMFUNDS.com. There, you can learn more about your Fund’s investment strategies, holdings, and performance.
9
GOLDMAN SACHS INCOME BUILDER FUND
Performance Summary
October 31, 2019
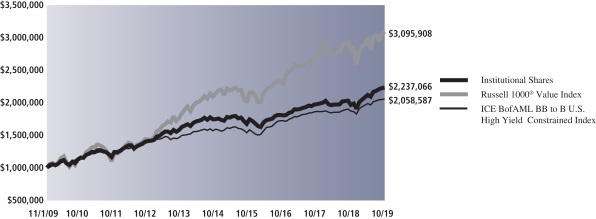
The following graph shows the value, as of October 31, 2019, of a $1,000,000 investment made on November 1, 2009 in Institutional Shares. For comparative purposes, the performance of the Fund’s current benchmarks, the Russell 1000® Value Index and the ICE BofAML BB to B U.S. High Yield Constrained Index, are shown. Performance reflects applicable fee waivers and/or expense limitations in effect during the periods shown and in their absence, performance would be reduced. Returns do not reflect the deduction of taxes that a shareholder would pay on Fund distributions or the redemption of Fund shares. The returns set forth below represent past performance. Past performance does not guarantee future results. The Fund’s investment return and principal value will fluctuate so that an investor’s shares, when redeemed, may be worth more or less than their original cost. Current performance may be lower or higher than the performance quoted below. Please visit our web site at www.GSAMFUNDS.com to obtain the most recent month-end returns.
| Income Builder Fund’s 10 Year Performance |
Performance of a $1,000,000 Investment, with distributions reinvested, from November 1, 2009 through October 31, 2019.
| Average Annual Total Return through October 31, 2019* | One Year | Five Years | Ten Years | Since Inception | ||||||||||
Class A | ||||||||||||||
Excluding sales charges | 13.34% | 4.62% | 7.95% | — | ||||||||||
Including sales charges | 7.12% | 3.44% | 7.34% | — | ||||||||||
| ||||||||||||||
Class C | ||||||||||||||
Excluding contingent deferred sales charges | 12.44% | 3.83% | 7.15% | — | ||||||||||
Including contingent deferred sales charges | 11.41% | 3.83% | 7.15% | — | ||||||||||
| ||||||||||||||
Institutional Class | 13.76% | 5.04% | 8.38% | — | ||||||||||
| ||||||||||||||
Investor (Commenced August 31, 2010) | 13.59% | 4.88% | N/A | 8.16% | ||||||||||
| ||||||||||||||
Class P (Commenced April 16, 2018) | 13.77% | N/A | N/A | 7.87% | ||||||||||
| ||||||||||||||
Class R6 (Commenced July 31, 2015) | 13.72% | N/A | N/A | 5.60% | ||||||||||
| ||||||||||||||
| * | These returns assume reinvestment of all distributions at NAV and reflect a maximum initial sales charge of 5.50% for Class A and the assumed contingent deferred sales charge for Class C Shares (1% if redeemed within 12 months of purchase). Because Institutional, Investor, Class P and Class R6 Shares do not involve a sales charge, such a charge is not applied to their Average Annual Total Return. |
10
FUND RESULTS
Goldman Sachs Rising Dividend Growth Fund
Investment Objective
The Fund seeks long-term growth of capital and current income.
Portfolio Management Discussion and Analysis
Below, the Quantitative Investment Strategies (“QIS”) portfolio management team, the Goldman Sachs Global Portfolio Solutions Group and the Dividend Assets Capital, LLC (“DAC”) portfolio management team, the Fund’ssub-adviser, discuss the Goldman Sachs Rising Dividend Growth Fund’s (the “Fund”) performance and positioning for the12-month period ended October 31, 2019 (the “Reporting Period”).
| Q | How did the Fund perform during the Reporting Period? |
| A | During the Reporting Period, the Fund’s Class A, Class C, Institutional, Investor, Class P, Class R and Class R6 Shares generated average annual total returns, without sales charges, of 10.41%, 9.55%, 10.85%, 10.73%, 10.86%, 10.08% and 10.78%, respectively. These returns compare to the 14.33% average annual total return of the Fund’s benchmark, the Standard & Poor’s® 500 Index (with dividends reinvested) (the “S&P 500 Index”), during the same time period. |
| Q | What economic and market factors most influenced the U.S. equity markets as a whole during the Reporting Period? |
| A | The S&P 500 Index gained 2.04% in November 2018 following a volatile prior month. Trade and political uncertainty persisted, but U.S. equities were buoyed by dovish comments from Federal Reserve (“Fed”) Chair Jerome Powell and by seemingly encouraging progress towardChina-U.S. trade talks. (Dovish language tends to suggest lower interest rates; opposite of hawkish.) The U.S. midterm elections on November 6th resulted in a divided government, as had been widely anticipated, with the Democrats gaining control of the House of Representatives and the Republicans maintaining their majority in the Senate. U.S. economic data remained strong, with Gross Domestic Product (“GDP”) growing at an annualized pace of 3.5% in the third quarter of 2018, following a 4.2% annualized GDP growth rate in the second calendar quarter. However, the rally was short-lived, as U.S. equities plunged in December 2018 on renewed investor fears, sparked by the arrest of a Chinese technology executive, the partial federal government shutdown and the U.S. President’s criticism of Fed Chair Powell. |
The S&P 500 Index rose 13.65% in the first quarter of 2019. After a volatile end to 2018, the rally to begin 2019 marked the best first quarter performance for the S&P 500 Index since 1998. Fed commentary provided a supportive background for U.S. equities, as Fed Chair Powell reiterated a “patient” approach to monetary policy that included a pause in interest rate hikes and a nearing end to the balance sheet runoff, or the shrinking of the Fed balance sheet as securities mature. The U.S. unemployment rate remained well below trend at 3.8% in February 2019, with a steady increase in wages of 3.4% year over year. Housing data continued to show strength in the first quarter, with new home sales reaching 667,000 in February, bringing the three-month average up to 630,000. Strength in housing data could be partially attributed to a steep decline in mortgage rates, resulting from a more cautious Fed. The University of Michigan Consumer Sentiment Index was a point of significant strength in the U.S. economy, climbing in each month of the first quarter of 2019 and eventually reaching 98.4 in March, its highest level in six months. Economic growth concerns, however, failed to completely abate, as fourth quarter 2018 GDP growth was revised down in March to 2.2%. While the revision was evidence of a slowing U.S. economy, the result was largely priced in by equity markets and thus had a limited effect on stock prices outside of the financials sector, which tends to be more interest rate-sensitive. |
The S&P 500 Index gained 4.30% in the second quarter of 2019, which, when combined with the sharp rally of the prior quarter, brought the S&P 500 Index to close its best first half of a calendar year since 1997. Trade tensions between the U.S. and China dominated headlines and broadly added noise to the markets. (Noise refers to information or activity that confuses or misrepresents genuine underlying trends.) In |
11
FUND RESULTS
April 2019, there was an optimistic outlook on a possible trade deal, but optimism then faded in May when the U.S. President threatened to raise then-current tariffs and impose new duties on $300 billion of additional Chinese imports. Sanctions were temporarily placed on a Chinese telecommunications giant, until they were lifted in June, when any additional tariffs or compromise were postponed. Also during the quarter, the market kept a close eye on the Fed. After steadily raising interest rates since 2015, the Fed alluded during the second quarter to a more accommodative approach. The market consensus had largely priced in at least one interest rate cut by the end of 2019, if not sooner. Economic indicators were mixed during the quarter, with consumer sentiment remaining elevated but nonfarm payrolls and manufacturing indices across the board falling short of market expectations. |
The S&P 500 Index rose 1.70% in the third quarter of 2019. During the third quarter, global economic data continued to slow, prompting the Fed to adopt measures of monetary easing. The Fed cut interest rates in July and September — its first interest rate cuts since 2008 — in an effort to prolong the U.S. economic expansion. Economic data was largely mixed, with manufacturing data and consumer confidence showing signs of weakness, but domestic demand held steady in the context of a strong labor market. |
The S&P 500 Index increased 2.17% in October 2019. U.S. equities welcomed signs of an easing in geopolitical tensions during the month, as U.S. and Chinese authorities appeared to move closer to a partial trade agreement, and the U.K. edged back from ano-deal Brexit. (Brexit is the term for the U.K.’s exit from, or path out of, the European Union.) U.S. economic data continued to soften, with the majority of weakness manifesting in the trade-sensitive manufacturing sector. Consumer confidence and the pace of job growth also fell moderately, and this overall picture of slowing economic momentum led the Fed to cut interest rates for the third time this calendar year. |
For the Reporting Period overall, real estate, information technology and utilities were the best performing sectors in the S&P 500 Index. The weakest performing sector in the S&P 500 Index was energy, followed at some distance by health care and financials. |
Within the U.S. equity market, all capitalization segments posted solid positive absolute returns, but on a relative basis,large-cap stocks, as measured by the Russell 1000® Index, performed best, followed closely bymid-cap stocks, as measured by the Russell Midcap® Index, and then, at some distance, bysmall-cap stocks, as measured by the Russell 2000® Index. From a style perspective, growth-oriented stocks significantly outpaced value-oriented stocks across the capitalization spectrum. (All as measured by the FTSE Russell indices.) |
| Q | What economic and market factors most influenced energy MLPs as a whole during the Reporting Period? |
| A | In the first months of the Reporting Period, fears about a U.S. economic slowdown, led by weakness abroad and trade tensions with China, triggered a global equity marketsell-off, including energy Master Limited Partnerships (“MLPs”). Brent crude oil active contracts lost 26.8% between October 31, 2018 and December 31, 2018, while economically-sensitive indices like the Dow Jones Transportation Average declined approximately 10% and the S&P 500 Index shed approximately 7.6%. As a result, Fed policymakers paused their interest rate hiking cycle and signaled monetary policy would remain accommodative and “patient” with any future interest rate increases. Risky assets subsequently rebounded from their December 2018 lows in the new calendar year, including equity markets and commodity prices. In the meantime, U.S. economic data, such as Purchasing Managers Index (“PMI”), Consumer Sentiment Index and labor market data all came in above consensus expectations. China’s PMI also reverted from contraction to expansion, suggesting its government’s stimulus measures put in place in 2018 started to channel through different economic sectors. With the relief rally at the start of 2019, Brent crude oil active contracts jumped 31.6% between January 1, 2019 and April 30, 2019. For the same time period, the Dow Jones Transportation Average rebounded approximately 18.8% and the S&P 500 Index was up approximately 18.3%. |
U.S. economic growth slowed somewhat during the third quarter of 2019 to less than 2% on a year over year basis. Industrial production growth was weak, partially offset by healthy consumer spending. The International Monetary Fund lowered its expectations for global economic growth as well, as U.S.-China trade tensions, Brexit and Middle East geopolitical risks created uncertainties, thus increasing the volatility of commodity prices, as concerns about an economic slowdown can lead to a reduction of energy demand. The Fed and other major central banks around the world enacted increasingly accommodative monetary policies in an effort to prevent an economic meltdown. On the positive side, the cost of capital remained relatively |
12
FUND RESULTS
inexpensive, and the capital markets remained open to most of the midstream energy companies. (The midstream component of the energy industry is usually defined as those companies providing products or services that help link the supply side, i.e. energy producers, and the demand side, i.e. energyend-users, for any type of energy commodity. Such midstream businesses can include, but are not limited to, those that process, store, market and transport various energy commodities.) |
In this persistently low commodity demand environment, many exploration and production companies were rationalizing their drilling capital expenditures, with many reducing the number of rigs operating. Even with fewer rigs, however, U.S. producers hit 12 million barrels per days early in 2019 and stayed above this level, with the exception of July 2019. As of the end of October 2019, the Energy Information Administration reported 12.6 million barrels per day of production and 696 oil rigs versus 11.5 million barrels per day with 874 rigs one year prior. Resilient production triggered oversupply fears from market participants. |
Front-month West Texas Intermediate (“WTI”) crude contract prices spent much of the Reporting Period trading between $50 to $65 per barrel, with an average price of $57 per barrel. Even with the attack on Saudi Arabian oil sites temporarily disrupting crude oil supply, an increase in oil prices was not sustained, only an increase in oil price volatility. In this environment, midstream assets operators, as measured by the Alerian U.S. Midstream Energy Index (“AMNA”), which is a broad-based composite of North American energy infrastructure companies, delivered a total return of 6.42% for the Reporting Period. The energyMLP-based Alerian MLP Index (“AMZ”) posted a total return of-6.53%, and the S&P 500 Index energy sector generated a total return of-11.04% for the Reporting Period. To compare, natural gas contract prices and WTI crude oil contract prices returned-10.14% and-17.20%, respectively, during the Reporting Period. |
AMNA’s outperformance of AMZ indicated, in our view, strength and investor acceptance fornon-MLP structured midstream assets operators, especially for those Canadian companies operating in the space. AMNA’s and AMZ’s outperformance of pure energy companies indicated, in our opinion, that the attractive yield and improved business fundamentals for the midstream space were embraced by investors seeking income and energy commodity exposure. |
Notably, during the Reporting Period, the topic of simplification — through a Limited Partnership roll up or an Incentive Distribution Rights (“IDRs”) buy in or a structural change from an MLP to a C-corp — to seek to attract a broad investor base was at the forefront of traditional MLP management decision making. (IDRs give a general partner an increasing share of a limited partnership’s incremental distributable cash flow. Used in MLPs, IDRs outlineper-unit distribution increases to the limited partners. IDRs are used to align the interests of all parties in a partnership. A C-corp, orC-corporation, is a corporation in which the owners, or shareholders, are taxed separately from the entity.) As a result, there was increased merger activity between limited partners and general partners during the Reporting Period. Some of these corporate events caused heightened volatility. Some became a catalyst for superior performance, for as idiosyncratic risks increased, actively managed strategies outperformed passively managed strategies during the Reporting Period. |
| Q | What key factors were responsible for the Fund’s performance during the Reporting Period? |
| A | While the Fund posted solid absolute gains, it underperformed the S&P 500 Index on a relative basis for the Reporting Period. |
During the Reporting Period, the Fund’s dividend-paying investments underperformed the S&P 500ex-Energy Index, the benchmark used for the dividend-paying growers portion of the Fund. Stock selection detracted from relative results within this portion of the Fund. Sector allocation contributed positively, albeit modestly. |
For the Reporting Period, the Fund’s MLP assets outperformed the Alerian MLP Index, the benchmark used for the MLP portion of the Fund. Such outperformance was driven by favorable stock selection and, to a lesser degree, by effective allocation positioning. In particular, DAC’s focus on high quality midstream assets operators and its ability to construct the MLP portion of the Fund in a way to reduce idiosyncratic risks was key to its relative performance during the Reporting Period, as the industry continued to face macro and fundamental challenges. On a factor level, the Fund’s MLPs had positive active exposure to larger market cap size, higher growth and timely trade activity and negative exposure to high yield, high leverage and deep value. These factors are consistent with DAC’s investment strategy of |
13
FUND RESULTS
seeking to capture returns from high quality midstream operators. A position in cash within this portion of the Fund, albeit modest, detracted from relative results during the Reporting Period. |
| Q | Which equity market sectors most significantly affected Fund performance during the Reporting Period? |
| A | The dividend-paying growers portion of the Fund does not take explicit sector bets relative to the S&P 500ex-Energy Index but rather allocations are the result of stock selection. That said, the sectors that detracted most on a relative basis to the S&P 500ex-Energy Index during the Reporting Period were industrials, consumer discretionary and communication services. Partially offsetting these detractors were information technology, materials and utilities, which contributed positively to this portion of the Fund’s relative results. |
| Q | Which stocks detracted significantly from the Fund’s performance during the Reporting Period? |
| A | Detracting most from the Fund’s results relative to the S&P 500ex-Energy Index during the Reporting Period were overweight positions in multimedia company CBS and package and freight delivery and logistics provider FedEx and an underweight position in software behemoth Microsoft. CBS and FedEx underperformed the S&P 500ex-Energy Index and Microsoft outperformed the S&P 500ex-Energy Index during the Reporting Period. |
| Q | What were some of the Fund’s best-performing individual stocks during the Reporting Period? |
| A | The top individual contributors to the Fund’s relative performance during the Reporting Period were overweight positions in semiconductor companies Xilinx, Applied Materials and KLA, each of which outperformed the S&P 500ex-Energy Index during the Reporting Period. |
| Q | Which industries within the Alerian MLP Index most significantly affected Fund performance during the Reporting Period? |
| A | As measured by the Alerian MLP Index, the GICSsub-industries that contributed most positively on a relative basis during the Reporting Period were oil and gas storage and transportation; oil and gas equipment and services; and renewable electricity. Effective security selection helped most within oil and gas storage and transportation, while having an overweight to oil and gas transportation and services and exposure to renewable electricity, which each outperformed the Alerian MLP Index during the Reporting Period, boosted relative results most. |
Thesub-industries that detracted most from the MLP portion of the Fund during the Reporting Period were oil and gas refining and marketing; coal and consumable fuels; and oil and gas exploration and production. Both weak stock selection within and having an underweight to oil and gas refining and marketing hurt most. Having overweights to both coal and consumable fuels and oil and gas exploration and production detracted. |
| Q | What were some of the Fund’s best-performing MLPs during the Reporting Period? |
| A | Relative to the Alerian MLP Index, among those MLPs that contributed most to the Fund’s performance during the Reporting Period were USA Compression Partners LP, ONEOK Inc. and Cheniere Energy Partners LP. Each of these holdings delivered a double-digit positive absolute return during the Reporting Period, and the MLP portion of the Fund was overweight USA Compression Partners LP and Cheniere Energy Partners LP and had exposure to ONEOK Inc, which is not a component of the Alerian MLP Index but which significantly outperformed the Alerian MLP Index.. |
| Q | Which MLPs detracted significantly from the Fund’s performance during the Reporting Period? |
| A | Among those MLPs detracting most from the Fund’s results relative to the Alerian MLP Index were overweight positions in Antero Midstream Corp. and Alliance Resources Partners LP and exposure to Targa Resources Corp., which is not a component of the Alerian MLP Index. Each posted a double-digit negative return within the MLP portion of the Fund during the Reporting Period. |
| Q | How did the Fund use derivatives during the Reporting Period? |
| A | The MLP portion of the Fund did not use derivatives during the Reporting Period. The dividend-paying equity investments portion of the Fund used equity index futures on an opportunistic basis during the Reporting Period to equitize its modest cash position. In other words, we put the Fund’s excess cash holdings to work by using them as collateral for the purchase of equity index futures. The use of these derivatives did not have a material impact on Fund results during the Reporting Period. |
14
FUND RESULTS
| Q | Did the Fund make any significant equity purchases or sales during the Reporting Period? |
| A | The dividend-paying growers portion of the Fund uses a systematic, rules-based approach and thus equity purchases and sales are based solely on that quantitative process. |
| Q | Did the Fund make any significant purchases or sales of MLPs during the Reporting Period? |
| A | Notably, the Alerian MLP Index eliminated Alliance Resource Partners LP and USA Compression Partners LP during the Reporting Period, as it continues to refine its inclusion methodology. Each was a holding of the MLP portion of the Fund during the Reporting Period. Also Antero Resources Corp. sold Antero Midstream Partners LP to Antero Midstream Corp., announced in early October 2018, with the transaction closingmid-March 2019. The MLP portion of the Fund owned Antero Midstream Corp. before the deal and since then has reduced the Fund’s position. |
During the Reporting Period, the MLP portion of the Fund initiated a position in TC Energy (“TRP”) and DCP Midstream LP (“DCP”). We established a Fund position in TRP, as we view it as a compelling total return opportunity. TRP is among the largest North American natural gas pipeline operators and storage providers. TRP has been a consistent dividend payer since 2000 despite challenging energy prices. At the time of purchase, we expected TRP to accelerate its earnings before interest, taxes, depreciation and amortization growth going forward due to multiple projectstart-ups that could potentially support higher dividend growth and, as a result, a stronger valuation. We established a Fund position in DCP, as we believed its valuation compression was overdone, and incremental improvement should support a better valuation, resulting potentially in a robust total return opportunity. Growing earnings as volumes transported and processed on existing assets increase and new projects come into service, combined with what we view as its stable cash flow, meaningful scale and basin diversification, could be near to medium term catalysts, in our opinion. |
Conversely, the MLP portion of the Fund eliminated its position in EnLink Midstream LLC (“ENLC”) and Summit Midstream Partners LP (“SMLP”). We exited the Fund’s position in ENLC, as we believe its frequent management changes and what we see as its poor strategy execution adds additional risks during a challenging energy environment. We sold the Fund’s position in SMLP after it announced a distribution cut in early 2019. Based on our investment criteria, the distribution cut triggered DAC’s sell discipline. The timing of our sale proved prudent, as SMLP’s share price declined significantly since its distribution cut announcement. |
| Q | Were there any notable changes in the Fund’s equity sector weightings during the Reporting Period? |
| A | As mentioned earlier, under the QIS team’s investment approach, the dividend-paying growers portion of the Fund does not take sector bets by design. Therefore, the dividend-paying investments portion of the Fund, using a quantitative process, strove to be similar to the S&P 500ex-Energy Index in terms of sector allocation. We seek to provide exposure to high quality, dividend-paying growers within each sector. |
| Q | Were there any notable changes in the Fund’s MLP weightings during the Reporting Period? |
| A | During the Reporting Period, the Alerian MLP Index updated its methodology guidance and inclusion rules. As a result, the Alerian MLP Index no longer has exposure to gas utilities; oil and gas exploration and production; oil and gas equipment services; and coal and consumable fuels. The only GICSsub-industries the Alerian MLP Index has exposure to since November 30, 2018 are oil and gas storage and transportation and oil and gas refining and marketing. Given these changes, the MLP portion of the Fund hadout-of-benchmark exposure to oil and gas equipment and services; oil and gas exploration and production; coal and consumable fuels; and renewable electricity at the end of the Reporting Period. Based on GICSsub-industries, the MLP portion of the Fund had an underweighted allocation relative to the Alerian MLP Index in oil and gas storage and transportation and had no exposure to oil and gas refining and marketing at the end of the Reporting Period. |
At the end of the Reporting Period, the MLP portion of the Fund had its largest allocation in the oil and gas storage and transportationsub-industry, equivalent to approximately 91.3% of the Fund’s MLP assets, excluding cash. |
| Q | How was the dividend-paying investments portion of the Fund positioned relative to the S&P 500ex-Energy Index at the end of the Reporting Period? |
| A | As mentioned earlier, it is not part of the dividend-paying investments portion of the Fund’s approach to take sector bets. Thus, at the end of October 2019, the dividend-paying investments portion of the Fund had rather neutral positions |
15
FUND RESULTS
in each sector of the S&P 500ex-Energy Index, with the exception of information technology and communication services, wherein underweighted positions were held. |
| Q | Were there any changes to the Fund’s portfolio management team during the Reporting Period? |
| A | There were no changes in either portion of the Fund’s portfolio management team during the Reporting Period. |
| Q | What is the Fund’s tactical view and strategy for the months ahead? |
| A | The Fund seeks long-term growth of capital and current income. Within the dividend-paying growers sleeve, we maintained confidence at the end of the Reporting Period in high quality business models that have demonstrated commitment to grow their dividend in a rather stable manner. |
As for MLPs, we believed at the end of the Reporting Period that uncertainty around U.S.-China trade tensions, a global economic slowdown and Middle East turmoil remained vital factors impacting market sentiment toward near-term crude oil prices. On the industry level, the rate of shale production growth, rig counts and inventory data, as well as regulatory changes, remained just as crucial, as the U.S. becomes a major swing producer. (A swing producer is a supplier or a close oligopolistic group of suppliers of any commodity, controlling its global deposits and possessing large spare production capacity. A swing producer is able to increase or decrease commodity supply at minimal additional internal cost, and thus able to influence prices and balance the markets, providing downside protection in the short to middle term.) With that said, we believed that with such uncertainty, many opportunities for investment may present upside potential in 2020. At the end of the Reporting Period, we were optimistic around incremental improvement of U.S.-China trade relations, a rebound of the global economy, and a crude oil supply/demand deficit supporting moderate oil price recovery in 2020. |
On a micro level, we believed midstream companies and MLPs had started to provide improved total return opportunities, as their distributions stabilized in comparison to the decline trend of the past couple of years and their dividend yields were relatively higher. During the Reporting Period, we continued to see a valuation gap between publicly-traded midstream companies, including MLPs, and their private counterparts. Private equity and pension funds have been actively seeking deeply discounted assets either with high leverage or have challenging growth aspects otherwise not desirable from public investors. |
Most of the midstream companies and MLPs were able to deliver improved growth, stronger balance sheets and less complicated organization structures during the Reporting Period. As investors become more selective in the industry, performance dispersion widened. Although the midstream space overall had yet to return to historical valuation levels, further valuationre-rating may be well underway, as midstream companies’ and MLP’s management teams work to restore investor confidence with more consistent messaging and improved credibility. (When the market changes its view of a company, industry or sector sufficiently to make calculation ratios, such as price/earnings ratios, substantially higher or lower, this is are-rating.) |
Additionally, we believed opportunities remained around exports. Crude oil exports from the U.S. are widely expected to reach 4 million barrels per day in 2020, having reached 3.5 million barrels per day in March 2019, an almost one million barrel per day increase from 2018. Natural gas exports during the first half of 2019 doubled year over year for the second consecutive year. As more liquid natural gas facilities have come online during the second half of 2019, expanding U.S. liquid natural gas export capacity is expected by many analysts to rise to 8.9 billion cubic feet per day by the end of 2020. Midstream operators play a vital role, as they transport and store the barrels from producing basins to exporting terminals. In our view, the MLP portion of the Fund was well positioned at the end of the Reporting Period to benefit from this secular trend. We feel the capital markets remained accommodative to high quality midstream companies, with project returns being well above the cost of capital, potentially creating long-term economic value for shareholders. The MLP portion of the Fund is, we believe, positioned with what we consider to be the strongest companies whose businesses touch several points of the supply chain, with limited commodity exposure through long-term contracts or value-added services. Over the long term, we believe the MLP portion of the Fund’s focus on high quality has produced superior relative returns compared to the Alerian MLP Index, despite near-term market volatility. As always, we continue to monitor domestic and global economies, geopolitical factors, interest rates and equity market fundamentals as we actively manage the Fund. |
16
FUND RESULTS
Index Definitions
The Alerian MLP Index (AMZ) is a widely recognized, unmanaged index that includes a composite of the 50 most prominent energy MLPs. The Index returns do not reflect the deduction of expenses, which have been deducted from net returns. The Index return assumes reinvestment of all distributions and does not reflect the deduction of taxes and fees.
The Alerian U.S. Midstream Energy Index (AMNA) is a broad-based composite of U.S. energy infrastructure companies. The capped, float-adjusted, capitalization-weighted index, whose constituents earn the majority of their cash flow from midstream activities involving energy commodities, is disseminated real-time on a price-return basis (AMNA) and on a total return basis (AMNAX).
The Dow Jones Transportation Average is a price-weighted average of 20 transportation stocks traded in the U.S.
The S&P 500Ex-Energy is designed to provide broad market exposure except for members of the energy sector.
S&P 500® Index is a U.S. stock market index based on the market capitalizations of 500 large companies having common stock listed on the New York Stock Exchange or NASDAQ. The S&P 500® Index components and their weightings are determined by S&P Dow Jones Indices.
It is not possible to invest directly in an unmanaged index.
The University of Michigan Consumer Sentiment Index is a monthly survey of U.S. consumer confidence levels conducted by the University of Michigan. It is based on telephone surveys that gather information on consumer expectations regarding the overall economy. The index is designed to capture the mood of American consumers with regard to their economic well-being and outlook. Because consumer spending accounts for roughly 70% of U.S. gross domestic product, the index is regarded as one of the many important economic indicators followed by businesses, policymakers and participants in the investment community.
The Purchasing Managers Index (“PMI”) is an index of the prevailing direction of economic trends in the manufacturing and service sectors.
The Consumer Sentiment Index measures consumers’ attitudes towards the economy.
17
FUND BASICS
Rising Dividend Growth Fund
as of October 31, 2019
| TOP TEN HOLDINGS AS OF 10/31/191 | ||||||||
| Holding | % of Net Assets | Line of Business | ||||||
| Comcast Corp. Class A | 2.3 | % | Media | |||||
| The Walt Disney Co. | 2.3 | Entertainment | ||||||
| Enterprise Products Partners LP | 2.0 | Oil, Gas & Consumable Fuels | ||||||
| Omnicom Group, Inc. | 1.7 | Media | ||||||
| Magellan Midstream Partners LP | 1.6 | Oil, Gas & Consumable Fuels | ||||||
| Energy Transfer LP | 1.5 | Oil, Gas & Consumable Fuels | ||||||
| UnitedHealth Group, Inc. | 1.5 | Health Care Providers & Services | ||||||
| CBS Corp. Class B | 1.5 | Media | ||||||
| MPLX LP | 1.4 | Oil, Gas & Consumable Fuels | ||||||
| CVS Health Corp. | 1.3 | Health Care Providers & Services | ||||||
| 1 | The top 10 holdings may not be representative of the Portfolio’s future investments. The top 10 holdings exclude investments in money market funds. |
| FUND VS. BENCHMARK SECTOR ALLOCATION2 |
| As of October 31, 2019 |
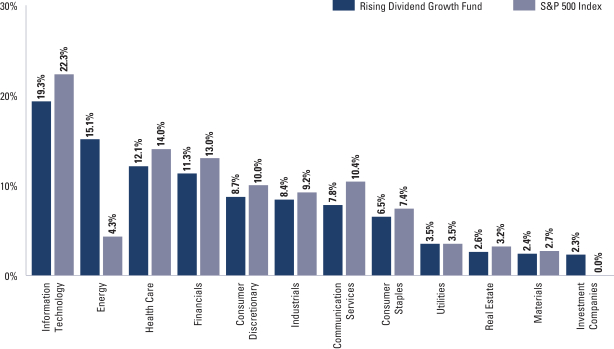
| 2 | The Fund is actively managed and, as such, its composition may differ over time. Consequently, the Fund’s overall sector allocations may differ from the percentages contained in the graph above. The graph categorizes investments using the Global Industry Classification Standard (“GICS”), however, the sector classifications used by the portfolio management team may differ from GICS. Underlying sector allocations of Investment Companies held by the Fund are not reflected in the graph above. The percentage shown for each investment category reflects the value of investments in that category as a percentage of market value. The graph depicts the Fund’s investments but may not represent the Fund’s market exposure due to the exclusion of certain derivatives, if any, as listed in the Additional Investment Information section of the Schedule of Investments. |
For more information about your Fund, please refer to www.GSAMFUNDS.com. There, you can learn more about your Fund’s investment strategies, holdings, and performance.
18
GOLDMAN SACHS RISING DIVIDEND GROWTH FUND
Performance Summary
October 31, 2019
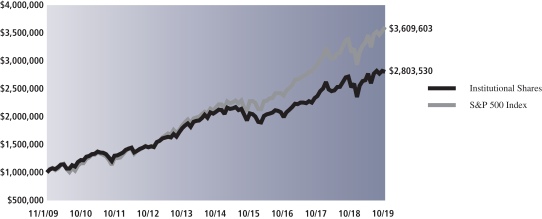
The following graph shows the value, as of October 31, 2019, of a $1,000,000 investment made on November 1, 2009 in Institutional Shares. For comparative purposes, the performance of the Fund’s benchmark, the S&P 500 Index (with dividends reinvested), is shown. Performance reflects applicable fee waivers and/or expense limitations in effect during the periods shown and in their absence, performance would be reduced. Returns do not reflect the deduction of taxes that a shareholder would pay on Fund distributions or the redemption of Fund shares. The returns set forth below represent past performance. Past performance does not guarantee future results. The Fund’s investment return and principal value will fluctuate so that an investor’s shares, when redeemed, may be worth more or less than their original cost. Current performance may be lower or higher than the performance quoted below. Please visit our web site at www.GSAMFUNDS.com to obtain the most recent month-end returns.
| Rising Dividend Growth Fund’s 10 Year Performance |
Performance of a $1,000,000 Investment, with distributions reinvested, from November 1, 2009 through October 31, 2019.
| Average Annual Total Return through October 31, 2019* | One Year | Five Years | Ten Years | Since Inception | ||||||||||
Class A | ||||||||||||||
Excluding sales charges | 10.41% | 5.65% | 10.39% | — | ||||||||||
Including sales charges | 4.33% | 4.46% | 9.76% | — | ||||||||||
| ||||||||||||||
Class C | ||||||||||||||
Excluding contingent deferred sales charges | 9.55% | 4.86% | 9.68% | — | ||||||||||
Including contingent deferred sales charges | 8.46% | 4.86% | 9.68% | — | ||||||||||
| ||||||||||||||
Institutional Class | 10.85% | 6.08% | 10.85% | — | ||||||||||
| ||||||||||||||
Investor (Commenced February 27, 2012) | 10.73% | 5.92% | N/A | 9.15% | ||||||||||
| ||||||||||||||
Class P (Commenced April 23, 2018) | 10.86% | N/A | N/A | 7.61% | ||||||||||
| ||||||||||||||
Class R (Commenced February 27, 2012) | 10.08% | 5.38% | N/A | 8.60% | ||||||||||
| ||||||||||||||
Class R6 (Commenced February 28, 2018) | 10.78% | N/A | N/A | 7.29% | ||||||||||
| ||||||||||||||
| * | Effective February 27, 2012, the Rising Dividend Growth Fund, a series of Dividend Growth Trust (the “Predecessor Fund”), was reorganized into the Fund. As accounting successor to the Predecessor Fund, the Fund has assumed the Predecessor Fund’s historical performance. These returns assume reinvestment of all distributions at NAV and reflect a maximum initial sales charge of 5.50% for Class A and the assumed contingent deferred sales charge for Class C Shares (1% if redeemed within 12 months of purchase). Because Institutional, Investor, Class P and Class R6 Shares do not involve a sales charge, such a charge is not applied to their Average Annual Total Return. |
19
GOLDMAN SACHS INCOME BUILDER FUND
October 31, 2019
| Shares | Description | Value | ||||||
| Common Stocks – 35.8% | ||||||||
| Aerospace & Defense – 0.6% | ||||||||
| 21,619 | Northrop Grumman Corp. | $ | 7,620,265 | |||||
| 12,244 | Raytheon Co. | 2,598,299 | ||||||
|
| |||||||
| 10,218,564 | ||||||||
|
| |||||||
| Banks – 2.5% | ||||||||
| 174,939 | Bank of America Corp. | 5,470,342 | ||||||
| 186,975 | BB&T Corp. | 9,919,024 | ||||||
| 27,548 | Cullen/Frost Bankers, Inc. | 2,481,524 | ||||||
| 110,175 | JPMorgan Chase & Co. | 13,763,061 | ||||||
| 35,560 | M&T Bank Corp. | 5,566,207 | ||||||
| 89,202 | Wells Fargo & Co. | 4,605,499 | ||||||
|
| |||||||
| 41,805,657 | ||||||||
|
| |||||||
| Beverages – 0.5% | ||||||||
| 162,776 | TheCoca-Cola Co. | 8,859,898 | ||||||
|
| |||||||
| Biotechnology – 0.2% | ||||||||
| 42,836 | Gilead Sciences, Inc. | 2,729,082 | ||||||
|
| |||||||
| Capital Markets – 1.2% | ||||||||
| 162,676 | Morgan Stanley | 7,491,230 | ||||||
| 85,944 | Northern Trust Corp. | 8,566,898 | ||||||
| 47,384 | Singapore Exchange Ltd. ADR | 4,683,909 | ||||||
|
| |||||||
| 20,742,037 | ||||||||
|
| |||||||
| Chemicals – 1.2% | ||||||||
| 100,228 | DuPont de Nemours, Inc. | 6,606,027 | ||||||
| 19,275 | Ecolab, Inc. | 3,702,149 | ||||||
| 44,665 | Linde PLC | 8,859,303 | ||||||
|
| |||||||
| 19,167,479 | ||||||||
|
| |||||||
| Commercial Services & Supplies – 0.4% | ||||||||
| 81,815 | Republic Services, Inc. | 7,159,631 | ||||||
|
| |||||||
| Communications Equipment – 1.1% | ||||||||
| 318,910 | Cisco Systems, Inc. | 15,151,414 | ||||||
| 124,470 | Juniper Networks, Inc. | 3,089,345 | ||||||
|
| |||||||
| 18,240,759 | ||||||||
|
| |||||||
| Construction & Engineering – 0.6% | ||||||||
| 372,250 | Vinci SA ADR | 10,430,445 | ||||||
|
| |||||||
| Containers & Packaging – 0.6% | ||||||||
| 226,587 | International Paper Co. | 9,897,320 | ||||||
|
| |||||||
| Diversified Telecommunication Services – 0.8% | ||||||||
| 227,229 | Verizon Communications, Inc. | 13,740,538 | ||||||
|
| |||||||
| Electric Utilities – 0.6% | ||||||||
| 798,506 | Enel SpA ADR(a) | 6,172,451 | ||||||
| 59,206 | Xcel Energy, Inc. | 3,760,173 | ||||||
|
| |||||||
| 9,932,624 | ||||||||
|
| |||||||
| Electrical Equipment – 0.6% | ||||||||
| 503,091 | Schneider Electric SE ADR | 9,322,276 | ||||||
|
| |||||||
| Electronic Equipment, Instruments & Components – 0.3% | ||||||||
| 51,590 | TE Connectivity Ltd. | 4,617,305 | ||||||
|
| |||||||
| Common Stocks – (continued) | ||||||||
| Energy Equipment & Services – 0.1% | ||||||||
| 107,194 | Baker Hughes Co. | 2,293,952 | ||||||
|
| |||||||
| Equity Real Estate Investment Trusts (REITs) – 2.2% | ||||||||
| 29,728 | American Tower Corp. | 6,483,082 | ||||||
| 27,589 | AvalonBay Communities, Inc. | 6,005,022 | ||||||
| 45,833 | Camden Property Trust | 5,241,920 | ||||||
| 144,530 | Hudson Pacific Properties, Inc. | 5,191,517 | ||||||
| 161,179 | Klepierre SA | 6,007,985 | ||||||
| 256,988 | SITE Centers Corp. | 3,991,024 | ||||||
| 45,639 | Ventas, Inc. | 2,971,099 | ||||||
|
| |||||||
| 35,891,649 | ||||||||
|
| |||||||
| Food & Staples Retailing – 0.2% | ||||||||
| 116,903 | The Kroger Co. | 2,880,490 | ||||||
|
| |||||||
| Food Products – 0.6% | ||||||||
| 84,828 | Nestle SA ADR | 9,090,168 | ||||||
|
| |||||||
| Health Care Equipment & Supplies – 1.4% | ||||||||
| 152,737 | Medtronic PLC | 16,633,059 | ||||||
| 51,038 | Zimmer Biomet Holdings, Inc. | 7,054,983 | ||||||
|
| |||||||
| 23,688,042 | ||||||||
|
| |||||||
| Health Care Providers & Services – 0.4% | ||||||||
| 109,260 | �� | CVS Health Corp. | 7,253,771 | |||||
|
| |||||||
| Hotels, Restaurants & Leisure – 0.8% | ||||||||
| 52,926 | Las Vegas Sands Corp. | 3,272,944 | ||||||
| 51,651 | McDonald’s Corp. | 10,159,752 | ||||||
|
| |||||||
| 13,432,696 | ||||||||
|
| |||||||
| Household Durables – 0.3% | ||||||||
| 108,170 | D.R. Horton, Inc. | 5,664,863 | ||||||
|
| |||||||
| Household Products – 0.6% | ||||||||
| 85,538 | The Procter & Gamble Co. | 10,650,336 | ||||||
|
| |||||||
| Industrial Conglomerates – 0.7% | ||||||||
| 64,323 | Honeywell International, Inc. | 11,110,512 | ||||||
|
| |||||||
| Insurance – 1.7% | ||||||||
| 59,926 | Chubb Ltd. | 9,133,921 | ||||||
| 66,341 | Principal Financial Group, Inc. | 3,541,282 | ||||||
| 30,327 | The Travelers Cos., Inc. | 3,974,656 | ||||||
| 32,513 | Willis Towers Watson PLC | 6,076,680 | ||||||
| 153,184 | Zurich Insurance Group AG ADR | 6,006,345 | ||||||
|
| |||||||
| 28,732,884 | ||||||||
|
| |||||||
| IT Services – 0.6% | ||||||||
| 28,503 | Automatic Data Processing, Inc. | 4,624,042 | ||||||
| 34,821 | Fidelity National Information Services, Inc. | 4,588,015 | ||||||
|
| |||||||
| 9,212,057 | ||||||||
|
| |||||||
| Machinery – 0.8% | ||||||||
| 42,822 | Deere & Co. | 7,457,023 | ||||||
| 42,141 | Stanley Black & Decker, Inc. | 6,377,198 | ||||||
|
| |||||||
| 13,834,221 | ||||||||
|
| |||||||
| 20 | The accompanying notes are an integral part of these financial statements. |
GOLDMAN SACHS INCOME BUILDER FUND
| Shares | Description | Value | ||||||
| Common Stocks – (continued) | ||||||||
| Media – 0.8% | ||||||||
| 194,739 | Bright Pattern Holding Co. | $ | 253,160 | |||||
| 299,823 | Comcast Corp. Class A | 13,438,067 | ||||||
|
| |||||||
| 13,691,227 | ||||||||
|
| |||||||
| Metals & Mining – 0.5% | ||||||||
| 144,021 | Rio Tinto PLC ADR | 7,490,532 | ||||||
|
| |||||||
| Multi-Utilities – 0.8% | ||||||||
| 81,085 | Ameren Corp. | 6,300,305 | ||||||
| 58,668 | Public Service Enterprise Group, Inc. | 3,714,271 | ||||||
| 25,196 | Sempra Energy | 3,641,074 | ||||||
|
| |||||||
| 13,655,650 | ||||||||
|
| |||||||
| Oil, Gas & Consumable Fuels – 3.8% | ||||||||
| 183,440 | Antero Midstream Corp. | 1,181,353 | ||||||
| 240,335 | BP PLC ADR | 9,111,100 | ||||||
| 157,019 | Chevron Corp. | 18,236,187 | ||||||
| 547,918 | Energy Transfer LP | 6,898,288 | ||||||
| 45,213 | Marathon Petroleum Corp. | 2,891,371 | ||||||
| 128,349 | Plains All American Pipeline LP | 2,326,967 | ||||||
| 277,277 | Royal Dutch Shell PLC ADR Class A | 16,073,748 | ||||||
| 315,649 | The Williams Cos., Inc. | 7,042,129 | ||||||
|
| |||||||
| 63,761,143 | ||||||||
|
| |||||||
| Personal Products – 0.6% | ||||||||
| 174,232 | Unilever NV | 10,321,504 | ||||||
|
| |||||||
| Pharmaceuticals – 2.8% | ||||||||
| 142,581 | AstraZeneca PLC ADR | 6,990,746 | ||||||
| 96,846 | Eli Lilly & Co. | 11,035,602 | ||||||
| 149,090 | Johnson & Johnson | 19,685,844 | ||||||
| 103,870 | Novartis AG ADR | 9,082,393 | ||||||
|
| |||||||
| 46,794,585 | ||||||||
|
| |||||||
| Road & Rail – 0.9% | ||||||||
| 30,370 | Norfolk Southern Corp. | 5,527,340 | ||||||
| 56,896 | Union Pacific Corp. | 9,414,012 | ||||||
|
| |||||||
| 14,941,352 | ||||||||
|
| |||||||
| Semiconductors & Semiconductor Equipment – 0.9% | ||||||||
| 136,782 | Intel Corp. | 7,732,287 | ||||||
| 67,382 | Texas Instruments, Inc. | 7,950,402 | ||||||
|
| |||||||
| 15,682,689 | ||||||||
|
| |||||||
| Software – 0.5% | ||||||||
| 62,290 | Microsoft Corp. | 8,930,517 | ||||||
|
| |||||||
| Specialty Retail – 1.2% | ||||||||
| 285,838 | Industria de Diseno Textil SA ADR | 4,467,648 | ||||||
| 64,261 | The Home Depot, Inc. | 15,074,345 | ||||||
|
| |||||||
| 19,541,993 | ||||||||
|
| |||||||
| Technology Hardware, Storage & Peripherals – 0.5% | ||||||||
| 34,710 | Apple, Inc. | 8,634,460 | ||||||
|
| |||||||
| Common Stocks – (continued) | ||||||||
| Technology – Software/Services(b)(c) – 0.0% | ||||||||
| 194,739 | Aspect Software, Inc. Class B | 48,685 | ||||||
|
| |||||||
| Tobacco – 0.4% | ||||||||
| 82,671 | Philip Morris International, Inc. | 6,732,726 | ||||||
|
| |||||||
| Water Utilities – 0.5% | ||||||||
| 71,745 | American Water Works Co., Inc. | 8,844,005 | ||||||
|
| |||||||
| TOTAL COMMON STOCKS | ||||||||
| (Cost $506,776,409) | $ | 599,670,324 | ||||||
|
| |||||||
| Shares | Dividend Rate | Value | ||||||
| Preferred Stocks(d) – 0.6% | ||||||||
| Capital Markets(e) – 0.3% | ||||||||
Morgan Stanley (3M USD LIBOR + 3.708%) |
| |||||||
| 183,597 | 6.375 | % | $ | 5,168,256 | ||||
| ||||||||
| Diversified Telecommunication Services – 0.1% | ||||||||
Qwest Corp. |
| |||||||
| 43,276 | 6.500 | 1,103,105 | ||||||
| ||||||||
| Insurance(e) – 0.2% | ||||||||
Delphi Financial Group, Inc. (3M USD LIBOR + 3.190%) |
| |||||||
| 143,849 | 5.348 | 3,344,489 | ||||||
| ||||||||
| TOTAL PREFERRED STOCKS |
| |||||||
| (Cost $8,780,987) |
| $ | 9,615,850 | |||||
| ||||||||
| Principal Amount | Interest Rate | Maturity Date | Value | |||||||||||
| Corporate Obligations – 46.8% | ||||||||||||||
| Advertising(d)(f) – 0.0% | ||||||||||||||
Outfront Media Capital LLC/Outfront Media Capital Corp. | ||||||||||||||
| $ | 360,000 | 5.000 | % | 08/15/27 | $ | 377,550 | ||||||||
|
| |||||||||||||
| Aerospace & Defense(d) – 0.7% | ||||||||||||||
Arconic, Inc. | ||||||||||||||
| 2,950,000 | 5.400 | 04/15/21 | 3,044,665 | |||||||||||
Bombardier, Inc.(f) | ||||||||||||||
| 2,330,000 | 7.500 | 03/15/25 | 2,213,500 | |||||||||||
TransDigm, Inc. | ||||||||||||||
| 2,750,000 | 6.000 | 07/15/22 | 2,797,025 | |||||||||||
| 365,000 | 6.500 | 05/15/25 | 379,144 | |||||||||||
| 3,300,000 | 5.500 | (f) | 11/15/27 | 3,287,625 | ||||||||||
|
| |||||||||||||
| 11,721,959 | ||||||||||||||
|
| |||||||||||||
| Agriculture – 0.6% | ||||||||||||||
BAT Capital Corp.(d) | ||||||||||||||
| 10,000,000 | 4.390 | 08/15/37 | 9,856,300 | |||||||||||
MHP SE | ||||||||||||||
| 330,000 | 7.750 | 05/10/24 | 349,800 | |||||||||||
|
| |||||||||||||
| 10,206,100 | ||||||||||||||
|
| |||||||||||||
| Airlines(f) – 0.1% | ||||||||||||||
Air Canada Pass ThroughTrust Series 2013-1, Class B | ||||||||||||||
| 1,732,381 | 5.375 | 11/15/22 | 1,780,333 | |||||||||||
|
| |||||||||||||
| The accompanying notes are an integral part of these financial statements. | 21 |
GOLDMAN SACHS INCOME BUILDER FUND
Schedule of Investments(continued)
October 31, 2019
| Principal Amount | Interest Rate | Maturity Date | Value | |||||||||||
| Corporate Obligations – (continued) | ||||||||||||||
| Automotive – 0.7% | ||||||||||||||
American Axle & Manufacturing, Inc.(d) | ||||||||||||||
| $ | 1,950,000 | 6.250 | % | 04/01/25 | $ | 1,881,750 | ||||||||
Delphi Technologies PLC(f) | ||||||||||||||
| 4,100,000 | 5.000 | 10/01/25 | 3,556,750 | |||||||||||
Ford Motor Credit Co. LLC | ||||||||||||||
| 2,500,000 | 5.875 | 08/02/21 | 2,621,250 | |||||||||||
General Motors Co.(d) | ||||||||||||||
| 3,000,000 | 6.600 | 04/01/36 | 3,478,410 | |||||||||||
|
| |||||||||||||
| 11,538,160 | ||||||||||||||
|
| |||||||||||||
| Banks – 3.6% | ||||||||||||||
Akbank Turk A/S(d)(e) (5 year USD Swap + 5.026%) | ||||||||||||||
| 320,000 | 7.200 | 03/16/27 | 301,900 | |||||||||||
Banco do Brasil SA(d)(e) (10 Year CMT + 4.398%) | ||||||||||||||
| 560,000 | 6.250 | 04/15/49 | 554,288 | |||||||||||
Banco Mercantil del Norte SA(d)(e)(f) (5 Year CMT + 4.967%) | ||||||||||||||
| 680,000 | 6.750 | 09/27/49 | 690,200 | |||||||||||
Bank of America Corp.(d)(e) (3M USD LIBOR + 3.898%) | ||||||||||||||
| 4,000,000 | 6.100 | 12/29/49 | 4,420,000 | |||||||||||
BBVA Bancomer SA(d)(e) (5 Year CMT + 2.650%) | ||||||||||||||
| 530,000 | 5.125 | 01/18/33 | 514,391 | |||||||||||
BNP Paribas SA(f) | ||||||||||||||
| 2,700,000 | 4.375 | 05/12/26 | 2,883,627 | |||||||||||
CIT Group, Inc.(d) | ||||||||||||||
| 4,025,000 | 5.250 | 03/07/25 | 4,432,531 | |||||||||||
Citigroup, Inc.(d)(e) (3M USD LIBOR + 4.517%) | ||||||||||||||
| 4,000,000 | 6.250 | 12/29/49 | 4,530,000 | |||||||||||
Credit Suisse Group AG(d)(e)(f) (5 year USD Swap + 4.598%) | ||||||||||||||
| 4,025,000 | 7.500 | 12/29/49 | 4,397,312 | |||||||||||
Deutsche Bank AG(d)(e) (5 year USD Swap + 2.248%) | ||||||||||||||
| 2,000,000 | 4.296 | 05/24/28 | 1,895,000 | |||||||||||
FirstRand Bank Ltd.(d)(e) (5 year USD Swap + 3.561%) | ||||||||||||||
| 320,000 | 6.250 | 04/23/28 | 340,100 | |||||||||||
ING Groep NV(d)(e) | ||||||||||||||
(5 year USD Swap + 4.445%) | ||||||||||||||
| 4,275,000 | 6.000 | 12/29/49 | 4,301,719 | |||||||||||
(5 year USD Swap + 4.446%) | ||||||||||||||
| 5,000,000 | 6.500 | 12/29/49 | 5,312,500 | |||||||||||
Intesa Sanpaolo SpA(f) | ||||||||||||||
| 8,000,000 | 5.017 | 06/26/24 | 8,340,000 | |||||||||||
Itau Unibanco Holding SA(d)(e) (5 Year CMT + 3.981%) | ||||||||||||||
| 500,000 | 6.125 | 12/12/49 | 514,141 | |||||||||||
JPMorgan Chase & Co.(d)(e) (3M USD LIBOR + 3.330%) | ||||||||||||||
| 4,000,000 | 6.125 | 12/29/49 | 4,375,520 | |||||||||||
Royal Bank of Scotland Group PLC | ||||||||||||||
| 2,675,000 | 3.875 | 09/12/23 | 2,793,208 | |||||||||||
| 2,975,000 | 6.000 | 12/19/23 | 3,298,079 | |||||||||||
Turkiye Vakiflar Bankasi TAO | ||||||||||||||
| 200,000 | 6.000 | 11/01/22 | 193,000 | |||||||||||
| | UBS Group Funding Switzerland AG(d)(e) (5 year USD Swap + | | ||||||||||||
| 6,000,000 | 6.875 | 12/29/49 | 6,553,620 | |||||||||||
United Bank for Africa PLC | ||||||||||||||
| 470,000 | 7.750 | 06/08/22 | 497,613 | |||||||||||
|
| |||||||||||||
| 61,138,749 | ||||||||||||||
|
| |||||||||||||
| Corporate Obligations – (continued) | ||||||||||||||
| Beverages – 0.8% | ||||||||||||||
Anadolu Efes Biracilik Ve Malt Sanayii A/S | ||||||||||||||
| 350,000 | 3.375 | 11/01/22 | 346,390 | |||||||||||
| | Anheuser-Busch Cos. LLC/Anheuser-Busch InBev Worldwide, | | ||||||||||||
| 3,000,000 | 4.700 | 02/01/36 | 3,468,840 | |||||||||||
Anheuser-Busch InBev Worldwide, Inc.(d) | ||||||||||||||
| 3,000,000 | 4.150 | 01/23/25 | 3,279,270 | |||||||||||
Central American Bottling Corp.(d) | ||||||||||||||
| 480,000 | 5.750 | 01/31/27 | 504,900 | |||||||||||
Constellation Brands, Inc.(d) | ||||||||||||||
| 2,700,000 | 3.700 | 12/06/26 | 2,890,604 | |||||||||||
Keurig Dr Pepper, Inc.(d) | ||||||||||||||
| 2,000,000 | 4.057 | 05/25/23 | 2,121,120 | |||||||||||
|
| |||||||||||||
| 12,611,124 | ||||||||||||||
|
| |||||||||||||
| Building Materials(d) – 0.7% | ||||||||||||||
BMC East LLC(f) | ||||||||||||||
| 2,750,000 | 5.500 | 10/01/24 | 2,860,000 | |||||||||||
Builders FirstSource, Inc.(f) | ||||||||||||||
| 3,482,000 | 5.625 | 09/01/24 | 3,625,632 | |||||||||||
| 1,675,000 | 6.750 | 06/01/27 | 1,809,000 | |||||||||||
Cemex SAB de CV | ||||||||||||||
| 490,000 | 5.700 | 01/11/25 | 502,679 | |||||||||||
| 230,000 | 7.750 | 04/16/26 | 247,825 | |||||||||||
Cornerstone Building Brands, Inc.(f) | ||||||||||||||
| 2,780,000 | 8.000 | 04/15/26 | 2,731,350 | |||||||||||
|
| |||||||||||||
| 11,776,486 | ||||||||||||||
|
| |||||||||||||
| Chemicals – 0.8% | ||||||||||||||
Ashland LLC(d) | ||||||||||||||
| 3,010,000 | 6.875 | 05/15/43 | 3,431,400 | |||||||||||
Ingevity Corp.(d)(f) | ||||||||||||||
| 1,225,000 | 4.500 | 02/01/26 | 1,235,719 | |||||||||||
OCI NV(d)(f) | ||||||||||||||
| 1,250,000 | 5.250 | 11/01/24 | 1,289,063 | |||||||||||
PQ Corp.(d)(f) | ||||||||||||||
| 3,400,000 | 6.750 | 11/15/22 | 3,510,500 | |||||||||||
Sasol Financing USA LLC(d) | ||||||||||||||
| 200,000 | 6.500 | 09/27/28 | 222,594 | |||||||||||
Valvoline, Inc.(d) | ||||||||||||||
| 1,950,000 | 5.500 | 07/15/24 | 2,020,687 | |||||||||||
WR Grace & Co-Conn(f) | ||||||||||||||
| 1,800,000 | 5.125 | 10/01/21 | 1,863,000 | |||||||||||
|
| |||||||||||||
| 13,572,963 | ||||||||||||||
|
| |||||||||||||
| Coal(d) – 0.0% | ||||||||||||||
Mongolian Mining Corp./Energy Resources LLC | ||||||||||||||
| 330,000 | 9.250 | 04/15/24 | 303,600 | |||||||||||
|
| |||||||||||||
| Commercial Services – 1.7% | ||||||||||||||
Avis Budget Car Rental LLC/Avis Budget Finance, Inc.(d)(f) | ||||||||||||||
| 1,750,000 | 5.750 | 07/15/27 | 1,793,750 | |||||||||||
| | GEMS MENASA Cayman Ltd./GEMS Education Delaware | | ||||||||||||
| 1,800,000 | 7.125 | 07/31/26 | 1,870,875 | |||||||||||
Global Liman Isletmeleri(d) | ||||||||||||||
| 510,000 | 8.125 | 11/14/21 | 499,003 | |||||||||||
|
| |||||||||||||
| 22 | The accompanying notes are an integral part of these financial statements. |
GOLDMAN SACHS INCOME BUILDER FUND
| Principal Amount | Interest Rate | Maturity Date | Value | |||||||||||
| Corporate Obligations – (continued) | ||||||||||||||
| Commercial Services – (continued) | ||||||||||||||
Herc Holdings, Inc.(d)(f) | ||||||||||||||
| $ | 2,610,000 | 5.500 | % | 07/15/27 | $ | 2,720,925 | ||||||||
IHS Markit Ltd.(d)(f) | ||||||||||||||
| 5,675,000 | 4.750 | 02/15/25 | 6,242,727 | |||||||||||
Nielsen Finance LLC/Nielsen Finance Co.(d)(f) | ||||||||||||||
| 5,450,000 | 5.000 | 04/15/22 | 5,470,437 | |||||||||||
Prime Security Services Borrower LLC/Prime Finance, Inc.(f) | ||||||||||||||
| 3,550,000 | 5.250 | 04/15/24 | 3,616,563 | |||||||||||
Refinitiv US Holdings, Inc.(d)(f) | ||||||||||||||
| 3,000,000 | 8.250 | 11/15/26 | 3,367,500 | |||||||||||
The Hertz Corp.(d)(f) | ||||||||||||||
| 900,000 | 7.625 | 06/01/22 | 934,875 | |||||||||||
United Rentals North America, Inc.(d) | ||||||||||||||
| 1,350,000 | 5.875 | 09/15/26 | 1,431,000 | |||||||||||
|
| |||||||||||||
| 27,947,655 | ||||||||||||||
|
| |||||||||||||
| Computers(d) – 0.9% | ||||||||||||||
Banff Merger Sub, Inc.(f) | ||||||||||||||
| 2,450,000 | 9.750 | 09/01/26 | 2,290,750 | |||||||||||
Dell International LLC/EMC Corp.(f) | ||||||||||||||
| 5,000,000 | 8.100 | 07/15/36 | 6,427,900 | |||||||||||
Hewlett Packard Enterprise Co. | ||||||||||||||
| 3,000,000 | 6.200 | 10/15/35 | 3,599,340 | |||||||||||
Western Digital Corp. | ||||||||||||||
| 3,000,000 | 4.750 | 02/15/26 | 3,067,500 | |||||||||||
|
| |||||||||||||
| 15,385,490 | ||||||||||||||
|
| |||||||||||||
| Distribution & Wholesale(d)(f) – 0.3% | ||||||||||||||
Core & Main Holdings LP(g) (PIK 9.375%, Cash 8.625%) | ||||||||||||||
| 1,550,000 | 8.625 | 09/15/24 | 1,542,250 | |||||||||||
IAA, Inc. | ||||||||||||||
| 750,000 | 5.500 | 06/15/27 | 802,500 | |||||||||||
Performance Food Group, Inc. | ||||||||||||||
| 2,150,000 | 5.500 | 06/01/24 | 2,198,375 | |||||||||||
| 1,150,000 | 5.500 | 10/15/27 | 1,220,437 | |||||||||||
|
| |||||||||||||
| 5,763,562 | ||||||||||||||
|
| |||||||||||||
| Diversified Financial Services – 3.3% | ||||||||||||||
Air Lease Corp.(d) | ||||||||||||||
| 2,750,000 | 3.750 | 06/01/26 | 2,894,251 | |||||||||||
Allied Universal Holdco LLC/Allied Universal Finance Corp.(d)(f) | ||||||||||||||
| 1,555,000 | 6.625 | 07/15/26 | 1,656,075 | |||||||||||
| 1,620,000 | 9.750 | 07/15/27 | 1,709,100 | |||||||||||
Ally Financial, Inc. | ||||||||||||||
| 4,000,000 | 8.000 | 11/01/31 | 5,560,000 | |||||||||||
Avolon Holdings Funding Ltd.(d)(f) | ||||||||||||||
| 3,450,000 | 5.250 | 05/15/24 | 3,756,360 | |||||||||||
CoBank ACB(d)(e) (3M USD LIBOR + 4.660%) | ||||||||||||||
| 5,350,000 | 6.250 | 12/29/49 | 5,739,159 | |||||||||||
Curo Group Holdings Corp.(d)(f) | ||||||||||||||
| 2,125,000 | 8.250 | 09/01/25 | 1,854,063 | |||||||||||
| | Global Aircraft Leasing Co. Ltd.(d)(f)(g) (PIK 7.250%, Cash | | ||||||||||||
| 1,750,000 | 6.500 | 09/15/24 | 1,787,188 | |||||||||||
Icahn Enterprises LP/Icahn Enterprises Finance Corp.(d) | ||||||||||||||
| 4,000,000 | 6.250 | 02/01/22 | 4,095,000 | |||||||||||
|
| |||||||||||||
| Corporate Obligations – (continued) | ||||||||||||||
| Diversified Financial Services – (continued) | ||||||||||||||
Nationstar Mortgage Holdings, Inc.(d)(f) | ||||||||||||||
| 3,050,000 | 8.125 | 07/15/23 | 3,229,187 | |||||||||||
Nationstar Mortgage LLC/Nationstar Capital Corp.(d) | ||||||||||||||
| 2,223,000 | 6.500 | 07/01/21 | 2,231,336 | |||||||||||
Navient Corp. | ||||||||||||||
| 5,000,000 | 5.875 | 03/25/21 | 5,187,500 | |||||||||||
| 3,000,000 | 5.500 | 01/25/23 | 3,120,000 | |||||||||||
Oilflow SPV 1 DAC | ||||||||||||||
| 630,000 | 12.000 | 01/13/22 | 652,995 | |||||||||||
Park Aerospace Holdings Ltd.(d)(f) | ||||||||||||||
| 2,235,000 | 5.250 | 08/15/22 | 2,382,215 | |||||||||||
Quicken Loans, Inc.(d)(f) | ||||||||||||||
| 2,000,000 | 5.750 | 05/01/25 | 2,060,720 | |||||||||||
Springleaf Finance Corp. | ||||||||||||||
| 2,600,000 | 6.125 | 05/15/22 | 2,795,000 | |||||||||||
| 3,500,000 | 7.125 | 03/15/26 | 3,994,375 | |||||||||||
| 75,000 | 6.625 | (d) | 01/15/28 | 82,969 | ||||||||||
Unifin Financiera SAB de CV(d) | ||||||||||||||
| 350,000 | 7.375 | 02/12/26 | 350,700 | |||||||||||
|
| |||||||||||||
| 55,138,193 | ||||||||||||||
|
| |||||||||||||
| Electrical – 0.8% | ||||||||||||||
Calpine Corp.(d)(f) | ||||||||||||||
| 2,000,000 | 6.000 | 01/15/22 | 2,000,000 | |||||||||||
| 3,000,000 | 5.875 | 01/15/24 | 3,056,250 | |||||||||||
Electricite de France SA(d)(e)(f) (10 year USD Swap + 3.709%) | ||||||||||||||
| 2,500,000 | 5.250 | 01/29/49 | 2,565,625 | |||||||||||
Eskom Holdings SOC Ltd. | ||||||||||||||
| 200,000 | 5.750 | 01/26/21 | 201,625 | |||||||||||
| 630,000 | 6.350 | (h) | 08/10/28 | 667,997 | ||||||||||
Listrindo Capital B.V.(d) | ||||||||||||||
| 520,000 | 4.950 | 09/14/26 | 530,075 | |||||||||||
LLPL Capital Pte Ltd. | ||||||||||||||
| 454,572 | 6.875 | 02/04/39 | 530,736 | |||||||||||
Minejesa Capital B.V. | ||||||||||||||
| 260,000 | 4.625 | 08/10/30 | 267,475 | |||||||||||
NRG Energy, Inc.(d) | ||||||||||||||
| 2,800,000 | 3.750 | (f) | 06/15/24 | 2,903,737 | ||||||||||
| 140,000 | 7.250 | 05/15/26 | 153,300 | |||||||||||
|
| |||||||||||||
| 12,876,820 | ||||||||||||||
|
| |||||||||||||
| Electronics – 0.1% | ||||||||||||||
The ADT Security Corp. | ||||||||||||||
| 1,850,000 | 4.125 | 06/15/23 | 1,884,688 | |||||||||||
|
| |||||||||||||
| Energy-Alternate Sources(d) – 0.1% | ||||||||||||||
Greenko Dutch B.V. | ||||||||||||||
| 690,000 | 5.250 | 07/24/24 | 696,469 | |||||||||||
Neerg Energy Ltd. | ||||||||||||||
| 340,000 | 6.000 | 02/13/22 | 336,175 | |||||||||||
|
| |||||||||||||
| 1,032,644 | ||||||||||||||
|
| |||||||||||||
| Engineering & Construction – 0.1% | ||||||||||||||
Aeropuertos Dominicanos Siglo XXI SA(d) | ||||||||||||||
| 630,000 | 6.750 | 03/30/29 | 670,950 | |||||||||||
GMR Hyderabad International Airport Ltd. | ||||||||||||||
| 660,000 | 5.375 | 04/10/24 | 682,275 | |||||||||||
|
| |||||||||||||
| The accompanying notes are an integral part of these financial statements. | 23 |
GOLDMAN SACHS INCOME BUILDER FUND
Schedule of Investments(continued)
October 31, 2019
| Principal Amount | Interest Rate | Maturity Date | Value | |||||||||||
| Corporate Obligations – (continued) | ||||||||||||||
| Engineering & Construction – (continued) | ||||||||||||||
IHS Netherlands Holdco B.V.(d)(f) | ||||||||||||||
| $ | 200,000 | 7.125 | % | 03/18/25 | $ | 206,180 | ||||||||
|
| |||||||||||||
| 1,559,405 | ||||||||||||||
|
| |||||||||||||
| Entertainment(d)(f) – 0.3% | ||||||||||||||
Motion Bondco DAC | ||||||||||||||
| 3,250,000 | 6.625 | 11/15/27 | 3,310,937 | |||||||||||
Scientific Games International, Inc. | ||||||||||||||
| 1,000,000 | 5.000 | 10/15/25 | 1,027,500 | |||||||||||
| 1,350,000 | 8.250 | 03/15/26 | 1,427,625 | |||||||||||
|
| |||||||||||||
| 5,766,062 | ||||||||||||||
|
| |||||||||||||
| Environmental(d)(f) – 0.2% | ||||||||||||||
GFL Environmental, Inc. | ||||||||||||||
| 1,430,000 | 8.500 | 05/01/27 | 1,573,000 | |||||||||||
Stericycle, Inc. | ||||||||||||||
| 1,950,000 | 5.375 | 07/15/24 | 2,031,725 | |||||||||||
|
| |||||||||||||
| 3,604,725 | ||||||||||||||
|
| |||||||||||||
| Exploration and Production(d) – 0.0% | ||||||||||||||
Compania General Combust | ||||||||||||||
| 590,000 | 9.500 | 11/07/21 | 454,300 | |||||||||||
|
| |||||||||||||
| Food & Drug Retailing(d) – 0.8% | ||||||||||||||
| | Albertsons Cos., Inc./Safeway, Inc./New Albertsons | | ||||||||||||
| 1,995,000 | 5.875 | 02/15/28 | 2,142,131 | |||||||||||
Arcor SAIC | ||||||||||||||
| 110,000 | 6.000 | 07/06/23 | 98,416 | |||||||||||
B&G Foods, Inc. | ||||||||||||||
| 4,020,000 | 5.250 | 04/01/25 | 4,105,425 | |||||||||||
Post Holdings, Inc.(f) | ||||||||||||||
| 6,000,000 | 5.500 | 03/01/25 | 6,277,500 | |||||||||||
|
| |||||||||||||
| 12,623,472 | ||||||||||||||
|
| |||||||||||||
| Forest Products & Paper(d)(f) – 0.1% | ||||||||||||||
Mercer International, Inc. | ||||||||||||||
| 1,850,000 | 7.375 | 01/15/25 | 1,910,125 | |||||||||||
|
| |||||||||||||
| Gas(d) – 0.3% | ||||||||||||||
AmeriGas Partners LP/AmeriGas Finance Corp. | ||||||||||||||
| 4,125,000 | 5.875 | 08/20/26 | 4,568,438 | |||||||||||
|
| |||||||||||||
| Health Care Products(d) – 0.4% | ||||||||||||||
Becton Dickinson & Co. | ||||||||||||||
| 2,000,000 | 2.894 | 06/06/22 | 2,038,640 | |||||||||||
| 3,375,000 | 3.363 | 06/06/24 | 3,536,966 | |||||||||||
Hill-Rom Holdings, Inc.(f) | ||||||||||||||
| 400,000 | 4.375 | 09/15/27 | 411,000 | |||||||||||
|
| |||||||||||||
| 5,986,606 | ||||||||||||||
|
| |||||||||||||
| Healthcare Providers & Services – 2.3% | ||||||||||||||
Acadia Healthcare Co., Inc.(d) | ||||||||||||||
| 2,100,000 | 6.500 | 03/01/24 | 2,178,750 | |||||||||||
Charles River Laboratories International, Inc.(d)(f) | ||||||||||||||
| 650,000 | 4.250 | 05/01/28 | 660,563 | |||||||||||
CHS/Community Health Systems, Inc.(d) | ||||||||||||||
| 3,000,000 | 6.250 | 03/31/23 | 2,925,000 | |||||||||||
|
| |||||||||||||
| Corporate Obligations – (continued) | ||||||||||||||
| Healthcare Providers & Services – (continued) | ||||||||||||||
Encompass Health Corp.(d) | ||||||||||||||
| 1,200,000 | 4.500 | 02/01/28 | 1,224,000 | |||||||||||
HCA, Inc. | ||||||||||||||
| 3,000,000 | 4.750 | 05/01/23 | 3,212,160 | |||||||||||
| 12,000,000 | 5.000 | 03/15/24 | 13,080,000 | |||||||||||
| 250,000 | 5.875 | (d) | 02/15/26 | 280,625 | ||||||||||
MEDNAX, Inc.(d)(f) | ||||||||||||||
| 3,650,000 | 5.250 | 12/01/23 | 3,706,611 | |||||||||||
Tenet Healthcare Corp. | ||||||||||||||
| 5,600,000 | 8.125 | 04/01/22 | 6,062,000 | |||||||||||
| 2,000,000 | 6.250 | (d)(f) | 02/01/27 | 2,115,000 | ||||||||||
Universal Health Services, Inc.(d)(f) | ||||||||||||||
| 2,650,000 | 5.000 | 06/01/26 | 2,778,710 | |||||||||||
|
| |||||||||||||
| 38,223,419 | ||||||||||||||
|
| |||||||||||||
| Holding Companies-Diversified(d) – 0.0% | ||||||||||||||
KOC Holding A/S | ||||||||||||||
| 700,000 | 6.500 | 03/11/25 | 729,313 | |||||||||||
|
| |||||||||||||
| Home Builders – 0.5% | ||||||||||||||
Installed Building Products, Inc.(d)(f) | ||||||||||||||
| 800,000 | 5.750 | 02/01/28 | 840,000 | |||||||||||
Lennar Corp.(d) | ||||||||||||||
| 1,825,000 | 4.125 | 01/15/22 | 1,868,344 | |||||||||||
PulteGroup, Inc. | ||||||||||||||
| 3,000,000 | 7.875 | 06/15/32 | 3,810,000 | |||||||||||
Williams Scotsman International, Inc.(d)(f) | ||||||||||||||
| 1,350,000 | 6.875 | 08/15/23 | 1,417,500 | |||||||||||
|
| |||||||||||||
| 7,935,844 | ||||||||||||||
|
| |||||||||||||
| Household Products(d) – 0.0% | ||||||||||||||
Spectrum Brands, Inc. | ||||||||||||||
| 700,000 | 5.750 | 07/15/25 | 729,750 | |||||||||||
|
| |||||||||||||
| Housewares(d) – 0.0% | ||||||||||||||
Turkiye Sise ve Cam Fabrikalari A/S | ||||||||||||||
| 530,000 | 6.950 | 03/14/26 | 550,869 | |||||||||||
|
| |||||||||||||
| Insurance – 0.4% | ||||||||||||||
Fidelity & Guaranty Life Holdings, Inc.(d)(f) | ||||||||||||||
| 2,850,000 | 5.500 | 05/01/25 | 3,049,500 | |||||||||||
Fortune Star BVI Ltd.(d) | ||||||||||||||
| 340,000 | 5.250 | 03/23/22 | 338,725 | |||||||||||
HUB International Ltd.(d)(f) | ||||||||||||||
| 1,760,000 | 7.000 | 05/01/26 | 1,810,600 | |||||||||||
Transatlantic Holdings, Inc. | ||||||||||||||
| 75,000 | 8.000 | 11/30/39 | 111,455 | |||||||||||
USI, Inc.(d)(f) | ||||||||||||||
| 1,850,000 | 6.875 | 05/01/25 | 1,882,375 | |||||||||||
|
| |||||||||||||
| 7,192,655 | ||||||||||||||
|
| |||||||||||||
| Internet – 1.2% | ||||||||||||||
21Vianet Group, Inc. | ||||||||||||||
| 400,000 | 7.875 | 10/15/21 | 405,007 | |||||||||||
Getty Images, Inc.(d)(f) | ||||||||||||||
| 250,000 | 9.750 | 03/01/27 | 250,625 | |||||||||||
Go Daddy Operating Co. LLC/GD Finance Co., Inc.(d)(f) | ||||||||||||||
| 1,305,000 | 5.250 | 12/01/27 | 1,383,300 | |||||||||||
|
| |||||||||||||
| 24 | The accompanying notes are an integral part of these financial statements. |
GOLDMAN SACHS INCOME BUILDER FUND
| Principal Amount | Interest Rate | Maturity Date | Value | |||||||||||
| Corporate Obligations – (continued) | ||||||||||||||
| Internet – (continued) | ||||||||||||||
GrubHub Holdings, Inc.(d)(f) | ||||||||||||||
| $ | 1,650,000 | 5.500 | % | 07/01/27 | $ | 1,546,875 | ||||||||
Netflix, Inc. | ||||||||||||||
| 5,600,000 | 5.875 | 02/15/25 | 6,181,000 | |||||||||||
Symantec Corp.(d)(f) | ||||||||||||||
| 4,000,000 | 5.000 | 04/15/25 | 4,100,000 | |||||||||||
Uber Technologies, Inc.(d)(f) | ||||||||||||||
| 2,100,000 | 7.500 | 11/01/23 | 2,136,750 | |||||||||||
VeriSign, Inc.(d) | ||||||||||||||
| 4,000,000 | 5.250 | 04/01/25 | 4,370,000 | |||||||||||
|
| |||||||||||||
| 20,373,557 | ||||||||||||||
|
| |||||||||||||
| Iron/Steel – 0.2% | ||||||||||||||
ABJA Investment Co. Pte Ltd. | ||||||||||||||
| 650,000 | 5.950 | 07/31/24 | 681,891 | |||||||||||
Cleveland-Cliffs, Inc.(d) | ||||||||||||||
| 1,038,000 | 5.750 | 03/01/25 | 1,025,025 | |||||||||||
| 2,250,000 | 5.875 | (f) | 06/01/27 | 2,137,500 | ||||||||||
Vale Overseas Ltd. | ||||||||||||||
| 300,000 | 6.250 | 08/10/26 | 349,740 | |||||||||||
|
| |||||||||||||
| 4,194,156 | ||||||||||||||
|
| |||||||||||||
| Lodging – 0.5% | ||||||||||||||
MGM Resorts International | ||||||||||||||
| 8,000,000 | 6.750 | 10/01/20 | 8,290,000 | |||||||||||
|
| |||||||||||||
| Media – 5.2% | ||||||||||||||
Altice Financing SA(d) | ||||||||||||||
| 6,000,000 | 6.625 | (f) | 02/15/23 | 6,165,000 | ||||||||||
| 200,000 | 7.500 | 05/15/26 | 212,250 | |||||||||||
Altice Finco SA(d)(f) | ||||||||||||||
| 2,000,000 | 8.125 | 01/15/24 | 2,062,500 | |||||||||||
AMC Networks, Inc.(d) | ||||||||||||||
| 1,800,000 | 4.750 | 08/01/25 | 1,818,000 | |||||||||||
CCO Holdings LLC/CCO Holdings Capital Corp.(d)(f) | ||||||||||||||
| 3,000,000 | 5.875 | 05/01/27 | 3,180,000 | |||||||||||
| | Charter Communications Operating LLC/Charter | | ||||||||||||
| 12,000,000 | 6.384 | 10/23/35 | 14,738,160 | |||||||||||
Clear Channel Worldwide Holdings, Inc.(d)(f) | ||||||||||||||
| 383,000 | 9.250 | 02/15/24 | 421,300 | |||||||||||
CSC Holdings LLC | ||||||||||||||
| 985,000 | 5.250 | 06/01/24 | 1,061,338 | |||||||||||
| 5,450,000 | 5.500 | (d)(f) | 05/15/26 | 5,749,750 | ||||||||||
Cumulus Media New Holdings, Inc.(d)(f) | ||||||||||||||
| 2,680,000 | 6.750 | 07/01/26 | 2,840,800 | |||||||||||
Diamond Sports Group LLC/Diamond Sports Finance Co.(d)(f) | ||||||||||||||
| 1,590,000 | 5.375 | 08/15/26 | 1,661,550 | |||||||||||
| 3,345,000 | 6.625 | 08/15/27 | 3,449,531 | |||||||||||
DISH DBS Corp. | ||||||||||||||
| 6,300,000 | 5.875 | 07/15/22 | 6,583,500 | |||||||||||
Entercom Media Corp.(d)(f) | ||||||||||||||
| 2,300,000 | 7.250 | 11/01/24 | 2,397,750 | |||||||||||
| 3,050,000 | 6.500 | 05/01/27 | 3,194,875 | |||||||||||
Gray Television, Inc.(d)(f) | ||||||||||||||
| 2,125,000 | 7.000 | 05/15/27 | 2,324,219 | |||||||||||
|
| |||||||||||||
| Corporate Obligations – (continued) | ||||||||||||||
| Media – (continued) | ||||||||||||||
iHeartCommunications, Inc.(d)(f) | ||||||||||||||
| 1,450,000 | 5.250 | 08/15/27 | 1,497,125 | |||||||||||
Meredith Corp.(d) | ||||||||||||||
| 10,000 | 6.875 | 02/01/26 | 10,325 | |||||||||||
Nexstar Broadcasting, Inc.(d)(f) | ||||||||||||||
| 1,500,000 | 5.625 | 07/15/27 | 1,578,750 | |||||||||||
Scripps Escrow, Inc.(d)(f) | ||||||||||||||
| 1,050,000 | 5.875 | 07/15/27 | 1,076,250 | |||||||||||
Sirius XM Radio, Inc.(d)(f) | ||||||||||||||
| 1,085,000 | 4.625 | 07/15/24 | 1,131,112 | |||||||||||
The E.W. Scripps Co.(d)(f) | ||||||||||||||
| 1,875,000 | 5.125 | 05/15/25 | 1,903,125 | |||||||||||
UPCB Finance IV Ltd.(d)(f) | ||||||||||||||
| 8,000,000 | 5.375 | 01/15/25 | 8,250,000 | |||||||||||
Videotron Ltd.(d)(f) | ||||||||||||||
| 5,125,000 | 5.375 | 06/15/24 | 5,560,625 | |||||||||||
Virgin Media Secured Finance PLC(d) | ||||||||||||||
| GBP | 4,000,000 | 4.875 | 01/15/27 | 5,361,092 | ||||||||||
Ziggo Bond Co. B.V.(d)(f) | ||||||||||||||
| $ | 3,000,000 | 5.875 | 01/15/25 | 3,082,500 | ||||||||||
|
| |||||||||||||
| 87,311,427 | ||||||||||||||
|
| |||||||||||||
| Mining – 1.3% | ||||||||||||||
Constellium SE(d)(f) | ||||||||||||||
| 2,100,000 | 5.875 | 02/15/26 | 2,194,500 | |||||||||||
First Quantum Minerals Ltd.(d)(f) | ||||||||||||||
| 4,000,000 | 7.250 | 04/01/23 | 4,021,360 | |||||||||||
FMG Resources August 2006 Pty Ltd.(d)(f) | ||||||||||||||
| 4,675,000 | 4.750 | 05/15/22 | 4,821,094 | |||||||||||
Freeport-McMoRan, Inc.(d) | ||||||||||||||
| 2,950,000 | 3.875 | 03/15/23 | 2,994,250 | |||||||||||
| 2,000,000 | 5.400 | 11/14/34 | 1,952,500 | |||||||||||
Glencore Finance Canada Ltd.(f) | ||||||||||||||
| 3,000,000 | 5.550 | 10/25/42 | 3,240,570 | |||||||||||
Novelis Corp.(d)(f) | ||||||||||||||
| 2,100,000 | 5.875 | 09/30/26 | 2,210,250 | |||||||||||
Vedanta Resources Finance II PLC(d)(f) | ||||||||||||||
| 200,000 | 9.250 | 04/23/26 | 199,250 | |||||||||||
|
| |||||||||||||
| 21,633,774 | ||||||||||||||
|
| |||||||||||||
| Oil Field Services – 1.6% | ||||||||||||||
Antero Resources Corp.(d) | ||||||||||||||
| 6,500,000 | 5.125 | 12/01/22 | 4,875,000 | |||||||||||
Chesapeake Energy Corp. | ||||||||||||||
| 525,000 | 8.000 | (d) | 01/15/25 | 346,500 | ||||||||||
| 2,000,000 | 5.500 | 09/15/26 | 1,120,318 | |||||||||||
DNO ASA(d)(f) | ||||||||||||||
| 500,000 | 8.375 | 05/29/24 | 496,900 | |||||||||||
Ensign Drilling, Inc.(d)(f) | ||||||||||||||
| 1,400,000 | 9.250 | 04/15/24 | 1,211,000 | |||||||||||
Geopark Ltd.(d) | ||||||||||||||
| 330,000 | 6.500 | 09/21/24 | 340,003 | |||||||||||
Gulfport Energy Corp.(d) | ||||||||||||||
| 3,200,000 | 6.375 | 01/15/26 | 1,920,000 | |||||||||||
Kosmos Energy Ltd.(d) | ||||||||||||||
| 500,000 | 7.125 | 04/04/26 | 521,406 | |||||||||||
|
| |||||||||||||
| The accompanying notes are an integral part of these financial statements. | 25 |
GOLDMAN SACHS INCOME BUILDER FUND
Schedule of Investments(continued)
October 31, 2019
| Principal Amount | Interest Rate | Maturity Date | Value | |||||||||||
| Corporate Obligations – (continued) | ||||||||||||||
| Oil Field Services – (continued) | ||||||||||||||
Laredo Petroleum, Inc.(d) | ||||||||||||||
| $ | 2,300,000 | 5.625 | % | 01/15/22 | $ | 2,185,000 | ||||||||
Matador Resources Co.(d) | ||||||||||||||
| 3,000,000 | 5.875 | 09/15/26 | 2,880,000 | |||||||||||
MEG Energy Corp.(d)(f) | ||||||||||||||
| 1,425,000 | 6.375 | 01/30/23 | 1,357,312 | |||||||||||
Nexen, Inc. | ||||||||||||||
| 5,000 | 6.400 | 05/15/37 | 6,995 | |||||||||||
| 50,000 | 7.500 | 07/30/39 | 79,547 | |||||||||||
Nine Energy Service, Inc.(d)(f) | ||||||||||||||
| 1,450,000 | 8.750 | 11/01/23 | 1,094,750 | |||||||||||
Noble Holding International Ltd.(d) | ||||||||||||||
| 840,000 | 7.750 | 01/15/24 | 520,800 | |||||||||||
| 1,975,000 | 7.875 | (f) | 02/01/26 | 1,352,875 | ||||||||||
Petrobras Global Finance B.V.(i) | ||||||||||||||
| 500,000 | 6.850 | 06/05/15 | 573,400 | |||||||||||
Petroleos Mexicanos | ||||||||||||||
| EUR | 220,000 | 2.500 | 08/21/21 | 251,500 | ||||||||||
| $ | 80,000 | 6.490 | (d)(f) | 01/23/27 | 85,240 | |||||||||
Range Resources Corp.(d) | ||||||||||||||
| 2,250,000 | 5.875 | 07/01/22 | 2,137,500 | |||||||||||
Sunoco LP/Sunoco Finance Corp.(d) | ||||||||||||||
| 545,000 | 5.500 | 02/15/26 | 565,438 | |||||||||||
Tecpetrol SA(d) | ||||||||||||||
| 770,000 | 4.875 | 12/12/22 | 710,205 | |||||||||||
Tullow Oil PLC(d) | ||||||||||||||
| 330,000 | 7.000 | 03/01/25 | 339,075 | |||||||||||
| | USA Compression Partners LP/USA Compression Finance | | ||||||||||||
| 1,300,000 | 6.875 | 04/01/26 | 1,304,875 | |||||||||||
Whiting Petroleum Corp. | ||||||||||||||
| 427,000 | 1.250 | 04/01/20 | 419,704 | |||||||||||
|
| |||||||||||||
| 26,695,343 | ||||||||||||||
|
| |||||||||||||
| Packaging(f) – 1.4% | ||||||||||||||
Ardagh Packaging Finance PLC/Ardagh Holdings USA, Inc.(d) | ||||||||||||||
| 6,000,000 | 6.000 | 02/15/25 | 6,292,500 | |||||||||||
| 650,000 | 5.250 | 08/15/27 | 663,000 | |||||||||||
Berry Global, Inc.(d) | ||||||||||||||
| 2,200,000 | 4.500 | 02/15/26 | 2,211,000 | |||||||||||
| 2,000,000 | 5.625 | 07/15/27 | 2,120,000 | |||||||||||
LABL Escrow Issuer LLC(d) | ||||||||||||||
| 1,750,000 | 6.750 | 07/15/26 | 1,815,625 | |||||||||||
Mauser Packaging Solutions Holding Co.(d) | ||||||||||||||
| 2,150,000 | 5.500 | 04/15/24 | 2,211,812 | |||||||||||
| 965,000 | 7.250 | 04/15/25 | 920,369 | |||||||||||
Owens-Brockway Glass Container, Inc. | ||||||||||||||
| 1,750,000 | 5.875 | 08/15/23 | 1,846,250 | |||||||||||
| | Reynolds Group Issuer, Inc./Reynolds Group Issuer | | ||||||||||||
| 190,000 | 7.000 | 07/15/24 | 196,650 | |||||||||||
Sealed Air Corp.(d) | ||||||||||||||
| 2,000,000 | 5.250 | 04/01/23 | 2,135,000 | |||||||||||
Trivium Packaging Finance B.V.(d) | ||||||||||||||
| 1,075,000 | 5.500 | 08/15/26 | 1,124,719 | |||||||||||
| 1,300,000 | 8.500 | 08/15/27 | 1,382,875 | |||||||||||
|
| |||||||||||||
| 22,919,800 | ||||||||||||||
|
| |||||||||||||
| Corporate Obligations – (continued) | ||||||||||||||
| Pharmaceuticals(d) – 0.9% | ||||||||||||||
Bausch Health Cos., Inc.(f) | ||||||||||||||
| 453,000 | 5.875 | 05/15/23 | 459,229 | |||||||||||
| 4,000,000 | 9.000 | 12/15/25 | 4,500,000 | |||||||||||
CVS Health Corp. | ||||||||||||||
| 2,775,000 | 3.700 | 03/09/23 | 2,890,631 | |||||||||||
HLF Financing S.a.r.l. LLC/Herbalife International, Inc.(f) | ||||||||||||||
| 2,745,000 | 7.250 | 08/15/26 | 2,868,525 | |||||||||||
Mylan NV | ||||||||||||||
| 3,000,000 | 3.950 | 06/15/26 | 3,114,990 | |||||||||||
Vizient, Inc.(f) | ||||||||||||||
| 580,000 | 6.250 | 05/15/27 | 626,400 | |||||||||||
|
| |||||||||||||
| 14,459,775 | ||||||||||||||
|
| |||||||||||||
| Pipelines – 3.0% | ||||||||||||||
Buckeye Partners LP(d) | ||||||||||||||
| 1,025,000 | 4.350 | 10/15/24 | 1,027,634 | |||||||||||
| 2,331,000 | 3.950 | 12/01/26 | 2,157,364 | |||||||||||
| 929,000 | 4.125 | 12/01/27 | 856,566 | |||||||||||
Cheniere Energy Partners LP(d)(f) | ||||||||||||||
| 1,800,000 | 4.500 | 10/01/29 | 1,836,000 | |||||||||||
DCP Midstream Operating LP(f) | ||||||||||||||
| 4,000,000 | 6.750 | 09/15/37 | 4,140,000 | |||||||||||
Energy Transfer Operating LP | ||||||||||||||
| 4,000,000 | 4.250 | (d) | 03/15/23 | 4,205,568 | ||||||||||
| 2,985,000 | 6.625 | 10/15/36 | 3,603,761 | |||||||||||
| | Enterprise Products Operating LLC(d)(e) (3M USD LIBOR + | | ||||||||||||
| 1,000,000 | 4.909 | 06/01/67 | 923,730 | |||||||||||
Genesis Energy LP/Genesis Energy Finance Corp.(d) | ||||||||||||||
| 3,500,000 | 6.000 | 05/15/23 | 3,403,750 | |||||||||||
Kinder Morgan Energy Partners LP | ||||||||||||||
| 7,000,000 | 7.300 | 08/15/33 | 9,312,660 | |||||||||||
NGPL PipeCo LLC(d)(f) | ||||||||||||||
| 1,315,000 | 4.375 | 08/15/22 | 1,361,025 | |||||||||||
Plains All American Pipeline LP/PAA Finance Corp.(d) | ||||||||||||||
| 3,000,000 | 3.600 | 11/01/24 | 3,072,360 | |||||||||||
| | Targa Resources Partners LP/Targa Resources Partners Finance | | ||||||||||||
| 5,000,000 | 5.125 | 02/01/25 | 5,125,000 | |||||||||||
The Williams Cos., Inc. | ||||||||||||||
| 7,000,000 | 7.500 | 01/15/31 | 9,038,029 | |||||||||||
|
| |||||||||||||
| 50,063,447 | ||||||||||||||
|
| |||||||||||||
| Real Estate Investment Trust – 3.2% | ||||||||||||||
American Tower Corp. | ||||||||||||||
| 2,250,000 | 5.000 | 02/15/24 | 2,492,302 | |||||||||||
| | Brookfield Property REIT, Inc./BPR Cumulus LLC/BPR Nimbus | | ||||||||||||
| 600,000 | 5.750 | 05/15/26 | 624,265 | |||||||||||
Country Garden Holdings Co. Ltd.(d) | ||||||||||||||
| 650,000 | 6.500 | 04/08/24 | 690,625 | |||||||||||
Crown Castle International Corp. | ||||||||||||||
| 2,250,000 | 5.250 | 01/15/23 | 2,453,996 | |||||||||||
Equinix, Inc.(d) | ||||||||||||||
| 3,000,000 | 5.375 | 04/01/23 | 3,063,750 | |||||||||||
| 8,000,000 | 5.750 | 01/01/25 | 8,270,000 | |||||||||||
|
| |||||||||||||
| 26 | The accompanying notes are an integral part of these financial statements. |
GOLDMAN SACHS INCOME BUILDER FUND
| Principal Amount | Interest Rate | Maturity Date | Value | |||||||||||
| Corporate Obligations – (continued) | ||||||||||||||
| Real Estate Investment Trust – (continued) | ||||||||||||||
Growthpoint Properties International Pty Ltd. | ||||||||||||||
| $ | 470,000 | 5.872 | % | 05/02/23 | $ | 503,135 | ||||||||
IRSA Propiedades Comerciales SA(d) | ||||||||||||||
| 540,000 | 8.750 | 03/23/23 | 434,025 | |||||||||||
Kaisa Group Holdings Ltd. | ||||||||||||||
| 320,000 | 11.750 | 02/26/21 | 332,700 | |||||||||||
| | Ladder Capital Finance Holdings LLLP/Ladder Capital Finance | | ||||||||||||
| 2,500,000 | 5.875 | 08/01/21 | 2,534,375 | |||||||||||
| 4,000,000 | 5.250 | 03/15/22 | 4,140,000 | |||||||||||
MPT Operating Partnership LP/MPT Finance Corp.(d) | ||||||||||||||
| 4,000,000 | 6.375 | 03/01/24 | 4,194,200 | |||||||||||
| 3,000,000 | 5.000 | 10/15/27 | 3,172,500 | |||||||||||
NE Property B.V.(d) | ||||||||||||||
| EUR | 470,000 | 1.750 | 11/23/24 | 529,816 | ||||||||||
Realogy Group LLC/Realogy Co-Issuer Corp.(d)(f) | ||||||||||||||
| $ | 350,000 | 4.875 | 06/01/23 | 340,375 | ||||||||||
| 1,950,000 | 9.375 | 04/01/27 | 1,915,875 | |||||||||||
SBA Communications Corp.(d) | ||||||||||||||
| 15,016,000 | 4.875 | 07/15/22 | 15,203,700 | |||||||||||
Scenery Journey Ltd.(d) | ||||||||||||||
| 310,000 | 13.000 | 11/06/22 | 311,712 | |||||||||||
Starwood Property Trust, Inc.(d) | ||||||||||||||
| 2,700,000 | 4.750 | 03/15/25 | 2,797,875 | |||||||||||
Theta Capital Pte Ltd.(d) | ||||||||||||||
| 340,000 | 7.000 | 04/11/22 | 340,850 | |||||||||||
|
| |||||||||||||
| 54,346,076 | ||||||||||||||
|
| |||||||||||||
| Retailing – 1.1% | ||||||||||||||
1011778 BC ULC/New Red Finance, Inc.(d)(f) | ||||||||||||||
| 3,000,000 | 5.000 | 10/15/25 | 3,097,500 | |||||||||||
eG Global Finance PLC(d)(f) | ||||||||||||||
| 3,800,000 | 6.750 | 02/07/25 | 3,795,250 | |||||||||||
Eurotorg LLC Via Bonitron DAC | ||||||||||||||
| 410,000 | 8.750 | 10/30/22 | 441,262 | |||||||||||
IRB Holding Corp.(d)(f) | ||||||||||||||
| 2,710,000 | 6.750 | 02/15/26 | 2,757,425 | |||||||||||
L Brands, Inc. | ||||||||||||||
| 3,000,000 | 6.875 | 11/01/35 | 2,535,000 | |||||||||||
PetSmart, Inc.(d)(f) | ||||||||||||||
| 2,800,000 | 5.875 | 06/01/25 | 2,758,000 | |||||||||||
Staples, Inc.(d)(f) | ||||||||||||||
| 2,150,000 | 7.500 | 04/15/26 | 2,241,375 | |||||||||||
Suburban Propane Partners LP/Suburban Energy Finance Corp.(d) | ||||||||||||||
| 550,000 | 5.500 | 06/01/24 | 562,375 | |||||||||||
|
| |||||||||||||
| 18,188,187 | ||||||||||||||
|
| |||||||||||||
| Semiconductors – 0.7% | ||||||||||||||
Amkor Technology, Inc.(d)(f) | ||||||||||||||
| 850,000 | 6.625 | 09/15/27 | 930,750 | |||||||||||
Broadcom Corp./Broadcom Cayman Finance Ltd. | ||||||||||||||
| 2,000,000 | 2.375 | 01/15/20 | 2,000,720 | |||||||||||
Broadcom, Inc.(d)(f) | ||||||||||||||
| 4,000,000 | 3.625 | 10/15/24 | 4,108,880 | |||||||||||
Microchip Technology, Inc. | ||||||||||||||
| 2,000,000 | 3.922 | 06/01/21 | 2,046,960 | |||||||||||
|
| |||||||||||||
| Corporate Obligations – (continued) | ||||||||||||||
| Semiconductors – (continued) | ||||||||||||||
NXP B.V./NXP Funding LLC(f) | ||||||||||||||
| 3,000,000 | 4.125 | 06/01/21 | 3,084,030 | |||||||||||
|
| |||||||||||||
| 12,171,340 | ||||||||||||||
|
| |||||||||||||
| Software(d) – 0.6% | ||||||||||||||
Camelot Finance SA(f) | ||||||||||||||
| 2,250,000 | 4.500 | 11/01/26 | 2,272,500 | |||||||||||
Fiserv, Inc. | ||||||||||||||
| 2,775,000 | 3.200 | 07/01/26 | 2,899,442 | |||||||||||
Nuance Communications, Inc. | ||||||||||||||
| 3,000,000 | 5.625 | 12/15/26 | 3,187,500 | |||||||||||
SS&C Technologies, Inc.(f) | ||||||||||||||
| 850,000 | 5.500 | 09/30/27 | 906,313 | |||||||||||
|
| |||||||||||||
| 9,265,755 | ||||||||||||||
|
| |||||||||||||
| Telecommunication Services – 5.1% | ||||||||||||||
Altice France SA(d)(f) | ||||||||||||||
| 5,000,000 | 7.375 | 05/01/26 | 5,356,250 | |||||||||||
AT&T, Inc.(d) | ||||||||||||||
| 3,000,000 | 5.250 | 03/01/37 | 3,536,070 | |||||||||||
CenturyLink, Inc. | ||||||||||||||
| 5,000,000 | 6.450 | 06/15/21 | 5,262,500 | |||||||||||
CommScope, Inc.(d)(f) | ||||||||||||||
| 2,000,000 | 5.500 | 06/15/24 | 1,892,500 | |||||||||||
| 1,100,000 | 6.000 | 03/01/26 | 1,128,875 | |||||||||||
| 250,000 | 8.250 | 03/01/27 | 236,250 | |||||||||||
Connect Finco S.A.R.L./Connect US Finco LLC(d)(f) | ||||||||||||||
| 3,500,000 | 6.750 | 10/01/26 | 3,661,875 | |||||||||||
Digicel Group One Ltd.(d)(f) | ||||||||||||||
| 1,955,000 | 8.250 | 12/30/22 | 1,145,508 | |||||||||||
Digicel Group Two Ltd.(d)(f) | ||||||||||||||
| 1,845,000 | 8.250 | 09/30/22 | 461,250 | |||||||||||
Frontier Communications Corp.(d) | ||||||||||||||
| 6,000,000 | 11.000 | 09/15/25 | 2,820,000 | |||||||||||
| 1,250,000 | 8.500 | (f) | 04/01/26 | 1,250,000 | ||||||||||
Intelsat Jackson Holdings SA(d)(f) | ||||||||||||||
| 4,800,000 | 8.000 | 02/15/24 | 4,944,000 | |||||||||||
| 3,000,000 | 8.500 | 10/15/24 | 3,026,250 | |||||||||||
MTN Mauritius Investments Ltd. | ||||||||||||||
| 620,000 | 6.500 | 10/13/26 | 684,519 | |||||||||||
Nokia of America Corp. | ||||||||||||||
| 3,000,000 | 6.450 | 03/15/29 | 3,105,000 | |||||||||||
Qwest Corp. | ||||||||||||||
| 4,780,000 | 6.750 | 12/01/21 | 5,154,503 | |||||||||||
SoftBank Group Corp.(d) | ||||||||||||||
| 3,550,000 | 4.750 | 09/19/24 | 3,598,812 | |||||||||||
| 1,575,000 | 6.125 | 04/20/25 | 1,675,391 | |||||||||||
Sprint Corp. | ||||||||||||||
| 10,039,000 | 7.875 | 09/15/23 | 11,093,095 | |||||||||||
T-Mobile USA, Inc.(d) | ||||||||||||||
| 3,000,000 | 4.000 | 04/15/22 | 3,078,750 | |||||||||||
| 6,000,000 | 6.500 | 01/15/26 | 6,442,500 | |||||||||||
Telecom Argentina SA(d) | ||||||||||||||
| 340,000 | 6.500 | 06/15/21 | 320,875 | |||||||||||
| 310,000 | 8.000 | (f) | 07/18/26 | 277,353 | ||||||||||
Telecom Italia Capital SA | ||||||||||||||
| 4,000,000 | 7.721 | 06/04/38 | 4,875,000 | |||||||||||
|
| |||||||||||||
| The accompanying notes are an integral part of these financial statements. | 27 |
GOLDMAN SACHS INCOME BUILDER FUND
Schedule of Investments(continued)
October 31, 2019
| Principal Amount | Interest Rate | Maturity Date | Value | |||||||||||
| Corporate Obligations – (continued) | ||||||||||||||
| Telecommunication Services – (continued) | ||||||||||||||
Telecom Italia SpA(f) | ||||||||||||||
| $ | 5,000,000 | 5.303 | % | 05/30/24 | $ | 5,386,575 | ||||||||
Telesat Canada/Telesat LLC(d)(f) | ||||||||||||||
| 575,000 | 6.500 | 10/15/27 | 598,967 | |||||||||||
Verizon Communications, Inc. | ||||||||||||||
| 3,000,000 | 5.250 | 03/16/37 | 3,764,610 | |||||||||||
|
| |||||||||||||
| 84,777,278 | ||||||||||||||
|
| |||||||||||||
| Toys/Games/Hobbies(d) – 0.1% | ||||||||||||||
Mattel, Inc. | ||||||||||||||
| 2,475,000 | 3.150 | 03/15/23 | 2,360,531 | |||||||||||
|
| |||||||||||||
| Transportation – 0.1% | ||||||||||||||
Mexico City Airport Trust(d) | ||||||||||||||
| 520,000 | 5.500 | 10/31/46 | 522,438 | |||||||||||
MV24 Capital B.V.(f) | ||||||||||||||
| 340,000 | 6.748 | 06/01/34 | 355,300 | |||||||||||
Rumo Luxembourg S.a.r.l.(d) | ||||||||||||||
| 240,000 | 5.875 | 01/18/25 | 254,850 | |||||||||||
|
| |||||||||||||
| 1,132,588 | ||||||||||||||
|
| |||||||||||||
| TOTAL CORPORATE OBLIGATIONS | ||||||||||||||
| (Cost $761,026,792) | $ | 785,074,093 | ||||||||||||
|
| |||||||||||||
| Mortgage-Backed Obligations(e) – 0.0% | ||||||||||||||
| Collateralized Mortgage Obligations – 0.0% | ||||||||||||||
| Sequential Floating Rate – 0.0% | ||||||||||||||
| | JPMorgan Alternative LoanTrust Series 2005-A2, Class 1A1 | | ||||||||||||
| $ | 49,889 | 2.343 | % | 01/25/36 | $ | 49,568 | ||||||||
| | Merrill Lynch Alternative Note AssetTrust Series 2007-OAR3, | | ||||||||||||
| 239,323 | 2.208 | 07/25/47 | 224,568 | |||||||||||
|
| |||||||||||||
| TOTAL MORTGAGE-BACKED OBLIGATIONS | ||||||||||||||
| (Cost $128,471) | $ | 274,136 | ||||||||||||
|
| |||||||||||||
| Foreign Debt Obligations – 0.3% | ||||||||||||||
| Sovereign – 0.3% | ||||||||||||||
Ecuador Government International Bond | ||||||||||||||
| $ | 290,000 | 10.750 | % | 03/28/22 | 308,578 | |||||||||
| 330,000 | 7.950 | 06/20/24 | 319,172 | |||||||||||
Republic of Angola | ||||||||||||||
| 300,000 | 9.500 | 11/12/25 | 337,875 | |||||||||||
Republic of Egypt | ||||||||||||||
| EUR | 590,000 | 4.750 | 04/11/25 | 680,235 | ||||||||||
Republic of Ghana | ||||||||||||||
| $ | 630,000 | 7.875 | 08/07/23 | 687,291 | ||||||||||
Republic of Nigeria | ||||||||||||||
| 690,000 | 6.500 | 11/28/27 | 691,509 | |||||||||||
Republic of Sri Lanka(f) | ||||||||||||||
| 630,000 | 6.350 | 06/28/24 | 637,875 | |||||||||||
Republic of Turkey | ||||||||||||||
| 760,000 | 6.125 | 10/24/28 | 750,263 | |||||||||||
|
| |||||||||||||
| Foreign Debt Obligations – (continued) | ||||||||||||||
| Sovereign – (continued) | ||||||||||||||
Ukraine Government Bond | ||||||||||||||
| 680,000 | 7.750 | 09/01/23 | 727,600 | |||||||||||
|
| |||||||||||||
| TOTAL FOREIGN DEBT OBLIGATIONS | ||||||||||||||
| (Cost $4,919,612) | $ | 5,140,398 | ||||||||||||
|
| |||||||||||||
| Bank Loans(e)(j) – 7.1% | ||||||||||||||
| Aerospace – 0.3% | ||||||||||||||
TransDigm, Inc. (1M LIBOR + 2.500%) | ||||||||||||||
| $ | 4,283,062 | 4.286 | % | 06/09/23 | $ | 4,261,090 | ||||||||
|
| |||||||||||||
| Automotive – 0.3% | ||||||||||||||
Adient US LLC (3M LIBOR + 4.250%) | ||||||||||||||
| 4,365,138 | 6.889 | 05/06/24 | 4,251,906 | |||||||||||
|
| |||||||||||||
| Chemicals – 0.3% | ||||||||||||||
Momentive Performance Materials, Inc. (1M LIBOR + 3.250%) | ||||||||||||||
| 2,144,625 | 5.040 | 05/15/24 | 2,103,083 | |||||||||||
Starfruit Finco B.V. (1M LIBOR + 3.250%) | ||||||||||||||
| 2,908,963 | 5.190 | 10/01/25 | 2,833,243 | |||||||||||
|
| |||||||||||||
| 4,936,326 | ||||||||||||||
|
| |||||||||||||
| Entertainment – 0.2% | ||||||||||||||
AMC Entertainment Holdings, Inc. (6M LIBOR + 3.000%) | ||||||||||||||
| 2,835,750 | 5.230 | 04/22/26 | 2,832,999 | |||||||||||
|
| |||||||||||||
| Environmental – 0.1% | ||||||||||||||
Advanced Disposal Services, Inc. (1 Week LIBOR + 2.250%) | ||||||||||||||
| 1,978,437 | 4.086 | 11/10/23 | 1,980,890 | |||||||||||
|
| |||||||||||||
| Food & Drug Retailers – 0.0% | ||||||||||||||
B&G Foods, Inc. (3M LIBOR + 2.500%) | ||||||||||||||
| 750,000 | 4.475 | 10/10/26 | 752,347 | |||||||||||
|
| |||||||||||||
| Health Care – Services – 0.4% | ||||||||||||||
MPH Acquisition Holdings LLC (3M LIBOR + 2.750%) | ||||||||||||||
| 1,928,826 | 4.854 | 06/07/23 | 1,804,551 | |||||||||||
Sotera Health Holdings LLC (3M LIBOR + 3.000%) | ||||||||||||||
| 1,984,733 | 4.927 | 05/15/22 | 1,947,519 | |||||||||||
U.S. Renal Care, Inc. (1M LIBOR + 5.000%) | ||||||||||||||
| 2,200,000 | 6.786 | 06/26/26 | 2,028,312 | |||||||||||
Verscend Holding Corp. (1M LIBOR + 4.500%) | ||||||||||||||
| 1,386,000 | 6.286 | 08/27/25 | 1,386,000 | |||||||||||
|
| |||||||||||||
| 7,166,382 | ||||||||||||||
|
| |||||||||||||
| Home Construction – 0.1% | ||||||||||||||
Brookfield Residential Properties, Inc. (1M LIBOR + 2.250%) | ||||||||||||||
| 2,037,890 | 4.036 | 08/28/23 | 2,006,058 | |||||||||||
|
| |||||||||||||
| Media – Broadcasting & Radio – 0.2% | ||||||||||||||
Cumulus Media New Holdings, Inc. (1M LIBOR + 3.750%) | ||||||||||||||
| 925,000 | 5.536 | 03/31/26 | 928,663 | |||||||||||
Getty Images, Inc. (1M LIBOR + 4.500%) | ||||||||||||||
| 1,985,000 | 6.313 | 02/19/26 | 1,930,412 | |||||||||||
|
| |||||||||||||
| 2,859,075 | ||||||||||||||
|
| |||||||||||||
| 28 | The accompanying notes are an integral part of these financial statements. |
GOLDMAN SACHS INCOME BUILDER FUND
| Principal Amount | Interest Rate | Maturity Date | Value | |||||||||||
| Bank Loans(e)(j) – (continued) | ||||||||||||||
| Media – Cable – 0.3% | ||||||||||||||
CSC Holdings LLC | ||||||||||||||
(1M LIBOR + 2.250%) | ||||||||||||||
| $ | 1,711,582 | 4.171 | % | 07/17/25 | $ | 1,701,364 | ||||||||
(2M LIBOR + 2.500%) | ||||||||||||||
| 3,801,875 | 4.327 | 04/15/27 | 3,795,070 | |||||||||||
|
| |||||||||||||
| 5,496,434 | ||||||||||||||
|
| |||||||||||||
| Metals & Mining – 0.2% | ||||||||||||||
Aleris International, Inc. (1M LIBOR + 4.750%) | ||||||||||||||
| 3,950,000 | 6.536 | 02/27/23 | 3,947,551 | |||||||||||
|
| |||||||||||||
| Packaging – 0.2% | ||||||||||||||
Reynolds Group Holdings, Inc. (1M LIBOR + 2.750%) | ||||||||||||||
| 2,969,465 | 4.536 | 02/05/23 | 2,967,832 | |||||||||||
|
| |||||||||||||
| Pharmaceuticals – 0.7% | ||||||||||||||
Alphabet Holding Co., Inc. (1M LIBOR + 7.750%) | ||||||||||||||
| 5,000,000 | 9.536 | 09/26/25 | 4,256,250 | |||||||||||
| | Valeant Pharmaceuticals International, Inc. (1M LIBOR + | | ||||||||||||
| 7,437,650 | 4.921 | 06/02/25 | 7,461,674 | |||||||||||
|
| |||||||||||||
| 11,717,924 | ||||||||||||||
|
| |||||||||||||
| Restaurants – 0.0% | ||||||||||||||
1011778 B.C. Unlimited Liability Co. (1M LIBOR + 2.250%) | ||||||||||||||
| 477,583 | 4.036 | 02/16/24 | 477,941 | |||||||||||
|
| |||||||||||||
| Retailers – 0.2% | ||||||||||||||
OEConnection LLC (3M LIBOR + 4.250%) | ||||||||||||||
| 2,078,030 | 5.823 | 09/25/26 | 2,057,250 | |||||||||||
Staples, Inc. (3M LIBOR + 5.000%) | ||||||||||||||
| 1,596,000 | 7.123 | 04/16/26 | 1,571,597 | |||||||||||
|
| |||||||||||||
| 3,628,847 | ||||||||||||||
|
| |||||||||||||
| Services Cyclical – Business Services – 0.3% | ||||||||||||||
EVO Payments International LLC (1M LIBOR + 3.250%) | ||||||||||||||
| 2,969,849 | 5.050 | 12/22/23 | 2,971,097 | |||||||||||
Travelport Finance S.a.r.l. (3M LIBOR + 5.000%) | ||||||||||||||
| 3,100,000 | 7.104 | 05/29/26 | 2,883,000 | |||||||||||
|
| |||||||||||||
| 5,854,097 | ||||||||||||||
|
| |||||||||||||
| Services Cyclical – Consumer Services – 0.2% | ||||||||||||||
Asurion LLC (1M LIBOR + 3.000%) | ||||||||||||||
| 3,367,809 | 4.786 | 08/04/22 | 3,368,415 | |||||||||||
|
| |||||||||||||
| Technology – Software/Services – 2.4% | ||||||||||||||
Ancestry.com Operations, Inc. (1M LIBOR + 3.750%) | ||||||||||||||
| 5,141,335 | 5.540 | 10/19/23 | 4,704,322 | |||||||||||
BMC Software Finance, Inc. (1M LIBOR + 4.250%) | ||||||||||||||
| 4,974,216 | 6.036 | 10/02/25 | 4,595,827 | |||||||||||
Cerence, Inc. (3M LIBOR + 3.750%) | ||||||||||||||
| 1,850,000 | 8.032 | 10/01/24 | 1,735,540 | |||||||||||
Ceridian HCM Holding, Inc. (1M LIBOR + 3.000%) | ||||||||||||||
| 2,970,000 | 4.800 | 04/30/25 | 2,973,712 | |||||||||||
DCert Buyer, Inc. (1M LIBOR + 4.000%) | ||||||||||||||
| 1,775,000 | 5.786 | 10/16/26 | 1,740,618 | |||||||||||
Financial & Risk US Holdings, Inc. (1M LIBOR + 3.750%) | ||||||||||||||
| 4,118,875 | 5.536 | 10/01/25 | 4,138,440 | |||||||||||
|
| |||||||||||||
| Bank Loans(e)(j) – (continued) | ||||||||||||||
| Technology – Software/Services – (continued) | ||||||||||||||
Infor (US), Inc. (3M LIBOR + 2.750%) | ||||||||||||||
| 4,121,882 | 4.854 | 02/01/22 | 4,121,882 | |||||||||||
Ion Trading Technologies S.a.r.l. (3M LIBOR + 4.000%) | ||||||||||||||
| 1,998,950 | 6.064 | 11/21/24 | 1,869,638 | |||||||||||
MA FinanceCo. LLC (1M LIBOR + 2.250%) | ||||||||||||||
| 3,602,166 | 4.050 | 11/19/21 | 3,570,648 | |||||||||||
| | SS&C Technologies Holdings Europe S.a.r.l. (1M LIBOR + | | ||||||||||||
| 1,315,649 | 4.036 | 04/16/25 | 1,317,846 | |||||||||||
SS&C Technologies, Inc. (1M LIBOR + 2.250%) | ||||||||||||||
| 2,015,461 | 4.036 | 04/16/25 | 2,018,827 | |||||||||||
The Dun & Bradstreet Corp. (1M LIBOR + 5.000%) | ||||||||||||||
| 3,100,000 | 6.804 | 02/06/26 | 3,107,099 | |||||||||||
The Ultimate Software Group, Inc. (1M LIBOR + 3.750%) | ||||||||||||||
| 1,650,000 | 5.536 | 05/04/26 | 1,652,525 | |||||||||||
TIBCO Software, Inc. (1M LIBOR + 4.000%) | ||||||||||||||
| 1,989,795 | 6.000 | 06/30/26 | 1,977,359 | |||||||||||
|
| |||||||||||||
| 39,524,283 | ||||||||||||||
|
| |||||||||||||
| Telecommunication Services – 0.2% | ||||||||||||||
Level 3 Financing, Inc. (1M LIBOR + 2.250%) | ||||||||||||||
| 3,000,000 | 4.036 | 02/22/24 | 3,002,250 | |||||||||||
|
| |||||||||||||
| Wireless Telecommunications – 0.2% | ||||||||||||||
Intelsat Jackson Holdings SA(6M LIBOR + 3.750%) | ||||||||||||||
| 3,000,000 | 5.682 | 11/27/23 | 2,994,390 | |||||||||||
|
| |||||||||||||
| Wirelines Telecommunications – 0.3% | ||||||||||||||
Consolidated Communications, Inc. (1M LIBOR + 3.000%) | ||||||||||||||
| 4,887,408 | 4.790 | 10/04/23 | 4,525,447 | |||||||||||
|
| |||||||||||||
| TOTAL BANK LOANS | ||||||||||||||
| (Cost $120,193,397) | $ | 118,552,484 | ||||||||||||
|
| |||||||||||||
| Shares | Description | Value | ||||||||||
| U.S. Treasury Obligation(k) – 0.1% | ||||||||||||
United States Treasury Note | ||||||||||||
| 1,730,000 | 1.875 | % | 12/15/20 | 1,735,203 | ||||||||
| (Cost $1,727,831) | ||||||||||||
| ||||||||||||
| Shares | Dividend Rate | Value | ||||||
| Investment Companies(l) – 5.3% | ||||||||
Goldman Sachs Emerging Markets Equity Fund – Class R6 |
| |||||||
| 2,489 | 0.694 | % | $ | 54,599 | ||||
Goldman Sachs Financial Square Government Fund – Class R6 |
| |||||||
| 47,167,247 | 1.701 | 47,167,247 | ||||||
Goldman Sachs Financial Square Government Fund – Institutional Shares |
| |||||||
| 42,020,144 | 1.701 | 42,020,144 | ||||||
Goldman Sachs High Yield Fund – Class R6 |
| |||||||
| 8,336 | 5.630 | 53,353 | ||||||
| ||||||||
| TOTAL INVESTMENT COMPANIES |
| |||||||
| (Cost $89,285,869) |
| $ | 89,295,343 | |||||
| ||||||||
| The accompanying notes are an integral part of these financial statements. | 29 |
GOLDMAN SACHS INCOME BUILDER FUND
Schedule of Investments(continued)
October 31, 2019
Principal Amount | Interest Rate | Maturity Date | Value | |||||||||||
| Short-term Investments(f)(m) – 1.0% | ||||||||||||||
| Commercial Paper – 1.0% | ||||||||||||||
AT&T, Inc. | ||||||||||||||
| $ | 7,950,000 | 0.000 | % | 12/10/19 | $ | 7,931,097 | ||||||||
VW Credit, Inc. | ||||||||||||||
| 1,750,000 | 0.000 | 12/06/19 | 1,746,447 | |||||||||||
| 5,000,000 | 0.000 | 02/03/20 | 4,972,028 | |||||||||||
| 1,750,000 | 0.000 | 03/30/20 | 1,734,431 | |||||||||||
|
| |||||||||||||
| TOTALSHORT-TERM INVESTMENTS | ||||||||||||||
| (Cost $16,370,808) | $ | 16,384,003 | ||||||||||||
|
| |||||||||||||
| | TOTAL INVESTMENTS BEFORE SECURITIES LENDING REINVESTMENT VEHICLE | | ||||||||||||
| (Cost $1,509,210,176) | $ | 1,625,741,834 | ||||||||||||
|
| |||||||||||||
| Shares | Dividend Rate | Value | ||||
| Securities Lending Reinvestment Vehicle(l) – 0.0% | ||||||
Goldman Sachs Financial Square Government Fund – Institutional Shares |
| |||||
| 92,000 | 1.701% | $ | 92,000 | |||
| (Cost $92,000) | ||||||
| ||||||
| TOTAL INVESTMENTS – 97.0% |
| |||||
| (Cost $1,509,302,176) | $ | 1,625,833,834 | ||||
| ||||||
OTHER ASSETS IN EXCESS OF LIABILITIES – 3.0% | 49,646,752 | |||||
| ||||||
| NET ASSETS – 100.0% | $ | 1,675,480,586 | ||||
| ||||||
| The percentage shown for each investment category reflects the value of investments in that category as a percentage of net assets. | ||
(a) | All or a portion of security is on loan. | |
(b) | Security is currently in default and/or non-income producing. | |
(c) | Significant unobservable inputs were used in the valuation of this portfolio security; i.e., Level 3. | |
(d) | Security with “Call” features with resetting interest rates. Maturity dates disclosed are the final maturity dates. | |
(e) | Variable rate security. Except for floating rate notes (for which final maturity is disclosed), maturity date disclosed is the next interest reset date. Interest rate disclosed is that which is in effect on October 31, 2019. | |
(f) | Exempt from registration under Rule 144A of the Securities Act of 1933. | |
(g) | Pay-in-kind securities. | |
(h) | Guaranteed by a foreign government until maturity. Total market value of these securities amounts to $667,997, which represents approximately 0.0% of the Fund’s net assets as of October 31, 2019. | |
(i) | Actual maturity date is June 5, 2115. | |
(j) | Bank Loans often require prepayments from excess cash flows or permit the borrower to repay at its election. The degree to which borrowers repay, whether as a contractual requirement or at their election, cannot be predicted with accuracy. As a result, the actual remaining maturity may be substantially less than the stated maturities shown. As bank loan positions may involve multiple underlying tranches for which the aggregate position is presented, the stated interest rate represents the weighted average interest rate of all contracts on October 31, 2019. Bank Loans typically have rates of interest which are predetermined either daily, monthly, quarterly or semi-annually by reference to a base lending rate, plus a premium. These base lending rates are primarily the London-Interbank Offered Rate (“LIBOR”), and secondarily the prime rate offered by one or more major United States banks (the “Prime Rate”) and the certificate of deposit (“CD”) rate or other base lending rates used by commercial lenders. | |
(k) | All or a portion of security is segregated as collateral for initial margin requirements on futures transactions. | |
(l) | Represents an affiliated issuer/fund. | |
(m) | Issued with a zero coupon. Income is recognized through the accretion of discount. | |
| ||
Currency Abbreviations: | ||
EUR | —Euro | |
GBP | —British Pound | |
USD | —U.S. Dollar | |
Investment Abbreviations: | ||
ADR | —American Depositary Receipt | |
CMT | —Constant Maturity Treasury Indexes | |
EURO | —Euro Offered Rate | |
LIBOR | —London Interbank Offered Rate | |
LLC | —Limited Liability Company | |
LP | —Limited Partnership | |
MTN | —Medium Term Note | |
PLC | —Public Limited Company | |
REIT | —Real Estate Investment Trust | |
| ||
| ADDITIONAL INVESTMENT INFORMATION |
UNFUNDED LOAN COMMITMENTS — At October 31, 2019, the Fund had unfunded loan commitments which could be extended at the option of the borrowers, pursuant to the following loan agreements:
| Borrower | Principal Amount | Current Value | Unrealized Gain (Loss) | |||||||||
OEConnection LLC, due 09/25/26 | $ | 196,970 | $ | 195,000 | $ | (998 | ) | |||||
| 30 | The accompanying notes are an integral part of these financial statements. |
GOLDMAN SACHS INCOME BUILDER FUND
| ADDITIONAL INVESTMENT INFORMATION (continued) |
FORWARD FOREIGN CURRENCY EXCHANGE CONTRACTS — At October 31, 2019, the Fund had the following forward foreign currency exchange contracts:
FORWARD FOREIGN CURRENCY EXCHANGE CONTRACTS WITH UNREALIZED LOSS
| Counterparty | Currency Purchased | Currency Sold | Settlement Date | Unrealized Loss | ||||||||||||||||
MS & Co. Int. PLC | USD | 1,396,085 | EUR | 1,264,242 | 11/27/19 | $ | (16,394 | ) | ||||||||||||
| USD | 4,426,717 | GBP | 3,577,443 | 12/04/19 | (212,458 | ) | ||||||||||||||
| TOTAL | $ | (228,852 | ) | |||||||||||||||||
FUTURES CONTRACTS — At October 31, 2019, the Fund had the following futures contracts:
| Description | Number of Contracts | Expiration Date | Notional Amount | Unrealized Appreciation/ (Depreciation) | ||||||||||||
Long position contracts: | ||||||||||||||||
S&P 500E-Mini Index | 359 | 12/20/19 | $ | 54,492,610 | $ | 550,684 | ||||||||||
Ultra Long U.S. Treasury Bonds | 550 | 12/19/19 | 104,362,500 | (3,811,963 | ) | |||||||||||
U.S. Long Bonds | 23 | 12/19/19 | 3,711,625 | (89,282 | ) | |||||||||||
2 Year U.S. Treasury Notes | 8 | 12/31/19 | 1,724,813 | (2,639 | ) | |||||||||||
10 Year U.S. Treasury Notes | 173 | 12/19/19 | 22,541,359 | 184,158 | ||||||||||||
| Total | $ | (3,169,042 | ) | |||||||||||||
Short position contracts: | ||||||||||||||||
Ultra 10 Year U.S. Treasury Notes | (126 | ) | 12/19/19 | (17,905,781 | ) | 372,054 | ||||||||||
U.S. Long Bonds | (156 | ) | 12/19/19 | (25,174,500 | ) | 470,359 | ||||||||||
5 Year U.S. Treasury Notes | (529 | ) | 12/31/19 | (63,058,453 | ) | 61,059 | ||||||||||
| Total | $ | 903,472 | ||||||||||||||
| TOTAL FUTURES CONTRACTS | $ | (2,265,570 | ) | |||||||||||||
SWAP CONTRACTS — At October 31, 2019, the Fund had the following swap contracts:
CENTRALLY CLEARED INTEREST RATE SWAP CONTRACTS
| Payments Made by the Fund | Payments Received by Fund | Termination Date | Notional (000s)(c) | Market Value | Upfront Premium (Received) Paid | Unrealized Appreciation/ (Depreciation) | ||||||||||||||||||||
1.485%(a) | 3M LIBOR(b) | 05/15/45 | $ | 32,310 | $ | 2,023,188 | $ | 2,617,137 | $ | (593,949 | ) | |||||||||||||||
1.500(a) | 3M LIBOR(b) | 12/18/21 | 2,360 | 940 | (39,433 | ) | 40,373 | |||||||||||||||||||
1.500(a) | 3M LIBOR(b) | 12/18/22 | 3,490 | (1,966 | ) | (91,096 | ) | 89,130 | ||||||||||||||||||
1.750(a) | 3M LIBOR(b) | 12/18/26 | 10,170 | (161,233 | ) | (96,317 | ) | (64,916 | ) | |||||||||||||||||
0.250(d) | 6M EURO(a) | 12/18/24 | EUR | 800 | (23,041 | ) | (30,841 | ) | 7,800 | |||||||||||||||||
0.500(d) | 6M EURO(a) | 12/18/26 | 160 | (8,271 | ) | (10,237 | ) | 1,966 | ||||||||||||||||||
3M LIBOR(b) | 1.295%(a) | 05/15/29 | $ | 31,330 | (772,416 | ) | (1,077,598 | ) | 305,182 | |||||||||||||||||
3M LIBOR(b) | 1.500(a) | 12/18/29 | 211,090 | (1,958,873 | ) | (3,530,294 | ) | 1,571,421 | ||||||||||||||||||
3M LIBOR(b) | 1.750(a) | 12/18/39 | 1,870 | (4,150 | ) | (21,486 | ) | 17,336 | ||||||||||||||||||
3M LIBOR(b) | 1.500(a) | 12/18/24 | 165,590 | 224,457 | (791,951 | ) | 1,016,408 | |||||||||||||||||||
| TOTAL | $ | (681,365 | ) | $ | (3,072,116 | ) | $ | 2,390,751 | ||||||||||||||||||
| (a) | Payments made semi-annually. |
| The accompanying notes are an integral part of these financial statements. | 31 |
GOLDMAN SACHS INCOME BUILDER FUND
Schedule of Investments(continued)
October 31, 2019
| ADDITIONAL INVESTMENT INFORMATION (continued) |
| (b) | Payments made quarterly. |
| (c) | Represents forward starting interest rate swaps whose effective dates of commencement of accruals and cash flows occur subsequent to October 31, 2019. |
| (d) | Payments made annually. |
WRITTEN OPTION CONTRACTS — At October 31, 2019, the Fund had the following written options:
OVER-THE-COUNTER OPTIONS ON EQUITIES
| Description | Counterparty | Exercise Price | Expiration Date | Number of Contracts | Notional Amount | Market Value | Premiums Paid (Received) by Portfolio | Unrealized Appreciation/ (Depreciation) | ||||||||||||||||||||||
Written option contracts | ||||||||||||||||||||||||||||||
Calls | ||||||||||||||||||||||||||||||
SPX Index | MS & Co. Int. PLC | 3,010.070 | 11/15/2019 | (21,989 | ) | $ | (21,989 | ) | $ | (922,238 | ) | $ | (640,520 | ) | $ | (281,718 | ) | |||||||||||||
STOX Indices | UBS AG (London) | 3,640.260 | 11/15/2019 | (8,248 | ) | (8,248 | ) | (128,039 | ) | (207,607 | ) | 79,568 | ||||||||||||||||||
| TotalOver-the-Counter Options on Equities |
| (30,237 | ) | $ | (30,237 | ) | $ | (1,050,277 | ) | $ | (848,127 | ) | $ | (202,150 | ) | |||||||||||||||
| ||
Abbreviations: | ||
MS & Co. Int. PLC | —Morgan Stanley & Co. International PLC | |
| ||
| 32 | The accompanying notes are an integral part of these financial statements. |
GOLDMAN SACHS RISING DIVIDEND GROWTH FUND
Schedule of Investments
October 31, 2019
Shares | Description | Value | ||||||
| Common Stocks – 97.2% | ||||||||
| Air Freight & Logistics – 1.0% | ||||||||
| 48,180 | FedEx Corp. | $ | 7,355,159 | |||||
|
| |||||||
| Banks – 0.4% | ||||||||
| 99,750 | Bank OZK | 2,798,985 | ||||||
|
| |||||||
| Building Products – 1.2% | ||||||||
| 82,620 | A.O. Smith Corp. | 4,104,562 | ||||||
| 18,750 | Lennox International, Inc. | 4,638,000 | ||||||
|
| |||||||
| 8,742,562 | ||||||||
|
| |||||||
| Capital Markets – 5.5% | ||||||||
| 41,460 | Ameriprise Financial, Inc. | 6,255,899 | ||||||
| 18,345 | BlackRock, Inc. | 8,469,886 | ||||||
| 32,462 | Evercore, Inc. Class A | 2,390,502 | ||||||
| 18,745 | FactSet Research Systems, Inc. | 4,752,232 | ||||||
| 32,685 | Moody’s Corp. | 7,213,253 | ||||||
| 74,105 | SEI Investments Co. | 4,440,372 | ||||||
| 57,494 | T. Rowe Price Group, Inc. | 6,657,805 | ||||||
|
| |||||||
| 40,179,949 | ||||||||
|
| |||||||
| Chemicals – 1.9% | ||||||||
| 28,930 | Ecolab, Inc. | 5,556,585 | ||||||
| 5,245 | NewMarket Corp. | 2,546,395 | ||||||
| 9,877 | The Sherwin-Williams Co. | 5,652,805 | ||||||
|
| |||||||
| 13,755,785 | ||||||||
|
| |||||||
| Commercial Services & Supplies – 0.7% | ||||||||
| 134,340 | Rollins, Inc. | 5,119,697 | ||||||
|
| |||||||
| Consumer Finance – 0.9% | ||||||||
| 78,974 | Discover Financial Services | 6,338,453 | ||||||
|
| |||||||
| Electric Utilities – 1.2% | ||||||||
| 37,700 | NextEra Energy, Inc. | 8,985,418 | ||||||
|
| |||||||
| Electrical Equipment – 0.9% | ||||||||
| 35,890 | Rockwell Automation, Inc. | 6,172,721 | ||||||
|
| |||||||
| Electronic Equipment, Instruments & Components – 3.6% | ||||||||
| 70,095 | Amphenol Corp. Class A | 7,032,631 | ||||||
| 34,755 | Badger Meter, Inc. | 2,008,839 | ||||||
| 227,175 | Corning, Inc. | 6,731,195 | ||||||
| 85,032 | National Instruments Corp. | 3,519,475 | ||||||
| 74,988 | TE Connectivity Ltd. | 6,711,426 | ||||||
|
| |||||||
| 26,003,566 | ||||||||
|
| |||||||
| Energy Equipment & Services – 0.5% | ||||||||
| 217,400 | USA Compression Partners LP | 3,841,458 | ||||||
|
| |||||||
| Entertainment – 2.3% | ||||||||
| 128,900 | The Walt Disney Co. | 16,746,688 | ||||||
|
| |||||||
| Equity Real Estate Investment Trusts (REITs) – 2.6% | ||||||||
| 40,800 | Digital Realty Trust, Inc. | 5,183,232 | ||||||
| 60,735 | Equity LifeStyle Properties, Inc. | 4,247,806 | ||||||
| 38,890 | Extra Space Storage, Inc. | 4,366,180 | ||||||
| 23,600 | Public Storage | 5,259,496 | ||||||
|
| |||||||
| 19,056,714 | ||||||||
|
| |||||||
| Common Stocks – (continued) | ||||||||
| Food & Staples Retailing – 3.5% | ||||||||
| 21,360 | Casey’s General Stores, Inc. | 3,648,502 | ||||||
| 27,610 | Costco Wholesale Corp. | 8,203,207 | ||||||
| 238,235 | The Kroger Co. | 5,870,110 | ||||||
| 141,755 | Walgreens Boots Alliance, Inc. | 7,765,339 | ||||||
|
| |||||||
| 25,487,158 | ||||||||
|
| |||||||
| Food Products – 1.6% | ||||||||
| 140,260 | Hormel Foods Corp. | 5,735,231 | ||||||
| 43,625 | Ingredion, Inc. | 3,446,375 | ||||||
| 13,780 | J&J Snack Foods Corp. | 2,628,673 | ||||||
|
| |||||||
| 11,810,279 | ||||||||
|
| |||||||
| Health Care Equipment & Supplies – 4.1% | ||||||||
| 2,670 | Atrion Corp. | 2,251,958 | ||||||
| 65,825 | Danaher Corp. | 9,072,002 | ||||||
| 87,110 | Medtronic PLC | 9,486,279 | ||||||
| 41,605 | Stryker Corp. | 8,997,913 | ||||||
|
| |||||||
| 29,808,152 | ||||||||
|
| |||||||
| Health Care Providers & Services – 7.3% | ||||||||
| 79,250 | AmerisourceBergen Corp. | 6,766,365 | ||||||
| 127,165 | Cardinal Health, Inc. | 6,288,309 | ||||||
| 10,250 | Chemed Corp. | 4,037,578 | ||||||
| 144,671 | CVS Health Corp. | 9,604,708 | ||||||
| 53,495 | McKesson Corp. | 7,114,835 | ||||||
| 57,465 | Quest Diagnostics, Inc. | 5,818,331 | ||||||
| 60,131 | The Ensign Group, Inc. | 2,540,535 | ||||||
| 42,255 | UnitedHealth Group, Inc. | 10,677,838 | ||||||
|
| |||||||
| 52,848,499 | ||||||||
|
| |||||||
| Hotels, Restaurants & Leisure – 1.5% | ||||||||
| 46,570 | Brinker International, Inc. | 2,070,037 | ||||||
| 17,645 | Cracker Barrel Old Country Store, Inc. | 2,743,797 | ||||||
| 59,885 | Yum! Brands, Inc. | 6,090,903 | ||||||
|
| |||||||
| 10,904,737 | ||||||||
|
| |||||||
| Independent Power and Renewable Electricity Producers – 0.4% | ||||||||
| 49,200 | NextEra Energy Partners LP | 2,592,840 | ||||||
|
| |||||||
| Industrial Conglomerates – 1.2% | ||||||||
| 51,540 | 3M Co. | 8,503,585 | ||||||
|
| |||||||
| Insurance – 4.5% | ||||||||
| 44,329 | American Financial Group, Inc. | 4,611,989 | ||||||
| 37,625 | Aon PLC | 7,267,645 | ||||||
| 102,670 | Principal Financial Group, Inc. | 5,480,525 | ||||||
| 79,200 | Prudential Financial, Inc. | 7,218,288 | ||||||
| 29,465 | Reinsurance Group of America, Inc. | 4,787,179 | ||||||
| 24,775 | The Hanover Insurance Group, Inc. | 3,263,115 | ||||||
|
| |||||||
| 32,628,741 | ||||||||
|
| |||||||
| IT Services – 7.9% | ||||||||
| 45,532 | Accenture PLC Class A | 8,442,543 | ||||||
| 49,890 | Automatic Data Processing, Inc. | 8,093,655 | ||||||
| 44,732 | Broadridge Financial Solutions, Inc. | 5,601,341 | ||||||
|
| |||||||
| The accompanying notes are an integral part of these financial statements. | 33 |
GOLDMAN SACHS RISING DIVIDEND GROWTH FUND
Schedule of Investments(continued)
October 31, 2019
Shares | Description | Value | ||||||
| Common Stocks – (continued) | ||||||||
| IT Services – (continued) | ||||||||
| 60,535 | International Business Machines Corp. | $ | 8,095,346 | |||||
| 35,405 | Jack Henry & Associates, Inc. | 5,011,932 | ||||||
| 32,290 | Mastercard, Inc. Class A | 8,938,195 | ||||||
| 195,190 | The Western Union Co. | 4,891,461 | ||||||
| 47,770 | Visa, Inc. Class A | 8,544,142 | ||||||
|
| |||||||
| 57,618,615 | ||||||||
|
| |||||||
| Leisure Products – 1.1% | ||||||||
| 45,105 | Hasbro, Inc. | 4,389,167 | ||||||
| 39,509 | Polaris, Inc. | 3,897,563 | ||||||
|
| |||||||
| 8,286,730 | ||||||||
|
| |||||||
| Machinery – 0.5% | ||||||||
| 68,915 | Donaldson Co., Inc. | 3,634,577 | ||||||
|
| |||||||
| Media – 5.5% | ||||||||
| 293,504 | CBS Corp. Class B | 10,577,884 | ||||||
| 377,320 | Comcast Corp. Class A | 16,911,515 | ||||||
| 155,765 | Omnicom Group, Inc. | 12,023,500 | ||||||
|
| |||||||
| 39,512,899 | ||||||||
|
| |||||||
| Metals & Mining – 0.5% | ||||||||
| 27,878 | Reliance Steel & Aluminum Co. | 3,234,963 | ||||||
|
| |||||||
| Multi-Utilities – 1.9% | ||||||||
| 97,536 | CMS Energy Corp. | 6,234,501 | ||||||
| 75,755 | WEC Energy Group, Inc. | 7,151,272 | ||||||
|
| |||||||
| 13,385,773 | ||||||||
|
| |||||||
| Oil, Gas & Consumable Fuels – 14.5% | ||||||||
| 121,000 | Alliance Resource Partners LP | 1,379,400 | ||||||
| 159,811 | Antero Midstream Corp. | 1,029,183 | ||||||
| 81,000 | BP Midstream Partners LP | 1,194,750 | ||||||
| 117,000 | Cheniere Energy Partners LP | 5,256,810 | ||||||
| 149,500 | DCP Midstream LP | 3,422,055 | ||||||
| 234,000 | Enable Midstream Partners LP | 2,361,060 | ||||||
| 886,800 | Energy Transfer LP | 11,164,812 | ||||||
| 545,900 | Enterprise Products Partners LP | 14,209,777 | ||||||
| 248,377 | Hess Midstream Partners LP | 5,292,914 | ||||||
| 97,861 | Holly Energy Partners LP | 2,236,124 | ||||||
| 188,000 | Magellan Midstream Partners LP | 11,716,160 | ||||||
| 394,100 | MPLX LP | 10,392,417 | ||||||
| 30,068 | Noble Midstream Partners LP | 725,240 | ||||||
| 99,000 | ONEOK, Inc. | 6,913,170 | ||||||
| 90,500 | Pembina Pipeline Corp. | 3,181,980 | ||||||
| 123,500 | Phillips 66 Partners LP | 6,902,415 | ||||||
| 10,000 | Tallgrass Energy LP Class A | 186,600 | ||||||
| 108,076 | Targa Resources Corp. | 4,201,995 | ||||||
| 42,000 | TC Energy Corp. | 2,113,860 | ||||||
| 290,000 | The Williams Cos., Inc. | 6,469,900 | ||||||
| 66,530 | Viper Energy Partners LP | 1,601,377 | ||||||
| 155,707 | Western Midstream Partners LP | 3,310,331 | ||||||
|
| |||||||
| 105,262,330 | ||||||||
|
| |||||||
| Common Stocks – (continued) | ||||||||
| Personal Products – 1.4% | ||||||||
| 52,236 | Nu Skin Enterprises, Inc. Class A | 2,328,681 | ||||||
| 40,090 | The Estee Lauder Cos., Inc. Class A | 7,467,564 | ||||||
|
| |||||||
| 9,796,245 | ||||||||
|
| |||||||
| Pharmaceuticals – 0.6% | ||||||||
| 86,635 | Perrigo Co. PLC | 4,593,388 | ||||||
|
| |||||||
| Professional Services – 0.4% | ||||||||
| 28,395 | Insperity, Inc. | 2,999,364 | ||||||
|
| |||||||
| Semiconductors & Semiconductor Equipment – 5.6% | ||||||||
| 66,665 | Analog Devices, Inc. | 7,108,489 | ||||||
| 142,645 | Applied Materials, Inc. | 7,739,918 | ||||||
| 40,590 | KLA Corp. | 6,861,334 | ||||||
| 24,621 | Power Integrations, Inc. | 2,243,219 | ||||||
| 110,435 | QUALCOMM, Inc. | 8,883,391 | ||||||
| 63,650 | Texas Instruments, Inc. | 7,510,063 | ||||||
|
| |||||||
| 40,346,414 | ||||||||
|
| |||||||
| Software – 1.2% | ||||||||
| 62,260 | Microsoft Corp. | 8,926,216 | ||||||
|
| |||||||
| Specialty Retail – 2.6% | ||||||||
| 47,739 | Aaron’s, Inc. | 3,577,083 | ||||||
| 90,645 | Best Buy Co., Inc. | 6,511,031 | ||||||
| 38,135 | The Home Depot, Inc. | 8,945,708 | ||||||
|
| |||||||
| 19,033,822 | ||||||||
|
| |||||||
| Technology Hardware, Storage & Peripherals – 0.9% | ||||||||
| 392,805 | HP, Inc. | 6,823,023 | ||||||
|
| |||||||
| Textiles, Apparel & Luxury Goods – 3.3% | ||||||||
| 36,955 | Columbia Sportswear Co. | 3,342,618 | ||||||
| 92,390 | NIKE, Inc. Class B | 8,273,524 | ||||||
| 26,315 | Oxford Industries, Inc. | 1,812,051 | ||||||
| 44,345 | Ralph Lauren Corp. | 4,259,781 | ||||||
| 79,398 | VF Corp. | 6,533,661 | ||||||
|
| |||||||
| 24,221,635 | ||||||||
|
| |||||||
| Trading Companies & Distributors – 2.5% | ||||||||
| 182,020 | Fastenal Co. | 6,541,799 | ||||||
| 31,188 | MSC Industrial Direct Co., Inc. Class A | 2,283,273 | ||||||
| 18,744 | W.W. Grainger, Inc. | 5,788,897 | ||||||
| 20,729 | Watsco, Inc. | 3,654,523 | ||||||
|
| |||||||
| 18,268,492 | ||||||||
|
| |||||||
| TOTAL COMMON STOCKS | ||||||||
| (Cost $594,585,239) | $ | 705,625,632 | ||||||
|
| |||||||
| 34 | The accompanying notes are an integral part of these financial statements. |
GOLDMAN SACHS RISING DIVIDEND GROWTH FUND
| Shares | Dividend Rate | Value | ||||||
| Investment Companies(a) – 2.3% | ||||||||
Goldman Sachs Financial Square Government Fund – Class R6 | ||||||||
| 16,595,220 | 1.701% | $ | 16,595,220 | |||||
| | Goldman Sachs Financial Square Government Fund – | | ||||||
| 117,787 | 1.701 | 117,787 | ||||||
|
| |||||||
| TOTAL INVESTMENT COMPANIES | ||||||||
| (Cost $16,713,007) | $ | 16,713,007 | ||||||
|
| |||||||
| TOTAL INVESTMENTS – 99.5% | ||||||||
| (Cost $611,298,246) | $ | 722,338,639 | ||||||
|
| |||||||
| | OTHER ASSETS IN EXCESS OF LIABILITIES – 0.5% | 3,371,272 | ||||||
|
| |||||||
| NET ASSETS – 100.0% | $ | 725,709,911 | ||||||
|
| |||||||
| The percentage shown for each investment category reflects the value of investments in that category as a percentage of net assets. | ||
(a) | Represents an affiliated issuer. | |
| ||
Investment Abbreviations: | ||
LP | —Limited Partnership | |
PLC | —Public Limited Company | |
| ||
| ADDITIONAL INVESTMENT INFORMATION |
FUTURES CONTRACTS — At October 31, 2019, the Fund had the following futures contracts:
| Description | Number of Contracts | Expiration Date | Notional Amount | Unrealized Appreciation/ (Depreciation) | ||||||||||||
S&P 500E-Mini Index | 143 | 12/20/19 | $ | 21,705,970 | $ | 234,933 | ||||||||||
| The accompanying notes are an integral part of these financial statements. | 35 |
GOLDMAN SACHS DIVIDEND FOCUS FUNDS
Statements of Assets and Liabilities
October 31, 2019
| Income Builder Fund | Rising Dividend Growth Fund | |||||||||
| Assets: |
| |||||||||
Investments, at value (cost $1,419,924,307 and $594,585,239, respectively)(a) | $ | 1,536,446,491 | $ | 705,625,632 | ||||||
Investments of affiliated issuers, at value (cost $89,285,869 and $16,713,007, respectively) | 89,295,343 | 16,713,007 | ||||||||
Investments in securities lending reinvestment vehicle — affiliated issuer, at value (Cost $92,000 and $0, respectively) | 92,000 | — | ||||||||
Foreign currencies, at value (cost $999,730 and $0, respectively) | 1,011,490 | — | ||||||||
Cash | 26,453,144 | 2,483,966 | ||||||||
Variation margin on swaps contracts | 2,662,776 | — | ||||||||
Variation margin on futures contracts | 1,342,041 | 669 | ||||||||
Receivables: | ||||||||||
Collateral on certain derivative contracts(b) | 19,139,368 | 990,989 | ||||||||
Dividends and interest | 11,904,232 | 1,381,334 | ||||||||
Fund shares sold | 2,985,600 | 136,293 | ||||||||
Investments sold | 2,401,531 | 252,032 | ||||||||
Reimbursement from investment adviser | 80,092 | 136,364 | ||||||||
Foreign tax reclaims | 69,946 | 423,230 | ||||||||
Securities lending income | 1,677 | 393 | ||||||||
Other assets | 120,514 | 34,677 | ||||||||
| Total assets | 1,694,006,245 | 728,178,586 | ||||||||
| Liabilities: |
| |||||||||
Written option contracts, at value (premium received $848,127 and $0, respectively) | 1,050,277 | — | ||||||||
Unrealized loss on forward foreign currency exchange contracts | 228,852 | — | ||||||||
Unrealized loss on unfunded loan commitment | 998 | — | ||||||||
Payables: | ||||||||||
Investments purchased on an extended settlement basis | 7,641,694 | — | ||||||||
Investments purchased | 6,550,000 | 198,860 | ||||||||
Fund shares redeemed | 1,380,762 | 1,236,220 | ||||||||
Distribution and service fees and transfer agency fees | 628,045 | 293,889 | ||||||||
Management fees | 618,045 | 464,358 | ||||||||
Payable upon return of securities loaned | 92,000 | — | ||||||||
Accrued expenses | 334,986 | 275,348 | ||||||||
| Total liabilities | 18,525,659 | 2,468,675 | ||||||||
| Net Assets: |
| |||||||||
Paid-in capital | 1,580,800,731 | 578,169,841 | ||||||||
Total distributable earnings | 94,679,855 | 147,540,070 | ||||||||
| NET ASSETS | $ | 1,675,480,586 | $ | 725,709,911 | ||||||
Net Assets: | ||||||||||
Class A | $ | 314,951,064 | $ | 208,415,913 | ||||||
Class C | 463,482,585 | 194,301,750 | ||||||||
Institutional | 609,413,500 | 191,509,370 | ||||||||
Investor | 263,228,468 | 105,497,711 | ||||||||
Class P | 13,919,350 | 21,170,824 | ||||||||
Class R | — | 2,574,754 | ||||||||
Class R6 | 10,485,619 | 2,239,589 | ||||||||
Total Net Assets | $ | 1,675,480,586 | $ | 725,709,911 | ||||||
Shares Outstanding $0.001 par value (unlimited number of shares authorized): | ||||||||||
Class A | 13,305,505 | 18,637,371 | ||||||||
Class C | 19,929,133 | 17,099,702 | ||||||||
Institutional | 25,168,220 | 16,279,164 | ||||||||
Investor | 10,903,939 | 8,981,534 | ||||||||
Class P | 574,846 | 1,799,631 | ||||||||
Class R | — | 231,273 | ||||||||
Class R6 | 433,183 | 190,423 | ||||||||
Net asset value, offering and redemption price per share:(c) | ||||||||||
Class A | $23.67 | $11.18 | ||||||||
Class C | 23.26 | 11.36 | ||||||||
Institutional | 24.21 | 11.76 | ||||||||
Investor | 24.14 | 11.75 | ||||||||
Class P | 24.21 | 11.76 | ||||||||
Class R | — | 11.13 | ||||||||
Class R6 | 24.21 | 11.76 | ||||||||
| (a) | Includes loaned securities having a market value of $88,297 and $0, respectively. |
| (b) | Segregated for initial margin and/or collateral as follows: |
| Fund | Futures | Swaps | Options | |||||||||
Income Builder | $ | 4,066,312 | $ | 14,073,056 | $ | 1,000,000 | ||||||
Rising Dividend Growth | 990,989 | — | — | |||||||||
| (c) | Maximum public offering price per share for Class A Shares of the Income Builder and the Rising Dividend Growth Funds is $25.05 and $11.83, respectively. At redemption, Class C Shares may be subject to a contingent deferred sales charge, assessed on the amount equal to the lesser of the current net asset value or the original purchase price of the shares. |
| 36 | The accompanying notes are an integral part of these financial statements. |
GOLDMAN SACHS DIVIDEND FOCUS FUNDS
Statements of Operations
For the Fiscal Year Ended October 31, 2019
| Income Builder Fund | Rising Dividend Growth Fund | |||||||||
| Investment income: |
| |||||||||
Interest | $ | 52,500,309 | $ | 55,136 | ||||||
Dividends — unaffiliated issuers (net of foreign withholding taxes of $468,787 and $143,854) | 19,504,497 | 17,356,305 | ||||||||
Dividends — affiliated issuers | 3,173,508 | 477,899 | ||||||||
Securities lending income — affiliated issuer | 6,859 | 7,416 | ||||||||
| Total investment income | 75,185,173 | 17,896,756 | ||||||||
| Expenses: |
| |||||||||
Management fees | 8,527,320 | 6,589,156 | ||||||||
Distribution and Service fees(a) | 5,407,526 | 2,974,939 | ||||||||
Transfer Agency fees(a) | 2,020,329 | 1,181,393 | ||||||||
Custody, accounting and administrative services | 265,084 | 208,384 | ||||||||
Printing and mailing costs | 244,084 | 155,070 | ||||||||
Professional fees | 194,620 | 190,942 | ||||||||
Registration fees | 143,174 | 171,166 | ||||||||
Trustee fees | 18,635 | 17,382 | ||||||||
Shareholder meeting expense | 3,030 | 43,244 | ||||||||
Other | 31,578 | 34,273 | ||||||||
| Total expenses | 16,855,380 | 11,565,949 | ||||||||
Less — expense reductions | (790,277 | ) | (919,692 | ) | ||||||
| Net expenses | 16,065,103 | 10,646,257 | ||||||||
| NET INVESTMENT INCOME | 59,120,070 | 7,250,499 | ||||||||
| Realized and unrealized gain (loss): |
| |||||||||
Net realized gain (loss) from: | ||||||||||
Investments — unaffiliated issuers (including commission recapture of $5,226 and $0) | 7,776,267 | 66,874,792 | ||||||||
Investments — affiliated issuers | (2,462,924 | ) | — | |||||||
Futures contracts | 13,970,751 | 2,879,240 | ||||||||
Written options | (2,167,171 | ) | — | |||||||
Swap contracts | 25,102,090 | — | ||||||||
Forward foreign currency exchange contracts | 190,351 | — | ||||||||
Foreign currency transactions | 60,915 | 103 | ||||||||
Net change in unrealized gain (loss) on: | ||||||||||
Investments — unaffiliated issuers | 83,594,549 | (2,028,188 | ) | |||||||
Investments — affiliated issuers | 7,283,365 | — | ||||||||
Futures contracts | 4,727,229 | 2,479,726 | ||||||||
Unfunded loan commitments | (998 | ) | — | |||||||
Written options | (202,150 | ) | — | |||||||
Swap contracts | 5,354,071 | — | ||||||||
Forward foreign currency exchange contracts | (215,954 | ) | — | |||||||
Foreign currency translation | 3,084 | (72 | ) | |||||||
| Net realized and unrealized gain | 143,013,475 | 70,205,601 | ||||||||
| NET INCREASE IN NET ASSETS RESULTING FROM OPERATIONS | $ | 202,133,545 | $ | 77,456,100 | ||||||
| (a) | Class specific Distribution and Service and Transfer Agency fees were as follows: |
| Distribution and Service Fees | Transfer Agency Fees | |||||||||||||||||||||||||||||||||||||||
Fund | Class A | Class C | Class R | Class A | Class C | Institutional | Investor | Class P | Class R | Class R6 | ||||||||||||||||||||||||||||||
Income Builder | $ | 760,342 | $ | 4,647,184 | $ | — | $ | 536,948 | $ | 820,826 | $ | 246,416 | $ | 409,823 | $ | 3,943 | $ | — | $ | 2,373 | ||||||||||||||||||||
Rising Dividend Growth | 560,909 | 2,399,801 | 14,229 | 396,621 | 424,997 | 99,133 | 247,638 | 7,432 | 5,033 | 539 | ||||||||||||||||||||||||||||||
| The accompanying notes are an integral part of these financial statements. | 37 |
GOLDMAN SACHS DIVIDEND FOCUS FUNDS
Statements of Changes in Net Assets
| Income Builder Fund | Rising Dividend Growth Fund | |||||||||||||||||||||
| For the Fiscal Year Ended October 31, 2019 | For the Fiscal Year Ended October 31, 2018 | For the Fiscal Year Ended October 31, 2019 | For the Fiscal Year Ended October 31, 2018 | |||||||||||||||||||
| From operations: |
| |||||||||||||||||||||
Net investment income | $ | 59,120,070 | $ | 68,390,555 | $ | 7,250,499 | $ | 6,671,563 | ||||||||||||||
Net realized gain | 42,470,279 | 25,984,073 | 69,754,135 | 534,353,974 | ||||||||||||||||||
Net change in unrealized gain (loss) | 100,543,196 | (111,004,711 | ) | 451,466 | (419,146,159 | ) | ||||||||||||||||
| Net increase (decrease) in net assets resulting from operations | 202,133,545 | (16,630,083 | ) | 77,456,100 | 121,879,378 | |||||||||||||||||
| Distributions to shareholders: |
| |||||||||||||||||||||
From distributable earnings | ||||||||||||||||||||||
Class A Shares | (11,236,076 | ) | (12,517,684 | ) | (122,698,079 | ) | (68,626,546 | ) | ||||||||||||||
Class C Shares | (13,981,530 | ) | (16,065,974 | ) | (142,610,726 | ) | (81,567,378 | ) | ||||||||||||||
Institutional Shares | (24,548,602 | ) | (29,183,012 | ) | (164,809,422 | ) | (124,315,111 | ) | ||||||||||||||
Investor Shares | (8,998,284 | ) | (10,376,835 | ) | (83,957,904 | ) | (63,337,794 | ) | ||||||||||||||
Class P Shares(a) | (523,868 | ) | (266,588 | ) | (16,342,234 | ) | (714,643 | ) | ||||||||||||||
Class R Shares | — | — | (1,522,397 | ) | (876,021 | ) | ||||||||||||||||
Class R6 Shares(b) | (325,169 | ) | (1,664 | ) | (57,671 | ) | (206 | ) | ||||||||||||||
From capital | ||||||||||||||||||||||
Class A Shares | — | (396,253 | ) | — | — | |||||||||||||||||
Class C Shares | — | (629,266 | ) | — | — | |||||||||||||||||
Institutional Shares | — | (848,901 | ) | — | — | |||||||||||||||||
Investor Shares | — | (312,980 | ) | — | — | |||||||||||||||||
Class P Shares(a) | — | (13,057 | ) | — | — | |||||||||||||||||
Class R6 Shares(b) | — | (50 | ) | — | — | |||||||||||||||||
| Total distributions to shareholders | (59,613,529 | ) | (70,612,264 | ) | (531,998,433 | ) | (339,437,699 | ) | ||||||||||||||
| From share transactions: |
| |||||||||||||||||||||
Proceeds from sales of shares | 385,979,825 | 362,634,067 | 177,494,764 | 177,893,913 | ||||||||||||||||||
Reinvestment of distributions | 53,137,972 | 63,231,528 | 475,127,949 | 302,328,491 | ||||||||||||||||||
Cost of shares redeemed | (627,911,281 | ) | (744,673,467 | ) | (815,636,639 | ) | (879,243,018 | ) | ||||||||||||||
| Net decrease in net assets resulting from share transactions | (188,793,484 | ) | (318,807,872 | ) | (163,013,926 | ) | (399,020,614 | ) | ||||||||||||||
| TOTAL DECREASE | (46,273,468 | ) | (406,050,219 | ) | (617,556,259 | ) | (616,578,935 | ) | ||||||||||||||
| Net assets: |
| |||||||||||||||||||||
Beginning of year | 1,721,754,054 | 2,127,804,273 | 1,343,266,170 | 1,959,845,105 | ||||||||||||||||||
End of year | $ | 1,675,480,586 | $ | 1,721,754,054 | $ | 725,709,911 | $ | 1,343,266,170 | ||||||||||||||
| (a) | Commenced operations on April 16, 2018. |
| (b) | Commenced operations on February 28, 2018 for the Rising Dividend Growth Fund. |
| 38 | The accompanying notes are an integral part of these financial statements. |
GOLDMAN SACHS INCOME BUILDER FUND
Selected Share Data for a Share Outstanding Throughout Each Year
| Goldman Sachs Income Builder Fund | ||||||||||||||||||||||
| Class A | ||||||||||||||||||||||
| Year Ended October 31, | ||||||||||||||||||||||
| 2019 | 2018 | 2017 | 2016 | 2015 | ||||||||||||||||||
| Per Share Data |
| |||||||||||||||||||||
Net asset value, beginning of year | $ | 21.67 | $ | 22.72 | $ | 21.60 | $ | 21.77 | $ | 22.83 | ||||||||||||
Net investment income(a) | 0.82 | 0.80 | 0.79 | 0.79 | 0.84 | |||||||||||||||||
Net realized and unrealized gain (loss) | 2.02 | (1.02 | ) | 1.17 | (0.16 | ) | (0.99 | ) | ||||||||||||||
Total from investment operations | 2.84 | (0.22 | ) | 1.96 | 0.63 | (0.15 | ) | |||||||||||||||
Distributions to shareholders from net investment income | (0.84 | ) | (0.80 | ) | (0.80 | ) | (0.80 | ) | (0.82 | ) | ||||||||||||
Distributions to shareholders from return of capital | — | (0.03 | ) | (0.04 | ) | — | (0.09 | ) | ||||||||||||||
Total distributions | (0.84 | ) | (0.83 | ) | (0.84 | ) | (0.80 | ) | (0.91 | ) | ||||||||||||
Net asset value, end of year | $ | 23.67 | $ | 21.67 | $ | 22.72 | $ | 21.60 | $ | 21.77 | ||||||||||||
| Total return(b) | 13.34 | % | (1.03 | )% | 9.21 | % | 3.04 | % | (0.70 | )% | ||||||||||||
Net assets, end of year (in 000s) | $ | 314,951 | $ | 309,719 | $ | 387,349 | $ | 574,574 | $ | 708,457 | ||||||||||||
Ratio of net expenses to average net assets | 0.95 | % | 0.97 | % | 0.98 | % | 0.98 | % | 0.97 | % | ||||||||||||
Ratio of total expenses to average net assets | 1.00 | % | 1.02 | % | 1.10 | % | 1.10 | % | 1.10 | % | ||||||||||||
Ratio of net investment income to average net assets | 3.63 | % | 3.54 | % | 3.55 | % | 3.75 | % | 3.73 | % | ||||||||||||
Portfolio turnover rate(c) | 47 | % | 42 | % | 51 | % | 80 | % | 57 | % | ||||||||||||
| (a) | Calculated based on the average shares outstanding methodology. |
| (b) | Assumes investment at the NAV at the beginning of the year, reinvestment of all dividends and distributions, a complete redemption of the investment at the NAV at the end of the year and no sales or redemption charges (if any). Total returns would be reduced if a sales or redemption charge was taken into account. Returns do not reflect the impact of taxes to shareholders relating to Fund distributions or the redemption of Fund shares. |
| (c) | The Fund’s portfolio turnover rate is calculated in accordance with regulatory requirements, without regard to transactions involving short term investments and certain derivatives. If such transactions were included, the Fund’s portfolio turnover rate may be higher. |
| The accompanying notes are an integral part of these financial statements. | 39 |
GOLDMAN SACHS INCOME BUILDER FUND
Financial Highlights(continued)
Selected Share Data for a Share Outstanding Throughout Each Year
| Goldman Sachs Income Builder Fund | ||||||||||||||||||||||
| Class C | ||||||||||||||||||||||
| Year Ended October 31, | ||||||||||||||||||||||
| 2019 | 2018 | 2017 | 2016 | 2015 | ||||||||||||||||||
| Per Share Data |
| |||||||||||||||||||||
Net asset value, beginning of year | $ | 21.31 | $ | 22.35 | $ | 21.26 | $ | 21.45 | $ | 22.51 | ||||||||||||
Net investment income(a) | 0.64 | 0.62 | 0.61 | 0.62 | 0.66 | |||||||||||||||||
Net realized and unrealized gain (loss) | 1.98 | (1.00 | ) | 1.16 | (0.16 | ) | (0.98 | ) | ||||||||||||||
Total from investment operations | 2.62 | (0.38 | ) | 1.77 | 0.46 | (0.32 | ) | |||||||||||||||
Distributions to shareholders from net investment income | (0.67 | ) | (0.64 | ) | (0.65 | ) | (0.65 | ) | (0.66 | ) | ||||||||||||
Distributions to shareholders from return of capital | — | (0.02 | ) | (0.03 | ) | — | (0.08 | ) | ||||||||||||||
Total distributions | (0.67 | ) | (0.66 | ) | (0.68 | ) | (0.65 | ) | (0.74 | ) | ||||||||||||
Net asset value, end of year | $ | 23.26 | $ | 21.31 | $ | 22.35 | $ | 21.26 | $ | 21.45 | ||||||||||||
| Total return(b) | 12.44 | % | (1.74 | )% | 8.41 | % | 2.25 | % | (1.44 | )% | ||||||||||||
Net assets, end of year (in 000s) | $ | 463,483 | $ | 475,897 | $ | 619,357 | $ | 682,819 | $ | 704,566 | ||||||||||||
Ratio of net expenses to average net assets | 1.70 | % | 1.72 | % | 1.73 | % | 1.73 | % | 1.72 | % | ||||||||||||
Ratio of total expenses to average net assets | 1.75 | % | 1.77 | % | 1.85 | % | 1.85 | % | 1.85 | % | ||||||||||||
Ratio of net investment income to average net assets | 2.88 | % | 2.79 | % | 2.79 | % | 2.98 | % | 2.98 | % | ||||||||||||
Portfolio turnover rate(c) | 47 | % | 42 | % | 51 | % | 80 | % | 57 | % | ||||||||||||
| (a) | Calculated based on the average shares outstanding methodology. |
| (b) | Assumes investment at the NAV at the beginning of the year, reinvestment of all dividends and distributions, a complete redemption of the investment at the NAV at the end of the year and no sales or redemption charges (if any). Total returns would be reduced if a sales or redemption charge was taken into account. Returns do not reflect the impact of taxes to shareholders relating to Fund distributions or the redemption of Fund shares. |
| (c) | The Fund’s portfolio turnover rate is calculated in accordance with regulatory requirements, without regard to transactions involving short term investments and certain derivatives. If such transactions were included, the Fund’s portfolio turnover rate may be higher. |
| 40 | The accompanying notes are an integral part of these financial statements. |
GOLDMAN SACHS INCOME BUILDER FUND
Financial Highlights(continued)
Selected Share Data for a Share Outstanding Throughout Each Year
| Goldman Sachs Income Builder Fund | ||||||||||||||||||||||
| Institutional | ||||||||||||||||||||||
| Year Ended October 31, | ||||||||||||||||||||||
| 2019 | 2018 | 2017 | 2016 | 2015 | ||||||||||||||||||
| Per Share Data |
| |||||||||||||||||||||
Net asset value, beginning of year | $ | 22.15 | $ | 23.20 | $ | 22.04 | $ | 22.20 | $ | 23.25 | ||||||||||||
Net investment income(a) | 0.93 | 0.90 | 0.90 | 0.89 | 0.94 | |||||||||||||||||
Net realized and unrealized gain (loss) | 2.06 | (1.03 | ) | 1.19 | (0.17 | ) | (0.99 | ) | ||||||||||||||
Total from investment operations | 2.99 | (0.13 | ) | 2.09 | 0.72 | (0.05 | ) | |||||||||||||||
Distributions to shareholders from net investment income | (0.93 | ) | (0.89 | ) | (0.88 | ) | (0.88 | ) | (0.90 | ) | ||||||||||||
Distributions to shareholders from return of capital | — | (0.03 | ) | (0.05 | ) | — | (0.10 | ) | ||||||||||||||
Total distributions | (0.93 | ) | (0.92 | ) | (0.93 | ) | (0.88 | ) | (1.00 | ) | ||||||||||||
Net asset value, end of year | $ | 24.21 | $ | 22.15 | $ | 23.20 | $ | 22.04 | $ | 22.20 | ||||||||||||
| Total return(b) | 13.76 | % | (0.63 | )% | 9.64 | % | 3.42 | % | (0.25 | )% | ||||||||||||
Net assets, end of year (in 000s) | $ | 609,414 | $ | 680,661 | $ | 818,309 | $ | 740,182 | $ | 766,537 | ||||||||||||
Ratio of net expenses to average net assets | 0.57 | % | 0.58 | % | 0.58 | % | 0.58 | % | 0.57 | % | ||||||||||||
Ratio of total expenses to average net assets | 0.61 | % | 0.63 | % | 0.70 | % | 0.70 | % | 0.70 | % | ||||||||||||
Ratio of net investment income to average net assets | 4.03 | % | 3.93 | % | 3.93 | % | 4.13 | % | 4.13 | % | ||||||||||||
Portfolio turnover rate(c) | 47 | % | 42 | % | 51 | % | 80 | % | 57 | % | ||||||||||||
| (a) | Calculated based on the average shares outstanding methodology. |
| (b) | Assumes investment at the NAV at the beginning of the year, reinvestment of all dividends and distributions, a complete redemption of the investment at the NAV at the end of the year and no sales or redemption charges (if any). Total returns would be reduced if a sales or redemption charge was taken into account. Returns do not reflect the impact of taxes to shareholders relating to Fund distributions or the redemption of Fund shares. |
| (c) | The Fund’s portfolio turnover rate is calculated in accordance with regulatory requirements, without regard to transactions involving short term investments and certain derivatives. If such transactions were included, the Fund’s portfolio turnover rate may be higher. |
| The accompanying notes are an integral part of these financial statements. | 41 |
GOLDMAN SACHS INCOME BUILDER FUND
Financial Highlights(continued)
Selected Share Data for a Share Outstanding Throughout Each Year
| Goldman Sachs Income Builder Fund | ||||||||||||||||||||||
| Investor | ||||||||||||||||||||||
| Year Ended October 31, | ||||||||||||||||||||||
| 2019 | 2018 | 2017 | 2016 | 2015 | ||||||||||||||||||
| Per Share Data |
| |||||||||||||||||||||
Net asset value, beginning of year | $ | 22.09 | $ | 23.14 | $ | 21.98 | $ | 22.14 | $ | 23.20 | ||||||||||||
Net investment income(a) | 0.89 | 0.87 | 0.86 | 0.85 | 0.91 | |||||||||||||||||
Net realized and unrealized gain (loss) | 2.05 | (1.03 | ) | 1.20 | (0.16 | ) | (1.01 | ) | ||||||||||||||
Total from investment operations | 2.94 | (0.16 | ) | 2.06 | 0.69 | (0.10 | ) | |||||||||||||||
Distributions to shareholders from net investment income | (0.89 | ) | (0.86 | ) | (0.85 | ) | (0.85 | ) | (0.86 | ) | ||||||||||||
Distributions to shareholders from return of capital | — | (0.03 | ) | (0.05 | ) | — | (0.10 | ) | ||||||||||||||
Total distributions | (0.89 | ) | (0.89 | ) | (0.90 | ) | (0.85 | ) | (0.96 | ) | ||||||||||||
Net asset value, end of year | $ | 24.14 | $ | 22.09 | $ | 23.14 | $ | 21.98 | $ | 22.14 | ||||||||||||
| Total return(b) | 13.59 | % | (0.77 | )% | 9.51 | % | 3.28 | % | (0.45 | )% | ||||||||||||
Net assets, end of year (in 000s) | $ | 263,228 | $ | 239,226 | $ | 302,778 | $ | 142,813 | $ | 130,575 | ||||||||||||
Ratio of net expenses to average net assets | 0.70 | % | 0.72 | % | 0.73 | % | 0.73 | % | 0.72 | % | ||||||||||||
Ratio of total expenses to average net assets | 0.75 | % | 0.77 | % | 0.85 | % | 0.85 | % | 0.85 | % | ||||||||||||
Ratio of net investment income to average net assets | 3.87 | % | 3.79 | % | 3.77 | % | 3.96 | % | 3.98 | % | ||||||||||||
Portfolio turnover rate(c) | 47 | % | 42 | % | 51 | % | 80 | % | 57 | % | ||||||||||||
| (a) | Calculated based on the average shares outstanding methodology. |
| (b) | Assumes investment at the NAV at the beginning of the year, reinvestment of all dividends and distributions, a complete redemption of the investment at the NAV at the end of the year and no sales or redemption charges (if any). Total returns would be reduced if a sales or redemption charge was taken into account. Returns do not reflect the impact of taxes to shareholders relating to Fund distributions or the redemption of Fund shares. |
| (c) | The Fund’s portfolio turnover rate is calculated in accordance with regulatory requirements, without regard to transactions involving short term investments and certain derivatives. If such transactions were included, the Fund’s portfolio turnover rate may be higher. |
| 42 | The accompanying notes are an integral part of these financial statements. |
GOLDMAN SACHS INCOME BUILDER FUND
Financial Highlights(continued)
Selected Share Data for a Share Outstanding Throughout Each Period
| Goldman Sachs Income Builder Fund | ||||||||||
| Class P Shares | ||||||||||
| Period Ended October 31, 2019 | Period Ended October 31, 2018(a) | |||||||||
| Per Share Data |
| |||||||||
Net asset value, beginning of period | $ | 22.15 | $ | 22.95 | ||||||
Net investment income(b) | 0.94 | 0.45 | ||||||||
Net realized and unrealized gain (loss) | 2.05 | (0.71 | ) | |||||||
Total from investment operations | 2.99 | (0.26 | ) | |||||||
Distributions to shareholders from net investment income | (0.93 | ) | (0.51 | ) | ||||||
Distributions to shareholders from return of capital | — | (0.03 | ) | |||||||
Total distributions | (0.93 | ) | (0.54 | ) | ||||||
Net asset value, end of period | $ | 24.21 | $ | 22.15 | ||||||
| Total return(c) | 13.77 | % | (1.18 | )% | ||||||
Net assets, end of period (in 000s) | $ | 13,919 | $ | 16,122 | ||||||
Ratio of net expenses to average net assets | 0.56 | % | 0.58 | %(d) | ||||||
Ratio of total expenses to average net assets | 0.61 | % | 0.58 | %(d) | ||||||
Ratio of net investment income to average net assets | 4.04 | % | 3.60 | %(d) | ||||||
Portfolio turnover rate(e) | 47 | % | 42 | % | ||||||
| (a) | Commenced operations on April 16, 2018. |
| (b) | Calculated based on the average shares outstanding methodology. |
| (c) | Assumes investment at the NAV at the beginning of the period, reinvestment of all dividends and distributions, a complete redemption of the investment at the NAV at the end of the period and no sales or redemption charges (if any). Total returns would be reduced if a sales or redemption charge was taken into account. Returns do not reflect the impact of taxes to shareholders relating to Fund distributions or the redemption of Fund shares. Total returns for periods less than one full period are not annualized. |
| (d) | Annualized. |
| (e) | The Fund’s portfolio turnover rate is calculated in accordance with regulatory requirements, without regard to transactions involving short term investments and certain derivatives. If such transactions were included, the Fund’s portfolio turnover rate may be higher. |
| The accompanying notes are an integral part of these financial statements. | 43 |
GOLDMAN SACHS INCOME BUILDER FUND
Financial Highlights(continued)
Selected Share Data for a Share Outstanding Throughout Each Period
| Goldman Sachs Income Builder Fund | ||||||||||||||||||||||
| Class R6 Shares | ||||||||||||||||||||||
| Period Ended October 31, | For the Period Ended | |||||||||||||||||||||
| 2019 | 2018 | 2017 | 2016 | |||||||||||||||||||
| Per Share Data |
| |||||||||||||||||||||
Net asset value, beginning of period | $ | 22.15 | $ | 23.20 | $ | 22.04 | $ | 22.20 | $ | 22.83 | ||||||||||||
Net investment income(b) | 0.93 | 0.85 | 0.90 | 0.89 | 0.18 | |||||||||||||||||
Net realized and unrealized gain (loss) | 2.06 | (0.98 | ) | 1.19 | (0.17 | ) | (0.56 | ) | ||||||||||||||
Total from investment operations | 2.99 | (0.13 | ) | 2.09 | 0.72 | (0.38 | ) | |||||||||||||||
Distributions to shareholders from net investment income | (0.93 | ) | (0.89 | ) | (0.88 | ) | (0.88 | ) | (0.22 | ) | ||||||||||||
Distributions to shareholders from return of capital | — | (0.03 | ) | (0.05 | ) | — | (0.03 | ) | ||||||||||||||
Total distributions | (0.93 | ) | (0.92 | ) | (0.93 | ) | (0.88 | ) | (0.25 | ) | ||||||||||||
Net asset value, end of period | $ | 24.21 | $ | 22.15 | $ | 23.20 | $ | 22.04 | $ | 22.20 | ||||||||||||
| Total return(c) | 13.72 | % | (0.62 | )% | 9.69 | % | 3.38 | % | (1.63 | )% | ||||||||||||
Net assets, end of period (in 000s) | $ | 10,486 | $ | 130 | $ | 11 | $ | 10 | $ | 10 | ||||||||||||
Ratio of net expenses to average net assets | 0.56 | % | 0.57 | % | 0.57 | % | 0.58 | % | 0.58 | %(d) | ||||||||||||
Ratio of total expenses to average net assets | 0.61 | % | 0.61 | % | 0.69 | % | 0.70 | % | 0.69 | %(d) | ||||||||||||
Ratio of net investment income to average net assets | 3.96 | % | 3.72 | % | 3.93 | % | 4.12 | % | 3.15 | %(d) | ||||||||||||
Portfolio turnover rate(e) | 47 | % | 42 | % | 51 | % | 80 | % | 57 | % | ||||||||||||
| (a) | Commenced operations on July 31, 2015. |
| (b) | Calculated based on the average shares outstanding methodology. |
| (c) | Assumes investment at the NAV at the beginning of the period, reinvestment of all dividends and distributions, a complete redemption of the investment at the NAV at the end of the period and no sales or redemption charges (if any). Total returns would be reduced if a sales or redemption charge was taken into account. Returns do not reflect the impact of taxes to shareholders relating to Fund distributions or the redemption of Fund shares. Total returns for periods less than one full period are not annualized. |
| (d) | Annualized. |
| (e) | The Fund’s portfolio turnover rate is calculated in accordance with regulatory requirements, without regard to transactions involving short term investments and certain derivatives. If such transactions were included, the Fund’s portfolio turnover rate may be higher. |
| 44 | The accompanying notes are an integral part of these financial statements. |
GOLDMAN SACHS RISING DIVIDEND GROWTH FUND
Financial Highlights(continued)
Selected Share Data for a Share Outstanding Throughout Each Year
| Goldman Sachs Rising Dividend Growth Fund | ||||||||||||||||||||||
| Class A | ||||||||||||||||||||||
| Year Ended October 31, | ||||||||||||||||||||||
| 2019 | 2018 | 2017 | 2016 | 2015 | ||||||||||||||||||
| Per Share Data |
| |||||||||||||||||||||
Net asset value, beginning of year | $ | 19.56 | $ | 22.54 | $ | 19.66 | $ | 20.68 | $ | 21.25 | ||||||||||||
Net investment income(a) | 0.10 | 0.09 | 0.11 | 0.07 | 0.06 | |||||||||||||||||
Net realized and unrealized gain (loss) | 0.78 | 1.25 | 3.48 | (0.83 | ) | (0.42 | ) | |||||||||||||||
Total from investment operations | 0.88 | 1.34 | 3.59 | (0.76 | ) | (0.36 | ) | |||||||||||||||
Distributions to shareholders from net investment income | (0.22 | ) | (0.28 | ) | (0.25 | ) | (0.12 | ) | (0.10 | ) | ||||||||||||
Distributions to shareholders from net realized gains | (9.04 | ) | (4.04 | ) | (0.46 | ) | (0.14 | ) | — | |||||||||||||
Distributions to shareholders from return of capital | — | — | — | — | (0.11 | ) | ||||||||||||||||
Total distributions | (9.26 | ) | (4.32 | ) | (0.71 | ) | (0.26 | ) | (0.21 | ) | ||||||||||||
Net asset value, end of year | $ | 11.18 | $ | 19.56 | $ | 22.54 | $ | 19.66 | $ | 20.68 | ||||||||||||
| Total return(b) | 10.41 | % | 6.27 | % | 18.59 | % | (3.71 | )% | (1.72 | )% | ||||||||||||
Net assets, end of year (in 000s) | $ | 208,416 | $ | 297,772 | $ | 370,204 | $ | 697,430 | $ | 1,054,093 | ||||||||||||
Ratio of net expenses to average net assets | 1.15 | % | 1.17 | % | 1.16 | % | 1.14 | % | 1.13 | % | ||||||||||||
Ratio of total expenses to average net assets | 1.27 | % | 1.20 | % | 1.19 | % | 1.16 | % | 1.15 | % | ||||||||||||
Ratio of net investment income to average net assets | 0.86 | % | 0.42 | % | 0.52 | % | 0.35 | % | 0.28 | % | ||||||||||||
Portfolio turnover rate(c) | 45 | % | 101 | % | 45 | % | 16 | % | 25 | % | ||||||||||||
| (a) | Calculated based on the average shares outstanding methodology. |
| (b) | Assumes investment at the NAV at the beginning of the year, reinvestment of all dividends and distributions, a complete redemption of the investment at the NAV at the end of the year and no sales or redemption charges (if any). Total returns would be reduced if a sales or redemption charge was taken into account. Returns do not reflect the impact of taxes to shareholders relating to Fund distributions or the redemption of Fund shares. |
| (c) | The Fund’s portfolio turnover rate is calculated in accordance with regulatory requirements, without regard to transactions involving short term investments and certain derivatives. If such transactions were included, the Fund’s portfolio turnover rate may be higher. |
| The accompanying notes are an integral part of these financial statements. | 45 |
GOLDMAN SACHS RISING DIVIDEND GROWTH FUND
Financial Highlights(continued)
Selected Share Data for a Share Outstanding Throughout Each Year
| Goldman Sachs Rising Dividend Growth Fund | ||||||||||||||||||||||
| Class C | ||||||||||||||||||||||
| Year Ended October 31, | ||||||||||||||||||||||
| 2019 | 2018 | 2017 | 2016 | 2015 | ||||||||||||||||||
| Per Share Data |
| |||||||||||||||||||||
Net asset value, beginning of year | $ | 19.71 | $ | 22.69 | $ | 19.79 | $ | 20.84 | $ | 21.41 | ||||||||||||
Net investment income (loss)(a) | 0.01 | (0.07 | ) | (0.05 | ) | (0.08 | ) | (0.10 | ) | |||||||||||||
Net realized and unrealized gain (loss) | 0.80 | 1.26 | 3.50 | (0.84 | ) | (0.42 | ) | |||||||||||||||
Total from investment operations | 0.81 | 1.19 | 3.45 | (0.92 | ) | (0.52 | ) | |||||||||||||||
Distributions to shareholders from net investment income | (0.12 | ) | (0.13 | ) | (0.13 | ) | (0.06 | ) | (0.02 | ) | ||||||||||||
Distributions to shareholders from net realized gains | (9.04 | ) | (4.04 | ) | (0.42 | ) | (0.07 | ) | — | |||||||||||||
Distributions to shareholders from return of capital | — | — | — | — | (0.03 | ) | ||||||||||||||||
Total distributions | (9.16 | ) | (4.17 | ) | (0.55 | ) | (0.13 | ) | (0.05 | ) | ||||||||||||
Net asset value, end of year | $ | 11.36 | $ | 19.71 | $ | 22.69 | $ | 19.79 | $ | 20.84 | ||||||||||||
| Total return(b) | 9.55 | % | 5.49 | % | 17.68 | % | (4.43 | )% | (2.44 | )% | ||||||||||||
Net assets, end of year (in 000s) | $ | 194,302 | $ | 348,220 | $ | 463,110 | $ | 571,438 | $ | 732,998 | ||||||||||||
Ratio of net expenses to average net assets | 1.90 | % | 1.92 | % | 1.91 | % | 1.89 | % | 1.88 | % | ||||||||||||
Ratio of total expenses to average net assets | 2.02 | % | 1.95 | % | 1.94 | % | 1.91 | % | 1.90 | % | ||||||||||||
Ratio of net investment income (loss) to average net assets | 0.12 | % | (0.33 | )% | (0.23 | )% | (0.40 | )% | (0.47 | )% | ||||||||||||
Portfolio turnover rate(c) | 45 | % | 101 | % | 45 | % | 16 | % | 25 | % | ||||||||||||
| (a) | Calculated based on the average shares outstanding methodology. |
| (b) | Assumes investment at the NAV at the beginning of the year, reinvestment of all dividends and distributions, a complete redemption of the investment at the NAV at the end of the year and no sales or redemption charges (if any). Total returns would be reduced if a sales or redemption charge was taken into account. Returns do not reflect the impact of taxes to shareholders relating to Fund distributions or the redemption of Fund shares. |
| (c) | The Fund’s portfolio turnover rate is calculated in accordance with regulatory requirements, without regard to transactions involving short term investments and certain derivatives. If such transactions were included, the Fund’s portfolio turnover rate may be higher. |
| 46 | The accompanying notes are an integral part of these financial statements. |
GOLDMAN SACHS RISING DIVIDEND GROWTH FUND
Financial Highlights(continued)
Selected Share Data for a Share Outstanding Throughout Each Year
| Goldman Sachs Rising Dividend Growth Fund | ||||||||||||||||||||||
| Institutional | ||||||||||||||||||||||
| Year Ended October 31, | ||||||||||||||||||||||
| 2019 | 2018 | 2017 | 2016 | 2015 | ||||||||||||||||||
| Per Share Data |
| |||||||||||||||||||||
Net asset value, beginning of year | $ | 20.08 | $ | 23.02 | $ | 20.08 | $ | 21.12 | $ | 21.69 | ||||||||||||
Net investment income(a) | 0.15 | 0.18 | 0.20 | 0.15 | 0.15 | |||||||||||||||||
Net realized and unrealized gain (loss) | 0.83 | 1.28 | 3.55 | (0.85 | ) | (0.43 | ) | |||||||||||||||
Total from investment operations | 0.98 | 1.46 | 3.75 | (0.70 | ) | (0.28 | ) | |||||||||||||||
Distributions to shareholders from net investment income | (0.26 | ) | (0.36 | ) | (0.31 | ) | (0.15 | ) | (0.14 | ) | ||||||||||||
Distributions to shareholders from net realized gains | (9.04 | ) | (4.04 | ) | (0.50 | ) | (0.19 | ) | — | |||||||||||||
Distributions to shareholders from return of capital | — | — | — | — | (0.15 | ) | ||||||||||||||||
Total distributions | (9.30 | ) | (4.40 | ) | (0.81 | ) | (0.34 | ) | (0.29 | ) | ||||||||||||
Net asset value, end of year | $ | 11.76 | $ | 20.08 | $ | 23.02 | $ | 20.08 | $ | 21.12 | ||||||||||||
| Total return(b) | 10.85 | % | 6.75 | % | 19.01 | % | (3.35 | )% | (1.29 | )% | ||||||||||||
Net assets, end of year (in 000s) | $ | 191,509 | $ | 425,555 | $ | 759,274 | $ | 958,317 | $ | 1,476,799 | ||||||||||||
Ratio of net expenses to average net assets | 0.80 | % | 0.78 | % | 0.76 | % | 0.74 | % | 0.73 | % | ||||||||||||
Ratio of total expenses to average net assets | 0.88 | % | 0.81 | % | 0.79 | % | 0.76 | % | 0.74 | % | ||||||||||||
Ratio of net investment income to average net assets | 1.25 | % | 0.83 | % | 0.92 | % | 0.74 | % | 0.67 | % | ||||||||||||
Portfolio turnover rate(c) | 45 | % | 101 | % | 45 | % | 16 | % | 25 | % | ||||||||||||
| (a) | Calculated based on the average shares outstanding methodology. |
| (b) | Assumes investment at the NAV at the beginning of the year, reinvestment of all dividends and distributions, a complete redemption of the investment at the NAV at the end of the year and no sales or redemption charges (if any). Total returns would be reduced if a sales or redemption charge was taken into account. Returns do not reflect the impact of taxes to shareholders relating to Fund distributions or the redemption of Fund shares. |
| (c) | The Fund’s portfolio turnover rate is calculated in accordance with regulatory requirements, without regard to transactions involving short term investments and certain derivatives. If such transactions were included, the Fund’s portfolio turnover rate may be higher. |
| The accompanying notes are an integral part of these financial statements. | 47 |
GOLDMAN SACHS RISING DIVIDEND GROWTH FUND
Financial Highlights(continued)
Selected Share Data for a Share Outstanding Throughout Each Year
| Goldman Sachs Rising Dividend Growth Fund | ||||||||||||||||||||||
| Investor | ||||||||||||||||||||||
| Year Ended October 31, | ||||||||||||||||||||||
| 2019 | 2018 | 2017 | 2016 | 2015 | ||||||||||||||||||
| Per Share Data |
| |||||||||||||||||||||
Net asset value, beginning of year | $ | 20.07 | $ | 23.01 | $ | 20.07 | $ | 21.10 | $ | 21.68 | ||||||||||||
Net investment income(a) | 0.14 | 0.14 | 0.17 | 0.12 | 0.11 | |||||||||||||||||
Net realized and unrealized gain (loss) | 0.83 | 1.29 | 3.54 | (0.84 | ) | (0.43 | ) | |||||||||||||||
Total from investment operations | 0.97 | 1.43 | 3.71 | (0.72 | ) | (0.32 | ) | |||||||||||||||
Distributions to shareholders from net investment income | (0.25 | ) | (0.33 | ) | (0.27 | ) | (0.14 | ) | (0.13 | ) | ||||||||||||
Distributions to shareholders from net realized gains | (9.04 | ) | (4.04 | ) | (0.50 | ) | (0.17 | ) | — | |||||||||||||
Distributions to shareholders from return of capital | — | — | — | — | (0.13 | ) | ||||||||||||||||
Total distributions | (9.29 | ) | (4.37 | ) | (0.77 | ) | (0.31 | ) | (0.26 | ) | ||||||||||||
Net asset value, end of year | $ | 11.75 | $ | 20.07 | $ | 23.01 | $ | 20.07 | $ | 21.10 | ||||||||||||
| Total return(b) | 10.73 | % | 6.56 | % | 18.85 | % | (3.45 | )% | (1.49 | )% | ||||||||||||
Net assets, end of year (in 000s) | $ | 105,498 | $ | 227,158 | $ | 362,752 | $ | 272,442 | $ | 437,422 | ||||||||||||
Ratio of net expenses to average net assets | 0.90 | % | 0.92 | % | 0.91 | % | 0.89 | % | 0.88 | % | ||||||||||||
Ratio of total expenses to average net assets | 1.02 | % | 0.95 | % | 0.94 | % | 0.91 | % | 0.89 | % | ||||||||||||
Ratio of net investment income to average net assets | 1.13 | % | 0.68 | % | 0.79 | % | 0.59 | % | 0.53 | % | ||||||||||||
Portfolio turnover rate(c) | 45 | % | 101 | % | 45 | % | 16 | % | 25 | % | ||||||||||||
| (a) | Calculated based on the average shares outstanding methodology. |
| (b) | Assumes investment at the NAV at the beginning of the year, reinvestment of all dividends and distributions, a complete redemption of the investment at the NAV at the end of the year and no sales or redemption charges (if any). Total returns would be reduced if a sales or redemption charge was taken into account. Returns do not reflect the impact of taxes to shareholders relating to Fund distributions or the redemption of Fund shares. |
| (c) | The Fund’s portfolio turnover rate is calculated in accordance with regulatory requirements, without regard to transactions involving short term investments and certain derivatives. If such transactions were included, the Fund’s portfolio turnover rate may be higher. |
| 48 | The accompanying notes are an integral part of these financial statements. |
GOLDMAN SACHS RISING DIVIDEND GROWTH FUND
Financial Highlights(continued)
Selected Share Data for a Share Outstanding Throughout Each Period
| Goldman Sachs Rising Dividend Growth Fund | ||||||||||
| Class P Shares | ||||||||||
| Year Ended October 31, 2019 | Period Ended October 31, 2018(a) | |||||||||
| Per Share Data |
| |||||||||
Net asset value, beginning of period | $ | 20.08 | $ | 20.21 | ||||||
Net investment income (loss)(b) | 0.15 | (0.04 | ) | |||||||
Net realized and unrealized gain | 0.84 | 0.25 | ||||||||
Total from investment operations | 0.99 | 0.21 | ||||||||
Distributions to shareholders from net investment income | (0.27 | ) | (0.21 | ) | ||||||
Distributions to shareholders from net realized gains | (9.04 | ) | (0.13 | ) | ||||||
Total distributions | (9.31 | ) | (0.34 | ) | ||||||
Net asset value, end of period | $ | 11.76 | $ | 20.08 | ||||||
| Total return(c) | 10.86 | % | 1.03 | % | ||||||
Net assets, end of period (in 000s) | $ | 21,171 | $ | 41,067 | ||||||
Ratio of net expenses to average net assets | 0.79 | % | 0.77 | %(d) | ||||||
Ratio of total expenses to average net assets | 0.87 | % | 0.81 | %(d) | ||||||
Ratio of net investment income (loss) to average net assets | 1.24 | % | (0.37 | )%(d) | ||||||
Portfolio turnover rate(e) | 45 | % | 101 | % | ||||||
| (a) | Commenced operations on April 16, 2018. |
| (b) | Calculated based on the average shares outstanding methodology. |
| (c) | Assumes investment at the NAV at the beginning of the period, reinvestment of all dividends and distributions, a complete redemption of the investment at the NAV at the end of the period and no sales or redemption charges (if any). Total returns would be reduced if a sales or redemption charge was taken into account. Returns do not reflect the impact of taxes to shareholders relating to Fund distributions or the redemption of Fund shares. Total returns for periods less than one full year are not annualized. |
| (d) | Annualized. |
| (e) | The Fund’s portfolio turnover rate is calculated in accordance with regulatory requirements, without regard to transactions involving short term investments and certain derivatives. If such transactions were included, the Fund’s portfolio turnover rate may be higher. |
| The accompanying notes are an integral part of these financial statements. | 49 |
GOLDMAN SACHS RISING DIVIDEND GROWTH FUND
Financial Highlights(continued)
Selected Share Data for a Share Outstanding Throughout Each Year
| Goldman Sachs Rising Dividend Growth Fund | ||||||||||||||||||||||
| Class R | ||||||||||||||||||||||
| Year Ended October 31, | ||||||||||||||||||||||
| 2019 | 2018 | 2017 | 2016 | 2015 | ||||||||||||||||||
| Per Share Data |
| |||||||||||||||||||||
Net asset value, beginning of year | $ | 19.51 | $ | 22.49 | $ | 19.63 | $ | 20.66 | $ | 21.20 | ||||||||||||
Net investment income(a) | 0.07 | 0.04 | 0.06 | 0.02 | 0.01 | |||||||||||||||||
Net realized and unrealized gain (loss) | 0.78 | 1.25 | 3.47 | (0.84 | ) | (0.43 | ) | |||||||||||||||
Total from investment operations | 0.85 | 1.29 | 3.53 | (0.82 | ) | (0.42 | ) | |||||||||||||||
Distributions to shareholders from net investment income | (0.19 | ) | (0.23 | ) | (0.21 | ) | (0.08 | ) | (0.06 | ) | ||||||||||||
Distributions to shareholders from net realized gains | (9.04 | ) | (4.04 | ) | (0.46 | ) | (0.13 | ) | — | |||||||||||||
Distributions to shareholders from return of capital | — | — | — | — | (0.06 | ) | ||||||||||||||||
Total distributions | (9.23 | ) | (4.27 | ) | (0.67 | ) | (0.21 | ) | (0.12 | ) | ||||||||||||
Net asset value, end of year | $ | 11.13 | $ | 19.51 | $ | 22.49 | $ | 19.63 | $ | 20.66 | ||||||||||||
| Total return(b) | 10.08 | % | 6.07 | % | 18.27 | % | (3.96 | )% | (2.00 | )% | ||||||||||||
Net assets, end of year (in 000s) | $ | 2,575 | $ | 3,484 | $ | 4,506 | $ | 4,749 | $ | 3,740 | ||||||||||||
Ratio of net expenses to average net assets | 1.40 | % | 1.42 | % | 1.41 | % | 1.39 | % | 1.38 | % | ||||||||||||
Ratio of total expenses to average net assets | 1.52 | % | 1.45 | % | 1.44 | % | 1.41 | % | 1.39 | % | ||||||||||||
Ratio of net investment income to average net assets | 0.61 | % | 0.18 | % | 0.27 | % | 0.10 | % | 0.05 | % | ||||||||||||
Portfolio turnover rate(c) | 45 | % | 101 | % | 45 | % | 16 | % | 25 | % | ||||||||||||
| (a) | Calculated based on the average shares outstanding methodology. |
| (b) | Assumes investment at the NAV at the beginning of the year, reinvestment of all dividends and distributions, a complete redemption of the investment at the NAV at the end of the year and no sales or redemption charges (if any). Total returns would be reduced if a sales or redemption charge was taken into account. Returns do not reflect the impact of taxes to shareholders relating to Fund distributions or the redemption of Fund shares. |
| (c) | The Fund’s portfolio turnover rate is calculated in accordance with regulatory requirements, without regard to transactions involving short term investments and certain derivatives. If such transactions were included, the Fund’s portfolio turnover rate may be higher. |
| 50 | The accompanying notes are an integral part of these financial statements. |
GOLDMAN SACHS RISING DIVIDEND GROWTH FUND
Financial Highlights(continued)
Selected Share Data for a Share Outstanding Throughout Each Period
| Goldman Sachs Rising Dividend Growth Fund | ||||||||||
| Class R6 Shares | ||||||||||
| Year Ended October 31, 2019 | Period Ended October 31, 2018(a) | |||||||||
| Per Share Data |
| |||||||||
Net asset value, beginning of period | $ | 20.08 | $ | 20.18 | ||||||
Net investment income(b) | 0.14 | 0.02 | ||||||||
Net realized and unrealized gain | 0.85 | 0.29 | ||||||||
Total from investment operations | 0.99 | 0.31 | ||||||||
Distributions to shareholders from net investment income | (0.27 | ) | (0.28 | ) | ||||||
Distributions to shareholder from net realized gains | (9.04 | ) | (0.13 | ) | ||||||
Total distributions | (9.31 | ) | (0.41 | ) | ||||||
Net asset value, end of period | $ | 11.76 | $ | 20.08 | ||||||
| Total return(c) | 10.78 | % | 1.54 | % | ||||||
Net assets, end of period (in 000s) | $ | 2,240 | $ | 10 | ||||||
Ratio of net expenses to average net assets | 0.80 | % | 0.77 | %(d) | ||||||
Ratio of total expenses to average net assets | 0.89 | % | 0.80 | %(d) | ||||||
Ratio of net investment income to average net assets | 1.19 | % | 0.16 | %(d) | ||||||
Portfolio turnover rate(e) | 45 | % | 101 | % | ||||||
| (a) | Commenced operations on February 28, 2018. |
| (b) | Calculated based on the average shares outstanding methodology. |
| (c) | Assumes investment at the NAV at the beginning of the period, reinvestment of all dividends and distributions, a complete redemption of the investment at the NAV at the end of the period and no sales or redemption charges (if any). Total returns would be reduced if a sales or redemption charge was taken into account. Returns do not reflect the impact of taxes to shareholders relating to Fund distributions or the redemption of Fund shares. Total returns for periods less than one full year are not annualized. |
| (d) | Annualized. |
| (e) | The Fund’s portfolio turnover rate is calculated in accordance with regulatory requirements, without regard to transactions involving short term investments and certain derivatives. If such transactions were included, the Fund’s portfolio turnover rate may be higher. |
| The accompanying notes are an integral part of these financial statements. | 51 |
GOLDMAN SACHS DIVIDEND FOCUS FUNDS
October 31, 2019
| 1. ORGANIZATION |
Goldman Sachs Trust (the “Trust”) is a Delaware statutory trust registered under the Investment Company Act of 1940, as amended (the “Act”), as anopen-end management investment company. The following table lists those series of the Trust that are included in this report (collectively, the “Funds” or individually a “Fund”), along with their corresponding share classes and respective diversification status under the Act:
| Fund | Share Classes Offered | Diversified/ Non-diversified | ||
Income Builder | A, C, Institutional, Investor, P and R6 | Diversified | ||
| Rising Dividend Growth | A, C, Institutional, Investor, P, R and R6 | Diversified |
Class A Shares are sold with afront-end sales charge of up to 5.50%. Class C Shares are sold with contingent deferred sales charge (“CDSC”) of 1.00% which is imposed on redemptions made within 12 months of purchase. Institutional, Investor, Class P, Class R and Class R6 Shares are not subject to a sales charge.
Goldman Sachs Asset Management, L.P. (“GSAM”), an affiliate of Goldman Sachs & Co. LLC (“Goldman Sachs”), serves as investment adviser to the Fund pursuant to a management agreement (the “Agreement”) with the Trust. Dividend Assets Capital, LLC (“DAC” or the “Sub Adviser”) serves as thesub-adviser to the Rising Dividend Growth Fund. GSAM compensates theSub-Adviser directly in accordance with the terms of theSub-Advisory Agreement. The Fund is not charged any separate or additional investment advisory fees by theSub-Adviser.
| 2. SIGNIFICANT ACCOUNTING POLICIES |
The financial statements have been prepared in accordance with accounting principles generally accepted in the United States of America (“GAAP”) and require management to make estimates and assumptions that may affect the reported amounts and disclosures. Actual results may differ from those estimates and assumptions. Each Fund is an investment company under GAAP and follows the accounting and reporting guidance applicable to investment companies.
A. Investment Valuation— The Funds’ valuation policy is to value investments at fair value.
B. Investment Income and Investments— Investment income includes interest income, dividend income and securities lending income, if any. Interest income is accrued daily and adjusted for amortization of premiums and accretion of discounts. Dividend income is recognized onex-dividend date or, for certain foreign securities, as soon as such information is obtained subsequent to theex-dividend date. Non-cash dividends, if any, are recorded at the fair market value of the securities received. Investment transactions are reflected on trade date. Realized gains and losses are calculated using identified cost. Investment transactions are recorded on the following business day for daily net asset value (“NAV”) calculations. Investment income is recorded net of any foreign withholding taxes, less any amounts reclaimable. The Funds may file withholding tax reclaims in certain jurisdictions to recover a portion of amounts previously withheld. Any foreign capital gains tax is accrued daily based upon net unrealized gains, and is payable upon sale of such investments. Distributions received from the Funds’ investments in U.S. real estate investment trusts (“REITs”) may be characterized as ordinary income, net capital gain and/or a return of capital. A return of capital is recorded by the Funds as a reduction to the cost basis of the REIT. Distributions from master limited partnerships (“MLPs”) are generally recorded based on the characterization reported on the MLP’s tax return. A Fund records itspro-rata share of the income/loss and capital gains/losses, allocated from the underlying partnerships and adjusts the cost basis of the underlying partnerships accordingly. For derivative contracts, realized gains and losses are recorded upon settlement of the contract. Upfront payments, if any, are made or received upon entering into a swap agreement and are reflected in the Statements of Assets and Liabilities. Upfront payments are recognized over the contract’s term/event as realized gains or losses, with the exception of forward starting swap contracts whose realized gains or losses are recognized from the effective start date. For securities with paydown provisions, principal payments received are treated as a proportionate reduction to the cost basis of the securities, and excess or shortfall amounts are recorded as income.
52
GOLDMAN SACHS DIVIDEND FOCUS FUNDS
| 2. SIGNIFICANT ACCOUNTING POLICIES (continued) |
C. Class Allocations and Expenses — Investment income, realized and unrealized gain (loss), if any, andnon-class specific expenses of each Fund are allocated daily based upon the proportion of net assets of each class.Non-class specific expenses directly incurred by a Fund are charged to that Fund, while such expenses incurred by the Trust are allocated across the applicable Funds on a straight-line and/orpro-rata basis depending upon the nature of the expenses. Class specific expenses, where applicable, are borne by the respective share classes and include Distribution and Service, Transfer Agency and Service fees.
D. Federal Taxes and Distributions to Shareholders — It is each Fund’s policy to comply with the requirements of the Internal Revenue Code of 1986, as amended (the “Code”), applicable to regulated investment companies and to distribute each year substantially all of its investment company taxable income and capital gains to its shareholders. Accordingly, each Fund is not required to make any provisions for the payment of federal income tax. Distributions to shareholders are recorded on theex-dividend date. Income and capital gains distributions, if any, are declared according to the following schedule:
| Fund | Income Distributions Declared/Paid | Capital Gains Distributions Declared/Paid | ||||
Income Builder | Monthly | Annually | ||||
Rising Dividend Growth | Quarterly | Annually |
Net capital losses, if any, are carried forward to future fiscal years and may be used to the extent allowed by the Code to offset any future capital gains. Losses that are carried forward will retain their character as either short-term or long-term capital losses. Utilization of capital loss carryforwards will reduce the requirement of future capital gains distributions.
The characterization of distributions to shareholders for financial reporting purposes is determined in accordance with federal income tax rules, which may differ from GAAP. The source of each Fund’s distributions may be shown in the accompanying financial statements as either from distributable earnings or capital. Certain components of the Funds’ net assets on the Statements of Assets and Liabilities reflect permanent GAAP/tax differences based on the appropriate tax character.
E. Foreign Currency Translation — The accounting records and reporting currency of the Funds are maintained in U.S. dollars. Assets and liabilities denominated in foreign currencies are translated into U.S. dollars using the current exchange rates at the close of each business day. The effect of changes in foreign currency exchange rates on investments is included within net realized and unrealized gain (loss) on investments. Changes in the value of other assets and liabilities as a result of fluctuations in foreign exchange rates are included in the Statements of Operations within net change in unrealized gain (loss) on foreign currency translation. Transactions denominated in foreign currencies are translated into U.S. dollars on the date the transaction occurred, the effects of which are included within net realized gain (loss) on foreign currency transactions.
F. Commission Recapture — GSAM, on behalf of certain Funds, may direct portfolio trades, subject to seeking best execution, to various brokers who have agreed to rebate a portion of the commissions generated. Such rebates are made directly to a Fund as cash payments and are included in net realized gain (loss) from investments on the Statements of Operations.
| 3. INVESTMENTS AND FAIR VALUE MEASUREMENTS |
U.S. GAAP defines the fair value of a financial instrument as the amount that would be received to sell an asset or paid to transfer a liability in an orderly transaction between market participants at the measurement date (i.e., the exit price); the Funds’ policy is to use the market approach. GAAP establishes a fair value hierarchy that prioritizes the inputs to valuation techniques used to measure fair value. The hierarchy gives the highest priority to unadjusted quoted prices in active markets for identical assets or liabilities (Level 1 measurements) and the lowest priority to unobservable inputs (Level 3 measurements). The levels used for classifying investments are not necessarily an indication of the risk associated with investing in these investments. The three levels of the fair value hierarchy are described below:
Level 1 — Unadjusted quoted prices in active markets that are accessible at the measurement date for identical, unrestricted assets or liabilities;
53
GOLDMAN SACHS DIVIDEND FOCUS FUNDS
Notes to Financial Statements(continued)
October 31, 2019
| 3. INVESTMENTS AND FAIR VALUE MEASUREMENTS (continued) |
Level 2 — Quoted prices in markets that are not active or financial instruments for which significant inputs are observable (including, but not limited to, quoted prices for similar investments, interest rates, foreign exchange rates, volatility and credit spreads), either directly or indirectly;
Level 3 — Prices or valuations that require significant unobservable inputs (including GSAM’s assumptions in determining fair value measurement).
The Board of Trustees (“Trustees”) has approved Valuation Procedures that govern the valuation of the portfolio investments held by the Funds, including investments for which market quotations are not readily available. The Trustees have delegated to GSAMday-to-day responsibility for implementing and maintaining internal controls and procedures related to the valuation of the Funds’ investments. To assess the continuing appropriateness of pricing sources and methodologies, GSAM regularly performs price verification procedures and issues challenges as necessary to third party pricing vendors or brokers, and any differences are reviewed in accordance with the Valuation Procedures.
A. Level 1 and Level 2 Fair Value Investments — The valuation techniques and significant inputs used in determining the fair values for investments classified as Level 1 and Level 2 are as follows:
Equity Securities — Equity securities traded on a United States (“U.S.”) securities exchange or the NASDAQ system, or those located on certain foreign exchanges, including but not limited to the Americas, are valued daily at their last sale price or official closing price on the principal exchange or system on which they are traded. If there is no sale or official closing price or such price is believed by GSAM to not represent fair value, equity securities may be valued at the closing bid price for long positions and at the closing ask price for short positions. To the extent these investments are actively traded, they are classified as Level 1 of the fair value hierarchy, otherwise they are generally classified as Level 2.
Unlisted equity securities for which market quotations are available are valued at the last sale price on the valuation date, or if no sale occurs, at the last bid price for long positions or the last ask price for short positions, and are generally classified as Level 2. Securities traded on certain foreign securities exchanges are valued daily at fair value determined by an independent fair value service (if available) under Valuation Procedures approved by the Trustees and consistent with applicable regulatory guidance. The independent fair value service takes into account multiple factors including, but not limited to, movements in the securities markets, certain depositary receipts, futures contracts and foreign currency exchange rates that have occurred subsequent to the close of the foreign securities exchange. These investments are generally classified as Level 2 of the fair value hierarchy.
Underlying Funds (including Money Market Funds) — Underlying funds (“Underlying Funds”) include other investment companies. Investments in the Underlying Funds are valued at the NAV per share on the day of valuation. Because the Funds invest in Underlying Funds that fluctuate in value, the Funds’ shares will correspondingly fluctuate in value. To the extent these investments are actively traded, they are classified as Level 1 of the fair value hierarchy, otherwise they are generally classified as Level 2. For information regarding an Underlying Fund’s accounting policies and investment holdings, please see the Underlying Fund’s shareholder report.
Debt Securities — Debt securities for which market quotations are readily available are valued daily on the basis of quotations supplied by dealers or an independent pricing service approved by the Trustees. The pricing services may use valuation models or matrix pricing, which consider: (i) yield or price with respect to bonds that are considered comparable in characteristics such as rating, interest rate and maturity date or (ii) quotations from securities dealers to determine current value. With the exception of treasury securities of G7 countries, which are generally classified as Level 1, these investments are generally classified as Level 2 of the fair value hierarchy.
i. Bank Loans — Bank loans (“Loans”) are interests in amounts owed by corporate, governmental, or other borrowers to lenders or lending syndicates. Loans are arranged through private negotiations between the borrower and one or more financial institutions (“Lenders”). A Fund’s investments in Loans are in the form of either participations in Loans (“Participations”) or assignments of all or a portion of Loans from third parties (“Assignments”). With respect to Participations, a Fund has the right to receive payments of principal, interest and any fees to which it is entitled from the Lender selling the Participations and only upon receipt by the Lender of the payments from the borrower. A Fund generally has no right to enforce compliance by the borrower with the terms of the loan agreement with respect to Participations.
54
GOLDMAN SACHS DIVIDEND FOCUS FUNDS
| 3. INVESTMENTS AND FAIR VALUE MEASUREMENTS (continued) |
Conversely, assignments result in a Fund having a direct contractual relationship with the borrower, and the Fund may be permitted to enforce compliance by the borrower with the terms of the loan agreement.
ii. Commercial Paper — Commercial paper normally represents short-term unsecured promissory notes issued in bearer form by banks or bank holding companies, corporations, finance companies and other issuers. Commercial paper consists of direct U.S. dollar-denominated obligations of domestic or foreign issuers. Asset-backed commercial paper is issued by a special purpose entity that is organized to issue the commercial paper and to purchase trade receivables or other financial assets.
iii. Mortgage-Backed and Asset-Backed Securities — Mortgage-backed securities represent direct or indirect participations in, or are collateralized by and payable from, mortgage loans secured by residential and/or commercial real estate property. Asset-backed securities include securities whose principal and interest payments are collateralized by pools of other assets or receivables. The value of certain mortgage-backed and asset-backed securities (including adjustable rate mortgage loans) may be particularly sensitive to changes in prevailing interest rates. The value of these securities may also fluctuate in response to the market’s perception of the creditworthiness of the issuers.
Asset-backed securities may present credit risks that are not presented by mortgage-backed securities because they generally do not have the benefit of a security interest in collateral that is comparable to mortgage assets. Some asset-backed securities may only have a subordinated claim on collateral.
Stripped mortgage-backed securities are usually structured with two different classes: one that receives substantially all interest payments (interest-only, or “IO” and/or high coupon rate with relatively low principal amount, or “IOette”), and the other that receives substantially all principal payments (principal-only, or “PO”) from a pool of mortgage loans. Little to no principal will be received at the maturity of an IO; as a result, periodic adjustments are recorded to reduce the cost of the security until maturity. These adjustments are included in interest income.
iv. Repurchase Agreements — Repurchase agreements involve the purchase of securities subject to the seller’s agreement to repurchase the securities at a mutually agreed upon date and price, under the terms of a Master Repurchase Agreement (“MRA”). During the term of a repurchase agreement, the value of the underlying securities held as collateral on behalf of a Fund, including accrued interest, is required to exceed the value of the repurchase agreement, including accrued interest. The gross value of repurchase agreements is included in the Statements of Assets and Liabilities for financial reporting purposes. The underlying securities for all repurchase agreements are held at the Funds’ custodian or designatedsub-custodians undertri-party repurchase agreements.
An MRA governs transactions between a Fund and select counterparties. An MRA contains provisions for, among other things, initiation of the transaction, income payments, events of default, and maintenance of securities for both repurchase agreements and reverse repurchase agreements. An MRA also permits offsetting with collateral to create one single net payment in the event of default or similar events, including the bankruptcy or insolvency of a counterparty.
If the seller defaults, a Fund could suffer a loss to the extent that the proceeds from the sale of the ;underlying securities and other collateral held by the Fund are less than the repurchase price and the Fund’s costs associated with delay and enforcement of the repurchase agreement. In addition, in the event of default or insolvency of the seller, a court could determine that a Fund’s interest in the collateral is not enforceable, resulting in additional losses to the Fund.
Pursuant to exemptive relief granted by the Securities and Exchange Commission (“SEC”) and terms and conditions contained therein, the Funds, together with other funds of the Trust and registered investment companies having management agreements with GSAM or its affiliates, may transfer uninvested cash into joint accounts, the daily aggregate balance of which is invested in one or more repurchase agreements. Under these joint accounts, the Funds maintainpro-rata credit exposure to the underlying repurchase agreements’ counterparties. With the exception of certain transaction fees, the Funds are not subject to any expenses in relation to these investments.
Derivative Contracts — A derivative is an instrument whose value is derived from underlying assets, indices, reference rates or a combination of these factors. A Fund enters into derivative transactions to hedge against changes in interest rates, securities prices, and/or currency exchange rates, to increase total return, or to gain access to certain markets or attain exposure to other underliers. For financial reporting purposes, cash collateral that has been pledged to cover obligations of a Fund and cash collateral
55
GOLDMAN SACHS DIVIDEND FOCUS FUNDS
Notes to Financial Statements(continued)
October 31, 2019
| 3. INVESTMENTS AND FAIR VALUE MEASUREMENTS (continued) |
received, if any, is reported separately on the Statements of Assets and Liabilities as receivables/payables for collateral on certain derivatives contracts.Non-cash collateral pledged by a Fund, if any, is noted in the Schedules of Investments.
Exchange-traded derivatives, including futures and options contracts, are generally valued at the last sale or settlement price on the exchange where they are principally traded. Exchange-traded options without settlement prices are generally valued at the midpoint of the bid and ask prices on the exchange where they are principally traded (or, in the absence oftwo-way trading, at the last bid price for long positions and the last ask price for short positions). Exchange-traded derivatives typically fall within Level 1 of the fair value hierarchy.Over-the-counter (“OTC”) and centrally cleared derivatives are valued using market transactions and other market evidence, including market-based inputs to models, calibration to market-clearing transactions, broker or dealer quotations, or other alternative pricing sources. Where models are used, the selection of a particular model to value OTC and centrally cleared derivatives depends upon the contractual terms of, and specific risks inherent in, the instrument, as well as the availability of pricing information in the market. Valuation models require a variety of inputs, including contractual terms, market prices, yield curves, credit curves, measures of volatility, voluntary and involuntary prepayment rates, loss severity rates and correlations of such inputs. For OTC and centrally cleared derivatives that trade in liquid markets, model inputs can generally be verified and model selection does not involve significant management judgment. OTC and centrally cleared derivatives are classified within Level 2 of the fair value hierarchy when significant inputs are corroborated by market evidence.
i. Forward Contracts — A forward contract is a contract between two parties to buy or sell an asset at a specified price on a future date. A forward contract settlement can occur on a cash or delivery basis. Forward contracts aremarked-to-market daily using independent vendor prices, and the change in value, if any, is recorded as an unrealized gain or loss. Cash and certain investments may be used to collateralize forward contracts.
Aforward foreign currency exchange contractis a forward contract in which a Fund agrees to receive or deliver a fixed quantity of one currency for another, at apre-determined price at a future date. All forward foreign currency exchange contracts aremarked-to-market daily at the applicable forward rate.Non-deliverable forward foreign currency exchange contracts are settled with the counterparty in cash without the delivery of foreign currency.
ii. Futures Contracts — Futures contracts are contracts to buy or sell a standardized quantity of a specified commodity or security. Upon entering into a futures contract, a Fund deposits cash or securities in an account on behalf of the broker in an amount sufficient to meet the initial margin requirement. Subsequent payments are made or received by a Fund equal to the daily change in the contract value and are recorded as variation margin receivable or payable with a corresponding offset to unrealized gains or losses.
iii. Options — When a Fund writes call or put options, an amount equal to the premium received is recorded as a liability and is subsequentlymarked-to-market to reflect the current value of the option written. Swaptions are options on interest rate swap contracts or credit defaults swap contracts.
Upon the purchase of a call option or a put option by a Fund, the premium paid is recorded as an investment and subsequentlymarked-to-market to reflect the current value of the option. Certain options may be purchased with premiums to be determined on a future date. The premiums for these options are based upon implied volatility parameters at specified terms.
iv. Swap Contracts — Bilateral swap contracts are agreements in which a Fund and a counterparty agree to exchange periodic payments on a specified notional amount or make a net payment upon termination. Bilateral swap transactions are privately negotiated in the OTC market and payments are settled through direct payments between a Fund and the counterparty. By contrast, certain swap transactions are subject to mandatory central clearing. These swaps are executed through a derivatives clearing member (“DCM”), acting in an agency capacity, and submitted to a central counterparty (“CCP”) (“centrally cleared swaps”), in which case all payments are settled with the CCP through the DCM. Swaps aremarked-to-market daily using pricing vendor quotations, counterparty or clearinghouse prices or model prices, and the change in value, if any, is recorded as an unrealized gain or loss. Upon entering into a swap contract, a Fund is required to satisfy an initial margin requirement by delivering cash or securities to the counterparty (or in some cases, segregated in a triparty account on behalf of the counterparty), which can be adjusted by anymark-to-market gains or losses pursuant to bilateral or centrally cleared arrangements. For centrally cleared swaps the daily change in valuation, if any, is recorded as a receivable or payable for variation margin.
56
GOLDMAN SACHS DIVIDEND FOCUS FUNDS
| 3. INVESTMENTS AND FAIR VALUE MEASUREMENTS (continued) |
An interest rate swap is an agreement that obligates two parties to exchange a series of cash flows at specified intervals, based upon or calculated by reference to changes in interest rates on a specified notional principal amount. The payment flows are usually netted against each other, with the difference being paid by one party to the other.
A total return swap is an agreement that gives a Fund the right to receive or pay the appreciation or depreciation, as applicable, in the value of a specified security, an index, a basket of securities or indices or other instrument in return for a fee paid to the counterparty, which will typically be an agreed upon interest rate. If the underlying asset declines in value over the term of the swap, a Fund may also be required to pay the dollar value of that decline to the counterparty.
Secured Borrowings — Secured borrowings are valued at their contractual amounts, which approximate fair value, and are generally classified as Level 2 of the fair value hierarchy.
i. Reverse Repurchase Agreements — Reverse repurchase agreements involve the sale of securities held by a Fund subject to the Fund’s agreement to repurchase the securities at a mutually agreed upon date and price (including interest), under the terms of a Master Repurchase Agreement (“MRA”). The gross value of reverse repurchase agreements is included in the Statements of Assets and Liabilities for financial reporting purposes.
When a Fund enters into a reverse repurchase agreement, it is required to deliver securities as collateral to the counterparty that exceed the value of the reverse repurchase agreement. During the term of a reverse repurchase agreement, the value of the underlying securities pledged as collateral on behalf of a Fund, including accrued interest, is required to exceed the value of the reverse repurchase agreement, including accrued interest. If the value of those securities pledged as collateral, including accrued interest, becomes less than the value of the reverse repurchase agreement, including accrued interest, a Fund will be obligated to deliver additional collateral to the buyer. If the buyer defaults on its commitment to sell back the securities, a Fund could suffer a loss to the extent that the amount borrowed is less than the replacement cost of similar securities and the Fund’s costs associated with delay and enforcement of the reverse repurchase agreement. In addition, in the event of default or insolvency of the buyer, a court could determine that a Fund’s interest in the amount borrowed is not enforceable, resulting in additional losses to a Fund.
B. Level 3 Fair Value Investments — To the extent that significant inputs to valuation models and other alternative pricing sources are unobservable, or if quotations are not readily available, or if GSAM believes that such quotations do not accurately reflect fair value, the fair value of a Fund’s investments may be determined under Valuation Procedures approved by the Trustees. GSAM, consistent with its procedures and applicable regulatory guidance, may make an adjustment to the most recent valuation prices of either domestic or foreign securities in light of significant events to reflect what it believes to be the fair value of the securities at the time of determining a Fund’s NAV. To the extent investments are valued using single source broker quotations obtained directly from the broker or passed through from third party pricing vendors, such investments are classified as Level 3 investments. GSAM did not develop the unobservable inputs for valuation of Level 3 Assets and Liabilities.
57
GOLDMAN SACHS DIVIDEND FOCUS FUNDS
Notes to Financial Statements(continued)
October 31, 2019
| 3. INVESTMENTS AND FAIR VALUE MEASUREMENTS (continued) |
C. Fair Value Hierarchy — The following is a summary of the Funds’ investments and derivatives classified in the fair value hierarchy as of October 31, 2019:
| INCOME BUILDER |
| |||||||||||
| Investment Type | Level 1 | Level 2 | Level 3 | |||||||||
| Assets | ||||||||||||
Common Stock and/or Other Equity Investments(a) | ||||||||||||
Asia | $ | 4,683,908 | $ | — | $ | — | ||||||
Europe | 149,879,624 | 6,007,985 | — | |||||||||
North America | 438,796,962 | 9,869,010 | 48,685 | |||||||||
Fixed Income | ||||||||||||
Corporate Obligations | — | 785,074,093 | — | |||||||||
Mortgage-Backed Obligations | — | 274,136 | — | |||||||||
Foreign Debt Obligations | — | 5,140,398 | — | |||||||||
Bank Loans | — | 118,552,484 | — | |||||||||
U.S. Treasury Obligations | 1,735,203 | — | — | |||||||||
Investment Companies | 89,295,343 | — | — | |||||||||
Short-term Investments | — | 16,384,003 | — | |||||||||
Securities Lending Reinvestment Vehicle | 92,000 | — | — | |||||||||
| Total | $ | 684,483,040 | $ | 941,302,109 | $ | 48,685 | ||||||
| Liabilities | ||||||||||||
Unfunded Loan Commitment | $ | — | $ | (998 | ) | $ | — | |||||
| Derivative Type | ||||||||||||
| Assets(b) | ||||||||||||
Futures Contracts | $ | 1,638,314 | $ | — | $ | — | ||||||
Interest Rate Swap Contracts | — | 3,049,616 | — | |||||||||
| Total | $ | 1,638,314 | $ | 3,049,616 | $ | — | ||||||
| Liabilities | ||||||||||||
Forward Foreign Currency Exchange Contracts(b) | $ | — | $ | (228,852 | ) | $ | — | |||||
Futures Contracts(b) | (3,903,884 | ) | — | — | ||||||||
Interest Rate Swap Contracts(b) | — | (658,865 | ) | — | ||||||||
Written option contracts | — | (1,050,277 | ) | — | ||||||||
| Total | $ | (3,903,884 | ) | $ | (1,937,994 | ) | $ | — | ||||
| (a) | Amounts are disclosed by continent to highlight the impact of time zone differences between local market close and the calculation of net asset value. Security valuations are based on the principal exchange or system on which they are traded, which may differ from country of domicile. The Funds utilize fair value model prices provided by an independent fair value service for international equities, resulting in a Level 2 classification. |
| (b) | Amount shown represents unrealized gain (loss) at period end. |
58
GOLDMAN SACHS DIVIDEND FOCUS FUNDS
| 3. INVESTMENTS AND FAIR VALUE MEASUREMENTS (continued) |
| RISING DIVIDEND GROWTH | ||||||||||||
| Investment Type | Level 1 | Level 2 | Level 3 | |||||||||
| Assets |
| |||||||||||
Common Stock and/or Other Equity Investments(a) | ||||||||||||
Europe | $ | 36,501,281 | $ | — | $ | — | ||||||
North America | 669,124,351 | — | — | |||||||||
Investment Companies | 16,713,007 | — | — | |||||||||
| Total | $ | 722,338,639 | $ | — | $ | — | ||||||
| Derivative Type | ||||||||||||
| Assets(b) | ||||||||||||
Futures Contracts | $ | 234,933 | $ | — | $ | — | ||||||
| (a) | Amounts are disclosed by continent to highlight the impact of time zone differences between local market close and the calculation of net asset value. Security valuations are based on the principal exchange or system on which they are traded, which may differ from country of domicile. The Funds utilize fair value model prices provided by an independent fair value service for international equities, resulting in a Level 2 classification. |
| (b) | Amount shown represents unrealized gain (loss) at period end. |
For further information regarding security characteristics, see the Schedules of Investments.
| 4. INVESTMENTS IN DERIVATIVES |
The following tables set forth, by certain risk types, the gross value of derivative contracts (not considered to be hedging instruments for accounting disclosure purposes) as of October 31, 2019. These instruments were used as part of the Funds’ investment strategies and to obtain and/or manage exposure related to the risks below. The values in the tables below exclude the effects of cash collateral received or posted pursuant to these derivative contracts, and therefore are not representative of the Funds’ net exposure.
| Income Builder | ||||||||||||
| Risk | Statements of Assets and Liabilities | Assets | Statements of Assets and Liabilities | Liabilities | ||||||||
Interest rate | Variation margin on swap contracts; Variation margin on futures contracts | $ | 4,137,246 | (a) | Variation margin on swap contracts; Variation margin on futures contracts | $ | (4,562,749) | (a) | ||||
Currency | — | — | Payable for unrealized loss on forward foreign currency exchange contracts | (228,852) | ||||||||
Equity | Variation margin on futures contracts | 550,684 | (a) | Written options, at value | (1,050,277) | |||||||
| Total | $ | 4,687,930 | $ | (5,841,878) | ||||||||
| Rising Dividend Growth | ||||||||||||
| Risk | Statements of Assets and Liabilities | Assets | Statements of Assets and Liabilities | Liabilities | ||||||||
| Equity | Variation margin on futures contracts | $ | 234,933 | (a) | — | $ | — | |||||
| (a) | Includes unrealized gain (loss) on futures contracts described in the Additional Investment Information sections of the Schedules of Investments. Only current day’s variation margin is reported within the Statements of Assets and Liabilities. |
59
GOLDMAN SACHS DIVIDEND FOCUS FUNDS
Notes to Financial Statements(continued)
October 31, 2019
| 4. INVESTMENTS IN DERIVATIVES (continued) |
The following tables set forth, by certain risk types, the Funds’ gains (losses) related to these derivatives and their indicative volumes for the fiscal year ended October 31, 2019. These gains (losses) should be considered in the context that these derivative contracts may have been executed to create investment opportunities and/or economically hedge certain investments, and accordingly, certain gains (losses) on such derivative contracts may offset certain (losses) gains attributable to investments. These gains (losses) are included in “Net realized gain (loss)” or “Net change in unrealized gain (loss)” on the Statements of Operations:
| Income Builder | ||||||||||||||
| Risk | Statements of Operations | Net Realized Gain (Loss) | Net Change in Unrealized Gain | Average Number of Contracts(a) | ||||||||||
| Interest rate | Net realized gain (loss) from futures contracts and swap contracts | $ | 39,409,277 | $ | 3,560,342 | 1,107 | ||||||||
| Currency | Net realized gain (loss) from forward foreign currency exchange contracts/Net change in unrealized gain (loss) on forward foreign currency exchange contracts | 190,351 | (215,954 | ) | 2 | |||||||||
| Equity | Net realized gain (loss) from futures contracts, swap contracts and written options/Net change in unrealized gain (loss) futures contracts, swap contracts and written options | (2,503,607 | ) | 6,318,808 | 411 | |||||||||
| Total | $ | 37,096,021 | $ | 9,663,196 | 1,520 | |||||||||
| Rising Dividend Growth | ||||||||||||||
| Risk | Statements of Operations | Net Realized Gain (Loss) | Net Change in Unrealized Gain (Loss) | Average Number of Contracts(a) | ||||||||||
| Equity | Net realized gain (loss) from futures contracts/Net unrealized gain(loss) on futures contracts | $ | 2,879,240 | $ | 2,479,726 | 234 | ||||||||
| (a) | Average number of contracts is based on the average of month end balances for the fiscal year ended October 31, 2019. |
| 5. AGREEMENTS AND AFFILIATED TRANSACTIONS |
A. Management Agreement — Under the Agreement, GSAM manages the Funds, subject to the general supervision of the Trustees.
As compensation for the services rendered pursuant to the Agreement, the assumption of the expenses related thereto and administration of the Funds’ business affairs, including providing facilities, GSAM is entitled to a management fee, accrued daily and paid monthly, equal to an annual percentage rate of each Fund’s average daily net assets.
For the fiscal year ended October 31, 2019, contractual and effective net management fees with GSAM were at the following rates:
| Contractual Management Rate | Effective Net | |||||||||||||||||||||||||||||
| Fund | First $1 billion | Next $1 billion | Next $3 billion | Next $3 billion | Over $8 billion | Effective Rate | ||||||||||||||||||||||||
Income Builder | 0.54 | % | 0.49 | % | 0.46 | % | 0.45 | % | 0.44 | % | 0.52 | % | 0.49 | % | ||||||||||||||||
Rising Dividend Growth | 0.75 | 0.68 | 0.64 | 0.63 | 0.62 | 0.75 | 0.74 | |||||||||||||||||||||||
| ^ | Effective Net Management Rate includes impact of management fee waivers of underlying funds, if any. |
60
GOLDMAN SACHS DIVIDEND FOCUS FUNDS
| 5. AGREEMENTS AND AFFILIATED TRANSACTIONS (continued) |
Certain Funds invest in Institutional Shares of the Goldman Sachs Financial Square Government Fund and Class R6 Shares of the Goldman Sachs Emerging Markets Debt Fund, Goldman Sachs Emerging Markets Equity Fund, Goldman Sachs Financial Square Government Fund, Goldman Sachs High Yield Fund, and Goldman Sachs Local Emerging Markets Debt Fund, which are affiliated Underlying Funds. GSAM has agreed to waive a portion of its management fee payable by the Funds in an amount equal to the management fee it earns as an investment adviser to any of the affiliated Underlying Funds in which the Funds invest. For the fiscal year ended October 31, 2019, the management fee waived by GSAM was for each Fund as follows:
| Fund | Management Fee Waived | |||||||||
Income Builder | $ | 447,111 | ||||||||
Rising Dividend Growth | 34,777 | |||||||||
B. Distribution and/or Service(12b-1) Plans — The Trust, on behalf of Class A and Class R Shares of each applicable Fund, has adopted Distribution and Service Plans subject to Rule12b-1 under the Act. Under the Distribution and Service Plans, Goldman Sachs, which serves as distributor (the “Distributor”), is entitled to a fee accrued daily and paid monthly, for distribution services and personal and account maintenance services, which may then be paid by Goldman Sachs to authorized dealers. These fees are equal to an annual percentage rate of the average daily net assets attributable to Class A or Class R Shares of the Funds, as applicable, as set forth below.
The Trust, on behalf of Class C Shares of each applicable Fund, has adopted a Distribution Plan subject to Rule12b-1 under the Act. Under the Distribution Plan, Goldman Sachs as Distributor is entitled to a fee accrued daily and paid monthly for distribution services, which may then be paid by Goldman Sachs to authorized dealers. These fees are equal to an annual percentage rate of the average daily net assets attributable to Class C Shares of the Funds, as set forth below.
| Distribution and/or Service Plan Rates | ||||||||||||
| Class A* | Class C | Class R* | ||||||||||
Distribution and/or Service Plan | 0.25 | % | 0.75 | % | 0.50 | % | ||||||
| * | With respect to Class A and Class R Shares, the Distributor at its discretion may use compensation for distribution services paid under the Distribution and/or Service Plan to compensate service organizations for personal and account maintenance services and expenses as long as such total compensation does not exceed the maximum cap on “service fees” imposed by the Financial Industry Regulatory Authority. |
C. Distribution Agreement — Goldman Sachs, as Distributor of the shares of the Funds pursuant to a Distribution Agreement, may retain a portion of the Class A Shares’ front end sales charge and Class C Shares’ CDSC. During the fiscal year ended October 31, 2019 , Goldman Sachs retained the following amounts:
| Front End Sales Charge | Contingent Deferred Sales Charge | |||||||||
| Class A | Class C | |||||||||
Income Builder | $ | 49,547 | $ | — | ||||||
Rising Dividend Growth | 18,033 | 48 | ||||||||
D. Service Plan — The Trust, on behalf of each applicable Fund, has adopted a Service Plan to allow Class C Shares to compensate service organizations (including Goldman Sachs) for providing varying levels of personal and account maintenance services to their customers who are beneficial owners of such shares. The Service Plan provides for compensation to the service organizations equal to an annual percentage rate of 0.25% of the average daily net assets attributable to Class C Shares of the Funds.
E. Transfer Agency Agreement — Goldman Sachs also serves as the transfer agent of the Funds for a fee pursuant to the Transfer Agency Agreement. The fees charged for such transfer agency services are accrued daily and paid monthly at annual rates
61
GOLDMAN SACHS DIVIDEND FOCUS FUNDS
Notes to Financial Statements(continued)
October 31, 2019
| 5. AGREEMENTS AND AFFILIATED TRANSACTIONS (continued) |
as follows: 0.17% of the average daily net assets of Class A, Class C, Investor and Class R Shares; 0.03% of the average daily net assets of Class P and R6 Shares; and 0.04% of the average daily net assets of Institutional Shares. Prior to July 1, 2019, such fee was 0.18% of the average daily net assets of the Class A, Class C, Investor and Class R Shares.
Effective February 28, 2019, Goldman Sachs has agreed to waive a portion of its transfer agency fees by an amount equal to 0.06% as an annual percentage rate of the average daily net assets attributable to Class A, Class C, Investor and Class R Shares of the Rising Dividend Growth Fund. This arrangement will remain in effect through at least February 28, 2020, and prior to such date, Goldman Sachs may not terminate the arrangement without the approval of the Board of Trustees.
F. Other Expense Agreements and Affiliated Transactions — GSAM has agreed to reduce or limit certain “Other Expenses” of the Funds (excluding acquired fund fees and expenses, transfer agency fees and expenses, service fees and shareholder administration fees (as applicable), taxes, interest, brokerage fees, expenses of shareholder meetings, litigation and indemnification, and extraordinary expenses) to the extent such expenses exceed, on an annual basis, a percentage rate of the average daily net assets of each Fund. Such Other Expense reimbursements, if any, are accrued daily and paid monthly. In addition, the Funds are not obligated to reimburse GSAM for prior fiscal year expense reimbursements, if any. The Other Expense limitations as an annual percentage rate of average daily net assets for the Income Builder and Rising Dividend Growth Funds are 0.034% and 0.014%, respectively. These Other Expense limitations will remain in place through at least February 28, 2020, and prior to such date GSAM may not terminate the arrangements without the approval of the Trustees. In addition, the Funds have entered into certain offset arrangements with the transfer agent, which may result in a reduction of the Funds’ expenses and are received irrespective of the application of the “Other Expense” limitations described above.
For the fiscal year ended October 31, 2019, these expense reductions, including any fee waivers and Other Expense reimbursements, were as follows:
| Fund | Management Fee Waiver | Transfer Agency Waivers/Credits | Other Expense | Total Expense Reductions | ||||||||||||||
Income Builder | $ | 447,111 | $ | 3,044 | $ | 340,122 | $ | 790,277 | ||||||||||
Rising Dividend Growth | 34,777 | 231,192 | 653,723 | 919,692 | ||||||||||||||
G. Line of Credit Facility — As of October 31, 2019, the Funds participated in a $580,000,000 committed, unsecured revolving line of credit facility (the “facility”) together with other funds of the Trust and certain registered investment companies having management agreements with GSAM or its affiliates. This facility is to be used for temporary emergency purposes, or to allow for an orderly liquidation of securities to meet redemption requests. The interest rate on borrowings is based on the federal funds rate. The facility also requires a fee to be paid by the Funds based on the amount of the commitment that has not been utilized. For the fiscal year ended October 31, 2019, the Funds did not have any borrowings under the facility. Prior to April 30, 2019 the facility was $770,000,000.
H. Other Transactions with Affiliates — For the fiscal year ended October 31, 2019, Goldman Sachs earned $24,387, in brokerage commissions from portfolio transactions, on behalf of the Income Builder Fund.
The Funds may purchase securities from, or sell securities to, an affiliated fund provided the affiliation is solely due to having a common investment adviser, common officers, or common trustees. For the fiscal year ended October 31, 2019, the purchases at cost with an affiliated fund in compliance with Rule 17a-7 under the Act for the Income Builder Fund were $1,944,911.
62
GOLDMAN SACHS DIVIDEND FOCUS FUNDS
| 5. AGREEMENTS AND AFFILIATED TRANSACTIONS (continued) |
The table below shows the transactions in and earnings from investments in the Underlying Funds for the fiscal year ended October 31, 2019:
| Fund | Underlying Fund | Beginning Value as of October 31, 2018 | Purchases at Cost | Proceeds from Sales | Net Realized | Change in Unrealized Gain/(Loss) | Ending Value as of October 31, 2019 | Shares as of October 31, 2019 | Dividend Income | |||||||||||||||||||||||||
Income Builder | Goldman Sachs Emerging Markets Debt Fund — Class R6 Shares | $ | 14,482,024 | $ | 324,264 | $ | (15,609,725 | ) | $ | (59,163 | ) | $ | 862,600 | $ | — | — | $ | 370,172 | ||||||||||||||||
| Goldman Sachs Emerging Markets Equity Fund — Class R6 Shares | 13,919,890 | 114,533 | (14,200,000 | ) | (2,869,142 | ) | 3,089,318 | 54,599 | 2,489 | 114,533 | ||||||||||||||||||||||||
| Goldman Sachs Financial Square Government Fund — Institutional Shares | 34,687,589 | 441,702,353 | (434,369,798 | ) | — | — | 42,020,144 | 42,020,144 | 1,260,863 | |||||||||||||||||||||||||
| Goldman Sachs Financial Square Government Fund — Class R6 Shares | 21,433,835 | 393,630,731 | (367,897,319 | ) | — | — | 47,167,247 | 47,167,247 | 417,832 | |||||||||||||||||||||||||
| Goldman Sachs High Yield Fund — Class R6 Shares | 49,242 | 2,970 | — | — | 1,141 | 53,353 | 8,336 | 2,969 | ||||||||||||||||||||||||||
| Goldman Sachs Local Emerging Markets Debt Fund — Class R6 Shares | 29,205,566 | 984,468 | (32,638,987 | ) | 465,381 | 1,983,572 | — | — | 1,007,139 | |||||||||||||||||||||||||
Total | $ | 113,778,146 | $ | 836,759,319 | $ | (864,715,829 | ) | $ | (2,462,924 | ) | $ | 5,936,631 | $ | 89,295,343 | $ | 3,173,508 | ||||||||||||||||||
| Rising Dividend Growth | Goldman Sachs Financial Square Government Fund — Institutional Shares | $ | — | $ | 20,173,709 | $ | (20,055,922 | ) | $ | — | $ | — | $ | 117,787 | 117,787 | $ | 9,968 | |||||||||||||||||
| Goldman Sachs Financial Square Government Fund — Class R6 Shares | 15,556,632 | 634,090,405 | (633,051,817 | ) | — | — | 16,595,220 | 16,595,220 | 467,931 | |||||||||||||||||||||||||
Total | $ | 15,556,632 | $ | 654,264,114 | $ | (653,107,739 | ) | $ | — | $ | — | $ | 16,713,007 | $ | 477,899 | |||||||||||||||||||
An investment by a Fund representing greater than 5% of the voting shares of an issuer makes that issuer an “affiliated person” (as defined by the Act) of such Fund. The following table provides information about the investment in the shares of issuer deemed to be affiliate of the Income Builder Fund for the fiscal year ended October 31, 2019:
| Name of Affiliated Issuer | Beginning Value as of October 31, 2019 | Purchases at Cost | Proceeds from Sales | Change in Gain/(Loss) | Change in Gain/(Loss) | Ending Value as of | Shares as of October 31, 2019 | |||||||||||||||||||
Montage Resources Corp(a)(b) | $1,248,346 | — | $ | (730,541 | ) | $ | (1,864,539 | ) | $ | 1,346,734 | $ | — | — | |||||||||||||
| (a) | Effective March 31, 2019, shares of Blue Ridge Mountain Resources, Inc. were converted to shares of Montage Resources Corp through anon-cash merger. |
| (b) | Security was no longer held as of October 31, 2019. |
63
GOLDMAN SACHS DIVIDEND FOCUS FUNDS
Notes to Financial Statements(continued)
October 31, 2019
| 6. PORTFOLIO SECURITIES TRANSACTIONS |
The cost of purchases and proceeds from sales and maturities of long-term securities for the fiscal year ended October 31, 2019, were:
| Fund | Purchases of U.S. Government and Agency Obligations | Purchases (Excluding U.S. Government and Agency Obligations) | Sales and Maturities of U.S. Government and Agency Obligations | Sales and Maturities (Excluding U.S. Government and Agency Obligations) | ||||||||||||||
Income Builder | $ | — | $ | 706,490,835 | $ | 11,340,713 | $ | 885,990,406 | ||||||||||
Rising Dividend Growth | — | 385,429,320 | — | 1,043,968,242 | ||||||||||||||
The table below summarizes the reverse repurchase agreement activity for the fiscal year ended October 31, 2019:
| Fund | Average amount of borrowings | Weighted average interest rate (Paid) Received | Number of days outstanding during the period | |||||||||||
Income Builder | $ | 1,760,977 | (0.947 | )% | 8 | |||||||||
As of October 31, 2019, the Funds did not have any investments in reverse repurchase agreements.
| 7. SECURITIES LENDING |
The Income Builder Fund may lend its securities through a securities lending agent, the Bank of New York Mellon (“BNYM”), to certain qualified borrowers. Pursuant to exemptive relief granted by the SEC and the terms and conditions contained therein, the Rising Dividend Growth Fund may lend its securities through a securities lending agent, Goldman Sachs Agency Lending (“GSAL”), a wholly-owned subsidiary of Goldman Sachs, to certain qualified borrowers including Goldman Sachs and affiliates. In accordance with the Funds’ securities lending procedures, the Funds receive cash collateral at least equal to the market value of the securities on loan. The market value of the loaned securities is determined at the close of business of the Funds, at their last sale price or official closing price on the principal exchange or system on which they are traded, and any additional required collateral is delivered to the Funds on the next business day. As with other extensions of credit, the Funds may experience delay in the recovery of their securities or incur a loss should the borrower of the securities breach its agreement with the Funds or become insolvent at a time when the collateral is insufficient to cover the cost of repurchasing securities on loan. Dividend income received from securities on loan may not be subject to withholding taxes and therefore withholding taxes paid may differ from the amounts listed in the Statements of Operations. Loans of securities are terminable at any time and as such 1) the remaining contractual maturities of the outstanding securities lending transactions are considered to be overnight and continuous and 2) the borrower, after notice, is required to return borrowed securities within the standard time period for settlement of securities transactions.
The Funds invest the cash collateral received in connection with securities lending transactions in the Goldman Sachs Financial Square Government Fund (“Government Money Market Fund”), an affiliated series of the Goldman Sachs Trust. The Government Money Market Fund is registered under the Act as an open end investment company, is subject to Rule2a-7 under the Act, and is managed by GSAM, for which GSAM may receive a management fee of up to 0.16% on an annualized basis of the average daily net assets of the Government Money Market Fund.
In the event of a default by a borrower with respect to any loan, GSAL will and BNYM may exercise any and all remedies provided under the applicable borrower agreement to make the Funds whole. These remedies include purchasing replacement securities by applying the collateral held from the defaulting broker against the purchase cost of the replacement securities. If GSAL or BNYM are unable to purchase replacement securities, GSAL and/or BNYM will indemnify the Funds by paying the Funds an amount equal to the market value of the securities loaned minus the value of cash collateral received from the borrower for the loan, subject to an exclusion for any shortfalls resulting from a loss of value in such cash collateral due to reinvestment risk. The Funds’ master netting agreements with certain borrowers provide the right, in the event of a default (including bankruptcy or insolvency), for thenon-defaulting party to liquidate the collateral and calculate net exposure to the defaulting party or request
64
GOLDMAN SACHS DIVIDEND FOCUS FUNDS
| 7. SECURITIES LENDING (continued) |
additional collateral. However, in the event of a default by a borrower, a resolution authority could determine that such rights are not enforceable due to the restrictions or prohibitions against the right ofset-off that may be imposed in accordance with a particular jurisdiction’s bankruptcy or insolvency laws. The Funds’ loaned securities were all subject to enforceable Securities Lending Agreements and the value of the collateral was at least equal to the value of the cash received. The amounts of the Funds’ overnight and continuous agreements, which represent the gross amounts of recognized liabilities for securities lending transactions outstanding as of October 31, 2019, are disclosed as “Payable upon return of securities loaned” on the Statements of Assets and Liabilities, where applicable.
The Funds, GSAL and BNYM received compensation relating to the lending of the Funds’ securities. The amounts earned, if any, by the Funds for the fiscal year ended October 31, 2019, are reported under Investment Income on the Statements of Operations.
The table below details securities lending activity with affiliates of Goldman Sachs:
| For the Fiscal Year Ended October 31, 2019 | Amounts Payable to Goldman Sachs Upon Return of Securities Loaned as of October 31, 2019 | |||||||||||||
| Fund | Earnings of GSAL Relating to Securities Loaned | Amounts Received by the Funds from Lending to Goldman Sachs | ||||||||||||
Rising Dividend Growth | $ | 824 | $ | — | $ | — | ||||||||
The following table provides information about the Funds’ investment in the Government Money Market Fund for the fiscal year ended October 31, 2019.
| Fund | Beginning value as of October 31, 2018 | Purchases at Cost | Proceeds from Sales | Ending value as of October 31, 2019 | Shares as of October 31, 2019 | |||||||||||||||||
Income Builder | $ | — | $ | 20,812,807 | $ | (20,720,807 | ) | $ | 92,000 | 92,000 | ||||||||||||
Rising Dividend Growth | — | 41,022,247 | (41,022,247 | ) | — | — | ||||||||||||||||
| 8. TAX INFORMATION |
The tax character of distributions paid during the fiscal year ended October 31, 2019 was as follows:
| Income Builder | Rising Dividend Growth | |||||||
Distributions paid from: | ||||||||
Ordinary income | $ | 59,613,529 | $ | 15,524,354 | ||||
Net long-term capital gains | — | 516,474,079 | ||||||
Total Taxable Distributions | $ | 59,613,529 | $ | 531,998,433 | ||||
Tax Return of Capital | $ | — | $ | — | ||||
65
GOLDMAN SACHS DIVIDEND FOCUS FUNDS
Notes to Financial Statements(continued)
October 31, 2019
| 8. TAX INFORMATION (continued) |
The tax character of distributions paid during the fiscal year ended October 31, 2018 was as follows:
| Income Builder | Rising Dividend | |||||||
Distributions paid from: | ||||||||
Ordinary income | $ | 68,411,757 | $ | 21,945,416 | ||||
Net long-term capital gains | — | 317,492,283 | ||||||
Total Taxable Distributions | $ | 68,411,757 | $ | 339,437,699 | ||||
Tax Return of Capital | $ | 2,200,507 | $ | — | ||||
As of October 31, 2019, the components of accumulated earnings (losses) on a tax basis were as follows:
| Income Builder | Rising Dividend Growth | |||||||
Undistributed ordinary income — net | $ | 1,717,947 | $ | 11,986,548 | ||||
Undistributed long-term capital gains | — | 51,530,076 | ||||||
Total undistributed earnings | $ | 1,717,947 | $ | 63,516,624 | ||||
Capital loss carryforwards:(1) | ||||||||
Perpetual Short-Term | $ | (5,277,107 | ) | $ | — | |||
Perpetual Long-Term | (19,236,354 | ) | — | |||||
Total capital loss carryforwards | $ | (24,513,461 | ) | $ | — | |||
Timing differences (Straddles) | $ | (7,372 | ) | $ | — | |||
Unrealized gains (losses) — net | 117,482,741 | 84,023,446 | ||||||
Total accumulated earnings losses — net | $ | 94,679,855 | $ | 147,540,070 | ||||
| (1) | The Income Builder Fund utilized $46,653,668 of capital losses in the current fiscal year. |
As of October 31, 2019, the Funds’ aggregate security unrealized gains and losses based on cost for U.S. federal income tax purposes were as follows:
Income Builder | Rising Dividend | |||||||
Tax Cost | $ | 1,508,059,301 | $ | 638,550,054 | ||||
Gross unrealized gain | 142,178,343 | 113,568,316 | ||||||
Gross unrealized loss | (24,695,602 | ) | (29,544,870 | ) | ||||
Net unrealized gains (losses) | $ | 117,482,741 | $ | 84,023,446 | ||||
The difference between GAAP-basis and tax basis unrealized gains (losses) is attributable primarily to wash sales, net mark to market gains (losses) on regulated futures contracts, net mark to market gains/(losses) on foreign currency contracts, and differences to the tax treatment of underlying fund investments, partnership investments and material modification of debt securities.
The Income Builder Fund reclassed $174,586 from paid in capital to distributable earnings for the year ending October 31, 2019. In order to present certain components of the Funds’ capital accounts on atax-basis, certain reclassifications have been recorded to the Funds’ accounts. These reclassifications have no impact on the net asset value of the Funds’ and result primarily from return of capital distributions, real estate trust investments, and differences in the tax treatment of partnership investments.
66
GOLDMAN SACHS DIVIDEND FOCUS FUNDS
| 8. TAX INFORMATION (continued) |
The Rising Dividend Growth Fund reclassed $478,135 from paid in capital to distributable earnings for the year ending October 31, 2019. In order to present certain components of the Funds’ capital accounts on atax-basis, certain reclassifications have been recorded to the Funds’ accounts. These reclassifications have no impact on the net asset value of the Funds’ and result primarily from differences in the tax treatment of partnership investments.
GSAM has reviewed the Funds’ tax positions for all open tax years (the current and prior three years, as applicable) and has concluded that no provision for income tax is required in the Funds’ financial statements. Such open tax years remain subject to examination and adjustment by tax authorities.
| 9. OTHER RISKS |
The Funds’ risks include, but are not limited to, the following:
Derivatives Risk — The Funds’ use of derivatives may result in loss. Derivative instruments, which may pose risks in addition to and greater than those associated with investing directly in securities, currencies or other instruments, may be illiquid or less liquid, volatile, difficult to price and leveraged so that small changes in the value of the underlying instruments may produce disproportionate losses to the Funds. Derivatives are also subject to counterparty risk, which is the risk that the other party in the transaction will not fulfill its contractual obligation. The use of derivatives is a highly specialized activity that involves investment techniques and risks different from those associated with investments in more traditional securities and instruments. Losses from derivatives can also result from a lack of correlation between changes in the value of derivative instruments and the portfolio assets (if any) being hedged.
Foreign Countries Risk —Investing in foreign markets may involve special risks and considerations not typically associated with investing in the United States. Foreign securities may be subject to risk of loss because of more or less foreign government regulation, less public information and less economic, political and social stability in the countries in which a Fund invests. The imposition of exchange controls (including repatriation restrictions), confiscation of assets and property, trade restrictions (including tariffs) and other government restrictions by the United States or other governments, or from problems in share registration, settlement or custody, may also result in losses. Foreign risk also involves the risk of negative foreign currency rate fluctuations, which may cause the value of securities denominated in such foreign currency (or other instruments through which a Fund has exposure to foreign currencies) to decline in value. Currency exchange rates may fluctuate significantly over short periods of time.
Foreign Custody Risk— If a Fund invests in foreign securities, the Fund may hold such securities and cash with foreign banks, agents, and securities depositories appointed by the Fund’s custodian (each a “Foreign Custodian”). Some foreign custodians may be recently organized or new to the foreign custody business. In some countries, Foreign Custodians may be subject to little or no regulatory oversight over, or independent evaluation of, their operations. Further, the laws of certain countries may place limitations on a Fund’s ability to recover its assets if a Foreign Custodian enters bankruptcy.
Interest Rate Risk— When interest rates increase, fixed income securities or instruments held by a Fund will generally decline in value. Long-term fixed income securities or instruments will normally have more price volatility because of this risk than short-term fixed income securities or instruments. The risks associated with changing interest rates may have unpredictable effects on the markets and a Fund’s investments. Fluctuations in interest rates may also affect the liquidity of fixed income securities and instruments held by the Funds.
Investments in Other Investment Companies Risk — As a shareholder of another investment company, a Fund will indirectly bear its proportionate share of any net management fees and other expenses paid by such other investment companies, in addition to the fees and expenses regularly borne by the Fund.
Large Shareholder Transactions Risk—A Fund may experience adverse effects when certain large shareholders, such as other funds, institutional investors (including those trading by use ofnon-discretionary mathematical formulas), financial
67
GOLDMAN SACHS DIVIDEND FOCUS FUNDS
Notes to Financial Statements(continued)
October 31, 2019
| 9. OTHER RISKS (continued) |
intermediaries (who may make investment decisions on behalf of underlying clients and/or include a Fund in their investment model), individuals, accounts and Goldman Sachs affiliates, purchase or redeem large amounts of shares of a Fund. Such large shareholder redemptions, which may occur rapidly or unexpectedly, may cause a Fund to sell portfolio securities at times when it would not otherwise do so, which may negatively impact a Fund’s NAV and liquidity. These transactions may also accelerate the realization of taxable income to shareholders if such sales of investments resulted in gains, and may also increase transaction costs. In addition, a large redemption could result in a Fund’s current expenses being allocated over a smaller asset base, leading to an increase in the Fund’s expense ratio. Similarly, large Fund share purchases may adversely affect a Fund’s performance to the extent that the Fund is delayed in investing new cash or otherwise maintains a larger cash position than it ordinarily would.
Leverage Risk—Leverage creates exposure to potential gains and losses in excess of the initial amount invested. Borrowing and the use of derivatives may result in leverage and may make a Fund more volatile. When a Fund uses leverage, the sum of that Fund’s investment exposure may significantly exceed the amount of assets invested in the Fund, although these exposures may vary over time. Relatively small market movements may result in large changes in the value of a leveraged investment. A Fund will identify liquid assets on its books or otherwise cover transactions that may give rise to such risk, to the extent required by applicable law. The use of leverage may cause a Fund to liquidate portfolio positions to satisfy its obligations or to meet segregation requirements when it may not be advantageous to do so. The use of leverage by a Fund can substantially increase the adverse impact to which the Fund’s investment portfolio may be subject.
Liquidity Risk— A Fund may make investments that are illiquid or that may become less liquid in response to market developments or adverse investor perceptions. Illiquid investments may be more difficult to value. Liquidity risk may also refer to the risk that a Fund will not be able to pay redemption proceeds within the allowable time period or without significant dilution to remaining investors’ interests because of unusual market conditions, an unusually high volume of redemption requests, or other reasons. To meet redemption requests, a Fund may be forced to sell investments at an unfavorable time and/or under unfavorable conditions. If a Fund is forced to sell securities at an unfavorable time and/or under unfavorable conditions, such sales may adversely affect the Fund’s NAV and dilute remaining investors’ interests. Liquidity risk may be the result of, among other things, the reduced number and capacity of traditional market participants to make a market in fixed income securities or the lack of an active market. The potential for liquidity risk may be magnified by a rising interest rate environment or other circumstances where investor redemptions from fixed income mutual funds may be higher than normal, potentially causing increased supply in the market due to selling activity. Redemptions by large shareholders may have a negative impact on a Fund’s liquidity.
Loan-Related Investments Risk — In addition to risks generally associated with debt investments (e.g., interest rate risk and default risk), loan-related investments such as loan participations and assignments are subject to other risks. Although a loan obligation may be fully collateralized at the time of acquisition, the collateral may decline in value, be or become illiquid or less liquid, or lose all or substantially all of its value subsequent to investment. Many loan investments are subject to legal or contractual restrictions on resale and certain loan investments may be or become illiquid or less liquid and more difficult to value, particularly in the event of a downgrade of the loan or the borrower. There is less readily available, reliable information about most loan investments than is the case for many other types of securities. Substantial increases in interest rates may cause an increase in loan obligation defaults. With respect to loan participations, the Fund may not always have direct recourse against a borrower if the borrower fails to pay scheduled principal and/or interest; may be subject to greater delays, expenses and risks than if the Fund had purchased a direct obligation of the borrower; and may be regarded as the creditor of the agent lender (rather than the borrower), subjecting the Fund to the creditworthiness of that lender as well. Investors in loans, such as the Fund, may not be entitled to rely on the anti-fraud protections of the federal securities laws, although they may be entitled to certain contractual remedies. The market for loan obligations may be subject to irregular trading activity, wide bid/ask spreads and extended trade settlement periods. Because transactions in many loans are subject to extended trade settlement periods, the Fund may not receive the proceeds from the sale of a loan for a period after the sale. As a result, sale proceeds related to the sale of loans may not be available to make additional investments or to meet the Fund’s redemption obligations for a period after the sale of the loans, and, as a result, the Fund may have to sell other investments or engage in borrowing transactions, such as borrowing from its credit facility, if necessary to raise cash to meet its obligations.
68
GOLDMAN SACHS DIVIDEND FOCUS FUNDS
| 9. OTHER RISKS (continued) |
Senior Loans hold the most senior position in the capital structure of a business entity, and are typically secured with specific collateral, but are nevertheless usually rated below investment grade. Because Second Lien Loans are subordinated or unsecured and thus lower in priority of payment to Senior Loans, they are subject to the additional risk that the cash flow of the borrower and property securing the loan or debt, if any, may be insufficient to meet scheduled payments after giving effect to the senior secured obligations of the borrower. Second Lien Loans generally have greater price volatility than Senior Loans and may be less liquid.
Market and Credit Risks — In the normal course of business, a Fund trades financial instruments and enters into financial transactions where risk of potential loss exists due to changes in the market (market risk). Additionally, a Fund may also be exposed to credit risk in the event that an issuer or guarantor fails to perform or that an institution or entity with which the Fund has unsettled or open transactions defaults.
Master Limited Partnership Risk — Investments in securities of MLPs involve risks that differ from investments in common stock, including risks related to limited control and limited rights to vote on matters affecting the MLP, risks related to potential conflicts of interest between the MLP and the MLP’s general partner, cash flow risks, dilution risks, limited liquidity and risks related to the general partner’s right to require unit-holders to sell their common units at an undesirable time or price.
Short Position Risk — The Funds may enter into a short position through a futures contract, an option or swap agreement or through short sales of any instrument that the Funds may purchase for investment. Taking short positions involves leverage of the Funds’ assets and presents various risks, including counterparty risk. If the value of the underlying instrument or market in which the Funds have taken a short position increases, then the Funds will incur a loss equal to the increase in value from the time that the short position was entered into plus any related interest payments or other fees. Taking short positions involves the risk that losses may be disproportionate, may exceed the amount invested, and may be unlimited. To the extent that the Funds use the proceeds they receive from a short position to take additional long positions, the risks associated with the short position, including leverage risks, may be heightened, because doing so increases the exposure of the Funds to the markets and therefore could magnify changes to the Funds’ NAV.
| 10. INDEMNIFICATIONS |
Under the Trust’s organizational documents, its Trustees, officers, employees and agents are indemnified, to the extent permitted by the Act and state law, against certain liabilities that may arise out of performance of their duties to the Funds. Additionally, in the course of business, the Funds enter into contracts that contain a variety of indemnification clauses. The Funds’ maximum exposure under these arrangements is unknown, as this would involve future claims that may be made against the Funds that have not yet occurred. However, GSAM believes the risk of loss under these arrangements to be remote.
| 11. OTHER MATTERS |
In March 2017, the Financial Accounting Standards Board issued Accounting Standards Update (ASU)2017-08 — Receivables — Nonrefundable Fees and Other Costs (Subtopic310-20): Premium Amortization on Purchased Callable Debt Securities. The amendments in the ASU shorten the amortization period for certain callable debt securities held at a premium, by requiring amortization to the earliest call date. The ASU is effective for fiscal years, and interim periods within those fiscal years, beginning after December 15, 2018. GSAM is currently evaluating the impact, if any, of the amendments.
On November 5, 2019, a definitive proxy statement (“proxy”) was filed with the SEC to elect certain Trustees to the Trust. The Funds will bear their respective share of the proxy, shareholder meeting and other related costs and GSAM has agreed to reimburse each Fund to the extent such expenses exceed a specified percentage of the Fund’s net assets.
69
GOLDMAN SACHS DIVIDEND FOCUS FUNDS
Notes to Financial Statements(continued)
October 31, 2019
| 12. SUBSEQUENT EVENTS |
Subsequent events after the Statements of Assets and Liabilities date other than above have been evaluated, and GSAM has concluded that there is no impact requiring adjustment or disclosure in the financial statements.
| 13. SUMMARY OF SHARE TRANSACTIONS |
Share activity is as follows:
| Income Builder Fund | ||||||||||||||||
|
| |||||||||||||||
| For the Fiscal Year Ended October 31, 2019 | For the Fiscal Year Ended October 31, 2018 | |||||||||||||||
|
| |||||||||||||||
| Shares | Dollars | Shares | Dollars | |||||||||||||
|
| |||||||||||||||
| Class A Shares | ||||||||||||||||
Shares sold | 1,799,656 | $ | 40,853,964 | 1,785,092 | $ | 40,204,213 | ||||||||||
Reinvestment of distributions | 473,912 | 10,712,396 | 548,582 | 12,291,013 | ||||||||||||
Shares redeemed | (3,259,093 | ) | (72,590,615 | ) | (5,090,064 | ) | (114,234,110 | ) | ||||||||
| (985,525 | ) | (21,024,255 | ) | (2,756,390 | ) | (61,738,884 | ) | |||||||||
| Class C Shares | ||||||||||||||||
Shares sold | 2,010,857 | 44,464,284 | 1,851,990 | 41,074,070 | ||||||||||||
Reinvestment of distributions | 569,398 | 12,640,806 | 685,018 | 15,096,254 | ||||||||||||
Shares redeemed | (4,986,655 | ) | (109,946,008 | ) | (7,909,622 | ) | (174,679,951 | ) | ||||||||
| (2,406,400 | ) | (52,840,918 | ) | (5,372,614 | ) | (118,509,627 | ) | |||||||||
| Institutional Shares | ||||||||||||||||
Shares sold | 7,470,375 | 173,813,483 | 9,311,756 | 215,175,360 | ||||||||||||
Reinvestment of distributions | 865,254 | 19,941,926 | 1,086,788 | 24,874,912 | ||||||||||||
Shares redeemed | (13,897,580 | ) | (318,459,334 | ) | (14,935,164 | ) | (343,676,196 | ) | ||||||||
| (5,561,951 | ) | (124,703,925 | ) | (4,536,620 | ) | (103,625,924 | ) | |||||||||
| Investor Shares | ||||||||||||||||
Shares sold | 4,827,414 | 111,049,360 | 2,073,883 | 47,605,287 | ||||||||||||
Reinvestment of distributions | 390,392 | 8,998,199 | 468,350 | 10,689,253 | ||||||||||||
Shares redeemed | (5,145,695 | ) | (116,297,027 | ) | (4,796,110 | ) | (109,846,752 | ) | ||||||||
| 72,111 | 3,750,532 | (2,253,877 | ) | (51,552,212 | ) | |||||||||||
| Class P Shares(a) | ||||||||||||||||
Shares sold | 95,414 | 2,230,065 | 813,199 | 18,451,567 | ||||||||||||
Reinvestment of distributions | 22,699 | 523,868 | 12,301 | 279,645 | ||||||||||||
Shares redeemed | (271,094 | ) | (6,089,236 | ) | (97,673 | ) | (2,236,043 | ) | ||||||||
| (152,981 | ) | (3,335,303 | ) | 727,827 | 16,495,169 | |||||||||||
| Class R6 Shares | ||||||||||||||||
Shares sold | 611,262 | 13,568,669 | 5,382 | 123,570 | ||||||||||||
Reinvestment of distributions | 13,716 | 320,777 | 21 | 451 | ||||||||||||
Shares redeemed | (197,660 | ) | (4,529,061 | ) | (19 | ) | (415 | ) | ||||||||
| 427,318 | 9,360,385 | 5,384 | 123,606 | |||||||||||||
NET DECREASE | (8,607,428 | ) | $ | (188,793,484 | ) | (14,186,290 | ) | $ | (318,807,872 | ) | ||||||
| (a) | Commenced operations on April 16, 2018. |
70
GOLDMAN SACHS DIVIDEND FOCUS FUNDS
| 13. SUMMARY OF SHARE TRANSACTIONS (continued) |
| Rising Dividend Growth Fund | ||||||||||||||||
|
| |||||||||||||||
| For the Fiscal Year Ended October 31, 2019 | For the Fiscal Year Ended October 31, 2018 | |||||||||||||||
|
| |||||||||||||||
| Shares | Dollars | Shares | Dollars | |||||||||||||
|
| |||||||||||||||
| Class A Shares | ||||||||||||||||
Shares sold | 3,875,656 | $ | 41,704,284 | 1,251,756 | $ | 25,564,840 | ||||||||||
Reinvestment of distributions | 11,404,340 | 115,817,078 | 3,291,672 | 64,533,940 | ||||||||||||
Shares redeemed | (11,867,123 | ) | (144,815,996 | ) | (5,745,663 | ) | (116,707,958 | ) | ||||||||
| 3,412,873 | 12,705,366 | (1,202,235 | ) | (26,609,178 | ) | |||||||||||
| Class C Shares | ||||||||||||||||
Shares sold | 1,990,737 | 21,306,015 | 987,628 | 19,971,825 | ||||||||||||
Reinvestment of distributions | 12,146,115 | 124,900,331 | 3,608,555 | 71,210,377 | ||||||||||||
Shares redeemed | (14,700,253 | ) | (176,996,871 | ) | (7,347,614 | ) | (151,191,571 | ) | ||||||||
| (563,401 | ) | (30,790,525 | ) | (2,751,431 | ) | (60,009,369 | ) | |||||||||
| Institutional Shares | ||||||||||||||||
Shares sold | 6,366,869 | 88,407,748 | 3,048,075 | 63,011,397 | ||||||||||||
Reinvestment of distributions | 12,457,809 | 132,953,032 | 5,070,695 | 101,991,902 | ||||||||||||
Shares redeemed | (23,734,594 | ) | (312,316,042 | ) | (19,906,472 | ) | (423,748,047 | ) | ||||||||
| (4,909,916 | ) | (90,955,262 | ) | (11,787,702 | ) | (258,744,748 | ) | |||||||||
| Investor Shares | ||||||||||||||||
Shares sold | 1,916,994 | 22,095,019 | 1,059,119 | 22,245,923 | ||||||||||||
Reinvestment of distributions | 7,878,882 | 83,943,748 | 3,148,574 | 63,278,078 | ||||||||||||
Shares redeemed | (12,134,679 | ) | (156,756,382 | ) | (8,652,881 | ) | (181,621,659 | ) | ||||||||
| (2,338,803 | ) | (50,717,615 | ) | (4,445,188 | ) | (96,097,658 | ) | |||||||||
| Class P Shares(a) | ||||||||||||||||
Shares sold | 17,063 | 209,619 | 2,176,595 | 45,658,034 | ||||||||||||
Reinvestment of distributions | 1,531,128 | 16,342,234 | 33,863 | 714,643 | ||||||||||||
Shares redeemed | (1,793,344 | ) | (22,149,574 | ) | (165,674 | ) | (3,514,400 | ) | ||||||||
| (245,153 | ) | (5,597,721 | ) | 2,044,784 | 42,858,277 | |||||||||||
| Class R Shares | ||||||||||||||||
Shares sold | 89,215 | 955,086 | 69,947 | 1,431,894 | ||||||||||||
Reinvestment of distributions | 110,225 | 1,113,855 | 30,656 | 599,345 | ||||||||||||
Shares redeemed | (146,729 | ) | (1,739,234 | ) | (122,354 | ) | (2,459,383 | ) | ||||||||
| 52,711 | 329,707 | (21,751 | ) | (428,144 | ) | |||||||||||
| Class R6 Shares(b) | ||||||||||||||||
Shares sold | 260,151 | 2,816,993 | 495 | 10,000 | ||||||||||||
Reinvestment of distributions | 5,071 | 57,671 | 10 | 206 | ||||||||||||
Shares redeemed | (75,304 | ) | (862,540 | ) | — | — | ||||||||||
| 189,918 | 2,012,124 | 505 | 10,206 | |||||||||||||
NET DECREASE | (4,401,771 | ) | $ | (163,013,926 | ) | (18,163,018 | ) | $ | (399,020,614 | ) | ||||||
| (a) | Commenced operations on April 16, 2018. |
| (b) | Commenced operations on February 28, 2018. |
71
Report of Independent Registered Public
Accounting Firm
Tothe Board of Trustees of Goldman Sachs Trust and Shareholders of Goldman Sachs Income Builder Fund and Goldman Sachs Rising Dividend Growth Fund
Opinions on the Financial Statements
We have audited the accompanying statements of assets and liabilities, including the schedules of investments, of Goldman Sachs Income Builder Fund and Goldman Sachs Rising Dividend Growth Fund (two of the funds constituting Goldman Sachs Trust, hereafter collectively referred to as the “Funds”) as of October 31, 2019, the related statements of operations for the year ended October 31, 2019, the statements of changes in net assets for each of the two years in the period ended October 31, 2019, including the related notes,and the financial highlights for each of the periods indicated therein (collectively referred to as the “financial statements”). In our opinion, the financial statements present fairly, in all material respects, the financial position of each of the Funds as of October 31, 2019, the results of each of their operations for the year then ended, the changes in each of their net assets for each of the two years in the period ended October 31, 2019 and each of the financial highlights for each of the periods indicated therein in conformity with accounting principles generally accepted in the United States of America.
Basis for Opinions
These financial statements are the responsibility of the Funds’ management. Our responsibility is to express an opinion on the Funds’ financial statements based on our audits. We are a public accounting firm registered with the Public Company Accounting Oversight Board (United States) (PCAOB) and are required to be independent with respect to the Funds in accordance with the U.S. federal securities laws and the applicable rules and regulations of the Securities and Exchange Commission and the PCAOB.
We conducted our audits of these financial statements in accordance with the standards of the PCAOB. Those standards require that we plan and perform the audit to obtain reasonable assurance about whether the financial statements are free of material misstatement, whether due to error or fraud.
Our audits included performing procedures to assess the risks of material misstatement of the financial statements, whether due to error or fraud, and performing procedures that respond to those risks. Such procedures included examining, on a test basis, evidence regarding the amounts and disclosures in the financial statements. Our audits also included evaluating the accounting principles used and significant estimates made by management, as well as evaluating the overall presentation of the financial statements. Our procedures included confirmation of securities owned as of October 31, 2019 by correspondence with the custodian, transfer agent and brokers; when replies were not received from brokers, we performed other auditing procedures. We believe that our audits provide a reasonable basis for our opinions.
PricewaterhouseCoopers LLP
Boston, Massachusetts
December 23, 2019
We have served as the auditor of one or more investment companies in the Goldman Sachs fund complex since 2000.
72
GOLDMAN SACHS DIVIDEND FOCUS FUNDS
As a shareholder of Class A, Class C, Institutional, Investor, Class P, Class R and Class R6 Shares of a Fund, you incur two types of costs: (1) transaction costs, including sales charges on purchase payments (with respect to Class A Shares), contingent deferred sales charges on redemptions (with respect to Class C Shares), and (2) ongoing costs, including management fees; distribution and/or service(12b-1) fees (with respect to Class A, Class C and Class R Shares); and other Fund expenses. This Example is intended to help you understand your ongoing costs (in dollars) of investing in Class A, Class C, Institutional, Investor, Class P, Class R or Class R6 Shares of the Funds and to compare these costs with the ongoing costs of investing in other mutual funds.
The Example is based on an investment of $1,000 invested at the beginning of the period and held for the entire period from May 1, 2019 through October 31, 2019, which represents a period of 184 days in a 365 day year.
Actual Expenses — The first line under each share class in the table below provides information about actual account values and actual expenses. You may use the information in this line, together with the amount you invested, to estimate the expenses that you paid over the period. Simply divide your account value by $1,000 (for example, an $8,600 account value divided by $1,000=8.6), then multiply the result by the number in the first line under the heading entitled “Expenses Paid” to estimate the expenses you paid on your account during this period.
Hypothetical Example for Comparison Purposes — The second line under each share class in the table below provides information about hypothetical account values and hypothetical expenses based on the Funds’ actual net expense ratios and an assumed rate of return of 5% per year before expenses, which is not the Funds’ actual return. The hypothetical account values and expenses may not be used to estimate the actual ending account balance or expenses you paid for the period. You may use this information to compare the ongoing costs of investing in the Funds and other funds. To do so, compare this 5% hypothetical example with the 5% hypothetical examples that appear in the shareholder reports of the other funds.
Please note that the expenses shown in the table are meant to highlight your ongoing costs only and do not reflect any transactional costs, such as sales charges, redemption fees, or exchange fees. Therefore, the second line of the table is useful in comparing ongoing costs only, and will not help you determine the relative total costs of owning different funds. In addition, if these transactional costs were included, your costs would have been higher:
| Income Builder Fund | Rising Dividend Growth Fund | |||||||||||||||||||||||
| Share Class | Beginning Account Value 5/1/19 | Ending Account Value 10/31/19 | Expenses Paid for the 6 months ended 10/31/19* | Beginning Account Value 5/1/19 | Ending Account Value 10/31/19 | Expenses Paid for the 6 months ended 10/31/19* | ||||||||||||||||||
| Class A | ||||||||||||||||||||||||
Actual | $ | 1,000.00 | $ | 1,053.50 | $ | 4.92 | $ | 1,000.00 | $ | 1,009.50 | $ | 5.77 | ||||||||||||
Hypothetical 5% return | 1,000.00 | 1,020.42 | + | 4.84 | 1,000.00 | 1,019.46 | + | 5.80 | ||||||||||||||||
| Class C | ||||||||||||||||||||||||
Actual | 1,000.00 | 1,049.50 | 8.78 | 1,000.00 | 1,005.10 | 9.50 | ||||||||||||||||||
Hypothetical 5% return | 1,000.00 | 1,016.64 | + | 8.64 | 1,000.00 | 1,015.73 | + | 9.55 | ||||||||||||||||
| Institutional | ||||||||||||||||||||||||
Actual | 1,000.00 | 1,055.60 | 2.95 | 1,000.00 | 1,011.40 | 4.11 | ||||||||||||||||||
Hypothetical 5% return | 1,000.00 | 1,022.33 | + | 2.91 | 1,000.00 | 1,021.12 | + | 4.13 | ||||||||||||||||
| Investor | ||||||||||||||||||||||||
Actual | 1,000.00 | 1,055.00 | 3.63 | 1,000.00 | 1,011.00 | 4.46 | ||||||||||||||||||
Hypothetical 5% return | 1,000.00 | 1,021.68 | + | 3.57 | 1,000.00 | 1,020.77 | + | 4.48 | ||||||||||||||||
| Class P | ||||||||||||||||||||||||
Actual | 1,000.00 | 1,055.60 | 2.90 | 1,000.00 | 1,011.50 | 4.06 | ||||||||||||||||||
Hypothetical 5% return | 1,000.00 | 1,022.38 | + | 2.85 | 1,000.00 | 1,021.17 | + | 4.08 | ||||||||||||||||
| Class R | ||||||||||||||||||||||||
Actual | N/A | N/A | N/A | 1,000.00 | 1,008.20 | 7.04 | ||||||||||||||||||
Hypothetical 5% return | N/A | N/A | + | N/A | 1,000.00 | 1,018.20 | + | 7.07 | ||||||||||||||||
| Class R6 | ||||||||||||||||||||||||
Actual | 1,000.00 | 1,055.70 | 2.90 | 1,000.00 | 1,011.50 | 4.06 | ||||||||||||||||||
Hypothetical 5% return | 1,000.00 | 1,022.38 | + | 2.85 | 1,000.00 | 1,021.17 | + | 4.08 | ||||||||||||||||
| * | Expenses for each share class are calculated using each Fund’s annualized net expense ratio for each class, which represents the ongoing expenses as a percentage of net assets for the six months ended October 31, 2019. Expenses are calculated by multiplying the annualized net expense ratio by the average account value for the period; then multiplying the result by the number of days in the most recent fiscal half year; and then dividing that result by the number of days in the fiscal year. The annualized net expense ratios for the period were as follows: |
| Fund | Class A | Class C | Institutional | Investor | Class P | Class R | Class R6 | |||||||||||||||||||||
Income Builder | 0.95 | % | 1.70 | % | 0.57 | % | 0.70 | % | 0.56 | % | N/A | 0.56 | % | |||||||||||||||
Rising Dividend Growth | 1.14 | 1.88 | 0.81 | 0.88 | 0.80 | 1.39 | % | 0.80 | ||||||||||||||||||||
| + | Hypothetical expenses are based on each Fund’s actual annualized net expense ratios and an assumed rate of return of 5% per year before expenses. |
73
GOLDMAN SACHS DIVIDEND FOCUS FUNDS
Statement Regarding Basis for Approval of Management Agreement andSub-Advisory Agreement (Unaudited)
Background
The Goldman Sachs Income Builder Fund and Goldman Sachs Rising Dividend Growth Fund (the “Funds”) are investment portfolios of Goldman Sachs Trust (the “Trust”). The Board of Trustees oversees the management of the Trust and reviews the investment performance and expenses of the Funds at regularly scheduled meetings held throughout the year. In addition, the Board of Trustees determines annually whether to approve the continuance of the Trust’s investment management agreement (the “Management Agreement”) with Goldman Sachs Asset Management, L.P. (the “Investment Adviser”) on behalf of the Funds and thesub-advisory agreement (the“Sub-Advisory Agreement,” and together with the Management Agreement, the “Agreements”) between the Investment Adviser and Dividend Assets Capital, LLC (the“Sub-Adviser”) on behalf of the Rising Dividend Growth Fund.
The Agreements were most recently approved for continuation until June 30, 2020 by the Board of Trustees, including those Trustees who are not parties to the Agreements or “interested persons” (as defined in the Investment Company Act of 1940, as amended) of any party thereto (the “Independent Trustees”), at a meeting held onJune 11-12, 2019 (the “Annual Meeting”).
The review process undertaken by the Trustees spans the course of the year and culminates with the Annual Meeting. To assist the Trustees in their deliberations, the Trustees have established a Contract Review Committee (the “Committee”), comprised of the Independent Trustees. The Committee held four meetings over the course of the year since the Agreements were last approved. At those Committee meetings, regularly scheduled Board or other committee meetings, and/or the Annual Meeting, matters relevant to the renewal of the Management Agreement were considered by the Board, or the Independent Trustees, as applicable. With respect to each Fund, such matters included:
| (a) | the nature and quality of the advisory, administrative, and other services provided to the Fund by the Investment Adviser and its affiliates, including information about: |
| (i) | the structure, staff, and capabilities of the Investment Adviser and its portfolio management teams; |
| (ii) | the groups within the Investment Adviser and its affiliates that support the portfolio management teams or provide other types of necessary services, including fund services groups (e.g., accounting and financial reporting, tax, shareholder services, and operations); controls and risk management groups (e.g., legal, compliance, valuation oversight, credit risk management, internal audit, compliance testing, market risk analysis, finance, and central funding); sales and distribution support groups, and others (e.g., information technology and training); |
| (iii) | trends in employee headcount; |
| (iv) | the Investment Adviser’s financial resources and ability to hire and retain talented personnel and strengthen its operations; and |
| (v) | the parent company’s support of the Investment Adviser and its mutual fund business, as expressed by the firm’s senior management; |
| (b) | information on the investment performance of the Fund, including comparisons to the performance of similar mutual funds, as provided by a third-party mutual fund data provider engaged as part of the contract review process (the “Outside Data Provider”), a benchmark performance index; and information on general investment outlooks in the markets in which the Fund invests; |
| (c) | information provided by the Investment Adviser indicating the Investment Adviser’s views on whether the Fund’s peer group and/or benchmark index had high, medium, or low relevance given the Fund’s particular investment strategy; |
| (d) | the terms of the Agreements and other agreements with affiliated service providers entered into by the Trust on behalf of the Fund; |
| (e) | fee and expense information for the Fund, including: |
| (i) | the relative management fee and expense levels of the Fund as compared to those of comparable funds managed by other advisers, as provided by the Outside Data Provider; |
| (ii) | the Fund’s expense trends over time; and |
| (iii) | to the extent the Investment Adviser manages other types of accounts (such as bank collective trusts, private wealth management accounts, institutional separate accounts,sub-advised mutual funds, andnon-U.S. funds) having investment objectives and policies similar to those of the Fund, comparative information on the advisory fees charged and services provided to those accounts by the Investment Adviser; |
| (f) | with respect to the extensive investment performance and expense comparison data provided by the Outside Data Provider, its processes in producing that data for the Fund; |
| (g) | the undertakings of the Investment Adviser and its affiliates to implement fee waivers and/or expense limitations; |
74
GOLDMAN SACHS DIVIDEND FOCUS FUNDS
Statement Regarding Basis for Approval of Management Agreement andSub-Advisory Agreement (Unaudited) (continued)
| (h) | information relating to the profitability of the Management Agreement and the transfer agency and distribution and service arrangements of the Fund to the Investment Adviser and its affiliates; |
| (i) | whether the Fund’s existing management fee schedule adequately addressed any economies of scale; |
| (j) | a summary of the“fall-out” benefits derived by the Investment Adviser and its affiliates from their relationships with the Fund, including the fees received by the Investment Adviser’s affiliates from the Fund for transfer agency, securities lending (with respect to the Rising Dividend Growth Fund), portfolio trading, distribution and other services; |
| (k) | a summary of potential benefits derived by the Fund as a result of its relationship with the Investment Adviser; |
| (l) | information regarding commissions paid by the Fund and broker oversight, an update on the Investment Adviser’s soft dollars practices, other information regarding portfolio trading, and how the Investment Adviser carries out its duty to seek best execution; |
| (m) | portfolio manager ownership of Fund shares; the manner in which portfolio manager compensation is determined; and the number and types of accounts managed by the portfolio managers; |
| (n) | the nature and quality of the services provided to the Fund by its unaffiliated service providers (as well as the Rising Dividend Growth Fund’sSub-Adviser), and the Investment Adviser’s general oversight and evaluation (including reports on due diligence) of those service providers as part of the administrative services provided under the Management Agreement; and |
| (o) | the Investment Adviser’s processes and policies addressing various types of potential conflicts of interest; its approach to risk management; the annual review of the effectiveness of the Fund’s compliance program; and periodic compliance reports. |
The Trustees also received an overview of the Funds’ distribution arrangements. They received information regarding the Funds’ assets, share purchase and redemption activity, and payment of distribution and service fees. Information was also provided to the Trustees relating to revenue sharing payments made by and services provided by the Investment Adviser and its affiliates to intermediaries that promote the sale, distribution, and/or servicing of Fund shares. The Independent Trustees also discussed the broad range of other investment choices that are available to Fund investors, including the availability of comparable funds managed by other advisers.
The presentations made at the Board and Committee meetings and at the Annual Meeting encompassed the Funds and other mutual funds for which the Board of Trustees has responsibility. In evaluating the Management Agreement at the Annual Meeting, the Trustees relied upon their knowledge, resulting from their meetings and other interactions throughout the year, of the Investment Adviser and its affiliates, their services, and the Funds. In conjunction with these meetings, the Trustees received written materials and oral presentations on the topics covered, and the Investment Adviser addressed the questions and concerns of the Trustees, including concerns regarding the investment performance of certain of the funds they oversee. The Independent Trustees were advised by their independent legal counsel regarding their responsibilities and other regulatory requirements related to the approval and continuation of mutual fund investment management agreements under applicable law. In addition, the Investment Adviser and its affiliates provided the Independent Trustees with a written response to a formal request for information sent on behalf of the Independent Trustees by their independent legal counsel. During the course of their deliberations, the Independent Trustees met in executive sessions with their independent legal counsel, without representatives of the Investment Adviser or its affiliates present.
Nature, Extent, and Quality of the Services Provided Under the Management Agreement
As part of their review, the Trustees considered the nature, extent, and quality of the services provided to the Funds by the Investment Adviser. In this regard, the Trustees considered both the investment advisory services andnon-advisory services that are provided by the Investment Adviser and its affiliates (including, with respect to the Rising Dividend Growth Fund, the Investment Adviser’s oversight of theSub-Adviser). The Trustees noted the transition in the leadership and changes in personnel of various of the Investment Adviser’s portfolio management teams that had occurred in recent periods, and the ongoing recruitment efforts aimed at bringing high quality investment talent to the Investment Adviser. They also noted the Investment Adviser’s commitment to maintaining high quality systems and expending substantial resources to respond to ongoing changes to the regulatory and control environment in which the Funds and their service providers operate, as well as the efforts of the Investment Adviser and its affiliates to combat cyber security risks. The Trustees concluded that the Investment Adviser continued to commit substantial financial and operational resources to the Funds and expressed confidence that the Investment Adviser would continue to do so in the future. The Trustees also recognized that the Investment Adviser had made significant commitments to address regulatory compliance requirements applicable to the Funds and the Investment Adviser and its affiliates.
75
GOLDMAN SACHS DIVIDEND FOCUS FUNDS
Statement Regarding Basis for Approval of Management Agreement andSub-Advisory Agreement (Unaudited) (continued)
Investment Performance
The Trustees also considered the investment performance of the Funds. In this regard, they compared the investment performance ofeach Fund to its peers usingrankings and ratings compiled by the Outside Data Provider as of December 31, 2018, and updated performance information prepared by the Investment Adviser using the peer group identified by the Outside Data Provider as of March 31, 2019. The information on each Fund’s investment performance was provided for theone-, three-, five-, andten-year periods ending on the applicable dates. The Trustees also reviewed each Fund’s investment performance relative to its performance benchmark. As part of this review, they considered the investment performance trends of the Funds over time, and reviewed the investment performance of each Fund in light of its investment objective and policies and market conditions.
In addition, the Trustees considered materials prepared and presentations made by the Investment Adviser’s senior management and portfolio management personnel in which Fund performance was assessed. The Trustees also considered the Investment Adviser’s periodic reports with respect to the Funds’ risk profiles, and how the Investment Adviser’s approach to risk monitoring and management influences portfolio management. They noted the efforts of the Rising Dividend Growth Fund’s portfolio management team to continue to enhance the investment models used in managing the Funds.
The Trustees observed that the Income Builder Fund’s Institutional Shares had placed in the top half of its peer group for theone-, three-, five-, andten-year periods, and had outperformed the Fund’s benchmark index for theone-year period and underperformed for the three-,five-, andten-year periods ended March 31, 2019. The Trustees recalled that the Income Builder Fund had been repositioned from the Goldman Sachs Balanced Fund in 2012. The Trustees noted that the Rising Dividend Growth Fund’s Institutional Shares had placed in the top half of its peer group for theone-year period and the fourth quartile of its peer group for the three-, five-, andten-year periods, and had underperformed the Fund’s benchmark index for theone-,three-, five-, andten-year periods ended March 31, 2019. They noted that in March 2018, the Investment Adviser’s Quantitative Investment Strategies Team assumed portfolio management responsibilities for the portion of the Fund’s portfolio that follows a “10/10 Strategy” and that the Fund’sSub-Adviser, retained portfolio management responsibilities for the portion of the Fund’s portfolio that invests in energy infrastructure companies. The Trustees noted that the Investment Adviser’s Global Portfolio Solutions Team manages allocations between the “10/10 Strategy” and the sleeve managed by theSub-Adviser. They observed that the Investment Adviser had also implemented certain changes to the Fund’s “10/10 Strategy.” The Trustees noted that the Rising Dividend Growth Fund’s peer group (Large Growth) and benchmark (the S&P 500 Index) were broad-based, whereas the Fund focused on dividend-paying stocks. They recalled that the Rising Dividend Growth Fund’s predecessor, which was advised by an affiliate of theSub-Adviser, had commenced operations in March 2004 and had been reorganized into the Fund as a series of the Trust in February 2012. They also noted that the Rising Dividend Growth Fund and the Income Builder Fund had experienced certain portfolio management changes in the first half of 2019.
Costs of Services Provided and Competitive Information
The Trustees considered the contractual terms of the Agreements and the fee rates payable by each Fund under the Management Agreement and, with respect to the Rising Dividend Growth Fund, payable by the Investment Adviser under theSub-Advisory Agreement. In this regard, the Trustees considered information on the services rendered by the Investment Adviser to the Funds, which included both advisory and administrative services that were directed to the needs and operations of the Funds as registered mutual funds.
In particular, the Trustees reviewed analyses prepared by the Outside Data Provider regarding the expense rankings of the Funds. The analyses provided a comparison of each Fund’s management fee and breakpoints to those of a relevant peer group and category universe; an expense analysis which compared each Fund’s overall net and gross expenses to a peer group and a category universe; and data comparing each Fund’s net expenses to the peer and category medians. The analyses also compared each Fund’s other expenses and fee waivers/reimbursements to those of the peer group and category medians. The Trustees concluded that the comparisons provided by the Outside Data Provider were useful in evaluating the reasonableness of the management fees and total expenses paid by the Funds.
In addition, the Trustees considered the Investment Adviser’s undertakings to implement fee waivers and/or expense limitations. They also considered, to the extent that the Investment Adviser manages other types of accounts having investment objectives and policies similar to those of the Funds, comparative fee information for services provided by the Investment Adviser to those accounts, and information that indicated that services provided to the Funds differed in various significant respects from the services provided to other types of accounts which, in many cases, operated under less stringent legal and regulatory structures, required fewer services from the Investment Adviser to a smaller number of client contact points, and were less time-intensive.
In addition, the Trustees noted that shareholders are able to redeem their Fund shares at any time if shareholders believe that the Fund fees and expenses are too high or if they are dissatisfied with the performance of the Fund.
76
GOLDMAN SACHS DIVIDEND FOCUS FUNDS
Statement Regarding Basis for Approval of Management Agreement andSub-Advisory Agreement (Unaudited) (continued)
Profitability
The Trustees reviewed each Fund’s contribution to the Investment Adviser’s revenues andpre-tax profit margins. In this regard the Trustees noted that they had received, among other things, profitability analyses and summaries, revenue and expense schedules by Fund and by function (i.e., investment management, transfer agency and distribution and service), and information on the Investment Adviser’s expense allocation methodology. They observed that the profitability and expense figures are substantially similar to those used by the Investment Adviser for many internal purposes, including compensation decisions among various business groups, and are thus subject to a vigorous internal debate about how certain revenue and expenses should be allocated. The Trustees also noted that the internal audit group within the Goldman Sachs organization periodically audits the expense allocation methodology and that the internal audit group was satisfied with the reasonableness, consistency, and accuracy of the Investment Adviser’s expense allocation methodology. Profitability data for each Fund was provided for 2018 and 2017, and the Trustees considered this information in relation to the Investment Adviser’s overall profitability.
Economies of Scale
The Trustees considered the information that had been provided regarding whether there have been economies of scale with respect to the management of the Funds. The Trustees also considered the breakpoints in the fee rate payable under the Management Agreement for each of the Funds at the following annual percentage rates of the average daily net assets of the Funds:
| Income Builder Fund | Rising Dividend Growth Fund | |||||||
| First $1 billion | 0.54 | % | 0.75 | % | ||||
| Next $1 billion | 0.49 | 0.68 | ||||||
| Next $3 billion | 0.46 | 0.64 | ||||||
| Next $3 billion | 0.45 | 0.63 | ||||||
| Over $8 billion | 0.44 | 0.62 | ||||||
The Trustees noted that the breakpoints were designed to share potential economies of scale, if any, with the Funds and their shareholders as assets under management reach those asset levels. The Trustees also considered the relationship between the management andsub-advisory fee schedules for the Rising Dividend Growth Fund, including any effects of asymmetrical waivers and breakpoints. The Trustees noted that thesub-advisory fee schedule for the Fund does not include fee breakpoints. The Trustees considered the amounts of assets in the Funds; the Funds’ recent share purchase and redemption activity; the information provided by the Investment Adviser relating to the costs of the services provided by the Investment Adviser and its affiliates and their realized profits; information comparing fee rates charged by the Investment Adviser with fee rates charged to other funds in the peer groups; and the Investment Adviser’s undertaking to limit certain expenses of the Funds that exceed specified levels. Upon reviewing these matters at the Annual Meeting, the Trustees concluded that the fee breakpoints represented a means of assuring that benefits of scalability, if any, would be passed along to shareholders at the specified asset levels. They also noted that the Investment Adviser had passed along savings to shareholders of the Funds, which had asset levels above at least the first breakpoint during the prior fiscal year.
Other Benefits to the Investment Adviser and Its Affiliates
The Trustees also considered the other benefits derived by the Investment Adviser and its affiliates from their relationships with the Funds as stated above, including: (a) transfer agency fees received by Goldman Sachs & Co. LLC (“Goldman Sachs”); (b) brokerage and futures commissions earned by Goldman Sachs for executing securities and futures transactions on behalf of the Funds; (c) research received by the Investment Adviser from broker-dealers in exchange for executing certain transactions on behalf of the Funds; (d) trading efficiencies resulting from aggregation of orders of the Funds with those for other funds or accounts managed by the Investment Adviser; (e) fees earned by Goldman Sachs Agency Lending (“GSAL”), an affiliate of the Investment Adviser, as securities lending agent for the Rising Dividend Growth Fund (and fees earned by the Investment Adviser for managing the fund in which the Funds’ cash collateral is invested); (f) the Investment Adviser’s ability to leverage the infrastructure designed to service the Funds on behalf of its other clients; (g) the Investment Adviser’s ability to cross-market other products and services to Fund shareholders; (h) Goldman Sachs’ retention of certain fees as Fund Distributor; (i) the Investment Adviser’s ability to negotiate better pricing with custodians on behalf of its other clients, as a result of the relationship with the Funds; and (j) the possibility that the working relationship between the Investment Adviser and the Funds’ third-party service providers may cause those service providers to be more likely to do business with other areas of Goldman Sachs. In the course of considering the foregoing, the Independent Trustees requested and received further information quantifying certain of thesefall-out benefits.
77
GOLDMAN SACHS DIVIDEND FOCUS FUNDS
Statement Regarding Basis for Approval of Management Agreement andSub-Advisory Agreement (Unaudited) (continued)
Other Benefits to the Funds and Their Shareholders
The Trustees also noted that the Funds receive certain other potential benefits as a result of their relationship with the Investment Adviser, including: (a) trading efficiencies resulting from aggregation of orders of the Funds with those of other funds or accounts managed by the Investment Adviser; (b) enhanced servicing from vendors due to the volume of business generated by the Investment Adviser and its affiliates; (c) enhanced servicing from broker-dealers due to the volume of business generated by the Investment Adviser and its affiliates; (d) the Investment Adviser’s ability to negotiate favorable terms with derivatives counterparties on behalf of the Funds as a result of the size and reputation of the Goldman Sachs organization; (e) the advantages received from the Investment Adviser’s knowledge and experience gained from managing other accounts and products; (f) the Investment Adviser’s ability to hire and retain qualified personnel to provide services to the Funds because of the reputation of the Goldman Sachs organization; (g) the Funds’ access, through the Investment Adviser, to certain firm-wide resources (e.g., proprietary risk management systems and databases), subject to certain restrictions; (h) the Rising Dividend Growth Fund’s ability to participate in the securities lending program administered by GSAL, as measured by the revenue received by the Funds in connection with the program; and (i) the Funds’ access to certain affiliated distribution channels. In addition, the Trustees noted the competitive nature of the mutual fund marketplace, and considered that many of the Funds’ shareholders invested in the Funds in part because of the Funds’ relationship with the Investment Adviser and that those shareholders have a general expectation that the relationship will continue.
Conclusion
In connection with their consideration of the Agreements, the Trustees gave weight to each of the factors described above, but did not identify any particular factor as controlling their decision. After deliberation and consideration of all of the information provided, including the factors described above, the Trustees concluded, in the exercise of their business judgment, that the management fees paid by each of the Funds were reasonable in light of the services provided to it by the Investment Adviser, the Investment Adviser’s costs and each Fund’s current and reasonably foreseeable asset levels. The Trustees unanimously concluded that the Investment Adviser’s continued management likely would benefit each Fund and its shareholders and that the Agreements should be approved and continued with respect to each Fund until June 30, 2020.
78
GOLDMAN SACHS DIVIDEND FOCUS FUNDS
Sub-Advisory Agreement for the Rising Dividend Growth Fund
Nature, Extent, and Quality of the Services Provided Under theSub-Advisory Agreement and Investment Performance
In evaluating theSub-Advisory Agreement, the Trustees relied upon materials furnished and presentations made by the Investment Adviser andSub-Adviser. In evaluating the nature, extent, and quality of services provided by theSub-Adviser, the Trustees considered information on the services provided to the Rising Dividend Growth Fund by theSub-Adviser, information about theSub-Adviser’s: (a) personnel and organizational structure; (b) track record in providingsub-advisory services for the Fund; (c) policies and procedures in place to address potential conflicts of interest; and (d) compliance program and code of ethics. The Trustees noted that the Fund’s predecessor (the “Predecessor Fund”), which was advised by an affiliate of theSub-Adviser, had commenced operations in March 2004 and had been reorganized into the Fund as a series of the Trust in February 2012. The Trustees reviewed the services provided to the Fund under theSub-Advisory Agreement. They also observed that the Fund’s Institutional Shares (together with the Predecessor Fund, as applicable) had placed in the third quartile of its peer group for theone-year period and the fourth quartile of its peer group for the three-, five, andten-year periods, and had underperformed the Fund’s benchmark index for theone-,three-, five-, andten-year periods ended March 31, 2019. The Trustees noted that the Fund’s peer group (Large Growth) and benchmark (the S&P 500 Index) were broad-based, whereas the Fund focused on dividend-paying stocks. They noted that in March 2018 the investment management responsibilities of the Fund had changed and that theSub-Adviser nowsub-advises only the Fund’s investments in energy infrastructure companies.
Costs of Services Provided
The Trustees reviewed the terms of theSub-Advisory Agreement, including the schedule of fees payable to theSub-Adviser. They considered thesub-advisory fee rate payable under theSub-Advisory Agreement, which is calculated at the annual rate of 0.50% of the average daily net assets of the Fund managed by theSub-Adviser. The Trustees noted that theSub-Adviser’s compensation is paid by the Investment Adviser, not by the Fund, and that the retention of theSub-Adviser does not increase the fees incurred by the Fund for advisory services. They considered the Investment Adviser’s belief that the relationship between the management fees paid by the Fund and thesub-advisory fees paid by the Investment Adviser is appropriate given the extent of these services.
Conclusion
After deliberation and consideration of the information provided, the Trustees concluded that thesub-advisory fee to be paid by the Investment Adviser to theSub-Adviser with respect to the Rising Dividend Growth Fund is reasonable in light of the services to be provided by theSub-Adviser and the Fund’s reasonably foreseeable asset levels, and that theSub-Advisory Agreement should be approved and continued until June 30, 2020.
79
GOLDMAN SACHS DIVIDEND FOCUS FUNDS
Trustees and Officers (Unaudited)
Independent Trustees*
Name, Address and Age1 | Position(s) Held with the Trust | Term of Office and Length of Time Served2 | Principal Occupation(s) During Past 5 Years | Number of Portfolios in Fund Complex Overseen by Trustee3 | Other Directorships Held by Trustee4 | |||||
Jessica Palmer Age: 70 | Chair of the Board of Trustees | Since 2018 (Trustee since 2007) | Ms. Palmer is retired. She was formerly Consultant, Citigroup Human Resources Department (2007-2008); Managing Director, Citigroup Corporate and Investment Banking (previously, Salomon Smith Barney/ Salomon Brothers) (1984-2006). Ms. Palmer was a Member of the Board of Trustees of Indian Mountain School (private elementary and secondary school) (2004-2009).
Chair of the Board of Trustees — Goldman Sachs Trust and Goldman Sachs Variable Insurance Trust. | 102 | None | |||||
Kathryn A. Cassidy Age: 65 | Trustee | Since 2015 | Ms. Cassidy is retired. Formerly, she was Advisor to the Chairman (May 2014-December 2014); and Senior Vice President and Treasurer (2008-2014), General Electric Company & General Electric Capital Corporation (technology and financial services companies).
Trustee — Goldman Sachs Trust and Goldman Sachs Variable Insurance Trust. | 102 | None | |||||
Diana M. Daniels Age: 70 | Trustee | Since 2007 | Ms. Daniels is retired. Formerly, she was Vice President, General Counsel and Secretary, The Washington Post Company (1991-2006). Ms. Daniels is a Trustee Emeritus and serves as a Presidential Councillor of Cornell University (2013-Present); former Member of the Legal Advisory Board, New York Stock Exchange (2003- 2006) and of the Corporate Advisory Board, Standish Mellon Management Advisors (2006- 2007).
Trustee — Goldman Sachs Trust and Goldman Sachs Variable Insurance Trust. | 102 | None | |||||
Roy W. Templin Age: 59 | Trustee | Since 2013 | Mr. Templin is retired. He is Director, Armstrong World Industries, Inc. (a designer and manufacturer of ceiling, wall and suspension system solutions) (2016-Present); and was formerly Chairman of the Board of Directors, Con-Way Incorporated (a transportation, logistics and supply chain management service company) (2014-2015); Executive Vice President and Chief Financial Officer, Whirlpool Corporation (an appliance manufacturer and marketer) (2004- 2012). Previously, Mr. Templin served as an Advisory Board Member of Goldman Sachs Trust and Goldman Sachs Variable Insurance Trust (June 2013-October 2013).
Trustee — Goldman Sachs Trust and Goldman Sachs Variable Insurance Trust. | 102 | Armstrong World Industries, Inc. (a ceiling, wall and suspension systems solutions manufacturer) | |||||
Gregory G. Weaver Age: 68 | Trustee | Since 2015 | Mr. Weaver is retired. He is Director, Verizon Communications Inc. (2015-Present); and was formerly Chairman and Chief Executive Officer, Deloitte & Touche LLP (a professional services firm) (2001-2005 and 2012-2014); and Member of the Board of Directors, Deloitte & Touche LLP (2006-2012).
Trustee — Goldman Sachs Trust and Goldman Sachs Variable Insurance Trust. | 102 | Verizon Communications Inc. | |||||
80
GOLDMAN SACHS DIVIDEND FOCUS FUNDS
Trustees and Officers (Unaudited) (continued)
Interested Trustee*
Name, Address and Age1 | Position(s) Held with the Trust | Term of Office and Length of Time Served2 | Principal Occupation(s) During Past 5 Years | Number of Portfolios in Fund Complex Overseen by Trustee3 | Other Directorships Held by Trustee4 | |||||
James A. McNamara Age: 57 | President and Trustee | Since 2007 | Advisory Director, Goldman Sachs (January 2018-Present); Managing Director, Goldman Sachs (January 2000-December 2017); Director of Institutional Fund Sales, GSAM (April 1998-December 2000); and Senior Vice President and Manager, Dreyfus Institutional Service Corporation (January 1993-April 1998).
President and Trustee — Goldman Sachs Trust; Goldman Sachs Variable Insurance Trust; Goldman Sachs Trust II; Goldman Sachs MLP Income Opportunities Fund; Goldman Sachs MLP and Energy Renaissance Fund; and Goldman Sachs ETF Trust. | 162 | None | |||||
Advisory Board Members
Name, Address, Age1 | Position(s) Held with the Trust | Term of Office and Length of Time Served2 | Principal Occupation(s) During Past 5 Years | Number of Portfolios in Fund Complex Overseen by Advisory | Other Directorships Held by Advisory Board Member4 | |||||
Dwight L. Bush Age: 62 | Advisory Board Member | Since 2019 | Ambassador Bush is President and CEO of D.L. Bush & Associates (a financial advisory and private investment firm) (2002-2014 and 2017-present); and was formerly U.S. Ambassador to the Kingdom of Morocco (2014-2017) and a Member of the Board of Directors of Santander Bank, N.A. (2018-2019).
Advisory Board Member — Goldman Sachs Trust and Goldman Sachs Variable Insurance Trust. | 102 | None | |||||
Joaquin Delgado Age: 59 | Advisory Board Member | Since 2019 | Dr. Delgado is retired. He is Director, Hexion Inc. (a specialty chemical manufacturer) (2019-present); and Director, Stepan Company (a specialty chemical manufacturer) (2011-present); and was formerly Executive Vice President, Consumer Business Group of 3M Company (July 2016-July 2019); and Executive Vice President, Health Care Business Group of 3M Company (October 2012-July 2016).
Advisory Board Member — Goldman Sachs Trust and Goldman Sachs Variable Insurance Trust.
| 102 | Stepan Company (a specialty chemical manufacturer) | |||||
| * | Mr. McNamara is considered to be an “Interested Trustee” because he holds positions with Goldman Sachs and owns securities issued by The Goldman Sachs Group, Inc. Mr. McNamara holds comparable positions with certain other companies of which Goldman Sachs, GSAM or an affiliate thereof is the investment adviser, administrator and/or distributor. |
| 1 | Each Trustee and Advisory Board Member may be contacted by writing to the Trustee or Advisory Board Member, c/o Goldman Sachs, 200 West Street, New York, New York, 10282, Attn: Caroline Kraus. Information is provided as of October 31, 2019. |
| 2 | Subject to such policies as may be adopted by the Board from time-to-time, each Trustee holds office for an indefinite term, until the earliest of: (a) the election of his or her successor; (b) the date the Trustee resigns or is removed by the Board or shareholders, in accordance with the Trust’s Declaration of Trust; or (c) the termination of the Trust. The Board has adopted policies which provide that (a) no Trustee shall hold office for more than 15 years and (b) a Trustee shall retire as of December 31st of the calendar year in which he or she reaches his or her 74th birthday, unless a waiver of such requirements shall have been adopted by a majority of the other Trustees. These policies may be changed by the Trustees without shareholder vote. |
| 3 | The Goldman Sachs Fund Complex includes certain other companies listed above for each respective Trustee. As of October 31, 2019, Goldman Sachs Trust consisted of 89 portfolios (88 of which offered shares to the public); Goldman Sachs Variable Insurance Trust consisted of 13 portfolios; Goldman Sachs Trust II consisted of 19 portfolios (17 of which offered shares to the public); Goldman Sachs MLP Income Opportunities Fund and Goldman Sachs MLP and Energy Renaissance Fund each consisted of one portfolio; and Goldman Sachs ETF Trust consisted of 39 portfolios (21 of which offered shares to the public). |
| 4 | This column includes only directorships of companies required to report to the Securities and Exchange Commission under the Securities Exchange Act of 1934 (i.e., “public companies”) or other investment companies registered under the Act. |
Additional information about the Trustees is available in the Funds’ Statement of Additional Information, which can be obtained from Goldman Sachs free of charge by calling this toll-free number (in the United States of America): 1-800-526-7384. Additional information about the Advisory Board Members will be available in the Funds’ Statement of Additional Information dated February 28, 2020, which will be available from Goldman Sachs free of charge by calling this toll-free number (in the United States of America): 1-800-526-7384.
81
GOLDMAN SACHS DIVIDEND FOCUS FUNDS
Trustees and Officers (Unaudited) (continued)
Officers of the Trust*
Name, Address and Age1 | Position(s) Held with the Trust | Term of Office and | Principal Occupation(s) During Past 5 Years | |||
James A. McNamara 200 West Street New York, NY 10282 Age: 57 | Trustee and President | Since 2007 | Advisory Director, Goldman Sachs (January 2018-Present); Managing Director, Goldman Sachs (January 2000-December 2017); Director of Institutional Fund Sales, GSAM (April 1998-December 2000); and Senior Vice President and Manager, Dreyfus Institutional Service Corporation (January 1993-April 1998).
President and Trustee — Goldman Sachs Trust; Goldman Sachs Variable Insurance Trust; Goldman Sachs Trust II; Goldman Sachs MLP Income Opportunities Fund; Goldman Sachs MLP and Energy Renaissance Fund; and Goldman Sachs ETF Trust. | |||
Caroline L. Kraus 200 West Street New York, NY 10282 Age: 42 | Secretary | Since 2012 | Managing Director, Goldman Sachs (January 2016-Present); Vice President, Goldman Sachs (August 2006-December 2015); Associate General Counsel, Goldman Sachs (2012-Present); Assistant General Counsel, Goldman Sachs (August 2006-December 2011); and Associate, Weil, Gotshal & Manges, LLP (2002-2006).
Secretary — Goldman Sachs Trust (previously Assistant Secretary (2012)); Goldman Sachs Variable Insurance Trust (previously Assistant Secretary (2012)); Goldman Sachs Trust II; Goldman Sachs BDC, Inc.; Goldman Sachs Private Middle Market Credit LLC; Goldman Sachs Middle Market Lending Corp.; Goldman Sachs MLP Income Opportunities Fund; Goldman Sachs MLP and Energy Renaissance Fund; and Goldman Sachs ETF Trust. | |||
Joseph F. DiMaria 30 Hudson Street Jersey City, NJ 07302 Age: 51 | Treasurer, Principal Financial Officer and Principal Accounting Officer | Since 2017 (Treasurer and Principal Financial Officer since 2019) | Managing Director, Goldman Sachs (November 2015-Present) and Vice President — Mutual Fund Administration, Columbia Management Investment Advisers, LLC (May 2010-October 2015).
Treasurer, Principal Financial Officer and Principal Accounting Officer — Goldman Sachs Trust (previously Assistant Treasurer (2016)); Goldman Sachs Variable Insurance Trust (previously Assistant Treasurer (2016)); Goldman Sachs Trust II (previously Assistant Treasurer (2017)); Goldman Sachs MLP Income Opportunities Fund (previously Assistant Treasurer (2017)); Goldman Sachs MLP and Energy Renaissance Fund (previously Assistant Treasurer (2017)); and Goldman Sachs ETF Trust (previously Assistant Treasurer (2017)). | |||
| * | Represents a partial list of officers of the Trust. Additional information about all the officers is available in the Funds’ Statement of Additional Information, which can be obtained from Goldman Sachs free of charge by calling this toll-free number (in the United States): 1-800-526-7384. |
| 1 | Information is provided as of October 31, 2019. |
| 2 | Officers hold office at the pleasure of the Board of Trustees or until their successors are duly elected and qualified. Each officer holds comparable positions with certain other companies of which Goldman Sachs, GSAM or an affiliate thereof is the investment adviser, administrator and/or distributor. |
Goldman Sachs Trust — Dividend Focus Fund — Tax Information (Unaudited)
For the year ended October 31, 2019, 20.63% and 57.14% of the dividends paid from net investment company taxable income by the Income Builder and Rising Dividend Growth Funds, respectively, qualify for the dividends received deduction available to corporations.
For the year ended October 31, 2019, 28.00% and 70.99% of the dividends paid from net investment company taxable income by the Income Builder and Rising Dividend Growth Funds, respectively, qualify for the reduced tax rate under the Jobs and Growth Tax Relief and Reconciliation Act of 2003.
Pursuant to Section 852 of the Internal Revenue Code, the Rising Dividend Growth Fund designates $516,474,079, or if different, the maximum amount allowable, as capital gain dividends paid during the fiscal year ended October 31, 2019.
82
FUNDS PROFILE
Goldman Sachs Funds
Goldman Sachs is a premier financial services firm, known since 1869 for creating thoughtful and customized investment solutions in complex global markets.
Today, theConsumer and Investment Management Division of Goldman Sachs serves a diverse set of clients worldwide, including private institutions, public entities and individuals. With approximately $1.60 trillion in assets under supervision as of September 30, 2019, Goldman Sachs Asset Management (“GSAM”) has portfolio management teams located around the world and our investment professionals bring firsthand knowledge of local markets to every investment decision. Assets under supervision includes assets under management and other client assets for which Goldman Sachs does not have full discretion. GSAM leverages the resources of Goldman Sachs & Co. LLC subject to legal, internal and regulatory restrictions.
Money Market
Financial Square FundsSM
| ∎ | Financial Square Treasury Solutions Fund1 |
| ∎ | Financial Square Government Fund1 |
| ∎ | Financial Square Money Market Fund2 |
| ∎ | Financial Square Prime Obligations Fund2 |
| ∎ | Financial Square Treasury Instruments Fund1 |
| ∎ | Financial Square Treasury Obligations Fund1 |
| ∎ | Financial Square Federal Instruments Fund1 |
Investor FundsSM
| ∎ | Investor Money Market Fund3 |
| ∎ | Investor Tax-Exempt Money Market Fund3 |
Fixed Income
Short Duration and Government
| ∎ | Enhanced Income Fund |
| ∎ | High Quality Floating Rate Fund |
| ∎ | Short-Term Conservative Income Fund |
| ∎ | Short Duration Government Fund |
| ∎ | Short Duration Income Fund |
| ∎ | Government Income Fund |
| ∎ | Inflation Protected Securities Fund |
Multi-Sector
| ∎ | Bond Fund |
| ∎ | Core Fixed Income Fund |
| ∎ | Global Income Fund |
| ∎ | Strategic Income Fund |
Municipal and Tax-Free
| ∎ | High Yield Municipal Fund |
| ∎ | Dynamic Municipal Income Fund |
| ∎ | Municipal Income Completion Fund |
| ∎ | Short Duration Tax-Free Fund |
Single Sector
| ∎ | Investment Grade Credit Fund |
| ∎ | U.S. Mortgages Fund |
| ∎ | High Yield Fund |
| ∎ | High Yield Floating Rate Fund |
| ∎ | Emerging Markets Debt Fund |
| ∎ | Local Emerging Markets Debt Fund |
Fixed Income Alternatives
| ∎ | Long Short Credit Strategies Fund |
Fundamental Equity
| ∎ | Equity Income Fund |
| ∎ | Small Cap Growth Fund |
| ∎ | Small Cap Value Fund |
| ∎ | Small/Mid Cap Value Fund |
| ∎ | Mid Cap Value Fund |
| ∎ | Large Cap Value Fund |
| ∎ | Focused Value Fund |
| ∎ | Capital Growth Fund |
| ∎ | Strategic Growth Fund |
| ∎ | Small/Mid Cap Growth Fund |
| ∎ | Flexible Cap Fund |
| ∎ | Concentrated Growth Fund |
| ∎ | Technology Opportunities Fund |
| ∎ | Growth Opportunities Fund |
| ∎ | Rising Dividend Growth Fund |
| ∎ | Blue Chip Fund |
| ∎ | Income Builder Fund |
Tax-Advantaged Equity
| ∎ | U.S. Tax-Managed Equity Fund |
| ∎ | International Tax-Managed Equity Fund |
| ∎ | U.S. Equity Dividend and Premium Fund |
| ∎ | International Equity Dividend and Premium Fund |
Equity Insights
| ∎ | Small Cap Equity Insights Fund |
| ∎ | U.S. Equity Insights Fund |
| ∎ | Small Cap Growth Insights Fund |
| ∎ | Large Cap Growth Insights Fund |
| ∎ | Large Cap Value Insights Fund |
| ∎ | Small Cap Value Insights Fund |
| ∎ | International Small Cap Insights Fund |
| ∎ | International Equity Insights Fund |
| ∎ | Emerging Markets Equity Insights Fund |
Fundamental Equity International
| ∎ | International Equity Income Fund |
| ∎ | International Equity ESG Fund |
| ∎ | China Equity Fund4 |
| ∎ | Emerging Markets Equity Fund |
| ∎ | Imprint Emerging Markets Opportunities Fund5 |
| ∎ | ESG Emerging Markets Equity Fund |
Alternative
| ∎ | Real Estate Securities Fund |
| ∎ | International Real Estate Securities Fund |
| ∎ | Commodity Strategy Fund |
| ∎ | Global Real Estate Securities Fund |
| ∎ | Alternative Premia Fund |
| ∎ | Absolute Return Tracker Fund |
| ∎ | Managed Futures Strategy Fund |
| ∎ | MLP Energy Infrastructure Fund |
| ∎ | MLP & Energy Fund |
| ∎ | Multi-Manager Alternatives Fund |
| ∎ | Global Infrastructure Fund |
Total Portfolio Solutions
| ∎ | Global Managed Beta Fund |
| ∎ | Multi-Manager Non-Core Fixed Income Fund |
| ∎ | Multi-Manager U.S. Dynamic Equity Fund |
| ∎ | Multi-Manager Global Equity Fund |
| ∎ | Multi-Manager International Equity Fund |
| ∎ | Tactical Tilt Overlay Fund |
| ∎ | Balanced Strategy Portfolio |
| ∎ | Multi-Manager U.S. Small Cap Equity Fund |
| ∎ | Multi-Manager Real Assets Strategy Fund |
| ∎ | Growth and Income Strategy Portfolio |
| ∎ | Growth Strategy Portfolio |
| ∎ | Dynamic Global Equity Fund6 |
| ∎ | Satellite Strategies Portfolio |
| ∎ | Enhanced Dividend Global Equity Portfolio |
| ∎ | Tax-Advantaged Global Equity Portfolio |
| ∎ | Strategic Factor Allocation Fund |
| ∎ | Target Date 2020 Portfolio |
| ∎ | Target Date 2025 Portfolio |
| ∎ | Target Date 2030 Portfolio |
| ∎ | Target Date 2035 Portfolio |
| ∎ | Target Date 2040 Portfolio |
| ∎ | Target Date 2045 Portfolio |
| ∎ | Target Date 2050 Portfolio |
| ∎ | Target Date 2055 Portfolio |
| ∎ | Target Date 2060 Portfolio |
| ∎ | GQG Partners International Opportunities Fund |
| 1 | You could lose money by investing in the Fund. Although the Fund seeks to preserve the value of your investment at $1.00 per share, it cannot guarantee it will do so. An investment in the Fund is not a deposit of a bank and is not insured or guaranteed by the Federal Deposit Insurance Corporation or any other government agency. The Fund’s sponsor has no legal obligation to provide financial support to the Fund, and you should not expect that the sponsor will provide financial support to the Fund at any time. |
| 2 | You could lose money by investing in the Fund. Because the share price of the Fund will fluctuate, when you sell your shares they may be worth more or less than what you originally paid for them. The Fund may impose a fee upon sale of your shares or may temporarily suspend your ability to sell shares if the Fund’s liquidity falls below required minimums because of market conditions or other factors. An investment in the Fund is not a deposit of a bank and is not insured or guaranteed by the Federal Deposit Insurance Corporation or any other government agency. The Fund’s sponsor has no legal obligation to provide financial support to the Fund, and you should not expect that the sponsor will provide financial support to the Fund at any time. |
| 3 | You could lose money by investing in the Fund. Although the Fund seeks to preserve the value of your investment at $1.00 per share, it cannot guarantee it will do so. The Fund may impose a fee upon sale of your shares or may temporarily suspend your ability to sell shares if the Fund’s liquidity falls below required minimums because of market conditions or other factors. An investment in the Fund is not a deposit of a bank and is not insured or guaranteed by the Federal Deposit Insurance Corporation or any other government agency. The Fund’s sponsor has no legal obligation to provide financial support to the Fund, and you should not expect that the sponsor will provide financial support to the Fund at any time. |
| 4 | Effective after the close of business on November 20, 2019, the Goldman Sachs Asia Equity Fund was renamed the Goldman Sachs China Equity Fund. |
| 5 | Effective after the close of business on August 30, 2019, the Goldman Sachs N-11 Equity Fund was renamed the Goldman Sachs Imprint Emerging Markets Opportunities Fund. |
| 6 | Effective after the close of business on February 28, 2019, the Goldman Sachs Equity Growth Strategy Portfolio was renamed the Goldman Sachs Dynamic Global Equity Fund. |
| * | This list covers open-end funds only. Please visit our website at www.GSAMFUNDS.com to learn about our closed-end funds and exchange-traded funds. |
TRUSTEES Jessica Palmer,Chair Kathryn A. Cassidy Diana M. Daniels James A. McNamara Roy W. Templin Gregory G. Weaver | OFFICERS James A. McNamara,President Joseph F. DiMaria,Principal FinancialOfficer, PrincipalAccounting Officer and Treasurer Caroline L. Kraus,Secretary | |
GOLDMAN SACHS & CO. LLC Distributor and Transfer Agent | GOLDMAN SACHS ASSET MANAGEMENT, L.P. Investment Adviser | |
Visit our website atwww.GSAMFUNDS.com to obtain the most recent month-end returns.
Goldman Sachs Asset Management, L.P., 200 West Street, New York, New York 10282
The reports concerning the Funds included in this shareholder report may contain certain forward-looking statements about the factors that may affect the performance of the Funds in the future. These statements are based on Fund management’s predictions and expectations concerning certain future events and their expected impact on the Funds, such as performance of the economy as a whole and of specific industry sectors, changes in the levels of interest rates, the impact of developing world events, and other factors that may influence the future performance of the Funds. Management believes these forward-looking statements to be reasonable, although they are inherently uncertain and difficult to predict. Actual events may cause adjustments in portfolio management strategies from those currently expected to be employed.
A description of the policies and procedures that the Funds use to determine how to vote proxies relating to portfolio securities and information regarding how the Funds voted proxies relating to portfolio securities during the most recent 12-month period ended June 30 is available (i) without charge, upon request by calling 1-800-526-7384 (for Retail Shareholders) or 1-800-621-2550 (for Institutional Shareholders); and (ii) on the Securities and Exchange Commission (“SEC”) web site at http://www.sec.gov.
The Funds will file their portfolio holdings for each month in a fiscal quarter within 60 days after the end of the relevant fiscal quarter on Form N-PORT. Portfolio holdings information for the third month of each fiscal quarter will be made available on the SEC’s web site at http://www.sec.gov. Portfolio holdings information may be obtained upon request and without charge by calling 1-800-526-7384 (for Retail Shareholders) or 1-800-621-2550 (for Institutional Shareholders).
All or a portion of the Funds’ distributions may be treated for tax purposes as a return of capital, however, the final characterization of such distributions will be reported annually on Form 1099-DIV. The final tax status of the distributions may differ substantially from the above dividend information.
Fund holdings and allocations shown are unaudited, and may not be representative of current or future investments. Fund holdings and allocations may not include the Funds’ entire investment portfolio, which may change at any time. Fund holdings should not be relied on in making investment decisions and should not be construed as research or investment advice regarding particular securities. Current and future holdings are subject to risk.
Economic and market forecasts presented herein reflect our judgment as of the date of this presentation and are subject to change without notice. These forecasts do not take into account the specific investment objectives, restrictions, tax and financial situation or other needs of any specific client. Actual data will vary and may not be reflected here. These forecasts are subject to high levels of uncertainty that may affect actual performance. Accordingly, these forecasts should be viewed as merely representative of a broad range of possible outcomes. These forecasts are estimated, based on assumptions, and are subject to significant revision and may change materially as economic and market conditions change. Goldman Sachs has no obligation to provide updates or changes to these forecasts. Case studies and examples are for illustrative purposes only.
The Global Industry Classification Standard (GICS) was developed by and is the exclusive property and a service mark of Morgan Stanley Capital International Inc. (MSCI) and Standard & Poor’s, a division of The McGraw-Hill Companies, Inc. (S&P) and is licensed for use by Goldman Sachs. Neither MSCI, S&P nor any other party involved in making or compiling the GICS or any GICS classifications makes any express or implied warranties or representations with respect to such standard or classification (or the results to be obtained by the use thereof), and all such parties hereby expressly disclaim all warranties of originality, accuracy, completeness, merchantability or fitness for a particular purpose with respect to any of such standard or classification. Without limiting any of the foregoing, in no event shall MSCI, S&P, any of their affiliates or any third party involved in making or compiling the GICS or any GICS classifications have any liability for any direct, indirect, special, punitive, consequential or any other damages (including lost profits) even if notified of the possibility of such damages.
The portfolio risk management process includes an effort to monitor and manage risk, but does not imply low risk.
This material is not authorized for distribution to prospective investors unless preceded or accompanied by a current Prospectus or summary prospectus, if applicable. Investors should consider a Fund’s objective, risks, and charges and expenses, and read the summary prospectus, if available, and/or the Prospectus carefully before investing or sending money. The summary prospectus, if available, and the Prospectus contain this and other information about a Fund and may be obtained from your authorized dealer or from Goldman Sachs & Co. LLC by calling (retail – 1-800-526-7384) (institutional – 1-800-621-2550).
© 2019 Goldman Sachs. All rights reserved. 187094-OTU-1103595 DIVFOAR-19
Goldman Sachs Funds

| Annual Report | October 31, 2019 | |||
Domestic Equity Insights Funds | ||||
Large Cap Growth Insights | ||||
Large Cap Value Insights | ||||
Small Cap Equity Insights | ||||
Small Cap Growth Insights | ||||
Small Cap Value Insights | ||||
U.S. Equity Insights | ||||
It is our intention that beginning on January 1, 2021, paper copies of the Funds’ annual and semi-annual shareholder reports will no longer be sent by mail, unless you specifically request paper copies of the reports from a Fund or from your financial intermediary. Instead, the reports will be made available on a website, and you will be notified by mail each time a report is posted and provided with a website link to access the report.
If you already elected to receive shareholder reports electronically, you will not be affected by this change and you need not take any action. At any time, you may elect to receive reports and certain communications from a Fund electronically by calling the applicable toll-free number below or by contacting your financial intermediary.
You may elect to receive all future shareholder reports in paper free of charge. If you hold shares of a Fund directly with the Fund’s transfer agent, you can inform the transfer agent that you wish to receive paper copies of reports by calling toll-free800-621-2550 for Institutional, Service, Class R6 and Class P shareholders or800-526-7384 for all other shareholders. If you hold shares of a Fund through a financial intermediary, please contact your financial intermediary to make this election. Your election to receive reports in paper will apply to all Goldman Sachs Funds held in your account if you invest through your financial intermediary or all Goldman Sachs Funds held with the Funds’ transfer agent if you invest directly with the transfer agent.

Goldman Sachs Domestic Equity Insights Funds
| ∎ | LARGE CAP GROWTH INSIGHTS |
| ∎ | LARGE CAP VALUE INSIGHTS |
| ∎ | SMALL CAP EQUITY INSIGHTS |
| ∎ | SMALL CAP GROWTH INSIGHTS |
| ∎ | SMALL CAP VALUE INSIGHTS |
| ∎ | U.S. EQUITY INSIGHTS |
| 1 | ||||
| 3 | ||||
| 5 | ||||
| 29 | ||||
| 30 | ||||
| 57 | ||||
| 64 | ||||
| 64 | ||||
| 72 | ||||
| 80 | ||||
| 88 | ||||
| 95 | ||||
| 102 | ||||
| 110 | ||||
| 131 | ||||
| 132 | ||||
| NOT FDIC-INSURED | May Lose Value | No Bank Guarantee | ||
GOLDMAN SACHS DOMESTIC EQUITY INSIGHTS FUNDS
What Differentiates Goldman Sachs’
Domestic Equity Insights Funds Investment Process?
At Goldman Sachs Asset Management, L.P. (“GSAM”), Equity Insights combines traditional fundamental analysis with sophisticated quantitative modeling. Our approach is not unlike that of a more traditional active manager: we look at fundamental investment themes that have been effective historically in forecasting excess returns of stocks. However, where we differ from traditional managers is that we seek to rigorously test every potential research theme or signal to verify whether they have shown consistent predictive ability across a wide variety of stocks in different time periods and under different market conditions.
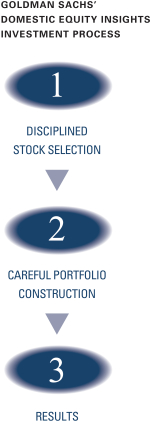

| ∎ | Comprehensive– We calculate expected excess returns for more than 10,000 stocks on a daily basis. |
| ∎ | Rigorous– We evaluate stocks based on fundamental investment criteria that have outperformed historically. |
| ∎ | Objective– Our stock selection process is designed to be free from the emotion that may lead to biased investment decisions. |

| ∎ | Our computer optimization process allocates risk to our high conviction investment ideas and constructs funds that strive to neutralize systematic risks and deliver better returns. |
| ∎ | We use a proprietary risk model that is designed to be more precise, more focused and faster to respond because it seeks to identify, track and manage risk specific to our process, using daily data. |

Fully invested, well-diversified portfolio that seeks to:
| ∎ | Maintain style, sector, risk and capitalization characteristics similar to the benchmark. |
| ∎ | Offer broad access to a clearly defined equity universe. |
| ∎ | Generate excess returns that are positive, consistent and repeatable. |
1
GOLDMAN SACHS DOMESTIC EQUITY INSIGHTS FUNDS
Enhancements Made to Proprietary Quantitative Model during the 12-Month Period Ended October 31, 2019
We continuously look for ways to improve our investment process. Accordingly, we introduced a number of enhancements to our proprietary quantitative model during the 12-month period ended October 31, 2019 (the “Reporting Period”).
In the first half of the Reporting Period, we added a signal within our High Quality Business Models investment theme that uses novel data to help us understand consumer retail trends. We believe this signal will complement our existing suite of alternative data metrics to help us better understand retailers’ earnings growth. In addition, we added a number of signals that utilize natural language processing and regulatory filings to help us better understand the regulatory and business risks faced by companies. Within our Sentiment Analysis investment theme, we enhanced our existing signals that use machine learning to help understand sell-side analyst sentiment. With a larger corpus of sell-side research reports to analyze, we have introduced a new machine learning algorithm to help classify sentiment.
In the second half of the Reporting Period, we implemented a new signal within our Sentiment Analysis investment theme that gauges investor conviction around future price declines for securities. We analyze more than 6,000 stocks to ascertain the difficulty in borrowing the security for the purposes of short selling. We also implemented two new signals within our Market Themes & Trends investment theme. The first signal analyzes co-movement of companies that have a similar online presence. The second signal, which covers more than 7,000 stocks, identifies stocks collectively held by mutual funds in order to gauge their potential co-movement resulting from investor activity.
2
MARKET REVIEW
Goldman Sachs Domestic Equity Insights Funds
U.S. equities recorded substantial gains during the 12-month period ended October 31, 2019 (the “Reporting Period”), with Federal Reserve (“Fed”) monetary policy, economic growth expectations and geopolitics dominating market sentiment.
When the Reporting Period began in November 2018, U.S. equities gained following a volatile prior month. Trade and political uncertainty persisted, but U.S. stocks were buoyed by dovish comments from Fed Chair Jerome Powell and by seemingly encouraging progress toward China-U.S. trade talks. (Dovish language tends to suggest lower interest rates; opposite of hawkish.) The U.S. midterm elections on November 6th resulted in a divided government, as had been widely anticipated, with the Democrats gaining control of the House of Representatives and the Republicans maintaining their majority in the Senate. U.S. economic data remained strong, with Gross Domestic Product (“GDP”) growing at an annualized pace of 3.5% in the third quarter of 2018, following a 4.2% annualized GDP growth rate in the second calendar quarter. However, the rally was short-lived, as U.S. equities plunged in December 2018 on renewed investor fears, sparked by the arrest of a Chinese technology executive, a partial U.S. federal government shutdown and the U.S. President’s criticism of Fed Chair Powell.
U.S. equities rallied in January 2019, rebounding after a challenging and volatile 2018. Fed commentary provided a supportive background for U.S. equities, as Fed Chair Powell reiterated a “patient” approach to monetary policy that included a pause in interest rate hikes and a nearing end to the balance sheet runoff, or the shrinking of the Fed balance sheet as securities mature. The U.S. unemployment rate remained well below trend at 3.8% in February 2019, with a steady increase in wages of 3.4% year over year. Housing data continued to show strength in the first quarter, with new home sales reaching 667,000 in February, bringing the three-month average up to 630,000. Strength in housing data could be partially attributed to a steep decline in mortgage rates, resulting from a more cautious Fed. The University of Michigan Consumer Sentiment Index was a point of significant strength in the U.S. economy, climbing in each month of the first quarter of 2019 and eventually reaching 98.4 in March, its highest level in six months. Economic growth concerns, however, failed to completely abate, as fourth quarter 2018 GDP growth was revised down in March to 2.2%. While the revision was evidence of a slowing U.S. economy, the result was largely priced in by equity markets and thus had a limited effect on stock prices outside of the financials sector, which tends to be more interest rate-sensitive.
U.S. equities continued to post gains in the second quarter of 2019. Trade tensions between the U.S. and China dominated headlines and broadly added noise to the markets. (Noise refers to information or activity that confuses or misrepresents genuine underlying trends.) In April 2019, investors seemed optimistic about a possible trade deal, but this positive outlook faded in May when the U.S. President threatened to raise then-current tariffs and impose new duties on $300 billion of additional Chinese imports. Sanctions were temporarily placed on a Chinese telecommunications giant, until they were lifted in June, when any additional tariffs or compromise were postponed. Also during the second calendar quarter, the U.S. equity market kept a close eye on the Fed. After steadily raising interest rates since 2015, the Fed alluded to a more accommodative approach. The market consensus had largely priced in at least one interest rate cut by the end of 2019, if not sooner. Economic indicators were mixed during the second calendar quarter, with consumer sentiment remaining elevated but nonfarm payrolls and manufacturing indices across the board falling short of market expectations.
During the third quarter of 2019, U.S. equities recorded slightly positive returns. Global economic data continued to slow, prompting the Fed to adopt measures of monetary easing. The Fed cut interest rates in July and September — its first interest rate cuts since 2008 — in an effort to prolong the U.S. economic expansion. Economic data was largely mixed during the third calendar quarter, with manufacturing data and consumer confidence showing signs of weakness, but domestic demand holding steady in the context of a strong labor market.
In October 2019, U.S. equities posted a modest gain. Investors welcomed signs of an easing in geopolitical tensions during the month, as U.S. and Chinese authorities appeared to move closer to a partial trade agreement, and the U.K. edged back from a no-deal Brexit. (Brexit refers to the U.K.’s efforts to exit the European Union.) U.S. economic data continued to soften, with the majority of weakness manifesting in the trade-sensitive manufacturing sector. Consumer confidence and the pace of job growth also fell moderately, and this overall picture of slowing economic momentum led the Fed to cut interest rates for the third time in the 2019 calendar year.
3
MARKET REVIEW
For the Reporting Period overall, the S&P 500® Index (with dividends reinvested) returned 14.33%, with 10 of its 11 sectors generating positive absolute returns. Real estate, information technology and utilities were the best performing sectors in the S&P 500® Index. Energy was the only sector in the S&P 500® Index to decline, while health care and financials generated the weakest positive returns.
In terms of market capitalization, all segments posted solid positive absolute returns, but on a relative basis, large-cap stocks, as measured by the Russell 1000® Index, performed best, followed closely by mid-cap stocks, as measured by the Russell Midcap® Index, and then, at some distance, by small-cap stocks, as measured by the Russell 2000® Index. From a style perspective, growth-oriented stocks significantly outpaced value-oriented stocks across the capitalization spectrum. (All as measured by the FTSE Russell indices.)
Looking Ahead
At the end of the Reporting Period, we continued to believe that less expensive stocks should outpace more expensive stocks. In addition, we expected stocks with good momentum to outperform those with poor momentum. We plan to focus on seeking companies about which fundamental research analysts are becoming more positive as well as profitable companies with sustainable earnings and a track record of using their capital to enhance shareholder value. As such, we anticipate remaining fully invested, with long-term performance likely to be the result of stock selection rather than sector or capitalization allocations.
We stand behind our investment philosophy that sound economic investment principles, coupled with a disciplined quantitative approach, can provide strong, uncorrelated returns over the long term. Our research agenda is robust, and we continue to enhance our existing models, add new proprietary forecasting signals and improve our trading execution as we seek to provide the most value to our shareholders.
4
PORTFOLIO RESULTS
Goldman Sachs Large Cap Growth Insights Fund
Investment Objective
The Fund seeks long-term growth of capital, with dividend income as a secondary consideration.
Portfolio Management Discussion and Analysis
Below, the Goldman Sachs Quantitative Investment Strategies Team discusses the Goldman Sachs Large Cap Growth Insights Fund’s (the “Fund”) performance and positioning for the 12-month period ended October 31, 2019 (the “Reporting Period”).
| Q | How did the Fund perform during the Reporting Period? |
| A | During the Reporting Period, the Fund’s Class A, Class C, Institutional, Service, Investor, Class P, Class R and Class R6 Shares generated average annual total returns, without sales charges, of 11.28%, 10.42%, 11.70%, 11.15%, 11.56%, 11.71%, 10.98% and 11.72%, respectively. These returns compare to the 17.10% average annual total return of the Fund’s benchmark, the Russell 1000® Growth Index (with dividends reinvested) (the “Index”), during the same period. |
| Q | What key factors were most responsible for the Fund’s performance during the Reporting Period? |
| A | The Fund uses a quantitative style of management, in combination with a qualitative overlay, that emphasizes fundamentally-based stock selection, careful portfolio construction and efficient implementation. The Fund’s investments are selected using fundamental research and a variety of quantitative techniques based on certain investment themes, including Fundamental Mispricings, High Quality Business Models, Sentiment Analysis and Market Themes & Trends. |
During the Reporting Period, the Fund underperformed the Index, with all four of our quantitative model’s investment themes detracting from performance. Stock selection driven by these investment themes hurt relative returns. |
| Q | What impact did the Fund’s investment themes have on performance during the Reporting Period? |
| A | In keeping with our investment approach, we use our quantitative model and four investment themes to take a long-term view of market patterns and look for inefficiencies, selecting stocks for the Fund and overweighting or underweighting the ones chosen by the model. Over time and by design, the performance of any one of the model’s investment themes tends to have a low correlation with the model’s other themes, demonstrating the diversification benefit of the Fund’s theme-driven quantitative model. The variance in performance supports our research indicating that the diversification provided by our different investment themes is a significant investment advantage over the long term, even though the Fund may experience underperformance in the short term. Of course, diversification does not protect an investor from market risk nor does it ensure a profit. |
During the Reporting Period, all four of our investment themes detracted from the Fund’s relative performance. High Quality Business Models was the Fund’s worst-performing investment theme, followed by Fundamental Mispricings, Sentiment Analysis and Market Themes & Trends. High Quality Business Models seeks to identify companies that are generating high quality revenues with sustainable business models and aligned management incentives. Fundamental Mispricings seeks to identify high quality businesses trading at a fair price, which we believe may lead to strong performance over the long run. Sentiment Analysis seeks to identify stocks experiencing improvements in their overall market sentiment. Market Themes & Trends seeks to identify companies positively positioned to benefit from themes and trends in the market and macroeconomic environment. |
| Q | How did the Fund’s sector allocations affect relative performance? |
| A | In constructing the Fund’s portfolio, we focus on picking stocks rather than on making sector or industry bets. Consequently, the Fund is similar to the Index in terms of its sector and industry allocations and style. Changes in its sector or industry weights generally do not have a meaningful impact on relative performance. |
5
PORTFOLIO RESULTS
| Q | Did stock selection help or hurt Fund performance during the Reporting Period? |
| A | We seek to outpace the Index by overweighting stocks we expect to outperform and underweighting those we think may lag. At the same time, we strive to maintain a risk profile similar to the Index. The Fund’s investments are selected using fundamental research and a variety of quantitative techniques based on our investment themes. For example, the Fund aims to hold a basket of stocks with better Fundamental Mispricings characteristics than the Index. |
During the Reporting Period, stock selection hurt the Fund’s relative performance, highlighted by holdings in the health care, financials and information technology sectors. On the positive side, the Fund benefited from stock selection in communication services. |
| Q | Which individual stock positions detracted most from the Fund’s results during the Reporting Period? |
| A | In terms of individual stock positions, the Fund was hurt during the Reporting Period by overweight positions relative to the Index in Spirit AeroSystems Holdings, an aerostructures manufacturer; Allison Transmission, a maker of commercial-duty automatic transmissions and hybrid propulsion systems; and Comerica, a financial services company. The Fund’s overweights in Spirit AeroSystems Holdings and Allison Transmission were primarily due to our High Quality Business Models and Fundamental Mispricings investment themes. We chose to overweight Comerica mainly because of our Fundamental Mispricings investment theme. |
| Q | Which individual stock positions contributed most to the Fund’s relative returns during the Reporting Period? |
| A | During the Reporting Period, the Fund benefited from an underweight in tobacco company Altria Group. Its overweight positions in food retailer Chipotle Mexican Grill and technology company Apple also bolstered relative performance. The underweight in Altria Group was driven by our Sentiment Analysis, Market Themes & Trends and High Quality Business Models investment themes. Our High Quality Business Models and Sentiment Analysis investment themes were largely responsible for the Fund’s overweight in Chipotle Mexican Grill. We adopted the overweight in Apple primarily because of our High Quality Business Models investment theme. |
| Q | How did the Fund use derivatives and similar instruments during the Reporting Period? |
| A | During the Reporting Period, we used futures contracts to equitize the Fund’s cash holdings. In other words, we put the Fund’s cash holdings to work by using them as collateral for the purchase of futures contracts. The use of these derivatives did not have a material impact on Fund results during the Reporting Period. |
| Q | What was the Fund’s sector positioning relative to the Index at the end of the Reporting Period? |
| A | At the end of the Reporting Period, the Fund was overweight the real estate, financials, materials, consumer discretionary and health care sectors relative to the Index. Compared to the Index, the Fund was underweight the industrials, information technology, communication services and consumer staples sectors. The Fund was relatively neutral compared to the Index in the energy and utilities sectors at the end of the Reporting Period. |
6
FUND BASICS
Large Cap Growth Insights Fund
as of October 31, 2019
| TOP TEN HOLDINGS AS OF 10/31/191 | ||||||||
| Holding | % of Net Assets | Line of Business | ||||||
| Apple, Inc. | 7.7 | % | Technology Hardware, Storage & Peripherals | |||||
| Microsoft Corp. | 7.0 | Software | ||||||
| Amazon.com, Inc. | 6.0 | Internet & Direct Marketing Retail | ||||||
| Facebook, Inc., Class A | 4.2 | Interactive Media & Services | ||||||
| Visa, Inc., Class A | 2.9 | IT Services | ||||||
| Alphabet, Inc., Class C | 2.8 | Interactive Media & Services | ||||||
| Alphabet, Inc., Class A | 2.3 | Interactive Media & Services | ||||||
| Cisco Systems, Inc. | 2.0 | Communications Equipment | ||||||
| PayPal Holdings, Inc. | 1.9 | IT Services | ||||||
| AbbVie, Inc. | 1.8 | Biotechnology | ||||||
| 1 | The top 10 holdings may not be representative of the Fund’s future investments. |
| FUND VS. BENCHMARK SECTOR ALLOCATIONS2 |
| As of October 31, 2019 |
| 2 | The Fund is actively managed and, as such, its composition may differ over time. Consequently, the Fund’s overall sector allocations may differ from the percentages contained in the graph above. The graph categorizes investments using the Global Industry Classification Standard (“GICS”), however, the sector classifications used by the portfolio management team may differ from GICS. The percentage shown for each investment category reflects the value of investments in that category as a percentage of market value (excluding investments in the securities lending reinvestment vehicle, if any). The graph depicts the Fund’s investments but may not represent the Fund’s market exposure due to the exclusion of certain derivatives, if any, as listed in the Additional Investment Information section of the Schedule of Investments. |
For more information about your Fund, please refer to www.GSAMFUNDS.com. There, you can learn more about your Fund’s investment strategies, holdings, and performance.
7
GOLDMAN SACHS LARGE CAP GROWTH INSIGHTS FUND
Performance Summary
October 31, 2019
The following graph shows the value, as of October 31, 2019, of a $1,000,000 investment made on November 1, 2009 in Institutional Shares at NAV. For comparative purposes, the performance of the Fund’s benchmark, the Russell 1000® Growth Index (with dividends reinvested), is shown. Performance reflects applicable fee waivers and/or expense limitations in effect during the periods shown and in their absence, performance would be reduced. Returns do not reflect the deduction of taxes that a shareholder would pay on Fund distributions or the redemption of Fund shares. The returns set forth below represent past performance. Past performance does not guarantee future results. The Fund’s investment return and principal value will fluctuate so that an investor’s shares, when redeemed, may be worth more or less than their original cost. Current performance may be lower or higher than the performance quoted below. Please visit our web site at www.GSAMFUNDS.com to obtain the most recent month-end returns.
| Large Cap Growth Insights Fund’s 10 Year Performance |
Performance of a $1,000,000 investment, including any applicable sales charges, with distributions reinvested, from November 1, 2009 through October 31, 2019.
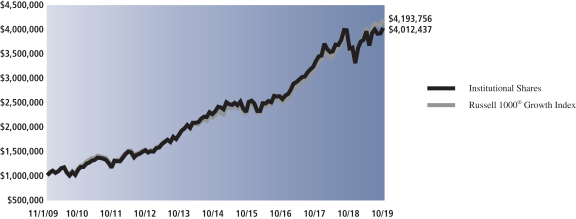
| Average Annual Total Return through October 31, 2019* | One Year | Five Years | Ten Years | Since Inception | ||||||||
Class A | ||||||||||||
Excluding sales charges | 11.28% | 11.24% | 14.43% | — | ||||||||
Including sales charges | 5.15% | 9.99% | 13.79% | — | ||||||||
| ||||||||||||
Class C | ||||||||||||
Excluding contingent deferred sales charges | 10.42% | 10.41% | 13.58% | — | ||||||||
Including contingent deferred sales charges | 9.31% | 10.41% | 13.58% | — | ||||||||
| ||||||||||||
Institutional | 11.70% | 11.69% | 14.90% | — | ||||||||
| ||||||||||||
Service | 11.15% | 11.14% | 14.32% | — | ||||||||
| ||||||||||||
Investor | 11.56% | 11.52% | 14.72% | — | ||||||||
| ||||||||||||
Class P (Commenced April 16, 2018) | 11.71% | N/A | N/A | 7.60% | ||||||||
| ||||||||||||
Class R | 10.98% | 10.97% | 14.14% | — | ||||||||
| ||||||||||||
Class R6 (Commenced July 31, 2015) | 11.72% | N/A | N/A | 11.70% | ||||||||
| ||||||||||||
| * | These returns assume reinvestment of all distributions at NAV and reflect a maximum initial sales charge of 5.50% for Class A Shares and the assumed contingent deferred sales charge for Class C Shares (1% if redeemed within 12 months of purchase). Because Institutional, Service, Investor, Class P, Class R and Class R6 Shares do not involve a sales charge, such a charge is not applied to their Average Annual Total Return. |
8
PORTFOLIO RESULTS
Goldman Sachs Large Cap Value Insights Fund
Investment Objective
The Fund seeks long-term growth of capital and dividend income.
Portfolio Management Discussion and Analysis
Below, the Goldman Sachs Quantitative Investment Strategies Team discusses the Goldman Sachs Large Cap Value Insights Fund’s (the “Fund”) performance and positioning for the12-month period ended October 31, 2019 (the “Reporting Period”).
| Q | How did the Fund perform during the Reporting Period? |
| A | During the Reporting Period, the Fund’s Class A, Class C, Institutional, Service, Investor, Class P, Class R and Class R6 Shares generated average annual total returns, without sales charges, of 5.30%, 4.53%, 5.68%, 5.19%, 5.55%, 5.74%, 5.01% and 5.73%, respectively. These returns compare to the 11.21% average annual total return of the Fund’s benchmark, the Russell 1000® Value Index (with dividends reinvested) (the “Index”), during the same period. |
| Q | What key factors were most responsible for the Fund’s performance during the Reporting Period? |
| A | The Fund uses a quantitative style of management, in combination with a qualitative overlay, that emphasizes fundamentally-based stock selection, careful portfolio construction and efficient implementation. The Fund’s investments are selected using fundamental research and a variety of quantitative techniques based on certain investment themes, including Fundamental Mispricings, High Quality Business Models, Sentiment Analysis and Market Themes & Trends. |
| During the Reporting Period, the Fund underperformed the Index, with all four of our quantitative model’s investment themes detracting from returns. Stock selection driven by these investment themes hurt relative returns. |
| Q | What impact did the Fund’s investment themes have on performance during the Reporting Period? |
| A | In keeping with our investment approach, we use our quantitative model and four investment themes to take a long-term view of market patterns and look for inefficiencies, selecting stocks for the Fund and overweighting or underweighting the ones chosen by the model. Over time and by design, the performance of any one of the model’s investment themes tends to have a low correlation with the model’s other themes, demonstrating the diversification benefit of the Fund’s theme-driven quantitative model. The variance in performance supports our research indicating that the diversification provided by our different investment themes is a significant investment advantage over the long term, even though the Fund may experience underperformance in the short term. Of course, diversification does not protect an investor from market risk nor does it ensure a profit. |
| During the Reporting Period, all four of our investment themes detracted from the Fund’s relative performance. High Quality Business Models was the Fund’s worst-performing investment theme, followed by Sentiment Analysis, Fundamental Mispricings and Market Themes & Trends. High Quality Business Models seeks to identify companies that are generating high quality revenues with sustainable business models and aligned management incentives. Sentiment Analysis seeks to identify stocks experiencing improvements in their overall market sentiment. Fundamental Mispricings seeks to identify high quality businesses trading at a fair price, which we believe may lead to strong performance over the long run. Market Themes & Trends seeks to identify companies positively positioned to benefit from themes and trends in the market and macroeconomic environment. |
| Q | How did the Fund’s sector allocations affect relative performance? |
| A | In constructing the Fund’s portfolio, we focus on picking stocks rather than on making sector or industry bets. Consequently, the Fund is similar to the Index in terms of its sector and industry allocations and style. Changes in its sector or industry weights generally do not have a meaningful impact on relative performance. |
9
PORTFOLIO RESULTS
| Q | Did stock selection help or hurt Fund performance during the Reporting Period? |
| A | We seek to outpace the Index by overweighting stocks we expect to outperform and underweighting those we think may lag. At the same time, we strive to maintain a risk profile similar to the Index. The Fund’s investments are selected using fundamental research and a variety of quantitative techniques based on our investment themes. For example, the Fund aims to hold a basket of stocks with better Fundamental Mispricings characteristics than the Index. |
| During the Reporting Period, stock selection detracted from the Fund’s relative performance, led by investments in the health care, financials and consumer staples sectors. Stock selection in industrials, real estate and information technology contributed positively to relative returns. |
| Q | Which individual stock positions detracted most from the Fund’s results during the Reporting Period? |
| A | In terms of individual stock positions, the Fund was hampered during the Reporting Period by overweight positions relative to the Index in Mylan, a maker of generic and specialty pharmaceuticals; Conagra Brands, a packaged food company; and ConocoPhillips, an energy company. We decided to overweight Mylan mainly because of our Sentiment Analysis and Fundamental Mispricings investment themes, while the overweight in Conagra Brands was primarily due to our Market Themes & Trends and Sentiment Analysis investment themes. Our High Quality Business Models and Sentiment Analysis investment themes led to the overweight position in ConocoPhillips. |
| Q | Which individual stock positions contributed most to the Fund’s relative returns during the Reporting Period? |
| A | During the Reporting Period, the Fund benefited from overweight positions in retailer Target, paint and coating manufacturer Sherwin-Williams and electronics testing and measurement equipment and software maker Keysight Technologies. We adopted the overweight in Target because of our High Quality Business Models, Sentiment Analysis and Market Themes & Trends investment themes. The Fund was overweight Sherwin-Williams and Keysight Technologies largely due to our High Quality Business Models and Market Themes & Trends investment themes. |
| Q | How did the Fund use derivatives and similar instruments during the Reporting Period? |
| A | During the Reporting Period, we used futures contracts to equitize the Fund’s cash holdings. In other words, we put the Fund’s cash holdings to work by using them as collateral for the purchase of futures contracts. The use of these derivatives did not have a material impact on Fund results during the Reporting Period. |
| Q | What was the Fund’s sector positioning relative to the Index at the end of the Reporting Period? |
| A | At the end of the Reporting Period, the Fund was overweight the consumer discretionary, health care, real estate and utilities sectors relative to the Index. Compared to the Index, the Fund was underweight the communication services, industrials, consumer staples and financials sectors. The Fund was relatively neutral in the materials, energy and information technology sectors at the end of the Reporting Period. |
10
FUND BASICS
Large Cap Value Insights Fund
as of October 31, 2019
| TOP TEN HOLDINGS AS OF 10/31/191 | ||||||||
| Holding | % of Net Assets | Line of Business | ||||||
| Johnson & Johnson | 2.5 | % | Pharmaceuticals | |||||
| Berkshire Hathaway, Inc., Class B | 2.1 | Diversified Financial Services | ||||||
| Philip Morris International, Inc. | 1.9 | Tobacco | ||||||
| JPMorgan Chase & Co. | 1.9 | Banks | ||||||
| Home Depot, Inc. (The) | 1.8 | Specialty Retail | ||||||
| Pfizer, Inc. | 1.8 | Pharmaceuticals | ||||||
| Gilead Sciences, Inc. | 1.5 | Biotechnology | ||||||
| Becton Dickinson and Co. | 1.5 | Health Care Equipment & Supplies | ||||||
| ConocoPhillips | 1.4 | Oil, Gas & Consumable Fuels | ||||||
| Prologis, Inc. REIT | 1.4 | Equity Real Estate Investment Trusts (REITs) | ||||||
| 1 | The top 10 holdings may not be representative of the Fund’s future investments. The top 10 holdings exclude investments in money market funds. |
| FUND VS. BENCHMARK SECTOR ALLOCATIONS2 |
| As of October 31, 2019 |
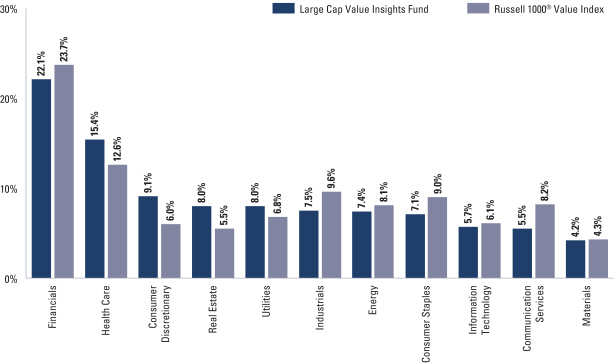
| 2 | The Fund is actively managed and, as such, its composition may differ over time. Consequently, the Fund’s overall sector allocations may differ from the percentages contained in the graph above. The graph categorizes investments using the Global Industry Classification Standard (“GICS”); however, the sector classifications used by the portfolio management team may differ from GICS. The percentage shown for each investment category reflects the value of investments in that category as a percentage of market value. The graph depicts the Fund’s investments but may not represent the Fund’s market exposure due to the exclusion of certain derivatives, if any, as listed in the Additional Investment Information section of the Schedule of Investments. |
For more information about your Fund, please refer to www.GSAMFUNDS.com. There, you can learn more about your Fund’s investment strategies, holdings, and performance.
11
GOLDMAN SACHS LARGE CAP VALUE INSIGHTS FUND
Performance Summary
October 31, 2019
The following graph shows the value, as of October 31, 2019, of a $1,000,000 investment made on November 1, 2009 in Institutional Shares at NAV. For comparative purposes, the performance of the Fund’s benchmark, the Russell 1000® Value Index (with dividends reinvested), is shown. Performance reflects applicable fee waivers and/or expense limitations in effect during the periods shown and in their absence, performance would be reduced. Returns do not reflect the deduction of taxes that a shareholder would pay on Fund distributions or the redemption of Fund shares. The returns set forth below represent past performance. Past performance does not guarantee future results. The Fund’s investment return and principal value will fluctuate so that an investor’s shares, when redeemed, may be worth more or less than their original cost. Current performance may be lower or higher than the performance quoted below. Please visit our web site at www.GSAMFUNDS.com to obtain the most recent month-end returns.
| Large Cap Value Insights Fund’s 10 Year Performance |
Performance of a $1,000,000 investment, including any applicable sales charges, with distributions reinvested, from November 1, 2009 through October 31, 2019.
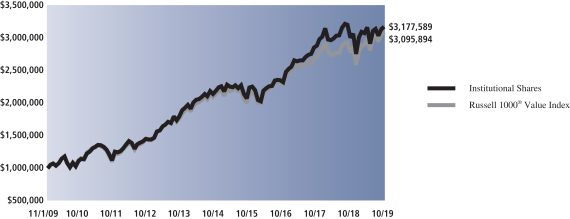
| Average Annual Total Return through October 31, 2019* | One Year | Five Years | Ten Years | Since Inception | ||||||||
Class A | ||||||||||||
Excluding sales charges | 5.30% | 7.28% | 11.80% | — | ||||||||
Including sales charges | -0.51% | 6.07% | 11.17% | — | ||||||||
| ||||||||||||
Class C | ||||||||||||
Excluding contingent deferred sales charges | 4.53% | 6.48% | 10.97% | — | ||||||||
Including contingent deferred sales charges | 3.48% | 6.48% | 10.97% | — | ||||||||
| ||||||||||||
Institutional | 5.68% | 7.68% | 12.25% | — | ||||||||
| ||||||||||||
Service | 5.19% | 7.17% | 11.69% | — | ||||||||
| ||||||||||||
Investor | 5.55% | 7.54% | 12.07% | — | ||||||||
| ||||||||||||
Class P (Commenced April 16, 2018) | 5.74% | N/A | N/A | 3.16% | ||||||||
| ||||||||||||
Class R | 5.01% | 7.00% | 11.51% | — | ||||||||
| ||||||||||||
Class R6 (Commenced July 31, 2015) | 5.73% | N/A | N/A | 8.19% | ||||||||
| ||||||||||||
| * | These returns assume reinvestment of all distributions at NAV and reflect a maximum initial sales charge of 5.50% for Class A Shares and the assumed contingent deferred sales charge for Class C Shares (1% if redeemed within 12 months of purchase). Because Institutional, Service, Investor, Class P, Class R and Class R6 Shares do not involve a sales charge, such a charge is not applied to their Average Annual Total Return. |
12
PORTFOLIO RESULTS
Goldman Sachs Small Cap Equity Insights Fund
Investment Objective
The Fund seeks long-term growth of capital.
Portfolio Management Discussion and Analysis
Below, the Goldman Sachs Quantitative Investment Strategies Team discusses the Goldman Sachs Small Cap Equity Insights Fund’s (the “Fund”) performance and positioning for the12-month period ended October 31, 2019 (the “Reporting Period”).
| Q | How did the Fund perform during the Reporting Period? |
| A | During the Reporting Period, the Fund’s Class A, Class C, Institutional, Service, Investor, Class P, Class R and Class R6 Shares generated average annual total returns, without sales charges, of 5.64%, 4.86%, 6.03%, 5.52%, 5.90%, 6.06%, 5.35% and 6.05%, respectively. These returns compare to the 4.90% average annual total return of the Fund’s benchmark, the Russell 2000® Index (with dividends reinvested) (the “Index”), during the same period. |
| Q | What key factors were most responsible for the Fund’s performance during the Reporting Period? |
| A | The Fund uses a quantitative style of management, in combination with a qualitative overlay, that emphasizes fundamentally-based stock selection, careful portfolio construction and efficient implementation. The Fund’s investments are selected using fundamental research and a variety of quantitative techniques based on certain investment themes, including Fundamental Mispricings, High Quality Business Models, Sentiment Analysis and Market Themes & Trends. |
| During the Reporting Period, most shares classes of the Fund outperformed the Index, with all four of our quantitative model’s investment themes adding to performance. Stock selection driven by these investment themes bolstered relative returns. |
| Q | What impact did the Fund’s investment themes have on performance during the Reporting Period? |
| A | In keeping with our investment approach, we use our quantitative model and four investment themes to take a long-term view of market patterns and look for inefficiencies, selecting stocks for the Fund and overweighting or underweighting the ones chosen by the model. Over time and by design, the performance of any one of the model’s investment themes tends to have a low correlation with the model’s other themes, demonstrating the diversification benefit of the Fund’s theme-driven quantitative model. The variance in performance supports our research indicating that the diversification provided by our different investment themes is a significant investment advantage over the long term, even though the Fund may experience underperformance in the short term. Of course, diversification does not protect an investor from market risk nor does it ensure a profit. |
| During the Reporting Period, all four of our investment themes contributed positively to the Fund’s relative performance. Market Themes & Trends and Sentiment Analysis were the Fund’s best-performing investment themes. Fundamental Mispricings and High Quality Business Models also added to returns, albeit to a lesser extent. Market Themes & Trends seeks to identify companies positively positioned to benefit from themes and trends in the market and macroeconomic environment. Sentiment Analysis seeks to identify stocks experiencing improvements in their overall market sentiment. Fundamental Mispricings seeks to identify high quality businesses trading at a fair price, which we believe may lead to strong performance over the long run. High Quality Business Models seeks to identify companies that are generating high quality revenues with sustainable business models and aligned management incentives. |
| Q | How did the Fund’s sector allocations affect relative performance? |
| A | In constructing the Fund’s portfolio, we focus on picking stocks rather than on making sector or industry bets. Consequently, the Fund is similar to the Index in terms of its sector and industry allocations and style. Changes in its sector or industry weights generally do not have a meaningful impact on relative performance. |
13
PORTFOLIO RESULTS
| Q | Did stock selection help or hurt Fund performance during the Reporting Period? |
| A | We seek to outpace the Index by overweighting stocks we expect to outperform and underweighting those we think may lag. At the same time, we strive to maintain a risk profile similar to the Index. The Fund’s investments are selected using fundamental research and a variety of quantitative techniques based on our investment themes. For example, the Fund aims to hold a basket of stocks with better Fundamental Mispricings characteristics than the Index. |
| During the Reporting Period, stock selection added to the Fund’s performance, with investments in the health care sector contributing most positively. Holdings in the real estate and energy sectors also boosted relative returns. Conversely, selection in the financials, materials and information technology sectors detracted from the Fund’s results. |
| Q | Which individual stock positions contributed most to the Fund’s relative returns during the Reporting Period? |
| A | In terms of individual stock positions, the Fund benefited during the Reporting Period from its overweights compared to the Index in Sinclair Broadcast Group, a telecommunications company; Array BioPharma, a clinical stage pharmaceutical company; and Inphi, a provider of high-speed data movement interconnects. The overweight in Sinclair Broadcast Group was established predominantly due to our High Quality Business Models and Market Themes & Trends investment themes. The overweight in Array BioPharma was based primarily on our Sentiment Analysis, High Quality Business Models and Market Themes & Trends investment themes. We chose to overweight Inphi largely because of our High Quality Business Models and Sentiment Analysis investment themes. |
| Q | Which individual stock positions detracted most from the Fund’s results during the Reporting Period? |
| A | During the Reporting Period, the Fund was hindered by its overweight positions in movie theater chain AMC Entertainment Holdings; biodiesel production company Renewable Energy Group; and nutrition and weight loss company Medifast. Our High Quality Business Models, Fundamental Mispricings and Sentiment Analysis investment themes drove the overweight in AMC Entertainment Holdings. The Fund was overweight Renewable Energy Group because of our Fundamental Mispricings, Market Themes & Trends and High Quality Business Models investment themes. The overweight in Medifast was due primarily to our High Quality Business Models investment theme. |
| Q | How did the Fund use derivatives and similar instruments during the Reporting Period? |
| A | During the Reporting Period, we used futures contracts to equitize the Fund’s cash holdings. In other words, we put the Fund’s cash holdings to work by using them as collateral for the purchase of futures contracts. The use of these derivatives did not have a material impact on Fund results during the Reporting Period. |
| Q | What was the Fund’s sector positioning relative to the Index at the end of the Reporting Period? |
| A | At the end of the Reporting Period, the Fund was overweight the energy and consumer discretionary sectors relative to the Index. Compared to the Index, the Fund was underweight the utilities, health care and information technology sectors. The Fund was relatively neutral versus the Index in the communication services, consumer staples, materials, real estate, financials and industrials sectors at the end of the Reporting Period. |
14
FUND BASICS
Small Cap Equity Insights Fund
as of October 31, 2019
| TOP TEN HOLDINGS AS OF 10/31/191 | ||||||||
| Holding | % of Net Assets | Line of Business | ||||||
| Rexford Industrial Realty, Inc. REIT | 0.8 | % | Equity Real Estate Investment Trusts (REITs) | |||||
| First Industrial Realty Trust, Inc. REIT | 0.8 | Equity Real Estate Investment Trusts (REITs) | ||||||
| Terreno Realty Corp. REIT | 0.8 | Equity Real Estate Investment Trusts (REITs) | ||||||
| Simpson Manufacturing Co., Inc. | 0.7 | Building Products | ||||||
| Murphy USA, Inc. | 0.7 | Specialty Retail | ||||||
| Perspecta, Inc. | 0.7 | IT Services | ||||||
| Viavi Solutions, Inc. | 0.7 | Communications Equipment | ||||||
| TopBuild Corp. | 0.7 | Household Durables | ||||||
| Vishay Intertechnology, Inc. | 0.7 | Electronic Equipment, Instruments & Components | ||||||
| NuVasive, Inc. | 0.7 | Health Care Equipment & Supplies | ||||||
| 1 | The top 10 holdings may not be representative of the Fund’s future investments. The top 10 holdings exclude investments in money market funds. |
| FUND VS. BENCHMARK SECTOR ALLOCATIONS2 |
| As of October 31, 2019 |
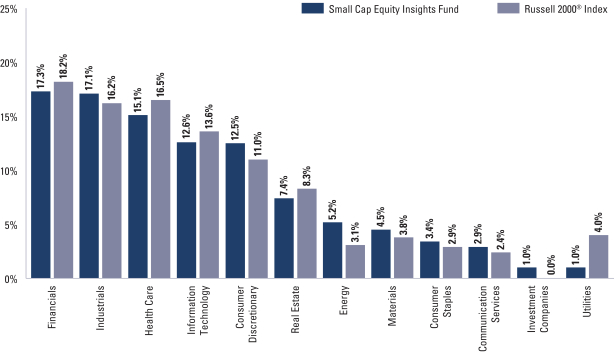
| 2 | The Fund is actively managed and, as such, its composition may differ over time. Consequently, the Fund’s overall sector allocations may differ from the percentages contained in the graph above. The graph categorizes investments using the Global Industry Classification Standard (“GICS”), however, the sector classifications used by the portfolio management team may differ from GICS. The percentage shown for each investment category reflects the value of investments in that category as a percentage of market value (excluding investments in the securities lending reinvestment vehicle, if any). Investments in the securities lending reinvestment vehicle represented 0.2% of the Fund’s net assets as of October 31, 2019. The graph depicts the Fund’s investments but may not represent the Fund’s market exposure due to the exclusion of certain derivatives, if any, as listed in the Additional Investment Information section of the Schedule of Investments. |
For more information about your Fund, please refer to www.GSAMFUNDS.com. There, you can learn more about your Fund’s investment strategies, holdings, and performance.
15
GOLDMAN SACHS SMALL CAP EQUITY INSIGHTS FUND
Performance Summary
October 31, 2019
The following graph shows the value, as of October 31, 2019, of a $1,000,000 investment made on November 1, 2009 in Institutional Shares at NAV. For comparative purposes, the performance of the Fund’s benchmark, the Russell 2000® Index (with dividends reinvested), is shown. Performance reflects applicable fee waivers and/or expense limitations in effect during the periods shown and in their absence, performance would be reduced. Returns do not reflect the deduction of taxes that a shareholder would pay on Fund distributions or the redemption of Fund shares. The returns set forth below represent past performance. Past performance does not guarantee future results. The Fund’s investment return and principal value will fluctuate so that an investor’s shares, when redeemed, may be worth more or less than their original cost. Current performance may be lower or higher than the performance quoted below. Please visit our web site at www.GSAMFUNDS.com to obtain the most recent month-end returns.
| Small Cap Equity Insights Fund’s 10 Year Performance |
Performance of a $1,000,000 investment, including any applicable sales charges, with distributions reinvested, from November 1, 2009 through October 31, 2019.
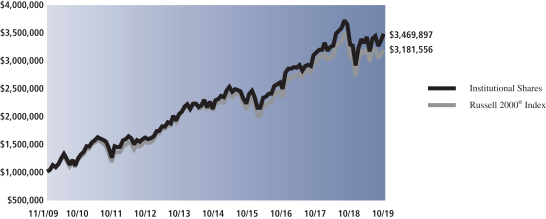
| Average Annual Total Return through October 31, 2019* | One Year | Five Years | Ten Years | Since Inception | ||||||||
Class A | ||||||||||||
Excluding sales charges | 5.64% | 8.38% | 12.79% | — | ||||||||
Including sales charges | -0.18% | 7.17% | 12.16% | — | ||||||||
| ||||||||||||
Class C | ||||||||||||
Excluding contingent deferred sales charges | 4.86% | 7.57% | 11.95% | — | ||||||||
Including contingent deferred sales charges | 3.81% | 7.57% | 11.95% | — | ||||||||
| ||||||||||||
Institutional | 6.03% | 8.81% | 13.24% | — | ||||||||
| ||||||||||||
Service | 5.52% | 8.27% | 12.67% | — | ||||||||
| ||||||||||||
Investor | 5.90% | 8.66% | 13.07% | — | ||||||||
| ||||||||||||
Class P (Commenced April 16, 2018) | 6.06% | N/A | N/A | 2.79% | ||||||||
| ||||||||||||
Class R | 5.35% | 8.11% | 12.51% | — | ||||||||
| ||||||||||||
Class R6 (Commenced July 31, 2015) | 6.05% | N/A | N/A | 8.68% | ||||||||
| ||||||||||||
| * | These returns assume reinvestment of all distributions at NAV and reflect a maximum initial sales charge of 5.50% for Class A Shares and the assumed contingent deferred sales charge for Class C Shares (1% if redeemed within 12 months of purchase). Because Institutional, Service, Investor, Class P, Class R and Class R6 Shares do not involve a sales charge, such a charge is not applied to their Average Annual Total Return. |
16
PORTFOLIO RESULTS
Goldman Sachs Small Cap Growth Insights Fund
Investment Objective
The Fund seeks long-term growth of capital.
Portfolio Management Discussion and Analysis
Below, the Goldman Sachs Quantitative Investment Strategies Team discusses the Goldman Sachs Small Cap Growth Insights Fund’s (the “Fund”) performance and positioning for the 12-month period ended October 31, 2019 (the “Reporting Period”).
| Q | How did the Fund perform during the Reporting Period? |
| A | During the Reporting Period, the Fund’s Class A, Class C, Institutional, Investor, Class P, Class R and Class R6 Shares generated average annual total returns, without sales charges, of 5.65%, 4.92%, 6.08%, 5.93%, 6.08%, 5.42% and 6.08%, respectively. These returns compare to the 6.40% average annual total return of the Fund’s benchmark, the Russell 2000® Growth Index (with dividends reinvested) (the “Index”), during the same period. |
| Q | What key factors were most responsible for the Fund’s performance during the Reporting Period? |
| A | The Fund uses a quantitative style of management, in combination with a qualitative overlay, that emphasizes fundamentally-based stock selection, careful portfolio construction and efficient implementation. The Fund’s investments are selected using fundamental research and a variety of quantitative techniques based on certain investment themes, including Fundamental Mispricings, High Quality Business Models, Sentiment Analysis and Market Themes & Trends. |
| During the Reporting Period, the Fund underperformed the Index, with two of our quantitative model’s four investment themes detracting from returns. The Fund was also hurt by certain individual stock positions based on our investment themes. |
| Q | What impact did the Fund’s investment themes have on performance during the Reporting Period? |
| A | In keeping with our investment approach, we use our quantitative model and four investment themes to take a long-term view of market patterns and look for inefficiencies, selecting stocks for the Fund and overweighting or underweighting the ones chosen by the model. Over time and by design, the performance of any one of the model’s investment themes tends to have a low correlation with the model’s other themes, demonstrating the diversification benefit of the Fund’s theme-driven quantitative model. The variance in performance supports our research indicating that the diversification provided by our different investment themes is a significant investment advantage over the long term, even though the Fund may experience underperformance in the short term. Of course, diversification does not protect an investor from market risk nor does it ensure a profit. |
| During the Reporting Period, two of our investment themes — High Quality Business Models and Fundamental Mispricings — detracted from the Fund’s relative performance. High Quality Business Models seeks to identify companies that are generating high quality revenues with sustainable business models and aligned management incentives. Fundamental Mispricings seeks to identify high quality businesses trading at a fair price, which we believe may lead to strong performance over the long run. |
| Our Market Themes & Trends and Sentiment Analysis investment themes contributed positively to relative results. Market Themes & Trends seeks to identify companies positively positioned to benefit from themes and trends in the market and macroeconomic environment. Sentiment Analysis seeks to identify stocks experiencing improvements in their overall market sentiment. |
| Q | How did the Fund’s sector allocations affect relative performance? |
| A | In constructing the Fund’s portfolio, we focus on picking stocks rather than on making sector or industry bets. Consequently, the Fund is similar to the Index in terms of its sector and industry allocations and style. Changes in its |
17
PORTFOLIO RESULTS
sector or industry weights generally do not have a meaningful impact on relative performance. |
| Q | Did stock selection help or hurt Fund performance during the Reporting Period? |
| A | We seek to outpace the Index by overweighting stocks we expect to outperform and underweighting those we think may lag. At the same time, we strive to maintain a risk profile similar to the Index. The Fund’s investments are selected using fundamental research and a variety of quantitative techniques based on our investment themes. For example, the Fund aims to hold a basket of stocks with better Fundamental Mispricings characteristics than the Index. |
| During the Reporting Period, the Fund was hampered by certain individual stock positions. Investments in the financials, materials, consumer discretionary and energy sectors detracted from relative performance. On the positive side, holdings in the health care, real estate and communication services sectors added to results. |
| Q | Which individual stock positions detracted most from the Fund’s results during the Reporting Period? |
| A | In terms of individual stock positions, the Fund was hurt during the Reporting Period by its overweight positions relative to the Index in Renewable Energy Group, a biodiesel production company, and Ferro, a producer of technology-based performance materials for manufacturers. An underweight position in Generac Holdings, a maker of backup power generation products, also detracted from the Fund’s performance. We chose to overweight Renewable Energy Group due primarily to our Fundamental Mispricings, Market Themes & Trends and High Quality Business Models investment themes. Our Sentiment Analysis investment theme drove the overweight in Ferro. The underweight in Generac Holdings was largely the result of our High Quality Business Models and Sentiment Analysis investment themes. |
| Q | Which individual stock positions contributed most to the Fund’s relative returns during the Reporting Period? |
| A | During the Reporting Period, the Fund was helped by its overweights in Array BioPharma, a clinical stage pharmaceutical company; Sinclair Broadcast Group, a telecommunications company; and Inphi, a provider of high-speed data movement interconnects. The overweight in Array BioPharma was based primarily on our Sentiment Analysis investment theme. We adopted the overweights in Sinclair Broadcast Group and Inphi mostly because of our High Quality Business Models investment theme. |
| Q | How did the Fund use derivatives and similar instruments during the Reporting Period? |
| A | During the Reporting Period, we used futures contracts to equitize the Fund’s cash holdings. In other words, we put the Fund’s cash holdings to work by using them as collateral for the purchase of futures contracts. The use of these derivatives did not have a material impact on Fund results during the Reporting Period. |
| Q | What was the Fund’s sector positioning relative to the Index at the end of the Reporting Period? |
| A | At the end of the Reporting Period, the Fund was overweight the energy and financials sectors relative to the Index. Compared to the Index, the Fund was underweight the health care, utilities, and real estate sectors. The Fund was relatively neutral compared to the Index in the consumer discretionary, communication services, materials, industrials, information technology and consumer staples sectors at the end of the Reporting Period. |
18
FUND BASICS
Small Cap Growth Insights Fund
as of October 31, 2019
| TOP TEN HOLDINGS AS OF 10/31/191 | ||||||||
| Holding | % of Net Assets | Line of Business | ||||||
Haemonetics Corp. | 1.0 | % | Health Care Equipment & Supplies | |||||
Simpson Manufacturing Co., Inc. | 1.0 | Building Products | ||||||
Viavi Solutions, Inc. | 0.9 | Communications Equipment | ||||||
NuVasive, Inc. | 0.9 | Health Care Equipment & Supplies | ||||||
TopBuild Corp. | 0.9 | Household Durables | ||||||
Novocure Ltd. | 0.8 | Health Care Equipment & Supplies | ||||||
Insperity, Inc. | 0.8 | Professional Services | ||||||
Deckers Outdoor Corp. | 0.8 | Textiles, Apparel & Luxury Goods | ||||||
Repligen Corp. | 0.8 | Biotechnology | ||||||
Omnicell, Inc. | 0.8 | Health Care Technology | ||||||
| 1 | The top 10 holdings may not be representative of the Fund’s future investments. The top 10 holdings exclude investments in money market funds. |
| FUND VS. BENCHMARK SECTOR ALLOCATIONS2 |
| As of October 31, 2019 |
| 2 | The Fund is actively managed and, as such, its composition may differ over time. Consequently, the Fund’s overall sector allocations may differ from the percentages contained in the graph above. The graph categorizes investments using the Global Industry Classification Standard (“GICS”), however, the sector classifications used by the portfolio management team may differ from GICS. The percentage shown for each investment category reflects the value of investments in that category as a percentage of market value (excluding investments in the securities lending reinvestment vehicle, if any). The graph depicts the Fund’s investments but may not represent the Fund’s market exposure due to the exclusion of certain derivatives, if any, as listed in the Additional Investment Information section of the Schedule of Investments. Percentages may not sum to 100% due to rounding. |
For more information about your Fund, please refer to www.GSAMFUNDS.com. There, you can learn more about your Fund’s investment strategies, holdings, and performance.
19
GOLDMAN SACHS SMALL CAP GROWTH INSIGHTS FUND
Performance Summary
October 31, 2019
The following graph shows the value, as of October 31, 2019, of a $1,000,000 investment made on November 1, 2009 in Institutional Shares at NAV. For comparative purposes, the performance of the Fund’s benchmark, the Russell 2000® Growth Index (with dividends reinvested), is shown. Performance reflects applicable fee waivers and/or expense limitations in effect during the periods shown and in their absence, performance would be reduced. Returns do not reflect the deduction of taxes that a shareholder would pay on Fund distributions or the redemption of Fund shares. The returns set forth below represent past performance. Past performance does not guarantee future results. The Fund’s investment return and principal value will fluctuate so that an investor’s shares, when redeemed, may be worth more or less than their original cost. Current performance may be lower or higher than the performance quoted below. Please visit our web site at www.GSAMFUNDS.com to obtain the most recent month-end returns.
| Small Cap Growth Insights Fund’s 10 Year Performance |
Performance of a $1,000,000 investment, including any applicable sales charges, with distributions reinvested, from November 1, 2009, through October 31, 2019.
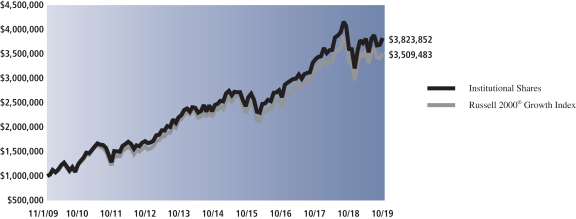
| Average Annual Total Return through October 31, 2019* | One Year | Five Years | Ten Years | Since Inception | ||||||||
Class A | ||||||||||||
Excluding sales charges | 5.65% | 8.86% | 13.90% | — | ||||||||
Including sales charges | -0.17% | 7.64% | 13.25% | — | ||||||||
| ||||||||||||
Class C | ||||||||||||
Excluding contingent deferred sales charges | 4.92% | 8.06% | 13.05% | — | ||||||||
Including contingent deferred sales charges | 3.87% | 8.06% | 13.05% | — | ||||||||
| ||||||||||||
Institutional | 6.08% | 9.29% | 14.35% | — | ||||||||
| ||||||||||||
Investor | 5.93% | 9.14% | 14.18% | — | ||||||||
| ||||||||||||
Class P (Commenced April 16, 2018) | 6.08% | N/A | N/A | 2.75% | ||||||||
| ||||||||||||
Class R | 5.42% | 8.59% | 13.61% | — | ||||||||
| ||||||||||||
Class R6 (Commenced July 31, 2015) | 6.08% | N/A | N/A | 8.36% | ||||||||
| ||||||||||||
| * | These returns assume reinvestment of all distributions at NAV and reflect a maximum initial sales charge of 5.50% for Class A Shares and the assumed contingent deferred sales charge for Class C Shares (1% if redeemed within 12 months of purchase). Because Institutional, Investor, Class P, Class R and Class R6 Shares do not involve a sales charge, such a charge is not applied to their Average Annual Total Return. |
20
PORTFOLIO RESULTS
Goldman Sachs Small Cap Value Insights Fund
Investment Objective
The Fund seeks long-term growth of capital.
Portfolio Management Discussion and Analysis
Below, the Goldman Sachs Quantitative Investment Strategies Team discusses the Goldman Sachs Small Cap Value Insights Fund’s (the “Fund”) performance and positioning for the 12-month period ended October 31, 2019 (the “Reporting Period”).
| Q | How did the Fund perform during the Reporting Period? |
| A | During the Reporting Period, the Fund’s Class A, Class C, Institutional, Investor, Class P, Class R and Class R6 Shares generated average annual total returns, without sales charges, of 4.40%, 3.67%, 4.81%, 4.69%, 4.82%, 4.14% and 4.83%, respectively. These returns compare to the 3.22% average annual total return of the Fund’s benchmark, the Russell 2000® Value Index (with dividends reinvested) (the “Index”), during the same period. |
| Q | What key factors were most responsible for the Fund’s performance during theReporting Period? |
| A | The Fund uses a quantitative style of management, in combination with a qualitative overlay, that emphasizes fundamentally-based stock selection, careful portfolio construction and efficient implementation. The Fund’s investments are selected using fundamental research and a variety of quantitative techniques based on certain investment themes, including Fundamental Mispricings, High Quality Business Models, Sentiment Analysis and Market Themes & Trends. |
| During the Reporting Period, the Fund outperformed the Index, with three of our quantitative model’s four investment themes contributing positively. Stock selection driven by these investment themes added to relative returns. |
| Q | What impact did the Fund’s investment themes have on performance during the Reporting Period? |
| A | In keeping with our investment approach, we use our quantitative model and four investment themes to take a long-term view of market patterns and look for inefficiencies, selecting stocks for the Fund and overweighting or underweighting the ones chosen by the model. Over time and by design, the performance of any one of the model’s investment themes tends to have a low correlation with the model’s other themes, demonstrating the diversification benefit of the Fund’s theme-driven quantitative model. The variance in performance supports our research indicating that the diversification provided by our different investment themes is a significant investment advantage over the long term, even though the Fund may experience underperformance in the short term. Of course, diversification does not protect an investor from market risk nor does it ensure a profit. |
| During the Reporting Period, three of our four investment themes bolstered the Fund’s relative performance. Market Themes & Trends was the Fund’s best-performing investment theme. Sentiment Analysis and Fundamental Mispricings also added to returns, albeit to a lesser extent. Market Themes & Trends seeks to identify companies positively positioned to benefit from themes and trends in the market and macroeconomic environment. Sentiment Analysis seeks to identify stocks experiencing improvements in their overall market sentiment. Fundamental Mispricings seeks to identify high quality businesses trading at a fair price, which we believe may lead to strong performance over the long run. |
| The impact of our High Quality Business Models investment theme was rather neutral during the Reporting Period. High Quality Business Models seeks to identify companies that are generating high quality revenues with sustainable business models and aligned management incentives. |
| Q | How did the Fund’s sector allocations affect relative performance? |
| A | In constructing the Fund’s portfolio, we focus on picking stocks rather than on making sector or industry bets. Consequently, the Fund is similar to the Index in terms of its |
21
PORTFOLIO RESULTS
sector and industry allocations and style. Changes in its sector or industry weights generally do not have a meaningful impact on relative performance. |
| Q | Did stock selection help or hurt Fund performance during the Reporting Period? |
| A | We seek to outpace the Index by overweighting stocks we expect to outperform and underweighting those we think may lag. At the same time, we strive to maintain a risk profile similar to the Index. The Fund’s investments are selected using fundamental research and a variety of quantitative techniques based on our investment themes. For example, the Fund aims to hold a basket of stocks with better Fundamental Mispricings characteristics than the Index. |
| During the Reporting Period, the Fund benefited from stock selection in the energy, health care and industrials sectors. Investments in the financials, consumer staples and information technology sectors detracted from relative performance. |
| Q | Which individual stock positions contributed most to the Fund’s relative returns during the Reporting Period? |
| A | In terms of individual positions, the Fund was helped during the Reporting Period by overweight positions versus the Index in telecommunications company Sinclair Broadcast Group, real estate development company Meritage Homes, and high-speed data movement interconnects provider Inphi. The overweights in Sinclair Broadcast Group and Inphi were due mainly to our High Quality Business Models investment theme. We decided to overweight Meritage Homes largely because of our Fundamental Mispricings, Sentiment Analysis and High Quality Business Models investment themes. |
| Q | Which individual stock positions detracted most from the Fund’s results during the Reporting Period? |
| A | During the Reporting Period, the Fund was hurt by overweight positions in oilfield services company Superior Energy Services and movie theater chain AMC Entertainment Holdings. An underweight in Cree, which makes lighting-class light emitting diodes (“LEDs”), lighting products and products for power and radio-frequency applications, also detracted from the Fund’s relative returns. The overweight in Superior Energy Services was implemented mainly because of our Sentiment Analysis and High Quality Business Models investment themes. Our High Quality Business Models investment theme led us to overweight AMC Entertainment Holdings. We adopted the underweight in Cree mostly due to our High Quality Business Models and Fundamental Mispricings investment themes. |
| Q | How did the Fund use derivatives and similar instruments during the Reporting Period? |
| A | During the Reporting Period, we used futures contracts to equitize the Fund’s cash holdings. In other words, we put the Fund’s cash holdings to work by using them as collateral for the purchase of futures contracts. The use of these derivatives did not have a material impact on Fund results during the Reporting Period. |
| Q | What was the Fund’s sector positioning relative to the Index at the end of the Reporting Period? |
| A | At the end of the Reporting Period, the Fund was overweight the industrials, consumer discretionary and energy sectors relative to the Index. Compared to the Index, the Fund was underweight the utilities, real estate and financials sectors. The Fund was relatively neutral in the health care, consumer staples, materials, information technology and communication services sectors at the end of the Reporting Period. |
22
FUND BASICS
Small Cap Value Insights Fund
as of October 31, 2019
| TOP TEN HOLDINGS AS OF 10/31/191 | ||||||||
| Holding | % of Net Assets | Line of Business | ||||||
Rexford Industrial Realty, Inc. REIT | 0.9 | % | Equity Real Estate Investment Trusts (REITs) | |||||
First Industrial Realty Trust, Inc. REIT | 0.9 | Equity Real Estate Investment Trusts (REITs) | ||||||
Portland General Electric Co. | 0.9 | Electric Utilities | ||||||
Perspecta, Inc. | 0.9 | IT Services | ||||||
CenterState Bank Corp. | 0.8 | Banks | ||||||
Darling Ingredients, Inc. | 0.8 | Food Products | ||||||
Vishay Intertechnology, Inc. | 0.8 | Electronic Equipment, Instruments & Components | ||||||
Delek US Holdings, Inc. | 0.8 | Oil, Gas & Consumable Fuels | ||||||
Columbia Banking System, Inc. | 0.8 | Banks | ||||||
Terreno Realty Corp. REIT | 0.8 | Equity Real Estate Investment Trusts (REITs) | ||||||
| 1 | The top 10 holdings may not be representative of the Fund’s future investments. The top 10 holdings exclude investments in money market funds. |
| FUND VS. BENCHMARK SECTOR ALLOCATIONS2 |
| As of October 31, 2019 |
| 2 | The Fund is actively managed and, as such, its composition may differ over time. Consequently, the Fund’s overall sector allocations may differ from the percentages contained in the graph above. The graph categorizes investments using the Global Industry Classification Standard (“GICS”); however, the sector classifications used by the portfolio management team may differ from GICS. The percentage shown for each investment category reflects the value of investments in that category as a percentage of market value (excluding investments in the securities lending reinvestment vehicle, if any). Investments in the securities lending reinvestment vehicle represented 0.4% of the Fund’s net assets as of October 31, 2019. The graph depicts the Fund’s investments but may not represent the Fund’s market exposure due to the exclusion of certain derivatives, if any, as listed in the Additional Investment Information section of the Schedule of Investments. |
For more information about your Fund, please refer to www.GSAMFUNDS.com. There, you can learn more about your Fund’s investment strategies, holdings, and performance.
23
GOLDMAN SACHS SMALL CAP VALUE INSIGHTS FUND
Performance Summary
October 31, 2019
The following graph shows the value, as of October 31, 2019, of a $10,000 investment made on November 1, 2009 in Class A Shares (with the maximum sales charge of 5.5%). For comparative purposes, the performance of the Fund’s benchmark, the Russell 2000® Value Index (with dividends reinvested), is shown. Performance reflects applicable fee waivers and/or expense limitations in effect during the periods shown and in their absence, performance would be reduced. Returns do not reflect the deduction of taxes that a shareholder would pay on Fund distributions or the redemption of Fund shares. The returns set forth below represent past performance. Past performance does not guarantee future results. The Fund’s investment return and principal value will fluctuate so that an investor’s shares, when redeemed, may be worth more or less than their original cost. Current performance may be lower or higher than the performance quoted below. Please visit our web site at www.GSAMFUNDS.com to obtain the most recent month-end returns.
| Small Cap Value Insights Fund’s 10 Year Performance |
Performance of a $10,000 investment, including any applicable sales charges, with distributions reinvested, from November 1, 2009 through October 31, 2019.
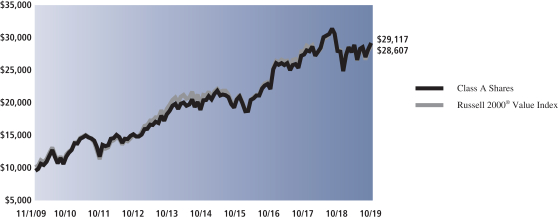
| Average Annual Total Return through October 31, 2019* | One Year | Five Years | Ten Years | Since Inception | ||||||||
Class A | ||||||||||||
Excluding sales charges | 4.40% | 7.48% | 11.90% | — | ||||||||
Including sales charges | -1.34% | 6.28% | 11.27% | — | ||||||||
| ||||||||||||
Class C | ||||||||||||
Excluding contingent deferred sales charges | 3.67% | 6.69% | 11.08% | — | ||||||||
Including contingent deferred sales charges | 2.64% | 6.69% | 11.08% | — | ||||||||
| ||||||||||||
Institutional | 4.81% | 7.91% | 12.35% | — | ||||||||
| ||||||||||||
Investor | 4.69% | 7.75% | 12.19% | — | ||||||||
| ||||||||||||
Class P (Commenced April 16, 2018) | 4.82% | N/A | N/A | 1.51% | ||||||||
| ||||||||||||
Class R | 4.14% | 7.21% | 11.62% | — | ||||||||
| ||||||||||||
Class R6 (Commenced July 31, 2015) | 4.83% | N/A | N/A | 8.70% | ||||||||
| ||||||||||||
| * | These returns assume reinvestment of all distributions at NAV and reflect a maximum initial sales charge of 5.50% for Class A Shares and the assumed contingent deferred sales charge for Class C Shares (1% if redeemed within 12 months of purchase). Because Institutional, Investor, Class P, Class R and Class R6 Shares do not involve a sales charge, such a charge is not applied to their Average Annual Total Return. |
24
PORTFOLIO RESULTS
Goldman Sachs U.S. Equity Insights Fund
Investment Objective
The Fund seeks long-term growth of capital and dividend income.
Portfolio Management Discussion and Analysis
Below, the Goldman Sachs Quantitative Investment Strategies Team discusses the Goldman Sachs U.S. Equity Insights Fund’s (the “Fund”) performance and positioning for the 12-month period ended October 31, 2019 (the “Reporting Period”).
| Q | How did the Fund perform during the Reporting Period? |
| A | During the Reporting Period, the Fund’s Class A, Class C, Institutional, Service, Investor, Class P, Class R and Class R6 Shares generated average annual total returns, without sales charges, of 7.98%, 7.20%, 8.39%, 7.86%, 8.25%, 8.40%, 7.72% and 8.38%, respectively. These returns compare to the 14.33% average annual total return of the Fund’s benchmark, the S&P 500® Index (with dividends reinvested) (the “Index”), during the same period. |
| Q | What key factors were most responsible for the Fund’s performance during the Reporting Period? |
| A | The Fund uses a quantitative style of management, in combination with a qualitative overlay, that emphasizes fundamentally-based stock selection, careful portfolio construction and efficient implementation. The Fund’s investments are selected using fundamental research and a variety of quantitative techniques based on certain investment themes, including Fundamental Mispricings, High Quality Business Models, Sentiment Analysis and Market Themes & Trends. |
During the Reporting Period, the Fund underperformed the Index, with all four of our quantitative model’s investment themes detracting from results. Stock selection driven by these investment themes further hampered relative performance. |
| Q | What impact did the Fund’s investment themes have on performance during the Reporting Period? |
| A | In keeping with our investment approach, we use our quantitative model and four investment themes to take a long-term view of market patterns and look for inefficiencies, selecting stocks for the Fund and overweighting or underweighting the ones chosen by the model. Over time and by design, the performance of any one of the model’s investment themes tends to have a low correlation with the model’s other themes, demonstrating the diversification benefit of the Fund’s theme-driven quantitative model. The variance in performance supports our research indicating that the diversification provided by our different investment themes is a significant investment advantage over the long term, even though the Fund may experience underperformance in the short term. Of course, diversification does not protect an investor from market risk nor does it ensure a profit. |
During the Reporting Period, all four of our investment themes — High Quality Business Models, Sentiment Analysis, Fundamental Mispricings and Market Themes & Trends — detracted from the Fund’s relative performance. High Quality Business Models seeks to identify companies that are generating high quality revenues with sustainable business models and aligned management incentives. Sentiment Analysis seeks to identify stocks experiencing improvements in their overall market sentiment. Fundamental Mispricings seeks to identify high quality businesses trading at a fair price, which we believe may lead to strong performance over the long run. Market Themes & Trends seeks to identify companies positively positioned to benefit from themes and trends in the market and macroeconomic environment. |
| Q | How did the Fund’s sector allocations affect relative performance? |
| A | In constructing the Fund’s portfolio, we focus on picking stocks rather than on making sector or industry bets. Consequently, the Fund is similar to the Index in terms of its sector and industry allocations and style. Changes in its sector or industry weights generally do not have a meaningful impact on relative performance. |
25
PORTFOLIO RESULTS
| Q | Did stock selection help or hurt Fund performance during the Reporting Period? |
| A | We seek to outpace the Index by overweighting stocks we expect to outperform and underweighting those we think may lag. At the same time, we strive to maintain a risk profile similar to the Index. The Fund’s investments are selected using fundamental research and a variety of quantitative techniques based on our investment themes. For example, the Fund aims to hold a basket of stocks with better Fundamental Mispricings characteristics than the Index. |
During the Reporting Period, stock selection hurt the Fund’s performance, with holdings in the health care sector detracting most. Investments in the financials and consumer staples sectors also diminished relative returns. There was no sector in which stock selection had a positive impact overall on relative performance. |
| Q | Which individual stock positions detracted most from the Fund’s results during the Reporting Period? |
| A | In terms of individual stock positions, the Fund was hampered during the Reporting Period by overweight positions relative to the Index in ConocoPhillips, an energy company; Conagra Brands, a packaged foods company; and Align Technology, a manufacturer of 3D digital scanners and clear aligners used in orthodontics. The overweights in ConocoPhillips and Align Technology were largely due to our High Quality Business Models and Sentiment Analysis investment themes. We assumed the overweight in Conagra Brands mainly because of our Market Themes & Trends and Sentiment Analysis investment themes. |
| Q | Which individual stock positions contributed most to the Fund’s relative returns during the Reporting Period? |
| A | During the Reporting Period, the Fund was aided by overweight positions in technology company Apple, retail chain Target and paint and coating manufacturer Sherwin-Williams. We decided to overweight Apple and Sherwin-Williams based mostly on our High Quality Business Models investment theme. Our High Quality Business Models and Market Themes & Trends investment themes drove the Fund’s overweight in Target. |
| Q | How did the Fund use derivatives and similar instruments during the Reporting Period? |
| A | During the Reporting Period, we used futures contracts to equitize the Fund’s cash holdings. In other words, we put the Fund’s cash holdings to work by using them as collateral for the purchase of futures contracts. The use of these derivatives did not have a material impact on Fund results during the Reporting Period. |
| Q | What was the Fund’s sector positioning relative to the Index at the end of the Reporting Period? |
| A | At the end of the Reporting Period, the Fund was overweight the real estate, consumer discretionary, utilities and health care sectors relative to the Index. Compared to the Index, the Fund was underweight the communication services, industrials, consumer staples and information technology sectors. The Fund was relatively neutral compared to the Index in the energy, materials and financials sectors at the end of the Reporting Period. |
26
FUND BASICS
U.S. Equity Insights Fund
as of October 31, 2019
| TOP TEN HOLDINGS AS OF 10/31/191 | ||||||||
| Holding | % of Net Assets | Line of Business | ||||||
| Microsoft Corp. | 5.4 | % | Software | |||||
| Apple, Inc. | 4.5 | Technology Hardware, Storage & Peripherals | ||||||
| Amazon.com, Inc. | 3.9 | Internet & Direct Marketing Retail | ||||||
| Facebook, Inc., Class A | 2.8 | Interactive Media & Services | ||||||
| Home Depot, Inc. (The) | 2.0 | Specialty Retail | ||||||
| Alphabet, Inc., Class A | 2.0 | Interactive Media & Services | ||||||
| Alphabet, Inc., Class C | 2.0 | Interactive Media & Services | ||||||
| Johnson & Johnson | 1.8 | Pharmaceuticals | ||||||
| Cisco Systems, Inc. | 1.5 | Communications Equipment | ||||||
| Costco Wholesale Corp. | 1.5 | Food & Staples Retailing | ||||||
| 1 | The top 10 holdings may not be representative of the Fund’s future investments. |
| FUND VS. BENCHMARK SECTOR ALLOCATIONS2 |
| As of October 31, 2019 |
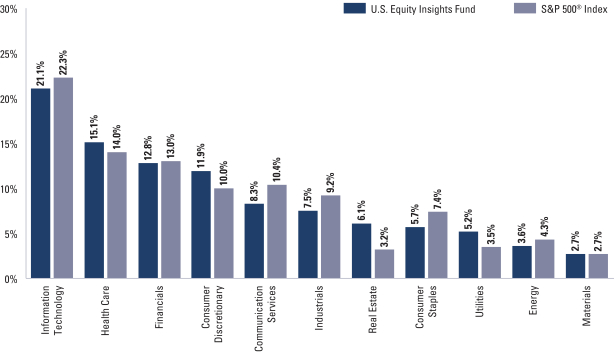
| 2 | The Fund is actively managed and, as such, its composition may differ over time. Consequently, the Fund’s overall sector allocations may differ from the percentages contained in the graph above. The graph categorizes investments using the Global Industry Classification Standard (“GICS”), however, the sector classifications used by the portfolio management team may differ from GICS. The percentage shown for each investment category reflects the value of investments in that category as a percentage of market value (excluding investments in the securities lending reinvestment vehicle, if any). The graph depicts the Fund’s investments but may not represent the Fund’s market exposure due to the exclusion of certain derivatives, if any, as listed in the Additional Investment Information section of the Schedule of Investments. |
For more information about your Fund, please refer to www.GSAMFUNDS.com. There, you can learn more about your Fund’s investment strategies, holdings, and performance.
27
GOLDMAN SACHS U.S. EQUITY INSIGHTS FUND
Performance Summary
October 31, 2019
The following graph shows the value, as of October 31, 2019, of a $10,000 investment made on November 1, 2009 in Class A Shares (with the maximum sales charge of 5.5%). For comparative purposes, the performance of the Fund’s benchmark, the Standard and Poor’s 500 Index (with dividends reinvested) (“S&P 500® Index”), is shown. Performance reflects applicable fee waivers and/or expense limitations in effect during the periods shown and in their absence, performance would be reduced. Returns do not reflect the deduction of taxes that a shareholder would pay on Fund distributions or the redemption of Fund shares. The returns set forth below represent past performance. Past performance does not guarantee future results. The Fund’s investment return and principal value will fluctuate so that an investor’s shares, when redeemed, may be worth more or less than their original cost. Current performance may be lower or higher than the performance quoted below. Please visit our web site at www.GSAMFUNDS.com to obtain the most recent month-end returns.
| U.S. Equity Insights Fund’s 10 Year Performance |
Performance of a $10,000 investment, including any applicable sales charges, with distributions reinvested, from November 1, 2009 through October 31, 2019.
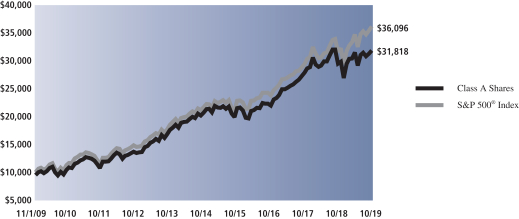
| Average Annual Total Return through October 31, 2019* | One Year | Five Years | Ten Years | Since Inception | ||||||||
Class A | ||||||||||||
Excluding sales charges | 7.98% | 9.04% | 12.90% | — | ||||||||
Including sales charges | 2.04% | 7.81% | 12.26% | — | ||||||||
| ||||||||||||
Class C | ||||||||||||
Excluding contingent deferred sales charges | 7.20% | 8.22% | 12.06% | — | ||||||||
Including contingent deferred sales charges | 6.16% | 8.22% | 12.06% | — | ||||||||
| ||||||||||||
Institutional | 8.39% | 9.46% | 13.34% | — | ||||||||
| ||||||||||||
Service | 7.86% | 8.92% | 12.78% | — | ||||||||
| ||||||||||||
Investor | 8.25% | 9.30% | 13.18% | — | ||||||||
| ||||||||||||
Class P (Commenced April 16, 2018) | 8.40% | N/A | N/A | 5.62% | ||||||||
| ||||||||||||
Class R | 7.72% | 8.76% | 12.62% | — | ||||||||
| ||||||||||||
Class R6 (Commenced July 31, 2015) | 8.38% | N/A | N/A | 9.77% | ||||||||
| ||||||||||||
| * | These returns assume reinvestment of all distributions at NAV and reflect a maximum initial sales charge of 5.50% for Class A Shares and the assumed contingent deferred sales charge for Class C Shares (1% if redeemed within 12 months of purchase). Because Institutional, Service, Investor, Class P, Class R and Class R6 Shares do not involve a sales charge, such a charge is not applied to their Average Annual Total Return. |
28
FUND BASICS
Russell Midcap® Index measures the performance of the mid-cap segment of the U.S. equity universe. The Russell Midcap® Index is a subset of the Russell 1000® Index. The Russell Midcap® Index includes approximately 800 of the smallest securities based on a combination of their market cap and current index membership. The Russell Midcap® Index represents approximately 31% of the total market capitalization of the Russell 1000® Index companies. The Russell Midcap® Index is constructed to provide a comprehensive and unbiased barometer for the mid-cap segment. The Russell Midcap® Index is completely reconstituted annually to ensure larger stocks do not distort the performance and characteristics of the true mid-cap opportunity set.
Russell 1000® Index measures the performance of the large-cap segment of the U.S. equity universe. The Russell 1000® Index is a subset of the Russell 3000® Index and includes approximately 1000 of the largest securities based on a combination of their market cap and current index membership. The Russell 1000® Index represents approximately 92% of the U.S. market. The Russell 1000® Index is constructed to provide a comprehensive and unbiased barometer for the large-cap segment and is completely reconstituted annually to ensure new and growing equities are reflected.
The Russell 1000® Growth Index (with dividends reinvested) is an unmanaged market capitalization weighted index of the 1000 largest U.S. companies with higher price-to-book ratios and higher forecasted growth values. The figures for the Russell 1000® Growth Index do not include any deduction for fees, expenses or taxes.
The Russell 1000® Value Index (with dividends reinvested) is an unmanaged market capitalization weighted index of the 1000 largest U.S. companies with lower price-to-book ratios and lower forecasted growth values. The figures for the Russell 1000® Value Index do not include any deduction for fees, expenses or taxes.
The Russell 2000® Index (with dividends reinvested) is an unmanaged index of common stock prices that measures the performance of the 2000 smallest companies in the Russell 3000® Index. The figures for the Russell 2000® Index do not include any deduction for fees, expenses or taxes.
The Russell 2000® Growth Index (with dividends reinvested) is an unmanaged index of common stock prices that measures the performance of those Russell 2000 companies with higher price-to-book ratios and higher forecasted growth values. The Russell 2000® Growth Index figures do not reflect any deduction for fees, expenses or taxes. It is not possible to invest directly in an index.
The Russell 2000® Value Index (with dividends reinvested) is an unmanaged index of common stock prices that measures the performance of those Russell 2000 companies with lower price-to-book ratios and lower forecasted growth values. The Russell 2000® Value Index figures do not reflect any deduction for fees, expenses or taxes.
The S&P 500® Index (with dividends reinvested) is the Standard & Poor’s 500 Composite Index of 500 stocks, an unmanaged index of common stock prices. The figures for the S&P 500® Index do not include any deduction for fees, expenses or taxes.
It is not possible to invest directly in an index.
29
GOLDMAN SACHS LARGE CAP GROWTH INSIGHTS FUND
October 31, 2019
| Shares | Description | Value | ||||||
| Common Stocks – 99.6% | ||||||||
| Aerospace & Defense – 0.9% | ||||||||
| 16,449 | Boeing Co. (The) | $ | 5,591,180 | |||||
| 96,606 | HEICO Corp. | 11,915,384 | ||||||
|
| |||||||
| 17,506,564 | ||||||||
|
| |||||||
| Airlines – 2.4% | ||||||||
| 378,376 | Delta Air Lines, Inc. | 20,840,950 | ||||||
| 850,305 | JetBlue Airways Corp.* | 16,410,887 | ||||||
| 165,995 | Southwest Airlines Co. | 9,317,299 | ||||||
|
| |||||||
| 46,569,136 | ||||||||
|
| |||||||
| Banks – 1.7% | ||||||||
| 176,303 | Popular, Inc. | 9,601,461 | ||||||
| 126,816 | Signature Bank | 15,004,869 | ||||||
| 23,765 | SVB Financial Group* | 5,263,472 | ||||||
| 60,060 | Western Alliance Bancorp | 2,962,760 | ||||||
| 15,848 | Zions Bancorp NA | 768,153 | ||||||
|
| |||||||
| 33,600,715 | ||||||||
|
| |||||||
| Beverages – 0.7% | ||||||||
| 207,153 | Monster Beverage Corp.* | 11,627,498 | ||||||
| 17,332 | PepsiCo, Inc. | 2,377,430 | ||||||
|
| |||||||
| 14,004,928 | ||||||||
|
| |||||||
| Biotechnology – 5.6% | ||||||||
| 437,609 | AbbVie, Inc. | 34,811,796 | ||||||
| 180,425 | Alexion Pharmaceuticals, Inc.* | 19,016,795 | ||||||
| 51,020 | Biogen, Inc.* | 15,240,184 | ||||||
| 325,838 | Gilead Sciences, Inc. | 20,759,139 | ||||||
| 228,998 | Incyte Corp.* | 19,217,512 | ||||||
|
| |||||||
| 109,045,426 | ||||||||
|
| |||||||
| Building Products – 0.4% | ||||||||
| 8,993 | Allegion PLC | 1,043,548 | ||||||
| 154,124 | Johnson Controls International PLC | 6,678,193 | ||||||
|
| |||||||
| 7,721,741 | ||||||||
|
| |||||||
| Capital Markets – 0.3% | ||||||||
| 11,444 | S&P Global, Inc. | 2,952,438 | ||||||
| 94,290 | TD Ameritrade Holding Corp. | 3,618,850 | ||||||
|
| |||||||
| 6,571,288 | ||||||||
|
| |||||||
| Chemicals – 1.5% | ||||||||
| 84,099 | Axalta Coating Systems Ltd.* | 2,480,080 | ||||||
| 35,169 | CF Industries Holdings, Inc. | 1,594,914 | ||||||
| 45,839 | Sherwin-Williams Co. (The) | 26,234,576 | ||||||
|
| |||||||
| 30,309,570 | ||||||||
|
| |||||||
| Commercial Services & Supplies – 1.0% | ||||||||
| 75,292 | Cintas Corp. | 20,228,702 | ||||||
|
| |||||||
| Communications Equipment – 2.1% | ||||||||
| 63,886 | Ciena Corp.* | 2,371,448 | ||||||
| 813,412 | Cisco Systems, Inc. | 38,645,204 | ||||||
|
| |||||||
| 41,016,652 | ||||||||
|
| |||||||
| Construction Materials – 0.1% | ||||||||
| 11,485 | Martin Marietta Materials, Inc. | 3,008,036 | ||||||
|
| |||||||
| Common Stocks – (continued) | ||||||||
| Consumer Finance – 1.5% | ||||||||
| 304,480 | Ally Financial, Inc. | 9,326,222 | ||||||
| 587,666 | Synchrony Financial | 20,785,747 | ||||||
|
| |||||||
| 30,111,969 | ||||||||
|
| |||||||
| Containers & Packaging – 0.4% | ||||||||
| 170,336 | Berry Global Group, Inc.* | 7,070,647 | ||||||
|
| |||||||
| Distributors – 0.1% | ||||||||
| 11,271 | Pool Corp. | 2,337,605 | ||||||
|
| |||||||
| Diversified Financial Services – 0.9% | ||||||||
| 336,394 | Voya Financial, Inc. | 18,151,820 | ||||||
|
| |||||||
| Electronic Equipment, Instruments & Components – 2.1% | ||||||||
| 291,428 | Jabil, Inc. | 10,730,379 | ||||||
| 219,094 | Keysight Technologies, Inc.* | 22,108,776 | ||||||
| 178,226 | National Instruments Corp. | 7,376,774 | ||||||
|
| |||||||
| 40,215,929 | ||||||||
|
| |||||||
| Entertainment – 0.6% | ||||||||
| 35,355 | Take-Two Interactive Software, Inc.* | 4,254,974 | ||||||
| 1,150,230 | Zynga, Inc., Class A* | 7,096,919 | ||||||
|
| |||||||
| 11,351,893 | ||||||||
|
| |||||||
| Equity Real Estate Investment Trusts (REITs) – 4.6% | ||||||||
| 58,414 | American Homes 4 Rent, Class A REIT | 1,546,218 | ||||||
| 74,174 | CubeSmart REIT | 2,351,316 | ||||||
| 151,563 | Duke Realty Corp. REIT | 5,325,924 | ||||||
| 309,770 | Equity LifeStyle Properties, Inc. REIT | 21,665,314 | ||||||
| 179,425 | Extra Space Storage, Inc. REIT | 20,144,045 | ||||||
| 456,874 | Invitation Homes, Inc. REIT | 14,067,150 | ||||||
| 94,572 | Public Storage REIT | 21,076,316 | ||||||
| 18,941 | Sun Communities, Inc. REIT | 3,080,754 | ||||||
|
| |||||||
| 89,257,037 | ||||||||
|
| |||||||
| Food & Staples Retailing – 1.8% | ||||||||
| 69,023 | Costco Wholesale Corp. | 20,507,424 | ||||||
| 267,750 | Walgreens Boots Alliance, Inc. | 14,667,345 | ||||||
|
| |||||||
| 35,174,769 | ||||||||
|
| |||||||
| Health Care Equipment & Supplies – 3.5% | ||||||||
| 43,545 | Align Technology, Inc.* | 10,985,968 | ||||||
| 73,817 | Becton Dickinson and Co. | 18,897,152 | ||||||
| 2,515 | Cooper Cos., Inc. (The) | 731,865 | ||||||
| 42,882 | DENTSPLY SIRONA, Inc. | 2,349,076 | ||||||
| 42,892 | Hill-Rom Holdings, Inc. | 4,490,364 | ||||||
| 23,381 | Hologic, Inc.* | 1,129,536 | ||||||
| 94,271 | STERIS PLC | 13,345,945 | ||||||
| 26,828 | Teleflex, Inc. | 9,320,315 | ||||||
| 48,576 | West Pharmaceutical Services, Inc. | 6,987,172 | ||||||
|
| |||||||
| 68,237,393 | ||||||||
|
| |||||||
| Health Care Providers & Services – 3.3% | ||||||||
| 82,506 | Anthem, Inc. | 22,200,715 | ||||||
| 5,305 | Centene Corp.* | 281,589 | ||||||
|
| |||||||
| 30 | The accompanying notes are an integral part of these financial statements. |
GOLDMAN SACHS LARGE CAP GROWTH INSIGHTS FUND
| Shares | Description | Value | ||||||
| Common Stocks – (continued) | ||||||||
| Health Care Providers & Services – (continued) | ||||||||
| 167,912 | HCA Healthcare, Inc. | $ | 22,422,969 | |||||
| 36,810 | Molina Healthcare, Inc.* | 4,330,328 | ||||||
| 59,769 | UnitedHealth Group, Inc. | 15,103,626 | ||||||
|
| |||||||
| 64,339,227 | ||||||||
|
| |||||||
| Health Care Technology – 0.1% | ||||||||
| 13,727 | Veeva Systems, Inc., Class A* | 1,946,900 | ||||||
|
| |||||||
| Hotels, Restaurants & Leisure – 3.3% | ||||||||
| 4,135 | Chipotle Mexican Grill, Inc.* | 3,217,692 | ||||||
| 243,246 | MGM Resorts International | 6,932,511 | ||||||
| 20,617 | Planet Fitness, Inc., Class A* | 1,312,478 | ||||||
| 398,646 | Starbucks Corp. | 33,709,506 | ||||||
| 183,534 | Yum! Brands, Inc. | 18,667,243 | ||||||
|
| |||||||
| 63,839,430 | ||||||||
|
| |||||||
| Household Durables – 1.0% | ||||||||
| 265,086 | D.R. Horton, Inc. | 13,882,554 | ||||||
| 81,537 | Lennar Corp., Class A | 4,859,605 | ||||||
|
| |||||||
| 18,742,159 | ||||||||
|
| |||||||
| Independent Power and Renewable Electricity Producers – 0.4% | ||||||||
| 454,223 | AES Corp. | 7,744,502 | ||||||
|
| |||||||
| Insurance – 0.3% | ||||||||
| 6,021 | Athene Holding Ltd., Class A* | 261,010 | ||||||
| 87,952 | Progressive Corp. (The) | 6,130,255 | ||||||
|
| |||||||
| 6,391,265 | ||||||||
|
| |||||||
| Interactive Media & Services – 9.3% | ||||||||
| 35,022 | Alphabet, Inc., Class A* | 44,085,694 | ||||||
| 44,008 | Alphabet, Inc., Class C* | 55,454,921 | ||||||
| 432,439 | Facebook, Inc., Class A* | 82,876,934 | ||||||
|
| |||||||
| 182,417,549 | ||||||||
|
| |||||||
| Internet & Direct Marketing Retail – 7.6% | ||||||||
| 65,587 | Amazon.com, Inc.* | 116,525,799 | ||||||
| 15,406 | Booking Holdings, Inc.* | 31,563,351 | ||||||
|
| |||||||
| 148,089,150 | ||||||||
|
| |||||||
| IT Services – 7.1% | ||||||||
| 6,004 | CACI International, Inc., Class A* | 1,343,395 | ||||||
| 75,479 | Mastercard, Inc., Class A | 20,893,342 | ||||||
| 351,260 | PayPal Holdings, Inc.* | 36,566,166 | ||||||
| 115,594 | VeriSign, Inc.* | 21,965,172 | ||||||
| 321,019 | Visa, Inc., Class A | 57,417,458 | ||||||
|
| |||||||
| 138,185,533 | ||||||||
|
| |||||||
| Life Sciences Tools & Services – 2.1% | ||||||||
| 10,369 | Agilent Technologies, Inc. | 785,451 | ||||||
| 118,078 | IQVIA Holdings, Inc.* | 17,052,825 | ||||||
| 31,717 | Mettler-Toledo International, Inc.* | 22,358,582 | ||||||
|
| |||||||
| 40,196,858 | ||||||||
|
| |||||||
| Machinery – 0.9% | ||||||||
| 386,870 | Allison Transmission Holdings, Inc. | 16,871,401 | ||||||
|
| |||||||
| Media – 0.3% | ||||||||
| 8,249 | Charter Communications, Inc., Class A* | 3,859,377 | ||||||
|
| |||||||
| Common Stocks – (continued) | ||||||||
| Media – (continued) | ||||||||
| 54,494 | New York Times Co. (The), Class A | 1,683,865 | ||||||
|
| |||||||
| 5,543,242 | ||||||||
|
| |||||||
| Metals & Mining – 0.4% | ||||||||
| 359,013 | Alcoa Corp.* | 7,463,880 | ||||||
|
| |||||||
| Multiline Retail – 0.9% | ||||||||
| 1,206,984 | Macy’s, Inc. | 18,297,877 | ||||||
|
| |||||||
| Oil, Gas & Consumable Fuels – 0.5% | ||||||||
| 99,218 | HollyFrontier Corp. | 5,451,037 | ||||||
| 47,945 | Valero Energy Corp. | 4,649,706 | ||||||
|
| |||||||
| 10,100,743 | ||||||||
|
| |||||||
| Personal Products – 1.3% | ||||||||
| 131,771 | Estee Lauder Cos., Inc. (The), Class A | 24,544,984 | ||||||
|
| |||||||
| Pharmaceuticals – 1.0% | ||||||||
| 51,244 | Johnson & Johnson | 6,766,258 | ||||||
| 109,016 | Merck & Co., Inc. | 9,447,327 | ||||||
| 204,869 | Mylan NV* | 3,923,241 | ||||||
|
| |||||||
| 20,136,826 | ||||||||
|
| |||||||
| Professional Services – 0.6% | ||||||||
| 23,053 | CoStar Group, Inc.* | 12,668,085 | ||||||
|
| |||||||
| Road & Rail – 0.6% | ||||||||
| 4,659 | CSX Corp. | 327,388 | ||||||
| 69,931 | Union Pacific Corp. | 11,570,783 | ||||||
|
| |||||||
| 11,898,171 | ||||||||
|
| |||||||
| Semiconductors & Semiconductor Equipment – 3.4% | ||||||||
| 150,345 | Analog Devices, Inc. | 16,031,287 | ||||||
| 118,664 | Cree, Inc.* | 5,663,833 | ||||||
| 9,362 | Lam Research Corp. | 2,537,476 | ||||||
| 78,045 | NXP Semiconductors NV (Netherlands) | 8,872,156 | ||||||
| 188,728 | Teradyne, Inc. | 11,553,928 | ||||||
| 122,034 | Texas Instruments, Inc. | 14,398,792 | ||||||
| 36,193 | Universal Display Corp. | 7,245,115 | ||||||
|
| |||||||
| 66,302,587 | ||||||||
|
| |||||||
| Software – 12.6% | ||||||||
| 93,368 | Adobe, Inc.* | 25,949,768 | ||||||
| 331,461 | Cadence Design Systems, Inc.* | 21,660,977 | ||||||
| 59,791 | Citrix Systems, Inc. | 6,508,848 | ||||||
| 24,873 | HubSpot, Inc.* | 3,857,802 | ||||||
| 109,434 | Intuit, Inc. | 28,179,255 | ||||||
| 949,997 | Microsoft Corp. | 136,201,070 | ||||||
| 71,235 | ServiceNow, Inc.* | 17,613,566 | ||||||
| 34,074 | Workday, Inc., Class A* | 5,525,440 | ||||||
|
| |||||||
| 245,496,726 | ||||||||
|
| |||||||
| Specialty Retail – 2.3% | ||||||||
| 73,033 | CarMax, Inc.* | 6,804,485 | ||||||
| 146,327 | Home Depot, Inc. (The) | 34,325,388 | ||||||
| 221,089 | L Brands, Inc. | 3,767,356 | ||||||
|
| |||||||
| 44,897,229 | ||||||||
|
| |||||||
| The accompanying notes are an integral part of these financial statements. | 31 |
GOLDMAN SACHS LARGE CAP GROWTH INSIGHTS FUND
Schedule of Investments(continued)
October 31, 2019
| Shares | Description | Value | ||||||
| Common Stocks – (continued) | ||||||||
| Technology Hardware, Storage & Peripherals – 8.1% | ||||||||
| 606,036 | Apple, Inc. | $ | 150,757,515 | |||||
| 377,485 | HP, Inc. | 6,556,915 | ||||||
|
| |||||||
| 157,314,430 | ||||||||
|
| |||||||
| TOTAL INVESTMENTS – 99.6% | ||||||||
| (Cost $1,588,909,801) | $ | 1,944,920,574 | ||||||
|
| |||||||
| | OTHER ASSETS IN EXCESS OF LIABILITIES – 0.4% | 7,983,262 | ||||||
|
| |||||||
| NET ASSETS – 100.0% | $ | 1,952,903,836 | ||||||
|
| |||||||
| The percentage shown for each investment category reflects the value of investments in that category as a percentage of net assets. | ||
* | Non-income producing security. | |
| ||
Investment Abbreviations: | ||
PLC | —Public Limited Company | |
REIT | —Real Estate Investment Trust | |
| ||
| 32 | The accompanying notes are an integral part of these financial statements. |
GOLDMAN SACHS LARGE CAP VALUE INSIGHTS FUND
Schedule of Investments
October 31, 2019
| Shares | Description | Value | ||||||
| Common Stocks – 99.1% | ||||||||
| Aerospace & Defense – 0.1% | ||||||||
| 1,307 | L3Harris Technologies, Inc. | $ | 269,647 | |||||
|
| |||||||
| Airlines – 2.5% | ||||||||
| 9,990 | Copa Holdings SA, Class A (Panama) | 1,016,383 | ||||||
| 98,548 | Delta Air Lines, Inc. | 5,428,024 | ||||||
| 126,424 | JetBlue Airways Corp.* | 2,439,983 | ||||||
| 42,378 | Southwest Airlines Co. | 2,378,677 | ||||||
|
| |||||||
| 11,263,067 | ||||||||
|
| |||||||
| Automobiles – 0.0% | ||||||||
| 4,050 | General Motors Co. | 150,498 | ||||||
|
| |||||||
| Banks – 10.4% | ||||||||
| 137,122 | Bank of America Corp. | 4,287,805 | ||||||
| 12,178 | Citigroup, Inc. | 875,111 | ||||||
| 144,789 | Citizens Financial Group, Inc. | 5,090,781 | ||||||
| 179,966 | Fifth Third Bancorp | 5,233,411 | ||||||
| 69,904 | JPMorgan Chase & Co. | 8,732,408 | ||||||
| 4,450 | PacWest Bancorp | 164,605 | ||||||
| 52,668 | People’s United Financial, Inc. | 851,641 | ||||||
| 85,423 | Popular, Inc. | 4,652,137 | ||||||
| 37,169 | Signature Bank | 4,397,836 | ||||||
| 4,985 | SVB Financial Group* | 1,104,078 | ||||||
| 64,784 | Wells Fargo & Co. | 3,344,798 | ||||||
| 75,742 | Western Alliance Bancorp | 3,736,353 | ||||||
| 98,395 | Zions Bancorp NA | 4,769,206 | ||||||
|
| |||||||
| 47,240,170 | ||||||||
|
| |||||||
| Beverages – 0.1% | ||||||||
| 8,713 | Monster Beverage Corp.* | 489,061 | ||||||
|
| |||||||
| Biotechnology – 3.2% | ||||||||
| 23,814 | AbbVie, Inc. | 1,894,403 | ||||||
| 26,710 | Alexion Pharmaceuticals, Inc.* | 2,815,234 | ||||||
| 9,559 | Biogen, Inc.* | 2,855,369 | ||||||
| 107,401 | Gilead Sciences, Inc. | 6,842,518 | ||||||
|
| |||||||
| 14,407,524 | ||||||||
|
| |||||||
| Building Products – 1.3% | ||||||||
| 131,662 | Johnson Controls International PLC | 5,704,914 | ||||||
|
| |||||||
| Capital Markets – 2.5% | ||||||||
| 13,120 | Ameriprise Financial, Inc. | 1,979,677 | ||||||
| 85,675 | Morgan Stanley | 3,945,334 | ||||||
| 62,375 | State Street Corp. | 4,121,116 | ||||||
| 34,848 | TD Ameritrade Holding Corp. | 1,337,466 | ||||||
|
| |||||||
| 11,383,593 | ||||||||
|
| |||||||
| Chemicals – 2.4% | ||||||||
| 29,977 | Axalta Coating Systems Ltd.* | 884,022 | ||||||
| 25,909 | CF Industries Holdings, Inc. | 1,174,973 | ||||||
| 66,224 | Dow, Inc. | 3,343,650 | ||||||
| 14,069 | Eastman Chemical Co. | 1,069,807 | ||||||
| 7,777 | Sherwin-Williams Co. (The) | 4,450,932 | ||||||
|
| |||||||
| 10,923,384 | ||||||||
|
| |||||||
| Common Stocks – (continued) | ||||||||
| Communications Equipment – 0.1% | ||||||||
| 10,035 | Ciena Corp.* | 372,499 | ||||||
| 435 | Motorola Solutions, Inc. | 72,349 | ||||||
|
| |||||||
| 444,848 | ||||||||
|
| |||||||
| Construction Materials – 0.6% | ||||||||
| 6,851 | Martin Marietta Materials, Inc. | 1,794,346 | ||||||
| 6,045 | Vulcan Materials Co. | 863,649 | ||||||
|
| |||||||
| 2,657,995 | ||||||||
|
| |||||||
| Consumer Finance – 2.5% | ||||||||
| 160,028 | Ally Financial, Inc. | 4,901,658 | ||||||
| 14,018 | Capital One Financial Corp. | 1,307,178 | ||||||
| 145,414 | Synchrony Financial | 5,143,293 | ||||||
|
| |||||||
| 11,352,129 | ||||||||
|
| |||||||
| Containers & Packaging – 0.2% | ||||||||
| 25,840 | Berry Global Group, Inc.* | 1,072,618 | ||||||
|
| |||||||
| Diversified Financial Services – 3.8% | ||||||||
| 136,055 | AXA Equitable Holdings, Inc. | 2,938,788 | ||||||
| 44,086 | Berkshire Hathaway, Inc., Class B* | 9,371,802 | ||||||
| 89,833 | Voya Financial, Inc. | 4,847,389 | ||||||
|
| |||||||
| 17,157,979 | ||||||||
|
| |||||||
| Diversified Telecommunication Services – 1.9% | ||||||||
| 126,688 | AT&T, Inc. | 4,876,221 | ||||||
| 63,500 | Verizon Communications, Inc. | 3,839,845 | ||||||
|
| |||||||
| 8,716,066 | ||||||||
|
| |||||||
| Electric Utilities – 4.3% | ||||||||
| 28,227 | American Electric Power Co., Inc. | 2,664,346 | ||||||
| 129,814 | Exelon Corp. | 5,905,239 | ||||||
| 111,663 | FirstEnergy Corp. | 5,395,556 | ||||||
| 163,061 | PPL Corp. | 5,460,913 | ||||||
|
| |||||||
| 19,426,054 | ||||||||
|
| |||||||
| Electrical Equipment – 1.1% | ||||||||
| 17,837 | AMETEK, Inc. | 1,634,761 | ||||||
| 37,133 | Eaton Corp. PLC | 3,234,656 | ||||||
|
| |||||||
| 4,869,417 | ||||||||
|
| |||||||
| Electronic Equipment, Instruments & Components – 1.2% | ||||||||
| 21,592 | Jabil, Inc. | 795,018 | ||||||
| 44,031 | Keysight Technologies, Inc.* | 4,443,168 | ||||||
|
| |||||||
| 5,238,186 | ||||||||
|
| |||||||
| Energy Equipment & Services – 0.1% | ||||||||
| 12,873 | Helmerich & Payne, Inc. | 482,737 | ||||||
|
| |||||||
| Entertainment – 1.1% | ||||||||
| 31,926 | Cinemark Holdings, Inc. | 1,168,491 | ||||||
| 2,882 | Take-Two Interactive Software, Inc.* | 346,849 | ||||||
| 24,179 | Walt Disney Co. (The) | 3,141,336 | ||||||
| 24,101 | Zynga, Inc., Class A* | 148,703 | ||||||
|
| |||||||
| 4,805,379 | ||||||||
|
| |||||||
| The accompanying notes are an integral part of these financial statements. | 33 |
GOLDMAN SACHS LARGE CAP VALUE INSIGHTS FUND
Schedule of Investments(continued)
October 31, 2019
| Shares | Description | Value | ||||||
| Common Stocks – (continued) | ||||||||
| Equity Real Estate Investment Trusts (REITs) – 7.9% | ||||||||
| 11,804 | Camden Property Trust REIT | $ | 1,350,023 | |||||
| 114,096 | CubeSmart REIT | 3,616,843 | ||||||
| 140,344 | Duke Realty Corp. REIT | 4,931,688 | ||||||
| 12,288 | Equity LifeStyle Properties, Inc. REIT | 859,423 | ||||||
| 39,498 | Extra Space Storage, Inc. REIT | 4,434,440 | ||||||
| 41,596 | Healthcare Trust of America, Inc., Class A REIT | 1,289,476 | ||||||
| 164,315 | Invitation Homes, Inc. REIT | 5,059,259 | ||||||
| 72,777 | Prologis, Inc. REIT | 6,386,910 | ||||||
| 17,760 | Public Storage REIT | 3,957,994 | ||||||
| 108,346 | Retail Properties of America, Inc., Class A REIT | 1,490,841 | ||||||
| 1,879 | STORE Capital Corp. REIT | 76,099 | ||||||
| 14,735 | Sun Communities, Inc. REIT | 2,396,648 | ||||||
|
| |||||||
| 35,849,644 | ||||||||
|
| |||||||
| Food & Staples Retailing – 2.3% | ||||||||
| 4,247 | Costco Wholesale Corp. | 1,261,826 | ||||||
| 52,053 | US Foods Holding Corp.* | 2,064,942 | ||||||
| 107,693 | Walgreens Boots Alliance, Inc. | 5,899,423 | ||||||
| 8,497 | Walmart, Inc. | 996,358 | ||||||
|
| |||||||
| 10,222,549 | ||||||||
|
| |||||||
| Food Products – 0.3% | ||||||||
| 28,886 | Bunge Ltd. | 1,559,844 | ||||||
|
| |||||||
| Health Care Equipment & Supplies – 3.2% | ||||||||
| 25,897 | Becton Dickinson and Co. | 6,629,632 | ||||||
| 84,648 | DENTSPLY SIRONA, Inc. | 4,637,018 | ||||||
| 3,289 | Medtronic PLC | 358,172 | ||||||
| 13,707 | STERIS PLC | 1,940,500 | ||||||
| 1,624 | West Pharmaceutical Services, Inc. | 233,596 | ||||||
| 5,356 | Zimmer Biomet Holdings, Inc. | 740,360 | ||||||
|
| |||||||
| 14,539,278 | ||||||||
|
| |||||||
| Health Care Providers & Services – 3.3% | ||||||||
| 22,704 | Anthem, Inc. | 6,109,192 | ||||||
| 17,622 | Cardinal Health, Inc. | 871,408 | ||||||
| 37,413 | HCA Healthcare, Inc. | 4,996,132 | ||||||
| 21,312 | Universal Health Services, Inc., Class B | 2,929,548 | ||||||
|
| |||||||
| 14,906,280 | ||||||||
|
| |||||||
| Hotels, Restaurants & Leisure – 2.3% | ||||||||
| 70,562 | MGM Resorts International | 2,011,017 | ||||||
| 51,679 | Starbucks Corp. | 4,369,976 | ||||||
| 40,895 | Yum! Brands, Inc. | 4,159,431 | ||||||
|
| |||||||
| 10,540,424 | ||||||||
|
| |||||||
| Household Durables – 1.9% | ||||||||
| 97,486 | D.R. Horton, Inc. | 5,105,342 | ||||||
| 54,376 | Lennar Corp., Class A | 3,240,810 | ||||||
| 1,617 | Mohawk Industries, Inc.* | 231,845 | ||||||
|
| |||||||
| 8,577,997 | ||||||||
|
| |||||||
| Common Stocks – (continued) | ||||||||
| Household Products – 1.4% | ||||||||
| 10,880 | Kimberly-Clark Corp. | 1,445,734 | ||||||
| 39,572 | Procter & Gamble Co. (The) | 4,927,110 | ||||||
|
| |||||||
| 6,372,844 | ||||||||
|
| |||||||
| Independent Power and Renewable Electricity Producers – 1.1% | ||||||||
| 294,216 | AES Corp. | 5,016,383 | ||||||
|
| |||||||
| Industrial Conglomerates – 0.1% | ||||||||
| 3,858 | Carlisle Cos., Inc. | 587,458 | ||||||
|
| |||||||
| Insurance – 2.7% | ||||||||
| 64,771 | Athene Holding Ltd., Class A* | 2,807,823 | ||||||
| 61,497 | Progressive Corp. (The) | 4,286,341 | ||||||
| 7,006 | Reinsurance Group of America, Inc. | 1,138,265 | ||||||
| 838 | RenaissanceRe Holdings Ltd. (Bermuda) | 156,857 | ||||||
| 137,214 | Unum Group | 3,778,873 | ||||||
|
| |||||||
| 12,168,159 | ||||||||
|
| |||||||
| Interactive Media & Services – 1.0% | ||||||||
| 23,751 | Facebook, Inc., Class A* | 4,551,879 | ||||||
|
| |||||||
| Internet & Direct Marketing Retail – 1.4% | ||||||||
| 2,567 | Amazon.com, Inc.* | 4,560,686 | ||||||
| 906 | Booking Holdings, Inc.* | 1,856,186 | ||||||
|
| |||||||
| 6,416,872 | ||||||||
|
| |||||||
| IT Services – 2.1% | ||||||||
| 43,691 | PayPal Holdings, Inc.* | 4,548,233 | ||||||
| 24,998 | VeriSign, Inc.* | 4,750,120 | ||||||
|
| |||||||
| 9,298,353 | ||||||||
|
| |||||||
| Life Sciences Tools & Services – 0.7% | ||||||||
| 7,388 | Agilent Technologies, Inc. | 559,641 | ||||||
| 19,008 | IQVIA Holdings, Inc.* | 2,745,135 | ||||||
|
| |||||||
| 3,304,776 | ||||||||
|
| |||||||
| Machinery – 1.3% | ||||||||
| 12,410 | Ingersoll-Rand PLC | 1,574,705 | ||||||
| 59,022 | PACCAR, Inc. | 4,489,213 | ||||||
|
| |||||||
| 6,063,918 | ||||||||
|
| |||||||
| Media – 1.5% | ||||||||
| 2,995 | Charter Communications, Inc., Class A* | 1,401,241 | ||||||
| 28,301 | New York Times Co. (The), Class A | 874,501 | ||||||
| 328,334 | News Corp., Class A | 4,501,459 | ||||||
|
| |||||||
| 6,777,201 | ||||||||
|
| |||||||
| Metals & Mining – 1.0% | ||||||||
| 212,188 | Alcoa Corp.* | 4,411,389 | ||||||
|
| |||||||
| Multiline Retail – 1.0% | ||||||||
| 233,516 | Macy’s, Inc. | 3,540,103 | ||||||
| 9,900 | Target Corp. | 1,058,409 | ||||||
|
| |||||||
| 4,598,512 | ||||||||
|
| |||||||
| 34 | The accompanying notes are an integral part of these financial statements. |
GOLDMAN SACHS LARGE CAP VALUE INSIGHTS FUND
| Shares | Description | Value | ||||||
| Common Stocks – (continued) | ||||||||
| Multi-Utilities – 2.5% | ||||||||
| 17,641 | Ameren Corp. | $ | 1,370,706 | |||||
| 36,309 | CMS Energy Corp. | 2,320,871 | ||||||
| 40,510 | DTE Energy Co. | 5,157,733 | ||||||
| 40,370 | Public Service Enterprise Group, Inc. | 2,555,825 | ||||||
|
| |||||||
| 11,405,135 | ||||||||
|
| |||||||
| Oil, Gas & Consumable Fuels – 7.2% | ||||||||
| 44,158 | Chevron Corp. | 5,128,510 | ||||||
| 117,393 | ConocoPhillips | 6,480,094 | ||||||
| 20,141 | Devon Energy Corp. | 408,459 | ||||||
| 76,946 | Exxon Mobil Corp. | 5,199,241 | ||||||
| 84,687 | HollyFrontier Corp. | 4,652,704 | ||||||
| 24,559 | Phillips 66 | 2,868,982 | ||||||
| 56,964 | Valero Energy Corp. | 5,524,369 | ||||||
| 103,573 | Williams Cos., Inc. (The) | 2,310,714 | ||||||
|
| |||||||
| 32,573,073 | ||||||||
|
| |||||||
| Personal Products – 1.0% | ||||||||
| 23,590 | Estee Lauder Cos., Inc. (The), Class A | 4,394,109 | ||||||
|
| |||||||
| Pharmaceuticals – 4.9% | ||||||||
| 4,901 | Bristol-Myers Squibb Co. | 281,170 | ||||||
| 84,818 | Johnson & Johnson | 11,199,369 | ||||||
| 135,233 | Mylan NV* | 2,589,712 | ||||||
| 207,979 | Pfizer, Inc. | 7,980,154 | ||||||
|
| |||||||
| 22,050,405 | ||||||||
|
| |||||||
| Professional Services – 0.1% | ||||||||
| 1,021 | CoStar Group, Inc.* | 561,060 | ||||||
|
| |||||||
| Road & Rail – 0.3% | ||||||||
| 20,986 | CSX Corp. | 1,474,686 | ||||||
|
| |||||||
| Semiconductors & Semiconductor Equipment – 2.1% | ||||||||
| 29,819 | Analog Devices, Inc. | 3,179,600 | ||||||
| 67,102 | Intel Corp. | 3,793,276 | ||||||
| 23,071 | Micron Technology, Inc.* | 1,097,026 | ||||||
| 12,958 | NXP Semiconductors NV (Netherlands) | 1,473,066 | ||||||
|
| |||||||
| 9,542,968 | ||||||||
|
| |||||||
| Software – 0.1% | ||||||||
| 1,817 | Intuit, Inc. | 467,878 | ||||||
|
| |||||||
| Specialty Retail – 2.3% | ||||||||
| 15,820 | AutoNation, Inc.* | 804,447 | ||||||
| 14,024 | CarMax, Inc.* | 1,306,616 | ||||||
| 35,148 | Home Depot, Inc. (The) | 8,245,018 | ||||||
| 11,907 | L Brands, Inc. | 202,895 | ||||||
|
| |||||||
| 10,558,976 | ||||||||
|
| |||||||
| Technology Hardware, Storage & Peripherals – 0.2% | ||||||||
| 43,222 | HP, Inc. | 750,766 | ||||||
|
| |||||||
| Tobacco – 1.9% | ||||||||
| 107,611 | Philip Morris International, Inc. | 8,763,840 | ||||||
|
| |||||||
| Common Stocks – (continued) | ||||||||
| Trading Companies & Distributors – 0.6% | ||||||||
| 66,871 | HD Supply Holdings, Inc.* | 2,644,079 | ||||||
|
| |||||||
| TOTAL INVESTMENTS – 99.1% | ||||||||
| (Cost $422,710,132) | $ | 449,006,001 | ||||||
|
| |||||||
| | OTHER ASSETS IN EXCESS OF LIABILITIES – 0.9% | 4,055,405 | ||||||
|
| |||||||
| NET ASSETS – 100.0% | $ | 453,061,406 | ||||||
|
| |||||||
| The percentage shown for each investment category reflects the value of investments in that category as a percentage of net assets. | ||
* | Non-income producing security. | |
| ||
Investment Abbreviations: | ||
PLC | —Public Limited Company | |
REIT | —Real Estate Investment Trust | |
| ||
| The accompanying notes are an integral part of these financial statements. | 35 |
GOLDMAN SACHS SMALL CAP EQUITY INSIGHTS FUND
Schedule of Investments
October 31, 2019
| Shares | Description | Value | ||||||
| Common Stocks – 97.1% | ||||||||
| Aerospace & Defense – 0.9% | ||||||||
| 55,720 | Aerojet Rocketdyne Holdings, Inc.* | $ | 2,408,775 | |||||
| 61,154 | Astronics Corp.* | 1,769,797 | ||||||
| 2,839 | Ducommun, Inc.* | 140,758 | ||||||
| 28,795 | Kratos Defense & Security Solutions, Inc.* | 543,650 | ||||||
| 9,116 | Mercury Systems, Inc.* | 671,484 | ||||||
| 7,904 | Moog, Inc., Class A | 661,644 | ||||||
|
| |||||||
| 6,196,108 | ||||||||
|
| |||||||
| Air Freight & Logistics – 0.6% | ||||||||
| 72,075 | Atlas Air Worldwide Holdings, Inc.* | 1,580,605 | ||||||
| 92,864 | Echo Global Logistics, Inc.* | 1,848,922 | ||||||
| 11,119 | Hub Group, Inc., Class A* | 509,250 | ||||||
| 47,374 | Radiant Logistics, Inc.* | 255,346 | ||||||
|
| |||||||
| 4,194,123 | ||||||||
|
| |||||||
| Airlines – 0.4% | ||||||||
| 1,971 | Allegiant Travel Co. | 329,807 | ||||||
| 36,418 | SkyWest, Inc. | 2,168,692 | ||||||
|
| |||||||
| 2,498,499 | ||||||||
|
| |||||||
| Auto Components – 0.2% | ||||||||
| 94,054 | American Axle & Manufacturing Holdings, Inc.* | 786,292 | ||||||
| 8,137 | Standard Motor Products, Inc. | 426,053 | ||||||
|
| |||||||
| 1,212,345 | ||||||||
|
| |||||||
| Banks – 11.3% | ||||||||
| 76,378 | 1st Source Corp. | 3,909,026 | ||||||
| 47,786 | Amalgamated Bank, Class A | 870,183 | ||||||
| 57,948 | Atlantic Capital Bancshares, Inc.* | 1,080,730 | ||||||
| 90,848 | Bancorp, Inc. (The)* | 990,243 | ||||||
| 6,051 | Banner Corp. | 326,633 | ||||||
| 99,849 | Boston Private Financial Holdings, Inc. | 1,123,301 | ||||||
| 3,869 | Capital City Bank Group, Inc. | 110,073 | ||||||
| 26,700 | Cathay General Bancorp | 949,719 | ||||||
| 157,873 | CenterState Bank Corp. | 4,003,659 | ||||||
| 127,529 | Central Pacific Financial Corp. | 3,688,139 | ||||||
| 1,302 | Century Bancorp, Inc., Class A | 113,287 | ||||||
| 6,445 | Civista Bancshares, Inc. | 144,884 | ||||||
| 117,862 | Columbia Banking System, Inc. | 4,631,977 | ||||||
| 216,834 | CVB Financial Corp. | 4,505,811 | ||||||
| 138,566 | First BanCorp. | 1,457,714 | ||||||
| 102,203 | First Bancorp/Southern Pines NC | 3,858,163 | ||||||
| 243,190 | First Commonwealth Financial Corp. | 3,426,547 | ||||||
| 28,577 | First Financial Corp. | 1,253,673 | ||||||
| 148,243 | First Foundation, Inc. | 2,373,370 | ||||||
| 48,787 | First Internet Bancorp | 1,109,416 | ||||||
| 9,080 | First Midwest Bancorp, Inc. | 186,503 | ||||||
| 5,173 | Hanmi Financial Corp. | 99,580 | ||||||
| 87,526 | Heartland Financial USA, Inc. | 4,094,466 | ||||||
| 3,942 | Heritage Financial Corp. | 108,523 | ||||||
| 175,490 | Hilltop Holdings, Inc. | 4,099,446 | ||||||
| 10,385 | Hope Bancorp, Inc. | 148,194 | ||||||
| 31,290 | Horizon Bancorp, Inc. | 571,199 | ||||||
| 16,858 | IBERIABANK Corp. | 1,237,209 | ||||||
|
| |||||||
| Common Stocks – (continued) | ||||||||
| Banks – (continued) | ||||||||
| 10,313 | Independent Bank Corp. | 232,146 | ||||||
| 8,678 | Independent Bank Group, Inc. | 464,013 | ||||||
| 112,165 | International Bancshares Corp. | 4,594,278 | ||||||
| 311,640 | Investors Bancorp, Inc. | 3,755,262 | ||||||
| 20,441 | Lakeland Bancorp, Inc. | 338,299 | ||||||
| 12,469 | Metropolitan Bank Holding Corp.* | 535,419 | ||||||
| 101,433 | National Bank Holdings Corp., Class A | 3,489,295 | ||||||
| 7,903 | NBT Bancorp, Inc. | 314,144 | ||||||
| 5,851 | Northeast Bank | 125,270 | ||||||
| 10,360 | OFG Bancorp | 210,412 | ||||||
| 30,825 | Old National Bancorp | 554,696 | ||||||
| 43,691 | Pacific Premier Bancorp, Inc. | 1,474,790 | ||||||
| 15,776 | Preferred Bank | 841,019 | ||||||
| 7,962 | Sandy Spring Bancorp, Inc. | 274,689 | ||||||
| 120,461 | Seacoast Banking Corp. of Florida* | 3,372,908 | ||||||
| 20,768 | Sierra Bancorp | 565,720 | ||||||
| 51,705 | Southern National Bancorp of Virginia, Inc. | 819,007 | ||||||
| 4,535 | Spirit of Texas Bancshares, Inc.* | 94,782 | ||||||
| 83,173 | TriCo Bancshares | 3,129,800 | ||||||
| 28,771 | UMB Financial Corp. | 1,877,595 | ||||||
| 19,662 | Univest Financial Corp. | 506,297 | ||||||
| 38,486 | WesBanco, Inc. | 1,446,689 | ||||||
|
| |||||||
| 79,488,198 | ||||||||
|
| |||||||
| Beverages – 0.5% | ||||||||
| 14,173 | Coca-Cola Consolidated, Inc. | 3,888,504 | ||||||
|
| |||||||
| Biotechnology – 7.1% | ||||||||
| 65,898 | ACADIA Pharmaceuticals, Inc.* | 2,794,734 | ||||||
| 27,742 | Acceleron Pharma, Inc.* | 1,244,784 | ||||||
| 55,867 | Anika Therapeutics, Inc.* | 3,932,478 | ||||||
| 22,122 | Arena Pharmaceuticals, Inc.* | 1,077,673 | ||||||
| 52,208 | Arrowhead Pharmaceuticals, Inc.* | 2,090,930 | ||||||
| 44,053 | Avid Bioservices, Inc.* | 235,684 | ||||||
| 14,052 | BioSpecifics Technologies Corp.* | 680,538 | ||||||
| 5,493 | Blueprint Medicines Corp.* | 378,138 | ||||||
| 62,139 | CareDx, Inc.* | 1,628,663 | ||||||
| 231,081 | Catalyst Pharmaceuticals, Inc.* | 1,093,013 | ||||||
| 153,947 | Coherus Biosciences, Inc.* | 2,674,059 | ||||||
| 10,691 | Dicerna Pharmaceuticals, Inc.* | 176,295 | ||||||
| 12,632 | Eagle Pharmaceuticals, Inc.* | 792,026 | ||||||
| 18,919 | Editas Medicine, Inc.* | 394,272 | ||||||
| 8,708 | Emergent BioSolutions, Inc.* | 497,749 | ||||||
| 46,540 | Enanta Pharmaceuticals, Inc.* | 2,833,355 | ||||||
| 37,284 | Esperion Therapeutics, Inc.* | 1,482,785 | ||||||
| 72,438 | FibroGen, Inc.* | 2,835,948 | ||||||
| 7,141 | G1 Therapeutics, Inc.* | 151,532 | ||||||
| 6,783 | Global Blood Therapeutics, Inc.* | 325,245 | ||||||
| 227,787 | Halozyme Therapeutics, Inc.* | 3,489,697 | ||||||
| 12,454 | Heron Therapeutics, Inc.* | 264,648 | ||||||
| 35,870 | Immunomedics, Inc.* | 573,920 | ||||||
| 3,723 | Intercept Pharmaceuticals, Inc.* | 270,960 | ||||||
| 53,510 | Ironwood Pharmaceuticals, Inc.* | 537,240 | ||||||
| 3,601 | Mirati Therapeutics, Inc.* | 339,142 | ||||||
| 12,036 | Momenta Pharmaceuticals, Inc.* | 186,317 | ||||||
| 8,863 | Natera, Inc.* | 341,403 | ||||||
|
| |||||||
| 36 | The accompanying notes are an integral part of these financial statements. |
GOLDMAN SACHS SMALL CAP EQUITY INSIGHTS FUND
| Shares | Description | Value | ||||||
| Common Stocks – (continued) | ||||||||
| Biotechnology – (continued) | ||||||||
| 75,572 | PDL BioPharma, Inc.* | $ | 213,113 | |||||
| 63,521 | Portola Pharmaceuticals, Inc.* | 1,836,392 | ||||||
| 86,332 | Prothena Corp. PLC (Ireland)* | 785,621 | ||||||
| 15,232 | PTC Therapeutics, Inc.* | 622,837 | ||||||
| 23,193 | Puma Biotechnology, Inc.* | 157,712 | ||||||
| 141,899 | Radius Health, Inc.* | 4,035,608 | ||||||
| 43,369 | Repligen Corp.* | 3,447,402 | ||||||
| 148,452 | Vanda Pharmaceuticals, Inc.* | 2,005,587 | ||||||
| 75,675 | Veracyte, Inc.* | 1,735,228 | ||||||
| 68,873 | Voyager Therapeutics, Inc.* | 1,059,955 | ||||||
| 26,888 | Xencor, Inc.* | 919,839 | ||||||
|
| |||||||
| 50,142,522 | ||||||||
|
| |||||||
| Building Products – 3.0% | ||||||||
| 192,209 | Builders FirstSource, Inc.* | 4,345,845 | ||||||
| 145,644 | Continental Building Products, Inc.* | 4,356,212 | ||||||
| 15,200 | CSW Industrials, Inc. | 1,052,144 | ||||||
| 24,170 | Gibraltar Industries, Inc.* | 1,286,569 | ||||||
| 37,947 | Griffon Corp. | 808,651 | ||||||
| 104,703 | JELD-WEN Holding, Inc.* | 1,789,374 | ||||||
| 69,415 | Quanex Building Products Corp. | 1,339,015 | ||||||
| 62,565 | Simpson Manufacturing Co., Inc. | 5,170,372 | ||||||
| 13,649 | Universal Forest Products, Inc. | 687,364 | ||||||
|
| |||||||
| 20,835,546 | ||||||||
|
| |||||||
| Capital Markets – 0.9% | ||||||||
| 26,090 | Artisan Partners Asset Management, Inc., Class A | 713,561 | ||||||
| 78,079 | Brightsphere Investment Group, Inc. | 766,736 | ||||||
| 9,716 | INTL. FCStone, Inc.* | 388,640 | ||||||
| 8,228 | Moelis & Co., Class A | 293,575 | ||||||
| 63,578 | Oppenheimer Holdings, Inc., Class A | 1,729,322 | ||||||
| 23,234 | Piper Jaffray Cos. | 1,824,798 | ||||||
| 4,571 | Virtus Investment Partners, Inc. | 495,862 | ||||||
| 9,764 | Westwood Holdings Group, Inc. | 295,166 | ||||||
|
| |||||||
| 6,507,660 | ||||||||
|
| |||||||
| Chemicals – 2.3% | ||||||||
| 12,801 | Chase Corp. | 1,499,637 | ||||||
| 339,032 | Ferro Corp.* | 3,773,426 | ||||||
| 35,004 | Innophos Holdings, Inc. | 1,141,831 | ||||||
| 17,945 | Innospec, Inc. | 1,639,455 | ||||||
| 6,508 | Kraton Corp.* | 145,909 | ||||||
| 68,895 | Minerals Technologies, Inc. | 3,406,858 | ||||||
| 133,523 | PolyOne Corp. | 4,279,412 | ||||||
| 11,003 | Trinseo SA | 467,628 | ||||||
|
| |||||||
| 16,354,156 | ||||||||
|
| |||||||
| Commercial Services & Supplies – 1.8% | ||||||||
| 26,783 | Covanta Holding Corp. | 386,747 | ||||||
| 11,624 | Ennis, Inc. | 227,714 | ||||||
| 75,008 | HNI Corp. | 2,850,304 | ||||||
| 15,443 | Interface, Inc. | 256,817 | ||||||
| 44,688 | Kimball International, Inc., Class B | 909,848 | ||||||
| 45,570 | Knoll, Inc. | 1,218,542 | ||||||
| 7,468 | Matthews International Corp., Class A | 276,167 | ||||||
|
| |||||||
| Common Stocks – (continued) | ||||||||
| Commercial Services & Supplies – (continued) | ||||||||
| 42,287 | McGrath RentCorp | 3,226,921 | ||||||
| 28,933 | Steelcase, Inc., Class A | 505,459 | ||||||
| 14,061 | UniFirst Corp. | 2,824,011 | ||||||
|
| |||||||
| 12,682,530 | ||||||||
|
| |||||||
| Communications Equipment – 1.5% | ||||||||
| 59,494 | Comtech Telecommunications Corp. | 2,079,315 | ||||||
| 24,051 | Extreme Networks, Inc.* | 154,889 | ||||||
| 47,755 | Lumentum Holdings, Inc.* | 2,992,328 | ||||||
| 319,000 | Viavi Solutions, Inc.* | 5,091,240 | ||||||
|
| |||||||
| 10,317,772 | ||||||||
|
| |||||||
| Construction & Engineering – 0.6% | ||||||||
| 44,373 | Aegion Corp.* | 961,563 | ||||||
| 141,489 | Great Lakes Dredge & Dock Corp.* | 1,521,007 | ||||||
| 27,736 | MasTec, Inc.* | 1,745,704 | ||||||
|
| |||||||
| 4,228,274 | ||||||||
|
| |||||||
| Consumer Finance – 0.4% | ||||||||
| 111,080 | Enova International, Inc.* | 2,609,269 | ||||||
| 3,854 | Nelnet, Inc., Class A | 236,135 | ||||||
| 6,886 | Regional Management Corp.* | 199,212 | ||||||
|
| |||||||
| 3,044,616 | ||||||||
|
| |||||||
| Distributors – 0.1% | ||||||||
| 25,524 | Core-Mark Holding Co., Inc. | 778,992 | ||||||
|
| |||||||
| Diversified Consumer Services – 1.0% | ||||||||
| 21,979 | American Public Education, Inc.* | 477,384 | ||||||
| 27,006 | Carriage Services, Inc. | 695,675 | ||||||
| 14,499 | Collectors Universe, Inc. | 415,541 | ||||||
| 32,151 | K12, Inc.* | 636,268 | ||||||
| 247,747 | Laureate Education, Inc., Class A* | 3,828,930 | ||||||
| 20,115 | WW International, Inc.* | 701,410 | ||||||
|
| |||||||
| 6,755,208 | ||||||||
|
| |||||||
| Diversified Financial Services – 0.4% | ||||||||
| 47,323 | Banco Latinoamericano de Comercio Exterior SA, Class E (Panama) | 976,273 | ||||||
| 3,947 | Cannae Holdings, Inc.* | 115,252 | ||||||
| 188,454 | FGL Holdings | 1,701,740 | ||||||
| 67,389 | On Deck Capital, Inc.* | 300,555 | ||||||
|
| |||||||
| 3,093,820 | ||||||||
|
| |||||||
| Diversified Telecommunication Services – 0.9% | ||||||||
| 75,361 | Cogent Communications Holdings, Inc. | 4,419,169 | ||||||
| 18,137 | Iridium Communications, Inc.* | 443,812 | ||||||
| 376,401 | ORBCOMM, Inc.* | 1,509,368 | ||||||
|
| |||||||
| 6,372,349 | ||||||||
|
| |||||||
| Electric Utilities – 0.2% | ||||||||
| 8,951 | Otter Tail Corp. | 507,343 | ||||||
| 11,558 | Portland General Electric Co. | 657,419 | ||||||
|
| |||||||
| 1,164,762 | ||||||||
|
| |||||||
| Electrical Equipment – 0.4% | ||||||||
| 36,339 | Atkore International Group, Inc.* | 1,260,963 | ||||||
|
| |||||||
| The accompanying notes are an integral part of these financial statements. | 37 |
GOLDMAN SACHS SMALL CAP EQUITY INSIGHTS FUND
Schedule of Investments(continued)
October 31, 2019
| Shares | Description | Value | ||||||
| Common Stocks – (continued) | ||||||||
| Electrical Equipment – (continued) | ||||||||
| 14,624 | Encore Wire Corp. | $ | 821,869 | |||||
| 7,465 | Powell Industries, Inc. | 292,329 | ||||||
| 5,078 | Thermon Group Holdings, Inc.* | 121,009 | ||||||
|
| |||||||
| 2,496,170 | ||||||||
|
| |||||||
| Electronic Equipment, Instruments & Components – 5.2% | ||||||||
| 31,946 | AVX Corp. | 489,413 | ||||||
| 23,980 | Badger Meter, Inc. | 1,386,044 | ||||||
| 44,667 | Belden, Inc. | 2,290,524 | ||||||
| 127,725 | Benchmark Electronics, Inc. | 4,329,877 | ||||||
| 41,548 | CTS Corp. | 1,108,501 | ||||||
| 29,221 | Fabrinet (Thailand)* | 1,643,097 | ||||||
| 108,928 | II-VI, Inc.* | 3,610,963 | ||||||
| 34,057 | Itron, Inc.* | 2,597,187 | ||||||
| 12,716 | Knowles Corp.* | 274,411 | ||||||
| 38,414 | PC Connection, Inc. | 1,876,140 | ||||||
| 16,149 | Rogers Corp.* | 2,187,866 | ||||||
| 134,092 | Sanmina Corp.* | 4,120,647 | ||||||
| 26,823 | Tech Data Corp.* | 3,258,994 | ||||||
| 25,484 | TTM Technologies, Inc.* | 298,418 | ||||||
| 244,957 | Vishay Intertechnology, Inc. | 4,935,884 | ||||||
| 57,939 | Vishay Precision Group, Inc.* | 1,972,823 | ||||||
|
| |||||||
| 36,380,789 | ||||||||
|
| |||||||
| Energy Equipment & Services – 1.0% | ||||||||
| 7,914 | Era Group, Inc.* | 76,528 | ||||||
| 85,991 | Matrix Service Co.* | 1,613,191 | ||||||
| 253,670 | Nabors Industries Ltd. | 469,290 | ||||||
| 106,356 | Oceaneering International, Inc.* | 1,506,001 | ||||||
| 79,829 | SEACOR Holdings, Inc.* | 3,425,462 | ||||||
| 25,947 | US Silica Holdings, Inc. | 115,724 | ||||||
|
| |||||||
| 7,206,196 | ||||||||
|
| |||||||
| Entertainment – 0.1% | ||||||||
| 34,593 | Glu Mobile, Inc.* | 205,137 | ||||||
| 24,583 | IMAX Corp.* | 524,847 | ||||||
|
| |||||||
| 729,984 | ||||||||
|
| |||||||
| Equity Real Estate Investment Trusts (REITs) – 7.3% | ||||||||
| 173,825 | Cedar Realty Trust, Inc. REIT | 580,575 | ||||||
| 3,021 | EastGroup Properties, Inc. REIT | 404,663 | ||||||
| 140,024 | First Industrial Realty Trust, Inc. REIT | 5,896,411 | ||||||
| 96,728 | Gladstone Commercial Corp. REIT | 2,278,912 | ||||||
| 85,662 | Independence Realty Trust, Inc. REIT | 1,319,195 | ||||||
| 17,079 | Investors Real Estate Trust REIT | 1,292,368 | ||||||
| 414,202 | Lexington Realty Trust REIT | 4,506,518 | ||||||
| 113,623 | National Storage Affiliates Trust REIT | 3,882,498 | ||||||
| 74,293 | NexPoint Residential Trust, Inc. REIT | 3,623,270 | ||||||
| 93,232 | Physicians Realty Trust REIT | 1,740,641 | ||||||
| 178,930 | Piedmont Office Realty Trust, Inc., Class A REIT | 4,015,189 | ||||||
| 24,061 | PS Business Parks, Inc. REIT | 4,344,213 | ||||||
| 54,562 | Retail Value, Inc. REIT | 1,997,515 | ||||||
| 122,793 | Rexford Industrial Realty, Inc. REIT | 5,905,115 | ||||||
| 106,880 | RPT Realty REIT | 1,549,760 | ||||||
| 88,304 | STAG Industrial, Inc. REIT | 2,740,956 | ||||||
|
| |||||||
| Common Stocks – (continued) | ||||||||
| Equity Real Estate Investment Trusts (REITs) – (continued) | ||||||||
| 97,048 | Terreno Realty Corp. REIT | 5,474,478 | ||||||
|
| |||||||
| 51,552,277 | ||||||||
|
| |||||||
| Food & Staples Retailing – 0.2% | ||||||||
| 11,307 | Ingles Markets, Inc., Class A | 445,835 | ||||||
| 21,226 | SpartanNash Co. | 277,954 | ||||||
| 23,153 | Village Super Market, Inc., Class A | 613,555 | ||||||
|
| |||||||
| 1,337,344 | ||||||||
|
| |||||||
| Food Products – 2.5% | ||||||||
| 241,684 | Darling Ingredients, Inc.* | 4,664,501 | ||||||
| 8,112 | Freshpet, Inc.* | 423,933 | ||||||
| 24,602 | J&J Snack Foods Corp. | 4,693,078 | ||||||
| 22,782 | John B Sanfilippo & Son, Inc. | 2,417,626 | ||||||
| 15,489 | Lancaster Colony Corp. | 2,155,759 | ||||||
| 17,863 | Sanderson Farms, Inc. | 2,765,371 | ||||||
| 20,456 | Simply Good Foods Co. (The)* | 501,990 | ||||||
|
| |||||||
| 17,622,258 | ||||||||
|
| |||||||
| Health Care Equipment & Supplies – 3.0% | ||||||||
| 9,987 | Cardiovascular Systems, Inc.* | 444,621 | ||||||
| 57,515 | GenMark Diagnostics, Inc.* | 322,659 | ||||||
| 21,202 | Haemonetics Corp.* | 2,559,718 | ||||||
| 57,105 | Integer Holdings Corp.* | 4,422,211 | ||||||
| 36,413 | Invacare Corp. | 281,108 | ||||||
| 6,265 | Mesa Laboratories, Inc. | 1,426,854 | ||||||
| 17,552 | Natus Medical, Inc.* | 591,151 | ||||||
| 35,145 | Novocure Ltd.* | 2,517,788 | ||||||
| 67,759 | NuVasive, Inc.* | 4,779,720 | ||||||
| 20,890 | Surmodics, Inc.* | 992,484 | ||||||
| 41,208 | Tandem Diabetes Care, Inc.* | 2,537,589 | ||||||
| 13,843 | Varex Imaging Corp.* | 415,428 | ||||||
|
| |||||||
| 21,291,331 | ||||||||
|
| |||||||
| Health Care Providers & Services – 1.4% | ||||||||
| 255,645 | Brookdale Senior Living, Inc.* | 1,878,991 | ||||||
| 167,627 | Community Health Systems, Inc.* | 593,399 | ||||||
| 52,661 | Cross Country Healthcare, Inc.* | 569,265 | ||||||
| 26,112 | Ensign Group, Inc. (The) | 1,103,232 | ||||||
| 5,106 | LHC Group, Inc.* | 566,613 | ||||||
| 12,523 | Magellan Health, Inc.* | 812,743 | ||||||
| 7,936 | Providence Service Corp. (The)* | 506,872 | ||||||
| 41,246 | R1 RCM, Inc.* | 438,445 | ||||||
| 100,590 | Tenet Healthcare Corp.* | 2,548,951 | ||||||
| 64,764 | Triple-S Management Corp., Class B* | 979,879 | ||||||
|
| |||||||
| 9,998,390 | ||||||||
|
| |||||||
| Health Care Technology – 1.0% | ||||||||
| 9,417 | Computer Programs & Systems, Inc. | 217,250 | ||||||
| 74,273 | HMS Holdings Corp.* | 2,427,984 | ||||||
| 59,094 | Omnicell, Inc.* | 4,159,627 | ||||||
|
| |||||||
| 6,804,861 | ||||||||
|
| |||||||
| Hotels, Restaurants & Leisure – 2.3% | ||||||||
| 67,103 | Brinker International, Inc. | 2,982,728 | ||||||
| 182,983 | Denny’s Corp.* | 3,681,618 | ||||||
|
| |||||||
| 38 | The accompanying notes are an integral part of these financial statements. |
GOLDMAN SACHS SMALL CAP EQUITY INSIGHTS FUND
| Shares | Description | Value | ||||||
| Common Stocks – (continued) | ||||||||
| Hotels, Restaurants & Leisure – (continued) | ||||||||
| 12,138 | Fiesta Restaurant Group, Inc.* | $ | 104,326 | |||||
| 8,551 | PlayAGS, Inc.* | 98,679 | ||||||
| 61,568 | Scientific Games Corp.* | 1,477,016 | ||||||
| 119,857 | SeaWorld Entertainment, Inc.* | 3,166,622 | ||||||
| 52,702 | Wingstop, Inc. | 4,396,928 | ||||||
|
| |||||||
| 15,907,917 | ||||||||
|
| |||||||
| Household Durables – 2.8% | ||||||||
| 24,287 | Bassett Furniture Industries, Inc. | 370,377 | ||||||
| 42,018 | Installed Building Products, Inc.* | 2,740,414 | ||||||
| 115,120 | KB Home | 4,108,633 | ||||||
| 34,451 | M/I Homes, Inc.* | 1,522,045 | ||||||
| 46,602 | Taylor Morrison Home Corp.* | 1,167,380 | ||||||
| 47,609 | TopBuild Corp.* | 4,948,003 | ||||||
| 278,274 | TRI Pointe Group, Inc.* | 4,380,033 | ||||||
| 11,231 | Universal Electronics, Inc.* | 585,360 | ||||||
|
| |||||||
| 19,822,245 | ||||||||
|
| |||||||
| Independent Power and Renewable Electricity Producers – 0.4% | ||||||||
| 34,234 | Clearway Energy, Inc., Class C | 620,662 | ||||||
| 25,805 | Ormat Technologies, Inc. | 1,975,631 | ||||||
|
| |||||||
| 2,596,293 | ||||||||
|
| |||||||
| Industrial Conglomerates – 0.0% | ||||||||
| 6,661 | Raven Industries, Inc. | 232,336 | ||||||
|
| |||||||
| Insurance – 2.7% | ||||||||
| 180,024 | American Equity Investment Life Holding Co. | 4,442,992 | ||||||
| 58,243 | AMERISAFE, Inc. | 3,700,178 | ||||||
| 61,756 | Argo Group International Holdings Ltd. | 3,820,844 | ||||||
| 18,908 | FBL Financial Group, Inc., Class A | 1,084,941 | ||||||
| 166,041 | Genworth Financial, Inc., Class A* | 710,656 | ||||||
| 10,227 | Goosehead Insurance, Inc., Class A | 523,418 | ||||||
| 74,594 | MBIA, Inc.* | 692,978 | ||||||
| 37,479 | National General Holdings Corp. | 799,052 | ||||||
| 1,889 | National Western Life Group, Inc., Class A | 514,941 | ||||||
| 59,439 | Stewart Information Services Corp. | 2,432,244 | ||||||
|
| |||||||
| 18,722,244 | ||||||||
|
| |||||||
| Interactive Media & Services – 0.6% | ||||||||
| 283,668 | Cars.com, Inc.* | 3,208,285 | ||||||
| 84,828 | Liberty TripAdvisor Holdings, Inc., Class A* | 818,590 | ||||||
| 6,070 | QuinStreet, Inc.* | 77,878 | ||||||
|
| |||||||
| 4,104,753 | ||||||||
|
| |||||||
| Internet & Direct Marketing Retail – 0.2% | ||||||||
| 38,363 | Groupon, Inc.* | 106,649 | ||||||
| 48,407 | Lands’ End, Inc.* | 584,273 | ||||||
| 14,328 | Shutterstock, Inc.* | 581,430 | ||||||
| 2,623 | Stamps.com, Inc.* | 221,460 | ||||||
|
| |||||||
| 1,493,812 | ||||||||
|
| |||||||
| IT Services – 0.9% | ||||||||
| 8,104 | Cardtronics PLC, Class A* | 277,643 | ||||||
|
| |||||||
| Common Stocks – (continued) | ||||||||
| IT Services – (continued) | ||||||||
| 6,848 | Cass Information Systems, Inc. | 392,459 | ||||||
| 2,833 | MAXIMUS, Inc. | 217,404 | ||||||
| 192,401 | Perspecta, Inc. | 5,106,323 | ||||||
| 2,760 | Sykes Enterprises, Inc.* | 85,270 | ||||||
| 23,365 | Unisys Corp.* | 239,725 | ||||||
|
| |||||||
| 6,318,824 | ||||||||
|
| |||||||
| Leisure Products – 0.4% | ||||||||
| 166,171 | American Outdoor Brands Corp.* | 1,176,491 | ||||||
| 6,293 | Johnson Outdoors, Inc., Class A | 368,455 | ||||||
| 8,591 | Malibu Boats, Inc., Class A* | 280,238 | ||||||
| 39,775 | MasterCraft Boat Holdings, Inc.* | 626,456 | ||||||
| 83,868 | Vista Outdoor, Inc.* | 561,916 | ||||||
|
| |||||||
| 3,013,556 | ||||||||
|
| |||||||
| Life Sciences Tools & Services – 0.3% | ||||||||
| 16,723 | Fluidigm Corp.* | 82,277 | ||||||
| 31,559 | Medpace Holdings, Inc.* | 2,323,689 | ||||||
|
| |||||||
| 2,405,966 | ||||||||
|
| |||||||
| Machinery – 4.0% | ||||||||
| 51,871 | Albany International Corp., Class A | 4,356,127 | ||||||
| 5,258 | Barnes Group, Inc. | 307,330 | ||||||
| 37,846 | Columbus McKinnon Corp. | 1,419,982 | ||||||
| 29,436 | EnPro Industries, Inc. | 2,047,274 | ||||||
| 20,325 | Evoqua Water Technologies Corp.* | 353,045 | ||||||
| 10,594 | Federal Signal Corp. | 343,669 | ||||||
| 30,611 | Franklin Electric Co., Inc. | 1,648,402 | ||||||
| 72,840 | Hillenbrand, Inc. | 2,242,744 | ||||||
| 10,938 | Hurco Cos, Inc. | 380,533 | ||||||
| 82,881 | Kennametal, Inc. | 2,565,167 | ||||||
| 12,433 | Miller Industries, Inc. | 446,966 | ||||||
| 52,087 | Mueller Industries, Inc. | 1,602,717 | ||||||
| 62,104 | Navistar International Corp.* | 1,942,613 | ||||||
| 14,616 | Rexnord Corp.* | 413,487 | ||||||
| 93,701 | TriMas Corp.* | 3,028,416 | ||||||
| 31,329 | Wabash National Corp. | 446,752 | ||||||
| 47,230 | Watts Water Technologies, Inc., Class A | 4,404,197 | ||||||
|
| |||||||
| 27,949,421 | ||||||||
|
| |||||||
| Marine – 0.1% | ||||||||
| 26,026 | Matson, Inc. | 993,673 | ||||||
|
| |||||||
| Media – 1.2% | ||||||||
| 26,639 | Liberty Latin America Ltd., Class A (Chile)* | 497,883 | ||||||
| 6,853 | Loral Space & Communications, Inc.* | 274,051 | ||||||
| 107,691 | Meredith Corp. | 4,059,951 | ||||||
| 97,514 | MSG Networks, Inc., Class A* | 1,580,702 | ||||||
| 153,556 | New Media Investment Group, Inc.(a) | 1,352,828 | ||||||
| 24,025 | TechTarget, Inc.* | 586,210 | ||||||
| 18,160 | WideOpenWest, Inc.* | 115,316 | ||||||
|
| |||||||
| 8,466,941 | ||||||||
|
| |||||||
| Metals & Mining – 1.4% | ||||||||
| 58,083 | Carpenter Technology Corp. | 2,847,229 | ||||||
| 37,235 | Haynes International, Inc. | 1,283,118 | ||||||
|
| |||||||
| The accompanying notes are an integral part of these financial statements. | 39 |
GOLDMAN SACHS SMALL CAP EQUITY INSIGHTS FUND
Schedule of Investments(continued)
October 31, 2019
| Shares | Description | Value | ||||||
| Common Stocks – (continued) | ||||||||
| Metals & Mining – (continued) | ||||||||
| 22,064 | Kaiser Aluminum Corp. | $ | 2,362,613 | |||||
| 53,860 | Materion Corp. | 3,061,402 | ||||||
| 11,243 | Worthington Industries, Inc. | 413,855 | ||||||
|
| |||||||
| 9,968,217 | ||||||||
|
| |||||||
| Mortgage Real Estate Investment Trusts (REITs) – 0.1% | ||||||||
| 308,754 | Anworth Mortgage Asset Corp. REIT | 1,055,939 | ||||||
|
| |||||||
| Multiline Retail – 0.3% | ||||||||
| 106,224 | Big Lots, Inc. | 2,301,874 | ||||||
|
| |||||||
| Multi-Utilities – 0.4% | ||||||||
| 45,545 | Unitil Corp. | 2,836,087 | ||||||
|
| |||||||
| Oil, Gas & Consumable Fuels – 4.1% | ||||||||
| 59,923 | Ardmore Shipping Corp. (Ireland)* | 478,785 | ||||||
| 74,038 | Clean Energy Fuels Corp.* | 166,585 | ||||||
| 91,135 | CVR Energy, Inc. | 4,321,622 | ||||||
| 117,394 | Delek US Holdings, Inc. | 4,689,890 | ||||||
| 154,057 | Denbury Resources, Inc.* | 153,764 | ||||||
| 420,712 | DHT Holdings, Inc. | 3,252,104 | ||||||
| 173,755 | GasLog Ltd. (Monaco) | 2,382,181 | ||||||
| 115,473 | Golar LNG Ltd. (Bermuda) | 1,590,063 | ||||||
| 97,177 | International Seaways, Inc.* | 2,443,030 | ||||||
| 86,211 | PDC Energy, Inc.* | 1,719,909 | ||||||
| 123,060 | Scorpio Tankers, Inc. (Monaco) | 3,914,539 | ||||||
| 18,161 | Teekay Corp. (Bermuda)(a) | 92,803 | ||||||
| 86,921 | World Fuel Services Corp. | 3,630,690 | ||||||
|
| |||||||
| 28,835,965 | ||||||||
|
| |||||||
| Paper & Forest Products – 0.6% | ||||||||
| 87,726 | Boise Cascade Co. | 3,137,959 | ||||||
| 79,126 | PH Glatfelter Co. | 1,424,268 | ||||||
|
| |||||||
| 4,562,227 | ||||||||
|
| |||||||
| Personal Products – 0.1% | ||||||||
| 15,432 | elf Beauty, Inc.* | 259,258 | ||||||
| 5,858 | Inter Parfums, Inc. | 453,585 | ||||||
|
| |||||||
| 712,843 | ||||||||
|
| |||||||
| Pharmaceuticals – 1.9% | ||||||||
| 53,806 | Amphastar Pharmaceuticals, Inc.* | 1,039,263 | ||||||
| 49,122 | ANI Pharmaceuticals, Inc.* | 3,836,920 | ||||||
| 165,137 | Endo International PLC* | 757,979 | ||||||
| 81,794 | Mallinckrodt PLC*(a) | 258,469 | ||||||
| 61,918 | Phibro Animal Health Corp., Class A | 1,483,555 | ||||||
| 111,333 | Prestige Consumer Healthcare, Inc.* | 3,947,868 | ||||||
| 82,499 | Supernus Pharmaceuticals, Inc.* | 2,292,647 | ||||||
|
| |||||||
| 13,616,701 | ||||||||
|
| |||||||
| Professional Services – 2.4% | ||||||||
| 11,405 | Barrett Business Services, Inc. | 1,000,561 | ||||||
| 12,552 | CRA International, Inc. | 618,186 | ||||||
| 25,931 | Heidrick & Struggles International, Inc. | 737,996 | ||||||
| 36,377 | Insperity, Inc. | 3,842,502 | ||||||
| 87,701 | Kforce, Inc. | 3,587,848 | ||||||
| 58,433 | Korn Ferry | 2,143,907 | ||||||
|
| |||||||
| Common Stocks – (continued) | ||||||||
| Professional Services – (continued) | ||||||||
| 37,036 | Resources Connection, Inc. | 542,577 | ||||||
| 54,311 | TriNet Group, Inc.* | 2,877,940 | ||||||
| 77,324 | TrueBlue, Inc.* | 1,770,720 | ||||||
|
| |||||||
| 17,122,237 | ||||||||
|
| |||||||
| Road & Rail – 0.8% | ||||||||
| 20,237 | Avis Budget Group, Inc.* | 601,241 | ||||||
| 30,105 | Covenant Transportation Group, Inc., Class A* | 462,714 | ||||||
| 91,525 | Heartland Express, Inc. | 1,912,873 | ||||||
| 105,678 | Marten Transport Ltd. | 2,288,985 | ||||||
| 15,057 | Werner Enterprises, Inc. | 549,581 | ||||||
|
| |||||||
| 5,815,394 | ||||||||
|
| |||||||
| Semiconductors & Semiconductor Equipment – 2.8% | ||||||||
| 15,733 | Ambarella, Inc.* | 828,028 | ||||||
| 165,640 | Amkor Technology, Inc.* | 2,058,905 | ||||||
| 10,451 | Cirrus Logic, Inc.* | 710,250 | ||||||
| 19,073 | Diodes, Inc.* | 889,755 | ||||||
| 57,599 | Inphi Corp.* | 4,140,216 | ||||||
| 141,674 | Lattice Semiconductor Corp.* | 2,775,394 | ||||||
| 46,079 | MaxLinear, Inc.* | 873,658 | ||||||
| 115,211 | NeoPhotonics Corp.* | 758,088 | ||||||
| 313,700 | Rambus, Inc.* | 4,343,177 | ||||||
| 33,964 | Veeco Instruments, Inc.* | 463,269 | ||||||
| 97,355 | Xperi Corp. | 1,976,793 | ||||||
|
| |||||||
| 19,817,533 | ||||||||
|
| |||||||
| Software – 2.1% | ||||||||
| 11,150 | American Software, Inc., Class A | 180,742 | ||||||
| 83,775 | Bottomline Technologies DE, Inc.* | 3,430,586 | ||||||
| 9,185 | Box, Inc., Class A* | 155,410 | ||||||
| 35,529 | CommVault Systems, Inc.* | 1,764,725 | ||||||
| 17,778 | Cornerstone OnDemand, Inc.* | 1,041,257 | ||||||
| 84,727 | Digital Turbine, Inc.* | 592,242 | ||||||
| 22,907 | Five9, Inc.* | 1,271,568 | ||||||
| 2,062 | MicroStrategy, Inc., Class A* | 316,002 | ||||||
| 74,571 | MobileIron, Inc.* | 466,814 | ||||||
| 28,909 | Progress Software Corp. | 1,152,891 | ||||||
| 9,419 | QAD, Inc., Class A | 437,795 | ||||||
| 60,867 | SPS Commerce, Inc.* | 3,211,952 | ||||||
| 35,699 | Telenav, Inc.* | 168,142 | ||||||
| 64,052 | TiVo Corp. | 521,383 | ||||||
|
| |||||||
| 14,711,509 | ||||||||
|
| |||||||
| Specialty Retail – 4.0% | ||||||||
| 15,783 | America’s Car-Mart, Inc.* | 1,436,095 | ||||||
| 41,431 | Asbury Automotive Group, Inc.* | 4,272,779 | ||||||
| 26,814 | Boot Barn Holdings, Inc.* | 939,831 | ||||||
| 45,069 | Cato Corp. (The), Class A | 788,257 | ||||||
| 62,384 | Citi Trends, Inc. | 1,113,554 | ||||||
| 50,785 | Genesco, Inc.* | 1,972,997 | ||||||
| 9,035 | Group 1 Automotive, Inc. | 898,440 | ||||||
| 12,045 | Hudson Ltd, Class A* | 149,599 | ||||||
| 46,784 | Michaels Cos., Inc. (The)* | 408,424 | ||||||
| 43,776 | Murphy USA, Inc.* | 5,162,504 | ||||||
|
| |||||||
| 40 | The accompanying notes are an integral part of these financial statements. |
GOLDMAN SACHS SMALL CAP EQUITY INSIGHTS FUND
| Shares | Description | Value | ||||||
| Common Stocks – (continued) | ||||||||
| Specialty Retail – (continued) | ||||||||
| 57,253 | Rent-A-Center, Inc. | $ | 1,481,135 | |||||
| 169,195 | Sally Beauty Holdings, Inc.* | 2,622,523 | ||||||
| 52,788 | Sleep Number Corp.* | 2,540,159 | ||||||
| 126,649 | Sonic Automotive, Inc., Class A | 4,081,897 | ||||||
| 41,866 | Tilly’s, Inc., Class A | 429,545 | ||||||
|
| |||||||
| 28,297,739 | ||||||||
|
| |||||||
| Textiles, Apparel & Luxury Goods – 1.0% | ||||||||
| 28,814 | Crocs, Inc.* | 1,008,202 | ||||||
| 20,980 | Deckers Outdoor Corp.* | 3,207,842 | ||||||
| 31,669 | Steven Madden Ltd. | 1,304,129 | ||||||
| 55,642 | Wolverine World Wide, Inc. | 1,651,455 | ||||||
|
| |||||||
| 7,171,628 | ||||||||
|
| |||||||
| Thrifts & Mortgage Finance – 1.1% | ||||||||
| 11,621 | First Defiance Financial Corp. | 359,322 | ||||||
| 9,341 | Meridian Bancorp, Inc. | 182,710 | ||||||
| 105,974 | NMI Holdings, Inc., Class A* | 3,099,740 | ||||||
| 4,814 | Provident Financial Services, Inc. | 120,109 | ||||||
| 135,788 | TrustCo Bank Corp. | 1,173,208 | ||||||
| 52,598 | United Community Financial Corp. | 599,091 | ||||||
| 47,972 | WSFS Financial Corp. | 2,022,979 | ||||||
|
| |||||||
| 7,557,159 | ||||||||
|
| |||||||
| Tobacco – 0.0% | ||||||||
| 1,756 | Universal Corp. | 96,229 | ||||||
|
| |||||||
| Trading Companies & Distributors – 1.8% | ||||||||
| 44,310 | Applied Industrial Technologies, Inc. | 2,651,510 | ||||||
| 15,536 | Beacon Roofing Supply, Inc.* | 482,238 | ||||||
| 142,027 | BMC Stock Holdings, Inc.* | 3,833,309 | ||||||
| 3,287 | DXP Enterprises, Inc.* | 113,467 | ||||||
| 54,869 | Foundation Building Materials, Inc.* | 1,020,015 | ||||||
| 98,205 | GMS, Inc.* | 2,942,222 | ||||||
| 12,879 | H&E Equipment Services, Inc. | 437,113 | ||||||
| 14,203 | Kaman Corp. | 833,290 | ||||||
| 30,894 | MRC Global, Inc.* | 350,956 | ||||||
| 15,454 | Titan Machinery, Inc.* | 256,536 | ||||||
|
| |||||||
| 12,920,656 | ||||||||
|
| |||||||
| Wireless Telecommunication Services – 0.1% | ||||||||
| 34,122 | Spok Holdings, Inc. | 406,052 | ||||||
|
| |||||||
| TOTAL COMMON STOCKS | ||||||||
| (Cost $641,110,329) | $ | 685,009,554 | ||||||
|
| |||||||
| Shares | Dividend Rate | Value | ||||||
| Investment Company – 1.0%(b) | ||||||||
| | Goldman Sachs Financial Square Government Fund – | | ||||||
| 7,203,961 | 1.701%(c) | $ | 7,203,961 | |||||
| (Cost $7,203,961) | ||||||||
|
| |||||||
| | TOTAL INVESTMENTS BEFORE SECURITIES LENDING REINVESTMENT VEHICLE |
| ||||||
| (Cost $648,314,290) | $ | 692,213,515 | ||||||
|
| |||||||
| Securities Lending Reinvestment Vehicle – 0.2%(b) | ||||||||
| | Goldman Sachs Financial Square Government Fund – | | ||||||
| 1,732,225 | 1.701%(c) | $ | 1,732,225 | |||||
| (Cost $1,732,225) | ||||||||
|
| |||||||
| TOTAL INVESTMENTS – 98.3% | ||||||||
| (Cost $650,046,515) | $ | 693,945,740 | ||||||
|
| |||||||
| | OTHER ASSETS IN EXCESS OF LIABILITIES – 1.7% | 11,745,676 | ||||||
|
| |||||||
| NET ASSETS – 100.0% | $ | 705,691,416 | ||||||
|
| |||||||
| The percentage shown for each investment category reflects the value of investments in that category as a percentage of net assets. | ||
* | Non-income producing security. | |
(a) | All or a portion of security is on loan. | |
(b) | Represents an affiliated issuer. | |
(c) | Rate shown reflects the yield as of October 31, 2019. | |
| ||
Investment Abbreviations: | ||
PLC | —Public Limited Company | |
REIT | —Real Estate Investment Trust | |
| ||
| ADDITIONAL INVESTMENT INFORMATION |
FUTURES CONTRACTS — At October 31, 2019, the Fund had the following futures contracts:
| Description | Number of Contracts | Expiration Date | Notional Amount | Unrealized Appreciation/ (Depreciation) | ||||||||||||
Long position contracts: | ||||||||||||||||
E-mini Russell 2000 Index | 143 | 12/20/19 | $ | 11,319,422 | $ | (141,112 | ) | |||||||||
| The accompanying notes are an integral part of these financial statements. | 41 |
GOLDMAN SACHS SMALL CAP GROWTH INSIGHTS FUND
Schedule of Investments
October 31, 2019
| Shares | Description | Value | ||||||
| Common Stocks – 97.5% | ||||||||
| Aerospace & Defense – 1.9% | ||||||||
| 144,484 | Aerojet Rocketdyne Holdings, Inc.* | $ | 6,246,043 | |||||
| 132,948 | Astronics Corp.* | 3,847,515 | ||||||
| 130,264 | Kratos Defense & Security Solutions, Inc.* | 2,459,384 | ||||||
| 83,554 | Mercury Systems, Inc.* | 6,154,588 | ||||||
| 39,602 | Moog, Inc., Class A | 3,315,084 | ||||||
|
| |||||||
| 22,022,614 | ||||||||
|
| |||||||
| Air Freight & Logistics – 0.4% | ||||||||
| 33,702 | Atlas Air Worldwide Holdings, Inc.* | 739,085 | ||||||
| 180,299 | Echo Global Logistics, Inc.* | 3,589,753 | ||||||
| 71,472 | Radiant Logistics, Inc.* | 385,234 | ||||||
|
| |||||||
| 4,714,072 | ||||||||
|
| |||||||
| Airlines – 0.3% | ||||||||
| 15,092 | Allegiant Travel Co. | 2,525,344 | ||||||
| 12,030 | SkyWest, Inc. | 716,387 | ||||||
| 12,580 | Spirit Airlines, Inc.* | 472,505 | ||||||
|
| |||||||
| 3,714,236 | ||||||||
|
| |||||||
| Auto Components – 0.0% | ||||||||
| 46,186 | American Axle & Manufacturing Holdings, Inc.* | 386,115 | ||||||
|
| |||||||
| Banks – 3.7% | ||||||||
| 19,069 | 1st Source Corp. | 975,951 | ||||||
| 61,171 | Amalgamated Bank, Class A | 1,113,924 | ||||||
| 61,669 | Atlantic Capital Bancshares, Inc.* | 1,150,127 | ||||||
| 23,024 | Bancorp, Inc. (The)* | 250,962 | ||||||
| 196,630 | Central Pacific Financial Corp. | 5,686,540 | ||||||
| 229,250 | CVB Financial Corp. | 4,763,815 | ||||||
| 4,181 | First Bancorp/Southern Pines NC | 157,833 | ||||||
| 134,736 | First Foundation, Inc. | 2,157,123 | ||||||
| 16,466 | HarborOne Bancorp, Inc.* | 168,118 | ||||||
| 12,604 | Heartland Financial USA, Inc. | 589,615 | ||||||
| 59,294 | Heritage Commerce Corp. | 712,714 | ||||||
| 272,046 | Hilltop Holdings, Inc. | 6,354,994 | ||||||
| 7,304 | Independent Bank Corp. | 164,413 | ||||||
| 16,175 | Independent Bank Group, Inc. | 864,877 | ||||||
| 157,835 | International Bancshares Corp. | 6,464,922 | ||||||
| 140,107 | National Bank Holdings Corp., Class A | 4,819,681 | ||||||
| 10,784 | Preferred Bank | 574,895 | ||||||
| 126,119 | Seacoast Banking Corp. of Florida* | 3,531,332 | ||||||
| 72,057 | TriCo Bancshares | 2,711,505 | ||||||
|
| |||||||
| 43,213,341 | ||||||||
|
| |||||||
| Beverages – 0.6% | ||||||||
| 25,629 | Coca-Cola Consolidated, Inc. | 7,031,572 | ||||||
|
| |||||||
| Biotechnology – 12.8% | ||||||||
| 198,274 | ACADIA Pharmaceuticals, Inc.* | 8,408,800 | ||||||
| 90,417 | Acceleron Pharma, Inc.* | 4,057,011 | ||||||
| 69,689 | Affimed NV (Germany)* | 204,886 | ||||||
| 324,760 | Amicus Therapeutics, Inc.* | 2,737,727 | ||||||
| 47,860 | Anika Therapeutics, Inc.* | 3,368,865 | ||||||
|
| |||||||
| Common Stocks – (continued) | ||||||||
| Biotechnology – (continued) | ||||||||
| 23,652 | Apellis Pharmaceuticals, Inc.* | 695,132 | ||||||
| 68,315 | Arena Pharmaceuticals, Inc.* | 3,327,965 | ||||||
| 150,517 | Arrowhead Pharmaceuticals, Inc.* | 6,028,206 | ||||||
| 11,599 | Atara Biotherapeutics, Inc.* | 126,661 | ||||||
| 75,266 | Audentes Therapeutics, Inc.* | 2,024,655 | ||||||
| 72,163 | Avid Bioservices, Inc.* | 386,072 | ||||||
| 22,823 | BioSpecifics Technologies Corp.* | 1,105,318 | ||||||
| 57,466 | Blueprint Medicines Corp.* | 3,955,959 | ||||||
| 146,155 | CareDx, Inc.* | 3,830,723 | ||||||
| 465,757 | Catalyst Pharmaceuticals, Inc.* | 2,203,031 | ||||||
| 285,378 | Coherus Biosciences, Inc.* | 4,957,016 | ||||||
| 140,667 | Dicerna Pharmaceuticals, Inc.* | 2,319,599 | ||||||
| 35,643 | Eagle Pharmaceuticals, Inc.* | 2,234,816 | ||||||
| 74,770 | Editas Medicine, Inc.* | 1,558,207 | ||||||
| 72,289 | Emergent BioSolutions, Inc.* | 4,132,039 | ||||||
| 94,801 | Enanta Pharmaceuticals, Inc.* | 5,771,485 | ||||||
| 84,010 | Esperion Therapeutics, Inc.* | 3,341,078 | ||||||
| 23,688 | Fate Therapeutics, Inc.* | 354,136 | ||||||
| 193,817 | FibroGen, Inc.* | 7,587,936 | ||||||
| 26,656 | G1 Therapeutics, Inc.* | 565,640 | ||||||
| 51,431 | Global Blood Therapeutics, Inc.* | 2,466,117 | ||||||
| 516,085 | Halozyme Therapeutics, Inc.* | 7,906,422 | ||||||
| 65,122 | Heron Therapeutics, Inc.* | 1,383,843 | ||||||
| 183,501 | Immunomedics, Inc.* | 2,936,016 | ||||||
| 36,448 | Intercept Pharmaceuticals, Inc.* | 2,652,685 | ||||||
| 121,463 | Iovance Biotherapeutics, Inc.* | 2,566,513 | ||||||
| 262,325 | Ironwood Pharmaceuticals, Inc.* | 2,633,743 | ||||||
| 42,645 | Minerva Neurosciences, Inc.* | 202,137 | ||||||
| 33,166 | Mirati Therapeutics, Inc.* | 3,123,574 | ||||||
| 28,821 | Momenta Pharmaceuticals, Inc.* | 446,149 | ||||||
| 68,240 | Natera, Inc.* | 2,628,605 | ||||||
| 226,195 | Pieris Pharmaceuticals, Inc.* | 748,705 | ||||||
| 187,011 | Portola Pharmaceuticals, Inc.* | 5,406,488 | ||||||
| 18,748 | Precision BioSciences, Inc.* | 121,675 | ||||||
| 67,401 | Prothena Corp. PLC (Ireland)* | 613,349 | ||||||
| 71,054 | PTC Therapeutics, Inc.* | 2,905,398 | ||||||
| 69,306 | Puma Biotechnology, Inc.* | 471,281 | ||||||
| 285,556 | Radius Health, Inc.* | 8,121,213 | ||||||
| 119,866 | Repligen Corp.* | 9,528,148 | ||||||
| 30,577 | Twist Bioscience Corp.* | 728,344 | ||||||
| 17,630 | Ultragenyx Pharmaceutical, Inc.* | 707,668 | ||||||
| 302,139 | Vanda Pharmaceuticals, Inc.* | 4,081,898 | ||||||
| 201,285 | Veracyte, Inc.* | 4,615,465 | ||||||
| 164,288 | Voyager Therapeutics, Inc.* | 2,528,392 | ||||||
| 105,034 | Xencor, Inc.* | 3,593,213 | ||||||
|
| |||||||
| 148,400,004 | ||||||||
|
| |||||||
| Building Products – 3.5% | ||||||||
| 13,192 | American Woodmark Corp.* | 1,308,119 | ||||||
| 398,118 | Builders FirstSource, Inc.* | 9,001,448 | ||||||
| 269,575 | Continental Building Products, Inc.* | 8,062,988 | ||||||
| 40,118 | CSW Industrials, Inc. | 2,776,968 | ||||||
| 2,881 | Gibraltar Industries, Inc.* | 153,356 | ||||||
| 214,860 | JELD-WEN Holding, Inc.* | 3,671,957 | ||||||
| 13,745 | Patrick Industries, Inc.* | 679,140 | ||||||
| 9,072 | Quanex Building Products Corp. | 174,999 | ||||||
|
| |||||||
| 42 | The accompanying notes are an integral part of these financial statements. |
GOLDMAN SACHS SMALL CAP GROWTH INSIGHTS FUND
| Shares | Description | Value | ||||||
| Common Stocks – (continued) | ||||||||
| Building Products – (continued) | ||||||||
| 137,847 | Simpson Manufacturing Co., Inc. | $ | 11,391,676 | |||||
| 66,192 | Universal Forest Products, Inc. | 3,333,429 | ||||||
|
| |||||||
| 40,554,080 | ||||||||
|
| |||||||
| Capital Markets – 0.7% | ||||||||
| 79,529 | Artisan Partners Asset Management, Inc., Class A | 2,175,118 | ||||||
| 38,382 | Moelis & Co., Class A | 1,369,470 | ||||||
| 43,107 | Oppenheimer Holdings, Inc., Class A | 1,172,510 | ||||||
| 35,615 | Piper Jaffray Cos. | 2,797,202 | ||||||
| 2,014 | Virtus Investment Partners, Inc. | 218,479 | ||||||
|
| |||||||
| 7,732,779 | ||||||||
|
| |||||||
| Chemicals – 2.3% | ||||||||
| 30,097 | Chase Corp. | 3,525,864 | ||||||
| 595,618 | Ferro Corp.* | 6,629,228 | ||||||
| 44,679 | Ingevity Corp.* | 3,762,419 | ||||||
| 18,070 | Innophos Holdings, Inc. | 589,443 | ||||||
| 50,303 | Kraton Corp.* | 1,127,793 | ||||||
| 43,385 | Minerals Technologies, Inc. | 2,145,388 | ||||||
| 265,731 | PolyOne Corp. | 8,516,679 | ||||||
| 6,047 | Stepan Co. | 590,913 | ||||||
|
| |||||||
| 26,887,727 | ||||||||
|
| |||||||
| Commercial Services & Supplies – 2.0% | ||||||||
| 13,644 | Brink’s Co. (The) | 1,159,194 | ||||||
| 202,631 | Covanta Holding Corp. | 2,925,992 | ||||||
| 142,045 | HNI Corp. | 5,397,710 | ||||||
| 37,801 | Interface, Inc. | 628,631 | ||||||
| 121,469 | Kimball International, Inc., Class B | 2,473,109 | ||||||
| 100,141 | Knoll, Inc. | 2,677,770 | ||||||
| 87,613 | McGrath RentCorp | 6,685,748 | ||||||
| 18,680 | Steelcase, Inc., Class A | 326,339 | ||||||
| 6,313 | Tetra Tech, Inc. | 552,198 | ||||||
| 3,046 | UniFirst Corp. | 611,759 | ||||||
|
| |||||||
| 23,438,450 | ||||||||
|
| |||||||
| Communications Equipment – 1.3% | ||||||||
| 6,959 | Comtech Telecommunications Corp. | 243,217 | ||||||
| 298,676 | Extreme Networks, Inc.* | 1,923,473 | ||||||
| 35,665 | Lumentum Holdings, Inc.* | 2,234,769 | ||||||
| 666,986 | Viavi Solutions, Inc.* | 10,645,097 | ||||||
|
| |||||||
| 15,046,556 | ||||||||
|
| |||||||
| Construction & Engineering – 0.8% | ||||||||
| 278,781 | Great Lakes Dredge & Dock Corp.* | 2,996,896 | ||||||
| 97,913 | MasTec, Inc.* | 6,162,644 | ||||||
|
| |||||||
| 9,159,540 | ||||||||
|
| |||||||
| Consumer Finance – 0.5% | ||||||||
| 230,001 | Enova International, Inc.* | 5,402,724 | ||||||
| 10,718 | Green Dot Corp., Class A* | 309,107 | ||||||
| 3,263 | Nelnet, Inc., Class A | 199,924 | ||||||
|
| |||||||
| 5,911,755 | ||||||||
|
| |||||||
| Common Stocks – (continued) | ||||||||
| Distributors – 0.2% | ||||||||
| 63,967 | Core-Mark Holding Co., Inc. | 1,952,273 | ||||||
|
| |||||||
| Diversified Consumer Services – 0.6% | ||||||||
| 24,222 | American Public Education, Inc.* | 526,102 | ||||||
| 8,730 | Carriage Services, Inc. | 224,885 | ||||||
| 38,768 | Collectors Universe, Inc. | 1,111,091 | ||||||
| 110,368 | K12, Inc.* | 2,184,183 | ||||||
| 155,654 | Laureate Education, Inc., Class A* | 2,405,632 | ||||||
|
| |||||||
| 6,451,893 | ||||||||
|
| |||||||
| Diversified Financial Services – 0.0% | ||||||||
| 6,436 | Banco Latinoamericano de Comercio Exterior SA, Class E (Panama) | 132,775 | ||||||
| 34,356 | FGL Holdings | 310,234 | ||||||
|
| |||||||
| 443,009 | ||||||||
|
| |||||||
| Diversified Telecommunication Services – 1.0% | ||||||||
| 153,863 | Cogent Communications Holdings, Inc. | 9,022,526 | ||||||
| 538,564 | ORBCOMM, Inc.* | 2,159,642 | ||||||
|
| |||||||
| 11,182,168 | ||||||||
|
| |||||||
| Electric Utilities – 0.1% | ||||||||
| 13,113 | Otter Tail Corp. | 743,245 | ||||||
|
| |||||||
| Electrical Equipment – 0.4% | ||||||||
| 99,296 | Atkore International Group, Inc.* | 3,445,571 | ||||||
| 2,721 | Encore Wire Corp. | 152,920 | ||||||
| 31,445 | Thermon Group Holdings, Inc.* | 749,335 | ||||||
|
| |||||||
| 4,347,826 | ||||||||
|
| |||||||
| Electronic Equipment, Instruments & Components – 4.5% | ||||||||
| 47,598 | Badger Meter, Inc. | 2,751,164 | ||||||
| 6,130 | Belden, Inc. | 314,346 | ||||||
| 129,673 | Benchmark Electronics, Inc. | 4,395,915 | ||||||
| 15,313 | CTS Corp. | 408,551 | ||||||
| 67,525 | Fabrinet (Thailand)* | 3,796,931 | ||||||
| 246,711 | II-VI, Inc.* | 8,178,470 | ||||||
| 77,816 | Itron, Inc.* | 5,934,248 | ||||||
| 11,779 | Napco Security Technologies, Inc.* | 357,610 | ||||||
| 17,896 | Novanta, Inc.* | 1,593,639 | ||||||
| 12,197 | PC Connection, Inc. | 595,701 | ||||||
| 58,899 | Rogers Corp.* | 7,979,637 | ||||||
| 208,271 | Sanmina Corp.* | 6,400,168 | ||||||
| 292,618 | Vishay Intertechnology, Inc. | 5,896,253 | ||||||
| 94,398 | Vishay Precision Group, Inc.* | 3,214,252 | ||||||
|
| |||||||
| 51,816,885 | ||||||||
|
| |||||||
| Energy Equipment & Services – 0.6% | ||||||||
| 108,986 | Matrix Service Co.* | 2,044,577 | ||||||
| 21,917 | Oceaneering International, Inc.* | 310,345 | ||||||
| 100,199 | SEACOR Holdings, Inc.* | 4,299,539 | ||||||
|
| |||||||
| 6,654,461 | ||||||||
|
| |||||||
| Entertainment – 0.3% | ||||||||
| 185,400 | Glu Mobile, Inc.* | 1,099,422 | ||||||
|
| |||||||
| The accompanying notes are an integral part of these financial statements. | 43 |
GOLDMAN SACHS SMALL CAP GROWTH INSIGHTS FUND
Schedule of Investments(continued)
October 31, 2019
| Shares | Description | Value | ||||||
| Common Stocks – (continued) | ||||||||
| Entertainment – (continued) | ||||||||
| 87,908 | IMAX Corp.* | $ | 1,876,836 | |||||
|
| |||||||
| 2,976,258 | ||||||||
|
| |||||||
| Equity Real Estate Investment Trusts (REITs) – 3.6% | ||||||||
| 39,220 | EastGroup Properties, Inc. REIT | 5,253,519 | ||||||
| 190,411 | First Industrial Realty Trust, Inc. REIT | 8,018,207 | ||||||
| 36,921 | Gladstone Commercial Corp. REIT | 869,859 | ||||||
| 38,336 | Lexington Realty Trust REIT | 417,096 | ||||||
| 197,547 | National Storage Affiliates Trust REIT | 6,750,181 | ||||||
| 131,151 | NexPoint Residential Trust, Inc. REIT | 6,396,234 | ||||||
| 33,690 | PS Business Parks, Inc. REIT | 6,082,730 | ||||||
| 3,338 | Retail Value, Inc. REIT | 122,204 | ||||||
| 6,657 | Rexford Industrial Realty, Inc. REIT | 320,135 | ||||||
| 125,913 | Terreno Realty Corp. REIT | 7,102,752 | ||||||
|
| |||||||
| 41,332,917 | ||||||||
|
| |||||||
| Food Products – 2.6% | ||||||||
| 222,039 | Darling Ingredients, Inc.* | 4,285,353 | ||||||
| 38,254 | Freshpet, Inc.* | 1,999,154 | ||||||
| 43,618 | J&J Snack Foods Corp. | 8,320,570 | ||||||
| 42,927 | John B Sanfilippo & Son, Inc. | 4,555,413 | ||||||
| 28,142 | Lancaster Colony Corp. | 3,916,803 | ||||||
| 44,022 | Sanderson Farms, Inc. | 6,815,046 | ||||||
|
| |||||||
| 29,892,339 | ||||||||
|
| |||||||
| Health Care Equipment & Supplies – 5.6% | ||||||||
| 136,096 | Antares Pharma, Inc.* | 457,283 | ||||||
| 43,471 | Cardiovascular Systems, Inc.* | 1,935,329 | ||||||
| 8,365 | Cutera, Inc.* | 263,498 | ||||||
| 218,212 | GenMark Diagnostics, Inc.* | 1,224,169 | ||||||
| 97,007 | Haemonetics Corp.* | 11,711,655 | ||||||
| 21,666 | Inogen, Inc.* | 1,179,389 | ||||||
| 105,227 | Integer Holdings Corp.* | 8,148,779 | ||||||
| 52,250 | Invacare Corp. | 403,370 | ||||||
| 13,012 | Lantheus Holdings, Inc.* | 271,300 | ||||||
| 16,801 | Meridian Bioscience, Inc. | 164,482 | ||||||
| 14,236 | Mesa Laboratories, Inc. | 3,242,249 | ||||||
| 76,365 | Natus Medical, Inc.* | 2,571,973 | ||||||
| 135,836 | Novocure Ltd.* | 9,731,291 | ||||||
| 149,458 | NuVasive, Inc.* | 10,542,767 | ||||||
| 95,300 | Surmodics, Inc.* | 4,527,703 | ||||||
| 122,718 | Tandem Diabetes Care, Inc.* | 7,556,974 | ||||||
| 1,635 | Utah Medical Products, Inc. | 167,538 | ||||||
| 46,261 | Varex Imaging Corp.* | 1,388,293 | ||||||
|
| |||||||
| 65,488,042 | ||||||||
|
| |||||||
| Health Care Providers & Services – 2.7% | ||||||||
| 13,773 | Amedisys, Inc.* | 1,770,106 | ||||||
| 226,236 | Brookdale Senior Living, Inc.* | 1,662,834 | ||||||
| 93,558 | Community Health Systems, Inc.* | 331,195 | ||||||
| 5,000 | CorVel Corp.* | 395,600 | ||||||
| 101,784 | Ensign Group, Inc. (The) | 4,300,374 | ||||||
| 45,934 | LHC Group, Inc.* | 5,097,296 | ||||||
| 40,219 | Magellan Health, Inc.* | 2,610,213 | ||||||
| 9,388 | National Research Corp. | 539,153 | ||||||
| 22,364 | Providence Service Corp. (The)* | 1,428,389 | ||||||
|
| |||||||
| Common Stocks – (continued) | ||||||||
| Health Care Providers & Services – (continued) | ||||||||
| 232,257 | R1 RCM, Inc.* | 2,468,892 | ||||||
| 293,668 | Tenet Healthcare Corp.* | 7,441,547 | ||||||
| 76,185 | Triple-S Management Corp., Class B (Puerto Rico)* | 1,152,679 | ||||||
| 11,923 | US Physical Therapy, Inc. | 1,686,747 | ||||||
|
| |||||||
| 30,885,025 | ||||||||
|
| |||||||
| Health Care Technology – 1.8% | ||||||||
| 26,223 | Computer Programs & Systems, Inc. | 604,965 | ||||||
| 249,358 | HMS Holdings Corp.* | 8,151,513 | ||||||
| 80,692 | Inovalon Holdings, Inc., Class A* | 1,261,216 | ||||||
| 125,230 | NextGen Healthcare, Inc.* | 2,117,013 | ||||||
| 132,015 | Omnicell, Inc.* | 9,292,536 | ||||||
|
| |||||||
| 21,427,243 | ||||||||
|
| |||||||
| Hotels, Restaurants & Leisure – 2.8% | ||||||||
| 115,852 | Brinker International, Inc. | 5,149,621 | ||||||
| 2,183 | Cracker Barrel Old Country Store, Inc. | 339,457 | ||||||
| 318,568 | Denny’s Corp.* | 6,409,588 | ||||||
| 131,156 | Everi Holdings, Inc.* | 1,319,429 | ||||||
| 48,810 | PlayAGS, Inc.* | 563,267 | ||||||
| 164,808 | Scientific Games Corp.* | 3,953,744 | ||||||
| 237,136 | SeaWorld Entertainment, Inc.* | 6,265,133 | ||||||
| 102,234 | Wingstop, Inc. | 8,529,383 | ||||||
|
| |||||||
| 32,529,622 | ||||||||
|
| |||||||
| Household Durables – 2.9% | ||||||||
| 114,695 | Installed Building Products, Inc.* | 7,480,408 | ||||||
| 183,172 | KB Home | 6,537,409 | ||||||
| 22,210 | M/I Homes, Inc.* | 981,238 | ||||||
| 57,862 | Taylor Morrison Home Corp.* | 1,449,443 | ||||||
| 100,834 | TopBuild Corp.* | 10,479,677 | ||||||
| 359,391 | TRI Pointe Group, Inc.* | 5,656,814 | ||||||
| 14,681 | Universal Electronics, Inc.* | 765,174 | ||||||
|
| |||||||
| 33,350,163 | ||||||||
|
| |||||||
| Independent Power and Renewable Electricity Producers – 0.2% | ||||||||
| 30,594 | Ormat Technologies, Inc. | 2,342,277 | ||||||
|
| |||||||
| Industrial Conglomerates – 0.1% | ||||||||
| 21,840 | Raven Industries, Inc. | 761,779 | ||||||
|
| |||||||
| Insurance – 1.4% | ||||||||
| 264,586 | American Equity Investment Life Holding Co. | 6,529,982 | ||||||
| 76,642 | Argo Group International Holdings Ltd. | 4,741,841 | ||||||
| 36,172 | Genworth Financial, Inc., Class A* | 154,816 | ||||||
| 37,339 | Goosehead Insurance, Inc., Class A | 1,911,010 | ||||||
| 110,826 | MBIA, Inc.* | 1,029,574 | ||||||
| 95,472 | National General Holdings Corp. | 2,035,463 | ||||||
| 4,285 | Stewart Information Services Corp. | 175,342 | ||||||
|
| |||||||
| 16,578,028 | ||||||||
|
| |||||||
| Interactive Media & Services – 0.8% | ||||||||
| 487,845 | Cars.com, Inc.* | 5,517,527 | ||||||
|
| |||||||
| 44 | The accompanying notes are an integral part of these financial statements. |
GOLDMAN SACHS SMALL CAP GROWTH INSIGHTS FUND
| Shares | Description | Value | ||||||
| Common Stocks – (continued) | ||||||||
| Interactive Media & Services – (continued) | ||||||||
| 244,433 | Liberty TripAdvisor Holdings, Inc., Class A* | $ | 2,358,779 | |||||
| 110,904 | QuinStreet, Inc.* | 1,422,898 | ||||||
|
| |||||||
| 9,299,204 | ||||||||
|
| |||||||
| Internet & Direct Marketing Retail – 0.3% | ||||||||
| 21,852 | 1-800-Flowers.com, Inc., Class A* | 311,609 | ||||||
| 214,961 | Groupon, Inc.* | 597,592 | ||||||
| 61,424 | Shutterstock, Inc.* | 2,492,586 | ||||||
|
| |||||||
| 3,401,787 | ||||||||
|
| |||||||
| IT Services – 1.6% | ||||||||
| 17,050 | Cardtronics PLC, Class A* | 584,133 | ||||||
| 7,852 | Cass Information Systems, Inc. | 449,998 | ||||||
| 9,492 | CSG Systems International, Inc. | 547,119 | ||||||
| 49,388 | Evo Payments, Inc., Class A* | 1,404,101 | ||||||
| 7,535 | ExlService Holdings, Inc.* | 524,662 | ||||||
| 39,977 | I3 Verticals, Inc., Class A* | 817,530 | ||||||
| 25,857 | MAXIMUS, Inc. | 1,984,266 | ||||||
| 266,291 | Perspecta, Inc. | 7,067,363 | ||||||
| 55,968 | Science Applications International Corp. | 4,624,076 | ||||||
| 85,658 | Unisys Corp.* | 878,851 | ||||||
|
| |||||||
| 18,882,099 | ||||||||
|
| |||||||
| Leisure Products – 0.2% | ||||||||
| 40,411 | American Outdoor Brands Corp.* | 286,110 | ||||||
| 4,072 | Johnson Outdoors, Inc., Class A | 238,416 | ||||||
| 30,871 | Malibu Boats, Inc., Class A* | 1,007,012 | ||||||
| 85,852 | MasterCraft Boat Holdings, Inc.* | 1,352,169 | ||||||
|
| |||||||
| 2,883,707 | ||||||||
|
| |||||||
| Life Sciences Tools & Services – 0.6% | ||||||||
| 121,656 | Fluidigm Corp.* | 598,547 | ||||||
| 90,800 | Medpace Holdings, Inc.* | 6,685,604 | ||||||
| 2,464 | Syneos Health, Inc.* | 123,570 | ||||||
|
| |||||||
| 7,407,721 | ||||||||
|
| |||||||
| Machinery – 4.3% | ||||||||
| 106,856 | Albany International Corp., Class A | 8,973,767 | ||||||
| 38,984 | Barnes Group, Inc. | 2,278,615 | ||||||
| 81,597 | Columbus McKinnon Corp. | 3,061,519 | ||||||
| 58,782 | EnPro Industries, Inc. | 4,088,288 | ||||||
| 26,537 | Evoqua Water Technologies Corp.* | 460,948 | ||||||
| 65,371 | Federal Signal Corp. | 2,120,635 | ||||||
| 77,161 | Franklin Electric Co., Inc. | 4,155,120 | ||||||
| 112,288 | Hillenbrand, Inc. | 3,457,347 | ||||||
| 47,227 | Kennametal, Inc. | 1,461,676 | ||||||
| 23,305 | Meritor, Inc.* | 513,409 | ||||||
| 126,397 | Mueller Industries, Inc. | 3,889,236 | ||||||
| 27,080 | Navistar International Corp.* | 847,062 | ||||||
| 22,418 | RBC Bearings, Inc.* | 3,596,744 | ||||||
| 35,388 | Rexnord Corp.* | 1,001,126 | ||||||
| 10,572 | SPX Corp.* | 481,449 | ||||||
| 45,061 | TriMas Corp.* | 1,456,372 | ||||||
|
| |||||||
| Common Stocks – (continued) | ||||||||
| Machinery – (continued) | ||||||||
| 80,461 | Watts Water Technologies, Inc., Class A | 7,502,988 | ||||||
|
| |||||||
| 49,346,301 | ||||||||
|
| |||||||
| Marine – 0.0% | ||||||||
| 6,730 | Matson, Inc. | 256,951 | ||||||
|
| |||||||
| Media – 0.8% | ||||||||
| 17,863 | Loral Space & Communications, Inc.* | 714,341 | ||||||
| 183,608 | Meredith Corp. | 6,922,022 | ||||||
| 74,248 | TechTarget, Inc.* | 1,811,651 | ||||||
|
| |||||||
| 9,448,014 | ||||||||
|
| |||||||
| Metals & Mining – 1.1% | ||||||||
| 27,560 | Carpenter Technology Corp. | 1,350,991 | ||||||
| 67,014 | Kaiser Aluminum Corp. | 7,175,859 | ||||||
| 68,196 | Materion Corp. | 3,876,261 | ||||||
| 16,607 | Worthington Industries, Inc. | 611,304 | ||||||
|
| |||||||
| 13,014,415 | ||||||||
|
| |||||||
| Oil, Gas & Consumable Fuels – 2.1% | ||||||||
| 50,985 | Ardmore Shipping Corp. (Ireland)* | 407,370 | ||||||
| 153,552 | CVR Energy, Inc. | 7,281,436 | ||||||
| 86,878 | Delek US Holdings, Inc. | 3,470,776 | ||||||
| 264,048 | DHT Holdings, Inc. | 2,041,091 | ||||||
| 236,366 | GasLog Ltd. (Monaco) | 3,240,578 | ||||||
| 123,500 | Golar LNG Ltd. (Bermuda) | 1,700,595 | ||||||
| 35,788 | International Seaways, Inc.* | 899,710 | ||||||
| 11,951 | PDC Energy, Inc.* | 238,422 | ||||||
| 113,764 | Scorpio Tankers, Inc. (Monaco) | 3,618,833 | ||||||
| 27,240 | World Fuel Services Corp. | 1,137,815 | ||||||
|
| |||||||
| 24,036,626 | ||||||||
|
| |||||||
| Paper & Forest Products – 0.3% | ||||||||
| 112,503 | Boise Cascade Co. | 4,024,232 | ||||||
|
| |||||||
| Personal Products – 0.1% | ||||||||
| 42,402 | elf Beauty, Inc.* | 712,354 | ||||||
| 11,491 | Inter Parfums, Inc. | 889,748 | ||||||
|
| |||||||
| 1,602,102 | ||||||||
|
| |||||||
| Pharmaceuticals – 2.2% | ||||||||
| 33,968 | Aerie Pharmaceuticals, Inc.* | 753,750 | ||||||
| 72,715 | Amneal Pharmaceuticals, Inc.* | 223,962 | ||||||
| 148,383 | Amphastar Pharmaceuticals, Inc.* | 2,866,018 | ||||||
| 89,539 | ANI Pharmaceuticals, Inc.* | 6,993,891 | ||||||
| 36,290 | Collegium Pharmaceutical, Inc.* | 435,480 | ||||||
| 272,856 | Endo International PLC* | 1,252,409 | ||||||
| 35,303 | Intersect ENT, Inc.* | 629,100 | ||||||
| 11,387 | Pacira BioSciences, Inc.* | 461,060 | ||||||
| 162,302 | Phibro Animal Health Corp., Class A | 3,888,756 | ||||||
| 94,861 | Prestige Consumer Healthcare, Inc.* | 3,363,771 | ||||||
| 171,036 | Supernus Pharmaceuticals, Inc.* | 4,753,090 | ||||||
|
| |||||||
| 25,621,287 | ||||||||
|
| |||||||
| The accompanying notes are an integral part of these financial statements. | 45 |
GOLDMAN SACHS SMALL CAP GROWTH INSIGHTS FUND
Schedule of Investments(continued)
October 31, 2019
| Shares | Description | Value | ||||||
| Common Stocks – (continued) | ||||||||
| Professional Services – 2.9% | ||||||||
| 23,044 | Barrett Business Services, Inc. | $ | 2,021,650 | |||||
| 2,954 | CRA International, Inc. | 145,485 | ||||||
| 23,329 | Heidrick & Struggles International, Inc. | 663,943 | ||||||
| 90,680 | Insperity, Inc. | 9,578,528 | ||||||
| 155,341 | Kforce, Inc. | 6,355,000 | ||||||
| 148,905 | Korn Ferry | 5,463,324 | ||||||
| 8,846 | Resources Connection, Inc. | 129,594 | ||||||
| 129,127 | TriNet Group, Inc.* | 6,842,440 | ||||||
| 125,565 | TrueBlue, Inc.* | 2,875,439 | ||||||
|
| |||||||
| 34,075,403 | ||||||||
|
| |||||||
| Road & Rail – 0.7% | ||||||||
| 84,129 | Avis Budget Group, Inc.* | 2,499,472 | ||||||
| 175,921 | Heartland Express, Inc. | 3,676,749 | ||||||
| 97,756 | Marten Transport Ltd. | 2,117,395 | ||||||
|
| |||||||
| 8,293,616 | ||||||||
|
| |||||||
| Semiconductors & Semiconductor Equipment – 3.5% | ||||||||
| 51,989 | Ambarella, Inc.* | 2,736,181 | ||||||
| 145,012 | Amkor Technology, Inc.* | 1,802,499 | ||||||
| 71,007 | Diodes, Inc.* | 3,312,477 | ||||||
| 69,552 | Enphase Energy, Inc.* | 1,351,395 | ||||||
| 11,086 | FormFactor, Inc.* | 242,008 | ||||||
| 105,354 | Inphi Corp.* | 7,572,846 | ||||||
| 382,078 | Lattice Semiconductor Corp.* | 7,484,908 | ||||||
| 121,916 | MaxLinear, Inc.* | 2,311,527 | ||||||
| 389,172 | Rambus, Inc.* | 5,388,086 | ||||||
| 41,406 | Silicon Laboratories, Inc.* | 4,398,974 | ||||||
| 12,374 | Veeco Instruments, Inc.* | 168,781 | ||||||
| 164,014 | Xperi Corp. | 3,330,304 | ||||||
|
| |||||||
| 40,099,986 | ||||||||
|
| |||||||
| Software – 6.0% | ||||||||
| 97,768 | ACI Worldwide, Inc.* | 3,068,937 | ||||||
| 25,617 | Agilysys, Inc.* | 645,292 | ||||||
| 53,892 | Alarm.com Holdings, Inc.* | 2,662,265 | ||||||
| 52,965 | American Software, Inc., Class A | 858,563 | ||||||
| 46,913 | Blackline, Inc.* | 2,192,714 | ||||||
| 190,717 | Bottomline Technologies DE, Inc.* | 7,809,861 | ||||||
| 199,667 | Box, Inc., Class A* | 3,378,366 | ||||||
| 104,647 | CommVault Systems, Inc.* | 5,197,816 | ||||||
| 117,415 | Cornerstone OnDemand, Inc.* | 6,876,996 | ||||||
| 271,087 | Digital Turbine, Inc.* | 1,894,898 | ||||||
| 115,309 | Five9, Inc.* | 6,400,803 | ||||||
| 14,969 | MicroStrategy, Inc., Class A* | 2,293,999 | ||||||
| 280,618 | MobileIron, Inc.* | 1,756,669 | ||||||
| 120,200 | Progress Software Corp. | 4,793,576 | ||||||
| 37,386 | PROS Holdings, Inc.* | 1,915,659 | ||||||
| 24,159 | QAD, Inc., Class A | 1,122,910 | ||||||
| 42,945 | Qualys, Inc.* | 3,664,497 | ||||||
| 142,594 | SPS Commerce, Inc.* | 7,524,685 | ||||||
| 132,659 | SVMK, Inc.* | 2,440,926 | ||||||
| 91,859 | Telenav, Inc.* | 432,656 | ||||||
| 10,212 | Upland Software, Inc.* | 382,746 | ||||||
|
| |||||||
| Common Stocks – (continued) | ||||||||
| Software – (continued) | ||||||||
| 60,906 | Verint Systems, Inc.* | 2,764,523 | ||||||
|
| |||||||
| 70,079,357 | ||||||||
|
| |||||||
| Specialty Retail – 3.5% | ||||||||
| 31,892 | American Eagle Outfitters, Inc. | 490,499 | ||||||
| 40,498 | America’s Car-Mart, Inc.* | 3,684,913 | ||||||
| 83,768 | Asbury Automotive Group, Inc.* | 8,638,994 | ||||||
| 68,346 | Boot Barn Holdings, Inc.* | 2,395,527 | ||||||
| 52,175 | Citi Trends, Inc. | 931,324 | ||||||
| 86,863 | Genesco, Inc.* | 3,374,628 | ||||||
| 114,432 | Hudson Ltd, Class A* | 1,421,245 | ||||||
| 55,298 | Murphy USA, Inc.* | 6,521,293 | ||||||
| 145,069 | Rent-A-Center, Inc. | 3,752,935 | ||||||
| 3,880 | RH* | 704,996 | ||||||
| 120,602 | Sleep Number Corp.* | 5,803,368 | ||||||
| 78,761 | Sonic Automotive, Inc., Class A | 2,538,467 | ||||||
|
| |||||||
| 40,258,189 | ||||||||
|
| |||||||
| Textiles, Apparel & Luxury Goods – 1.9% | ||||||||
| 97,433 | Crocs, Inc.* | 3,409,181 | ||||||
| 62,616 | Deckers Outdoor Corp.* | 9,573,986 | ||||||
| 131,451 | Steven Madden Ltd. | 5,413,152 | ||||||
| 111,408 | Wolverine World Wide, Inc. | 3,306,590 | ||||||
|
| |||||||
| 21,702,909 | ||||||||
|
| |||||||
| Thrifts & Mortgage Finance – 0.7% | ||||||||
| 16,046 | Meridian Bancorp, Inc. | 313,860 | ||||||
| 274,904 | NMI Holdings, Inc., Class A* | 8,040,942 | ||||||
| 4,479 | Walker & Dunlop, Inc. | 282,132 | ||||||
|
| |||||||
| 8,636,934 | ||||||||
|
| |||||||
| Trading Companies & Distributors – 1.6% | ||||||||
| 85,658 | Applied Industrial Technologies, Inc. | 5,125,775 | ||||||
| 22,931 | Beacon Roofing Supply, Inc.* | 711,778 | ||||||
| 144,017 | BMC Stock Holdings, Inc.* | 3,887,019 | ||||||
| 40,818 | Foundation Building Materials, Inc.* | 758,806 | ||||||
| 158,741 | GMS, Inc.* | 4,755,880 | ||||||
| 31,155 | H&E Equipment Services, Inc. | 1,057,401 | ||||||
| 40,785 | Kaman Corp. | 2,392,856 | ||||||
|
| |||||||
| 18,689,515 | ||||||||
|
| |||||||
| Wireless Telecommunication Services – 0.1% | ||||||||
| 50,717 | Shenandoah Telecommunications Co. | 1,631,059 | ||||||
|
| |||||||
| TOTAL COMMON STOCKS | ||||||||
| (Cost $1,056,526,455) | $ | 1,132,059,708 | ||||||
|
| |||||||
| 46 | The accompanying notes are an integral part of these financial statements. |
GOLDMAN SACHS SMALL CAP GROWTH INSIGHTS FUND
| Shares | Dividend Rate | Value | ||||||
| Investment Company – 0.9%(a) | ||||||||
| | Goldman Sachs Financial Square Government Fund – | | ||||||
| 10,845,477 | 1.701%(b) | $ | 10,845,477 | |||||
| (Cost $10,845,477) | ||||||||
|
| |||||||
| TOTAL INVESTMENTS – 98.4% | ||||||||
| (Cost $1,067,371,932) | $ | 1,142,905,185 | ||||||
|
| |||||||
| | OTHER ASSETS IN EXCESS OF LIABILITIES – 1.6% | 18,170,140 | ||||||
|
| |||||||
| NET ASSETS – 100.0% | $ | 1,161,075,325 | ||||||
|
| |||||||
| The percentage shown for each investment category reflects the value of investments in that category as a percentage of net assets. | ||
* | Non-income producing security. | |
(a) | Represents an affiliated issuer. | |
(b) | Rate shown reflects the yield as of October 31, 2019. | |
| ||
Investment Abbreviations: | ||
PLC | —Public Limited Company | |
REIT | —Real Estate Investment Trust | |
| ||
| ADDITIONAL INVESTMENT INFORMATION |
FUTURES CONTRACTS — At October 31, 2019, the Fund had the following futures contracts:
| Description | Number of Contracts | Expiration Date | Notional Amount | Unrealized Appreciation/ (Depreciation) | ||||||||||||
Long position contracts | ||||||||||||||||
E-mini Russell 2000 Index | 238 | 12/20/19 | $ | 18,839,318 | $ | (234,858 | ) | |||||||||
| The accompanying notes are an integral part of these financial statements. | 47 |
GOLDMAN SACHS SMALL CAP VALUE INSIGHTS FUND
Schedule of Investments
October 31, 2019
| Shares | Description | Value | ||||||
| Common Stocks – 96.5% | ||||||||
| Aerospace & Defense – 0.2% | ||||||||
| 19,669 | Aerojet Rocketdyne Holdings, Inc.* | $ | 850,291 | |||||
| 7,988 | Ducommun, Inc.* | 396,045 | ||||||
|
| |||||||
| 1,246,336 | ||||||||
|
| |||||||
| Air Freight & Logistics – 0.8% | ||||||||
| 75,928 | Atlas Air Worldwide Holdings, Inc.* | 1,665,101 | ||||||
| 80,680 | Echo Global Logistics, Inc.* | 1,606,339 | ||||||
| 23,057 | Hub Group, Inc., Class A* | 1,056,010 | ||||||
| 44,769 | Radiant Logistics, Inc.* | 241,305 | ||||||
|
| |||||||
| 4,568,755 | ||||||||
|
| |||||||
| Airlines – 0.5% | ||||||||
| 44,976 | SkyWest, Inc. | 2,678,321 | ||||||
|
| |||||||
| Auto Components – 0.2% | ||||||||
| 166,127 | American Axle & Manufacturing Holdings, Inc.* | 1,388,822 | ||||||
|
| |||||||
| Banks – 19.7% | ||||||||
| 66,427 | 1st Source Corp. | 3,399,734 | ||||||
| 47,955 | Amalgamated Bank, Class A | 873,261 | ||||||
| 46,096 | Ameris Bancorp | 1,975,214 | ||||||
| 4,942 | Arrow Financial Corp. | 173,563 | ||||||
| 89,633 | Atlantic Capital Bancshares, Inc.* | 1,671,655 | ||||||
| 153,321 | Bancorp, Inc. (The)* | 1,671,199 | ||||||
| 31,742 | BancorpSouth Bank | 973,527 | ||||||
| 15,300 | Banner Corp. | 825,894 | ||||||
| 6,099 | BCB Bancorp, Inc. | 78,677 | ||||||
| 169,047 | Boston Private Financial Holdings, Inc. | 1,901,779 | ||||||
| 20,045 | Bridge Bancorp, Inc. | 649,458 | ||||||
| 13,442 | Capital City Bank Group, Inc. | 382,425 | ||||||
| 37,181 | Cathay General Bancorp | 1,322,528 | ||||||
| 6,981 | CBTX, Inc. | 200,006 | ||||||
| 183,978 | CenterState Bank Corp. | 4,665,682 | ||||||
| 102,476 | Central Pacific Financial Corp. | 2,963,606 | ||||||
| 16,205 | Civista Bancshares, Inc. | 364,288 | ||||||
| 115,049 | Columbia Banking System, Inc. | 4,521,426 | ||||||
| 206,931 | CVB Financial Corp. | 4,300,026 | ||||||
| 15,775 | Eagle Bancorp, Inc. | 712,083 | ||||||
| 2,471 | Esquire Financial Holdings, Inc.* | 60,045 | ||||||
| 27,578 | Financial Institutions, Inc. | 866,776 | ||||||
| 224,692 | First BanCorp. | 2,363,760 | ||||||
| 92,016 | First Bancorp/Southern Pines NC | 3,473,604 | ||||||
| 8,158 | First Bancshares, Inc. (The) | 268,888 | ||||||
| 162,897 | First Commonwealth Financial Corp. | 2,295,219 | ||||||
| 29,831 | First Financial Corp. | 1,308,686 | ||||||
| 199,436 | First Foundation, Inc. | 3,192,970 | ||||||
| 25,551 | First Internet Bancorp | 581,030 | ||||||
| 1,612 | First Mid Bancshares, Inc. | 56,259 | ||||||
| 129,033 | First Midwest Bancorp, Inc. | 2,650,338 | ||||||
| 4,759 | Great Southern Bancorp, Inc. | 287,539 | ||||||
| 48,359 | Hanmi Financial Corp. | 930,911 | ||||||
| 79,805 | Heartland Financial USA, Inc. | 3,733,278 | ||||||
| 105,126 | Heritage Commerce Corp. | 1,263,614 | ||||||
| 40,483 | Heritage Financial Corp. | 1,114,497 | ||||||
| 156,749 | Hilltop Holdings, Inc. | 3,661,657 | ||||||
| 65,732 | Hope Bancorp, Inc. | 937,996 | ||||||
|
| |||||||
| Common Stocks – (continued) | ||||||||
| Banks – (continued) | ||||||||
| 61,563 | Horizon Bancorp, Inc. | 1,123,833 | ||||||
| 17,601 | IBERIABANK Corp. | 1,291,737 | ||||||
| 44,372 | Independent Bank Corp. | 998,814 | ||||||
| 35,636 | Independent Bank Group, Inc. | 1,905,457 | ||||||
| 101,193 | International Bancshares Corp. | 4,144,865 | ||||||
| 364,583 | Investors Bancorp, Inc. | 4,393,225 | ||||||
| 94,856 | Lakeland Bancorp, Inc. | 1,569,867 | ||||||
| 12,772 | Macatawa Bank Corp. | 133,531 | ||||||
| 24,949 | Mercantile Bank Corp. | 878,454 | ||||||
| 11,306 | Metropolitan Bank Holding Corp.* | 485,480 | ||||||
| 83,516 | National Bank Holdings Corp., Class A | 2,872,950 | ||||||
| 14,501 | NBT Bancorp, Inc. | 576,415 | ||||||
| 12,115 | Northeast Bank | 259,382 | ||||||
| 7,059 | Northrim BanCorp, Inc. | 274,948 | ||||||
| 14,137 | OFG Bancorp | 287,122 | ||||||
| 63,258 | Old National Bancorp | 1,138,328 | ||||||
| 31,498 | Old Second Bancorp, Inc. | 380,181 | ||||||
| 5,852 | Opus Bank | 145,071 | ||||||
| 77,074 | Pacific Premier Bancorp, Inc. | 2,601,633 | ||||||
| 2,728 | Parke Bancorp, Inc. | 65,581 | ||||||
| 29,192 | Peapack Gladstone Financial Corp. | 852,406 | ||||||
| 28,004 | Preferred Bank | 1,492,893 | ||||||
| 5,852 | QCR Holdings, Inc. | 237,474 | ||||||
| 7,938 | Republic Bancorp, Inc., Class A | 353,003 | ||||||
| 29,748 | Sandy Spring Bancorp, Inc. | 1,026,306 | ||||||
| 4,680 | SB One Bancorp | 103,334 | ||||||
| 132,061 | Seacoast Banking Corp. of Florida* | 3,697,708 | ||||||
| 31,359 | Sierra Bancorp | 854,219 | ||||||
| 74,535 | Southern National Bancorp of Virginia, Inc. | 1,180,634 | ||||||
| 6,152 | Spirit of Texas Bancshares, Inc.* | 128,577 | ||||||
| 4,569 | Stock Yards Bancorp, Inc. | 182,486 | ||||||
| 39,089 | Towne Bank/Portsmouth VA | 1,098,010 | ||||||
| 85,471 | TriCo Bancshares | 3,216,274 | ||||||
| 55,842 | UMB Financial Corp. | 3,644,249 | ||||||
| 70,504 | Univest Financial Corp. | 1,815,478 | ||||||
| 6,062 | Washington Trust Bancorp, Inc. | 309,708 | ||||||
| 89,178 | WesBanco, Inc. | 3,352,201 | ||||||
|
| |||||||
| 111,744,932 | ||||||||
|
| |||||||
| Beverages – 0.4% | ||||||||
| 9,042 | Coca-Cola Consolidated, Inc. | 2,480,763 | ||||||
|
| |||||||
| Biotechnology – 1.8% | ||||||||
| 44,880 | Anika Therapeutics, Inc.* | 3,159,103 | ||||||
| 12,665 | Avid Bioservices, Inc.* | 67,758 | ||||||
| 10,312 | CareDx, Inc.* | 270,277 | ||||||
| 60,223 | Catalyst Pharmaceuticals, Inc.* | 284,855 | ||||||
| 131,650 | Coherus Biosciences, Inc.* | 2,286,760 | ||||||
| 2,127 | Eagle Pharmaceuticals, Inc.* | 133,363 | ||||||
| 4,544 | Enanta Pharmaceuticals, Inc.* | 276,639 | ||||||
| 4,931 | Esperion Therapeutics, Inc.* | 196,106 | ||||||
| 19,757 | FibroGen, Inc.* | 773,487 | ||||||
| 11,297 | Halozyme Therapeutics, Inc.* | 173,070 | ||||||
| 25,876 | PDL BioPharma, Inc.* | 72,970 | ||||||
| 39,268 | Prothena Corp. PLC (Ireland)* | 357,339 | ||||||
| 59,039 | Radius Health, Inc.* | 1,679,069 | ||||||
|
| |||||||
| 48 | The accompanying notes are an integral part of these financial statements. |
GOLDMAN SACHS SMALL CAP VALUE INSIGHTS FUND
| Shares | Description | Value | ||||||
| Common Stocks – (continued) | ||||||||
| Biotechnology – (continued) | ||||||||
| 23,751 | Vanda Pharmaceuticals, Inc.* | $ | 320,876 | |||||
| 12,885 | Voyager Therapeutics, Inc.* | 198,300 | ||||||
|
| |||||||
| 10,249,972 | ||||||||
|
| |||||||
| Building Products – 2.9% | ||||||||
| 11,255 | Armstrong Flooring, Inc.* | 69,106 | ||||||
| 131,687 | Builders FirstSource, Inc.* | 2,977,443 | ||||||
| 110,055 | Continental Building Products, Inc.* | 3,291,745 | ||||||
| 37,368 | Gibraltar Industries, Inc.* | 1,989,099 | ||||||
| 66,764 | Griffon Corp. | 1,422,741 | ||||||
| 70,173 | JELD-WEN Holding, Inc.* | 1,199,256 | ||||||
| 10,992 | Patrick Industries, Inc.* | 543,115 | ||||||
| 91,678 | Quanex Building Products Corp. | 1,768,469 | ||||||
| 26,410 | Simpson Manufacturing Co., Inc. | 2,182,522 | ||||||
| 14,851 | Universal Forest Products, Inc. | 747,896 | ||||||
|
| |||||||
| 16,191,392 | ||||||||
|
| |||||||
| Capital Markets – 0.9% | ||||||||
| 13,519 | Brightsphere Investment Group, Inc. | 132,757 | ||||||
| 4,187 | GAMCO Investors, Inc., Class A | 65,987 | ||||||
| 13,065 | INTL. FCStone, Inc.* | 522,600 | ||||||
| 18,167 | Moelis & Co., Class A | 648,199 | ||||||
| 53,399 | Oppenheimer Holdings, Inc., Class A | 1,452,453 | ||||||
| 23,249 | Piper Jaffray Cos. | 1,825,976 | ||||||
| 5,419 | Virtus Investment Partners, Inc. | 587,853 | ||||||
|
| |||||||
| 5,235,825 | ||||||||
|
| |||||||
| Chemicals – 1.9% | ||||||||
| 252,524 | Ferro Corp.* | 2,810,592 | ||||||
| 30,706 | Innophos Holdings, Inc. | 1,001,630 | ||||||
| 6,334 | Kraton Corp.* | 142,008 | ||||||
| 67,341 | Minerals Technologies, Inc. | 3,330,013 | ||||||
| 89,067 | PolyOne Corp. | 2,854,597 | ||||||
| 3,768 | Stepan Co. | 368,209 | ||||||
| 10,734 | Trinseo SA | 456,195 | ||||||
|
| |||||||
| 10,963,244 | ||||||||
|
| |||||||
| Commercial Services & Supplies – 2.2% | ||||||||
| 18,149 | Ennis, Inc. | 355,539 | ||||||
| 76,468 | HNI Corp. | 2,905,784 | ||||||
| 9,113 | Interface, Inc. | 151,549 | ||||||
| 50,963 | Kimball International, Inc., Class B | 1,037,607 | ||||||
| 51,069 | Knoll, Inc. | 1,365,585 | ||||||
| 31,349 | Matthews International Corp., Class A | 1,159,286 | ||||||
| 10,402 | McGrath RentCorp | 793,776 | ||||||
| 26,978 | Steelcase, Inc., Class A | 471,306 | ||||||
| 19,858 | UniFirst Corp. | 3,988,281 | ||||||
|
| |||||||
| 12,228,713 | ||||||||
|
| |||||||
| Communications Equipment – 1.1% | ||||||||
| 50,237 | Comtech Telecommunications Corp. | 1,755,783 | ||||||
| 14,678 | Digi International, Inc.* | 211,657 | ||||||
| 52,636 | Lumentum Holdings, Inc.* | 3,298,172 | ||||||
| 70,710 | Viavi Solutions, Inc.* | 1,128,531 | ||||||
|
| |||||||
| 6,394,143 | ||||||||
|
| |||||||
| Common Stocks – (continued) | ||||||||
| Construction & Engineering – 0.4% | ||||||||
| 35,994 | Aegion Corp.* | 779,990 | ||||||
| 122,956 | Great Lakes Dredge & Dock Corp.* | 1,321,777 | ||||||
|
| |||||||
| 2,101,767 | ||||||||
|
| |||||||
| Consumer Finance – 0.4% | ||||||||
| 58,608 | Enova International, Inc.* | 1,376,702 | ||||||
| 11,139 | Nelnet, Inc., Class A | 682,486 | ||||||
|
| |||||||
| 2,059,188 | ||||||||
|
| |||||||
| Diversified Consumer Services – 1.3% | ||||||||
| 34,330 | American Public Education, Inc.* | 745,648 | ||||||
| 24,131 | Carriage Services, Inc. | 621,614 | ||||||
| 27,165 | Collectors Universe, Inc. | 778,549 | ||||||
| 26,640 | K12, Inc.* | 527,206 | ||||||
| 236,938 | Laureate Education, Inc., Class A* | 3,661,877 | ||||||
| 25,299 | WW International, Inc.* | 882,176 | ||||||
|
| |||||||
| 7,217,070 | ||||||||
|
| |||||||
| Diversified Financial Services – 1.1% | ||||||||
| 68,322 | Banco Latinoamericano de Comercio Exterior SA, Class E (Panama) | 1,409,483 | ||||||
| 30,701 | Cannae Holdings, Inc.* | 896,469 | ||||||
| 399,185 | FGL Holdings | 3,604,641 | ||||||
| 111,148 | On Deck Capital, Inc.* | 495,720 | ||||||
|
| |||||||
| 6,406,313 | ||||||||
|
| |||||||
| Diversified Telecommunication Services – 0.7% | ||||||||
| 2,898 | ATN International, Inc. | 171,648 | ||||||
| 47,967 | Cogent Communications Holdings, Inc. | 2,812,785 | ||||||
| 306,383 | ORBCOMM, Inc.* | 1,228,596 | ||||||
|
| |||||||
| 4,213,029 | ||||||||
|
| |||||||
| Electric Utilities – 1.4% | ||||||||
| 23,120 | Otter Tail Corp. | 1,310,441 | ||||||
| 33,067 | PNM Resources, Inc. | 1,724,444 | ||||||
| 85,519 | Portland General Electric Co. | 4,864,321 | ||||||
|
| |||||||
| 7,899,206 | ||||||||
|
| |||||||
| Electrical Equipment – 0.4% | ||||||||
| 25,604 | Encore Wire Corp. | 1,438,945 | ||||||
| 18,408 | Powell Industries, Inc. | 720,857 | ||||||
|
| |||||||
| 2,159,802 | ||||||||
|
| |||||||
| Electronic Equipment, Instruments & Components – 4.7% | ||||||||
| 56,670 | AVX Corp. | 868,184 | ||||||
| 36,343 | Belden, Inc. | 1,863,669 | ||||||
| 111,410 | Benchmark Electronics, Inc. | 3,776,799 | ||||||
| 54,757 | CTS Corp. | 1,460,917 | ||||||
| 11,313 | Daktronics, Inc. | 77,607 | ||||||
| 15,055 | Fabrinet (Thailand)* | 846,543 | ||||||
| 89,144 | II-VI, Inc.* | 2,955,123 | ||||||
| 21,927 | Knowles Corp.* | 473,185 | ||||||
| 30,469 | PC Connection, Inc. | 1,488,106 | ||||||
| 118,111 | Sanmina Corp.* | 3,629,551 | ||||||
| 21,830 | Tech Data Corp.* | 2,652,345 | ||||||
| 61,738 | TTM Technologies, Inc.* | 722,952 | ||||||
|
| |||||||
| The accompanying notes are an integral part of these financial statements. | 49 |
GOLDMAN SACHS SMALL CAP VALUE INSIGHTS FUND
Schedule of Investments(continued)
October 31, 2019
| Shares | Description | Value | ||||||
| Common Stocks – (continued) | ||||||||
| Electronic Equipment, Instruments & Components – (continued) | ||||||||
| 227,924 | Vishay Intertechnology, Inc. | $ | 4,592,669 | |||||
| 44,179 | Vishay Precision Group, Inc.* | 1,504,295 | ||||||
|
| |||||||
| 26,911,945 | ||||||||
|
| |||||||
| Energy Equipment & Services – 1.5% | ||||||||
| 19,228 | Era Group, Inc.* | 185,935 | ||||||
| 17,784 | Exterran Corp.* | 225,323 | ||||||
| 136,727 | Forum Energy Technologies, Inc.* | 158,603 | ||||||
| 79,168 | FTS International, Inc.* | 120,336 | ||||||
| 90,954 | Matrix Service Co.* | 1,706,297 | ||||||
| 525,041 | Nabors Industries Ltd. | 971,326 | ||||||
| 156,299 | Oceaneering International, Inc.* | 2,213,194 | ||||||
| 57,211 | SEACOR Holdings, Inc.* | 2,454,924 | ||||||
| 16,317 | Tidewater, Inc.* | 264,825 | ||||||
| 104,322 | US Silica Holdings, Inc.(a) | 465,276 | ||||||
|
| |||||||
| 8,766,039 | ||||||||
|
| |||||||
| Equity Real Estate Investment Trusts (REITs) – 8.8% | ||||||||
| 180,473 | Cedar Realty Trust, Inc. REIT | 602,780 | ||||||
| 125,540 | First Industrial Realty Trust, Inc. REIT | 5,286,489 | ||||||
| 8,675 | Franklin Street Properties Corp. REIT | 74,605 | ||||||
| 123,710 | Gladstone Commercial Corp. REIT | 2,914,608 | ||||||
| 42,824 | Healthcare Realty Trust, Inc. REIT | 1,488,990 | ||||||
| 105,507 | Independence Realty Trust, Inc. REIT | 1,624,808 | ||||||
| 33,351 | Investors Real Estate Trust REIT | 2,523,670 | ||||||
| 362,861 | Lexington Realty Trust REIT | 3,947,928 | ||||||
| 59,576 | NexPoint Residential Trust, Inc. REIT | 2,905,521 | ||||||
| 81,890 | Physicians Realty Trust REIT | 1,528,886 | ||||||
| 184,679 | Piedmont Office Realty Trust, Inc., Class A REIT | 4,144,197 | ||||||
| 6,888 | PS Business Parks, Inc. REIT | 1,243,628 | ||||||
| 44,469 | Retail Opportunity Investments Corp. REIT | 830,014 | ||||||
| 83,578 | Retail Value, Inc. REIT | 3,059,791 | ||||||
| 111,834 | Rexford Industrial Realty, Inc. REIT | 5,378,097 | ||||||
| 240,236 | RPT Realty REIT | 3,483,422 | ||||||
| 73,138 | Senior Housing Properties Trust REIT | 725,895 | ||||||
| 127,731 | STAG Industrial, Inc. REIT | 3,964,770 | ||||||
| 78,846 | Terreno Realty Corp. REIT | 4,447,703 | ||||||
|
| |||||||
| 50,175,802 | ||||||||
|
| |||||||
| Food & Staples Retailing – 0.3% | ||||||||
| 23,708 | Ingles Markets, Inc., Class A | 934,806 | ||||||
| 9,908 | SpartanNash Co. | 129,745 | ||||||
| 13,925 | Village Super Market, Inc., Class A | 369,013 | ||||||
|
| |||||||
| 1,433,564 | ||||||||
|
| |||||||
| Food Products – 1.9% | ||||||||
| 240,335 | Darling Ingredients, Inc.* | 4,638,465 | ||||||
| 192,401 | Dean Foods Co.(a) | 188,553 | ||||||
| 9,222 | John B Sanfilippo & Son, Inc. | 978,639 | ||||||
| 22,480 | Lancaster Colony Corp. | 3,128,766 | ||||||
| 9,159 | Sanderson Farms, Inc. | 1,417,905 | ||||||
| 17,798 | Simply Good Foods Co. (The)* | 436,763 | ||||||
|
| |||||||
| 10,789,091 | ||||||||
|
| |||||||
| Common Stocks – (continued) | ||||||||
| Gas Utilities – 0.5% | ||||||||
| 21,775 | Northwest Natural Holding Co. | 1,510,314 | ||||||
| 15,334 | Southwest Gas Holdings, Inc. | 1,338,658 | ||||||
|
| |||||||
| 2,848,972 | ||||||||
|
| |||||||
| Health Care Equipment & Supplies – 0.8% | ||||||||
| 42,160 | Integer Holdings Corp.* | 3,264,870 | ||||||
| 31,005 | Invacare Corp. | 239,358 | ||||||
| 7,681 | NuVasive, Inc.* | 541,818 | ||||||
| 7,396 | Tandem Diabetes Care, Inc.* | 455,446 | ||||||
| 4,204 | Varex Imaging Corp.* | 126,162 | ||||||
|
| |||||||
| 4,627,654 | ||||||||
|
| |||||||
| Health Care Providers & Services – 0.6% | ||||||||
| 218,466 | Brookdale Senior Living, Inc.* | 1,605,725 | ||||||
| 126,389 | Community Health Systems, Inc.* | 447,417 | ||||||
| 5,596 | Magellan Health, Inc.* | 363,181 | ||||||
| 1,010 | National Research Corp. | 58,004 | ||||||
| 21,968 | Tenet Healthcare Corp.* | 556,669 | ||||||
| 33,072 | Triple-S Management Corp., Class B* | 500,379 | ||||||
|
| |||||||
| 3,531,375 | ||||||||
|
| |||||||
| Health Care Technology – 0.1% | ||||||||
| 20,554 | Computer Programs & Systems, Inc. | 474,181 | ||||||
| 2,083 | Omnicell, Inc.* | 146,622 | ||||||
|
| |||||||
| 620,803 | ||||||||
|
| |||||||
| Hotels, Restaurants & Leisure – 1.6% | ||||||||
| 62,603 | Brinker International, Inc. | 2,782,703 | ||||||
| 139,898 | Denny’s Corp.* | 2,814,748 | ||||||
| 69,366 | Fiesta Restaurant Group, Inc.* | 596,201 | ||||||
| 3,612 | SeaWorld Entertainment, Inc.* | 95,429 | ||||||
| 34,317 | Wingstop, Inc. | 2,863,067 | ||||||
|
| |||||||
| 9,152,148 | ||||||||
|
| |||||||
| Household Durables – 2.5% | ||||||||
| 9,080 | Bassett Furniture Industries, Inc. | 138,470 | ||||||
| 59,371 | KB Home | 2,118,951 | ||||||
| 61,354 | M/I Homes, Inc.* | 2,710,620 | ||||||
| 7,603 | Meritage Homes Corp.* | 548,100 | ||||||
| 43,596 | Taylor Morrison Home Corp.* | 1,092,080 | ||||||
| 25,111 | TopBuild Corp.* | 2,609,786 | ||||||
| 263,492 | TRI Pointe Group, Inc.* | 4,147,364 | ||||||
| 15,901 | Universal Electronics, Inc.* | 828,760 | ||||||
|
| |||||||
| 14,194,131 | ||||||||
|
| |||||||
| Independent Power and Renewable Electricity Producers – 0.7% | ||||||||
| 69,401 | Atlantic Power Corp.* | 161,704 | ||||||
| 45,856 | Clearway Energy, Inc., Class C | 831,369 | ||||||
| 41,458 | Ormat Technologies, Inc. | 3,174,025 | ||||||
|
| |||||||
| 4,167,098 | ||||||||
|
| |||||||
| Insurance – 3.7% | ||||||||
| 168,049 | American Equity Investment Life Holding Co. | 4,147,449 | ||||||
| 53,356 | AMERISAFE, Inc. | 3,389,707 | ||||||
| 58,580 | Argo Group International Holdings Ltd. | 3,624,345 | ||||||
|
| |||||||
| 50 | The accompanying notes are an integral part of these financial statements. |
GOLDMAN SACHS SMALL CAP VALUE INSIGHTS FUND
| Shares | Description | Value | ||||||
| Common Stocks – (continued) | ||||||||
| Insurance – (continued) | ||||||||
| 22,196 | FBL Financial Group, Inc., Class A | $ | 1,273,607 | |||||
| 310,372 | Genworth Financial, Inc., Class A* | 1,328,392 | ||||||
| 6,797 | Goosehead Insurance, Inc., Class A | 347,870 | ||||||
| 102,886 | MBIA, Inc.* | 955,811 | ||||||
| 50,953 | National General Holdings Corp. | 1,086,318 | ||||||
| 4,694 | National Western Life Group, Inc., Class A | 1,279,584 | ||||||
| 4,171 | Protective Insurance Corp., Class B | 66,361 | ||||||
| 2,120 | Safety Insurance Group, Inc. | 206,064 | ||||||
| 74,733 | Stewart Information Services Corp. | 3,058,074 | ||||||
| 12,214 | United Insurance Holdings Corp. | 149,744 | ||||||
|
| |||||||
| 20,913,326 | ||||||||
|
| |||||||
| Interactive Media & Services – 0.4% | ||||||||
| 190,117 | Cars.com, Inc.* | 2,150,223 | ||||||
|
| |||||||
| Internet & Direct Marketing Retail – 0.1% | ||||||||
| 25,524 | Lands’ End, Inc.* | 308,075 | ||||||
| 3,596 | Stamps.com, Inc.* | 303,610 | ||||||
|
| |||||||
| 611,685 | ||||||||
|
| |||||||
| IT Services – 1.0% | ||||||||
| 183,225 | Perspecta, Inc. | 4,862,791 | ||||||
| 56,033 | Unisys Corp.* | 574,899 | ||||||
|
| |||||||
| 5,437,690 | ||||||||
|
| |||||||
| Leisure Products – 0.4% | ||||||||
| 158,507 | American Outdoor Brands Corp.* | 1,122,230 | ||||||
| 20,602 | Clarus Corp. | 262,676 | ||||||
| 2,662 | Johnson Outdoors, Inc., Class A | 155,860 | ||||||
| 129,212 | Vista Outdoor, Inc.* | 865,720 | ||||||
|
| |||||||
| 2,406,486 | ||||||||
|
| |||||||
| Machinery – 4.0% | ||||||||
| 18,698 | Albany International Corp., Class A | 1,570,258 | ||||||
| 2,792 | Barnes Group, Inc. | 163,193 | ||||||
| 32,448 | Columbus McKinnon Corp. | 1,217,449 | ||||||
| 33,315 | EnPro Industries, Inc. | 2,317,058 | ||||||
| 4,448 | Federal Signal Corp. | 144,293 | ||||||
| 55,980 | Hillenbrand, Inc. | 1,723,624 | ||||||
| 6,584 | Hurco Cos, Inc. | 229,057 | ||||||
| 114,313 | Kennametal, Inc. | 3,537,987 | ||||||
| 16,684 | Miller Industries, Inc. | 599,790 | ||||||
| 57,999 | Mueller Industries, Inc. | 1,784,629 | ||||||
| 75,528 | Navistar International Corp.* | 2,362,516 | ||||||
| 32,660 | Rexnord Corp.* | 923,952 | ||||||
| 4,526 | SPX Corp.* | 206,114 | ||||||
| 3,500 | SPX FLOW, Inc.* | 158,480 | ||||||
| 60,424 | TriMas Corp.* | 1,952,904 | ||||||
| 39,424 | Wabash National Corp. | 562,186 | ||||||
| 36,700 | Watts Water Technologies, Inc., Class A | 3,422,275 | ||||||
|
| |||||||
| 22,875,765 | ||||||||
|
| |||||||
| Marine – 0.3% | ||||||||
| 38,160 | Matson, Inc. | 1,456,949 | ||||||
|
| |||||||
| Common Stocks – (continued) | ||||||||
| Media – 1.3% | ||||||||
| 25,494 | Emerald Expositions Events, Inc. | 247,802 | ||||||
| 48,447 | Liberty Latin America Ltd., Class A (Chile)* | 905,475 | ||||||
| 24,254 | Liberty Latin America Ltd., Class C (Chile)* | 446,516 | ||||||
| 52,403 | Meredith Corp. | 1,975,593 | ||||||
| 126,810 | MSG Networks, Inc., Class A* | 2,055,590 | ||||||
| 26,667 | National CineMedia, Inc. | 223,869 | ||||||
| 120,683 | New Media Investment Group, Inc.(a) | 1,063,217 | ||||||
| 54,532 | WideOpenWest, Inc.* | 346,278 | ||||||
|
| |||||||
| 7,264,340 | ||||||||
|
| |||||||
| Metals & Mining – 2.0% | ||||||||
| 66,124 | Carpenter Technology Corp. | 3,241,398 | ||||||
| 45,878 | Haynes International, Inc. | 1,580,956 | ||||||
| 29,508 | Kaiser Aluminum Corp. | 3,159,717 | ||||||
| 43,675 | Materion Corp. | 2,482,487 | ||||||
| 20,630 | Worthington Industries, Inc. | 759,390 | ||||||
|
| |||||||
| 11,223,948 | ||||||||
|
| |||||||
| Mortgage Real Estate Investment Trusts (REITs) – 0.6% | ||||||||
| 356,195 | Anworth Mortgage Asset Corp. REIT | 1,218,187 | ||||||
| 24,697 | Exantas Capital Corp. REIT | 290,437 | ||||||
| 89,778 | Great Ajax Corp. REIT | 1,405,025 | ||||||
| 16,159 | Ladder Capital Corp. REIT | 279,066 | ||||||
|
| |||||||
| 3,192,715 | ||||||||
|
| |||||||
| Multiline Retail – 0.4% | ||||||||
| 109,339 | Big Lots, Inc. | 2,369,376 | ||||||
|
| |||||||
| Multi-Utilities – 0.5% | ||||||||
| 49,891 | Unitil Corp. | 3,106,713 | ||||||
|
| |||||||
| Oil, Gas & Consumable Fuels – 5.3% | ||||||||
| 113,805 | Ardmore Shipping Corp. (Ireland)* | 909,302 | ||||||
| 198,613 | Clean Energy Fuels Corp.* | 446,879 | ||||||
| 72,138 | CVR Energy, Inc. | 3,420,784 | ||||||
| 113,892 | Delek US Holdings, Inc. | 4,549,985 | ||||||
| 366,722 | Denbury Resources, Inc.* | 366,025 | ||||||
| 338,535 | DHT Holdings, Inc. | 2,616,876 | ||||||
| 6,797 | Dorian LPG Ltd.* | 84,623 | ||||||
| 107,867 | GasLog Ltd. (Monaco) | 1,478,857 | ||||||
| 131,456 | Golar LNG Ltd. (Bermuda) | 1,810,149 | ||||||
| 106,621 | International Seaways, Inc.* | 2,680,452 | ||||||
| 1,440 | NACCO Industries, Inc., Class A | 72,720 | ||||||
| 44,115 | Nordic American Tankers Ltd. | 157,932 | ||||||
| 32,769 | Oasis Petroleum, Inc.* | 85,527 | ||||||
| 12,977 | Par Pacific Holdings, Inc.* | 293,929 | ||||||
| 122,481 | PDC Energy, Inc.* | 2,443,496 | ||||||
| 3,995 | REX American Resources Corp.* | 323,275 | ||||||
| 110,745 | Scorpio Tankers, Inc. (Monaco) | 3,522,799 | ||||||
| 87,499 | Teekay Corp. (Bermuda)(a) | 447,120 | ||||||
| 77,028 | Teekay Tankers Ltd., Class A (Bermuda)* | 157,137 | ||||||
| 106,173 | World Fuel Services Corp. | 4,434,846 | ||||||
|
| |||||||
| 30,302,713 | ||||||||
|
| |||||||
| The accompanying notes are an integral part of these financial statements. | 51 |
GOLDMAN SACHS SMALL CAP VALUE INSIGHTS FUND
Schedule of Investments(continued)
October 31, 2019
| Shares | Description | Value | ||||||
| Common Stocks – (continued) | ||||||||
| Paper & Forest Products – 0.9% | ||||||||
| 85,363 | Boise Cascade Co. | $ | 3,053,435 | |||||
| 112,708 | PH Glatfelter Co. | 2,028,744 | ||||||
|
| |||||||
| 5,082,179 | ||||||||
|
| |||||||
| Personal Products – 0.1% | ||||||||
| 23,936 | elf Beauty, Inc.* | 402,125 | ||||||
|
| |||||||
| Pharmaceuticals – 1.2% | ||||||||
| 16,649 | Akorn, Inc.* | 83,079 | ||||||
| 5,191 | Amphastar Pharmaceuticals, Inc.* | 100,264 | ||||||
| 21,368 | ANI Pharmaceuticals, Inc.* | 1,669,054 | ||||||
| 105,935 | Endo International PLC* | 486,242 | ||||||
| 47,308 | Mallinckrodt PLC*(a) | 149,493 | ||||||
| 47,144 | Phibro Animal Health Corp., Class A | 1,129,570 | ||||||
| 87,181 | Prestige Consumer Healthcare, Inc.* | 3,091,438 | ||||||
| 4,178 | Supernus Pharmaceuticals, Inc.* | 116,107 | ||||||
|
| |||||||
| 6,825,247 | ||||||||
|
| |||||||
| Professional Services – 0.9% | ||||||||
| 1,404 | Barrett Business Services, Inc. | 123,173 | ||||||
| 4,285 | CRA International, Inc. | 211,036 | ||||||
| 5,019 | Heidrick & Struggles International, Inc. | 142,841 | ||||||
| 31,078 | Kelly Services, Inc., Class A | 746,183 | ||||||
| 25,473 | Kforce, Inc. | 1,042,100 | ||||||
| 71,980 | Resources Connection, Inc. | 1,054,507 | ||||||
| 6,930 | TriNet Group, Inc.* | 367,221 | ||||||
| 61,767 | TrueBlue, Inc.* | 1,414,464 | ||||||
|
| |||||||
| 5,101,525 | ||||||||
|
| |||||||
| Real Estate Management & Development – 0.0% | ||||||||
| 6,769 | Tejon Ranch Co.* | 108,846 | ||||||
|
| |||||||
| Road & Rail – 1.1% | ||||||||
| 8,669 | ArcBest Corp. | 250,447 | ||||||
| 29,710 | Covenant Transportation Group, Inc., Class A* | 456,643 | ||||||
| 116,064 | Heartland Express, Inc. | 2,425,738 | ||||||
| 96,667 | Marten Transport Ltd. | 2,093,807 | ||||||
| 24,224 | Werner Enterprises, Inc. | 884,176 | ||||||
|
| |||||||
| 6,110,811 | ||||||||
|
| |||||||
| Semiconductors & Semiconductor Equipment – 2.0% | ||||||||
| 7,919 | Ambarella, Inc.* | 416,777 | ||||||
| 218,984 | Amkor Technology, Inc.* | 2,721,971 | ||||||
| 20,551 | Cirrus Logic, Inc.* | 1,396,646 | ||||||
| 87,119 | NeoPhotonics Corp.* | 573,243 | ||||||
| 254,429 | Rambus, Inc.* | 3,522,570 | ||||||
| 14,286 | Synaptics, Inc.* | 601,583 | ||||||
| 22,567 | Veeco Instruments, Inc.* | 307,814 | ||||||
| 91,350 | Xperi Corp. | 1,854,862 | ||||||
|
| |||||||
| 11,395,466 | ||||||||
|
| |||||||
| Software – 0.1% | ||||||||
| 9,760 | American Software, Inc., Class A | 158,210 | ||||||
| 31,086 | Telenav, Inc.* | 146,415 | ||||||
| 55,944 | TiVo Corp. | 455,384 | ||||||
|
| |||||||
| 760,009 | ||||||||
|
| |||||||
| Common Stocks – (continued) | ||||||||
| Specialty Retail – 4.2% | ||||||||
| 29,777 | Abercrombie & Fitch Co., Class A | 482,090 | ||||||
| 1,429 | America’s Car-Mart, Inc.* | 130,025 | ||||||
| 27,245 | Asbury Automotive Group, Inc.* | 2,809,777 | ||||||
| 88,118 | Cato Corp. (The), Class A | 1,541,184 | ||||||
| 37,627 | Citi Trends, Inc. | 671,642 | ||||||
| 70,378 | Genesco, Inc.* | 2,734,185 | ||||||
| 13,952 | Group 1 Automotive, Inc. | 1,387,387 | ||||||
| 148,181 | Michaels Cos., Inc. (The)* | 1,293,620 | ||||||
| 30,899 | Murphy USA, Inc.* | 3,643,919 | ||||||
| 5,188 | Rent-A-Center, Inc. | 134,213 | ||||||
| 181,220 | Sally Beauty Holdings, Inc.* | 2,808,910 | ||||||
| 40,853 | Sleep Number Corp.* | 1,965,846 | ||||||
| 108,219 | Sonic Automotive, Inc., Class A | 3,487,898 | ||||||
| 65,356 | Tilly’s, Inc., Class A | 670,553 | ||||||
|
| |||||||
| 23,761,249 | ||||||||
|
| |||||||
| Textiles, Apparel & Luxury Goods – 0.4% | ||||||||
| 68,086 | Wolverine World Wide, Inc. | 2,020,792 | ||||||
|
| |||||||
| Thrifts & Mortgage Finance – 1.4% | ||||||||
| 36,482 | First Defiance Financial Corp. | 1,128,023 | ||||||
| 20,705 | Luther Burbank Corp. | 239,557 | ||||||
| 65,319 | Meridian Bancorp, Inc. | 1,277,640 | ||||||
| 43,045 | Provident Financial Services, Inc. | 1,073,973 | ||||||
| 30,321 | Radian Group, Inc. | 761,057 | ||||||
| 8,398 | Riverview Bancorp, Inc. | 60,382 | ||||||
| 12,927 | Sterling Bancorp, Inc. | 125,263 | ||||||
| 1,996 | Territorial Bancorp, Inc. | 59,002 | ||||||
| 102,677 | TrustCo Bank Corp. | 887,129 | ||||||
| 27,745 | United Community Financial Corp. | 316,015 | ||||||
| 41,888 | WSFS Financial Corp. | 1,766,417 | ||||||
|
| |||||||
| 7,694,458 | ||||||||
|
| |||||||
| Tobacco – 0.2% | ||||||||
| 21,105 | Universal Corp. | 1,156,554 | ||||||
|
| |||||||
| Trading Companies & Distributors – 1.7% | ||||||||
| 1,713 | Applied Industrial Technologies, Inc. | 102,506 | ||||||
| 19,980 | Beacon Roofing Supply, Inc.* | 620,179 | ||||||
| 141,287 | BMC Stock Holdings, Inc.* | 3,813,336 | ||||||
| 43,558 | Foundation Building Materials, Inc.* | 809,743 | ||||||
| 89,237 | GMS, Inc.* | 2,673,541 | ||||||
| 6,761 | H&E Equipment Services, Inc. | 229,468 | ||||||
| 37,947 | MRC Global, Inc.* | 431,078 | ||||||
| 54,536 | NOW, Inc.* | 574,809 | ||||||
| 14,901 | Titan Machinery, Inc.* | 247,357 | ||||||
|
| |||||||
| 9,502,017 | ||||||||
|
| |||||||
| Water Utilities – 0.0% | ||||||||
| 2,151 | Artesian Resources Corp., Class A | 79,802 | ||||||
| 3,173 | York Water Co. (The) | 139,739 | ||||||
|
| |||||||
| 219,541 | ||||||||
|
| |||||||
| Wireless Telecommunication Services – 0.0% | ||||||||
| 12,288 | Spok Holdings, Inc. | 146,227 | ||||||
|
| |||||||
| TOTAL COMMON STOCKS | ||||||||
| (Cost $516,026,434) | $ | 548,245,190 | ||||||
|
| |||||||
| 52 | The accompanying notes are an integral part of these financial statements. |
GOLDMAN SACHS SMALL CAP VALUE INSIGHTS FUND
| Shares | Dividend Rate | Value | ||||||
| Investment Company – 1.9%(b) | ||||||||
| | Goldman Sachs Financial Square Government Fund – | | ||||||
| 10,633,890 | 1.701%(c) | $ | 10,633,890 | |||||
| (Cost $10,633,890) | ||||||||
|
| |||||||
| | TOTAL INVESTMENTS BEFORE SECURITIES LENDING REINVESTMENT VEHICLE | | ||||||
| (Cost $526,660,324) | $ | 558,879,080 | ||||||
|
| |||||||
| Securities Lending Reinvestment Vehicle – 0.4%(b) | ||||||||
| | Goldman Sachs Financial Square Government Fund – | | ||||||
| 2,300,481 | 1.701%(c) | $ | 2,300,481 | |||||
| (Cost $2,300,481) | ||||||||
|
| |||||||
| TOTAL INVESTMENTS – 98.8% | ||||||||
| (Cost $528,960,805) | $ | 561,179,561 | ||||||
|
| |||||||
| | OTHER ASSETS IN EXCESS OF LIABILITIES – 1.2% | 7,109,192 | ||||||
|
| |||||||
| NET ASSETS – 100.0% | $ | 568,288,753 | ||||||
|
| |||||||
| The percentage shown for each investment category reflects the value of investments in that category as a percentage of net assets. | ||
* | Non-income producing security. | |
(a) | All or a portion of security is on loan. | |
(b) | Represents an affiliated issuer. | |
(c) | Rate shown reflects the yield as of October 31, 2019. | |
| ||
Investment Abbreviations: | ||
PLC | —Public Limited Company | |
REIT | —Real Estate Investment Trust | |
| ||
| ADDITIONAL INVESTMENT INFORMATION |
FUTURES CONTRACTS — At October 31, 2019, the Fund had the following futures contracts:
| Description | Number of Contracts | Expiration Date | Notional Amount | Unrealized Appreciation/ (Depreciation) | ||||||||||||
Long position contracts | ||||||||||||||||
E-mini Russell 2000 Index | 152 | 12/20/19 | $ | 11,473,639 | $ | 408,201 | ||||||||||
| The accompanying notes are an integral part of these financial statements. | 53 |
GOLDMAN SACHS U.S. EQUITY INSIGHTS FUND
Schedule of Investments
October 31, 2019
| Shares | Description | Value | ||||||
| Common Stocks – 99.1% | ||||||||
| Aerospace & Defense – 0.8% | ||||||||
| 16,957 | Boeing Co. (The) | $ | 5,763,854 | |||||
| 19,580 | HEICO Corp. | 2,414,997 | ||||||
|
| |||||||
| 8,178,851 | ||||||||
|
| |||||||
| Airlines – 1.6% | ||||||||
| 208,405 | Delta Air Lines, Inc. | 11,478,947 | ||||||
| 59,517 | JetBlue Airways Corp.* | 1,148,678 | ||||||
| 73,475 | Southwest Airlines Co. | 4,124,152 | ||||||
|
| |||||||
| 16,751,777 | ||||||||
|
| |||||||
| Banks – 5.5% | ||||||||
| 20,086 | Bank of America Corp. | 628,089 | ||||||
| 298,947 | Citizens Financial Group, Inc. | 10,510,977 | ||||||
| 323,070 | Fifth Third Bancorp | 9,394,876 | ||||||
| 49,363 | JPMorgan Chase & Co. | 6,166,426 | ||||||
| 183,480 | Popular, Inc. | 9,992,321 | ||||||
| 45,115 | Signature Bank | 5,338,007 | ||||||
| 1,567 | SVB Financial Group* | 347,059 | ||||||
| 96,165 | Wells Fargo & Co. | 4,964,999 | ||||||
| 56,659 | Western Alliance Bancorp | 2,794,988 | ||||||
| 128,020 | Zions Bancorp NA | 6,205,129 | ||||||
|
| |||||||
| 56,342,871 | ||||||||
|
| |||||||
| Beverages – 0.8% | ||||||||
| 143,309 | Monster Beverage Corp.* | 8,043,934 | ||||||
|
| |||||||
| Biotechnology – 4.3% | ||||||||
| 185,824 | AbbVie, Inc. | 14,782,299 | ||||||
| 54,245 | Alexion Pharmaceuticals, Inc.* | 5,717,423 | ||||||
| 19,795 | Biogen, Inc.* | 5,912,965 | ||||||
| 206,934 | Gilead Sciences, Inc. | 13,183,765 | ||||||
| 46,890 | Incyte Corp.* | 3,935,009 | ||||||
|
| |||||||
| 43,531,461 | ||||||||
|
| |||||||
| Building Products – 1.2% | ||||||||
| 273,008 | Johnson Controls International PLC | 11,829,437 | ||||||
|
| |||||||
| Capital Markets – 1.7% | ||||||||
| 4,990 | Ameriprise Financial, Inc. | 752,941 | ||||||
| 192,019 | Morgan Stanley | 8,842,475 | ||||||
| 12,577 | S&P Global, Inc. | 3,244,740 | ||||||
| 40,788 | State Street Corp. | 2,694,863 | ||||||
| 42,997 | TD Ameritrade Holding Corp. | 1,650,225 | ||||||
|
| |||||||
| 17,185,244 | ||||||||
|
| |||||||
| Chemicals – 2.0% | ||||||||
| 42,862 | Axalta Coating Systems Ltd.* | 1,264,001 | ||||||
| 49,758 | Dow, Inc. | 2,512,282 | ||||||
| 6,605 | Eastman Chemical Co. | 502,244 | ||||||
| 19,919 | Ecolab, Inc. | 3,825,842 | ||||||
| 20,926 | Sherwin-Williams Co. (The) | 11,976,368 | ||||||
|
| |||||||
| 20,080,737 | ||||||||
|
| |||||||
| Commercial Services & Supplies – 0.7% | ||||||||
| 25,949 | Cintas Corp. | 6,971,718 | ||||||
|
| |||||||
| Communications Equipment – 1.5% | ||||||||
| 330,687 | Cisco Systems, Inc. | 15,710,939 | ||||||
|
| |||||||
| Common Stocks – (continued) | ||||||||
| Construction Materials – 0.2% | ||||||||
| 8,133 | Martin Marietta Materials, Inc. | 2,130,114 | ||||||
| 1,005 | Vulcan Materials Co. | 143,584 | ||||||
|
| |||||||
| 2,273,698 | ||||||||
|
| |||||||
| Consumer Finance – 2.1% | ||||||||
| 327,064 | Ally Financial, Inc. | 10,017,970 | ||||||
| 3,201 | Capital One Financial Corp. | 298,493 | ||||||
| 310,259 | Synchrony Financial | 10,973,861 | ||||||
|
| |||||||
| 21,290,324 | ||||||||
|
| |||||||
| Diversified Financial Services – 1.5% | ||||||||
| 51,270 | AXA Equitable Holdings, Inc. | 1,107,432 | ||||||
| 49,937 | Berkshire Hathaway, Inc., Class B* | 10,615,608 | ||||||
| 67,141 | Voya Financial, Inc. | 3,622,928 | ||||||
|
| |||||||
| 15,345,968 | ||||||||
|
| |||||||
| Diversified Telecommunication Services – 0.1% | ||||||||
| 32,313 | AT&T, Inc. | 1,243,727 | ||||||
|
| |||||||
| Electric Utilities – 3.2% | ||||||||
| 254,836 | Exelon Corp. | 11,592,490 | ||||||
| 231,598 | FirstEnergy Corp. | 11,190,815 | ||||||
| 296,121 | PPL Corp. | 9,917,092 | ||||||
|
| |||||||
| 32,700,397 | ||||||||
|
| |||||||
| Electrical Equipment – 0.2% | ||||||||
| 24,788 | Eaton Corp. PLC | 2,159,283 | ||||||
|
| |||||||
| Electronic Equipment, Instruments & Components – 1.1% | ||||||||
| 107,278 | Keysight Technologies, Inc.* | 10,825,423 | ||||||
|
| |||||||
| Energy Equipment & Services – 0.2% | ||||||||
| 123,828 | TechnipFMC PLC (United Kingdom) | 2,443,126 | ||||||
|
| |||||||
| Equity Real Estate Investment Trusts (REITs) – 6.1% | ||||||||
| 45,229 | CubeSmart REIT | 1,433,759 | ||||||
| 305,889 | Duke Realty Corp. REIT | 10,748,939 | ||||||
| 140,522 | Equity LifeStyle Properties, Inc. REIT | 9,828,109 | ||||||
| 55,283 | Extra Space Storage, Inc. REIT | 6,206,622 | ||||||
| 334,896 | Invitation Homes, Inc. REIT | 10,311,448 | ||||||
| 143,150 | Prologis, Inc. REIT | 12,562,844 | ||||||
| 46,667 | Public Storage REIT | 10,400,208 | ||||||
| 2,371 | Sun Communities, Inc. REIT | 385,643 | ||||||
|
| |||||||
| 61,877,572 | ||||||||
|
| |||||||
| Food & Staples Retailing – 2.8% | ||||||||
| 51,761 | Costco Wholesale Corp. | 15,378,711 | ||||||
| 44,285 | US Foods Holding Corp.* | 1,756,786 | ||||||
| 212,949 | Walgreens Boots Alliance, Inc. | 11,665,346 | ||||||
|
| |||||||
| 28,800,843 | ||||||||
|
| |||||||
| Food Products – 0.0% | ||||||||
| 5,451 | Bunge Ltd. | 294,354 | ||||||
|
| |||||||
| Health Care Equipment & Supplies – 2.2% | ||||||||
| 51,857 | Becton Dickinson and Co. | 13,275,392 | ||||||
| 125,752 | DENTSPLY SIRONA, Inc. | 6,888,695 | ||||||
| 8,482 | STERIS PLC | 1,200,797 | ||||||
|
| |||||||
| 54 | The accompanying notes are an integral part of these financial statements. |
GOLDMAN SACHS U.S. EQUITY INSIGHTS FUND
| Shares | Description | Value | ||||||
| Common Stocks – (continued) | ||||||||
| Health Care Equipment & Supplies – (continued) | ||||||||
| 1,369 | Teleflex, Inc. | $ | 475,604 | |||||
|
| |||||||
| 21,840,488 | ||||||||
|
| |||||||
| Health Care Providers & Services – 3.3% | ||||||||
| 48,530 | Anthem, Inc. | 13,058,452 | ||||||
| 91,045 | HCA Healthcare, Inc. | 12,158,149 | ||||||
| 1,075 | McKesson Corp. | 142,975 | ||||||
| 22,118 | UnitedHealth Group, Inc. | 5,589,219 | ||||||
| 22,132 | Universal Health Services, Inc., Class B | 3,042,265 | ||||||
|
| |||||||
| 33,991,060 | ||||||||
|
| |||||||
| Hotels, Restaurants & Leisure – 2.6% | ||||||||
| 652 | Chipotle Mexican Grill, Inc.* | 507,360 | ||||||
| 31,794 | MGM Resorts International | 906,129 | ||||||
| 169,714 | Starbucks Corp. | 14,351,016 | ||||||
| 100,818 | Yum! Brands, Inc. | 10,254,199 | ||||||
|
| |||||||
| 26,018,704 | ||||||||
|
| |||||||
| Household Durables – 1.2% | ||||||||
| 207,696 | D.R. Horton, Inc. | 10,877,039 | ||||||
| 14,043 | Lennar Corp., Class A | 836,963 | ||||||
|
| |||||||
| 11,714,002 | ||||||||
|
| |||||||
| Household Products – 0.2% | ||||||||
| 19,114 | Procter & Gamble Co. (The) | 2,379,884 | ||||||
|
| |||||||
| Independent Power and Renewable Electricity Producers – 1.0% | ||||||||
| 622,635 | AES Corp. | 10,615,927 | ||||||
|
| |||||||
| Insurance – 1.9% | ||||||||
| 18,148 | Aon PLC | 3,505,468 | ||||||
| 13,889 | Athene Holding Ltd., Class A* | 602,088 | ||||||
| 155,727 | Progressive Corp. (The) | 10,854,172 | ||||||
| 147,535 | Unum Group | 4,063,114 | ||||||
|
| |||||||
| 19,024,842 | ||||||||
|
| |||||||
| Interactive Media & Services – 6.8% | ||||||||
| 16,163 | Alphabet, Inc., Class A* | 20,345,985 | ||||||
| 16,103 | Alphabet, Inc., Class C* | 20,291,551 | ||||||
| 151,158 | Facebook, Inc., Class A* | 28,969,430 | ||||||
|
| |||||||
| 69,606,966 | ||||||||
|
| |||||||
| Internet & Direct Marketing Retail – 5.3% | ||||||||
| 22,585 | Amazon.com, Inc.* | 40,125,866 | ||||||
| 6,637 | Booking Holdings, Inc.* | 13,597,687 | ||||||
|
| |||||||
| 53,723,553 | ||||||||
|
| |||||||
| IT Services – 4.3% | ||||||||
| 3,424 | CACI International, Inc., Class A* | 766,120 | ||||||
| 4,577 | Mastercard, Inc., Class A | 1,266,959 | ||||||
| 142,964 | PayPal Holdings, Inc.* | 14,882,553 | ||||||
| 58,000 | VeriSign, Inc.* | 11,021,160 | ||||||
| 85,876 | Visa, Inc., Class A | 15,359,781 | ||||||
|
| |||||||
| 43,296,573 | ||||||||
|
| |||||||
| Common Stocks – (continued) | ||||||||
| Life Sciences Tools & Services – 1.1% | ||||||||
| 41,726 | IQVIA Holdings, Inc.* | 6,026,069 | ||||||
| 7,713 | Mettler-Toledo International, Inc.* | 5,437,202 | ||||||
|
| |||||||
| 11,463,271 | ||||||||
|
| |||||||
| Machinery – 0.6% | ||||||||
| 18,975 | Allison Transmission Holdings, Inc. | 827,500 | ||||||
| 10,562 | Caterpillar, Inc. | 1,455,444 | ||||||
| 53,887 | PACCAR, Inc. | 4,098,645 | ||||||
|
| |||||||
| 6,381,589 | ||||||||
|
| |||||||
| Media – 1.3% | ||||||||
| 8,824 | Charter Communications, Inc., Class A* | 4,128,397 | ||||||
| 64,054 | Liberty Global PLC, Class C (United Kingdom)* | 1,528,969 | ||||||
| 544,961 | News Corp., Class A | 7,471,415 | ||||||
|
| |||||||
| 13,128,781 | ||||||||
|
| |||||||
| Metals & Mining – 0.5% | ||||||||
| 253,373 | Alcoa Corp.* | 5,267,625 | ||||||
|
| |||||||
| Multiline Retail – 0.7% | ||||||||
| 455,053 | Macy’s, Inc. | 6,898,603 | ||||||
|
| |||||||
| Multi-Utilities – 0.8% | ||||||||
| 66,759 | DTE Energy Co. | 8,499,756 | ||||||
|
| |||||||
| Oil, Gas & Consumable Fuels – 3.4% | ||||||||
| 11,747 | Chevron Corp. | 1,364,297 | ||||||
| 226,511 | ConocoPhillips | 12,503,407 | ||||||
| 27,900 | Exxon Mobil Corp. | 1,885,203 | ||||||
| 145,037 | HollyFrontier Corp. | 7,968,333 | ||||||
| 85,076 | Valero Energy Corp. | 8,250,670 | ||||||
| 92,848 | Williams Cos., Inc. (The) | 2,071,439 | ||||||
|
| |||||||
| 34,043,349 | ||||||||
|
| |||||||
| Personal Products – 1.2% | ||||||||
| 64,219 | Estee Lauder Cos., Inc. (The), Class A | 11,962,073 | ||||||
|
| |||||||
| Pharmaceuticals – 4.0% | ||||||||
| 140,826 | Johnson & Johnson | 18,594,665 | ||||||
| 45,618 | Merck & Co., Inc. | 3,953,256 | ||||||
| 217,622 | Mylan NV* | 4,167,461 | ||||||
| 376,080 | Pfizer, Inc. | 14,430,190 | ||||||
|
| |||||||
| 41,145,572 | ||||||||
|
| |||||||
| Professional Services – 0.6% | ||||||||
| 10,583 | CoStar Group, Inc.* | 5,815,570 | ||||||
|
| |||||||
| Road & Rail – 1.7% | ||||||||
| 50,313 | CSX Corp. | 3,535,495 | ||||||
| 80,803 | Union Pacific Corp. | 13,369,664 | ||||||
|
| |||||||
| 16,905,159 | ||||||||
|
| |||||||
| Semiconductors & Semiconductor Equipment – 2.6% | ||||||||
| 60,957 | Analog Devices, Inc. | 6,499,845 | ||||||
| 8,232 | Intel Corp. | 465,355 | ||||||
|
| |||||||
| The accompanying notes are an integral part of these financial statements. | 55 |
GOLDMAN SACHS U.S. EQUITY INSIGHTS FUND
Schedule of Investments(continued)
October 31, 2019
| Shares | Description | Value | ||||||
| Common Stocks – (continued) | ||||||||
| Semiconductors & Semiconductor Equipment – (continued) | ||||||||
| 25,958 | Micron Technology, Inc.* | $ | 1,234,303 | |||||
| 81,511 | NXP Semiconductors NV (Netherlands) | 9,266,171 | ||||||
| 74,368 | Texas Instruments, Inc. | 8,774,680 | ||||||
|
| |||||||
| 26,240,354 | ||||||||
|
| |||||||
| Software – 7.0% | ||||||||
| 581 | Adobe, Inc.* | 161,477 | ||||||
| 21,976 | Cadence Design Systems, Inc.* | 1,436,132 | ||||||
| 48,427 | Intuit, Inc. | 12,469,952 | ||||||
| 379,537 | Microsoft Corp. | 54,414,220 | ||||||
| 11,607 | ServiceNow, Inc.* | 2,869,947 | ||||||
|
| |||||||
| 71,351,728 | ||||||||
|
| |||||||
| Specialty Retail – 2.1% | ||||||||
| 87,516 | Home Depot, Inc. (The) | 20,529,503 | ||||||
| 18,062 | L Brands, Inc. | 307,777 | ||||||
|
| |||||||
| 20,837,280 | ||||||||
|
| |||||||
| Technology Hardware, Storage & Peripherals – 4.5% | ||||||||
| 181,963 | Apple, Inc. | 45,265,116 | ||||||
|
| |||||||
| Textiles, Apparel & Luxury Goods – 0.0% | ||||||||
| 13,918 | Tapestry, Inc. | 359,919 | ||||||
|
| |||||||
| Common Stocks – (continued) | ||||||||
| Tobacco – 0.6% | ||||||||
| 72,799 | Philip Morris International, Inc. | 5,928,751 | ||||||
|
| |||||||
| TOTAL INVESTMENTS – 99.1% | ||||||||
| (Cost $878,928,307) | $ | 1,007,588,179 | ||||||
|
| |||||||
| | OTHER ASSETS IN EXCESS OF LIABILITIES – 0.9% | 8,969,530 | ||||||
|
| |||||||
| NET ASSETS – 100.0% | $ | 1,016,557,709 | ||||||
|
| |||||||
| The percentage shown for each investment category reflects the value of investments in that category as a percentage of net assets. | ||
* | Non-income producing security. | |
| ||
Investment Abbreviations: | ||
PLC | —Public Limited Company | |
REIT | —Real Estate Investment Trust | |
| ||
| 56 | The accompanying notes are an integral part of these financial statements. |
GOLDMAN SACHS DOMESTIC EQUITY INSIGHTS FUNDS
Statements of Assets and Liabilities
October 31, 2019
Large Cap Growth Insights Fund | Large Cap Value Insights Fund | Small Cap Equity Insights Fund | ||||||||||||
| Assets: |
| |||||||||||||
Investments of unaffiliated issuers, at value (cost $1,588,909,801, $422,710,132 and $641,110,329, respectively)(a) | $ | 1,944,920,574 | $ | 449,006,001 | $ | 685,009,554 | ||||||||
Investments of affiliated issuers, at value (cost $0, $0 and $7,203,961, respectively) | — | — | 7,203,961 | |||||||||||
Investments in securities lending reinvestment vehicle — affiliated issuer, at value (cost $0, $0 and $1,732,225, respectively | — | — | 1,732,225 | |||||||||||
Cash | 9,518,509 | 699,604 | 10,601,206 | |||||||||||
Receivables: | ||||||||||||||
Investments sold | 55,390,198 | 14,870,181 | 12,439,965 | |||||||||||
Dividends | 1,054,316 | 608,722 | 180,297 | |||||||||||
Fund shares sold | 659,503 | 501,337 | 3,376,364 | |||||||||||
Reimbursement from investment adviser | 217,683 | 96,586 | 132,542 | |||||||||||
Securities lending income | — | — | 5,890 | |||||||||||
Collateral on certain derivative contracts(b) | — | — | 511,225 | |||||||||||
Other assets | 69,020 | 61,965 | 70,592 | |||||||||||
| Total assets | 2,011,829,803 | 465,844,396 | 721,263,821 | |||||||||||
| Liabilities: |
| |||||||||||||
Variation margin on futures contracts | — | — | 78,650 | |||||||||||
Payables: | ||||||||||||||
Investments purchased | 51,516,444 | 11,985,079 | 12,169,789 | |||||||||||
Fund shares redeemed | 5,836,928 | 336,520 | 812,902 | |||||||||||
Management fees | 814,609 | 198,366 | 461,450 | |||||||||||
Distribution and Service fees and Transfer Agency fees | 283,262 | 67,495 | 62,365 | |||||||||||
Upon return of securities loaned | — | — | 1,732,225 | |||||||||||
Accrued expenses | 474,724 | 195,530 | 255,024 | |||||||||||
| Total liabilities | 58,925,967 | 12,782,990 | 15,572,405 | |||||||||||
| Net Assets: |
| |||||||||||||
Paid-in capital | 1,530,242,740 | 434,352,560 | 667,879,240 | |||||||||||
Total distributable earnings | 422,661,096 | 18,708,846 | 37,812,176 | |||||||||||
| NET ASSETS | $ | 1,952,903,836 | $ | 453,061,406 | $ | 705,691,416 | ||||||||
Net Assets: | ||||||||||||||
Class A | $ | 301,505,736 | $ | 65,555,680 | $ | 53,502,682 | ||||||||
Class C | 42,004,273 | 12,694,181 | 7,784,765 | |||||||||||
Institutional | 760,315,626 | 120,416,817 | 290,652,042 | |||||||||||
Service | 50,444,747 | 7,554,190 | 3,141,231 | |||||||||||
Investor | 401,676,650 | 134,069,122 | 74,880,877 | |||||||||||
Class P | 49,099,346 | 33,600,851 | 106,038,943 | |||||||||||
Class R | 34,396,638 | 5,189,188 | 16,562,209 | |||||||||||
Class R6 | 313,460,820 | 73,981,377 | 153,128,667 | |||||||||||
Total Net Assets | $ | 1,952,903,836 | $ | 453,061,406 | $ | 705,691,416 | ||||||||
Shares Outstanding $0.001 par value (unlimited number of shares authorized): | ||||||||||||||
Class A | 9,558,810 | 3,082,360 | 2,088,497 | |||||||||||
Class C | 1,511,270 | 602,684 | 357,948 | |||||||||||
Institutional | 23,201,503 | 5,668,805 | 10,869,159 | |||||||||||
Service | 1,626,313 | 353,695 | 124,806 | |||||||||||
Investor | 12,902,940 | 6,328,620 | 2,936,842 | |||||||||||
Class P | 1,499,626 | 1,582,681 | 3,965,654 | |||||||||||
Class R | 1,119,228 | 245,666 | 663,480 | |||||||||||
Class R6 | 9,570,075 | 3,482,858 | 5,725,622 | |||||||||||
Net asset value, offering and redemption price per share:(c) | ||||||||||||||
Class A | $31.54 | $21.27 | $25.62 | |||||||||||
Class C | 27.79 | 21.06 | 21.75 | |||||||||||
Institutional | 32.77 | 21.24 | 26.74 | |||||||||||
Service | 31.02 | 21.36 | 25.17 | |||||||||||
Investor | 31.13 | 21.18 | 25.50 | |||||||||||
Class P | 32.74 | 21.23 | 26.74 | |||||||||||
Class R | 30.73 | 21.12 | 24.96 | |||||||||||
Class R6 | 32.75 | 21.24 | 26.74 | |||||||||||
| (a) | Includes loaned securities having a market value of $1,617,922 for the Small Cap Equity Insights Fund. |
| (b) | Segregated for initial margin and/or collateral as follows: |
| Fund | Futures | |||
Small Cap Equity Insights Fund | $ | 511,225 | ||
| (c) | Maximum public offering price per share for Class A Shares of the Large Cap Growth Insights, Large Cap Value Insights and Small Cap Equity Insights Funds is $33.38, $22.51 and $27.11, respectively. At redemption, Class C Shares may be subject to a contingent deferred sales charge assessed on the amount equal to the lesser of the current NAV or the original purchase price of the shares. |
| The accompanying notes are an integral part of these financial statements. | 57 |
GOLDMAN SACHS DOMESTIC EQUITY INSIGHTS FUNDS
Statements of Assets and Liabilities(continued)
October 31, 2019
Small Cap Growth Insights Fund | Small Cap Value Insights Fund | U.S. Equity Insights Fund | ||||||||||||
| Assets: |
| |||||||||||||
Investments of unaffiliated issuers, at value (cost $1,056,526,455, $516,026,434 and $878,928,307, respectively)(a) | $ | 1,132,059,708 | $ | 548,245,190 | $ | 1,007,588,179 | ||||||||
Investments of affiliated issuers, at value (cost $10,845,477, $10,633,890 and $0, respectively) | 10,845,477 | 10,633,890 | — | |||||||||||
Investments in securities lending reinvestment vehicle — affiliated issuer, (cost $0, $2,300,481and $0, respectively) | — | 2,300,481 | — | |||||||||||
Cash | 17,534,879 | 8,549,852 | 9,176,723 | |||||||||||
Receivables: | ||||||||||||||
Investments sold | 20,153,542 | — | — | |||||||||||
Fund shares sold | 1,330,947 | 1,201,402 | 493,265 | |||||||||||
Collateral on certain derivative contracts(b) | 850,850 | 543,400 | — | |||||||||||
Reimbursement from investment advisor | 205,506 | 116,468 | 176,191 | |||||||||||
Dividends | 126,354 | 233,713 | 1,002,045 | |||||||||||
Securities lending income | 136 | 4,399 | — | |||||||||||
Other assets | 53,349 | 46,239 | 53,269 | |||||||||||
| Total assets | 1,183,160,748 | 571,875,034 | 1,018,489,672 | |||||||||||
| Liabilities: | ||||||||||||||
Variation margin on futures contracts | 130,900 | 83,600 | — | |||||||||||
Payables: | ||||||||||||||
Upon return of securities loaned | — | 2,300,481 | — | |||||||||||
Investments purchased | 18,792,716 | — | — | |||||||||||
Fund shares redeemed | 1,821,435 | 437,040 | 981,968 | |||||||||||
Management fees | 767,929 | 364,603 | 446,390 | |||||||||||
Distribution and Service fees and Transfer Agency fees | 120,849 | 76,050 | 182,657 | |||||||||||
Accrued expenses | 451,594 | 324,507 | 320,948 | |||||||||||
| Total liabilities | 22,085,423 | 3,586,281 | 1,931,963 | |||||||||||
| Net Assets: | ||||||||||||||
Paid-in capital | 1,074,371,271 | 536,575,058 | 890,235,766 | |||||||||||
Total distributable earnings | 86,704,054 | 31,713,695 | 126,321,943 | |||||||||||
| NET ASSETS | $ | 1,161,075,325 | $ | 568,288,753 | $ | 1,016,557,709 | ||||||||
Net Assets: | ||||||||||||||
Class A | $ | 84,556,546 | $ | 132,886,222 | $ | 299,439,947 | ||||||||
Class C | 8,302,626 | 7,960,871 | 15,854,218 | |||||||||||
Institutional | 349,348,269 | 192,819,736 | 295,408,076 | |||||||||||
Service | — | — | 6,700,498 | |||||||||||
Investor | 378,807,360 | 59,799,690 | 116,633,327 | |||||||||||
Class P | 12,533,600 | 47,977,234 | 225,898,744 | |||||||||||
Class R | 19,707,190 | 8,514,441 | 44,555,091 | |||||||||||
Class R6 | 307,819,734 | 118,330,559 | 12,067,808 | |||||||||||
Total Net Assets | $ | 1,161,075,325 | $ | 568,288,753 | $ | 1,016,557,709 | ||||||||
Shares Outstanding $0.001 par value (unlimited number of shares authorized): | ||||||||||||||
Class A | 2,410,217 | 3,347,753 | 6,052,320 | |||||||||||
Class C | 317,386 | 292,234 | 359,982 | |||||||||||
Institutional | 8,333,069 | 3,587,946 | 5,773,956 | |||||||||||
Service | — | — | 136,213 | |||||||||||
Investor | 10,475,174 | 1,512,918 | 2,388,138 | |||||||||||
Class P | 298,822 | 893,020 | 4,416,981 | |||||||||||
Class R | 586,916 | 218,531 | 919,204 | |||||||||||
Class R6 | 7,338,473 | 2,202,380 | 236,020 | |||||||||||
Net asset value, offering and redemption price per share(c): | ||||||||||||||
Class A | $35.08 | $39.69 | $49.48 | |||||||||||
Class C | 26.16 | 27.24 | 44.04 | |||||||||||
Institutional | 41.92 | 53.74 | 51.16 | |||||||||||
Service | — | — | 49.19 | |||||||||||
Investor | 36.16 | 39.53 | 48.84 | |||||||||||
Class P | 41.94 | 53.72 | 51.14 | |||||||||||
Class R | 33.58 | 38.96 | 48.47 | |||||||||||
Class R6 | 41.95 | 53.73 | 51.13 | |||||||||||
| (a) | Includes loaned securities having a market value of $2,083,439 for the Small Cap Value Insights Fund. |
| (b) | Segregated for initial margin and/or collateral as follows: |
| Fund | Futures | |||
Small Cap Growth Insights | $ | 850,850 | ||
Small Cap Value Insights | 543,400 | |||
| (c) | Maximum public offering price per share for Class A Shares of the Small Cap Growth Insights, Small Cap Value Insights and U.S. Equity Insights Funds is $37.12, $42.00 and $52.36, respectively. At redemption, Class C Shares may be subject to a contingent deferred sales charge assessed on the amount equal to the lesser of the current NAV or the original purchase price of the shares. |
| 58 | The accompanying notes are an integral part of these financial statements. |
GOLDMAN SACHS DOMESTIC EQUITY INSIGHTS FUNDS
Statements of Operations
For the Fiscal Year Ended October 31, 2019
Large Cap Growth Insights Fund | Large Cap Value Insights Fund | Small Cap Equity Insights Fund | ||||||||||||
| Investment income: |
| |||||||||||||
Dividends — unaffiliated issuers (net of foreign withholding taxes of $34,766, $13,694 and $419, respectively) | $ | 25,787,089 | $ | 11,628,745 | $ | 8,444,429 | ||||||||
Dividends — affiliated issuers | 70,294 | 110,158 | 131,744 | |||||||||||
Securities lending income — affiliated issuer | 4,558 | — | 109,447 | |||||||||||
| Total investment income | 25,861,941 | 11,738,903 | 8,685,620 | |||||||||||
| Expenses: |
| |||||||||||||
Management fees | 10,105,673 | 2,625,032 | 4,939,077 | |||||||||||
Transfer Agency fees(a) | 1,897,862 | 456,102 | 399,074 | |||||||||||
Distribution and Service fees(a) | 1,417,546 | 315,492 | 281,553 | |||||||||||
Registration fees | 341,719 | 227,011 | 251,900 | |||||||||||
Custody, accounting and administrative services | 208,107 | 136,162 | 168,417 | |||||||||||
Printing and mailing cost | 176,175 | 70,766 | 89,172 | |||||||||||
Service Share fees — Service Plan | 133,581 | 21,757 | 6,826 | |||||||||||
Service Share fees — Shareholder Administration Plan | 133,581 | 21,757 | 6,826 | |||||||||||
Professional fees | 106,047 | 106,047 | 106,047 | |||||||||||
Trustee fees | 26,871 | 18,627 | 18,894 | |||||||||||
Other | 136,245 | 44,788 | 73,621 | |||||||||||
| Total expenses | 14,683,407 | 4,043,541 | 6,341,407 | |||||||||||
Less — expense reductions | (844,173 | ) | (571,184 | ) | (655,925 | ) | ||||||||
| Net expenses | 13,839,234 | 3,472,357 | 5,685,482 | |||||||||||
| NET INVESTMENT INCOME | 12,022,707 | 8,266,546 | 3,000,138 | |||||||||||
| Realized and unrealized gain (loss): |
| |||||||||||||
Net realized gain (loss) from: | ||||||||||||||
Investments — unaffiliated issuers | 66,103,785 | (5,969,169 | ) | (9,811,031 | ) | |||||||||
Futures contracts | 1,665,745 | 350,631 | 1,186,467 | |||||||||||
Net change in unrealized gain on: |
| |||||||||||||
Investments — unaffiliated issuers | 147,817,520 | 24,276,289 | 53,905,336 | |||||||||||
Futures contracts | — | 666,310 | 36,715 | |||||||||||
| Net realized and unrealized gain | 215,587,050 | 19,324,061 | 45,317,487 | |||||||||||
| NET INCREASE IN NET ASSETS RESULTING FROM OPERATIONS | $ | 227,609,757 | $ | 27,590,607 | $ | 48,317,625 | ||||||||
| (a) | Class specific Distribution and/or Service and Transfer Agency fees were as follows: |
| Distribution and Service Fees | Transfer Agency Fees | |||||||||||||||||||||||||||||||||||||||||||
Class A | Class C | Class R | Class A | Class C | Institutional | Service | Investor | Class P | Class R | Class R6 | ||||||||||||||||||||||||||||||||||
Large Cap Growth Insights | $ | 803,074 | $ | 484,594 | $ | 129,878 | $ | 567,426 | $ | 85,773 | $ | 315,535 | $ | 21,373 | $ | 745,481 | $ | 13,429 | $ | 45,833 | $ | 103,012 | ||||||||||||||||||||||
Large Cap Value Insights | 164,058 | 123,950 | 27,484 | 115,882 | 21,889 | 57,767 | 3,481 | 201,183 | 9,813 | 9,714 | 36,373 | |||||||||||||||||||||||||||||||||
Small Cap Equity Insights | 131,028 | 76,565 | 73,960 | 92,573 | 13,526 | 96,481 | 1,092 | 96,110 | 29,104 | 26,086 | 44,102 | |||||||||||||||||||||||||||||||||
| The accompanying notes are an integral part of these financial statements. | 59 |
GOLDMAN SACHS DOMESTIC EQUITY INSIGHTS FUNDS
Statements of Operations(continued)
For the Fiscal Year Ended October 31, 2019
| Small Cap Growth Insights Fund | Small Cap Value Insights Fund | U.S. Equity Insights Fund | ||||||||||||
| Investment income: |
| |||||||||||||
Dividends — unaffiliated issuers (net of foreign withholding taxes of $—, $849 and $28,257, respectively) | $ | 8,542,275 | $ | 7,608,109 | $ | 26,479,738 | ||||||||
Dividends — affiliated issuers | 306,034 | 171,389 | 127,638 | |||||||||||
Securities lending income — affiliated issuer | 244,377 | 12,427 | 1,851 | |||||||||||
| Total investment income | 9,092,686 | 7,791,925 | 26,609,227 | |||||||||||
| Expenses: |
| |||||||||||||
Management fees | 8,448,243 | 3,362,656 | 7,038,650 | |||||||||||
Transfer Agency fees(a) | 1,013,731 | 391,913 | 1,189,158 | |||||||||||
Distribution and Service fees(a) | 394,571 | 394,833 | 1,147,251 | |||||||||||
Registration fees | 265,632 | 207,577 | 345,256 | |||||||||||
Printing and mailing cost | 260,037 | 85,189 | 193,617 | |||||||||||
Custody, accounting and administrative services | 192,473 | 150,259 | 181,333 | |||||||||||
Professional fees | 96,955 | 96,961 | 106,047 | |||||||||||
Trustee fees | 17,734 | 17,614 | 23,840 | |||||||||||
Service Share fees — Service Plan | — | — | 16,215 | |||||||||||
Service Share fees — Shareholder Administration Plan | — | — | 16,215 | |||||||||||
Other | 182,142 | 155,583 | 98,303 | |||||||||||
| Total expenses | 10,871,518 | 4,862,585 | 10,355,885 | |||||||||||
Less — expense reductions | (882,235 | ) | (595,118 | ) | (866,360 | ) | ||||||||
| Net expenses | 9,989,283 | 4,267,467 | 9,489,525 | |||||||||||
| NET INVESTMENT INCOME (LOSS) | (896,597 | ) | 3,524,458 | 17,119,702 | ||||||||||
| Realized and unrealized gain (loss): |
| |||||||||||||
Net realized gain (loss) from: | ||||||||||||||
Investments — unaffiliated issuers | 14,362,826 | (4,188,983 | ) | (10,278,622 | ) | |||||||||
Futures contracts | (1,577,106 | ) | 669,740 | (2,252,522 | ) | |||||||||
Net change in unrealized gain on: |
| |||||||||||||
Investments — unaffiliated issuers | 59,651,176 | 36,603,588 | 110,186,063 | |||||||||||
Futures contracts | 1,375,468 | 591,805 | 1,906,386 | |||||||||||
| Net realized and unrealized gain | 73,812,364 | 33,676,150 | 99,561,305 | |||||||||||
| NET INCREASE IN NET ASSETS RESULTING FROM OPERATIONS | $ | 72,915,767 | $ | 37,200,608 | $ | 116,681,007 | ||||||||
| (a) | Class specific Distribution and/or Service and Transfer Agency fees were as follows: |
| Distribution and Service Fees | Transfer Agency Fees | |||||||||||||||||||||||||||||||||||||||||||
Class A | Class C | Class R | Class A | Class C | Institutional | Service | Investor | Class P | Class R | Class R6 | ||||||||||||||||||||||||||||||||||
Small Cap Growth Insights | $ | 213,007 | $ | 82,328 | $ | 99,236 | $ | 150,503 | $ | 14,540 | $ | 136,331 | $ | — | $ | 598,517 | $ | 3,193 | $ | 35,066 | $ | 75,581 | ||||||||||||||||||||||
Small Cap Value Insights | 307,394 | 72,336 | 15,103 | 217,001 | 12,766 | 49,925 | — | 70,222 | 13,046 | 5,307 | 23,646 | |||||||||||||||||||||||||||||||||
U.S. Equity Insights | 754,235 | 157,050 | 235,966 | 532,812 | 27,737 | 267,334 | 2,594 | 204,524 | 64,440 | 83,399 | 6,318 | |||||||||||||||||||||||||||||||||
| 60 | The accompanying notes are an integral part of these financial statements. |
GOLDMAN SACHS DOMESTIC EQUITY INSIGHTS FUNDS
Statements of Changes in Net Assets
| Large Cap Growth Insights Fund | Large Cap Value Insights Fund | |||||||||||||||||||||
For the Fiscal Year Ended October 31, 2019 | For the Fiscal Year Ended October 31, 2018 | For the Fiscal Year Ended October 31, 2019 | For the Fiscal Year Ended October 31, 2018 | |||||||||||||||||||
| From operations: |
| |||||||||||||||||||||
Net investment income | $ | 12,022,707 | $ | 11,653,879 | $ | 8,266,546 | $ | 5,927,116 | ||||||||||||||
Net realized gain (loss) | 67,769,530 | 155,437,132 | (5,618,538 | ) | 22,666,351 | |||||||||||||||||
Net change in unrealized gain (loss) | 147,817,520 | (34,021,826 | ) | 24,942,599 | (16,564,771 | ) | ||||||||||||||||
| Net increase in net assets resulting from operations | 227,609,757 | 133,069,185 | 27,590,607 | 12,028,696 | ||||||||||||||||||
| Distributions to shareholders: |
| |||||||||||||||||||||
From distributable earnings: | ||||||||||||||||||||||
Class A Shares | (27,564,725 | ) | (14,198,237 | ) | (4,045,532 | ) | (648,554 | ) | ||||||||||||||
Class C Shares | (4,973,355 | ) | (2,987,929 | ) | (634,798 | ) | (29,940 | ) | ||||||||||||||
Institutional Shares | (67,332,090 | ) | (42,591,930 | ) | (8,978,283 | ) | (2,093,000 | ) | ||||||||||||||
Service Shares | (4,268,995 | ) | (3,169,404 | ) | (592,566 | ) | (78,742 | ) | ||||||||||||||
Investor Shares | (35,840,025 | ) | (18,342,542 | ) | (6,499,108 | ) | (662,879 | ) | ||||||||||||||
Class P Shares(a) | (3,340,204 | ) | — | (1,984,309 | ) | (194,354 | ) | |||||||||||||||
Class R Shares | (2,118,839 | ) | (1,332,171 | ) | (346,593 | ) | (46,006 | ) | ||||||||||||||
Class R6 Shares | (30,834,650 | ) | (6,564,955 | ) | (10,049,072 | ) | (1,810,853 | ) | ||||||||||||||
| Total distributions to shareholders | (176,272,883 | ) | (89,187,168 | ) | (33,130,261 | ) | (5,564,328 | ) | ||||||||||||||
| From share transactions: |
| |||||||||||||||||||||
Proceeds from sales of shares | 674,755,517 | 1,050,543,949 | 313,186,552 | 480,848,026 | ||||||||||||||||||
Reinvestment of distributions | 159,092,941 | 79,836,761 | 30,462,643 | 5,251,598 | ||||||||||||||||||
Cost of shares redeemed | (990,901,692 | ) | (989,737,926 | ) | (357,980,026 | ) | (399,354,761 | ) | ||||||||||||||
| Net increase (decrease) in net assets resulting from share transactions | (157,053,234 | ) | 140,642,784 | (14,330,831 | ) | 86,744,863 | ||||||||||||||||
| TOTAL INCREASE (DECREASE) | (105,716,360 | ) | 184,524,801 | (19,870,485 | ) | 93,209,231 | ||||||||||||||||
| Net assets: | ||||||||||||||||||||||
Beginning of year | 2,058,620,196 | 1,874,095,395 | 472,931,891 | 379,722,660 | ||||||||||||||||||
End of year | $ | 1,952,903,836 | $ | 2,058,620,196 | $ | 453,061,406 | $ | 472,931,891 | ||||||||||||||
| (a) | Commenced operations on April 16, 2018. |
| The accompanying notes are an integral part of these financial statements. | 61 |
GOLDMAN SACHS DOMESTIC EQUITY INSIGHTS FUNDS
Statements of Changes in Net Assets(continued)
| Small Cap Equity Insights Fund | Small Cap Growth Insights Fund | |||||||||||||||||||||
For the Fiscal Year Ended October 31, 2019 | For the Fiscal Year Ended October 31, 2018 | For the Fiscal Year Ended October 31, 2019 | For the Fiscal Year Ended October 31, 2018 | |||||||||||||||||||
| From operations: |
| |||||||||||||||||||||
Net investment income (loss) | $ | 3,000,138 | $ | 1,396,336 | $ | (896,597 | ) | $ | (643,837 | ) | ||||||||||||
Net realized gain (loss) | (8,624,564 | ) | 29,632,181 | 12,785,720 | 87,210,753 | |||||||||||||||||
Net change in unrealized gain (loss) | 53,942,051 | (41,145,988 | ) | 61,026,644 | (64,094,572 | ) | ||||||||||||||||
| Net increase (decrease) in net assets resulting from operations | 48,317,625 | (10,117,471 | ) | 72,915,767 | 22,472,344 | |||||||||||||||||
| Distributions to shareholders: |
| |||||||||||||||||||||
From distributable earnings: | ||||||||||||||||||||||
Class A Shares | (2,973,498 | ) | — | (8,979,679 | ) | (3,251,737 | ) | |||||||||||||||
Class C Shares | (464,085 | ) | — | (1,069,015 | ) | (521,416 | ) | |||||||||||||||
Institutional Shares | (11,437,346 | ) | (640,783 | ) | (27,575,852 | ) | (9,557,173 | ) | ||||||||||||||
Service Shares | (124,376 | ) | — | — | — | |||||||||||||||||
Investor Shares | (2,425,323 | ) | (3,431 | ) | (31,017,003 | ) | (8,261,586 | ) | ||||||||||||||
Class P Shares(a) | (3,278,915 | ) | — | (778,940 | ) | — | ||||||||||||||||
Class R Shares | (786,446 | ) | — | (2,101,140 | ) | (567,593 | ) | |||||||||||||||
Class R6 Shares | (9,476,064 | ) | (999 | ) | (14,097,427 | ) | (1,567,068 | ) | ||||||||||||||
| Total distributions to shareholders | (30,966,053 | ) | (645,213 | ) | (85,619,056 | ) | (23,726,573 | ) | ||||||||||||||
| From share transactions: |
| |||||||||||||||||||||
Proceeds from sales of shares | 382,161,015 | 614,401,419 | 549,336,651 | 452,224,339 | ||||||||||||||||||
Reinvestment of distributions | 30,650,153 | 640,255 | 84,301,544 | 22,652,616 | ||||||||||||||||||
Cost of shares redeemed | (300,885,593 | ) | (329,549,837 | ) | (321,356,916 | ) | (212,159,289 | ) | ||||||||||||||
| Net increase in net assets resulting from share transactions | 111,925,575 | 285,491,837 | 312,281,279 | 262,717,666 | ||||||||||||||||||
| TOTAL INCREASE | 129,277,147 | 274,729,153 | 299,577,990 | 261,463,437 | ||||||||||||||||||
| Net assets: |
| |||||||||||||||||||||
Beginning of year | 576,414,269 | 301,685,116 | 861,497,335 | 600,033,898 | ||||||||||||||||||
End of year | $ | 705,691,416 | $ | 576,414,269 | $ | 1,161,075,325 | $ | 861,497,335 | ||||||||||||||
| (a) | Commenced operations on April 16, 2018. |
| 62 | The accompanying notes are an integral part of these financial statements. |
GOLDMAN SACHS DOMESTIC EQUITY INSIGHTS FUNDS
Statements of Changes in Net Assets(continued)
| Small Cap Value Insights Fund | U.S. Equity Insights Fund | |||||||||||||||||||||
For the Fiscal Year Ended October 31, 2019 | For the Fiscal Year Ended October 31, 2018 | For the Fiscal Year Ended October 31, 2019 | For the Fiscal Year Ended October 31, 2018 | |||||||||||||||||||
| From operations: |
| |||||||||||||||||||||
Net investment income | $ | 3,524,458 | $ | 1,207,335 | $ | 17,119,702 | $ | 7,940,649 | ||||||||||||||
Net realized gain (loss) | (3,519,243 | ) | 21,584,632 | (12,531,144 | ) | 47,085,922 | ||||||||||||||||
Net change in unrealized gain (loss) | 37,195,393 | (25,247,040 | ) | 112,092,449 | (74,530,660 | ) | ||||||||||||||||
| Net increase (decrease) in net assets resulting from operations | 37,200,608 | (2,455,073 | ) | 116,681,007 | (19,504,089 | ) | ||||||||||||||||
| Distributions to shareholders: |
| |||||||||||||||||||||
From distributable earnings: | ||||||||||||||||||||||
Class A Shares | (10,543,077 | ) | (10,687,250 | ) | (11,514,034 | ) | (26,986,508 | ) | ||||||||||||||
Class C Shares | (844,101 | ) | (2,305,227 | ) | (572,348 | ) | (2,857,609 | ) | ||||||||||||||
Institutional Shares | (4,776,734 | ) | (4,764,505 | ) | (34,531,169 | ) | (25,747,094 | ) | ||||||||||||||
Service Shares | — | — | (218,665 | ) | (665,619 | ) | ||||||||||||||||
Investor Shares | (1,907,349 | ) | (587,886 | ) | (4,499,108 | ) | (4,504,647 | ) | ||||||||||||||
Class P Shares(a) | (2,877,391 | ) | — | (6,101,132 | ) | — | ||||||||||||||||
Class R Shares | (225,486 | ) | (177,610 | ) | (1,722,455 | ) | (5,093,418 | ) | ||||||||||||||
Class R6 Shares | (1,908,993 | ) | (407,268 | ) | (1,352,886 | ) | (272,129 | ) | ||||||||||||||
| Total distributions to shareholders | (23,083,131 | ) | (18,929,746 | ) | (60,511,797 | ) | (66,127,024 | ) | ||||||||||||||
| From share transactions: |
| |||||||||||||||||||||
Proceeds from sales of shares | 372,978,518 | 196,176,353 | 475,796,540 | 1,332,211,213 | ||||||||||||||||||
Reinvestment of distributions | 22,702,592 | 18,382,160 | 59,440,795 | 63,915,868 | ||||||||||||||||||
Cost of shares redeemed | (106,350,529 | ) | (115,545,932 | ) | (1,128,321,651 | ) | (417,178,878 | ) | ||||||||||||||
| Net increase (decrease) in net assets resulting from share transactions | 289,330,581 | 99,012,581 | (593,084,316 | ) | 978,948,203 | |||||||||||||||||
| TOTAL INCREASE (DECREASE) | 303,448,058 | 77,627,762 | (536,915,106 | ) | 893,317,090 | |||||||||||||||||
| Net assets: |
| |||||||||||||||||||||
Beginning of year | 264,840,695 | 187,212,933 | 1,553,472,815 | 660,155,725 | ||||||||||||||||||
End of year | $ | 568,288,753 | $ | 264,840,695 | $ | 1,016,557,709 | $ | 1,553,472,815 | ||||||||||||||
| (a) | Commenced operations on April 16, 2018. |
| The accompanying notes are an integral part of these financial statements. | 63 |
GOLDMAN SACHS LARGE CAP GROWTH INSIGHTS FUND
Selected Data for a Share Outstanding Throughout Each Year
| Goldman Sachs Large Cap Growth Insights Fund | ||||||||||||||||||||||
| Class A Shares | ||||||||||||||||||||||
| Year Ended October 31, | ||||||||||||||||||||||
| 2019 | 2018 | 2017 | 2016 | 2015 | ||||||||||||||||||
| Per Share Data |
| |||||||||||||||||||||
Net asset value, beginning of year | $ | 31.05 | $ | 30.36 | $ | 23.44 | $ | 23.13 | $ | 21.57 | ||||||||||||
Net investment income(a) | 0.10 | 0.10 | 0.10 | 0.11 | 0.16 | |||||||||||||||||
Net realized and unrealized gain | 3.00 | 1.96 | 6.93 | 0.33 | 1.55 | |||||||||||||||||
Total from investment operations | 3.10 | 2.06 | 7.03 | 0.44 | 1.71 | |||||||||||||||||
Distributions to shareholders from net investment income | (0.09 | ) | (0.08 | ) | (0.11 | ) | (0.13 | ) | (0.15 | ) | ||||||||||||
Distributions to shareholders from net realized gains | (2.52 | ) | (1.29 | ) | — | — | — | |||||||||||||||
Total distributions | (2.61 | ) | (1.37 | ) | (0.11 | ) | (0.13 | ) | (0.15 | ) | ||||||||||||
Net asset value, end of year | $ | 31.54 | $ | 31.05 | $ | 30.36 | $ | 23.44 | $ | 23.13 | ||||||||||||
| Total Return(b) | 11.28 | % | 6.95 | % | 30.11 | % | 1.93 | % | 7.96 | % | ||||||||||||
Net assets, end of year (in 000’s) | $ | 301,506 | $ | 317,418 | $ | 316,689 | $ | 254,036 | $ | 200,634 | ||||||||||||
Ratio of net expenses to average net assets | 0.93 | % | 0.92 | % | 0.95 | % | 0.96 | % | 0.96 | % | ||||||||||||
Ratio of total expenses to average net assets | 0.97 | % | 0.95 | % | 1.10 | % | 1.15 | % | 1.16 | % | ||||||||||||
Ratio of net investment income to average net assets | 0.33 | % | 0.32 | % | 0.38 | % | 0.49 | % | 0.72 | % | ||||||||||||
Portfolio turnover rate(c) | 192 | % | 188 | % | 196 | % | 254 | % | 222 | % | ||||||||||||
| (a) | Calculated based on the average shares outstanding methodology. |
| (b) | Assumes investment at the NAV at the beginning of the year, reinvestment of all dividends and distributions, a complete redemption of the investment at the NAV at the end of the year and no sales or redemption charges (if any). Total returns would be reduced if a sales or redemption charge was taken into account. Returns do not reflect the impact of taxes to shareholders relating to Fund distributions or the redemption of Fund shares. |
| (c) | The Fund’s portfolio turnover rate is calculated in accordance with regulatory requirements, without regard to transactions involving short term investments and certain derivatives. If such transactions were included, the Fund’s portfolio turnover rate may be higher. |
| 64 | The accompanying notes are an integral part of these financial statements. |
GOLDMAN SACHS LARGE CAP GROWTH INSIGHTS FUND
Financial Highlights(continued)
Selected Data for a Share Outstanding Throughout Each Year
| Goldman Sachs Large Cap Growth Insights Fund | ||||||||||||||||||||||
| Class C Shares | ||||||||||||||||||||||
| Year Ended October 31, | ||||||||||||||||||||||
| 2019 | 2018 | 2017 | 2016 | 2015 | ||||||||||||||||||
| Per Share Data |
| |||||||||||||||||||||
Net asset value, beginning of year | $ | 27.78 | $ | 27.42 | $ | 21.23 | $ | 21.02 | $ | 19.67 | ||||||||||||
Net investment income loss(a) | (0.10 | ) | (0.12 | ) | (0.09 | ) | (0.05 | ) | (0.01 | ) | ||||||||||||
Net realized and unrealized gain | 2.63 | 1.77 | 6.28 | 0.30 | 1.41 | |||||||||||||||||
Total from investment operations | 2.53 | 1.65 | 6.19 | 0.25 | 1.40 | |||||||||||||||||
Distributions to shareholders from net investment income | — | — | — | (0.04 | ) | (0.05 | ) | |||||||||||||||
Distributions to shareholders from net realized gains | (2.52 | ) | (1.29 | ) | — | — | — | |||||||||||||||
Total distributions | (2.52 | ) | (1.29 | ) | — | (0.04 | ) | (0.05 | ) | |||||||||||||
Net asset value, end of year | $ | 27.79 | $ | 27.78 | $ | 27.42 | $ | 21.23 | $ | 21.02 | ||||||||||||
| Total Return(b) | 10.42 | % | 6.18 | % | 29.16 | % | 1.18 | % | 7.12 | % | ||||||||||||
Net assets, end of year (in 000’s) | $ | 42,004 | $ | 56,046 | $ | 63,500 | $ | 48,610 | $ | 49,658 | ||||||||||||
Ratio of net expenses to average net assets | 1.68 | % | 1.67 | % | 1.70 | % | 1.71 | % | 1.71 | % | ||||||||||||
Ratio of total expenses to average net assets | 1.72 | % | 1.70 | % | 1.85 | % | 1.90 | % | 1.91 | % | ||||||||||||
Ratio of net investment loss to average net assets | (0.40 | )% | (0.42 | )% | (0.37 | )% | (0.25 | )% | (0.05 | )% | ||||||||||||
Portfolio turnover rate(c) | 192 | % | 188 | % | 196 | % | 254 | % | 222 | % | ||||||||||||
| (a) | Calculated based on the average shares outstanding methodology. |
| (b) | Assumes investment at the NAV at the beginning of the year, reinvestment of all dividends and distributions, a complete redemption of the investment at the NAV at the end of the year and no sales or redemption charges (if any). Total returns would be reduced if a sales or redemption charge was taken into account. Returns do not reflect the impact of taxes to shareholders relating to Fund distributions or the redemption of Fund shares. |
| (c) | The Fund’s portfolio turnover rate is calculated in accordance with regulatory requirements, without regard to transactions involving short term investments and certain derivatives. If such transactions were included, the Fund’s portfolio turnover rate may be higher. |
| The accompanying notes are an integral part of these financial statements. | 65 |
GOLDMAN SACHS LARGE CAP GROWTH INSIGHTS FUND
Financial Highlights(continued)
Selected Data for a Share Outstanding Throughout Each Year
| Goldman Sachs Large Cap Growth Insights Fund | ||||||||||||||||||||||
| Institutional Shares | ||||||||||||||||||||||
| Year Ended October 31, | ||||||||||||||||||||||
| 2019 | 2018 | 2017 | 2016 | 2015 | ||||||||||||||||||
| Per Share Data |
| |||||||||||||||||||||
Net asset value, beginning of year | $ | 32.17 | $ | 31.39 | $ | 24.21 | $ | 23.86 | $ | 22.22 | ||||||||||||
Net investment income(a) | 0.23 | 0.23 | 0.22 | 0.21 | 0.26 | |||||||||||||||||
Net realized and unrealized gain | 3.09 | 2.02 | 7.15 | 0.34 | 1.60 | |||||||||||||||||
Total from investment operations | 3.32 | 2.25 | 7.37 | 0.55 | 1.86 | |||||||||||||||||
Distributions to shareholders from net investment income | (0.20 | ) | (0.18 | ) | (0.19 | ) | (0.20 | ) | (0.22 | ) | ||||||||||||
Distributions to shareholders from net realized gains | (2.52 | ) | (1.29 | ) | — | — | — | |||||||||||||||
Total distributions | (2.72 | ) | (1.47 | ) | (0.19 | ) | (0.20 | ) | (0.22 | ) | ||||||||||||
Net asset value, end of year | $ | 32.77 | $ | 32.17 | $ | 31.39 | $ | 24.21 | $ | 23.86 | ||||||||||||
| Total Return(b) | 11.70 | % | 7.38 | % | 30.63 | % | 2.35 | % | 8.41 | % | ||||||||||||
Net assets, end of year (in 000’s) | $ | 760,316 | $ | 806,091 | $ | 897,009 | $ | 448,961 | $ | 493,322 | ||||||||||||
Ratio of net expenses to average net assets | 0.54 | % | 0.53 | % | 0.56 | % | 0.56 | % | 0.56 | % | ||||||||||||
Ratio of total expenses to average net assets | 0.58 | % | 0.56 | % | 0.70 | % | 0.75 | % | 0.76 | % | ||||||||||||
Ratio of net investment income to average net assets | 0.72 | % | 0.71 | % | 0.78 | % | 0.89 | % | 1.13 | % | ||||||||||||
Portfolio turnover rate(c) | 192 | % | 188 | % | 196 | % | 254 | % | 222 | % | ||||||||||||
| (a) | Calculated based on the average shares outstanding methodology. |
| (b) | Assumes investment at the NAV at the beginning of the year, reinvestment of all dividends and distributions, a complete redemption of the investment at the NAV at the end of the year and no sales or redemption charges (if any). Total returns would be reduced if a sales or redemption charge was taken into account. Returns do not reflect the impact of taxes to shareholders relating to Fund distributions or the redemption of Fund shares. |
| (c) | The Fund’s portfolio turnover rate is calculated in accordance with regulatory requirements, without regard to transactions involving short term investments and certain derivatives. If such transactions were included, the Fund’s portfolio turnover rate may be higher. |
| 66 | The accompanying notes are an integral part of these financial statements. |
GOLDMAN SACHS LARGE CAP GROWTH INSIGHTS FUND
Financial Highlights(continued)
Selected Data for a Share Outstanding Throughout Each Year
| Goldman Sachs Large Cap Growth Insights Fund | ||||||||||||||||||||||
| Service Shares | ||||||||||||||||||||||
| Year Ended October 31, | ||||||||||||||||||||||
| 2019 | 2018 | 2017 | 2016 | 2015 | ||||||||||||||||||
| Per Share Data |
| |||||||||||||||||||||
Net asset value, beginning of year | $ | 30.53 | $ | 29.94 | $ | 23.15 | $ | 22.89 | $ | 21.41 | ||||||||||||
Net investment income(a) | 0.07 | 0.07 | 0.04 | 0.08 | 0.13 | |||||||||||||||||
Net realized and unrealized gain | 2.95 | 1.92 | 6.88 | 0.33 | 1.55 | |||||||||||||||||
Total from investment operations | 3.02 | 1.99 | 6.92 | 0.41 | 1.68 | |||||||||||||||||
Distributions to shareholders from net investment income | (0.01 | ) | (0.11 | ) | (0.13 | ) | (0.15 | ) | (0.20 | ) | ||||||||||||
Distributions to shareholders from net realized gains | (2.52 | ) | (1.29 | ) | — | — | — | |||||||||||||||
Total distributions | (2.53 | ) | (1.40 | ) | (0.13 | ) | (0.15 | ) | (0.20 | ) | ||||||||||||
Net asset value, end of year | $ | 31.02 | $ | 30.53 | $ | 29.94 | $ | 23.15 | $ | 22.89 | ||||||||||||
| Total Return(b) | 11.15 | % | 6.82 | % | 30.04 | % | 1.82 | % | 7.88 | % | ||||||||||||
Net assets, end of year (in 000’s) | $ | 50,445 | $ | 53,347 | $ | 67,450 | $ | 12,517 | $ | 3,096 | ||||||||||||
Ratio of net expenses to average net assets | 1.04 | % | 1.03 | % | 1.05 | % | 1.06 | % | 1.06 | % | ||||||||||||
Ratio of total expenses to average net assets | 1.08 | % | 1.06 | % | 1.19 | % | 1.26 | % | 1.26 | % | ||||||||||||
Ratio of net investment income to average net assets | 0.22 | % | 0.21 | % | 0.17 | % | 0.34 | % | 0.60 | % | ||||||||||||
Portfolio turnover rate(c) | 192 | % | 188 | % | 196 | % | 254 | % | 222 | % | ||||||||||||
| (a) | Calculated based on the average shares outstanding methodology. |
| (b) | Assumes investment at the NAV at the beginning of the year, reinvestment of all dividends and distributions, a complete redemption of the investment at the NAV at the end of the year and no sales or redemption charges (if any). Total returns would be reduced if a sales or redemption charge was taken into account. Returns do not reflect the impact of taxes to shareholders relating to Fund distributions or the redemption of Fund shares. |
| (c) | The Fund’s portfolio turnover rate is calculated in accordance with regulatory requirements, without regard to transactions involving short term investments and certain derivatives. If such transactions were included, the Fund’s portfolio turnover rate may be higher. |
| The accompanying notes are an integral part of these financial statements. | 67 |
GOLDMAN SACHS LARGE CAP GROWTH INSIGHTS FUND
Financial Highlights(continued)
Selected Data for a Share Outstanding Throughout Each Year
| Goldman Sachs Large Cap Growth Insights Fund | ||||||||||||||||||||||
| Investor Shares | ||||||||||||||||||||||
| Year Ended October 31, | ||||||||||||||||||||||
| 2019 | 2018 | 2017 | 2016 | 2015 | ||||||||||||||||||
| Per Share Data |
| |||||||||||||||||||||
Net asset value, beginning of year | $ | 30.69 | $ | 30.03 | $ | 23.19 | $ | 22.88 | $ | 21.36 | ||||||||||||
Net investment income(a) | 0.17 | 0.18 | 0.16 | 0.17 | 0.22 | |||||||||||||||||
Net realized and unrealized gain | 2.95 | 1.93 | 6.86 | 0.32 | 1.52 | |||||||||||||||||
Total from investment operations | 3.12 | 2.11 | 7.02 | 0.49 | 1.74 | |||||||||||||||||
Distributions to shareholders from net investment income | (0.16 | ) | (0.16 | ) | (0.18 | ) | (0.18 | ) | (0.22 | ) | ||||||||||||
Distributions to shareholders from net realized gains | (2.52 | ) | (1.29 | ) | — | — | — | |||||||||||||||
Total distributions | (2.68 | ) | (1.45 | ) | (0.18 | ) | (0.18 | ) | (0.22 | ) | ||||||||||||
Net asset value, end of year | $ | 31.13 | $ | 30.69 | $ | 30.03 | $ | 23.19 | $ | 22.88 | ||||||||||||
| Total Return(b) | 11.56 | % | 7.23 | % | 30.43 | % | 2.18 | % | 8.21 | % | ||||||||||||
Net assets, end of year (in 000’s) | $ | 401,677 | $ | 415,757 | $ | 365,836 | $ | 48,133 | $ | 36,001 | ||||||||||||
Ratio of net expenses to average net assets | 0.68 | % | 0.67 | % | 0.70 | % | 0.71 | % | 0.71 | % | ||||||||||||
Ratio of total expenses to average net assets | 0.72 | % | 0.70 | % | 0.84 | % | 0.90 | % | 0.91 | % | ||||||||||||
Ratio of net investment income to average net assets | 0.58 | % | 0.56 | % | 0.59 | % | 0.74 | % | 0.97 | % | ||||||||||||
Portfolio turnover rate(c) | 192 | % | 188 | % | 196 | % | 254 | % | 222 | % | ||||||||||||
| (a) | Calculated based on the average shares outstanding methodology. |
| (b) | Assumes investment at the NAV at the beginning of the year, reinvestment of all dividends and distributions, a complete redemption of the investment at the NAV at the end of the year and no sales or redemption charges (if any). Total returns would be reduced if a sales or redemption charge was taken into account. Returns do not reflect the impact of taxes to shareholders relating to Fund distributions or the redemption of Fund shares. |
| (c) | The Fund’s portfolio turnover rate is calculated in accordance with regulatory requirements, without regard to transactions involving short term investments and certain derivatives. If such transactions were included, the Fund’s portfolio turnover rate may be higher. |
| 68 | The accompanying notes are an integral part of these financial statements. |
GOLDMAN SACHS LARGE CAP GROWTH INSIGHTS FUND
Financial Highlights(continued)
Selected Data for a Share Outstanding Throughout Each Period
| Goldman Sachs Large Cap Growth Insights Fund | ||||||||||
| Class P Shares | ||||||||||
| For the Year Ended October 31, 2019 | Period Ended October 31, 2018(a) | |||||||||
| Per Share Data |
| |||||||||
Net asset value, beginning of period | $ | 32.15 | $ | 32.07 | ||||||
Net investment income(b) | 0.22 | 0.12 | ||||||||
Net realized and unrealized gain (loss) | 3.10 | (0.04 | ) | |||||||
Total from investment operations | 3.32 | 0.08 | ||||||||
Distributions to shareholders from net investment income | (0.21 | ) | — | |||||||
Distributions to shareholders from net realized gains | (2.52 | ) | — | |||||||
Total distributions | (2.73 | ) | — | |||||||
Net asset value, end of period | $ | 32.74 | $ | 32.15 | ||||||
| Total Return(c) | 11.71 | % | 0.25 | % | ||||||
Net assets, end of period (in 000’s) | $ | 49,099 | $ | 39,938 | ||||||
Ratio of net expenses to average net assets | 0.53 | % | 0.52 | %(d) | ||||||
Ratio of total expenses to average net assets | 0.57 | % | 0.56 | %(d) | ||||||
Ratio of net investment income to average net assets | 0.71 | % | 0.66 | %(d) | ||||||
Portfolio turnover rate(e) | 192 | % | 188 | % | ||||||
| (a) | Commenced operations on April 16, 2018. |
| (b) | Calculated based on the average shares outstanding methodology. |
| (c) | Assumes investment at the NAV at the beginning of the period, reinvestment of all dividends and distributions, a complete redemption of the investment at the NAV at the end of the period and no sales or redemption charges (if any). Total returns would be reduced if a sales or redemption charge was taken into account. Returns do not reflect the impact of taxes to shareholders relating to Fund distributions or the redemption of Fund shares. Total returns for periods less than one full year are not annualized. |
| (d) | Annualized. |
| (e) | The Fund’s portfolio turnover rate is calculated in accordance with regulatory requirements, without regard to transactions involving short term investments and certain derivatives. If such transactions were included, the Fund’s portfolio turnover rate may be higher. |
| The accompanying notes are an integral part of these financial statements. | 69 |
GOLDMAN SACHS LARGE CAP GROWTH INSIGHTS FUND
Financial Highlights(continued)
Selected Data for a Share Outstanding Throughout Each Year
| Goldman Sachs Large Cap Growth Insights Fund | ||||||||||||||||||||||
| Class R Shares | ||||||||||||||||||||||
| Year Ended October 31, | ||||||||||||||||||||||
| 2019 | 2018 | 2017 | 2016 | 2015 | ||||||||||||||||||
| Per Share Data |
| |||||||||||||||||||||
Net asset value, beginning of year | $ | 30.30 | $ | 29.67 | $ | 22.93 | $ | 22.71 | $ | 21.25 | ||||||||||||
Net investment income(a) | 0.02 | 0.02 | 0.04 | 0.05 | 0.09 | |||||||||||||||||
Net realized and unrealized gain | 2.93 | 1.92 | 6.78 | 0.32 | 1.55 | |||||||||||||||||
Total from investment operations | 2.95 | 1.94 | 6.82 | 0.37 | 1.64 | |||||||||||||||||
Distributions to shareholders from net investment income | — | (0.02 | ) | (0.08 | ) | (0.15 | ) | (0.18 | ) | |||||||||||||
Distributions to shareholders from net realized gains | (2.52 | ) | (1.29 | ) | — | — | — | |||||||||||||||
Total distributions | (2.52 | ) | (1.31 | ) | (0.08 | ) | (0.15 | ) | (0.18 | ) | ||||||||||||
Net asset value, end of year | $ | 30.73 | $ | 30.30 | $ | 29.67 | $ | 22.93 | $ | 22.71 | ||||||||||||
| Total Return(b) | 10.98 | % | 6.69 | % | 29.81 | % | 1.66 | % | 7.73 | % | ||||||||||||
Net assets, end of year (in 000’s) | $ | 34,397 | $ | 25,893 | $ | 29,734 | $ | 20,635 | $ | 10,660 | ||||||||||||
Ratio of net expenses to average net assets | 1.18 | % | 1.17 | % | 1.20 | % | 1.21 | % | 1.21 | % | ||||||||||||
Ratio of total expenses to average net assets | 1.22 | % | 1.20 | % | 1.35 | % | 1.40 | % | 1.41 | % | ||||||||||||
Ratio of net investment income to average net assets | 0.05 | % | 0.08 | % | 0.14 | % | 0.22 | % | 0.39 | % | ||||||||||||
Portfolio turnover rate(c) | 192 | % | 188 | % | 196 | % | 254 | % | 222 | % | ||||||||||||
| (a) | Calculated based on the average shares outstanding methodology. |
| (b) | Assumes investment at the NAV at the beginning of the year, reinvestment of all dividends and distributions, a complete redemption of the investment at the NAV at the end of the year and no sales or redemption charges (if any). Total returns would be reduced if a sales or redemption charge was taken into account. Returns do not reflect the impact of taxes to shareholders relating to Fund distributions or the redemption of Fund shares. |
| (c) | The Fund’s portfolio turnover rate is calculated in accordance with regulatory requirements, without regard to transactions involving short term investments and certain derivatives. If such transactions were included, the Fund’s portfolio turnover rate may be higher. |
| 70 | The accompanying notes are an integral part of these financial statements. |
GOLDMAN SACHS LARGE CAP GROWTH INSIGHTS FUND
Financial Highlights(continued)
Selected Data for a Share Outstanding Throughout Each Period
| Goldman Sachs Large Cap Growth Insights Fund | ||||||||||||||||||||||
| Class R6 Shares | ||||||||||||||||||||||
| Year Ended October 31, | Period Ended October 31, 2015(a) | |||||||||||||||||||||
| 2019 | 2018 | 2017 | 2016 | |||||||||||||||||||
| Per Share Data |
| |||||||||||||||||||||
Net asset value, beginning of period | $ | 32.15 | $ | 31.38 | $ | 24.21 | $ | 23.86 | $ | 23.90 | ||||||||||||
Net investment income(b) | 0.23 | 0.24 | 0.21 | 0.18 | 0.06 | |||||||||||||||||
Net realized and unrealized gain (loss) | 3.10 | 2.01 | 7.16 | 0.38 | (0.10 | ) | ||||||||||||||||
Total from investment operations | 3.33 | 2.25 | 7.37 | 0.56 | (0.04 | ) | ||||||||||||||||
Distributions to shareholders from net investment income | (0.21 | ) | (0.19 | ) | (0.20 | ) | (0.21 | ) | — | |||||||||||||
Distributions to shareholders from net realized gains | (2.52 | ) | (1.29 | ) | — | — | — | |||||||||||||||
Total distributions | (2.73 | ) | (1.48 | ) | (0.20 | ) | (0.21 | ) | — | |||||||||||||
Net asset value, end of period | $ | 32.75 | $ | 32.15 | $ | 31.38 | $ | 24.21 | $ | 23.86 | ||||||||||||
| Total Return(c) | 11.72 | % | 7.37 | % | 30.64 | % | 2.38 | % | (0.17 | )% | ||||||||||||
Net assets, end of period (in 000’s) | $ | 313,461 | $ | 344,129 | $ | 133,877 | $ | 8,208 | $ | 10 | ||||||||||||
Ratio of net expenses to average net assets | 0.53 | % | 0.52 | % | 0.54 | % | 0.54 | % | 0.54 | %(d) | ||||||||||||
Ratio of total expenses to average net assets | 0.57 | % | 0.55 | % | 0.67 | % | 0.74 | % | 0.74 | %(d) | ||||||||||||
Ratio of net investment income to average net assets | 0.75 | % | 0.71 | % | 0.74 | % | 0.72 | % | 1.00 | %(d) | ||||||||||||
Portfolio turnover rate(e) | 192 | % | 188 | % | 196 | % | 254 | % | 222 | % | ||||||||||||
| (a) | Commenced operations on July 31, 2015. |
| (b) | Calculated based on the average shares outstanding methodology. |
| (c) | Assumes investment at the NAV at the beginning of the year, reinvestment of all dividends and distributions, a complete redemption of the investment at the NAV at the end of the period and no sales or redemption charges (if any). Total returns would be reduced if a sales or redemption charge was taken into account. Returns do not reflect the impact of taxes to shareholders relating to Fund distributions or the redemption of Fund shares. Total returns for periods less than one full year are not annualized. |
| (d) | Annualized. |
| (e) | The Fund’s portfolio turnover rate is calculated in accordance with regulatory requirements, without regard to transactions involving short term investments and certain derivatives. If such transactions were included, the Fund’s portfolio turnover rate may be higher. |
| The accompanying notes are an integral part of these financial statements. | 71 |
GOLDMAN SACHS LARGE CAP VALUE INSIGHTS FUND
Financial Highlights(continued)
Selected Data for a Share Outstanding Throughout Each Year
| Goldman Sachs Large Cap Value Insights Fund | ||||||||||||||||||||||
| Class A Shares | ||||||||||||||||||||||
| Year Ended October 31, | ||||||||||||||||||||||
| 2019 | 2018 | 2017 | 2016 | 2015 | ||||||||||||||||||
| Per Share Data |
| |||||||||||||||||||||
Net asset value, beginning of year | $ | 21.59 | $ | 21.01 | $ | 17.27 | $ | 16.92 | $ | 16.86 | ||||||||||||
Net investment income(a) | 0.28 | 0.25 | 0.27 | 0.23 | 0.24 | |||||||||||||||||
Net realized and unrealized gain | 0.75 | 0.56 | 3.77 | 0.33 | 0.06 | |||||||||||||||||
Total from investment operations | 1.03 | 0.81 | 4.04 | 0.56 | 0.30 | |||||||||||||||||
Distributions to shareholders from net investment income | (0.29 | ) | (0.23 | ) | (0.30 | ) | (0.21 | ) | (0.24 | ) | ||||||||||||
Distributions to shareholders from net realized gains | (1.06 | ) | — | — | — | — | ||||||||||||||||
Total distributions | (1.35 | ) | (0.23 | ) | (0.30 | ) | (0.21 | ) | (0.24 | ) | ||||||||||||
Net asset value, end of year | $ | 21.27 | $ | 21.59 | $ | 21.01 | $ | 17.27 | $ | 16.92 | ||||||||||||
| Total Return(b) | 5.30 | % | 3.82 | % | 23.51 | % | 3.35 | % | 1.82 | % | ||||||||||||
Net assets, end of year (in 000’s) | $ | 65,556 | $ | 62,349 | $ | 63,848 | $ | 60,942 | $ | 62,150 | ||||||||||||
Ratio of net expenses to average net assets | 0.95 | % | 0.95 | % | 0.96 | % | 0.96 | % | 0.96 | % | ||||||||||||
Ratio of total expenses to average net assets | 1.07 | % | 1.03 | % | 1.10 | % | 1.15 | % | 1.12 | % | ||||||||||||
Ratio of net investment income to average net assets | 1.36 | % | 1.13 | % | 1.37 | % | 1.36 | % | 1.39 | % | ||||||||||||
Portfolio turnover rate(c) | 225 | % | 202 | % | 208 | % | 229 | % | 221 | % | ||||||||||||
| (a) | Calculated based on the average shares outstanding methodology. |
| (b) | Assumes investment at the NAV at the beginning of the year, reinvestment of all dividends and distributions, a complete redemption of the investment at the NAV at the end of the year and no sales or redemption charges (if any). Total returns would be reduced if a sales or redemption charge was taken into account. Returns do not reflect the impact of taxes to shareholders relating to Fund distributions or the redemption of Fund shares. |
| (c) | The Fund’s portfolio turnover rate is calculated in accordance with regulatory requirements, without regard to transactions involving short term investments and certain derivatives. If such transactions were included, the Fund’s portfolio turnover rate may be higher. |
| 72 | The accompanying notes are an integral part of these financial statements. |
GOLDMAN SACHS LARGE CAP VALUE INSIGHTS FUND
Financial Highlights(continued)
Selected Data for a Share Outstanding Throughout Each Year
| Goldman Sachs Large Cap Value Insights Fund | ||||||||||||||||||||||
| Class C Shares | ||||||||||||||||||||||
| Year Ended October 31, | ||||||||||||||||||||||
| 2019 | 2018 | 2017 | 2016 | 2015 | ||||||||||||||||||
| Per Share Data |
| |||||||||||||||||||||
Net asset value, beginning of year | $ | 21.39 | $ | 20.82 | $ | 17.12 | $ | 16.78 | $ | 16.71 | ||||||||||||
Net investment income(a) | 0.12 | 0.08 | 0.11 | 0.10 | 0.11 | |||||||||||||||||
Net realized and unrealized gain | 0.75 | 0.55 | 3.75 | 0.33 | 0.07 | |||||||||||||||||
Total from investment operations | 0.87 | 0.63 | 3.86 | 0.43 | 0.18 | |||||||||||||||||
Distributions to shareholders from net investment income | (0.14 | ) | (0.06 | ) | (0.16 | ) | (0.09 | ) | (0.11 | ) | ||||||||||||
Distributions to shareholders from net realized gains | (1.06 | ) | — | — | — | — | ||||||||||||||||
Total distributions | (1.20 | ) | (0.06 | ) | (0.16 | ) | (0.09 | ) | (0.11 | ) | ||||||||||||
Net asset value, end of year | $ | 21.06 | $ | 21.39 | $ | 20.82 | $ | 17.12 | $ | 16.78 | ||||||||||||
| Total Return(b) | 4.53 | % | 3.00 | % | 22.59 | % | 2.56 | % | 1.11 | % | ||||||||||||
Net assets, end of year (in 000’s) | $ | 12,694 | $ | 10,058 | $ | 10,601 | $ | 13,437 | $ | 15,658 | ||||||||||||
Ratio of net expenses to average net assets | 1.70 | % | 1.70 | % | 1.71 | % | 1.71 | % | 1.71 | % | ||||||||||||
Ratio of total expenses to average net assets | 1.82 | % | 1.78 | % | 1.85 | % | 1.90 | % | 1.87 | % | ||||||||||||
Ratio of net investment income to average net assets | 0.61 | % | 0.37 | % | 0.59 | % | 0.61 | % | 0.64 | % | ||||||||||||
Portfolio turnover rate(c) | 225 | % | 202 | % | 208 | % | 229 | % | 221 | % | ||||||||||||
| (a) | Calculated based on the average shares outstanding methodology. |
| (b) | Assumes investment at the NAV at the beginning of the year, reinvestment of all dividends and distributions, a complete redemption of the investment at the NAV at the end of the year and no sales or redemption charges (if any). Total returns would be reduced if a sales or redemption charge was taken into account. Returns do not reflect the impact of taxes to shareholders relating to Fund distributions or the redemption of Fund shares. |
| (c) | The Fund’s portfolio turnover rate is calculated in accordance with regulatory requirements, without regard to transactions involving short term investments and certain derivatives. If such transactions were included, the Fund’s portfolio turnover rate may be higher. |
| The accompanying notes are an integral part of these financial statements. | 73 |
GOLDMAN SACHS LARGE CAP VALUE INSIGHTS FUND
Financial Highlights(continued)
Selected Data for a Share Outstanding Throughout Each Year
| Goldman Sachs Large Cap Value Insights Fund | ||||||||||||||||||||||
| Institutional Shares | ||||||||||||||||||||||
| Year Ended October 31, | ||||||||||||||||||||||
| 2019 | 2018 | 2017 | 2016 | 2015 | ||||||||||||||||||
| Per Share Data |
| |||||||||||||||||||||
Net asset value, beginning of year | $ | 21.57 | $ | 20.99 | $ | 17.25 | $ | 16.91 | $ | 16.85 | ||||||||||||
Net investment income(a) | 0.36 | 0.33 | 0.35 | 0.29 | 0.31 | |||||||||||||||||
Net realized and unrealized gain | 0.74 | 0.56 | 3.77 | 0.32 | 0.06 | |||||||||||||||||
Total from investment operations | 1.10 | 0.89 | 4.12 | 0.61 | 0.37 | |||||||||||||||||
Distributions to shareholders from net investment income | (0.37 | ) | (0.31 | ) | (0.38 | ) | (0.27 | ) | (0.31 | ) | ||||||||||||
Distributions to shareholders from net realized gains | (1.06 | ) | — | — | — | — | ||||||||||||||||
Total distributions | (1.43 | ) | (0.31 | ) | (0.38 | ) | (0.27 | ) | (0.31 | ) | ||||||||||||
Net asset value, end of year | $ | 21.24 | $ | 21.57 | $ | 20.99 | $ | 17.25 | $ | 16.91 | ||||||||||||
| Total Return(b) | 5.68 | % | 4.22 | % | 24.02 | % | 3.69 | % | 2.24 | % | ||||||||||||
Net assets, end of year (in 000’s) | $ | 120,417 | $ | 122,587 | $ | 261,684 | $ | 341,830 | $ | 296,403 | ||||||||||||
Ratio of net expenses to average net assets | 0.57 | % | 0.56 | % | 0.56 | % | 0.56 | % | 0.56 | % | ||||||||||||
Ratio of total expenses to average net assets | 0.68 | % | 0.64 | % | 0.70 | % | 0.75 | % | 0.72 | % | ||||||||||||
Ratio of net investment income to average net assets | 1.74 | % | 1.52 | % | 1.78 | % | 1.73 | % | 1.81 | % | ||||||||||||
Portfolio turnover rate(c) | 225 | % | 202 | % | 208 | % | 229 | % | 221 | % | ||||||||||||
| (a) | Calculated based on the average shares outstanding methodology. |
| (b) | Assumes investment at the NAV at the beginning of the year, reinvestment of all dividends and distributions, a complete redemption of the investment at the NAV at the end of the year and no sales or redemption charges (if any). Total returns would be reduced if a sales or redemption charge was taken into account. Returns do not reflect the impact of taxes to shareholders relating to Fund distributions or the redemption of Fund shares. |
| (c) | The Fund’s portfolio turnover rate is calculated in accordance with regulatory requirements, without regard to transactions involving short term investments and certain derivatives. If such transactions were included, the Fund’s portfolio turnover rate may be higher. |
| 74 | The accompanying notes are an integral part of these financial statements. |
GOLDMAN SACHS LARGE CAP VALUE INSIGHTS FUND
Financial Highlights(continued)
Selected Data for a Share Outstanding Throughout Each Year
| Goldman Sachs Large Cap Value Insights Fund | ||||||||||||||||||||||
| Service Shares | ||||||||||||||||||||||
| Year Ended October 31, | ||||||||||||||||||||||
| 2019 | 2018 | 2017 | 2016 | 2015 | ||||||||||||||||||
| Per Share Data |
| |||||||||||||||||||||
Net asset value, beginning of year | $ | 21.67 | $ | 21.09 | $ | 17.34 | $ | 16.99 | $ | 16.92 | ||||||||||||
Net investment income(a) | 0.27 | 0.22 | 0.25 | 0.21 | 0.22 | |||||||||||||||||
Net realized and unrealized gain | 0.75 | 0.56 | 3.79 | 0.33 | 0.07 | |||||||||||||||||
Total from investment operations | 1.02 | 0.78 | 4.04 | 0.54 | 0.29 | |||||||||||||||||
Distributions to shareholders from net investment income | (0.27 | ) | (0.20 | ) | (0.29 | ) | (0.19 | ) | (0.22 | ) | ||||||||||||
Distributions to shareholders from net realized gains | (1.06 | ) | — | — | — | — | ||||||||||||||||
Total distributions | (1.33 | ) | (0.20 | ) | (0.29 | ) | (0.19 | ) | (0.22 | ) | ||||||||||||
Net asset value, end of year | $ | 21.36 | $ | 21.67 | $ | 21.09 | $ | 17.34 | $ | 16.99 | ||||||||||||
| Total Return(b) | 5.19 | % | 3.70 | % | 23.37 | % | 3.22 | % | 1.77 | % | ||||||||||||
Net assets, end of year (in 000’s) | $ | 7,554 | $ | 10,199 | $ | 8,403 | $ | 6,014 | $ | 7,271 | ||||||||||||
Ratio of net expenses to average net assets | 1.07 | % | 1.06 | % | 1.06 | % | 1.06 | % | 1.06 | % | ||||||||||||
Ratio of total expenses to average net assets | 1.18 | % | 1.14 | % | 1.20 | % | 1.24 | % | 1.22 | % | ||||||||||||
Ratio of net investment income to average net assets | 1.28 | % | 1.00 | % | 1.28 | % | 1.27 | % | 1.29 | % | ||||||||||||
Portfolio turnover rate(c) | 225 | % | 202 | % | 208 | % | 229 | % | 221 | % | ||||||||||||
| (a) | Calculated based on the average shares outstanding methodology. |
| (b) | Assumes investment at the NAV at the beginning of the year, reinvestment of all dividends and distributions, a complete redemption of the investment at the NAV at the end of the year and no sales or redemption charges (if any). Total returns would be reduced if a sales or redemption charge was taken into account. Returns do not reflect the impact of taxes to shareholders relating to Fund distributions or the redemption of Fund shares. |
| (c) | The Fund’s portfolio turnover rate is calculated in accordance with regulatory requirements, without regard to transactions involving short term investments and certain derivatives. If such transactions were included, the Fund’s portfolio turnover rate may be higher. |
| The accompanying notes are an integral part of these financial statements. | 75 |
GOLDMAN SACHS LARGE CAP VALUE INSIGHTS FUND
Financial Highlights(continued)
Selected Data for a Share Outstanding Throughout Each Year
| Goldman Sachs Large Cap Value Insights Fund | ||||||||||||||||||||||
| Investor Shares | ||||||||||||||||||||||
| Year Ended October 31, | ||||||||||||||||||||||
| 2019 | 2018 | 2017 | 2016 | 2015 | ||||||||||||||||||
| Per Share Data |
| |||||||||||||||||||||
Net asset value, beginning of year | $ | 21.51 | $ | 20.94 | $ | 17.22 | $ | 16.88 | $ | 16.81 | ||||||||||||
Net investment income(a) | 0.32 | 0.29 | 0.34 | 0.26 | 0.27 | |||||||||||||||||
Net realized and unrealized gain | 0.76 | 0.57 | 3.74 | 0.33 | 0.08 | |||||||||||||||||
Total from investment operations | 1.08 | 0.86 | 4.08 | 0.59 | 0.35 | |||||||||||||||||
Distributions to shareholders from net investment income | (0.35 | ) | (0.29 | ) | (0.36 | ) | (0.25 | ) | (0.28 | ) | ||||||||||||
Distributions to shareholders from net realized gains | (1.06 | ) | — | — | — | — | ||||||||||||||||
Total distributions | (1.41 | ) | (0.29 | ) | (0.36 | ) | (0.25 | ) | (0.28 | ) | ||||||||||||
Net asset value, end of year | $ | 21.18 | $ | 21.51 | $ | 20.94 | $ | 17.22 | $ | 16.88 | ||||||||||||
| Total Return(b) | 5.55 | % | 4.07 | % | 23.79 | % | 3.57 | % | 2.14 | % | ||||||||||||
Net assets, end of year (in 000’s) | $ | 134,069 | $ | 84,895 | $ | 29,871 | $ | 9,947 | $ | 5,425 | ||||||||||||
Ratio of net expenses to average net assets | 0.70 | % | 0.70 | % | 0.71 | % | 0.71 | % | 0.71 | % | ||||||||||||
Ratio of total expenses to average net assets | 0.82 | % | 0.78 | % | 0.84 | % | 0.90 | % | 0.87 | % | ||||||||||||
Ratio of net investment income to average net assets | 1.58 | % | 1.33 | % | 1.70 | % | 1.56 | % | 1.60 | % | ||||||||||||
Portfolio turnover rate(c) | 225 | % | 202 | % | 208 | % | 229 | % | 221 | % | ||||||||||||
| (a) | Calculated based on the average shares outstanding methodology. |
| (b) | Assumes investment at the NAV at the beginning of the year, reinvestment of all dividends and distributions, a complete redemption of the investment at the NAV at the end of the year and no sales or redemption charges (if any). Total returns would be reduced if a sales or redemption charge was taken into account. Returns do not reflect the impact of taxes to shareholders relating to Fund distributions or the redemption of Fund shares. |
| (c) | The Fund’s portfolio turnover rate is calculated in accordance with regulatory requirements, without regard to transactions involving short term investments and certain derivatives. If such transactions were included, the Fund’s portfolio turnover rate may be higher. |
| 76 | The accompanying notes are an integral part of these financial statements. |
GOLDMAN SACHS LARGE CAP VALUE INSIGHTS FUND
Financial Highlights(continued)
Selected Data for a Share Outstanding Throughout Each Period
| Goldman Sachs Large Cap Value Insights Fund | ||||||||||
| Class P Shares | ||||||||||
| For the Year Ended October 31, 2019 | Period Ended October 31, 2018(a) | |||||||||
| Per Share Data |
| |||||||||
Net asset value, beginning of period | $ | 21.55 | $ | 21.87 | ||||||
Net investment income(b) | 0.36 | 0.17 | ||||||||
Net realized and unrealized gain (loss) | 0.76 | (0.33 | ) | |||||||
Total from investment operations | 1.12 | (0.16 | ) | |||||||
Distributions to shareholders from net investment income | (0.38 | ) | (0.16 | ) | ||||||
Distributions to shareholders from net realized gains | (1.06 | ) | — | |||||||
Total distributions | (1.44 | ) | (0.16 | ) | ||||||
Net asset value, end of period | $ | 21.23 | $ | 21.55 | ||||||
| Total Return(c) | 5.74 | % | (0.77 | )% | ||||||
Net assets, end of period (in 000’s) | $ | 33,601 | $ | 27,967 | ||||||
Ratio of net expenses to average net assets | 0.56 | % | 0.55 | %(d) | ||||||
Ratio of total expenses to average net assets | 0.67 | % | 0.65 | %(d) | ||||||
Ratio of net investment income to average net assets | 1.75 | % | 1.38 | %(d) | ||||||
Portfolio turnover rate(e) | 225 | % | 202 | % | ||||||
| (a) | Commenced operations on April 16, 2018. |
| (b) | Calculated based on the average shares outstanding methodology. |
| (c) | Assumes investment at the NAV at the beginning of the period, reinvestment of all dividends and distributions, a complete redemption of the investment at the NAV at the end of the period and no sales or redemption charges (if any). Total returns would be reduced if a sales or redemption charge was taken into account. Returns do not reflect the impact of taxes to shareholders relating to Fund distributions or the redemption of Fund shares. Total returns for periods less than one full year are not annualized. |
| (d) | Annualized. |
| (e) | The Fund’s portfolio turnover rate is calculated in accordance with regulatory requirements, without regard to transactions involving short term investments and certain derivatives. If such transactions were included, the Fund’s portfolio turnover rate may be higher. |
| The accompanying notes are an integral part of these financial statements. | 77 |
GOLDMAN SACHS LARGE CAP VALUE INSIGHTS FUND
Financial Highlights(continued)
Selected Data for a Share Outstanding Throughout Each Year
| Goldman Sachs Large Cap Value Insights Fund | ||||||||||||||||||||||
| Class R Shares | ||||||||||||||||||||||
| Year Ended October 31, | ||||||||||||||||||||||
| 2019 | 2018 | 2017 | 2016 | 2015 | ||||||||||||||||||
| Per Share Data |
| |||||||||||||||||||||
Net asset value, beginning of year | $ | 21.45 | $ | 20.88 | $ | 17.18 | $ | 16.84 | $ | 16.81 | ||||||||||||
Net investment income(a) | 0.23 | 0.19 | 0.24 | 0.18 | 0.18 | |||||||||||||||||
Net realized and unrealized gain | 0.74 | 0.56 | 3.73 | 0.33 | 0.08 | |||||||||||||||||
Total from investment operations | 0.97 | 0.75 | 3.97 | 0.51 | 0.26 | |||||||||||||||||
Distributions to shareholders from net investment income | (0.24 | ) | (0.18 | ) | (0.27 | ) | (0.17 | ) | (0.23 | ) | ||||||||||||
Distributions to shareholders from net realized gains | (1.06 | ) | — | — | — | — | ||||||||||||||||
Total distributions | (1.30 | ) | (0.18 | ) | (0.27 | ) | (0.17 | ) | (0.23 | ) | ||||||||||||
Net asset value, end of year | $ | 21.12 | $ | 21.45 | $ | 20.88 | $ | 17.18 | $ | 16.84 | ||||||||||||
| Total Return(b) | 5.01 | % | 3.56 | % | 23.19 | % | 3.08 | % | 1.56 | % | ||||||||||||
Net assets, end of year (in 000’s) | $ | 5,189 | $ | 5,651 | $ | 5,240 | $ | 1,877 | $ | 1,270 | ||||||||||||
Ratio of net expenses to average net assets | 1.20 | % | 1.20 | % | 1.21 | % | 1.21 | % | 1.21 | % | ||||||||||||
Ratio of total expenses to average net assets | 1.32 | % | 1.28 | % | 1.34 | % | 1.40 | % | 1.37 | % | ||||||||||||
Ratio of net investment income to average net assets | 1.12 | % | 0.88 | % | 1.22 | % | 1.07 | % | 1.07 | % | ||||||||||||
Portfolio turnover rate(c) | 225 | % | 202 | % | 208 | % | 229 | % | 221 | % | ||||||||||||
| (a) | Calculated based on the average shares outstanding methodology. |
| (b) | Assumes investment at the NAV at the beginning of the year, reinvestment of all dividends and distributions, a complete redemption of the investment at the NAV at the end of the year and no sales or redemption charges (if any). Total returns would be reduced if a sales or redemption charge was taken into account. Returns do not reflect the impact of taxes to shareholders relating to Fund distributions or the redemption of Fund shares. |
| (c) | The Fund’s portfolio turnover rate is calculated in accordance with regulatory requirements, without regard to transactions involving short term investments and certain derivatives. If such transactions were included, the Fund’s portfolio turnover rate may be higher. |
| 78 | The accompanying notes are an integral part of these financial statements. |
GOLDMAN SACHS LARGE CAP VALUE INSIGHTS FUND
Financial Highlights(continued)
Selected Data for a Share Outstanding Throughout Each Period
| Goldman Sachs Large Cap Value Insights Fund | ||||||||||||||||||||||
| Class R6 Shares | ||||||||||||||||||||||
| Year Ended October 31, | Period Ended October 31, 2015(a) | |||||||||||||||||||||
| 2019 | 2018 | 2017 | 2016 | |||||||||||||||||||
| Per Share Data |
| |||||||||||||||||||||
Net asset value, beginning of period | $ | 21.56 | $ | 20.99 | $ | 17.25 | $ | 16.90 | $ | 17.23 | ||||||||||||
Net investment income(b) | 0.40 | 0.33 | 0.36 | 0.29 | 0.07 | |||||||||||||||||
Net realized and unrealized gain (loss) | 0.72 | 0.55 | 3.77 | 0.34 | (0.32 | ) | ||||||||||||||||
Total from investment operations | 1.12 | 0.88 | 4.13 | 0.63 | (0.25 | ) | ||||||||||||||||
Distributions to shareholders from net investment income | (0.38 | ) | (0.31 | ) | (0.39 | ) | (0.28 | ) | (0.08 | ) | ||||||||||||
Distributions to shareholders from net realized gains | (1.06 | ) | — | — | — | — | ||||||||||||||||
Total distributions | (1.44 | ) | (0.31 | ) | (0.39 | ) | (0.28 | ) | (0.08 | ) | ||||||||||||
Net asset value, end of period | $ | 21.24 | $ | 21.56 | $ | 20.99 | $ | 17.25 | $ | 16.90 | ||||||||||||
| Total Return(c) | 5.73 | % | 4.19 | % | 24.05 | % | 3.76 | % | (1.41 | )% | ||||||||||||
Net assets, end of period (in 000’s) | $ | 73,981 | $ | 149,225 | $ | 75 | $ | 10 | $ | 10 | ||||||||||||
Ratio of net expenses to average net assets | 0.55 | % | 0.55 | % | 0.55 | % | 0.54 | % | 0.58 | %(d) | ||||||||||||
Ratio of total expenses to average net assets | 0.66 | % | 0.62 | % | 0.67 | % | 0.74 | % | 0.74 | %(d) | ||||||||||||
Ratio of net investment income to average net assets | 1.84 | % | 1.47 | % | 1.81 | % | 1.77 | % | 1.62 | %(d) | ||||||||||||
Portfolio turnover rate(e) | 225 | % | 202 | % | 208 | % | 229 | % | 221 | % | ||||||||||||
| (a) | Commenced operations on July 31, 2015. |
| (b) | Calculated based on the average shares outstanding methodology. |
| (c) | Assumes investment at the NAV at the beginning of the year, reinvestment of all dividends and distributions, a complete redemption of the investment at the NAV at the end of the year and no sales or redemption charges (if any). Total returns would be reduced if a sales or redemption charge was taken into account. Returns do not reflect the impact of taxes to shareholders relating to Fund distributions or the redemption of Fund shares. Total returns for periods less than one full year are not annualized. |
| (d) | Annualized. |
| (e) | The Fund’s portfolio turnover rate is calculated in accordance with regulatory requirements, without regard to transactions involving short term investments and certain derivatives. If such transactions were included, the Fund’s portfolio turnover rate may be higher. |
| The accompanying notes are an integral part of these financial statements. | 79 |
GOLDMAN SACHS SMALL CAP EQUITY INSIGHTS FUND
Financial Highlights(continued)
Selected Data for a Share Outstanding Throughout Each Year
| Goldman Sachs Small Cap Equity Insights Fund | ||||||||||||||||||||||
| Class A Shares | ||||||||||||||||||||||
| Year Ended October 31, | ||||||||||||||||||||||
| 2019 | 2018 | 2017 | 2016 | 2015 | ||||||||||||||||||
| Per Share Data |
| |||||||||||||||||||||
Net asset value, beginning of year | $ | 25.74 | $ | 24.77 | $ | 19.73 | $ | 19.10 | $ | 18.25 | ||||||||||||
Net investment income(a) | 0.05 | 0.01 | (b) | 0.04 | 0.08 | 0.03 | ||||||||||||||||
Net realized and unrealized gain | 1.23 | 0.96 | 5.06 | 0.58 | 0.82 | |||||||||||||||||
Total from investment operations | 1.28 | 0.97 | 5.10 | 0.66 | 0.85 | |||||||||||||||||
Distributions to shareholders from net investment income | — | — | (0.06 | ) | (0.03 | ) | — | |||||||||||||||
Distributions to shareholders from net realized gains | (1.40 | ) | — | — | — | — | ||||||||||||||||
Total distributions | (1.40 | ) | — | (0.06 | ) | (0.03 | ) | — | ||||||||||||||
Net asset value, end of year | $ | 25.62 | $ | 25.74 | $ | 24.77 | $ | 19.73 | $ | 19.10 | ||||||||||||
| Total Return(c) | 5.64 | % | 3.92 | % | 25.87 | % | 3.44 | % | 4.66 | % | ||||||||||||
Net assets, end of year (in 000’s) | $ | 53,503 | $ | 55,472 | $ | 41,945 | $ | 31,733 | $ | 34,680 | ||||||||||||
Ratio of net expenses to average net assets | 1.23 | % | 1.23 | % | 1.24 | % | 1.25 | % | 1.26 | % | ||||||||||||
Ratio of total expenses to average net assets | 1.34 | % | 1.31 | % | 1.43 | % | 1.49 | % | 1.47 | % | ||||||||||||
Ratio of net investment income to average net assets | 0.19 | % | 0.04 | %(b) | 0.16 | % | 0.43 | % | 0.15 | % | ||||||||||||
Portfolio turnover rate(d) | 140 | % | 111 | % | 137 | % | 144 | % | 127 | % | ||||||||||||
| (a) | Calculated based on the average shares outstanding methodology. |
| (b) | Reflects income recognized from special dividends which amounted to $0.04 per share and 0.15% of average net assets. |
| (c) | Assumes investment at the NAV at the beginning of the year, reinvestment of all dividends and distributions, a complete redemption of the investment at the NAV at the end of the year and no sales or redemption charges (if any). Total returns would be reduced if a sales or redemption charge was taken into account. Returns do not reflect the impact of taxes to shareholders relating to Fund distributions or the redemption of Fund shares. |
| (d) | The Fund’s portfolio turnover rate is calculated in accordance with regulatory requirements, without regard to transactions involving short term investments and certain derivatives. If such transactions were included, the Fund’s portfolio turnover rate may be higher. |
| 80 | The accompanying notes are an integral part of these financial statements. |
GOLDMAN SACHS SMALL CAP EQUITY INSIGHTS FUND
Financial Highlights(continued)
Selected Data for a Share Outstanding Throughout Each Year
| Goldman Sachs Small Cap Equity Insights Fund | ||||||||||||||||||||||
| Class C Shares | ||||||||||||||||||||||
| Year Ended October 31, | ||||||||||||||||||||||
| 2019 | 2018 | 2017 | 2016 | 2015 | ||||||||||||||||||
| Per Share Data |
| |||||||||||||||||||||
Net asset value, beginning of year | $ | 22.23 | $ | 21.56 | $ | 17.25 | $ | 16.81 | $ | 16.18 | ||||||||||||
Net investment loss(a) | (0.12 | ) | (0.17 | )(b) | (0.11 | ) | (0.05 | ) | (0.10 | ) | ||||||||||||
Net realized and unrealized gain | 1.04 | 0.84 | 4.42 | 0.49 | 0.73 | |||||||||||||||||
Total from investment operations | 0.92 | 0.67 | 4.31 | 0.44 | 0.63 | |||||||||||||||||
Distributions to shareholders from net realized gains | (1.40 | ) | — | — | — | — | ||||||||||||||||
Net asset value, end of year | $ | 21.75 | $ | 22.23 | $ | 21.56 | $ | 17.25 | $ | 16.81 | ||||||||||||
| Total Return(c) | 4.86 | % | 3.16 | % | 24.93 | % | 2.61 | % | 3.89 | % | ||||||||||||
Net assets, end of year (in 000’s) | $ | 7,785 | $ | 7,139 | $ | 9,439 | $ | 12,133 | $ | 14,153 | ||||||||||||
Ratio of net expenses to average net assets | 1.98 | % | 1.98 | % | 1.99 | % | 2.00 | % | 2.01 | % | ||||||||||||
Ratio of total expenses to average net assets | 2.09 | % | 2.06 | % | 2.18 | % | 2.24 | % | 2.22 | % | ||||||||||||
Ratio of net investment loss to average net assets | (0.57 | )% | (0.72 | )%(b) | (0.56 | )% | (0.32 | )% | (0.60 | )% | ||||||||||||
Portfolio turnover rate(d) | 140 | % | 111 | % | 137 | % | 144 | % | 127 | % | ||||||||||||
| (a) | Calculated based on the average shares outstanding methodology. |
| (b) | Reflects income recognized from special dividends which amounted to $0.04 per share and 0.15% of average net assets. |
| (c) | Assumes investment at the NAV at the beginning of the year, reinvestment of all dividends and distributions, a complete redemption of the investment at the NAV at the end of the year and no sales or redemption charges (if any). Total returns would be reduced if a sales or redemption charge was taken into account. Returns do not reflect the impact of taxes to shareholders relating to Fund distributions or the redemption of Fund shares. |
| (d) | The Fund’s portfolio turnover rate is calculated in accordance with regulatory requirements, without regard to transactions involving short term investments and certain derivatives. If such transactions were included, the Fund’s portfolio turnover rate may be higher. |
| The accompanying notes are an integral part of these financial statements. | 81 |
GOLDMAN SACHS SMALL CAP EQUITY INSIGHTS FUND
Financial Highlights(continued)
Selected Data for a Share Outstanding Throughout Each Year
| Goldman Sachs Small Cap Equity Insights Fund | ||||||||||||||||||||||
| Institutional Shares | ||||||||||||||||||||||
| Year Ended October 31, | ||||||||||||||||||||||
| 2019 | 2018 | 2017 | 2016 | 2015 | ||||||||||||||||||
| Per Share Data |
| |||||||||||||||||||||
Net asset value, beginning of year | $ | 26.77 | $ | 25.73 | $ | 20.47 | $ | 19.84 | $ | 18.94 | ||||||||||||
Net investment income(a) | 0.14 | 0.12 | (b) | 0.13 | 0.17 | 0.11 | ||||||||||||||||
Net realized and unrealized gain | 1.29 | 0.99 | 5.27 | 0.57 | 0.86 | |||||||||||||||||
Total from investment operations | 1.43 | 1.11 | 5.40 | 0.74 | 0.97 | |||||||||||||||||
Distributions to shareholders from net investment income | (0.06 | ) | (0.07 | ) | (0.14 | ) | (0.11 | ) | (0.07 | ) | ||||||||||||
Distributions to shareholders from net realized gains | (1.40 | ) | — | — | — | — | ||||||||||||||||
Total distributions | (1.46 | ) | (0.07 | ) | (0.14 | ) | (0.11 | ) | (0.07 | ) | ||||||||||||
Net asset value, end of year | $ | 26.74 | $ | 26.77 | $ | 25.73 | $ | 20.47 | $ | 19.84 | ||||||||||||
| Total Return(c) | 6.03 | % | 4.32 | % | 26.44 | % | 3.77 | % | 5.13 | % | ||||||||||||
Net assets, end of year (in 000’s) | $ | 290,652 | $ | 212,229 | $ | 231,226 | $ | 176,644 | $ | 81,067 | ||||||||||||
Ratio of net expenses to average net assets | 0.85 | % | 0.84 | % | 0.84 | % | 0.85 | % | 0.86 | % | ||||||||||||
Ratio of total expenses to average net assets | 0.96 | % | 0.93 | % | 1.03 | % | 1.08 | % | 1.07 | % | ||||||||||||
Ratio of net investment income to average net assets | 0.54 | % | 0.43 | %(b) | 0.56 | % | 0.84 | % | 0.57 | % | ||||||||||||
Portfolio turnover rate(d) | 140 | % | 111 | % | 137 | % | 144 | % | 127 | % | ||||||||||||
| (a) | Calculated based on the average shares outstanding methodology. |
| (b) | Reflects income recognized from special dividends which amounted to $0.04 per share and 0.15% of average net assets. |
| (c) | Assumes investment at the NAV at the beginning of the year, reinvestment of all dividends and distributions, a complete redemption of the investment at the NAV at the end of the year and no sales or redemption charges (if any). Total returns would be reduced if a sales or redemption charge was taken into account. Returns do not reflect the impact of taxes to shareholders relating to Fund distributions or the redemption of Fund shares. |
| (d) | The Fund’s portfolio turnover rate is calculated in accordance with regulatory requirements, without regard to transactions involving short term investments and certain derivatives. If such transactions were included, the Fund’s portfolio turnover rate may be higher. |
| 82 | The accompanying notes are an integral part of these financial statements. |
GOLDMAN SACHS SMALL CAP EQUITY INSIGHTS FUND
Financial Highlights(continued)
Selected Data for a Share Outstanding Throughout Each Year
| Goldman Sachs Small Cap Equity Insights Fund | ||||||||||||||||||||||
| Service Shares | ||||||||||||||||||||||
| Year Ended October 31, | ||||||||||||||||||||||
| 2019 | 2018 | 2017 | 2016 | 2015 | ||||||||||||||||||
| Per Share Data |
| |||||||||||||||||||||
Net asset value, beginning of year | $ | 25.34 | $ | 24.41 | $ | 19.44 | $ | 18.82 | $ | 18.00 | ||||||||||||
Net investment income (loss)(a) | 0.01 | (0.02 | )(b) | 0.01 | 0.06 | 0.02 | ||||||||||||||||
Net realized and unrealized gain | 1.22 | 0.95 | 5.00 | 0.56 | 0.80 | |||||||||||||||||
Total from investment operations | 1.23 | 0.93 | 5.01 | 0.62 | 0.82 | |||||||||||||||||
Distributions to shareholders from net investment income | — | — | (0.04 | ) | — | — | ||||||||||||||||
Distributions to shareholders from net realized gains | (1.40 | ) | — | — | — | — | ||||||||||||||||
Total distributions | (1.40 | ) | — | (0.04 | ) | — | — | |||||||||||||||
Net asset value, end of year | $ | 25.17 | $ | 25.34 | $ | 24.41 | $ | 19.44 | $ | 18.82 | ||||||||||||
| Total Return(c) | 5.52 | % | 3.81 | % | 25.77 | % | 3.29 | % | 4.56 | % | ||||||||||||
Net assets, end of year (in 000’s) | $ | 3,141 | $ | 2,031 | $ | 769 | $ | 651 | $ | 959 | ||||||||||||
Ratio of net expenses to average net assets | 1.35 | % | 1.34 | % | 1.34 | % | 1.35 | % | 1.36 | % | ||||||||||||
Ratio of total expenses to average net assets | 1.45 | % | 1.42 | % | 1.53 | % | 1.59 | % | 1.58 | % | ||||||||||||
Ratio of net investment income (loss) to average net assets | 0.04 | % | (0.06 | )%(b) | 0.06 | % | 0.31 | % | 0.12 | % | ||||||||||||
Portfolio turnover rate(d) | 140 | % | 111 | % | 137 | % | 144 | % | 127 | % | ||||||||||||
| (a) | Calculated based on the average shares outstanding methodology. |
| (b) | Reflects income recognized from special dividends which amounted to $0.04 per share and 0.15% of average net assets. |
| (c) | Assumes investment at the NAV at the beginning of the year, reinvestment of all dividends and distributions, a complete redemption of the investment at the NAV at the end of the year and no sales or redemption charges (if any). Total returns would be reduced if a sales or redemption charge was taken into account. Returns do not reflect the impact of taxes to shareholders relating to Fund distributions or the redemption of Fund shares. |
| (d) | The Fund’s portfolio turnover rate is calculated in accordance with regulatory requirements, without regard to transactions involving short term investments and certain derivatives. If such transactions were included, the Fund’s portfolio turnover rate may be higher. |
| The accompanying notes are an integral part of these financial statements. | 83 |
GOLDMAN SACHS SMALL CAP EQUITY INSIGHTS FUND
Financial Highlights(continued)
Selected Data for a Share Outstanding Throughout Each Year
| Goldman Sachs Small Cap Equity Insights Fund | ||||||||||||||||||||||
| Investor Shares | ||||||||||||||||||||||
| Year Ended October 31, | ||||||||||||||||||||||
| 2019 | 2018 | 2017 | 2016 | 2015 | ||||||||||||||||||
| Per Share Data |
| |||||||||||||||||||||
Net asset value, beginning of year | $ | 25.62 | $ | 24.61 | $ | 19.61 | $ | 19.02 | $ | 18.14 | ||||||||||||
Net investment income(a) | 0.09 | 0.08 | (b) | 0.14 | 0.09 | 0.06 | ||||||||||||||||
Net realized and unrealized gain | 1.24 | 0.95 | 4.99 | 0.59 | 0.84 | |||||||||||||||||
Total from investment operations | 1.33 | 1.03 | 5.13 | 0.68 | 0.90 | |||||||||||||||||
Distributions to shareholders from net investment income | (0.05 | ) | (0.02 | ) | (0.13 | ) | (0.09 | ) | (0.02 | ) | ||||||||||||
Distributions to shareholders from net realized gains | (1.40 | ) | — | — | — | — | ||||||||||||||||
Total distributions | (1.45 | ) | (0.02 | ) | (0.13 | ) | (0.09 | ) | (0.02 | ) | ||||||||||||
Net asset value, end of year | $ | 25.50 | $ | 25.62 | $ | 24.61 | $ | 19.61 | $ | 19.02 | ||||||||||||
| Total Return(c) | 5.90 | % | 4.19 | % | 26.22 | % | 3.63 | % | 4.99 | % | ||||||||||||
Net assets, end of year (in 000’s) | $ | 74,881 | $ | 44,984 | $ | 2,684 | $ | 7,462 | $ | 1,119 | ||||||||||||
Ratio of net expenses to average net assets | 0.99 | % | 0.98 | % | 0.99 | % | 0.99 | % | 1.01 | % | ||||||||||||
Ratio of total expenses to average net assets | 1.09 | % | 1.06 | % | 1.17 | % | 1.22 | % | 1.23 | % | ||||||||||||
Ratio of net investment income to average net assets | 0.40 | % | 0.31 | %(b) | 0.60 | % | 0.45 | % | 0.32 | % | ||||||||||||
Portfolio turnover rate(d) | 140 | % | 111 | % | 137 | % | 144 | % | 127 | % | ||||||||||||
| (a) | Calculated based on the average shares outstanding methodology. |
| (b) | Reflects income recognized from special dividends which amounted to $0.04 per share and 0.15% of average net assets. |
| (c) | Assumes investment at the NAV at the beginning of the year, reinvestment of all dividends and distributions, a complete redemption of the investment at the NAV at the end of the year and no sales or redemption charges (if any). Total returns would be reduced if a sales or redemption charge was taken into account. Returns do not reflect the impact of taxes to shareholders relating to Fund distributions or the redemption of Fund shares. |
| (d) | The Fund’s portfolio turnover rate is calculated in accordance with regulatory requirements, without regard to transactions involving short term investments and certain derivatives. If such transactions were included, the Fund’s portfolio turnover rate may be higher. |
| 84 | The accompanying notes are an integral part of these financial statements. |
GOLDMAN SACHS SMALL CAP EQUITY INSIGHTS FUND
Financial Highlights(continued)
Selected Data for a Share Outstanding Throughout Each Period
| Goldman Sachs Small Cap Equity Insights Fund | ||||||||||
| Class P Shares | ||||||||||
| For the Year Ended October 31, 2019 | Period Ended October 31, 2018(a) | |||||||||
| Per Share Data |
| |||||||||
Net asset value, beginning of period | $ | 26.77 | $ | 27.21 | ||||||
Net investment income(b) | 0.13 | 0.08 | (c) | |||||||
Net realized and unrealized gain (loss) | 1.30 | (0.52 | ) | |||||||
Total from investment operations | 1.43 | (0.44 | ) | |||||||
Distributions to shareholders from net investment income | (0.06 | ) | — | |||||||
Distributions to shareholders from net realized gains | (1.40 | ) | — | |||||||
Total distributions | (1.46 | ) | — | |||||||
Net asset value, end of period | $ | 26.74 | $ | 26.77 | ||||||
| Total Return(d) | 6.06 | % | (1.62 | )% | ||||||
Net assets, end of period (in 000’s) | $ | 106,039 | $ | 66,823 | ||||||
Ratio of net expenses to average net assets | 0.84 | % | 0.83 | %(e) | ||||||
Ratio of total expenses to average net assets | 0.94 | % | 0.92 | %(e) | ||||||
Ratio of net investment income to average net assets | 0.53 | % | 0.48 | %(c)(e) | ||||||
Portfolio turnover rate(f) | 140 | % | 111 | % | ||||||
| (a) | Commenced operations on April 16, 2018. |
| (b) | Calculated based on the average shares outstanding methodology. |
| (c) | Reflects income recognized from special dividends which amounted to $0.04 per share and 0.15% of average net assets. |
| (d) | Assumes investment at the NAV at the beginning of the period, reinvestment of all dividends and distributions, a complete redemption of the investment at the NAV at the end of the period and no sales or redemption charges (if any). Total returns would be reduced if a sales or redemption charge was taken into account. Returns do not reflect the impact of taxes to shareholders relating to Fund distributions or the redemption of Fund shares. Total returns for periods less than one full year are not annualized. |
| (e) | Annualized. |
| (f) | The Fund’s portfolio turnover rate is calculated in accordance with regulatory requirements, without regard to transactions involving short term investments and certain derivatives. If such transactions were included, the Fund’s portfolio turnover rate may be higher. |
| The accompanying notes are an integral part of these financial statements. | 85 |
GOLDMAN SACHS SMALL CAP EQUITY INSIGHTS FUND
Financial Highlights(continued)
Selected Data for a Share Outstanding Throughout Each Year
| Goldman Sachs Small Cap Equity Insights Fund | ||||||||||||||||||||||
| Class R Shares | ||||||||||||||||||||||
| Year Ended October 31, | ||||||||||||||||||||||
| 2019 | 2018 | 2017 | 2016 | 2015 | ||||||||||||||||||
| Per Share Data |
| |||||||||||||||||||||
Net asset value, beginning of year | $ | 25.18 | $ | 24.29 | $ | 19.36 | $ | 18.78 | $ | 17.98 | ||||||||||||
Net investment income (loss)(a) | (0.02 | ) | (0.06 | )(c) | (0.02 | ) | 0.03 | (0.02 | ) | |||||||||||||
Net realized and unrealized gain | 1.20 | 0.95 | 4.98 | 0.55 | 0.82 | |||||||||||||||||
Total from investment operations | 1.18 | 0.89 | 4.96 | 0.58 | 0.80 | |||||||||||||||||
Distributions to shareholders from net investment income | — | — | (0.03 | ) | — | (b) | — | |||||||||||||||
Distributions to shareholders from net realized gains | (1.40 | ) | — | — | — | — | ||||||||||||||||
Total distributions | (1.40 | ) | — | (0.03 | ) | — | — | |||||||||||||||
Net asset value, end of year | $ | 24.96 | $ | 25.18 | $ | 24.29 | $ | 19.36 | $ | 18.78 | ||||||||||||
| Total Return(d) | 5.35 | % | 3.66 | % | 25.60 | % | 3.11 | % | 4.45 | % | ||||||||||||
Net assets, end of year (in 000’s) | $ | 16,562 | $ | 14,625 | $ | 15,284 | $ | 9,954 | $ | 8,986 | ||||||||||||
Ratio of net expenses to average net assets | 1.48 | % | 1.48 | % | 1.49 | % | 1.50 | % | 1.51 | % | ||||||||||||
Ratio of total expenses to average net assets | 1.59 | % | 1.56 | % | 1.68 | % | 1.74 | % | 1.72 | % | ||||||||||||
Ratio of net investment income (loss) to average net assets | (0.08 | )% | (0.22 | )%(c) | (0.10 | )% | 0.18 | % | (0.11 | )% | ||||||||||||
Portfolio turnover rate(e) | 140 | % | 111 | % | 137 | % | 144 | % | 127 | % | ||||||||||||
| (a) | Calculated based on the average shares outstanding methodology. |
| (b) | Amount is less than $0.005 per share. |
| (c) | Reflects income recognized from special dividends which amounted to $0.04 per share and 0.15% of average net assets. |
| (d) | Assumes investment at the NAV at the beginning of the year, reinvestment of all dividends and distributions, a complete redemption of the investment at the NAV at the end of the year and no sales or redemption charges (if any). Total returns would be reduced if a sales or redemption charge was taken into account. Returns do not reflect the impact of taxes to shareholders relating to Fund distributions or the redemption of Fund shares. |
| (e) | The Fund’s portfolio turnover rate is calculated in accordance with regulatory requirements, without regard to transactions involving short term investments and certain derivatives. If such transactions were included, the Fund’s portfolio turnover rate may be higher. |
| 86 | The accompanying notes are an integral part of these financial statements. |
GOLDMAN SACHS SMALL CAP EQUITY INSIGHTS FUND
Financial Highlights(continued)
Selected Data for a Share Outstanding Throughout Each Period
| Goldman Sachs Small Cap Equity Insights Fund | ||||||||||||||||||||||
| Class R6 Shares | ||||||||||||||||||||||
| Year Ended October 31, | Period Ended October 31, 2015(a) | |||||||||||||||||||||
| 2019 | 2018 | 2017 | 2016 | |||||||||||||||||||
| Per Share Data |
| |||||||||||||||||||||
Net asset value, beginning of period | $ | 26.77 | $ | 25.73 | $ | 20.47 | $ | 19.84 | $ | 20.22 | ||||||||||||
Net investment income(b) | 0.16 | 0.13 | (c) | 0.11 | 0.17 | 0.02 | ||||||||||||||||
Net realized and unrealized gain (loss) | 1.27 | 0.99 | 5.29 | 0.58 | (0.40 | ) | ||||||||||||||||
Total from investment operations | 1.43 | 1.12 | 5.40 | 0.75 | (0.38 | ) | ||||||||||||||||
Distributions to shareholders from net investment income | (0.06 | ) | (0.08 | ) | (0.14 | ) | (0.12 | ) | — | |||||||||||||
Distributions to shareholders from net realized gains | (1.40 | ) | — | — | — | — | ||||||||||||||||
Total distributions | (1.46 | ) | (0.08 | ) | (0.14 | ) | (0.12 | ) | — | |||||||||||||
Net asset value, end of period | $ | 26.74 | $ | 26.77 | $ | 25.73 | $ | 20.47 | $ | 19.84 | ||||||||||||
| Total Return(d) | 6.05 | % | 4.35 | % | 26.45 | % | 3.81 | % | (1.88 | )% | ||||||||||||
Net assets, end of period (in 000’s) | $ | 153,129 | $ | 173,112 | $ | 337 | $ | 35 | $ | 10 | ||||||||||||
Ratio of net expenses to average net assets | 0.84 | % | 0.83 | % | 0.83 | % | 0.83 | % | 0.86 | %(e) | ||||||||||||
Ratio of total expenses to average net assets | 0.94 | % | 0.89 | % | 1.02 | % | 1.06 | % | 1.06 | %(e) | ||||||||||||
Ratio of net investment income to average net assets | 0.63 | % | 0.45 | %(c) | 0.47 | % | 0.85 | % | 0.38 | %(e) | ||||||||||||
Portfolio turnover rate(f) | 140 | % | 111 | % | 137 | % | 144 | % | 127 | % | ||||||||||||
| (a) | Commenced operations on July 31, 2015. |
| (b) | Calculated based on the average shares outstanding methodology. |
| (c) | Reflects income recognized from special dividends which amounted to $0.04 per share and 0.15% of average net assets. |
| (d) | Assumes investment at the NAV at the beginning of the period, reinvestment of all dividends and distributions, a complete redemption of the investment at the NAV at the end of the period and no sales or redemption charges (if any). Total returns would be reduced if a sales or redemption charge was taken into account. Returns do not reflect the impact of taxes to shareholders relating to Fund distributions or the redemption of Fund shares. Total returns for periods less than one full year are not annualized. |
| (e) | Annualized. |
| (f) | The Fund’s portfolio turnover rate is calculated in accordance with regulatory requirements, without regard to transactions involving short term investments and certain derivatives. If such transactions were included, the Fund’s portfolio turnover rate may be higher. |
| The accompanying notes are an integral part of these financial statements. | 87 |
GOLDMAN SACHS SMALL CAP GROWTH INSIGHTS FUND
Financial Highlights(continued)
Selected Data for a Share Outstanding Throughout Each Period
| Goldman Sachs Small Cap Growth Insights Fund | ||||||||||||||||||||||
| Class A Shares | ||||||||||||||||||||||
| Year Ended October 31, | ||||||||||||||||||||||
| 2019 | 2018 | 2017 | 2016 | 2015 | ||||||||||||||||||
| Per Share Data |
| |||||||||||||||||||||
Net asset value, beginning of year | $ | 37.25 | $ | 36.71 | $ | 28.34 | $ | 31.15 | $ | 31.17 | ||||||||||||
Net investment loss(a) | (0.12 | ) | (0.13 | )(b) | (0.07 | ) | — | (c) | (0.10 | ) | ||||||||||||
Net realized and unrealized gain (loss) | 1.76 | 2.20 | 8.44 | (0.12 | )(d) | 1.87 | ||||||||||||||||
Total from investment operations | 1.64 | 2.07 | 8.37 | (0.12 | ) | 1.77 | ||||||||||||||||
Distributions to shareholders from net realized gains | (3.81 | ) | (1.53 | ) | — | (2.69 | ) | (1.79 | ) | |||||||||||||
Net asset value, end of year | $ | 35.08 | $ | 37.25 | $ | 36.71 | $ | 28.34 | $ | 31.15 | ||||||||||||
| Total Return(e) | 5.65 | % | 5.87 | % | 29.53 | % | (0.37 | )% | 5.95 | % | ||||||||||||
Net assets, end of year (in 000’s) | $ | 84,557 | $ | 88,316 | $ | 77,969 | $ | 65,195 | $ | 43,647 | ||||||||||||
Ratio of net expenses to average net assets | 1.24 | % | 1.22 | % | 1.22 | % | 1.25 | % | 1.26 | % | ||||||||||||
Ratio of total expenses to average net assets | 1.32 | % | 1.32 | % | 1.40 | % | 1.51 | % | 1.60 | % | ||||||||||||
Ratio of net investment loss to average net assets | (0.36 | )% | (0.35 | )%(b) | (0.21 | )% | — | % | (0.33 | )% | ||||||||||||
Portfolio turnover rate(f) | 140 | % | 127 | % | 136 | % | 139 | % | 145 | % | ||||||||||||
| (a) | Calculated based on the average shares outstanding methodology. |
| (b) | Reflects income recognized from special dividends which amounted to $0.05 per share and 0.12% of average net assets. |
| (c) | Amount is less than $0.005 per share. |
| (d) | The amount shown for a share outstanding does not correspond with the aggregate net gain on investments during the period due to the timing of sales and redemptions of Fund shares in relation to the fluctuating market values of the investments of the Fund. |
| (e) | Assumes investment at the NAV at the beginning of the year, reinvestment of all dividends and distributions, a complete redemption of the investment at the NAV at the end of the year and no sales or redemption charges (if any). Total returns would be reduced if a sales or redemption charge was taken into account. Returns do not reflect the impact of taxes to shareholders relating to Fund distributions or the redemption of Fund shares. |
| (f) | The Fund’s portfolio turnover rate is calculated in accordance with regulatory requirements, without regard to transactions involving short term investments and certain derivatives. If such transactions were included, the Fund’s portfolio turnover rate may be higher. |
| 88 | The accompanying notes are an integral part of these financial statements. |
GOLDMAN SACHS SMALL CAP GROWTH INSIGHTS FUND
Financial Highlights(continued)
Selected Data for a Share Outstanding Throughout Each Period
| Goldman Sachs Small Cap Growth Insights Fund | ||||||||||||||||||||||
| Class C Shares | ||||||||||||||||||||||
| Year Ended October 31, | ||||||||||||||||||||||
| 2019 | 2018 | 2017 | 2016 | 2015 | ||||||||||||||||||
| Per Share Data |
| |||||||||||||||||||||
Net asset value, beginning of year | $ | 28.98 | $ | 29.12 | $ | 22.64 | $ | 25.61 | $ | 26.12 | ||||||||||||
Net investment loss(a) | (0.28 | ) | (0.33 | )(b) | (0.25 | ) | (0.16 | ) | (0.28 | ) | ||||||||||||
Net realized and unrealized gain (loss) | 1.27 | 1.72 | 6.73 | (0.12 | )(c) | 1.56 | ||||||||||||||||
Total from investment operations | 0.99 | 1.39 | 6.48 | (0.28 | ) | 1.28 | ||||||||||||||||
Distributions to shareholders from net realized gains | (3.81 | ) | (1.53 | ) | — | (2.69 | ) | (1.79 | ) | |||||||||||||
Net asset value, end of year | $ | 26.16 | $ | 28.98 | $ | 29.12 | $ | 22.64 | $ | 25.61 | ||||||||||||
| Total Return(d) | 4.92 | % | 5.03 | % | 28.62 | % | (1.14 | )% | 5.18 | % | ||||||||||||
Net assets, end of year (in 000’s) | $ | 8,303 | $ | 8,179 | $ | 9,852 | $ | 7,420 | $ | 7,964 | ||||||||||||
Ratio of net expenses to average net assets | 1.99 | % | 1.97 | % | 1.97 | % | 2.00 | % | 2.01 | % | ||||||||||||
Ratio of total expenses to average net assets | 2.07 | % | 2.07 | % | 2.15 | % | 2.26 | % | 2.36 | % | ||||||||||||
Ratio of net investment loss to average net assets | (1.11 | )% | (1.09 | )%(b) | (0.95 | )% | (0.74 | )% | (1.06 | )% | ||||||||||||
Portfolio turnover rate(e) | 140 | % | 127 | % | 136 | % | 139 | % | 145 | % | ||||||||||||
| (a) | Calculated based on the average shares outstanding methodology. |
| (b) | Reflects income recognized from special dividends which amounted to $0.05 per share and 0.12% of average net assets. |
| (c) | The amount shown for a share outstanding does not correspond with the aggregate net gain on investments during the period due to the timing of sales and redemptions of Fund shares in relation to the fluctuating market values of the investments of the Fund. |
| (d) | Assumes investment at the NAV at the beginning of the year, reinvestment of all dividends and distributions, a complete redemption of the investment at the NAV at the end of the year and no sales or redemption charges (if any). Total returns would be reduced if a sales or redemption charge was taken into account. Returns do not reflect the impact of taxes to shareholders relating to Fund distributions or the redemption of Fund shares. |
| (e) | The Fund’s portfolio turnover rate is calculated in accordance with regulatory requirements, without regard to transactions involving short term investments and certain derivatives. If such transactions were included, the Fund’s portfolio turnover rate may be higher. |
| The accompanying notes are an integral part of these financial statements. | 89 |
GOLDMAN SACHS SMALL CAP GROWTH INSIGHTS FUND
Financial Highlights(continued)
Selected Data for a Share Outstanding Throughout Each Period
| Goldman Sachs Small Cap Growth Insights Fund | ||||||||||||||||||||||
| Institutional Shares | ||||||||||||||||||||||
| Year Ended October 31, | ||||||||||||||||||||||
| 2019 | 2018 | 2017 | 2016 | 2015 | ||||||||||||||||||
| Per Share Data |
| |||||||||||||||||||||
Net asset value, beginning of year | $ | 43.56 | $ | 42.53 | $ | 32.76 | $ | 35.46 | $ | 35.10 | ||||||||||||
Net investment income(a) | 0.01 | 0.02 | (b) | 0.05 | 0.13 | 0.02 | ||||||||||||||||
Net realized and unrealized gain (loss) | 2.16 | 2.54 | 9.79 | (0.14 | )(c) | 2.13 | ||||||||||||||||
Total from investment operations | 2.17 | 2.56 | 9.84 | (0.01 | ) | 2.15 | ||||||||||||||||
Distributions to shareholders from net investment income | — | — | (0.07 | ) | — | — | ||||||||||||||||
Distributions to shareholders from net realized gains | (3.81 | ) | (1.53 | ) | — | (2.69 | ) | (1.79 | ) | |||||||||||||
Total distributions | (3.81 | ) | (1.53 | ) | (0.07 | ) | (2.69 | ) | (1.79 | ) | ||||||||||||
Net asset value, end of year | $ | 41.92 | $ | 43.56 | $ | 42.53 | $ | 32.76 | $ | 35.46 | ||||||||||||
| Total Return(d) | 6.08 | % | 6.26 | % | 30.04 | % | 0.01 | % | 6.39 | % | ||||||||||||
Net assets, end of year (in 000’s) | $ | 349,348 | $ | 307,032 | $ | 265,199 | $ | 91,248 | $ | 64,023 | ||||||||||||
Ratio of net expenses to average net assets | 0.85 | % | 0.84 | % | 0.85 | % | 0.85 | % | 0.86 | % | ||||||||||||
Ratio of total expenses to average net assets | 0.93 | % | 0.93 | % | 1.01 | % | 1.11 | % | 1.20 | % | ||||||||||||
Ratio of net investment income to average net assets | 0.02 | % | 0.03 | %(b) | 0.13 | % | 0.40 | % | 0.06 | % | ||||||||||||
Portfolio turnover rate(e) | 140 | % | 127 | % | 136 | % | 139 | % | 145 | % | ||||||||||||
| (a) | Calculated based on the average shares outstanding methodology. |
| (b) | Reflects income recognized from special dividends which amounted to $0.05 per share and 0.12% of average net assets. |
| (c) | The amount shown for a share outstanding does not correspond with the aggregate net gain on investments during the period due to the timing of sales and redemptions of Fund shares in relation to the fluctuating market values of the investments of the Fund. |
| (d) | Assumes investment at the NAV at the beginning of the year, reinvestment of all dividends and distributions, a complete redemption of the investment at the NAV at the end of the year and no sales or redemption charges (if any). Total returns would be reduced if a sales or redemption charge was taken into account. Returns do not reflect the impact of taxes to shareholders relating to Fund distributions or the redemption of Fund shares. |
| (e) | The Fund’s portfolio turnover rate is calculated in accordance with regulatory requirements, without regard to transactions involving short term investments and certain derivatives. If such transactions were included, the Fund’s portfolio turnover rate may be higher. |
| 90 | The accompanying notes are an integral part of these financial statements. |
GOLDMAN SACHS SMALL CAP GROWTH INSIGHTS FUND
Financial Highlights(continued)
Selected Data for a Share Outstanding Throughout Each Period
| Goldman Sachs Small Cap Growth Insights Fund | ||||||||||||||||||||||
| Investor Shares | ||||||||||||||||||||||
| Year Ended October 31, | ||||||||||||||||||||||
| 2019 | 2018 | 2017 | 2016 | 2015 | ||||||||||||||||||
| Per Share Data |
| |||||||||||||||||||||
Net asset value, beginning of year | $ | 38.18 | $ | 37.50 | $ | 28.93 | $ | 31.68 | $ | 31.59 | ||||||||||||
Net investment income (loss)(a) | (0.04 | ) | (0.04 | )(b) | — | (c) | 0.01 | (0.04 | ) | |||||||||||||
Net realized and unrealized gain (loss) | 1.83 | 2.25 | 8.63 | (0.07 | )(d) | 1.92 | ||||||||||||||||
Total from investment operations | 1.79 | 2.21 | 8.63 | (0.06 | ) | 1.88 | ||||||||||||||||
Distributions to shareholders from net investment income | — | — | (0.06 | ) | — | — | ||||||||||||||||
Distributions to shareholders from net realized gains | (3.81 | ) | (1.53 | ) | — | (2.69 | ) | (1.79 | ) | |||||||||||||
Total distributions | (3.81 | ) | (1.53 | ) | (0.06 | ) | (2.69 | ) | (1.79 | ) | ||||||||||||
Net asset value, end of year | $ | 36.16 | $ | 38.18 | $ | 37.50 | $ | 28.93 | $ | 31.68 | ||||||||||||
| Total Return(e) | 5.93 | % | 6.13 | % | 29.87 | % | (0.15 | )% | 6.24 | % | ||||||||||||
Net assets, end of year (in 000’s) | $ | 378,807 | $ | 308,366 | $ | 192,860 | $ | 47,826 | $ | 4,683 | ||||||||||||
Ratio of net expenses to average net assets | 0.99 | % | 0.97 | % | 0.96 | % | 1.00 | % | 1.01 | % | ||||||||||||
Ratio of total expenses to average net assets | 1.07 | % | 1.07 | % | 1.16 | % | 1.23 | % | 1.33 | % | ||||||||||||
Ratio of net investment income (loss) to average net assets | (0.12 | )% | (0.10 | )%(b) | 0.01 | % | 0.04 | % | (0.12 | )% | ||||||||||||
Portfolio turnover rate(f) | 140 | % | 127 | % | 136 | % | 139 | % | 145 | % | ||||||||||||
| (a) | Calculated based on the average shares outstanding methodology. |
| (b) | Reflects income recognized from special dividends which amounted to $0.05 per share and 0.12% of average net assets. |
| (c) | Amount is less than $0.005 per share. |
| (d) | The amount shown for a share outstanding does not correspond with the aggregate net gain on investments during the period due to the timing of sales and redemptions of Fund shares in relation to the fluctuating market values of the investments of the Fund. |
| (e) | Assumes investment at the NAV at the beginning of the year, reinvestment of all dividends and distributions, a complete redemption of the investment at the NAV at the end of the year and no sales or redemption charges (if any). Total returns would be reduced if a sales or redemption charge was taken into account. Returns do not reflect the impact of taxes to shareholders relating to Fund distributions or the redemption of Fund shares. |
| (f) | The Fund’s portfolio turnover rate is calculated in accordance with regulatory requirements, without regard to transactions involving short term investments and certain derivatives. If such transactions were included, the Fund’s portfolio turnover rate may be higher. |
| The accompanying notes are an integral part of these financial statements. | 91 |
GOLDMAN SACHS SMALL CAP GROWTH INSIGHTS FUND
Financial Highlights(continued)
Selected Data for a Share Outstanding Throughout Each Period
| Goldman Sachs Small Cap Growth Insights Fund | ||||||||||
| Class P Shares | ||||||||||
| For the Year Ended October 31, 2019 | Period Ended October 31, 2018(a) | |||||||||
| Per Share Data |
| |||||||||
Net asset value, beginning of period | $ | 43.58 | $ | 44.33 | ||||||
Net investment income(b) | 0.01 | 0.03 | (c) | |||||||
Net realized and unrealized gain (loss) | 2.16 | (0.78 | ) | |||||||
Total from investment operations | 2.17 | (0.75 | ) | |||||||
Distributions to shareholders from net realized gains | (3.81 | ) | — | |||||||
Total distributions | (3.81 | ) | — | |||||||
Net asset value, end of period | $ | 41.94 | $ | 43.58 | ||||||
| Total Return(d) | 6.08 | % | (1.69 | )% | ||||||
Net assets, end of period (in 000’s) | $ | 12,534 | $ | 10,878 | ||||||
Ratio of net expenses to average net assets | 0.84 | % | 0.83 | %(e) | ||||||
Ratio of total expenses to average net assets | 0.93 | % | 0.93 | %(e) | ||||||
Ratio of net investment income to average net assets | 0.02 | % | 0.12 | %(c)(e) | ||||||
Portfolio turnover rate(f) | 140 | % | 127 | % | ||||||
| (a) | Commenced operations on April 16, 2018. |
| (b) | Calculated based on the average shares outstanding methodology. |
| (c) | Reflects income recognized from special dividends which amounted to $0.05 per share and 0.12% of average net assets. |
| (d) | Assumes investment at the NAV at the beginning of the period, reinvestment of all dividends and distributions, a complete redemption of the investment at the NAV at the end of the period and no sales or redemption charges (if any). Total returns would be reduced if a sales or redemption charge was taken into account. Returns do not reflect the impact of taxes to shareholders relating to Fund distributions or the redemption of Fund shares. Total returns for periods less than one full year are not annualized. |
| (e) | Annualized. |
| (f) | The Fund’s portfolio turnover rate is calculated in accordance with regulatory requirements, without regard to transactions involving short term investments and certain derivatives. If such transactions were included, the Fund’s portfolio turnover rate may be higher. |
| 92 | The accompanying notes are an integral part of these financial statements. |
GOLDMAN SACHS SMALL CAP GROWTH INSIGHTS FUND
Financial Highlights(continued)
Selected Data for a Share Outstanding Throughout Each Period
| Goldman Sachs Small Cap Growth Insights Fund | ||||||||||||||||||||||
| Class R Shares | ||||||||||||||||||||||
| Year Ended October 31, | ||||||||||||||||||||||
| 2019 | 2018 | 2017 | 2016 | 2015 | ||||||||||||||||||
| Per Share Data |
| |||||||||||||||||||||
Net asset value, beginning of year | $ | 35.90 | $ | 35.53 | $ | 27.49 | $ | 30.37 | $ | 30.51 | ||||||||||||
Net investment loss(a) | (0.20 | ) | (0.22 | )(b) | (0.16 | ) | (0.06 | ) | (0.18 | ) | ||||||||||||
Net realized and unrealized gain (loss) | 1.69 | 2.12 | 8.20 | (0.13 | )(c) | 1.83 | ||||||||||||||||
Total from investment operations | 1.49 | 1.90 | 8.04 | (0.19 | ) | 1.65 | ||||||||||||||||
Distributions to shareholders from net realized gains | (3.81 | ) | (1.53 | ) | — | (2.69 | ) | (1.79 | ) | |||||||||||||
Net asset value, end of year | $ | 33.58 | $ | 35.90 | $ | 35.53 | $ | 27.49 | $ | 30.37 | ||||||||||||
| Total Return(d) | 5.42 | % | 5.58 | % | 29.25 | % | (0.63 | )% | 5.67 | % | ||||||||||||
Net assets, end of year (in 000’s) | $ | 19,707 | $ | 19,998 | $ | 12,113 | $ | 3,689 | $ | 2,299 | ||||||||||||
Ratio of net expenses to average net assets | 1.49 | % | 1.47 | % | 1.46 | % | 1.50 | % | 1.51 | % | ||||||||||||
Ratio of total expenses to average net assets | 1.57 | % | 1.57 | % | 1.66 | % | 1.76 | % | 1.85 | % | ||||||||||||
Ratio of net investment loss to average net assets | (0.61 | )% | (0.59 | )%(b) | (0.50 | )% | (0.21 | )% | (0.60 | )% | ||||||||||||
Portfolio turnover rate(e) | 140 | % | 127 | % | 136 | % | 139 | % | 145 | % | ||||||||||||
| (a) | Calculated based on the average shares outstanding methodology. |
| (b) | Reflects income recognized from special dividends which amounted to $0.05 per share and 0.12% of average net assets. |
| (c) | The amount shown for a share outstanding does not correspond with the aggregate net gain on investments during the period due to the timing of sales and redemptions of Fund shares in relation to the fluctuating market values of the investments of the Fund. |
| (d) | Assumes investment at the NAV at the beginning of the year, reinvestment of all dividends and distributions, a complete redemption of the investment at the NAV at the end of the year and no sales or redemption charges (if any). Total returns would be reduced if a sales or redemption charge was taken into account. Returns do not reflect the impact of taxes to shareholders relating to Fund distributions or the redemption of Fund shares. |
| (e) | The Fund’s portfolio turnover rate is calculated in accordance with regulatory requirements, without regard to transactions involving short term investments and certain derivatives. If such transactions were included, the Fund’s portfolio turnover rate may be higher. |
| The accompanying notes are an integral part of these financial statements. | 93 |
GOLDMAN SACHS SMALL CAP GROWTH INSIGHTS FUND
Financial Highlights(continued)
Selected Data for a Share Outstanding Throughout Each Period
| Goldman Sachs Small Cap Growth Insights Fund | ||||||||||||||||||||||
| Class R6 Shares | ||||||||||||||||||||||
| Year Ended October 31, | Period Ended October 31, 2015(a) | |||||||||||||||||||||
| 2019 | 2018 | 2017 | 2016 | |||||||||||||||||||
| Per Share Data |
| |||||||||||||||||||||
Net asset value, beginning of period | $ | 43.58 | $ | 42.54 | $ | 32.78 | $ | 35.46 | $ | 36.95 | ||||||||||||
Net investment income (loss)(b) | — | 0.02 | (c) | 0.04 | 0.13 | (0.01 | ) | |||||||||||||||
Net realized and unrealized gain (loss) | 2.18 | 2.55 | 9.80 | (0.12 | )(d) | (1.48 | ) | |||||||||||||||
Total from investment operations | 2.18 | 2.57 | 9.84 | 0.01 | (1.49 | ) | ||||||||||||||||
Distributions to shareholders from net investment income | — | — | (0.08 | ) | — | — | ||||||||||||||||
Distributions to shareholders from net realized gains | (3.81 | ) | (1.53 | ) | — | (2.69 | ) | — | ||||||||||||||
Total distributions | (3.81 | ) | (1.53 | ) | (0.08 | ) | (2.69 | ) | — | |||||||||||||
Net asset value, end of period | $ | 41.95 | $ | 43.58 | $ | 42.54 | $ | 32.78 | $ | 35.46 | ||||||||||||
| Total Return(e) | 6.08 | % | 6.25 | % | 30.05 | % | 0.07 | % | (4.03 | )% | ||||||||||||
Net assets, end of period (in 000’s) | $ | 307,820 | $ | 118,729 | $ | 42,042 | $ | 6,667 | $ | 10 | ||||||||||||
Ratio of net expenses to average net assets | 0.84 | % | 0.83 | % | 0.83 | % | 0.83 | % | 0.85 | %(f) | ||||||||||||
Ratio of total expenses to average net assets | 0.93 | % | 0.92 | % | 1.00 | % | 1.06 | % | 1.16 | %(f) | ||||||||||||
Ratio of net investment income (loss) to average net assets | (0.01 | )% | 0.04 | %(c) | 0.09 | % | 0.40 | % | (0.07 | )%(f) | ||||||||||||
Portfolio turnover rate(g) | 140 | % | 127 | % | 136 | % | 139 | % | 145 | % | ||||||||||||
| (a) | Commenced operations on July 31, 2015. |
| (b) | Calculated based on the average shares outstanding methodology. |
| (c) | Reflects income recognized from special dividends which amounted to $0.05 per share and 0.12% of average net assets. |
| (d) | The amount shown for a share outstanding does not correspond with the aggregate net gain on investments during the period due to the timing of sales and redemptions of Fund shares in relation to the fluctuating market values of the investments of the Fund. |
| (e) | Assumes investment at the NAV at the beginning of the year, reinvestment of all dividends and distributions, a complete redemption of the investment at the NAV at the end of the year and no sales or redemption charges (if any). Total returns would be reduced if a sales or redemption charge was taken into account. Returns do not reflect the impact of taxes to shareholders relating to Fund distributions or the redemption of Fund shares. Total returns for periods less than one full year are not annualized. |
| (f) | Annualized. |
| (g) | The Fund’s portfolio turnover rate is calculated in accordance with regulatory requirements, without regard to transactions involving short term investments and certain derivatives. If such transactions were included, the Fund’s portfolio turnover rate may be higher. |
| 94 | The accompanying notes are an integral part of these financial statements. |
GOLDMAN SACHS SMALL CAP VALUE INSIGHTS FUND
Financial Highlights(continued)
Selected Data for a Share Outstanding Throughout Each Period
| Goldman Sachs Small Cap Value Insights Fund | ||||||||||||||||||||||
| Class A Shares | ||||||||||||||||||||||
| Year Ended October 31, | ||||||||||||||||||||||
| 2019 | 2018 | 2017 | 2016 | 2015 | ||||||||||||||||||
| Per Share Data |
| |||||||||||||||||||||
Net asset value, beginning of year | $ | 42.30 | $ | 46.29 | $ | 38.86 | $ | 38.37 | $ | 38.89 | ||||||||||||
Net investment income(a) | 0.25 | 0.20 | 0.23 | (b) | 0.28 | 0.30 | ||||||||||||||||
Net realized and unrealized gain (loss) | 1.17 | 0.70 | 9.04 | 2.55 | (0.09 | ) | ||||||||||||||||
Total from investment operations | 1.42 | 0.90 | 9.27 | 2.83 | 0.21 | |||||||||||||||||
Distributions to shareholders from net investment income | (0.19 | ) | (0.17 | ) | (0.25 | ) | (0.29 | ) | (0.14 | ) | ||||||||||||
Distributions to shareholders from net realized gains | (3.84 | ) | (4.72 | ) | (1.59 | ) | (2.05 | ) | (0.59 | ) | ||||||||||||
Total distributions | (4.03 | ) | (4.89 | ) | (1.84 | ) | (2.34 | ) | (0.73 | ) | ||||||||||||
Net asset value, end of year | $ | 39.69 | $ | 42.30 | $ | 46.29 | $ | 38.86 | $ | 38.37 | ||||||||||||
| Total Return(c) | 4.40 | % | 2.08 | % | 23.98 | % | 7.99 | % | 0.53 | % | ||||||||||||
Net assets, end of year (in 000’s) | $ | 132,886 | $ | 112,219 | $ | 102,127 | $ | 91,210 | $ | 93,151 | ||||||||||||
Ratio of net expenses to average net assets | 1.25 | % | 1.23 | % | 1.24 | % | 1.25 | % | 1.25 | % | ||||||||||||
Ratio of total expenses to average net assets | 1.39 | % | 1.40 | % | 1.49 | % | 1.54 | % | 1.52 | % | ||||||||||||
Ratio of net investment income to average net assets | 0.67 | % | 0.44 | % | 0.53 | %(b) | 0.78 | % | 0.76 | % | ||||||||||||
Portfolio turnover rate(d) | 142 | % | 130 | % | 138 | % | 129 | % | 133 | % | ||||||||||||
| (a) | Calculated based on the average shares outstanding methodology. |
| (b) | Reflects income recognized from special dividends which amounted to $0.03 per share and 0.07% of average net assets. |
| (c) | Assumes investment at the NAV at the beginning of the year, reinvestment of all dividends and distributions, a complete redemption of the investment at the NAV at the end of the year and no sales or redemption charges (if any). Total returns would be reduced if a sales or redemption charge was taken into account. Returns do not reflect the impact of taxes to shareholders relating to Fund distributions or the redemption of Fund shares. |
| (d) | The Fund’s portfolio turnover rate is calculated in accordance with regulatory requirements, without regard to transactions involving short term investments and certain derivatives. If such transactions were included, the Fund’s portfolio turnover rate may be higher. |
| The accompanying notes are an integral part of these financial statements. | 95 |
GOLDMAN SACHS SMALL CAP VALUE INSIGHTS FUND
Financial Highlights(continued)
Selected Data for a Share Outstanding Throughout Each Period
| Goldman Sachs Small Cap Value Insights Fund | ||||||||||||||||||||||
| Class C Shares | ||||||||||||||||||||||
| Year Ended October 31, | ||||||||||||||||||||||
| 2019 | 2018 | 2017 | 2016 | 2015 | ||||||||||||||||||
| Per Share Data |
| |||||||||||||||||||||
Net asset value, beginning of year | $ | 30.35 | $ | 34.65 | $ | 29.53 | $ | 29.75 | $ | 30.40 | ||||||||||||
Net investment income (loss)(a) | (0.02 | ) | (0.10 | ) | (0.07 | )(b) | 0.01 | — | ||||||||||||||
Net realized and unrealized gain (loss) | 0.75 | 0.52 | 6.85 | 1.92 | (0.06 | ) | ||||||||||||||||
Total from investment operations | 0.73 | 0.42 | 6.78 | 1.93 | (0.06 | ) | ||||||||||||||||
Distributions to shareholders from net investment income | — | — | (0.07 | ) | (0.10 | ) | — | |||||||||||||||
Distributions to shareholders from net realized gains | (3.84 | ) | (4.72 | ) | (1.59 | ) | (2.05 | ) | (0.59 | ) | ||||||||||||
Total distributions | (3.84 | ) | (4.72 | ) | (1.66 | ) | (2.15 | ) | (0.59 | ) | ||||||||||||
Net asset value, end of year | $ | 27.24 | $ | 30.35 | $ | 34.65 | $ | 29.53 | $ | 29.75 | ||||||||||||
| Total Return(c) | 3.67 | % | 1.31 | % | 23.09 | % | 7.15 | % | (0.21 | )% | ||||||||||||
Net assets, end of year (in 000’s) | $ | 7,961 | $ | 6,903 | $ | 17,037 | $ | 15,224 | $ | 16,416 | ||||||||||||
Ratio of net expenses to average net assets | 2.00 | % | 1.98 | % | 1.99 | % | 2.00 | % | 2.00 | % | ||||||||||||
Ratio of total expenses to average net assets | 2.14 | % | 2.14 | % | 2.24 | % | 2.29 | % | 2.27 | % | ||||||||||||
Ratio of net investment income (loss) to average net assets | (0.07 | )% | (0.31 | )% | (0.22 | )%(b) | 0.03 | % | 0.01 | % | ||||||||||||
Portfolio turnover rate(d) | 142 | % | 130 | % | 138 | % | 129 | % | 133 | % | ||||||||||||
| (a) | Calculated based on the average shares outstanding methodology. |
| (b) | Reflects income recognized from special dividends which amounted to $0.03 per share and 0.07% of average net assets. |
| (c) | Assumes investment at the NAV at the beginning of the year, reinvestment of all dividends and distributions, a complete redemption of the investment at the NAV at the end of the year and no sales or redemption charges (if any). Total returns would be reduced if a sales or redemption charge was taken into account. Returns do not reflect the impact of taxes to shareholders relating to Fund distributions or the redemption of Fund shares. |
| (d) | The Fund’s portfolio turnover rate is calculated in accordance with regulatory requirements, without regard to transactions involving short term investments and certain derivatives. If such transactions were included, the Fund’s portfolio turnover rate may be higher. |
| 96 | The accompanying notes are an integral part of these financial statements. |
GOLDMAN SACHS SMALL CAP VALUE INSIGHTS FUND
Financial Highlights(continued)
Selected Data for a Share Outstanding Throughout Each Period
| Goldman Sachs Small Cap Value Insights Fund | ||||||||||||||||||||||
| Institutional Shares | ||||||||||||||||||||||
| Year Ended October 31, | ||||||||||||||||||||||
| 2019 | 2018 | 2017 | 2016 | 2015 | ||||||||||||||||||
| Per Share Data |
| |||||||||||||||||||||
Net asset value, beginning of year | $ | 55.71 | $ | 59.38 | $ | 49.35 | $ | 48.06 | $ | 48.49 | ||||||||||||
Net investment income(a) | 0.47 | 0.48 | 0.50 | (b) | 0.55 | 0.55 | ||||||||||||||||
Net realized and unrealized gain (loss) | 1.73 | 0.90 | 11.53 | 3.23 | (0.10 | ) | ||||||||||||||||
Total from investment operations | 2.20 | 1.38 | 12.03 | 3.78 | 0.45 | |||||||||||||||||
Distributions to shareholders from net investment income | (0.33 | ) | (0.33 | ) | (0.41 | ) | (0.44 | ) | (0.29 | ) | ||||||||||||
Distributions to shareholders from net realized gains | (3.84 | ) | (4.72 | ) | (1.59 | ) | (2.05 | ) | (0.59 | ) | ||||||||||||
Total distributions | (4.17 | ) | (5.05 | ) | (2.00 | ) | (2.49 | ) | (0.88 | ) | ||||||||||||
Net asset value, end of year | $ | 53.74 | $ | 55.71 | $ | 59.38 | $ | 49.35 | $ | 48.06 | ||||||||||||
| Total Return(c) | 4.81 | % | 2.47 | % | 24.49 | % | 8.41 | % | 0.93 | % | ||||||||||||
Net assets, end of year (in 000’s) | $ | 192,820 | $ | 60,516 | $ | 56,191 | $ | 21,717 | $ | 21,036 | ||||||||||||
Ratio of net expenses to average net assets | 0.87 | % | 0.84 | % | 0.84 | % | 0.85 | % | 0.85 | % | ||||||||||||
Ratio of total expenses to average net assets | 1.02 | % | 1.00 | % | 1.09 | % | 1.14 | % | 1.12 | % | ||||||||||||
Ratio of net investment income to average net assets | 0.96 | % | 0.82 | % | 0.90 | %(b) | 1.19 | % | 1.13 | % | ||||||||||||
Portfolio turnover rate(d) | 142 | % | 130 | % | 138 | % | 129 | % | 133 | % | ||||||||||||
| (a) | Calculated based on the average shares outstanding methodology. |
| (b) | Reflects income recognized from special dividends which amounted to $0.03 per share and 0.07% of average net assets. |
| (c) | Assumes investment at the NAV at the beginning of the year, reinvestment of all dividends and distributions, a complete redemption of the investment at the NAV at the end of the year and no sales or redemption charges (if any). Total returns would be reduced if a sales or redemption charge was taken into account. Returns do not reflect the impact of taxes to shareholders relating to Fund distributions or the redemption of Fund shares. |
| (d) | The Fund’s portfolio turnover rate is calculated in accordance with regulatory requirements, without regard to transactions involving short term investments and certain derivatives. If such transactions were included, the Fund’s portfolio turnover rate may be higher. |
| The accompanying notes are an integral part of these financial statements. | 97 |
GOLDMAN SACHS SMALL CAP VALUE INSIGHTS FUND
Financial Highlights(continued)
Selected Data for a Share Outstanding Throughout Each Period
| Goldman Sachs Small Cap Value Insights Fund | ||||||||||||||||||||||
| Investor Shares | ||||||||||||||||||||||
| Year Ended October 31, | ||||||||||||||||||||||
| 2019 | 2018 | 2017 | 2016 | 2015 | ||||||||||||||||||
| Per Share Data |
| |||||||||||||||||||||
Net asset value, beginning of year | $ | 42.18 | $ | 46.17 | $ | 38.78 | $ | 38.31 | $ | 38.84 | ||||||||||||
Net investment income(a) | 0.30 | 0.31 | 0.31 | (b) | 0.37 | 0.39 | ||||||||||||||||
Net realized and unrealized gain (loss) | 1.20 | 0.69 | 9.05 | 2.54 | (0.10 | ) | ||||||||||||||||
Total from investment operations | 1.50 | 1.00 | 9.36 | 2.91 | 0.29 | |||||||||||||||||
Distributions to shareholders from net investment income | (0.31 | ) | (0.27 | ) | (0.38 | ) | (0.39 | ) | (0.23 | ) | ||||||||||||
Distributions to shareholders from net realized gains | (3.84 | ) | (4.72 | ) | (1.59 | ) | (2.05 | ) | (0.59 | ) | ||||||||||||
Total distributions | (4.15 | ) | (4.99 | ) | (1.97 | ) | (2.44 | ) | (0.82 | ) | ||||||||||||
Net asset value, end of year | $ | 39.53 | $ | 42.18 | $ | 46.17 | $ | 38.78 | $ | 38.31 | ||||||||||||
| Total Return(c) | 4.69 | % | 2.33 | % | 24.30 | % | 8.26 | % | 0.76 | % | ||||||||||||
Net assets, end of year (in 000’s) | $ | 59,800 | $ | 18,257 | $ | 5,695 | $ | 1,925 | $ | 1,774 | ||||||||||||
Ratio of net expenses to average net assets | 1.01 | % | 0.98 | % | 0.99 | % | 1.00 | % | 1.00 | % | ||||||||||||
Ratio of total expenses to average net assets | 1.15 | % | 1.17 | % | 1.24 | % | 1.29 | % | 1.27 | % | ||||||||||||
Ratio of net investment income to average net assets | 0.83 | % | 0.70 | % | 0.72 | %(b) | 1.02 | % | 1.00 | % | ||||||||||||
Portfolio turnover rate(d) | 142 | % | 130 | % | 138 | % | 129 | % | 133 | % | ||||||||||||
| (a) | Calculated based on the average shares outstanding methodology. |
| (b) | Reflects income recognized from special dividends which amounted to $0.03 per share and 0.07% of average net assets. |
| (c) | Assumes investment at the NAV at the beginning of the year, reinvestment of all dividends and distributions, a complete redemption of the investment at the NAV at the end of the year and no sales or redemption charges (if any). Total returns would be reduced if a sales or redemption charge was taken into account. Returns do not reflect the impact of taxes to shareholders relating to Fund distributions or the redemption of Fund shares. |
| (d) | The Fund’s portfolio turnover rate is calculated in accordance with regulatory requirements, without regard to transactions involving short term investments and certain derivatives. If such transactions were included, the Fund’s portfolio turnover rate may be higher. |
| 98 | The accompanying notes are an integral part of these financial statements. |
GOLDMAN SACHS SMALL CAP VALUE INSIGHTS FUND
Financial Highlights(continued)
Selected Data for a Share Outstanding Throughout Each Period
| Goldman Sachs Small Cap Value Insights Fund | ||||||||||
| Class P Shares | ||||||||||
| For the Year Ended October 31, 2019 | Period Ended October 31, 2018(a) | |||||||||
| Per Share Data |
| |||||||||
Net asset value, beginning of period | $ | 55.70 | $ | 57.05 | ||||||
Net investment income(b) | 0.54 | 0.30 | ||||||||
Net realized and unrealized gain (loss) | 1.66 | (1.65 | ) | |||||||
Total from investment operations | 2.20 | (1.35 | ) | |||||||
Distributions to shareholders from net investment income | (0.34 | ) | — | |||||||
Distributions to shareholders from net realized gains | (3.84 | ) | — | |||||||
Total distributions | (4.18 | ) | — | |||||||
Net asset value, end of period | $ | 53.72 | $ | 55.70 | ||||||
| Total Return(c) | 4.82 | % | (2.37 | )% | ||||||
Net assets, end of period (in 000’s) | $ | 47,977 | $ | 42,165 | ||||||
Ratio of net expenses to average net assets | 0.85 | % | 0.83 | %(d) | ||||||
Ratio of total expenses to average net assets | 0.99 | % | 1.06 | %(d) | ||||||
Ratio of net investment income to average net assets | 1.07 | % | 0.93 | %(d) | ||||||
Portfolio turnover rate(e) | 142 | % | 130 | % | ||||||
| (a) | Commenced operations on April 16, 2018. |
| (b) | Calculated based on the average shares outstanding methodology. |
| (c) | Assumes investment at the NAV at the beginning of the period, reinvestment of all dividends and distributions, a complete redemption of the investment at the NAV at the end of the period and no sales or redemption charges (if any). Total returns would be reduced if a sales or redemption charge was taken into account. Returns do not reflect the impact of taxes to shareholders relating to Fund distributions or the redemption of Fund shares. Total returns for periods less than one full year are not annualized. |
| (d) | Annualized. |
| (e) | The Fund’s portfolio turnover rate is calculated in accordance with regulatory requirements, without regard to transactions involving short term investments and certain derivatives. If such transactions were included, the Fund’s portfolio turnover rate may be higher. |
| The accompanying notes are an integral part of these financial statements. | 99 |
GOLDMAN SACHS SMALL CAP VALUE INSIGHTS FUND
Financial Highlights(continued)
Selected Data for a Share Outstanding Throughout Each Period
| Goldman Sachs Small Cap Value Insights Fund | ||||||||||||||||||||||
| Class R Shares | ||||||||||||||||||||||
| Year Ended October 31, | ||||||||||||||||||||||
| 2019 | 2018 | 2017 | 2016 | 2015 | ||||||||||||||||||
| Per Share Data |
| |||||||||||||||||||||
Net asset value, beginning of year | $ | 41.63 | $ | 45.57 | $ | 38.32 | $ | 37.99 | $ | 38.50 | ||||||||||||
Net investment income(a) | 0.08 | 0.09 | 0.14 | (b) | 0.20 | 0.14 | ||||||||||||||||
Net realized and unrealized gain (loss) | 1.22 | 0.69 | 8.89 | 2.50 | (0.04 | ) | ||||||||||||||||
Total from investment operations | 1.30 | 0.78 | 9.03 | 2.70 | 0.10 | |||||||||||||||||
Distributions to shareholders from net investment income | (0.13 | ) | — | (0.19 | ) | (0.32 | ) | (0.02 | ) | |||||||||||||
Distributions to shareholders from net realized gains | (3.84 | ) | (4.72 | ) | (1.59 | ) | (2.05 | ) | (0.59 | ) | ||||||||||||
Total distributions | (3.97 | ) | (4.72 | ) | (1.78 | ) | (2.37 | ) | (0.61 | ) | ||||||||||||
Net asset value, end of year | $ | 38.96 | $ | 41.63 | $ | 45.57 | $ | 38.32 | $ | 37.99 | ||||||||||||
| Total Return(c) | 4.14 | % | 1.83 | % | 23.67 | % | 7.72 | % | 0.27 | % | ||||||||||||
Net assets, end of year (in 000’s) | $ | 8,514 | $ | 2,320 | $ | 1,621 | $ | 5,762 | $ | 4,992 | ||||||||||||
Ratio of net expenses to average net assets | 1.53 | % | 1.48 | % | 1.49 | % | 1.50 | % | 1.51 | % | ||||||||||||
Ratio of total expenses to average net assets | 1.69 | % | 1.66 | % | 1.73 | % | 1.79 | % | 1.77 | % | ||||||||||||
Ratio of net investment income to average net assets | 0.23 | % | 0.20 | % | 0.33 | %(b) | 0.55 | % | 0.36 | % | ||||||||||||
Portfolio turnover rate(d) | 142 | % | 130 | % | 138 | % | 129 | % | 133 | % | ||||||||||||
| (a) | Calculated based on the average shares outstanding methodology. |
| (b) | Reflects income recognized from special dividends which amounted to $0.03 per share and 0.07% of average net assets. |
| (c) | Assumes investment at the NAV at the beginning of the year, reinvestment of all dividends and distributions, a complete redemption of the investment at the NAV at the end of the year and no sales or redemption charges (if any). Total returns would be reduced if a sales or redemption charge was taken into account. Returns do not reflect the impact of taxes to shareholders relating to Fund distributions or the redemption of Fund shares. |
| (d) | The Fund’s portfolio turnover rate is calculated in accordance with regulatory requirements, without regard to transactions involving short term investments and certain derivatives. If such transactions were included, the Fund’s portfolio turnover rate may be higher. |
| 100 | The accompanying notes are an integral part of these financial statements. |
GOLDMAN SACHS SMALL CAP VALUE INSIGHTS FUND
Financial Highlights(continued)
Selected Data for a Share Outstanding Throughout Each Period
| Goldman Sachs Small Cap Value Insights Fund | ||||||||||||||||||||||
| Class R6 Shares | ||||||||||||||||||||||
| Year Ended October 31, | Period Ended October 31, 2015(a) | |||||||||||||||||||||
| 2019 | 2018 | 2017 | 2016 | |||||||||||||||||||
| Per Share Data |
| |||||||||||||||||||||
Net asset value, beginning of period | $ | 55.71 | $ | 59.38 | $ | 49.35 | $ | 48.07 | $ | 48.87 | ||||||||||||
Net investment income(b) | 0.45 | 0.50 | 0.46 | (c) | 0.55 | 0.10 | ||||||||||||||||
Net realized and unrealized gain (loss) | 1.75 | 0.90 | 11.56 | 3.23 | (0.90 | ) | ||||||||||||||||
Total from investment operations | 2.20 | 1.40 | 12.02 | 3.78 | (0.80 | ) | ||||||||||||||||
Distributions to shareholders from net investment income | (0.34 | ) | (0.35 | ) | (0.40 | ) | (0.45 | ) | — | |||||||||||||
Distributions to shareholders from net realized gains | (3.84 | ) | (4.72 | ) | (1.59 | ) | (2.05 | ) | — | |||||||||||||
Total distributions | (4.18 | ) | (5.07 | ) | (1.99 | ) | (2.50 | ) | — | |||||||||||||
Net asset value, end of period | $ | 53.73 | $ | 55.71 | $ | 59.38 | $ | 49.35 | $ | 48.07 | ||||||||||||
| Total Return(d) | 4.83 | % | 2.49 | % | 24.49 | % | 8.41 | % | (1.64 | )% | ||||||||||||
Net assets, end of period (in 000’s) | $ | 118,331 | $ | 22,460 | $ | 4,542 | $ | 11 | $ | 10 | ||||||||||||
Ratio of net expenses to average net assets | 0.86 | % | 0.83 | % | 0.83 | % | 0.84 | % | 0.83 | %(e) | ||||||||||||
Ratio of total expenses to average net assets | 1.00 | % | 1.02 | % | 1.11 | % | 1.14 | % | 1.09 | %(e) | ||||||||||||
Ratio of net investment income to average net assets | 0.91 | % | 0.85 | % | 0.83 | %(c) | 1.18 | % | 0.83 | %(e) | ||||||||||||
Portfolio turnover rate(f) | 142 | % | 130 | % | 138 | % | 129 | % | 133 | % | ||||||||||||
| (a) | Commenced operations on July 31, 2015. |
| (b) | Calculated based on the average shares outstanding methodology. |
| (c) | Reflects income recognized from special dividends which amounted to $0.03 per share and 0.07% of average net assets. |
| (d) | Assumes investment at the NAV at the beginning of the year, reinvestment of all dividends and distributions, a complete redemption of the investment at the NAV at the end of the year and no sales or redemption charges (if any). Total returns would be reduced if a sales or redemption charge was taken into account. Returns do not reflect the impact of taxes to shareholders relating to Fund distributions or the redemption of Fund shares. Total returns for periods less than one full year are not annualized. |
| (e) | Annualized. |
| (f) | The Fund’s portfolio turnover rate is calculated in accordance with regulatory requirements, without regard to transactions involving short term investments and certain derivatives. If such transactions were included, the Fund’s portfolio turnover rate may be higher. |
| The accompanying notes are an integral part of these financial statements. | 101 |
GOLDMAN SACHS U.S. EQUITY INSIGHTS FUND
Financial Highlights(continued)
Selected Data for a Share Outstanding Throughout Each Period
| Goldman Sachs U.S. Equity Insights Fund | ||||||||||||||||||||||
| Class A Shares | ||||||||||||||||||||||
| Year Ended October 31, | ||||||||||||||||||||||
| 2019 | 2018 | 2017 | 2016 | 2015 | ||||||||||||||||||
| Per Share Data |
| |||||||||||||||||||||
Net asset value, beginning of year | $ | 47.72 | $ | 49.73 | $ | 40.76 | $ | 41.46 | $ | 40.20 | ||||||||||||
Net investment income(a) | 0.44 | 0.36 | 0.49 | 0.38 | 0.43 | |||||||||||||||||
Net realized and unrealized gain | 3.14 | 2.46 | 10.17 | 0.49 | 1.12 | |||||||||||||||||
Total from investment operations | 3.58 | 2.82 | 10.66 | 0.87 | 1.55 | |||||||||||||||||
Distributions to shareholders from net investment income | (0.17 | ) | (0.45 | ) | (0.31 | ) | (0.38 | ) | (0.29 | ) | ||||||||||||
Distributions to shareholders from net realized gains | (1.65 | ) | (4.38 | ) | (1.38 | ) | (1.19 | ) | — | |||||||||||||
Total distributions | (1.82 | ) | (4.83 | ) | (1.69 | ) | (1.57 | ) | (0.29 | ) | ||||||||||||
Net asset value, end of year | $ | 49.48 | $ | 47.72 | $ | 49.73 | $ | 40.76 | $ | 41.46 | ||||||||||||
| Total Return(b) | 7.98 | % | 5.93 | % | 26.89 | % | 2.25 | % | 3.86 | % | ||||||||||||
Net assets, end of year (in 000’s) | $ | 299,440 | $ | 301,934 | $ | 278,516 | $ | 251,466 | $ | 272,738 | ||||||||||||
Ratio of net expenses to average net assets | 0.94 | % | 0.95 | % | 0.96 | % | 0.96 | % | 0.96 | % | ||||||||||||
Ratio of total expenses to average net assets | 1.01 | % | 1.00 | % | 1.14 | % | 1.18 | % | 1.17 | % | ||||||||||||
Ratio of net investment income to average net assets | 0.93 | % | 0.73 | % | 1.08 | % | 0.96 | % | 1.04 | % | ||||||||||||
Portfolio turnover rate(c) | 199 | % | 168 | % | 193 | % | 213 | % | 224 | % | ||||||||||||
| (a) | Calculated based on the average shares outstanding methodology. |
| (b) | Assumes investment at the NAV at the beginning of the year, reinvestment of all dividends and distributions, a complete redemption of the investment at the NAV at the end of the year and no sales or redemption charges (if any). Total returns would be reduced if a sales or redemption charge was taken into account. Returns do not reflect the impact of taxes to shareholders relating to Fund distributions or the redemption of Fund shares. |
| (c) | The Fund’s portfolio turnover rate is calculated in accordance with regulatory requirements, without regard to transactions involving short term investments and certain derivatives. If such transactions were included, the Fund’s portfolio turnover rate may be higher. |
| 102 | The accompanying notes are an integral part of these financial statements. |
GOLDMAN SACHS U.S. EQUITY INSIGHTS FUND
Financial Highlights(continued)
Selected Data for a Share Outstanding Throughout Each Period
| Goldman Sachs U.S. Equity Insights Fund | ||||||||||||||||||||||
| Class C Shares | ||||||||||||||||||||||
| Year Ended October 31, | ||||||||||||||||||||||
| 2019 | 2018 | 2017 | 2016 | 2015 | ||||||||||||||||||
| Per Share Data |
| |||||||||||||||||||||
Net asset value, beginning of year | $ | 42.80 | $ | 45.08 | $ | 37.10 | $ | 37.88 | $ | 36.78 | ||||||||||||
Net investment income(a) | 0.08 | 0.01 | 0.13 | 0.08 | 0.11 | |||||||||||||||||
Net realized and unrealized gain | 2.81 | 2.22 | 9.25 | 0.44 | 1.03 | |||||||||||||||||
Total from investment operations | 2.89 | 2.23 | 9.38 | 0.52 | 1.14 | |||||||||||||||||
Distributions to shareholders from net investment income | — | (0.13 | ) | (0.02 | ) | (0.11 | ) | (0.04 | ) | |||||||||||||
Distributions to shareholders from net realized gains | (1.65 | ) | (4.38 | ) | (1.38 | ) | (1.19 | ) | — | |||||||||||||
Total distributions | (1.65 | ) | (4.51 | ) | (1.40 | ) | (1.30 | ) | (0.04 | ) | ||||||||||||
Net asset value, end of year | $ | 44.04 | $ | 42.80 | $ | 45.08 | $ | 37.10 | $ | 37.88 | ||||||||||||
| Total Return(b) | 7.20 | % | 5.15 | % | 25.93 | % | 1.48 | % | 3.09 | % | ||||||||||||
Net assets, end of year (in 000’s) | $ | 15,854 | $ | 14,277 | $ | 28,756 | $ | 31,377 | $ | 37,811 | ||||||||||||
Ratio of net expenses to average net assets | 1.69 | % | 1.70 | % | 1.71 | % | 1.71 | % | 1.71 | % | ||||||||||||
Ratio of total expenses to average net assets | 1.76 | % | 1.75 | % | 1.89 | % | 1.93 | % | 1.92 | % | ||||||||||||
Ratio of net investment income to average net assets | 0.18 | % | 0.01 | % | 0.31 | % | 0.21 | % | 0.28 | % | ||||||||||||
Portfolio turnover rate(c) | 199 | % | 168 | % | 193 | % | 213 | % | 224 | % | ||||||||||||
| (a) | Calculated based on the average shares outstanding methodology. |
| (b) | Assumes investment at the NAV at the beginning of the year, reinvestment of all dividends and distributions, a complete redemption of the investment at the NAV at the end of the year and no sales or redemption charges (if any). Total returns would be reduced if a sales or redemption charge was taken into account. Returns do not reflect the impact of taxes to shareholders relating to Fund distributions or the redemption of Fund shares. |
| (c) | The Fund’s portfolio turnover rate is calculated in accordance with regulatory requirements, without regard to transactions involving short term investments and certain derivatives. If such transactions were included, the Fund’s portfolio turnover rate may be higher. |
| The accompanying notes are an integral part of these financial statements. | 103 |
GOLDMAN SACHS U.S. EQUITY INSIGHTS FUND
Financial Highlights(continued)
Selected Data for a Share Outstanding Throughout Each Period
| Goldman Sachs U.S. Equity Insights Fund | ||||||||||||||||||||||
| Institutional Shares | ||||||||||||||||||||||
| Year Ended October 31, | ||||||||||||||||||||||
| 2019 | 2018 | 2017 | 2016 | 2015 | ||||||||||||||||||
| Per Share Data |
| |||||||||||||||||||||
Net asset value, beginning of year | $ | 49.30 | $ | 51.21 | $ | 41.92 | $ | 42.60 | $ | 41.29 | ||||||||||||
Net investment income(a) | 0.72 | 0.54 | 0.70 | 0.54 | 0.60 | |||||||||||||||||
Net realized and unrealized gain | 3.14 | 2.56 | 10.45 | 0.52 | 1.16 | |||||||||||||||||
Total from investment operations | 3.86 | 3.10 | 11.15 | 1.06 | 1.76 | |||||||||||||||||
Distributions to shareholders from net investment income | (0.35 | ) | (0.63 | ) | (0.48 | ) | (0.55 | ) | (0.45 | ) | ||||||||||||
Distributions to shareholders from net realized gains | (1.65 | ) | (4.38 | ) | (1.38 | ) | (1.19 | ) | — | |||||||||||||
Total distributions | (2.00 | ) | (5.01 | ) | (1.86 | ) | (1.74 | ) | (0.45 | ) | ||||||||||||
Net asset value, end of year | $ | 51.16 | $ | 49.30 | $ | 51.21 | $ | 41.92 | $ | 42.60 | ||||||||||||
| Total Return(b) | 8.39 | % | 6.34 | % | 27.40 | % | 2.66 | % | 4.27 | % | ||||||||||||
Net assets, end of year (in 000’s) | $ | 295,408 | $ | 842,673 | $ | 249,034 | $ | 177,412 | $ | 121,863 | ||||||||||||
Ratio of net expenses to average net assets | 0.55 | % | 0.55 | % | 0.56 | % | 0.56 | % | 0.56 | % | ||||||||||||
Ratio of total expenses to average net assets | 0.60 | % | 0.62 | % | 0.74 | % | 0.78 | % | 0.77 | % | ||||||||||||
Ratio of net investment income to average net assets | 1.40 | % | 1.07 | % | 1.50 | % | 1.33 | % | 1.42 | % | ||||||||||||
Portfolio turnover rate(c) | 199 | % | 168 | % | 193 | % | 213 | % | 224 | % | ||||||||||||
| (a) | Calculated based on the average shares outstanding methodology. |
| (b) | Assumes investment at the NAV at the beginning of the year, reinvestment of all dividends and distributions, a complete redemption of the investment at the NAV at the end of the year and no sales or redemption charges (if any). Total returns would be reduced if a sales or redemption charge was taken into account. Returns do not reflect the impact of taxes to shareholders relating to Fund distributions or the redemption of Fund shares. |
| (c) | The Fund’s portfolio turnover rate is calculated in accordance with regulatory requirements, without regard to transactions involving short term investments and certain derivatives. If such transactions were included, the Fund’s portfolio turnover rate may be higher. |
| 104 | The accompanying notes are an integral part of these financial statements. |
GOLDMAN SACHS U.S. EQUITY INSIGHTS FUND
Financial Highlights(continued)
Selected Data for a Share Outstanding Throughout Each Period
| Goldman Sachs U.S. Equity Insights Fund | ||||||||||||||||||||||
| Service Shares | ||||||||||||||||||||||
| Year Ended October 31, | ||||||||||||||||||||||
| 2019 | 2018 | 2017 | 2016 | 2015 | ||||||||||||||||||
| Per Share Data |
| |||||||||||||||||||||
Net asset value, beginning of year | $ | 47.41 | $ | 49.47 | $ | 40.60 | $ | 41.37 | $ | 40.12 | ||||||||||||
Net investment income(a) | 0.38 | 0.30 | 0.43 | 0.33 | 0.36 | |||||||||||||||||
Net realized and unrealized gain | 3.13 | 2.45 | 10.14 | 0.50 | 1.15 | |||||||||||||||||
Total from investment operations | 3.51 | 2.75 | 10.57 | 0.83 | 1.51 | |||||||||||||||||
Distributions to shareholders from net investment income | (0.08 | ) | (0.43 | ) | (0.32 | ) | (0.41 | ) | (0.26 | ) | ||||||||||||
Distributions to shareholders from net realized gains | (1.65 | ) | (4.38 | ) | (1.38 | ) | (1.19 | ) | — | |||||||||||||
Total distributions | (1.73 | ) | (4.81 | ) | (1.70 | ) | (1.60 | ) | (0.26 | ) | ||||||||||||
Net asset value, end of year | $ | 49.19 | $ | 47.41 | $ | 49.47 | $ | 40.60 | $ | 41.37 | ||||||||||||
| Total Return(b) | 7.86 | % | 5.81 | % | 26.76 | % | 2.15 | % | 3.75 | % | ||||||||||||
Net assets, end of year (in 000’s) | $ | 6,700 | $ | 5,925 | $ | 6,739 | $ | 5,473 | $ | 3,344 | ||||||||||||
Ratio of net expenses to average net assets | 1.05 | % | 1.06 | % | 1.06 | % | 1.06 | % | 1.06 | % | ||||||||||||
Ratio of total expenses to average net assets | 1.13 | % | 1.11 | % | 1.24 | % | 1.28 | % | 1.27 | % | ||||||||||||
Ratio of net investment income to average net assets | 0.81 | % | 0.61 | % | 0.96 | % | 0.83 | % | 0.86 | % | ||||||||||||
Portfolio turnover rate(c) | 199 | % | 168 | % | 193 | % | 213 | % | 224 | % | ||||||||||||
| (a) | Calculated based on the average shares outstanding methodology. |
| (b) | Assumes investment at the NAV at the beginning of the year, reinvestment of all dividends and distributions, a complete redemption of the investment at the NAV at the end of the year and no sales or redemption charges (if any). Total returns would be reduced if a sales or redemption charge was taken into account. Returns do not reflect the impact of taxes to shareholders relating to Fund distributions or the redemption of Fund shares. |
| (c) | The Fund’s portfolio turnover rate is calculated in accordance with regulatory requirements, without regard to transactions involving short term investments and certain derivatives. If such transactions were included, the Fund’s portfolio turnover rate may be higher. |
| The accompanying notes are an integral part of these financial statements. | 105 |
GOLDMAN SACHS U.S. EQUITY INSIGHTS FUND
Financial Highlights(continued)
Selected Data for a Share Outstanding Throughout Each Period
| Goldman Sachs U.S. Equity Insights Fund | ||||||||||||||||||||||
| Investor Shares | ||||||||||||||||||||||
| Year Ended October 31, | ||||||||||||||||||||||
| 2019 | 2018 | 2017 | 2016 | 2015 | ||||||||||||||||||
| Per Share Data |
| |||||||||||||||||||||
Net asset value, beginning of year | $ | 47.17 | $ | 49.22 | $ | 40.39 | $ | 41.13 | $ | 39.89 | ||||||||||||
Net investment income(a) | 0.54 | 0.46 | 0.61 | 0.45 | 0.51 | |||||||||||||||||
Net realized and unrealized gain | 3.09 | 2.45 | 10.05 | 0.50 | 1.13 | |||||||||||||||||
Total from investment operations | 3.63 | 2.91 | 10.66 | 0.95 | 1.64 | |||||||||||||||||
Distributions to shareholders from net investment income | (0.31 | ) | (0.58 | ) | (0.45 | ) | (0.50 | ) | (0.40 | ) | ||||||||||||
Distributions to shareholders from net realized gains | (1.65 | ) | (4.38 | ) | (1.38 | ) | (1.19 | ) | — | |||||||||||||
Total distributions | (1.96 | ) | (4.96 | ) | (1.83 | ) | (1.69 | ) | (0.40 | ) | ||||||||||||
Net asset value, end of year | $ | 48.84 | $ | 47.17 | $ | 49.22 | $ | 40.39 | $ | 41.13 | ||||||||||||
| Total Return(b) | 8.25 | % | 6.20 | % | 27.21 | % | 2.48 | % | 4.12 | % | ||||||||||||
Net assets, end of year (in 000’s) | $ | 116,633 | $ | 103,230 | $ | 43,290 | $ | 18,322 | $ | 4,615 | ||||||||||||
Ratio of net expenses to average net assets | 0.69 | % | 0.70 | % | 0.71 | % | 0.71 | % | 0.71 | % | ||||||||||||
Ratio of total expenses to average net assets | 0.76 | % | 0.76 | % | 0.89 | % | 0.93 | % | 0.92 | % | ||||||||||||
Ratio of net investment income to average net assets | 1.17 | % | 0.95 | % | 1.36 | % | 1.13 | % | 1.24 | % | ||||||||||||
Portfolio turnover rate(c) | 199 | % | 168 | % | 193 | % | 213 | % | 224 | % | ||||||||||||
| (a) | Calculated based on the average shares outstanding methodology. |
| (b) | Assumes investment at the NAV at the beginning of the year, reinvestment of all dividends and distributions, a complete redemption of the investment at the NAV at the end of the year and no sales or redemption charges (if any). Total returns would be reduced if a sales or redemption charge was taken into account. Returns do not reflect the impact of taxes to shareholders relating to Fund distributions or the redemption of Fund shares. |
| (c) | The Fund’s portfolio turnover rate is calculated in accordance with regulatory requirements, without regard to transactions involving short term investments and certain derivatives. If such transactions were included, the Fund’s portfolio turnover rate may be higher. |
| 106 | The accompanying notes are an integral part of these financial statements. |
GOLDMAN SACHS U.S. EQUITY INSIGHTS FUND
Financial Highlights(continued)
Selected Data for a Share Outstanding Throughout Each Period
| Goldman Sachs U.S. Equity Insights Fund | ||||||||||
| Class P Shares | ||||||||||
| For the Year Ended October 31, 2019 | Period Ended October 31, 2018(a) | |||||||||
| Per Share Data |
| |||||||||
Net asset value, beginning of period | $ | 49.28 | $ | 49.09 | ||||||
Net investment income(b) | 0.65 | 0.26 | ||||||||
Net realized and unrealized gain (loss) | 3.21 | (0.07 | ) | |||||||
Total from investment operations | 3.86 | 0.19 | ||||||||
Distributions to shareholders from net investment income | (0.35 | ) | — | |||||||
Distributions to shareholders from net realized gains | (1.65 | ) | — | |||||||
Total distributions | (2.00 | ) | — | |||||||
Net asset value, end of period | $ | 51.14 | $ | 49.28 | ||||||
| Total Return(c) | 8.40 | % | 0.39 | % | ||||||
Net assets, end of period (in 000’s) | $ | 225,899 | $ | 203,525 | ||||||
Ratio of net expenses to average net assets | 0.54 | % | 0.54 | %(d) | ||||||
Ratio of total expenses to average net assets | 0.62 | % | 0.62 | %(d) | ||||||
Ratio of net investment income to average net assets | 1.33 | % | 0.93 | %(d) | ||||||
Portfolio turnover rate(e) | 199 | % | 168 | % | ||||||
| (a) | Commenced operations on April 16, 2018. |
| (b) | Calculated based on the average shares outstanding methodology. |
| (c) | Assumes investment at the NAV at the beginning of the period, reinvestment of all dividends and distributions, a complete redemption of the investment at the NAV at the end of the period and no sales or redemption charges (if any). Total returns would be reduced if a sales or redemption charge was taken into account. Returns do not reflect the impact of taxes to shareholders relating to Fund distributions or the redemption of Fund shares. Total returns for periods less than one full year are not annualized. |
| (d) | Annualized. |
| (e) | The Fund’s portfolio turnover rate is calculated in accordance with regulatory requirements, without regard to transactions involving short term investments and certain derivatives. If such transactions were included, the Fund’s portfolio turnover rate may be higher. |
| The accompanying notes are an integral part of these financial statements. | 107 |
GOLDMAN SACHS U.S. EQUITY INSIGHTS FUND
Financial Highlights(continued)
Selected Data for a Share Outstanding Throughout Each Period
| Goldman Sachs U.S. Equity Insights Fund | ||||||||||||||||||||||
| Class R Shares | ||||||||||||||||||||||
| Year Ended October 31, | ||||||||||||||||||||||
| 2019 | 2018 | 2017 | 2016 | 2015 | ||||||||||||||||||
| Per Share Data |
| |||||||||||||||||||||
Net asset value, beginning of year | $ | 46.74 | $ | 48.89 | $ | 40.12 | $ | 40.91 | $ | 39.80 | ||||||||||||
Net investment income(a) | 0.32 | 0.23 | 0.37 | 0.27 | 0.26 | |||||||||||||||||
Net realized and unrealized gain | 3.08 | 2.42 | 10.01 | 0.49 | 1.18 | |||||||||||||||||
Total from investment operations | 3.40 | 2.65 | 10.38 | 0.76 | 1.44 | |||||||||||||||||
Distributions to shareholders from net investment income | (0.02 | ) | (0.42 | ) | (0.23 | ) | (0.36 | ) | (0.33 | ) | ||||||||||||
Distributions to shareholders from net realized gains | (1.65 | ) | (4.38 | ) | (1.38 | ) | (1.19 | ) | — | |||||||||||||
Total distributions | (1.67 | ) | (4.80 | ) | (1.61 | ) | (1.55 | ) | (0.33 | ) | ||||||||||||
Net asset value, end of year | $ | 48.47 | $ | 46.74 | $ | 48.89 | $ | 40.12 | $ | 40.91 | ||||||||||||
| Total Return(b) | 7.72 | % | 5.65 | % | 26.58 | % | 1.99 | % | 3.58 | % | ||||||||||||
Net assets, end of year (in 000’s) | $ | 44,555 | $ | 49,993 | $ | 51,263 | $ | 30,341 | $ | 27,685 | ||||||||||||
Ratio of net expenses to average net assets | 1.19 | % | 1.20 | % | 1.21 | % | 1.21 | % | 1.21 | % | ||||||||||||
Ratio of total expenses to average net assets | 1.26 | % | 1.25 | % | 1.39 | % | 1.43 | % | 1.42 | % | ||||||||||||
Ratio of net investment income to average net assets | 0.69 | % | 0.48 | % | 0.84 | % | 0.70 | % | 0.64 | % | ||||||||||||
Portfolio turnover rate(c) | 199 | % | 168 | % | 193 | % | 213 | % | 224 | % | ||||||||||||
| (a) | Calculated based on the average shares outstanding methodology. |
| (b) | Assumes investment at the NAV at the beginning of the year, reinvestment of all dividends and distributions, a complete redemption of the investment at the NAV at the end of the year and no sales or redemption charges (if any). Total returns would be reduced if a sales or redemption charge was taken into account. Returns do not reflect the impact of taxes to shareholders relating to Fund distributions or the redemption of Fund shares. |
| (c) | The Fund’s portfolio turnover rate is calculated in accordance with regulatory requirements, without regard to transactions involving short term investments and certain derivatives. If such transactions were included, the Fund’s portfolio turnover rate may be higher. |
| 108 | The accompanying notes are an integral part of these financial statements. |
GOLDMAN SACHS U.S. EQUITY INSIGHTS FUND
Financial Highlights(continued)
Selected Data for a Share Outstanding Throughout Each Period
| Goldman Sachs U.S. Equity Insights Fund | ||||||||||||||||||||||
| Class R6 Shares | ||||||||||||||||||||||
| Year Ended October 31, | Period Ended October 31, 2015(a) | |||||||||||||||||||||
| 2019 | 2018 | 2017 | 2016 | |||||||||||||||||||
| Per Share Data |
| |||||||||||||||||||||
Net asset value, beginning of period | $ | 49.27 | $ | 51.19 | $ | 41.91 | $ | 42.60 | $ | 43.19 | ||||||||||||
Net investment income(b) | 0.76 | 0.42 | 0.82 | 0.56 | 0.14 | |||||||||||||||||
Net realized and unrealized gain (loss) | 3.10 | 2.68 | 10.33 | 0.50 | (0.73 | ) | ||||||||||||||||
Total from investment operations | 3.86 | 3.10 | 11.15 | 1.06 | (0.59 | ) | ||||||||||||||||
Distributions to shareholders from net investment income | (0.35 | ) | (0.64 | ) | (0.49 | ) | (0.56 | ) | — | |||||||||||||
Distributions to shareholders from net realized gains | (1.65 | ) | (4.38 | ) | (1.38 | ) | (1.19 | ) | — | |||||||||||||
Total distributions | (2.00 | ) | (5.02 | ) | (1.87 | ) | (1.75 | ) | — | |||||||||||||
Net asset value, end of period | $ | 51.13 | $ | 49.27 | $ | 51.19 | $ | 41.91 | $ | 42.60 | ||||||||||||
| Total Return(c) | 8.38 | % | 6.37 | % | 27.41 | % | 2.66 | % | (1.37 | )% | ||||||||||||
Net assets, end of period (in 000’s) | $ | 12,068 | $ | 31,916 | $ | 2,557 | $ | 60 | $ | 10 | ||||||||||||
Ratio of net expenses to average net assets | 0.54 | % | 0.54 | % | 0.55 | % | 0.55 | % | 0.55 | %(d) | ||||||||||||
Ratio of total expenses to average net assets | 0.59 | % | 0.63 | % | 0.71 | % | 0.77 | % | 0.74 | %(d) | ||||||||||||
Ratio of net investment income to average net assets | 1.49 | % | 0.82 | % | 1.70 | % | 1.36 | % | 1.37 | %(d) | ||||||||||||
Portfolio turnover rate(e) | 199 | % | 168 | % | 193 | % | 213 | % | 224 | % | ||||||||||||
| (a) | Commenced operations on July 31, 2015. |
| (b) | Calculated based on the average shares outstanding methodology. |
| (c) | Assumes investment at the NAV at the beginning of the period, reinvestment of all dividends and distributions, a complete redemption of the investment at the NAV at the end of the period and no sales or redemption charges (if any). Total returns would be reduced if a sales or redemption charge was taken into account. Returns do not reflect the impact of taxes to shareholders relating to Fund distributions or the redemption of Fund shares. Total returns for periods less than one full year are not annualized. |
| (d) | Annualized. |
| (e) | The Fund’s portfolio turnover rate is calculated in accordance with regulatory requirements, without regard to transactions involving short term investments and certain derivatives. If such transactions were included, the Fund’s portfolio turnover rate may be higher. |
| The accompanying notes are an integral part of these financial statements. | 109 |
GOLDMAN SACHS DOMESTIC EQUITY INSIGHTS FUNDS
October 31, 2019
| 1. ORGANIZATION |
Goldman Sachs Trust (the “Trust”) is a Delaware statutory trust registered under the Investment Company Act of 1940, as amended (the “Act”), as an open-end management investment company. The following table lists those series of the Trust that are included in this report (collectively, the “Funds” or individually a “Fund”), along with their corresponding share classes and respective diversification status under the Act:
| Fund | Share Classes Offered | Diversified/ Non-diversified | ||
Large Cap Growth Insights, Large Cap Value Insights, Small Cap Equity Insights and U.S. Equity Insights | A, C, Institutional, Service, Investor, P, R and R6 | Diversified | ||
Small Cap Growth Insights and Small Cap Value Insights | A, C, Institutional, Investor, P, R and R6 | Diversified |
Class A Shares are sold with a front-end sales charge of up to 5.50%. Class C Shares are sold with a contingent deferred sales charge (“CDSC”) of 1.00%, which is imposed on redemptions made within 12 months of purchase. Institutional, Service, Investor, Class P, Class R and Class R6 Shares are not subject to a sales charge.
Goldman Sachs Asset Management, L.P. (“GSAM”), an affiliate of Goldman Sachs & Co. LLC (“Goldman Sachs”), serves as investment adviser to the Funds pursuant to a management agreement (the “Agreement”) with the Trust.
| 2. SIGNIFICANT ACCOUNTING POLICIES |
The financial statements have been prepared in accordance with accounting principles generally accepted in the United States of America (“GAAP”) and require management to make estimates and assumptions that may affect the reported amounts and disclosures. Actual results may differ from those estimates and assumptions. Each Fund is an investment company under GAAP and follows the accounting and reporting guidance applicable to investment companies.
A. Investment Valuation— The Funds’ valuation policy is to value investments at fair value.
B. Investment Income and Investments— Investment income includes interest income, dividend income, and securities lending income, if any. Interest income is accrued daily and adjusted for amortization of premiums and accretion of discounts. Dividend income is recognized on ex-dividend date or, for certain foreign securities, as soon as such information is obtained subsequent to the ex-dividend date. Non-cash dividends, if any, are recorded at fair market value of the securities received. Investment transactions are reflected on trade date. Realized gains and losses are calculated using identified cost. Investment transactions are recorded on the following business day for daily net asset value (“NAV”) calculations. Investment income is recorded net of any foreign withholding taxes, less any amounts reclaimable. The Funds may file withholding tax reclaims in certain jurisdictions to recover a portion of amounts previously withheld. Any foreign capital gains tax is accrued daily based upon net unrealized gains, and is payable upon sale of such investments. Distributions received from the Funds’ investments in U.S. real estate investment trusts (“REITs”) may be characterized as ordinary income, net capital gain and/or a return of capital. A return of capital is recorded by the Funds as a reduction to the cost basis of the REIT.
For derivative contracts, realized gains and losses are recorded upon settlement of the contract.
C. Class Allocations and Expenses— Investment income, realized and unrealized gain (loss), if any, and non-class specific expenses of each Fund are allocated daily based upon the proportion of net assets of each class.Non-class specific expenses directly incurred by a Fund are charged to that Fund, while such expenses incurred by the Trust are allocated across the applicable Funds on a straight-line and/orpro-rata basis depending upon the nature of the expenses. Class specific expenses, where applicable, are borne by the respective share classes and include Distribution and Service, Transfer Agency and Service and Shareholder Administration fees.
110
GOLDMAN SACHS DOMESTIC EQUITY INSIGHTS FUNDS
| 2. SIGNIFICANT ACCOUNTING POLICIES (continued) |
D. Federal Taxes and Distributions to Shareholders— It is each Fund’s policy to comply with the requirements of the Internal Revenue Code of 1986, as amended (the “Code”), applicable to regulated investment companies and to distribute each year substantially all of its investment company taxable income and capital gains to its shareholders. Accordingly, each Fund is not required to make any provisions for the payment of federal income tax. Distributions to shareholders are recorded on theex-dividend date. Income and capital gains distributions, if any, are declared and paid according to the following schedule:
| Fund | Income Distributions Declared/Paid | Capital Gains Distributions Declared/Paid | ||||
Large Cap Value Insights | Quarterly | Annually | ||||
Large Cap Growth Insights, Small Cap Equity Insights, Small Cap Growth Insights, Small Cap Value Insights and U.S. Equity Insights | Annually | Annually |
Net capital losses, if any, are carried forward to future fiscal years and may be used to the extent allowed by the Code to offset any future capital gains. Losses that are carried forward will retain their character as eithershort-term orlong-term capital losses. Utilization of capital loss carryforwards will reduce the requirement of future capital gains distributions.
The characterization of distributions to shareholders for financial reporting purposes is determined in accordance with federal income tax rules, which may differ from GAAP. The source of each Fund’s distributions may be shown in the accompanying financial statements as either from distributable earnings or capital. Certain components of the Funds’ net assets on the Statements of Assets and Liabilities reflect permanent GAAP/tax differences based on the appropriate tax character.
| 3. INVESTMENTS AND FAIR VALUE MEASUREMENTS |
U.S. GAAP defines the fair value of a financial instrument as the amount that would be received to sell an asset or paid to transfer a liability in an orderly transaction between market participants at the measurement date (i.e., the exit price); the Funds’ policy is to use the market approach. GAAP establishes a fair value hierarchy that prioritizes the inputs to valuation techniques used to measure fair value. The hierarchy gives the highest priority to unadjusted quoted prices in active markets for identical assets or liabilities (Level 1 measurements) and the lowest priority to unobservable inputs (Level 3 measurements). The levels used for classifying investments are not necessarily an indication of the risk associated with investing in these investments. The three levels of the fair value hierarchy are described below:
Level 1 — Unadjusted quoted prices in active markets that are accessible at the measurement date for identical, unrestricted assets or liabilities;
Level 2 — Quoted prices in markets that are not active or financial instruments for which significant inputs are observable (including, but not limited to, quoted prices for similar investments, interest rates, foreign exchange rates, volatility and credit spreads), either directly or indirectly;
Level 3 — Prices or valuations that require significant unobservable inputs (including GSAM’s assumptions in determining fair value measurement).
The Board of Trustees (“Trustees”) has approved Valuation Procedures that govern the valuation of the portfolio investments held by the Funds, including investments for which market quotations are not readily available. The Trustees have delegated to GSAMday-to-day responsibility for implementing and maintaining internal controls and procedures related to the valuation of the Funds’ investments. To assess the continuing appropriateness of pricing sources and methodologies, GSAM regularly performs price verification procedures and issues challenges as necessary to third party pricing vendors or brokers, and any differences are reviewed in accordance with the Valuation Procedures.
111
GOLDMAN SACHS DOMESTIC EQUITY INSIGHTS FUNDS
Notes to Financial Statements(continued)
October 31, 2019
| 3. INVESTMENTS AND FAIR VALUE MEASUREMENTS (continued) |
A. Level 1 and Level 2 Fair Value Investments— The valuation techniques and significant inputs used in determining the fair values for investments classified as Level 1 and Level 2 are as follows:
Equity Securities— Equity securities traded on a United States (“U.S.”) securities exchange or the NASDAQ system, or those located on certain foreign exchanges, including but not limited to the Americas, are valued daily at their last sale price or official closing price on the principal exchange or system on which they are traded. If there is no sale or official closing price or such price is believed by GSAM to not represent fair value, equity securities may be valued at the closing bid price for long positions and at the closing ask price for short positions. To the extent these investments are actively traded, they are classified as Level 1 of the fair value hierarchy, otherwise they are generally classified as Level 2.
Unlisted equity securities for which market quotations are available are valued at the last sale price on the valuation date, or if no sale occurs, at the last bid price for long positions or the last ask price for short positions, and are generally classified as Level 2. Securities traded on certain foreign securities exchanges are valued daily at fair value determined by an independent fair value service (if available) under Valuation Procedures approved by the Trustees and consistent with applicable regulatory guidance. The independent fair value service takes into account multiple factors including, but not limited to, movements in the securities markets, certain depositary receipts, futures contracts and foreign currency exchange rates that have occurred subsequent to the close of the foreign securities exchange. These investments are generally classified as Level 2 of the fair value hierarchy.
Money Market Funds— Investments in the Goldman Sachs Financial Square Government Fund (“Government Money Market Fund”) are valued at the NAV per share of the Institutional Share class on the day of valuation. These investments are generally classified as Level 1 of the fair value hierarchy. For information regarding the Government Money Market Fund’s accounting policies and investment holdings, please see the Government Money Market Fund’s shareholder report.
Derivative Contracts— A derivative is an instrument whose value is derived from underlying assets, indices, reference rates or a combination of these factors. A Fund enters into derivative transactions to hedge against changes in interest rates, securities prices, and/or currency exchange rates, to increase total return, or to gain access to certain markets or attain exposure to other underliers. For financial reporting purposes, cash collateral that has been pledged to cover obligations of a Fund and cash collateral received, if any, is reported separately on the Statements of Assets and Liabilities as receivables/payables for collateral on certain derivatives contracts.Non-cash collateral pledged by a Fund, if any, is noted in the Schedules of Investments.
Exchange-traded derivatives, including futures and options contracts, are generally valued at the last sale or settlement price on the exchange where they are principally traded. Exchange-traded options without settlement prices are generally valued at the midpoint of the bid and ask prices on the exchange where they are principally traded (or, in the absence of two-way trading, at the last bid price for long positions and the last ask price for short positions). Exchange-traded derivatives typically fall within Level 1 of the fair value hierarchy.Over-the-counter (“OTC”) and centrally cleared derivatives are valued using market transactions and other market evidence, including market-based inputs to models, calibration to market-clearing transactions, broker or dealer quotations, or other alternative pricing sources. Where models are used, the selection of a particular model to value OTC and centrally cleared derivatives depends upon the contractual terms of, and specific risks inherent in, the instrument, as well as the availability of pricing information in the market. Valuation models require a variety of inputs, including contractual terms, market prices, yield curves, credit curves, measures of volatility, voluntary and involuntary prepayment rates, loss severity rates and correlations of such inputs. For OTC and centrally cleared derivatives that trade in liquid markets, model inputs can generally be verified and model selection does not involve significant management judgment. OTC and centrally cleared derivatives are classified within Level 2 of the fair value hierarchy when significant inputs are corroborated by market evidence.
i. Futures Contracts— Futures contracts are contracts to buy or sell a standardized quantity of a specified commodity or security. Upon entering into a futures contract, a Fund deposits cash or securities in an account on behalf of the broker in an amount sufficient to meet the initial margin requirement. Subsequent payments are made or received by a Fund equal to the daily change in the contract value and are recorded as variation margin receivable or payable with a corresponding offset to unrealized gains or losses.
112
GOLDMAN SACHS DOMESTIC EQUITY INSIGHTS FUNDS
| 3. INVESTMENTS AND FAIR VALUE MEASUREMENTS (continued) |
B. Level 3 Fair Value Investments— To the extent that significant inputs to valuation models and other alternative pricing sources are unobservable, or if quotations are not readily available, or if GSAM believes that such quotations do not accurately reflect fair value, the fair value of a Fund’s investments may be determined under Valuation Procedures approved by the Trustees. GSAM, consistent with its procedures and applicable regulatory guidance, may make an adjustment to the most recent valuation prices of either domestic or foreign securities in light of significant events to reflect what it believes to be the fair value of the securities at the time of determining a Fund’s NAV. To the extent investments are valued using single source broker quotations obtained directly from the broker or passed through from third party pricing vendors, such investments are classified as Level 3 investments.
C. Fair Value Hierarchy— The following is a summary of the Funds’ investments and derivatives classified in the fair value hierarchy as of October 31, 2019:
| LARGE CAP GROWTH INSIGHTS | ||||||||||||
| Investment Type | Level 1 | Level 2 | Level 3 | |||||||||
| Assets | ||||||||||||
Common Stock and/or Other Equity Investments(a) | ||||||||||||
Europe | $ | 8,872,156 | $ | — | $ | — | ||||||
North America | 1,936,048,418 | — | — | |||||||||
| Total | $ | 1,944,920,574 | $ | — | $ | — | ||||||
| LARGE CAP VALUE INSIGHTS | ||||||||||||
| Investment Type | Level 1 | Level 2 | Level 3 | |||||||||
| Assets | ||||||||||||
Common Stock and/or Other Equity Investments(a) | ||||||||||||
Europe | $ | 1,473,066 | $ | — | $ | — | ||||||
North America | 447,532,935 | — | — | |||||||||
| Total | $ | 449,006,001 | $ | — | $ | — | ||||||
| SMALL CAP EQUITY INSIGHTS | ||||||||||||
| Investment Type | Level 1 | Level 2 | Level 3 | |||||||||
| Assets | ||||||||||||
Common Stock and/or Other Equity Investments(a) | ||||||||||||
Asia | $ | 1,643,097 | $ | — | $ | — | ||||||
Europe | 7,561,126 | — | — | |||||||||
North America | 675,307,448 | — | — | |||||||||
South America | 497,883 | — | — | |||||||||
Investment Company | 7,203,961 | — | — | |||||||||
Securities Lending Reinvestment Vehicle | 1,732,225 | — | — | |||||||||
| Total | $ | 693,945,740 | $ | — | $ | — | ||||||
| (a) | Amounts are disclosed by continent to highlight the impact of time zone differences between local market close and the calculation of NAV. Security valuations are based on the principal exchange or system on which they are traded, which may differ from country of domicile noted in table. |
113
GOLDMAN SACHS DOMESTIC EQUITY INSIGHTS FUNDS
Notes to Financial Statements(continued)
October 31, 2019
| 3. INVESTMENTS AND FAIR VALUE MEASUREMENTS (continued) |
| SMALL CAP EQUITY INSIGHTS (continued) | ||||||||||||
| Derivative Type | Level 1 | Level 2 | Level 3 | |||||||||
| Liabilities(b) | ||||||||||||
Futures Contracts | $ | (141,112 | ) | $ | — | $ | — | |||||
| SMALL CAP GROWTH INSIGHTS | ||||||||||||
| Investment Type | Level 1 | Level 2 | Level 3 | |||||||||
| Assets | ||||||||||||
Common Stock and/or Other Equity Investments(a) | ||||||||||||
Asia | $ | 3,796,931 | $ | — | $ | — | ||||||
Europe | 8,085,016 | — | — | |||||||||
North America | 1,120,177,761 | — | ||||||||||
Investment Company | 10,845,477 | — | — | |||||||||
| Total | $ | 1,142,905,185 | $ | — | $ | — | ||||||
| Derivative Type | ||||||||||||
| Liabilities(b) | ||||||||||||
Futures Contracts | $ | (234,858 | ) | $ | — | $ | — | |||||
| SMALL CAP VALUE INSIGHTS | ||||||||||||
| Investment Type | Level 1 | Level 2 | Level 3 | |||||||||
| Assets | ||||||||||||
Common Stock and/or Other Equity Investments(a) | ||||||||||||
Asia | $ | 846,543 | $ | — | $ | — | ||||||
Europe | 6,268,297 | — | — | |||||||||
North America | 539,778,359 | — | — | |||||||||
South America | 1,351,991 | — | — | |||||||||
Investment Company | 10,633,890 | — | — | |||||||||
Securities Lending Reinvestment Vehicle | 2,300,481 | — | — | |||||||||
| Total | $ | 561,179,561 | $ | — | $ | — | ||||||
| Derivative Type | ||||||||||||
| Assets(b) | ||||||||||||
Futures Contracts | $ | 408,201 | $ | — | $ | — | ||||||
| (a) | Amounts are disclosed by continent to highlight the impact of time zone differences between local market close and the calculation of NAV. Security valuations are based on the principal exchange or system on which they are traded, which may differ from country of domicile noted in table. |
| (b) | Amounts shown represent unrealized gain (loss) at fiscal year end. |
114
GOLDMAN SACHS DOMESTIC EQUITY INSIGHTS FUNDS
| 3. INVESTMENTS AND FAIR VALUE MEASUREMENTS (continued) |
| U.S. EQUITY INSIGHTS | ||||||||||||
| Investment Type | Level 1 | Level 2 | Level 3 | |||||||||
| Assets | ||||||||||||
Common Stock and/or Other Equity Investments(a) | ||||||||||||
Europe | $ | 13,238,266 | $ | — | $ | — | ||||||
North America | 994,349,913 | — | — | |||||||||
| Total | $ | 1,007,588,179 | $ | — | $ | — | ||||||
| (a) | Amounts are disclosed by continent to highlight the impact of time zone differences between local market close and the calculation of NAV. Security valuations are based on the principal exchange or system on which they are traded, which may differ from country of domicile noted in table. |
For further information regarding security characteristics, see the Schedules of Investments.
| 4. INVESTMENTS IN DERIVATIVES |
The following tables set forth, by certain risk types, the gross value of derivative contracts (not considered to be hedging instruments for accounting disclosure purposes) as of October 31, 2019. These instruments were used as part of the Funds’ investment strategies and to obtain and/or manage exposure related to the risks below. The values in the tables below exclude the effects of cash collateral received or posted pursuant to these derivative contracts, and therefore are not representative of the Funds’ net exposure.
| Risk | Fund | Statement of Assets and Liabilities | Assets (Liabilities)(a) | |||||||||||||||||
Equity | Small Cap Equity Insights | Variation Margin on Futures Contracts | $ | (141,112 | ) | |||||||||||||||
Equity | Small Cap Growth Insights | Variation Margin on Futures Contracts | (234,858 | ) | ||||||||||||||||
Equity | Small Cap Value Insights | Variation Margin on Futures Contracts | 408,201 | |||||||||||||||||
| (a) | Includes unrealized gain (loss) on futures contracts described in the Additional Investment Information sections of the Schedules of Investments. Only the variation margin as of October 31, 2019 is reported within the Statements of Assets and Liabilities. |
The following tables set forth, by certain risk types, the Funds’ gains (losses) related to these derivatives and their indicative volumes for the fiscal year ended October 31, 2019. These gains (losses) should be considered in the context that these derivative contracts may have been executed to create investment opportunities and/or economically hedge certain investments, and
115
GOLDMAN SACHS DOMESTIC EQUITY INSIGHTS FUNDS
Notes to Financial Statements(continued)
October 31, 2019
| 4. INVESTMENTS IN DERIVATIVES (continued) |
accordingly, certain gains (losses) on such derivative contracts may offset certain (losses) gains attributable to investments. These gains (losses) are included in “Net realized gain (loss)” or “Net change in unrealized gain (loss)” on the Statements of Operations:
| Risk | Fund | Net Realized Gain (Loss) from Futures Contracts | Net Change in Unrealized Gain (Loss) on Futures Contracts | Average Number of Contracts(a) | ||||||||||||||
| Equity | Large Cap Growth Insights | $ | 1,665,745 | $ | — | 36 | ||||||||||||
| Equity | Large Cap Value Insights | 350,631 | 666,310 | 39 | ||||||||||||||
| Equity | Small Cap Equity Insights | 1,186,467 | 36,715 | 99 | ||||||||||||||
| Equity | Small Cap Growth Insights | (1,577,106 | ) | 1,375,468 | 235 | |||||||||||||
| Equity | Small Cap Value Insights | 669,740 | 591,805 | 100 | ||||||||||||||
| Equity | U.S. Equity Insights | $ | (2,252,522 | ) | $ | 1,906,386 | 57 | |||||||||||
| (a) | Average number of contracts is based on the month end balances for the fiscal year ended October 31, 2019. |
| 5. AGREEMENTS AND AFFILIATED TRANSACTIONS |
A. Management Agreement— Under the Agreement, GSAM manages the Funds, subject to the general supervision of the Trustees.
As compensation for the services rendered pursuant to the Agreement, the assumption of the expenses related thereto and administration of the Funds’ business affairs, including providing facilities, GSAM is entitled to a management fee, accrued daily and paid monthly, equal to an annual percentage rate of each Fund’s average daily net assets.
For the fiscal year ended October 31, 2019, contractual and effective net management fees with GSAM were at the following rates:
| Contractual Management Rate | Effective Net Management Rate^ | |||||||||||||||||||||||||||||||
| Fund | First $1 billion | Next $1 billion | Next $3 billion | Next $3 billion | Over $8 billion | Effective Rate | ||||||||||||||||||||||||||
Large Cap Growth Insights | 0.52 | % | 0.47 | % | 0.44 | % | 0.44 | % | 0.43 | % | 0.49 | % | 0.49 | % | ||||||||||||||||||
Large Cap Value Insights | 0.52 | 0.47 | 0.44 | 0.44 | 0.43 | 0.52 | 0.52 | |||||||||||||||||||||||||
Small Cap Equity Insights | 0.80 | 0.80 | 0.72 | 0.68 | 0.67 | 0.80 | 0.80 | |||||||||||||||||||||||||
Small Cap Growth Insights | 0.80 | 0.80 | 0.72 | 0.68 | 0.67 | 0.80 | 0.80 | |||||||||||||||||||||||||
Small Cap Value Insights | 0.80 | 0.80 | 0.72 | 0.68 | 0.67 | 0.80 | 0.80 | |||||||||||||||||||||||||
U.S. Equity Insights | 0.52 | 0.47 | 0.44 | 0.44 | 0.43 | 0.51 | 0.51 | |||||||||||||||||||||||||
| ^ | Effective Net Management Rate includes the impact of management fee waivers of affiliated underlying funds, if any. |
The Large Cap Growth Insights, Large Cap Value Insights, Small Cap Equity Insights, Small Cap Growth Insights, Small Cap Value Insights and U.S. Equity Insights Funds invest in Institutional Shares of the Government Money Market Fund, which is an affiliated underlying fund. GSAM has agreed to waive a portion of its management fee payable by the Funds in an amount equal to the management fee it earns as an investment adviser to the affiliated underlying funds in which the Funds invest, except those management fees it earns from the Fund’s investments of cash collateral received in connection with securities lending transactions
116
GOLDMAN SACHS DOMESTIC EQUITY INSIGHTS FUNDS
| 5. AGREEMENTS AND AFFILIATED TRANSACTIONS (continued) |
in the Government Money Market Fund. For the fiscal year ended October 31, 2019, the management fee waived by GSAM for each Fund was as follows:
| Fund | Management Fee Waived | |||||
Large Cap Growth Insights | $ | 5,047 | ||||
Large Cap Value Insights | 7,863 | |||||
Small Cap Equity Insights | 9,367 | |||||
Small Cap Growth Insights | 21,893 | |||||
Small Cap Value Insights | 11,738 | |||||
U.S. Equity Insights | 9,653 | |||||
B. Distribution and/or Service (12b-1) Plans— The Trust, on behalf of Class A and Class R Shares of each applicable Fund, has adopted Distribution and Service Plans subject to Rule 12b-1 under the Act. Under the Distribution and Service Plans, Goldman Sachs, which serves as distributor (the “Distributor”), is entitled to a fee accrued daily and paid monthly for distribution services and personal and account maintenance services, which may then be paid by Goldman Sachs to authorized dealers. These fees are equal to an annual percentage rate of the average daily net assets attributable to Class A or Class R Shares of the Funds, as applicable, as set forth below.
The Trust, on behalf of Class C Shares of each applicable Fund, has adopted a Distribution Plan subject to Rule 12b-1 under the Act. Under the Distribution Plan, Goldman Sachs as Distributor is entitled to a fee accrued daily and paid monthly for distribution services, which may then be paid by Goldman Sachs to authorized dealers. These fees are equal to an annual percentage rate of the average daily net assets attributable to Class C Shares of the Funds, as set forth below.
The Trust, on behalf of Service Shares of each applicable Fund, has adopted a Service Plan subject to Rule 12b-1 under the Act to allow Service Shares to compensate service organizations (including Goldman Sachs) for providing personal and account maintenance services to their customers who are beneficial owners of such shares. The Service Plan provides for compensation to the service organizations equal to an annual percentage rate of the average daily net assets attributable to Service Shares of the Funds as set forth below.
| Distribution and/or Service Plan Rates | ||||||||||||||||
| Class A* | Class C | Class R* | Service Shares | |||||||||||||
Distribution and/or Service Plan | 0.25 | % | 0.75 | % | 0.50 | % | 0.25 | % | ||||||||
| * | With respect to Class A and Class R Shares, the Distributor at its discretion may use compensation for distribution services paid under the Distribution and/or Service Plan to compensate service organizations for personal and account maintenance services and expenses as long as such total compensation does not exceed the maximum cap on “service fees” imposed by the Financial Industry Regulatory Authority. |
117
GOLDMAN SACHS DOMESTIC EQUITY INSIGHTS FUNDS
Notes to Financial Statements(continued)
October 31, 2019
| 5. AGREEMENTS AND AFFILIATED TRANSACTIONS (continued) |
C. Distribution Agreement— Goldman Sachs, as Distributor of the shares of the Funds pursuant to a Distribution Agreement, may retain a portion of the Class A Shares’ front end sales charge and Class C Shares’ CDSC. During the fiscal year ended October 31, 2019, Goldman Sachs retained the following amounts:
| Front End Sales Charge | Contingent Deferred Sales Charge | |||||||||
| Fund | Class A | Class C | ||||||||
Large Cap Growth Insights | $ | 28,305 | $ | 50 | ||||||
Large Cap Value Insights | 9,324 | 560 | ||||||||
Small Cap Equity Insights | 3,896 | 445 | ||||||||
Small Cap Growth Insights | 6,741 | 71 | ||||||||
Small Cap Value Insights | 8,146 | 54 | ||||||||
U.S. Equity Insights | 15,323 | 752 | ||||||||
D. Service and Shareholder Administration Plans— The Trust, on behalf of each applicable Fund, has adopted a Service Plan to allow Class C Shares and a Shareholder Administration Plan to allow Service Shares, respectively, to compensate service organizations (including Goldman Sachs) for providing varying levels of personal and account maintenance or shareholder administration services to their customers who are beneficial owners of such shares. The Service and Shareholder Administration Plans each provide for compensation to the service organizations equal to an annual percentage rate of 0.25% of the average daily net assets attributable to Class C and Service Shares of the Funds.
E. Transfer Agency Agreement— Goldman Sachs also serves as the transfer agent of the Funds for a fee pursuant to the Transfer Agency Agreement. The fees charged for such transfer agency services are accrued daily and paid monthly at annual rates as follows: 0.17% of the average daily net assets of Class A, Class C, Investor and Class R Shares; 0.03% of the average daily net assets of Class P and Class R6 Shares; and 0.04% of the average daily net assets of Institutional and Service Shares. Prior to July 1, 2019, such fee was 0.18% of the average daily net assets of the Class A, Class C, Investor and Class R Shares.
F. Other Expense Agreements and Affiliated Transactions— GSAM has agreed to reduce or limit certain “Other Expenses” of the Funds (excluding acquired fund fees and expenses, transfer agency fees and expenses, service fees and shareholder administration fees (as applicable), taxes, interest, brokerage fees, expenses of shareholder meetings, litigation and indemnification, and extraordinary expenses) to the extent such expenses exceed, on an annual basis, a percentage rate of the average daily net assets of each Fund. Such Other Expense reimbursements, if any, are accrued daily and paid monthly. In addition, the Funds are not obligated to reimburse GSAM for prior fiscal year expense reimbursements, if any. The Other Expense limitations as an annual percentage rate of average daily net assets are 0.004%. These Other Expense limitations will remain in place through at least February 28, 2020, and prior to such date GSAM may not terminate the arrangements without the approval of the Trustees. In addition, the Funds have entered into certain offset arrangements with the transfer agent, which may result in a reduction of the Funds’ expenses and are received irrespective of the application of the “Other Expense” limitations described above.
118
GOLDMAN SACHS DOMESTIC EQUITY INSIGHTS FUNDS
| 5. AGREEMENTS AND AFFILIATED TRANSACTIONS (continued) |
For the fiscal year ended October 31, 2019, these expense reductions, including any fee waivers and Other Expense reimbursements, were as follows:
| Fund | Management Fee Waiver | Other Expense Reimbursements | Total Expense Reductions | |||||||||||
Large Cap Growth Insights | $ | 5,047 | $ | 839,126 | $ | 844,173 | ||||||||
Large Cap Value Insights | 7,863 | 563,321 | 571,184 | |||||||||||
Small Cap Equity Insights | 9,367 | 646,558 | 655,925 | |||||||||||
Small Cap Growth Insights | 21,893 | 860,342 | 882,235 | |||||||||||
Small Cap Value Insights | 11,738 | 583,380 | 595,118 | |||||||||||
U.S. Equity Insights | 9,653 | 856,707 | 866,360 | |||||||||||
G. Line of Credit Facility— As of October 31, 2019, the Funds participated in a $580,000,000 committed, unsecured revolving line of credit facility (the “facility”) together with other funds of the Trust and certain registered investment companies having management agreements with GSAM or its affiliates. This facility is to be used for temporary emergency purposes, or to allow for an orderly liquidation of securities to meet redemption requests. The interest rate on borrowings is based on the federal funds rate. The facility also requires a fee to be paid by the Funds based on the amount of the commitment that has not been utilized. For the fiscal year ended October 31, 2019, the Funds did not have any borrowings under the facility. Prior to April 30, 2019 the facility was $770,000,000.
H. Other Transactions with Affiliates— For the fiscal year ended October 31, 2019, Goldman Sachs earned $692, $1,050, $2,578, $4,475, $1,822 and $6,242 in brokerage commissions from portfolio transactions, including futures transactions executed with Goldman Sachs as the Futures Commission Merchant, on behalf of the Large Cap Growth Insights, Large Cap Value Insights, Small Cap Equity Insights, Small Cap Growth Insights, Small Cap Value Insights and U.S. Equity Insights Funds, respectively.
As of October 31, 2019, Goldman Sachs Dynamic Global Equity Fund and Goldman Sachs Enhanced Dividend Global Equity Portfolio were beneficial owners of 5% or more of total outstanding shares of the following Funds:
| Fund | Goldman Sachs Dynamic Global Equity | Goldman Sachs Enhanced Dividend Global Equity | ||||||||
Large Cap Value Insights | 11 | % | — | % | ||||||
Small Cap Equity Insights | — | 7 | ||||||||
119
GOLDMAN SACHS DOMESTIC EQUITY INSIGHTS FUNDS
Notes to Financial Statements(continued)
October 31, 2019
| 5. AGREEMENTS AND AFFILIATED TRANSACTIONS (continued) |
The following table provides information about the Funds’ investments in the Government Money Market Fund as of and for the fiscal year ended October 31, 2019:
| Fund | Market Value as of October 31, 2018 | Purchases at Cost | Proceeds from Sales | Market Value as of October 31, 2019 | Shares as of October 31, 2019 | Dividend Income from Affiliated Investment Companies | ||||||||||||||||||
Large Cap Growth Insights | $ | 37,210 | $ | 124,447,043 | $ | (124,484,253 | ) | $ | — | $ | — | $ | 70,294 | |||||||||||
Large Cap Value Insights | 7,298,796 | 137,035,715 | (144,334,511 | ) | — | — | 110,158 | |||||||||||||||||
Small Cap Equity Insights | 223,093 | 226,422,102 | (219,441,234 | ) | 7,203,961 | 7,203,961 | 131,744 | |||||||||||||||||
Small Cap Growth Insights | 9,550,604 | 282,495,598 | (281,200,725 | ) | 10,845,477 | 10,845,477 | 306,034 | |||||||||||||||||
Small Cap Value Insights | 3,260,345 | 259,656,066 | (252,282,521 | ) | 10,633,890 | 10,633,890 | 171,389 | |||||||||||||||||
U.S. Equity Insights | 23,933,904 | 219,004,146 | (242,938,050 | ) | — | — | 127,638 | |||||||||||||||||
| 6. PORTFOLIO SECURITIES TRANSACTIONS |
The cost of purchases and proceeds from sales and maturities oflong-term securities for the fiscal year ended October 31, 2019 were as follows:
| Fund | Purchases | Sales and Maturities | ||||||
Large Cap Growth Insights | $3,874,253,667 | $ | 4,178,564,224 | |||||
Large Cap Value Insights | 1,106,771,661 | 1,134,016,808 | ||||||
Small Cap Equity Insights | 928,115,215 | 853,856,934 | ||||||
Small Cap Growth Insights | 1,665,933,712 | 1,446,110,755 | ||||||
Small Cap Value Insights | 840,203,492 | 578,990,325 | ||||||
U.S. Equity Insights | 2,727,744,913 | 3,324,092,587 | ||||||
| 7. SECURITIES LENDING |
Pursuant to exemptive relief granted by the Securities and Exchange Commission (“SEC”) and the terms and conditions contained therein, the Large Cap Growth Insights, Large Cap Value Insights, Small Cap Equity Insights, Small Cap Growth Insights, Small Cap Value Insights and U.S. Equity Insights Funds may lend their securities through a securities lending agent, Goldman Sachs Agency Lending (“GSAL”), awholly-owned subsidiary of Goldman Sachs, to certain qualified borrowers including Goldman Sachs and affiliates. In accordance with the Funds’ securities lending procedures, the Funds receive cash collateral at least equal to the market value of the securities on loan. The market value of the loaned securities is determined at the close of business of the Funds at their last sale price or official closing price on the principal exchange or system on which they are traded, and any additional required collateral is delivered to the Funds on the next business day. As with other extensions of credit, the Funds may experience delay in the recovery of their securities or incur a loss should the borrower of the securities breach its agreement with the Funds or become insolvent at a time when the collateral is insufficient to cover the cost of repurchasing securities on loan. Dividend income received from securities on loan may not be subject to withholding taxes and therefore withholding taxes paid
120
GOLDMAN SACHS DOMESTIC EQUITY INSIGHTS FUNDS
| 7. SECURITIES LENDING (continued) |
may differ from the amounts listed in the Statements of Operations. Loans of securities are terminable at any time and as such 1) the remaining contractual maturities of the outstanding securities lending transactions are considered to be overnight and continuous and 2) the borrower, after notice, is required to return borrowed securities within the standard time period for settlement of securities transactions.
The Funds invest the cash collateral received in connection with securities lending transactions in the Government Money Market Fund, an affiliated series of the Trust. The Government Money Market Fund is registered under the Act as an open end investment company, is subject to Rule 2a-7 under the Act, and is managed by GSAM, for which GSAM may receive a management fee of up to 0.16% on an annualized basis of the average daily net assets of the Government Money Market Fund.
In the event of a default by a borrower with respect to any loan, GSAL will exercise any and all remedies provided under the applicable borrower agreement to make the Funds whole. These remedies include purchasing replacement securities by applying the collateral held from the defaulting broker against the purchase cost of the replacement securities. If GSAL is unable to purchase replacement securities, GSAL will indemnify the Funds by paying an amount equal to the market value of the securities loaned minus the value of cash collateral received from the borrower for the loan, subject to an exclusion for any shortfalls resulting from a loss of value in such cash collateral due to reinvestment risk. The Funds’ master netting agreements with certain borrowers provide the right, in the event of a default (including bankruptcy or insolvency), for the non-defaulting party to liquidate the collateral and calculate net exposure to the defaulting party or request additional collateral. However, in the event of a default by a borrower, a resolution authority could determine that such rights are not enforceable due to the restrictions or prohibitions against the right of set-off that may be imposed in accordance with a particular jurisdiction’s bankruptcy or insolvency laws. The Funds’ loaned securities were all subject to enforceable Securities Lending Agreements and the value of the collateral was at least equal to the value of the cash received. The amounts of the Funds’ overnight and continuous agreements, which represent the gross amounts of recognized liabilities for securities lending transactions outstanding as of October 31, 2019, are disclosed as “Payable upon return of securities loaned” on the Statements of Assets and Liabilities, where applicable. The Large Cap Growth Insights, Large Cap Value Insights Fund, Small Cap Growth Insights, and U.S. Equity Insights Funds did not have securities on loan as of October 31, 2019.
Both the Funds and GSAL received compensation relating to the lending of the Funds’ securities. The amounts earned by the Funds for the fiscal year ended October 31, 2019, are reported under Investment Income on the Statements of Operations.
The table below details securities lending activity with affiliates of Goldman Sachs:
| For the Fiscal Year Ended October 31, 2019 | Amounts Payable to Goldman Sachs Upon Return of Securities Loaned as of October 31, 2019 | |||||||||||||
| Fund | Earnings of GSAL Relating to Securities Loaned | Amounts Received by the Funds from Lending to Goldman Sachs | ||||||||||||
Large Cap Growth Insights | $ | 506 | $ | 331 | $ | — | ||||||||
Small Cap Equity Insights | 12,158 | 9,831 | — | |||||||||||
Small Cap Growth Insights | 27,151 | 57,907 | — | |||||||||||
Small Cap Value Insights | 1,162 | 1,799 | 371,375 | |||||||||||
U.S. Equity Insights | 29 | 22 | — | |||||||||||
121
GOLDMAN SACHS DOMESTIC EQUITY INSIGHTS FUNDS
Notes to Financial Statements(continued)
October 31, 2019
| 7. SECURITIES LENDING (continued) |
The following table provides information about the Funds’ investments in the Government Money Market Fund for the fiscal year ended October 31, 2019.
| Fund | Beginning value as of October 31, 2018 | Purchases at Cost | Proceeds from Sales | Ending value as of October 31, 2019 | ||||||||||||||
Large Cap Growth Insights | $ | — | $ | 56,046,445 | $ | (56,046,445 | ) | $ | — | |||||||||
Small Cap Equity Insights | 11,340,050 | 76,711,159 | (86,318,984 | ) | 1,732,225 | |||||||||||||
Small Cap Growth Insights | 11,929,725 | 116,930,369 | (128,860,094 | ) | — | |||||||||||||
Small Cap Value Insights | 1,315,150 | 42,010,638 | (41,025,307 | ) | 2,300,481 | |||||||||||||
U.S. Equity Insights | — | 3,182,300 | (3,182,300 | ) | — | |||||||||||||
| 8. TAX INFORMATION |
The tax character of distributions paid during the fiscal year ended October 31, 2019 were as follows:
| Large Cap Growth Insights | Large Cap Value Insights | Small Cap Equity Insights | Small Cap Growth Insights | Small Cap Value Insights | U.S. Equity Insights | |||||||||||||||||||
Distributions paid from: | ||||||||||||||||||||||||
Ordinary Income | $ | 123,336,193 | $ | 28,355,963 | $ | 15,104,381 | $ | 46,614,425 | $ | 10,386,975 | $ | 38,805,040 | ||||||||||||
Net long-term capital gains | 52,936,690 | 4,774,298 | 15,861,672 | 39,004,631 | 12,696,156 | 21,706,757 | ||||||||||||||||||
Total taxable distributions | $ | 176,272,883 | $ | 33,130,261 | $ | 30,966,053 | $ | 85,619,056 | $ | 23,083,131 | $ | 60,511,797 | ||||||||||||
The tax character of distributions paid during the fiscal year ended October 31, 2018 were as follows:
| Large Cap Growth Insights | Large Cap Value Insights | Small Cap Equity Insights | Small Cap Growth Insights | Small Cap Value Insights | U.S. Equity Insights | |||||||||||||||||||
Distributions paid from: | ||||||||||||||||||||||||
Ordinary Income | $ | 78,811,939 | $ | 5,564,328 | $ | 645,213 | $ | 12,880,483 | $ | 8,874,628 | $ | 56,659,399 | ||||||||||||
Netlong-term capital gains | 10,375,229 | — | — | 10,846,090 | 10,055,118 | 9,467,625 | ||||||||||||||||||
Total taxable distributions | $ | 89,187,168 | $ | 5,564,328 | $ | 645,213 | $ | 23,726,573 | $ | 18,929,746 | $ | 66,127,024 | ||||||||||||
122
GOLDMAN SACHS DOMESTIC EQUITY INSIGHTS FUNDS
| 8. TAX INFORMATION (continued) |
As of October 31, 2019, the components of accumulated earnings (losses) on a tax basis were as follows:
| Large Cap Growth Insights | Large Cap Value Insights | Small Cap Equity Insights | Small Cap Growth Insights | Small Cap Value Insights | U.S. Equity Insights | |||||||||||||||||||
Undistributed ordinary income — net | $ | 10,482,381 | $ | 307,662 | $ | 3,083,959 | $ | — | $ | 2,851,828 | $ | 13,897,732 | ||||||||||||
Undistributed long-term capital gains | 66,746,520 | — | — | 14,468,758 | — | — | ||||||||||||||||||
Total undistributed earnings | $ | 77,228,901 | $ | 307,662 | $ | 3,083,959 | $ | 14,468,758 | $ | 2,851,828 | $ | 13,897,732 | ||||||||||||
Capital loss carryforwards: | ||||||||||||||||||||||||
Perpetual Short-Term | $ | — | $ | (4,163,332 | ) | $ | (7,643,446 | ) | $ | — | $ | (2,035,337 | ) | $ | (8,201,432 | ) | ||||||||
Timing differences (Qualified Late Year Loss Deferral) | $ | — | $ | — | $ | — | $ | (801,682 | ) | $ | — | $ | — | |||||||||||
Unrealized gains (losses) — net | 345,432,195 | 22,564,516 | 42,371,663 | 73,036,978 | 30,897,204 | 120,625,643 | ||||||||||||||||||
Total accumulated earnings (losses) — net | $ | 422,661,096 | $ | 18,708,846 | $ | 37,812,176 | $ | 86,704,054 | $ | 31,713,695 | $ | 126,321,943 | ||||||||||||
As of October 31, 2019, the Funds’ aggregate security unrealized gains and losses based on cost for U.S. federal income tax purposes were as follows:
| Large Cap Growth Insights | Large Cap Value Insights | Small Cap Equity Insights | Small Cap Growth Insights | Small Cap Value Insights | U.S. Equity Insights | |||||||||||||||||||
Tax Cost | $ | 1,599,488,379 | $ | 426,441,485 | $ | 651,432,965 | $ | 1,069,633,348 | $ | 530,690,558 | $ | 886,962,536 | ||||||||||||
Gross unrealized gain | 375,306,122 | 32,692,979 | 74,820,131 | 132,793,489 | 54,337,959 | 136,222,812 | ||||||||||||||||||
Gross unrealized loss | (29,873,927 | ) | (10,128,463 | ) | (32,448,468 | ) | (59,756,511 | ) | (23,440,755 | ) | (15,597,169 | ) | ||||||||||||
Net unrealized gain (loss) | $ | 345,432,195 | $ | 22,564,516 | $ | 42,371,663 | $ | 73,036,978 | $ | 30,897,204 | $ | 120,625,643 | ||||||||||||
The difference between GAAP-basis and tax basis unrealized gains (losses) is attributable primarily to wash sales, net mark to market gains (losses) on regulated futures contracts, and differences in the tax treatment of underlying fund investments.
The Small Cap Growth Insights Fund reclassed $321,801 from paid in capital to distributable earnings for the year ending October 31, 2019. In order to present certain components of the Funds’ capital accounts on a tax-basis, certain reclassifications have been recorded to the Funds’ accounts. These reclassifications have no impact on the net asset value of the Funds’ and result primarily from net operating losses and redemptions utilized as distributions.
GSAM has reviewed the Funds’ tax positions for all open tax years (the current and prior three years, as applicable) and has concluded that no provision for income tax is required in the Funds’ financial statements. Such open tax years remain subject to examination and adjustment by tax authorities.
| 9. OTHER RISKS |
The Funds’ risks include, but are not limited to, the following:
Derivatives Risk— The Funds’ use of derivatives may result in loss. Derivative instruments, which may pose risks in addition to and greater than those associated with investing directly in securities, currencies or other instruments, may be illiquid or less liquid, volatile, difficult to price and leveraged so that small changes in the value of the underlying instruments may produce disproportionate losses to the Funds. Derivatives are also subject to counterparty risk, which is the risk that the other party in the transaction will not fulfill its contractual obligation. The use of derivatives is a highly specialized activity that involves investment techniques and risks different from those associated with investments in more traditional securities and instruments. Losses from derivatives can also result from a lack of correlation between changes in the value of derivative instruments and the portfolio assets (if any) being hedged.
123
GOLDMAN SACHS DOMESTIC EQUITY INSIGHTS FUNDS
Notes to Financial Statements(continued)
October 31, 2019
| 9. OTHER RISKS (continued) |
Large Shareholder Transactions Risk— A Fund may experience adverse effects when certain large shareholders, such as other funds, institutional investors (including those trading by use of non-discretionary mathematical formulas), financial intermediaries (who may make investment decisions on behalf of underlying clients and/or include a Fund in their investment model), individuals, accounts and Goldman Sachs affiliates, purchase or redeem large amounts of shares of a Fund. Such large shareholder redemptions, which may occur rapidly or unexpectedly, may cause a Fund to sell portfolio securities at times when it would not otherwise do so, which may negatively impact a Fund’s NAV and liquidity. These transactions may also accelerate the realization of taxable income to shareholders if such sales of investments resulted in gains, and may also increase transaction costs. In addition, a large redemption could result in a Fund’s current expenses being allocated over a smaller asset base, leading to an increase in the Fund’s expense ratio. Similarly, large Fund share purchases may adversely affect a Fund’s performance to the extent that the Fund is delayed in investing new cash or otherwise maintains a larger cash position than it ordinarily would.
Liquidity Risk— A Fund may make investments that are illiquid or that may become less liquid in response to market developments or adverse investor perceptions. Illiquid investments may be more difficult to value. Liquidity risk may also refer to the risk that a Fund will not be able to pay redemption proceeds within the allowable time period or without significant dilution to remaining investors’ interests because of unusual market conditions, an unusually high volume of redemption requests, or other reasons. To meet redemption requests, a Fund may be forced to sell investments at an unfavorable time and/or under unfavorable conditions. If a Fund is forced to sell securities at an unfavorable time and/or under unfavorable conditions, such sales may adversely affect the Fund’s NAV and dilute remaining investors’ interests. Redemptions by large shareholders may have a negative impact on a Fund’s liquidity.
Market and Credit Risks— In the normal course of business, a Fund trades financial instruments and enters into financial transactions where risk of potential loss exists due to changes in the market (market risk). Additionally, a Fund may also be exposed to credit risk in the event that an issuer or guarantor fails to perform or that an institution or entity with which the Fund has unsettled or open transactions defaults.
| 10. INDEMNIFICATIONS |
Under the Trust’s organizational documents, its Trustees, officers, employees and agents are indemnified, to the extent permitted by the Act and state law, against certain liabilities that may arise out of performance of their duties to the Funds. Additionally, in the course of business, the Funds enter into contracts that contain a variety of indemnification clauses. The Funds’ maximum exposure under these arrangements is unknown, as this would involve future claims that may be made against the Funds that have not yet occurred. However, GSAM believes the risk of loss under these arrangements to be remote.
| 11. OTHER MATTERS |
On November 5, 2019, a definitive proxy statement (“proxy”) was filed with the SEC to elect certain Trustees to the Trust. In addition, the proxy includes a proposal to change Large Cap Growth Insights Fund’s sub-classification under the Act from “diversified” to “non-diversified” and to eliminate a related fundamental investment restriction. The Funds will bear their respective share of the proxy, shareholder meeting and other related costs and GSAM has agreed to reimburse each Fund to the extent such expenses exceed a specified percentage of the Fund’s net assets.
| 12. SUBSEQUENT EVENTS |
Subsequent events after the Statements of Assets and Liabilities date other than above have been evaluated, and GSAM has concluded that there is no impact requiring adjustment or disclosure in the financial statements.
124
GOLDMAN SACHS DOMESTIC EQUITY INSIGHTS FUNDS
| 13. SUMMARY OF SHARE TRANSACTIONS |
| Large Cap Growth Insights Fund | ||||||||||||||||
|
| |||||||||||||||
| For the Fiscal Year Ended October 31, 2019 | For the Fiscal Year Ended October 31, 2018 | |||||||||||||||
|
| |||||||||||||||
| Shares | Dollars | Shares | Dollars | |||||||||||||
|
| |||||||||||||||
| Class A Shares | ||||||||||||||||
Shares sold | 2,578,365 | $ | 76,171,954 | 3,361,037 | $ | 107,482,287 | ||||||||||
Reinvestment of distributions | 839,624 | 22,972,444 | 368,877 | 11,027,208 | ||||||||||||
Shares redeemed | (4,081,407 | ) | (121,582,504 | ) | (3,937,732 | ) | (124,940,816 | ) | ||||||||
| (663,418 | ) | (22,438,106 | ) | (207,818 | ) | (6,431,321 | ) | |||||||||
| Class C Shares | ||||||||||||||||
Shares sold | 353,072 | 8,870,934 | 551,666 | 15,661,815 | ||||||||||||
Reinvestment of distributions | 171,082 | 4,147,030 | 93,096 | 2,498,705 | ||||||||||||
Shares redeemed | (1,030,728 | ) | (26,741,128 | ) | (942,395 | ) | (27,571,385 | ) | ||||||||
| (506,574 | ) | (13,723,164 | ) | (297,633 | ) | (9,410,865 | ) | |||||||||
| Institutional Shares | ||||||||||||||||
Shares sold | 8,260,634 | 249,994,999 | 10,276,437 | 339,341,399 | ||||||||||||
Reinvestment of distributions | 2,021,752 | 57,355,849 | 1,221,475 | 37,829,628 | ||||||||||||
Shares redeemed | (12,141,151 | ) | (372,578,159 | ) | (15,012,677 | ) | (476,258,739 | ) | ||||||||
| (1,858,765 | ) | (65,227,311 | ) | (3,514,765 | ) | (99,087,712 | ) | |||||||||
| Service Shares | ||||||||||||||||
Shares sold | 706,347 | 19,913,545 | 568,235 | 17,694,789 | ||||||||||||
Reinvestment of distributions | 158,528 | 4,265,164 | 106,775 | 3,145,083 | ||||||||||||
Shares redeemed | (986,078 | ) | (28,691,006 | ) | (1,180,590 | ) | (36,778,620 | ) | ||||||||
| (121,203 | ) | (4,512,297 | ) | (505,580 | ) | (15,938,748 | ) | |||||||||
| Investor Shares | ||||||||||||||||
Shares sold | 4,093,644 | 116,918,081 | 5,720,505 | 178,464,723 | ||||||||||||
Reinvestment of distributions | 1,328,599 | 35,834,532 | 620,319 | 18,342,393 | ||||||||||||
Shares redeemed | (6,065,761 | ) | (177,715,416 | ) | (4,974,713 | ) | (155,121,933 | ) | ||||||||
| (643,518 | ) | (24,962,803 | ) | 1,366,111 | 41,685,183 | |||||||||||
| Class P Shares(a) | ||||||||||||||||
Shares sold | 457,690 | 13,187,898 | 1,270,391 | 43,135,036 | ||||||||||||
Reinvestment of distributions | 117,890 | 3,340,204 | — | — | ||||||||||||
Shares redeemed | (318,316 | ) | (9,349,058 | ) | (28,029 | ) | (910,748 | ) | ||||||||
| 257,264 | 7,179,044 | 1,242,362 | 42,224,288 | |||||||||||||
| Class R Shares | ||||||||||||||||
Shares sold | 778,072 | 23,164,660 | 284,666 | 8,718,509 | ||||||||||||
Reinvestment of distributions | 24,918 | 665,049 | 14,724 | 429,404 | ||||||||||||
Shares redeemed | (538,455 | ) | (15,874,791 | ) | (446,862 | ) | (14,008,511 | ) | ||||||||
| 264,535 | 7,954,918 | (147,472 | ) | (4,860,598 | ) | |||||||||||
| Class R6 Shares | ||||||||||||||||
Shares sold | 5,501,572 | 166,533,446 | 10,901,755 | 340,045,391 | ||||||||||||
Reinvestment of distributions | 1,076,243 | 30,512,669 | 212,022 | 6,564,340 | ||||||||||||
Shares redeemed | (7,710,537 | ) | (238,369,630 | ) | (4,676,929 | ) | (154,147,174 | ) | ||||||||
| (1,132,722 | ) | (41,323,515 | ) | 6,436,848 | 192,462,557 | |||||||||||
NET INCREASE (DECREASE) | (4,404,401 | ) | $ | (157,053,234 | ) | 4,372,053 | $ | 140,642,784 | ||||||||
| (a) | Class P Shares commenced operations on April 16, 2018. |
125
GOLDMAN SACHS DOMESTIC EQUITY INSIGHTS FUNDS
Notes to Financial Statements(continued)
October 31, 2019
| 13. SUMMARY OF SHARE TRANSACTIONS (continued) |
| Large Cap Value Insights Fund | ||||||||||||||||
|
| |||||||||||||||
| For the Fiscal Year Ended October 31, 2019 | For the Fiscal Year Ended October 31, 2018 | |||||||||||||||
|
| |||||||||||||||
| Shares | Dollars | Shares | Dollars | |||||||||||||
|
| |||||||||||||||
| Class A Shares | ||||||||||||||||
Shares sold | 1,078,518 | $ | 21,990,268 | 944,950 | $ | 20,989,295 | ||||||||||
Reinvestment of distributions | 183,901 | 3,664,612 | 26,778 | 589,565 | ||||||||||||
Shares redeemed | (1,068,564 | ) | (21,978,819 | ) | (1,122,378 | ) | (24,803,667 | ) | ||||||||
| 193,855 | 3,676,061 | (150,650 | ) | (3,224,807 | ) | |||||||||||
| Class C Shares | ||||||||||||||||
Shares sold | 349,252 | 6,992,702 | 213,237 | 4,673,952 | ||||||||||||
Reinvestment of distributions | 30,361 | 597,860 | 1,328 | 28,615 | ||||||||||||
Shares redeemed | (247,041 | ) | (5,052,720 | ) | (253,631 | ) | (5,662,279 | ) | ||||||||
| 132,572 | 2,537,842 | (39,066 | ) | (959,712 | ) | |||||||||||
| Institutional Shares | ||||||||||||||||
Shares sold | 5,286,811 | 107,719,818 | 5,653,415 | 126,316,795 | ||||||||||||
Reinvestment of distributions | 351,295 | 7,006,599 | 85,290 | 1,875,634 | ||||||||||||
Shares redeemed | (5,653,571 | ) | (114,141,291 | ) | (12,519,743 | ) | (265,396,147 | ) | ||||||||
| (15,465 | ) | 585,126 | (6,781,038 | ) | (137,203,718 | ) | ||||||||||
| Service Shares | ||||||||||||||||
Shares sold | 79,120 | 1,644,632 | 175,274 | 3,860,383 | ||||||||||||
Reinvestment of distributions | 29,623 | 591,853 | 3,562 | 78,635 | ||||||||||||
Shares redeemed | (225,687 | ) | (4,695,199 | ) | (106,621 | ) | (2,346,999 | ) | ||||||||
| (116,944 | ) | (2,458,714 | ) | 72,215 | 1,592,019 | |||||||||||
| Investor Shares | ||||||||||||||||
Shares sold | 3,812,155 | 78,553,524 | 2,784,560 | 62,066,119 | ||||||||||||
Reinvestment of distributions | 326,191 | 6,496,411 | 30,036 | 662,248 | ||||||||||||
Shares redeemed | (1,755,954 | ) | (35,924,975 | ) | (294,664 | ) | (6,505,798 | ) | ||||||||
| 2,382,392 | 49,124,960 | 2,519,932 | 56,222,569 | |||||||||||||
| Class P Shares(a) | ||||||||||||||||
Shares sold | 798,187 | 15,252,281 | 1,317,496 | 29,534,295 | ||||||||||||
Reinvestment of distributions | 99,454 | 1,984,309 | 8,680 | 194,354 | ||||||||||||
Shares redeemed | (612,512 | ) | (12,240,790 | ) | (28,624 | ) | (646,944 | ) | ||||||||
| 285,129 | 4,995,800 | 1,297,552 | 29,081,705 | |||||||||||||
| Class R Shares | ||||||||||||||||
Shares sold | 50,087 | 1,018,472 | 133,484 | 2,949,725 | ||||||||||||
Reinvestment of distributions | 17,212 | 340,328 | 1,878 | 41,071 | ||||||||||||
Shares redeemed | (85,122 | ) | (1,731,114 | ) | (122,793 | ) | (2,686,941 | ) | ||||||||
| (17,823 | ) | (372,314 | ) | 12,569 | 303,855 | |||||||||||
| Class R6 Shares | ||||||||||||||||
Shares sold | 3,956,938 | 80,014,855 | 10,968,514 | 230,457,462 | ||||||||||||
Reinvestment of distributions | 492,877 | 9,780,671 | 81,472 | 1,781,476 | ||||||||||||
Shares redeemed | (7,888,267 | ) | (162,215,118 | ) | (4,132,273 | ) | (91,305,986 | ) | ||||||||
| (3,438,452 | ) | (72,419,592 | ) | 6,917,713 | 140,932,952 | |||||||||||
NET DECREASE | (594,736 | ) | $ | (14,330,831 | ) | 3,849,227 | $ | 86,744,863 | ||||||||
| (a) | Class P Shares commenced operations on April 16, 2018. |
126
GOLDMAN SACHS DOMESTIC EQUITY INSIGHTS FUNDS
| 13. SUMMARY OF SHARE TRANSACTIONS (continued) |
| Small Cap Equity Insights Fund | ||||||||||||||||
|
| |||||||||||||||
| For the Fiscal Year Ended October 31, 2019 | For the Fiscal Year Ended October 31, 2018 | |||||||||||||||
|
| |||||||||||||||
| Shares | Dollars | Shares | Dollars | |||||||||||||
|
| |||||||||||||||
| Class A Shares | ||||||||||||||||
Shares sold | 568,989 | $ | 13,714,526 | 970,112 | $ | 27,122,881 | ||||||||||
Reinvestment of distributions | 125,799 | 2,866,956 | — | — | ||||||||||||
Shares redeemed | (761,578 | ) | (18,374,675 | ) | (508,292 | ) | (13,663,277 | ) | ||||||||
| (66,790 | ) | (1,793,193 | ) | 461,820 | 13,459,604 | |||||||||||
| Class C Shares | ||||||||||||||||
Shares sold | 177,041 | 3,568,562 | 173,355 | 4,152,072 | ||||||||||||
Reinvestment of distributions | 23,381 | 455,454 | — | — | ||||||||||||
Shares redeemed | (163,619 | ) | (3,359,695 | ) | (290,102 | ) | (6,958,010 | ) | ||||||||
| 36,803 | 664,321 | (116,747 | ) | (2,805,938 | ) | |||||||||||
| Institutional Shares | ||||||||||||||||
Shares sold | 5,235,766 | 131,485,651 | 8,642,169 | 250,527,303 | ||||||||||||
Reinvestment of distributions | 476,089 | 11,287,686 | 24,305 | 635,825 | ||||||||||||
Shares redeemed | (2,771,991 | ) | (69,865,556 | ) | (9,724,798 | ) | (263,840,664 | ) | ||||||||
| 2,939,864 | 72,907,781 | (1,058,324 | ) | (12,677,536 | ) | |||||||||||
| Service Shares | ||||||||||||||||
Shares sold | 91,926 | 2,205,781 | 56,177 | 1,492,122 | ||||||||||||
Reinvestment of distributions | 4,673 | 104,730 | — | — | ||||||||||||
Shares redeemed | (51,949 | ) | (1,230,710 | ) | (7,503 | ) | (198,971 | ) | ||||||||
| 44,650 | 1,079,801 | 48,674 | 1,293,151 | |||||||||||||
| Investor Shares | ||||||||||||||||
Shares sold | 2,111,112 | 51,466,887 | 1,924,148 | 52,833,323 | ||||||||||||
Reinvestment of distributions | 107,128 | 2,425,323 | 137 | 3,431 | ||||||||||||
Shares redeemed | (1,037,135 | ) | (25,425,896 | ) | (277,612 | ) | (7,549,298 | ) | ||||||||
| 1,181,105 | 28,466,314 | 1,646,673 | 45,287,456 | |||||||||||||
| Class P Shares(a) | ||||||||||||||||
Shares sold | 2,896,062 | 66,645,917 | 2,673,276 | 77,734,314 | ||||||||||||
Reinvestment of distributions | 138,422 | 3,278,915 | — | — | ||||||||||||
Shares redeemed | (1,565,207 | ) | (38,912,996 | ) | (176,899 | ) | (5,010,896 | ) | ||||||||
| 1,469,277 | 31,011,836 | 2,496,377 | 72,723,418 | |||||||||||||
| Class R Shares | ||||||||||||||||
Shares sold | 271,701 | 6,483,888 | 218,831 | 5,749,564 | ||||||||||||
Reinvestment of distributions | 33,918 | 755,025 | — | — | ||||||||||||
Shares redeemed | (223,024 | ) | (5,325,434 | ) | (267,208 | ) | (6,910,330 | ) | ||||||||
| 82,595 | 1,913,479 | (48,377 | ) | (1,160,766 | ) | |||||||||||
| Class R6 Shares | ||||||||||||||||
Shares sold | 4,301,945 | 106,589,803 | 7,353,764 | 194,789,840 | ||||||||||||
Reinvestment of distributions | 399,759 | 9,476,064 | 38 | 999 | ||||||||||||
Shares redeemed | (5,443,120 | ) | (138,390,631 | ) | (899,879 | ) | (25,418,391 | ) | ||||||||
| (741,416 | ) | (22,324,764 | ) | 6,453,923 | 169,372,448 | |||||||||||
NET INCREASE | 4,946,088 | $ | 111,925,575 | 9,884,019 | $ | 285,491,837 | ||||||||||
| (a) | Class P Shares commenced operations on April 16, 2018. |
127
GOLDMAN SACHS DOMESTIC EQUITY INSIGHTS FUNDS
Notes to Financial Statements(continued)
October 31, 2019
| 13. SUMMARY OF SHARE TRANSACTIONS (continued) |
| Small Cap Growth Insights Fund | ||||||||||||||||
|
| |||||||||||||||
| For the Fiscal Year Ended October 31, 2019 | For the Fiscal Year Ended October 31, 2018 | |||||||||||||||
|
| |||||||||||||||
| Shares | Dollars | Shares | Dollars | |||||||||||||
|
| |||||||||||||||
| Class A Shares | ||||||||||||||||
Shares sold | 592,484 | $ | 20,113,595 | 1,051,133 | $ | 41,444,407 | ||||||||||
Reinvestment of distributions | 281,405 | 8,799,530 | 89,749 | 3,166,328 | ||||||||||||
Shares redeemed | (834,841 | ) | (28,043,840 | ) | (893,423 | ) | (34,393,355 | ) | ||||||||
| 39,048 | 869,285 | 247,459 | 10,217,380 | |||||||||||||
| Class C Shares | ||||||||||||||||
Shares sold | 73,157 | 1,836,124 | 89,830 | 2,769,118 | ||||||||||||
Reinvestment of distributions | 44,452 | 1,043,280 | 18,384 | 508,120 | ||||||||||||
Shares redeemed | (82,422 | ) | (2,101,668 | ) | (164,381 | ) | (5,170,324 | ) | ||||||||
| 35,187 | 777,736 | (56,167 | ) | (1,893,086 | ) | |||||||||||
| Institutional Shares | ||||||||||||||||
Shares sold | 3,227,816 | 127,361,435 | 2,753,107 | 125,416,287 | ||||||||||||
Reinvestment of distributions | 718,806 | 26,768,316 | 211,110 | 8,682,959 | ||||||||||||
Shares redeemed | (2,661,680 | ) | (106,449,391 | ) | (2,152,304 | ) | (96,087,410 | ) | ||||||||
| 1,284,942 | 47,680,360 | 811,913 | 38,011,836 | |||||||||||||
| Investor Shares | ||||||||||||||||
Shares sold | 3,840,487 | 134,252,383 | 4,039,136 | 160,587,707 | ||||||||||||
Reinvestment of distributions | 964,429 | 31,016,030 | 228,917 | 8,261,586 | ||||||||||||
Shares redeemed | (2,406,524 | ) | (83,691,568 | ) | (1,333,523 | ) | (53,347,127 | ) | ||||||||
| 2,398,392 | 81,576,845 | 2,934,530 | 115,502,166 | |||||||||||||
| Class P Shares(a) | ||||||||||||||||
Shares sold | 146,086 | 5,834,292 | 253,406 | 12,181,734 | ||||||||||||
Reinvestment of distributions | 20,911 | 778,940 | — | — | ||||||||||||
Shares redeemed | (117,790 | ) | (4,759,537 | ) | (3,791 | ) | (175,264 | ) | ||||||||
| 49,207 | 1,853,695 | 249,615 | 12,006,470 | |||||||||||||
| Class R Shares | ||||||||||||||||
Shares sold | 191,155 | 6,202,346 | 278,260 | 10,388,204 | ||||||||||||
Reinvestment of distributions | 59,954 | 1,798,021 | 13,690 | 466,555 | ||||||||||||
Shares redeemed | (221,227 | ) | (7,312,754 | ) | (75,856 | ) | (2,797,277 | ) | ||||||||
| 29,882 | 687,613 | 216,094 | 8,057,482 | |||||||||||||
| Class R6 Shares | ||||||||||||||||
Shares sold | 6,482,593 | 253,736,476 | 2,135,325 | 99,436,882 | ||||||||||||
Reinvestment of distributions | 378,454 | 14,097,427 | 38,091 | 1,567,068 | ||||||||||||
Shares redeemed | (2,246,884 | ) | (88,998,158 | ) | (437,408 | ) | (20,188,532 | ) | ||||||||
| 4,614,163 | 178,835,745 | 1,736,008 | 80,815,418 | |||||||||||||
NET INCREASE | 8,450,821 | $ | 312,281,279 | 6,139,452 | $ | 262,717,666 | ||||||||||
| (a) | Class P Shares commenced operations on April 16, 2018. |
128
GOLDMAN SACHS DOMESTIC EQUITY INSIGHTS FUNDS
| 13. SUMMARY OF SHARE TRANSACTIONS (continued) |
| Small Cap Value Insights Fund | ||||||||||||||||
|
| |||||||||||||||
| For the Fiscal Year Ended October 31, 2019 | For the Fiscal Year Ended October 31, 2018 | |||||||||||||||
|
| |||||||||||||||
| Shares | Dollars | Shares | Dollars | |||||||||||||
|
| |||||||||||||||
| Class A Shares | ||||||||||||||||
Shares sold | 1,050,768 | $ | 38,541,580 | 676,366 | $ | 31,024,046 | ||||||||||
Reinvestment of distributions | 287,947 | 10,340,127 | 248,444 | 10,399,770 | ||||||||||||
Shares redeemed | (644,168 | ) | (24,334,368 | ) | (477,761 | ) | (21,092,565 | ) | ||||||||
| 694,547 | 24,547,339 | 447,049 | 20,331,251 | |||||||||||||
| Class C Shares | ||||||||||||||||
Shares sold | 127,462 | 3,310,457 | 82,732 | 2,697,118 | ||||||||||||
Reinvestment of distributions | 33,399 | 826,636 | 75,551 | 2,274,846 | ||||||||||||
Shares redeemed | (96,061 | ) | (2,520,272 | ) | (422,522 | ) | (13,954,814 | ) | ||||||||
| 64,800 | 1,616,821 | (264,239 | ) | (8,982,850 | ) | |||||||||||
| Institutional Shares | ||||||||||||||||
Shares sold | 3,054,255 | 151,801,030 | 1,259,092 | 74,483,445 | ||||||||||||
Reinvestment of distributions | 97,074 | 4,698,255 | 84,092 | 4,631,023 | ||||||||||||
Shares redeemed | (649,663 | ) | (32,690,060 | ) | (1,203,243 | ) | (72,387,964 | ) | ||||||||
| 2,501,666 | 123,809,225 | 139,941 | 6,726,504 | |||||||||||||
| Investor Shares | ||||||||||||||||
Shares sold | 1,447,937 | 53,566,402 | 376,564 | 16,973,315 | ||||||||||||
Reinvestment of distributions | 53,407 | 1,907,349 | 14,076 | 587,886 | ||||||||||||
Shares redeemed | (421,221 | ) | (15,930,853 | ) | (81,186 | ) | (3,630,109 | ) | ||||||||
| 1,080,123 | 39,542,898 | 309,454 | 13,931,092 | |||||||||||||
| Class P Shares(a) | ||||||||||||||||
Shares sold | 393,971 | 19,494,828 | 803,810 | 48,953,572 | ||||||||||||
Reinvestment of distributions | 59,484 | 2,877,391 | — | — | ||||||||||||
Shares redeemed | (317,399 | ) | (15,579,917 | ) | (46,846 | ) | (2,765,790 | ) | ||||||||
| 136,056 | 6,792,302 | 756,964 | 46,187,782 | |||||||||||||
| Class R Shares | ||||||||||||||||
Shares sold | 193,683 | 7,197,157 | 36,986 | 1,646,619 | ||||||||||||
Reinvestment of distributions | 4,075 | 143,841 | 1,979 | 81,367 | ||||||||||||
Shares redeemed | (34,966 | ) | (1,291,159 | ) | (18,791 | ) | (811,541 | ) | ||||||||
| 162,792 | 6,049,839 | 20,174 | 916,445 | |||||||||||||
| Class R6 Shares | ||||||||||||||||
Shares sold | 2,033,658 | 99,067,064 | 334,545 | 20,398,238 | ||||||||||||
Reinvestment of distributions | 39,496 | 1,908,993 | 7,394 | 407,268 | ||||||||||||
Shares redeemed | (273,958 | ) | (14,003,900 | ) | (15,248 | ) | (903,149 | ) | ||||||||
| 1,799,196 | 86,972,157 | 326,691 | 19,902,357 | |||||||||||||
NET INCREASE | 6,439,180 | $ | 289,330,581 | 1,736,034 | $ | 99,012,581 | ||||||||||
| (a) | Class P Shares commenced operations on April 16, 2018. |
129
GOLDMAN SACHS DOMESTIC EQUITY INSIGHTS FUNDS
Notes to Financial Statements(continued)
October 31, 2019
| 13. SUMMARY OF SHARE TRANSACTIONS (continued) |
| U.S. Equity Insights Fund | ||||||||||||||||
|
| |||||||||||||||
| For the Fiscal Year Ended October 31, 2019 | For the Fiscal Year Ended October 31, 2018 | |||||||||||||||
|
| |||||||||||||||
| Shares | Dollars | Shares | Dollars | |||||||||||||
|
| |||||||||||||||
| Class A Shares | ||||||||||||||||
Shares sold | 496,152 | $ | 22,850,037 | 949,778 | $ | 46,836,246 | ||||||||||
Reinvestment of distributions | 247,236 | 10,881,031 | 540,991 | 25,388,649 | ||||||||||||
Shares redeemed | (1,018,418 | ) | (47,836,906 | ) | (763,607 | ) | (37,280,302 | ) | ||||||||
| (275,030 | ) | (14,105,838 | ) | 727,162 | 34,944,593 | |||||||||||
| Class C Shares | ||||||||||||||||
Shares sold | 148,922 | 5,994,935 | 114,867 | 5,111,767 | ||||||||||||
Reinvestment of distributions | 13,896 | 548,621 | 65,851 | 2,772,693 | ||||||||||||
Shares redeemed | (136,446 | ) | (5,655,834 | ) | (484,924 | ) | (21,975,139 | ) | ||||||||
| 26,372 | 887,722 | (304,206 | ) | (14,090,679 | ) | |||||||||||
| Institutional Shares | ||||||||||||||||
Shares sold | 5,561,162 | 252,475,763 | 17,672,155 | 930,844,173 | ||||||||||||
Reinvestment of distributions | 755,380 | 34,167,885 | 525,650 | 25,470,196 | ||||||||||||
Shares redeemed | (17,635,422 | ) | (854,571,457 | ) | (5,967,512 | ) | (304,848,649 | ) | ||||||||
| (11,318,880 | ) | (567,927,809 | ) | 12,230,293 | 651,465,720 | |||||||||||
| Service Shares | ||||||||||||||||
Shares sold | 30,525 | 1,372,352 | 69,639 | 3,389,043 | ||||||||||||
Reinvestment of distributions | 4,689 | 205,533 | 13,459 | 628,029 | ||||||||||||
Shares redeemed | (23,962 | ) | (1,120,436 | ) | (94,360 | ) | (4,680,684 | ) | ||||||||
| 11,252 | 457,449 | (11,262 | ) | (663,612 | ) | |||||||||||
| Investor Shares | ||||||||||||||||
Shares sold | 1,320,028 | 60,005,258 | 1,555,878 | 76,579,742 | ||||||||||||
Reinvestment of distributions | 103,871 | 4,499,108 | 97,081 | 4,504,647 | ||||||||||||
Shares redeemed | (1,224,326 | ) | (56,455,932 | ) | (343,857 | ) | (16,669,597 | ) | ||||||||
| 199,573 | 8,048,434 | 1,309,102 | 64,414,792 | |||||||||||||
| Class P Shares(a) | ||||||||||||||||
Shares sold | 2,522,934 | 114,163,961 | 4,283,367 | 218,451,046 | ||||||||||||
Reinvestment of distributions | 135,300 | 6,101,132 | — | — | ||||||||||||
Shares redeemed | (2,371,343 | ) | (113,078,993 | ) | (153,277 | ) | (7,903,827 | ) | ||||||||
| 286,891 | 7,186,100 | 4,130,090 | 210,547,219 | |||||||||||||
| Class R Shares | ||||||||||||||||
Shares sold | 219,851 | 10,041,364 | 394,654 | 18,855,699 | ||||||||||||
Reinvestment of distributions | 38,936 | 1,684,599 | 105,956 | 4,879,525 | ||||||||||||
Shares redeemed | (409,091 | ) | (18,891,773 | ) | (479,608 | ) | (22,869,760 | ) | ||||||||
| (150,304 | ) | (7,165,810 | ) | 21,002 | 865,464 | |||||||||||
| Class R6 Shares | ||||||||||||||||
Shares sold | 189,729 | 8,892,870 | 611,273 | 32,143,497 | ||||||||||||
Reinvestment of distributions | 29,892 | 1,352,886 | 5,619 | 272,129 | ||||||||||||
Shares redeemed | (631,325 | ) | (30,710,320 | ) | (19,119 | ) | (950,920 | ) | ||||||||
| (411,704 | ) | (20,464,564 | ) | 597,773 | 31,464,706 | |||||||||||
NET DECREASE | (11,631,830 | ) | $ | (593,084,316 | ) | 18,699,954 | $ | 978,948,203 | ||||||||
| (a) | Class P Shares commenced operations on April 16, 2018. |
130
Report of Independent Registered Public
Accounting Firm
To the Board of Trustees of
Goldman Sachs Trust and Shareholders of Goldman Sachs Large Cap Growth Insights Fund, Goldman Sachs Large Cap Value Insights Fund, Goldman Sachs Small Cap Equity Insights Fund, Goldman Sachs Small Cap Growth Insights Fund, Goldman Sachs Small Cap Value Insights Fund, and Goldman Sachs U.S. Equity Insights Fund
Opinions on the Financial Statements
We have audited the accompanying statements of assets and liabilities, including the schedules of investments, of Goldman Sachs Large Cap Growth Insights Fund, Goldman Sachs Large Cap Value Insights Fund, Goldman Sachs Small Cap Equity Insights Fund, Goldman Sachs Small Cap Growth Insights Fund, Goldman Sachs Small Cap Value Insights Fund, and Goldman Sachs U.S. Equity Insights Fund (six of the funds constituting Goldman Sachs Trust, hereafter collectively referred to as the “Funds”) as of October 31, 2019, the related statements of operations for the year ended October 31, 2019, the statements of changes in net assets for each of the two years in the period ended October 31, 2019, including the related notes, and the financial highlights for each of the periods indicated therein (collectively referred to as the “financial statements”). In our opinion, the financial statements present fairly, in all material respects, the financial position of each of the Funds as of October 31, 2019, the results of each of their operations for the year then ended, the changes in each of their net assets for each of the two years in the period ended October 31, 2019 and each of the financial highlights for each of the periods indicated therein in conformity with accounting principles generally accepted in the United States of America.
Basis for Opinions
These financial statements are the responsibility of the Funds’ management. Our responsibility is to express an opinion on the Funds’ financial statements based on our audits. We are a public accounting firm registered with the Public Company Accounting Oversight Board (United States) (PCAOB) and are required to be independent with respect to the Funds in accordance with the U.S. federal securities laws and the applicable rules and regulations of the Securities and Exchange Commission and the PCAOB.
We conducted our audits of these financial statements in accordance with the standards of the PCAOB. Those standards require that we plan and perform the audit to obtain reasonable assurance about whether the financial statements are free of material misstatement, whether due to error or fraud.
Our audits included performing procedures to assess the risks of material misstatement of the financial statements, whether due to error or fraud, and performing procedures that respond to those risks. Such procedures included examining, on a test basis, evidence regarding the amounts and disclosures in the financial statements. Our audits also included evaluating the accounting principles used and significant estimates made by management, as well as evaluating the overall presentation of the financial statements. Our procedures included confirmation of securities owned as of October 31, 2019 by correspondence with the custodian, transfer agent and brokers; when replies were not received from brokers, we performed other auditing procedures. We believe that our audits provide a reasonable basis for our opinions.
PricewaterhouseCoopers LLP
Boston, Massachusetts
December 23, 2019
We have served as the auditor of one or more investment companies in the Goldman Sachs fund complex since 2000.
131
GOLDMAN SACHS DOMESTIC EQUITY INSIGHTS FUNDS
Fund Expenses — Six Month Period Ended October 31, 2019 (Unaudited)
As a shareholder of Class A, Class C, Institutional, Service, Investor, Class P, Class R and Class R6 Shares of a Fund, you incur two types of costs: (1) transaction costs, including sales charges on purchase payments (with respect to Class A Shares), contingent deferred sales charges on redemptions (with respect to Class C Shares), and (2) ongoing costs, including management fees; distribution and/or service (12b-1) fees (with respect to Class A, Class C, Service and Class R Shares); and other Fund expenses. This Example is intended to help you understand your ongoing costs (in dollars) of investing in Class A, Class C, Institutional, Service, Investor, Class P, Class R or Class R6 Shares of the Funds and to compare these costs with the ongoing costs of investing in other mutual funds.
The Example is based on an investment of $1,000 invested at the beginning of the period and held for the entire period from May 1, 2019 through October 31, 2019, which represents a period of 184 days in a 365 day year. This projection assumes that annualized expense ratios were in effect during the period.
Actual Expenses — The first line under each share class in the table below provides information about actual account values and actual expenses. You may use the information in this line, together with the amount you invested, to estimate the expenses that you paid over the period. Simply divide your account value by $1,000 (for example, an $8,600 account value divided by $1,000=8.6), then multiply the result by the number in the first line under the heading entitled “Expenses Paid” to estimate the expenses you paid on your account during this period.
Hypothetical Example for Comparison Purposes — The second line under each share class in the table below provides information about hypothetical account values and hypothetical expenses based on the Funds’ actual net expense ratios and an assumed rate of return of 5% per year before expenses, which is not the Funds’ actual return. The hypothetical account values and expenses may not be used to estimate the actual ending account balance or expenses you paid for the period. You may use this information to compare the ongoing costs of investing in the Funds and other funds. To do so, compare this 5% hypothetical example with the 5% hypothetical examples that appear in the shareholder reports of the other funds.
Please note that the expenses shown in the table are meant to highlight your ongoing costs only and do not reflect any transactional costs, such as sales charges, redemption fees, or exchange fees. Therefore, the second line of the table is useful in comparing ongoing costs only, and will not help you determine the relative total costs of owning different funds. In addition, if these transactional costs were included, your costs would have been higher:
| Large Cap Growth Insights Fund | Large Cap Value Insights Fund | Small Cap Equity Insights Fund | Small Cap Growth Insights Fund | |||||||||||||||||||||||||||||||||||||||||||||
| Share Class | Beginning 5/1/19 | Ending Account Value 10/31/19 | Expenses Paid for the 6 months ended 10/31/19* | Beginning 5/1/19 | Ending Account Value 10/31/19 | Expenses Paid for the 6 months ended 10/31/19* | Beginning 5/1/19 | Ending Account Value 10/31/19 | Expenses Paid for the 6 months ended 10/31/19* | Beginning 5/1/19 | Ending Account Value 10/31/19 | Expenses Paid for the 6 months ended 10/31/19* | ||||||||||||||||||||||||||||||||||||
| Class A | ||||||||||||||||||||||||||||||||||||||||||||||||
Actual | $ | 1,000.00 | $ | 1,014.47 | $ | 4.73 | $ | 1,000.00 | $ | 1,001.87 | $ | 4.84 | $ | 1,000.00 | $ | 1,014.25 | $ | 6.30 | $ | 1,000.00 | $ | 1,000.86 | $ | 6.33 | ||||||||||||||||||||||||
Hypothetical 5% return | 1,000.00 | 1,020.51 | + | 4.75 | 1,000.00 | 1,020.37 | + | 4.89 | 1,000.00 | 1,018.95 | + | 6.32 | 1,000.00 | 1,018.88 | + | 6.38 | ||||||||||||||||||||||||||||||||
| Class C | ||||||||||||||||||||||||||||||||||||||||||||||||
Actual | 1,000.00 | 1,010.55 | 8.52 | 1,000.00 | 998.07 | 8.61 | 1,000.00 | 1,010.22 | 10.09 | 1,000.00 | 997.33 | 10.09 | ||||||||||||||||||||||||||||||||||||
Hypothetical 5% return | 1,000.00 | 1,016.73 | + | 8.55 | 1,000.00 | 1,016.59 | + | 8.69 | 1,000.00 | 1,015.17 | + | 10.11 | 1,000.00 | 1,015.10 | + | 10.18 | ||||||||||||||||||||||||||||||||
| Institutional | ||||||||||||||||||||||||||||||||||||||||||||||||
Actual | 1,000.00 | 1,016.44 | 2.79 | 1,000.00 | 1,003.84 | 2.90 | 1,000.00 | 1,015.96 | 4.37 | 1,000.00 | 1,002.87 | 4.40 | ||||||||||||||||||||||||||||||||||||
Hypothetical 5% return | 1,000.00 | 1,022.44 | + | 2.80 | 1,000.00 | 1,022.31 | + | 2.93 | 1,000.00 | 1,020.87 | + | 4.38 | 1,000.00 | 1,020.82 | + | 4.44 | ||||||||||||||||||||||||||||||||
| Service | ||||||||||||||||||||||||||||||||||||||||||||||||
Actual | 1,000.00 | 1,014.06 | 5.32 | 1,000.00 | 1,001.17 | 5.43 | 1,000.00 | 1,013.29 | 6.89 | — | — | — | ||||||||||||||||||||||||||||||||||||
Hypothetical 5% return | 1,000.00 | 1,019.92 | + | 5.34 | 1,000.00 | 1,019.78 | + | 5.48 | 1,000.00 | 1,018.36 | + | 6.91 | — | — | — | |||||||||||||||||||||||||||||||||
| Investor | ||||||||||||||||||||||||||||||||||||||||||||||||
Actual | 1,000.00 | 1,015.66 | 3.47 | 1,000.00 | 1,002.72 | 3.59 | 1,000.00 | 1,015.13 | 5.05 | 1,000.00 | 1,002.22 | 5.08 | ||||||||||||||||||||||||||||||||||||
Hypothetical 5% return | 1,000.00 | 1,021.77 | + | 3.48 | 1,000.00 | 1,021.63 | + | 3.62 | 1,000.00 | 1,020.20 | + | 5.06 | 1,000.00 | 1,020.14 | + | 5.12 | ||||||||||||||||||||||||||||||||
| Class P | ||||||||||||||||||||||||||||||||||||||||||||||||
Actual | 1,000.00 | 1,016.46 | 2.74 | 1,000.00 | 1,003.90 | 2.86 | 1,000.00 | 1,015.96 | 4.31 | 1,000.00 | 1,002.87 | 4.36 | ||||||||||||||||||||||||||||||||||||
Hypothetical 5% return | 1,000.00 | 1,022.48 | + | 2.75 | 1,000.00 | 1,022.35 | + | 2.89 | 1,000.00 | 1,020.93 | + | 4.32 | 1,000.00 | 1,020.86 | + | 4.40 | ||||||||||||||||||||||||||||||||
| Class R | ||||||||||||||||||||||||||||||||||||||||||||||||
Actual | 1,000.00 | 1,013.19 | 6.02 | 1,000.00 | 1,000.58 | 6.10 | 1,000.00 | 1,012.58 | 7.57 | 1,000.00 | 1,000.00 | 7.59 | ||||||||||||||||||||||||||||||||||||
Hypothetical 5% return | 1,000.00 | 1,019.23 | + | 6.04 | 1,000.00 | 1,019.11 | + | 6.15 | 1,000.00 | 1,017.69 | + | 7.59 | 1,000.00 | 1,017.62 | + | 7.65 | ||||||||||||||||||||||||||||||||
| Class R6 | ||||||||||||||||||||||||||||||||||||||||||||||||
Actual | 1,000.00 | 1,016.45 | 2.74 | 1,000.00 | 1,003.84 | 2.86 | 1,000.00 | 1,015.96 | 4.32 | 1,000.00 | 1,002.87 | 4.36 | ||||||||||||||||||||||||||||||||||||
Hypothetical 5% return | 1,000.00 | 1,022.49 | + | 2.75 | 1,000.00 | 1,022.36 | + | 2.88 | 1,000.00 | 1,020.92 | + | 4.33 | 1,000.00 | 1,020.86 | + | 4.39 | ||||||||||||||||||||||||||||||||
| * | Expenses for each share class are calculated using each Fund’s annualized net expense ratio for each class, which represents the ongoing expenses as a percentage of net assets for the six months ended October 31, 2019. Expenses are calculated by multiplying the annualized net expense ratio by the average account value for the period; then multiplying the result by the number of days in the most recent fiscal half year; and then dividing that result by the number of days in the fiscal year. The annualized net expense ratios for the period were as follows: |
132
GOLDMAN SACHS DOMESTIC EQUITY INSIGHTS FUNDS
Fund Expenses — Six Month Period Ended October 31, 2019 (Unaudited) (continued)
| Small Cap Value Insights Fund | U.S. Equity Insights Fund | |||||||||||||||||||||||
| Share Class | Beginning 5/1/19 | Ending Account Value 10/31/19 | Expenses Paid for the 6 months ended 10/31/19* | Beginning 5/1/19 | Ending Account Value 10/31/19 | Expenses Paid for the 6 months ended 10/31/19* | ||||||||||||||||||
| Class A | ||||||||||||||||||||||||
Actual | $ | 1,000.00 | $ | 1,010.70 | $ | 6.52 | $ | 1,000.00 | $ | 1,012.48 | $ | 4.83 | ||||||||||||
Hypothetical 5% return | 1,000.00 | 1,018.72 | + | 6.55 | 1,000.00 | 1,020.41 | + | 4.85 | ||||||||||||||||
| Class C | ||||||||||||||||||||||||
Actual | 1,000.00 | 1,007.02 | 10.31 | 1,000.00 | 1,008.47 | 8.62 | ||||||||||||||||||
Hypothetical 5% return | 1,000.00 | 1,014.93 | + | 10.35 | 1,000.00 | 1,016.62 | + | 8.65 | ||||||||||||||||
| Institutional | ||||||||||||||||||||||||
Actual | 1,000.00 | 1,012.82 | 4.64 | 1,000.00 | 1,014.27 | 2.85 | ||||||||||||||||||
Hypothetical 5% return | 1,000.00 | 1,020.59 | + | 4.66 | 1,000.00 | 1,022.38 | + | 2.86 | ||||||||||||||||
| Service | ||||||||||||||||||||||||
Actual | — | — | — | 1,000.00 | 1,011.72 | 5.42 | ||||||||||||||||||
Hypothetical 5% return | — | — | — | 1,000.00 | 1,019.82 | 5.44 | ||||||||||||||||||
| Investor | ||||||||||||||||||||||||
Actual | 1,000.00 | 1,012.29 | 5.30 | 1,000.00 | 1,013.70 | 3.56 | ||||||||||||||||||
Hypothetical 5% return | 1,000.00 | 1,019.94 | + | 5.32 | 1,000.00 | 1,021.67 | + | 3.58 | ||||||||||||||||
| Class P | ||||||||||||||||||||||||
Actual | 1,000.00 | 1,012.82 | 4.54 | 1,000.00 | 1,014.28 | 2.84 | ||||||||||||||||||
Hypothetical 5% return | 1,000.00 | 1,020.70 | + | 4.55 | 1,000.00 | 1,022.39 | + | 2.85 | ||||||||||||||||
| Class R | ||||||||||||||||||||||||
Actual | 1,000.00 | 1,009.59 | 8.19 | 1,000.00 | 1,011.06 | 6.09 | ||||||||||||||||||
Hypothetical 5% return | 1,000.00 | 1,017.06 | + | 8.22 | 1,000.00 | 1,019.15 | + | 6.12 | ||||||||||||||||
| Class R6 | ||||||||||||||||||||||||
Actual | 1,000.00 | 1,013.01 | 4.59 | 1,000.00 | 1,014.48 | 2.84 | ||||||||||||||||||
Hypothetical 5% return | 1,000.00 | 1,020.65 | + | 4.60 | 1,000.00 | 1,022.39 | + | 2.85 | ||||||||||||||||
| * | Expenses for each share class are calculated using each Fund’s annualized net expense ratio for each class, which represents the ongoing expenses as a percentage of net assets for the six months ended October 31, 2019. Expenses are calculated by multiplying the annualized net expense ratio by the average account value for the period; then multiplying the result by the number of days in the most recent fiscal half year; and then dividing that result by the number of days in the fiscal year. |
| The annualized net expense ratios for the period were as follows: |
| Fund | Class A | Class C | Institutional | Service | Investor | Class P | Class R | Class R6 | ||||||||||||||||||||||||
Large Cap Growth Insights+ | 0.93 | % | 1.68 | % | 0.55 | % | 1.05 | % | 0.68 | % | 0.54 | % | 1.19 | % | 0.54 | % | ||||||||||||||||
Large Cap Value Insights+ | 0.96 | 1.71 | 0.57 | 1.08 | 0.71 | 0.57 | 1.21 | 0.57 | ||||||||||||||||||||||||
Small Cap Equity Insights+ | 1.24 | 1.99 | 0.86 | 1.36 | 0.99 | 0.85 | 1.49 | 0.85 | ||||||||||||||||||||||||
Small Cap Growth Insights+ | 1.25 | 2.00 | 0.87 | — | 1.01 | 0.86 | 1.50 | 0.86 | ||||||||||||||||||||||||
Small Cap Value Insights+ | 1.29 | 2.04 | 0.92 | — | 1.05 | 0.89 | 1.62 | 0.90 | ||||||||||||||||||||||||
U.S. Equity Insights+ | 0.95 | 1.70 | 0.56 | 1.07 | 0.70 | 0.56 | 1.20 | 0.56 | ||||||||||||||||||||||||
| + | Hypothetical expenses are based on each Fund’s actual annualized net expense ratios and an assumed rate of return of 5% per year before expenses. |
133
GOLDMAN SACHS DOMESTIC EQUITY INSIGHTS FUNDS
Statement Regarding Basis for Approval of Management Agreement (Unaudited)
Background
The Goldman Sachs Large Cap Growth Insights Fund, Goldman Sachs Large Cap Value Insights Fund, Goldman Sachs Small Cap Equity Insights Fund, Goldman Sachs Small Cap Growth Insights Fund, Goldman Sachs Small Cap Value Insights Fund, and Goldman Sachs U.S. Equity Insights Fund (the “Funds”) are investment portfolios of Goldman Sachs Trust (the “Trust”). The Board of Trustees oversees the management of the Trust and reviews the investment performance and expenses of the Funds at regularly scheduled meetings held throughout the year. In addition, the Board of Trustees determines annually whether to approve the continuance of the Trust’s investment management agreement (the “Management Agreement”) with Goldman Sachs Asset Management, L.P. (the “Investment Adviser”) on behalf of the Funds.
The Management Agreement was most recently approved for continuation until June 30, 2020 by the Board of Trustees, including those Trustees who are not parties to the Management Agreement or “interested persons” (as defined in the Investment Company Act of 1940, as amended) of any party thereto (the “Independent Trustees”), at a meeting held onJune 11-12, 2019 (the “Annual Meeting”).
The review process undertaken by the Trustees spans the course of the year and culminates with the Annual Meeting. To assist the Trustees in their deliberations, the Trustees have established a Contract Review Committee (the “Committee”), comprised of the Independent Trustees. The Committee held four meetings over the course of the year since the Management Agreement was last approved. At those Committee meetings, regularly scheduled Board or other committee meetings, and/or the Annual Meeting, matters relevant to the renewal of the Management Agreement were considered by the Board, or the Independent Trustees, as applicable. With respect to each Fund, such matters included:
| (a) | the nature and quality of the advisory, administrative, and other services provided to the Fund by the Investment Adviser and its affiliates, including information about: |
| (i) | the structure, staff, and capabilities of the Investment Adviser and its portfolio management teams; |
| (ii) | the groups within the Investment Adviser and its affiliates that support the portfolio management teams or provide other types of necessary services, including fund services groups (e.g., accounting and financial reporting, tax, shareholder services, and operations); controls and risk management groups (e.g., legal, compliance, valuation oversight, credit risk management, internal audit, compliance testing, market risk analysis, finance, and central funding); sales and distribution support groups, and others (e.g., information technology and training); |
| (iii) | trends in employee headcount; |
| (iv) | the Investment Adviser’s financial resources and ability to hire and retain talented personnel and strengthen its operations; and |
| (v) | the parent company’s support of the Investment Adviser and its mutual fund business, as expressed by the firm’s senior management; |
| (b) | information on the investment performance of the Fund, including comparisons to the performance of similar mutual funds, as provided by a third-party mutual fund data provider engaged as part of the contract review process (the “Outside Data Provider”), a benchmark performance index, and (in the case of the Large Cap Growth Insights Fund, Small Cap Growth Insights Fund and U.S. Equity Insights Fund) a composite of accounts with comparable investment strategies managed by the Investment Adviser; and information on general investment outlooks in the markets in which the Fund invests; |
| (c) | information provided by the Investment Adviser indicating the Investment Adviser’s views on whether the Fund’s peer group and/or benchmark index had high, medium, or low relevance given the Fund’s particular investment strategy; |
| (d) | the terms of the Management Agreement and other agreements with affiliated service providers entered into by the Trust on behalf of the Fund; |
| (e) | fee and expense information for the Fund, including: |
| (i) | the relative management fee and expense levels of the Fund as compared to those of comparable funds managed by other advisers, as provided by the Outside Data Provider; |
| (ii) | the Fund’s expense trends over time; and |
| (iii) | to the extent the Investment Adviser manages other types of accounts (such as bank collective trusts, private wealth management accounts, institutional separate accounts,sub-advised mutual funds, andnon-U.S. funds) having investment objectives and policies similar to those of the Fund, comparative information on the advisory fees charged and services provided to those accounts by the Investment Adviser; |
| (f) | with respect to the extensive investment performance and expense comparison data provided by the Outside Data Provider, its processes in producing that data for the Fund; |
| (g) | the undertakings of the Investment Adviser and its affiliates to implement fee waivers and/or expense limitations; |
134
GOLDMAN SACHS DOMESTIC EQUITY INSIGHTS FUNDS
Statement Regarding Basis for Approval of Management Agreement (Unaudited) (continued)
| (h) | information relating to the profitability of the Management Agreement and the transfer agency and distribution and service arrangements of the Fund to the Investment Adviser and its affiliates; |
| (i) | whether the Fund’s existing management fee schedule adequately addressed any economies of scale; |
| (j) | a summary of the“fall-out” benefits derived by the Investment Adviser and its affiliates from their relationships with the Fund, including the fees received by the Investment Adviser’s affiliates from the Fund for transfer agency, securities lending, portfolio trading, distribution and other services; |
| (k) | a summary of potential benefits derived by the Fund as a result of its relationship with the Investment Adviser; |
| (l) | information regarding commissions paid by the Fund and broker oversight, other information regarding portfolio trading, and how the Investment Adviser carries out its duty to seek best execution; |
| (m) | portfolio manager ownership of Fund shares; the manner in which portfolio manager compensation is determined; and the number and types of accounts managed by the portfolio managers; |
| (n) | the nature and quality of the services provided to the Fund by its unaffiliated service providers, and the Investment Adviser’s general oversight and evaluation (including reports on due diligence) of those service providers as part of the administrative services provided under the Management Agreement; and |
| (o) | the Investment Adviser’s processes and policies addressing various types of potential conflicts of interest; its approach to risk management; the annual review of the effectiveness of the Fund’s compliance program; and periodic compliance reports. |
The Trustees also received an overview of the Funds’ distribution arrangements. They received information regarding the Funds’ assets, share purchase and redemption activity, and payment of distribution, service, and shareholder administration fees, as applicable. Information was also provided to the Trustees relating to revenue sharing payments made by and services provided by the Investment Adviser and its affiliates to intermediaries that promote the sale, distribution, and/or servicing of Fund shares. The Independent Trustees also discussed the broad range of other investment choices that are available to Fund investors, including the availability of comparable funds managed by other advisers.
The presentations made at the Board and Committee meetings and at the Annual Meeting encompassed the Funds and other mutual funds for which the Board of Trustees has responsibility. In evaluating the Management Agreement at the Annual Meeting, the Trustees relied upon their knowledge, resulting from their meetings and other interactions throughout the year, of the Investment Adviser and its affiliates, their services, and the Funds. In conjunction with these meetings, the Trustees received written materials and oral presentations on the topics covered, and the Investment Adviser addressed the questions and concerns of the Trustees, including concerns regarding the investment performance of certain of the funds they oversee. The Independent Trustees were advised by their independent legal counsel regarding their responsibilities and other regulatory requirements related to the approval and continuation of mutual fund investment management agreements under applicable law. In addition, the Investment Adviser and its affiliates provided the Independent Trustees with a written response to a formal request for information sent on behalf of the Independent Trustees by their independent legal counsel. During the course of their deliberations, the Independent Trustees met in executive sessions with their independent legal counsel, without representatives of the Investment Adviser or its affiliates present.
Nature, Extent, and Quality of the Services Provided Under the Management Agreement
As part of their review, the Trustees considered the nature, extent, and quality of the services provided to the Funds by the Investment Adviser. In this regard, the Trustees considered both the investment advisory services andnon-advisory services that are provided by the Investment Adviser and its affiliates. The Trustees noted the transition in the leadership and changes in personnel of various of the Investment Adviser’s portfolio management teams that had occurred in recent periods, and the ongoing recruitment efforts aimed at bringing high quality investment talent to the Investment Adviser. They also noted the Investment Adviser’s commitment to maintaining high quality systems and expending substantial resources to respond to ongoing changes to the regulatory and control environment in which the Funds and their service providers operate, as well as the efforts of the Investment Adviser and its affiliates to combat cyber security risks. The Trustees concluded that the Investment Adviser continued to commit substantial financial and operational resources to the Funds and expressed confidence that the Investment Adviser would continue to do so in the future. The Trustees also recognized that the Investment Adviser had made significant commitments to address regulatory compliance requirements applicable to the Funds and the Investment Adviser and its affiliates.
Investment Performance
The Trustees also considered the investment performance of the Funds. In this regard, they compared the investment performance of each Fund to its peers using rankings and ratings compiled by the Outside Data Provider as of December 31, 2018, and updated performance information prepared by the Investment Adviser using the peer group identified by the Outside Data
135
GOLDMAN SACHS DOMESTIC EQUITY INSIGHTS FUNDS
Statement Regarding Basis for Approval of Management Agreement (Unaudited) (continued)
Provider as of March 31, 2019. The information on each Fund’s investment performance was provided for theone-, three-, five-, andten-year periods ending on the applicable dates. The Trustees also reviewed each Fund’s investment performance relative to its performance benchmark. As part of this review, they considered the investment performance trends of the Funds over time, and reviewed the investment performance of each Fund in light of its investment objective and policies and market conditions. The Trustees also received information comparing the Large Cap Growth Insights Fund’s, Small Cap Growth Insights Fund’s and U.S. Equity Insights Fund’s performance to that of composites of accounts with comparable investment strategies managed by the Investment Adviser.
In addition, the Trustees considered materials prepared and presentations made by the Investment Adviser’s senior management and portfolio management personnel in which Fund performance was assessed. The Trustees also considered the Investment Adviser’s periodic reports with respect to the Funds’ risk profiles, and how the Investment Adviser’s approach to risk monitoring and management influences portfolio management. They noted the efforts of the Funds’ portfolio management team to continue to enhance the investment models used in managing the Funds.
The Trustees noted that the Large Cap Growth Insights Fund’s Institutional Shares had placed in the top half of the Fund’s peer group for the five- andten-year periods, in the third quartile for the three-year period and in the fourth quartile for theone-year period, and had underperformed the Fund’s benchmark index for theone-,three-, five-, andten-year periods ended March 31, 2019. They observed that the Large Cap Value Insights Fund’s Institutional Shares had placed in the top half of the Fund’s peer group for the three-, five-, andten-year periods and in the third quartile for theone-year period, and had outperformed the Fund’s benchmark index for the three-, five-, andten-year periods and underperformed for theone-year period ended March 31, 2019. The Trustees noted that the Small Cap Equity Insights Fund’s Institutional Shares had placed in the top half of the Fund’s peer group for theone-, three-, five-, andten-year periods, and had outperformed the Fund’s benchmark index for theone-,five-, andten-year periods and underperformed for the three-year period ended March 31, 2019. They observed that the Small Cap Growth Insights Fund’s Institutional Shares had placed in the top half of the Fund’s peer group for the five- andten-year periods and in the third quartile for theone- and three-year periods, and had outperformed the Fund’s benchmark index for theone-, five-, andten-year periods and underperformed for the three-year period ended March 31, 2019. The Trustees noted that the Small Cap Value Insights Fund’s Institutional Shares had placed in the top half of the Fund’s peer group for theone-, three-, five-, andten-year periods, and had outperformed the Fund’s benchmark index for the three-, five-, andten-year periods and underperformed for theone-year period ended March 31, 2019. They observed that the U.S. Equity Insights Fund’s Institutional Shares had placed in the top half of the Fund’s peer group for the three-, five-, andten-year periods and in the third quartile for theone-year period, and had underperformed the Fund’s benchmark index for theone-, five-, andten-year periods and outperformed for the three-year period ended March 31, 2019.
Costs of Services Provided and Competitive Information
The Trustees considered the contractual terms of the Management Agreement and the fee rates payable by each Fund thereunder. In this regard, the Trustees considered information on the services rendered by the Investment Adviser to the Funds, which included both advisory and administrative services that were directed to the needs and operations of the Funds as registered mutual funds.
In particular, the Trustees reviewed analyses prepared by the Outside Data Provider regarding the expense rankings of the Funds. The analyses provided a comparison of each Fund’s management fee and breakpoints to those of a relevant peer group and category universe; an expense analysis which compared each Fund’s overall net and gross expenses to a peer group and a category universe; and data comparing each Fund’s net expenses to the peer and category medians. The analyses also compared each Fund’s other expenses and fee waivers/reimbursements to those of the peer group and category medians. The Trustees concluded that the comparisons provided by the Outside Data Provider were useful in evaluating the reasonableness of the management fees and total expenses paid by the Funds.
In addition, the Trustees considered the Investment Adviser’s undertakings to implement fee waivers and/or expense limitations. They also considered, to the extent that the Investment Adviser manages other types of accounts having investment objectives and policies similar to those of the Funds, comparative fee information for services provided by the Investment Adviser to those accounts, and information that indicated that services provided to the Funds differed in various significant respects from the services provided to other types of accounts which, in many cases, operated under less stringent legal and regulatory structures, required fewer services from the Investment Adviser to a smaller number of client contact points, and were less time-intensive.
In addition, the Trustees noted that shareholders are able to redeem their Fund shares at any time if shareholders believe that the Fund fees and expenses are too high or if they are dissatisfied with the performance of the Fund.
136
GOLDMAN SACHS DOMESTIC EQUITY INSIGHTS FUNDS
Statement Regarding Basis for Approval of Management Agreement (Unaudited) (continued)
Profitability
The Trustees reviewed each Fund’s contribution to the Investment Adviser’s revenues andpre-tax profit margins. In this regard the Trustees noted that they had received, among other things, profitability analyses and summaries, revenue and expense schedules by Fund and by function (i.e., investment management, transfer agency and distribution and service), and information on the Investment Adviser’s expense allocation methodology. They observed that the profitability and expense figures are substantially similar to those used by the Investment Adviser for many internal purposes, including compensation decisions among various business groups, and are thus subject to a vigorous internal debate about how certain revenue and expenses should be allocated. The Trustees also noted that the internal audit group within the Goldman Sachs organization periodically audits the expense allocation methodology and that the internal audit group was satisfied with the reasonableness, consistency, and accuracy of the Investment Adviser’s expense allocation methodology. Profitability data for each Fund was provided for 2018 and 2017, and the Trustees considered this information in relation to the Investment Adviser’s overall profitability.
Economies of Scale
The Trustees considered the information that had been provided regarding whether there have been economies of scale with respect to the management of the Funds. The Trustees also considered the breakpoints in the fee rate payable under the Management Agreement for each of the Funds at the following annual percentage rates of the average daily net assets of the Funds:
| Average Daily Net Assets | Large Cap Growth Insights Fund | Large Cap Value Insights Fund | Small Cap Equity Insights Fund | Small Cap Growth Insights Fund | Small Cap Value Insights Fund | U.S. Equity Insights Fund | ||||||||||||||||||
| First $1 billion | 0.52 | % | 0.52 | % | 0.80 | % | 0.80 | % | 0.80 | % | 0.52 | % | ||||||||||||
| Next $1 billion | 0.47 | 0.47 | 0.80 | 0.80 | 0.80 | 0.47 | ||||||||||||||||||
| Next $3 billion | 0.44 | 0.44 | 0.72 | 0.72 | 0.72 | 0.44 | ||||||||||||||||||
| Next $3 billion | 0.44 | 0.44 | 0.68 | 0.68 | 0.68 | 0.44 | ||||||||||||||||||
| Over $8 billion | 0.43 | 0.43 | 0.67 | 0.67 | 0.67 | 0.43 | ||||||||||||||||||
The Trustees noted that the breakpoints were designed to share potential economies of scale, if any, with the Funds and their shareholders as assets under management reach those asset levels. The Trustees considered the amounts of assets in the Funds; the Funds’ recent share purchase and redemption activity; the information provided by the Investment Adviser relating to the costs of the services provided by the Investment Adviser and its affiliates and their realized profits; information comparing fee rates charged by the Investment Adviser with fee rates charged to other funds in the peer groups; and the Investment Adviser’s undertaking to limit certain expenses of the Funds that exceed specified levels. Upon reviewing these matters at the Annual Meeting, the Trustees concluded that the fee breakpoints represented a means of assuring that benefits of scalability, if any, would be passed along to shareholders at the specified asset levels. They also noted that the Investment Adviser had passed along savings to shareholders of the Large Cap Growth Insights Fund, which had asset levels above at least the first breakpoint during the prior fiscal year.
Other Benefits to the Investment Adviser and Its Affiliates
The Trustees also considered the other benefits derived by the Investment Adviser and its affiliates from their relationships with the Funds as stated above, including: (a) transfer agency fees received by Goldman Sachs & Co. LLC (“Goldman Sachs”); (b) brokerage and futures commissions earned by Goldman Sachs for executing securities and futures transactions on behalf of the Funds; (c) trading efficiencies resulting from aggregation of orders of the Funds with those for other funds or accounts managed by the Investment Adviser; (d) fees earned by Goldman Sachs Agency Lending (“GSAL”), an affiliate of the Investment Adviser, as securities lending agent (and fees earned by the Investment Adviser for managing the fund in which the Funds’ cash collateral is invested); (e) the Investment Adviser’s ability to leverage the infrastructure designed to service the Funds on behalf of its other clients; (f) the Investment Adviser’s ability to cross-market other products and services to Fund shareholders; (g) Goldman Sachs’ retention of certain fees as Fund Distributor; (h) the Investment Adviser’s ability to negotiate better pricing with custodians on behalf of its other clients, as a result of the relationship with the Funds; and (i) the possibility that the working relationship between the Investment Adviser and the Funds’ third-party service providers may cause those service providers to be more likely to do business with other areas of Goldman Sachs. In the course of considering the foregoing, the Independent Trustees requested and received further information quantifying certain of thesefall-out benefits.
137
GOLDMAN SACHS DOMESTIC EQUITY INSIGHTS FUNDS
Statement Regarding Basis for Approval of Management Agreement (Unaudited) (continued)
Other Benefits to the Funds and Their Shareholders
The Trustees also noted that the Funds receive certain other potential benefits as a result of their relationship with the Investment Adviser, including: (a) trading efficiencies resulting from aggregation of orders of the Funds with those of other funds or accounts managed by the Investment Adviser; (b) enhanced servicing from vendors due to the volume of business generated by the Investment Adviser and its affiliates; (c) enhanced servicing from broker-dealers due to the volume of business generated by the Investment Adviser and its affiliates; (d) the Investment Adviser’s ability to negotiate favorable terms with derivatives counterparties on behalf of the Funds as a result of the size and reputation of the Goldman Sachs organization; (e) the advantages received from the Investment Adviser’s knowledge and experience gained from managing other accounts and products; (f) the Investment Adviser’s ability to hire and retain qualified personnel to provide services to the Funds because of the reputation of the Goldman Sachs organization; (g) the Funds’ access, through the Investment Adviser, to certain firm-wide resources (e.g., proprietary risk management systems and databases), subject to certain restrictions; (h) the Funds’ ability to participate in the securities lending program administered by GSAL, as measured by the revenue received by the Funds in connection with the program; and (i) the Funds’ access to certain affiliated distribution channels. In addition, the Trustees noted the competitive nature of the mutual fund marketplace, and considered that many of the Funds’ shareholders invested in the Funds in part because of the Funds’ relationship with the Investment Adviser and that those shareholders have a general expectation that the relationship will continue.
Conclusion
In connection with their consideration of the Management Agreement, the Trustees gave weight to each of the factors described above, but did not identify any particular factor as controlling their decision. After deliberation and consideration of all of the information provided, including the factors described above, the Trustees concluded, in the exercise of their business judgment, that the management fees paid by each of the Funds were reasonable in light of the services provided to it by the Investment Adviser, the Investment Adviser’s costs and each Fund’s current and reasonably foreseeable asset levels. The Trustees unanimously concluded that the Investment Adviser’s continued management likely would benefit each Fund and its shareholders and that the Management Agreement should be approved and continued with respect to each Fund until June 30, 2020.
138
GOLDMAN SACHS DOMESTIC EQUITY INSIGHTS FUNDS
Trustees and Officers (Unaudited) Independent Trustees
| Name, Address and Age1 | Position(s) Held with the Trust | Term of Office and Length of Time Served2 | Principal Occupation(s) During Past 5 Years | Number of Portfolios in Fund Complex Overseen by Trustee3 | Other Directorships Held by Trustee4 | |||||
Jessica Palmer Age: 70 | Chair of the Board of Trustees | Since 2018 (Trustee since 2007) | Ms. Palmer is retired. She was formerly Director, Emerson Center for the Arts and Culture (2011- 2017); and Consultant, Citigroup Human Resources Department (2007-2008); Managing Director, Citigroup Corporate and Investment Banking (previously, Salomon Smith Barney/ Salomon Brothers) (1984-2006). Ms. Palmer was a Member of the Board of Trustees of Indian Mountain School (private elementary and secondary school)(2004-2009).
Chair of the Board of Trustees — Goldman Sachs Trust and Goldman Sachs Variable Insurance Trust. | 102 | None | |||||
Kathryn A. Cassidy Age: 65 | Trustee | Since 2015 | Ms. Cassidy is retired. Formerly, she was Advisor to the Chairman (May 2014-December 2014); and Senior Vice President and Treasurer (2008-2014), General Electric Company & General Electric Capital Corporation (technology and financial services companies).
Trustee — Goldman Sachs Trust and Goldman Sachs Variable Insurance Trust. | 102 | None | |||||
Diana M. Daniels Age: 70 | Trustee | Since 2007 | Ms. Daniels is retired. Formerly, she was Vice President, General Counsel and Secretary, The Washington Post Company (1991-2006). Ms. Daniels is a Trustee Emeritus and serves as a Presidential Councillor of Cornell University (2013-Present); former Member of the Legal Advisory Board, New York Stock Exchange (2003- 2006) and of the Corporate Advisory Board, Standish Mellon Management Advisors (2006- 2007).
Trustee — Goldman Sachs Trust and Goldman Sachs Variable Insurance Trust. | 102 | None | |||||
Roy W. Templin Age: 59 | Trustee | Since 2013 | Mr. Templin is retired. He is Director, Armstrong World Industries, Inc. (a designer and manufacturer of ceiling, wall and suspension system solutions) (2016-Present); and was formerly Chairman of the Board of Directors, Con- Way Incorporated (a transportation, logistics and supply chain management service company) (2014-2015); Executive Vice President and Chief Financial Officer, Whirlpool Corporation (an appliance manufacturer and marketer) (2004- 2012). Previously, Mr. Templin served as an Advisory Board Member of Goldman Sachs Trust and Goldman Sachs Variable Insurance Trust (June 2013-October 2013).
Trustee — Goldman Sachs Trust and Goldman Sachs Variable Insurance Trust. | 102 | Armstrong World Industries, Inc. (a ceiling, wall and suspension systems solutions manufacturer) | |||||
Gregory G. Weaver Age: 68 | Trustee | Since 2015 | Mr. Weaver is retired. He is Director, Verizon Communications Inc. (2015-Present); and was formerly Chairman and Chief Executive Officer, Deloitte & Touche LLP (a professional services firm) (2001-2005 and 2012-2014); and Member of the Board of Directors, Deloitte & Touche LLP (2006-2012).
Trustee — Goldman Sachs Trust and Goldman Sachs Variable Insurance Trust. | 102 | Verizon Communications Inc. | |||||
139
GOLDMAN SACHS DOMESTIC EQUITY INSIGHTS FUNDS
Trustees and Officers (Unaudited) (continued) Interested Trustee*
| Name, Address and Age1 | Position(s) Held with the Trust | Term of Office and Length of Time Served2 | Principal Occupation(s) During Past 5 Years | Number of Portfolios in Fund Complex Overseen by Trustee3 | Other Directorships Held by Trustee4 | |||||
James A. McNamara Age: 57 | President and Trustee | Since 2007 | Advisory Director, Goldman Sachs (January 2018-Present); Managing Director, Goldman Sachs (January 2000-December 2017); Director of Institutional Fund Sales, GSAM (April 1998- December 2000); and Senior Vice President and Manager, Dreyfus Institutional Service Corporation (January 1993- April 1998).
President and Trustee — Goldman Sachs Trust; Goldman Sachs Variable Insurance Trust; Goldman Sachs Trust II; Goldman Sachs MLP Income Opportunities Fund; Goldman Sachs MLP and Energy Renaissance Fund; and Goldman Sachs ETF Trust. | 162 | None | |||||
Advisory Board Members
| Name, Address, Age1 | Position(s) Held with the Trust | Term of Office and | Principal Occupation(s) During Past 5 Years | Number of Portfolios in Fund Complex Overseen by Advisory Board Member3 | Other Directorships Held by Advisory Board Member4 | |||||
Dwight L. Bush Age: 62 | Advisory Board Member | Since 2019 | Ambassador Bush is President and CEO of D.L. Bush & Associates (a financial advisory and private investment firm) (2002-2014 and 2017-present); and was formerly U.S. Ambassador to the Kingdom of Morocco (2014-2017) and a Member of the Board of Directors of Santander Bank, N.A. (2018-2019).
Advisory Board Member — Goldman Sachs Trust and Goldman Sachs Variable Insurance Trust. | 102 | None | |||||
Joaquin Delgado Age: 59 | Advisory Board Member | Since 2019 | Dr. Delgado is retired. He is Director, Hexion Inc. (a specialty chemical manufacturer) (2019-present); and Director, Stepan Company (a specialty chemical manufacturer) (2011-present); and was formerly Executive Vice President, Consumer Business Group of 3M Company (July 2016-July 2019); and Executive Vice President, Health Care Business Group of 3M Company (October 2012-July 2016).
Advisory Board Member — Goldman Sachs Trust and Goldman Sachs Variable Insurance Trust. | 102 | Stepan Company (a specialty chemical manufacturer) | |||||
| * | Mr. McNamara is considered to be an “Interested Trustee” because he holds positions with Goldman Sachs and owns securities issued by The Goldman Sachs Group, Inc. Mr. McNamara holds comparable positions with certain other companies of which Goldman Sachs, GSAM or an affiliate thereof is the investment adviser, administrator and/or distributor. |
| 1 | Each Trustee and Advisory Board Member may be contacted by writing to the Trustee or Advisory Board Member, c/o Goldman Sachs, 200 West Street, New York, New York, 10282, Attn: Caroline L. Kraus. Information is provided as of October 31, 2019. |
| 2 | Subject to such policies as may be adopted by the Board fromtime-to-time, each Trustee holds office for an indefinite term, until the earliest of: (a) the election of his or her successor; (b) the date the Trustee resigns or is removed by the Board or shareholders, in accordance with the Trust’s Declaration of Trust; or (c) the termination of the Trust. The Board has adopted policies which provide that (a) no Trustee shall hold office for more than 15 years and (b) a Trustee shall retire as of December 31st of the calendar year in which he or she reaches his or her 74th birthday, unless a waiver of such requirement shall have been adopted by a majority of the other Trustees. These policies may be changed by the Trustees without shareholder vote. |
| 3 | The Goldman Sachs Fund Complex includes certain other companies listed above for each respective Trustee. As of October 31, 2019, Goldman Sachs Trust consisted of 89 portfolios (88 of which offered shares to the public); Goldman Sachs Variable Insurance Trust consisted of 13 portfolios; Goldman Sachs Trust II consisted of 19 portfolios (17 of which offered shares to the public); Goldman Sachs MLP Income Opportunities Fund and Goldman Sachs MLP and Energy Renaissance Fund each consisted of one portfolio; and Goldman Sachs ETF Trust consisted of 39 portfolios (21 of which offered shares to the public). |
| 4 | This column includes only directorships of companies required to report to the Securities and Exchange Commission under the Securities Exchange Act of 1934 (i.e., “public companies”) or other investment companies registered under the Act. |
Additional information about the Trustees is available in the Funds’ Statement of Additional Information, which can be obtained from Goldman Sachs free of charge by calling this toll-free number (in the United States of America):1-800-526-7384 (for shareholders of Class A Shares or Class C Shares) or1-800-621-2550 (for shareholders of all other share classes of a Fund). Additional information about the Advisory Board Members will be available in the Funds’ Statement of Additional Information dated February 28, 2020, which will be available from Goldman Sachs free of charge by calling this toll-free number (in the United States of America):1-800-526-7384 (for shareholders of Class A Shares or Class C Shares) or 1-800-621-2550 (for shareholders of all other share classes of a Fund).
140
GOLDMAN SACHS DOMESTIC EQUITY INSIGHTS FUNDS
Trustees and Officers (Unaudited) (continued) Officers of the Trust*
| Name, Address and Age1 | Position(s) Held with the Trust | Term of Office and Length of Time Served2 | Principal Occupation(s) During Past 5 Years | |||
James A. McNamara 200 West Street New York, NY 10282 Age: 57 | Trustee and President | Since 2007 | Advisory Director, Goldman Sachs (January 2018-Present); Managing Director, Goldman Sachs (January 2000-December 2017); Director of Institutional Fund Sales, GSAM (April 1998-December 2000); and Senior Vice President and Manager, Dreyfus Institutional Service Corporation (January 1993-April 1998).
President and Trustee — Goldman Sachs ETF Trust; Goldman Sachs Trust; Goldman Sachs Variable Insurance Trust; Goldman Sachs Trust II; Goldman Sachs MLP Incom Opportunities Fund; and Goldman Sachs MLP and Energy Renaissance Fund. | |||
Caroline L. Kraus 200 West Street New York, NY 10282 Age: 42 | Secretary | Since 2012 | Managing Director, Goldman Sachs (January 2016-Present); Vice President, Goldman Sachs (August 2006-December 2015); Associate General Counsel, Goldman Sachs (2012-Present); Assistant General Counsel, Goldman Sachs (August 2006-December 2011); and Associate, Weil, Gotshal & Manges, LLP (2002-2006).
Secretary — Goldman Sachs ETF Trust; Goldman Sachs Trust (previously Assistant Secretary (2012)); Goldman Sachs Variable Insurance Trust (previously Assistant Secretary (2012)); Goldman Sachs Trust II; Goldman Sachs BDC, Inc.; Goldman Sachs Private Middle Market Credit LLC; Goldman Sachs Middle Market Lending Corp.; Goldman Sachs ML Income Opportunities Fund; and Goldman Sachs MLP and Energy Renaissance Fund. | |||
Joseph F. DiMaria 30 Hudson Street Jersey City, NJ 07302 Age: 51 | Treasurer, Principal Financial Officer and Principal Accounting Officer | Since 2017 (Treasurer and Principal Financial Officer since 2019 | Managing Director, Goldman Sachs (November 2015-Present) and Vice President — Mutual Fund Administration, Columbia Management Investment Advisers, LLC (May 2010-October 2015).
Treasurer, Principal Financial Officer and Principal Accounting Officer — Goldman Sachs ETF Trust (previously Assistant Treasurer (2017)); Goldman Sachs Trust (previously Assistant Treasurer (2016)); Goldman Sachs Variable Insurance Trust (previously Assistant Treasurer (2016)); Goldman Sachs Trust II (previously Assistant Treasurer (2017)); Goldman Sachs MLP Income Opportunities Fund (previously Assistant Treasurer (2017)); and Goldman Sachs MLP and Energy Renaissance Fund (previously Assistant Treasurer (2017)). | |||
| * | Represents a partial list of officers of the Trust. Additional information about all the officers is available in the Funds’ Statement of Additional Information, which can be obtained from Goldman Sachs free of charge by calling this toll-free number (in the United States):1-800-526-7384. |
| 1 | Information is provided as of October 31, 2019. |
| 2 | Officers hold office at the pleasure of the Board of Trustees or until their successors are duly elected and qualified. Each officer holds comparable positions with certain other companies of which Goldman Sachs, GSAM or an affiliate thereof is the investment adviser, administrator and/or distributor. |
Goldman Sachs Trust — Domestic Equity Insights Funds — Tax Information (Unaudited)
For the year ended October 31, 2019, 19.46%, 48.35%, 24.05%, 9.38%, 29.87% and 39.38% of the dividends paid from net investment company taxable income by the Large Cap Growth Insights, Large Cap Value Insights, Small Cap Equity Insights, Small Cap Growth Insights, Small Cap Value Insights, and U.S. Equity Insights Funds, respectively, qualify for the dividends received deduction available to corporations.
For the year ended October 31, 2019, 17.94 %, 30.16%, 23.65%, 9.64%, 26.76% and 40.45% of the dividends paid from net investment company taxable income by the Large Cap Growth Insights, Large Cap Value Insights, Small Cap Equity Insights, Small Cap Growth Insights, Small Cap Value Insights, and U.S. Equity Insights Funds, respectively, qualify for the reduced tax rate under the Jobs and Growth Tax Relief and Reconciliation Act of 2003.
Pursuant to Section 852 of the Internal Revenue Code, the Large Cap Growth Insights, Large Cap Value Insights, Small Cap Equity Insights, Small Cap Growth Insights, Small Cap Value Insights and U.S. Equity Insights Funds designate $52,936,690, $4,774,298, $15,861,672, $39,010,351, $12,696,156 and $21,706,757, respectively, or if different, the maximum amount allowable, as capital gain dividends paid during the fiscal year ended October 31, 2019.
During the fiscal year ended October 31, 2019, the Large Cap Growth Insights, Large Cap Value Insights, Small Cap Equity Insights, Small Cap Growth Insights, Small Cap Value Insights and U.S. Equity Insights Funds designate $111,813,966, $19,900,811, $14,045,986, $46,614,425, $8,863,349 and $28,406,443, respectively, as short-term capital gain dividends pursuant to Section 871(k) of the Internal Revenue Code.
141
FUNDS PROFILE
Goldman Sachs Funds
Goldman Sachs is a premier financial services firm, known since 1869 for creating thoughtful and customized investment solutions in complex global markets.
Today, theConsumer and Investment Management Division of Goldman Sachs serves a diverse set of clients worldwide, including private institutions, public entities and individuals. With approximately $1.60 trillion in assets under supervision as of September 30, 2019, Goldman Sachs Asset Management (“GSAM”) has portfolio management teams located around the world and our investment professionals bring firsthand knowledge of local markets to every investment decision. Assets under supervision includes assets under management and other client assets for which Goldman Sachs does not have full discretion. GSAM leverages the resources of Goldman Sachs & Co. LLC subject to legal, internal and regulatory restrictions.
Money Market
Financial Square FundsSM
| ∎ | Financial Square Treasury Solutions Fund1 |
| ∎ | Financial Square Government Fund1 |
| ∎ | Financial Square Money Market Fund2 |
| ∎ | Financial Square Prime Obligations Fund2 |
| ∎ | Financial Square Treasury Instruments Fund1 |
| ∎ | Financial Square Treasury Obligations Fund1 |
| ∎ | Financial Square Federal Instruments Fund1 |
Investor FundsSM
| ∎ | Investor Money Market Fund3 |
| ∎ | Investor Tax-Exempt Money Market Fund3 |
Fixed Income
Short Duration and Government
| ∎ | Enhanced Income Fund |
| ∎ | High Quality Floating Rate Fund |
| ∎ | Short-Term Conservative Income Fund |
| ∎ | Short Duration Government Fund |
| ∎ | Short Duration Income Fund |
| ∎ | Government Income Fund |
| ∎ | Inflation Protected Securities Fund |
Income Fund
Multi-Sector
| ∎ | Bond Fund |
| ∎ | Core Fixed Income Fund |
| ∎ | Global Income Fund |
| ∎ | Income Fund |
| ∎ | Strategic Income Fund |
Municipal and Tax-Free
| ∎ | High Yield Municipal Fund |
| ∎ | Dynamic Municipal Income Fund |
| ∎ | Municipal Income Completion Fund |
| ∎ | Short Duration Tax-Free Fund |
Single Sector
| ∎ | Investment Grade Credit Fund |
| ∎ | U.S. Mortgages Fund |
| ∎ | High Yield Fund |
| ∎ | High Yield Floating Rate Fund |
| ∎ | Emerging Markets Debt Fund |
| ∎ | Local Emerging Markets Debt Fund |
Fixed Income Alternatives
| ∎ | Long Short Credit Strategies Fund |
Fundamental Equity
| ∎ | Equity Income Fund |
| ∎ | Small Cap Growth Fund |
| ∎ | Small Cap Value Fund |
| ∎ | Small/Mid Cap Value Fund |
| ∎ | Mid Cap Value Fund |
| ∎ | Large Cap Value Fund |
| ∎ | Focused Value Fund |
| ∎ | Capital Growth Fund |
| ∎ | Strategic Growth Fund |
| ∎ | Small/Mid Cap Growth Fund |
| ∎ | Flexible Cap Fund |
| ∎ | Concentrated Growth Fund |
| ∎ | Technology Opportunities Fund |
| ∎ | Growth Opportunities Fund |
| ∎ | Rising Dividend Growth Fund |
| ∎ | Blue Chip Fund |
| ∎ | Income Builder Fund |
Tax-Advantaged Equity
| ∎ | U.S. Tax-Managed Equity Fund |
| ∎ | International Tax-Managed Equity Fund |
| ∎ | U.S. Equity Dividend and Premium Fund |
| ∎ | International Equity Dividend and Premium Fund |
Equity Insights
| ∎ | Small Cap Equity Insights Fund |
| ∎ | U.S. Equity Insights Fund |
| ∎ | Small Cap Growth Insights Fund |
| ∎ | Large Cap Growth Insights Fund |
| ∎ | Large Cap Value Insights Fund |
| ∎ | Small Cap Value Insights Fund |
| ∎ | International Small Cap Insights Fund |
| ∎ | International Equity Insights Fund |
| ∎ | Emerging Markets Equity Insights Fund |
Fundamental Equity International
| ∎ | International Equity Income Fund |
| ∎ | International Equity ESG Fund |
| ∎ | China Equity Fund4 |
| ∎ | Emerging Markets Equity Fund |
| ∎ | Imprint Emerging Markets Opportunities Fund5 |
| ∎ | ESG Emerging Markets Equity Fund |
Alternative
| ∎ | Real Estate Securities Fund |
| ∎ | International Real Estate Securities Fund |
| ∎ | Commodity Strategy Fund |
| ∎ | Global Real Estate Securities Fund |
| ∎ | Alternative Premia Fund |
| ∎ | Absolute Return Tracker Fund |
| ∎ | Managed Futures Strategy Fund |
| ∎ | MLP Energy Infrastructure Fund |
| ∎ | MLP & Energy Fund |
| ∎ | Multi-Manager Alternatives Fund |
| ∎ | Global Infrastructure Fund |
Total Portfolio Solutions
| ∎ | Global Managed Beta Fund |
| ∎ | Multi-Manager Non-Core Fixed Income Fund |
| ∎ | Multi-Manager U.S. Dynamic Equity Fund |
| ∎ | Multi-Manager Global Equity Fund |
| ∎ | Multi-Manager International Equity Fund |
| ∎ | Tactical Tilt Overlay Fund |
| ∎ | Balanced Strategy Portfolio |
| ∎ | Multi-Manager U.S. Small Cap Equity Fund |
| ∎ | Multi-Manager Real Assets Strategy Fund |
| ∎ | Growth and Income Strategy Portfolio |
| ∎ | Growth Strategy Portfolio |
| ∎ | Dynamic Global Equity Fund6 |
| ∎ | Satellite Strategies Portfolio |
| ∎ | Enhanced Dividend Global Equity Portfolio |
| ∎ | Tax-Advantaged Global Equity Portfolio |
| ∎ | Strategic Factor Allocation Fund |
| ∎ | Target Date 2020 Portfolio |
| ∎ | Target Date 2025 Portfolio |
| ∎ | Target Date 2030 Portfolio |
| ∎ | Target Date 2035 Portfolio |
| ∎ | Target Date 2040 Portfolio |
| ∎ | Target Date 2045 Portfolio |
| ∎ | Target Date 2050 Portfolio |
| ∎ | Target Date 2055 Portfolio |
| ∎ | Target Date 2060 Portfolio |
| ∎ | GQG Partners International Opportunities Fund |
| 1 | You could lose money by investing in the Fund. Although the Fund seeks to preserve the value of your investment at $1.00 per share, it cannot guarantee it will do so. An investment in the Fund is not a deposit of a bank and is not insured or guaranteed by the Federal Deposit Insurance Corporation or any other government agency. The Fund’s sponsor has no legal obligation to provide financial support to the Fund, and you should not expect that the sponsor will provide financial support to the Fund at any time. |
| 2 | You could lose money by investing in the Fund. Because the share price of the Fund will fluctuate, when you sell your shares they may be worth more or less than what you originally paid for them. The Fund may impose a fee upon sale of your shares or may temporarily suspend your ability to sell shares if the Fund’s liquidity falls below required minimums because of market conditions or other factors. An investment in the Fund is not a deposit of a bank and is not insured or guaranteed by the Federal Deposit Insurance Corporation or any other government agency. The Fund’s sponsor has no legal obligation to provide financial support to the Fund, and you should not expect that the sponsor will provide financial support to the Fund at any time. |
| 3 | You could lose money by investing in the Fund. Although the Fund seeks to preserve the value of your investment at $1.00 per share, it cannot guarantee it will do so. The Fund may impose a fee upon sale of your shares or may temporarily suspend your ability to sell shares if the Fund’s liquidity falls below required minimums because of market conditions or other factors. An investment in the Fund is not a deposit of a bank and is not insured or guaranteed by the Federal Deposit Insurance Corporation or any other government agency. The Fund’s sponsor has no legal obligation to provide financial support to the Fund, and you should not expect that the sponsor will provide financial support to the Fund at any time. |
| 4 | Effective after the close of business on November 20, 2019, the Goldman Sachs Asia Equity Fund was renamed the Goldman Sachs China Equity Fund. |
| 5 | Effective after the close of business on August 30, 2019, the Goldman Sachs N-11 Equity Fund was renamed the Goldman Sachs Imprint Emerging Markets Opportunities Fund. |
| 6 | Effective after the close of business on February 28, 2019, the Goldman Sachs Equity Growth Strategy Portfolio was renamed the Goldman Sachs Dynamic Global Equity Fund. |
| Financial Square FundsSM and Investor FundsSM are registered service marks of Goldman Sachs & Co. LLC. |
| * | This list covers open-end funds only. Please visit our website at www.GSAMFUNDS.com to learn about our closed-end funds and exchange-traded funds. |
TRUSTEES Jessica Palmer,Chair Kathryn A. Cassidy Diana M. Daniels James A. McNamara Roy W. Templin Gregory G. Weaver | OFFICERS James A. McNamara,President Joseph F. DiMaria,Principal Financial Officer, Principal Accounting Officer and Treasurer Caroline L. Kraus,Secretary | |
GOLDMAN SACHS & CO. LLC Distributor and Transfer Agent | GOLDMAN SACHS ASSET MANAGEMENT, L.P. Investment Adviser | |
Visit our web site atwww.GSAMFUNDS.com to obtain the most recentmonth-end returns.
Goldman Sachs Asset Management, L.P., 200 West Street, New York, New York 10282
The reports concerning the Funds included in this shareholder report may contain certain forward-looking statements about the factors that may affect the performance of the Funds in the future. These statements are based on Fund management’s predictions and expectations concerning certain future events and their expected impact on the Funds, such as performance of the economy as a whole and of specific industry sectors, changes in the levels of interest rates, the impact of developing world events, and other factors that may influence the future performance of the Funds. Management believes these forward-looking statements to be reasonable, although they are inherently uncertain and difficult to predict. Actual events may cause adjustments in portfolio management strategies from those currently expected to be employed.
A description of the policies and procedures that the Funds use to determine how to vote proxies relating to portfolio securities and information regarding how a Fund voted proxies relating to portfolio securities during the most recent12-month period ended June 30 is available (i) without charge, upon request by calling1-800-526-7384 (for Retail Shareholders) or1-800-621-2550 (for Institutional Shareholders); and (ii) on the Securities and Exchange Commission (“SEC”) web site at http://www.sec.gov.
The Funds will file their portfolio holdings for each month in a fiscal quarter within 60 days after the end of the relevant fiscal quarter on Form N-PORT. Portfolio holdings information for the third month of each fiscal quarter will be made available on the SEC’s web site at http://www.sec.gov. Portfolio holdings information may be obtained upon request and without charge by calling1-800-526-7384 (for Retail Shareholders) or1-800-621-2550 (for Institutional Shareholders).
Fund holdings and allocations shown are unaudited, and may not be representative of current or future investments. Fund holdings and allocations may not include the Fund’s entire investment portfolio, which may change at any time. Fund holdings should not be relied on in making investment decisions and should not be construed as research or investment advice regarding particular securities. Current and future holdings are subject to risk.
Economic and market forecasts presented herein reflect our judgment as of the date of this presentation and are subject to change without notice. These forecasts do not take into account the specific investment objectives, restrictions, tax and financial situation or other needs of any specific client. Actual data will vary and may not be reflected here. These forecasts are subject to high levels of uncertainty that may affect actual performance. Accordingly, these forecasts should be viewed as merely representative of a broad range of possible outcomes. These forecasts are estimated, based on assumptions, and are subject to significant revision and may change materially as economic and market conditions change. Goldman Sachs has no obligation to provide updates or changes to these forecasts. Case studies and examples are for illustrative purposes only.
The Global Industry Classification Standard (GICS) was developed by and is the exclusive property and a service mark of Morgan Stanley Capital International Inc. (MSCI) and Standard & Poor’s, a division of The McGraw-Hill Companies, Inc. (S&P) and is licensed for use by Goldman Sachs. Neither MSCI, S&P nor any other party involved in making or compiling the GICS or any GICS classifications makes any express or implied warranties or representations with respect to such standard or classification (or the results to be obtained by the use thereof), and all such parties hereby expressly disclaim all warranties of originality, accuracy, completeness, merchantability or fitness for a particular purpose with respect to any of such standard or classification. Without limiting any of the foregoing, in no event shall MSCI, S&P, any of their affiliates or any third party involved in making or compiling the GICS or any GICS classifications have any liability for any direct, indirect, special, punitive, consequential or any other damages (including lost profits) even if notified of the possibility of such damages.
The portfolio risk management process includes an effort to monitor and manage risk, but does not imply low risk.
This material is not authorized for distribution to prospective investors unless preceded or accompanied by a current prospectus or summary prospectus, if applicable. Investors should consider a Fund’s objective, risks, and charges and expenses, and read the summary prospectus, if available, and/or the prospectus carefully before investing or sending money. The summary prospectus, if available, and the prospectus contain this and other information about a Fund and may be obtained from your authorized dealer or from Goldman Sachs & Co. LLC by calling (retail –1-800-526-7384) (institutional –1-800-621-2550).
© 2019 Goldman Sachs. All rights reserved. 187254-OTU 1103589 DOMINSAR-19
Goldman Sachs Funds

| Annual Report | October 31, 2019 | |||
Fundamental Emerging Markets Equity Funds | ||||
Asia Equity* | ||||
Emerging Markets Equity | ||||
ESG Emerging Markets Equity | ||||
Imprint Emerging Markets Opportunities** | ||||
| * | Effective after the close of business on November 20, 2019, the Goldman Sachs Asia Equity Fund was renamed the Goldman Sachs China Equity Fund. |
| ** | Effective after the close of business on August 30, 2019, The Goldman Sachs N-11 Equity Fund was renamed the Goldman Sachs Imprint Emerging Markets Opportunities Fund. |
It is our intention that beginning on January 1, 2021, paper copies of the Funds’ annual and semi-annual shareholder reports will no longer be sent by mail, unless you specifically request paper copies of the reports from a Fund or from your financial intermediary. Instead, the reports will be made available on a website, and you will be notified by mail each time a report is posted and provided with a website link to access the report.
If you already elected to receive shareholder reports electronically, you will not be affected by this change and you need not take any action. At any time, you may elect to receive reports and certain communications from a Fund electronically by calling the applicable toll-free number below or by contacting your financial intermediary.
You may elect to receive all future shareholder reports in paper free of charge. If you hold shares of a Fund directly with the Fund’s transfer agent, you can inform the transfer agent that you wish to receive paper copies of reports by calling toll-free 800-621-2550 for Institutional, Service, Class R6 and Class P shareholders or 800-526-7384 for all other shareholders. If you hold shares of a Fund through a financial intermediary, please contact your financial intermediary to make this election. Your election to receive reports in paper will apply to all Goldman Sachs Funds held in your account if you invest through your financial intermediary or all Goldman Sachs Funds held with the Funds’ transfer agent if you invest directly with the transfer agent.

Goldman Sachs Fundamental Emerging Markets Equity Funds
| ∎ | ASIA EQUITY |
| ∎ | EMERGING MARKETS EQUITY |
| ∎ | ESG EMERGING MARKETS EQUITY |
| ∎ | IMPRINT EMERGING MARKETS OPPORTUNITIES |
| 1 | ||||
| 2 | ||||
| 5 | ||||
| 28 | ||||
| 39 | ||||
| 43 | ||||
| 43 | ||||
| 49 | ||||
| 56 | ||||
| 62 | ||||
| 68 | ||||
| 84 | ||||
| 85 | ||||
| NOT FDIC-INSURED | May Lose Value | No Bank Guarantee | ||
GOLDMAN SACHS FUNDAMENTAL EMERGING MARKETS EQUITY FUNDS
What Differentiates Goldman Sachs’ Fundamental Emerging Markets Equity Investment Process?
Goldman Sachs’ Fundamental Emerging Markets Equity investment process is based on the belief that strong, consistent results are best achieved through expert stock selection, performed by our dedicated Emerging Markets Team that works together on a global scale. Our deep, diverse and experienced team of research analysts and portfolio managers combines local insights with global, industry-specific expertise to seek to identify its best investment ideas.

| ∎ | The Emerging Markets Equity research team, based in the United States, United Kingdom, Japan, China, Korea, Singapore, Brazil, India and Australia, focuses on long-term business and management quality |
| ∎ | Proprietary, bottom-up research is the key driver of our investment process |
| ∎ | Analysts collaborate regularly to leverage regional and industry-specific research and insights |

| ∎ | Members of each local investment team are aligned by sector and are responsible for finding ideas with the best risk-adjusted upside in their respective areas of coverage |
| ∎ | The decision-making process includes active participation in frequent and regular research meetings |
| ∎ | The Emerging Market Equity team benefits from the country and currency expertise of our Global Emerging Markets Debt and Currency teams |

| ∎ | Security selections are aligned with levels of investment conviction and risk-adjusted upside |
| ∎ | Continual risk monitoring identifies various risks at the stock and portfolio level and assesses whether they are intended and justified |
| ∎ | Dedicated portfolio construction team assists in ongoing monitoring and adjustment of the Funds |

Emerging markets equity portfolios that strive to offer:
| ∎ | Access to markets across emerging markets |
| ∎ | Disciplined approach to stock selection |
| ∎ | Optimal risk/return profiles |
The portfolio risk management process includes an effort to monitor and manage risk, but does not imply low risk.
1
MARKET REVIEW
Goldman Sachs Fundamental Emerging Markets Equity Funds
Emerging markets equities rallied during the12-month period ended October 31, 2019 (the “Reporting Period”). The MSCI Emerging Markets Index (Net, USD, Unhedged) (the “MSCI EM Index”) posted a return of 11.86%.* Emerging markets equities modestly outperformed international developed markets equities on a relative basis, as measured by the MSCI Europe, Australasia, Far East (EAFE) Index, which returned 11.04%* for the same time period.
Following a challenging October 2018, emerging markets equities saw a brief reprieve as the Reporting Period began in November 2018 on dovish comments from U.S. Federal Reserve (“Fed”) Chair Jerome Powell, an accommodative stance by Chinese policymakers toward the private corporate sector and seemingly encouraging progress towardChina-U.S. trade talks. (Dovish language tends to suggest lower interest rates; opposite of hawkish.) However, the relief rally proved short-lived, as investors were unnerved in December 2018 by the arrest of Chinese technology executive, a partial U.S. federal government shutdown and the U.S. President’s criticism of Fed Chair Powell. Equities globally also fell sharply on trade war escalations between the U.S. and China as well as on political uncertainty — and in a delayed response to an earliersell-off in global rates. Though posting negative absolute returns, emerging market equities outperformed their developed markets counterparts on a relative basis both for the month of December and for the fourth calendar quarter overall.
Emerging markets equities recovered during the first quarter of 2019, with the MSCI EM Index gaining 9.92%*, as three major headwinds subsided. First on trade, markets perceived progressing negotiations between the U.S. and China as constructive, decreasing some of the volatility previously caused by tariff uncertainty. Subsequently, China’s equity market regained some of the trade-related losses from the prior calendar year, with the MSCI China Index outperforming the MSCI EM Index by 778 basis pointsyear-to-date through March 2019. (A basis point is 1/100th of a percentage point.) Second, financial conditions became more supportive with the U.S. Fed taking a pause in its interest rate hiking cycle. Third, the economic pulse check, in the form of released macro data, showed emerging market Gross Domestic Product (“GDP”) growth returning to above-trend levels, while some developed markets countries saw their economic growth forecasts revised downward, though symptoms of a possible recession in the U.S. and other developed markets countries remained scarce. The healthy macroeconomic diagnosis for emerging markets generally was complemented by solid fundamentals, as markets expected 2019 earnings for emerging markets equities to grow more than twice as much as in the U.S.1 Despite the broader recovery, investors remained cautious around Indian equities, with general elections scheduled to commence in April 2019. Investors also remained cautious around Turkish markets, which were rattled by the overall economic downturn and by municipal elections at the end of March 2019.
The MSCI EM Index gained 0.61% in the second quarter of 2019, bringing totalyear-to-date returns to 10.58%*. Emerging markets equities were supported by the U.S. Fed signaling a dovish outlook for the rest of the calendar year. Emerging markets equities also recovered in June 2019 from a sharp decline in May, while awaiting U.S.-China trade talks to reconvene at the G20 Summit. (The G20 (or Group of Twenty) is an international forum for the governments and central bank governors from 19 countries and the European Union. Its aim is to discuss policy pertaining to the promotion of international financial stability.) Negotiations had been halted in May 2019 following the increase of tariffs from 10% to 25% on $200 billion of Chinese goods by the U.S. This degradation of trade talks contributed to a volatile May 2019, wherein the MSCI EM Index declined 7.26%.* On June 18, 2019, the U.S. President announced that he and President Xi of China would be meeting on the sidelines of the G20 Summit in Osaka, Japan on June 29th to discuss the ongoing trade impasse, resulting in an immediate positive market reaction. The result was both sides agreeing to restart negotiations, and the U.S. agreeing to put plans for additional tariffs of 25% on all remaining imports from China on an indefinite hold. In an additional positive surprise, the U.S. agreed to lift restrictions it had put in place on Chinese technology firm Huawei, allowing it to purchase equipmentnon-threatening to U.S. national security from U.S. firms. The outcome of the G20 Summit was similar to that of the one held in Buenos Aires in 2018, which led to a temporary truce in trade tensions and a delay in raising tariffs.
The MSCI EM Index rose 1.91% in September 2019 but returned-4.25%* for the third quarter of 2019. Emerging markets equities started the third quarter on a soft note, as in July 2019, despite their meeting in Shanghai, the U.S. and Chinese Presidents were unable to make any forward steps toward a trade deal. Emerging markets equities remained under pressure in August 2019, as the
| *All | index returns are expressed in U.S. dollar terms. |
| 1 | Source: IBES via DataStream, as of March 29, 2019. |
2
MARKET REVIEW
U.S. President announced a new round of tariffs on another $300 billion of Chinese goods, and China announced retaliatory tariffs on $75 billion of U.S. goods. Emerging markets equities then surged in September 2019, as optimism rose that both sides might soon be able to reach an agreement. Both countries exempted tariffs on the other throughout the month, with the U.S. also agreeing to delay its increase on $250 billion of Chinese imports. The Chinese equity market was able to eke out a modest increase in September, despite concerns of potential investment restrictions on the country. In line with market expectations, the U.S. Fed cut interest rates by 25 basis points in both July and September 2019 — its first interest rate cuts since 2008 — although the consensus forecasted no further interest rate cuts in 2019. South Korea was the main driver of emerging markets equities’ performance in September, as it saw benefits from the drawdown in trade tensions. August was a strenuous month for India, as economic growth there slowed to asix-year low. In response, on September 20, 2019, India’s Finance Minister announced a surprise corporate tax rate cut—from the base rate of 30% to the new base rate of 22%. This announcement came as part of a series of measures undertaken by the Indian government to boost its economy and employment and to revive investor sentiment. This tax cut helped India’s equity market to gain in September 2019.
The MSCI EM Index rose 4.22% in October 2019, bringing totalyear-to-date returns to 10.35%*. Emerging markets equities benefited from seeming trade talk progress made between the U.S. and China during the month, as markets were then expecting some sort of official interim deal between the two parties in the foreseeable future. These expectations stemmed from an October 11, 2019 meeting in which the two sides reached a proposed “Phase One” deal, including China purchasing $40 to $50 billion of U.S. agricultural products annually and issuing new guidelines on how it manages its currency. Additionally, the U.S. announced it would further delay a tariff increase of 30% on $250 billion of Chinese goods. Indian equities continued their solid performance during the month, largely driven by continued economic momentum and earnings upgrades following its September corporate tax rate cut. At the end of October, the U.S. Fed once again cut interest rates by 25 basis points, but it signaled a pause in its latest interest rate cutting cycle for the near term. Brazil also continued its monetary policy easing cycle, as it cut its interest rates for a third straight meeting following the passing of new pension reform that led to heightened hopes of a recovery for the country’s sluggish economy amid low inflation.
For the Reporting Period as a whole, information technology, consumer discretionary and real estate were the strongest sectors in the MSCI EM Index. Materials and health care were the only two sectors in the MSCI EM Index to post negative absolute returns during the Reporting Period.
From a country perspective, Russia was the best performing individual constituent of the MSCI EM Index for the Reporting Period, followed by Egypt, Greece, Taiwan, the Philippines and Indonesia, each of which posted a robust double-digit absolute gain. Conversely, Argentina was by far the weakest individual country constituent of the MSCI EM Index, followed by Pakistan, Chile and Saudi Arabia, each of which posted a double-digit decline during the Reporting Period.
Looking Ahead
Year-to-date through October 2019, emerging markets equities experienced a volatile but strong rally, in stark contrast to a challenging 2018. The reversal trickled down to the underlying drivers as well, with a rebound in price/earnings ratios founded on improving market sentiment driving most of the returns. Still, earnings trends disappointed overall. Looking through the noise of the volatility, our view of emerging markets equities and their secular growth drivers remained constructive at the end of the Reporting Period, driven by two primary factors. (Noise refers to information or activity that confuses or misrepresents genuine underlying trends.)
First, with corporate earnings growth expected by the consensus to return to double-digit rates, well above developed markets estimates, the fundamental outlook for emerging markets equities remained intact at the end of the Reporting Period and underpinned our expectation for healthy growth over the medium- and long-term. Over any given period of six to 12 months, returns can often be dictated by market sentiment, i.e. multiplere-ratings. (When the market changes its view of a company, industry or sector sufficiently to make calculation ratios, such as price/earnings ratios, substantially higher or lower, this is a multiplere-rating.) However, over the long term, fundamentals are responsible for approximately 70% of total returns for emerging
| * | All index returns are expressed in U.S. dollar terms. |
3
MARKET REVIEW
markets equity investors. In 2019,year-to-date through October, earnings detracted from total returns — compared to the 11% positive contribution in 2018 — and, albeit improving, were not expected by the consensus to turn around substantially during the remainder of the calendar year. Given ongoing trade tensions, the information technology sector was expected by many analysts to decline the most in 2019, which, in turn, hurts countries such as South Korea and Taiwan. On the other hand, countries with a domestically-facing earnings profile remained in healthy growth territory at the end of the Reporting Period. Indeed, earnings in India and Brazil were rebounding, illustrating there are bright spots across the investment opportunity set, even in the near term.
Second, from a macroeconomic perspective, secular growth drivers remained in place at the end of the Reporting Period, in our view, as GDP growth in emerging markets countries continued to outpace that of developing markets countries. Analysts expect emerging markets countries to contribute approximately 70% of global economic growth in 2019 and to further expand their share in the years to come. We believe China’s economy will continue to grow at approximately a 5% to 6% rate, with the next leg of its growth being underpinned by the rise of its middle class, increased spending from the millennial generation and the opening up of its financial markets. Investor concerns around the impact of a hawkish U.S. Fed have dissipated in 2019, and accommodative domestic monetary policy should provide some short-term support to emerging markets equities. Additionally, it is important to note that emerging markets countries overall are in a different phase of the economic cycle than are developed markets countries. Emerging markets equities have proven resilient in prior episodes of the late-economic cycle woes in developed markets countries — on average, outperforming the U.S. equity market during asell-off, especially when both regions enter the drawdown undergoing different phases of their respective economic cycles.
Investor concerns around trade war implication on China and other emerging markets countries were responsible for most of the equity market volatility in 2019year-to-date through the end of October, and any further escalation orde-escalation would likely continue to move markets over the near term. Regardless of the outcome of the current negotiations, we believe the diversity of the Funds’ investment universes, or opportunity sets, may well be helpful in mitigating the potential effects of any such volatility ahead, as gradual adjustment to global supply chains are likely, in our view, to favor some countries over others. Finally, despite theyear-to-datere-rating, valuations remained attractive overall at the end of the Reporting Period, in our opinion. Emerging markets equities as a whole were trading at the end of the Reporting Period at a meaningful discount to developed markets equities and below their own long-term average. With earnings expected by the consensus to revert to double-digit growth rates and the macroeconomic outlook remaining rather healthy, we see this as a potentially interesting entry-point to a multi-year growth story for emerging markets equities.
As always, we maintain our focus on seeking high-quality equity investments trading at compelling valuations and intend to stay true to our long-term discipline as we seek to achieve long-term capital appreciation and navigate potentially volatile markets ahead.
| * | All index returns are expressed in U.S. dollar terms. |
4
PORTFOLIO RESULTS
Goldman Sachs Asia Equity Fund
Investment Objective
The Fund seeks long-term capital appreciation.
Portfolio Management Discussion and Analysis
Below, the Goldman Sachs Fundamental Asia ex Japan Equity Portfolio Management Team discusses the Goldman Sachs Asia Equity Fund’s (the “Fund”) performance and positioning for the12-month period ended October 31, 2019 (the “Reporting Period”).
| Q | How did the Fund perform during the Reporting Period? |
| A | During the Reporting Period, the Fund’s Class A, Class C, Institutional, Investor, Class P and Class R6 Shares generated average annual total returns, without sales charges, of 19.54%, 18.66%, 19.98% 19.86%, 19.98% and 19.96%, respectively. These returns compare to the 13.24% average annual total return of the Fund’s benchmark, the MSCI All Country Asiaex-Japan Index (Net, USD, Unhedged) (the “Index”), during the same time period. |
| Q | What key factors were responsible for the Fund’s performance during the Reporting Period? |
| A | The Fund outperformed the Index on a relative basis during the Reporting Period, primarily attributable to individual stock selection. From a country perspective, stock selection in China/Hong Kong, Taiwan and India contributed most positively to the Fund’s relative results. Only partially offsetting these positive contributors was stock selection in the Philippines and South Korea, which detracted from the Fund’s relative results most. Having a position, albeit modest, in cash also dampened relative results during a Reporting Period when the Index posted a double-digit positive return. |
| Q | What were some of the Fund’s best-performing individual stocks? |
| A | The Fund benefited most relative to the Index from holdings in Kweichow Moutai, AIA Group and Anta Sports Products. |
Within the consumer staples sector, the Fund’s overweight position in Kweichow Moutai was the strongest positive contributor to relative results. Kweichow Moutai is the largest Chinese hard liquor maker positioned at the premium end of the market. Its stock outperformed the Index during the Reporting Period, as the company reported a strong set of results, demonstrating its resilience during the economic slowdown in China. The company also capitalized on its strong product and brand value to improve its margins during its channel restructuring. At the end of the Reporting Period, we maintained the Fund’s overweight position in the stock, as we believed demand for the company’s flagship products remained strong. |
AIA Group is a Hong Kong-based insurance and financial services company. We maintained an overweight position in the Fund in AIA Group because of what we saw as its well diversified Asian footprint and strong distribution network and management. During the Reporting Period, its onshore China business showed sustained growth momentum with a premium agent model targetinghigh-end customers. In our view, its growth opportunity was enhanced by its rather recent opening of additional China provinces for the firm. Further, its cross-border business between Hong Kong and Southeast Asia local businesses showed improvement, in our opinion, with an expanded distribution network and better margins, reinforcing its positive earnings and value creation outlook for the medium term. The company delivered strong results during the Reporting Period, driven by what investors saw as its solid fundamentals. |
The Fund’s overweight position in Anta Sports Products also contributed positively to relative results. Anta Sports Products is a branded sportswear company in China, mainly marketing its products under the Anta brand, which has a “value for the money” proposition. During the Reporting Period, Anta Sports Products outperformed the Index, as the company delivered better than market expected annual and quarterly results, including strongtop-line growth, mainly driven by its Fila brand. The company continued to operate as a multi-brand omni-channel operator with what we saw as solid execution. At the end of the Reporting Period, we believed the company maintained strong branding power, |
5
PORTFOLIO RESULTS
and we expected it to continue to grow on the back of growth in the sportswear market overall and market share gains from smaller unbranded companies. |
| Q | Which stocks detracted significantly from the Fund’s performance during the Reporting Period? |
| A | Detracting most from the Fund’s results relative to the Index were positions in Hankook Tire & Technology, LG Chem and Geely Automobile Holdings. |
The Fund’s overweight position in Hankook Tire & Technology detracted most from its relative results during the Reporting Period. Hankook Tire & Technology, based in South Korea, is one of the world’s largest manufacturers of tires, selling close to 100 million tires annually. Its stock underperformed the Index during the Reporting Period overall due to lower than market expected quarterly results, driven by weak global auto demand. However, toward the end of the Reporting Period, its most recent quarterly results showed improvement, resulting in a stock price rebound. At the end of the Reporting Period, we maintained the Fund’s position in Hankook Tire & Technology and expected the company to benefit from benign raw material prices, margin improvement and new capacity stabilization. |
Within the materials sector, the Fund’s overweight position in LG Chem, a South Korea-based chemicals manufacturer, detracted from relative results during the Reporting Period. The company’s battery business experienced some slowdown due to a ramp up of its production facilities, and its management announced its company-anticipated recovery would likely be delayed. Its stock performance was also weighed upon by the fact that yields at the company’s European plant were slow to improve following a rapid capacity expansion, coupled with lackluster sales and a persistent cost burden. At the end of the Reporting Period, we maintained the Fund’s position in LG Chem, as, along with recovery of its battery business, we expect its European plant to achieve its target yield by early 2020. |
The Fund’s overweight position in Geely Automobile Holdings, a China-based passenger vehicle manufacturer, detracted from relative results during the Reporting Period. The company had a mixed year in 2018, when after strong momentum in the first half of the calendar year, it demonstrated signs of vulnerability. We opted to exit the Fund’s position in Geely Automobile Holdings during the first half of the Reporting Period to allocate the proceeds to positions with what we considered to be more attractive risk-return profiles. |
| Q | Which equity market sectors most significantly affected Fund performance during the Reporting Period? |
| A | The sectors that contributed most positively to the Fund’s performance relative to the Index were financials, consumer staples and information technology, where stock selection in each boosted relative results. At an individual stock level, positions in AIA Group and Kweichow Moutai, each mentioned earlier, boosted results most in financials and consumer staples, respectively. In information technology, having no exposure to Baidu, a China-based Internet search engine, helped most, as its stock performed poorly during the Reporting Period. We had sold the Fund’s position in Baidu during the first quarter of 2018 due to our concerns about its business outlook. During the Reporting Period, the company was losing market share in the online advertising market given heightened competition. |
Only two sectors detracted from the Fund’s relative results during the Reporting Period — consumer discretionary and real estate. In consumer discretionary, the Fund’s position in Hankook Tire & Technology, mentioned earlier, detracted most. In real estate, having a significant underweight to this strongly performing sector dampened relative results most. China/Hong Kong real estate securities comprise the vast majority of the overall average 5.9% weight of the sector in the Index. During much of the second half of 2018, the Chinese property sector was under pressure as a result of a sales slowdown amongtier-two to tier-four cities in China following months of tighter credit and slower economic momentum. Also, during the first two months of 2019, especially in January and during the festive Chinese New Year season, housing sales had been on the weaker side for the overall industry. However, the broader China/Hong Kong-listed real estate companies performed stronger thereafter given widely anticipated and then some actual alleviation of the U.S.-China trade war, fiscal and credit stimulus by the Chinese government and pockets of policy loosening in the country, including a mortgage rate cut by a small number of Chinese banks in select cities. |
| Q | How did the Fund use derivatives and similar instruments during the Reporting Period? |
| A | The Fund did not use derivatives or similar instruments during the Reporting Period. |
6
PORTFOLIO RESULTS
| Q | Did the Fund make any significant purchases or sales during the Reporting Period? |
| A | During the Reporting Period, we initiated a Fund position in Axis Bank within the financials sector. Axis Bank is the third largest private bank in India in terms of loans and profitability but had been struggling due to corporate loan quality issues, with its earnings being impacted by loan loss provisions. (A loan loss provision is an expense set aside as an allowance for uncollected loans and loan payments. This provision is used to cover a number of factors associated with potential loan losses, including bad loans, customer defaults, and renegotiated terms of a loan that incur lower than previously estimated payments.) We established the Fund position based on our expectations for the asset quality cycle to bottom out and for management changes at the bank in the near term. We also viewed Axis Bank as a strong liability franchise trading at what we considered to be attractive valuations. Since the Fund’s purchase of its stock, the company has reported sharp improvement across profitability metrics as part of its quarterly results, along with strong growth in fee income. |
We added to the Fund’s position in auto manufacturer Maruti Suzuki India within the consumer discretionary sector. The company had reported weak quarterly results in July 2019 on the back of what proved to be an industry-wide temporary slowdown in auto sales volume, which led to its stock price correction. Subsequently, its stock outperformed the Index, along with a broad industry recovery, as India’s finance minister announced a series of measures to boost the country’s economy. At the end of the Reporting Period, we maintained our conviction in the company, as we expected its market share to grow, driven by a cooling down of input prices, a better product mix and improving demand for its products. |
Conversely, in addition to those sales already mentioned, we eliminated the Fund’s position in Bursa Malaysia within the financials sector. Bursa Malaysia is a holding company operating a fully integrated stock exchange in Malaysia. Its business model is heavily reliant on the securities trading business, from which the company derives approximately 50% of its revenue. We exited the Fund’s position in the company due to our weak outlook for the securities and derivatives business. |
We exited the Fund’s position in China Petroleum and Chemical (“Sinopec”) within the energy sector. Sinopec is one of the largest integrated oil companies in China. We sold the position based on our concerns related to rising competition in its marketing and refining segments from independent refineries. Further, we expected its management guidance for an increase in capital expenditures to potentially be a drag on Sinopec’s return on capital and reduce its dividend payout capability. |
| Q | Were there any notable changes in the Fund’s weightings during the Reporting Period? |
| A | Most sector weights are usually established within a relatively narrow range from the Index, as our team prefers to make decisions at the individual stock level, where we believe we can generate more added value. That said, during the Reporting Period, relative to the Index, the Fund’s exposure to financials and communication services increased, and its allocations to consumer discretionary and energy decreased. |
Similarly, allocations to countries are directly the result of various stock selection decisions. During the Reporting Period, relative to the Index, the Fund’s allocations to India, Taiwan, Indonesia and China/Hong Kong increased, and its exposures to South Korea and Thailand decreased. |
| Q | Were there any changes to the Fund’s portfolio management team during the Reporting Period? |
| A | Kevin Ohn, managing director and portfolio manager for the Fund since 2013 retired from the firm at the end of March 2019. Basak Yavuz and Hiren Dasani,co-heads of Emerging Markets Equity, and Sumit Mangal, vice president on the Emerging Markets Equity team, assumed Kevin’s portfolio management responsibilities for the Fund effective the same date. Basak and Hiren have deep expertise investing across the emerging market equities universe, with 19 and 18 years of industry experience, respectively. Sumit has 14 years of industry experience. Additionally, Seong Kook Jung had been a portfolio manager for the Fund since 2016. Effective March 31, 2019, he no longer had portfolio management responsibilities for the Fund, and he subsequently left the firm in September 2019. |
| Q | How was the Fund positioned relative to the Index at the end of the Reporting Period? |
At the end of the Reporting Period, the Fund had overweighted exposure to India and held anout-of-Index allocation in Vietnam. On the same date, the Fund had underweighted exposure relative to the Index to Taiwan, China/Hong Kong and Malaysia. The Fund was rather neutrally weighted relative to the Index in Indonesia, South Korea, Singapore, the Philippines and Thailand and had no exposure to Pakistan at the end of the Reporting Period. |
7
PORTFOLIO RESULTS
From a sector allocation perspective, the Fund had overweighted positions relative to the Index in the consumer discretionary, financials, health care and information technology at the end of the Reporting Period. On the same date, the Fund had underweighted positions compared to the Index in the real estate sector and was relatively neutrally weighted compared to the Index in consumer staples, materials, communication services and industrials. The Fund had no exposure to the utilities or energy sectors at the end of the Reporting Period. |
As always, we remained focused on individual stock selection, with sector and country positioning being a secondary, closely-monitored effect. |
| Upon the recommendation of Goldman Sachs Asset Management, L.P., the Board of Trustees of the Goldman Sachs Trust approved, in early September 2019, certain changes to the Fund’s name, principal investment strategy and benchmark. The Fund’s current investment objective to seek long-term capital appreciation did not change. Effective after the close of business on November 20, 2019, the Fund’s name changed to the Goldman Sachs China Equity Fund, and the Fund invests, under normal circumstances, at least 80% of its net assets plus any borrowings for investment purposes (measured at the time of purchase) in a diversified portfolio of equity investments in issuers economically tied to China. The Fund expects to invest primarily in common stocks, but may also invest in preferred stocks, securities convertible into common or preferred stocks, and depositary receipts. This may include securities that trade in local Chinese, Hong Kong or other foreign exchanges and securities that trade in renminbi, the official currency of China. |
| The Fund’s benchmark changed from the MSCI All Country Asiaex-Japan Index (Net, USD, Unhedged) to the MSCI China All Shares Index (Net, USD, Unhedged). |
| In light of these changes, Shao Ping Guan, Vice President, and Christine Pu, CFA, Vice President, became portfolio managers for the Fund. Basak Yavuz, CFA, Managing Director, and Hiren Dasani, CFA, Managing Director, also continue to manage the Fund. Sumit Mangal no longer serves as a portfolio manager for the Fund. |
8
FUND BASICS
Asia Equity Fund
as of October 31, 2019
| TOP TEN HOLDINGS AS OF 10/31/191 | ||||||||||
| Holding | % of Net Assets | Line of Business | Country | |||||||
| Tencent Holdings Ltd. | 6.5 | % | Media & Entertainment | China | ||||||
| Taiwan Semiconductor Manufacturing Co. Ltd. | 6.1 | Semiconductors & Semiconductor Equipment | Taiwan | |||||||
| AIA Group Ltd. | 5.8 | Insurance | Hong Kong | |||||||
| Samsung Electronics Co. Ltd. | 5.3 | Technology Hardware & Equipment | South Korea | |||||||
| Ping An Insurance Group Co. of China Ltd. Class H | 5.1 | Insurance | China | |||||||
| Alibaba Group Holding Ltd. ADR | 4.7 | Retailing | China | |||||||
| Kweichow Moutai Co. Ltd. Class A | 4.2 | Food, Beverage & Tobacco | China | |||||||
| China Merchants Bank Co. Ltd. Class H | 3.2 | Banks | China | |||||||
| DBS Group Holdings Ltd. | 3.2 | Banks | Singapore | |||||||
| Maruti Suzuki India Ltd. | 2.6 | Automobiles & Components | India | |||||||
| 1 | The top 10 holdings may not be representative of the Fund’s future investments. |
| FUND VS. BENCHMARK SECTOR ALLOCATIONS2 |
| As of October 31, 2019 |
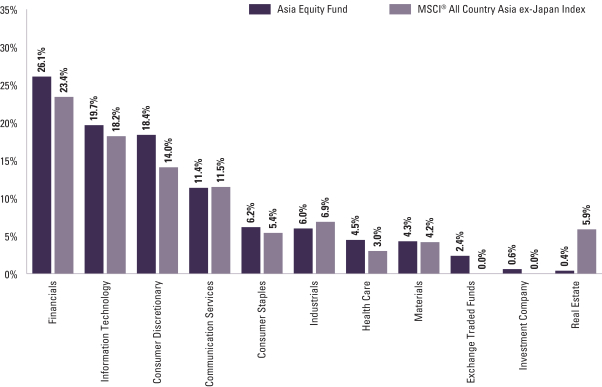
| 2 | The Fund is actively managed and, as such, its composition may differ over time. Consequently, the Fund’s overall sector allocations may differ from percentages contained in the graph above. The graph categorizes investments using Global Industry Classification Standard (“GICS”); however, the sector classifications used by the portfolio management team may differ from GICS. The percentage shown for each investment category reflects the value of investments in that category as a percentage of market value (excluding investments in the securities lending reinvestment vehicle, if any). Underlying sector allocations of exchange traded funds and investment companies held by the Fund are not reflected in the graph above. Investments in the securities lending reinvestment vehicle represented 1.4% of the Fund’s net assets at October 31, 2019. |
For more information about your Fund, please refer to www.GSAMFUNDS.com. There, you can learn more about your Fund’s investment strategies, holdings, and performance.
9
GOLDMAN SACHS ASIA EQUITY FUND
Performance Summary
October 31, 2019
The following graph shows the value, as of October 31, 2019, of a $10,000 investment made on November 1, 2009 in Class A Shares at NAV. For comparative purposes, the performance of the Fund’s benchmark, the MSCI® All Country Asiaex-Japan Index (Net, USD, Unhedged), is shown. Performance reflects applicable fee waivers and/or expense limitations in effect during the periods shown and in their absence, performance would be reduced. Returns do not reflect the deduction of taxes that a shareholder would pay on Fund distributions or the redemption of Fund shares. The returns set forth below represent past performance. Past performance does not guarantee future results. The Fund’s investment return and principal value will fluctuate so that an investor’s shares, when redeemed, may be worth more or less than their original cost. Current performance may be lower or higher than the performance quoted below. Please visit our web site at www.GSAMFUNDS.com to obtain the most recent month-end returns.
| Fund’s 10 Year Performance |
Performance of a $10,000 Investment, with distributions reinvested, from November 1, 2009 through October 31, 2019.
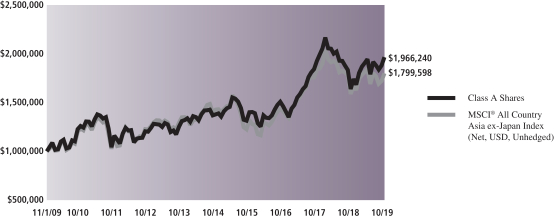
| Average Annual Total Return through October 31, 2019* | One Year | Five Years | Ten Years | Since Inception | ||||||||||
Class A | ||||||||||||||
Excluding sales charges | 19.54% | 6.94% | 6.57% | — | ||||||||||
Including sales charges | 12.95% | 5.73% | 5.97% | — | ||||||||||
| ||||||||||||||
Class C | ||||||||||||||
Excluding contingent deferred sales charges | 18.66% | 6.14% | 5.77% | — | ||||||||||
Including contingent deferred sales charges | 17.59% | 6.14% | 5.77% | — | ||||||||||
| ||||||||||||||
Institutional | 19.98% | 7.35% | 6.99% | — | ||||||||||
| ||||||||||||||
Investor (Commenced February 28, 2014) | 19.86% | 7.21% | N/A | 6.57% | ||||||||||
| ||||||||||||||
Class P (Commenced April 16, 2018) | 19.98% | N/A | N/A | -2.41% | ||||||||||
| ||||||||||||||
Class R6 (Commenced February 28, 2018) | 19.96% | N/A | N/A | -2.67% | ||||||||||
| ||||||||||||||
| * | These returns assume reinvestment of all distributions at NAV and reflect a maximum initial sales charge of 5.50% for Class A and the assumed contingent deferred sales charge for Class C Shares (1% if redeemed within 12 months of purchase). Because Institutional, Investor, Class P and Class R6 Shares do not involve a sales charge, such a charge is not applied to their Average Annual Total Return. |
10
PORTFOLIO RESULTS
Goldman Sachs Emerging Markets Equity Fund
Investment Objective
The Fund seeks long-term capital appreciation.
Portfolio Management Discussion and Analysis
Below, the Goldman Sachs Fundamental Emerging Markets Equity Portfolio Management Team discusses the Goldman Sachs Emerging Markets Equity Fund’s (the “Fund”) performance and positioning for the12-month period ended October 31, 2019 (the “Reporting Period”).
| Q | How did the Fund perform during the Reporting Period? |
| A | During the Reporting Period, the Fund’s Class A, Class C, Institutional, Service, Investor, Class P and Class R6 Shares generated average annual total returns, without sales charges, of 19.03%, 18.12%, 19.51%, 18.85%, 19.31%, 19.47% and 19.52%, respectively. These returns compare to the 11.86% average annual total return of the Fund’s benchmark, the MSCI Emerging Markets Index (Net, USD, Unhedged) (the “Index”), during the same period. |
| Q | What key factors were responsible for the Fund’s performance during the Reporting Period? |
| A | The Fund outperformed the Index on a relative basis during the Reporting Period, primarily attributable to individual stock selection. From a country perspective, effective stock selection in China, Brazil and Taiwan contributed most positively to the Fund’s performance. These positive contributors were only partially offset by stock selection in the United Arab Emirates, Russia and the Philippines, which detracted. Having an underweighted allocation to Russia, which significantly outperformed the Index during the Reporting Period, also hurt. The Fund’s relative results were further dampened by having an exposure, albeit modest, to cash during a Reporting Period when the Index posted a double-digit positive return. |
| Q | What were some of the Fund’s best-performing individual stocks? |
| A | The strongest contributors to the Fund’s performance during the Reporting Period were Kweichow Moutai, AIA Group and B3. |
| Within the consumer staples sector, the Fund’s overweight position in Kweichow Moutai was the strongest positive contributor to relative results. Kweichow Moutai is the largest Chinese hard liquor maker positioned at the premium end of the market. Its stock outperformed the Index during the Reporting Period, as the company reported a strong set of results, demonstrating its resilience during the economic slowdown in China. The company also capitalized its strong product and brand value to improve its margins during its channel restructuring. At the end of the Reporting Period, we maintained the Fund’s overweight position in the stock, as we believed demand for the company’s flagship products remained strong. |
| AIA Group is a Hong Kong-based insurance and financial services company. We maintained an overweight position in the Fund in AIA Group because of what we saw as its well diversified Asian footprint and strong distribution network and management. During the Reporting Period, its onshore China business showed sustained growth momentum with a premium agent model targetinghigh-end customers. In our view, its growth opportunity was enhanced by its rather recent opening of additional China provinces for the firm. Further, its cross-border business between Hong Kong and Southeast Asia local businesses showed improvement, in our opinion, with an expanded distribution network and better margins, reinforcing its positive earnings and value creation outlook for the medium term. The company delivered strong results during the Reporting Period, driven by what investors saw as its solid fundamentals. |
| B3 is a Brazilian stock exchange that holds a virtual monopoly in its space. During the Reporting Period, it performed strongly, driven by two important factors — 1) the approval of pension reform in the first round of voting by Brazil’s Lower House; and 2) lower interest rates, which led investors to reallocate investments from fixed income to equity. As a consequence, average daily trading volume at B3 increased more than 16% quarter over quarter and nearly 79% year over year, as of the end of the third quarter of 2019. |
11
PORTFOLIO RESULTS
| Q | Which stocks detracted significantly from the Fund’s performance during the Reporting Period? |
| A | Detracting most from the Fund’s results relative to the Index were positions in NMC Health, Hankook Tire & Technology and LG Chem. |
| NMC Health, anout-of-Index position, is a diversified health care company based in the United Arab Emirates. Its stock declined during the first half of the Reporting Period, as the hospital sector in Europe, where most of the company’s investors are located, did not perform well. Also, the company’s high financial leverage was out of favor through the Reporting Period, and regulatory pressures kept its share price under pressure as well. At the end of the Reporting Period, we maintained the Fund’s position in NMC Health, as we expect the company’s joint venture with Hassana Investment Company, of Saudi Arabia, to benefit NMC Health and were confident in what we viewed as its robust fundamentals. |
| The Fund’s overweight position in Hankook Tire & Technology detracted from its relative results during the Reporting Period. Hankook Tire & Technology, based in South Korea, is one of the world’s largest manufacturers of tires, selling close to 100 million tires annually. Its stock underperformed the Index during the Reporting Period overall due to lower than market expected quarterly results, driven by weak global auto demand. However, toward the end of the Reporting Period, its most recent quarterly results showed improvement, resulting in a stock price rebound. At the end of the Reporting Period, we maintained the Fund’s position in Hankook Tire & Technology and expected the company to benefit from benign raw material prices, margin improvement and new capacity stabilization. |
| Within the materials sector, the Fund’s overweight position in LG Chem, a South Korea-based chemicals manufacturer, detracted from relative results during the Reporting Period. The company’s battery business experienced some slowdown due to a ramp up of its production facilities, and its management announced its company-anticipated recovery would likely be delayed. Its stock performance was also weighed upon by the fact that yields at the company’s European plant were slow to improve following a rapid capacity expansion, coupled with lackluster sales and a persistent cost burden. At the end of the Reporting Period, we maintained the Fund’s position in LG Chem, as, along with recovery of its battery business, we expect its European plant to achieve its target yield by early 2020. |
| Q | Which equity market sectors most significantly affected Fund performance during the Reporting Period? |
| A | Relative to the Index, strong stock selection within the financials, consumer staples and communication services sectors contributed most positively to the Fund’s performance. Conversely, weak stock selection in consumer discretionary and having an underweighted allocation to real estate, which outperformed the Index during the Reporting Period, dampened the Fund’s performance. These were the only two sectors to detract from the Fund’s relative results during the Reporting Period. |
| Q | How did the Fund use derivatives and similar instruments during the Reporting Period? |
| A | During the Reporting Period, we did not use derivatives as part of our active management strategy. |
| Q | Did the Fund make any significant purchases or sales during the Reporting Period? |
| A | During the Reporting Period, we added to the Fund’s position in Tencent Holdings within the communication services sectors. Tencent Holdings is a China-based global leader in the media, entertainment and Internet-related services industries. Although its share price was under pressure during the Reporting Period due to ongoing trade tensions between the U.S. and China and lower than market expected advertising revenue growth, we added to the Fund’s overweight position in its stock, as we expect advertising revenue to rebound. Further, we believe the company stands to benefit from the newly-launched 5G (fifth generation) network in China, which, in turn, is expected by the consensus to benefit the Internet services segment as a whole. |
| We initiated a Fund position in Orion within the consumer staples sector. Orion is one of the largest food companies in South Korea. Although softer industrial growth trends, coupled with high competition in China, weighed on its stock’s performance during the Reporting Period, we established the position, as we believed its then-current share price already reflected the weakness in its operations. We further expected what we see as the company’s robust product pipeline and recovery in Vietnam may boost its profitability going forward. |
12
PORTFOLIO RESULTS
| Conversely, we eliminated the Fund’s position in Bursa Malaysia within the financials sector. Bursa Malaysia is a holding company operating a fully integrated stock exchange in Malaysia. Its business model is heavily reliant on the securities trading business, from which the company derives approximately 50% of its revenue. We exited the Fund’s position in the company due to our weak outlook for the securities and derivatives business. |
| We sold the Fund’s position in British American Tobacco within the consumer staples sector. Following the gains in the stock’s price during the first half of 2019, we felt the risk/reward relationship for the stock had become less attractive. Also, despite the Malaysian government stepping up law enforcement to curb illicit tobacco trade, including conducting increased numbers of checks, there was no significant decline in the business of illicit cigarettes there. Thus, we exited the Fund’s position in British American Tobacco. |
| Q | Were there any notable changes in the Fund’s weightings during the Reporting Period? |
| A | Fund weightings at a sector level are driven bybottom-up stock selection. That said, during the Reporting Period, the Fund’s exposure relative to the Index to information technology and consumer staples increased, and its allocations relative to the Index to energy, materials and financials decreased. |
| Similarly, allocations to countries are directly the result of various stock selection decisions. As such, the Fund’s exposure relative to the Index in China, India, Taiwan and Indonesia increased, and its allocations relative to the Index to Russia and Malaysia decreased. |
| Q | Were there any changes to the Fund’s portfolio management team during the Reporting Period? |
| A | There were no changes to the Fund’s portfolio management team during the Reporting Period. |
| Q | How was the Fund positioned relative to the Index at the end of the Reporting Period? |
| A | At the end of the Reporting Period, the Fund had overweighted exposure to India, China and Peru and underweighted exposure to Taiwan, Malaysia, South Africa, Thailand and Russia relative to the Index. On the same date, the Fund was relatively neutrally weighted to the Index in the remaining components of the Index, with the exceptions of Saudi Arabia, Argentina, Pakistan, Hungary, Qatar and Chile, where the Fund had no exposure at the end of the Reporting Period. The Fund also had exposure to equity markets that are not components of the Index, including Vietnam and Singapore. |
| From a sector allocation perspective, the Fund had overweighted positions relative to the Index in financials, information technology, consumer staples and consumer discretionary at the end of the Reporting Period. The Fund had underweighted positions compared to the Index in the energy, materials, real estate and communication services sectors at the end of the Reporting Period. The Fund had rather neutral exposure to the industrials and health care sectors and no allocation to the utilities sector at the end of the Reporting Period. |
| As always, we remained focused on individual stock selection, with sector and country positioning being a secondary, closely-monitored effect. |
13
FUND BASICS
Emerging Markets Equity Fund
as of October 31, 2019
| TOP TEN HOLDINGS AS OF 10/31/191,2 | ||||||||||
| Holding | % of Net Assets | Line of Business | Country | |||||||
| Tencent Holdings Ltd. | 6.0 | % | Media & Entertainment | China | ||||||
| Taiwan Semiconductor Manufacturing Co. Ltd. | 5.3 | Semiconductors & Semiconductor Equipment | Taiwan | |||||||
| Samsung Electronics Co. Ltd. | 4.7 | Technology Hardware & Equipment | South Korea | |||||||
| Alibaba Group Holding Ltd. ADR | 4.2 | Retailing | China | |||||||
| iShares MSCI Emerging Markets ETF | 3.3 | Diversified Financials | United States | |||||||
| Ping An Insurance Group Co. of China Ltd. Class H | 3.0 | Insurance | China | |||||||
| AIA Group Ltd. | 2.8 | Insurance | Hong Kong | |||||||
| Kweichow Moutai Co. Ltd. Class A | 2.6 | Food, Beverage & Tobacco | China | |||||||
| China Merchants Bank Co. Ltd. Class H | 1.8 | Banks | China | |||||||
| Bank Central Asia Tbk. PT | 1.6 | Banks | Indonesia | |||||||
| 1 | The top 10 holdings may not be representative of the Fund’s future investments. |
| 2 | The Fund’s overall top 10 holdings differ from the table above due to the exclusion of the Goldman Sachs Financial Square Government Fund (a short-term investment fund), which represents approximately 2.7% of the Fund’s net assets as of 10/31/19. |
| FUND VS. BENCHMARK SECTOR ALLOCATIONS3 |
| As of October 31, 2019 |
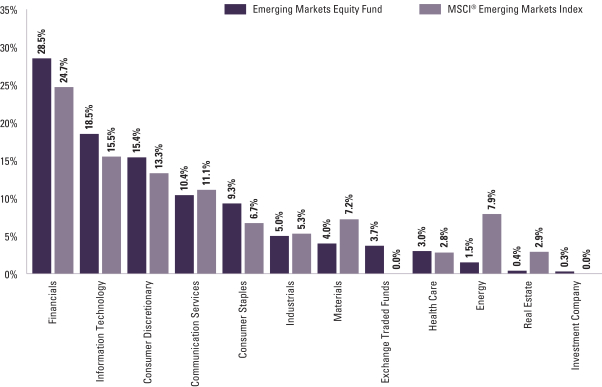
| 3 | The Fund is actively managed and, as such, its composition may differ over time. Consequently, the Fund’s overall sector allocations may differ from percentages contained in the graph above. The graph categorizes investments using Global Industry Classification Standard (“GICS”); however, the sector classifications used by the portfolio management team may differ from GICS. The percentage shown for each investment category reflects the value of investments in that category as a percentage of market value (excluding investments in the securities lending reinvestment vehicle, if any). Underlying sector allocations of exchange traded funds and investment companies held by the Fund are not reflected in the graph above. Investments in the securities lending reinvestment vehicle represented 2.4% of the Fund’s net assets at October 31, 2019. |
For more information about your Fund, please refer to www.GSAMFUNDS.com. There, you can learn more about your Fund’s investment strategies, holdings, and performance.
14
GOLDMAN SACHS EMERGING MARKETS EQUITY FUND
Performance Summary
October 31, 2019
The following graph shows the value, as of October 31, 2019, of a $1,000,000 investment made on November 1, 2009 in Institutional Shares at NAV. For comparative purposes, the performance of the Fund’s benchmark, the MSCI® Emerging Markets Index (Net, USD, Unhedged), is shown. Performance reflects applicable fee waivers and/or expense limitations in effect during the periods shown and in their absence, performance would be reduced. Returns do not reflect the deduction of taxes that a shareholder would pay on Fund distributions or the redemption of Fund shares. The returns set forth below represent past performance. Past performance does not guarantee future results. The Fund’s investment return and principal value will fluctuate so that an investor’s shares, when redeemed, may be worth more or less than their original cost. Current performance may be lower or higher than the performance quoted below. Please visit our web site at www.GSAMFUNDS.com to obtain the most recent month-end returns.
| Emerging Markets Equity Fund’s 10 Year Performance |
Performance of a $1,000,000 Investment, with distributions reinvested, from November 1, 2009 through October 31, 2019.
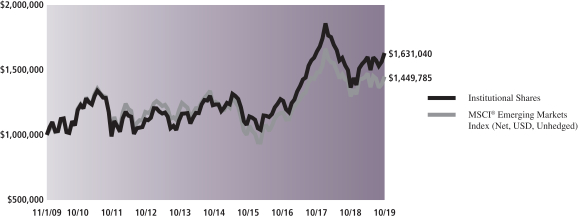
| Average Annual Total Return through October 31, 2019* | One Year | Five Years | Ten Years | Since Inception | ||||||||||
Class A | ||||||||||||||
Excluding sales charges | 19.03% | 5.31% | 4.59% | — | ||||||||||
Including sales charges | 12.48% | 4.13% | 4.00% | — | ||||||||||
| ||||||||||||||
Class C | ||||||||||||||
Including sales charges | 18.12% | 4.52% | 3.81% | — | ||||||||||
Excluding contingent deferred sales charges | 17.12% | 4.52% | 3.81% | — | ||||||||||
| ||||||||||||||
Institutional | 19.51% | 5.72% | 5.01% | — | ||||||||||
| ||||||||||||||
Service | 18.85% | 5.20% | 4.49% | — | ||||||||||
| ||||||||||||||
Investor | 19.31% | 5.57% | N/A | 4.51% | ||||||||||
| ||||||||||||||
Class P (Commenced April 16, 2018) | 19.47% | N/A | N/A | -3.72% | ||||||||||
| ||||||||||||||
Class R6 (Commenced July 31, 2015) | 19.52% | N/A | N/A | 7.23% | ||||||||||
| ||||||||||||||
| * | These returns assume reinvestment of all distributions at NAV and reflect a maximum initial sales charge of 5.50% for Class A and the assumed contingent deferred sales charge for Class C Shares (1% if redeemed within 12 months of purchase). Because Institutional, Service, Investor, Class P and Class R6 Shares do not involve a sales charge, such a charge is not applied to their Average Annual Total Return. |
15
PORTFOLIO RESULTS
Goldman Sachs ESG Emerging Markets Equity Fund
Investment Objective
The Fund seeks long-term capital appreciation.
Portfolio Management Discussion and Analysis
Below, the Goldman Sachs Fundamental Emerging Markets Equity Portfolio Management Team discusses the Goldman Sachs ESG Emerging Markets Equity Fund (the “Fund”) performance and positioning for the12-month period ended October 31, 2019 (the “Reporting Period”).
| Q | How did the Fund perform during the Reporting Period? |
| A | During the Reporting Period, the Fund’s Class A, Class C, Institutional, Investor, Class R and Class R6 Shares generated average annual total returns, without sales charges, of 18.74%, 17.92%, 19.26%, 19.03%, 18.57% and 19.26%, respectively. These returns compare to the 11.86% average annual total return of the Fund’s benchmark, the MSCI Emerging Markets Index (Net, USD, Unhedged) (the “Index”), during the same period. |
| Q | What key factors were responsible for the Fund’s performance during the Reporting Period? |
| A | The Fund outperformed the Index on a relative basis during the Reporting Period, primarily attributable to individual stock selection. From a country perspective, effective stock selection in China, Brazil and Taiwan contributed most positively to the Fund’s relative performance. These positive contributors were only partially offset by weaker stock selection in United Arab Emirates, Mexico and the Philippines, which detracted. The Fund’s relative results were further dampened by having an exposure, albeit modest, to cash during a Reporting Period when the Index posted a double-digit positive return. |
| Q | What were some of the Fund’s best-performing individual stocks? |
| A | The strongest contributors to the Fund’s performance during the Reporting Period were B3, AIA Group and Anta Sports Products. |
| B3 is a Brazilian stock exchange that holds a virtual monopoly in its space. During the Reporting Period, it performed strongly, driven by two important factors — 1) the approval of pension reform in the first round of voting by Brazil’s Lower House; and 2) lower interest rates, which led investors to reallocate investments from fixed income to equity. As a consequence, average daily trading volume at B3 increased more than 16% quarter over quarter and nearly 79% year over year, as of the end of the third quarter of 2019. |
| AIA Group is a Hong Kong-based insurance and financial services company. We maintained an overweight position in the Fund in AIA Group because of what we saw as its well diversified Asian footprint and strong distribution network and management. During the Reporting Period, its onshore China business showed sustained growth momentum with a premium agent model targetinghigh-end customers. In our view, its growth opportunity was enhanced by its rather recent opening of additional China provinces for the firm. Further, its cross-border business between Hong Kong and Southeast Asia local businesses showed improvement, in our opinion, with an expanded distribution network and better margins, reinforcing its positive earnings and value creation outlook for the medium term. The company delivered strong results during the Reporting Period, driven by what investors saw as its solid fundamentals. |
| The Fund’s overweight position in Anta Sports Products also contributed positively to relative results. Anta Sports Products is a branded sportswear company in China, mainly marketing its products under the Anta brand, which has a “value for the money” proposition. During the Reporting Period, Anta Sports Products outperformed the Index, as the company delivered better than market expected annual and quarterly results, including strongtop-line growth, mainly driven by its Fila brand. The company continued to operate as a multi-brand omni-channel operator with what we saw as solid execution. At the end of the Reporting Period, we believed the company maintained strong branding power, and we expected it to continue to grow on the back of growth in the sportswear market overall and market share gains from smaller unbranded companies. |
16
PORTFOLIO RESULTS
| Q | Which stocks detracted significantly from the Fund’s performance during the Reporting Period? |
| A | Among those stocks detracting most from the Fund’s results relative to the Index were positions in NMC Health, Alsea SAB de CV and Hankook Tire & Technology. |
| NMC Health, anout-of-Index position, is a diversified health care company based in the United Arab Emirates. Its stock declined during the first half of the Reporting Period, as the hospital sector in Europe, where most of the company’s investors are located, did not perform well. Also, the company’s high financial leverage was out of favor through the Reporting Period, and regulatory pressures kept its share price under pressure as well. At the end of the Reporting Period, we maintained the Fund’s position in NMC Health, as we expect the company’s joint venture with Hassana Investment Company, of Saudi Arabia, to benefit NMC Health and were confident in what we viewed as its robust fundamentals. |
| Alsea SAB de CV, based in Mexico, is a multi-brand operator in Latin America, operating brands from the fast food, cafeteria and casual dining segments. Factors contributing to its stock’s price decline during the Reporting Period included below market expected fourth quarter 2018 and first quarter 2019 results and slower operating performance as it integrates its latest acquisitions. Additionally, same-store sales growth has been challenged, and the company requires, in our opinion, robust growth to drive earnings before interest, taxes, depreciation and amortization to maintain or reduce its leverage levels. We sold the Fund’s position in Alsea SAB de CV, as we believed operating improvements would take time following its management changes. |
| The Fund’s overweight position in Hankook Tire & Technology detracted from its relative results during the Reporting Period. Hankook Tire & Technology, based in South Korea, is one of the world’s largest manufacturers of tires, selling close to 100 million tires annually. Its stock underperformed the Index during the Reporting Period overall due to lower than market expected quarterly results, driven by weak global auto demand. However, toward the end of the Reporting Period, its most recent quarterly results showed improvement, resulting in a stock price rebound. At the end of the Reporting Period, we maintained the Fund’s position in Hankook Tire & Technology and expected the company to benefit from benign raw material prices, margin improvement and new capacity stabilization. |
| Q | Which equity market sectors most significantly affected Fund performance during the Reporting Period? |
| A | Relative to the Index, strong stock selection in financials, information technology and communication services contributed most positively to the Fund’s relative results. Within financials, it is important to note strong stock selection was achieved despite an underweight to banks, driven by our concerns around state ownership, which is rather pronounced in some of the larger Asian countries. While there are exceptions, generally speaking, we remain skeptical about state-owned enterprises, in particular in asset-heavy sectors, where misalignment of interests between governments and minority shareholders create concerns around the sustainability of returns. Within the sector, we favorednon-banking financial companies (“NBFCs”), such as stock exchanges, insurance companies, consumer lending and financial technology platforms. In our view, NBFCs not only benefit from secular growth themes, such as further credit penetration and rising wealth in emerging markets, but they also play a crucial role in driving financial inclusion in their domestic markets given the challenges many face in accessing basic financial services. |
| Conversely, having no exposure to real estate and a significant underweight to utilities, which outperformed and performed in line with the Index, respectively, detracted from the Fund’s relative results during the Reporting Period, the only two sectors to do so during the Reporting Period. |
| Q | How did the Fund use derivatives and similar instruments during the Reporting Period? |
| A | During the Reporting Period, we did not use derivatives as part of our active management strategy. |
| Q | Did the Fund make any significant purchases or sales during the Reporting Period? |
| A | We established a Fund position in IRB Brasil Resseguros, the leading Brazilian reinsurance company, with an approximately 37% market share in Brazil. During the Reporting Period, penetration of reinsurance was only at 10% of premiums written, but we expect growth of the reinsurance industry to accelerate during the next three to five years, should the economic recovery play out as we anticipate. IRB Brasil Resseguros is well positioned, in our view, to capture the bulk of this growth given what we see as its strong leadership position in syndication panels, superior risk-based pricing and broad high quality service offerings. We also see opportunities for the company to continue |
17
PORTFOLIO RESULTS
gaining market share in South America, which is a stated priority for its management going forward. |
| We initiated a Fund position in Sunny Optical Technology, a Chinese optical lens manufacturer. We believe the company benefits from an increase in the numbers of cameras per smartphone in the market as well as from improvement in its production yield. We expect the number of cameras per smartphone to continue to increase going forward, and we believe Sunny Optical Technology may expand its market share by leveraging its full product offering. |
| Conversely, in addition to the sale of Alsea SAB de CV already mentioned, we eliminated the Fund’s position in Bursa Malaysia within the financials sector. Bursa Malaysia is a holding company operating a fully integrated stock exchange in Malaysia. Its business model is heavily reliant on the securities trading business, from which the company derives approximately 50% of its revenue. We exited the Fund’s position in the company due to our weak outlook for the securities and derivatives business. |
| We exited the Fund’s position in BB Seguridade Participacoes, the Brazilian insurance company, as its stock had reached our target price, and we saw the opportunity to use the proceeds for a bid in a secondary offering of IRB Brasil Resseguros, mentioned above, which operates in the same industry. |
| Q | Were there any notable changes in the Fund’s weightings during the Reporting Period? |
| A | Fund weightings at a sector level are driven bybottom-up stock selection. That said, during the Reporting Period, the Fund’s exposure relative to the Index to consumer discretionary, communication services and industrials increased, and its allocations relative to the Index to information technology and financials decreased. |
| Similarly, allocations to countries are directly the result of various stock selection decisions. As such, the Fund’s exposure relative to the Index in China, India, Brazil, South Korea and Taiwan increased. There were no significant decreases in country allocations relative to the Index during the Reporting Period. |
| Q | Were there any changes to the Fund’s portfolio management team during the Reporting Period? |
| A | There were no changes to the Fund’s portfolio management team during the Reporting Period. |
| Q | How was the Fund positioned relative to the Index at the end of the Reporting Period? |
| A | At the end of the Reporting Period, the Fund had overweighted exposures to India, Brazil, Peru, South Korea and China and underweighted exposures to Taiwan, Thailand, Malaysia and South Africa relative to the Index. On the same date, the Fund was relatively neutrally weighted to the Index in the remaining components of the Index, with the exceptions of Pakistan, Argentina, Hungary, Chile, Qatar and Saudi Arabia, where the Fund had no exposure at all. |
| From a sector allocation perspective, the Fund had overweighted positions relative to the Index in financials, information technology and consumer discretionary at the end of the Reporting Period. The Fund had underweighted positions compared to the Index in the materials, consumer staples and industrials sectors at the end of the Reporting Period. The Fund had rather neutral exposure to the communication services and health care sectors and no allocations to the utilities, real estate and energy sectors at the end of the Reporting Period. |
| We remained focused on individual stock selection, with sector and country positioning being a secondary, closely-monitored effect. We believe our ongoing engagement efforts with companies in the Fund’s portfolio is helping to drive improvements in environmental, social and corporate governance practices for these businesses, which may not only help unlock shareholder value over time, but may also help encourage these businesses to operate in an even more sustainable fashion in the future. |
18
FUND BASICS
ESG Emerging Markets Equity Fund
| TOP TEN HOLDINGS AS OF 10/31/191 | ||||||||||
| Holding | % of Net Assets | Line of Business | Country | |||||||
| Tencent Holdings Ltd. | 6.6 | % | Media & Entertainment | China | ||||||
| Taiwan Semiconductor Manufacturing Co. Ltd. | 5.8 | Semiconductors & Semiconductor Equipment | Taiwan | |||||||
| Samsung Electronics Co. Ltd. | 5.1 | Technology Hardware & Equipment | South Korea | |||||||
| Alibaba Group Holding Ltd. ADR | 4.8 | Retailing | China | |||||||
| Ping An Insurance Group Co. of China Ltd. Class H | 3.6 | Insurance | China | |||||||
| AIA Group Ltd. | 3.1 | Insurance | Hong Kong | |||||||
| Sberbank of Russia PJSC ADR | 2.5 | Banks | Russia | |||||||
| Banco Bradesco SA ADR | 2.4 | Banks | Brazil | |||||||
| B3 SA — Brasil Bolsa Balcao | 2.4 | Diversified Financials | Brazil | |||||||
| Maruti Suzuki India Ltd. | 2.3 | Automobiles & Components | India | |||||||
| 1 | The top 10 holdings may not be representative of the Fund’s future investments. |
| FUND VS. BENCHMARK SECTOR ALLOCATIONS2 |
| As of October 31, 2019 |
| 2 | The Fund is actively managed and, as such, its composition may differ over time. Consequently, the Fund’s overall sector allocations may differ from percentages contained in the graph above. The graph categorizes investments using Global Industry Classification Standard (“GICS”); however, the sector classifications used by the portfolio management team may differ from GICS. The percentage shown for each investment category reflects the value of investments in that category as a percentage of market value. Underlying sector allocations of exchange traded funds and investment companies held by the Fund are not reflected in the graph above. |
For more information about your Fund, please refer to www.GSAMFUNDS.com. There, you can learn more about your Fund’s investment strategies, holdings, and performance.
19
GOLDMAN SACHS ESG EMERGING MARKETS EQUITY FUND
Performance Summary
October 31, 2019
The following graph shows the value, as of October 31, 2019, of a $1,000,000 investment made on May 31, 2018 (commencement of operations) in Institutional Shares at NAV. For comparative purposes, the performance of the Fund’s benchmark, the MSCI® Emerging Markets Index (Net, USD, Unhedged), is shown. Performance reflects applicable fee waivers and/or expense limitations in effect during the periods shown and in their absence, performance would be reduced. Returns do not reflect the deduction of taxes that a shareholder would pay on Fund distributions or the redemption of Fund shares. The returns set forth below represent past performance. Past performance does not guarantee future results. The Fund’s investment return and principal value will fluctuate so that an investor’s shares, when redeemed, may be worth more or less than their original cost. Current performance may be lower or higher than the performance quoted below. Please visit our web site at www.GSAMFUNDS.com to obtain the most recent month-end returns.
| ESG Emerging Markets Equity Fund’s Lifetime Performance |
Performance of a $1,000,000 Investment, with distributions reinvested, from May 31, 2018 through October 31, 2019.
| Average Annual Total Return through October 31, 2019* | One Year | Since Inception | ||||||||||||
Class A (Commenced May 31, 2018) | ||||||||||||||
Excluding sales charges | 18.74% | -0.18% | ||||||||||||
Including sales charges | 12.20% | -4.06% | ||||||||||||
| ||||||||||||||
Class C (Commenced May 31, 2018) | ||||||||||||||
Excluding contingent deferred sales charges | 17.92% | -0.92% | ||||||||||||
Including contingent deferred sales charges | 16.92% | -0.92% | ||||||||||||
| ||||||||||||||
Institutional (Commenced May 31, 2018) | 19.26% | 0.21% | ||||||||||||
| ||||||||||||||
Investor (Commenced May 31, 2018) | 19.03% | 0.07% | ||||||||||||
| ||||||||||||||
Class R (Commenced May 31, 2018) | 18.57% | -0.37% | ||||||||||||
| ||||||||||||||
Class R6 (Commenced May 31, 2018) | 19.26% | 0.21% | ||||||||||||
| ||||||||||||||
| * | These returns assume reinvestment of all distributions at NAV and reflect a maximum initial sales charge of 5.50% for Class A and the assumed contingent deferred sales charge for Class C Shares (1% if redeemed within 12 months of purchase). Because Institutional, Investor, Class R and Class R6 Shares do not involve a sales charge, such a charge is not applied to their Average Annual Total Return. |
20
PORTFOLIO RESULTS
Goldman Sachs Imprint Emerging Markets Opportunities Fund
Investment Objective
The Fund seeks long-term capital appreciation.
Portfolio Management Discussion and Analysis
Effective after the close of business on August 30, 2019, the Goldman Sachs N-11 Equity Fund changed its name to the Goldman Sachs Imprint Emerging Markets Opportunities Fund (the “Fund”), and its principal investment strategy and benchmark index changed as well. Below, the Goldman Sachs Fundamental Emerging Markets Equity Portfolio Management Team discusses the Fund’s performance and positioning for the 12-month period ended October 31, 2019 (the “Reporting Period”).
| Q | How did the Fund perform during the Reporting Period? |
| A | During the Reporting Period, the Fund’s Class A, Class C, Institutional, Investor, Class P and Class R6 Shares generated average annual total returns, without sales charges, of 5.72%, 4.97%, 6.02%, 6.00%, 6.15% and 6.12%, respectively. These returns compare to the 11.86% average annual total return of the Fund’s benchmark, the MSCI Emerging Markets Index (Net, USD, Unhedged), during the Reporting Period. The Fund’s former benchmark, the MSCI Next 11 ex-Iran GDP Weighted Index (Net, USD, Unhedged), returned 6.47% during the same period. |
| Q | What changes were made to the Fund during the Reporting Period? |
| A | At a meeting held on June 11-12, 2019, upon the recommendation of Goldman Sachs Asset Management, L.P., the Board of Trustees of the Goldman Sachs Trust approved certain changes to the Goldman Sachs N-11 Equity Fund’s name, principal investment strategy and benchmark. However, the Fund’s investment objective to seek long-term capital appreciation did not change. After the close of business on August 30, 2019 (the “Effective Date”), the Goldman Sachs N-11 Equity Fund’s name changed to the Goldman Sachs Imprint Emerging Markets Opportunities Fund. After the Effective Date, the Fund then invested in a broader universe of emerging market countries, with up to 20% of the Fund’s net assets invested in frontier market countries. The Fund also became more concentrated in terms of number of holdings. Accordingly, the Fund invested, under normal circumstances, at least 80% of its net assets plus any borrowings for investment purposes (measured at the time of purchase) in a diversified portfolio of equity investments in emerging country issuers. Such equity investments may include exchange-traded funds, futures and other instruments with similar economic exposures. The Fund’s benchmark changed from the MSCI Next 11 ex-Iran GDP Weighted Index (Net, USD, Unhedged) (the “Next 11 Index”) to the MSCI Emerging Markets Index (Net, USD, Unhedged) (the “Index”). |
| Q | What key factors were responsible for the Fund’s performance from November 1, 2018 through August 30, 2019 (“the first portion of the Reporting Period”)? |
| A | The Fund outperformed the Next 11 Index on a relative basis during the first portion of the Reporting Period, primarily attributable to individual stock selection. The Fund’s effective stock selection in Indonesia and Egypt contributed most positively. Having no exposure to Nigeria, the second weakest performing constituent of the Next 11 Index during the first portion of the Reporting Period, and having an underweight in Pakistan, the weakest performing constituent of the Next 11 Index during the first portion of the Reporting Period, also helped. Such positive contributors were only partially offset by weaker stock selection in Bangladesh and the Philippines, which detracted from the Fund’s relative results during the first portion of the Reporting Period. The Fund’s relative results were further dampened by having an exposure, albeit modest, to cash during a portion of the Reporting Period when the Next 11 Index posted a modest positive return. |
21
PORTFOLIO RESULTS
| Q | What were some of the Fund’s best-performing individual stocks during the first portion of the Reporting Period? |
| A | The strongest contributors to the Fund’s performance during the first portion of the Reporting Period were positions in the financials sector — Bank Central Asia and Joint Stock Commercial Bank for Foreign Trade of Vietnam. |
Bank Central Asia is the largest private bank by assets and deposits and, in our view, the best managed consumer bank in Indonesia. During the first portion of the Reporting Period, its shares gained, reflecting its reports of a strong return on equity as well as solid balance sheet performance. In our opinion, it has best in class asset quality and the strongest liability franchise, each a historically long-term driver of returns. |
Joint Stock Commercial Bank for Foreign Trade of Vietnam is a commercial bank in Vietnam. During the first portion of the Reporting Period, it posted strong results, including good loan growth, strong net interest income and net fee income growth, benign asset quality and well-controlled operating expenses. We exited the Fund’s position in the bank, as it reached our target price. |
| Q | Which stocks detracted significantly from the Fund’s performance during the first portion of the Reporting Period? |
| A | Detracting most from the Fund’s results relative to the Next 11 Index were also financials-related positions—Bank Rakyat Indonesia Persero and Orange Life Insurance. |
Bank Rakyat Indonesia Persero, based in Indonesia, provides commercial banking activities and related services. During the first portion of the Reporting Period, the bank demonstrated strong performance but detracted from the Fund’s relative results given the Fund’s underweight position in the holding. Strong performance was driven by 1) the bank being relatively well placed to cushion declining interest rates versus its peers and 2) its ongoing business mix shift toward the profitable micro segment. However, the Fund was underweight the position for several reasons. First, high competition in its key profitable payroll segment was negatively impacting its loan growth. Second, tight liquidity was hurting its net interest margins. Third, we believed its large restructured book could result in asset quality issues. And fourth, we had renewed concerns around regulator-driven loan rate cuts. |
Orange Life Insurance, a South Korea-based insurance company, detracted, with its shares declining after the confirmation of Shinhan Life Insurance’s acquisition of the company. Concerns around the merger between existing life insurance entity, Shinhan Life Insurance, with Orange Life Insurance were cast, as many felt it might dilute Orange Life Insurance’s key appeal — its sufficient capital buffer. After discussion with Shinhan Life Insurance’s management, we concluded they would not merge the two entities any time soon and would maintain the dividend level, which might help the recovery of investors’ confidence in Orange Life Insurance going forward. |
| Q | Which equity market sectors most significantly affected Fund performance during the first portion of the Reporting Period? |
| A | Relative to the Next 11 Index, effective stock selection in the financials and materials sectors contributed most positively to the Fund’s performance. Having a significantly underweighted allocation to energy, the weakest sector in the Next 11 Index during the first portion of the Reporting Period, also helped. Conversely, weaker stock selection in the consumer discretionary and information technology sectors detracted most from the Fund’s relative performance. Having an overweighted allocation to information technology, which lagged the Next 11 Index during the first portion of the Reporting Period, and having an underweighted exposure to real estate, which was the best performing sector in the Next 11 Index during the first portion of the Reporting Period, also hurt. |
| Q | What key factors were responsible for the Fund’s performance from September 1, 2019 through October 31, 2019 (“the second portion of the Reporting Period”)? |
| A | The Fund underperformed the Index on a relative basis during the second portion of the Reporting Period, attributable primarily to individual stock selection. Stock selection in and having an overweight to the United Arab Emirates, which was the second-weakest constituent in the Index during the second portion of the Reporting Period, detracted most. Stock selection in and having an underweight to Taiwan, which significantly outperformed the Index during the second portion of the Reporting Period, also hurt. Having an out-of-Index exposure to Bangladesh, which underperformed the Index during the second portion of the Reporting Period, dampened the Fund’s relative results as well. These detractors were partially offset by effective stock selection in Mexico and India, which contributed positively |
22
PORTFOLIO RESULTS
to the Fund’s relative results during the second portion of the Reporting Period. The Fund’s relative results were further buoyed by having no exposure to Thailand, which lagged the Index during the second portion of the Reporting Period. |
| Q | Which stock detracted most significantly from the Fund’s performance during the second portion of the Reporting Period? |
| A | Detracting most from the Fund’s results relative to the Index during the second portion of the Reporting Period was Emirates NBD Bank, Dubai’s largest and highest quality bank and one of the largest banking groups in the Middle East. Emirates NBD Bank saw its share price decline during the second portion of the Reporting Period due to anticipation of a rights issue that is scheduled to be conducted at the end of 2019. (A rights issue is a group of rights offered to existing shareholders to purchase additional stock shares, known as subscription warrants, in proportion to their existing holdings. These are considered to be a type of option since it gives a company’s stockholders the right, but not the obligation, to purchase additional shares in the company.) Also, the bank has historically traded at a material discount to its fair value as a result of its low 5% foreign ownership limit (“FOL”). We have long recognized that an increase in the FOL could serve as a catalyst for the stock and have actively engaged with the bank’s management and Board of Trustees over the past several years on this issue. The bank recently increased its FOL to 20% and is conducting a modest capital raise in order to make an acquisition in Turkey. At the end of the Reporting Period, we believed there was still considerable upside potential going forward, once the overhang of the rights issue is removed and the company is added to relevant indices. |
| Q | What was the Fund’s best-performing individual stock during the second portion of the Reporting Period? |
| A | The strongest contributor to the Fund’s performance during the second portion of the Reporting Period was a position in Alsea SAB de CV, based in Mexico, which is a multi-brand operator in Latin America, operating brands from the fast food, cafeteria and casual dining segments. During the second portion of the Reporting Period, Alsea SAB de CV demonstrated resilient growth and margins. Its management executed on its turnaround of Starbucks in Mexico and continued to divest of peripheral and underperforming formats and regions to focus on its core business. The company also showed progress in integrating its recent acquisition in Europe, which should, in our view, drive margin expansion and cash flow generation going forward. |
| Q | Which equity market sectors most significantly affected Fund performance during the second portion of the Reporting Period? |
| A | Relative to the Index, stock selection in financials, information technology and health care detracted most from the Fund’s performance during the second portion of the Reporting Period. Having an underweight to information technology, which was the strongest performing sector in the Index during the second portion of the Reporting Period, also hurt. Conversely, having no exposure to the utilities sector, which underperformed the Index during the second portion of the Reporting Period, contributed most positively to the Fund’s relative performance. Effective stock selection in consumer staples and having an underweight to materials, which lagged the Index during the second portion of the Reporting Period, also helped. |
| Q | How did the Fund use derivatives and similar instruments during the Reporting Period? |
| A | During the Reporting Period, the Fund did not use derivatives or similar instruments. |
| Q | Did the Fund make any significant purchases or sales during the Reporting Period? |
| A | Given the repositioning of the Fund during the Reporting Period, the number of purchases and sales, i.e. trading activity, was higher than usual as we implemented the changes to the Fund’s investment strategy. |
| Q | Were there any notable changes in the Fund’s weightings during the Reporting Period? |
| A | Fund weightings at a sector level are driven by bottom-up stock selection as are allocations to countries. That said, during the Reporting Period, the Fund’s changes in sector and country weightings were directly the result of the repositioning of the Fund to its new investment strategy and benchmark index. |
| Q | Were there any changes to the Fund’s portfolio management team during the Reporting Period? |
| A | In light of the changes made to the Fund, after the Effective Date, Jamieson Odell, Vice President, and Lee Gao, Vice President, became the co-portfolio managers of the Fund. Jamieson Odell and Lee Gao have approximately 25 years of combined experience investing in emerging and frontier markets with a clearly defined, sustainability focused |
23
PORTFOLIO RESULTS
approach. Basak Yavuz no longer served as a portfolio manager for the Fund after the Effective Date. We believe this repositioning of the Fund and of our portfolio management talent will help to further broaden our already strong range of emerging market equity capabilities and enhance our approach to Environmental, Social and Governance integration across our Fundamental Equity Funds. |
| Q | How was the Fund positioned relative to the Index at the end of the Reporting Period? |
| A | At the end of the Reporting Period, the Fund was overweight relative to the Index in the United Arab Emirates, Egypt, Bangladesh, Slovenia, Turkey, South Africa, Hong Kong, Mexico, the Netherlands, Vietnam and the Philippines and was underweight relative to the Index in China, Taiwan, South Korea, India, Brazil, Russia and Saudi Arabia. On the same date, the Fund was relatively neutrally weighted to the Index in the remaining country components of the Index, with the exceptions of Czech Republic, Argentina, Hungary, Greece, Peru, Colombia, Chile, Qatar, Poland, Malaysia and Thailand, where the Fund held no exposure at all. |
From a sector allocation perspective, the Fund had overweighted positions relative to the Index in consumer discretionary, financials and health care. The Fund had underweighted positions compared to the Index in information technology, communication services, materials and consumer staples at the end of the Reporting Period. The Fund was relatively neutrally weighted to the Index in industrials and had no exposure at all to the utilities, real estate and energy sectors at the end of the Reporting Period. |
As always, we remained focused on individual stock selection, with sector and country positioning being a secondary, closely-monitored effect. |
24
FUND BASICS
Imprint Emerging Markets Opportunities
as of October 31, 2019
| TOP TEN HOLDINGS AS OF 10/31/191 | ||||||||||
| Holding | % of Net Assets | Line of Business | Country | |||||||
| Emirates NBD PJSC | 9.1 | % | Banks | United Arab Emirates | ||||||
| Naspers Ltd. Class N | 7.1 | Retailing | South Africa | |||||||
| Commercial International Bank Egypt SAE | 5.7 | Banks | Egypt | |||||||
| Haier Smart Home Co. Ltd. Class A | 5.6 | Consumer Durables & Apparel | China | |||||||
| IRB Brasil Resseguros S/A | 5.1 | Insurance | Brazil | |||||||
| Suzuki Motor Corp. | 4.9 | Automobiles & Components | Japan | |||||||
| Delta Electronics, Inc. | 4.3 | Technology Hardware & Equipment | Taiwan | |||||||
| Shenzhen Inovance Technology Co. Ltd. Class A | 3.7 | Capital Goods | China | |||||||
| 58.com, Inc. ADR | 3.5 | Media & Entertainment | China | |||||||
| NMC Health plc | 3.2 | Health Care Equipment & Services | United Arab Emirates | |||||||
| 1 | The top 10 holdings may not be representative of the Fund’s future investments. |
| FUND VS. BENCHMARK SECTOR ALLOCATIONS2 |
| As of October 31, 2019 |
| 2 | The Fund is actively managed and, as such, its composition may differ over time. Consequently, the Fund’s overall sector allocations may differ from percentages contained in the graph above. The graph categorizes investments using Global Industry Classification Standard (“GICS”); however, the sector classifications used by the portfolio management team may differ from GICS. The percentage shown for each investment category reflects the value of investments in that category as a percentage of market value. |
For more information about your Fund, please refer to www.GSAMFUNDS.com. There, you can learn more about your Fund’s investment strategies, holdings, and performance.
25
GOLDMAN SACHS IMPRINT EMERGING MARKETS OPPORTUNITIES FUND
Performance Summary
October 31, 2019
The following graph shows the value, as of October 31, 2019, of a $1,000,000 investment made on February 28, 2011 (commencement of operations) in Institutional Shares at NAV. For comparative purposes, the performance of the Fund’s current and former benchmarks, the MSCI Emerging Markets Index (Net, USD, Unhedged) and the MSCI® Next 11 ex-Iran GDP Weighted Index (Net, USD, Unhedged), respectively, are shown. Performance reflects applicable fee waivers and/or expense limitations in effect and in their absence, performance would be reduced. Returns do not reflect the deduction of taxes that a shareholder would pay on Fund distributions or the redemption of Fund shares. The returns set forth below represent past performance. Past performance does not guarantee future results. The Fund’s investment return and principal value will fluctuate so that an investor’s shares, when redeemed, may be worth more or less than their original cost. Current performance may be lower or higher than the performance quoted below. Please visit our web site at www.GSAMFUNDS.com to obtain the most recent month-end returns.
| Imprint Emerging Markets Opportunity Fund’s Lifetime Performance |
Performance of a $1,000,000 Investment from February 28, 2011 through October 31, 2019.
| Average Annual Total Return through October 31, 2019* | One Year | Five Years | Since Inception | |||||||||||
Class A (Commenced February 28, 2011) | ||||||||||||||
Excluding sales charges | 5.72% | -5.41% | -1.77% | |||||||||||
Including sales charges | -0.12% | -6.47% | -2.40% | |||||||||||
| ||||||||||||||
Class C (Commenced February 28, 2011) | ||||||||||||||
Excluding contingent deferred sales charges | 4.97% | -6.10% | -2.50% | |||||||||||
Including contingent deferred sales charges | 3.97% | -6.10% | -2.50% | |||||||||||
| ||||||||||||||
Institutional (Commenced February 28, 2011) | 6.02% | -5.04% | -1.38% | |||||||||||
| ||||||||||||||
Investor (Commenced February 28, 2011) | 6.00% | -5.16% | -1.52% | |||||||||||
| ||||||||||||||
Class P (Commenced April 16, 2018) | 6.15% | N/A | -10.90% | |||||||||||
| ||||||||||||||
Class R6 (Commenced February 28, 2018) | 6.12% | N/A | -10.78% | |||||||||||
| ||||||||||||||
| * | These returns assume reinvestment of all distributions at NAV and reflect a maximum initial sales charge of 5.50% for Class A and the assumed contingent deferred sales charge for Class C Shares (1% if redeemed within 12 months of purchase). Because Institutional, Investor, Class P and Class R6 Shares do not involve a sales charge, such a charge is not applied to their Average Annual Total Return. |
26
FUND BASICS
Index Definitions
The MSCI® All Country Asia ex-Japan Index (Net, USD, Unhedged) is a free float adjusted market capitalization weighted index that is designed to measure the equity market performance of Asia, excluding Japan. As of April 30, 2019, the MSCI All Country Asia ex-Japan Index consisted of the following 11 developed and emerging market country indices: China, Hong Kong, India, Indonesia, Korea, Malaysia, Pakistan, Philippines, Singapore, Taiwan, and Thailand. The series of returns reflected by the MSCI All Country Asia ex-Japan Index approximates the minimum possible dividend reinvestment. The dividend is reinvested after deduction of withholding tax, applying the rate to non-resident individuals who do not benefit from double taxation treaties. MSCI Barra uses withholding tax rates applicable to Luxembourg holding companies, as Luxembourg applies the highest rates. It is not possible to invest directly in an index.
The MSCI China All Shares Index captures large and mid-cap representation across China A-shares, B-shares, H-shares, Red-chips,P-chips and foreign listings (e.g. ADRs). The index aims to reflect the opportunity set of China share classes listed in Hong Kong, Shanghai, Shenzhen and outside of China. It is based on the concept of the integrated MSCI China equity universe with China A-shares included.
The MSCI® Emerging Markets Index (Net, USD, Unhedged) is a free float-adjusted market capitalization index that is designed to measure equity market performance of emerging markets. As of April 30, 2019 the MSCI® Emerging Markets Index consists of the following 24 emerging market country indexes: Brazil, Chile, China, Colombia, Czech Republic, Egypt, Greece, Hungary, India, Indonesia, Korea, Malaysia, Mexico, Pakistan, Peru, Philippines, Poland, Qatar, Russia, South Africa, Taiwan, Thailand, Turkey and United Arab Emirates. For this Index, the dividend is reinvested after deduction of withholding tax, applying the rate to nonresident individuals who do not benefit from double taxation treaties. MSCI Barra uses withholding tax rates applicable to Luxembourg holding companies, as Luxembourg applies the highest rates. The MSCI Emerging Markets Index does not reflect any deductions of expenses associated with mutual funds such as management fees and other expenses. It is not possible to invest directly in an index.
27
GOLDMAN SACHS ASIA EQUITY FUND
October 31, 2019
| Shares | Description | Value | ||||||
| Common Stocks – 96.6% | ||||||||
| China – 35.7% | ||||||||
| 5,950 | 58.com, Inc. ADR (Media & Entertainment)* | $ | 314,219 | |||||
| 19,878 | Alibaba Group Holding Ltd. ADR (Retailing)* | 3,511,846 | ||||||
| 112,800 | Anhui Conch Cement Co. Ltd. Class H (Materials) | 674,175 | ||||||
| 91,000 | ANTA Sports Products Ltd. (Consumer Durables & Apparel) | 890,173 | ||||||
| 501,500 | China Merchants Bank Co. Ltd. Class H (Banks) | 2,391,769 | ||||||
| 29,198 | Contemporary Amperex Technology Co. Ltd. Class A (Capital Goods) | 284,971 | ||||||
| 39,100 | Gree Electric Appliances, Inc. of Zhuhai Class A (Consumer Durables & Apparel) | 326,184 | ||||||
| 37,591 | Huami Corp. ADR (Technology Hardware & Equipment)* | 339,823 | ||||||
| 18,740 | Kweichow Moutai Co. Ltd. Class A (Food, Beverage & Tobacco) | 3,138,334 | ||||||
| 29,519 | LexinFintech Holdings Ltd. ADR (Diversified Financials)* | 334,745 | ||||||
| 152,000 | Minth Group Ltd. (Automobiles & Components) | 537,652 | ||||||
| 127,300 | NARI Technology Co. Ltd. Class A (Capital Goods) | 396,692 | ||||||
| 5,284 | New Oriental Education & Technology Group, Inc. ADR (Consumer Services)* | 644,965 | ||||||
| 444,000 | Nexteer Automotive Group Ltd. (Automobiles & Components) | 413,817 | ||||||
| 329,500 | Ping An Insurance Group Co. of China Ltd. Class H (Insurance) | 3,803,020 | ||||||
| 25,200 | Shanghai International Airport Co. Ltd. Class A (Transportation) | 272,924 | ||||||
| 92,000 | Shenzhou International Group Holdings Ltd. (Consumer Durables & Apparel) | 1,271,316 | ||||||
| 21,752 | Silergy Corp. (Semiconductors & Semiconductor Equipment) | 609,367 | ||||||
| 47,600 | Sunny Optical Technology Group Co. Ltd. (Technology Hardware & Equipment) | 765,117 | ||||||
| 119,100 | Tencent Holdings Ltd. (Media & Entertainment) | 4,831,043 | ||||||
| 102,960 | Topsports International Holdings Ltd. (Retailing)*(a) | 124,168 | ||||||
| 43,400 | WuXi AppTec Co. Ltd. Class H (Pharmaceuticals, Biotechnology & Life Sciences)(a) | 523,262 | ||||||
|
| |||||||
| 26,399,582 | ||||||||
|
| |||||||
| Hong Kong – 9.5% | ||||||||
| 428,836 | AIA Group Ltd. (Insurance) | 4,270,445 | ||||||
| 26,301 | Hong Kong Exchanges & Clearing Ltd. (Diversified Financials) | 819,383 | ||||||
| 151,000 | IMAX China Holding, Inc. (Media & Entertainment)(a) | 342,756 | ||||||
|
| |||||||
| Common Stocks – (continued) | ||||||||
| Hong Kong – (continued) | ||||||||
| 1,960,000 | Peace Mark Holdings Ltd. (Consumer Durables & Apparel)*(b) | — | ||||||
| 797,000 | Sino Biopharmaceutical Ltd. (Pharmaceuticals, Biotechnology & Life Sciences) | 1,186,648 | ||||||
| 54,500 | Techtronic Industries Co. Ltd. (Capital Goods) | 425,918 | ||||||
|
| |||||||
| 7,045,150 | ||||||||
|
| |||||||
| India – 15.2% | ||||||||
| 2,580 | Abbott India Ltd. (Pharmaceuticals, Biotechnology & Life Sciences) | 428,288 | ||||||
| 72,518 | Aditya Birla Fashion and Retail Ltd. (Consumer Durables & Apparel)* | 216,747 | ||||||
| 19,822 | AIA Engineering Ltd. (Capital Goods) | 484,380 | ||||||
| 3,621 | Atul Ltd. (Materials) | 219,278 | ||||||
| 106,589 | Axis Bank Ltd. (Banks) | 1,104,385 | ||||||
| 8,046 | Bajaj Finance Ltd. (Diversified Financials) | 456,272 | ||||||
| 81,725 | Crompton Greaves Consumer Electricals Ltd. (Consumer Durables & Apparel) | 286,540 | ||||||
| 25,800 | Dalmia Bharat Ltd. (Materials) | 294,561 | ||||||
| 39,776 | Divi’s Laboratories Ltd. (Pharmaceuticals, Biotechnology & Life Sciences) | 983,452 | ||||||
| 101,852 | Edelweiss Financial Services Ltd. (Diversified Financials) | 132,262 | ||||||
| 1,137 | Eicher Motors Ltd. (Automobiles & Components) | 360,484 | ||||||
| 58,995 | Hindustan Zinc Ltd. (Materials) | 176,670 | ||||||
| 32,051 | ICICI Lombard General Insurance Co. Ltd. (Insurance)(a) | 606,779 | ||||||
| 8,241 | Info Edge India Ltd. (Media & Entertainment) | 298,340 | ||||||
| 52,089 | Infosys Ltd. (Software & Services) | 500,881 | ||||||
| 16,044 | Infosys Ltd. ADR (Software & Services) | 153,862 | ||||||
| 11,010 | Larsen & Toubro Infotech Ltd. (Software & Services)(a) | 267,276 | ||||||
| 18,180 | Maruti Suzuki India Ltd. (Automobiles & Components) | 1,937,057 | ||||||
| 315 | MRF Ltd. (Automobiles & Components) | 291,350 | ||||||
| 34,030 | Navin Fluorine International Ltd. (Materials) | 430,600 | ||||||
| | 71,486 | | Prestige Estates Projects Ltd. (Real Estate) | 304,101 | ||||
| 1,830 | Procter & Gamble Hygiene & Health Care Ltd. (Household & Personal Products) | 315,858 | ||||||
| 23,326 | SBI Life Insurance Co. Ltd. (Insurance)(a) | 325,679 | ||||||
| 13,081 | TeamLease Services Ltd. (Commercial & Professional Services)* | 542,384 | ||||||
| 9,536 | Thermax Ltd. (Capital Goods) | 151,642 | ||||||
|
| |||||||
| 11,269,128 | ||||||||
|
| |||||||
| 28 | The accompanying notes are an integral part of these financial statements. |
GOLDMAN SACHS ASIA EQUITY FUND
| Shares | Description | Value | ||||||
| Common Stocks – (continued) | ||||||||
| Indonesia – 3.0% | ||||||||
| 565,400 | Bank Central Asia Tbk. PT (Banks) | $ | 1,265,550 | |||||
| 4,944,000 | BFI Finance Indonesia Tbk. PT (Diversified Financials) | 213,088 | ||||||
| 877,800 | Map Aktif Adiperkasa PT (Retailing)* | 342,378 | ||||||
| 478,100 | Semen Indonesia Persero Tbk. PT (Materials) | 431,192 | ||||||
|
| |||||||
| 2,252,208 | ||||||||
|
| |||||||
| Macau – 0.7% | ||||||||
| 76,000 | Galaxy Entertainment Group Ltd. (Consumer Services) | 523,309 | ||||||
|
| |||||||
| Philippines – 0.8% | ||||||||
| 131,730 | Jollibee Foods Corp. (Consumer Services) | 601,919 | ||||||
|
| |||||||
| Singapore – 3.6% | ||||||||
| 124,221 | DBS Group Holdings Ltd. (Banks) | 2,367,762 | ||||||
| 800,252 | Silverlake Axis Ltd. (Software & Services) | 267,460 | ||||||
|
| |||||||
| 2,635,222 | ||||||||
|
| |||||||
| South Korea – 14.6% | ||||||||
| 15,809 | Hankook Tire & Technology Co. Ltd. (Automobiles & Components) | 421,549 | ||||||
| 5,861 | Kolmar Korea Co. Ltd. (Household & Personal Products) | 241,363 | ||||||
| 3,485 | LG Chem Ltd. (Materials) | 919,500 | ||||||
| 5,103 | LG Electronics, Inc. (Consumer Durables & Apparel) | 292,449 | ||||||
| 19,104 | Modetour Network, Inc. (Consumer Services) | 258,542 | ||||||
| 3,415 | NAVER Corp. (Media & Entertainment) | 481,503 | ||||||
| 3,316 | NCSoft Corp. (Media & Entertainment) | 1,471,627 | ||||||
| 35,440 | Orange Life Insurance Ltd. (Insurance)(a) | 852,069 | ||||||
| 2,227 | Orion Corp. (Food, Beverage & Tobacco) | 202,333 | ||||||
| 5,445 | Osstem Implant Co. Ltd. (Health Care Equipment & Services)* | 186,668 | ||||||
| 1,855 | Pearl Abyss Corp. (Media & Entertainment)* | 345,066 | ||||||
| 3,564 | Samsung Electro-Mechanics Co. Ltd. (Technology Hardware & Equipment) | 345,047 | ||||||
| 89,834 | Samsung Electronics Co. Ltd. (Technology Hardware & Equipment) | 3,882,612 | ||||||
| 1,428 | Samsung Fire & Marine Insurance Co. Ltd. (Insurance) | 265,642 | ||||||
| 9,314 | SK Hynix, Inc. (Semiconductors & Semiconductor Equipment) | 654,923 | ||||||
|
| |||||||
| 10,820,893 | ||||||||
|
| |||||||
| Taiwan – 10.0% | ||||||||
| 964,000 | FIT Hon Teng Ltd. (Technology Hardware & Equipment)(a) | 391,428 | ||||||
| 83,183 | Kingpak Technology, Inc. (Technology Hardware & Equipment) | 404,745 | ||||||
|
| |||||||
| Common Stocks – (continued) | ||||||||
| Taiwan – (continued) | ||||||||
| 5,000 | Largan Precision Co. Ltd. (Technology Hardware & Equipment) | 733,672 | ||||||
| 31,000 | Nien Made Enterprise Co. Ltd. (Consumer Durables & Apparel) | 281,205 | ||||||
| 50,000 | Novatek Microelectronics Corp. (Semiconductors & Semiconductor Equipment) | 320,282 | ||||||
| 11,899 | Sea Ltd. ADR (Media & Entertainment)* | 354,114 | ||||||
| 462,338 | Taiwan Semiconductor Manufacturing Co. Ltd. (Semiconductors & Semiconductor Equipment) | 4,530,822 | ||||||
| 85,000 | Taiwan Union Technology Corp. (Technology Hardware & Equipment) | 372,517 | ||||||
|
| |||||||
| 7,388,785 | ||||||||
|
| |||||||
| Thailand – 2.5% | ||||||||
| 710,500 | Airports of Thailand PCL (Transportation) | 1,840,884 | ||||||
|
| |||||||
| Vietnam – 1.0% | ||||||||
| 125,306 | Vietnam Dairy Products JSC (Food, Beverage & Tobacco) | 701,002 | ||||||
|
| |||||||
| TOTAL COMMON STOCKS | ||||||||
| (Cost $64,285,773) | $ | 71,478,082 | ||||||
|
| |||||||
| Exchange Traded Funds(c) – 2.4% | ||||||||
| 21,404 | iShares MSCI All Country Asia ex Japan ETF | $ | 1,483,297 | |||||
| 9,243 | iShares MSCI Malaysia ETF | 259,913 | ||||||
|
| |||||||
| TOTAL EXCHANGE TRADED FUNDS | ||||||||
| (Cost $1,797,824) | $ | 1,743,210 | ||||||
|
| |||||||
| Shares | Dividend Rate | Value | ||||||
| Investment Company(d) – 0.6% | ||||||||
| | Goldman Sachs Financial Square Government Fund – | | ||||||
| 461,147 | 1.701% | $ | 461,147 | |||||
| (Cost $461,147) | ||||||||
|
| |||||||
| | TOTAL INVESTMENTS BEFORE SECURITIES LENDING REINVESTMENT VEHICLE | | ||||||
| (Cost $66,544,744) | $ | 73,682,439 | ||||||
|
| |||||||
| The accompanying notes are an integral part of these financial statements. | 29 |
GOLDMAN SACHS ASIA EQUITY FUND
Schedule of Investments(continued)
October 31, 2019
| Shares | Dividend Rate | Value | ||||||
| Securities Lending Reinvestment Vehicle(d) – 1.4% | ||||||||
| | Goldman Sachs Financial Square Government Fund – | | ||||||
| 1,018,700 | 1.701% | $ | 1,018,700 | |||||
| (Cost $1,018,700) | ||||||||
|
| |||||||
| TOTAL INVESTMENTS – 101.0% | ||||||||
| (Cost $67,563,444) | $ | 74,701,139 | ||||||
|
| |||||||
| | LIABILITIES IN EXCESS OF OTHER ASSETS – (1.0)% | (750,716 | ) | |||||
|
| |||||||
| NET ASSETS – 100.0% | $ | 73,950,423 | ||||||
|
| |||||||
| The percentage shown for each investment category reflects the value of investments in that category as a percentage of net assets. | ||
* | Non-income producing security. | |
(a) | Exempt from registration under Rule 144A of the Securities Act of 1933. | |
(b) | Significant unobservable inputs were used in the valuation of this portfolio security; i.e., Level 3. | |
(c) | All or a portion of security is on loan. | |
(d) | Represents an Affiliated Issuer. | |
| ||
Investment Abbreviation: | ||
ADR | —American Depositary Receipt | |
| ||
| 30 | The accompanying notes are an integral part of these financial statements. |
GOLDMAN SACHS EMERGING MARKETS EQUITY FUND
Schedule of Investments
October 31, 2019
| Shares | Description | Value | ||||||
| Common Stocks – 95.6% | ||||||||
| Argentina – 1.0% | ||||||||
| 34,588 | MercadoLibre, Inc. (Retailing)* | $ | 18,038,334 | |||||
|
| |||||||
| Brazil – 7.0% | ||||||||
| 1,789,800 | Atacadao SA (Food & Staples Retailing)* | 8,528,382 | ||||||
| 312,100 | Azul SA (Preference) (Transportation)*(a) | 4,087,144 | ||||||
| 2,351,400 | B3 SA – Brasil Bolsa Balcao (Diversified Financials) | 28,365,723 | ||||||
| 276,755 | Banco Bradesco SA ADR (Banks) | 2,424,374 | ||||||
| 3,301,535 | Banco Bradesco SA (Preference) (Banks)(a) | 28,952,746 | ||||||
| 447,531 | Banco Pan SA (Banks)* | 1,011,004 | ||||||
| 447,531 | Banco Pan SA (Preference) (Banks)*(a) | 1,011,004 | ||||||
| 1,776,300 | IRB Brasil Resseguros S/A (Insurance) | 16,737,658 | ||||||
| 287,766 | Pagseguro Digital Ltd. Class A (Software & Services)* | 10,670,363 | ||||||
| 2,161,800 | Sao Martinho SA (Food, Beverage & Tobacco) | 9,465,455 | ||||||
| 376,700 | TOTVS SA (Software & Services)* | 5,849,863 | ||||||
| 2,895,783 | Wiz Solucoes e Corretagem de Seguros SA (Insurance) | 7,870,349 | ||||||
|
| |||||||
| 124,974,065 | ||||||||
|
| |||||||
| China – 28.1% | ||||||||
| 181,299 | 58.com, Inc. ADR (Media & Entertainment)* | 9,574,400 | ||||||
| 423,082 | Alibaba Group Holding Ltd. ADR (Retailing)* | 74,745,897 | ||||||
| 1,880,000 | Anhui Conch Cement Co. Ltd. Class H (Materials) | 11,236,255 | ||||||
| 1,550,000 | ANTA Sports Products Ltd. (Consumer Durables & Apparel) | 15,162,288 | ||||||
| 1,878,000 | China Mengniu Dairy Co. Ltd. (Food, Beverage & Tobacco)* | 7,487,108 | ||||||
| 6,864,000 | China Merchants Bank Co. Ltd. Class H (Banks) | 32,736,004 | ||||||
| 693,879 | Contemporary Amperex Technology Co. Ltd. Class A (Capital Goods) | 6,772,216 | ||||||
| 927,377 | Gree Electric Appliances, Inc. of Zhuhai Class A (Consumer Durables & Apparel) | 7,736,454 | ||||||
| 572,672 | Huami Corp. ADR (Technology Hardware & Equipment)* | 5,176,955 | ||||||
| 272,181 | Kweichow Moutai Co. Ltd. Class A (Food, Beverage & Tobacco) | 45,581,374 | ||||||
| 692,741 | LexinFintech Holdings Ltd. ADR (Diversified Financials)* | 7,855,683 | ||||||
| 1,412,100 | Meituan Dianping Class B (Retailing)* | 16,843,730 | ||||||
| 3,140,000 | Minth Group Ltd. (Automobiles & Components) | 11,106,751 | ||||||
| 2,606,401 | NARI Technology Co. Ltd. Class A (Capital Goods) | 8,122,052 | ||||||
|
| |||||||
| Common Stocks – (continued) | ||||||||
| China – (continued) | ||||||||
| 137,223 | New Oriental Education & Technology Group, Inc. ADR (Consumer Services)* | 16,749,439 | ||||||
| 4,915,000 | Nexteer Automotive Group Ltd. (Automobiles & Components) | 4,580,876 | ||||||
| 4,650,000 | Ping An Insurance Group Co. of China Ltd. Class H (Insurance) | 53,661,690 | ||||||
| 1,086,867 | Shanghai International Airport Co. Ltd. Class A (Transportation) | 11,771,106 | ||||||
| 405,497 | Silergy Corp. (Semiconductors & Semiconductor Equipment) | 11,359,713 | ||||||
| 1,174,400 | Sunny Optical Technology Group Co. Ltd. (Technology Hardware & Equipment) | 18,877,170 | ||||||
| 2,616,300 | Tencent Holdings Ltd. (Media & Entertainment) | 106,124,761 | ||||||
| 2,436,828 | Topsports International Holdings Ltd. (Retailing)*(b) | 2,938,766 | ||||||
| 977,680 | WuXi AppTec Co. Ltd. Class H (Pharmaceuticals, Biotechnology & Life Sciences)(b) | 11,787,620 | ||||||
|
| |||||||
| 497,988,308 | ||||||||
|
| |||||||
| Colombia – 0.3% | ||||||||
| 415,763 | Banco Davivienda SA (Preference) (Banks)(a) | 5,313,894 | ||||||
|
| |||||||
| Czech Republic – 0.6% | ||||||||
| 3,281,094 | Moneta Money Bank A/S (Banks)(b) | 10,893,636 | ||||||
|
| |||||||
| Egypt – 0.5% | ||||||||
| 1,718,324 | Commercial International Bank Egypt SAE (Registered) GDR (Banks) | 8,488,521 | ||||||
|
| |||||||
| Greece – 0.9% | ||||||||
| 419,953 | JUMBO SA (Retailing) | 8,181,694 | ||||||
| 824,947 | Sarantis SA (Household & Personal Products) | 7,286,902 | ||||||
|
| |||||||
| 15,468,596 | ||||||||
|
| |||||||
| Hong Kong – 5.3% | ||||||||
| 4,972,800 | AIA Group Ltd. (Insurance) | 49,520,261 | ||||||
| 620,713 | Hong Kong Exchanges & Clearing Ltd. (Diversified Financials) | 19,337,716 | ||||||
| 1,387,500 | IMAX China Holding, Inc. (Media & Entertainment)(b) | 3,149,499 | ||||||
| 9,190,000 | Sino Biopharmaceutical Ltd. (Pharmaceuticals, Biotechnology & Life Sciences) | 13,682,930 | ||||||
| 1,139,000 | Techtronic Industries Co. Ltd. (Capital Goods) | 8,901,302 | ||||||
|
| |||||||
| 94,591,708 | ||||||||
|
| |||||||
| India – 12.9% | ||||||||
| 28,850 | Abbott India Ltd. (Pharmaceuticals, Biotechnology & Life Sciences) | 4,789,193 | ||||||
|
| |||||||
| The accompanying notes are an integral part of these financial statements. | 31 |
GOLDMAN SACHS EMERGING MARKETS EQUITY FUND
Schedule of Investments(continued)
October 31, 2019
| Shares | Description | Value | ||||||
| Common Stocks – (continued) | ||||||||
| India – (continued) | ||||||||
| 1,807,676 | Aditya Birla Fashion and Retail Ltd. (Consumer Durables & Apparel)* | $ | 5,402,910 | |||||
| 443,541 | AIA Engineering Ltd. (Capital Goods) | 10,838,587 | ||||||
| 435,918 | Amber Enterprises India Ltd. (Consumer Durables & Apparel)* | 6,407,799 | ||||||
| 82,444 | Atul Ltd. (Materials) | 4,992,582 | ||||||
| 2,523,313 | Axis Bank Ltd. (Banks) | 26,144,436 | ||||||
| 184,744 | Bajaj Finance Ltd. (Diversified Financials) | 10,476,445 | ||||||
| 1,873,839 | Crompton Greaves Consumer Electricals Ltd. (Consumer Durables & Apparel) | 6,569,955 | ||||||
| 584,090 | Dalmia Bharat Ltd. (Materials) | 6,668,609 | ||||||
| 524,552 | Divi’s Laboratories Ltd. (Pharmaceuticals, Biotechnology & Life Sciences) | 12,969,416 | ||||||
| 23,886 | Eicher Motors Ltd. (Automobiles & Components) | 7,573,026 | ||||||
| 192,995 | Hindustan Zinc Ltd. (Materials) | 577,955 | ||||||
| 713,908 | ICICI Lombard General Insurance Co. Ltd. (Insurance)(b) | 13,515,474 | ||||||
| 370,447 | Info Edge India Ltd. (Media & Entertainment) | 13,410,887 | ||||||
| 1,292,388 | Infosys Ltd. (Software & Services) | 12,427,430 | ||||||
| 403,559 | Infosys Ltd. ADR (Software & Services) | 3,870,131 | ||||||
| 257,852 | Larsen & Toubro Infotech Ltd. (Software & Services)(b) | 6,259,556 | ||||||
| 233,891 | Maruti Suzuki India Ltd. (Automobiles & Components) | 24,920,806 | ||||||
| 5,673 | MRF Ltd. (Automobiles & Components) | 5,247,070 | ||||||
| 534,201 | Navin Fluorine International Ltd. (Materials) | 6,759,535 | ||||||
| 1,489,935 | Prestige Estates Projects Ltd. (Real Estate) | 6,338,179 | ||||||
| 41,855 | Procter & Gamble Hygiene & Health Care Ltd. (Household & Personal Products) | 7,224,172 | ||||||
| 551,415 | SBI Life Insurance Co. Ltd. (Insurance)(b) | 7,698,887 | ||||||
| 279,124 | TeamLease Services Ltd. (Commercial & Professional Services)* | 11,573,453 | ||||||
| 358,270 | Thermax Ltd. (Capital Goods) | 5,697,213 | ||||||
|
| |||||||
| 228,353,706 | ||||||||
|
| |||||||
| Indonesia – 2.7% | ||||||||
| 13,066,500 | Bank Central Asia Tbk. PT (Banks) | 29,247,108 | ||||||
| 122,564,400 | BFI Finance Indonesia Tbk. PT (Diversified Financials) | 5,282,572 | ||||||
|
| |||||||
| Common Stocks – (continued) | ||||||||
| Indonesia – (continued) | ||||||||
| 11,974,200 | Map Aktif Adiperkasa PT (Retailing)* | 4,670,424 | ||||||
| 10,699,900 | Semen Indonesia Persero Tbk. PT (Materials) | 9,650,087 | ||||||
|
| |||||||
| 48,850,191 | ||||||||
|
| |||||||
| Mexico – 1.9% | ||||||||
| 4,546,910 | Bolsa Mexicana de Valores SAB de CV (Diversified Financials) | 9,970,039 | ||||||
| 2,202,800 | Grupo Cementos de Chihuahua SAB de CV (Materials) | 12,313,419 | ||||||
| 3,642,200 | Kimberly-Clark de Mexico SAB de CV Class A (Household & Personal Products)* | 7,344,420 | ||||||
| 2,838,768 | Unifin Financiera SAB de CV (Diversified Financials) | 4,775,429 | ||||||
|
| |||||||
| 34,403,307 | ||||||||
|
| |||||||
| Peru – 1.9% | ||||||||
| 2,416,454 | Alicorp SAA (Food, Beverage & Tobacco) | 6,625,073 | ||||||
| 4,756,191 | Banco BBVA Peru SA (Banks) | 4,977,029 | ||||||
| 30,896 | Credicorp Ltd. (Banks) | 6,612,980 | ||||||
| 387,725 | Intercorp Financial Services, Inc. (Banks)* | 16,175,348 | ||||||
|
| |||||||
| 34,390,430 | ||||||||
|
| |||||||
| Philippines – 0.6% | ||||||||
| 2,236,290 | Jollibee Foods Corp. (Consumer Services) | 10,218,373 | ||||||
|
| |||||||
| Poland – 1.3% | ||||||||
| 402,464 | Dino Polska SA (Food & Staples Retailing)*(b) | 15,684,021 | ||||||
| 811,257 | Powszechna Kasa Oszczednosci Bank Polski SA (Banks) | 8,100,315 | ||||||
|
| |||||||
| 23,784,336 | ||||||||
|
| |||||||
| Russia – 3.0% | ||||||||
| 282,003 | LUKOIL PJSC (Energy) | 26,052,226 | ||||||
| 3,424,947 | Moscow ExchangeMICEX-RTS PJSC (Diversified Financials) | 5,076,932 | ||||||
| 5,928,743 | Sberbank of Russia PJSC (Banks) | 21,728,316 | ||||||
|
| |||||||
| 52,857,474 | ||||||||
|
| |||||||
| Singapore – 0.2% | ||||||||
| 10,078,200 | Silverlake Axis Ltd. (Software & Services) | 3,368,339 | ||||||
|
| |||||||
| South Africa – 3.1% | ||||||||
| 1,127,308 | Absa Group Ltd. (Banks) | 11,561,762 | ||||||
| 190,219 | Bid Corp. Ltd. (Food & Staples Retailing) | 4,437,659 | ||||||
| 496,404 | Clicks Group Ltd. (Food & Staples Retailing) | 8,069,488 | ||||||
| 1,529,591 | FirstRand Ltd. (Diversified Financials) | 6,612,398 | ||||||
| 894,228 | JSE Ltd. (Diversified Financials) | 7,693,302 | ||||||
|
| |||||||
| 32 | The accompanying notes are an integral part of these financial statements. |
GOLDMAN SACHS EMERGING MARKETS EQUITY FUND
| Shares | Description | Value | ||||||
| Common Stocks – (continued) | ||||||||
| South Africa – (continued) | ||||||||
| 350,472 | Santam Ltd. (Insurance) | $ | 6,549,968 | |||||
| 6,355,504 | Transaction Capital Ltd. (Diversified Financials) | 9,274,270 | ||||||
|
| |||||||
| 54,198,847 | ||||||||
|
| |||||||
| South Korea – 12.6% | ||||||||
| 373,363 | Hankook Tire & Technology Co. Ltd. (Automobiles & Components) | 9,955,768 | ||||||
| 120,639 | Kolmar Korea Co. Ltd. (Household & Personal Products) | 4,968,052 | ||||||
| 63,726 | LG Chem Ltd. (Materials) | 16,813,787 | ||||||
| 149,657 | LG Electronics, Inc. (Consumer Durables & Apparel) | 8,576,730 | ||||||
| 131,073 | NAVER Corp. (Media & Entertainment) | 18,480,830 | ||||||
| 44,361 | NCSoft Corp. (Media & Entertainment) | 19,687,229 | ||||||
| 597,778 | Orange Life Insurance Ltd. (Insurance)(b) | 14,372,129 | ||||||
| 96,084 | Orion Corp. (Food, Beverage & Tobacco) | 8,729,657 | ||||||
| 40,588 | Pearl Abyss Corp. (Media & Entertainment)*(c) | 7,550,154 | ||||||
| 84,637 | Samsung Electro-Mechanics Co. Ltd. (Technology Hardware & Equipment)(c) | 8,194,089 | ||||||
| 1,929,660 | Samsung Electronics Co. Ltd. (Technology Hardware & Equipment) | 83,399,617 | ||||||
| 24,094 | Samsung Fire & Marine Insurance Co. Ltd. (Insurance) | 4,482,055 | ||||||
| 263,443 | SK Hynix, Inc. (Semiconductors & Semiconductor Equipment) | 18,524,259 | ||||||
|
| |||||||
| 223,734,356 | ||||||||
|
| |||||||
| Taiwan – 8.4% | ||||||||
| 20,692,000 | FIT Hon Teng Ltd. (Technology Hardware & Equipment)(b) | 8,401,895 | ||||||
| 684,700 | Kingpak Technology, Inc. (Technology Hardware & Equipment) | 3,331,561 | ||||||
| 121,000 | Largan Precision Co. Ltd. (Technology Hardware & Equipment) | 17,754,859 | ||||||
| 713,000 | Nien Made Enterprise Co. Ltd. (Consumer Durables & Apparel) | 6,467,723 | ||||||
| 1,186,000 | Novatek Microelectronics Corp. (Semiconductors & Semiconductor Equipment) | 7,597,086 | ||||||
| 547,000 | President Chain Store Corp. (Food & Staples Retailing) | 5,456,934 | ||||||
| 203,211 | Sea Ltd. ADR (Media & Entertainment)* | 6,047,559 | ||||||
| Common Stocks – (continued) | ||||||||
| Taiwan – (continued) | ||||||||
| 9,547,883 | Taiwan Semiconductor Manufacturing Co. Ltd. (Semiconductors & Semiconductor Equipment) | 93,567,381 | ||||||
|
| |||||||
| 148,624,998 | ||||||||
|
| |||||||
| Thailand – 1.2% | ||||||||
| 8,015,100 | Airports of Thailand PCL (Transportation) | 20,766,868 | ||||||
|
| |||||||
| Turkey – 0.3% | ||||||||
| 1,236,721 | Eregli Demir ve Celik Fabrikalari TAS (Materials) | 1,413,773 | ||||||
| 2,646,333 | Sok Marketler Ticaret A/S (Food & Staples Retailing)* | 4,114,088 | ||||||
|
| |||||||
| 5,527,861 | ||||||||
|
| |||||||
| United Arab Emirates – 1.0% | ||||||||
| 1,283,990 | Network International Holdings plc (Software & Services)*(b) | 8,998,001 | ||||||
| 337,345 | NMC Health plc (Health Care Equipment & Services) | 9,562,609 | ||||||
|
| |||||||
| 18,560,610 | ||||||||
|
| |||||||
| Vietnam – 0.8% | ||||||||
| 2,461,803 | Vietnam Dairy Products JSC (Food, Beverage & Tobacco) | 13,772,110 | ||||||
|
| |||||||
| TOTAL COMMON STOCKS | ||||||||
| (Cost $1,604,864,070) | $ | 1,697,168,868 | ||||||
|
| |||||||
| Exchange Traded Funds – 3.7% | ||||||||
| 1,371,838 | iShares MSCI Emerging Markets ETF(c) | $ | 58,412,862 | |||||
| 209,128 | iShares MSCI Malaysia ETF | 5,880,679 | ||||||
|
| |||||||
| TOTAL EXCHANGE TRADED FUNDS | ||||||||
| (Cost $69,532,767) | $ | 64,293,541 | ||||||
|
| |||||||
| Shares | Dividend Rate | Value | ||||||
| Investment Company(d) – 0.3% | ||||||||
| | Goldman Sachs Financial Square Government Fund – | | ||||||
| 6,059,064 | 1.701% | $ | 6,059,064 | |||||
| (Cost $6,059,064) | ||||||||
|
| |||||||
| | TOTAL INVESTMENTS BEFORE SECURITIES LENDING REINVESTMENT VEHICLE | | ||||||
| (Cost $1,680,455,901) | $ | 1,767,521,473 | ||||||
|
| |||||||
| The accompanying notes are an integral part of these financial statements. | 33 |
GOLDMAN SACHS EMERGING MARKETS EQUITY FUND
Schedule of Investments(continued)
October 31, 2019
| Shares | Dividend Rate | Value | ||||||
| Securities Lending Reinvestment Vehicle(d) – 2.4% | ||||||||
| | Goldman Sachs Financial Square Government Fund – | | ||||||
| 43,343,504 | 1.701% | $ | 43,343,504 | |||||
| (Cost $43,343,504) | ||||||||
|
| |||||||
| TOTAL INVESTMENTS – 102.0% | ||||||||
| (Cost $1,723,799,405) | $ | 1,810,864,977 | ||||||
|
| |||||||
| | LIABILITIES IN EXCESS OF OTHER ASSETS – (2.0)% | (35,811,199 | ) | |||||
|
| |||||||
| NET ASSETS – 100.0% | $ | 1,775,053,778 | ||||||
|
| |||||||
| The percentage shown for each investment category reflects the value of investments in that category as a percentage of net assets. | ||||
* | Non-income producing security. | |
(a) | Preference Shares are a special type of equity investment that shares in the earnings of the company, has limited voting rights, and receives a greater dividend than applicable Common Shares. | |
(b) | Exempt from registration under Rule 144A of the Securities Act of 1933. | |
(c) | All or a portion of security is on loan. | |
(d) | Represents an Affiliated Issuer. | |
| ||||
Investment Abbreviations: | ||||
ADR | —American Depositary Receipt | |||
GDR | —Global Depositary Receipt | |||
| ||||
| 34 | The accompanying notes are an integral part of these financial statements. |
GOLDMAN SACHS ESG EMERGING MARKETS EQUITY FUND
Schedule of Investments
October 31, 2019
| Shares | Description | Value | ||||||
| Common Stocks – 98.7% | ||||||||
| Argentina – 1.4% | ||||||||
| 199 | MercadoLibre, Inc. (Retailing)* | $ | 103,782 | |||||
|
| |||||||
| Brazil – 8.1% | ||||||||
| 11,000 | Atacadao SA (Food & Staples Retailing)* | 52,415 | ||||||
| 14,200 | B3 SA – Brasil Bolsa Balcao (Diversified Financials) | 171,299 | ||||||
| 19,706 | Banco Bradesco SA ADR (Banks) | 172,625 | ||||||
| 11,900 | IRB Brasil Resseguros S/A (Insurance) | 112,131 | ||||||
| 2,179 | Pagseguro Digital Ltd. Class A (Software & Services)* | 80,797 | ||||||
|
| |||||||
| 589,267 | ||||||||
|
| |||||||
| China – 28.0% | ||||||||
| 907 | 58.com, Inc. ADR (Media & Entertainment)* | 47,899 | ||||||
| 1,972 | Alibaba Group Holding Ltd. ADR (Retailing)* | 348,393 | ||||||
| 8,500 | Anhui Conch Cement Co. Ltd. Class H (Materials) | 50,802 | ||||||
| 7,000 | ANTA Sports Products Ltd. (Consumer Durables & Apparel) | 68,475 | ||||||
| 14,000 | China Mengniu Dairy Co. Ltd. (Food, Beverage & Tobacco)* | 55,814 | ||||||
| 33,000 | China Merchants Bank Co. Ltd. Class H (Banks) | 157,385 | ||||||
| 3,400 | Contemporary Amperex Technology Co. Ltd. Class A (Capital Goods) | 33,184 | ||||||
| 4,300 | Gree Electric Appliances, Inc. of Zhuhai Class A (Consumer Durables & Apparel) | 35,872 | ||||||
| 6,900 | Meituan Dianping Class B (Retailing)* | 82,304 | ||||||
| 18,100 | NARI Technology Co. Ltd. Class A (Capital Goods) | 56,403 | ||||||
| 585 | New Oriental Education & Technology Group, Inc. ADR (Consumer Services)* | 71,405 | ||||||
| 19,000 | Nexteer Automotive Group Ltd. (Automobiles & Components) | 17,708 | ||||||
| 23,000 | Ping An Insurance Group Co. of China Ltd. Class H (Insurance) | 265,461 | ||||||
| 5,200 | Shanghai International Airport Co. Ltd. Class A (Transportation) | 56,318 | ||||||
| 2,000 | Silergy Corp. (Semiconductors & Semiconductor Equipment) | 56,029 | ||||||
| 5,800 | Sunny Optical Technology Group Co. Ltd. (Technology Hardware & Equipment) | 93,228 | ||||||
| 11,900 | Tencent Holdings Ltd. (Media & Entertainment) | 482,699 | ||||||
| 4,860 | WuXi AppTec Co. Ltd. Class H (Pharmaceuticals, Biotechnology & Life Sciences)(a) | 58,596 | ||||||
|
| |||||||
| 2,037,975 | ||||||||
|
| |||||||
| Colombia – 0.3% | ||||||||
| 1,700 | Banco Davivienda SA (Preference) (Banks)(b) | 21,728 | ||||||
|
| |||||||
| Czech Republic – 0.9% | ||||||||
| 19,286 | Moneta Money Bank A/S (Banks)(a) | 64,032 | ||||||
|
| |||||||
| Common Stocks – (continued) | ||||||||
| Egypt – 0.9% | ||||||||
| 13,256 | Commercial International Bank Egypt SAE (Registered) GDR (Banks) | 65,485 | ||||||
|
| |||||||
| Greece – 0.9% | ||||||||
| 3,334 | JUMBO SA (Retailing) | 64,954 | ||||||
|
| |||||||
| Hong Kong – 6.0% | ||||||||
| 22,600 | AIA Group Ltd. (Insurance) | 225,056 | ||||||
| 3,067 | Hong Kong Exchanges & Clearing Ltd. (Diversified Financials) | 95,549 | ||||||
| 48,000 | Sino Biopharmaceutical Ltd. (Pharmaceuticals, Biotechnology & Life Sciences) | 71,467 | ||||||
| 5,500 | Techtronic Industries Co. Ltd. (Capital Goods) | 42,983 | ||||||
|
| |||||||
| 435,055 | ||||||||
|
| |||||||
| India – 13.7% | ||||||||
| 13,563 | Axis Bank Ltd. (Banks) | 140,528 | ||||||
| 1,255 | Bajaj Finance Ltd. (Diversified Financials) | 71,168 | ||||||
| 3,651 | Dalmia Bharat Ltd. (Materials) | 41,684 | ||||||
| 3,274 | Divi’s Laboratories Ltd. (Pharmaceuticals, Biotechnology & Life Sciences) | 80,949 | ||||||
| 164 | Eicher Motors Ltd. (Automobiles & Components) | 51,996 | ||||||
| 4,822 | ICICI Lombard General Insurance Co. Ltd. (Insurance)(a) | 91,289 | ||||||
| 2,278 | Info Edge India Ltd. (Media & Entertainment) | 82,468 | ||||||
| 8,471 | Infosys Ltd. (Software & Services) | 81,456 | ||||||
| 2,898 | Infosys Ltd. ADR (Software & Services) | 27,792 | ||||||
| 1,777 | Larsen & Toubro Infotech Ltd. (Software & Services)(a) | 43,138 | ||||||
| 1,549 | Maruti Suzuki India Ltd. (Automobiles & Components) | 165,044 | ||||||
| 35 | MRF Ltd. (Automobiles & Components) | 32,372 | ||||||
| 305 | Procter & Gamble Hygiene & Health Care Ltd. (Household & Personal Products) | 52,643 | ||||||
| 2,263 | SBI Life Insurance Co. Ltd. (Insurance)(a) | 31,596 | ||||||
|
| |||||||
| 994,123 | ||||||||
|
| |||||||
| Indonesia – 2.2% | ||||||||
| 61,300 | Bank Central Asia Tbk. PT (Banks) | 137,210 | ||||||
| 29,200 | Semen Indonesia Persero Tbk. PT (Materials) | 26,335 | ||||||
|
| |||||||
| 163,545 | ||||||||
|
| |||||||
| Mexico – 2.0% | ||||||||
| 12,300 | Grupo Cementos de Chihuahua SAB de CV (Materials) | 68,756 | ||||||
| 39,300 | Kimberly-Clark de Mexico SAB de CV Class A (Household & Personal Products)* | 79,247 | ||||||
|
| |||||||
| 148,003 | ||||||||
|
| |||||||
| Peru – 1.9% | ||||||||
| 321 | Credicorp Ltd. (Banks) | 68,707 | ||||||
|
| |||||||
| The accompanying notes are an integral part of these financial statements. | 35 |
GOLDMAN SACHS ESG EMERGING MARKETS EQUITY FUND
Schedule of Investments(continued)
October 31, 2019
| Shares | Description | Value | ||||||
| Common Stocks – (continued) | ||||||||
| Peru – (continued) | ||||||||
| 1,676 | Intercorp Financial Services, Inc. (Banks)* | $ | 69,939 | |||||
|
| |||||||
| 138,646 | ||||||||
|
| |||||||
| Philippines – 0.5% | ||||||||
| 8,430 | Jollibee Foods Corp. (Consumer Services) | 38,520 | ||||||
|
| |||||||
| Poland – 0.9% | ||||||||
| 6,614 | Powszechna Kasa Oszczednosci Bank Polski SA (Banks) | 66,040 | ||||||
|
| |||||||
| Russia – 3.3% | ||||||||
| 39,110 | Moscow ExchangeMICEX-RTS PJSC (Diversified Financials) | 57,974 | ||||||
| 12,377 | Sberbank of Russia PJSC ADR (Banks) | 181,973 | ||||||
|
| |||||||
| 239,947 | ||||||||
|
| |||||||
| South Africa – 3.5% | ||||||||
| 6,782 | Absa Group Ltd. (Banks) | 69,557 | ||||||
| 1,370 | Bid Corp. Ltd. (Food & Staples Retailing) | 31,961 | ||||||
| 3,659 | Clicks Group Ltd. (Food & Staples Retailing) | 59,480 | ||||||
| 9,444 | FirstRand Ltd. (Diversified Financials) | 40,826 | ||||||
| 2,663 | Santam Ltd. (Insurance) | 49,769 | ||||||
|
| |||||||
| 251,593 | ||||||||
|
| |||||||
| South Korea – 13.6% | ||||||||
| 1,614 | Hankook Tire & Technology Co. Ltd. (Automobiles & Components) | 43,037 | ||||||
| 278 | LG Chem Ltd. (Materials) | 73,349 | ||||||
| 684 | LG Electronics, Inc. (Consumer Durables & Apparel) | 39,199 | ||||||
| 724 | NAVER Corp. (Media & Entertainment) | 102,081 | ||||||
| 203 | NCSoft Corp. (Media & Entertainment) | 90,091 | ||||||
| 2,915 | Orange Life Insurance Ltd. (Insurance)(a) | 70,084 | ||||||
| 435 | Orion Corp. (Food, Beverage & Tobacco) | 39,522 | ||||||
| 187 | Pearl Abyss Corp. (Media & Entertainment)* | 34,786 | ||||||
| 362 | Samsung Electro-Mechanics Co. Ltd. (Technology Hardware & Equipment) | 35,047 | ||||||
| 8,530 | Samsung Electronics Co. Ltd. (Technology Hardware & Equipment) | 368,665 | ||||||
| 110 | Samsung Fire & Marine Insurance Co. Ltd. (Insurance) | 20,463 | ||||||
| 1,077 | SK Hynix, Inc. (Semiconductors & Semiconductor Equipment) | 75,730 | ||||||
|
| |||||||
| 992,054 | ||||||||
|
| |||||||
| Taiwan – 9.0% | ||||||||
| 1,000 | Largan Precision Co. Ltd. (Technology Hardware & Equipment) | 146,734 | ||||||
| 3,000 | Nien Made Enterprise Co. Ltd. (Consumer Durables & Apparel) | 27,214 | ||||||
| 5,000 | Novatek Microelectronics Corp. (Semiconductors & Semiconductor Equipment) | 32,028 | ||||||
| 896 | Sea Ltd. ADR (Media & Entertainment)* | 26,665 | ||||||
|
| |||||||
| 43,000 | Taiwan Semiconductor Manufacturing Co. Ltd. (Semiconductors & Semiconductor Equipment) | 421,392 | ||||||
|
| |||||||
| 654,033 | ||||||||
|
| |||||||
| Thailand – 1.0% | ||||||||
| 27,200 | Airports of Thailand PCL (Transportation) | 70,474 | ||||||
|
| |||||||
| Turkey – 0.2% | ||||||||
| 10,644 | Eregli Demir ve Celik Fabrikalari TAS (Materials) | 12,168 | ||||||
|
| |||||||
| United Arab Emirates – 0.4% | ||||||||
| 1,082 | NMC Health plc (Health Care Equipment & Services) | 30,671 | ||||||
|
| |||||||
| | TOTAL COMMON STOCKS (Cost $6,902,314) | $ | 7,182,095 | |||||
|
| |||||||
| Exchange Traded Fund – 0.3% | ||||||||
| 764 | iShares MSCI Malaysia ETF | $ | 21,484 | |||||
| (Cost $23,341) | ||||||||
|
| |||||||
| TOTAL INVESTMENTS – 99.0% | ||||||||
| (Cost $6,925,655) | $ | 7,203,579 | ||||||
|
| |||||||
| | OTHER ASSETS IN EXCESS OF LIABILITIES – 1.0% | 75,127 | ||||||
|
| |||||||
| NET ASSETS – 100.0% | $ | 7,278,706 | ||||||
|
| |||||||
| The percentage shown for each investment category reflects the value of investments in that category as a percentage of net assets. | ||
* | Non-income producing security. | |
(a) | Exempt from registration under Rule 144A of the Securities Act of 1933. | |
(b) | Preference Shares are a special type of equity investment that shares in the earnings of the company, has limited voting rights, and receives a greater dividend than applicable Common Shares. | |
| ||||
Investment Abbreviations: | ||||
ADR | —American Depositary Receipt | |||
GDR | —Global Depositary Receipt | |||
| ||||
| 36 | The accompanying notes are an integral part of these financial statements. |
GOLDMAN SACHS IMPRINT EMERGING MARKETS OPPORTUNITIES FUND
Schedule of Investments
October 31, 2019
| Shares | Description | Value | ||||||
| Common Stocks – 97.1% | ||||||||
| Bangladesh – 4.8% | ||||||||
| 881,968 | BRAC Bank Ltd. (Banks)* | $ | 526,455 | |||||
| 224,297 | Square Pharmaceuticals Ltd. (Pharmaceuticals, Biotechnology & Life Sciences) | 622,062 | ||||||
|
| |||||||
| 1,148,517 | ||||||||
|
| |||||||
| Brazil – 5.1% | ||||||||
| 128,700 | IRB Brasil Resseguros S/A (Insurance) | 1,212,710 | ||||||
|
| |||||||
| China – 22.4% | ||||||||
| 15,830 | 58.com, Inc. ADR (Media & Entertainment)* | 835,982 | ||||||
| 16,771 | Ctrip.com International Ltd. ADR (Retailing)* | 553,275 | ||||||
| 583,800 | Haier Smart Home Co. Ltd. Class A (Consumer Durables & Apparel) | 1,326,737 | ||||||
| 349,800 | Maoyan Entertainment (Retailing)*(a) | 503,080 | ||||||
| 5,594 | Prosus NV (Retailing)* | 385,757 | ||||||
| 248,679 | Shenzhen Inovance Technology Co. Ltd. Class A (Capital Goods) | 880,329 | ||||||
| 7,661 | TAL Education Group ADR (Consumer Services)* | 327,967 | ||||||
| 135,900 | Zhuzhou CRRC Times Electric Co. Ltd. Class H (Capital Goods) | 504,266 | ||||||
|
| |||||||
| 5,317,393 | ||||||||
|
| |||||||
| Egypt – 8.0% | ||||||||
| 1,407,483 | Cleopatra Hospital (Health Care Equipment & Services)* | 538,053 | ||||||
| 270,834 | Commercial International Bank Egypt SAE (Banks) | 1,359,204 | ||||||
|
| |||||||
| 1,897,257 | ||||||||
|
| |||||||
| Hong Kong – 1.3% | ||||||||
| 31,200 | AIA Group Ltd. (Insurance) | 310,697 | ||||||
|
| |||||||
| Indonesia – 1.6% | ||||||||
| 295,900 | Map Aktif Adiperkasa PT (Retailing)* | 115,413 | ||||||
| 3,804,400 | Mitra Adiperkasa Tbk. PT (Retailing) | 270,988 | ||||||
|
| |||||||
| 386,401 | ||||||||
|
| |||||||
| Japan – 4.9% | ||||||||
| 24,400 | Suzuki Motor Corp. (Automobiles & Components) | 1,152,024 | ||||||
|
| |||||||
| Mexico – 4.3% | ||||||||
| 252,900 | Alsea SAB de CV (Consumer Services)* | 674,698 | ||||||
| 63,333 | Grupo Financiero Banorte SAB de CV Class O (Banks) | 345,695 | ||||||
|
| |||||||
| 1,020,393 | ||||||||
|
| |||||||
| Philippines – 2.6% | ||||||||
| 318,680 | Bank of the Philippine Islands (Banks) | 608,832 | ||||||
|
| |||||||
| Russia – 2.0% | ||||||||
| 14,501 | Yandex NV Class A (Media & Entertainment)* | 484,188 | ||||||
|
| |||||||
| Common Stocks – (continued) | ||||||||
| Saudi Arabia – 1.1% | ||||||||
| 12,869 | Leejam Sports Co. JSC (Consumer Services) | 264,819 | ||||||
|
| |||||||
| Slovenia – 2.8% | ||||||||
| 55,545 | Nova Ljubljanska Banka dd GDR (Banks) | 662,858 | ||||||
|
| |||||||
| South Africa – 7.2% | ||||||||
| 11,991 | Naspers Ltd. Class N (Retailing) | 1,696,830 | ||||||
|
| |||||||
| South Korea – 7.6% | ||||||||
| 9,304 | Cosmax, Inc. (Household & Personal Products) | 636,181 | ||||||
| 2,382 | LG Chem Ltd. (Materials) | 628,479 | ||||||
| 22,587 | Orange Life Insurance Ltd. (Insurance)(a) | 543,050 | ||||||
|
| |||||||
| 1,807,710 | ||||||||
|
| |||||||
| Taiwan – 4.3% | ||||||||
| 234,000 | Delta Electronics, Inc. (Technology Hardware & Equipment) | 1,027,373 | ||||||
|
| |||||||
| Turkey – 3.3% | ||||||||
| 58,257 | Mavi Giyim Sanayi ve Ticaret A/S Class B (Consumer Durables & Apparel)*(a) | 470,101 | ||||||
| 197,419 | Sok Marketler Ticaret A/S (Food & Staples Retailing)* | 306,915 | ||||||
|
| |||||||
| 777,016 | ||||||||
|
| |||||||
| United Arab Emirates – 12.3% | ||||||||
| 663,511 | Emirates NBD PJSC (Banks) | 2,167,894 | ||||||
| 26,464 | NMC Health plc (Health Care Equipment & Services) | 750,166 | ||||||
|
| |||||||
| 2,918,060 | ||||||||
|
| |||||||
| Vietnam – 1.5% | ||||||||
| 147,012 | FPT Corp. (Technology Hardware & Equipment) | 365,969 | ||||||
|
| |||||||
| | TOTAL COMMON STOCKS (Cost $22,939,614) | $ | 23,059,047 | |||||
|
| |||||||
| The accompanying notes are an integral part of these financial statements. | 37 |
GOLDMAN SACHS IMPRINT EMERGING MARKETS OPPORTUNITIES FUND
Schedule of Investments(continued)
October 31, 2019
| Units | Description | Expiration Month | Value | |||||||||
| Right* – 0.4% | ||||||||||||
| United Arab Emirates – 0.4% | ||||||||||||
| 90,591 | Emirates NBD PJSC (Banks) | 11/2019 | $ | 86,330 | ||||||||
| (Cost $ $0) | ||||||||||||
|
| |||||||||||
| TOTAL INVESTMENTS – 97.5% | ||||||||||||
| (Cost $22,939,614) | $ | 23,145,377 | ||||||||||
|
| |||||||||||
| OTHER ASSETS IN EXCESS OF | ||||||||||||
| LIABILITIES – 2.5% | 596,788 | |||||||||||
|
| |||||||||||
| NET ASSETS – 100.0% | $ | 23,742,165 | ||||||||||
|
| |||||||||||
| The percentage shown for each investment category reflects the value of investments in that category as a percentage of net assets. | ||
* | Non-income producing security. | |
(a) | Exempt from registration under Rule 144A of the Securities Act of 1933. | |
| ||||
Investment Abbreviations: | ||||
ADR | —American Depositary Receipt | |||
GDR | —Global Depositary Receipt | |||
| ||||
| 38 | The accompanying notes are an integral part of these financial statements. |
GOLDMAN SACHS FUNDAMENTAL EMERGING MARKETS EQUITY FUNDS
Statements of Assets and Liabilities
October 31, 2019
Asia Equity Fund | Emerging Markets | ESG Emerging Markets Equity Fund | Imprint Emerging Markets Opportunities Fund | |||||||||||||||
| Assets: | ||||||||||||||||||
Investments in unaffiliated issuers, at value (cost $66,083,597, $1,674,396,837, $6,925,655 and $22,939,614)(a) | $ | 73,221,292 | $ | 1,761,462,409 | $ | 7,203,579 | $ | 23,145,377 | ||||||||||
Investments in affiliated issuers, at value (cost $461,147, $6,059,064, $0 and $0) | 461,147 | 6,059,064 | — | — | ||||||||||||||
Investments in affiliated securities lending reinvestment vehicle, at value (cost $1,018,700, $43,343,504, $0 and $0) | 1,018,700 | 43,343,504 | — | — | ||||||||||||||
Cash | 538,642 | 6,137,346 | — | 133,079 | ||||||||||||||
Foreign currencies, at value (cost $94,160, $2,470,208, $109,173 and $462,831) | 93,803 | 2,460,334 | 109,176 | 462,921 | ||||||||||||||
Receivables: | ||||||||||||||||||
Dividends | 34,760 | 993,097 | 1,908 | 7,524 | ||||||||||||||
Reimbursement from investment adviser | 33,361 | 60,307 | 40,925 | 36,627 | ||||||||||||||
Foreign tax reclaims | 23,976 | 234,960 | 1,212 | 4,656 | ||||||||||||||
Fund shares sold | 493 | 1,839,234 | — | 118,000 | ||||||||||||||
Securities lending income | 449 | 22,279 | — | — | ||||||||||||||
Investments sold | — | 1,301,667 | 9,125 | — | ||||||||||||||
Other assets | 31,670 | 84,316 | 34,332 | 26,841 | ||||||||||||||
| Total assets | 75,458,293 | 1,823,998,517 | 7,400,257 | 23,935,025 | ||||||||||||||
| Liabilities: | ||||||||||||||||||
Payables: | ||||||||||||||||||
Payable upon return of securities loaned | 1,018,700 | 43,343,504 | — | — | ||||||||||||||
Foreign capital gains taxes | 255,331 | 1,542,372 | 6,578 | 4,668 | ||||||||||||||
Management fees | 61,135 | 1,494,268 | 5,903 | 21,377 | ||||||||||||||
Fund shares redeemed | 17,125 | 1,551,156 | — | 13,005 | ||||||||||||||
Distribution and Service fees and Transfer Agency fees | 6,610 | 180,396 | 389 | 3,240 | ||||||||||||||
Due to custodian | — | — | 36,902 | — | ||||||||||||||
Accrued expenses | 148,969 | 833,043 | 71,779 | 150,570 | ||||||||||||||
| Total liabilities | 1,507,870 | 48,944,739 | 121,551 | 192,860 | ||||||||||||||
| Net Assets: | ||||||||||||||||||
Paid-in capital | 68,131,708 | 1,824,859,599 | 7,213,579 | 80,727,150 | ||||||||||||||
Total distributable earnings (loss) | 5,818,715 | (49,805,821 | ) | 65,127 | (56,984,985 | ) | ||||||||||||
| NET ASSETS | $ | 73,950,423 | $ | 1,775,053,778 | $ | 7,278,706 | $ | 23,742,165 | ||||||||||
Net Assets: | ||||||||||||||||||
Class A | $ | 13,396,684 | $ | 230,233,823 | $ | 50,104 | $ | 3,562,634 | ||||||||||
Class C | 895,892 | 30,115,362 | 49,359 | 1,248,601 | ||||||||||||||
Institutional | 6,327,251 | 940,631,771 | 6,911,680 | 4,082,360 | ||||||||||||||
Service | — | 24,182,814 | — | — | ||||||||||||||
Investor | 225,732 | 135,483,619 | 50,064 | 1,465,431 | ||||||||||||||
Class P | 52,672,966 | 389,018,969 | — | 13,374,875 | ||||||||||||||
Class R | — | — | 167,330 | — | ||||||||||||||
Class R6 | 431,898 | 25,387,420 | 50,169 | 8,264 | ||||||||||||||
Total Net Assets | $ | 73,950,423 | $ | 1,775,053,778 | $ | 7,278,706 | $ | 23,742,165 | ||||||||||
Shares outstanding $0.001 par value (unlimited shares authorized): | ||||||||||||||||||
Class A | 517,857 | 11,311,293 | 5,034 | 421,962 | ||||||||||||||
Class C | 38,716 | 1,661,902 | 5,000 | 155,625 | ||||||||||||||
Institutional | 228,989 | 43,053,677 | 692,410 | 480,696 | ||||||||||||||
Service | — | 1,228,647 | — | — | ||||||||||||||
Investor | 8,221 | 6,254,304 | 5,020 | 172,361 | ||||||||||||||
Class P | 1,911,805 | 17,730,538 | — | 1,576,305 | ||||||||||||||
Class R | — | — | 16,841 | — | ||||||||||||||
Class R6 | 15,681 | 1,157,079 | 5,025 | 973 | ||||||||||||||
Net asset value, offering and redemption price per share:(b) | ||||||||||||||||||
Class A | $25.87 | $20.35 | $9.95 | $8.44 | ||||||||||||||
Class C | 23.14 | 18.12 | 9.87 | 8.02 | ||||||||||||||
Institutional | 27.63 | 21.85 | 9.98 | 8.49 | ||||||||||||||
Service | — | 19.68 | — | — | ||||||||||||||
Investor | 27.46 | 21.66 | 9.97 | 8.50 | ||||||||||||||
Class P | 27.55 | 21.94 | — | 8.48 | ||||||||||||||
Class R | — | — | 9.94 | — | ||||||||||||||
Class R6 | 27.54 | 21.94 | 9.98 | 8.49 | ||||||||||||||
| (a) | Includes loaned securities having a market value of $994,402 and $41,817,794, for the Asia Equity and Emerging Markets Equity Funds, respectively. |
| (b) | Maximum public offering price per share for Class A Shares of the Asia Equity, Emerging Markets Equity, ESG Emerging Markets Equity and Imprint Emerging Markets Opportunities Funds is $27.38, $21.53, $10.53 and $8.93, respectively. At redemption, Class C Shares may be subject to a contingent deferred sales charge assessed on the amount equal to the lesser of the current NAV or the original purchase price of the shares. |
| The accompanying notes are an integral part of these financial statements. | 39 |
GOLDMAN SACHS FUNDAMENTAL EMERGING MARKETS EQUITY FUNDS
Statements of Operations
For the Fiscal Year Ended October 31, 2019
| Asia Equity Fund | Emerging Markets Equity Fund | ESG Emerging Equity Fund | Imprint Emerging Markets Opportunities Fund | |||||||||||||||
| Investment income: | ||||||||||||||||||
Dividends — unaffiliated issuers (net of foreign taxes withheld of $127,198, $2,956,976, $15,378 and $117,641) | $ | 1,164,097 | $ | 31,117,845 | $ | 146,821 | $ | 821,654 | ||||||||||
Dividends — affiliated issuers | 41,692 | 168,766 | 149 | — | ||||||||||||||
Securities lending income — affiliated issuer | 6,818 | 383,467 | — | 3,421 | ||||||||||||||
Income fromnon-cash dividends | — | — | — | 953,860 | ||||||||||||||
| Total investment income | 1,212,607 | 31,670,078 | 146,970 | 1,778,935 | ||||||||||||||
| Expenses: | ||||||||||||||||||
Management fees | 715,157 | 16,308,520 | 69,861 | 369,528 | ||||||||||||||
Custody, accounting and administrative services | 144,166 | 1,207,735 | 53,071 | 158,619 | ||||||||||||||
Professional fees | 121,000 | 126,571 | 93,866 | 111,969 | ||||||||||||||
Registration fees | 94,810 | 276,965 | 59,645 | 114,527 | ||||||||||||||
Distribution and Service fees(a) | 43,837 | 799,189 | 951 | 32,827 | ||||||||||||||
Transfer Agency fees(a) | 43,767 | 1,090,451 | 3,138 | 25,550 | ||||||||||||||
Printing and mailing costs | 41,591 | 280,655 | 28,760 | 39,748 | ||||||||||||||
Trustee fees | 16,023 | 18,515 | 15,922 | 15,960 | ||||||||||||||
Service share fees — Service and Shareholder Administration Plan | — | 114,490 | — | — | ||||||||||||||
Amortization of offering costs | — | — | 173,573 | — | ||||||||||||||
Other | 64,168 | 205,079 | 23,762 | 78,085 | ||||||||||||||
| Total expenses | 1,284,519 | 20,428,170 | 522,549 | 946,813 | ||||||||||||||
Less — expense reductions | (403,188 | ) | (405,936 | ) | (435,118 | ) | (458,036 | ) | ||||||||||
| Net expenses | 881,331 | 20,022,234 | 87,431 | 488,777 | ||||||||||||||
| NET INVESTMENT INCOME | 331,276 | 11,647,844 | 59,539 | 1,290,158 | ||||||||||||||
| Realized and unrealized gain (loss): | ||||||||||||||||||
Net realized gain (loss) from: | ||||||||||||||||||
Investments — unaffiliated issuers | (1,349,399 | ) | (45,896,308 | ) | (130,442 | ) | 2,729,696 | |||||||||||
Foreign currency transactions | (21,513 | ) | (27,366 | ) | (8,362 | ) | (8,384 | ) | ||||||||||
Net change in unrealized gain (loss) on: | ||||||||||||||||||
Investments — unaffiliated issuers (including the effects of the net change in the foreign capital gains tax liability of $338,838, $2,258,273, $6,488 and $0) | 13,646,035 | 300,745,103 | 1,276,785 | (1,640,849 | ) | |||||||||||||
Foreign currency translation | 185,510 | 821,270 | (159 | ) | 150 | |||||||||||||
| Net realized and unrealized gain | 12,460,633 | 255,642,699 | 1,137,822 | 1,080,613 | ||||||||||||||
| NET INCREASE IN NET ASSETS RESULTING FROM OPERATIONS | $ | 12,791,909 | $ | 267,290,543 | $ | 1,197,361 | $ | 2,370,771 | ||||||||||
| (a) | Class specific Distribution and/or Service, and Transfer Agency fees were as follows: |
| Distribution and/or Service Fees | Transfer Agency Fees | |||||||||||||||||||||||||||||||||||||||||||
Fund | Class A | Class C | Class R | Class A | Class C | Institutional | Service | Investor | Class P | Class R | Class R6 | |||||||||||||||||||||||||||||||||
Asia Equity | $ | 33,827 | $ | 10,010 | $ | — | $ | 23,908 | $ | 1,773 | $ | 2,638 | $ | — | $ | 400 | $ | 14,933 | $ | — | $ | 115 | ||||||||||||||||||||||
Emerging Markets Equity | 470,297 | 328,892 | — | 330,907 | 58,197 | 330,691 | 9,159 | 244,490 | 108,478 | — | 8,529 | |||||||||||||||||||||||||||||||||
ESG Emerging Markets Equity | 117 | 464 | 370 | 83 | 82 | 2,747 | — | 83 | — | 129 | 14 | |||||||||||||||||||||||||||||||||
Imprint Emerging Markets Opportunities | 14,687 | 18,140 | — | 10,406 | 3,218 | 3,356 | — | 4,208 | 4,358 | — | 4 | |||||||||||||||||||||||||||||||||
| 40 | The accompanying notes are an integral part of these financial statements. |
GOLDMAN SACHS FUNDAMENTAL EMERGING MARKETS EQUITY FUNDS
Statements of Changes in Net Assets
| Asia Equity Fund | Emerging Markets Equity Fund | |||||||||||||||||||||
| For the Fiscal Year Ended October 31, 2019 | For the Fiscal Year Ended October 31, 2018 | For the Fiscal Year Ended October 31, 2019 | For the Fiscal Year Ended October 31, 2018 | |||||||||||||||||||
| From operations: |
| |||||||||||||||||||||
Net investment income | $ | 331,276 | $ | 449,197 | $ | 11,647,844 | $ | 11,198,656 | ||||||||||||||
Net realized gain (loss) | (1,370,912 | ) | 4,138,041 | (45,923,674 | ) | (65,598,883 | ) | |||||||||||||||
Net change in unrealized gain (loss) | 13,831,545 | (17,738,709 | ) | 301,566,373 | (284,498,586 | ) | ||||||||||||||||
| Net increase (decrease) in net assets resulting from operations | 12,791,909 | (13,151,471 | ) | 267,290,543 | (338,898,813 | ) | ||||||||||||||||
| Distributions to shareholders: |
| |||||||||||||||||||||
From distributable earnings: | ||||||||||||||||||||||
Class A Shares | (889,921 | ) | (243,743 | ) | (673,495 | ) | (628,195 | ) | ||||||||||||||
Class C Shares | (72,137 | ) | (31,458 | ) | — | (70,973 | ) | |||||||||||||||
Institutional Shares | (433,817 | ) | (896,416 | ) | (5,268,709 | ) | (6,577,764 | ) | ||||||||||||||
Service Shares | — | — | (49,751 | ) | (162,107 | ) | ||||||||||||||||
Investor Shares | (17,126 | ) | (7,250 | ) | (901,707 | ) | (666,445 | ) | ||||||||||||||
Class P Shares(a) | (3,162,940 | ) | — | (2,644,053 | ) | — | ||||||||||||||||
Class R6 Shares | (539 | ) | — | (b) | (296,454 | ) | (1,439 | ) | ||||||||||||||
| Total distributions to shareholders | (4,576,480 | ) | (1,178,867 | ) | (9,834,169 | ) | (8,106,923 | ) | ||||||||||||||
| From share transactions: |
| |||||||||||||||||||||
Proceeds from sales of shares | 5,319,738 | 77,910,413 | 780,205,137 | 1,728,143,752 | ||||||||||||||||||
Reinvestment of distributions | 4,525,522 | 1,163,235 | 8,902,639 | 7,341,874 | ||||||||||||||||||
Cost of shares redeemed | (14,323,926 | ) | (76,099,825 | ) | (644,514,588 | ) | (890,792,904 | ) | ||||||||||||||
| Net increase (decrease) in net assets resulting from share transactions | (4,478,666 | ) | 2,973,823 | 144,593,188 | 844,692,722 | |||||||||||||||||
| TOTAL INCREASE (DECREASE) | 3,736,763 | (11,356,515 | ) | 402,049,562 | 497,686,986 | |||||||||||||||||
| Net Assets: |
| |||||||||||||||||||||
Beginning of year | 70,213,660 | 81,570,175 | 1,373,004,216 | 875,317,230 | ||||||||||||||||||
| End of year | $ | 73,950,423 | $ | 70,213,660 | $ | 1,775,053,778 | $ | 1,373,004,216 | ||||||||||||||
| (a) | Commenced operations on April 16, 2018. |
| (b) | Commenced operations on February 28, 2018. |
| The accompanying notes are an integral part of these financial statements. | 41 |
GOLDMAN SACHS FUNDAMENTAL EMERGING MARKETS EQUITY FUNDS
Statements of Changes in Net Assets(continued)
| ESG Emerging Markets Equity Fund | Imprint Emerging Markets Opportunities Fund | |||||||||||||||||||||
| For the Fiscal Year Ended October 31, 2019 | For the Period Ended October 31, 2018(a) | For the Fiscal Year Ended October 31, 2019 | For the Fiscal Year Ended October 31, 2018 | |||||||||||||||||||
| From operations: |
| |||||||||||||||||||||
Net investment income | $ | 59,539 | $ | 27,873 | $ | 1,290,158 | $ | 540,169 | ||||||||||||||
Net realized gain (loss) | (138,804 | ) | (133,896 | ) | 2,721,312 | 4,288,947 | ||||||||||||||||
Net change in unrealized gain (loss) | 1,276,626 | (1,005,277 | ) | (1,640,699 | ) | (14,322,693 | ) | |||||||||||||||
| Net increase (decrease) in net assets resulting from operations | 1,197,361 | (1,111,300 | ) | 2,370,771 | (9,493,577 | ) | ||||||||||||||||
| Distributions to shareholders: |
| |||||||||||||||||||||
From distributable earnings: | ||||||||||||||||||||||
Class A Shares | (100 | ) | — | (43,316 | ) | (1,461 | ) | |||||||||||||||
Class C Shares | — | — | — | — | ||||||||||||||||||
Institutional Shares | (27,540 | ) | — | (148,258 | ) | (166,435 | ) | |||||||||||||||
Investor Shares | (167 | ) | — | (18,320 | ) | (11,520 | ) | |||||||||||||||
Class P Shares | — | — | (211,532 | ) | — | (b) | ||||||||||||||||
Class R Shares | (34 | ) | — | — | — | |||||||||||||||||
Class R6 Shares | (206 | ) | — | (117 | ) | — | (c) | |||||||||||||||
| Total distributions to shareholders | (28,047 | ) | — | (421,543 | ) | (179,416 | ) | |||||||||||||||
| From share transactions: |
| |||||||||||||||||||||
Proceeds from sales of shares | 1,219,951 | 7,000,065 | 1,128,191 | 20,613,181 | ||||||||||||||||||
Reinvestment of distributions | 28,047 | — | 414,427 | 176,285 | ||||||||||||||||||
Cost of shares redeemed | (1,027,311 | ) | (60 | ) | (20,612,037 | ) | (49,946,724 | ) | ||||||||||||||
| Net increase (decrease) in net assets resulting from share transactions | 220,687 | 7,000,005 | (19,069,419 | ) | (29,157,258 | ) | ||||||||||||||||
| TOTAL INCREASE (DECREASE) | 1,390,001 | 5,888,705 | (17,120,191 | ) | (38,830,251 | ) | ||||||||||||||||
| Net Assets: |
| |||||||||||||||||||||
Beginning of period | 5,888,705 | — | 40,862,356 | 79,692,607 | ||||||||||||||||||
| End of period | $ | 7,278,706 | $ | 5,888,705 | $ | 23,742,165 | $ | 40,862,356 | ||||||||||||||
| (a) | Commenced operations on May 31, 2018. |
| (b) | Commenced operations on April 16, 2018. |
| (c) | Commenced operations on February 28, 2018. |
| 42 | The accompanying notes are an integral part of these financial statements. |
GOLDMAN SACHS ASIA EQUITY FUND
Selected Data for a Share Outstanding Throughout Each Year
| (a) | Calculated based on the average shares outstanding methodology. |
| (b) | Reflects income recognized from special dividends which amounted to $0.04 per share and 0.17% of average net assets. |
| (c) | Assumes investment at the net asset value at the beginning of the year, reinvestment of all distributions, a complete redemption of the investment at the net asset value at the end of the year and no sales or redemption charges (if any). Total returns would be reduced if a sales or redemption charge was taken into account. Returns do not reflect the impact of taxes to shareholders relating to Fund distributions or the redemption of Fund shares. |
| (d) | The Fund’s portfolio turnover rate is calculated in accordance with regulatory requirements, without regard to transactions involving short term investments. If such transactions were included, the Fund’s portfolio turnover rate may be higher. |
| The accompanying notes are an integral part of these financial statements. | 43 |
GOLDMAN SACHS ASIA EQUITY FUND
Financial Highlights(continued)
Selected Data for a Share Outstanding Throughout Each Year
| Goldman Sachs Asia Equity Fund | ||||||||||||||||||||||
| Class C Shares | ||||||||||||||||||||||
| Year Ended October 31, | ||||||||||||||||||||||
| 2019 | 2018 | 2017 | 2016 | 2015 | ||||||||||||||||||
| Per Share Data | ||||||||||||||||||||||
Net asset value, beginning of year | $ | 20.95 | $ | 25.31 | $ | 19.41 | $ | 18.81 | $ | 18.73 | ||||||||||||
Net investment loss(a) | (0.14 | ) | (0.13 | ) | (0.17 | )(b) | (0.15 | ) | (0.18 | ) | ||||||||||||
Net realized and unrealized gain (loss) | 3.82 | (3.84 | ) | 6.07 | 0.75 | 0.26 | ||||||||||||||||
Total from investment operations | 3.68 | (3.97 | ) | 5.90 | 0.60 | 0.08 | ||||||||||||||||
Distributions to shareholders from net realized gains | (1.49 | ) | (0.39 | ) | — | — | — | |||||||||||||||
Net asset value, end of year | $ | 23.14 | $ | 20.95 | $ | 25.31 | $ | 19.41 | $ | 18.81 | ||||||||||||
| Total return(c) | 18.66 | % | (15.94 | )% | 30.35 | % | 3.18 | % | 0.43 | % | ||||||||||||
Net assets, end of year (in 000s) | $ | 896 | $ | 1,318 | $ | 1,732 | $ | 1,810 | $ | 1,951 | ||||||||||||
Ratio of net expenses to average net assets | 2.27 | % | 2.29 | % | 2.30 | % | 2.35 | % | 2.44 | % | ||||||||||||
Ratio of total expenses to average net assets | 2.85 | % | 2.66 | % | 2.78 | % | 2.93 | % | 2.76 | % | ||||||||||||
Ratio of net investment loss to average net assets | (0.63 | )% | (0.52 | )% | (0.79 | )%(b) | (0.83 | )% | (0.91 | )% | ||||||||||||
Portfolio turnover rate(d) | 20 | % | 39 | % | 89 | % | 111 | % | 153 | % | ||||||||||||
| (a) | Calculated based on the average shares outstanding methodology. |
| (b) | Reflects income recognized from special dividends which amounted to $0.04 per share and 0.17% of average net assets. |
| (c) | Assumes investment at the net asset value at the beginning of the year, reinvestment of all distributions, a complete redemption of the investment at the net asset value at the end of the year and no sales or redemption charges (if any). Total returns would be reduced if a sales or redemption charge was taken into account. Returns do not reflect the impact of taxes to shareholders relating to Fund distributions or the redemption of Fund shares. |
| (d) | The Fund’s portfolio turnover rate is calculated in accordance with regulatory requirements, without regard to transactions involving short term investments. If such transactions were included, the Fund’s portfolio turnover rate may be higher. |
| 44 | The accompanying notes are an integral part of these financial statements. |
GOLDMAN SACHS ASIA EQUITY FUND
Financial Highlights(continued)
Selected Data for a Share Outstanding Throughout Each Year
| Goldman Sachs Asia Equity Fund | ||||||||||||||||||||||
| Institutional Shares | ||||||||||||||||||||||
| Year Ended October 31, | ||||||||||||||||||||||
| 2019 | 2018 | 2017 | 2016 | 2015 | ||||||||||||||||||
| Per Share Data | ||||||||||||||||||||||
Net asset value, beginning of year | $ | 24.56 | $ | 29.28 | $ | 22.20 | $ | 21.27 | $ | 20.99 | ||||||||||||
Net investment income(a) | 0.14 | 0.19 | 0.09 | (b) | 0.07 | 0.05 | ||||||||||||||||
Net realized and unrealized gain (loss) | 4.50 | (4.51 | ) | 6.99 | 0.86 | 0.29 | ||||||||||||||||
Total from investment operations | 4.64 | (4.32 | ) | 7.08 | 0.93 | 0.34 | ||||||||||||||||
Distributions to shareholders from net investment income | (0.08 | ) | (0.01 | ) | — | — | (0.06 | ) | ||||||||||||||
Distributions to shareholders from net realized gains | (1.49 | ) | (0.39 | ) | — | — | — | |||||||||||||||
Total distributions | (1.57 | ) | (0.40 | ) | — | — | (0.06 | ) | ||||||||||||||
Net asset value, end of year | $ | 27.63 | $ | 24.56 | $ | 29.28 | $ | 22.20 | �� | $ | 21.27 | |||||||||||
| Total return(c) | 19.98 | % | (14.98 | )% | 31.91 | % | 4.31 | % | 1.60 | % | ||||||||||||
Net assets, end of year (in 000s) | $ | 6,327 | $ | 6,997 | $ | 62,843 | $ | 56,077 | $ | 58,967 | ||||||||||||
Ratio of net expenses to average net assets | 1.15 | % | 1.15 | % | 1.15 | % | 1.20 | % | 1.29 | % | ||||||||||||
Ratio of total expenses to average net assets | 1.71 | % | 1.47 | % | 1.63 | % | 1.78 | % | 1.61 | % | ||||||||||||
Ratio of net investment income to average net assets | 0.54 | % | 0.63 | % | 0.36 | %(b) | 0.32 | % | 0.21 | % | ||||||||||||
Portfolio turnover rate(d) | 20 | % | 39 | % | 89 | % | 111 | % | 153 | % | ||||||||||||
| (a) | Calculated based on the average shares outstanding methodology. |
| (b) | Reflects income recognized from special dividends which amounted to $0.04 per share and 0.17% of average net assets. |
| (c) | Assumes investment at the net asset value at the beginning of the year, reinvestment of all distributions, a complete redemption of the investment at the net asset value at the end of the year and no sales or redemption charges (if any). Total returns would be reduced if a sales or redemption charge was taken into account. Returns do not reflect the impact of taxes to shareholders relating to Fund distributions or the redemption of Fund shares. |
| (d) | The Fund’s portfolio turnover rate is calculated in accordance with regulatory requirements, without regard to transactions involving short term investments. If such transactions were included, the Fund’s portfolio turnover rate may be higher. |
| The accompanying notes are an integral part of these financial statements. | 45 |
GOLDMAN SACHS ASIA EQUITY FUND
Financial Highlights(continued)
Selected Data for a Share Outstanding Throughout Each Year
| Goldman Sachs Asia Equity Fund | ||||||||||||||||||||||
| Investor Shares(a) | ||||||||||||||||||||||
| Year Ended October 31, | ||||||||||||||||||||||
| 2019 | 2018 | 2017 | 2016 | 2015 | ||||||||||||||||||
| Per Share Data | ||||||||||||||||||||||
Net asset value, beginning of year | $ | 24.41 | $ | 29.14 | $ | 22.12 | $ | 21.23 | $ | 20.98 | ||||||||||||
Net investment income(b) | 0.09 | 0.15 | 0.06 | (c) | 0.06 | 0.01 | ||||||||||||||||
Net realized and unrealized gain (loss) | 4.50 | (4.48 | ) | 6.96 | 0.83 | 0.29 | ||||||||||||||||
Total from investment operations | 4.59 | (4.33 | ) | 7.02 | 0.89 | 0.30 | ||||||||||||||||
Distributions to shareholders from net investment income | (0.05 | ) | (0.01 | ) | — | — | (0.05 | ) | ||||||||||||||
Distributions to shareholders from net realized gains | (1.49 | ) | (0.39 | ) | — | — | — | |||||||||||||||
Total distributions | (1.54 | ) | (0.40 | ) | — | — | (0.05 | ) | ||||||||||||||
Net asset value, end of year | $ | 27.46 | $ | 24.41 | $ | 29.14 | $ | 22.12 | $ | 21.23 | ||||||||||||
| Total return(d) | 19.86 | % | (15.11 | )% | 31.74 | % | 4.18 | % | 1.46 | % | ||||||||||||
Net assets, end of year (in 000s) | $ | 226 | $ | 392 | $ | 136 | $ | 57 | $ | 52 | ||||||||||||
Ratio of net expenses to average net assets | 1.27 | % | 1.29 | % | 1.30 | % | 1.34 | % | 1.44 | % | ||||||||||||
Ratio of total expenses to average net assets | 1.85 | % | 1.63 | % | 1.78 | % | 1.93 | % | 1.75 | % | ||||||||||||
Ratio of net investment income to average net assets | 0.35 | % | 0.52 | % | 0.24 | %(c) | 0.27 | % | 0.06 | % | ||||||||||||
Portfolio turnover rate(e) | 20 | % | 39 | % | 89 | % | 111 | % | 153 | % | ||||||||||||
| (a) | Effective August 15, 2017, Class IR changed its name to Investor Shares. |
| (b) | Calculated based on the average shares outstanding methodology. |
| (c) | Reflects income recognized from special dividends which amounted to $0.04 per share and 0.17% of average net assets. |
| (d) | Assumes investment at the net asset value at the beginning of the year, reinvestment of all distributions, a complete redemption of the investment at the net asset value at the end of the year and no sales or redemption charges (if any). Total returns would be reduced if a sales or redemption charge was taken into account. Returns do not reflect the impact of taxes to shareholders relating to Fund distributions or the redemption of Fund shares. |
| (e) | The Fund’s portfolio turnover rate is calculated in accordance with regulatory requirements, without regard to transactions involving short term investments. If such transactions were included, the Fund’s portfolio turnover rate may be higher. |
| 46 | The accompanying notes are an integral part of these financial statements. |
GOLDMAN SACHS ASIA EQUITY FUND
Financial Highlights(continued)
Selected Data for a Share Outstanding Throughout Each Period
| Goldman Sachs Asia Equity Fund | ||||||||||
| Class P Shares | ||||||||||
| Year Ended October 31, 2019 | April 16, 2018* to October 31, 2018 | |||||||||
| Per Share Data | ||||||||||
Net asset value, beginning of period | $ | 24.57 | $ | 30.61 | ||||||
Net investment income(a) | 0.14 | 0.09 | ||||||||
Net realized and unrealized gain (loss) | 4.49 | (6.13 | ) | |||||||
Total from investment operations | 4.63 | (6.04 | ) | |||||||
Distributions to shareholders from net investment income | (0.16 | ) | — | |||||||
Distributions to shareholders from net realized gains | (1.49 | ) | — | |||||||
Total distributions | (1.65 | ) | — | |||||||
Net asset value, end of period | $ | 27.55 | $ | 24.57 | ||||||
| Total return(b) | 19.98 | % | (19.73 | )% | ||||||
Net assets, end of period (in 000s) | $ | 52,673 | $ | 47,901 | ||||||
Ratio of net expenses to average net assets | 1.15 | % | 1.14 | %(c) | ||||||
Ratio of total expenses to average net assets | 1.70 | % | 1.77 | %(c) | ||||||
Ratio of net investment income to average net assets | 0.55 | % | 0.59 | %(c) | ||||||
Portfolio turnover rate(d) | 20 | % | 39 | % | ||||||
| * | Commencement of operations. |
| (a) | Calculated based on the average shares outstanding methodology. |
| (b) | Assumes investment at the net asset value at the beginning of the period, reinvestment of all distributions, a complete redemption of the investment at the net asset value at the end of the period and no sales or redemption charges (if any). Total returns would be reduced if a sales or redemption charge was taken into account. Returns do not reflect the impact of taxes to shareholders relating to Fund distributions or the redemption of Fund shares. Total returns for periods less than one full year are not annualized. |
| (c) | Annualized. |
| (d) | The Fund’s portfolio turnover rate is calculated in accordance with regulatory requirements, without regard to transactions involving short term investments. If such transactions were included, the Fund’s portfolio turnover rate may be higher. |
| The accompanying notes are an integral part of these financial statements. | 47 |
GOLDMAN SACHS ASIA EQUITY FUND
Financial Highlights(continued)
Selected Data for a Share Outstanding Throughout Each Period
| Goldman Sachs Asia Equity Fund | ||||||||||
| Class R6 Shares | ||||||||||
| Year Ended October 31, 2019 | February 28, 2018* to October 31, 2018 | |||||||||
| Per Share Data | ||||||||||
Net asset value, beginning of period | $ | 24.56 | $ | 30.83 | ||||||
Net investment income(a) | 0.15 | 0.19 | ||||||||
Net realized and unrealized gain (loss) | 4.48 | (6.46 | ) | |||||||
Total from investment operations | 4.63 | (6.27 | ) | |||||||
Distributions to shareholders from net investment income | (0.16 | ) | — | |||||||
Distributions to shareholders from net realized gains | (1.49 | ) | — | |||||||
Total distributions | (1.65 | ) | — | |||||||
Net asset value, end of period | $ | 27.54 | $ | 24.56 | ||||||
| Total return(b) | 19.96 | % | (20.34 | )% | ||||||
Net assets, end of period (in 000s) | $ | 432 | $ | 8 | ||||||
Ratio of net expenses to average net assets | 1.15 | % | 1.15 | %(c) | ||||||
Ratio of total expenses to average net assets | 1.70 | % | 1.55 | %(c) | ||||||
Ratio of net investment income to average net assets | 0.57 | % | 1.00 | %(c) | ||||||
Portfolio turnover rate(d) | 20 | % | 39 | % | ||||||
| * | Commencement of operations. |
| (a) | Calculated based on the average shares outstanding methodology. |
| (b) | Assumes investment at the net asset value at the beginning of the period, reinvestment of all distributions, a complete redemption of the investment at the net asset value at the end of the period and no sales or redemption charges (if any). Total returns would be reduced if a sales or redemption charge was taken into account. Returns do not reflect the impact of taxes to shareholders relating to Fund distributions or the redemption of Fund shares. Total returns for periods less than one full year are not annualized. |
| (c) | Annualized. |
| (d) | The Fund’s portfolio turnover rate is calculated in accordance with regulatory requirements, without regard to transactions involving short term investments. If such transactions were included, the Fund’s portfolio turnover rate may be higher. |
| 48 | The accompanying notes are an integral part of these financial statements. |
GOLDMAN SACHS EMERGING MARKETS EQUITY FUND
Financial Highlights(continued)
Selected Data for a Share Outstanding Throughout Each Year
| (a) | Calculated based on the average shares outstanding methodology. |
| (b) | Reflects income recognized from special dividends which amounted to $0.04 per share and 0.19% of average net assets. |
| (c) | Assumes investment at the net asset value at the beginning of the year, reinvestment of all distributions, a complete redemption of the investment at the net asset value at the end of the year and no sales or redemption charges (if any). Total returns would be reduced if a sales or redemption charge was taken into account. Returns do not reflect the impact of taxes to shareholders relating to Fund distributions or the redemption of Fund shares. |
| (d) | The Fund’s portfolio turnover rate is calculated in accordance with regulatory requirements, without regard to transactions involving short term investments. If such transactions were included, the Fund’s portfolio turnover rate may be higher. |
| The accompanying notes are an integral part of these financial statements. | 49 |
GOLDMAN SACHS EMERGING MARKETS EQUITY FUND
Financial Highlights(continued)
Selected Data for a Share Outstanding Throughout Each Year
| Goldman Sachs Emerging Markets Equity Fund | ||||||||||||||||||||||
| Class C Shares | ||||||||||||||||||||||
| Year Ended October 31, | ||||||||||||||||||||||
| 2019 | 2018 | 2017 | 2016 | 2015 | ||||||||||||||||||
| Per Share Data | ||||||||||||||||||||||
Net asset value, beginning of year | $ | 15.34 | $ | 18.72 | $ | 14.53 | $ | 13.31 | $ | 14.55 | ||||||||||||
Net investment loss(a) | (0.06 | ) | (0.05 | ) | (0.09 | )(b) | (0.06 | ) | (0.10 | ) | ||||||||||||
Net realized and unrealized gain (loss) | 2.84 | (3.30 | ) | 4.28 | 1.28 | (1.14 | ) | |||||||||||||||
Total from investment operations | 2.78 | (3.35 | ) | 4.19 | 1.22 | (1.24 | ) | |||||||||||||||
Distributions to shareholders from net investment income | — | (0.03 | ) | — | — | — | ||||||||||||||||
Net asset value, end of year | $ | 18.12 | $ | 15.34 | $ | 18.72 | $ | 14.53 | $ | 13.31 | ||||||||||||
| Total return(c) | 18.12 | % | (17.91 | )% | 28.84 | % | 9.14 | % | (8.52 | )% | ||||||||||||
Net assets, end of year (in 000s) | $ | 30,115 | $ | 33,252 | $ | 36,286 | $ | 30,104 | $ | 35,927 | ||||||||||||
Ratio of net expenses to average net assets | 2.30 | % | 2.31 | % | 2.32 | % | 2.40 | % | 2.41 | % | ||||||||||||
Ratio of total expenses to average net assets | 2.33 | % | 2.39 | % | 2.50 | % | 2.65 | % | 2.67 | % | ||||||||||||
Ratio of net investment loss to average net assets | (0.33 | )% | (0.25 | )% | (0.55 | )%(b) | (0.48 | )% | (0.68 | )% | ||||||||||||
Portfolio turnover rate(d) | 33 | % | 52 | % | 113 | % | 92 | % | 118 | % | ||||||||||||
| (a) | Calculated based on the average shares outstanding methodology. |
| (b) | Reflects income recognized from special dividends which amounted to $0.04 per share and 0.19% of average net assets. |
| (c) | Assumes investment at the net asset value at the beginning of the year, reinvestment of all distributions, a complete redemption of the investment at the net asset value at the end of the year and no sales or redemption charges (if any). Total returns would be reduced if a sales or redemption charge was taken into account. Returns do not reflect the impact of taxes to shareholders relating to Fund distributions or the redemption of Fund shares. |
| (d) | The Fund’s portfolio turnover rate is calculated in accordance with regulatory requirements, without regard to transactions involving short term investments. If such transactions were included, the Fund’s portfolio turnover rate may be higher. |
| 50 | The accompanying notes are an integral part of these financial statements. |
GOLDMAN SACHS EMERGING MARKETS EQUITY FUND
Financial Highlights(continued)
Selected Data for a Share Outstanding Throughout Each Year
| Goldman Sachs Emerging Markets Equity Fund | ||||||||||||||||||||||
| Institutional Shares | ||||||||||||||||||||||
| Year Ended October 31, | ||||||||||||||||||||||
| 2019 | 2018 | 2017 | 2016 | 2015 | ||||||||||||||||||
| Per Share Data | ||||||||||||||||||||||
Net asset value, beginning of year | $ | 18.43 | $ | 22.40 | $ | 17.38 | $ | 15.75 | $ | 17.08 | ||||||||||||
Net investment income(a) | 0.17 | 0.20 | 0.12 | (b) | 0.11 | 0.08 | ||||||||||||||||
Net realized and unrealized gain (loss) | 3.40 | (3.96 | ) | 5.07 | 1.54 | (1.36 | ) | |||||||||||||||
Total from investment operations | 3.57 | (3.76 | ) | 5.19 | 1.65 | (1.28 | ) | |||||||||||||||
Distributions to shareholders from net investment income | (0.15 | ) | (0.21 | ) | (0.17 | ) | (0.02 | ) | (0.05 | ) | ||||||||||||
Net asset value, end of year | $ | 21.85 | $ | 18.43 | $ | 22.40 | $ | 17.38 | $ | 15.75 | ||||||||||||
| Total return(c) | 19.51 | % | (16.99 | )% | 30.31 | % | 10.43 | % | (7.49 | )% | ||||||||||||
Net assets, end of year (in 000s) | $ | 940,632 | $ | 678,197 | $ | 664,085 | $ | 445,019 | $ | 326,068 | ||||||||||||
Ratio of net expenses to average net assets | 1.17 | % | 1.17 | % | 1.18 | % | 1.25 | % | 1.28 | % | ||||||||||||
Ratio of total expenses to average net assets | 1.19 | % | 1.24 | % | 1.36 | % | 1.50 | % | 1.52 | % | ||||||||||||
Ratio of net investment income to average net assets | 0.84 | % | 0.91 | % | 0.63 | %(b) | 0.69 | % | 0.48 | % | ||||||||||||
Portfolio turnover rate(d) | 33 | % | 52 | % | 113 | % | 92 | % | 118 | % | ||||||||||||
| (a) | Calculated based on the average shares outstanding methodology. |
| (b) | Reflects income recognized from special dividends which amounted to $0.04 per share and 0.19% of average net assets. |
| (c) | Assumes investment at the net asset value at the beginning of the year, reinvestment of all distributions, a complete redemption of the investment at the net asset value at the end of the year and no sales or redemption charges (if any). Total returns would be reduced if a sales or redemption charge was taken into account. Returns do not reflect the impact of taxes to shareholders relating to Fund distributions or the redemption of Fund shares. |
| (d) | The Fund’s portfolio turnover rate is calculated in accordance with regulatory requirements, without regard to transactions involving short term investments. If such transactions were included, the Fund’s portfolio turnover rate may be higher. |
| The accompanying notes are an integral part of these financial statements. | 51 |
GOLDMAN SACHS EMERGING MARKETS EQUITY FUND
Financial Highlights(continued)
Selected Data for a Share Outstanding Throughout Each Year
| Goldman Sachs Emerging Markets Equity Fund | ||||||||||||||||||||||
| Service Shares | ||||||||||||||||||||||
| Year Ended October 31, | ||||||||||||||||||||||
| 2019 | 2018 | 2017 | 2016 | 2015 | ||||||||||||||||||
| Per Share Data | ||||||||||||||||||||||
Net asset value, beginning of year | $ | 16.60 | $ | 20.21 | $ | 15.71 | $ | 14.29 | $ | 15.52 | ||||||||||||
Net investment income(a) | 0.06 | 0.07 | 0.02 | (b) | 0.02 | — | (c) | |||||||||||||||
Net realized and unrealized gain (loss) | 3.06 | (3.56 | ) | 4.59 | 1.40 | (1.23 | ) | |||||||||||||||
Total from investment operations | 3.12 | (3.49 | ) | 4.61 | 1.42 | (1.23 | ) | |||||||||||||||
Distributions to shareholders from net investment income | (0.04 | ) | (0.12 | ) | (0.11 | ) | — | — | ||||||||||||||
Net asset value, end of year | $ | 19.68 | $ | 16.60 | $ | 20.21 | $ | 15.71 | $ | 14.29 | ||||||||||||
| Total return(d) | 18.85 | % | (17.38 | )% | 29.65 | % | 9.91 | % | (7.93 | )% | ||||||||||||
Net assets, end of year (in 000s) | $ | 24,183 | $ | 19,922 | $ | 26,049 | $ | 19,069 | $ | 15,759 | ||||||||||||
Ratio of net expenses to average net assets | 1.67 | % | 1.67 | % | 1.68 | % | 1.75 | % | 1.77 | % | ||||||||||||
Ratio of total expenses to average net assets | 1.69 | % | 1.75 | % | 1.86 | % | 2.00 | % | 2.02 | % | ||||||||||||
Ratio of net investment income to average net assets | 0.32 | % | 0.36 | % | 0.11 | %(b) | 0.17 | % | 0.02 | % | ||||||||||||
Portfolio turnover rate(e) | 33 | % | 52 | % | 113 | % | 92 | % | 118 | % | ||||||||||||
| (a) | Calculated based on the average shares outstanding methodology. |
| (b) | Reflects income recognized from special dividends which amounted to $0.04 per share and 0.19% of average net assets. |
| (c) | Amount is less than $0.005 per share. |
| (d) | Assumes investment at the net asset value at the beginning of the year, reinvestment of all distributions, a complete redemption of the investment at the net asset value at the end of the year and no sales or redemption charges (if any). Total returns would be reduced if a sales or redemption charge was taken into account. Returns do not reflect the impact of taxes to shareholders relating to Fund distributions or the redemption of Fund shares. |
| (e) | The Fund’s portfolio turnover rate is calculated in accordance with regulatory requirements, without regard to transactions involving short term investments. If such transactions were included, the Fund’s portfolio turnover rate may be higher. |
| 52 | The accompanying notes are an integral part of these financial statements. |
GOLDMAN SACHS EMERGING MARKETS EQUITY FUND
Financial Highlights(continued)
Selected Data for a Share Outstanding Throughout Each Year
| Goldman Sachs Emerging Markets Equity Fund | ||||||||||||||||||||||
| Investor Shares(a) | ||||||||||||||||||||||
| Year Ended October 31, | ||||||||||||||||||||||
| 2019 | 2018 | 2017 | 2016 | 2015 | ||||||||||||||||||
| Per Share Data | ||||||||||||||||||||||
Net asset value, beginning of year | $ | 18.28 | $ | 22.24 | $ | 17.27 | $ | 15.67 | $ | 16.99 | ||||||||||||
Net investment income(b) | 0.12 | 0.17 | 0.13 | (c) | 0.08 | 0.01 | ||||||||||||||||
Net realized and unrealized gain (loss) | 3.38 | (3.94 | ) | 5.01 | 1.53 | (1.30 | ) | |||||||||||||||
Total from investment operations | 3.50 | (3.77 | ) | 5.14 | 1.61 | (1.29 | ) | |||||||||||||||
Distributions to shareholders from net investment income | (0.12 | ) | (0.19 | ) | (0.17 | ) | (0.01 | ) | (0.03 | ) | ||||||||||||
Net asset value, end of year | �� | $ | 21.66 | $ | 18.28 | $ | 22.24 | $ | 17.27 | $ | 15.67 | |||||||||||
| Total return(d) | 19.31 | % | (17.07 | )% | 30.11 | % | 10.26 | % | (7.62 | )% | ||||||||||||
Net assets, end of year (in 000s) | $ | 135,484 | $ | 139,726 | $ | 62,974 | $ | 5,263 | $ | 1,424 | ||||||||||||
Ratio of net expenses to average net assets | 1.30 | % | 1.31 | % | 1.31 | % | 1.40 | % | 1.42 | % | ||||||||||||
Ratio of total expenses to average net assets | 1.33 | % | 1.38 | % | 1.49 | % | 1.64 | % | 1.69 | % | ||||||||||||
Ratio of net investment income to average net assets | 0.58 | % | 0.79 | % | 0.67 | %(c) | 0.52 | % | 0.04 | % | ||||||||||||
Portfolio turnover rate(e) | 33 | % | 52 | % | 113 | % | 92 | % | 118 | % | ||||||||||||
| (a) | Effective August 15, 2017, Class IR changed its name to Investor Shares. |
| (b) | Calculated based on the average shares outstanding methodology. |
| (c) | Reflects income recognized from special dividends which amounted to $0.04 per share and 0.19% of average net assets. |
| (d) | Assumes investment at the net asset value at the beginning of the year, reinvestment of all distributions, a complete redemption of the investment at the net asset value at the end of the year and no sales or redemption charges (if any). Total returns would be reduced if a sales or redemption charge was taken into account. Returns do not reflect the impact of taxes to shareholders relating to Fund distributions or the redemption of Fund shares. |
| (e) | The Fund’s portfolio turnover rate is calculated in accordance with regulatory requirements, without regard to transactions involving short term investments. If such transactions were included, the Fund’s portfolio turnover rate may be higher. |
| The accompanying notes are an integral part of these financial statements. | 53 |
GOLDMAN SACHS EMERGING MARKETS EQUITY FUND
Financial Highlights(continued)
Selected Data for a Share Outstanding Throughout Each Period
| Goldman Sachs Emerging Markets Equity Fund | ||||||||||
| Class P Shares | ||||||||||
| Year Ended October 31, 2019 | April 16, 2018* October 31, 2018 | |||||||||
| Per Share Data | ||||||||||
Net asset value, beginning of period | $ | 18.51 | $ | 23.46 | ||||||
Net investment income(a) | 0.17 | 0.10 | ||||||||
Net realized and unrealized gain (loss) | 3.41 | (5.05 | ) | |||||||
Total from investment operations | 3.58 | (4.95 | ) | |||||||
Distributions to shareholders from net investment income | (0.15 | ) | — | |||||||
Net asset value, end of period | $ | 21.94 | $ | 18.51 | ||||||
| Total return(b) | 19.47 | % | (21.06 | )% | ||||||
Net assets, end of period (in 000s) | $ | 389,019 | $ | 311,447 | ||||||
Ratio of net expenses to average net assets | 1.16 | % | 1.15 | %(c) | ||||||
Ratio of total expenses to average net assets | 1.18 | % | 1.24 | %(c) | ||||||
Ratio of net investment income to average net assets | 0.82 | % | 0.94 | %(c) | ||||||
Portfolio turnover rate(d) | 33 | % | 52 | % | ||||||
| * | Commencement of operations. |
| (a) | Calculated based on the average shares outstanding methodology. |
| (b) | Assumes investment at the net asset value at the beginning of the period, reinvestment of all distributions, a complete redemption of the investment at the net asset value at the end of the period and no sales or redemption charges (if any). Total returns would be reduced if a sales or redemption charge was taken into account. Returns do not reflect the impact of taxes to shareholders relating to Fund distributions or the redemption of Fund shares. Total returns for periods less than one full year are not annualized. |
| (c) | Annualized. |
| (d) | The Fund’s portfolio turnover rate is calculated in accordance with regulatory requirements, without regard to transactions involving short term investments. If such transactions were included, the Fund’s portfolio turnover rate may be higher. |
| 54 | The accompanying notes are an integral part of these financial statements. |
GOLDMAN SACHS EMERGING MARKETS EQUITY FUND
Financial Highlights(continued)
Selected Data for a Share Outstanding Throughout Each Period
| Goldman Sachs Emerging Markets Equity Fund | ||||||||||||||||||||||
| Class R6 Shares | ||||||||||||||||||||||
| Year Ended October 31, | July 31, 2015* October 31, 2015
| |||||||||||||||||||||
| 2019 | 2018 | 2017 | 2016 | |||||||||||||||||||
| Per Share Data | ||||||||||||||||||||||
Net asset value, beginning of period | $ | 18.51 | $ | 22.41 | $ | 17.38 | $ | 15.74 | $ | 16.72 | ||||||||||||
Net investment income(a) | 0.17 | 0.21 | 0.16 | (b) | 0.10 | 0.01 | ||||||||||||||||
Net realized and unrealized gain (loss) | 3.41 | (4.00 | ) | 5.05 | 1.56 | (0.99 | ) | |||||||||||||||
Total from investment operations | 3.58 | (3.79 | ) | 5.21 | 1.66 | (0.98 | ) | |||||||||||||||
Distributions to shareholders from net investment income | (0.15 | ) | (0.11 | ) | (0.18 | ) | (0.02 | ) | — | |||||||||||||
Net asset value, end of period | $ | 21.94 | $ | 18.51 | $ | 22.41 | $ | 17.38 | $ | 15.74 | ||||||||||||
| Total return(c) | 19.52 | % | (16.96 | )% | 30.35 | % | 10.52 | % | (5.86 | )% | ||||||||||||
Net assets, end of period (in 000s) | $ | 25,387 | $ | 37,865 | $ | 245 | $ | 5,012 | $ | 9 | ||||||||||||
Ratio of net expenses to average net assets | 1.16 | % | 1.16 | % | 1.17 | % | 1.23 | % | 1.24 | %(d) | ||||||||||||
Ratio of total expenses to average net assets | 1.18 | % | 1.21 | % | 1.35 | % | 1.44 | % | 1.53 | %(d) | ||||||||||||
Ratio of net investment income to average net assets | 0.82 | % | 0.99 | % | 0.88 | %(b) | 0.57 | % | 0.14 | %(d) | ||||||||||||
Portfolio turnover rate(e) | 33 | % | 52 | % | 113 | % | 92 | % | 118 | % | ||||||||||||
| * | Commencement of operations. |
| (a) | Calculated based on the average shares outstanding methodology. |
| (b) | Reflects income recognized from special dividends which amounted to $0.04 per share and 0.19% of average net assets. |
| (c) | Assumes investment at the net asset value at the beginning of the period, reinvestment of all distributions, a complete redemption of the investment at the net asset value at the end of the period and no sales or redemption charges (if any). Total returns would be reduced if a sales or redemption charge was taken into account. Returns do not reflect the impact of taxes to shareholders relating to Fund distributions or the redemption of Fund shares. Total returns for periods less than one full year are not annualized. |
| (d) | Annualized. |
| (e) | The Fund’s portfolio turnover rate is calculated in accordance with regulatory requirements, without regard to transactions involving short term investments. If such transactions were included, the Fund’s portfolio turnover rate may be higher. |
| The accompanying notes are an integral part of these financial statements. | 55 |
GOLDMAN SACHS ESG EMERGING MARKETS EQUITY FUND
Financial Highlights(continued)
Selected Data for a Share Outstanding Throughout Each Period
| * | Commencement of operations. |
| (a) | Calculated based on the average shares outstanding methodology. |
| (b) | Assumes investment at the net asset value at the beginning of the period, reinvestment of all distributions, a complete redemption of the investment at the net asset value at the end of the period and no sales or redemption charges (if any). Total returns would be reduced if a sales or redemption charge was taken into account. Returns do not reflect the impact of taxes to shareholders relating to Fund distributions or the redemption of Fund shares. Total returns for periods less than one full year are not annualized. |
| (c) | Annualized. |
| (d) | The Fund’s portfolio turnover rate is calculated in accordance with regulatory requirements, without regard to transactions involving short term investments. If such transactions were included, the Fund’s portfolio turnover rate may be higher. |
| 56 | The accompanying notes are an integral part of these financial statements. |
GOLDMAN SACHS ESG EMERGING MARKETS EQUITY FUND
Financial Highlights(continued)
Selected Data for a Share Outstanding Throughout Each Period
| Goldman Sachs ESG Emerging Markets Equity Fund | ||||||||||
| Class C Shares | ||||||||||
| Year Ended October 31, 2019 | May 31, 2018* October 31, 2018 | |||||||||
| Per Share Data | ||||||||||
Net asset value, beginning of period | $ | 8.37 | $ | 10.00 | ||||||
Net investment loss(a) | (0.03 | ) | — | (b) | ||||||
Net realized and unrealized gain (loss) | 1.53 | (1.63 | ) | |||||||
Total from investment operations | 1.50 | (1.63 | ) | |||||||
Net asset value, end of period | $ | 9.87 | $ | 8.37 | ||||||
| Total return(c) | 17.92 | % | (16.30 | )% | ||||||
Net assets, end of period (in 000s) | $ | 49 | $ | 42 | ||||||
Ratio of net expenses to average net assets | 2.35 | % | 2.28 | %(d) | ||||||
Ratio of total expenses to average net assets | 8.49 | % | 11.03 | %(d) | ||||||
Ratio of net investment loss to average net assets | (0.31 | )% | (0.11 | )%(d) | ||||||
Portfolio turnover rate(e) | 57 | % | 23 | % | ||||||
| * | Commencement of operations. |
| (a) | Calculated based on the average shares outstanding methodology. |
| (b) | Amount is less than $0.005 per share. |
| (c) | Assumes investment at the net asset value at the beginning of the period, reinvestment of all distributions, a complete redemption of the investment at the net asset value at the end of the period and no sales or redemption charges (if any). Total returns would be reduced if a sales or redemption charge was taken into account. Returns do not reflect the impact of taxes to shareholders relating to Fund distributions or the redemption of Fund shares. Total returns for periods less than one full year are not annualized. |
| (d) | Annualized. |
| (e) | The Fund’s portfolio turnover rate is calculated in accordance with regulatory requirements, without regard to transactions involving short term investments. If such transactions were included, the Fund’s portfolio turnover rate may be higher. |
| The accompanying notes are an integral part of these financial statements. | 57 |
GOLDMAN SACHS ESG EMERGING MARKETS EQUITY FUND
Financial Highlights(continued)
Selected Data for a Share Outstanding Throughout Each Period
| Goldman Sachs ESG Emerging Markets Equity Fund | ||||||||||
| Institutional Shares | ||||||||||
| Year Ended October 31, 2019 | May 31, 2018* October 31, 2018 | |||||||||
| Per Share Data | ||||||||||
Net asset value, beginning of period | $ | 8.41 | $ | 10.00 | ||||||
Net investment income(a) | 0.08 | 0.04 | ||||||||
Net realized and unrealized gain (loss) | 1.53 | (1.63 | ) | |||||||
Total from investment operations | 1.61 | (1.59 | ) | |||||||
Distributions to shareholders from net investment income | (0.04 | ) | — | |||||||
Net asset value, end of period | $ | 9.98 | $ | 8.41 | ||||||
| Total return(b) | 19.26 | % | (15.90 | )% | ||||||
Net assets, end of period (in 000s) | $ | 6,912 | $ | 5,679 | ||||||
Ratio of net expenses to average net assets | 1.21 | % | 1.14 | %(c) | ||||||
Ratio of total expenses to average net assets | 7.31 | % | 9.89 | %(c) | ||||||
Ratio of net investment income to average net assets | 0.85 | % | 1.03 | %(c) | ||||||
Portfolio turnover rate(d) | 57 | % | 23 | % | ||||||
| * | Commencement of operations. |
| (a) | Calculated based on the average shares outstanding methodology. |
| (b) | Assumes investment at the net asset value at the beginning of the period, reinvestment of all distributions, a complete redemption of the investment at the net asset value at the end of the period and no sales or redemption charges (if any). Total returns would be reduced if a sales or redemption charge was taken into account. Returns do not reflect the impact of taxes to shareholders relating to Fund distributions or the redemption of Fund shares. Total returns for periods less than one full year are not annualized. |
| (c) | Annualized. |
| (d) | The Fund’s portfolio turnover rate is calculated in accordance with regulatory requirements, without regard to transactions involving short term investments. If such transactions were included, the Fund’s portfolio turnover rate may be higher. |
| 58 | The accompanying notes are an integral part of these financial statements. |
GOLDMAN SACHS ESG EMERGING MARKETS EQUITY FUND
Financial Highlights(continued)
Selected Data for a Share Outstanding Throughout Each Period
| Goldman Sachs ESG Emerging Markets Equity Fund | ||||||||||
| Investor Shares | ||||||||||
| Year Ended October 31, 2019 | May 31, 2018* to October 31, 2018 | |||||||||
| Per Share Data | ||||||||||
Net asset value, beginning of period | $ | 8.41 | $ | 10.00 | ||||||
Net investment income(a) | 0.06 | 0.03 | ||||||||
Net realized and unrealized gain (loss) | 1.53 | (1.62 | ) | |||||||
Total from investment operations | 1.59 | (1.59 | ) | |||||||
Distributions to shareholders from net investment income | (0.03 | ) | — | |||||||
Net asset value, end of period | $ | 9.97 | $ | 8.41 | ||||||
| Total return(b) | 19.03 | % | (15.90 | )% | ||||||
Net assets, end of period (in 000s) | $ | 50 | $ | 42 | ||||||
Ratio of net expenses to average net assets | 1.35 | % | 1.28 | %(c) | ||||||
Ratio of total expenses to average net assets | 7.49 | % | 10.03 | %(c) | ||||||
Ratio of net investment income to average net assets | 0.69 | % | 0.89 | %(c) | ||||||
Portfolio turnover rate(d) | 57 | % | 23 | % | ||||||
| * | Commencement of operations. |
| (a) | Calculated based on the average shares outstanding methodology. |
| (b) | Assumes investment at the net asset value at the beginning of the period, reinvestment of all distributions, a complete redemption of the investment at the net asset value at the end of the period and no sales or redemption charges (if any). Total returns would be reduced if a sales or redemption charge was taken into account. Returns do not reflect the impact of taxes to shareholders relating to Fund distributions or the redemption of Fund shares. Total returns for periods less than one full year are not annualized. |
| (c) | Annualized. |
| (d) | The Fund’s portfolio turnover rate is calculated in accordance with regulatory requirements, without regard to transactions involving short term investments. If such transactions were included, the Fund’s portfolio turnover rate may be higher. |
| The accompanying notes are an integral part of these financial statements. | 59 |
GOLDMAN SACHS ESG EMERGING MARKETS EQUITY FUND
Financial Highlights(continued)
Selected Data for a Share Outstanding Throughout Each Period
| Goldman Sachs ESG Emerging Markets Equity Fund | ||||||||||
| Class R Shares | ||||||||||
| Year Ended October 31, 2019 | May 31, 2018* October 31, 2018 | |||||||||
| Per Share Data | ||||||||||
Net asset value, beginning of period | $ | 8.39 | $ | 10.00 | ||||||
Net investment income(a) | 0.01 | 0.02 | ||||||||
Net realized and unrealized gain (loss) | 1.55 | (1.63 | ) | |||||||
Total from investment operations | 1.56 | (1.61 | ) | |||||||
Distributions to shareholders from net investment income | (0.01 | ) | — | |||||||
Net asset value, end of period | $ | 9.94 | $ | 8.39 | ||||||
| Total return(b) | 18.57 | % | (16.10 | )% | ||||||
Net assets, end of period (in 000s) | $ | 167 | $ | 42 | ||||||
Ratio of net expenses to average net assets | 1.92 | % | 1.78 | %(c) | ||||||
Ratio of total expenses to average net assets | 7.68 | % | 10.53 | %(c) | ||||||
Ratio of net investment income to average net assets | 0.06 | % | 0.39 | %(c) | ||||||
Portfolio turnover rate(d) | 57 | % | 23 | % | ||||||
| * | Commencement of operations. |
| (a) | Calculated based on the average shares outstanding methodology. |
| (b) | Assumes investment at the net asset value at the beginning of the period, reinvestment of all distributions, a complete redemption of the investment at the net asset value at the end of the period and no sales or redemption charges (if any). Total returns would be reduced if a sales or redemption charge was taken into account. Returns do not reflect the impact of taxes to shareholders relating to Fund distributions or the redemption of Fund shares. Total returns for periods less than one full year are not annualized. |
| (c) | Annualized. |
| (d) | The Fund’s portfolio turnover rate is calculated in accordance with regulatory requirements, without regard to transactions involving short term investments. If such transactions were included, the Fund’s portfolio turnover rate may be higher. |
| 60 | The accompanying notes are an integral part of these financial statements. |
GOLDMAN SACHS ESG EMERGING MARKETS EQUITY FUND
Financial Highlights(continued)
Selected Data for a Share Outstanding Throughout Each Period
| Goldman Sachs ESG Emerging Markets Equity Fund | ||||||||||
| Class R6 Shares | ||||||||||
| Year Ended October 31, 2019 | May 31, 2018* to October 31, 2018 | |||||||||
| Per Share Data | ||||||||||
Net asset value, beginning of period | $ | 8.41 | $ | 10.00 | ||||||
Net investment income(a) | 0.08 | 0.04 | ||||||||
Net realized and unrealized gain (loss) | 1.53 | (1.63 | ) | |||||||
Total from investment operations | 1.61 | (1.59 | ) | |||||||
Distributions to shareholders from net investment income | (0.04 | ) | — | |||||||
Net asset value, end of period | $ | 9.98 | $ | 8.41 | ||||||
| Total return(b) | 19.26 | % | (15.90 | )% | ||||||
Net assets, end of period (in 000s) | $ | 50 | $ | 42 | ||||||
Ratio of net expenses to average net assets | 1.20 | % | 1.13 | %(c) | ||||||
Ratio of total expenses to average net assets | 7.34 | % | 9.88 | %(c) | ||||||
Ratio of net investment income to average net assets | 0.84 | % | 1.04 | %(c) | ||||||
Portfolio turnover rate(d) | 57 | % | 23 | % | ||||||
| * | Commencement of operations. |
| (a) | Calculated based on the average shares outstanding methodology. |
| (b) | Assumes investment at the net asset value at the beginning of the period, reinvestment of all distributions, a complete redemption of the investment at the net asset value at the end of the period and no sales or redemption charges (if any). Total returns would be reduced if a sales or redemption charge was taken into account. Returns do not reflect the impact of taxes to shareholders relating to Fund distributions or the redemption of Fund shares. Total returns for periods less than one full year are not annualized. |
| (c) | Annualized. |
| (d) | The Fund’s portfolio turnover rate is calculated in accordance with regulatory requirements, without regard to transactions involving short term investments. If such transactions were included, the Fund’s portfolio turnover rate may be higher. |
| The accompanying notes are an integral part of these financial statements. | 61 |
GOLDMAN SACHS IMPRINT EMERGING MARKETS OPPORTUNITIES FUND
Financial Highlights(continued)
Selected Data for a Share Outstanding Throughout Each Year
| (a) | Calculated based on the average shares outstanding methodology. |
| (b) | Reflects income recognized from a corporate action which amounted to $0.25 per share and 2.90% of average net assets. |
| (c) | Amount is less than $0.005 per share. |
| (d) | Assumes investment at the net asset value at the beginning of the year, reinvestment of all distributions, a complete redemption of the investment at the net asset value at the end of the year and no sales or redemption charges (if any). Total returns would be reduced if a sales or redemption charge was taken into account. Returns do not reflect the impact of taxes to shareholders relating to Fund distributions or the redemption of Fund shares. |
| (e) | The Fund’s portfolio turnover rate is calculated in accordance with regulatory requirements, without regard to transactions involving short term investments. If such transactions were included, the Fund’s portfolio turnover rate may be higher. |
| 62 | The accompanying notes are an integral part of these financial statements. |
GOLDMAN SACHS IMPRINT EMERGING MARKETS OPPORTUNITIES FUND
Financial Highlights(continued)
Selected Data for a Share Outstanding Throughout Each Year
| Goldman Sachs Imprint Emerging Markets Opportunities Fund | ||||||||||||||||||||||
| Class C Shares | ||||||||||||||||||||||
| Year Ended October 31, | ||||||||||||||||||||||
| 2019 | 2018 | 2017 | 2016 | 2015 | ||||||||||||||||||
| Per Share Data | ||||||||||||||||||||||
Net asset value, beginning of year | $ | 7.64 | $ | 9.51 | $ | 8.66 | $ | 8.98 | $ | 10.99 | ||||||||||||
Net investment income (loss)(a) | 0.23 | (b) | (0.01 | ) | (0.01 | ) | (0.01 | ) | (0.04 | ) | ||||||||||||
Net realized and unrealized gain (loss) | 0.15 | (1.86 | ) | 0.86 | (0.31 | ) | (1.97 | ) | ||||||||||||||
Total from investment operations | 0.38 | (1.87 | ) | 0.85 | (0.32 | ) | (2.01 | ) | ||||||||||||||
Net asset value, end of year | $ | 8.02 | $ | 7.64 | $ | 9.51 | $ | 8.66 | $ | 8.98 | ||||||||||||
| Total return(c) | 4.97 | % | (19.66 | )% | 9.82 | % | (3.55 | )% | (18.29 | )% | ||||||||||||
Net assets, end of year (in 000s) | $ | 1,249 | $ | 2,082 | $ | 3,854 | $ | 5,642 | $ | 8,564 | ||||||||||||
Ratio of net expenses to average net assets | 2.48 | % | 2.47 | % | 2.48 | % | 2.49 | % | 2.48 | % | ||||||||||||
Ratio of total expenses to average net assets | 3.87 | % | 3.10 | % | 2.84 | % | 3.14 | % | 2.82 | % | ||||||||||||
Ratio of net investment income (loss) to average net assets | 2.84 | %(b) | (0.11 | )% | (0.15 | )% | (0.07 | )% | (0.41 | )% | ||||||||||||
Portfolio turnover rate(d) | 85 | % | 11 | % | 26 | % | 27 | % | 48 | % | ||||||||||||
| (a) | Calculated based on the average shares outstanding methodology. |
| (b) | Reflects income recognized from a corporate action which amounted to $0.25 per share and 2.90% of average net assets. |
| (c) | Assumes investment at the net asset value at the beginning of the year, reinvestment of all distributions, a complete redemption of the investment at the net asset value at the end of the year and no sales or redemption charges (if any). Total returns would be reduced if a sales or redemption charge was taken into account. Returns do not reflect the impact of taxes to shareholders relating to Fund distributions or the redemption of Fund shares. |
| (d) | The Fund’s portfolio turnover rate is calculated in accordance with regulatory requirements, without regard to transactions involving short term investments. If such transactions were included, the Fund’s portfolio turnover rate may be higher. |
| The accompanying notes are an integral part of these financial statements. | 63 |
GOLDMAN SACHS IMPRINT EMERGING MARKETS OPPORTUNITIES FUND
Financial Highlights(continued)
Selected Data for a Share Outstanding Throughout Each Year
| Goldman Sachs Imprint Emerging Markets Opportunities Fund | ||||||||||||||||||||||
| Institutional Shares | ||||||||||||||||||||||
| Year Ended October 31, | ||||||||||||||||||||||
| 2019 | 2018 | 2017 | 2016 | 2015 | ||||||||||||||||||
| Per Share Data | ||||||||||||||||||||||
Net asset value, beginning of year | $ | 8.12 | $ | 10.02 | $ | 9.02 | $ | 9.33 | $ | 11.34 | ||||||||||||
Net investment income(a) | 0.28 | (b) | 0.12 | 0.09 | 0.10 | 0.08 | ||||||||||||||||
Net realized and unrealized gain (loss) | 0.20 | (1.99 | ) | 0.91 | (0.33 | ) | (2.04 | ) | ||||||||||||||
Total from investment operations | 0.48 | (1.87 | ) | 1.00 | (0.23 | ) | (1.96 | ) | ||||||||||||||
Distributions to shareholders from net investment income | (0.11 | ) | (0.03 | ) | — | (c) | (0.08 | ) | (0.05 | ) | ||||||||||||
Net asset value, end of year | $ | 8.49 | $ | 8.12 | $ | 10.02 | $ | 9.02 | $ | 9.33 | ||||||||||||
| Total return(d) | 6.02 | % | (18.62 | )% | 11.02 | % | (2.46 | )% | (17.34 | )% | ||||||||||||
Net assets, end of year (in 000s) | $ | 4,082 | $ | 12,270 | $ | 50,730 | $ | 58,958 | $ | 115,099 | ||||||||||||
Ratio of net expenses to average net assets | 1.34 | % | 1.33 | % | 1.33 | % | 1.33 | % | 1.33 | % | ||||||||||||
Ratio of total expenses to average net assets | 2.71 | % | 1.91 | % | 1.67 | % | 1.99 | % | 1.68 | % | ||||||||||||
Ratio of net investment income to average net assets | 3.29 | %(b) | 1.24 | % | 0.94 | % | 1.08 | % | 0.78 | % | ||||||||||||
Portfolio turnover rate(e) | 85 | % | 11 | % | 26 | % | 27 | % | 48 | % | ||||||||||||
| (a) | Calculated based on the average shares outstanding methodology. |
| (b) | Reflects income recognized from a corporate action which amounted to $0.25 per share and 2.90% of average net assets. |
| (c) | Amount is less than $0.005 per share. |
| (d) | Assumes investment at the net asset value at the beginning of the year, reinvestment of all distributions, a complete redemption of the investment at the net asset value at the end of the year and no sales or redemption charges (if any). Total returns would be reduced if a sales or redemption charge was taken into account. Returns do not reflect the impact of taxes to shareholders relating to Fund distributions or the redemption of Fund shares. |
| (e) | The Fund’s portfolio turnover rate is calculated in accordance with regulatory requirements, without regard to transactions involving short term investments. If such transactions were included, the Fund’s portfolio turnover rate may be higher. |
| 64 | The accompanying notes are an integral part of these financial statements. |
GOLDMAN SACHS IMPRINT EMERGING MARKETS OPPORTUNITIES FUND
Financial Highlights(continued)
Selected Data for a Share Outstanding Throughout Each Year
| Goldman Sachs Imprint Emerging Markets Opportunities Fund | ||||||||||||||||||||||
| Investor Shares(a) | ||||||||||||||||||||||
| Year Ended October 31, | ||||||||||||||||||||||
| 2019 | 2018 | 2017 | 2016 | 2015 | ||||||||||||||||||
| Per Share Data | ||||||||||||||||||||||
Net asset value, beginning of year | $ | 8.09 | $ | 9.98 | $ | 9.00 | $ | 9.30 | $ | 11.30 | ||||||||||||
Net investment income(b) | 0.27 | (c) | 0.08 | 0.08 | 0.08 | 0.06 | ||||||||||||||||
Net realized and unrealized gain (loss) | 0.21 | (1.95 | ) | 0.90 | (0.32 | ) | (2.03 | ) | ||||||||||||||
Total from investment operations | 0.48 | (1.87 | ) | 0.98 | (0.24 | ) | (1.97 | ) | ||||||||||||||
Distributions to shareholders from net investment income | (0.07 | ) | (0.02 | ) | — | (0.06 | ) | (0.03 | ) | |||||||||||||
Net asset value, end of year | $ | 8.50 | $ | 8.09 | $ | 9.98 | $ | 9.00 | $ | 9.30 | ||||||||||||
| Total return(d) | 6.00 | % | (18.82 | )% | 10.89 | % | (2.59 | )% | (17.45 | )% | ||||||||||||
Net assets, end of year (in 000s) | $ | 1,465 | $ | 5,633 | $ | 8,613 | $ | 9,436 | $ | 13,092 | ||||||||||||
Ratio of net expenses to average net assets | 1.49 | % | 1.47 | % | 1.48 | % | 1.48 | % | 1.48 | % | ||||||||||||
Ratio of total expenses to average net assets | 2.85 | % | 2.11 | % | 1.80 | % | 2.14 | % | 1.82 | % | ||||||||||||
Ratio of net investment income to average net assets | 3.21 | %(c) | 0.86 | % | 0.91 | % | 0.90 | % | 0.59 | % | ||||||||||||
Portfolio turnover rate(e) | 85 | % | 11 | % | 26 | % | 27 | % | 48 | % | ||||||||||||
| (a) | Effective August 15, 2017, Class IR changed its name to Investor Shares. |
| (b) | Calculated based on the average shares outstanding methodology. |
| (c) | Reflects income recognized from a corporate action which amounted to $0.25 per share and 2.90% of average net assets. |
| (d) | Assumes investment at the net asset value at the beginning of the year, reinvestment of all distributions, a complete redemption of the investment at the net asset value at the end of the year and no sales or redemption charges (if any). Total returns would be reduced if a sales or redemption charge was taken into account. Returns do not reflect the impact of taxes to shareholders relating to Fund distributions or the redemption of Fund shares. |
| (e) | The Fund’s portfolio turnover rate is calculated in accordance with regulatory requirements, without regard to transactions involving short term investments. If such transactions were included, the Fund’s portfolio turnover rate may be higher. |
| The accompanying notes are an integral part of these financial statements. | 65 |
GOLDMAN SACHS IMPRINT EMERGING MARKETS OPPORTUNITIES FUND
Financial Highlights(continued)
Selected Data for a Share Outstanding Throughout Each Period
| Goldman Sachs Imprint Emerging Markets Opportunities Fund | ||||||||||
| Class P Shares | ||||||||||
| Year Ended October 31, 2019 | April 16, 2018* October 31, 2018 | |||||||||
| Per Share Data | ||||||||||
Net asset value, beginning of period | $ | 8.11 | $ | 10.29 | ||||||
Net investment income (loss)(a) | 0.41 | (b) | (0.01 | ) | ||||||
Net realized and unrealized gain (loss) | 0.08 | (2.17 | ) | |||||||
Total from investment operations | 0.49 | (2.18 | ) | |||||||
Distributions to shareholders from net investment income | (0.12 | ) | — | |||||||
Net asset value, end of period | $ | 8.48 | $ | 8.11 | ||||||
| Total return(c) | 6.15 | % | (21.19 | )% | ||||||
Net assets, end of period (in 000s) | $ | 13,375 | $ | 14,524 | ||||||
Ratio of net expenses to average net assets | 1.34 | % | 1.32 | %(d) | ||||||
Ratio of total expenses to average net assets | 2.74 | % | 2.28 | %(d) | ||||||
Ratio of net investment income (loss) to average net assets | 4.79 | %(b) | (0.18 | )%(d) | ||||||
Portfolio turnover rate(e) | 85 | % | 11 | % | ||||||
| * | Commencement of operations. |
| (a) | Calculated based on the average shares outstanding methodology. |
| (b) | Reflects income recognized from a corporate action which amounted to $0.25 per share and 2.90% of average net assets. |
| (c) | Assumes investment at the net asset value at the beginning of the period, reinvestment of all distributions, a complete redemption of the investment at the net asset value at the end of the period and no sales or redemption charges (if any). Total returns would be reduced if a sales or redemption charge was taken into account. Returns do not reflect the impact of taxes to shareholders relating to Fund distributions or the redemption of Fund shares. Total returns for periods less than one full year are not annualized. |
| (d) | Annualized. |
| (e) | The Fund’s portfolio turnover rate is calculated in accordance with regulatory requirements, without regard to transactions involving short term investments. If such transactions were included, the Fund’s portfolio turnover rate may be higher. |
| 66 | The accompanying notes are an integral part of these financial statements. |
GOLDMAN SACHS IMPRINT EMERGING MARKETS OPPORTUNITIES FUND
Financial Highlights(continued)
Selected Data for a Share Outstanding Throughout Each Period
| Goldman Sachs Imprint Emerging Markets Opportunities Fund | ||||||||||
| Class R6 Shares | ||||||||||
| Year Ended October 31, 2019 | February 28, 2018* October 31, 2018 | |||||||||
| Per Share Data | ||||||||||
Net asset value, beginning of period | $ | 8.12 | $ | 10.43 | ||||||
Net investment income(a) | 0.44 | (b) | 0.08 | |||||||
Net realized and unrealized gain (loss) | 0.05 | (2.39 | ) | |||||||
Total from investment operations | 0.49 | (2.31 | ) | |||||||
Distributions to shareholders from net investment income | (0.12 | ) | — | |||||||
Net asset value, end of period | $ | 8.49 | $ | 8.12 | ||||||
| Total return(c) | 6.12 | % | (22.15 | )% | ||||||
Net assets, end of period (in 000s) | $ | 8 | $ | 8 | ||||||
Ratio of net expenses to average net assets | 1.35 | % | 1.34 | %(d) | ||||||
Ratio of total expenses to average net assets | 2.76 | % | 2.00 | %(d) | ||||||
Ratio of net investment income to average net assets | 5.05 | %(b) | 1.33 | %(d) | ||||||
Portfolio turnover rate(e) | 85 | % | 11 | % | ||||||
| * | Commencement of operations. |
| (a) | Calculated based on the average shares outstanding methodology. |
| (b) | Reflects income recognized from a corporate action which amounted to $0.25 per share and 2.90% of average net assets. |
| (c) | Assumes investment at the net asset value at the beginning of the period, reinvestment of all distributions, a complete redemption of the investment at the net asset value at the end of the period and no sales or redemption charges (if any). Total returns would be reduced if a sales or redemption charge was taken into account. Returns do not reflect the impact of taxes to shareholders relating to Fund distributions or the redemption of Fund shares. Total returns for periods less than one full year are not annualized. |
| (d) | Annualized. |
| (e) | The Fund’s portfolio turnover rate is calculated in accordance with regulatory requirements, without regard to transactions involving short term investments. If such transactions were included, the Fund’s portfolio turnover rate may be higher. |
| The accompanying notes are an integral part of these financial statements. | 67 |
GOLDMAN SACHS FUNDAMENTAL EMERGING MARKETS EQUITY FUNDS
October 31, 2019
| 1. ORGANIZATION |
Goldman Sachs Trust (the “Trust”) is a Delaware statutory trust registered under the Investment Company Act of 1940, as amended (the “Act”), as anopen-end management investment company. The following table lists those series of the Trust that are included in this report (collectively, the “Funds” or individually a “Fund”), along with their corresponding share classes and respective diversification status under the Act:
| Fund | Share Classes Offered | Diversified/ Non-diversified | ||
Asia Equity | A, C, Institutional, Investor, P and R6 | Diversified | ||
Emerging Markets Equity | A, C, Institutional, Service, Investor, P and R6 | Diversified | ||
ESG Emerging Markets Equity | A, C, Institutional, Investor, R and R6 | Diversified | ||
Imprint Emerging Markets Opportunities+ | A, C, Institutional, Investor, P and R6 | Diversified |
| + | Formerly, the Goldman Sachs N-11 Equity Fund. Effective at the close of business on August 30, 2019, the Fund’s name changed to the Goldman Sachs Imprint Emerging Markets Opportunities Fund. |
Class A Shares are sold with afront-end sales charge of up to 5.50%. Class C Shares are sold with a contingent deferred sales charge (“CDSC”) of 1.00%, which is imposed on redemptions made within 12 months of purchase. Institutional, Service, Investor, Class P, Class R and Class R6 Shares are not subject to a sales charge.
Goldman Sachs Asset Management, L.P. (“GSAM”), an affiliate of Goldman Sachs & Co. LLC (“Goldman Sachs”), serves as investment adviser to the Funds pursuant to a management agreement (the “Agreement”) with the Trust.
| 2. SIGNIFICANT ACCOUNTING POLICIES |
The financial statements have been prepared in accordance with accounting principles generally accepted in the United States of America (“GAAP”) and require management to make estimates and assumptions that may affect the reported amounts and disclosures. Actual results may differ from those estimates and assumptions. Each Fund is an investment company under GAAP and follows the accounting and reporting guidance applicable to investment companies.
A. Investment Valuation — The Funds’ valuation policy is to value investments at fair value.
B. Investment Income and Investments — Investment income includes interest income, dividend income, and securities lending income, if any. Interest income is accrued daily and adjusted for amortization of premiums and accretion of discounts. Dividend income is recognized onex-dividend date or, for certain foreign securities, as soon as such information is obtained subsequent to theex-dividend date. Non-cash dividends, if any, are recorded at the fair market value of the securities received. Investment transactions are reflected on trade date. Realized gains and losses are calculated using identified cost. Investment transactions are recorded on the following business day for daily net asset value (“NAV”) calculations. Investment income is recorded net of any foreign withholding taxes, less any amounts reclaimable. The Funds may file withholding tax reclaims in certain jurisdictions to recover a portion of amounts previously withheld. Any foreign capital gains tax is accrued daily based upon net unrealized gains, and is payable upon sale of such investments.
C. Class Allocations and Expenses — Investment income, realized and unrealized gain (loss), if any, andnon-class specific expenses of each Fund are allocated daily based upon the proportion of net assets of each class.Non-class specific expenses directly incurred by a Fund are charged to that Fund, while such expenses incurred by the Trust are allocated across the applicable Funds on astraight-line and/orpro-rata basis depending upon the nature of the expenses. Class specific expenses, where applicable, are borne by the respective share classes and include Distribution and Service, Transfer Agency and Service and Shareholder Administration fees.
D. Federal Taxes and Distributions to Shareholders — It is each Fund’s policy to comply with the requirements of the Internal Revenue Code of 1986, as amended (the “Code”), applicable to regulated investment companies and to distribute each year substantially all of its investment company taxable income and capital gains to its shareholders. Accordingly, each Fund is not
68
GOLDMAN SACHS FUNDAMENTAL EMERGING MARKETS EQUITY FUNDS
| 2. SIGNIFICANT ACCOUNTING POLICIES (continued) |
required to make any provisions for the payment of federal income tax. Distributions to shareholders are recorded on theex-dividend date. Income and capital gains distributions, if any, are declared and paid at least annually.
Net capital losses, if any, are carried forward to future fiscal years and may be used to the extent allowed by the Code to offset any future capital gains. Losses that are carried forward will retain their character as either short-term or long-term capital losses. Utilization of capital loss carryforwards will reduce the requirement of future capital gains distributions.
The characterization of distributions to shareholders for financial reporting purposes is determined in accordance with federal income tax rules, which may differ from GAAP. The source of each Fund’s distributions may be shown in the accompanying financial statements as either from distributable earnings or capital. Certain components of the Funds’ net assets on the Statements of Assets and Liabilities reflect permanent GAAP/tax differences based on the appropriate tax character.
E. Foreign Currency Translation — The accounting records and reporting currency of a Fund are maintained in U.S. dollars. Assets and liabilities denominated in foreign currencies are translated into U.S. dollars using the current exchange rates at the close of each business day. The effect of changes in foreign currency exchange rates on investments is included within net realized and unrealized gain (loss) on investments. Changes in the value of other assets and liabilities as a result of fluctuations in foreign exchange rates are included in the Statements of Operations within net change in unrealized gain (loss) on foreign currency translation. Transactions denominated in foreign currencies are translated into U.S. dollars on the date the transaction occurred, the effects of which are included within net realized gain (loss) on foreign currency transactions.
F. Offering Costs — Offering costs paid in connection with the offering of shares of the ESG Emerging Markets Equity Fund were amortized on a straight-line basis over 12 months from the date of commencement of operations.
| 3. INVESTMENTS AND FAIR VALUE MEASUREMENTS |
U.S. GAAP defines the fair value of a financial instrument as the amount that would be received to sell an asset or paid to transfer a liability in an orderly transaction between market participants at the measurement date (i.e., the exit price); the Funds’ policy is to use the market approach. GAAP establishes a fair value hierarchy that prioritizes the inputs to valuation techniques used to measure fair value. The hierarchy gives the highest priority to unadjusted quoted prices in active markets for identical assets or liabilities (Level 1 measurements) and the lowest priority to unobservable inputs (Level 3 measurements). The levels used for classifying investments are not necessarily an indication of the risk associated with investing in these investments. The three levels of the fair value hierarchy are described below:
Level 1 — Unadjusted quoted prices in active markets that are accessible at the measurement date for identical, unrestricted assets or liabilities;
Level 2 — Quoted prices in markets that are not active or financial instruments for which significant inputs are observable (including, but not limited to, quoted prices for similar investments, interest rates, foreign exchange rates, volatility and credit spreads), either directly or indirectly;
Level 3 — Prices or valuations that require significant unobservable inputs (including GSAM’s assumptions in determining fair value measurement).
The Board of Trustees (“Trustees”) has approved Valuation Procedures that govern the valuation of the portfolio investments held by the Funds, including investments for which market quotations are not readily available. The Trustees have delegated toGSAM day-to-day responsibility for implementing and maintaining internal controls and procedures related to the valuation of the Funds’ investments. To assess the continuing appropriateness of pricing sources and methodologies, GSAM regularly performs price verification procedures and issues challenges as necessary to third party pricing vendors or brokers, and any differences are reviewed in accordance with the Valuation Procedures.
69
GOLDMAN SACHS FUNDAMENTAL EMERGING MARKETS EQUITY FUNDS
Notes to Financial Statements(continued)
October 31, 2019
| 3. INVESTMENTS AND FAIR VALUE MEASUREMENTS (continued) |
A. Level 1 and Level 2 Fair Value Investments — The valuation techniques and significant inputs used in determining the fair values for investments classified as Level 1 and Level 2 are as follows:
Equity Securities — Equity securities traded on a United States (“U.S.”) securities exchange or the NASDAQ system, or those located on certain foreign exchanges, including but not limited to the Americas, are valued daily at their last sale price or official closing price on the principal exchange or system on which they are traded. If there is no sale or official closing price or such price is believed by GSAM to not represent fair value, equity securities may be valued at the closing bid price for long positions and at the closing ask price for short positions. To the extent these investments are actively traded, they are classified as Level 1 of the fair value hierarchy, otherwise they are generally classified as Level 2.
Unlisted equity securities for which market quotations are available are valued at the last sale price on the valuation date, or if no sale occurs, at the last bid price for long positions or the last ask price for short positions, and are generally classified as Level 2. Securities traded on certain foreign securities exchanges are valued daily at fair value determined by an independent fair value service (if available) under Valuation Procedures approved by the Trustees and consistent with applicable regulatory guidance. The independent fair value service takes into account multiple factors including, but not limited to, movements in the securities markets, certain depositary receipts, futures contracts and foreign currency exchange rates that have occurred subsequent to the close of the foreign securities exchange. These investments are generally classified as Level 2 of the fair value hierarchy.
Underlying Funds (including Money Market Funds) — Underlying funds (“Underlying Funds”) include other investment companies and exchange-traded funds (“ETFs”). Investments in the Underlying Funds (except ETFs) are valued at the NAV per share on the day of valuation. ETFs are valued daily at the last sale price or official closing price on the principal exchange or system on which the investment is traded. Because the Funds invest in Underlying Funds that fluctuate in value, the Funds’ shares will correspondingly fluctuate in value. To the extent these investments are actively traded, they are classified as Level 1 of the fair value hierarchy, otherwise they are generally classified as Level 2. For information regarding an Underlying Fund’s accounting policies and investment holdings, please see the Underlying Fund’s shareholder report.
B. Level 3 Fair Value Investments — To the extent that significant inputs to valuation models and other alternative pricing sources are unobservable, or if quotations are not readily available, or if GSAM believes that such quotations do not accurately reflect fair value, the fair value of a Fund’s investments may be determined under Valuation Procedures approved by the Trustees. GSAM, consistent with its procedures and applicable regulatory guidance, may make an adjustment to the most recent valuation prices of either domestic or foreign securities in light of significant events to reflect what it believes to be the fair value of the securities at the time of determining a Fund’s NAV. To the extent investments are valued using single source broker quotations obtained directly from the broker or passed through from third party pricing vendors, such investments are classified as Level 3 investments. GSAM did not develop the unobservable inputs for valuation of Level 3 Assets and Liabilities.
C. Fair Value Hierarchy — The following is a summary of the Funds’ investments classified in the fair value hierarchy as of October 31, 2019:
| ASIA EQUITY | ||||||||||||
| Investment Type | Level 1 | Level 2 | Level 3 | |||||||||
| Assets | ||||||||||||
Common Stock and/or Other Equity Investments(a) | ||||||||||||
Asia | $ | 5,653,574 | $ | 65,824,508 | $ | — | ||||||
Exchange Traded Funds | 1,743,210 | — | — | |||||||||
Investment Company | 461,147 | — | — | |||||||||
Securities Lending Reinvestment Vehicle | 1,018,700 | — | — | |||||||||
| Total | $ | 8,876,631 | $ | 65,824,508 | $ | — | ||||||
| (a) | Amounts are disclosed by continent to highlight the impact of time zone differences between local market close and the calculation of NAV. Security valuations are based on the principal exchange or system on which they are traded, which may differ from country of domicile. The Funds utilize fair value model prices provided by an independent fair value service for certain international equity securities, resulting in a Level 2 classification. |
70
GOLDMAN SACHS FUNDAMENTAL EMERGING MARKETS EQUITY FUNDS
| 3. INVESTMENTS AND FAIR VALUE MEASUREMENTS (continued) |
| EMERGING MARKETS EQUITY | ||||||||||||
| Investment Type | Level 1 | Level 2 | Level 3 | |||||||||
| Assets | ||||||||||||
Common Stock and/or Other Equity Investments(a) | ||||||||||||
Africa | $ | — | $ | 62,687,368 | $ | — | ||||||
Asia | 124,020,064 | 1,243,194,838 | — | |||||||||
Europe | — | 50,146,568 | — | |||||||||
North America | 34,403,307 | — | — | |||||||||
South America | 143,351,935 | 39,364,788 | — | |||||||||
Exchange Traded Funds | 64,293,541 | — | — | |||||||||
Investment Company | 6,059,064 | — | — | |||||||||
Securities Lending Reinvestment Vehicle | 43,343,504 | — | — | |||||||||
| Total | $ | 415,471,415 | $ | 1,395,393,562 | $ | — | ||||||
| ESG EMERGING MARKETS EQUITY | ||||||||||||
| Investment Type | Level 1 | Level 2 | Level 3 | |||||||||
| Assets | ||||||||||||
Common Stock and/or Other Equity Investments(a) | ||||||||||||
Africa | $ | — | $ | 317,078 | $ | — | ||||||
Asia | 704,127 | 4,964,438 | — | |||||||||
Europe | — | 195,026 | — | |||||||||
North America | 148,003 | — | — | |||||||||
South America | 831,695 | 21,728 | — | |||||||||
Exchange Traded Fund | 21,484 | — | — | |||||||||
| Total | $ | 1,705,309 | $ | 5,498,270 | $ | — | ||||||
| IMPRINT EMERGING MARKETS OPPORTUNITIES | ||||||||||||
| Investment Type | Level 1 | Level 2 | Level 3 | |||||||||
| Assets | ||||||||||||
Common Stock and/or Other Equity Investments(a) | ||||||||||||
Africa | $ | — | $ | 3,594,087 | $ | — | ||||||
Asia | 2,201,412 | 14,453,917 | — | |||||||||
Europe | — | 662,858 | — | |||||||||
North America | 1,020,393 | — | — | |||||||||
South America | 1,212,710 | — | — | |||||||||
| Total | $ | 4,434,515 | $ | 18,710,862 | $ | — | ||||||
| (a) | Amounts are disclosed by continent to highlight the impact of time zone differences between local market close and the calculation of NAV. Security valuations are based on the principal exchange or system on which they are traded, which may differ from country of domicile. The Funds utilize fair value model prices provided by an independent fair value service for certain international equity securities, resulting in a Level 2 classification. |
For further information regarding security characteristics, see the Schedules of Investments.
71
GOLDMAN SACHS FUNDAMENTAL EMERGING MARKETS EQUITY FUNDS
Notes to Financial Statements(continued)
October 31, 2019
| 4. AGREEMENTS AND AFFILIATED TRANSACTIONS |
A. Management Agreement — Under the Agreement, GSAM manages the Funds, subject to the general supervision of the Trustees.
As compensation for the services rendered pursuant to the Agreement, the assumption of the expenses related thereto and administration of the Funds’ business affairs, including providing facilities, GSAM is entitled to a management fee, accrued daily and paid monthly, equal to an annual percentage rate of each Fund’s average daily net assets.
For the fiscal year ended October 31, 2019, contractual and effective net management fees with GSAM were at the following rates:
| Contractual Management Rate | Effective Net Management Rate^ | |||||||||||||||||||||||||||||
| Fund | First $1 billion | Next $1 billion | Next $3 billion | Next $3 billion | Over $8 billion | Effective Rate | ||||||||||||||||||||||||
Asia Equity | 1.00 | % | 0.90 | % | 0.86 | % | 0.84 | % | 0.82 | % | 1.00 | % | 1.00 | % | ||||||||||||||||
Emerging Markets Equity | 1.02 | 1.02 | 0.92 | 0.87 | 0.85 | 1.02 | 1.02 | |||||||||||||||||||||||
ESG Emerging Markets Equity | 0.98 | 0.98 | 0.88 | 0.84 | 0.82 | 0.98 | 0.98 | |||||||||||||||||||||||
Imprint Emerging Markets Opportunities | 1.05 | 1.05 | 0.95 | 0.90 | 0.88 | 1.12 | 1.12 | |||||||||||||||||||||||
| ^ | Effective Net Management Rate includes the impact of management fee waivers of affiliated underlying funds, if any. |
Prior to August 30, 2019, the contractual management fee rates for the Imprint Emerging Markets Opportunities Fund were as set forth in the Fund’s prospectus dated February 28, 2019:
| Fund | First $1 billion | Next $1 billion | Next $3 billion | Next $3 billion | Over $8 billion | |||||||||||||||||
Imprint Emerging Markets Opportunities | 1.13 | % | 1.13 | % | 1.02 | % | 0.97 | % | 0.95 | % | ||||||||||||
The Asia Equity, Emerging Markets Equity and ESG Emerging Markets Equity Funds invest in Institutional Shares of the Goldman Sachs Financial Square Government Fund, which is an affiliated Underlying Fund. GSAM has agreed to waive a portion of its management fee payable by the Funds in an amount equal to the management fee it earns as an investment adviser to the affiliated Underlying Fund in which the Funds invest, except those management fees it earns from the Funds’ investments of cash collateral received in connection with securities lending transactions in the Goldman Sachs Financial Square Government Fund. For the fiscal year ended October 31, 2019, GSAM waived $3,065, $12,334 and $12 of the Asia Equity, Emerging Markets Equity and ESG Emerging Markets Equity Funds’ management fees, respectively.
B. Distribution and/or Service(12b-1) Plans — The Trust, on behalf of Class A and Class R Shares of each applicable Fund, has adopted Distribution and Service Plans subject to Rule12b-1 under the Act. Under the Distribution and Service Plans, Goldman Sachs, which serves as distributor (the “Distributor”), is entitled to a fee accrued daily and paid monthly for distribution services and personal and account maintenance services, which may then be paid by Goldman Sachs to authorized dealers. These fees are equal to an annual percentage rate of the average daily net assets attributable to Class A or Class R Shares of the Funds, as applicable, as set forth below.
The Trust, on behalf of Class C Shares of each applicable Fund, has adopted a Distribution Plan subject to Rule12b-1 under the Act. Under the Distribution Plan, Goldman Sachs as Distributor is entitled to a fee accrued daily and paid monthly for distribution services, which may then be paid by Goldman Sachs to authorized dealers. These fees are equal to an annual percentage rate of the average daily net assets attributable to Class C Shares of the Funds, as set forth below.
The Trust, on behalf of Service Shares of each applicable Fund, has adopted a Service Plan subject to Rule12b-1 under the Act to allow Service Shares to compensate service organizations (including Goldman Sachs) for providing personal and account maintenance services to their customers who are beneficial owners of such shares. The Service Plan provides for compensation to
72
GOLDMAN SACHS FUNDAMENTAL EMERGING MARKETS EQUITY FUNDS
| 4. AGREEMENTS AND AFFILIATED TRANSACTIONS (continued) |
the service organizations equal to an annual percentage rate of the average daily net assets attributable to Service Shares of the Funds, as set forth below.
| Distribution and/or Service Plan Rates | ||||||||||||||||||
| Class A* | Class C | Class R* | Service | |||||||||||||||
Distribution and/or Service Plan | 0.25 | % | 0.75 | % | 0.50 | % | 0.25 | % | ||||||||||
| * | With respect to Class A and Class R Shares, the Distributor at its discretion may use compensation for distribution services paid under the Distribution and Service Plans to compensate service organizations for personal and account maintenance services and expenses as long as such total compensation does not exceed the maximum cap on “service fees” imposed by the Financial Industry Regulatory Authority. |
C. Distribution Agreement — Goldman Sachs, as Distributor of the shares of the Funds pursuant to a Distribution Agreement, may retain a portion of the Class A Shares’ front end sales charge and Class C Shares’ CDSC. During the fiscal year ended October 31, 2019, Goldman Sachs retained the following amounts:
| Front End Sales Charge | Contingent Deferred Sales Charge | |||||||||
| Fund | Class A | Class C | ||||||||
Asia Equity | $ | 2,707 | $ | — | ||||||
Emerging Markets Equity | 21,065 | 5 | ||||||||
ESG Emerging Markets Equity | — | — | ||||||||
Imprint Emerging Markets Opportunities | — | — | ||||||||
D. Service and Shareholder Administration Plans — The Trust, on behalf of each applicable Fund, has adopted Service Plans to allow Class C Shares and Shareholder Administration Plans to allow Service Shares, respectively, to compensate service organizations (including Goldman Sachs) for providing varying levels of personal and account maintenance or shareholder administration services to their customers who are beneficial owners of such shares. The Service and Shareholder Administration Plans each provide for compensation to the service organizations equal to an annual percentage rate of 0.25% of the average daily net assets attributable to Class C and Service Shares of the Funds, respectively.
E. Transfer Agency Agreement — Goldman Sachs also serves as the transfer agent of the Funds for a fee pursuant to the Transfer Agency Agreement. The fees charged for such transfer agency services are accrued daily and paid monthly at annual rates as follows: 0.17% of the average daily net assets of Class A, Class C, Investor and Class R Shares; 0.03% of the average daily net assets of Class P and Class R6 Shares; and 0.04% of the average daily net assets of Institutional and Service Shares. Prior to July 1, 2019, the annual rates were as follows: 0.18% of the average daily net assets of Class A, Class C, Investor and Class R Shares. Effective February 28, 2019 Goldman Sachs has agreed to waive a portion of its transfer agency fee equal to 0.04% as an annual percentage rate of the average daily net assets attributable to Class A, Class C, and Investor Shares of the Asia Equity Fund through at least February 28, 2020, and prior to such date the Investment Adviser and Goldman Sachs may not terminate the arrangement without the approval of the Board of Trustees.
F. Other Expense Agreements and Affiliated Transactions — GSAM has agreed to reduce or limit certain “Other Expenses” of the Funds (excluding acquired fund fees and expenses, transfer agency fees and expenses, service fees and shareholder administration fees (as applicable), taxes, interest, brokerage fees, expenses of shareholder meetings, litigation and indemnification, and extraordinary expenses) to the extent such expenses exceed, on an annual basis, a percentage rate of the average daily net assets of each Fund. Such Other Expense reimbursements, if any, are accrued daily and paid monthly. In addition, the Funds are not obligated to reimburse GSAM for prior fiscal year expense reimbursements, if any. The Other Expense limitations as an annual percentage rate of average daily net assets for the Asia Equity, Emerging Markets Equity, ESG Emerging Markets Equity and Imprint Emerging Markets Opportunities Funds are 0.114%, 0.104%, 0.124% and 0.164%, respectively. These
73
GOLDMAN SACHS FUNDAMENTAL EMERGING MARKETS EQUITY FUNDS
Notes to Financial Statements(continued)
October 31, 2019
| 4. AGREEMENTS AND AFFILIATED TRANSACTIONS (continued) |
Other Expense limitations will remain in place through at least February 28, 2020 and prior to such date GSAM may not terminate the arrangements without the approval of the Trustees. In addition, the Funds have entered into certain offset arrangements with the custodian and the transfer agent, which may result in a reduction of the Funds’ expenses and are received irrespective of the application of the “Other Expense” limitations described above.
For the fiscal year ended October 31, 2019, these expense reductions, including any fee waivers and Other Expense reimbursements, were as follows:
| Fund | Management Fee Waiver | Custody Fee Credits | Transfer Agency Waiver/Credits | Other Expense Reimbursement | Total Expense Reductions | |||||||||||||||||
Asia Equity | $ | 3,065 | $ | 2,894 | $ | 3,911 | $ | 393,318 | $ | 403,188 | ||||||||||||
Emerging Markets Equity | 12,334 | 34,947 | — | 358,655 | 405,936 | |||||||||||||||||
ESG Emerging Markets Equity | 12 | 157 | — | 434,949 | 435,118 | |||||||||||||||||
Imprint Emerging Markets Opportunities | — | 370 | — | 457,666 | 458,036 | |||||||||||||||||
G. Line of Credit Facility — As of October 31, 2019, the Funds participated in a $580,000,000 committed, unsecured revolving line of credit facility (the “facility”) together with other funds of the Trust and certain registered investment companies having management agreements with GSAM or its affiliates. This facility is to be used for temporary emergency purposes, or to allow for an orderly liquidation of securities to meet redemption requests. The interest rate on borrowings is based on the federal funds rate. The facility also requires a fee to be paid by the Funds based on the amount of the commitment that has not been utilized. For the fiscal year ended October 31, 2019, the Funds did not have any borrowings under the facility. Prior to April 30, 2019 the facility was $770,000,000.
H. Other Transactions with Affiliates — For the fiscal year ended October 31, 2019, Goldman Sachs earned $2,514, $172 and $300 in brokerage commissions from portfolio transactions on behalf of the Emerging Markets Equity, ESG Emerging Markets Equity and Imprint Emerging Markets Opportunities Funds, respectively.
The following table provides information about the Funds’ investments in the Goldman Sachs Financial Square Government Fund as of and for the fiscal year ended October 31, 2019:
| Fund | Beginning Value as of | Purchases at Cost | Proceeds from Sales | Ending Value as of October 31, 2019 | Shares as of October 31, 2019 | Dividend Income From Affiliated Investment Company | ||||||||||||||||||
Asia Equity | $ | 4,247,434 | $ | 16,375,002 | $ | (20,161,289 | ) | $ | 461,147 | 461,147 | $ | 41,692 | ||||||||||||
Emerging Markets Equity | 4,537,319 | 308,042,346 | (306,520,601 | ) | 6,059,064 | 6,059,064 | 168,766 | |||||||||||||||||
ESG Emerging Markets Equity | — | 473,770 | (473,770 | ) | — | — | 149 | |||||||||||||||||
As of October 31, 2019, The Goldman Sachs Group, Inc. was the beneficial owner of the following Funds:
| Fund | Class A | Class C | Institutional | Investor | Class R | Class R6 | ||||||||||||||||||||
Asia Equity | — | % | — | % | — | % | 15 | % | — | % | — | % | ||||||||||||||
ESG Emerging Markets Equity | 100 | 100 | 98 | 100 | 30 | 100 | ||||||||||||||||||||
Imprint Emerging Markets Opportunities | — | — | — | — | — | 100 | ||||||||||||||||||||
74
GOLDMAN SACHS FUNDAMENTAL EMERGING MARKETS EQUITY FUNDS
| 5. PORTFOLIO SECURITIES TRANSACTIONS |
The cost of purchases and proceeds from sales and maturities of long-term securities for the fiscal year ended October 31, 2019, were as follows:
| Fund | Purchases | Sales and Maturities | ||||||||
Asia Equity | $ | 14,082,872 | $ | 18,318,990 | ||||||
Emerging Markets Equity | 671,523,167 | 520,318,885 | ||||||||
ESG Emerging Markets Equity | 4,273,464 | 3,967,452 | ||||||||
Imprint Emerging Markets Opportunities | 28,076,012 | 46,802,455 | ||||||||
| 6. SECURITIES LENDING |
Pursuant to exemptive relief granted by the Securities and Exchange Commission (“SEC”) and the terms and conditions contained therein, the Asia Equity, Emerging Markets Equity and Imprint Emerging Markets Opportunities Funds may lend their securities through a securities lending agent, Goldman Sachs Agency Lending (“GSAL”), a wholly-owned subsidiary of Goldman Sachs, to certain qualified borrowers including Goldman Sachs and affiliates. In accordance with the Funds’ securities lending procedures, the Funds receive cash collateral at least equal to the market value of the securities on loan. The market value of the loaned securities is determined at the close of business of the Funds, at their last sale price or official closing price on the principal exchange or system on which they are traded, and any additional required collateral is delivered to the Funds on the next business day. As with other extensions of credit, the Funds may experience delay in the recovery of their securities or incur a loss should the borrower of the securities breach its agreement with the Funds or become insolvent at a time when the collateral is insufficient to cover the cost of repurchasing securities on loan. Dividend income received from securities on loan may not be subject to withholding taxes and therefore withholding taxes paid may differ from the amounts listed in the Statements of Operations. Loans of securities are terminable at any time and as such 1) the remaining contractual maturities of the outstanding securities lending transactions are considered to be overnight and continuous and 2) the borrower, after notice, is required to return borrowed securities within the standard time period for settlement of securities transactions.
The Asia Equity, Emerging Markets Equity and Imprint Emerging Markets Opportunities Funds invest the cash collateral received in connection with securities lending transactions in the Goldman Sachs Financial Square Government Fund (“Government Money Market Fund”), an affiliated series of the Goldman Sachs Trust. The Government Money Market Fund is registered under the Act as an open end investment company, is subject to Rule2a-7 under the Act, and is managed by GSAM, for which GSAM may receive a management fee of up to 0.16% on an annualized basis of the average daily net assets of the Government Money Market Fund.
In the event of a default by a borrower with respect to any loan, GSAL will exercise any and all remedies provided under the applicable borrower agreement to make the Funds whole. These remedies include purchasing replacement securities by applying the collateral held from the defaulting broker against the purchase cost of the replacement securities. If GSAL is unable to purchase replacement securities, GSAL will indemnify the Funds by paying the Funds an amount equal to the market value of the securities loaned minus the value of cash collateral received from the borrower for the loan, subject to an exclusion for any shortfalls resulting from a loss of value in such cash collateral due to reinvestment risk. The Funds’ master netting agreements with certain borrowers provide the right, in the event of a default (including bankruptcy or insolvency), for thenon-defaulting party to liquidate the collateral and calculate net exposure to the defaulting party or request additional collateral. However, in the event of a default by a borrower, a resolution authority could determine that such rights are not enforceable due to the restrictions or prohibitions against the right ofset-off that may be imposed in accordance with a particular jurisdiction’s bankruptcy or insolvency laws. The Funds’ loaned securities were all subject to enforceable Securities Lending Agreements and the value of the collateral was at least equal to the value of the cash received. The amounts of the Funds’ overnight and continuous agreements, which represent the gross amounts of recognized liabilities for securities lending transactions outstanding as of October 31, 2019 are disclosed as “Payable upon return of securities loaned” on the Statements of Assets and Liabilities, where applicable.
75
GOLDMAN SACHS FUNDAMENTAL EMERGING MARKETS EQUITY FUNDS
Notes to Financial Statements(continued)
October 31, 2019
| 6. SECURITIES LENDING (continued) |
Each of the Asia Equity, Emerging Markets Equity and Imprint Emerging Markets Opportunities Funds and GSAL received compensation relating to the lending of the Funds’ securities. The amounts earned, if any, by the Funds for the fiscal year ended October 31, 2019, are reported under Investment Income on the Statements of Operations.
The table below details securities lending activity with affiliates of Goldman Sachs:
| For the fiscal year ended October 31, 2019 | ||||||||||||||
| Fund | Earnings of GSAL Loaned | Amounts Received by the Funds from Lending to | Amount Payable to Goldman Sachs upon Return of Securities Loaned as of October 31, 2019 | |||||||||||
Asia Equity | $ | 752 | $ | — | $ | — | ||||||||
Emerging Markets Equity | 42,544 | 102,554 | 8,143,504 | |||||||||||
Imprint Emerging Markets Opportunities | 375 | 13 | — | |||||||||||
The following table provides information about the Funds’ investment in the Government Money Market Fund for the fiscal year ended October 31, 2019.
| Fund | Beginning October 31, 2018 | Purchases at Cost | Proceeds from Sales | Ending Value as of October 31, 2019 | ||||||||||||||
Asia Equity | $ | 116,025 | $ | 9,902,582 | $ | (8,999,907 | ) | $ | 1,018,700 | |||||||||
Emerging Markets Equity | 14,895,089 | 462,124,263 | (433,675,848 | ) | 43,343,504 | |||||||||||||
Imprint Emerging Markets Opportunities | 630,375 | 7,162,567 | (7,792,942 | ) | — | |||||||||||||
| 7. TAX INFORMATION |
The tax character of distributions paid during the fiscal year ended October 31, 2019 was as follows:
| Asia Equity | Emerging Markets Equity | ESG Emerging Markets Equity | Impring Emerging Markets Opportunities | |||||||||||||
Distributions paid from: | ||||||||||||||||
Ordinary income | $ | 362,857 | $ | 9,834,169 | $ | 28,047 | $ | 421,543 | ||||||||
Net long-term capital gains | 4,213,623 | — | — | — | ||||||||||||
Total | $ | 4,576,480 | $ | 9,834,169 | $ | 28,047 | $ | 421,543 | ||||||||
The tax character of distributions paid during the fiscal year ended October 31, 2018 was as follows:
Asia Equity | Emerging Markets Equity | ESG Emerging Markets Equity | Imprint Emerging Markets Opportunities | |||||||||||||
Distributions paid from: | ||||||||||||||||
Ordinary income | $ | 13,472 | $ | 8,106,923 | $ | — | $ | 179,416 | ||||||||
Net long-term capital gains | 1,165,395 | — | — | — | ||||||||||||
Total | $ | 1,178,867 | $ | 8,106,923 | $ | — | $ | 179,416 | ||||||||
76
GOLDMAN SACHS FUNDAMENTAL EMERGING MARKETS EQUITY FUNDS
| 7. TAX INFORMATION (continued) |
As of October 31, 2019, the components of accumulated earnings (losses) on atax-basis were as follows:
| Asia Equity | Emerging Markets Equity | ESG Emerging Markets Equity | Impring Emerging Markets Opportunities | |||||||||||||
Undistributed ordinary income — net | $ | 600,899 | $ | 19,618,259 | $ | 54,516 | $ | 1,222,566 | ||||||||
Undistributed long-term capital gains | — | — | — | — | ||||||||||||
Total undistributed earnings | $ | 600,899 | $ | 19,618,259 | $ | 54,516 | $ | 1,222,566 | ||||||||
Capital loss carryforwards: | ||||||||||||||||
Perpetual long-term | $ | (673,981 | ) | $ | (53,722,196 | ) | $ | (34,082 | ) | $ | (26,604,715 | ) | ||||
Perpetual short-term | (705,172 | ) | (93,713,818 | ) | (210,270 | ) | (31,944,098 | ) | ||||||||
Total capital loss carryforwards | $ | (1,379,153 | ) | $ | (147,436,014 | ) | $ | (244,352 | ) | $ | (58,548,813 | ) | ||||
Unrealized gains — net | 6,596,969 | 78,011,934 | 254,963 | 341,262 | ||||||||||||
Total accumulated gains (losses) — net | $ | 5,818,715 | $ | (49,805,821 | ) | $ | 65,127 | $ | (56,984,985 | ) | ||||||
As of October 31, 2019, the Funds’ aggregate security unrealized gains and losses based on cost for U.S. federal income tax purposes were as follows:
| Asia Equity | Emerging Markets Equity | ESG Emerging Markets Equity | Impring Emerging Markets Opportunities | |||||||||||||
Tax cost | $ | 67,864,172 | $ | 1,731,108,300 | $ | 6,942,041 | $ | 22,964,473 | ||||||||
Gross unrealized gain | 14,843,904 | 226,694,961 | 730,689 | 2,191,044 | ||||||||||||
Gross unrealized loss | (8,246,935 | ) | (148,683,027 | ) | (475,726 | ) | (1,849,782 | ) | ||||||||
Net unrealized gain | $ | 6,596,969 | $ | 78,011,934 | $ | 254,963 | $ | 341,262 | ||||||||
The difference between GAAP-basis andtax-basis unrealized gains (losses) is attributable primarily to wash sales and differences related to the tax treatment of passive foreign investment company investments.
The ESG Emerging Markets Equity Fund reclassified $5,328 from paid in capital to distributable earnings for the year ending October 31, 2019. In order to present certain components of the Fund’s capital accounts on a tax-basis, certain reclassifications have been recorded to the Fund’s accounts. These reclassifications have no impact on the NAV of the Fund and result primarily from certain non-deductible expenses.
GSAM has reviewed the Funds’ tax positions for all open tax years (the current and prior three years, as applicable) and has concluded that no provision for income tax is required in the Funds’ financial statements. Such open tax years remain subject to examination and adjustment by tax authorities.
| 8. OTHER RISKS |
The Funds’ risks include, but are not limited to, the following:
ESG Standards Risk — The ESG Emerging Markets Equity Fund’s adherence to its environmental, social and governance (“ESG”) criteria and the application of GSAM’s supplemental ESG analysis when selecting investments may affect the Fund’s exposure to certain companies, sectors, regions, and countries and may affect the Fund’s performance depending on whether such investments are in or out of favor. For example, the Fund will not seek to invest in companies that GSAM believes have adverse social or environmental impacts (i.e., gambling, alcohol, tobacco, coal or weapons companies), and the Fund will not seek to invest in companies that GSAM believes show inadequate governance standards (e.g., certain state-owned enterprises).
77
GOLDMAN SACHS FUNDAMENTAL EMERGING MARKETS EQUITY FUNDS
Notes to Financial Statements(continued)
October 31, 2019
| 8. OTHER RISKS (continued) |
Foreign and Emerging Countries Risk — Investing in foreign markets may involve special risks and considerations not typically associated with investing in the U.S. Foreign securities may be subject to risk of loss because of more or less foreign government regulation, less public information and less economic, political and social stability in the countries in which a Fund invests. The imposition of exchange controls (including repatriation restrictions), confiscation of assets and property, trade restrictions (including tariffs) and other government restrictions by the U.S. or other governments, or from problems in share registration, settlement or custody, may also result in losses. Foreign risk also involves the risk of negative foreign currency rate fluctuations, which may cause the value of securities denominated in such foreign currency (or other instruments through which a Fund has exposure to foreign currencies) to decline in value. Currency exchange rates may fluctuate significantly over short periods of time. To the extent that a Fund also invests in securities of issuers located in emerging markets, these risks may be more pronounced.
Foreign Custody Risk — If a Fund invests in foreign securities, the Fund may hold such securities and cash with foreign banks, agents, and securities depositories appointed by the Fund’s custodian (each a “Foreign Custodian”). Some foreign custodians may be recently organized or new to the foreign custody business. In some countries, Foreign Custodians may be subject to little or no regulatory oversight over, or independent evaluation of, their operations. Further, the laws of certain countries may place limitations on a Fund’s ability to recover its assets if a Foreign Custodian enters bankruptcy. Investments in emerging markets may be subject to even greater custody risks than investments in more developed markets. Custody services in emerging market countries are very often undeveloped and may be considerably less well regulated than in more developed countries, and thus may not afford the same level of investor protection as would apply in developed countries.
Geographic Risk — If a Fund focuses its investments in securities of issuers located in a particular country or geographic region, the Fund may be subjected, to a greater extent than if its investments were less focused, to the risks of volatile economic cycles and/or conditions and developments that may be particular to that country or region, such as: adverse securities markets; adverse exchange rates; adverse social, political, regulatory, economic, business, environmental or other developments; or natural disasters.
Investments in Other Investment Companies Risk — As a shareholder of another investment company, including an ETF, a Fund will indirectly bear its proportionate share of any net management fees and other expenses paid by such other investment companies, in addition to the fees and expenses regularly borne by the Fund. ETFs are subject to risks that do not apply to conventional mutual funds, including but not limited to the following: (i) the market price of the ETF’s shares may trade at a premium or a discount to their NAV; and (ii) an active trading market for an ETF’s shares may not develop or be maintained.
Large Shareholder Transactions Risk — A Fund may experience adverse effects when certain large shareholders, such as other funds, institutional investors (including those trading by use ofnon-discretionary mathematical formulas), financial intermediaries (who may make investment decisions on behalf of underlying clients and/or include a Fund in their investment model), individuals, accounts and Goldman Sachs affiliates, purchase or redeem large amounts of shares of a Fund. Such large shareholder redemptions, which may occur rapidly or unexpectedly, may cause a Fund to sell portfolio securities at times when it would not otherwise do so, which may negatively impact a Fund’s NAV and liquidity. These transactions may also accelerate the realization of taxable income to shareholders if such sales of investments resulted in gains, and may also increase transaction costs. In addition, a large redemption could result in a Fund’s current expenses being allocated over a smaller asset base, leading to an increase in the Fund’s expense ratio. Similarly, large Fund share purchases may adversely affect a Fund’s performance to the extent that the Fund is delayed in investing new cash or otherwise maintains a larger cash position than it ordinarily would.
Liquidity Risk — A Fund may make investments that are illiquid or that may become less liquid in response to market developments or adverse investor perceptions. Illiquid investments may be more difficult to value. Liquidity risk may also refer to the risk that a Fund will not be able to pay redemption proceeds within the allowable time period or without significant dilution to remaining investors’ interests because of unusual market conditions, an unusually high volume of redemption requests, or other reasons. To meet redemption requests, a Fund may be forced to sell investments at an unfavorable time and/or under unfavorable conditions. If a Fund is forced to sell securities at an unfavorable time and/or under unfavorable conditions, such sales may adversely affect the Fund’s NAV and dilute remaining investors’ interests. These risks may be more pronounced in connection
78
GOLDMAN SACHS FUNDAMENTAL EMERGING MARKETS EQUITY FUNDS
| 8. OTHER RISKS (continued) |
with the Funds’ investments in securities of issuers located in emerging market countries. Redemptions by large shareholders may have a negative impact on a Fund’s liquidity.
Market and Credit Risks — In the normal course of business, a Fund trades financial instruments and enters into financial transactions where risk of potential loss exists due to changes in the market (market risk). Additionally, a Fund may also be exposed to credit risk in the event that an issuer or guarantor fails to perform or that an institution or entity with which the Fund has unsettled or open transactions defaults.
| 9. INDEMNIFICATIONS |
Under the Trust’s organizational documents, its Trustees, officers, employees and agents are indemnified, to the extent permitted by the Act and state law, against certain liabilities that may arise out of performance of their duties to the Funds. Additionally, in the course of business, the Funds enter into contracts that contain a variety of indemnification clauses. The Funds’ maximum exposure under these arrangements is unknown, as this would involve future claims that may be made against the Funds that have not yet occurred. However, GSAM believes the risk of loss under these arrangements to be remote.
| 10. OTHER MATTERS |
At a meeting held on August 14, 2019, upon the recommendation of GSAM, the Board of Trustees of the Goldman Sachs Trust approved certain changes to the Goldman Sachs Asia Equity Fund’s name, principal investment strategy and benchmark, amongst other changes. Effective after the close of business on November 20, 2019, the Fund’s name changed to the “Goldman Sachs China Equity Fund.” However, the Fund’s current investment objective to seek long-term capital appreciation has not changed.
On November 5, 2019, a definitive proxy statement (“proxy”) was filed with the SEC to elect certain Trustees to the Trust. The Funds will bear their respective share of the proxy, shareholder meeting and other related costs and GSAM has agreed to reimburse each Fund to the extent such expenses exceed a specified percentage of the Fund’s net assets.
| 11. SUBSEQUENT EVENTS |
Subsequent events after the Statements of Assets and Liabilities date other than the above have been evaluated, and GSAM has concluded that there is no impact requiring adjustment or disclosure in the financial statements.
79
GOLDMAN SACHS FUNDAMENTAL EMERGING MARKETS EQUITY FUNDS
Notes to Financial Statements(continued)
October 31, 2019
| 12. SUMMARY OF SHARE TRANSACTIONS |
Share activity is as follows:
| Asia Equity Fund | ||||||||||||||||
|
| |||||||||||||||
| For the Fiscal Year Ended October 31, 2019 | For the Fiscal Year Ended October 31, 2018 | |||||||||||||||
|
| |||||||||||||||
| Shares | Dollars | Shares | Dollars | |||||||||||||
|
| |||||||||||||||
| Class A Shares | ||||||||||||||||
Shares sold | 100,472 | $ | 2,465,209 | 215,101 | $ | 5,987,069 | ||||||||||
Reinvestment of distributions | 38,407 | 858,528 | 8,226 | 233,609 | ||||||||||||
Shares redeemed | (208,987 | ) | (5,053,525 | ) | (244,210 | ) | (6,833,623 | ) | ||||||||
| (70,108 | ) | (1,729,788 | ) | (20,883 | ) | (612,945 | ) | |||||||||
| Class C Shares | ||||||||||||||||
Shares sold | 6,183 | 131,992 | 30,241 | 806,036 | ||||||||||||
Reinvestment of distributions | 3,328 | 66,890 | 1,145 | 29,647 | ||||||||||||
Shares redeemed | (33,688 | ) | (735,710 | ) | (36,927 | ) | (915,957 | ) | ||||||||
| (24,177 | ) | (536,828 | ) | (5,541 | ) | (80,274 | ) | |||||||||
| Institutional Shares | ||||||||||||||||
Shares sold | 56,003 | 1,438,836 | 392,167 | 11,942,821 | ||||||||||||
Reinvestment of distributions | 17,609 | 419,499 | 29,693 | 892,729 | ||||||||||||
Shares redeemed | (129,539 | ) | (3,261,359 | ) | (2,283,537 | ) | (65,021,389 | ) | ||||||||
| (55,927 | ) | (1,403,024 | ) | (1,861,677 | ) | (52,185,839 | ) | |||||||||
| Investor Shares | ||||||||||||||||
Shares sold | 2,795 | 74,498 | 40,676 | 1,223,331 | ||||||||||||
Reinvestment of distributions | 724 | 17,126 | 242 | 7,250 | ||||||||||||
Shares redeemed | (11,360 | ) | (283,760 | ) | (29,519 | ) | (871,564 | ) | ||||||||
| (7,841 | ) | (192,136 | ) | 11,399 | 359,017 | |||||||||||
| Class P Shares(a) | ||||||||||||||||
Shares sold | 23,591 | 611,925 | 2,041,704 | 57,941,156 | ||||||||||||
Reinvestment of distributions | 132,977 | 3,162,940 | — | — | ||||||||||||
Shares redeemed | (194,578 | ) | (4,752,501 | ) | (91,889 | ) | (2,457,292 | ) | ||||||||
| (38,010 | ) | (977,636 | ) | 1,949,815 | 55,483,864 | |||||||||||
| Class R6 Shares(b) | ||||||||||||||||
Shares sold | 24,436 | 597,278 | 324 | 10,000 | ||||||||||||
Reinvestment of distributions | 23 | 539 | — | — | ||||||||||||
Shares redeemed | (9,102 | ) | (237,071 | ) | — | — | ||||||||||
| 15,357 | 360,746 | 324 | 10,000 | |||||||||||||
NET INCREASE (DECREASE) | (180,706 | ) | $ | (4,478,666 | ) | 73,437 | $ | 2,973,823 | ||||||||
| (a) | Commenced operations on April 16, 2018. |
| (b) | Commenced operations on February 28, 2018. |
80
GOLDMAN SACHS FUNDAMENTAL EMERGING MARKETS EQUITY FUNDS
| 12. SUMMARY OF SHARE TRANSACTIONS (continued) |
| Emerging Markets Equity Fund | ||||||||||||||||
|
| |||||||||||||||
| For the Fiscal Year Ended October 31, 2019 | For the Fiscal Year Ended October 31, 2018 | |||||||||||||||
|
| |||||||||||||||
| Shares | Dollars | Shares | Dollars | |||||||||||||
|
| |||||||||||||||
| Class A Shares | ||||||||||||||||
Shares sold | 6,814,401 | $ | 132,500,133 | 7,534,544 | $ | 159,698,335 | ||||||||||
Reinvestment of distributions | 37,945 | 644,306 | 27,247 | 590,988 | ||||||||||||
Shares redeemed | (4,421,848 | ) | (82,650,999 | ) | (2,778,087 | ) | (58,228,632 | ) | ||||||||
| 2,430,498 | 50,493,440 | 4,783,704 | 102,060,691 | |||||||||||||
| Class C Shares | ||||||||||||||||
Shares sold | 475,915 | 7,954,572 | 1,205,035 | 23,137,573 | ||||||||||||
Reinvestment of distributions | — | — | 3,236 | 63,061 | ||||||||||||
Shares redeemed | (981,996 | ) | (16,512,774 | ) | (978,503 | ) | (17,043,397 | ) | ||||||||
| (506,081 | ) | (8,558,202 | ) | 229,768 | 6,157,237 | |||||||||||
| Institutional Shares | ||||||||||||||||
Shares sold | 21,184,595 | 429,740,047 | 38,923,020 | 889,487,169 | ||||||||||||
Reinvestment of distributions | 240,543 | 4,370,669 | 252,609 | 5,858,001 | ||||||||||||
Shares redeemed | (15,168,077 | ) | (301,279,401 | ) | (32,025,759 | ) | (683,921,550 | ) | ||||||||
| 6,257,061 | 132,831,315 | 7,149,870 | 211,423,620 | |||||||||||||
| Service Shares | ||||||||||||||||
Shares sold | 265,718 | 4,913,041 | 297,907 | 6,043,336 | ||||||||||||
Reinvestment of distributions | 2,995 | 49,234 | 7,730 | 162,107 | ||||||||||||
Shares redeemed | (240,524 | ) | (4,530,984 | ) | (394,066 | ) | (7,773,105 | ) | ||||||||
| 28,189 | 431,291 | (88,429 | ) | (1,567,662 | ) | |||||||||||
| Investor Shares | ||||||||||||||||
Shares sold | 4,372,238 | 87,269,385 | 7,539,554 | 168,726,981 | ||||||||||||
Reinvestment of distributions | 49,984 | 901,707 | 28,938 | 666,445 | ||||||||||||
Shares redeemed | (5,812,117 | ) | (118,938,935 | ) | (2,756,212 | ) | (56,869,721 | ) | ||||||||
| (1,389,895 | ) | (30,767,843 | ) | 4,812,280 | 112,523,705 | |||||||||||
| Class P Shares(a) | ||||||||||||||||
Shares sold | 5,473,674 | 108,679,052 | 19,101,787 | 411,608,226 | ||||||||||||
Reinvestment of distributions | 144,959 | 2,644,053 | — | — | ||||||||||||
Shares redeemed | (4,710,104 | ) | (93,985,135 | ) | �� | (2,279,778 | ) | (45,316,728 | ) | |||||||
| 908,529 | 17,337,970 | 16,822,009 | 366,291,498 | |||||||||||||
| Class R6 Shares | ||||||||||||||||
Shares sold | 456,009 | 9,148,907 | 3,176,223 | 69,442,132 | ||||||||||||
Reinvestment of distributions | 16,045 | 292,670 | 55 | 1,272 | ||||||||||||
Shares redeemed | (1,360,524 | ) | (26,616,360 | ) | (1,141,645 | ) | (21,639,771 | ) | ||||||||
| (888,470 | ) | (17,174,783 | ) | 2,034,633 | 47,803,633 | |||||||||||
NET INCREASE | 6,839,831 | $ | 144,593,188 | 35,743,835 | $ | 844,692,722 | ||||||||||
| (a) | Commenced operations on April 16, 2018. |
81
GOLDMAN SACHS FUNDAMENTAL EMERGING MARKETS EQUITY FUNDS
Notes to Financial Statements(continued)
October 31, 2019
| 12. SUMMARY OF SHARE TRANSACTIONS (continued) |
| ESG Emerging Markets Equity Fund | ||||||||||||||||
|
| |||||||||||||||
| For the Fiscal Year Ended October 31, 2019 | For the Period Ended October 31, 2018(a) | |||||||||||||||
|
| |||||||||||||||
| Shares | Dollars | Shares | Dollars | |||||||||||||
|
| |||||||||||||||
| Class A Shares | ||||||||||||||||
Shares sold | 22 | $ | 209 | 5,001 | $ | 50,010 | ||||||||||
Reinvestment of distributions | 12 | 100 | — | — | ||||||||||||
Shares redeemed | — | — | (1 | ) | (10 | ) | ||||||||||
| 34 | 309 | 5,000 | 50,000 | |||||||||||||
| Class C Shares | ||||||||||||||||
Shares sold | — | — | 5,001 | 50,010 | ||||||||||||
Shares redeemed | — | — | (1 | ) | (10 | ) | ||||||||||
| — | — | 5,000 | 50,000 | |||||||||||||
| Institutional Shares | ||||||||||||||||
Shares sold | 118,634 | 1,104,801 | 675,001 | 6,750,015 | ||||||||||||
Reinvestment of distributions | 3,343 | 27,540 | — | — | ||||||||||||
Shares redeemed | (104,567 | ) | (1,027,258 | ) | (1 | ) | (10 | ) | ||||||||
| 17,410 | 105,083 | 675,000 | 6,750,005 | |||||||||||||
| Investor Shares | ||||||||||||||||
Shares sold | — | — | 5,001 | 50,010 | ||||||||||||
Reinvestment of distributions | 20 | 167 | — | — | ||||||||||||
Shares redeemed | — | — | (1 | ) | (10 | ) | ||||||||||
| 20 | 167 | 5,000 | 50,000 | |||||||||||||
| Class R Shares | ||||||||||||||||
Shares sold | 11,843 | 114,941 | 5,001 | 50,010 | ||||||||||||
Reinvestment of distributions | 4 | 34 | — | — | ||||||||||||
Shares redeemed | (6 | ) | (53 | ) | (1 | ) | (10 | ) | ||||||||
| 11,841 | 114,922 | 5,000 | 50,000 | |||||||||||||
| Class R6 Shares | ||||||||||||||||
Shares sold | — | — | 5,001 | 50,010 | ||||||||||||
Reinvestment of distributions | 25 | 206 | — | — | ||||||||||||
Shares redeemed | — | — | (1 | ) | (10 | ) | ||||||||||
| 25 | 206 | 5,000 | 50,000 | |||||||||||||
NET INCREASE | 29,330 | $ | 220,687 | 700,000 | $ | 7,000,005 | ||||||||||
| (a) | Commenced operations on May 31, 2018. |
82
GOLDMAN SACHS FUNDAMENTAL EMERGING MARKETS EQUITY FUNDS
| 12. SUMMARY OF SHARE TRANSACTIONS (continued) |
| Imprint Emerging Markets Opportunities Fund | ||||||||||||||||
|
| |||||||||||||||
| For the Fiscal Year Ended October 31, 2019 | For the Fiscal Year Ended October 31, 2018 | |||||||||||||||
|
| |||||||||||||||
| Shares | Dollars | Shares | Dollars | |||||||||||||
|
| |||||||||||||||
| Class A Shares | ||||||||||||||||
Shares sold | 54,373 | $ | 462,086 | 76,753 | $ | 737,163 | ||||||||||
Reinvestment of distributions | 5,314 | 43,152 | 140 | 1,457 | ||||||||||||
Shares redeemed | (426,689 | ) | (3,637,862 | ) | (949,377 | ) | (9,311,775 | ) | ||||||||
| (367,002 | ) | (3,132,624 | ) | (872,484 | ) | (8,573,155 | ) | |||||||||
| Class C Shares | ||||||||||||||||
Shares sold | 871 | 7,085 | 9,228 | 88,943 | ||||||||||||
Shares redeemed | (117,652 | ) | (964,642 | ) | (142,158 | ) | (1,294,901 | ) | ||||||||
| (116,781 | ) | (957,557 | ) | (132,930 | ) | (1,205,958 | ) | |||||||||
| Institutional Shares | ||||||||||||||||
Shares sold | 43,062 | 384,696 | 235,610 | 2,255,894 | ||||||||||||
Reinvestment of distributions | 17,360 | 141,306 | 15,615 | 163,337 | ||||||||||||
Shares redeemed | (1,091,629 | ) | (9,349,452 | ) | (3,804,473 | ) | (36,202,219 | ) | ||||||||
| (1,031,207 | ) | (8,823,450 | ) | (3,553,248 | ) | (33,782,988 | ) | |||||||||
| Investor Shares | ||||||||||||||||
Shares sold | 6,747 | 56,324 | 133,683 | 1,255,601 | ||||||||||||
Reinvestment of distributions | 2,245 | 18,320 | 1,101 | 11,491 | ||||||||||||
Shares redeemed | (532,724 | ) | (4,404,839 | ) | (301,814 | ) | (2,892,022 | ) | ||||||||
| (523,732 | ) | (4,330,195 | ) | (167,030 | ) | (1,624,930 | ) | |||||||||
| Class P Shares(a) | ||||||||||||||||
Shares sold | 25,721 | 218,000 | 1,817,237 | 16,265,580 | ||||||||||||
Reinvestment of distributions | 26,019 | 211,532 | — | — | ||||||||||||
Shares redeemed | (265,388 | ) | (2,255,242 | ) | (27,284 | ) | (245,807 | ) | ||||||||
| (213,648 | ) | (1,825,710 | ) | 1,789,953 | 16,019,773 | |||||||||||
| Class R6 Shares(b) | ||||||||||||||||
Shares sold | — | — | 959 | 10,000 | ||||||||||||
Reinvestment of distributions | 14 | 117 | — | — | ||||||||||||
| 14 | 117 | 959 | 10,000 | |||||||||||||
NET DECREASE | (2,252,356 | ) | $ | (19,069,419 | ) | (2,934,780 | ) | $ | (29,157,258 | ) | ||||||
| (a) | Commenced operations on April 16, 2018. |
| (b) | Commenced operations on February 28, 2018. |
83
Report of Independent Registered Public
Accounting Firm
Tothe Board of Trustees of Goldman Sachs Trust and Shareholders of Goldman Sachs Asia Equity Fund, Goldman Sachs Emerging Markets Equity Fund, Goldman Sachs ESG Emerging Markets Equity Fund, and Goldman Sachs Imprint Emerging Markets Opportunity Fund (formerly, Goldman SachsN-11 Equity Fund)
Opinions on the Financial Statements
We have audited the accompanying statements of assets and liabilities, including the schedules of investments, of each of the funds listed in the table below (four of the funds constituting Goldman Sachs Trust, hereafter collectively referred to as the “Funds”) as of October 31, 2019, the related statements of operations and of changes in net assets for each of the periods indicated in the table below, including the related notes, and the financial highlights for each of the periods indicated in the table below (collectively referred to as the “financial statements”). In our opinion, the financial statements present fairly, in all material respects, the financial position of each of the Funds as of October 31, 2019, the results of each of their operations, the changes in each of their net assets, and each of the financial highlights for each of the periods indicated in the table below in conformity with accounting principles generally accepted in the United States of America.
| Fund | Statement of operations | Statements of changes in net assets | Financial highlights | |||
| Goldman Sachs Asia Equity Fund, Goldman Sachs Emerging Markets Equity Fund, Goldman Sachs Imprint Emerging Markets Opportunity Fund (formerly, Goldman SachsN-11 Equity Fund) | For the year ended October 31, 2019 | For each of the two years in the period ended October 31, 2019 | For each of the periods indicated therein | |||
| Goldman Sachs ESG Emerging Markets Equity Fund | For the year ended October 31, 2019 | For the year ended October 31, 2019 and for the period May 31, 2018 (commencement of operations) through October 31, 2018 | ||||
Basis for Opinions
These financial statements are the responsibility of the Funds’ management. Our responsibility is to express an opinion on the Funds’ financial statements based on our audits. We are a public accounting firm registered with the Public Company Accounting Oversight Board (United States) (PCAOB) and are required to be independent with respect to the Funds in accordance with the U.S. federal securities laws and the applicable rules and regulations of the Securities and Exchange Commission and the PCAOB.
We conducted our audits of these financial statements in accordance with the standards of the PCAOB. Those standards require that we plan and perform the audit to obtain reasonable assurance about whether the financial statements are free of material misstatement, whether due to error or fraud.
Our audits included performing procedures to assess the risks of material misstatement of the financial statements, whether due to error or fraud, and performing procedures that respond to those risks. Such procedures included examining, on a test basis, evidence regarding the amounts and disclosures in the financial statements. Our audits also included evaluating the accounting principles used and significant estimates made by management, as well as evaluating the overall presentation of the financial statements. Our procedures included confirmation of securities owned as of October 31, 2019 by correspondence with the custodian, transfer agent and brokers; when replies were not received from brokers, we performed other auditing procedures. We believe that our audits provide a reasonable basis for our opinions.
PricewaterhouseCoopers LLP
Boston, Massachusetts
December 23, 2019
We have served as the auditor of one or more investment companies in the Goldman Sachs fund complex since 2000.
84
GOLDMAN SACHS FUNDAMENTAL EMERGING MARKETS EQUITY FUNDS
Fund Expenses — Six Month Period Ended October 31, 2019 (Unaudited)
As a shareholder of Class A, Class C, Institutional, Service, Investor, Class P, Class R or Class R6 Shares of a Fund you incur two types of costs: (1) transaction costs, including sales charges on purchase payments (with respect to Class A Shares) and contingent deferred sales charges on redemptions (with respect to Class C Shares); and (2) ongoing costs, including management fees; distribution and/or service(12b-1) fees (with respect to Class A, Class C and Service Shares); and other Fund expenses. This example is intended to help you understand your ongoing costs (in dollars) of investing in Class A, Class C, Institutional, Service, Investor, Class P, Class R and Class R6 Shares of the Funds and to compare these costs with the ongoing costs of investing in other mutual funds.
The example is based on an investment of $1,000 invested at the beginning of the period and held for the entire period from May 1, 2019 through October 31, 2019, which represents a period of 184 days of a 365 day year.
Actual Expenses— The first line under each share class in the table below provides information about actual account values and actual expenses. You may use the information in this line, together with the amount you invested, to estimate the expenses that you paid over the period. Simply divide your account value by $1,000 (for example, an $8,600 account value divided by $1,000=8.6), then multiply the result by the number in the first line under the heading entitled “Expenses Paid” to estimate the expenses you paid on your account during this period.
Hypothetical Example for Comparison Purposes— The second line under each share class in the table below provides information about hypothetical account values and hypothetical expenses based on the Funds’ actual net expense ratio and an assumed rate of return of 5% per year before expenses, which is not the Funds’ actual return. The hypothetical account values and expenses may not be used to estimate the actual ending account balance or expenses you paid for the period. You may use this information to compare the ongoing costs of investing in the Funds and other funds. To do so, compare this 5% hypothetical example with the 5% hypothetical examples that appear in the shareholder reports of the other funds.
Please note that the expenses shown in the table are meant to highlight your ongoing costs only and do not reflect any transactional costs, such as sales charges, redemption fee or exchange fees. Therefore, the second line of the table is useful in comparing ongoing costs only, and will not help you determine the relative total costs of owning different funds. In addition, if these transactional costs were included, your costs would have been higher.
| Asia Equity Fund | Emerging Markets Equity Fund | ESG Emerging Markets Equity Fund | Imprint Emerging Markets Opportunities | |||||||||||||||||||||||||||||||||||||||||||||
| Share Class | Beginning Account Value 05/01/2019 | Ending Account Value 10/31/2019 | Expenses Paid for the 6 Months Ended 10/31/2019* | Beginning Account Value 05/01/2019 | Ending Account Value 10/31/2019 | Expenses Paid for the 6 Months Ended 10/31/2019* | Beginning Account Value 05/01/2019 | Ending Account Value 10/31/2019 | Expenses Paid for the 6 Months Ended 10/31/2019* | Beginning Account Value 05/01/2019 | Ending Account Value 10/31/2019 | Expenses Paid for the 6 Months Ended 10/31/2019* | ||||||||||||||||||||||||||||||||||||
| Class A | ||||||||||||||||||||||||||||||||||||||||||||||||
Actual | $ | 1,000 | $ | 1,009.40 | $ | 7.55 | $ | 1,000 | $ | 1,016.50 | $ | 7.88 | $ | 1,000 | $ | 1,011.20 | $ | 8.26 | $ | 1,000 | $ | 954.80 | $ | 8.47 | ||||||||||||||||||||||||
Hypothetical 5% return | 1,000 | 1,017.69 | + | 7.58 | 1,000 | 1,017.39 | + | 7.88 | 1,000 | 1,016.99 | + | 8.29 | 1,000 | 1,016.53 | + | 8.74 | ||||||||||||||||||||||||||||||||
| Class C | ||||||||||||||||||||||||||||||||||||||||||||||||
Actual | 1,000 | 1,005.70 | 11.32 | 1,000 | 1,012.90 | 11.67 | 1,000 | 1,007.10 | 12.04 | 1,000 | 951.40 | 12.15 | ||||||||||||||||||||||||||||||||||||
Hypothetical 5% return | 1,000 | 1,013.91 | + | 11.37 | 1,000 | 1,013.61 | + | 11.67 | 1,000 | 1,013.21 | + | 12.08 | 1,000 | 1,012.75 | + | 12.53 | ||||||||||||||||||||||||||||||||
| Institutional | ||||||||||||||||||||||||||||||||||||||||||||||||
Actual | 1,000 | 1,011.00 | 5.83 | 1,000 | 1,019.10 | 5.90 | 1,000 | 1,013.20 | 6.29 | 1,000 | 956.10 | 6.61 | ||||||||||||||||||||||||||||||||||||
Hypothetical 5% return | 1,000 | 1,019.41 | + | 5.85 | 1,000 | 1,019.36 | + | 5.90 | 1,000 | 1,018.95 | + | 6.31 | 1,000 | 1,018.45 | + | 6.82 | ||||||||||||||||||||||||||||||||
| Service | ||||||||||||||||||||||||||||||||||||||||||||||||
Actual | N/A | N/A | N/A | 1,000 | 1,016.00 | 8.44 | N/A | N/A | N/A | N/A | N/A | N/A | ||||||||||||||||||||||||||||||||||||
Hypothetical 5% return | N/A | N/A | N/A | 1,000 | 1,016.84 | + | 8.44 | N/A | N/A | N/A | N/A | N/A | N/A | |||||||||||||||||||||||||||||||||||
| Investor | ||||||||||||||||||||||||||||||||||||||||||||||||
Actual | 1,000 | 1,010.70 | 6.34 | 1,000 | 1,017.90 | 6.61 | 1,000 | 1,012.20 | 7.00 | 1,000 | 956.10 | 7.25 | ||||||||||||||||||||||||||||||||||||
Hypothetical 5% return | 1,000 | 1,018.90 | + | 6.36 | 1,000 | 1,018.65 | + | 6.61 | 1,000 | 1,018.25 | + | 7.02 | 1,000 | 1,017.80 | + | 7.48 | ||||||||||||||||||||||||||||||||
| Class P | ||||||||||||||||||||||||||||||||||||||||||||||||
Actual | 1,000 | 1,011.00 | 5.78 | 1,000 | 1,019.00 | 5.85 | N/A | N/A | N/A | 1,000 | 956.00 | 6.56 | ||||||||||||||||||||||||||||||||||||
Hypothetical 5% return | 1,000 | 1,019.46 | + | 5.80 | 1,000 | 1,019.41 | + | 5.85 | N/A | N/A | N/A | 1,000 | 1,018.50 | + | 6.77 | |||||||||||||||||||||||||||||||||
| Class R | ||||||||||||||||||||||||||||||||||||||||||||||||
Actual | N/A | N/A | N/A | N/A | N/A | N/A | 1,000 | 1,010.20 | 9.83 | N/A | N/A | N/A | ||||||||||||||||||||||||||||||||||||
Hypothetical 5% return | N/A | N/A | N/A | N/A | N/A | N/A | 1,000 | 1,015.43 | + | 9.86 | N/A | N/A | N/A | |||||||||||||||||||||||||||||||||||
| Class R6 | ||||||||||||||||||||||||||||||||||||||||||||||||
Actual | 1,000 | 1,011.00 | 5.78 | 1,000 | 1,019.00 | 5.85 | 1,000 | 1,013.20 | 6.29 | 1,000 | 957.20 | 6.61 | ||||||||||||||||||||||||||||||||||||
Hypothetical 5% return | 1,000 | 1,019.46 | + | 5.80 | 1,000 | 1,019.41 | + | 5.85 | 1,000 | 1,018.95 | + | 6.31 | 1,000 | 1,018.45 | + | 6.82 | ||||||||||||||||||||||||||||||||
| + | Hypothetical expenses are based on each Fund’s actual annualized net expense ratios and an assumed rate of return of 5% per year before expenses. |
| * | Expenses are calculated using each Fund’s annualized net expense ratio for each class, which represents the ongoing expenses as a percentage of net assets for the six months ended October 31, 2019. Expenses are calculated by multiplying the annualized net expense ratio by the average account value for the period; then multiplying the result by the number of days in the most recent fiscal half year; and then dividing that result by the number of days in the fiscal year. The annualized net expense ratios for the period were as follows: |
| Fund | Class A | Class C | Institutional | Service | Investor | Class P | Class R | Class R6 | ||||||||||||||||||||||||
Asia Equity | 1.50 | % | 2.25 | % | 1.16 | % | N/A | 1.26 | % | 1.15 | % | N/A | 1.15 | % | ||||||||||||||||||
Emerging Markets Equity | 1.55 | 2.30 | 1.17 | 1.67 | % | 1.30 | 1.16 | N/A | 1.16 | |||||||||||||||||||||||
ESG Emerging Markets Equity | 1.66 | 2.41 | 1.27 | N/A | 1.41 | N/A | 1.99 | % | 1.27 | |||||||||||||||||||||||
Imprint Emerging Markets Opportunities | 1.74 | 2.49 | 1.36 | N/A | 1.50 | 1.35 | N/A | 1.37 | ||||||||||||||||||||||||
85
GOLDMAN SACHS FUNDAMENTAL EMERGING MARKETS EQUITY FUNDS
Statement Regarding Basis for Approval of Management Agreement (Unaudited)
Background
The Goldman Sachs Asia Equity Fund (effective after the close of business on November 20, 2019, the Goldman Sachs China Equity Fund), Goldman Sachs Emerging Markets Equity Fund, Goldman Sachs ESG Emerging Markets Equity Fund and Goldman Sachs Imprint Emerging Markets Opportunities Fund (formerly, the Goldman SachsN-11 Equity Fund) (the “Funds”) are investment portfolios of Goldman Sachs Trust (the “Trust”). The Board of Trustees oversees the management of the Trust and reviews the investment performance and expenses of the Funds at regularly scheduled meetings held throughout the year. In addition, the Board of Trustees determines annually whether to approve the continuance of the Trust’s investment management agreement (the “Management Agreement”) with Goldman Sachs Asset Management, L.P. (the “Investment Adviser”) on behalf of the Funds.
The Management Agreement was most recently approved for continuation until June 30, 2020 by the Board of Trustees, including those Trustees who are not parties to the Management Agreement or “interested persons” (as defined in the Investment Company Act of 1940, as amended) of any party thereto (the “Independent Trustees”), at a meeting held onJune 11-12, 2019 (the “Annual Meeting”).
The review process undertaken by the Trustees spans the course of the year and culminates with the Annual Meeting. To assist the Trustees in their deliberations, the Trustees have established a Contract Review Committee (the “Committee”), comprised of the Independent Trustees. The Committee held four meetings over the course of the year since the Management Agreement was last approved. At those Committee meetings, regularly scheduled Board or other committee meetings, and/or the Annual Meeting, matters relevant to the renewal of the Management Agreement were considered by the Board, or the Independent Trustees, as applicable. With respect to each Fund, such matters included:
| (a) | the nature and quality of the advisory, administrative, and other services provided to the Fund by the Investment Adviser and its affiliates, including information about: |
| (i) | the structure, staff, and capabilities of the Investment Adviser and its portfolio management teams; |
| (ii) | the groups within the Investment Adviser and its affiliates that support the portfolio management teams or provide other types of necessary services, including fund services groups (e.g., accounting and financial reporting, tax, shareholder services, and operations); controls and risk management groups (e.g., legal, compliance, valuation oversight, credit risk management, internal audit, compliance testing, market risk analysis, finance, and central funding); sales and distribution support groups, and others (e.g., information technology and training); |
| (iii) | trends in employee headcount; |
| (iv) | the Investment Adviser’s financial resources and ability to hire and retain talented personnel and strengthen its operations; and |
| (v) | the parent company’s support of the Investment Adviser and its mutual fund business, as expressed by the firm’s senior management; |
| (b) | information on the investment performance of the Fund, including comparisons to the performance of similar mutual funds, as provided by a third-party mutual fund data provider engaged as part of the contract review process (the “Outside Data Provider”), a benchmark performance index,and (in the case of the Asia Equity Fund) a composite of accounts with comparable investment strategies managed by the Investment Adviser; and information on general investment outlooks in the markets in which the Fund invests; |
| (c) | information provided by the Investment Adviser indicating the Investment Adviser’s views on whether the Fund’s peer group and/or benchmark index had high, medium, or low relevance given the Fund’s particular investment strategy; |
| (d) | the terms of the Management Agreement and other agreements with affiliated service providers entered into by the Trust on behalf of the Fund; |
| (e) | fee and expense information for the Fund, including: |
| (i) | the relative management fee and expense levels of the Fund as compared to those of comparable funds managed by other advisers, as provided by the Outside Data Provider; |
| (ii) | the Fund’s expense trends over time (except for the ESG Emerging Markets Equity Fund); and |
| (iii) | to the extent the Investment Adviser manages other types of accounts (such as bank collective trusts, private wealth management accounts, institutional separate accounts,sub-advised mutual funds, andnon-U.S. funds) having investment objectives and policies similar to those of the Fund, comparative information on the advisory fees charged and services provided to those accounts by the Investment Adviser; |
| (f) | with respect to the extensive investment performance and expense comparison data provided by the Outside Data Provider, its processes in producing that data for the Fund; |
| (g) | the undertakings of the Investment Adviser and its affiliates to implement fee waivers and/or expense limitations; |
86
GOLDMAN SACHS FUNDAMENTAL EMERGING MARKETS EQUITY FUNDS
Statement Regarding Basis for Approval of Management Agreement (Unaudited) (continued)
| (h) | information relating to the profitability of the Management Agreement and the transfer agency and distribution and service arrangements of the Fund to the Investment Adviser and its affiliates; |
| (i) | whether the Fund’s existing management fee schedule adequately addressed any economies of scale; |
| (j) | a summary of the“fall-out” benefits derived by the Investment Adviser and its affiliates from their relationships with the Fund, including the fees received by the Investment Adviser’s affiliates from the Fund for transfer agency, securities lending, portfolio trading, distribution and other services; |
| (k) | a summary of potential benefits derived by the Fund as a result of its relationship with the Investment Adviser; |
| (l) | information regarding commissions paid by the Fund and broker oversight, an update on the Investment Adviser’s soft dollars practices, other information regarding portfolio trading, and how the Investment Adviser carries out its duty to seek best execution; |
| (m) | portfolio manager ownership of Fund shares; the manner in which portfolio manager compensation is determined; and the number and types of accounts managed by the portfolio managers; |
| (n) | the nature and quality of the services provided to the Fund by its unaffiliated service providers, and the Investment Adviser’s general oversight and evaluation (including reports on due diligence) of those service providers as part of the administrative services provided under the Management Agreement; and |
| (o) | the Investment Adviser’s processes and policies addressing various types of potential conflicts of interest; its approach to risk management; the annual review of the effectiveness of the Fund’s compliance program; and periodic compliance reports. |
The Trustees also received an overview of the Funds’ distribution arrangements. They received information regarding the Funds’ assets, share purchase and redemption activity, and payment of distribution, service, and shareholder administration fees, as applicable. Information was also provided to the Trustees relating to revenue sharing payments made by and services provided by the Investment Adviser and its affiliates to intermediaries that promote the sale, distribution, and/or servicing of Fund shares. The Independent Trustees also discussed the broad range of other investment choices that are available to Fund investors, including the availability of comparable funds managed by other advisers.
The presentations made at the Board and Committee meetings and at the Annual Meeting encompassed the Funds and other mutual funds for which the Board of Trustees has responsibility. In evaluating the Management Agreement at the Annual Meeting, the Trustees relied upon their knowledge, resulting from their meetings and other interactions throughout the year, of the Investment Adviser and its affiliates, their services, and the Funds. In conjunction with these meetings, the Trustees received written materials and oral presentations on the topics covered, and the Investment Adviser addressed the questions and concerns of the Trustees, including concerns regarding the investment performance of certain of the funds they oversee. The Independent Trustees were advised by their independent legal counsel regarding their responsibilities and other regulatory requirements related to the approval and continuation of mutual fund investment management agreements under applicable law. In addition, the Investment Adviser and its affiliates provided the Independent Trustees with a written response to a formal request for information sent on behalf of the Independent Trustees by their independent legal counsel. During the course of their deliberations, the Independent Trustees met in executive sessions with their independent legal counsel, without representatives of the Investment Adviser or its affiliates present.
Nature, Extent, and Quality of the Services Provided Under the Management Agreement
As part of their review, the Trustees considered the nature, extent, and quality of the services provided to the Funds by the Investment Adviser. In this regard, the Trustees considered both the investment advisory services andnon-advisory services that are provided by the Investment Adviser and its affiliates. The Trustees noted the transition in the leadership and changes in personnel of various of the Investment Adviser’s portfolio management teams that had occurred in recent periods, and the ongoing recruitment efforts aimed at bringing high quality investment talent to the Investment Adviser. They also noted the Investment Adviser’s commitment to maintaining high quality systems and expending substantial resources to respond to ongoing changes to the regulatory and control environment in which the Funds and their service providers operate, as well as the efforts of the Investment Adviser and its affiliates to combat cyber security risks. The Trustees concluded that the Investment Adviser continued to commit substantial financial and operational resources to the Funds and expressed confidence that the Investment Adviser would continue to do so in the future. The Trustees also recognized that the Investment Adviser had made significant commitments to address regulatory compliance requirements applicable to the Funds and the Investment Adviser and its affiliates.
Investment Performance
The Trustees also considered the investment performance of the Funds. In this regard, they compared the investment performance of each Fund to its peers usingrankings and ratings compiled by the Outside Data Provider as of December 31, 2018,
87
GOLDMAN SACHS FUNDAMENTAL EMERGING MARKETS EQUITY FUNDS
Statement Regarding Basis for Approval of Management Agreement (Unaudited) (continued)
and updated performance information prepared by the Investment Adviser using the peer group identified by the Outside Data Provider as of March 31, 2019. The information on each Fund’s investment performance was provided for theone-, three-, five-, andten-year periods ending on the applicable dates, to the extent that each Fund had been in existence for those periods. The Trustees also reviewed each Fund’s investment performance relative to its performance benchmark. As part of this review, they considered the investment performance trends of the Funds over time, and reviewed the investment performance of each Fund in light of its investment objective and policies and market conditions. The Trustees also received information comparing the Asia Equity Fund’s performance to that of a composite of accounts with comparable investment strategies managed by the Investment Adviser.
In addition, the Trustees considered materials prepared and presentations made by the Investment Adviser’s senior management and portfolio management personnel in which Fund performance was assessed. The Trustees also considered the Investment Adviser’s periodic reports with respect to the Funds’ risk profiles, and how the Investment Adviser’s approach to risk monitoring and management influences portfolio management.
The Trustees noted that the Asia Equity Fund’s Institutional Shares had placed in the first quartile of its peer group for the three-, five-, andten-year periods and in the third quartile for theone-year period, and had outperformed the Fund’s benchmark index for the five- andten-year periods and underperformed for theone- and three-year periods ended March 31, 2019. They also noted that the Asia Equity Fund had experienced certain portfolio management changes in the first half of 2019. The Trustees observed that the Emerging Markets Equity Fund’s Institutional Shares had placed in the top half of its peer group for the three-, five-, andten-year periods and the third quartile for theone-year period, and had outperformed the Fund’s benchmark index for the three-, five-, andten-year periods and underperformed for theone-year period ended March 31, 2019. The Trustees noted that theN-11 Equity Fund’s Institutional Shares had placed in the fourth quartile for theone-, three- and five-year periods, and had outperformed the Fund’s benchmark index for theone-year period and underperformed for the three- and five-year periods. They further noted that they had been asked to consider a repositioning of theN-11 Equity Fund to the Imprint Emerging Markets Opportunities Fund, which would involve changes to the Fund’s investment strategy.
The Trustees noted that the ESG Emerging Markets Equity Fund had launched on May 31, 2018 and did not yet have a meaningful performance history.
Costs of Services Provided and Competitive Information
The Trustees considered the contractual terms of the Management Agreement and the fee rates payable by each Fund thereunder. In this regard, the Trustees considered information on the services rendered by the Investment Adviser to the Funds, which included both advisory and administrative services that were directed to the needs and operations of the Funds as registered mutual funds.
In particular, the Trustees reviewed analyses prepared by the Outside Data Provider regarding the expense rankings of the Funds. The analyses provided a comparison of each Fund’s management fee and breakpoints to those of a relevant peer group and category universe; an expense analysis which compared each Fund’s overall net and gross expenses to a peer group and a category universe; and data comparing each Fund’s net expenses to the peer and category medians. The analyses also compared each Fund’s other expenses and fee waivers/reimbursements to those of the peer group and category medians. The Trustees concluded that the comparisons provided by the Outside Data Provider were useful in evaluating the reasonableness of the management fees and total expenses paid by the Funds.
In addition, the Trustees considered the Investment Adviser’s undertakings to implement fee waivers and/or expense limitations. The Trustees also noted that certain changes were being made to existing fee waiver or expense limitation arrangements of the Asia Equity Fund, Emerging Markets Equity Fund and ESG Emerging Markets Equity Fund that would have the effect of decreasing expenses of Class A, Class C, Class R and Investor Shares, as applicable, of each Fund, with such changes taking effect in connection with each Fund’s next annual registration statement update. They also considered, to the extent that the Investment Adviser manages other types of accounts having investment objectives and policies similar to those of the Funds, comparative fee information for services provided by the Investment Adviser to those accounts, and information that indicated that services provided to the Funds differed in various significant respects from the services provided to other types of accounts which, in many cases, operated under less stringent legal and regulatory structures, required fewer services from the Investment Adviser to a smaller number of client contact points, and were less time-intensive.
In addition, the Trustees noted that shareholders are able to redeem their Fund shares at any time if shareholders believe that the Fund fees and expenses are too high or if they are dissatisfied with the performance of the Fund.
88
GOLDMAN SACHS FUNDAMENTAL EMERGING MARKETS EQUITY FUNDS
Statement Regarding Basis for Approval of Management Agreement (Unaudited) (continued)
Profitability
The Trustees reviewed each Fund’s contribution to the Investment Adviser’s revenues andpre-tax profit margins. In this regard the Trustees noted that they had received, among other things, profitability analyses and summaries, revenue and expense schedules by Fund and by function (i.e., investment management, transfer agency and distribution and service), and information on the Investment Adviser’s expense allocation methodology. They observed that the profitability and expense figures are substantially similar to those used by the Investment Adviser for many internal purposes, including compensation decisions among various business groups, and are thus subject to a vigorous internal debate about how certain revenue and expenses should be allocated. The Trustees also noted that the internal audit group within the Goldman Sachs organization periodically audits the expense allocation methodology and that the internal audit group was satisfied with the reasonableness, consistency, and accuracy of the Investment Adviser’s expense allocation methodology. Profitability data for each Fund was provided for 2018 and 2017 (2018 only for the ESG Emerging Markets Equity Fund), and the Trustees considered this information in relation to the Investment Adviser’s overall profitability.
Economies of Scale
The Trustees considered the information that had been provided regarding whether there have been economies of scale with respect to the management of the Funds. The Trustees also considered the breakpoints in the fee rate payable under the Management Agreement for each of the Funds at the following annual percentage rates of the average daily net assets of the Funds:
| Asia Equity Fund | Emerging Markets Equity Fund | |||||||||||
| First $1 billion | 1.00 | % | First $ | 2 billion | 1.02 | % | ||||||
| Next $1 billion | 0.90 | Next $ | 3 billion | 0.92 | ||||||||
| Next $3 billion | 0.86 | Next $ | 3 billion | 0.87 | ||||||||
| Next $3 billion | 0.84 | Over $ | 8 billion | 0.85 | ||||||||
| Over $8 billion | 0.82 | |||||||||||
| ESG Emerging Markets Equity Fund | Imprint Emerging Markets Opportunities Fund | |||||||||||
| First $2 billion | 0.98 | % | First $ | 2 billion | 1.05 | % | ||||||
| Next $3 billion | 0.88 | Next $ | 3 billion | 0.95 | ||||||||
| Next $3 billion | 0.84 | Next $ | 3 billion | 0.90 | ||||||||
| Over $8 billion | 0.82 | Over $ | 8 billion | 0.88 | ||||||||
The Trustees noted that the breakpoints were designed to share potential economies of scale, if any, with the Funds and their shareholders as assets under management reach those asset levels. The Trustees considered the amounts of assets in the Funds; the Funds’ recent share purchase and redemption activity; the information provided by the Investment Adviser relating to the costs of the services provided by the Investment Adviser and its affiliates and their realized profits; information comparing fee rates charged by the Investment Adviser with fee rates charged to other funds in the peer groups; and the Investment Adviser’s undertaking to limit certain expenses of the Funds that exceed specified levels. Upon reviewing these matters at the Annual Meeting, the Trustees concluded that the fee breakpoints represented a means of assuring that benefits of scalability, if any, would be passed along to shareholders at the specified asset levels.
Other Benefits to the Investment Adviser and Its Affiliates
The Trustees also considered the other benefits derived by the Investment Adviser and its affiliates from their relationships with the Funds as stated above, including: (a) transfer agency fees received by Goldman Sachs & Co. LLC (“Goldman Sachs”); (b) brokerage and futures commissions earned by Goldman Sachs for executing securities and futures transactions on behalf of the Funds; (c) research received by the Investment Adviser from broker-dealers in exchange for executing certain transactions on behalf of the Funds; (d) trading efficiencies resulting from aggregation of orders of the Funds with those for other funds or accounts managed by the Investment Adviser; (e) fees earned by Goldman Sachs Agency Lending (“GSAL”), an affiliate of the Investment Adviser, as securities lending agent (and fees earned by the Investment Adviser for managing the fund in which the Funds’ cash collateral is invested); (f) the Investment Adviser’s ability to leverage the infrastructure designed to service the Funds on behalf of its other clients; (g) the Investment Adviser’s ability to cross-market other products and services to Fund shareholders; (h) Goldman Sachs’ retention of certain fees as Fund Distributor; (i) the Investment Adviser’s ability to negotiate better pricing
89
GOLDMAN SACHS FUNDAMENTAL EMERGING MARKETS EQUITY FUNDS
Statement Regarding Basis for Approval of Management Agreement (Unaudited) (continued)
with custodians on behalf of its other clients, as a result of the relationship with the Funds; and (j) the possibility that the working relationship between the Investment Adviser and the Funds’ third-party service providers may cause those service providers to be more likely to do business with other areas of Goldman Sachs. In the course of considering the foregoing, the Independent Trustees requested and received further information quantifying certain of thesefall-out benefits.
Other Benefits to the Funds and Their Shareholders
The Trustees also noted that the Funds receive certain other potential benefits as a result of their relationship with the Investment Adviser, including: (a) trading efficiencies resulting from aggregation of orders of the Funds with those of other funds or accounts managed by the Investment Adviser; (b) enhanced servicing from vendors due to the volume of business generated by the Investment Adviser and its affiliates; (c) enhanced servicing from broker-dealers due to the volume of business generated by the Investment Adviser and its affiliates; (d) the Investment Adviser’s ability to negotiate favorable terms with derivatives counterparties on behalf of the Funds as a result of the size and reputation of the Goldman Sachs organization; (e) the advantages received from the Investment Adviser’s knowledge and experience gained from managing other accounts and products; (f) the Investment Adviser’s ability to hire and retain qualified personnel to provide services to the Funds because of the reputation of the Goldman Sachs organization; (g) the Funds’ access, through the Investment Adviser, to certain firm-wide resources (e.g., proprietary risk management systems and databases), subject to certain restrictions; (h) the Funds’ ability to participate in the securities lending program administered by GSAL, as measured by the revenue received by the Funds in connection with the program; and (i) the Funds’ access to certain affiliated distribution channels. In addition, the Trustees noted the competitive nature of the mutual fund marketplace, and considered that many of the Funds’ shareholders invested in the Funds in part because of the Funds’ relationship with the Investment Adviser and that those shareholders have a general expectation that the relationship will continue.
Conclusion
In connection with their consideration of the Management Agreement, the Trustees gave weight to each of the factors described above, but did not identify any particular factor as controlling their decision. After deliberation and consideration of all of the information provided, including the factors described above, the Trustees concluded, in the exercise of their business judgment, that the management fees paid by each of the Funds were reasonable in light of the services provided to it by the Investment Adviser, the Investment Adviser’s costs and each Fund’s current and reasonably foreseeable asset levels. The Trustees unanimously concluded that the Investment Adviser’s continued management likely would benefit each Fund and its shareholders and that the Management Agreement should be approved and continued with respect to each Fund until June 30, 2020.
90
GOLDMAN SACHS FUNDAMENTAL EMERGING MARKETS EQUITY FUNDS
Trustees and Officers (Unaudited)
Independent Trustees
| Name, Address and Age1 | Position(s) Held with the Trust | Term of Office and | Principal Occupation(s) During Past 5 Years | Number of Portfolios in Fund Complex Overseen by Trustee3 | Other Directorships Held by Trustee4 | |||||
Jessica Palmer Age: 70 | Chair of the Board of Trustees | Since 2018 (Trustee since 2007) | Ms. Palmer is retired. She was formerly Consultant, Citigroup Human Resources Department (2007-2008); Managing Director, Citigroup Corporate and Investment Banking (previously, Salomon Smith Barney/Salomon Brothers) (1984-2006). Ms. Palmer was a Member of the Board of Trustees of Indian Mountain School (private elementary and secondary school) (2004-2009).
Chair of the Board of Trustees — Goldman Sachs Trust and Goldman Sachs Variable Insurance Trust. | 102 | None | |||||
Kathryn A. Cassidy Age: 65 | Trustee | Since 2015 | Ms. Cassidy is retired. Formerly, she was Advisor to the Chairman (May 2014-December 2014); and Senior Vice President and Treasurer (2008-2014), General Electric Company & General Electric Capital Corporation (technology and financial services companies).
Trustee — Goldman Sachs Trust and Goldman Sachs Variable Insurance Trust. | 102 | None | |||||
Diana M. Daniels Age: 70 | Trustee | Since 2007 | Ms. Daniels is retired. Formerly, she was Vice President, General Counsel and Secretary, The Washington Post Company (1991-2006). Ms. Daniels is a Trustee Emeritus and serves as a Presidential Councillor of Cornell University (2013-Present); former Member of the Legal Advisory Board, New York Stock Exchange (2003-2006) and of the Corporate Advisory Board, Standish Mellon Management Advisors (2006-2007).
Trustee — Goldman Sachs Trust and Goldman Sachs Variable Insurance Trust. | 102 | None | |||||
Roy W. Templin Age: 59 | Trustee | Since 2013 | Mr. Templin is retired. He is Director, Armstrong World Industries, Inc. (a designer and manufacturer of ceiling, wall and suspension system solutions) (2016-Present); and was formerly Chairman of the Board of Directors, Con-Way Incorporated (a transportation, logistics and supply chain management service company) (2014-2015); Executive Vice President and Chief Financial Officer, Whirlpool Corporation (an appliance manufacturer and marketer) (2004-2012). Previously, Mr. Templin served as an Advisory Board Member of Goldman Sachs Trust and Goldman Sachs Variable Insurance Trust (June 2013-October 2013).
Trustee — Goldman Sachs Trust and Goldman Sachs Variable Insurance Trust. | 102 | Armstrong World Industries, Inc. (a ceiling, wall and suspension systems solutions manufacturer) | |||||
Gregory G. Weaver Age: 68 | Trustee | Since 2015 | Mr. Weaver is retired. He is Director, Verizon Communications Inc. (2015-Present); and was formerly Chairman and Chief Executive Officer, Deloitte & Touche LLP (a professional services firm) (2001-2005 and 2012-2014); and Member of the Board of Directors, Deloitte & Touche LLP (2006-2012).
Trustee — Goldman Sachs Trust and Goldman Sachs Variable Insurance Trust. | 102 | Verizon Communications Inc. | |||||
91
GOLDMAN SACHS FUNDAMENTAL EMERGING MARKETS EQUITY FUNDS
Trustees and Officers (Unaudited) (continued)
Interested Trustee*
| Name, Address and Age1 | Position(s) Held with the Trust | Term of Office and | Principal Occupation(s) During Past 5 Years | Number of Portfolios in Fund Complex Overseen by Trustee3 | Other Directorships Held by Trustee4 | |||||
James A. McNamara Age: 57 | President and Trustee | Since 2007 | Advisory Director, Goldman Sachs (January 2018-Present); Managing Director, Goldman Sachs (January 2000-December 2017); Director of Institutional Fund Sales, GSAM (April 1998-December 2000); and Senior Vice President and Manager, Dreyfus Institutional Service Corporation (January 1993-April 1998).
President and Trustee — Goldman Sachs Trust; Goldman Sachs Variable Insurance Trust; Goldman Sachs Trust II; Goldman Sachs MLP Income Opportunities Fund; Goldman Sachs MLP and Energy Renaissance Fund; and Goldman Sachs ETF Trust. | 162 | None | |||||
Advisory Board Members
| Name, Address, Age1 | Position(s) Held with the Trust | Term of Office and | Principal Occupation(s) During Past 5 Years | Number of Portfolios in Fund Complex Overseen by Advisory Board Member3 | Other Directorships Held by Advisory Board Member4 | |||||
Dwight L. Bush Age: 62 | Advisory Board Member | Since 2019 | Ambassador Bush is President and CEO of D.L. Bush & Associates (a financial advisory and private investment firm) (2002-2014 and 2017-present); and was formerly U.S. Ambassador to the Kingdom of Morocco (2014-2017) and a Member of the Board of Directors of Santander Bank, N.A. (2018-2019).
Advisory Board Member — Goldman Sachs Trust and Goldman Sachs Variable Insurance Trust. | 102 | None | |||||
Joaquin Delgado Age: 59 | Advisory Board Member | Since 2019 | Dr. Delgado is retired. He is Director, Hexion Inc. (a specialty chemical manufacturer) (2019-present); and Director, Stepan Company (a specialty chemical manufacturer) (2011-present); and was formerly Executive Vice President, Consumer Business Group of 3M Company (July 2016-July 2019); and Executive Vice President, Health Care Business Group of 3M Company (October 2012-July 2016).
Advisory Board Member — Goldman Sachs Trust and Goldman Sachs Variable Insurance Trust. | 102 | Stepan Company (a specialty chemical manufacturer) | |||||
| * | Mr. McNamara is considered to be an “Interested Trustee” because he holds positions with Goldman Sachs and owns securities issued by The Goldman Sachs Group, Inc. Mr. McNamara holds comparable positions with certain other companies of which Goldman Sachs, GSAM or an affiliate thereof is the investment adviser, administrator and/or distributor. |
| 1 | Each Trustee and Advisory Board Member may be contacted by writing to the Trustee or Advisory Board Member, c/o Goldman Sachs, 200 West Street, New York, New York, 10282, Attn: Caroline Kraus. Information is provided as of October 31, 2019. |
| 2 | Subject to such policies as may be adopted by the Board from time-to-time, each Trustee holds office for an indefinite term, until the earliest of: (a) the election of his or her successor; (b) the date the Trustee resigns or is removed by the Board or shareholders, in accordance with the Trust’s Declaration of Trust; or (c) the termination of the Trust. The Board has adopted policies which provide that (a) no Trustee shall hold office for more than 15 years and (b) a Trustee shall retire as of December 31st of the calendar year in which he or she reaches his or her 74th birthday, unless a waiver of such requirements shall have been adopted by a majority of the other Trustees. These policies may be changed by the Trustees without shareholder vote. |
| 3 | The Goldman Sachs Fund Complex includes certain other companies listed above for each respective Trustee. As of October 31, 2019, Goldman Sachs Trust consisted of 89 portfolios (88 of which offered shares to the public); Goldman Sachs Variable Insurance Trust consisted of 13 portfolios; Goldman Sachs Trust II consisted of 19 portfolios (17 of which offered shares to the public); Goldman Sachs MLP Income Opportunities Fund and Goldman Sachs MLP and Energy Renaissance Fund each consisted of one portfolio; and Goldman Sachs ETF Trust consisted of 39 portfolios (21 of which offered shares to the public). |
| 4 | This column includes only directorships of companies required to report to the Securities and Exchange Commission under the Securities Exchange Act of 1934 (i.e., “public companies”) or other investment companies registered under the Act. |
Additional information about the Trustees is available in the Funds’ Statement of Additional Information, which can be obtained from Goldman Sachs free of charge by calling this toll-free number (in the United States of America): 1-800-526-7384. Additional information about the Advisory Board Members will be available in the Funds’ Statement of Additional Information dated February 28, 2020, which will be available from Goldman Sachs free of charge by calling this toll-free number (in the United States of America): 1-800-526-7384.
92
GOLDMAN SACHS FUNDAMENTAL EMERGING MARKETS EQUITY FUNDS
Trustees and Officers (Unaudited) (continued)
Officers of the Trust*
| Name, Address and Age1 | Position(s) Held with the Trust | Term of Office and | Principal Occupation(s) During Past 5 Years | |||
James A. McNamara 200 West Street New York, NY 10282 Age: 57 | Trustee and President | Since 2007 | Advisory Director, Goldman Sachs (January 2018-Present); Managing Director, Goldman Sachs (January 2000-December 2017); Director of Institutional Fund Sales, GSAM (April 1998-December 2000); and Senior Vice President and Manager, Dreyfus Institutional Service Corporation (January 1993-April 1998).
President and Trustee — Goldman Sachs Trust; Goldman Sachs Variable Insurance Trust; Goldman Sachs Trust II; Goldman Sachs MLP Income Opportunities Fund; Goldman Sachs MLP and Energy Renaissance Fund; and Goldman Sachs ETF Trust. | |||
Caroline L. Kraus 200 West Street New York, NY 10282 Age: 42 | Secretary | Since 2012 | Managing Director, Goldman Sachs (January 2016-Present); Vice President, Goldman Sachs (August 2006-December 2015); Associate General Counsel, Goldman Sachs (2012-Present); Assistant General Counsel, Goldman Sachs (August 2006-December 2011); and Associate, Weil, Gotshal & Manges, LLP (2002-2006).
Secretary — Goldman Sachs Trust (previously Assistant Secretary (2012)); Goldman Sachs Variable Insurance Trust (previously Assistant Secretary (2012)); Goldman Sachs Trust II; Goldman Sachs BDC, Inc.; Goldman Sachs Private Middle Market Credit LLC; Goldman Sachs Middle Market Lending Corp.; Goldman Sachs MLP Income Opportunities Fund; Goldman Sachs MLP and Energy Renaissance Fund; and Goldman Sachs ETF Trust. | |||
Joseph F. DiMaria 30 Hudson Street Jersey City, NJ 07302 Age: 51 | Treasurer, Principal Financial Officer and Principal Accounting Officer | Since 2017 (Treasurer and Principal Financial Officer since 2019) | Managing Director, Goldman Sachs (November 2015-Present) and Vice President — Mutual Fund Administration, Columbia Management Investment Advisers, LLC (May 2010-October 2015).
Treasurer, Principal Financial Officer and Principal Accounting Officer — Goldman Sachs Trust (previously Assistant Treasurer (2016)); Goldman Sachs Variable Insurance Trust (previously Assistant Treasurer (2016)); Goldman Sachs Trust II (previously Assistant Treasurer (2017)); Goldman Sachs MLP Income Opportunities Fund (previously Assistant Treasurer (2017)); Goldman Sachs MLP and Energy Renaissance Fund (previously Assistant Treasurer (2017)); and Goldman Sachs ETF Trust (previously Assistant Treasurer (2017)). | |||
| * | Represents a partial list of officers of the Trust. Additional information about all the officers is available in the Funds’ Statement of Additional Information, which can be obtained from Goldman Sachs free of charge by calling this toll-free number (in the United States): 1-800-526-7384. |
| 1 | Information is provided as of October 31, 2019. |
| 2 | Officers hold office at the pleasure of the Board of Trustees or until their successors are duly elected and qualified. Each officer holds comparable positions with certain other companies of which Goldman Sachs, GSAM or an affiliate thereof is the investment adviser, administrator and/or distributor. |
93
GOLDMAN SACHS FUNDAMENTAL EMERGING MARKETS EQUITY FUNDS
Goldman Sachs Trust — Fundamental Emerging Markets Equity Funds — Tax Information (Unaudited)
From distributions paid during the year ended October 31, 2019, the total amount of income received by the Asia Equity, Emerging Markets Equity, ESG Emerging Markets Equity, and Imprint Emerging Markets Opportunities Funds from sources within foreign countries and possessions of the United States was $0.1922, $0.1687, $0.0483, and $0.1601 per share, all of which is attributable to qualified passive income. The percentage of net investment income dividends paid from foreign sources by the Asia Equity, Emerging Markets Equity, ESG Emerging Markets Equity, and Imprint Emerging Markets Opportunities Funds was 100%, 90.07%, 100% and 93.46%. The total amount of taxes paid by the Asia Equity, Emerging Markets Equity, ESG Emerging Markets Equity, and Imprint Emerging Markets Opportunities Funds to such countries was $0.0616, $0.0320, $0.0104 and $0.0617 per share.
For the year ended October 31, 2019, 100% of the dividends paid from net investment company taxable income by the Asia Equity, Emerging Markets Equity, ESG Emerging Markets Equity, and Imprint Emerging Markets Opportunities Funds, respectively, qualify for the reduced tax rate under the Jobs and Growth Tax Relief and Reconciliation Act of 2003.
Pursuant to Section 852 of the Internal Revenue Code, the Asia Equity Fund designates $4,213,623 or if different, the maximum amount allowable, as capital gain dividends paid during the fiscal year ended October 31, 2019.
94
FUNDS PROFILE
Goldman Sachs Funds
Goldman Sachs is a premier financial services firm, known since 1869 for creating thoughtful and customized investment solutions in complex global markets.
Today, theConsumer and Investment Management Division of Goldman Sachs serves a diverse set of clients worldwide, including private institutions, public entities and individuals. With approximately $1.60 trillion in assets under supervision as of September 30, 2019, Goldman Sachs Asset Management (“GSAM”) has portfolio management teams located around the world and our investment professionals bring firsthand knowledge of local markets to every investment decision. Assets under supervision includes assets under management and other client assets for which Goldman Sachs does not have full discretion. GSAM leverages the resources of Goldman Sachs & Co. LLC subject to legal, internal and regulatory restrictions.
Money Market
Financial Square FundsSM
| ∎ | Financial Square Treasury Solutions Fund1 |
| ∎ | Financial Square Government Fund1 |
| ∎ | Financial Square Money Market Fund2 |
| ∎ | Financial Square Prime Obligations Fund2 |
| ∎ | Financial Square Treasury Instruments Fund1 |
| ∎ | Financial Square Treasury Obligations Fund1 |
| ∎ | Financial Square Federal Instruments Fund1 |
Investor FundsSM
| ∎ | Investor Money Market Fund3 |
| ∎ | Investor Tax-Exempt Money Market Fund3 |
Fixed Income
Short Duration and Government
| ∎ | Enhanced Income Fund |
| ∎ | High Quality Floating Rate Fund |
| ∎ | Short-Term Conservative Income Fund |
| ∎ | Short Duration Government Fund |
| ∎ | Short Duration Income Fund |
| ∎ | Government Income Fund |
| ∎ | Inflation Protected Securities Fund |
Multi-Sector
| ∎ | Bond Fund |
| ∎ | Core Fixed Income Fund |
| ∎ | Global Income Fund |
| ∎ | Strategic Income Fund |
Municipal and Tax-Free
| ∎ | High Yield Municipal Fund |
| ∎ | Dynamic Municipal Income Fund |
| ∎ | Municipal Income Completion Fund |
| ∎ | Short Duration Tax-Free Fund |
Single Sector
| ∎ | Investment Grade Credit Fund |
| ∎ | U.S. Mortgages Fund |
| ∎ | High Yield Fund |
| ∎ | High Yield Floating Rate Fund |
| ∎ | Emerging Markets Debt Fund |
| ∎ | Local Emerging Markets Debt Fund |
Fixed Income Alternatives
| ∎ | Long Short Credit Strategies Fund |
Fundamental Equity
| ∎ | Equity Income Fund |
| ∎ | Small Cap Growth Fund |
| ∎ | Small Cap Value Fund |
| ∎ | Small/Mid Cap Value Fund |
| ∎ | Mid Cap Value Fund |
| ∎ | Large Cap Value Fund |
| ∎ | Focused Value Fund |
| ∎ | Capital Growth Fund |
| ∎ | Strategic Growth Fund |
| ∎ | Small/Mid Cap Growth Fund |
| ∎ | Flexible Cap Fund |
| ∎ | Concentrated Growth Fund |
| ∎ | Technology Opportunities Fund |
| ∎ | Growth Opportunities Fund |
| ∎ | Rising Dividend Growth Fund |
| ∎ | Blue Chip Fund |
| ∎ | Income Builder Fund |
Tax-Advantaged Equity
| ∎ | U.S. Tax-Managed Equity Fund |
| ∎ | International Tax-Managed Equity Fund |
| ∎ | U.S. Equity Dividend and Premium Fund |
| ∎ | International Equity Dividend and Premium Fund |
Equity Insights
| ∎ | Small Cap Equity Insights Fund |
| ∎ | U.S. Equity Insights Fund |
| ∎ | Small Cap Growth Insights Fund |
| ∎ | Large Cap Growth Insights Fund |
| ∎ | Large Cap Value Insights Fund |
| ∎ | Small Cap Value Insights Fund |
| ∎ | International Small Cap Insights Fund |
| ∎ | International Equity Insights Fund |
| ∎ | Emerging Markets Equity Insights Fund |
Fundamental Equity International
| ∎ | International Equity Income Fund |
| ∎ | International Equity ESG Fund |
| ∎ | China Equity Fund4 |
| ∎ | Emerging Markets Equity Fund |
| ∎ | Imprint Emerging Markets Opportunities Fund5 |
| ∎ | ESG Emerging Markets Equity Fund |
Alternative
| ∎ | Real Estate Securities Fund |
| ∎ | International Real Estate Securities Fund |
| ∎ | Commodity Strategy Fund |
| ∎ | Global Real Estate Securities Fund |
| ∎ | Alternative Premia Fund |
| ∎ | Absolute Return Tracker Fund |
| ∎ | Managed Futures Strategy Fund |
| ∎ | MLP Energy Infrastructure Fund |
| ∎ | MLP & Energy Fund |
| ∎ | Multi-Manager Alternatives Fund |
| ∎ | Global Infrastructure Fund |
Total Portfolio Solutions
| ∎ | Global Managed Beta Fund |
| ∎ | Multi-Manager Non-Core Fixed Income Fund |
| ∎ | Multi-Manager U.S. Dynamic Equity Fund |
| ∎ | Multi-Manager Global Equity Fund |
| ∎ | Multi-Manager International Equity Fund |
| ∎ | Tactical Tilt Overlay Fund |
| ∎ | Balanced Strategy Portfolio |
| ∎ | Multi-Manager U.S. Small Cap Equity Fund |
| ∎ | Multi-Manager Real Assets Strategy Fund |
| ∎ | Growth and Income Strategy Portfolio |
| ∎ | Growth Strategy Portfolio |
| ∎ | Dynamic Global Equity Fund6 |
| ∎ | Satellite Strategies Portfolio |
| ∎ | Enhanced Dividend Global Equity Portfolio |
| ∎ | Tax-Advantaged Global Equity Portfolio |
| ∎ | Strategic Factor Allocation Fund |
| ∎ | Target Date 2020 Portfolio |
| ∎ | Target Date 2025 Portfolio |
| ∎ | Target Date 2030 Portfolio |
| ∎ | Target Date 2035 Portfolio |
| ∎ | Target Date 2040 Portfolio |
| ∎ | Target Date 2045 Portfolio |
| ∎ | Target Date 2050 Portfolio |
| ∎ | Target Date 2055 Portfolio |
| ∎ | Target Date 2060 Portfolio |
| ∎ | GQG Partners International Opportunities Fund |
| 1 | You could lose money by investing in the Fund. Although the Fund seeks to preserve the value of your investment at $1.00 per share, it cannot guarantee it will do so. An investment in the Fund is not a deposit of a bank and is not insured or guaranteed by the Federal Deposit Insurance Corporation or any other government agency. The Fund’s sponsor has no legal obligation to provide financial support to the Fund, and you should not expect that the sponsor will provide financial support to the Fund at any time. |
| 2 | You could lose money by investing in the Fund. Because the share price of the Fund will fluctuate, when you sell your shares they may be worth more or less than what you originally paid for them. The Fund may impose a fee upon sale of your shares or may temporarily suspend your ability to sell shares if the Fund’s liquidity falls below required minimums because of market conditions or other factors. An investment in the Fund is not a deposit of a bank and is not insured or guaranteed by the Federal Deposit Insurance Corporation or any other government agency. The Fund’s sponsor has no legal obligation to provide financial support to the Fund, and you should not expect that the sponsor will provide financial support to the Fund at any time. |
| 3 | You could lose money by investing in the Fund. Although the Fund seeks to preserve the value of your investment at $1.00 per share, it cannot guarantee it will do so. The Fund may impose a fee upon sale of your shares or may temporarily suspend your ability to sell shares if the Fund’s liquidity falls below required minimums because of market conditions or other factors. An investment in the Fund is not a deposit of a bank and is not insured or guaranteed by the Federal Deposit Insurance Corporation or any other government agency. The Fund’s sponsor has no legal obligation to provide financial support to the Fund, and you should not expect that the sponsor will provide financial support to the Fund at any time. |
| 4 | Effective after the close of business on November 20, 2019, the Goldman Sachs Asia Equity Fund was renamed the Goldman Sachs China Equity Fund. |
| 5 | Effective after the close of business on August 30, 2019, the Goldman Sachs N-11 Equity Fund was renamed the Goldman Sachs Imprint Emerging Markets Opportunities Fund. |
| 6 | Effective after the close of business on February 28, 2019, the Goldman Sachs Equity Growth Strategy Portfolio was renamed the Goldman Sachs Dynamic Global Equity Fund. |
| * | This list covers open-end funds only. Please visit our website at www.GSAMFUNDS.com to learn about our closed-end funds and exchange-traded funds. |
TRUSTEES Jessica Palmer,Chair Kathryn A. Cassidy Diana M. Daniels James A. McNamara Roy W. Templin Gregory G. Weaver | OFFICERS James A. McNamara,President Joseph F. DiMaria, Caroline L. Kraus,Secretary | |
GOLDMAN SACHS & CO. LLC Distributor and Transfer Agent | GOLDMAN SACHS ASSET MANAGEMENT, L.P. Investment Adviser | |
Visit our website atwww.GSAMFUNDS.com to obtain the most recent month-end returns.
Goldman Sachs Asset Management, L.P., 200 West Street, New York, New York 10282
The reports concerning the Funds included in this shareholder report may contain certain forward-looking statements about the factors that may affect the performance of the Funds in the future. These statements are based on Fund management’s predictions and expectations concerning certain future events and their expected impact on the Funds, such as performance of the economy as a whole and of specific industry sectors, changes in the levels of interest rates, the impact of developing world events, and other factors that may influence the future performance of the Funds. Management believes these forward-looking statements to be reasonable, although they are inherently uncertain and difficult to predict. Actual events may cause adjustments in portfolio management strategies from those currently expected to be employed.
A description of the policies and procedures that the Funds use to determine how to vote proxies relating to portfolio securities and information regarding how a Fund voted proxies relating to portfolio securities during the most recent 12-month period ended June 30 is available (i) without charge, upon request by calling 1-800-526-7384 (for Retail Shareholders) or 1-800-621-2550 (for Institutional Shareholders); and (ii) on the Securities and Exchange Commission (the “SEC”) web site at http://www.sec.gov.
Economic and market forecasts presented herein reflect our judgment as of the date of this presentation and are subject to change without notice. These forecasts do not take into account the specific investment objectives, restrictions, tax and financial situation or other needs of any specific client. Actual data will vary and may not be reflected here. These forecasts are subject to high levels of uncertainty that may affect actual performance. Accordingly, these forecasts should be viewed as merely representative of a broad range of possible outcomes. These forecasts are estimated, based on assumptions, and are subject to significant revision and may change materially as economic and market conditions change. Goldman Sachs has no obligation to provide updates or changes to these forecasts. Case studies and examples are for illustrative purposes only.
The Global Industry Classification Standard (GICS) was developed by and is the exclusive property and a service mark of Morgan Stanley Capital International Inc. (MSCI) and Standard & Poor’s, a division of The McGraw-Hill Companies, Inc. (S&P) and is licensed for use by Goldman Sachs. Neither MSCI, S&P nor any other party involved in making or compiling the GICS or any GICS classifications makes any express or implied warranties or representations with respect to such standard or classification (or the results to be obtained by the use thereof), and all such parties hereby expressly disclaim all warranties of originality, accuracy, completeness, merchantability or fitness for a particular purpose with respect to any of such standard or classification. Without limiting any of the foregoing, in no event shall MSCI, S&P, any of their affiliates or any third party involved in making or compiling the GICS or any GICS classifications have any liability for any direct, indirect, special, punitive, consequential or any other damages (including lost profits) even if notified of the possibility of such damages.
The Funds will file portfolio holdings information for each month in a fiscal quarter within 60 days after the end of the relevant fiscal quarter on Form N-PORT. Portfolio holdings information for the third month of each fiscal quarter will be made available on the SEC’s web site at http://www.sec.gov. Portfolio holdings information may be obtained upon request and without charge by calling 1-800-526-7384 (for Retail Shareholders) or 1-800-621-2550 (for Institutional Shareholders).
Holdings and allocations shown are as of October 31, 2019 and may not be representative of future investments. Fund holdings should not be relied on in making investment decisions and should not be construed as research or investment advice regarding particular securities. Current and future holdings are subject to risk.
The portfolio risk management process includes an effort to monitor and manage risk, but does not imply low risk.
This material is not authorized for distribution to prospective investors unless preceded or accompanied by a current prospectus or summary prospectus, if applicable. Investors should consider a Fund’s objective, risks, and charges and expenses, and read the summary prospectus, if available, and/or the prospectus carefully before investing or sending money. The summary prospectus, if available, and the prospectus contain this and other information about a Fund and may be obtained from your authorized dealer or from Goldman Sachs & Co. LLC by calling (retail – 1-800-526-7384) (institutional – 1-800-621-2550).
© 2019 Goldman Sachs. All rights reserved. 187086-OTU-1103583 EMEAR-19
Goldman Sachs Funds

| Annual Report | October 31, 2019 | |||
Fundamental International Equity Funds | ||||
International Equity ESG | ||||
International Equity Income | ||||
It is our intention that beginning on January 1, 2021, paper copies of the Funds’ annual and semi-annual shareholder reports will no longer be sent by mail, unless you specifically request paper copies of the reports from a Fund or from your financial intermediary. Instead, the reports will be made available on a website, and you will be notified by mail each time a report is posted and provided with a website link to access the report.
If you already elected to receive shareholder reports electronically, you will not be affected by this change and you need not take any action. At any time, you may elect to receive reports and certain communications from a Fund electronically by calling the applicable toll-free number below or by contacting your financial intermediary.
You may elect to receive all future shareholder reports in paper free of charge. If you hold shares of a Fund directly with the Fund’s transfer agent, you can inform the transfer agent that you wish to receive paper copies of reports by callingtoll-free 800-621-2550 for Institutional, Service, Class R6 and Class P shareholders or 800-526-7384 for all other shareholders. If you hold shares of a Fund through a financial intermediary, please contact your financial intermediary to make this election. Your election to receive reports in paper will apply to all Goldman Sachs Funds held in your account if you invest through your financial intermediary or all Goldman Sachs Funds held with the Funds’ transfer agent if you invest directly with the transfer agent.

Goldman Sachs Fundamental International Equity Funds
| ∎ | INTERNATIONAL EQUITY ESG |
| ∎ | INTERNATIONAL EQUITY INCOME |
| 1 | ||||
| 2 | ||||
| 4 | ||||
| 15 | ||||
| 19 | ||||
| 22 | ||||
| 22 | ||||
| 29 | ||||
| 36 | ||||
| 49 | ||||
| 50 | ||||
| NOT FDIC-INSURED | May Lose Value | No Bank Guarantee | ||
GOLDMAN SACHS FUNDAMENTAL INTERNATIONAL EQUITY FUNDS
What Differentiates Goldman Sachs’ Fundamental International Equity Investment Process?
Goldman Sachs’ Fundamental International Equity investment process is based on the belief that strong, consistent results are best achieved through expert stock selection, performed by research teams working together on a global scale. Our deep, diverse and experienced team of research analysts and portfolio managers combines local insights with global, industry-specific expertise in order to identify our high conviction investment ideas.
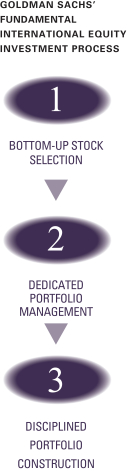

| ∎ | Fundamental research teams based in the United States, United Kingdom, Japan, China, Korea, Singapore, Brazil, and India and focusing on long-term business and management quality |
| ∎ | Analysts collaborate regularly to leverage regional and industry-specific research and insights |
| ∎ | Global perspective is informed by local market expertise |
| ∎ | A common valuation framework, focusing on long-term earnings power, ensures consistency when valuing and comparing a company to its peers globally |

| ∎ | Team of experienced Research Analysts is regionally aligned and has sector expertise |
| ∎ | Team leverages the research of the approximately 80+ regional investment professionals |
| ∎ | Decision-making process is informed by active participation in the global research process |

| ∎ | Security selections are aligned with the level of investment conviction |
| ∎ | Risk monitoring considers whether investment and other risks to the Funds are intended and justified |
| ∎ | Dedicated portfolio construction team assists in ongoing monitoring and adjustment of the stocks and their respective weightings in the Funds |

International equity portfolios that strive to offer:
| ∎ | Access to markets across the world |
| ∎ | Disciplined approach to stock selection |
| ∎ | Optimal risk/return profiles |
1
MARKET REVIEW
Goldman Sachs Fundamental International Equity Funds
International equities rallied during the 12-month period ended October 31, 2019 (the “Reporting Period”). The MSCI Europe, Australasia, Far East (EAFE) Index (Net, USD, Unhedged) (the “MSCI EAFE Index”) posted a return of 11.04%.*
Following a challenging October 2018, international equities experienced a brief reprieve as the Reporting Period began in November 2018 on dovish comments from U.S. Federal Reserve (“Fed”) Chair Jerome Powell, an accommodative stance by Chinese policymakers toward the private corporate sector and seemingly encouraging progress toward China-U.S. trade talks. (Dovish language tends to suggest lower interest rates; opposite of hawkish.) However, the relief rally proved short-lived, as international equities then plunged in December on renewed investor fears sparked by the arrest of a Chinese technology executive, a partial U.S. federal government shutdown and the U.S. President’s criticism of Fed Chair Powell. International equities also fell sharply on trade war escalations between the U.S. and China as well as on political uncertainty—and in a delayed response to an earlier sell-off in global rates. Political uncertainty remained elevated in Europe, particularly surrounding the Italian fiscal budget and ongoing Brexit negotiations. (Brexit indicates the U.K.’s path out of the European Union.)
Recovering from weakness in the last months of 2018, the MSCI EAFE Index returned 9.98% in the first quarter of 2019.* International developed equity markets rebounded across all regions. The U.S. Fed maintained its dovish stance amidst slower global economic growth, and significant progress appeared to be made in the trade talks between China and the U.S., paving the way for a potential resolution. European equities remained resilient, despite the overhang of Brexit, slowing economic data and political uncertainty. The European Union extended the Brexit deadline beyond March in a bid to prevent a tumultuous exit. Japanese equities gained during the quarter, as fears around the extent of the global economic growth slowdown eased and the yen gradually weakened.
The MSCI EAFE Index returned 3.68% in the second quarter of 2019.* International developed equity markets bounced back in June 2019 after seeing the calendar year’s first decline in May due to concerns over the U.S.-China trade war. Markets reacted positively after the U.S. and China declared a truce in their trade war and agreed to resume negotiations at the G20 Summit at the end of June. (The G20 (or Group of Twenty) is an international forum for the governments and central bank governors from 19 countries and the European Union. Its aim is to discuss policy pertaining to the promotion of international financial stability.) The U.S. agreed to hold off on imposing an additional $300 billion in tariffs and delay restrictions against Chinese technology firm Huawei, allowing U.S. companies to resume sales to the company. International developed equity markets were also supported by increasingly accommodative sentiment by several major central banks. The European equity markets were broadly higher for the quarter, as its manufacturing indices indicated improving conditions. U.K. equity markets also performed well during the quarter in spite of the ongoing uncertainty around Brexit negotiations. Japanese equity markets ended the quarter below other developed equity markets due to ongoing yen strength amidst increasing geopolitical volatility and as markets expected an easier monetary policy for the U.S. going forward. In June 2019, the truce between U.S. and China brought in some respite for the Japanese equity markets, which continued to be supported by a recovering economy, stronger capital spending and an increase in domestic demand resilience.
The MSCI EAFE Index returned -1.07% for the third quarter of 2019.* Trade news continued to dominate market movements along with the increasing political uncertainty across most governments. The U.S. Fed cut its interest rates in July and September 2019 — its first interest rate cuts since 2008 — lowering rates by 25 basis points each time, as the economy showed signs of a slowdown, but the Fed did not commit to a more extended easing cycle. (A basis point is 1/100th of a percentage point.) After witnessing a slowdown amidst weaker foreign demand, global tariff disputes and business uncertainty risk from Brexit, European equities gained toward the end of the quarter, as the European Central Bank (“ECB”) restarted quantitative easing measures. The ECB’s multi-dimensional monetary stimulus package aimed at addressing a slowing Eurozone economic growth rate through deposit rate cuts and the reinstitution of asset purchases. However, departing ECB President Mario Draghi commented on the limitations of interest rate cuts, calling instead on fiscal stimulus to support economic growth as he passes the baton of leadership to his successor Christine Lagarde, previously the President of the International Monetary Fund. The current configuration of the British parliament has regularly demonstrated it is not willing to allow the U.K. to leave the European Union
| * | All index returns are expressed in U.S. dollar terms. |
2
MARKET REVIEW
without a trade deal. A no-deal exit, therefore, remains unlikely unless a general election or referendum were to provide a mandate for it. Japan’s equity market witnessed a moderate recovery trend during the quarter, along with firmer economic fundamentals supporting domestic demand. The U.S. and Japan signed a “first stage” of a trade agreement aimed at achieving more fair and reciprocal trade between the two countries.
The MSCI EAFE Index gained 3.59% in October 2019.* International developed equity markets advanced on generally upbeat third calendar quarter corporate earnings reports and easing geopolitical tensions, including seeming progress in U.S.-China trade negotiations. The U.S. Fed cut its interest rates for the third time in 2019, lowering the targeted federal funds rate range by an additional 25 basis points. However, Fed Chair Powell signaled another rate change was unlikely as long as conditions remained steady. European equity markets moved higher on positive third calendar quarter corporate earnings and unchanged ECB policy. Tensions regarding a no-deal Brexit receded, as the European Union extended the Brexit deadline until January 31, 2020. The European Union and the U.K. agreed to a “flextension” arrangement, under which the U.K. would be able to leave the European Union earlier than the stated deadline if a withdrawal agreement was ratified by the European parliament and British parliament in time. The euro and pound sterling currencies strengthened against the U.S. dollar as investors remained optimistic for a potentially favorable U.K. parliamentary vote for the Brexit deal. Japanese equities saw positive returns during the month, as Japan’s economy continued to recover. The U.S. and Japan signed a limited trade deal on agriculture and digital trade, which covers about $55 billion of commerce between the two economies. Also, during the month, Japan’s cabinet approved a draft legislation that will require overseas investors to report plans to purchase more than 1% of shares in companies related to Japan’s national security, compared to the current 10% threshold. While the government plans to exclude asset management companies from these stricter rules, the exemption will not apply to foreign state-owned firms. The Bank of Japan stated it needs to monitor the impact of its recent sales tax hike and is also paying particular attention to the effect of the U.S. and China economies on Japan.
For the Reporting Period as a whole, utilities, information technology, health care and real estate were the strongest performing sectors in the MSCI EAFE Index, each producing a positive double-digit absolute return. The weakest performing sector in the MSCI EAFE Index and the only one to post a negative absolute return during the Reporting Period was energy. Financials, materials and communication services generated solid positive absolute returns but also lagged the MSCI EAFE Index during the Reporting Period.
From a country perspective, China, New Zealand and the Netherlands were the strongest performing constituents of the MSCI EAFE Index during the Reporting Period, each posting strong double-digit gains. The United Arab Emirates was by far the weakest individual country constituent of the MSCI EAFE Index during the Reporting Period, followed by Norway, Israel and Austria, each of which posted a negative absolute return.
Looking Ahead
At the end of the Reporting Period, economic data in some regions of the world was showing weakness after a long run of recovery and expansion. While we believe the economic cycle is mature and some cyclical softening is to be expected, economic softening does not necessarily lead to recession, and stock markets have a checkered history of predicting such. Geopolitics is and will likely continue to be the other major source of concern for international developed markets — a trade war between the world’s two most important economies, Brexit uncertainty and rising nationalism together create a challenging backdrop for investors.
As a result, markets have returned to more historically “normal” patterns of volatility. We can be reasonably confident that volatility is here to stay. That being said, we believe volatility is more a reflection of investor uncertainty than economic reality. In our opinion, volatility may ultimately provide opportunity. We are always cognizant of the fact that the companies the Funds own will have to face challenging economic times at some point, predictable or not. We selected those companies because of our confidence in their ability to grow and prosper relative to their competitors — over the long term.
As always, we maintain our focus on seeking companies with durable businesses that we believe will generate long-term growth in today’s ever-changing market conditions.
| * | All index returns are expressed in U.S. dollar terms. |
3
PORTFOLIO RESULTS
Goldman Sachs International Equity ESG Fund
Investment Objective
The Fund seeks long-term capital appreciation.
Portfolio Management Discussion and Analysis
Below, the Goldman Sachs Global Equity Team discusses Goldman Sachs International Equity ESG Fund (the “Fund”) performance and positioning for the 12-month period ended October 31, 2019 (the “Reporting Period”).
The Fund uses a proprietary framework to identify and invest in a selective portfolio of companies that satisfy the Fund’s Environmental, Social and Governance (“ESG”) criteria. By incorporating ESG criteria and an active ownership approach, the Fund seeks to manage risk from an ESG perspective and invest in sustainable businesses trading at attractive valuations that may generate excess returns over the benchmark.
| Q | How did the Fund perform during Reporting Period? |
| A | During the Reporting Period, the Fund’s Class A, Class C, Institutional, Service, Investor, Class P and Class R6 Shares generated average annual total returns, without sales charges, of 17.33%, 16.49%, 17.76%, 17.20%, 17.64%, 17.73% and 17.76%, respectively. These returns compare to the 11.04% average annual total return of the Fund’s benchmark, the MSCI EAFE Index (Net, USD, Unhedged) (the “MSCI EAFE Index”), during the same period. |
| Q | What key factors were responsible for the Fund’s performance during the Reporting Period? |
| A | The Fund outperformed the MSCI EAFE Index during the Reporting Period, attributable primarily to individual stock selection. Country allocation and sector allocation each had a positive but more modest effect during the Reporting Period. Having an allocation, albeit modest, to cash dampened the Fund’s relative results during a Reporting Period when the Index posted a solid positive return. |
| Q | What were some of the Fund’s best-performing individual stocks? |
| A | Among the greatest contributors to Fund performance relative to the MSCI EAFE Index during the Reporting Period were Cellnex Telecom, Hoya and Rentokil Initial. |
| Cellnex Telecom, based in Spain, operates infrastructure for wireless telecommunications in Spain, Italy, the Netherlands, France, Switzerland and elsewhere. During the Reporting Period, Cellnex Telecom delivered on its strategy of consolidating and optimizing the telecommunications tower infrastructure market in Europe. This market remains under-developed compared to that of the U.S., with phone carriers still largely owning their mobile towers. However, financial pressures and strategic decisions have been pushing operators to sell their infrastructure, and Cellnex Telecom has been one of the main beneficiaries of this trend given its existing position as the largest independent mast owner in Europe. In October 2019, Cellnex Telecom announced a $2.5 billion deal to acquire 7,400 mobile towers in the U.K. |
| Hoya engages in the manufacture and sale of imaging products, electronics and medical-related equipment. Its stock performed well during the Reporting Period on the back of a relatively stable earnings outlook for the company, despite tougher business conditions, especially slower demand for semiconductor-related products. Its stock performance during the Reporting Period was also driven by the company’s dominant market position in information technology-related products and investors’ reliability on the company’s ability to take proactive steps to improve profitability in the life care business. |
Rentokil Initial, based in the U.K., is a global pest management and hygiene services company. Its stock performed well after the company reported an increase in revenue for the third quarter of 2018. This increase was partly organic and partly buoyed by further acquisitions and improvements in the French workwear market. Its pest control business grew by double digits during the first half of the Reporting Period, with good performance being delivered across both developed and emerging markets. After the harsh weather conditions experienced in the first half of 2018, the company benefited from favorable weather conditions across Europe and the U.K. during the first half of the Reporting Period. This facilitated stronger revenues from wholesalers. |
4
PORTFOLIO RESULTS
Its stock continued to perform well after announcing its first half 2019 results, which were in line with market expectations. The company’s organic growth increased to its best first half organic growth level at the company in a decade. The company remained active in pursuing mergers and acquisitions, acquiring nine additional companies during the second quarter of 2019 alone. Rentokil Initial also announced it has agreed to sell its residual stake in the hygiene joint venture it had with Franz Haniel & Company (“Haniel”), a deal closed at the end of July 2019.(In December 2016, Haniel and Rentokil Initial had signed an agreement to form a joint venture, which was implemented in June 2017. In accordance with the agreement, Rentokil Initial received a 17.8% interest in hygiene, cleanliness and workwear company CWS in this transaction as part of the purchase price.) |
| Q | Which stocks detracted significantly from the Fund’s performance during the Reporting Period? |
| A | Among the biggest detractors from Fund performance relative to the MSCI EAFE Index during the Reporting Period were Reckitt Benckiser Group, Sumitomo Mitsui Financial Group and Bank of Ireland. |
| Reckitt Benckiser Group is a U.K.-based supplier of market-leading health, hygiene and household products. Its stock sold off during the early months of 2019, as its Chief Executive Officer, Rakesh Kapoor, announced his resignation after serving as the head of the company for the past eight years. At the end of the Reporting Period, we expected its share weakness to be short-lived, as the company continued to exhibit, in our view, strong fundamentals with an increasing momentum in its underlying businesses. We remained comfortable with the Fund’s position in the company at the end of the Reporting Period and were confident about its management’s ability to elect who it sees as the best candidate to help ensure a smooth transition. In our opinion, the change in management could increase the possibility of a split between the company’s health and hygiene division, which could bring new interest into Reckitt Benckiser Group’s shares in the months ahead. |
| Sumitomo Mitsui Financial Group, based in Japan, is a holding company that engages in the management of its subsidiaries, which provide financial services. This company has seen adverse effects from the persistently low interest rates in Japan. These low interest rates have not been favorable for the Japanese financials sector broadly, as they have caused net income to decline at many big Japanese banks. |
| The Bank of Ireland is an Irish bank engaged in financial and banking solutions. The Bank of Ireland’s underperformance of the MSCI EAFE Index during the Reporting Period was largely due to the ongoing uncertainty over Brexit, or the U.K.’s exit path from the European Union, as well as to lower benchmark interest rates. Both of these factors put pressure on the company’s revenues, which, in turn, drove its stock price down. Given these factors, we chose to sell the Fund’s position in the Bank of Ireland. |
| Q | Which equity market sectors most significantly affected Fund performance during the Reporting Period? |
| A | The sectors that contributed most positively to the Fund’s relative results during the Reporting Period were communication services, health care and industrials, each due primarily to effective stock selection. |
| The sectors that detracted most from the Fund’s relative results were financials and materials, each hurt by weak stock selection. Having no allocation to utilities, which outperformed the Index during the Reporting Period, also detracted. |
| Q | Which countries most affected the Fund’s performance during the Reporting Period? |
| A | Typically, the Fund’s individual stock holdings will significantly influence the Fund’s performance within a particular country or region relative to the MSCI EAFE Index. This effect may be even more pronounced in a concentrated portfolio or in countries that represent only a modest proportion of the MSCI EAFE Index. |
| That said, effective stock selection and allocation positioning in the U.K. and effective stock selection in Japan and Spain boosted the Fund’s relative returns most. Conversely, the countries that detracted most from the Fund’s relative results during the Reporting Period were Switzerland, Italy and France, where stock selection overall hurt. |
| Q | How did the Fund use derivatives and similar instruments during the Reporting Period? |
| A | During the Reporting Period, the Fund did not use derivatives or similar instruments. |
| Q | Did the Fund make any significant purchases or sales during the Reporting Period? |
| A | During the Reporting Period, we initiated a Fund position in Takeda Pharmaceutical, a Japanese pharmaceuticals company. We liked that the company did what we feel is a |
5
PORTFOLIO RESULTS
better job of communicating its expectations and raised its operating profit guidance two consecutive quarters, driven by more rapid de-leveraging, margin expansion based on synergies realized ahead of company expectations, and execution on key growth drivers on its top line, all three of which are key tenets of our investment thesis for the company and all three of which led to its stock performing better after our date of purchase. In our view, at the end of the Reporting Period, its stock continued to look attractive at its then-current valuation. |
| We established a Fund position in Neste, a Finland-based world leader in renewable energy with approximately 60% of the current industry-wide global capacity of renewable fuel, enabling, we believe, strong pricing power. The company expects to add an additional 65% of capacity during the next years following the recent extension of its Asian refinery. Longer term, we believe the company may be able to leverage its solid balance sheet to expand capacity on aviation fuel. |
| Conversely, in addition to the sale of Bank of Ireland, already mentioned, we exited the Fund’s position in UniCredit, an Italian bank, which posted weak performance during the Reporting Period largely due to macro level factors in Italy. The company saw negative effects from a persistently low interest rate environment in Europe and was also impacted by the political turmoil that Italy has experienced during the past year or so. These conditions led us to sell the position. |
| We eliminated the Fund’s position in Royal Dutch Shell, the Netherlands-based integrated energy company. The energy sector underperformed the broader equity market during the Reporting Period, largely due to macro concerns around oil and gas. During the third quarter of 2019, its stock performed roughly in line with most large-cap energy companies, with a double-digit decline. As the energy sector has struggled globally, we opted to sell the Fund’s position in Royal Dutch Shell. |
| Q | Were there any notable changes in the Fund’s weightings during the Reporting Period? |
| A | In this Fund, both sector weightings and country allocations are largely the result of our bottom-up stock selection process rather than any top-down macroeconomic views or regional, country, sector or industry bets. We seek to outpace the MSCI EAFE Index by overweighting stocks that we expect to outperform and underweighting those we think may lag. Consequently, changes in its sector or country weightings are generally the direct result of individual stock selection or of stock appreciation or depreciation. That said, during the Reporting Period, the Fund’s exposure to communication services, information technology, consumer staples, energy and materials increased relative to the MSCI EAFE Index during the Reporting Period, while its relative exposure to industrials, financials and consumer discretionary decreased. The Fund’s position in cash also decreased during the Reporting Period. |
| From a country perspective, the Fund’s exposure to Spain, Finland, Norway, the Netherlands, Sweden, Switzerland, Japan and Germany increased relative to the MSCI EAFE Index, while its relative exposure to the U.K., Denmark, Ireland and France decreased during the Reporting Period. |
| Q | How was the Fund positioned relative to the MSCI EAFE Index at the end of the Reporting Period? |
| A | At the end of the Reporting Period, the Fund had more exposure to Spain, Finland, Norway, New Zealand, the U.K., Denmark and the Netherlands and less exposure to Germany and Japan relative to the MSCI EAFE Index. At the end of the Reporting Period, the Fund held a neutral position relative to the MSCI EAFE Index in Singapore, Switzerland, Sweden and France and held no exposure to the remaining components of the MSCI EAFE Index. The Fund also had a position in Taiwan, which is not a constituent of the MSCI EAFE Index. |
| From a sector allocation perspective, the Fund had overweight positions relative to the MSCI EAFE Index in communication services, health care, real estate, information technology and industrials at the end of the Reporting Period. On the same date, the Fund had underweighted positions compared to the MSCI EAFE Index in consumer discretionary, financials, energy and materials. The Fund was rather neutrally weighted relative to the MSCI EAFE Index in consumer staples and had no exposure to the utilities sector at the end of the Reporting Period. |
| As always, we remained focused on individual stock selection, with sector and country positioning being a secondary, closely-monitored effect. |
6
FUND BASICS
International Equity ESG Fund
as of October 31, 2019
| TOP TEN HOLDINGS AS OF 10/31/191 | ||||||||||
| Holding | % of Net Assets | Line of Business | Country | |||||||
| Taiwan Semiconductor Manufacturing Co. Ltd. ADR | 4.5 | % | Semiconductors & Semiconductor Equipment | Taiwan | ||||||
| Klepierre SA (REIT) | 4.3 | Real Estate | France | |||||||
| Cellnex Telecom SA | 4.0 | Telecommunication Services | Spain | |||||||
| Reckitt Benckiser Group plc | 4.0 | Household & Personal Products | United Kingdom | |||||||
| Hoya Corp. | 3.5 | Health Care Equipment & Services | Japan | |||||||
| Vinci SA | 3.3 | Capital Goods | France | |||||||
| Novo Nordisk A/S Class B | 3.3 | Pharmaceuticals, Biotechnology & Life Sciences | Denmark | |||||||
| Aalberts NV | 3.2 | Capital Goods | Netherlands | |||||||
| Neste OYJ | 3.2 | Energy | Finland | |||||||
| Nestle SA (Registered) | 3.1 | Food, Beverage & Tobacco | Switzerland | |||||||
| 1 | The top 10 holdings may not be representative of the Fund’s future investments. |
| FUND VS. BENCHMARK SECTOR ALLOCATIONS2 |
| As of October 31, 2019 |
| 2 | The Fund is actively managed and, as such, its composition may differ over time. Consequently, the Fund’s overall sector allocations may differ from percentages contained in the graph above. The graph categorizes investments using Global Industry Classification Standard (“GICS”); however, the sector classifications used by the portfolio management team may differ from GICS. The percentage shown for each investment category reflects the value of investments in that category as a percentage of market value (excluding investments in the securities lending reinvestment vehicle, if any). Underlying sector allocations of exchange traded funds and investment companies held by the Fund are not reflected in the graph above. |
For more information about your Fund, please refer to www.GSAMFUNDS.com. There, you can learn more about your Fund’s investment strategies, holdings, and performance.
7
GOLDMAN SACHS INTERNATIONAL EQUITY ESG FUND
Performance Summary
October 31, 2019
The following graph shows the value, as of October 31, 2019, of a $1,000,000 investment made on November 1, 2009 in Institutional Shares at NAV. For comparative purposes, the performance of the Fund’s benchmark, the MSCI® EAFE Index (Net, USD, Unhedged) is shown. Performance reflects applicable fee waivers and/or expense limitations in effect during the periods shown and in their absence, performance would be reduced. Returns do not reflect the deduction of taxes that a shareholder would pay on Fund distributions or the redemption of Fund shares. The returns set forth below represent past performance. Past performance does not guarantee future results. The Fund’s investment return and principal value will fluctuate so that an investor’s shares, when redeemed, may be worth more or less than their original cost. Current performance may be lower or higher than the performance quoted below. Please visit our web site at www.GSAMFUNDS.com to obtain the most recent month-end returns.
| International Equity ESG Fund’s 10 Year Performance |
Performance of a $1,000,000 Investment, with distributions reinvested, from November 1, 2009 through October 31, 2019.
| Average Annual Total Return through October 31, 2019* | One Year | Five Years | Ten Years | Since Inception | ||||||||||
Class A | ||||||||||||||
Excluding sales charges | 17.33% | 4.27% | 5.17% | — | ||||||||||
Including sales charges | 10.88% | 3.09% | 4.57% | — | ||||||||||
| ||||||||||||||
Class C | ||||||||||||||
Excluding contingent deferred sales charges | 16.49% | 3.49% | 4.40% | — | ||||||||||
Including contingent deferred sales charges | 15.48% | 3.49% | 4.40% | — | ||||||||||
| ||||||||||||||
Institutional | 17.76% | 4.67% | 5.59% | — | ||||||||||
| ||||||||||||||
Service | 17.20% | 4.16% | 5.07% | — | ||||||||||
| ||||||||||||||
Investor (Commenced August 31, 2010) | 17.64% | 4.52% | N/A | 6.03% | ||||||||||
| ||||||||||||||
Class P (Commenced April 16, 2018) | 17.73% | N/A | N/A | 1.92% | ||||||||||
| ||||||||||||||
Class R6 (Commenced February 26, 2016) | 17.76% | N/A | N/A | 9.98% | ||||||||||
| ||||||||||||||
| * | These returns assume reinvestment of all distributions at NAV and reflect a maximum initial sales charge of 5.50% for Class A and the assumed contingent deferred sales charge for Class C Shares (1% if redeemed within 12 months of purchase). Because Institutional, Service, Investor, Class P and Class R6 Shares do not involve a sales charge, such a charge is not applied to their Average Annual Total Return. |
8
PORTFOLIO RESULTS
Goldman Sachs International Equity Income Fund
Investment Objective
The Fund seeks long-term capital appreciation and growth of income.
Portfolio Management Discussion and Analysis
Below, the Goldman Sachs Global Equity Team discusses Goldman Sachs International Equity Income Fund (the “Fund”) performance and positioning for the 12-month period ended October 31, 2019 (the “Reporting Period”).
| Q | How did the Fund perform during the Reporting Period? |
| A | During the Reporting Period, the Fund’s Class A, Class C, Institutional, Investor, Class P, Class R and Class R6 Shares generated average annual total returns, without sales charges, of 16.95%, 16.01%, 17.29%, 17.21%, 17.34%, 16.63% and 17.41%, respectively. These returns compare to the 11.04% average annual total return of the Fund’s benchmark, the MSCI EAFE Index (Net, USD, Unhedged) (the “MSCI EAFE Index”), during the same period. |
| Q | What key factors were responsible for the Fund’s performance during the Reporting Period? |
| A | The Fund outperformed the MSCI EAFE Index during the Reporting Period, attributable primarily to individual stock selection. Country allocation also contributed positively, while sector allocation detracted, albeit modestly, from relative results during the Reporting Period. |
| Q | What were some of the Fund’s best-performing individual stocks? |
| A | Among the greatest contributors to Fund performance relative to the MSCI EAFE Index during the Reporting Period were Iberdrola, Ferrovial and Enel. |
Iberdrola is a Spain-based utility with high exposure to renewable assets globally. Its stock performed well during the Reporting Period, driven by strong results across its businesses, including profits expected to be up significantly for calendar year 2019. The company found opportunities to deploy capital at attractive rates, giving confidence to investors on the sustainability of its growth in the medium term. Hydro generation, which was a headwind in the prior annual period, also performed well during the Reporting Period, boosting its results. Further, news flow on Spanish regulation over the utilities industry was better than consensus expected. |
Ferrovial, a Spain-based company, owns transportation infrastructure assets and also has exposure to the construction and related services businesses. Its stock’s strong performance during the Reporting Period can be attributed to its core assets, including Canadian toll roads and U.S. managed lanes, delivering better results than the company expected. Also, the company had announced divestiture of its services business, which had been an ongoing source of disappointment, leading to a positive re-rating of its shares. (When the market changes its view of a company, industry or sector sufficiently to make calculation ratios, such as price/earnings ratios, substantially higher or lower, this is a re-rating.) We expect the divestiture to significantly reduce the volatility of its earnings and enhance investors’ ability to focus on its infrastructure assets, assets we considered to remain attractive. |
Enel is an Italian company that operates as a multinational energy company. Enel’s execution and capital deployment were, in our view, best in class during the last couple of years. During the Reporting Period, Enel effectively expanded its business in Latin America and into renewable assets, and its core businesses performed well. During the second half of the Reporting Period, an improved political environment in Italy drove some positive re-rating of its stock. At the end of the Reporting Period, we considered its dividend yield attractive and believed the company could sustainably grow earnings and dividend growth. |
| Q | Which stocks detracted significantly from the Fund’s performance during the Reporting Period? |
| A | Among the biggest detractors from Fund performance relative to the MSCI EAFE Index during the Reporting Period were Takeda Pharmaceutical, British American Tobacco and Royal Dutch Shell. |
Takeda Pharmaceutical is a Japan-based company engaged in research and development, manufacturing, sales and marketing and import and export of pharmaceutical drugs. In |
9
PORTFOLIO RESULTS
March 2018, before the start of the Reporting Period, Takeda Pharmaceutical announced it was acquiring competitor Shire. Its underperformance of the MSCI EAFE Index during the Reporting Period was driven primarily by investor skepticism around that acquisition, which was followed by a resetting of operating profit growth expectations by the company after the completion of the acquisition earlier in 2019. However, the company has a history of conservative guidance, and there was more limited visibility into all the drivers of its guidance. That said, the company has, in our view, done a better job of communicating its expectations and raised its operating profit guidance two consecutive quarters, driven by more rapid de-leveraging, margin expansion based on synergies realized ahead of company expectations, and execution on key growth drivers on its top line, all three of which are key tenets of our investment thesis for the company and all three of which led to its stock performing better toward the end of the Reporting Period. In our view, at the end of the Reporting Period, its stock continued to look attractive at its then-current valuation. |
British American Tobacco is a U.K.-based tobacco company. In November 2018, the U.S. Food and Drug Administration commissioner announced it may clamp down on menthol flavored cigarettes. If implemented, this could put significant pressure on British American Tobacco’s cash flow, as menthol cigarettes in the U.S. accounts for approximately 25% of the company’s profits. Further, given its levered balance sheet, this could potentially put the company’s dividends under threat. Also, the tobacco industry broadly is undergoing a significant change, driven by new generational products (“NGPs”), like JUUL and iQOS, which, combined with harsher regulations on traditional cigarettes, could lead to faster volume declines and unsettling of existing economics within the industry. Although British American Tobacco had a reasonably diversified NGP strategy to adjust to this changing dynamic, in our view, we were no longer comfortable with the industry at large, as these disruptive trends strengthened, and we felt we saw further downside from a long-term perspective. We thus decided to sell the Fund’s position in British American Tobacco rather early in the Reporting Period. |
Royal Dutch Shell is a Netherlands-based integrated energy company with expertise in the exploration and production of oil and natural gas. The energy sector underperformed the broader equity market during the Reporting Period, largely due to macro concerns around oil and gas. During the third quarter of 2019, its stock performed roughly in line with most large-cap energy companies, with a double-digit decline. Though the energy sector has struggled globally, we opted to maintain an overweight position in Royal Dutch Shell at the end of the Reporting Period, having added to the Fund’s position in its stock, on weakness, during the Reporting Period, as we continued to view its fundamentals favorably. |
| Q | Which equity market sectors most significantly affected Fund performance during the Reporting Period? |
| A | The sectors that contributed most positively to the Fund’s performance relative to the MSCI EAFE Index were industrials, utilities and financials. Stock selection in all three sectors proved effective during the Reporting Period. |
The sectors that detracted from the Fund’s results most during the Reporting Period were consumer staples, consumer discretionary and energy. Weak stock selection in consumer staples and consumer discretionary hurt. Having an underweighted allocation to consumer discretionary, which outperformed the MSCI EAFE Index during the Reporting Period, and having an overweighted allocation to energy, which underperformed the MSCI EAFE Index during the Reporting Period, also dampened the Fund’s relative results. |
| Q | Which countries most affected the Fund’s performance during the Reporting Period? |
| A | Typically, the Fund’s individual stock holdings will significantly influence the Fund’s performance within a particular country or region relative to the MSCI EAFE Index. This effect may be even more pronounced in countries that represent only a modest proportion of the MSCI EAFE Index. |
That said, effective stock selection and allocation positioning in Italy and France and positive stock selection in Spain contributed most positively to the Fund’s results relative to the MSCI EAFE Index during the Reporting Period. Conversely, the countries that detracted most from the Fund’s relative performance were Sweden and Japan, where stock selection overall hurt. Having no exposure to China, which significantly outperformed the MSCI EAFE Index during the Reporting Period, also dampened the Fund’s relative results. |
| Q | How did the Fund use derivatives and similar instruments during the Reporting Period? |
| A | During the Reporting Period, the Fund did not use derivatives or similar instruments. |
10
PORTFOLIO RESULTS
| Q | Did the Fund make any significant purchases or sales during the Reporting Period? |
| A | During the Reporting Period, in addition to those purchases already mentioned, we established a Fund position in Reckitt Benckiser Group, a U.K.-based supplier of market-leading health, hygiene and household products. Its stock sold off during the early months of 2019, as its Chief Executive Officer, Rakesh Kapoor, announced his resignation after serving as the head of the company for the past eight years. At the end of the Reporting Period, we expected its share weakness to be short-lived, as the company continued to exhibit, in our view, strong fundamentals with an increasing momentum in its underlying businesses. We remained comfortable with the Fund’s position in the company at the end of the Reporting Period and were confident about its management’s ability to elect who it sees as the best candidate to help ensure a smooth transition. In our opinion, the change in management could increase the possibility of a split between the company’s health and hygiene division, which could bring new interest into Reckitt Benckiser Group’s shares in the months ahead. |
Conversely, in addition to the sales already mentioned, we exited the Fund’s position in Swedbank, as allegations of money laundering surfaced against the Swedish bank. Swedbank was not able to provide a satisfactory response to those allegations, and so we sold the Fund’s position in its stock. |
| Q | Were there any notable changes in the Fund’s weightings during the Reporting Period? |
| A | In this Fund, both sector weightings and country allocations are largely the result of our bottom-up stock selection process rather than any top-down macroeconomic views or regional, country, sector or industry bets. We seek to outpace the MSCI EAFE Index by overweighting stocks that we expect to outperform and underweighting those we think may lag. Consequently, changes in its sector or country weightings are generally the direct result of individual stock selection or of stock appreciation or depreciation. That said, during the Reporting Period, the Fund’s exposure to financials and materials increased relative to the MSCI EAFE Index during the Reporting Period, while its relative exposure to communication services, industrials, consumer staples and consumer discretionary decreased. |
From a country perspective, the Fund’s exposure to Spain, France and Singapore increased relative to the MSCI EAFE Index, while its relative exposure to the U.K., Switzerland and Italy decreased during the Reporting Period. |
| Q | How was the Fund positioned relative to the MSCI EAFE Index at the end of the Reporting Period? |
| A | At the end of the Reporting Period, the Fund had more exposure to the U.K., Spain, France, Switzerland, Singapore, Denmark and the Netherlands relative to the MSCI EAFE Index and less exposure to Japan, Germany and Australia relative to the MSCI EAFE Index. At the end of the Reporting Period, the Fund had neutral exposure relative to the MSCI EAFE Index in Italy and Sweden and had no exposure to several other components of the MSCI EAFE Index, including Austria, Belgium, China, Finland, Hong Kong, Ireland, Israel, New Zealand, Norway and Portugal. The Fund also held a position in Taiwan, which is not a component of the MSCI EAFE Index. |
From a sector allocation perspective, the Fund had overweight positions relative to the MSCI EAFE Index in real estate, financials, health care, utilities and energy at the end of the Reporting Period. On the same date, the Fund had underweighted positions compared to the MSCI EAFE Index in consumer discretionary, consumer staples, information technology and materials and rather neutral positions relative to the MSCI EAFE Index in communication services and industrials. |
As always, we remained focused on individual stock selection, with sector and country positioning being a secondary, closely-monitored effect. |
11
FUND BASICS
International Equity Income Fund
as of October 31, 2019
| TOP TEN HOLDINGS AS OF 10/31/191 | ||||||||||
| Holding | % of Net Assets | Line of Business | Country | |||||||
| Iberdrola SA | 4.0 | % | Utilities | Spain | ||||||
Royal Dutch Shell plc Class A | 3.8 | Energy | Netherlands | |||||||
Taiwan Semiconductor Manufacturing Co. Ltd. | 3.8 | Semiconductors & Semiconductor Equipment | Taiwan | |||||||
Vinci SA | 3.6 | Capital Goods | France | |||||||
Rio Tinto plc | 3.5 | Materials | Australia | |||||||
Novo Nordisk A/S Class B | 3.5 | Pharmaceuticals, Biotechnology & Life Sciences | Denmark | |||||||
Nestle SA (Registered) | 3.4 | Food, Beverage & Tobacco | Switzerland | |||||||
Schneider Electric SE | 3.1 | Capital Goods | France | |||||||
Vonovia SE | 3.1 | Real Estate | Germany | |||||||
Ferrovial SA | 3.1 | Capital Goods | Spain | |||||||
| 1 | The top 10 holdings may not be representative of the Fund’s future investments. |
| FUND VS. BENCHMARK SECTOR ALLOCATIONS2 |
| As of October 31, 2019 |
| 2 | The Fund is actively managed and, as such, its composition may differ over time. Consequently, the Fund’s overall sector allocations may differ from percentages contained in the graph above. The graph categorizes investments using Global Industry Classification Standard (“GICS”); however, the sector classifications used by the portfolio management team may differ from GICS. The percentage shown for each investment category reflects the value of investments in that category as a percentage of market value (excluding investments in the securities lending reinvestment vehicle, if any). Underlying sector allocations of exchange traded funds and investment companies held by the Fund are not reflected in the graph above. |
For more information about your Fund, please refer to www.GSAMFUNDS.com. There, you can learn more about your Fund’s investment strategies, holdings, and performance.
12
GOLDMAN SACHS INTERNATIONAL EQUITY INCOME FUND
Performance Summary
October 31, 2019
The following graph shows the value, as of October 31, 2019, of a $1,000,000 investment made on November 1, 2009 in Institutional Shares at NAV. For comparative purposes, the performance of the Fund’s benchmark, the MSCI® EAFE Index (Net, USD, Unhedged) is shown. Performance reflects applicable fee waivers and/or expense limitations in effect during the periods shown and in their absence, performance would be reduced. Returns do not reflect the deduction of taxes that a shareholder would pay on Fund distributions or the redemption of Fund shares. The returns set forth below represent past performance. Past performance does not guarantee future results. The Fund’s investment return and principal value will fluctuate so that an investor’s shares, when redeemed, may be worth more or less than their original cost. Current performance may be lower or higher than the performance quoted below. Please visit our web site at www.GSAMFUNDS.com to obtain the most recent month-end returns.
| International Equity Income Fund’s 10 Year Performance |
Performance of a $1,000,000 Investment, with distributions reinvested, from November 1, 2009 through October 31, 2019.
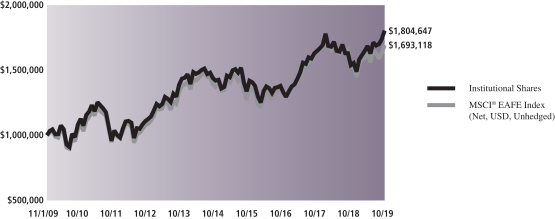
| Average Annual Total Return through October 31, 2019* | One Year | Five Years | Ten Years | Since Inception | ||||||||||
Class A | ||||||||||||||
Excluding sales charges | 16.95% | 4.48% | 5.67% | — | ||||||||||
Including sales charges | 10.52% | 3.30% | 5.08% | — | ||||||||||
| ||||||||||||||
Class C | ||||||||||||||
Excluding contingent deferred sales charges | 16.01% | 3.70% | 4.89% | — | ||||||||||
Including contingent deferred sales charges | 14.85% | 3.70% | 4.89% | — | ||||||||||
| ||||||||||||||
Institutional | 17.29% | 4.89% | 6.08% | — | ||||||||||
| ||||||||||||||
Investor | 17.21% | 4.75% | 5.99% | — | ||||||||||
| ||||||||||||||
Class P (Commenced April 16, 2018) | 17.34% | N/A | N/A | 3.02% | ||||||||||
| ||||||||||||||
Class R | 16.63% | 4.21% | 5.41% | — | ||||||||||
| ||||||||||||||
Class R6 (Commenced February 26, 2016) | 17.41% | N/A | N/A | 10.41% | ||||||||||
| ||||||||||||||
| * | These returns assume reinvestment of all distributions at NAV and reflect a maximum initial sales charge of 5.50% for Class A and the assumed contingent deferred sales charge for Class C Shares (1% if redeemed within 12 months of purchase). Because Institutional, Investor, Class P, Class R and Class R6 Shares do not involve a sales charge, such a charge is not applied to their Average Annual Total Return. |
13
FUND BASICS
Index Definition
The MSCI® EAFE Index is a market capitalization-weighted composite of securities in 21 developed markets. The MSCI® EAFE Index approximates the minimum possible dividend reinvestment. The dividend is reinvested after deduction for withholding tax, applying the rate to non-resident individuals who do not benefit from double taxation treaties. MSCI® Inc. uses withholding tax rates applicable to Luxembourg holding companies, as Luxembourg applies the highest rates. The MSCI® EAFE Index is unmanaged and the figures for the MSCI® EAFE Index do not include any deduction for fees or expenses. It is not possible to invest directly in an index.
14
GOLDMAN SACHS INTERNATIONAL EQUITY ESG FUND
October 31, 2019
| Shares | Description | Value | ||||||
| Common Stocks – 98.0% | ||||||||
| Denmark – 3.3% | ||||||||
| 73,006 | Novo Nordisk A/S Class B (Pharmaceuticals, Biotechnology & Life Sciences) | $ | 4,014,506 | |||||
|
| |||||||
| Finland – 3.2% | ||||||||
| 109,096 | Neste OYJ (Energy) | 3,941,908 | ||||||
|
| |||||||
| France – 13.5% | ||||||||
| 303,548 | Adevinta ASA Class B (Media & Entertainment)* | 3,465,857 | ||||||
| 70,176 | BNP Paribas SA (Banks) | 3,667,367 | ||||||
| 143,216 | Klepierre SA (REIT) | 5,338,411 | ||||||
| 36,573 | Vinci SA (Capital Goods) | 4,103,357 | ||||||
|
| |||||||
| 16,574,992 | ||||||||
|
| |||||||
| Germany – 5.3% | ||||||||
| 45,470 | CTS Eventim AG & Co. KGaA (Media & Entertainment) | 2,753,934 | ||||||
| 192,899 | Infineon Technologies AG (Semiconductors & Semiconductor Equipment) | 3,736,217 | ||||||
|
| |||||||
| 6,490,151 | ||||||||
|
| |||||||
| Japan – 21.7% | ||||||||
| 48,200 | Hoya Corp. (Health Care Equipment & Services) | 4,259,782 | ||||||
| 4,000 | Keyence Corp. (Technology Hardware & Equipment) | 2,529,186 | ||||||
| 161,100 | Mitsubishi Estate Co. Ltd. (Real Estate) | 3,127,818 | ||||||
| 26,000 | Nidec Corp. (Capital Goods) | 3,827,870 | ||||||
| 178,100 | ORIX Corp. (Diversified Financials) | 2,798,823 | ||||||
| 59,600 | Pigeon Corp. (Household & Personal Products) | 2,909,572 | ||||||
| 99,400 | Sumitomo Mitsui Financial Group, Inc. (Banks) | 3,529,018 | ||||||
| 105,273 | Takeda Pharmaceutical Co. Ltd. (Pharmaceuticals, Biotechnology & Life Sciences) | 3,803,838 | ||||||
|
| |||||||
| 26,785,907 | ||||||||
|
| |||||||
| Netherlands – 5.1% | ||||||||
| 99,110 | Aalberts NV (Capital Goods) | 3,993,914 | ||||||
| 18,944 | Koninklijke DSM NV (Materials) | 2,248,427 | ||||||
|
| |||||||
| 6,242,341 | ||||||||
|
| |||||||
| New Zealand – 1.9% | ||||||||
| 285,537 | a2 Milk Co. Ltd. (Food, Beverage & Tobacco)* | 2,358,730 | ||||||
|
| |||||||
| Singapore – 2.0% | ||||||||
| 128,480 | DBS Group Holdings Ltd. (Banks) | 2,448,942 | ||||||
|
| |||||||
| Spain – 9.0% | ||||||||
| 113,845 | Cellnex Telecom SA (Telecommunication Services)*(a) | 4,912,284 | ||||||
| 78,706 | Grifols SA (Pharmaceuticals, Biotechnology & Life Sciences) | 2,539,102 | ||||||
| 117,493 | Industria de Diseno Textil SA (Retailing) | 3,661,178 | ||||||
|
| |||||||
| 11,112,564 | ||||||||
|
| |||||||
| Common Stocks – (continued) | ||||||||
| Sweden – 2.3% | ||||||||
| 121,664 | Assa Abloy AB Class B (Capital Goods) | 2,889,323 | ||||||
|
| |||||||
| Switzerland – 8.6% | ||||||||
| 277,728 | Credit Suisse Group AG (Registered) (Diversified Financials)* | 3,437,682 | ||||||
| 36,267 | Nestle SA (Registered) (Food, Beverage & Tobacco) | 3,879,893 | ||||||
| 37,551 | Novartis AG (Registered) (Pharmaceuticals, Biotechnology & Life Sciences) | 3,281,029 | ||||||
|
| |||||||
| 10,598,604 | ||||||||
|
| |||||||
| Taiwan – 4.4% | ||||||||
| 106,199 | Taiwan Semiconductor Manufacturing Co. Ltd. ADR (Semiconductors & Semiconductor Equipment) | 5,483,054 | ||||||
|
| |||||||
| United Kingdom – 15.5% | ||||||||
| 26,400 | AstraZeneca plc (Pharmaceuticals, Biotechnology & Life Sciences) | 2,574,456 | ||||||
| 108,258 | Compass Group plc (Consumer Services) | 2,882,270 | ||||||
| 579,504 | DS Smith plc (Materials) | 2,686,708 | ||||||
| 226,646 | Informa plc (Media & Entertainment) | 2,278,076 | ||||||
| 63,113 | Reckitt Benckiser Group plc (Household & Personal Products) | 4,883,786 | ||||||
| 644,009 | Rentokil Initial plc (Commercial & Professional Services) | 3,790,119 | ||||||
|
| |||||||
| 19,095,415 | ||||||||
|
| |||||||
| United States – 2.2% | ||||||||
| 31,604 | Ferguson plc (Capital Goods) | 2,698,771 | ||||||
|
| |||||||
| TOTAL COMMON STOCKS | ||||||||
| (Cost $114,552,234) | $ | 120,735,208 | ||||||
|
| |||||||
| Shares | Dividend Rate | Value | ||||
| Investment Company(b) – 0.8% | ||||||
Goldman Sachs Financial Square Government Fund – Institutional Shares |
| |||||
| 992,989 | 1.701% | $ | 992,989 | |||
| (Cost $992,989) | ||||||
| ||||||
| TOTAL INVESTMENTS – 98.8% |
| |||||
| (Cost $115,545,223) | $ | 121,728,197 | ||||
| ||||||
| OTHER ASSETS IN EXCESS OF LIABILITIES – 1.2% | 1,466,787 | |||||
| ||||||
| NET ASSETS – 100.0% | $ | 123,194,984 | ||||
| ||||||
| The accompanying notes are an integral part of these financial statements. | 15 |
GOLDMAN SACHS INTERNATIONAL EQUITY ESG FUND
Schedule of Investments(continued)
October 31, 2019
| The percentage shown for each investment category reflects the value of investments in that category as a percentage of net assets. | ||
* | Non-income producing security. | |
(a) | Exempt from registration under Rule 144A of the Securities Act of 1933. | |
(b) | Represents an Affiliated Issuer. | |
| ||
Investment Abbreviations: | ||
ADR | —American Depositary Receipt | |
REIT | —Real Estate Investment Trust | |
| ||
| 16 | The accompanying notes are an integral part of these financial statements. |
GOLDMAN SACHS INTERNATIONAL EQUITY INCOME FUND
Schedule of Investments
October 31, 2019
| Shares | Description | Value | ||||||
| Common Stocks – 95.9% | ||||||||
| Australia – 5.7% | ||||||||
| 40,616 | Rio Tinto plc (Materials) | $ | 2,114,543 | |||||
| 219,116 | Sydney Airport (Transportation) | 1,327,064 | ||||||
|
| |||||||
| 3,441,607 | ||||||||
|
| |||||||
| Denmark – 3.5% | ||||||||
| 38,167 | Novo Nordisk A/S Class B (Pharmaceuticals, Biotechnology & Life Sciences) | 2,098,754 | ||||||
|
| |||||||
| Finland – 2.0% | ||||||||
| 164,954 | Nordea Bank Abp (Banks) | 1,207,354 | ||||||
|
| |||||||
| France – 14.9% | ||||||||
| 29,167 | BNP Paribas SA (Banks) | 1,524,254 | ||||||
| 9,568 | Gecina SA (REIT) | 1,642,529 | ||||||
| 48,802 | Klepierre SA (REIT) | 1,819,107 | ||||||
| 19,827 | Schneider Electric SE (Capital Goods) | 1,842,730 | ||||||
| 19,094 | Vinci SA (Capital Goods) | 2,142,277 | ||||||
|
| |||||||
| 8,970,897 | ||||||||
|
| |||||||
| Germany – 3.0% | ||||||||
| 34,575 | Vonovia SE (Real Estate) | 1,841,287 | ||||||
|
| |||||||
| Italy – 2.0% | ||||||||
| 156,989 | Enel SpA (Utilities) | 1,216,722 | ||||||
|
| |||||||
| Japan – 6.6% | ||||||||
| 78,300 | ORIX Corp. (Diversified Financials) | 1,230,476 | ||||||
| 28,100 | Sumitomo Mitsui Financial Group, Inc. (Banks) | 997,640 | ||||||
| 47,600 | Takeda Pharmaceutical Co. Ltd. (Pharmaceuticals, Biotechnology & Life Sciences) | 1,719,935 | ||||||
|
| |||||||
| 3,948,051 | ||||||||
|
| |||||||
| Netherlands – 9.1% | ||||||||
| 135,638 | ING Groep NV (Banks) | 1,535,896 | ||||||
| 542,683 | Koninklijke KPN NV (Telecommunication Services) | 1,684,690 | ||||||
| 78,130 | Royal Dutch Shell plc Class A (Energy) | 2,264,840 | ||||||
|
| |||||||
| 5,485,426 | ||||||||
|
| |||||||
| Singapore – 4.4% | ||||||||
| 59,200 | DBS Group Holdings Ltd. (Banks) | 1,128,404 | ||||||
| 228,000 | Singapore Exchange Ltd. (Diversified Financials) | 1,496,943 | ||||||
|
| |||||||
| 2,625,347 | ||||||||
|
| |||||||
| Spain – 9.9% | ||||||||
| 62,307 | Ferrovial SA (Capital Goods) | 1,838,256 | ||||||
| 231,718 | Iberdrola SA (Utilities) | 2,381,829 | ||||||
| 56,048 | Industria de Diseno Textil SA (Retailing) | 1,746,502 | ||||||
|
| |||||||
| 5,966,587 | ||||||||
|
| |||||||
| Common Stocks – (continued) | ||||||||
| Switzerland – 12.7% | ||||||||
| 18,882 | Nestle SA (Registered) (Food, Beverage & Tobacco) | $ | 2,020,022 | |||||
| 19,126 | Novartis AG (Registered) (Pharmaceuticals, Biotechnology & Life Sciences) | 1,671,140 | ||||||
| 11,339 | Swiss Re AG (Insurance) | 1,189,333 | ||||||
| 132,177 | UBS Group AG (Registered) (Diversified Financials)* | 1,564,337 | ||||||
| 3,021 | Zurich Insurance Group AG (Insurance) | 1,183,327 | ||||||
|
| |||||||
| 7,628,159 | ||||||||
|
| |||||||
| Taiwan – 3.8% | ||||||||
| 231,000 | Taiwan Semiconductor Manufacturing Co. Ltd. (Semiconductors & Semiconductor Equipment) | 2,263,755 | ||||||
|
| |||||||
| United Kingdom – 16.0% | ||||||||
| 17,025 | AstraZeneca plc (Pharmaceuticals, Biotechnology & Life Sciences) | 1,660,232 | ||||||
| 239,301 | BP plc (Energy) | 1,517,495 | ||||||
| 272,280 | DS Smith plc (Materials) | 1,262,350 | ||||||
| 58,667 | GlaxoSmithKline plc (Pharmaceuticals, Biotechnology & Life Sciences) | 1,343,764 | ||||||
| 13,317 | Reckitt Benckiser Group plc (Household & Personal Products) | 1,030,491 | ||||||
| 29,398 | Unilever plc (Household & Personal Products) | 1,760,322 | ||||||
| 519,184 | Vodafone Group plc (Telecommunication Services) | 1,059,510 | ||||||
|
| |||||||
| 9,634,164 | ||||||||
|
| |||||||
| United States – 2.3% | ||||||||
| 15,930 | Ferguson plc (Capital Goods) | 1,360,315 | ||||||
|
| |||||||
| TOTAL COMMON STOCKS | ||||||||
| (Cost $54,532,027) | $ | 57,688,425 | ||||||
|
| |||||||
| Shares | Dividend Rate | Value | ||||
| Investment Company(a) – 2.7% | ||||||
Goldman Sachs Financial Square Government Fund – Institutional Shares |
| |||||
| 1,609,740 | 1.701% | $ | 1,609,740 | |||
| (Cost $1,609,740) |
| |||||
| ||||||
| TOTAL INVESTMENTS – 98.6% |
| |||||
| (Cost $56,141,767) | $ | 59,298,165 | ||||
| ||||||
| OTHER ASSETS IN EXCESS OF LIABILITIES – 1.4% | 845,851 | |||||
| ||||||
| NET ASSETS – 100.0% | $ | 60,144,016 | ||||
| ||||||
| The accompanying notes are an integral part of these financial statements. | 17 |
GOLDMAN SACHS INTERNATIONAL EQUITY INCOME FUND
Schedule of Investments(continued)
October 31, 2019
| The percentage shown for each investment category reflects the value of investments in that category as a percentage of net assets. | ||
* | Non-income producing security. | |
(a) | Represents an Affiliated Issuer. | |
| ||
Investment Abbreviation: | ||
REIT | —Real Estate Investment Trust | |
| ||
| 18 | The accompanying notes are an integral part of these financial statements. |
GOLDMAN SACHS FUNDAMENTAL INTERNATIONAL EQUITY FUNDS
Statements of Assets and Liabilities
October 31, 2019
| International Equity ESG Fund | International Equity Income Fund | |||||||||
| Assets: |
| |||||||||
Investments in unaffiliated issuers, at value (cost $114,552,234 and $54,532,027) | $ | 120,735,208 | $ | 57,688,425 | ||||||
Investments in affiliated issuers, at value (cost $992,989 and $1,609,740) | 992,989 | 1,609,740 | ||||||||
Cash | 547,880 | 90,898 | ||||||||
Foreign currencies, at value (cost $849,007 and $13,417) | 847,493 | 13,382 | ||||||||
Receivables: | ||||||||||
Due from custodian | 2,434,498 | — | ||||||||
Foreign tax reclaims | 683,409 | 334,729 | ||||||||
Dividends | 476,775 | 158,608 | ||||||||
Reimbursement from investment adviser | 46,189 | 44,395 | ||||||||
Fund shares sold | 1,679 | 445,511 | ||||||||
Securities lending income | 1,119 | — | ||||||||
Other assets | 44,106 | 39,913 | ||||||||
| Total assets | 126,811,345 | 60,425,601 | ||||||||
| Liabilities: |
| |||||||||
Payables: | ||||||||||
Investments purchased | 3,262,901 | — | ||||||||
Management fees | 85,655 | 37,787 | ||||||||
Fund shares redeemed | 47,680 | 88,980 | ||||||||
Distribution and Service fees and Transfer Agency fees | 22,445 | 8,526 | ||||||||
Accrued expenses | 197,680 | 146,292 | ||||||||
| Total liabilities | 3,616,361 | 281,585 | ||||||||
| Net Assets: |
| |||||||||
Paid-in capital | 129,010,522 | 58,371,793 | ||||||||
Total distributable earnings (loss) | (5,815,538 | ) | 1,772,223 | |||||||
| NET ASSETS | $ | 123,194,984 | $ | 60,144,016 | ||||||
Net Assets: | ||||||||||
Class A | $ | 35,181,424 | $ | 16,711,344 | ||||||
Class C | 10,399,988 | 1,638,412 | ||||||||
Institutional | 7,659,941 | 5,231,858 | ||||||||
Service | 4,123 | — | ||||||||
Investor | 491,726 | 3,515,268 | ||||||||
Class P | 68,987,311 | 32,642,836 | ||||||||
Class R | — | 72,776 | ||||||||
Class R6 | 470,471 | 331,522 | ||||||||
Total Net Assets | $ | 123,194,984 | $ | 60,144,016 | ||||||
Shares outstanding $0.001 par value (unlimited shares authorized): | ||||||||||
Class A | 1,702,044 | 1,237,732 | ||||||||
Class C | 542,913 | 137,777 | ||||||||
Institutional | 361,816 | 366,785 | ||||||||
Service | 191 | — | ||||||||
Investor | 23,345 | 260,291 | ||||||||
Class P | 3,276,535 | 2,293,377 | ||||||||
Class R | — | 5,371 | ||||||||
Class R6 | 22,337 | 23,272 | ||||||||
Net asset value, offering and redemption price per share:(a) | ||||||||||
Class A | $20.67 | $13.50 | ||||||||
Class C | 19.16 | 11.89 | ||||||||
Institutional | 21.17 | 14.26 | ||||||||
Service | 21.63 | (b) | — | |||||||
Investor | 21.06 | 13.51 | ||||||||
Class P | 21.05 | 14.23 | ||||||||
Class R | — | 13.55 | ||||||||
Class R6 | 21.06 | 14.25 | ||||||||
| (a) | Maximum public offering price per share for Class A Shares of the International Equity ESG and International Equity Income Funds is $21.87 and $14.29, respectively. At redemption, Class C Shares may be subject to a contingent deferred sales charge assessed on the amount equal to the lesser of the current NAV or the original purchase price of the shares. |
| (b) | Net asset value may not recalculate due to rounding of fractional shares. |
| The accompanying notes are an integral part of these financial statements. | 19 |
GOLDMAN SACHS FUNDAMENTAL INTERNATIONAL EQUITY FUNDS
Statements of Operations
For the Fiscal Year Ended October 31, 2019
| International Equity ESG Fund | International Equity Income Fund | |||||||||
| Investment income: |
| |||||||||
Dividends — unaffiliated issuers (net of foreign taxes withheld of $388,182 and $183,211) | $ | 3,586,239 | $ | 1,994,471 | ||||||
Securities lending income — affiliated issuer | 54,922 | 13,879 | ||||||||
Dividends — affiliated issuers | 52,502 | 12,090 | ||||||||
Income fromnon-cash dividends | — | 155,107 | ||||||||
| Total investment income | 3,693,663 | 2,175,547 | ||||||||
| Expenses: |
| |||||||||
Management fees | 1,144,312 | 412,639 | ||||||||
Distribution and Service fees(a) | 186,006 | 55,841 | ||||||||
Professional fees | 159,710 | 138,390 | ||||||||
Registration fees | 112,312 | 109,653 | ||||||||
Custody, accounting and administrative services | 107,928 | 99,368 | ||||||||
Transfer Agency fees(a) | 106,677 | 41,884 | ||||||||
Printing and mailing costs | 100,000 | �� | 68,862 | |||||||
Trustee fees | 16,127 | 15,993 | ||||||||
Service share fees — Service and Shareholder Administration Plan | 18 | — | ||||||||
Other | 55,397 | 50,433 | ||||||||
| Total expenses | 1,988,487 | 993,063 | ||||||||
Less — expense reductions | (546,698 | ) | (469,109 | ) | ||||||
| Net expenses | 1,441,789 | 523,954 | ||||||||
| NET INVESTMENT INCOME | 2,251,874 | 1,651,593 | ||||||||
| Realized and unrealized gain (loss): |
| |||||||||
Net realized gain (loss) from: | ||||||||||
Investments — unaffiliated issuers | (5,870,108 | ) | (2,815,904 | ) | ||||||
Foreign currency transactions | 112,145 | 4,871 | ||||||||
Net change in unrealized gain on: |
| |||||||||
Investments — unaffiliated issuers | 24,139,816 | 9,465,105 | ||||||||
Foreign currency translation | 15,096 | 7,685 | ||||||||
| Net realized and unrealized gain | 18,396,949 | 6,661,757 | ||||||||
| NET INCREASE IN NET ASSETS RESULTING FROM OPERATIONS | $ | 20,648,823 | $ | 8,313,350 | ||||||
| (a) | Class specific Distribution and/or Service, and Transfer Agency fees were as follows: |
| Distribution and/or Service Fees | Transfer Agency Fees | |||||||||||||||||||||||||||||||||||||||
Fund | Class A | Class C | Class R | Class A | Class C | Institutional | Investor | Class P | Class R | Class R6 | ||||||||||||||||||||||||||||||
International Equity ESG | $ | 84,476 | $ | 101,530 | $ | — | $ | 59,684 | $ | 17,928 | $ | 4,896 | $ | 769 | $ | 23,293 | $ | — | $ | 107 | ||||||||||||||||||||
International Equity Income | 39,195 | 16,241 | 405 | 27,693 | 2,870 | 1,052 | 792 | 9,281 | 143 | 53 | ||||||||||||||||||||||||||||||
| 20 | The accompanying notes are an integral part of these financial statements. |
GOLDMAN SACHS FUNDAMENTAL INTERNATIONAL EQUITY FUNDS
Statements of Changes in Net Assets
| International Equity ESG Fund | International Equity Income Fund | |||||||||||||||||||||
| For the Fiscal Year Ended October 31, 2019 | For the Fiscal Year Ended October 31, 2018 | For the Fiscal Year Ended October 31, 2019 | For the Fiscal Year Ended October 31, 2018 | |||||||||||||||||||
| From operations: |
| |||||||||||||||||||||
Net investment income | $ | 2,251,874 | $ | 2,381,090 | $ | 1,651,593 | $ | 1,669,649 | ||||||||||||||
Net realized gain (loss) | (5,757,963 | ) | 6,860,608 | (2,811,033 | ) | 6,688,594 | ||||||||||||||||
Net change in unrealized gain (loss) | 24,154,912 | (23,508,392 | ) | 9,472,790 | (11,979,956 | ) | ||||||||||||||||
| Net increase (decrease) in net assets resulting from operations | 20,648,823 | (14,266,694 | ) | 8,313,350 | (3,621,713 | ) | ||||||||||||||||
| Distributions to shareholders: |
| |||||||||||||||||||||
From distributable earnings: | ||||||||||||||||||||||
Class A Shares | (465,302 | ) | (483,063 | ) | (1,987,104 | ) | (311,580 | ) | ||||||||||||||
Class C Shares | (23,970 | ) | (95,376 | ) | (225,027 | ) | (36,293 | ) | ||||||||||||||
Institutional Shares | (86,276 | ) | (2,074,667 | ) | (318,215 | ) | (908,138 | ) | ||||||||||||||
Service Shares | (43 | ) | (19 | ) | — | — | ||||||||||||||||
Investor Shares | (5,613 | ) | (8,008 | ) | (47,321 | ) | (8,463 | ) | ||||||||||||||
Class P Shares(a) | (1,603,197 | ) | — | (3,790,562 | ) | (252 | ) | |||||||||||||||
Class R Shares | — | — | (10,840 | ) | (710 | ) | ||||||||||||||||
Class R6 Shares | (196 | ) | (196 | ) | (8,522 | ) | (1,572 | ) | ||||||||||||||
| Total distributions to shareholders | (2,184,597 | ) | (2,661,329 | ) | (6,387,591 | ) | (1,267,008 | ) | ||||||||||||||
| From share transactions: |
| |||||||||||||||||||||
Proceeds from sales of shares | 29,120,933 | 127,208,672 | 9,295,378 | 38,702,151 | ||||||||||||||||||
Reinvestment of distributions | 2,160,928 | 2,615,810 | 6,309,522 | 1,244,540 | ||||||||||||||||||
Cost of shares redeemed | (73,381,271 | ) | (148,504,869 | ) | (9,001,452 | ) | (46,358,732 | ) | ||||||||||||||
| Net increase (decrease) in net assets resulting from share transactions | (42,099,410 | ) | (18,680,387 | ) | 6,603,448 | (6,412,041 | ) | |||||||||||||||
| TOTAL INCREASE (DECREASE) | (23,635,184 | ) | (35,608,410 | ) | 8,529,207 | (11,300,762 | ) | |||||||||||||||
| Net assets: |
| |||||||||||||||||||||
Beginning of year | 146,830,168 | 182,438,578 | 51,614,809 | 62,915,571 | ||||||||||||||||||
End of year | $ | 123,194,984 | $ | 146,830,168 | $ | 60,144,016 | $ | 51,614,809 | ||||||||||||||
| (a) | Commenced operations on April 16, 2018. |
| The accompanying notes are an integral part of these financial statements. | 21 |
GOLDMAN SACHS INTERNATIONAL EQUITY ESG FUND
Selected Data for a Share Outstanding Throughout Each Year
| Goldman Sachs International Equity ESG Fund | ||||||||||||||||||||||
| Class A Shares | ||||||||||||||||||||||
| Year Ended October 31, | ||||||||||||||||||||||
| 2019 | 2018 | 2017 | 2016 | 2015 | ||||||||||||||||||
| Per Share Data |
| |||||||||||||||||||||
Net asset value, beginning of year | $ | 17.88 | $ | 19.92 | $ | 16.61 | $ | 17.98 | $ | 18.49 | ||||||||||||
Net investment income(a) | 0.28 | 0.22 | 0.14 | 0.48 | (b) | 0.21 | ||||||||||||||||
Net realized and unrealized gain (loss) | 2.76 | (2.01 | ) | 3.63 | (1.65 | ) | (0.16 | ) | ||||||||||||||
Total from investment operations | 3.04 | (1.79 | ) | 3.77 | (1.17 | ) | 0.05 | |||||||||||||||
Distributions to shareholders from net investment income | (0.25 | ) | (0.25 | ) | (0.46 | ) | (0.20 | ) | (0.56 | ) | ||||||||||||
Net asset value, end of year | $ | 20.67 | $ | 17.88 | $ | 19.92 | $ | 16.61 | $ | 17.98 | ||||||||||||
| Total return(c) | 17.33 | % | (9.11 | )% | 23.29 | % | (6.54 | )% | 0.34 | % | ||||||||||||
Net assets, end of year (in 000s) | $ | 35,181 | $ | 34,602 | $ | 38,330 | $ | 38,152 | $ | 48,772 | ||||||||||||
Ratio of net expenses to average net assets | 1.26 | % | 1.29 | % | 1.30 | % | 1.30 | % | 1.30 | % | ||||||||||||
Ratio of total expenses to average net assets | 1.69 | % | 1.58 | % | 1.63 | % | 1.62 | % | 1.64 | % | ||||||||||||
Ratio of net investment income to average net assets | 1.52 | % | 1.11 | % | 0.78 | % | 2.86 | %(b) | 1.18 | % | ||||||||||||
Portfolio turnover rate(d) | 41 | % | 38 | % | 116 | % | 78 | % | 105 | % | ||||||||||||
| (a) | Calculated based on the average shares outstanding methodology. |
| (b) | Reflects income recognized from corporate actions which amounted to $0.28 per share and 1.63% of average net assets. |
| (c) | Assumes investment at the net asset value at the beginning of the year, reinvestment of all distributions, a complete redemption of the investment at the net asset value at the end of the year and no sales or redemption charges (if any). Total returns would be reduced if a sales or redemption charge was taken into account. Returns do not reflect the impact of taxes to shareholders relating to Fund distributions or the redemption of Fund shares. |
| (d) | The Fund’s portfolio turnover rate is calculated in accordance with regulatory requirements, without regard to transactions involving short term investments. If such transactions were included, the Fund’s portfolio turnover rate may be higher. |
| 22 | The accompanying notes are an integral part of these financial statements. |
GOLDMAN SACHS INTERNATIONAL EQUITY ESG FUND
Financial Highlights(continued)
Selected Data for a Share Outstanding Throughout Each Year
| Goldman Sachs International Equity ESG Fund | ||||||||||||||||||||||
| Class C Shares | ||||||||||||||||||||||
| Year Ended October 31, | ||||||||||||||||||||||
| 2019 | 2018 | 2017 | 2016 | 2015 | ||||||||||||||||||
| Per Share Data |
| |||||||||||||||||||||
Net asset value, beginning of year | $ | 16.49 | $ | 18.39 | $ | 15.37 | $ | 16.67 | $ | 17.18 | ||||||||||||
Net investment income(a) | 0.13 | 0.07 | 0.02 | 0.32 | (b) | 0.08 | ||||||||||||||||
Net realized and unrealized gain (loss) | 2.58 | (1.86 | ) | 3.35 | (1.53 | ) | (0.16 | ) | ||||||||||||||
Total from investment operations | 2.71 | (1.79 | ) | 3.37 | (1.21 | ) | (0.08 | ) | ||||||||||||||
Distributions to shareholders from net investment income | (0.04 | ) | (0.11 | ) | (0.35 | ) | (0.09 | ) | (0.43 | ) | ||||||||||||
Net asset value, end of year | $ | 19.16 | $ | 16.49 | $ | 18.39 | $ | 15.37 | $ | 16.67 | ||||||||||||
| Total return(c) | 16.49 | % | (9.79 | )% | 22.40 | % | (7.27 | )% | (0.42 | )% | ||||||||||||
Net assets, end of year (in 000s) | $ | 10,400 | $ | 9,985 | $ | 15,681 | $ | 15,577 | $ | 18,415 | ||||||||||||
Ratio of net expenses to average net assets | 2.01 | % | 2.04 | % | 2.05 | % | 2.05 | % | 2.05 | % | ||||||||||||
Ratio of total expenses to average net assets | 2.44 | % | 2.33 | % | 2.37 | % | 2.37 | % | 2.39 | % | ||||||||||||
Ratio of net investment income to average net assets | 0.78 | % | 0.40 | % | 0.12 | % | 2.05 | %(b) | 0.44 | % | ||||||||||||
Portfolio turnover rate(d) | 41 | % | 38 | % | 116 | % | 78 | % | 105 | % | ||||||||||||
| (a) | Calculated based on the average shares outstanding methodology. |
| (b) | Reflects income recognized from corporate actions which amounted to $0.28 per share and 1.63% of average net assets. |
| (c) | Assumes investment at the net asset value at the beginning of the year, reinvestment of all distributions, a complete redemption of the investment at the net asset value at the end of the year and no sales or redemption charges (if any). Total returns would be reduced if a sales or redemption charge was taken into account. Returns do not reflect the impact of taxes to shareholders relating to Fund distributions or the redemption of Fund shares. |
| (d) | The Fund’s portfolio turnover rate is calculated in accordance with regulatory requirements, without regard to transactions involving short term investments. If such transactions were included, the Fund’s portfolio turnover rate may be higher. |
| The accompanying notes are an integral part of these financial statements. | 23 |
GOLDMAN SACHS INTERNATIONAL EQUITY ESG FUND
Financial Highlights(continued)
Selected Data for a Share Outstanding Throughout Each Year
| Goldman Sachs International Equity ESG Fund | ||||||||||||||||||||||
| Institutional Shares | ||||||||||||||||||||||
| Year Ended October 31, | ||||||||||||||||||||||
| 2019 | 2018 | 2017 | 2016 | 2015 | ||||||||||||||||||
| Per Share Data |
| |||||||||||||||||||||
Net asset value, beginning of year | $ | 18.23 | $ | 20.30 | $ | 16.93 | $ | 18.34 | $ | 18.86 | ||||||||||||
Net investment income(a) | 0.29 | 0.40 | 0.22 | 0.47 | (b) | 0.29 | ||||||||||||||||
Net realized and unrealized gain (loss) | 2.89 | (2.14 | ) | 3.69 | (1.60 | ) | (0.16 | ) | ||||||||||||||
Total from investment operations | 3.18 | (1.74 | ) | 3.91 | (1.13 | ) | 0.13 | |||||||||||||||
Distributions to shareholders from net investment income | (0.24 | ) | (0.33 | ) | (0.54 | ) | (0.28 | ) | (0.65 | ) | ||||||||||||
Net asset value, end of year | $ | 21.17 | $ | 18.23 | $ | 20.30 | $ | 16.93 | $ | 18.34 | ||||||||||||
| Total return(c) | 17.76 | % | (8.76 | )% | 23.78 | % | (6.21 | )% | 0.74 | % | ||||||||||||
Net assets, end of year (in 000s) | $ | 7,660 | $ | 6,835 | $ | 127,403 | $ | 201,746 | $ | 151,755 | ||||||||||||
Ratio of net expenses to average net assets | 0.90 | % | 0.90 | % | 0.90 | % | 0.90 | % | 0.90 | % | ||||||||||||
Ratio of total expenses to average net assets | 1.31 | % | 1.17 | % | 1.22 | % | 1.21 | % | 1.24 | % | ||||||||||||
Ratio of net investment income to average net assets | 1.49 | % | 1.94 | % | 1.22 | % | 2.76 | %(b) | 1.56 | % | ||||||||||||
Portfolio turnover rate(d) | 41 | % | 38 | % | 116 | % | 78 | % | 105 | % | ||||||||||||
| (a) | Calculated based on the average shares outstanding methodology. |
| (b) | Reflects income recognized from corporate actions which amounted to $0.28 per share and 1.63% of average net assets. |
| (c) | Assumes investment at the net asset value at the beginning of the year, reinvestment of all distributions, a complete redemption of the investment at the net asset value at the end of the year and no sales or redemption charges (if any). Total returns would be reduced if a sales or redemption charge was taken into account. Returns do not reflect the impact of taxes to shareholders relating to Fund distributions or the redemption of Fund shares. |
| (d) | The Fund’s portfolio turnover rate is calculated in accordance with regulatory requirements, without regard to transactions involving short term investments. If such transactions were included, the Fund’s portfolio turnover rate may be higher. |
| 24 | The accompanying notes are an integral part of these financial statements. |
GOLDMAN SACHS INTERNATIONAL EQUITY ESG FUND
Financial Highlights(continued)
Selected Data for a Share Outstanding Throughout Each Year
| Goldman Sachs International Equity ESG Fund | ||||||||||||||||||||||
| Service Shares | ||||||||||||||||||||||
| Year Ended October 31, | ||||||||||||||||||||||
| 2019 | 2018 | 2017 | 2016 | 2015 | ||||||||||||||||||
| Per Share Data |
| |||||||||||||||||||||
Net asset value, beginning of year | $ | 18.70 | $ | 20.68 | $ | 16.79 | $ | 18.05 | $ | 18.57 | ||||||||||||
Net investment income(a) | 0.28 | 0.22 | 0.13 | 0.47 | (b) | 0.14 | ||||||||||||||||
Net realized and unrealized gain (loss) | 2.88 | (2.10 | ) | 3.76 | (1.67 | ) | (0.11 | ) | ||||||||||||||
Total from investment operations | 3.16 | (1.88 | ) | 3.89 | (1.20 | ) | 0.03 | |||||||||||||||
Distributions to shareholders from net investment income | (0.23 | ) | (0.10 | ) | — | (0.06 | ) | (0.55 | ) | |||||||||||||
Net asset value, end of year | $ | 21.63 | $ | 18.70 | $ | 20.68 | $ | 16.79 | $ | 18.05 | ||||||||||||
| Total return(c) | 17.20 | % | (9.14 | )% | 23.17 | % | (6.66 | )% | 0.19 | % | ||||||||||||
Net assets, end of year (in 000s) | $ | 4 | $ | 4 | $ | 4 | $ | 32 | $ | 37 | ||||||||||||
Ratio of net expenses to average net assets | 1.36 | % | 1.34 | % | 1.39 | % | 1.41 | % | 1.40 | % | ||||||||||||
Ratio of total expenses to average net assets | 1.75 | % | 1.58 | % | 1.66 | % | 1.72 | % | 1.73 | % | ||||||||||||
Ratio of net investment income to average net assets | 1.44 | % | 1.07 | % | 0.71 | % | 2.77 | %(b) | 0.76 | % | ||||||||||||
Portfolio turnover rate(d) | 41 | % | 38 | % | 116 | % | 78 | % | 105 | % | ||||||||||||
| (a) | Calculated based on the average shares outstanding methodology. |
| (b) | Reflects income recognized from corporate actions which amounted to $0.28 per share and 1.63% of average net assets. |
| (c) | Assumes investment at the net asset value at the beginning of the year, reinvestment of all distributions, a complete redemption of the investment at the net asset value at the end of the year and no sales or redemption charges (if any). Total returns would be reduced if a sales or redemption charge was taken into account. Returns do not reflect the impact of taxes to shareholders relating to Fund distributions or the redemption of Fund shares. |
| (d) | The Fund’s portfolio turnover rate is calculated in accordance with regulatory requirements, without regard to transactions involving short term investments. If such transactions were included, the Fund’s portfolio turnover rate may be higher. |
| The accompanying notes are an integral part of these financial statements. | 25 |
GOLDMAN SACHS INTERNATIONAL EQUITY ESG FUND
Financial Highlights(continued)
Selected Data for a Share Outstanding Throughout Each Year
| Goldman Sachs International Equity ESG Fund | ||||||||||||||||||||||
| Investor Shares(a) | ||||||||||||||||||||||
| Year Ended October 31, | ||||||||||||||||||||||
| 2019 | 2018 | 2017 | 2016 | 2015 | ||||||||||||||||||
| Per Share Data |
| |||||||||||||||||||||
Net asset value, beginning of year | $ | 18.20 | $ | 20.23 | $ | 16.86 | $ | 18.25 | $ | 18.76 | ||||||||||||
Net investment income(b) | 0.36 | 0.24 | 0.27 | 0.45 | (c) | 0.26 | ||||||||||||||||
Net realized and unrealized gain (loss) | 2.78 | (2.02 | ) | 3.60 | (1.60 | ) | (0.17 | ) | ||||||||||||||
Total from investment operations | 3.14 | (1.78 | ) | 3.87 | (1.15 | ) | 0.09 | |||||||||||||||
Distributions to shareholders from net investment income | (0.28 | ) | (0.25 | ) | (0.50 | ) | (0.24 | ) | (0.60 | ) | ||||||||||||
Net asset value, end of year | $ | 21.06 | $ | 18.20 | $ | 20.23 | $ | 16.86 | $ | 18.25 | ||||||||||||
| Total return(d) | 17.64 | % | (8.92 | )% | 23.63 | % | (6.34 | )% | 0.56 | % | ||||||||||||
Net assets, end of year (in 000s) | $ | 492 | $ | 421 | $ | 1,009 | $ | 749 | $ | 1,268 | ||||||||||||
Ratio of net expenses to average net assets | 1.00 | % | 1.04 | % | 1.05 | % | 1.05 | % | 1.05 | % | ||||||||||||
Ratio of total expenses to average net assets | 1.44 | % | 1.34 | % | 1.39 | % | 1.36 | % | 1.39 | % | ||||||||||||
Ratio of net investment income to average net assets | 1.87 | % | 1.20 | % | 1.50 | % | 2.62 | %(c) | 1.38 | % | ||||||||||||
Portfolio turnover rate(e) | 41 | % | 38 | % | 116 | % | 78 | % | 105 | % | ||||||||||||
| (a) | Effective August 15, 2017, Class IR changed its name to Investor Shares. |
| (b) | Calculated based on the average shares outstanding methodology. |
| (c) | Reflects income recognized from corporate actions which amounted to $0.28 per share and 1.63% of average net assets. |
| (d) | Assumes investment at the net asset value at the beginning of the year, reinvestment of all distributions, a complete redemption of the investment at the net asset value at the end of the year and no sales or redemption charges (if any). Total returns would be reduced if a sales or redemption charge was taken into account. Returns do not reflect the impact of taxes to shareholders relating to Fund distributions or the redemption of Fund shares. |
| (e) | The Fund’s portfolio turnover rate is calculated in accordance with regulatory requirements, without regard to transactions involving short term investments. If such transactions were included, the Fund’s portfolio turnover rate may be higher. |
| 26 | The accompanying notes are an integral part of these financial statements. |
GOLDMAN SACHS INTERNATIONAL EQUITY ESG FUND
Financial Highlights(continued)
Selected Data for a Share Outstanding Throughout Each Period
| Goldman Sachs International Equity ESG Fund | ||||||||||
| Class P Shares | ||||||||||
| Year Ended October 31, 2019 | April 16, 2018* to October 31, 2018 | |||||||||
| Per Share Data |
| |||||||||
Net asset value, beginning of period | $ | 18.23 | $ | 20.84 | ||||||
Net investment income(a) | 0.36 | 0.06 | ||||||||
Net realized and unrealized gain (loss) | 2.79 | (2.67 | ) | |||||||
Total from investment operations | 3.15 | (2.61 | ) | |||||||
Distributions to shareholders from net investment income | (0.33 | ) | — | |||||||
Net asset value, end of period | $ | 21.05 | $ | 18.23 | ||||||
| Total return(b) | 17.73 | % | (12.52 | )% | ||||||
Net assets, end of period (in 000s) | $ | 68,987 | $ | 94,972 | ||||||
Ratio of net expenses to average net assets | 0.89 | % | 0.89 | %(c) | ||||||
Ratio of total expenses to average net assets | 1.29 | % | 1.22 | %(c) | ||||||
Ratio of net investment income to average net assets | 1.88 | % | 0.59 | %(c) | ||||||
Portfolio turnover rate(d) | 41 | % | 38 | % | ||||||
| * | Commencement of operations. |
| (a) | Calculated based on the average shares outstanding methodology. |
| (b) | Assumes investment at the net asset value at the beginning of the period, reinvestment of all distributions, a complete redemption of the investment at the net asset value at the end of the period and no sales or redemption charges (if any). Total returns would be reduced if a sales or redemption charge was taken into account. Returns do not reflect the impact of taxes to shareholders relating to Fund distributions or the redemption of Fund shares. Total returns for periods less than one full year are not annualized. |
| (c) | Annualized. |
| (d) | The Fund’s portfolio turnover rate is calculated in accordance with regulatory requirements, without regard to transactions involving short term investments. If such transactions were included, the Fund’s portfolio turnover rate may be higher. |
| The accompanying notes are an integral part of these financial statements. | 27 |
GOLDMAN SACHS INTERNATIONAL EQUITY ESG FUND
Financial Highlights(continued)
Selected Data for a Share Outstanding Throughout Each Period
| Goldman Sachs International Equity ESG Fund | ||||||||||||||||||
| Class R6 Shares | ||||||||||||||||||
| Year Ended October 31, | February 26, 2016*
| |||||||||||||||||
| 2019 | 2018 | 2017 | ||||||||||||||||
| Per Share Data |
| |||||||||||||||||
Net asset value, beginning of period | $ | 18.23 | $ | 20.30 | $ | 16.93 | $ | 15.87 | ||||||||||
Net investment income(a) | 0.45 | 0.31 | 0.22 | 0.21 | (b) | |||||||||||||
Net realized and unrealized gain (loss) | 2.71 | (2.05 | ) | 3.69 | 0.85 | |||||||||||||
Total from investment operations | 3.16 | (1.74 | ) | 3.91 | 1.06 | |||||||||||||
Distributions to shareholders from net investment income | (0.33 | ) | (0.33 | ) | (0.54 | ) | — | |||||||||||
Net asset value, end of period | $ | 21.06 | $ | 18.23 | $ | 20.30 | $ | 16.93 | ||||||||||
| Total return(c) | 17.76 | % | (8.74 | )% | 23.80 | % | 6.68 | % | ||||||||||
Net assets, end of period (in 000s) | $ | 470 | $ | 11 | $ | 12 | $ | 11 | ||||||||||
Ratio of net expenses to average net assets | 0.90 | % | 0.89 | % | 0.89 | % | 0.89 | %(d) | ||||||||||
Ratio of total expenses to average net assets | 1.31 | % | 1.18 | % | 1.22 | % | 1.19 | %(d) | ||||||||||
Ratio of net investment income to average net assets | 2.35 | % | 1.53 | % | 1.21 | % | 1.83 | %(b)(d) | ||||||||||
Portfolio turnover rate(e) | 41 | % | 38 | % | 116 | % | 78 | % | ||||||||||
| * | Commencement of operations. |
| (a) | Calculated based on the average shares outstanding methodology. |
| (b) | Reflects income recognized from corporate actions which amounted to $0.28 per share and 1.63% of average net assets. |
| (c) | Assumes investment at the net asset value at the beginning of the period, reinvestment of all distributions, a complete redemption of the investment at the net asset value at the end of the period and no sales or redemption charges (if any). Total returns would be reduced if a sales or redemption charge was taken into account. Returns do not reflect the impact of taxes to shareholders relating to Fund distributions or the redemption of Fund shares. Total returns for periods less than one full year are not annualized. |
| (d) | Annualized. |
| (e) | The Fund’s portfolio turnover rate is calculated in accordance with regulatory requirements, without regard to transactions involving short term investments. If such transactions were included, the Fund’s portfolio turnover rate may be higher. |
| 28 | The accompanying notes are an integral part of these financial statements. |
GOLDMAN SACHS INTERNATIONAL EQUITY INCOME FUND
Financial Highlights(continued)
Selected Data for a Share Outstanding Throughout Each Year
| Goldman Sachs International Equity Income Fund | ||||||||||||||||||||||
| Class A Shares | ||||||||||||||||||||||
| Year Ended October 31, | ||||||||||||||||||||||
| 2019 | 2018 | 2017 | 2016 | 2015 | ||||||||||||||||||
| Per Share Data |
| |||||||||||||||||||||
Net asset value, beginning of year | $ | 13.25 | $ | 14.50 | $ | 11.99 | $ | 12.95 | $ | 13.52 | ||||||||||||
Net investment income(a) | 0.37 | 0.37 | 0.17 | 0.18 | 0.15 | |||||||||||||||||
Net realized and unrealized gain (loss) | 1.53 | (1.36 | ) | 2.58 | (1.04 | ) | (0.23 | ) | ||||||||||||||
Total from investment operations | 1.90 | (0.99 | ) | 2.75 | (0.86 | ) | (0.08 | ) | ||||||||||||||
Distributions to shareholders from net investment income | (0.36 | ) | (0.26 | ) | (0.24 | ) | (0.10 | ) | (0.49 | ) | ||||||||||||
Distributions to shareholders from net realized gains | (1.29 | ) | — | — | — | — | ||||||||||||||||
Total distributions | (1.65 | ) | (0.26 | ) | (0.24 | ) | (0.10 | ) | (0.49 | ) | ||||||||||||
Net asset value, end of year | $ | 13.50 | $ | 13.25 | $ | 14.50 | $ | 11.99 | $ | 12.95 | ||||||||||||
| Total return(b) | 16.95 | % | (6.98 | )% | 23.38 | % | (6.69 | )% | (0.57 | )% | ||||||||||||
Net assets, end of year (in 000s) | $ | 16,711 | $ | 15,844 | $ | 17,937 | $ | 18,301 | $ | 23,111 | ||||||||||||
Ratio of net expenses to average net assets | 1.25 | % | 1.26 | % | 1.30 | % | 1.30 | % | 1.30 | % | ||||||||||||
Ratio of total expenses to average net assets | 2.16 | % | 1.90 | % | 1.88 | % | 1.76 | % | 1.82 | % | ||||||||||||
Ratio of net investment income to average net assets | 2.99 | % | 2.54 | % | 1.32 | % | 1.47 | % | 1.11 | % | ||||||||||||
Portfolio turnover rate(c) | 27 | % | 87 | % | 32 | % | 68 | % | 83 | % | ||||||||||||
| (a) | Calculated based on the average shares outstanding methodology. |
| (b) | Assumes investment at the net asset value at the beginning of the year, reinvestment of all distributions, a complete redemption of the investment at the net asset value at the end of the year and no sales or redemption charges (if any). Total returns would be reduced if a sales or redemption charge was taken into account. Returns do not reflect the impact of taxes to shareholders relating to Fund distributions or the redemption of Fund shares. |
| (c) | The Fund’s portfolio turnover rate is calculated in accordance with regulatory requirements, without regard to transactions involving short term investments. If such transactions were included, the Fund’s portfolio turnover rate may be higher. |
| The accompanying notes are an integral part of these financial statements. | 29 |
GOLDMAN SACHS INTERNATIONAL EQUITY INCOME FUND
Financial Highlights(continued)
Selected Data for a Share Outstanding Throughout Each Year
| Goldman Sachs International Equity Income Fund | ||||||||||||||||||||||
| Class C Shares | ||||||||||||||||||||||
| Year Ended October 31, | ||||||||||||||||||||||
| 2019 | 2018 | 2017 | 2016 | 2015 | ||||||||||||||||||
| Per Share Data |
| |||||||||||||||||||||
Net asset value, beginning of year | $ | 11.88 | $ | 12.98 | $ | 10.75 | $ | 11.62 | $ | 12.17 | ||||||||||||
Net investment income(a) | 0.25 | 0.25 | 0.07 | 0.08 | 0.04 | |||||||||||||||||
Net realized and unrealized gain (loss) | 1.34 | (1.22 | ) | 2.31 | (0.94 | ) | (0.20 | ) | ||||||||||||||
Total from investment operations | 1.59 | (0.97 | ) | 2.38 | (0.86 | ) | (0.16 | ) | ||||||||||||||
Distributions to shareholders from net investment income | (0.29 | ) | (0.13 | ) | (0.15 | ) | (0.01 | ) | (0.39 | ) | ||||||||||||
Distributions to shareholders from net realized gains | (1.29 | ) | — | — | — | — | ||||||||||||||||
Total distributions | (1.58 | ) | (0.13 | ) | (0.15 | ) | (0.01 | ) | (0.39 | ) | ||||||||||||
Net asset value, end of year | $ | 11.89 | $ | 11.88 | $ | 12.98 | $ | 10.75 | $ | 11.62 | ||||||||||||
| Total return(b) | 16.01 | % | (7.59 | )% | 22.44 | % | (7.37 | )% | (1.33 | )% | ||||||||||||
Net assets, end of year (in 000s) | $ | 1,638 | $ | 1,673 | $ | 3,770 | $ | 3,974 | $ | 4,841 | ||||||||||||
Ratio of net expenses to average net assets | 2.00 | % | 2.01 | % | 2.05 | % | 2.05 | % | 2.05 | % | ||||||||||||
Ratio of total expenses to average net assets | 2.91 | % | 2.63 | % | 2.63 | % | 2.51 | % | 2.57 | % | ||||||||||||
Ratio of net investment income to average net assets | 2.24 | % | 1.89 | % | 0.58 | % | 0.74 | % | 0.35 | % | ||||||||||||
Portfolio turnover rate(c) | 27 | % | 87 | % | 32 | % | 68 | % | 83 | % | ||||||||||||
| (a) | Calculated based on the average shares outstanding methodology. |
| (b) | Assumes investment at the net asset value at the beginning of the year, reinvestment of all distributions, a complete redemption of the investment at the net asset value at the end of the year and no sales or redemption charges (if any). Total returns would be reduced if a sales or redemption charge was taken into account. Returns do not reflect the impact of taxes to shareholders relating to Fund distributions or the redemption of Fund shares. |
| (c) | The Fund’s portfolio turnover rate is calculated in accordance with regulatory requirements, without regard to transactions involving short term investments. If such transactions were included, the Fund’s portfolio turnover rate may be higher. |
| 30 | The accompanying notes are an integral part of these financial statements. |
GOLDMAN SACHS INTERNATIONAL EQUITY INCOME FUND
Financial Highlights(continued)
Selected Data for a Share Outstanding Throughout Each Year
| Goldman Sachs International Equity Income Fund | ||||||||||||||||||||||
| Institutional Shares | ||||||||||||||||||||||
| Year Ended October 31, | ||||||||||||||||||||||
| 2019 | 2018 | 2017 | 2016 | 2015 | ||||||||||||||||||
| Per Share Data |
| |||||||||||||||||||||
Net asset value, beginning of year | $ | 13.88 | $ | 15.20 | $ | 12.56 | $ | 13.56 | $ | 14.13 | ||||||||||||
Net investment income(a) | 0.42 | 0.49 | 0.23 | 0.23 | 0.20 | |||||||||||||||||
Net realized and unrealized gain (loss) | 1.63 | (1.46 | ) | 2.70 | (1.08 | ) | (0.23 | ) | ||||||||||||||
Total from investment operations | 2.05 | (0.97 | ) | 2.93 | (0.85 | ) | (0.03 | ) | ||||||||||||||
Distributions to shareholders from net investment income | (0.38 | ) | (0.35 | ) | (0.29 | ) | (0.15 | ) | (0.54 | ) | ||||||||||||
Distributions to shareholders from net realized gains | (1.29 | ) | — | — | — | — | ||||||||||||||||
Total distributions | (1.67 | ) | (0.35 | ) | (0.29 | ) | (0.15 | ) | (0.54 | ) | ||||||||||||
Net asset value, end of year | $ | 14.26 | $ | 13.88 | $ | 15.20 | $ | 12.56 | $ | 13.56 | ||||||||||||
| Total return(b) | 17.29 | % | (6.59 | )% | 23.88 | % | (6.31 | )% | (0.15 | )% | ||||||||||||
Net assets, end of year (in 000s) | $ | 5,232 | $ | 2,666 | $ | 40,667 | $ | 42,191 | $ | 45,795 | ||||||||||||
Ratio of net expenses to average net assets | 0.88 | % | 0.87 | % | 0.90 | % | 0.90 | % | 0.90 | % | ||||||||||||
Ratio of total expenses to average net assets | 1.79 | % | 1.42 | % | 1.49 | % | 1.36 | % | 1.42 | % | ||||||||||||
Ratio of net investment income to average net assets | 3.13 | % | 3.19 | % | 1.71 | % | 1.84 | % | 1.47 | % | ||||||||||||
Portfolio turnover rate(c) | 27 | % | 87 | % | 32 | % | 68 | % | 83 | % | ||||||||||||
| (a) | Calculated based on the average shares outstanding methodology. |
| (b) | Assumes investment at the net asset value at the beginning of the year, reinvestment of all distributions, a complete redemption of the investment at the net asset value at the end of the year and no sales or redemption charges (if any). Total returns would be reduced if a sales or redemption charge was taken into account. Returns do not reflect the impact of taxes to shareholders relating to Fund distributions or the redemption of Fund shares. |
| (c) | The Fund’s portfolio turnover rate is calculated in accordance with regulatory requirements, without regard to transactions involving short term investments. If such transactions were included, the Fund’s portfolio turnover rate may be higher. |
| The accompanying notes are an integral part of these financial statements. | 31 |
GOLDMAN SACHS INTERNATIONAL EQUITY INCOME FUND
Financial Highlights(continued)
Selected Data for a Share Outstanding Throughout Each Year
| Goldman Sachs International Equity Income Fund | ||||||||||||||||||||||
| Investor Shares(a) | ||||||||||||||||||||||
| Year Ended October 31, | ||||||||||||||||||||||
| 2019 | 2018 | 2017 | 2016 | 2015 | ||||||||||||||||||
| Per Share Data |
| |||||||||||||||||||||
Net asset value, beginning of year | $ | 13.25 | $ | 14.51 | $ | 12.00 | $ | 12.97 | $ | 13.55 | ||||||||||||
Net investment income(b) | 0.34 | 0.40 | 0.24 | 0.21 | 0.15 | |||||||||||||||||
Net realized and unrealized gain (loss) | 1.59 | (1.35 | ) | 2.54 | (1.04 | ) | (0.20 | ) | ||||||||||||||
Total from investment operations | 1.93 | (0.95 | ) | 2.78 | (0.83 | ) | (0.05 | ) | ||||||||||||||
Distributions to shareholders from net investment income | (0.38 | ) | (0.31 | ) | (0.27 | ) | (0.14 | ) | (0.53 | ) | ||||||||||||
Distributions to shareholders from net realized gains | (1.29 | ) | — | — | — | — | ||||||||||||||||
Total distributions | (1.67 | ) | (0.31 | ) | (0.27 | ) | (0.14 | ) | (0.53 | ) | ||||||||||||
Net asset value, end of year | $ | 13.51 | $ | 13.25 | $ | 14.51 | $ | 12.00 | $ | 12.97 | ||||||||||||
| Total return(c) | 17.21 | % | (6.74 | )% | 23.75 | % | (6.43 | )% | (0.32 | )% | ||||||||||||
Net assets, end of year (in 000s) | $ | 3,515 | $ | 349 | $ | 426 | $ | 471 | $ | 355 | ||||||||||||
Ratio of net expenses to average net assets | 1.09 | % | 1.01 | % | 1.05 | % | 1.05 | % | 1.05 | % | ||||||||||||
Ratio of total expenses to average net assets | 1.98 | % | 1.65 | % | 1.64 | % | 1.51 | % | 1.56 | % | ||||||||||||
Ratio of net investment income to average net assets | 2.67 | % | 2.78 | % | 1.85 | % | 1.71 | % | 1.17 | % | ||||||||||||
Portfolio turnover rate(d) | 27 | % | 87 | % | 32 | % | 68 | % | 83 | % | ||||||||||||
| (a) | Effective August 15, 2017, Class IR changed its name to Investor Shares. |
| (b) | Calculated based on the average shares outstanding methodology. |
| (c) | Assumes investment at the net asset value at the beginning of the year, reinvestment of all distributions, a complete redemption of the investment at the net asset value at the end of the year and no sales or redemption charges (if any). Total returns would be reduced if a sales or redemption charge was taken into account. Returns do not reflect the impact of taxes to shareholders relating to Fund distributions or the redemption of Fund shares. |
| (d) | The Fund’s portfolio turnover rate is calculated in accordance with regulatory requirements, without regard to transactions involving short term investments. If such transactions were included, the Fund’s portfolio turnover rate may be higher. |
| 32 | The accompanying notes are an integral part of these financial statements. |
GOLDMAN SACHS INTERNATIONAL EQUITY INCOME FUND
Financial Highlights(continued)
Selected Data for a Share Outstanding Throughout Each Period
| Goldman Sachs International Equity Income Fund | ||||||||||
| Class P Shares | ||||||||||
| Year Ended October 31, 2019 | April 16, 2018* to October 31, 2018 | |||||||||
| Per Share Data |
| |||||||||
Net asset value, beginning of period | $ | 13.86 | $ | 15.62 | ||||||
Net investment income(a) | 0.44 | 0.16 | ||||||||
Net realized and unrealized gain (loss) | 1.61 | (1.84 | ) | |||||||
Total from investment operations | 2.05 | (1.68 | ) | |||||||
Distributions to shareholders from net investment income | (0.39 | ) | (0.08 | ) | ||||||
Distributions to shareholders from net realized gains | (1.29 | ) | — | |||||||
Total distributions | (1.68 | ) | (0.08 | ) | ||||||
Net asset value, end of period | $ | 14.23 | $ | 13.86 | ||||||
| Total return(b) | 17.34 | % | (10.76 | )% | ||||||
Net assets, end of period (in 000s) | $ | 32,643 | $ | 30,930 | ||||||
Ratio of net expenses to average net assets | 0.85 | % | 0.84 | %(c) | ||||||
Ratio of total expenses to average net assets | 1.76 | % | 1.84 | %(c) | ||||||
Ratio of net investment income to average net assets | 3.37 | % | 2.00 | %(c) | ||||||
Portfolio turnover rate(d) | 27 | % | 87 | % | ||||||
| * | Commencement of operations. |
| (a) | Calculated based on the average shares outstanding methodology. |
| (b) | Assumes investment at the net asset value at the beginning of the period, reinvestment of all distributions, a complete redemption of the investment at the net asset value at the end of the period and no sales or redemption charges (if any). Total returns would be reduced if a sales or redemption charge was taken into account. Returns do not reflect the impact of taxes to shareholders relating to Fund distributions or the redemption of Fund shares. Total returns for periods less than one full year are not annualized. |
| (c) | Annualized. |
| (d) | The Fund’s portfolio turnover rate is calculated in accordance with regulatory requirements, without regard to transactions involving short term investments. If such transactions were included, the Fund’s portfolio turnover rate may be higher. |
| The accompanying notes are an integral part of these financial statements. | 33 |
GOLDMAN SACHS INTERNATIONAL EQUITY INCOME FUND
Financial Highlights(continued)
Selected Data for a Share Outstanding Throughout Each Year
| Goldman Sachs International Equity Income Fund | ||||||||||||||||||||||
| Class R Shares | ||||||||||||||||||||||
| Year Ended October 31, | ||||||||||||||||||||||
| 2019 | 2018 | 2017 | 2016 | 2015 | ||||||||||||||||||
| Per Share Data |
| |||||||||||||||||||||
Net asset value, beginning of year | $ | 13.32 | $ | 14.59 | $ | 12.08 | $ | 13.00 | $ | 13.57 | ||||||||||||
Net investment income(a) | 0.36 | 0.34 | 0.14 | 0.12 | 0.11 | |||||||||||||||||
Net realized and unrealized gain (loss) | 1.52 | (1.37 | ) | 2.59 | (1.01 | ) | (0.23 | ) | ||||||||||||||
Total from investment operations | 1.88 | (1.03 | ) | 2.73 | (0.89 | ) | (0.12 | ) | ||||||||||||||
Distributions to shareholders from net investment income | (0.36 | ) | (0.24 | ) | (0.22 | ) | (0.03 | ) | (0.45 | ) | ||||||||||||
Distributions to shareholders from net realized gains | (1.29 | ) | — | — | — | — | ||||||||||||||||
Total distributions | (1.65 | ) | (0.24 | ) | (0.22 | ) | (0.03 | ) | (0.45 | ) | ||||||||||||
Net asset value, end of year | $ | 13.55 | $ | 13.32 | $ | 14.59 | $ | 12.08 | $ | 13.00 | ||||||||||||
| Total return(b) | 16.63 | % | (7.19 | )% | 22.99 | % | (6.87 | )% | (0.84 | )% | ||||||||||||
Net assets, end of year (in 000s) | $ | 73 | $ | 84 | $ | 44 | $ | 28 | $ | 17 | ||||||||||||
Ratio of net expenses to average net assets | 1.50 | % | 1.51 | % | 1.55 | % | 1.55 | % | 1.55 | % | ||||||||||||
Ratio of total expenses to average net assets | 2.40 | % | 2.18 | % | 2.12 | % | 2.01 | % | 2.07 | % | ||||||||||||
Ratio of net investment income to average net assets | 2.90 | % | 2.38 | % | 1.05 | % | 0.99 | % | 0.86 | % | ||||||||||||
Portfolio turnover rate(c) | 27 | % | 87 | % | 32 | % | 68 | % | 83 | % | ||||||||||||
| (a) | Calculated based on the average shares outstanding methodology. |
| (b) | Assumes investment at the net asset value at the beginning of the year, reinvestment of all distributions, a complete redemption of the investment at the net asset value at the end of the year and no sales or redemption charges (if any). Total returns would be reduced if a sales or redemption charge was taken into account. Returns do not reflect the impact of taxes to shareholders relating to Fund distributions or the redemption of Fund shares. |
| (c) | The Fund’s portfolio turnover rate is calculated in accordance with regulatory requirements, without regard to transactions involving short term investments. If such transactions were included, the Fund’s portfolio turnover rate may be higher. |
| 34 | The accompanying notes are an integral part of these financial statements. |
GOLDMAN SACHS INTERNATIONAL EQUITY INCOME FUND
Financial Highlights(continued)
Selected Data for a Share Outstanding Throughout Each Period
| Goldman Sachs International Equity Income Fund | ||||||||||||||||||
| Class R6 Shares | ||||||||||||||||||
| Year Ended October 31, | February 26, 2016* to October 31, 2016 | |||||||||||||||||
| 2019 | 2018 | 2017 | ||||||||||||||||
| Per Share Data |
| |||||||||||||||||
Net asset value, beginning of period | $ | 13.87 | $ | 15.20 | $ | 12.56 | $ | 11.85 | ||||||||||
Net investment income(a) | 0.49 | 0.45 | 0.16 | 0.20 | ||||||||||||||
Net realized and unrealized gain (loss) | 1.57 | (1.43 | ) | 2.77 | 0.51 | |||||||||||||
Total from investment operations | 2.06 | (0.98 | ) | 2.93 | 0.71 | |||||||||||||
Distributions to shareholders from net investment income | (0.39 | ) | (0.35 | ) | (0.29 | ) | — | |||||||||||
Distributions to shareholders from net realized gains | (1.29 | ) | — | — | — | |||||||||||||
Total distributions | (1.68 | ) | (0.35 | ) | (0.29 | ) | — | |||||||||||
Net asset value, end of period | $ | 14.25 | $ | 13.87 | $ | 15.20 | $ | 12.56 | ||||||||||
| Total return(b) | 17.41 | % | (6.62 | )% | 23.91 | % | 5.99 | % | ||||||||||
Net assets, end of period (in 000s) | $ | 332 | $ | 68 | $ | 72 | $ | 11 | ||||||||||
Ratio of net expenses to average net assets | 0.86 | % | 0.86 | % | 0.89 | % | 0.89 | %(c) | ||||||||||
Ratio of total expenses to average net assets | 1.80 | % | 1.51 | % | 1.43 | % | 1.35 | %(c) | ||||||||||
Ratio of net investment income to average net assets | 3.74 | % | 2.99 | % | 1.16 | % | 2.33 | %(c) | ||||||||||
Portfolio turnover rate(d) | 27 | % | 87 | % | 32 | % | 68 | % | ||||||||||
| * | Commencement of operations. |
| (a) | Calculated based on the average shares outstanding methodology. |
| (b) | Assumes investment at the net asset value at the beginning of the period, reinvestment of all distributions, a complete redemption of the investment at the net asset value at the end of the period and no sales or redemption charges (if any). Total returns would be reduced if a sales or redemption charge was taken into account. Returns do not reflect the impact of taxes to shareholders relating to Fund distributions or the redemption of Fund shares. Total returns for periods less than one full year are not annualized. |
| (c) | Annualized. |
| (d) | The Fund’s portfolio turnover rate is calculated in accordance with regulatory requirements, without regard to transactions involving short term investments. If such transactions were included, the Fund’s portfolio turnover rate may be higher. |
| The accompanying notes are an integral part of these financial statements. | 35 |
GOLDMAN SACHS FUNDAMENTAL INTERNATIONAL EQUITY FUNDS
October 31, 2019
| 1. ORGANIZATION |
Goldman Sachs Trust (the “Trust”) is a Delaware statutory trust registered under the Investment Company Act of 1940, as amended (the “Act”), as anopen-end management investment company. The following table lists those series of the Trust that are included in this report (collectively, the “Funds” or individually a “Fund”), along with their corresponding share classes and respective diversification status under the Act:
| Fund | Share Classes Offered | Diversified/ Non-diversified | ||
International Equity ESG | A, C, Institutional, Service, Investor, P and R6 | Diversified | ||
International Equity Income | A, C, Institutional, Investor, P, R and R6 | Diversified |
Class A Shares are sold with afront-end sales charge of up to 5.50%. Class C Shares are sold with a contingent deferred sales charge (“CDSC”) of 1.00%, which is imposed on redemptions made within 12 months of purchase. Institutional, Service, Investor, Class P, Class R and Class R6 Shares are not subject to a sales charge.
Goldman Sachs Asset Management, L.P. (“GSAM”), an affiliate of Goldman Sachs & Co. LLC (“Goldman Sachs”), serves as investment adviser to the Funds pursuant to a management agreement (the “Agreement”) with the Trust.
| 2. SIGNIFICANT ACCOUNTING POLICIES |
The financial statements have been prepared in accordance with accounting principles generally accepted in the United States of America (“GAAP”) and require management to make estimates and assumptions that may affect the reported amounts and disclosures. Actual results may differ from those estimates and assumptions. Each Fund is an investment company under GAAP and follows the accounting and reporting guidance applicable to investment companies.
A. Investment Valuation — The Funds’ valuation policy is to value investments at fair value.
B. Investment Income and Investments — Investment income includes interest income, dividend income, and securities lending income, if any. Interest income is accrued daily and adjusted for amortization of premiums and accretion of discounts. Dividend income is recognized onex-dividend date or, for certain foreign securities, as soon as such information is obtained subsequent to theex-dividend date. Non-cash dividends, if any, are recorded at the fair market value of the securities received. Investment transactions are reflected on trade date. Realized gains and losses are calculated using identified cost. Investment transactions are recorded on the following business day for daily net asset value (“NAV”) calculations. Investment income is recorded net of any foreign withholding taxes, less any amounts reclaimable. The Funds may file withholding tax reclaims in certain jurisdictions to recover a portion of amounts previously withheld. Any foreign capital gains tax is accrued daily based upon net unrealized gains, and is payable upon sale of such investments.
C. Class Allocations and Expenses — Investment income, realized and unrealized gain (loss), if any, andnon-class specific expenses of each Fund are allocated daily based upon the proportion of net assets of each class.Non-class specific expenses directly incurred by a Fund are charged to that Fund, while such expenses incurred by the Trust are allocated across the applicable Funds on astraight-line and/orpro-rata basis depending upon the nature of the expenses. Class specific expenses, where applicable, are borne by the respective share classes and include Distribution and Service, Transfer Agency and Service and Shareholder Administration fees.
D. Federal Taxes and Distributions to Shareholders — It is each Fund’s policy to comply with the requirements of the Internal Revenue Code of 1986, as amended (the “Code”), applicable to regulated investment companies and to distribute each year substantially all of its investment company taxable income and capital gains to its shareholders. Accordingly, each Fund is not
36
GOLDMAN SACHS FUNDAMENTAL INTERNATIONAL EQUITY FUNDS
| 2. SIGNIFICANT ACCOUNTING POLICIES (continued) |
required to make any provisions for the payment of federal income tax. Distributions to shareholders are recorded on theex-dividend date. Income and capital gains distributions, if any, are declared and paid according to the following schedule:
| Portfolio | Income Distributions Declared/Paid | Capital Gains Distributions Declared/Paid | ||||
International Equity ESG | Annually | Annually | ||||
International Equity Income | Semi-Annually | Annually |
Net capital losses, if any, are carried forward to future fiscal years and may be used to the extent allowed by the Code to offset any future capital gains. Losses that are carried forward will retain their character as either short-term or long-term capital losses. Utilization of capital loss carryforwards will reduce the requirement of future capital gains distributions.
The characterization of distributions to shareholders for financial reporting purposes is determined in accordance with federal income tax rules, which may differ from GAAP. The source of each Fund’s distributions may be shown in the accompanying financial statements as either from distributable earnings or capital. Certain components of the Funds’ net assets on the Statements of Assets and Liabilities reflect permanent GAAP/tax differences based on the appropriate tax character.
E. Foreign Currency Translation — The accounting records and reporting currency of a Fund are maintained in U.S. dollars. Assets and liabilities denominated in foreign currencies are translated into U.S. dollars using the current exchange rates at the close of each business day. The effect of changes in foreign currency exchange rates on investments is included within net realized and unrealized gain (loss) on investments. Changes in the value of other assets and liabilities as a result of fluctuations in foreign exchange rates are included in the Statements of Operations within net change in unrealized gain (loss) on foreign currency translation. Transactions denominated in foreign currencies are translated into U.S. dollars on the date the transaction occurred, the effects of which are included within net realized gain (loss) on foreign currency transactions.
| 3. INVESTMENTS AND FAIR VALUE MEASUREMENTS |
U.S. GAAP defines the fair value of a financial instrument as the amount that would be received to sell an asset or paid to transfer a liability in an orderly transaction between market participants at the measurement date (i.e., the exit price); the Funds’ policy is to use the market approach. GAAP establishes a fair value hierarchy that prioritizes the inputs to valuation techniques used to measure fair value. The hierarchy gives the highest priority to unadjusted quoted prices in active markets for identical assets or liabilities (Level 1 measurements) and the lowest priority to unobservable inputs (Level 3 measurements). The levels used for classifying investments are not necessarily an indication of the risk associated with investing in these investments. The three levels of the fair value hierarchy are described below:
Level 1 — Unadjusted quoted prices in active markets that are accessible at the measurement date for identical, unrestricted assets or liabilities;
Level 2 — Quoted prices in markets that are not active or financial instruments for which significant inputs are observable (including, but not limited to, quoted prices for similar investments, interest rates, foreign exchange rates, volatility and credit spreads), either directly or indirectly;
Level 3 — Prices or valuations that require significant unobservable inputs (including GSAM’s assumptions in determining fair value measurement).
The Board of Trustees (“Trustees”) has approved Valuation Procedures that govern the valuation of the portfolio investments held by the Funds, including investments for which market quotations are not readily available. The Trustees have delegated to GSAMday-to-day responsibility for implementing and maintaining internal controls and procedures related to the valuation of the Funds’ investments. To assess the continuing appropriateness of pricing sources and methodologies, GSAM regularly performs price verification procedures and issues challenges as necessary to third party pricing vendors or brokers, and any differences are reviewed in accordance with the Valuation Procedures.
37
GOLDMAN SACHS FUNDAMENTAL INTERNATIONAL EQUITY FUNDS
Notes to Financial Statements(continued)
October 31, 2019
| 3. INVESTMENTS AND FAIR VALUE MEASUREMENTS (continued) |
A. Level 1 and Level 2 Fair Value Investments — The valuation techniques and significant inputs used in determining the fair values for investments classified as Level 1 and Level 2 are as follows:
Equity Securities — Equity securities traded on a United States (“U.S.”) securities exchange or the NASDAQ system, or those located on certain foreign exchanges, including but not limited to the Americas, are valued daily at their last sale price or official closing price on the principal exchange or system on which they are traded. If there is no sale or official closing price or such price is believed by GSAM to not represent fair value, equity securities may be valued at the closing bid price for long positions and at the closing ask price for short positions. To the extent these investments are actively traded, they are classified as Level 1 of the fair value hierarchy, otherwise they are generally classified as Level 2.
Unlisted equity securities for which market quotations are available are valued at the last sale price on the valuation date, or if no sale occurs, at the last bid price for long positions or the last ask price for short positions, and are generally classified as Level 2. Securities traded on certain foreign securities exchanges are valued daily at fair value determined by an independent fair value service (if available) under Valuation Procedures approved by the Trustees and consistent with applicable regulatory guidance. The independent fair value service takes into account multiple factors including, but not limited to, movements in the securities markets, certain depositary receipts, futures contracts and foreign currency exchange rates that have occurred subsequent to the close of the foreign securities exchange. These investments are generally classified as Level 2 of the fair value hierarchy.
Underlying Funds (including Money Market Funds) — Underlying funds (“Underlying Funds”) include other investment companies and exchange-traded funds (“ETFs”). Investments in the Underlying Funds (except ETFs) are valued at the NAV per share on the day of valuation. ETFs are valued daily at the last sale price or official closing price on the principal exchange or system on which the investment is traded. Because the Funds invest in Underlying Funds that fluctuate in value, the Funds’ shares will correspondingly fluctuate in value. To the extent these investments are actively traded, they are classified as Level 1 of the fair value hierarchy, otherwise they are generally classified as Level 2. For information regarding an Underlying Fund’s accounting policies and investment holdings, please see the Underlying Fund’s shareholder report.
B. Level 3 Fair Value Investments — To the extent that significant inputs to valuation models and other alternative pricing sources are unobservable, or if quotations are not readily available, or if GSAM believes that such quotations do not accurately reflect fair value, the fair value of a Fund’s investments may be determined under Valuation Procedures approved by the Trustees. GSAM, consistent with its procedures and applicable regulatory guidance, may make an adjustment to the most recent valuation prices of either domestic or foreign securities in light of significant events to reflect what it believes to be the fair value of the securities at the time of determining a Fund’s NAV. To the extent investments are valued using single source broker quotations obtained directly from the broker or passed through from third party pricing vendors, such investments are classified as Level 3 investments.
C. Fair Value Hierarchy — The following is a summary of the Funds’ investments classified in the fair value hierarchy as of October 31, 2019:
| INTERNATIONAL EQUITY ESG |
| |||||||||||
| Investment Type | Level 1 | Level 2 | Level 3 | |||||||||
| Assets | ||||||||||||
Common Stock and/or Other Equity Investments(a) | ||||||||||||
Asia | $ | 5,483,054 | $ | 29,234,849 | $ | — | ||||||
Australia and Oceania | — | 2,358,730 | — | |||||||||
Europe | — | 80,959,804 | — | |||||||||
North America | — | 2,698,771 | — | |||||||||
Investment Company | 992,989 | — | — | |||||||||
| Total | $ | 6,476,043 | $ | 115,252,154 | $ | — | ||||||
| (a) | Amounts are disclosed by continent to highlight the impact of time zone differences between local market close and the calculation of NAV. Security valuations are based on the principal exchange or system on which they are traded, which may differ from country of domicile. The Funds utilize fair value model prices provided by an independent fair value service for certain international equity securities, resulting in a Level 2 classification. |
38
GOLDMAN SACHS FUNDAMENTAL INTERNATIONAL EQUITY FUNDS
| 3. INVESTMENTS AND FAIR VALUE MEASUREMENTS (continued) |
| INTERNATIONAL EQUITY INCOME |
| |||||||||||
| Investment Type | Level 1 | Level 2 | Level 3 | |||||||||
| Assets | ||||||||||||
Common Stock and/or Other Equity Investments(a) | ||||||||||||
Asia | $ | — | $ | 8,837,153 | $ | — | ||||||
Australia and Oceania | — | 3,441,607 | — | |||||||||
Europe | — | 44,049,350 | — | |||||||||
North America | — | 1,360,315 | — | |||||||||
Investment Company | 1,609,740 | — | — | |||||||||
| Total | $ | 1,609,740 | $ | 57,688,425 | $ | — | ||||||
| (a) | Amounts are disclosed by continent to highlight the impact of time zone differences between local market close and the calculation of NAV. Security valuations are based on the principal exchange or system on which they are traded, which may differ from country of domicile. The Funds utilize fair value model prices provided by an independent fair value service for certain international equity securities, resulting in a Level 2 classification. |
For further information regarding security characteristics, see the Schedules of Investments.
| 4. AGREEMENTS AND AFFILIATED TRANSACTIONS |
A. Management Agreement — Under the Agreement, GSAM manages the Funds, subject to the general supervision of the Trustees.
As compensation for the services rendered pursuant to the Agreement, the assumption of the expenses related thereto and administration of the Funds’ business affairs, including providing facilities, GSAM is entitled to a management fee, accrued daily and paid monthly, equal to an annual percentage rate of each Fund’s average daily net assets.
For the fiscal year ended October 31, 2019, contractual and effective net management fees with GSAM were at the following rates:
| Contractual Management Rate | Effective Net | |||||||||||||||||||||||||||
| Fund | First $1 billion | Next $1 billion | Next $3 billion | Next $3 billion | Over $8 billion | Effective Rate | ||||||||||||||||||||||
International Equity ESG | 0.85 | % | 0.77 | % | 0.73 | % | 0.71 | % | 0.70 | % | 0.85 | % | 0.85 | % | ||||||||||||||
International Equity Income | 0.80 | 0.72 | 0.68 | 0.67 | 0.66 | 0.80 | 0.80 | |||||||||||||||||||||
| ^ | Effective Net Management Rate includes the impact of management fee waivers of affiliated underlying funds, if any. |
The International Equity ESG and International Equity Income Funds invest in Institutional Shares of the Goldman Sachs Financial Square Government Fund, which is an affiliated Underlying Fund. GSAM has agreed to waive a portion of its management fee payable by the Funds in an amount equal to the management fee it earns as an investment adviser to the affiliated Underlying Fund in which the Funds invest, except those management fees it earns from the Funds’ investments of cash collateral received in connection with securities lending transactions in the Goldman Sachs Financial Square Government Fund. For the fiscal year ended October 31, 2019, GSAM waived $3,847 and $951 of the International Equity ESG and International Equity Income Funds’ management fees, respectively.
B. Distribution and/or Service(12b-1) Plans— The Trust, on behalf of Class A and Class R Shares of each applicable Fund, has adopted Distribution and Service Plans subject to Rule12b-1 under the Act. Under the Distribution and Service Plans, Goldman Sachs, which serves as distributor (the “Distributor”), is entitled to a fee accrued daily and paid monthly for distribution services and personal and account maintenance services, which may then be paid by Goldman Sachs to authorized dealers. These
39
GOLDMAN SACHS FUNDAMENTAL INTERNATIONAL EQUITY FUNDS
Notes to Financial Statements(continued)
October 31, 2019
| 4. AGREEMENTS AND AFFILIATED TRANSACTIONS (continued) |
fees are equal to an annual percentage rate of the average daily net assets attributable to Class A or Class R Shares of the Funds, as applicable, as set forth below.
The Trust, on behalf of Class C Shares of each applicable Fund, has adopted a Distribution Plan subject to Rule12b-1 under the Act. Under the Distribution Plan, Goldman Sachs as Distributor is entitled to a fee accrued daily and paid monthly for distribution services, which may then be paid by Goldman Sachs to authorized dealers. These fees are equal to an annual percentage rate of the average daily net assets attributable to Class C Shares of the Funds, as set forth below.
The Trust, on behalf of Service Shares of each applicable Fund, has adopted a Service Plan subject to Rule12b-1 under the Act to allow Service Shares to compensate service organizations (including Goldman Sachs) for providing personal and account maintenance services to their customers who are beneficial owners of such shares. The Service Plan provides for compensation to the service organizations equal to an annual percentage rate of the average daily net assets attributable to Service Shares of the Funds, as set forth below.
| Distribution and/or Service Plan Rates | ||||||||||||||||
| Class A* | Class C | Class R* | Service | |||||||||||||
Distribution and/or Service Plan | 0.25 | % | 0.75 | % | 0.50 | % | 0.25 | % | ||||||||
| * | With respect to Class A and Class R Shares, the Distributor at its discretion may use compensation for distribution services paid under the Distribution and Service Plans to compensate service organizations for personal and account maintenance services and expenses as long as such total compensation does not exceed the maximum cap on “service fees” imposed by the Financial Industry Regulatory Authority. |
C. Distribution Agreement — Goldman Sachs, as Distributor of the shares of the Funds pursuant to a Distribution Agreement, may retain a portion of the Class A Shares’ front end sales charge and Class C Shares’ CDSC. During the fiscal year ended October 31, 2019, Goldman Sachs retained the following amounts:
| Front End Sales Charge | Contingent Deferred Sales Charge | |||||||||
| Fund | Class A | Class C | ||||||||
International Equity ESG | $ | 975 | $ | 261 | ||||||
International Equity Income | 826 | 52 | ||||||||
D. Service and Shareholder Administration Plans— The Trust, on behalf of each applicable Fund, has adopted Service Plans to allow Class C Shares and Shareholder Administration Plans to allow Service Shares, respectively, to compensate service organizations (including Goldman Sachs) for providing varying levels of personal and account maintenance or shareholder administration services to their customers who are beneficial owners of such shares. The Service and Shareholder Administration Plans each provide for compensation to the service organizations equal to an annual percentage rate of 0.25% of the average daily net assets attributable to Class C and Service Shares of the Funds, respectively.
E. Transfer Agency Agreement — Goldman Sachs also serves as the transfer agent of the Funds for a fee pursuant to the Transfer Agency Agreement. The fees charged for such transfer agency services are accrued daily and paid monthly at annual rates as follows: 0.17% of the average daily net assets of Class A, Class C, Investor and Class R Shares; 0.03% of the average daily net assets of Class P and Class R6 Shares; and 0.04% of the average daily net assets of Institutional and Service Shares. Prior to July 1, 2019, the annual rates were as follows: 0.18% of the average daily net assets of Class A, Class C, Investor and Class R Shares. Effective February 28, 2019, Goldman Sachs has agreed to waive a portion of its transfer agency fee equal to 0.05% as an annual percentage rate of the average daily net assets attributable to Class A, Class C and Investor Shares of the International Equity ESG Fund through at least February 28, 2020, and prior to such date, Goldman Sachs may not terminate the arrangement without the approval of the Board of Trustees.
F. Other Expense Agreements and Affiliated Transactions — GSAM has agreed to reduce or limit certain “Other Expenses” of the Funds (excluding acquired fund fees and expenses, transfer agency fees and expenses, service fees and shareholder administration fees (as applicable), taxes, interest, brokerage fees, expenses of shareholder meetings, litigation and
40
GOLDMAN SACHS FUNDAMENTAL INTERNATIONAL EQUITY FUNDS
| 4. AGREEMENTS AND AFFILIATED TRANSACTIONS (continued) |
indemnification, and extraordinary expenses) to the extent such expenses exceed, on an annual basis, a percentage rate of the average daily net assets of each Fund. Such Other Expense reimbursements, if any, are accrued daily and paid monthly. In addition, the Funds are not obligated to reimburse GSAM for prior fiscal year expense reimbursements, if any. The Other Expense limitations as an annual percentage rate of average daily net assets for the Funds are 0.014%. These Other Expense limitations will remain in place through at least February 28, 2020, and prior to such date GSAM may not terminate the arrangements without the approval of the Trustees. In addition, the Funds have entered into certain offset arrangements with the custodian and the transfer agent, which may result in a reduction of the Funds’ expenses and are received irrespective of the application of the “Other Expense” limitations described above.
For the fiscal year ended October 31, 2019, these expense reductions, including any fee waivers and Other Expense reimbursements, were as follows:
| Fund | Management Fee Waiver | Custody Fee Credits | Transfer Agency Waiver/Credits | Other Expense | Total Expense | |||||||||||||||||
International Equity ESG | $ | 3,847 | $ | 4,191 | $ | 15,038 | $ | 523,622 | $ | 546,698 | ||||||||||||
International Equity Income | 951 | 1,084 | — | 467,074 | 469,109 | |||||||||||||||||
G. Line of Credit Facility — As of October 31, 2019, the Funds participated in a $580,000,000 committed, unsecured revolving line of credit facility (the “facility”) together with other funds of the Trust and certain registered investment companies having management agreements with GSAM or its affiliates. This facility is to be used for temporary emergency purposes, or to allow for an orderly liquidation of securities to meet redemption requests. The interest rate on borrowings is based on the federal funds rate. The facility also requires a fee to be paid by the Funds based on the amount of the commitment that has not been utilized. For the fiscal year ended October 31, 2019, the Funds did not have any borrowings under the facility. Prior to April 30, 2019 the facility was $770,000,000.
H. Other Transactions with Affiliates — For the fiscal year ended October 31, 2019, Goldman Sachs earned $363 in brokerage commissions from portfolio transactions, on behalf of the International Equity ESG Fund.
The following table provides information about the Funds’ investments in the Goldman Sachs Financial Square Government Fund as of and for the fiscal year ended October 31, 2019:
| Fund | Beginning Value as of October 31, 2018 | Purchases at Cost | Proceeds from Sales | Ending Value as of October 31, 2019 | Shares as of October 31, 2019 | Dividend Income from Affiliated Investment Company | ||||||||||||||||||
International Equity ESG | $ | 5,551,407 | $ | 33,293,140 | $ | (37,851,558 | ) | $ | 992,989 | 992,989 | $ | 52,502 | ||||||||||||
International Equity Income | 633,777 | 10,261,954 | (9,285,991 | ) | 1,609,740 | 1,609,740 | 12,090 | |||||||||||||||||
As of October 31, 2019, The Goldman Sachs Group, Inc. was the beneficial owner of approximately 32% of the Service Shares of the International Equity ESG Fund and approximately 15% of the Class R Shares of the International Equity Income Fund.
| 5. PORTFOLIO SECURITIES TRANSACTIONS |
The cost of purchases and proceeds from sales and maturities of long-term securities for the fiscal year ended October 31, 2019, were as follows:
| Fund | Purchases | Sales and Maturities | ||||||||
International Equity ESG | $ | 53,515,031 | $ | 89,264,172 | ||||||
International Equity Income | 14,726,837 | 13,582,745 | ||||||||
41
GOLDMAN SACHS FUNDAMENTAL INTERNATIONAL EQUITY FUNDS
Notes to Financial Statements(continued)
October 31, 2019
| 6. SECURITIES LENDING |
Pursuant to exemptive relief granted by the Securities and Exchange Commission (“SEC”) and the terms and conditions contained therein, the Funds may lend their securities through a securities lending agent, Goldman Sachs Agency Lending (“GSAL”), a wholly-owned subsidiary of Goldman Sachs, to certain qualified borrowers including Goldman Sachs and affiliates. In accordance with the Funds’ securities lending procedures, the Funds receive cash collateral at least equal to the market value of the securities on loan. The market value of the loaned securities is determined at the close of business of the Funds, at their last sale price or official closing price on the principal exchange or system on which they are traded, and any additional required collateral is delivered to the Funds on the next business day. As with other extensions of credit, the Funds may experience delay in the recovery of their securities or incur a loss should the borrower of the securities breach its agreement with the Funds or become insolvent at a time when the collateral is insufficient to cover the cost of repurchasing securities on loan. Dividend income received from securities on loan may not be subject to withholding taxes and therefore withholding taxes paid may differ from the amounts listed in the Statements of Operations. Loans of securities are terminable at any time and as such 1) the remaining contractual maturities of the outstanding securities lending transactions are considered to be overnight and continuous and 2) the borrower, after notice, is required to return borrowed securities within the standard time period for settlement of securities transactions.
The Funds invest the cash collateral received in connection with securities lending transactions in the Goldman Sachs Financial Square Government Fund (“Government Money Market Fund”), an affiliated series of the Goldman Sachs Trust. The Government Money Market Fund is registered under the Act as an open end investment company, is subject to Rule2a-7 under the Act, and is managed by GSAM, for which GSAM may receive a management fee of up to 0.16% on an annualized basis of the average daily net assets of the Government Money Market Fund.
In the event of a default by a borrower with respect to any loan, GSAL will exercise any and all remedies provided under the applicable borrower agreement to make the Funds whole. These remedies include purchasing replacement securities by applying the collateral held from the defaulting broker against the purchase cost of the replacement securities. If GSAL is unable to purchase replacement securities, GSAL will indemnify the Funds by paying the Funds an amount equal to the market value of the securities loaned minus the value of cash collateral received from the borrower for the loan, subject to an exclusion for any shortfalls resulting from a loss of value in such cash collateral due to reinvestment risk. The Funds’ master netting agreements with certain borrowers provide the right, in the event of a default (including bankruptcy or insolvency), for thenon-defaulting party to liquidate the collateral and calculate net exposure to the defaulting party or request additional collateral. However, in the event of a default by a borrower, a resolution authority could determine that such rights are not enforceable due to the restrictions or prohibitions against the right ofset-off that may be imposed in accordance with a particular jurisdiction’s bankruptcy or insolvency laws. The Funds’ loaned securities were all subject to enforceable Securities Lending Agreements and the value of the collateral was at least equal to the value of the cash received. The amounts of the Funds’ overnight and continuous agreements, which represent the gross amounts of recognized liabilities for securities lending transactions outstanding as of October 31, 2019 are disclosed as “Payable upon return of securities loaned” on the Statements of Assets and Liabilities, where applicable.
Each of the Funds and GSAL received compensation relating to the lending of the Funds’ securities. The amounts earned, if any, by the Funds for the fiscal year ended October 31, 2019, are reported under Investment Income on the Statements of Operations.
The table below details securities lending activity with affiliates of Goldman Sachs:
| For the fiscal year ended October 31, 2019 | ||||||||||
| Fund | Earnings of GSAL Relating to Securites Loaned | Amounts Received by the Funds from Lending to Goldman Sachs | ||||||||
International Equity ESG | $ | 6,065 | $ | 9,750 | ||||||
International Equity Income | 1,542 | 1,133 | ||||||||
42
GOLDMAN SACHS FUNDAMENTAL INTERNATIONAL EQUITY FUNDS
| 6. SECURITIES LENDING (continued) |
The following table provides information about the Funds’ investment in the Government Money Market Fund for the fiscal year ended October 31, 2019:
| Fund | Beginning Value as of October 31, 2018 | Purchases at Cost | Proceeds from Sales | Ending Value as of October 31, 2019 | ||||||||||||||
International Equity ESG | $ | 9,909,535 | $ | 43,221,741 | $ | (53,131,276 | ) | $ | — | |||||||||
International Equity Income | 61 | 9,689,445 | (9,689,506 | ) | — | |||||||||||||
| 7. TAX INFORMATION |
The tax character of distributions paid during the fiscal year ended October 31, 2019 was as follows:
| International Equity ESG | International Equity Income | |||||||
Distributions paid from: | ||||||||
Ordinary income | $ | 2,184,597 | $ | 2,158,291 | ||||
Net long-term capital gains | — | 4,229,300 | ||||||
Total | $ | 2,184,597 | $ | 6,387,591 | ||||
The tax character of distributions paid during the fiscal year ended October 31, 2018 was as follows:
| International Equity ESG Fund | International Equity Income | |||||||
Distributions paid from: | ||||||||
Ordinary income | $ | 2,661,329 | $ | 1,267,008 | ||||
As of October 31, 2019, the components of accumulated earnings (losses) on atax-basis were as follows:
| International Equity ESG | International Equity Income | |||||||
Undistributed ordinary income — net | $ | 2,236,749 | $ | 1,589,300 | ||||
Capital loss carryforwards(1): | ||||||||
Perpetual long-term | $ | (13,797,006 | ) | $ | (1,921,941 | ) | ||
Perpetual short-term | (129,400 | ) | (912,994 | ) | ||||
Total capital loss carryforwards | $ | (13,926,406 | ) | $ | (2,834,935 | ) | ||
Unrealized gains — net | 5,874,119 | 3,017,858 | ||||||
Total accumulated gains (losses) — net | $ | (5,815,538 | ) | $ | 1,772,223 | |||
| (1) | The International Equity ESG Fund had capital loss carryforwards of $9,250,431 which expired in the current fiscal year. |
43
GOLDMAN SACHS FUNDAMENTAL INTERNATIONAL EQUITY FUNDS
Notes to Financial Statements(continued)
October 31, 2019
| 7. TAX INFORMATION (continued) |
As of October 31, 2019, the Funds’ aggregate security unrealized gains and losses based on cost for U.S. federal income tax purposes were as follows:
| International Equity ESG | International Equity Income | |||||||
Tax cost | $ | 115,848,188 | $ | 56,275,648 | ||||
Gross unrealized gain | 14,920,587 | 5,968,241 | ||||||
Gross unrealized loss | (9,046,468 | ) | (2,950,383 | ) | ||||
Net unrealized gain | $ | 5,874,119 | $ | 3,017,858 | ||||
The difference between GAAP-basis andtax-basis unrealized gains (losses) is attributable primarily to wash sales and differences related to the tax treatment of passive foreign investment company investments.
The International Equity ESG Fund reclassified $9,250,431 from paid in capital to distributable earnings for the year ending October 31, 2019. In order to present certain components of the Fund’s capital accounts on a tax-basis, certain reclassifications have been recorded to the Fund’s accounts. These reclassifications have no impact on the net asset value of the Fund and result primarily from expired capital loss carryforwards.
GSAM has reviewed the Funds’ tax positions for all open tax years (the current and prior three years, as applicable) and has concluded that no provision for income tax is required in the Funds’ financial statements. Such open tax years remain subject to examination and adjustment by tax authorities.
| 8. OTHER RISKS |
The Funds’ risks include, but are not limited to, the following:
ESG Standards Risk — The International Equity ESG’s adherence to its environmental, social and governance (“ESG”) criteria and the application of GSAM’s supplemental ESG analysis when selecting investments may affect the Fund’s exposure to certain companies, sectors, regions, and countries and may affect the Fund’s performance depending on whether such investments are in or out of favor. For example, the Fund will not seek to invest in companies that GSAM believes have adverse social or environmental impacts (i.e., gambling, alcohol, tobacco, coal or weapons companies), and the Fund will not seek to invest in companies that GSAM believes show inadequate governance standards (e.g., certain state-owned enterprises).
Foreign and Emerging Countries Risk — Investing in foreign markets may involve special risks and considerations not typically associated with investing in the U.S. Foreign securities may be subject to risk of loss because of more or less foreign government regulation, less public information and less economic, political and social stability in the countries in which a Fund invests. The imposition of exchange controls (including repatriation restrictions), confiscation of assets and property, trade restrictions (including tariffs) and other government restrictions by the U.S. or other governments, or from problems in share registration, settlement or custody, may also result in losses. Foreign risk also involves the risk of negative foreign currency rate fluctuations, which may cause the value of securities denominated in such foreign currency (or other instruments through which a Fund has exposure to foreign currencies) to decline in value. Currency exchange rates may fluctuate significantly over short periods of time. To the extent that a Fund also invests in securities of issuers located in emerging markets, these risks may be more pronounced.
Foreign Custody Risk — If a Fund invests in foreign securities, the Fund may hold such securities and cash with foreign banks, agents, and securities depositories appointed by the Fund’s custodian (each a “Foreign Custodian”). Some foreign custodians may be recently organized or new to the foreign custody business. In some countries, Foreign Custodians may be subject to little or no regulatory oversight over, or independent evaluation of, their operations. Further, the laws of certain countries may place limitations on a Fund’s ability to recover its assets if a Foreign Custodian enters bankruptcy. Investments in emerging markets may
44
GOLDMAN SACHS FUNDAMENTAL INTERNATIONAL EQUITY FUNDS
| 8. OTHER RISKS (continued) |
be subject to even greater custody risks than investments in more developed markets. Custody services in emerging market countries are very often undeveloped and may be considerably less well regulated than in more developed countries, and thus may not afford the same level of investor protection as would apply in developed countries.
Geographic Risk — If a Fund focuses its investments in securities of issuers located in a particular country or geographic region, the Fund may be subjected, to a greater extent than if its investments were less focused, to the risks of volatile economic cycles and/or conditions and developments that may be particular to that country or region, such as: adverse securities markets; adverse exchange rates; adverse social, political, regulatory, economic, business, environmental or other developments; or natural disasters.
Investments in Other Investment Companies Risk — As a shareholder of another investment company, including an ETF, a Fund will indirectly bear its proportionate share of any net management fees and other expenses paid by such other investment companies, in addition to the fees and expenses regularly borne by the Fund. ETFs are subject to risks that do not apply to conventional mutual funds, including but not limited to the following: (i) the market price of the ETF’s shares may trade at a premium or a discount to their NAV; and (ii) an active trading market for an ETF’s shares may not develop or be maintained.
Issuer Concentration Risk — The Funds may invest in a relatively small number of issuers. As a result, they may be subject to greater risks than a fund that invests in a greater number of issuers. A change in the value of any single investment held by the Funds may affect the overall value of the Funds more than it would affect a mutual fund that holds more investments. In particular, the Funds may be more susceptible to adverse developments affecting any single issuer in the Funds and may be susceptible to greater losses because of these developments.
Large Shareholder Transactions Risk — A Fund may experience adverse effects when certain large shareholders, such as other funds, institutional investors (including those trading by use ofnon-discretionary mathematical formulas), financial intermediaries (who may make investment decisions on behalf of underlying clients and/or include a Fund in their investment model), individuals, accounts and Goldman Sachs affiliates, purchase or redeem large amounts of shares of a Fund. Such large shareholder redemptions, which may occur rapidly or unexpectedly, may cause a Fund to sell portfolio securities at times when it would not otherwise do so, which may negatively impact a Fund’s NAV and liquidity. These transactions may also accelerate the realization of taxable income to shareholders if such sales of investments resulted in gains, and may also increase transaction costs. In addition, a large redemption could result in a Fund’s current expenses being allocated over a smaller asset base, leading to an increase in the Fund’s expense ratio. Similarly, large Fund share purchases may adversely affect a Fund’s performance to the extent that the Fund is delayed in investing new cash or otherwise maintains a larger cash position than it ordinarily would.
Liquidity Risk — A Fund may make investments that are illiquid or that may become less liquid in response to market developments or adverse investor perceptions. Illiquid investments may be more difficult to value. Liquidity risk may also refer to the risk that a Fund will not be able to pay redemption proceeds within the allowable time period or without significant dilution to remaining investors’ interests because of unusual market conditions, an unusually high volume of redemption requests, or other reasons. To meet redemption requests, a Fund may be forced to sell investments at an unfavorable time and/or under unfavorable conditions. If a Fund is forced to sell securities at an unfavorable time and/or under unfavorable conditions, such sales may adversely affect the Fund’s NAV and dilute remaining investors’ interests. These risks may be more pronounced in connection with the Funds’ investments in securities of issuers located in emerging market countries. Redemptions by large shareholders may have a negative impact on a Fund’s liquidity.
Market and Credit Risks — In the normal course of business, a Fund trades financial instruments and enters into financial transactions where risk of potential loss exists due to changes in the market (market risk). Additionally, a Fund may also be exposed to credit risk in the event that an issuer or guarantor fails to perform or that an institution or entity with which the Fund has unsettled or open transactions defaults.
45
GOLDMAN SACHS FUNDAMENTAL INTERNATIONAL EQUITY FUNDS
Notes to Financial Statements(continued)
October 31, 2019
| 9. INDEMNIFICATIONS |
Under the Trust’s organizational documents, its Trustees, officers, employees and agents are indemnified, to the extent permitted by the Act and state law, against certain liabilities that may arise out of performance of their duties to the Funds. Additionally, in the course of business, the Funds enter into contracts that contain a variety of indemnification clauses. The Funds’ maximum exposure under these arrangements is unknown, as this would involve future claims that may be made against the Funds that have not yet occurred. However, GSAM believes the risk of loss under these arrangements to be remote.
| 10. OTHER MATTERS |
On November 5, 2019, a definitive proxy statement (“proxy”) was filed with the SEC to elect certain Trustees to the Trust. The Funds will bear their respective share of the proxy, shareholder meeting and other related costs and GSAM has agreed to reimburse each Fund to the extent such expenses exceed a specified percentage of the Fund’s net assets.
| 11. SUBSEQUENT EVENTS |
Subsequent events after the Statements of Assets and Liabilities date other than the above have been evaluated, and GSAM has concluded that there is no impact requiring adjustment or disclosure in the financial statements.
46
GOLDMAN SACHS FUNDAMENTAL INTERNATIONAL EQUITY FUNDS
| 12. SUMMARY OF SHARE TRANSACTIONS |
Share activity is as follows:
| International Equity ESG Fund | ||||||||||||||||
| For the Fiscal Year Ended October 31, 2019 | For the Fiscal Year Ended October 31, 2018 | |||||||||||||||
|
| |||||||||||||||
| Shares | Dollars | Shares | Dollars | |||||||||||||
|
| |||||||||||||||
| Class A Shares | ||||||||||||||||
Shares sold | 64,610 | $ | 1,182,838 | 267,185 | $ | 5,266,595 | ||||||||||
Reinvestment of distributions | 27,075 | 449,717 | 23,108 | 466,316 | ||||||||||||
Shares redeemed | (325,180 | ) | (6,007,245 | ) | (279,337 | ) | (5,634,214 | ) | ||||||||
| (233,495 | ) | (4,374,690 | ) | 10,956 | 98,697 | |||||||||||
| Class C Shares | ||||||||||||||||
Shares sold | 46,331 | 788,954 | 61,838 | 1,165,128 | ||||||||||||
Reinvestment of distributions | 1,542 | 23,885 | 5,040 | 94,404 | ||||||||||||
Shares redeemed | (110,589 | ) | (1,926,146 | ) | (314,115 | ) | (5,699,946 | ) | ||||||||
| (62,716 | ) | (1,113,307 | ) | (247,237 | ) | (4,440,414 | ) | |||||||||
| Institutional Shares | ||||||||||||||||
Shares sold | 1,084,979 | 20,862,777 | 221,300 | 4,597,446 | ||||||||||||
Reinvestment of distributions | 4,615 | 78,277 | 99,798 | 2,046,867 | ||||||||||||
Shares redeemed | (1,102,693 | ) | (22,012,585 | ) | (6,221,940 | ) | (125,598,741 | ) | ||||||||
| (13,099 | ) | (1,071,531 | ) | (5,900,842 | ) | (118,954,428 | ) | |||||||||
| Service Shares | ||||||||||||||||
Reinvestment of distributions | 3 | 43 | 1 | 19 | ||||||||||||
| 3 | 43 | 1 | 19 | |||||||||||||
| Investor Shares | ||||||||||||||||
Shares sold | 18,990 | 370,134 | 6,936 | 142,346 | ||||||||||||
Reinvestment of distributions | 332 | 5,613 | 391 | 8,008 | ||||||||||||
Shares redeemed | (19,093 | ) | (366,160 | ) | (34,100 | ) | (697,632 | ) | ||||||||
| 229 | 9,587 | (26,773 | ) | (547,278 | ) | |||||||||||
| Class P Shares(a) | ||||||||||||||||
Shares sold | 293,748 | 5,446,526 | 5,763,403 | 116,037,157 | ||||||||||||
Reinvestment of distributions | 95,089 | 1,603,197 | — | — | ||||||||||||
Shares redeemed | (2,322,307 | ) | (42,986,970 | ) | (553,398 | ) | (10,874,338 | ) | ||||||||
| (1,933,470 | ) | (35,937,247 | ) | 5,210,005 | 105,162,819 | |||||||||||
| Class R6 Shares | ||||||||||||||||
Shares sold | 25,890 | 469,704 | — | — | ||||||||||||
Reinvestment of distributions | 12 | 196 | 10 | 196 | ||||||||||||
Shares redeemed | (4,165 | ) | (82,165 | ) | — | 2 | ||||||||||
| 21,737 | 387,735 | 10 | 198 | |||||||||||||
NET DECREASE | (2,220,811 | ) | $ | (42,099,410 | ) | (953,880 | ) | $ | (18,680,387 | ) | ||||||
| (a) | Commenced operations on April 16, 2018. |
47
GOLDMAN SACHS FUNDAMENTAL INTERNATIONAL EQUITY FUNDS
Notes to Financial Statements(continued)
October 31, 2019
| 12. SUMMARY OF SHARE TRANSACTIONS (continued) |
| International Equity Income Fund | ||||||||||||||||
| For the Fiscal Year Ended October 31, 2019 | For the Fiscal Year Ended October 31, 2018 | |||||||||||||||
|
| |||||||||||||||
| Shares | Dollars | Shares | Dollars | |||||||||||||
|
| |||||||||||||||
| Class A Shares | ||||||||||||||||
Shares sold | 125,432 | $ | 1,595,783 | 162,960 | $ | 2,316,790 | ||||||||||
Reinvestment of distributions | 167,381 | 1,917,576 | 20,777 | 301,377 | ||||||||||||
Shares redeemed | (250,762 | ) | (3,126,327 | ) | (225,177 | ) | (3,267,638 | ) | ||||||||
| 42,051 | 387,032 | (41,440 | ) | (649,471 | ) | |||||||||||
| Class C Shares | ||||||||||||||||
Shares sold | 14,593 | 159,836 | 24,359 | 316,316 | ||||||||||||
Reinvestment of distributions | 21,731 | 220,807 | 2,739 | 35,903 | ||||||||||||
Shares redeemed | (39,466 | ) | (432,297 | ) | (176,575 | ) | (2,245,497 | ) | ||||||||
| (3,142 | ) | (51,654 | ) | (149,477 | ) | (1,893,278 | ) | |||||||||
| Institutional Shares | ||||||||||||||||
Shares sold | 220,491 | 2,992,011 | 90,067 | 1,387,522 | ||||||||||||
Reinvestment of distributions | 26,135 | 315,581 | 59,163 | 896,435 | ||||||||||||
Shares redeemed | (71,950 | ) | (902,125 | ) | (2,632,812 | ) | (39,748,150 | ) | ||||||||
| 174,676 | 2,405,467 | (2,483,582 | ) | (37,464,193 | ) | |||||||||||
| Investor Shares | ||||||||||||||||
Shares sold | 247,942 | 3,267,774 | 8,760 | 123,415 | ||||||||||||
Reinvestment of distributions | 4,131 | 47,320 | 584 | 8,463 | ||||||||||||
Shares redeemed | (18,145 | ) | (229,025 | ) | (12,342 | ) | (177,325 | ) | ||||||||
| 233,928 | 3,086,069 | (2,998 | ) | (45,447 | ) | |||||||||||
| Class P Shares(a) | ||||||||||||||||
Shares sold | 76,129 | 976,161 | 2,293,515 | 34,495,583 | ||||||||||||
Reinvestment of distributions | 314,791 | 3,790,562 | 17 | 252 | ||||||||||||
Shares redeemed | (329,004 | ) | (4,214,711 | ) | (62,071 | ) | (903,725 | ) | ||||||||
| 61,916 | 552,012 | 2,231,461 | 33,592,110 | |||||||||||||
| Class R Shares | ||||||||||||||||
Shares sold | 2,282 | 28,441 | 3,962 | 54,769 | ||||||||||||
Reinvestment of distributions | 794 | 9,154 | 37 | 538 | ||||||||||||
Shares redeemed | (4,006 | ) | (50,618 | ) | (705 | ) | (9,990 | ) | ||||||||
| (930 | ) | (13,023 | ) | 3,294 | 45,317 | |||||||||||
| Class R6 Shares | ||||||||||||||||
Shares sold | 21,177 | 275,372 | 506 | 7,756 | ||||||||||||
Reinvestment of distributions | 708 | 8,522 | 104 | 1,572 | ||||||||||||
Shares redeemed | (3,528 | ) | (46,349 | ) | (421 | ) | (6,407 | ) | ||||||||
| 18,357 | 237,545 | 189 | 2,921 | |||||||||||||
NET INCREASE (DECREASE) | 526,856 | $ | 6,603,448 | (442,553 | ) | $ | (6,412,041 | ) | ||||||||
| (a) | Commenced operations on April 16, 2018. |
48
Report of Independent Registered Public
Accounting Firm
Tothe Board of Trustees of Goldman Sachs Trust and Shareholders of Goldman Sachs International Equity ESG Fund and Goldman Sachs International Equity Income Fund
Opinions on the Financial Statements
We have audited the accompanying statements of assets and liabilities, including the schedules of investments, of Goldman Sachs International Equity ESG Fund and Goldman Sachs International Equity Income Fund (two of the funds constituting Goldman Sachs Trust, hereafter collectively referred to as the “Funds”) as of October 31, 2019, the related statements of operations for the year ended October 31, 2019, the statements of changes in net assets for each of the two years in the period ended October 31, 2019, including the related notes,and the financial highlights for each of the periods indicated therein (collectively referred to as the “financial statements”). In our opinion, the financial statements present fairly, in all material respects, the financial position of each of the Funds as of October 31, 2019, the results of each of their operations for the year then ended, the changes in each of their net assets for each of the two years in the period ended October 31, 2019 and each of the financial highlights for each of the periods indicated therein in conformity with accounting principles generally accepted in the United States of America.
Basis for Opinions
These financial statements are the responsibility of the Funds’ management. Our responsibility is to express an opinion on the Funds’ financial statements based on our audits. We are a public accounting firm registered with the Public Company Accounting Oversight Board (United States) (PCAOB) and are required to be independent with respect to the Funds in accordance with the U.S. federal securities laws and the applicable rules and regulations of the Securities and Exchange Commission and the PCAOB.
We conducted our audits of these financial statements in accordance with the standards of the PCAOB. Those standards require that we plan and perform the audit to obtain reasonable assurance about whether the financial statements are free of material misstatement, whether due to error or fraud.
Our audits included performing procedures to assess the risks of material misstatement of the financial statements, whether due to error or fraud, and performing procedures that respond to those risks. Such procedures included examining, on a test basis, evidence regarding the amounts and disclosures in the financial statements. Our audits also included evaluating the accounting principles used and significant estimates made by management, as well as evaluating the overall presentation of the financial statements. Our procedures included confirmation of securities owned as of October 31, 2019 by correspondence with the custodian, transfer agent and brokers; when replies were not received from brokers, we performed other auditing procedures. We believe that our audits provide a reasonable basis for our opinions.
PricewaterhouseCoopers LLP
Boston, Massachusetts
December 23, 2019
We have served as the auditor of one or more investment companies in the Goldman Sachs fund complex since 2000.
49
GOLDMAN SACHS FUNDAMENTAL INTERNATIONAL EQUITY FUNDS
Fund Expenses — Six Month Period Ended October 31, 2019 (Unaudited) | ||
As a shareholder of Class A, Class C, Institutional, Service, Investor, Class P, Class R or Class R6 Shares of a Fund you incur two types of costs: (1) transaction costs, including sales charges on purchase payments (with respect to Class A Shares) and contingent deferred sales charges on redemptions (with respect to Class C Shares); and (2) ongoing costs, including management fees; distribution and/or service(12b-1) fees (with respect to Class A, Class C, Service and Class R Shares); and other Fund expenses. This example is intended to help you understand your ongoing costs (in dollars) of investing in Class A, Class C, Institutional, Service, Investor, Class P, Class R and Class R6 Shares of the Funds and to compare these costs with the ongoing costs of investing in other mutual funds.
The example is based on an investment of $1,000 invested at the beginning of the period and held for the entire period from May 1, 2019 through October 31, 2019, which represents a period of 184 days of a 365 day year.
Actual Expenses— The first line under each share class in the table below provides information about actual account values and actual expenses. You may use the information in this line, together with the amount you invested, to estimate the expenses that you paid over the period. Simply divide your account value by $1,000 (for example, an $8,600 account value divided by $1,000=8.6), then multiply the result by the number in the first line under the heading entitled “Expenses Paid” to estimate the expenses you paid on your account during this period.
Hypothetical Example for Comparison Purposes— The second line under each share class in the table below provides information about hypothetical account values and hypothetical expenses based on the Funds’ actual net expense ratio and an assumed rate of return of 5% per year before expenses, which is not the Funds’ actual return. The hypothetical account values and expenses may not be used to estimate the actual ending account balance or expenses you paid for the period. You may use this information to compare the ongoing costs of investing in the Funds and other funds. To do so, compare this 5% hypothetical example with the 5% hypothetical examples that appear in the shareholder reports of the other funds.
Please note that the expenses shown in the table are meant to highlight your ongoing costs only and do not reflect any transactional costs, such as sales charges, redemption fee or exchange fees. Therefore, the second line of the table is useful in comparing ongoing costs only, and will not help you determine the relative total costs of owning different funds. In addition, if these transactional costs were included, your costs would have been higher.
| International Equity ESG Fund | International Equity Income Fund | |||||||||||||||||||||||
| Share Class | Beginning Account Value 05/01/19 | Ending Account Value 10/31/19 | Expenses Paid for the 6 Months Ended 10/31/19* | Beginning Account Value 05/01/19 | Ending Account Value 10/31/19 | Expenses Paid for the 6 Months Ended 10/31/19* | ||||||||||||||||||
| Class A | �� | |||||||||||||||||||||||
Actual | $ | 1,000 | $ | 1,054.60 | $ | 6.37 | $ | 1,000 | $ | 1,068.00 | $ | 6.46 | ||||||||||||
Hypothetical 5% return | 1,000 | 1,019.00 | + | 6.26 | 1,000 | 1,018.95 | + | 6.31 | ||||||||||||||||
| Class C | ||||||||||||||||||||||||
Actual | 1,000 | 1,051.00 | 10.24 | 1,000 | 1,063.50 | 10.35 | ||||||||||||||||||
Hypothetical 5% return | 1,000 | 1,015.22 | + | 10.06 | 1,000 | 1,015.17 | + | 10.11 | ||||||||||||||||
| Institutional | ||||||||||||||||||||||||
Actual | 1,000 | 1,056.40 | 4.61 | 1,000 | 1,069.80 | 4.54 | ||||||||||||||||||
Hypothetical 5% return | 1,000 | 1,020.72 | + | 4.53 | 1,000 | 1,020.82 | + | 4.43 | ||||||||||||||||
| Service | ||||||||||||||||||||||||
Actual | 1,000 | 1,054.10 | 6.99 | N/A | N/A | N/A | ||||||||||||||||||
Hypothetical 5% return | 1,000 | 1,018.40 | + | 6.87 | N/A | N/A | N/A | |||||||||||||||||
| Investor | ||||||||||||||||||||||||
Actual | 1,000 | 1,055.60 | 5.08 | 1,000 | 1,069.70 | 5.58 | ||||||||||||||||||
Hypothetical 5% return | 1,000 | 1,020.27 | + | 4.99 | 1,000 | 1,019.81 | + | 5.45 | ||||||||||||||||
| Class P | ||||||||||||||||||||||||
Actual | 1,000 | 1,056.20 | 4.61 | 1,000 | 1,069.90 | 4.43 | ||||||||||||||||||
Hypothetical 5% return | 1,000 | 1,020.72 | + | 4.53 | 1,000 | 1,020.92 | + | 4.33 | ||||||||||||||||
| Class R | ||||||||||||||||||||||||
Actual | N/A | N/A | N/A | 1,000 | 1,066.90 | 7.81 | ||||||||||||||||||
Hypothetical 5% return | N/A | N/A | N/A | 1,000 | 1,017.64 | + | 7.63 | |||||||||||||||||
| Class R6 | ||||||||||||||||||||||||
Actual | 1,000 | 1,056.20 | 4.61 | 1,000 | 1,069.80 | 4.49 | ||||||||||||||||||
Hypothetical 5% return | 1,000 | 1,020.72 | + | 4.53 | 1,000 | 1,020.87 | + | 4.38 | ||||||||||||||||
| + | Hypothetical expenses are based on each Fund’s actual annualized net expense ratios and an assumed rate of return of 5% per year before expenses. |
| * | Expenses are calculated using each Fund’s annualized net expense ratio for each class, which represents the ongoing expenses as a percentage of net assets for the six months ended October 31, 2019. Expenses are calculated by multiplying the annualized net expense ratio by the average account value for the period; then multiplying the result by the number of days in the most recent fiscal half year; and then dividing that result by the number of days in the fiscal year. The annualized net expense ratios for the period were as follows: |
| Fund | Class A | Class C | Institutional | Service | Investor | Class P | Class R | Class R6 | ||||||||||||||||||||||||
International Equity ESG | 1.24 | % | 1.99 | % | 0.90 | % | 1.35 | % | 0.99 | % | 0.90 | % | N/A | 0.90 | % | |||||||||||||||||
International Equity Income | 1.26 | 2.01 | 0.90 | N/A | 1.16 | 0.87 | 1.51 | % | 0.88 | |||||||||||||||||||||||
50
GOLDMAN SACHS FUNDAMENTAL INTERNATIONAL EQUITY FUNDS
Statement Regarding Basis for Approval of Management Agreement (Unaudited)
Background
The Goldman Sachs International Equity ESG Fund and the Goldman Sachs International Equity Income Fund (the “Funds”) are investment portfolios of Goldman Sachs Trust (the “Trust”). The Board of Trustees oversees the management of the Trust and reviews the investment performance and expenses of the Funds at regularly scheduled meetings held throughout the year. In addition, the Board of Trustees determines annually whether to approve the continuance of the Trust’s investment management agreement (the “Management Agreement”) with Goldman Sachs Asset Management, L.P. (the “Investment Adviser”) on behalf of the Funds.
The Management Agreement was most recently approved for continuation until June 30, 2020 by the Board of Trustees, including those Trustees who are not parties to the Management Agreement or “interested persons” (as defined in the Investment Company Act of 1940, as amended) of any party thereto (the “Independent Trustees”), at a meeting held on June 11-12, 2019 (the “Annual Meeting”).
The review process undertaken by the Trustees spans the course of the year and culminates with the Annual Meeting. To assist the Trustees in their deliberations, the Trustees have established a Contract Review Committee (the “Committee”), comprised of the Independent Trustees. The Committee held four meetings over the course of the year since the Management Agreement was last approved. At those Committee meetings, regularly scheduled Board or other committee meetings, and/or the Annual Meeting, matters relevant to the renewal of the Management Agreement were considered by the Board, or the Independent Trustees, as applicable. With respect to each Fund, such matters included:
| (a) | the nature and quality of the advisory, administrative, and other services provided to the Fund by the Investment Adviser and its affiliates, including information about: |
| (i) | the structure, staff, and capabilities of the Investment Adviser and its portfolio management teams; |
| (ii) | the groups within the Investment Adviser and its affiliates that support the portfolio management teams or provide other types of necessary services, including fund services groups (e.g., accounting and financial reporting, tax, shareholder services, and operations); controls and risk management groups (e.g., legal, compliance, valuation oversight, credit risk management, internal audit, compliance testing, market risk analysis, finance, and central funding); sales and distribution support groups, and others (e.g., information technology and training); |
| (iii) | trends in employee headcount; |
| (iv) | the Investment Adviser’s financial resources and ability to hire and retain talented personnel and strengthen its operations; and |
| (v) | the parent company’s support of the Investment Adviser and its mutual fund business, as expressed by the firm’s senior management; |
| (b) | information on the investment performance of the Fund, including comparisons to the performance of similar mutual funds, as provided by a third-party mutual fund data provider engaged as part of the contract review process (the “Outside Data Provider”), and a benchmark performance index; and information on general investment outlooks in the markets in which the Fund invests; |
| (c) | information provided by the Investment Adviser indicating the Investment Adviser’s views on whether the Fund’s peer group and/or benchmark index had high, medium, or low relevance given the Fund’s particular investment strategy; |
| (d) | the terms of the Management Agreement and other agreements with affiliated service providers entered into by the Trust on behalf of the Fund; |
| (e) | fee and expense information for the Fund, including: |
| (i) | the relative management fee and expense levels of the Fund as compared to those of comparable funds managed by other advisers, as provided by the Outside Data Provider; |
| (ii) | the Fund’s expense trends over time; and |
| (iii) | to the extent the Investment Adviser manages other types of accounts (such as bank collective trusts, private wealth management accounts, institutional separate accounts, sub-advised mutual funds, and non-U.S. funds) having investment objectives and policies similar to those of the Fund, comparative information on the advisory fees charged and services provided to those accounts by the Investment Adviser; |
| (f) | with respect to the extensive investment performance and expense comparison data provided by the Outside Data Provider, its processes in producing that data for the Fund; (g) the undertakings of the Investment Adviser and its affiliates to implement fee waivers and/or expense limitations; |
| (g) | the undertakings of the Investment Adviser and its affiliates to implement fee waivers and/or expense limitations; |
| (h) | information relating to the profitability of the Management Agreement and the transfer agency and distribution and service arrangements of the Fund to the Investment Adviser and its affiliates; |
| (i) | whether the Fund’s existing management fee schedule adequately addressed any economies of scale; |
51
GOLDMAN SACHS FUNDAMENTAL INTERNATIONAL EQUITY FUNDS
Statement Regarding Basis for Approval of Management Agreement (Unaudited) (continued)
| (j) | a summary of the “fall-out” benefits derived by the Investment Adviser and its affiliates from their relationships with the Fund, including the fees received by the Investment Adviser’s affiliates from the Fund for transfer agency, securities lending, portfolio trading, distribution and other services; |
| (k) | a summary of potential benefits derived by the Fund as a result of its relationship with the Investment Adviser; |
| (l) | information regarding commissions paid by the Fund and broker oversight, an update on the Investment Adviser’s soft dollars practices, other information regarding portfolio trading, and how the Investment Adviser carries out its duty to seek best execution; |
| (m) | portfolio manager ownership of Fund shares; the manner in which portfolio manager compensation is determined; and the number and types of accounts managed by the portfolio managers; |
| (n) | the nature and quality of the services provided to the Fund by its unaffiliated service providers, and the Investment Adviser’s general oversight and evaluation (including reports on due diligence) of those service providers as part of the administrative services provided under the Management Agreement; and |
| (o) | the Investment Adviser’s processes and policies addressing various types of potential conflicts of interest; its approach to risk management; the annual review of the effectiveness of the Fund’s compliance program; and periodic compliance reports. |
The Trustees also received an overview of the Funds’ distribution arrangements. They received information regarding the Funds’ assets, share purchase and redemption activity, and payment of distribution, service, and shareholder administration fees, as applicable. Information was also provided to the Trustees relating to revenue sharing payments made by and services provided by the Investment Adviser and its affiliates to intermediaries that promote the sale, distribution, and/or servicing of Fund shares. The Independent Trustees also discussed the broad range of other investment choices that are available to Fund investors, including the availability of comparable funds managed by other advisers.
The presentations made at the Board and Committee meetings and at the Annual Meeting encompassed the Funds and other mutual funds for which the Board of Trustees has responsibility. In evaluating the Management Agreement at the Annual Meeting, the Trustees relied upon their knowledge, resulting from their meetings and other interactions throughout the year, of the Investment Adviser and its affiliates, their services, and the Funds. In conjunction with these meetings, the Trustees received written materials and oral presentations on the topics covered, and the Investment Adviser addressed the questions and concerns of the Trustees, including concerns regarding the investment performance of certain of the funds they oversee. The Independent Trustees were advised by their independent legal counsel regarding their responsibilities and other regulatory requirements related to the approval and continuation of mutual fund investment management agreements under applicable law. In addition, the Investment Adviser and its affiliates provided the Independent Trustees with a written response to a formal request for information sent on behalf of the Independent Trustees by their independent legal counsel. During the course of their deliberations, the Independent Trustees met in executive sessions with their independent legal counsel, without representatives of the Investment Adviser or its affiliates present.
Nature, Extent, and Quality of the Services Provided Under the Management Agreement
As part of their review, the Trustees considered the nature, extent, and quality of the services provided to the Funds by the Investment Adviser. In this regard, the Trustees considered both the investment advisory services and non-advisory services that are provided by the Investment Adviser and its affiliates. The Trustees noted the transition in the leadership and changes in personnel of various of the Investment Adviser’s portfolio management teams that had occurred in recent periods, and the ongoing recruitment efforts aimed at bringing high quality investment talent to the Investment Adviser. They also noted the Investment Adviser’s commitment to maintaining high quality systems and expending substantial resources to respond to ongoing changes to the regulatory and control environment in which the Funds and their service providers operate, as well as the efforts of the Investment Adviser and its affiliates to combat cyber security risks. The Trustees concluded that the Investment Adviser continued to commit substantial financial and operational resources to the Funds and expressed confidence that the Investment Adviser would continue to do so in the future. The Trustees also recognized that the Investment Adviser had made significant commitments to address regulatory compliance requirements applicable to the Funds and the Investment Adviser and its affiliates.
Investment Performance
The Trustees also considered the investment performance of the Funds. In this regard, they compared the investment performance of each Fund to its peers using rankings and ratings compiled by the Outside Data Provider as of December 31, 2018, and updated performance information prepared by the Investment Adviser using the peer group identified by the Outside Data Provider as of March 31, 2019. The information on each Fund’s investment performance was provided for the one-, three-, five-, and ten-year periods ending on the applicable dates. The Trustees also reviewed each Fund’s investment performance relative to its
52
GOLDMAN SACHS FUNDAMENTAL INTERNATIONAL EQUITY FUNDS
Statement Regarding Basis for Approval of Management Agreement (Unaudited) (continued)
performance benchmark. As part of this review, they considered the investment performance trends of the Funds over time, and reviewed the investment performance of each Fund in light of its investment objective and policies and market conditions.
In addition, the Trustees considered materials prepared and presentations made by the Investment Adviser’s senior management and portfolio management personnel in which Fund performance was assessed. The Trustees also considered the Investment Adviser’s periodic reports with respect to the Funds’ risk profiles, and how the Investment Adviser’s approach to risk monitoring and management influences portfolio management.
The Trustees observed that the International Equity ESG Fund’s Institutional Shares had placed in the third quartile for the one-, three-, and ten-year periods and the fourth quartile for the five-year period, and had underperformed the Fund’s benchmark index for the one-, three-, five-, and ten-year periods ended March 31, 2019. They also noted that in February 2018, the Fund had been repositioned from the Focused International Equity Fund, which involved changes to the Fund’s investment strategy. The Trustees observed that the International Equity Income Fund’s Institutional Shares had placed in the top half of its peer group for the one-, three-, five-, and ten-year periods, and had outperformed the Fund’s benchmark index for the one-year period and underperformed for the three-, five-, and ten-year periods ended March 31, 2019. They also noted that in February 2018, the Fund had been repositioned from the Strategic International Equity Fund, which involved changes to the Fund’s investment objective and investment strategy. The Trustees observed that the International Equity ESG Fund and the International Equity Income Fund had experienced certain portfolio management changes in 2018.
Costs of Services Provided and Competitive Information
The Trustees considered the contractual terms of the Management Agreement and the fee rates payable by each Fund thereunder. In this regard, the Trustees considered information on the services rendered by the Investment Adviser to the Funds, which included both advisory and administrative services that were directed to the needs and operations of the Funds as registered mutual funds.
In particular, the Trustees reviewed analyses prepared by the Outside Data Provider regarding the expense rankings of the Funds. The analyses provided a comparison of each Fund’s management fee and breakpoints to those of a relevant peer group and category universe; an expense analysis which compared each Fund’s overall net and gross expenses to a peer group and a category universe; and data comparing each Fund’s net expenses to the peer and category medians. The analyses also compared each Fund’s other expenses and fee waivers/reimbursements to those of the peer group and category medians. The Trustees concluded that the comparisons provided by the Outside Data Provider were useful in evaluating the reasonableness of the management fees and total expenses paid by the Funds.
In addition, the Trustees considered the Investment Adviser’s undertakings to implement fee waivers and/or expense limitations. The Trustees also noted that certain changes were being made to existing fee waiver or expense limitation arrangements of the International Equity ESG Fund that would have the effect of decreasing expenses of Class A, Class C, and Investor Shares of the Fund, with such changes taking effect in connection with the Fund’s next annual registration statement update. They also considered, to the extent that the Investment Adviser manages other types of accounts having investment objectives and policies similar to those of the Funds, comparative fee information for services provided by the Investment Adviser to those accounts, and information that indicated that services provided to the Funds differed in various significant respects from the services provided to other types of accounts which, in many cases, operated under less stringent legal and regulatory structures, required fewer services from the Investment Adviser to a smaller number of client contact points, and were less time-intensive.
In addition, the Trustees noted that shareholders are able to redeem their Fund shares at any time if shareholders believe that the Fund fees and expenses are too high or if they are dissatisfied with the performance of the Fund.
Profitability
The Trustees reviewed each Fund’s contribution to the Investment Adviser’s revenues and pre-tax profit margins. In this regard the Trustees noted that they had received, among other things, profitability analyses and summaries, revenue and expense schedules by Fund and by function (i.e., investment management, transfer agency and distribution and service), and information on the Investment Adviser’s expense allocation methodology. They observed that the profitability and expense figures are substantially similar to those used by the Investment Adviser for many internal purposes, including compensation decisions among various business groups, and are thus subject to a vigorous internal debate about how certain revenue and expenses should be allocated. The Trustees also noted that the internal audit group within the Goldman Sachs organization periodically audits the expense allocation methodology and that the internal audit group was satisfied with the reasonableness, consistency, and accuracy of the Investment Adviser’s expense allocation methodology. Profitability data for each Fund was provided for 2018 and 2017, and the Trustees considered this information in relation to the Investment Adviser’s overall profitability.
53
GOLDMAN SACHS FUNDAMENTAL INTERNATIONAL EQUITY FUNDS
Statement Regarding Basis for Approval of Management Agreement (Unaudited) (continued)
Economies of Scale
The Trustees considered the information that had been provided regarding whether there have been economies of scale with respect to the management of the Funds. The Trustees also considered the breakpoints in the fee rate payable under the Management Agreement for each of the Funds at the following annual percentage rates of the average daily net assets of the Funds:
| International Equity ESG Fund | International Equity Income Fund | |||||||
| First $1 billion | 0.85 | % | 0.80 | % | ||||
| Next $1 billion | 0.77 | 0.72 | ||||||
| Next $3 billion | 0.73 | 0.68 | ||||||
| Next $3 billion | 0.71 | 0.67 | ||||||
| Over $8 billion | 0.70 | 0.66 | ||||||
The Trustees noted that the breakpoints were designed to share potential economies of scale, if any, with the Funds and their shareholders as assets under management reach those asset levels. The Trustees considered the amounts of assets in the Funds; the Funds’ recent share purchase and redemption activity; the information provided by the Investment Adviser relating to the costs of the services provided by the Investment Adviser and its affiliates and their realized profits; information comparing fee rates charged by the Investment Adviser with fee rates charged to other funds in the peer groups; and the Investment Adviser’s undertaking to limit certain expenses of the Funds that exceed specified levels. Upon reviewing these matters at the Annual Meeting, the Trustees concluded that the fee breakpoints represented a means of assuring that benefits of scalability, if any, would be passed along to shareholders at the specified asset levels.
Other Benefits to the Investment Adviser and Its Affiliates
The Trustees also considered the other benefits derived by the Investment Adviser and its affiliates from their relationships with the Funds as stated above, including: (a) transfer agency fees received by Goldman Sachs & Co. LLC (“Goldman Sachs”); (b) brokerage and futures commissions earned by Goldman Sachs for executing securities and futures transactions on behalf of the Funds; (c) research received by the Investment Adviser from broker-dealers in exchange for executing certain transactions on behalf of the Funds; (d) trading efficiencies resulting from aggregation of orders of the Funds with those for other funds or accounts managed by the Investment Adviser; (e) fees earned by Goldman Sachs Agency Lending (“GSAL”), an affiliate of the Investment Adviser, as securities lending agent (and fees earned by the Investment Adviser for managing the fund in which the Funds’ cash collateral is invested); (f) the Investment Adviser’s ability to leverage the infrastructure designed to service the Funds on behalf of its other clients; (g) the Investment Adviser’s ability to cross-market other products and services to Fund shareholders; (h) Goldman Sachs’ retention of certain fees as Fund Distributor; (i) the Investment Adviser’s ability to negotiate better pricing with custodians on behalf of its other clients, as a result of the relationship with the Funds; and (j) the possibility that the working relationship between the Investment Adviser and the Funds’ third-party service providers may cause those service providers to be more likely to do business with other areas of Goldman Sachs. In the course of considering the foregoing, the Independent Trustees requested and received further information quantifying certain of these fall-out benefits.
Other Benefits to the Funds and Their Shareholders
The Trustees also noted that the Funds receive certain other potential benefits as a result of their relationship with the Investment Adviser, including: (a) trading efficiencies resulting from aggregation of orders of the Funds with those of other funds or accounts managed by the Investment Adviser; (b) enhanced servicing from vendors due to the volume of business generated by the Investment Adviser and its affiliates; (c) enhanced servicing from broker-dealers due to the volume of business generated by the Investment Adviser and its affiliates; (d) the advantages received from the Investment Adviser’s knowledge and experience gained from managing other accounts and products; (e) the Investment Adviser’s ability to hire and retain qualified personnel to provide services to the Funds because of the reputation of the Goldman Sachs organization; (f) the Funds’ access, through the Investment Adviser, to certain firm-wide resources (e.g., proprietary risk management systems and databases), subject to certain restrictions; (g) the Funds’ ability to participate in the securities lending program administered by GSAL, as measured by the revenue received by the Funds in connection with the program; and (h) the Funds’ access to certain affiliated distribution channels. In addition, the Trustees noted the competitive nature of the mutual fund marketplace, and considered that many of the Funds’ shareholders invested in the Funds in part because of the Funds’ relationship with the Investment Adviser and that those shareholders have a general expectation that the relationship will continue.
54
GOLDMAN SACHS FUNDAMENTAL INTERNATIONAL EQUITY FUNDS
Statement Regarding Basis for Approval of Management Agreement (Unaudited) (continued)
Conclusion
In connection with their consideration of the Management Agreement, the Trustees gave weight to each of the factors described above, but did not identify any particular factor as controlling their decision. After deliberation and consideration of all of the information provided, including the factors described above, the Trustees concluded, in the exercise of their business judgment, that the management fees paid by each of the Funds were reasonable in light of the services provided to it by the Investment Adviser, the Investment Adviser’s costs and each Fund’s current and reasonably foreseeable asset levels. The Trustees unanimously concluded that the Investment Adviser’s continued management likely would benefit each Fund and its shareholders and that the Management Agreement should be approved and continued with respect to each Fund until June 30, 2020.
55
GOLDMAN SACHS FUNDAMENTAL INTERNATIONAL EQUITY FUNDS
Trustees and Officers (Unaudited)
Independent Trustees
| Name, Address and Age1 | Position(s) Held with the Trust | Term of Office and | Principal Occupation(s) During Past 5 Years | Number of Portfolios in Fund Complex Overseen by Trustee3 | Other Directorships Held by Trustee4 | |||||
Jessica Palmer Age: 70 | Chair of the Board of Trustees | Since 2018 (Trustee since 2007) | Ms. Palmer is retired. She was formerly Consultant, Citigroup Human Resources Department (2007-2008); Managing Director, Citigroup Corporate and Investment Banking (previously, Salomon Smith Barney/Salomon Brothers) (1984-2006). Ms. Palmer was a Member of the Board of Trustees of Indian Mountain School (private elementary and secondary school) (2004-2009).
Chair of the Board of Trustees — Goldman Sachs Trust and Goldman Sachs Variable Insurance Trust. | 102 | None | |||||
Kathryn A. Cassidy Age: 65 | Trustee | Since 2015 | Ms. Cassidy is retired. Formerly, she was Advisor to the Chairman (May 2014-December 2014); and Senior Vice President and Treasurer (2008-2014), General Electric Company & General Electric Capital Corporation (technology and financial services companies).
Trustee — Goldman Sachs Trust and Goldman Sachs Variable Insurance Trust. | 102 | None | |||||
Diana M. Daniels Age: 70 | Trustee | Since 2007 | Ms. Daniels is retired. Formerly, she was Vice President, General Counsel and Secretary, The Washington Post Company (1991-2006). Ms. Daniels is a Trustee Emeritus and serves as a Presidential Councillor of Cornell University (2013-Present); former Member of the Legal Advisory Board, New York Stock Exchange(2003-2006) and of the Corporate Advisory Board, Standish Mellon Management Advisors (2006-2007).
Trustee — Goldman Sachs Trust and Goldman Sachs Variable Insurance Trust. | 102 | None | |||||
Roy W. Templin Age: 59 | Trustee | Since 2013 | Mr. Templin is retired. He is Director, Armstrong World Industries, Inc. (a designer and manufacturer of ceiling, wall and suspension system solutions) (2016-Present); and was formerly Chairman of the Board of Directors, Con-Way Incorporated (a transportation, logistics and supply chain management service company) (2014-2015); Executive Vice President and Chief Financial Officer, Whirlpool Corporation (an appliance manufacturer and marketer)(2004-2012). Previously, Mr. Templin served as an Advisory Board Member of Goldman Sachs Trust and Goldman Sachs Variable Insurance Trust (June 2013-October 2013).
Trustee — Goldman Sachs Trust and Goldman Sachs Variable Insurance Trust. | 102 | Armstrong World Industries, Inc. (a ceiling, wall and suspension systems solutions manufacturer) | |||||
Gregory G. Weaver Age: 68 | Trustee | Since 2015 | Mr. Weaver is retired. He is Director, Verizon Communications Inc. (2015-Present); and was formerly Chairman and Chief Executive Officer, Deloitte & Touche LLP (a professional services firm) (2001-2005 and 2012-2014); and Member of the Board of Directors, Deloitte & Touche LLP (2006-2012).
Trustee — Goldman Sachs Trust and Goldman Sachs Variable Insurance Trust. | 102 | Verizon Communications Inc. | |||||
56
GOLDMAN SACHS FUNDAMENTAL INTERNATIONAL EQUITY FUNDS
Trustees and Officers (Unaudited) (continued)
Interested Trustee*
| Name, Address and Age1 | Position(s) Held with the Trust | Term of Office and | Principal Occupation(s) During Past 5 Years | Number of Portfolios in Fund Complex Overseen by Trustee3 | Other Directorships Held by Trustee4 | |||||
James A. McNamara Age: 57 | President and Trustee | Since 2007 | Advisory Director, Goldman Sachs (January 2018-Present); Managing Director, Goldman Sachs (January 2000-December 2017); Director of Institutional Fund Sales, GSAM (April 1998-December 2000); and Senior Vice President and Manager, Dreyfus Institutional Service Corporation (January 1993-April 1998).
President and Trustee — Goldman Sachs Trust; Goldman Sachs Variable Insurance Trust; Goldman Sachs Trust II; Goldman Sachs MLP Income Opportunities Fund; Goldman Sachs MLP and Energy Renaissance Fund; and Goldman Sachs ETF Trust. | 162 | None | |||||
Advisory Board Members
| Name, Address, Age1 | Position(s) Held with the Trust | Term of Office and | Principal Occupation(s) During Past 5 Years | Number of Portfolios in Fund Complex Overseen by Advisory Board Member3 | Other Directorships Held by Advisory Board Member4 | |||||
Dwight L. Bush Age: 62 | Advisory Board Member | Since 2019 | Ambassador Bush is President and CEO of D.L. Bush & Associates (a financial advisory and private investment firm) (2002-2014 and 2017-present); and was formerly U.S. Ambassador to the Kingdom of Morocco (2014-2017) and a Member of the Board of Directors of Santander Bank, N.A. (2018-2019).
Advisory Board Member — Goldman Sachs Trust and Goldman Sachs Variable Insurance Trust. | 102 | None | |||||
Joaquin Delgado Age: 59 | Advisory Board Member | Since 2019 | Dr. Delgado is retired. He is Director, Hexion Inc. (a specialty chemical manufacturer) (2019-present); and Director, Stepan Company (a specialty chemical manufacturer) (2011-present); and was formerly Executive Vice President, Consumer Business Group of 3M Company (July 2016-July 2019); and Executive Vice President, Health Care Business Group of 3M Company (October 2012-July 2016).
Advisory Board Member — Goldman Sachs Trust and Goldman Sachs Variable Insurance Trust. | 102 | Stepan Company (a specialty chemical manufacturer) | |||||
| * | Mr. McNamara is considered to be an “Interested Trustee” because he holds positions with Goldman Sachs and owns securities issued by The Goldman Sachs Group, Inc. Mr. McNamara holds comparable positions with certain other companies of which Goldman Sachs, GSAM or an affiliate thereof is the investment adviser, administrator and/or distributor. |
| 1 | Each Trustee and Advisory Board Member may be contacted by writing to the Trustee or Advisory Board Member, c/o Goldman Sachs, 200 West Street, New York, New York, 10282, Attn: Caroline Kraus. Information is provided as of October 31, 2019. |
| 2 | Subject to such policies as may be adopted by the Board from time-to-time, each Trustee holds office for an indefinite term, until the earliest of: (a) the election of his or her successor; (b) the date the Trustee resigns or is removed by the Board or shareholders, in accordance with the Trust’s Declaration of Trust; or (c) the termination of the Trust. The Board has adopted policies which provide that (a) no Trustee shall hold office for more than 15 years and (b) a Trustee shall retire as of December 31st of the calendar year in which he or she reaches his or her 74th birthday, unless a waiver of such requirements shall have been adopted by a majority of the other Trustees. These policies may be changed by the Trustees without shareholder vote. |
| 3 | The Goldman Sachs Fund Complex includes certain other companies listed above for each respective Trustee. As of October 31, 2019, Goldman Sachs Trust consisted of 89 portfolios (88 of which offered shares to the public); Goldman Sachs Variable Insurance Trust consisted of 13 portfolios; Goldman Sachs Trust II consisted of 19 portfolios (17 of which offered shares to the public); Goldman Sachs MLP Income Opportunities Fund and Goldman Sachs MLP and Energy Renaissance Fund each consisted of one portfolio; and Goldman Sachs ETF Trust consisted of 39 portfolios (21 of which offered shares to the public). |
| 4 | This column includes only directorships of companies required to report to the Securities and Exchange Commission under the Securities Exchange Act of 1934 (i.e., “public companies”) or other investment companies registered under the Act. |
Additional information about the Trustees is available in the Funds’ Statement of Additional Information, which can be obtained from Goldman Sachs free of charge by calling this toll-free number (in the United States of America): 1-800-526-7384. Additional information about the Advisory Board Members will be available in the Funds’ Statement of Additional Information dated February 28, 2020, which will be available from Goldman Sachs free of charge by calling this toll-free number (in the United States of America): 1-800-526-7384.
57
GOLDMAN SACHS FUNDAMENTAL INTERNATIONAL EQUITY FUNDS
Trustees and Officers (Unaudited) (continued)
Officers of the Trust*
| Name, Address and Age1 | Position(s) Held with the Trust | Term of Office and | Principal Occupation(s) During Past 5 Years | |||
James A. McNamara 200 West Street New York, NY 10282 Age: 57 | Trustee and President | Since 2007 | Advisory Director, Goldman Sachs (January 2018-Present); Managing Director, Goldman Sachs (January 2000-December 2017); Director of Institutional Fund Sales, GSAM (April 1998-December 2000); and Senior Vice President and Manager, Dreyfus Institutional Service Corporation (January 1993-April 1998).
President and Trustee — Goldman Sachs Trust; Goldman Sachs Variable Insurance Trust; Goldman Sachs Trust II; Goldman Sachs MLP Income Opportunities Fund; Goldman Sachs MLP and Energy Renaissance Fund; and Goldman Sachs ETF Trust. | |||
Caroline L. Kraus 200 West Street New York, NY 10282 Age: 42 | Secretary | Since 2012 | Managing Director, Goldman Sachs (January 2016-Present); Vice President, Goldman Sachs (August 2006-December 2015); Associate General Counsel, Goldman Sachs (2012-Present); Assistant General Counsel, Goldman Sachs (August 2006-December 2011); and Associate, Weil, Gotshal & Manges, LLP (2002-2006).
Secretary — Goldman Sachs Trust (previously Assistant Secretary (2012)); Goldman Sachs Variable Insurance Trust (previously Assistant Secretary (2012)); Goldman Sachs Trust II; Goldman Sachs BDC, Inc.; Goldman Sachs Private Middle Market Credit LLC; Goldman Sachs Middle Market Lending Corp.; Goldman Sachs MLP Income Opportunities Fund; Goldman Sachs MLP and Energy Renaissance Fund; and Goldman Sachs ETF Trust. | |||
Joseph F. DiMaria 30 Hudson Street Jersey City, NJ 07302 Age: 51 | Treasurer, Principal Financial Officer and Principal Accounting Officer | Since 2017 (Treasurer and Principal Financial Officer since 2019) | Managing Director, Goldman Sachs (November 2015-Present) and Vice President — Mutual Fund Administration, Columbia Management Investment Advisers, LLC (May 2010-October 2015).
Treasurer, Principal Financial Officer and Principal Accounting Officer — Goldman Sachs Trust (previously Assistant Treasurer (2016)); Goldman Sachs Variable Insurance Trust (previously Assistant Treasurer (2016)); Goldman Sachs Trust II (previously Assistant Treasurer (2017)); Goldman Sachs MLP Income Opportunities Fund (previously Assistant Treasurer (2017)); Goldman Sachs MLP and Energy Renaissance Fund (previously Assistant Treasurer (2017)); and Goldman Sachs ETF Trust (previously Assistant Treasurer (2017)). | |||
| * | Represents a partial list of officers of the Trust. Additional information about all the officers is available in the Funds’ Statement of Additional Information, which can be obtained from Goldman Sachs free of charge by calling this toll-free number (in the United States): 1-800-526-7384. |
| 1 | Information is provided as of October 31, 2019. |
| 2 | Officers hold office at the pleasure of the Board of Trustees or until their successors are duly elected and qualified. Each officer holds comparable positions with certain other companies of which Goldman Sachs, GSAM or an affiliate thereof is the investment adviser, administrator and/or distributor. |
Goldman Sachs Trust — Fundamental International Equity Funds — Tax Information (Unaudited)
From distributions paid during the year ended October 31, 2019, the total amount of income received by the International Equity ESG and International Equity Income Funds from sources within foreign countries and possessions of the United States was $0.2643 and $0.4072 per share, respectively, all of which is attributable to qualified passive income. The percentage of net investment income dividends paid from foreign sources by the International Equity ESG and International Equity Income Funds were 79.46% and 86.51%, respectively. The total amount of taxes paid by the International Equity ESG and International Equity Income Funds was $0.0247 and $0.0372 per share, respectively.
For the year ended October 31, 2019, 100% and 92.57% of the dividends paid from net investment company taxable income by the International Equity ESG and International Equity Income Funds, respectively, qualify for the reduced tax rate under the Jobs and Growth Tax Relief and Reconciliation Act of 2003.
Pursuant to Section 852 of the Internal Revenue Code, the International Equity Income Fund designates $4,229,300 or if different, the maximum amount allowable, as capital gain dividends paid during the year ended October 31, 2019.
During the year ended October 31, 2019, the International Equity Income Fund designates $621,665 as short-term capital gain dividends pursuant to Section 871(k) of the Internal Revenue Code
58
FUNDS PROFILE
Goldman Sachs Funds
Goldman Sachs is a premier financial services firm, known since 1869 for creating thoughtful and customized investment solutions in complex global markets.
Today, theConsumer and Investment Management Division of Goldman Sachs serves a diverse set of clients worldwide, including private institutions, public entities and individuals. With approximately $1.60 trillion in assets under supervision as of September 30, 2019, Goldman Sachs Asset Management (“GSAM”) has portfolio management teams located around the world and our investment professionals bring firsthand knowledge of local markets to every investment decision. Assets under supervision includes assets under management and other client assets for which Goldman Sachs does not have full discretion. GSAM leverages the resources of Goldman Sachs & Co. LLC subject to legal, internal and regulatory restrictions.
Money Market
Financial Square FundsSM
| ∎ | Financial Square Treasury Solutions Fund1 |
| ∎ | Financial Square Government Fund1 |
| ∎ | Financial Square Money Market Fund2 |
| ∎ | Financial Square Prime Obligations Fund2 |
| ∎ | Financial Square Treasury Instruments Fund1 |
| ∎ | Financial Square Treasury Obligations Fund1 |
| ∎ | Financial Square Federal Instruments Fund1 |
Investor FundsSM
| ∎ | Investor Money Market Fund3 |
| ∎ | Investor Tax-Exempt Money Market Fund3 |
Fixed Income
Short Duration and Government
| ∎ | Enhanced Income Fund |
| ∎ | High Quality Floating Rate Fund |
| ∎ | Short-Term Conservative Income Fund |
| ∎ | Short Duration Government Fund |
| ∎ | Short Duration Income Fund |
| ∎ | Government Income Fund |
| ∎ | Inflation Protected Securities Fund |
Multi-Sector
| ∎ | Bond Fund |
| ∎ | Core Fixed Income Fund |
| ∎ | Global Income Fund |
| ∎ | Strategic Income Fund |
Municipal and Tax-Free
| ∎ | High Yield Municipal Fund |
| ∎ | Dynamic Municipal Income Fund |
| ∎ | Municipal Income Completion Fund |
| ∎ | Short Duration Tax-Free Fund |
Single Sector
| ∎ | Investment Grade Credit Fund |
| ∎ | U.S. Mortgages Fund |
| ∎ | High Yield Fund |
| ∎ | High Yield Floating Rate Fund |
| ∎ | Emerging Markets Debt Fund |
| ∎ | Local Emerging Markets Debt Fund |
Fixed Income Alternatives
| ∎ | Long Short Credit Strategies Fund |
Fundamental Equity
| ∎ | Equity Income Fund |
| ∎ | Small Cap Growth Fund |
| ∎ | Small Cap Value Fund |
| ∎ | Small/Mid Cap Value Fund |
| ∎ | Mid Cap Value Fund |
| ∎ | Large Cap Value Fund |
| ∎ | Focused Value Fund |
| ∎ | Capital Growth Fund |
| ∎ | Strategic Growth Fund |
| ∎ | Small/Mid Cap Growth Fund |
| ∎ | Flexible Cap Fund |
| ∎ | Concentrated Growth Fund |
| ∎ | Technology Opportunities Fund |
| ∎ | Growth Opportunities Fund |
| ∎ | Rising Dividend Growth Fund |
| ∎ | Blue Chip Fund |
| ∎ | Income Builder Fund |
Tax-Advantaged Equity
| ∎ | U.S. Tax-Managed Equity Fund |
| ∎ | International Tax-Managed Equity Fund |
| ∎ | U.S. Equity Dividend and Premium Fund |
| ∎ | International Equity Dividend and Premium Fund |
Equity Insights
| ∎ | Small Cap Equity Insights Fund |
| ∎ | U.S. Equity Insights Fund |
| ∎ | Small Cap Growth Insights Fund |
| ∎ | Large Cap Growth Insights Fund |
| ∎ | Large Cap Value Insights Fund |
| ∎ | Small Cap Value Insights Fund |
| ∎ | International Small Cap Insights Fund |
| ∎ | International Equity Insights Fund |
| ∎ | Emerging Markets Equity Insights Fund |
Fundamental Equity International
| ∎ | International Equity Income Fund |
| ∎ | International Equity ESG Fund |
| ∎ | China Equity Fund4 |
| ∎ | Emerging Markets Equity Fund |
| ∎ | Imprint Emerging Markets Opportunities Fund5 |
| ∎ | ESG Emerging Markets Equity Fund |
Alternative
| ∎ | Real Estate Securities Fund |
| ∎ | International Real Estate Securities Fund |
| ∎ | Commodity Strategy Fund |
| ∎ | Global Real Estate Securities Fund |
| ∎ | Alternative Premia Fund |
| ∎ | Absolute Return Tracker Fund |
| ∎ | Managed Futures Strategy Fund |
| ∎ | MLP Energy Infrastructure Fund |
| ∎ | MLP & Energy Fund |
| ∎ | Multi-Manager Alternatives Fund |
| ∎ | Global Infrastructure Fund |
Total Portfolio Solutions
| ∎ | Global Managed Beta Fund |
| ∎ | Multi-Manager Non-Core Fixed Income Fund |
| ∎ | Multi-Manager U.S. Dynamic Equity Fund |
| ∎ | Multi-Manager Global Equity Fund |
| ∎ | Multi-Manager International Equity Fund |
| ∎ | Tactical Tilt Overlay Fund |
| ∎ | Balanced Strategy Portfolio |
| ∎ | Multi-Manager U.S. Small Cap Equity Fund |
| ∎ | Multi-Manager Real Assets Strategy Fund |
| ∎ | Growth and Income Strategy Portfolio |
| ∎ | Growth Strategy Portfolio |
| ∎ | Dynamic Global Equity Fund6 |
| ∎ | Satellite Strategies Portfolio |
| ∎ | Enhanced Dividend Global Equity Portfolio |
| ∎ | Tax-Advantaged Global Equity Portfolio |
| ∎ | Strategic Factor Allocation Fund |
| ∎ | Target Date 2020 Portfolio |
| ∎ | Target Date 2025 Portfolio |
| ∎ | Target Date 2030 Portfolio |
| ∎ | Target Date 2035 Portfolio |
| ∎ | Target Date 2040 Portfolio |
| ∎ | Target Date 2045 Portfolio |
| ∎ | Target Date 2050 Portfolio |
| ∎ | Target Date 2055 Portfolio |
| ∎ | Target Date 2060 Portfolio |
| ∎ | GQG Partners International Opportunities Fund |
| 1 | You could lose money by investing in the Fund. Although the Fund seeks to preserve the value of your investment at $1.00 per share, it cannot guarantee it will do so. An investment in the Fund is not a deposit of a bank and is not insured or guaranteed by the Federal Deposit Insurance Corporation or any other government agency. The Fund’s sponsor has no legal obligation to provide financial support to the Fund, and you should not expect that the sponsor will provide financial support to the Fund at any time. |
| 2 | You could lose money by investing in the Fund. Because the share price of the Fund will fluctuate, when you sell your shares they may be worth more or less than what you originally paid for them. The Fund may impose a fee upon sale of your shares or may temporarily suspend your ability to sell shares if the Fund’s liquidity falls below required minimums because of market conditions or other factors. An investment in the Fund is not a deposit of a bank and is not insured or guaranteed by the Federal Deposit Insurance Corporation or any other government agency. The Fund’s sponsor has no legal obligation to provide financial support to the Fund, and you should not expect that the sponsor will provide financial support to the Fund at any time. |
| 3 | You could lose money by investing in the Fund. Although the Fund seeks to preserve the value of your investment at $1.00 per share, it cannot guarantee it will do so. The Fund may impose a fee upon sale of your shares or may temporarily suspend your ability to sell shares if the Fund’s liquidity falls below required minimums because of market conditions or other factors. An investment in the Fund is not a deposit of a bank and is not insured or guaranteed by the Federal Deposit Insurance Corporation or any other government agency. The Fund’s sponsor has no legal obligation to provide financial support to the Fund, and you should not expect that the sponsor will provide financial support to the Fund at any time. |
| 4 | Effective after the close of business on November 20, 2019, the Goldman Sachs Asia Equity Fund was renamed the Goldman Sachs China Equity Fund |
| 5 | Effective after the close of business on August 30, 2019, the Goldman Sachs N-11 Equity Fund was renamed the Goldman Sachs Imprint Emerging Markets Opportunities Fund. |
| 6 | Effective after the close of business on February 28, 2019, the Goldman Sachs Equity Growth Strategy Portfolio was renamed the Goldman Sachs Dynamic Global Equity Fund. |
| * | This list covers open-end funds only. Please visit our website at www.GSAMFUNDS.com to learn about our closed-end funds and exchange-traded funds. |
TRUSTEES Jessica Palmer,Chair Kathryn A. Cassidy Diana M. Daniels James A. McNamara Roy W. Templin Gregory G. Weaver | OFFICERS James A. McNamara,President Joseph F. DiMaria,Principal Financial Officer, Principal Accounting Officer and Treasurer Caroline L. Kraus,Secretary | |
GOLDMAN SACHS & CO. LLC Distributor and Transfer Agent | GOLDMAN SACHS ASSET MANAGEMENT, L.P. Investment Adviser | |
Visit our website atwww.GSAMFUNDS.com to obtain the most recent month-end returns.
Goldman Sachs Asset Management, L.P., 200 West Street, New York, New York 10282
The reports concerning the Funds included in this shareholder report may contain certain forward-looking statements about the factors that may affect the performance of the Funds in the future. These statements are based on Fund management’s predictions and expectations concerning certain future events and their expected impact on the Funds, such as performance of the economy as a whole and of specific industry sectors, changes in the levels of interest rates, the impact of developing world events, and other factors that may influence the future performance of the Funds. Management believes these forward-looking statements to be reasonable, although they are inherently uncertain and difficult to predict. Actual events may cause adjustments in portfolio management strategies from those currently expected to be employed.
A description of the policies and procedures that the Funds use to determine how to vote proxies relating to portfolio securities and information regarding how a Fund voted proxies relating to portfolio securities during the most recent 12-month period ended June 30 is available (i) without charge, upon request by calling 1-800-526-7384 (for Retail Shareholders) or 1-800-621-2550 (for Institutional Shareholders); and (ii) on the Securities and Exchange Commission (“SEC”) web site at http://www.sec.gov.
The Funds will file portfolio holdings information for each month in a fiscal quarter within 60 days after the end of the relevant fiscal quarter on Form N-PORT. Portfolio holdings information for the third month of each fiscal quarter will be made available on the SEC’s web site at http://www.sec.gov. Portfolio holdings information may be obtained upon request and without charge by calling 1-800-526-7384 (for Retail Shareholders) or 1-800-621-2550 (for Institutional Shareholders).
Fund holdings and allocations shown are as of October 31, 2019 and may not be representative of future investments. Fund holdings should not be relied on in making investment decisions and should not be construed as research or investment advice regarding particular securities. Current and future holdings are subject to risk.
The Global Industry Classification Standard (GICS) was developed by and is the exclusive property and a service mark of Morgan Stanley Capital International Inc. (MSCI) and Standard & Poor’s, a division of The McGraw-Hill Companies, Inc. (S&P) and is licensed for use by Goldman Sachs. Neither MSCI, S&P nor any other party involved in making or compiling the GICS or any GICS classifications makes any express or implied warranties or representations with respect to such standard or classification (or the results to be obtained by the use thereof), and all such parties hereby expressly disclaim all warranties of originality, accuracy, completeness, merchantability or fitness for a particular purpose with respect to any of such standard or classification. Without limiting any of the foregoing, in no event shall MSCI, S&P, any of their affiliates or any third party involved in making or compiling the GICS or any GICS classifications have any liability for any direct, indirect, special, punitive, consequential or any other damages (including lost profits) even if notified of the possibility of such damages.
The portfolio risk management process includes an effort to monitor and manage risk, but does not imply low risk.
This material is not authorized for distribution to prospective investors unless preceded or accompanied by a current Prospectus or summary prospectus, if applicable. Investors should consider a Fund’s objective, risks, and charges and expenses, and read the summary prospectus, if available, and/or the Prospectus carefully before investing or sending money. The summary prospectus, if available, and the Prospectus contain this and other information about a Fund and may be obtained from your authorized dealer or from Goldman Sachs & Co. LLC by calling (retail – 1-800-526-7384) (institutional – 1-800-621-2550).
© 2019 Goldman Sachs. All rights reserved. 187092-OTU-1103597 EQINTAR-19
Goldman Sachs Funds

| Annual Report | October 31, 2019 | |||
International Equity Insights Funds | ||||
Emerging Markets Equity Insights | ||||
International Equity Insights | ||||
International Small Cap Insights | ||||
It is our intention that beginning on January 1, 2021, paper copies of the Funds’ annual and semi-annual shareholder reports will no longer be sent by mail, unless you specifically request paper copies of the reports from a Fund or from your financial intermediary. Instead, the reports will be made available on a website, and you will be notified by mail each time a report is posted and provided with a website link to access the report.
If you already elected to receive shareholder reports electronically, you will not be affected by this change and you need not take any action. At any time, you may elect to receive reports and certain communications from a Fund electronically by calling the applicable toll-free number below or by contacting your financial intermediary.
You may elect to receive all future shareholder reports in paper free of charge. If you hold shares of a Fund directly with the Fund’s transfer agent, you can inform the transfer agent that you wish to receive paper copies of reports by callingtoll-free 800-621-2550 for Institutional, Service, Class R6 and Class P shareholders or 800-526-7384 for all other shareholders. If you hold shares of a Fund through a financial intermediary, please contact your financial intermediary to make this election. Your election to receive reports in paper will apply to all Goldman Sachs Funds held in your account if you invest through your financial intermediary or all Goldman Sachs Funds held with the Funds’ transfer agent if you invest directly with the transfer agent.

Goldman Sachs International Equity
Insights Funds
| ∎ | EMERGING MARKETS EQUITY INSIGHTS |
| ∎ | INTERNATIONAL EQUITY INSIGHTS |
| ∎ | INTERNATIONAL SMALL CAP INSIGHTS |
| 1 | ||||
| 3 | ||||
| 7 | ||||
| 22 | ||||
| 41 | ||||
| 45 | ||||
| 45 | ||||
| 52 | ||||
| 60 | ||||
| 66 | ||||
| 81 | ||||
| 82 | ||||
| NOT FDIC-INSURED | May Lose Value | No Bank Guarantee | ||
GOLDMAN SACHS INTERNATIONAL EQUITY INSIGHTS FUNDS
Goldman Sachs’ International Equity Insights Investment Process

| ∎ | Comprehensive – We forecast returns on over 8,000 international stocks and 43 equity markets on a daily basis. |
| ∎ | Rigorous – We evaluate stocks, countries and currencies based on fundamental investment criteria that have outperformed historically. |
| ∎ | Objective – Our stock and equity market selection process is designed to be free from emotion that may lead to biased investment decisions. |

| ∎ | Our computer optimization process allocates risk to our high conviction investment ideas and constructs funds that strive to neutralize systematic risks and deliver better returns. |
| ∎ | We use proprietary risk models that are designed to be more precise, more focused and faster to respond because they seek to identify, track and manage risk specific to our process, using daily data. |

Fully invested, well-diversified international portfolio that seeks to:
| ∎ | Blend top-down market views with bottom-up stock selection. |
| ∎ | Maintain style, sector, risk and capitalization characteristics similar to the benchmark. |
| ∎ | Achieve excess returns by taking many small diversified stock positions. Additionally, in the Goldman Sachs Emerging Markets Equity Insights Fund and the Goldman Sachs International Equity Insights Fund we take intentional country bets. |
1
GOLDMAN SACHS INTERNATIONAL EQUITY INSIGHTS FUNDS
Enhancements Made to Proprietary Quantitative Model during the12-Month Period Ended October 31, 2019 |
We continuously look for ways to improve our investment process. Accordingly, we introduced a number of enhancements to our proprietary quantitative model during the12-month period ended October 31, 2019 (the “Reporting Period”).
During the first half of the Reporting Period, we enhanced existing signals within our Sentiment Analysis investment theme that use machine learning to help understand sell-side analyst sentiment. In the Japan region, we added a signal that uses consumer and retailer activity data to predict the sales of retailers and consumer goods companies. We extended an existing market sentiment signal to the U.K. investment region; the signal examines institutional investor activity to extract conviction positions. In addition, within our High Quality Business Models and Sentiment Analysis investment themes, we extended a suite of signals to the Japan region that use natural language processing on Japanese regulatory filings.
During the second half of the Reporting Period, we implemented a new signal within our Sentiment Analysis investment theme in the Europe, Japan and emerging markets regions. This new signal gauges investor conviction around future price declines for securities. We analyze more than 6,000 stocks to ascertain the difficulty in borrowing the security for the purposes of short selling. In addition, we expanded an existing signal within our Market Themes & Trends investment theme to the emerging markets region. The signal, which covers more than 7,000 stocks, identifies stocks collectively held by mutual funds in order to gauge their potentialco-movement resulting from investor activity. |
2
MARKET REVIEW
Goldman Sachs International Equity
Insights Funds
During the12-month period ended October 31, 2019 (the “Reporting Period”), emerging markets equities and international equities generated positive returns. Emerging markets equities overall slightly outperformed international markets equities.
Emerging Markets Equities
Emerging markets equities rallied during the Reporting Period, with the MSCI Emerging Markets Index (Net, USD, Unhedged) (the “MSCI EM Index”) posting a return of 11.86%.1
Following a challenging October 2018, emerging markets equities saw a brief reprieve as the Reporting Period began in November 2018 on dovish comments from U.S. Federal Reserve (“Fed”) Chair Jerome Powell, an accommodative stance by Chinese policymakers toward the private corporate sector and seemingly encouraging progress towardChina-U.S. trade talks. (Dovish language tends to suggest lower interest rates; opposite of hawkish.) However, the relief rally proved short-lived, as investors were unnerved in December 2018 by the arrest of a Chinese technology executive, a partial U.S. federal government shutdown and the U.S. President’s criticism of Fed Chair Powell. Emerging markets stocks also fell sharply on trade war escalations between the U.S. and China as well as on political uncertainty — and in a delayed response to an earliersell-off, or rise, in global interest rates. Though posting negative absolute returns, emerging markets equities outperformed their developed markets counterparts on a relative basis both for the month of December and for the fourth calendar quarter overall.
Emerging markets equities recovered during the first quarter of 2019, as three major headwinds subsided. First on trade, markets perceived progressing negotiations between the U.S. and China as constructive, decreasing some of the volatility previously caused by tariff uncertainty. Subsequently, China’s equity market regained some of the trade-related losses from the 2018 calendar year, with the MSCI China Index outperforming the MSCI EM Index by 778 basis pointsyear-to-date through March 2019. (A basis point is 1/100th of a percentage point.) Second, financial conditions became more supportive with the Fed taking a pause in its interest rate hiking cycle. Third, the economic pulse check, in the form of released macro data, showed emerging market Gross Domestic Product (“GDP”) growth returning to above-trend levels, while some developed markets countries saw their economic growth forecasts revised downward, though symptoms of a possible recession in the U.S. and other developed markets countries remained scarce. The healthy macroeconomic diagnosis for emerging markets generally was complemented by solid fundamentals, as markets expected 2019 earnings in emerging markets equity markets to grow more than twice as much as in the U.S. Despite the broader recovery, investors remained cautious around Indian equities, with general elections scheduled to commence in April 2019. Investors also remained cautious around Turkish equity markets, which were rattled by the overall economic downturn and by municipal elections at the end of March 2019.
Emerging markets equities notched solidly positive returns in April 2019, underpinned by robust fundamentals and supportive financial conditions, as the Fed maintained its pause in increasing U.S. interest rates. They then suffered a sharp decline in May 2019, from which they generally recovered in June 2019 while awaiting U.S.-China trade talks to reconvene at the G20 Summit. (The G20 (or Group of Twenty) is an international forum for the governments and central bank governors from 19 countries and the European Union. It was founded in 1999 with the aim of discussing policy pertaining to the promotion of international financial stability.) Negotiations had been halted in May 2019 following the increase of tariffs from 10% to 25% on $200 billion of Chinese goods by the U.S. This degradation of trade talks contributed to a volatile May 2019. On June 18, 2019, the U.S. President announced that he and the President of China would be meeting on the sidelines of the G20 Summit in Osaka, Japan on June 29th to discuss the ongoing trade impasse, resulting in an immediate positive market reaction. The result was both sides agreeing to restart negotiations and the U.S. agreeing to put plans for additional tariffs of 25% on all remaining imports from China on an indefinite hold. In an additional positive surprise, the U.S. agreed to lift restrictions it had put in place on Chinese technology firm Huawei, allowing it to purchase equipmentnon-threatening to U.S. national security from U.S. firms. The outcome of the G20 Summit was similar to that of the one held in Buenos Aires in 2018, which led to a temporary truce in trade tensions and a delay in raising tariffs.
Emerging markets equities started the third calendar quarter on a soft note, as in July 2019, despite their meeting in Shanghai, the U.S. and Chinese Presidents were unable to make any forward steps toward a trade deal. Emerging markets equities remained
| 1 | All Index returns are expressed in U.S. dollar terms. |
3
MARKET REVIEW
under pressure in August 2019, as the U.S. President announced a new round of tariffs on another $300 billion of Chinese goods, and China announced retaliatory tariffs on $75 billion of U.S. goods. Emerging markets equities then surged in September 2019, as optimism rose that both sides might soon be able to reach an agreement. Both countries exempted tariffs on the other throughout the month, with the U.S. also agreeing to delay its increase on $250 billion of Chinese imports. The Chinese equity market was able to eke out a modest increase in September, despite concerns of potential investment restrictions on the country. In line with market expectations, the U.S. Fed cut its interest rates by 25 basis points in both July and September 2019 — its first interest rate cuts since 2008 — although the consensus forecasted no further interest rate cuts in 2019. South Korea was the main driver of emerging markets equities’ performance in September, as it saw benefits from the drawdown in trade tensions. August was a strenuous month for India, as economic growth there slowed to asix-year low. In response, on September 20, 2019, India’s Finance Minister announced a surprise corporate tax rate cut — from a base rate of 30% to a new base rate of 22%. This announcement came as part of a series of measures undertaken by the Indian government to boost its economy and employment and to revive investor sentiment. This tax cut helped India’s equity market to gain in September 2019.
In October 2019, emerging markets equities generated positive returns, benefiting from seeming trade talk progress made between the U.S. and China during the month, as markets were then expecting some sort of official interim deal between the two parties in the foreseeable future. These expectations stemmed from an October 11, 2019 meeting in which the two sides reached a proposed “Phase One” deal, including China purchasing $40 to $50 billion of U.S. agricultural products annually and issuing new guidelines on how it manages its currency. Additionally, the U.S. announced it would further delay a tariff increase of 30% on $250 billion of Chinese goods. Indian equities continued their solid performance during the month, largely driven by continued economic momentum and earnings upgrades following its September corporate tax rate cut. At the end of October 2019, the U.S. Fed once again cut interest rates by 25 basis points, but it signaled a pause in its latest interest rate cutting cycle for the near term. Brazil also continued its monetary policy easing cycle, as its central bank cut that country’s interest rates for a third straight meeting following the passing of new pension reform that led to heightened hopes of a recovery for the country’s sluggish economy amid low inflation.
For the Reporting Period as a whole, information technology, consumer discretionary and real estate were the strongest sectors in the MSCI EM Index. Materials and health care were the only two sectors in the MSCI EM Index to post negative absolute returns during the Reporting Period.
From a country perspective, Russia was the best performing individual constituent of the MSCI EM Index for the Reporting Period, followed by Egypt, Taiwan, Greece, the Philippines and Indonesia, each of which posted a robust double-digit absolute gain. Conversely, Argentina was by far the weakest individual country constituent of the MSCI EM Index, followed by Pakistan, Chile and Saudi Arabia, each of which posted a double-digit decline during the Reporting Period.
International Equities
International equities advanced during the Reporting Period, with the MSCI Europe, Australasia, Far East (EAFE) Standard Index (Net, USD, Unhedged) (the “MSCI EAFE Index”) recording a return of 11.04%.1
When the Reporting Period began in November 2018, international equities gained on dovish comments from U.S. Fed Chair Jerome Powell, an accommodative stance by Chinese policymakers toward the private corporate sector and seemingly encouraging progress towardChina-U.S. trade talks. However, international equities then plunged in December on renewed investor risk aversion triggered by the arrest of a Chinese technology executive, a partial U.S. federal government shutdown and the U.S. President’s criticism of Fed Chair Powell. International stocks also fell sharply on trade war escalations between the U.S. and China as well as on political uncertainty — and in a delayed response to an earliersell-off, or increase, in global interest rates. Political uncertainty remained elevated in Europe, particularly surrounding the Italian fiscal budget and ongoing Brexit negotiations. (Brexit indicates the U.K.’s path out of the European Union.)
During the first quarter of 2019, international equities posted strongly positive returns, rebounding from previous losses across all regions. The Fed maintained its dovish stance amidst slower global economic growth, and significant progress appeared to be made in the trade talks between China and the U.S., paving the way for a potential resolution. European equities remained resilient,
| 1 | All Index returns are expressed in U.S. dollar terms. |
4
MARKET REVIEW
despite the overhang of Brexit and slowing economic data. The European Union extended the Brexit deadline beyond March 2019 in a bid to prevent a tumultuous exit. Japanese equities gained during the first calendar quarter, as fears around the extent of the global economic growth slowdown eased and the Japanese yen gradually weakened.
As the second calendar quarter began in April 2019, international equities continued to rally. European equity markets broke records for calm and quiet trading periods, with little variation through the month, and remained resilient despite the persistent overhang of Brexit and slowing economic data. After seeing the calendar year’s first decline during May 2019 due to investor concerns over the U.S.-China trade war, international equities bounced back in June 2019. Markets reacted positively after the U.S. and China declared a truce in their trade war and agreed to resume negotiations at the G20 Summit at the end of June. The U.S. agreed to hold off on imposing an additional $300 billion in tariffs and delay restrictions against Chinese technology firm Huawei, allowing U.S. companies to resume sales to the company. International developed equity markets were also supported by increasingly accommodative sentiment by several major central banks. The European equity markets were broadly higher for the second calendar quarter, as manufacturing indices indicated improving conditions. U.K. equity markets also performed well in spite of the ongoing uncertainty around Brexit negotiations. Japanese equity markets ended the second quarter of 2019 below other developed equity markets due to ongoing Japanese yen strength amidst increasing geopolitical volatility and as markets expected an easier monetary policy for the U.S. going forward. In June 2019, the truce between the U.S. and China brought in some respite for the Japanese equity markets, which continued to be supported by a recovering domestic economy, stronger capital spending and an increase in domestic demand resilience.
International equities edged down in the third quarter of 2019, with trade news continuing to dominate market movements along with increasing political uncertainty across most governments. The U.S. Fed cut its interest rates in July and September 2019 — its first interest rate cuts since 2008 — lowering rates by 25 basis points each time, as the economy showed signs of a slowdown, but the Fed did not commit to a more extended easing cycle. After witnessing a slowdown amidst weaker foreign demand, global tariff disputes and business uncertainty risk from Brexit, European equities gained toward the end of the quarter, as the European Central Bank (“ECB”) restarted quantitative easing measures. The ECB’s multi-dimensional monetary stimulus package sought to address a slowing Eurozone economic growth rate through deposit rate cuts and the reinstitution of asset purchases. However, departing ECB President Mario Draghi commented on the limitations of interest rate cuts, calling instead on fiscal stimulus to support economic growth, as he passed the baton of leadership to his successor Christine Lagarde, previously the President of the International Monetary Fund. Meanwhile, the U.K. Parliament regularly demonstrated it was not willing to allow the U.K. to leave the European Union without a trade deal. Ano-deal exit, therefore, remained unlikely unless a general election or referendum provided a mandate for it. Japan’s equity market witnessed a moderate recovery trend during the third calendar quarter, along with firmer economic fundamentals supporting domestic demand. The U.S. and Japan signed a “first stage” of a trade agreement aimed at achieving more fair and reciprocal trade between the two countries.
In October 2019, international equities advanced on generally upbeat third calendar quarter corporate earnings reports and easing geopolitical tensions, including seeming progress in U.S.-China trade negotiations. The U.S. Fed cut its interest rates for the third time in 2019, lowering the targeted federal funds rate range by an additional 25 basis points. However, Fed Chair Powell signaled another rate change was unlikely as long as conditions remained steady. European equity markets moved higher on positive third calendar quarter corporate earnings and unchanged ECB policy. Tensions regarding ano-deal Brexit receded, as the European Union extended the Brexit deadline until January 31, 2020. The European Union and the U.K. agreed to a “flextension” arrangement, under which the U.K. would be able to leave the European Union earlier than the stated deadline if a withdrawal agreement was ratified by the European Parliament and British Parliament in time. The euro and British pound strengthened against the U.S. dollar as investors remained optimistic for a potentially favorable U.K. Parliamentary vote for the Brexit deal. Japanese equities saw positive returns during October 2019, as Japan’s economy continued to recover. The U.S. and Japan signed a limited trade deal on agriculture and digital trade, which covered about $55 billion of commerce between the two economies. Also, during the month, Japan’s cabinet approved a draft legislation that will require overseas investors to report plans to purchase more than 1% of shares in companies related to Japan’s national security, compared to the existing 10% threshold. While the government plans to exclude asset management companies from these stricter rules, the exemption will not apply to foreign state-owned firms. The Bank of Japan stated it needs to monitor the impact of its recent sales tax hike and is also paying particular attention to the effect of the U.S. and China economies on Japan.
5
MARKET REVIEW
For the Reporting Period as a whole, utilities, information technology, health care and real estate were the strongest performing sectors in the MSCI EAFE Index, each producing a positive double-digit absolute return. The weakest performing sector in the MSCI EAFE Index and the only one to post a negative absolute return during the Reporting Period was energy. Financials, materials and communication services generated solid positive absolute returns but also lagged the MSCI EAFE Index during the Reporting Period.
From a country perspective, China, New Zealand and the Netherlands were the strongest performing constituents of the MSCI EAFE Index during the Reporting Period, each posting strong double-digit gains. The United Arab Emirates was by far the weakest individual country constituent of the MSCI EAFE Index during the Reporting Period, followed by Norway, Israel and Austria, each of which posted a negative absolute return.
Looking Ahead
At the end of the Reporting Period, we continued to believe that less expensive stocks should outpace more expensive stocks. In addition, we expected stocks with good momentum to outperform those with poor momentum. We plan to focus on seeking companies about which fundamental research analysts are becoming more positive as well as profitable companies with what we view as sustainable earnings and a track record of using their capital to enhance shareholder value. As such, we anticipate remaining fully invested, with long-term performance likely to be the result of stock selection rather than sector or capitalization allocations.
We stand behind our investment philosophy that sound economic investment principles, coupled with a disciplined quantitative approach, can provide strong, uncorrelated returns over the long term. Our research agenda is robust, and we continue to enhance our existing models, add new proprietary forecasting signals and improve our trading execution as we seek to provide the most value to our shareholders.
6
PORTFOLIO RESULTS
Goldman Sachs Emerging Markets Equity
Insights Fund
Investment Objective
The Fund seeks long-term growth of capital.
Portfolio Management Discussion and Analysis
Below, the Goldman Sachs Quantitative Investment Strategies Team discusses the Goldman Sachs Emerging Markets Equity Insights Fund’s (the “Fund”) performance and positioning for the12-month period ended October 31, 2019 (the “Reporting Period”).
| Q | How did the Fund perform during the Reporting Period? |
| A | During the Reporting Period, the Fund’s Class A, Class C, Institutional, Investor, Class P, Class R and Class R6 Shares generated average annual total returns, without sales charges, of 5.74%, 5.09%, 6.18%, 6.06%, 6.33%, 5.52%, 6.32%, respectively. These returns compare to the 11.86% average annual total return of the Fund’s benchmark, the MSCI Emerging Markets Standard Index (Net, USD, Unhedged) (the “Index”), during the same period. |
| Q | What key factors were most responsible for the Fund’s performance during the Reporting Period? |
| A | The Fund uses a quantitative style of management, in combination with a qualitative overlay, that emphasizes fundamentally-based stock and country/currency selection, careful portfolio construction and efficient implementation. To manage the Fund, we use two distinct strategies — abottom-up stock selection strategy and atop-down country/currency selection strategy. These strategies are uncorrelated, that is, they tend to perform independently of each other over time, which enables us to greater diversify the portfolio. |
During the Reporting Period, the Fund underperformed the Index, with our stock selection strategy detracting from performance. Our country/currency strategy added to relative returns. |
| Q | Which investment themes helped and which hurt within the Team’s stock selection strategy? |
| A | In keeping with our investment approach, we use our quantitative model and four investment themes to take a long-term view of market patterns and look for inefficiencies, selecting stocks for the Fund and overweighting or underweighting the ones chosen by the model. Over time and by design, the performance of any one of the model’s investment themes tends to have a low correlation with the model’s other themes, demonstrating the diversification benefit of the Fund’s theme-driven quantitative model. The variance in performance supports our research indicating that the diversification provided by our different investment themes is a significant investment advantage over the long term, even though the Fund may experience underperformance in the short term. Of course, diversification does not protect an investor from market risk nor does it ensure a profit. |
During the Reporting Period, all four of our investment themes detracted from the Fund’s relative performance. Fundamental Mispricings and Market Themes & Trends were the Fund’s worst-performing investment themes. Our High Quality Business Models and Sentiment Analysis investment themes also diminished returns, though to a lesser extent. Fundamental Mispricings seeks to identify high quality businesses trading at a fair price, which we believe may lead to strong performance over the long run. Market Themes & Trends seeks to identify companies positively positioned to benefit from themes and trends in the market and macroeconomic environment. High Quality Business Models seeks to identify companies that are generating high quality revenues with sustainable business models and aligned management incentives. Sentiment Analysis seeks to identify stocks experiencing improvements in their overall market sentiment. |
| Q | How did the Fund’s sector and industry allocations affect relative results? |
| A | In constructing the portfolio, we focus on picking stocks rather than on making sector or industry bets. Consequently, the Fund is similar to the Index in terms of its sector and industry allocations and its style. Changes in its sector or industry weights generally do not have a meaningful impact on relative returns. |
7
PORTFOLIO RESULTS
| Q | Did stock selection help or hurt Fund performance during the Reporting Period? |
| A | We seek to outpace the Index by overweighting stocks we expect to outperform and underweighting those we think may lag. At the same time, we strive to maintain a risk profile similar to the Index. The Fund’s investments are selected using fundamental research and a variety of quantitative techniques based on our investment themes. For example, the Fund aims to hold a basket of stocks with better Fundamental Mispricings characteristics than the Index. |
During the Reporting Period, stock selection hampered the Fund’s relative results, with investments in the consumer staples sector detracting most. Selection in the energy and financials sectors also had a negative effect on results. On the positive side, the Fund benefited from stock selection in the materials and real estate sectors during the Reporting Period. |
| Q | Which individual stock positions detracted most from the Fund’s relative returns during the Reporting Period? |
| A | In terms of individual stock positions, the Fund was hurt during the Reporting Period by its overweights relative to the Index in GAIL, an Indian state-owned natural gas processing and distribution company, and Alrosa, a Russian diamond mining company. We overweighted both stocks due mainly to our Market Themes & Trends and Fundamental Mispricings investment themes. An underweight in Gazprom, a Russian natural gas producer and pipeline operator, also detracted from relative returns. Our Market Themes & Trends and High Quality Business Models investment themes were largely responsible for the Fund’s underweight in Gazprom. |
| Q | Which individual stock positions contributed most to the Fund’s relative returns during the Reporting Period? |
| During the Reporting Period, the Fund was helped by its underweight positions in Vale, a Brazilian metals and mining company and logistics operator, and in Baidu, a Chinese artificial intelligence and Internet company. Both of these underweights were mainly the result of our Market Themes & Trends and Fundamental Mispricings investment themes. An overweight position in Anglo American Platinum, a South Africa-based mining company, also contributed positively. We established the overweight in Anglo American Platinum primarily because of our Market Themes & Trends investment themes. |
| Q | What impact did the Team’s country/currency selection strategy have on the Fund’s relative performance during the Reporting Period? |
| A | Our country/currency strategy added to the Fund’s relative returns. During the Reporting Period, the Fund benefited from its overweight compared to the Index in Brazil and from its underweights in Taiwan and Saudi Arabia. Conversely, the Fund was hurt by its overweights in India and South Korea. |
We made our picks using our proprietary models, which, during the Reporting Period, were based on three investment themes specific to our country/currency strategy — Valuation, Risk Premium and Macro. Valuation favors equity and currency markets that appear cheap relative to accounting measures of value and purchasing power. Risk Premium evaluates whether a country is overcompensating investors for various types of risk. Macro assesses a market’s macroeconomic environment and growth prospects. |
| Q | How did the Fund use derivatives and similar instruments during the Reporting Period? |
| A | During the Reporting Period, we used futures contracts to equitize the Fund’s cash holdings. In other words, we put the Fund’s cash holdings to work by using them as collateral for the purchase of futures contracts. The use of these derivatives did not have a material impact on Fund results during the Reporting Period. |
| Q | What changes did you make to the Fund’s country weightings during the Reporting Period? |
| A | During the Reporting Period, we shifted the Fund from an overweight relative to the Index in India to a rather neutral position. We reduced the Fund’s overweight in China and increased its overweight in South Korea. Compared to the Index, we changed within the Fund from a rather neutral position in Indonesia to an overweight. We shifted the Fund from an underweight in Taiwan to a relatively neutral position. We also increased the Fund’s underweight in Malaysia during the Reporting Period. |
| Q | What were the Fund’s sector and country weightings at the end of the Reporting Period? |
| A | At the end of the Reporting Period, the Fund was overweight relative to the Index in the information technology, consumer discretionary, industrials and utilities sectors. Compared to the Index, the Fund was underweight the communication services, financials, health care, energy and consumer staples sectors. It was rather neutral versus the Index in the materials |
8
PORTFOLIO RESULTS
and real estate sectors at the conclusion of the Reporting Period. |
In terms of countries, the Fund was overweight relative to the Index in Indonesia, Mexico, South Korea, China and Turkey. Compared to the Index, the Fund was underweight Malaysia, South Africa and Saudi Arabia. The Fund was relatively neutral in Brazil, Taiwan, Qatar, India, the Philippines, Poland, Thailand, United Arab Emirates, Chile, Colombia, Peru, Hungary, Russia, Greece, Argentina, Egypt, Czech Republic and Pakistan at the end of the Reporting Period. |
9
FUND BASICS
Emerging Markets Equity Insights Fund
as of October 31, 2019
| TOP TEN HOLDINGS AS OF 10/31/191 | ||||||||||
| Holding | % of Net Assets | Line of Business | Country | |||||||
| Taiwan Semiconductor Manufacturing Co. Ltd. ADR | 3.1 | % | Semiconductors & Semiconductor Equipment | Taiwan | ||||||
| Alibaba Group Holding Ltd. ADR | 3.1 | Retailing | China | |||||||
| Samsung Electronics Co. Ltd. | 3.0 | Technology Hardware & Equipment | South Korea | |||||||
| Tencent Holdings Ltd. | 2.8 | Media & Entertainment | China | |||||||
| Ping An Insurance Group Co. of China Ltd. Class H | 2.0 | Insurance | China | |||||||
| SK Hynix, Inc. | 1.9 | Semiconductors & Semiconductor Equipment | South Korea | |||||||
| LUKOIL PJSC ADR | 1.8 | Energy | Russia | |||||||
| Bank Rakyat Indonesia Persero Tbk. PT | 1.8 | Banks | Indonesia | |||||||
| Telekomunikasi Indonesia Persero Tbk. PT | 1.7 | Telecommunication Services | Indonesia | |||||||
| PICC Property & Casualty Co. Ltd. Class H | 1.7 | Insurance | China | |||||||
| 1 | The top 10 holdings may not be representative of the Fund’s future investments. |
| FUND VS. BENCHMARK SECTOR ALLOCATIONS2 |
| As of October 31, 2019 |
| 2 | The Fund is actively managed and, as such, its composition may differ over time. Consequently, the Fund’s overall sector allocations may differ from percentages contained in the graph above. The graph categorizes investments using Global Industry Classification Standard (“GICS”); however, the sector classifications used by the portfolio management team may differ from GICS. The percentage shown for each investment category reflects the value of investments in that category as a percentage of market value (excluding investments in the securities lending reinvestment vehicle, if any). |
For more information about your Fund, please refer to www.GSAMFUNDS.com. There, you can learn more about your Fund’s investment strategies, holdings, and performance.
10
GOLDMAN SACHS EMERGING MARKETS EQUITY INSIGHTS FUND
Performance Summary
October 31, 2019
The following graph shows the value, as of October 31, 2019, of a $1,000,000 investment made on November 1, 2009 in Institutional Shares at NAV. For comparative purposes, the performance of the Fund’s benchmark, the MSCI® Emerging Markets Standard Index (the “MSCI® EM Index”) (Net, USD, unhedged), is shown. Performance reflects applicable fee waivers and/or expense limitations in effect during the periods shown and in their absence, performance would be reduced. Returns do not reflect the deduction of taxes that a shareholder would pay on Fund distributions or the redemption of Fund shares. The returns set forth below represent past performance. Past performance does not guarantee future results. The Fund’s investment return and principal value will fluctuate so that an investor’s shares, when redeemed, may be worth more or less than their original cost. Current performance may be lower or higher than the performance quoted below. Please visit our web site at www.GSAMFUNDS.com to obtain the most recent month-end returns.
| Emerging Markets Equity Insights Fund’s 10 Year Performance |
Performance of a $1,000,000 Investment, with distributions reinvested, from November 1, 2009 through October 31, 2019.
| Average Annual Total Return through October 31, 2019* | One Year | Five Years | Ten Years | Since Inception | ||||||||||
Class A | ||||||||||||||
Excluding sales charges | 5.74% | 3.00% | 4.40% | — | ||||||||||
Including sales charges | -0.05% | 1.85% | 3.81% | — | ||||||||||
| ||||||||||||||
Class C | ||||||||||||||
Excluding contingent deferred sales charges | 5.09% | 2.25% | 3.63% | — | ||||||||||
Including contingent deferred sales charges | 4.08% | 2.25% | 3.63% | — | ||||||||||
| ||||||||||||||
Institutional | 6.18% | 3.42% | 4.82% | — | ||||||||||
| ||||||||||||||
Investor (Commenced August 31, 2010) | 6.06% | 3.28% | N/A | 4.21% | ||||||||||
| ||||||||||||||
Class P (Commenced April 16, 2018) | 6.33% | N/A | N/A | -7.88% | ||||||||||
| ||||||||||||||
Class R (Commenced February 28, 2014) | 5.52% | 2.77% | N/A | 3.87% | ||||||||||
| ||||||||||||||
Class R6 (Commenced July 31, 2015) | 6.32% | N/A | N/A | 5.04% | ||||||||||
| ||||||||||||||
| * | These returns assume reinvestment of all distributions at NAV and reflect a maximum initial sales charge of 5.50% for Class A and the assumed contingent deferred sales charge for Class C Shares (1% if redeemed within 12 months of purchase). Because Institutional, Investor, Class P, Class R and Class R6 Shares do not involve a sales charge, such a charge is not applied to their Average Annual Total Return. |
11
PORTFOLIO RESULTS
Goldman Sachs International Equity Insights Fund
Investment Objective
The Fund seeks long-term growth of capital.
Portfolio Management Discussion and Analysis
Below, the Goldman Sachs Quantitative Investment Strategies Team discusses the Goldman Sachs International Equity Insights Fund’s (the “Fund”) performance and positioning for the12-month period ended October 31, 2019 (the “Reporting Period”).
| Q | How did the Fund perform during the Reporting Period? |
| A | During the Reporting Period, the Fund’s Class A, Class C, Institutional, Service, Investor, Class P, Class R and Class R6 Shares generated average annual total returns, without sales charges, of 6.58%, 5.79%, 7.07%, 6.45%, 6.90%, 7.03%, 6.36% and 7.10%, respectively. These returns compare to the 11.04% average annual total return of the Fund’s benchmark, the MSCI EAFE Standard Index (Net, USD, Unhedged) (the “Index”), during the same period. |
| Q | What key factors were most responsible for the Fund’s performance during the Reporting Period? |
| A | The Fund uses a quantitative style of management, in combination with a qualitative overlay, that emphasizes fundamentally-based stock and country/currency selection, careful portfolio construction and efficient implementation. To manage the Fund, we use two distinct strategies — abottom-up stock selection strategy and atop-down country/currency selection strategy. These strategies are uncorrelated, that is, they tend to perform independently of each other over time, which enables us to greater diversify the portfolio. |
During the Reporting Period, the Fund underperformed the Index, with our stock selection strategy and country/currency strategy both detracting from performance. |
| Q | Which investment themes helped and which hurt within the Team’s stock selection strategy? |
| A | In keeping with our investment approach, we use our quantitative model and four investment themes to take a long-term view of market patterns and look for inefficiencies, selecting stocks for the Fund and overweighting or underweighting the ones chosen by the model. Over time and by design, the performance of any one of the model’s investment themes tends to have a low correlation with the model’s other themes, demonstrating the diversification benefit of the Fund’s theme-driven quantitative model. The variance in performance supports our research indicating that the diversification provided by our different investment themes is a significant investment advantage over the long term, even though the Fund may experience underperformance in the short term. Of course, diversification does not protect an investor from market risk nor does it ensure a profit. |
During the Reporting Period, all four of our investment themes — Fundamental Mispricings, Market Themes & Trends, High Quality Business Models and Sentiment Analysis — detracted from the Fund’s relative performance. Fundamental Mispricings seeks to identify high quality businesses trading at a fair price, which we believe may lead to strong performance over the long run. Market Themes & Trends seeks to identify companies positively positioned to benefit from themes and trends in the market and macroeconomic environment. High Quality Business Models seeks to identify companies that are generating high quality revenues with sustainable business models and aligned management incentives. Sentiment Analysis seeks to identify stocks experiencing improvements in their overall market sentiment. |
| Q | How did the Fund’s sector and industry allocations affect relative results? |
| A | In constructing the portfolio, we focus on picking stocks rather than on making sector or industry bets. Consequently, the Fund is similar to the Index in terms of its sector and industry allocations and its style. Changes in its sector or industry weights generally do not have a meaningful impact on relative returns. |
12
PORTFOLIO RESULTS
| Q | Did stock selection help or hurt Fund performance during the Reporting Period? |
| A | We seek to outpace the Index by overweighting stocks we expect to outperform and underweighting those we think may lag. At the same time, we strive to maintain a risk profile similar to the Index. The Fund’s investments are selected using fundamental research and a variety of quantitative techniques based on our investment themes. For example, the Fund aims to hold a basket of stocks with better Fundamental Mispricings characteristics than the Index. |
During the Reporting Period, stock selection overall detracted from the Fund’s relative performance, primarily investments in the health care, consumer staples and communication services sectors. Conversely, the Fund benefited from stock selection in the information technology sector during the Reporting Period. |
| Q | Which individual stock positions detracted most from the Fund’s relative returns during the Reporting Period? |
| A | In terms of individual stock positions, the Fund was hurt during the Reporting Period by an underweight compared to the Index in Nestle, a Switzerland-based food and beverage company. We established the underweight in Nestle mostly because of our High Quality Business Models investment theme. Overweight positions in ProSiebenSat.1 Media, a German-based mass media company, and Eisai, a Japanese pharmaceutical company, also diminished the Fund’s relative returns. The overweight in ProSiebenSat.1 Media was largely the result of our Fundamental Mispricings, Sentiment Analysis and Market Themes & Trends investment themes. We chose to overweight Eisai mainly because of our High Quality Business Models investment theme. |
| Q | Which individual stock positions contributed most to the Fund’s relative returns during the Reporting Period? |
| A | During the Reporting Period, the Fund was helped by overweight positions in Fujitsu, a Japanese information technology company, and BE Semiconductor Industries, a Dutch manufacturer of semiconductor equipment. The overweight in Fujitsu was mostly due to our Fundamental Mispricings and Market Themes & Trends investment themes, while we adopted the overweight in BE Semiconductor Industries primarily due to our Market Themes & Trends and Fundamental Mispricings investment themes. An underweight in AIA Group, a Hong Kong-based life insurance company, also bolstered the Fund’s relative performance. The Fund was overweight AIA Group based largely on our Market Themes & Trends and High Quality Business Models investment themes. |
| Q | What impact did the Team’s country/currency selection strategy have on the Fund’s relative performance during the Reporting Period? |
| A | Our country/currency selection strategy detracted from the Fund’s relative returns during the Reporting Period. Compared to the Index, the Fund was hampered by a significant overweight in Japan, along with a slight overweight in Australia and a rather neutral position in Germany. On the positive side, the Fund benefited from its overweight in the Netherlands. Underweight positions in Hong Kong and Finland added further to the Fund’s relative performance. |
We made our picks using our proprietary models, which, during the Reporting Period, were based on five investment themes specific to our country/currency strategy — Valuation, Momentum, Risk Premium, Fund Flows and Macro. Valuation favors equity and currency markets that appear cheap relative to accounting measures of value and purchasing power. Momentum favors countries and currencies that have had strong recent outperformance. Risk Premium evaluates whether a country is overcompensating investors for various types of risk, while Fund Flows evaluates the strength of capital market inflows. Finally, Macro assesses a market’s macroeconomic environment and growth prospects. |
| Q | How did the Fund use derivatives and similar instruments during the Reporting Period? |
| A | During the Reporting Period, we used futures contracts to equitize the Fund’s cash holdings. In other words, we put the Fund’s cash holdings to work by using them as collateral for the purchase of futures contracts. The use of these derivatives did not have a material impact on Fund results during the Reporting Period. |
| Q | What changes did you make to the Fund’s country weightings during the Reporting Period? |
| A | During the Reporting Period, we moved the Fund from an overweight position versus the Index in Japan to an underweight position and changed the Fund’s overweight in Australia to a rather neutral position. Compared to the Index, we increased the Fund’s overweight in the Netherlands. We shifted the Fund from an underweight in France to a relatively neutral position. In addition, we moved the Fund |
13
PORTFOLIO RESULTS
from an underweight in Switzerland to an overweight position and from rather neutral positions in Italy and Norway to overweight positions. We changed the Fund’s relatively neutral position in Hong Kong to an underweight position during the Reporting Period. |
| Q | What were the Fund’s sector and country weightings at the end of the Reporting Period? |
| A | At the end of the Reporting Period, the Fund was overweight relative to the Index in the information technology, financials, industrials and energy sectors. Compared to the Index, the Fund was underweight the communication services, consumer discretionary and utilities sectors. The Fund was relatively neutral versus the Index in the health care, consumer staples, real estate and materials sectors at the end of the Reporting Period. |
In terms of countries, the Fund was overweight relative to the Index in the Netherlands, Italy, Norway, Switzerland and Sweden at the end of the Reporting Period. Compared to the Index, the Fund was underweight Hong Kong, the U.K. and Japan. The Fund was relatively neutral to the Index in France, Spain, Singapore, Israel, Ireland, Belgium, Denmark, Germany, Australia, Austria, New Zealand, Portugal and Finland at the end of the Reporting Period. |
14
FUND BASICS
International Equity Insights Fund
as of October 31, 2019
| TOP TEN HOLDINGS AS OF 10/31/191,2 | ||||||||||
| Holding | % of Net Assets | Line of Business | Country | |||||||
| Roche Holding AG | 2.2 | % | Pharmaceuticals, Biotechnology & Life Sciences | Switzerland | ||||||
| Novartis AG (Registered) | 1.5 | Pharmaceuticals, Biotechnology & Life Sciences | Switzerland | |||||||
| Diageo plc | 1.4 | Food, Beverage & Tobacco | United Kingdom | |||||||
| Royal Dutch Shell plc Class A | 1.3 | Energy | Netherlands | |||||||
| Bayer AG (Registered) | 1.2 | Pharmaceuticals, Biotechnology & Life Sciences | Germany | |||||||
| Air Liquide SA | 1.1 | Materials | France | |||||||
| BNP Paribas SA | 1.1 | Banks | France | |||||||
| Schneider Electric SE | 1.0 | Capital Goods | France | |||||||
| Intesa Sanpaolo SpA | 1.0 | Banks | Italy | |||||||
| Kering SA | 1.0 | Consumer Durables & Apparel | France | |||||||
| 1 | The top 10 holdings may not be representative of the Fund’s future investments. |
| 2 | The Fund’s overall top 10 holdings differ from the table above due to the exclusion of the Goldman Sachs Financial Square Government Fund (a short-term investment fund), which represents approximately 1.0% of the Fund’s net assets as of 10/31/19. |
| FUND VS. BENCHMARK SECTOR ALLOCATIONS3 |
| As of October 31, 2019 |
| 3 | The Fund is actively managed and, as such, its composition may differ over time. Consequently, the Fund’s overall sector allocations may differ from percentages contained in the graph above. The graph categorizes investments using Global Industry Classification Standard (“GICS”); however, the sector classifications used by the portfolio management team may differ from GICS. The percentage shown for each investment category reflects the value of investments in that category as a percentage of market value (excluding investments in the securities lending reinvestment vehicle, if any). Investments in the securities lending reinvestment vehicle represented 1.0% of the Fund’s net assets at October 31, 2019. |
For more information about your Fund, please refer to www.GSAMFUNDS.com. There, you can learn more about your Fund’s investment strategies, holdings, and performance.
15
GOLDMAN SACHS INTERNATIONAL EQUITY INSIGHTS FUND
Performance Summary
October 31, 2019
The following graph shows the value, as of October 31, 2019, of a $1,000,000 investment made on November 1, 2009 in Institutional Shares at NAV. For comparative purposes, the performance of the Fund’s benchmark, the MSCI® EAFE Standard Index (Net, USD, Unhedged), is shown. Performance reflects applicable fee waivers and/or expense limitations in effect during the periods shown and in their absence, performance would be reduced. Returns do not reflect the deduction of taxes that a shareholder would pay on Fund distributions or the redemption of Fund shares. The returns set forth below represent past performance. Past performance does not guarantee future results. The Fund’s investment return and principal value will fluctuate so that an investor’s shares, when redeemed, may be worth more or less than their original cost. Current performance may be lower or higher than the performance quoted below. Please visit our web site at www.GSAMFUNDS.com to obtain the most recent month-end returns.
| International Equity Insights Fund’s 10 Year Performance |
Performance of a $1,000,000 Investment, with distributions reinvested, from November 1, 2009 through October 31, 2019.
| Average Annual Total Return through October 31, 2019* | One Year | Five Years | Ten Years | Since Inception | ||||||||||
Class A | ||||||||||||||
Excluding sales charges | 6.58% | 5.23% | 5.27% | — | ||||||||||
Including sales charges | 0.73% | 4.05% | 4.68% | — | ||||||||||
| ||||||||||||||
Class C | ||||||||||||||
Including sales charges | 5.79% | 4.44% | 4.48% | — | ||||||||||
Excluding contingent deferred sales charges | 4.78% | 4.44% | 4.48% | — | ||||||||||
| ||||||||||||||
Institutional | 7.07% | 5.64% | 5.69% | — | ||||||||||
| ||||||||||||||
Service | 6.45% | 5.09% | 5.15% | — | ||||||||||
| ||||||||||||||
Investor | 6.90% | 5.51% | 5.53% | — | ||||||||||
| ||||||||||||||
Class P (Commenced April 16, 2018) | 7.03% | N/A | N/A | -3.42% | ||||||||||
| ||||||||||||||
Class R | 6.36% | 4.96% | 5.02% | — | ||||||||||
| ||||||||||||||
Class R6 (Commenced July 31, 2015) | 7.10% | N/A | N/A | 5.01% | ||||||||||
| ||||||||||||||
| * | These returns assume reinvestment of all distributions at NAV and reflect a maximum initial sales charge of 5.50% for Class A and the assumed contingent deferred sales charge for Class C Shares (1% if redeemed within 12 months of purchase). Because Institutional, Investor, Service, Class P, Class R and Class R6 Shares do not involve a sales charge, such a charge is not applied to their Average Annual Total Return. |
16
PORTFOLIO RESULTS
Goldman Sachs International Small Cap Insights Fund
Investment Objective
The Fund seeks long-term growth of capital.
Portfolio Management Discussion and Analysis
Below, the Goldman Sachs Quantitative Investment Strategies Team discusses the Goldman Sachs International Small Cap Insights Fund’s (the “Fund”) performance and positioning for the12-month period ended October 31, 2019 (the “Reporting Period”).
| Q | How did the Fund perform during the Reporting Period? |
| A | During the Reporting Period, the Fund’s Class A, Class C, Institutional, Investor, Class P and Class R6 Shares generated average annual total returns, without sales charges, of 6.68%, 5.94%, 7.10%, 7.01%, 7.11% and 7.11%, respectively. These returns compare to the 8.82% average annual total return of the Fund’s benchmark, the MSCI EAFE Small Cap Index (Net, USD, Unhedged) (the “Index”), during the same period. |
| Q | What key factors were most responsible for the Fund’s performance during the Reporting Period? |
| A | The Fund uses a quantitative style of management, in combination with a qualitative overlay, that emphasizes fundamentally-based stock selection, careful portfolio construction and efficient implementation. The Fund’s investments are selected using fundamental research and a variety of quantitative techniques based on certain investment themes, including Fundamental Mispricings, High Quality Business Models, Sentiment Analysis and Market Themes & Trends. |
During the Reporting Period, the Fund underperformed the Index, with two of our quantitative model’s four investment themes detracting from results. Stock selection driven by these investment themes diminished relative returns. |
| Q | What impact did the Fund’s investment themes have on performance during the Reporting Period? |
| A | In keeping with our investment approach, we use our quantitative model and four investment themes to take a long-term view of market patterns and look for inefficiencies, selecting stocks for the Fund and overweighting or underweighting the ones chosen by the model. Over time and by design, the performance of any one of the model’s investment themes tends to have a low correlation with the model’s other themes, demonstrating the diversification benefit of the Fund’s theme-driven quantitative model. The variance in performance supports our research indicating that the diversification provided by our different investment themes is a significant investment advantage over the long term, even though the Fund may experience underperformance in the short term. Of course, diversification does not protect an investor from market risk nor does it ensure a profit. |
During the Reporting Period, two of our investment themes — High Quality Business Models and Market Themes & Trends — detracted from the Fund’s relative performance. High Quality Business Models seeks to identify companies that are generating high quality revenues with sustainable business models and aligned management incentives. Market Themes and Trends seeks to identify companies positively positioned to benefit from themes and trends in the market and macroeconomic environment. |
Our Sentiment Analysis and Fundamental Mispricings investment themes added modestly to the Fund’s relative returns. Sentiment Analysis seeks to identify stocks experiencing improvements in their overall market sentiment. Fundamental Mispricings seeks to identify high quality businesses trading at a fair price, which we believe may leads to strong performance over the long run. |
| Q | How did the Fund’s sector and industry allocations affect relative results? |
| A | In constructing the portfolio, we focus on picking stocks rather than on making sector or industry bets. Consequently, the Fund is similar to the Index in terms of its sector and industry allocations and its style. Changes in its sector or industry weights generally do not have a meaningful impact on relative returns. |
17
PORTFOLIO RESULTS
| Q | Did stock selection help or hurt Fund performance during the Reporting Period? |
| A | We seek to outpace the Index by overweighting stocks we expect to outperform and underweighting those we think may lag. At the same time, we strive to maintain a risk profile similar to the Index. The Fund’s investments are selected using fundamental research and a variety of quantitative techniques based on our investment themes. For example, the Fund aims to hold a basket of stocks with better Fundamental Mispricings characteristics than the Index. |
During the Reporting Period, stock selection hurt the Fund’s relative performance. The negative results were led by investments in the industrials sector and, to a lesser extent, the communication services and consumer staples sectors. Contributing positively were the Fund’s holdings in the financials, information technology and consumer discretionary sectors. |
| Q | Which individual stock positions detracted most from the Fund’s relative returns during the Reporting Period? |
| A | In terms of individual stock positions, the Fund was hampered during the Reporting Period by overweight positions relative to the Index in Fever-Tree Drinks, a U.K. producer of premium drink mixers; Northern Star Resources, an Australian gold producer; and ASR Nederland, a Dutch insurance group. The overweights in Fever-Tree Drinks and Northern Star Resources were driven by our High Quality Business Models, Market Themes & Trends and Sentiment Analysis investment themes. We decided to overweight ASR Nederland largely because of our Market Themes & Trends investment theme. |
| Q | Which individual stock positions contributed most to the Fund’s relative results during the Reporting Period? |
| A | During the Reporting Period, the Fund was helped by its overweight positions in Altium, a U.S.-Australian provider ofPC-based software for the design of printed circuit boards; Magellan Financial Group, an Australian fund management company; and BE Semiconductor Industries, a Dutch manufacturer of semiconductor equipment. The overweight in Altium was largely due to our High Quality Business Models and Market Themes & Trends investment themes. We established the overweight in Magellan Financial Group mainly because of our Market Themes & Trends and High Quality Business Models investment themes. Our Market Themes & Trends investment theme was the predominant reason the Fund was overweight BE Semiconductor Industries. |
| Q | What impact did country selection have on the Fund’s relative performance during the Reporting Period? |
| A | To construct the portfolio, we focus on security selection rather than on making country bets. As a result, the Fund is similar to the Index in terms of its country allocation; changes in its country weightings are generally the result of our stock picking. |
| Q | How did the Fund use derivatives and similar instruments during the Reporting Period? |
| A | During the Reporting Period, we used futures contracts to equitize the Fund’s cash holdings. In other words, we put the Fund’s cash holdings to work by using them as collateral for the purchase of futures contracts. The use of these derivatives did not have a material impact on Fund results during the Reporting Period. |
| Q | What changes did you make to the Fund’s country weightings during the Reporting Period? |
| A | As mentioned previously, changes in the Fund’s country weightings are generally the result of our stock picking. During the Reporting Period, the Fund’s overweights relative to the Index in Germany and Japan increased. Its overweights in Norway and Switzerland changed to rather neutral positions, and its relatively neutral position in the Netherlands changed to an overweight position. In addition, the Fund’s underweights in Israel and Belgium increased during the Reporting Period. |
| Q | What were the Fund’s sector and country weightings at the end of the Reporting Period? |
| A | At the end of the Reporting Period, the Fund was overweight relative to the Index in the consumer discretionary, information technology, health care and financials sectors. Compared to the Index, the Fund was underweight the materials, industrials, utilities, energy and communication services sectors. The Fund was relatively neutral compared to the Index in the consumer staples and real estate sectors at the end of the Reporting Period. |
In terms of countries, the Fund was overweight Japan, Germany and the Netherlands relative to the Index at the end of the Reporting Period. Compared to the Index, the Fund was underweight the U.K., Israel, Singapore and Belgium. It was relatively neutral compared to the Index in Sweden, New Zealand, France, Australia, Norway, Hong Kong, Ireland, Spain, Italy, Finland, Austria, Portugal, Denmark and Switzerland at the end of the Reporting Period. |
18
FUND BASICS
International Small Cap Insights Fund
as of October 31, 2019
| TOP TEN HOLDINGS AS OF 10/31/191 | ||||||||||
| Holding | % of Net Assets | Line of Business | Country | |||||||
| Merlin Properties Socimi SA (REIT) | 1.2 | % | Real Estate | Spain | ||||||
| TIS, Inc. | 1.2 | Software & Services | Japan | |||||||
| GN Store Nord A/S | 1.1 | Health Care Equipment & Services | Denmark | |||||||
| Bellway plc | 1.1 | Consumer Durables & Apparel | United Kingdom | |||||||
| IG Group Holdings plc | 1.1 | Diversified Financials | United Kingdom | |||||||
| Signify NV | 1.1 | Capital Goods | Netherlands | |||||||
| Great Portland Estates plc (REIT) | 1.0 | Real Estate | United Kingdom | |||||||
| ASR Nederland NV | 1.0 | Insurance | Netherlands | |||||||
| Flughafen Zurich AG (Registered) | 1.0 | Transportation | Switzerland | |||||||
| ASM International NV | 1.0 | Semiconductors & Semiconductor Equipment | Netherlands | |||||||
| 1 | The top 10 holdings may not be representative of the Fund’s future investments. |
| FUND VS. BENCHMARK SECTOR ALLOCATIONS2 |
| As of October 31, 2019 |
| 2 | The Fund is actively managed and, as such, its composition may differ over time. Consequently, the Fund’s overall sector allocations may differ from percentages contained in the graph above. The graph categorizes investments using Global Industry Classification Standard (“GICS”); however, the sector classifications used by the portfolio management team may differ from GICS. The percentage shown for each investment category reflects the value of investments in that category as a percentage of market value (excluding investments in the securities lending reinvestment vehicle, if any). Investments in the securities lending reinvestment vehicle represented 0.8% of the Fund’s net assets at October 31, 2019. The graph depicts the Fund’s investments but may not represent the Fund’s market exposure due to the exclusion of certain derivatives, if any, as listed in the Additional Investment Information section of the Schedule of Investments. |
For more information about your Fund, please refer to www.GSAMFUNDS.com. There, you can learn more about your Fund’s investment strategies, holdings, and performance.
19
GOLDMAN SACHS INTERNATIONAL SMALL CAP INSIGHTS FUND
Performance Summary
October 31, 2019
The following graph shows the value, as of October 31, 2019, of a $1,000,000 investment made on November 1, 2009 in Institutional Shares at NAV. For comparative purposes, the performance of the Fund’s benchmark, the MSCI® EAFE Small Cap Index (Net, USD, Unhedged), is shown. Performance reflects applicable fee waivers and/or expense limitations in effect during the periods shown and in their absence, performance would be reduced. Returns do not reflect the deduction of taxes that a shareholder would pay on Fund distributions or the redemption of Fund shares. The returns set forth below represent past performance. Past performance does not guarantee future results. The Fund’s investment return and principal value will fluctuate so that an investor’s shares, when redeemed, may be worth more or less than their original cost. Current performance may be lower or higher than the performance quoted below. Please visit our web site at www.GSAMFUNDS.com to obtain the most recent month-end returns.
| International Small Cap Insights Fund’s 10 Year Performance |
Performance of a $1,000,000 Investment, with distributions reinvested, from November 1, 2009 through October 31, 2019.
| Average Annual Total Return through October 31, 2019* | One Year | Five Years | Ten Years | Since Inception | ||||||||||
Class A | ||||||||||||||
Excluding sales charges | 6.68% | 6.47% | 8.66% | — | ||||||||||
Including sales charges | 0.81% | 5.28% | 8.04% | — | ||||||||||
| ||||||||||||||
Class C | ||||||||||||||
Including sales charges | 5.94% | 5.68% | 7.86% | — | ||||||||||
Excluding contingent deferred sales charges | 4.94% | 5.68% | 7.86% | — | ||||||||||
| ||||||||||||||
Institutional | 7.10% | 6.88% | 9.09% | — | ||||||||||
| ||||||||||||||
Investor (Commenced August 31, 2010) | 7.01% | 6.74% | N/A | 9.55% | ||||||||||
| ||||||||||||||
Class P (Commenced April 16, 2018) | 7.11% | N/A | N/A | -5.39% | ||||||||||
| ||||||||||||||
Class R6 (Commenced July 31, 2015) | 7.11% | N/A | N/A | 5.73% | ||||||||||
| ||||||||||||||
| * | These returns assume reinvestment of all distributions at NAV and reflect a maximum initial sales charge of 5.50% for Class A and the assumed contingent deferred sales charge for Class C Shares (1% if redeemed within 12 months of purchase). Because Institutional, Investor, Class P and Class R6 Shares do not involve a sales charge, such a charge is not applied to their Average Annual Total Return. |
20
FUND BASICS
Index Definitions
MSCI China Index captures large and mid cap representation across China H shares, B shares, Red chips, P chips and foreign listings.
The MSCI Emerging Markets Standard Index (Net, USD, Unhedged) is a free float-adjusted market capitalization index that is designed to measure equity market performance of emerging markets. As of October 31, 2019, the MSCI® Emerging Markets Standard Index (Net, USD, Unhedged) consists of the following 26 emerging market country indices: Argentina, Brazil, Chile, China, Colombia, Czech Republic, Egypt, Greece, Hungary, India, Indonesia, Korea, Malaysia, Mexico, Pakistan, Peru, Philippines, Poland, Qatar, Russia, Saudi Arabia, South Africa, Taiwan, Thailand, Turkey and United Arab Emirates. The MSCI® Emerging Markets Standard Index (Net, USD, Unhedged) figures do not reflect any deduction for fees, expenses or taxes. It is not possible to invest directly in an index.
The MSCI® EAFE Standard Index (Net, USD, Unhedged) is a market capitalization weighted composite of securities in 21 developed markets. As of October 31, 2019, the MSCI® EAFE Standard Index (Net, USD, Unhedged) consists of the following 21 developed countries: Australia, Austria, Belgium, Denmark, Finland, France, Germany, Hong Kong, Ireland, Israel, Italy, Japan, the Netherlands, New Zealand, Norway, Portugal, Singapore, Spain, Sweden, Switzerland and the United Kingdom. The MSCI® EAFE Standard Index (Net, USD, Unhedged) figures do not reflect any deduction for fees, expenses or taxes. It is not possible to invest directly in an index.
The MSCI® EAFE Small Cap Index (Net, USD, Unhedged) is a free float-adjusted market capitalization index that is designed to measure developed market equity performance, excluding the U.S. and Canada. The MSCI® EAFE Small Cap Index (Net, USD, Unhedged) selects the most liquid securities across developed markets relative to their market capitalization, and targets for index inclusion 40% of the full market capitalization of the eligible small cap universe within each industry group, within each country. Its returns include net reinvested dividends but, unlike Fund returns, do not reflect the payment of sales commissions or other expenses incurred in the purchase or sale of the securities included in the MSCI® EAFE Small Cap Index (Net, USD, Unhedged). It is not possible to invest directly in an index.
It is not possible to invest directly in an unmanaged index.
21
GOLDMAN SACHS EMERGING MARKETS EQUITY INSIGHTS FUND
October 31, 2019
| Shares | Description | Value | ||||||
| Common Stocks – 99.8% | ||||||||
| Brazil – 8.4% | ||||||||
| 87,600 | AES Tiete Energia SA (Utilities)* | $ | 255,778 | |||||
| 327,800 | Alpargatas SA (Preference) (Consumer Durables & Apparel)*(a) | 2,226,474 | ||||||
| 3,800 | Arezzo Industria e Comercio SA (Consumer Durables & Apparel) | 55,998 | ||||||
| 2,470,000 | Banco do Brasil SA (Banks)* | 29,654,781 | ||||||
| 1,507,400 | Banco do Estado do Rio Grande do Sul SA (Preference) Class B (Banks)(a) | 8,404,305 | ||||||
| 357,400 | Cia de Saneamento de Minas Gerais-COPASA (Utilities)* | 6,014,444 | ||||||
| 188,114 | Cia de Saneamento do Parana (Utilities) | 4,277,770 | ||||||
| 238,340 | Cia de Saneamento do Parana (Preference) (Utilities)(a) | 1,079,231 | ||||||
| 1,982,984 | Cia de Transmissao de Energia Eletrica Paulista (Preference) (Utilities)(a) | 11,654,141 | ||||||
| 544,200 | Cia Energetica de Minas Gerais ADR (Utilities) | 1,828,512 | ||||||
| 778,900 | Cia Hering (Consumer Durables & Apparel) | 6,111,952 | ||||||
| 210,130 | Cia Paranaense de Energia (Preference) (Utilities)(a) | 2,916,828 | ||||||
| 1,618,040 | Construtora Tenda SA (Consumer Durables & Apparel) | 9,525,477 | ||||||
| 465,500 | Cosan Ltd. Class A (Energy)* | 7,829,710 | ||||||
| 131,300 | Cosan SA (Energy) | 1,891,990 | ||||||
| 1,697,200 | Cyrela Brazil Realty SA Empreendimentos e Participacoes (Consumer Durables & Apparel) | 11,396,483 | ||||||
| 162,600 | Ez Tec Empreendimentos e Participacoes SA (Consumer Durables & Apparel) | 1,670,395 | ||||||
| 1,264,000 | Itausa – Investimentos Itau SA (Preference) (Banks)(a) | 4,321,017 | ||||||
| 1,634,600 | MRV Engenharia e Participacoes SA (Consumer Durables & Apparel) | 7,169,334 | ||||||
| 166,900 | Odontoprev SA (Health Care Equipment & Services) | 615,497 | ||||||
| 1,672,300 | Petrobras Distribuidora SA (Retailing) | 11,792,206 | ||||||
| 222,454 | Porto Seguro SA (Insurance) | 3,183,857 | ||||||
| 1,190,100 | Telefonica Brasil SA ADR (Telecommunication Services) | 15,673,617 | ||||||
| 33,760 | TIM Participacoes SA ADR (Telecommunication Services) | 477,704 | ||||||
|
| |||||||
| 150,027,501 | ||||||||
|
| |||||||
| Chile – 0.4% | ||||||||
| 3,784,222 | AES Gener SA (Utilities) | 811,342 | ||||||
| 3,165,258 | Banco de Chile (Banks) | 407,209 | ||||||
| 313,648 | Cia Cervecerias Unidas SA ADR (Food, Beverage & Tobacco) | 6,225,913 | ||||||
| 2,185,060 | Colbun SA (Utilities) | 377,591 | ||||||
|
| |||||||
| 7,822,055 | ||||||||
|
| |||||||
| Common Stocks – (continued) | ||||||||
| China – 33.0% | ||||||||
| 5,536,000 | Agricultural Bank of China Ltd. Class H (Banks) | 2,278,085 | ||||||
| 309,600 | Alibaba Group Holding Ltd. ADR (Retailing)* | 54,697,032 | ||||||
| 4,183,000 | Anhui Conch Cement Co. Ltd. Class H (Materials) | 25,000,667 | ||||||
| 1,417,000 | ANTA Sports Products Ltd. (Consumer Durables & Apparel) | 13,861,266 | ||||||
| 3,947,000 | Asia Cement China Holdings Corp. (Materials) | 4,786,527 | ||||||
| 53,501,000 | Bank of China Ltd. Class H (Banks) | 21,816,913 | ||||||
| 40,774,000 | Bank of Communications Co. Ltd. Class H (Banks) | 27,846,509 | ||||||
| 10,822,596 | Bank of Nanjing Co. Ltd. Class A (Banks) | 13,264,299 | ||||||
| 1,443,768 | Bank of Shanghai Co. Ltd. Class A (Banks) | 1,912,804 | ||||||
| 2,205,000 | Beijing Enterprises Holdings Ltd. (Utilities) | 10,382,018 | ||||||
| 4,882,000 | China Aoyuan Group Ltd. (Real Estate) | 6,238,855 | ||||||
| 181,000 | China CITIC Bank Corp. Ltd. Class H (Banks) | 104,919 | ||||||
| 2,090,000 | China Lesso Group Holdings Ltd. (Capital Goods) | 2,158,166 | ||||||
| 2,479,000 | China Life Insurance Co. Ltd. Class H (Insurance) | 6,375,223 | ||||||
| 299,000 | China Minsheng Banking Corp. Ltd. Class H (Banks) | 209,142 | ||||||
| 12,398,000 | China National Building Material Co. Ltd. Class H (Materials) | 10,449,331 | ||||||
| 692,701 | China Pacific Insurance Group Co. Ltd. Class A (Insurance) | 3,391,101 | ||||||
| 7,115,000 | China Pacific Insurance Group Co. Ltd. Class H (Insurance) | 25,815,275 | ||||||
| 3,990,000 | China Resources Land Ltd. (Real Estate) | 16,968,983 | ||||||
| 26,394,000 | China Telecom Corp. Ltd. Class H (Telecommunication Services) | 11,228,236 | ||||||
| 5,918,000 | China Tower Corp. Ltd. Class H (Telecommunication Services)(b) | 1,302,510 | ||||||
| 758,800 | China Yangtze Power Co. Ltd. Class A (Utilities) | 1,925,214 | ||||||
| 742,000 | China Yongda Automobiles Services Holdings Ltd. (Retailing) | 629,986 | ||||||
| 1,176,663 | Chinese Universe Publishing and Media Group Co. Ltd. Class A (Media & Entertainment) | 1,986,724 | ||||||
| 947,000 | Chongqing Rural Commercial Bank Co. Ltd. Class H (Banks) | 505,459 | ||||||
| 2,814,000 | CITIC Telecom International Holdings Ltd. (Telecommunication Services) | 1,068,141 | ||||||
| 31,400 | ENN Energy Holdings Ltd. (Utilities) | 358,228 | ||||||
|
| |||||||
| 22 | The accompanying notes are an integral part of these financial statements. |
GOLDMAN SACHS EMERGING MARKETS EQUITY INSIGHTS FUND
| Shares | Description | Value | ||||||
| Common Stocks – (continued) | ||||||||
| China – (continued) | ||||||||
| 3,010,000 | Far East Horizon Ltd. (Diversified Financials) | $ | 2,849,697 | |||||
| 165,557 | Financial Street Holdings Co. Ltd. Class A (Real Estate) | 184,770 | ||||||
| 820,000 | Great Wall Motor Co. Ltd. Class H (Automobiles & Components) | 664,406 | ||||||
| 1,094,820 | Gree Electric Appliances, Inc. of Zhuhai Class A (Consumer Durables & Apparel) | 9,133,312 | ||||||
| 37,720,000 | Industrial & Commercial Bank of China Ltd. Class H (Banks) | 27,022,355 | ||||||
| 948,100 | JD.com, Inc. ADR (Retailing)* | 29,533,315 | ||||||
| 6,560,000 | Jiangsu Expressway Co. Ltd. Class H (Transportation) | 8,715,282 | ||||||
| 5,466,500 | KWG Group Holdings Ltd. (Real Estate)* | 5,504,667 | ||||||
| 4,866,000 | Logan Property Holdings Co. Ltd. (Real Estate) | 7,410,823 | ||||||
| 1,514,000 | Longfor Group Holdings Ltd. (Real Estate)(b) | 6,283,331 | ||||||
| 81,509 | Luzhou Laojiao Co. Ltd. Class A (Food, Beverage & Tobacco) | 1,008,522 | ||||||
| 39,200 | NetEase, Inc. ADR (Media & Entertainment) | 11,205,712 | ||||||
| 604,500 | New China Life Insurance Co. Ltd. Class H (Insurance) | 2,346,171 | ||||||
| 23,894,000 | PICC Property & Casualty Co. Ltd. Class H (Insurance) | 30,238,315 | ||||||
| 3,137,000 | Ping An Insurance Group Co. of China Ltd. Class H (Insurance) | 36,206,598 | ||||||
| 433,300 | SDIC Power Holdings Co. Ltd. Class A (Utilities) | 513,210 | ||||||
| 209,200 | Shandong Gold Mining Co. Ltd. Class A (Materials) | 950,882 | ||||||
| 7,838,000 | Shenzhen Expressway Co. Ltd. Class H (Transportation) | 10,491,154 | ||||||
| 931,770 | Shenzhen International Holdings Ltd. (Transportation) | 1,894,318 | ||||||
| 671,000 | Shimao Property Holdings Ltd. (Real Estate) | 2,247,907 | ||||||
| 3,400,000 | Shui On Land Ltd. (Real Estate) | 684,226 | ||||||
| 691,000 | SITC International Holdings Co. Ltd. (Transportation) | 760,859 | ||||||
| 1,211,600 | Tencent Holdings Ltd. (Media & Entertainment) | 49,146,031 | ||||||
| 560,300 | Vipshop Holdings Ltd. ADR (Retailing)* | 6,465,862 | ||||||
| 9,938,000 | Weichai Power Co. Ltd. Class H (Capital Goods) | 15,642,610 | ||||||
| 554,317 | Wuliangye Yibin Co. Ltd. Class A (Food, Beverage & Tobacco) | 10,375,606 | ||||||
| 5,390,407 | Xiamen C & D, Inc. Class A (Capital Goods) | 6,498,075 | ||||||
| 3,496,000 | Yuexiu Transport Infrastructure Ltd. (Transportation) | 3,227,376 | ||||||
| 671,500 | Yum China Holdings, Inc. (Consumer Services) | 28,538,750 | ||||||
|
| |||||||
| Common Stocks – (continued) | ||||||||
| China – (continued) | ||||||||
| 1,008,000 | Zhejiang Expressway Co. Ltd. Class H (Transportation) | 825,420 | ||||||
| 281,000 | Zhongsheng Group Holdings Ltd. (Retailing) | 931,576 | ||||||
| 3,676,000 | Zijin Mining Group Co. Ltd. Class H (Materials) | 1,273,329 | ||||||
| 1,298,200 | Zoomlion Heavy Industry Science and Technology Co. Ltd. Class A (Capital Goods) | 1,078,284 | ||||||
| 1,566,200 | Zoomlion Heavy Industry Science and Technology Co. Ltd. Class H (Capital Goods) | 1,149,742 | ||||||
|
| |||||||
| 587,564,106 | ||||||||
|
| |||||||
| Colombia – 0.0% | ||||||||
| 7,790 | Bancolombia SA ADR (Banks) | 404,145 | ||||||
|
| |||||||
| Greece – 0.1% | ||||||||
| 38,920 | Motor Oil Hellas Corinth Refineries SA (Energy) | 962,577 | ||||||
|
| |||||||
| Hong Kong – 0.1% | ||||||||
| 979,000 | Kingboard Laminates Holdings Ltd. (Technology Hardware & Equipment) | 896,259 | ||||||
|
| |||||||
| India – 8.1% | ||||||||
| 1,167,594 | Adani Ports & Special Economic Zone Ltd. (Transportation) | 6,506,327 | ||||||
| 40,289 | Bajaj Auto Ltd. (Automobiles & Components) | 1,842,782 | ||||||
| 11,913 | Bajaj Finserv Ltd. (Insurance) | 1,365,354 | ||||||
| 77,541 | Bajaj Holdings & Investment Ltd. (Diversified Financials) | 4,007,563 | ||||||
| 376,829 | Bata India Ltd. (Consumer Durables & Apparel) | 9,591,123 | ||||||
| 123,881 | CESC Ltd. (Utilities) | 1,393,013 | ||||||
| 47,580 | Dr Reddy’s Laboratories Ltd. ADR (Pharmaceuticals, Biotechnology & Life Sciences) | 1,862,757 | ||||||
| 5,190,823 | GAIL India Ltd. (Utilities) | 10,039,370 | ||||||
| 163,874 | Gujarat State Petronet Ltd. (Utilities) | 483,452 | ||||||
| 674,759 | Hindustan Petroleum Corp. Ltd. (Energy) | 3,084,552 | ||||||
| 3,237,059 | Indian Oil Corp. Ltd. (Energy) | 6,686,264 | ||||||
| 2,695,739 | Infosys Ltd. ADR (Software & Services) | 25,852,137 | ||||||
| 322,765 | InterGlobe Aviation Ltd. (Transportation)(b) | 6,614,606 | ||||||
| 359,525 | Mahanagar Gas Ltd. (Utilities) | 5,161,730 | ||||||
| 112,918 | Marico Ltd. (Household & Personal Products) | 582,362 | ||||||
| 178,378 | Mphasis Ltd. (Software & Services) | 2,389,774 | ||||||
| 8,271 | Multi Commodity Exchange of India Ltd. (Diversified Financials) | 132,549 | ||||||
| 4,841,157 | Oil & Natural Gas Corp. Ltd. (Energy) | 9,662,307 | ||||||
|
| |||||||
| The accompanying notes are an integral part of these financial statements. | 23 |
GOLDMAN SACHS EMERGING MARKETS EQUITY INSIGHTS FUND
Schedule of Investments(continued)
October 31, 2019
| Shares | Description | Value | ||||||
| Common Stocks – (continued) | ||||||||
| India – (continued) | ||||||||
| 349,475 | Petronet LNG Ltd. (Energy) | $ | 1,410,198 | |||||
| 28,638 | Pfizer Ltd. (Pharmaceuticals, Biotechnology & Life Sciences) | 1,638,387 | ||||||
| 127,607 | Pidilite Industries Ltd. (Materials) | 2,519,774 | ||||||
| 5,381,905 | REC Ltd. (Diversified Financials) | 10,587,530 | ||||||
| 198,437 | Reliance Industries Ltd. (Energy) | 4,090,046 | ||||||
| 68,529 | Torrent Pharmaceuticals Ltd. (Pharmaceuticals, Biotechnology & Life Sciences) | 1,714,873 | ||||||
| 5,762,699 | Wipro Ltd. (Software & Services) | 21,102,861 | ||||||
| 75,800 | WNS Holdings Ltd. ADR (Software & Services)* | 4,687,472 | ||||||
|
| |||||||
| 145,009,163 | ||||||||
|
| |||||||
| Indonesia – 4.2% | ||||||||
| 353,700 | Bank Central Asia Tbk. PT (Banks) | 791,696 | ||||||
| 12,832,100 | Bank Mandiri Persero Tbk. PT (Banks) | 6,414,374 | ||||||
| 8,625,500 | Bank Negara Indonesia Persero Tbk. PT (Banks) | 4,708,513 | ||||||
| 107,414,400 | Bank Rakyat Indonesia Persero Tbk. PT (Banks) | 32,185,143 | ||||||
| 223,700 | Gudang Garam Tbk. PT (Food, Beverage & Tobacco) | 893,395 | ||||||
| 234,900 | Indofood Sukses Makmur Tbk. PT (Food, Beverage & Tobacco) | 128,726 | ||||||
| 104,417,500 | Telekomunikasi Indonesia Persero Tbk. PT (Telecommunication Services) | 30,471,205 | ||||||
|
| |||||||
| 75,593,052 | ||||||||
|
| |||||||
| Mexico – 4.5% | ||||||||
| 75,499 | America Movil SAB de CV Class L ADR (Telecommunication Services) | 1,193,639 | ||||||
| 4,079,486 | Fibra Uno Administracion SA de CV (REIT) | 6,196,688 | ||||||
| 21,314 | Gentera SAB de CV (Diversified Financials) | 21,118 | ||||||
| 1,982,331 | Grupo Aeroportuario del Centro Norte SAB de CV (Transportation) | 13,743,846 | ||||||
| 650,458 | Grupo Aeroportuario del Pacifico SAB de CV Class B (Transportation) | 6,819,555 | ||||||
| 27,228 | Grupo Aeroportuario del Sureste SAB de CV ADR (Transportation) | 4,458,585 | ||||||
| 8,529,816 | Kimberly-Clark de Mexico SAB de CV Class A (Household & Personal Products)* | 17,200,196 | ||||||
| 51,800 | Prologis Property Mexico SA de CV (REIT) | 110,566 | ||||||
| 247,266 | Promotora y Operadora de Infraestructura SAB de CV (Transportation) | 2,287,241 | ||||||
|
| |||||||
| Common Stocks – (continued) | ||||||||
| Mexico – (continued) | ||||||||
| 9,270,445 | Wal-Mart de Mexico SAB de CV (Food & Staples Retailing) | 27,821,214 | ||||||
|
| |||||||
| 79,852,648 | ||||||||
|
| |||||||
| Philippines – 0.3% | ||||||||
| 873,700 | First Gen Corp. (Utilities) | 426,993 | ||||||
| 81,630 | Globe Telecom, Inc. (Telecommunication Services) | 2,934,144 | ||||||
| 768,560 | International Container Terminal Services, Inc. (Transportation) | 1,796,720 | ||||||
| 16,940 | Manila Electric Co. (Utilities) | 112,967 | ||||||
|
| |||||||
| 5,270,824 | ||||||||
|
| |||||||
| Poland – 1.7% | ||||||||
| 140,849 | Asseco Poland SA (Software & Services) | 1,893,914 | ||||||
| 4,912 | CD Projekt SA (Media & Entertainment) | 324,259 | ||||||
| 32,046 | Cyfrowy Polsat SA (Media & Entertainment) | 232,445 | ||||||
| 8,270 | Grupa Lotos SA (Energy) | 206,527 | ||||||
| 102,559 | PLAY Communications SA (Telecommunication Services)(b) | 813,687 | ||||||
| 73,111 | Polski Koncern Naftowy ORLEN SA (Energy) | 1,999,082 | ||||||
| 73,977 | Powszechna Kasa Oszczednosci Bank Polski SA (Banks) | 738,652 | ||||||
| 2,430,715 | Powszechny Zaklad Ubezpieczen SA (Insurance) | 23,522,266 | ||||||
|
| |||||||
| 29,730,832 | ||||||||
|
| |||||||
| Qatar – 0.1% | ||||||||
| 113,206 | Ooredoo QPSC (Telecommunication Services) | 227,196 | ||||||
| 298,395 | Qatar Fuel QSC (Energy) | 1,812,885 | ||||||
|
| |||||||
| 2,040,081 | ||||||||
|
| |||||||
| Russia – 4.4% | ||||||||
| 39,558,000 | Inter RAO UES PJSC (Utilities) | 2,666,189 | ||||||
| 355,871 | LUKOIL PJSC ADR (Energy) | 32,761,420 | ||||||
| 156,328 | Polyus PJSC (Materials) | 18,209,113 | ||||||
| 3,823,280 | Sberbank of Russia PJSC (Banks) | 14,011,981 | ||||||
| 146,490 | Tatneft PJSC ADR (Energy) | 10,125,389 | ||||||
| 175,200 | VEON Ltd. ADR (Telecommunication Services) | 420,480 | ||||||
|
| |||||||
| 78,194,572 | ||||||||
|
| |||||||
| Saudi Arabia – 1.2% | ||||||||
| 539,671 | Alinma Bank (Banks) | 3,016,893 | ||||||
| 45,692 | Arab National Bank (Banks) | 277,298 | ||||||
| 123,048 | Bank AlBilad (Banks) | 813,767 | ||||||
| 12,764 | Co. for Cooperative Insurance (The) (Insurance)* | 239,968 | ||||||
| 1,745,736 | Mobile Telecommunications Co. Saudi Arabia (Telecommunication Services)* | 5,626,496 | ||||||
| 2,047,433 | Riyad Bank (Banks) | 12,117,601 | ||||||
|
| |||||||
| 24 | The accompanying notes are an integral part of these financial statements. |
GOLDMAN SACHS EMERGING MARKETS EQUITY INSIGHTS FUND
| Shares | Description | Value | ||||||
| Common Stocks – (continued) | ||||||||
| Saudi Arabia – (continued) | ||||||||
| 5,279 | Saudia Dairy & Foodstuff Co. (Food, Beverage & Tobacco) | $ | 178,768 | |||||
|
| |||||||
| 22,270,791 | ||||||||
|
| |||||||
| Singapore – 0.0% | ||||||||
| 22,300 | BOC Aviation Ltd. (Capital Goods)(b) | 209,506 | ||||||
|
| |||||||
| South Africa – 3.5% | ||||||||
| 908,797 | Absa Group Ltd. (Banks) | 9,320,695 | ||||||
| 354,682 | African Rainbow Minerals Ltd. (Materials) | 3,553,456 | ||||||
| 258,372 | Anglo American Platinum Ltd. (Materials) | 19,282,018 | ||||||
| 717,428 | AngloGold Ashanti Ltd. ADR (Materials) | 15,840,810 | ||||||
| 133,443 | Barloworld Ltd. (Capital Goods) | 1,062,871 | ||||||
| 583,860 | Fortress REIT Ltd. Class A (REIT) | 811,813 | ||||||
| 1,012,488 | Gold Fields Ltd. ADR (Materials) | 6,257,176 | ||||||
| 1,091,680 | Netcare Ltd. (Health Care Equipment & Services) | 1,236,207 | ||||||
| 1,389,641 | Old Mutual Ltd. (Insurance) | 1,826,727 | ||||||
| 32,981 | SPAR Group Ltd. (The) (Food & Staples Retailing) | 443,734 | ||||||
| 506,451 | Telkom SA SOC Ltd. (Telecommunication Services) | 2,315,216 | ||||||
|
| |||||||
| 61,950,723 | ||||||||
|
| |||||||
| South Korea – 13.5% | ||||||||
| 58,082 | Advanced Process Systems Corp. (Semiconductors & Semiconductor Equipment) | 1,343,277 | ||||||
| 1,126 | BGF retail Co. Ltd. (Food & Staples Retailing) | 172,456 | ||||||
| 160,065 | Cheil Worldwide, Inc. (Media & Entertainment) | 3,402,261 | ||||||
| 354,788 | CJ Hello Co. Ltd. (Media & Entertainment) | 1,858,960 | ||||||
| 84,646 | Daelim Industrial Co. Ltd. (Capital Goods) | 6,579,490 | ||||||
| 125,971 | DB HiTek Co. Ltd. (Semiconductors & Semiconductor Equipment) | 1,837,689 | ||||||
| 44,988 | DB Insurance Co. Ltd. (Insurance) | 1,950,483 | ||||||
| 86,912 | Handsome Co. Ltd. (Consumer Durables & Apparel) | 2,178,047 | ||||||
| 79,589 | Hanwha Aerospace Co. Ltd. (Capital Goods)* | 2,585,306 | ||||||
| 84,328 | HS Industries Co. Ltd. (Consumer Durables & Apparel) | 821,866 | ||||||
| 65,849 | Huons Global Co. Ltd. (Health Care Equipment & Services) | 1,708,446 | ||||||
| 9,962 | Hyosung Corp. (Capital Goods) | 707,639 | ||||||
| 3,310 | Hyundai Glovis Co. Ltd. (Transportation) | 428,751 | ||||||
| 17,897 | Hyundai Mipo Dockyard Co. Ltd. (Capital Goods) | 667,408 | ||||||
|
| |||||||
| Common Stocks – (continued) | ||||||||
| South Korea – (continued) | ||||||||
| 94,714 | Hyundai Mobis Co. Ltd. (Automobiles & Components) | 19,315,379 | ||||||
| 42,515 | Hyundai Motor Co. (Automobiles & Components) | 4,453,210 | ||||||
| 704,389 | Kia Motors Corp. (Automobiles & Components) | 25,743,572 | ||||||
| 402,828 | Korea Aerospace Industries Ltd. (Capital Goods) | 13,148,885 | ||||||
| 3,078 | Korea Investment Holdings Co. Ltd. (Diversified Financials) | 178,815 | ||||||
| 18,896 | Korea Zinc Co. Ltd. (Materials) | 7,041,269 | ||||||
| 131,356 | LG Corp. (Capital Goods) | 7,830,995 | ||||||
| 220,447 | LG Electronics, Inc. (Consumer Durables & Apparel) | 12,633,651 | ||||||
| 39,770 | LG International Corp. (Capital Goods) | 530,153 | ||||||
| 148,667 | MegaStudyEdu Co. Ltd. (Consumer Services) | 4,665,427 | ||||||
| 32,760 | Meritz Fire & Marine Insurance Co. Ltd. (Insurance) | 519,917 | ||||||
| 31,319 | Mirae Asset Daewoo Co. Ltd. (Diversified Financials) | 192,015 | ||||||
| 206,048 | NICE Information Service Co. Ltd. (Commercial & Professional Services) | 2,154,902 | ||||||
| 47,599 | Osstem Implant Co. Ltd. (Health Care Equipment & Services)* | 1,631,815 | ||||||
| 29,340 | Partron Co. Ltd. (Technology Hardware & Equipment) | 297,523 | ||||||
| 20,732 | RFHIC Corp. (Semiconductors & Semiconductor Equipment) | 650,964 | ||||||
| 1,234,521 | Samsung Electronics Co. Ltd. (Technology Hardware & Equipment) | 53,355,813 | ||||||
| 291,084 | Samsung Electronics Co. Ltd. (Preference) (Technology Hardware & Equipment)(a) | 10,246,397 | ||||||
| 566,420 | Samsung Engineering Co. Ltd. (Capital Goods)* | 8,647,025 | ||||||
| 22,332 | Sangsangin Co. Ltd. (Banks)*(c) | 231,713 | ||||||
| 147,711 | Shinhan Financial Group Co. Ltd. (Banks) | 5,381,862 | ||||||
| 486,273 | SK Hynix, Inc. (Semiconductors & Semiconductor Equipment) | 34,192,774 | ||||||
| 160,425 | SK Networks Co. Ltd. (Capital Goods) | 800,188 | ||||||
| 72,858 | UniTest, Inc. (Semiconductors & Semiconductor Equipment) | 934,307 | ||||||
|
| |||||||
| 241,020,650 | ||||||||
|
| |||||||
| Taiwan – 11.0% | ||||||||
| 1,433,000 | Ardentec Corp. (Semiconductors & Semiconductor Equipment) | 1,334,331 | ||||||
| 3,126,000 | Asia Cement Corp. (Materials) | 4,412,740 | ||||||
| 503,000 | Chicony Electronics Co. Ltd. (Technology Hardware & Equipment) | 1,562,690 | ||||||
|
| |||||||
| The accompanying notes are an integral part of these financial statements. | 25 |
GOLDMAN SACHS EMERGING MARKETS EQUITY INSIGHTS FUND
Schedule of Investments(continued)
October 31, 2019
| Shares | Description | Value | ||||||
| Common Stocks – (continued) | ||||||||
| Taiwan – (continued) | ||||||||
| 5,211,000 | Chipbond Technology Corp. (Semiconductors & Semiconductor Equipment) | $ | 10,324,435 | |||||
| 6,326,000 | ChipMOS Technologies, Inc. (Semiconductors & Semiconductor Equipment) | 6,259,983 | ||||||
| 4,346,000 | Elan Microelectronics Corp. (Semiconductors & Semiconductor Equipment) | 13,408,204 | ||||||
| 362,400 | Feng TAY Enterprise Co. Ltd. (Consumer Durables & Apparel) | 2,448,136 | ||||||
| 134,000 | International Games System Co. Ltd. Class C (Media & Entertainment) | 1,723,525 | ||||||
| 5,997,000 | Lite-On Technology Corp. (Technology Hardware & Equipment) | 9,881,997 | ||||||
| 1,740,000 | Nanya Technology Corp. (Semiconductors & Semiconductor Equipment) | 3,979,912 | ||||||
| 198,000 | Novatek Microelectronics Corp. (Semiconductors & Semiconductor Equipment) | 1,268,316 | ||||||
| 9,000 | Parade Technologies Ltd. (Semiconductors & Semiconductor Equipment) | 173,898 | ||||||
| 8,819,000 | Pou Chen Corp. (Consumer Durables & Apparel) | 11,790,423 | ||||||
| 2,514,000 | Radiant Opto-Electronics Corp. (Semiconductors & Semiconductor Equipment) | 9,981,277 | ||||||
| 2,341,000 | Realtek Semiconductor Corp. (Semiconductors & Semiconductor Equipment) | 17,365,430 | ||||||
| 242,000 | Sigurd Microelectronics Corp. (Semiconductors & Semiconductor Equipment) | 294,953 | ||||||
| 150,000 | Simplo Technology Co. Ltd. (Technology Hardware & Equipment) | 1,381,677 | ||||||
| 501,000 | Supreme Electronics Co. Ltd. (Technology Hardware & Equipment) | 477,252 | ||||||
| 280,000 | Synnex Technology International Corp. (Technology Hardware & Equipment) | 333,966 | ||||||
| 3,443,000 | Taiflex Scientific Co. Ltd. (Technology Hardware & Equipment) | 4,839,774 | ||||||
| 1,076,600 | Taiwan Semiconductor Manufacturing Co. Ltd. ADR (Semiconductors & Semiconductor Equipment) | 55,584,858 | ||||||
| 2,403,000 | Taiwan Styrene Monomer (Materials) | 1,704,373 | ||||||
| 195,000 | Topco Scientific Co. Ltd. (Semiconductors & Semiconductor Equipment) | 620,105 | ||||||
|
| |||||||
| Common Stocks – (continued) | ||||||||
| Taiwan – (continued) | ||||||||
| 2,515,000 | Tripod Technology Corp. (Technology Hardware & Equipment) | 9,720,036 | ||||||
| 2,961,000 | Unimicron Technology Corp. (Technology Hardware & Equipment) | 4,549,834 | ||||||
| 939,000 | United Integrated Services Co. Ltd. (Capital Goods) | 4,883,283 | ||||||
| 137,000 | Walsin Technology Corp. (Technology Hardware & Equipment) | 820,199 | ||||||
| 12,404,000 | Wistron Corp. (Technology Hardware & Equipment) | 11,371,997 | ||||||
| 860,000 | Zhen Ding Technology Holding Ltd. (Technology Hardware & Equipment) | 4,066,420 | ||||||
|
| |||||||
| 196,564,024 | ||||||||
|
| |||||||
| Thailand – 3.4% | ||||||||
| 10,660,200 | CP ALL PCL (Food & Staples Retailing) | 27,553,875 | ||||||
| 3,653,000 | Krung Thai Bank PCL (Banks) | 2,008,274 | ||||||
| 7,774,800 | Ratch Group PCL (Utilities) | 18,938,813 | ||||||
| 1,507,700 | Siam Commercial Bank PCL (The) (Banks) | 5,588,006 | ||||||
| 6,129,000 | Thai Union Group PCL Class F (Food, Beverage & Tobacco) | 2,963,754 | ||||||
| 1,580,000 | Thanachart Capital PCL (Banks) | 2,774,413 | ||||||
| 96,300 | Tisco Financial Group PCL (Banks) | 310,880 | ||||||
|
| |||||||
| 60,138,015 | ||||||||
|
| |||||||
| Turkey – 1.6% | ||||||||
| 146,250 | Enerjisa Enerji A/S (Utilities)(b) | 158,255 | ||||||
| 165,230 | TAV Havalimanlari Holding A/S (Transportation) | 753,259 | ||||||
| 1,280,911 | Tupras Turkiye Petrol Rafinerileri A/S (Energy) | 27,880,740 | ||||||
|
| |||||||
| 28,792,254 | ||||||||
|
| |||||||
| United Arab Emirates – 0.1% | ||||||||
| 1,535,461 | Emaar Properties PJSC (Real Estate) | 1,784,529 | ||||||
| 63,822 | Emirates NBD PJSC (Banks) | 208,526 | ||||||
|
| |||||||
| 1,993,055 | ||||||||
|
| |||||||
| United States – 0.2% | ||||||||
| 425,000 | JBS SA (Food, Beverage & Tobacco) | 2,997,943 | ||||||
|
| |||||||
| TOTAL COMMON STOCKS | ||||||||
| (Cost $1,620,520,709) | $ | 1,779,304,776 | ||||||
|
| |||||||
| 26 | The accompanying notes are an integral part of these financial statements. |
GOLDMAN SACHS EMERGING MARKETS EQUITY INSIGHTS FUND
| Units | Description | Expiration Month | Value | |||||||
| Rights* – 0.0% | ||||||||||
| Taiwan – 0.0% | ||||||||||
| 7,738 | Sigurd Microelectronics Corp. (Semiconductors & Semiconductor Equipment) | 11/2019 | $ | 2,695 | ||||||
| ||||||||||
| United Arab Emirates – 0.0% | ||||||||||
| 8,713 | Emirates NBD PJSC (Banks) | 11/2019 | 8,303 | |||||||
| ||||||||||
| TOTAL RIGHTS |
| |||||||||
| (Cost $0) |
| $ | 10,998 | |||||||
| ||||||||||
| TOTAL INVESTMENTS BEFORE SECURITIES LENDING REINVESTMENT VEHICLE |
| |||||||||
| (Cost $1,620,520,709) |
| $ | 1,779,315,774 | |||||||
| ||||||||||
| Shares | Dividend Rate | Value | ||||
| Securities Lending Reinvestment Vehicle(d) – 0.0% | ||||||
Goldman Sachs Financial Square Government Fund – Institutional Shares |
| |||||
| 121,709 | 1.701% | $ | 121,709 | |||
| (Cost $121,709) |
| |||||
| ||||||
| TOTAL INVESTMENTS – 99.8% |
| |||||
| (Cost $1,620,642,418) | $ | 1,779,437,483 | ||||
| ||||||
OTHER ASSETS IN EXCESS OF LIABILITIES – 0.2% | 3,159,235 | |||||
| ||||||
| NET ASSETS – 100.0% | $ | 1,782,596,718 | ||||
| ||||||
| The percentage shown for each investment category reflects the value of investments in that category as a percentage of net assets. | ||
* | Non-income producing security. | |
(a) | Preference Shares are a special type of equity investment that shares in the earnings of the company, has limited voting rights, and receives a greater dividend than applicable Common Shares. | |
(b) | Exempt from registration under Rule 144A of the Securities Act of 1933. | |
(c) | All or a portion of security is on loan. | |
(d) | Represents an Affiliated Issuer. | |
| ||
Investment Abbreviations: | ||
ADR | —American Depositary Receipt | |
REIT | —Real Estate Investment Trust | |
| ||
| The accompanying notes are an integral part of these financial statements. | 27 |
GOLDMAN SACHS INTERNATIONAL EQUITY INSIGHTS FUND
Schedule of Investments
October 31, 2019
| Shares | Description | Value | ||||||
| Common Stocks – 98.6% | ||||||||
| Australia – 7.4% | ||||||||
| 175,608 | Altium Ltd. (Software & Services) | $ | 3,887,470 | |||||
| 378,666 | ASX Ltd. (Diversified Financials) | 21,493,788 | ||||||
| 677,268 | Aurizon Holdings Ltd. (Transportation) | 2,755,288 | ||||||
| 142,869 | Bendigo & Adelaide Bank Ltd. (Banks) | 1,048,531 | ||||||
| 247,721 | Brambles Ltd. (Commercial & Professional Services) | 2,047,922 | ||||||
| 100,767 | Charter Hall Group (REIT) | 785,167 | ||||||
| 2,585,286 | Coca-Cola Amatil Ltd. (Food, Beverage & Tobacco) | 18,142,630 | ||||||
| 27,618 | Cochlear Ltd. (Health Care Equipment & Services) | 4,029,193 | ||||||
| 679,764 | Coles Group Ltd. (Food & Staples Retailing) | 7,034,791 | ||||||
| 1,781,749 | Goodman Group (REIT) | 17,691,459 | ||||||
| 3,494,416 | Insurance Australia Group Ltd. (Insurance) | 19,146,155 | ||||||
| 71,552 | Macquarie Group Ltd. (Diversified Financials) | 6,606,928 | ||||||
| 100,514 | Magellan Financial Group Ltd. (Diversified Financials) | 3,333,843 | ||||||
| 299,087 | Newcrest Mining Ltd. (Materials) | 6,528,571 | ||||||
| 319,622 | Orica Ltd. (Materials) | 5,051,212 | ||||||
| 1,994,364 | QBE Insurance Group Ltd. (Insurance) | 17,351,739 | ||||||
| 6,986 | REA Group Ltd. (Media & Entertainment) | 524,295 | ||||||
| 1,547,481 | Regis Resources Ltd. (Materials) | 5,244,505 | ||||||
| 104,692 | Rio Tinto Ltd. (Materials) | 6,546,708 | ||||||
| 275,132 | Rio Tinto plc ADR (Materials) | 14,309,615 | ||||||
| 3,837,185 | Telstra Corp. Ltd. (Telecommunication Services) | 9,241,653 | ||||||
| 943,373 | Wesfarmers Ltd. (Retailing) | 25,919,094 | ||||||
| 1,061,969 | Woolworths Group Ltd. (Food & Staples Retailing) | 27,384,089 | ||||||
|
| |||||||
| 226,104,646 | ||||||||
|
| |||||||
| Austria – 0.2% | ||||||||
| 93,898 | OMV AG (Energy) | 5,489,430 | ||||||
| 13,456 | Wienerberger AG (Materials) | 364,464 | ||||||
|
| |||||||
| 5,853,894 | ||||||||
|
| |||||||
| Belgium – 0.4% | ||||||||
| 159,545 | UCB SA (Pharmaceuticals, Biotechnology & Life Sciences) | 12,859,147 | ||||||
|
| |||||||
| Cambodia – 0.0% | ||||||||
| 382,000 | NagaCorp Ltd. (Consumer Services) | 694,127 | ||||||
|
| |||||||
| China – 0.0% | ||||||||
| 766,000 | Towngas China Co. Ltd. (Utilities)* | 590,492 | ||||||
|
| |||||||
| Denmark – 2.2% | ||||||||
| 98,406 | Carlsberg A/S Class B (Food, Beverage & Tobacco) | 13,857,946 | ||||||
| 309,476 | GN Store Nord A/S (Health Care Equipment & Services) | 13,614,769 | ||||||
|
| |||||||
| Common Stocks – (continued) | ||||||||
| Denmark – (continued) | ||||||||
| 423,481 | Novo Nordisk A/S Class B (Pharmaceuticals, Biotechnology & Life Sciences) | 23,286,674 | ||||||
| 104,273 | Pandora A/S (Consumer Durables & Apparel) | 5,130,861 | ||||||
| 73,571 | Royal Unibrew A/S (Food, Beverage & Tobacco) | 6,035,710 | ||||||
| 58,015 | SimCorp A/S (Software & Services) | 5,191,053 | ||||||
|
| |||||||
| 67,117,013 | ||||||||
|
| |||||||
| Finland – 0.8% | ||||||||
| 468,945 | Neste OYJ (Energy) | 16,944,141 | ||||||
| 76,740 | UPM-Kymmene OYJ (Materials) | 2,499,382 | ||||||
| 218,192 | Valmet OYJ (Capital Goods) | 4,883,254 | ||||||
|
| |||||||
| 24,326,777 | ||||||||
|
| |||||||
| France – 10.3% | ||||||||
| 238,536 | Air France-KLM (Transportation)* | 2,843,461 | ||||||
| 251,761 | Air Liquide SA (Materials) | 33,474,424 | ||||||
| 176,192 | Airbus SE (Capital Goods) | 25,276,224 | ||||||
| 626,631 | BNP Paribas SA (Banks) | 32,747,458 | ||||||
| 105,528 | Capgemini SE (Software & Services) | 11,896,198 | ||||||
| 3,665 | Christian Dior SE (Consumer Durables & Apparel) | 1,810,357 | ||||||
| 182,038 | Eiffage SA (Capital Goods) | 19,552,011 | ||||||
| 19,623 | Gaztransport Et Technigaz SA (Energy) | 1,790,372 | ||||||
| 51,520 | Kering SA (Consumer Durables & Apparel) | 29,314,707 | ||||||
| 265,137 | Legrand SA (Capital Goods) | 20,713,582 | ||||||
| 50,320 | Publicis Groupe SA (Media & Entertainment) | 2,165,701 | ||||||
| 180,583 | Safran SA (Capital Goods) | 28,602,546 | ||||||
| 79,047 | Sanofi (Pharmaceuticals, Biotechnology & Life Sciences) | 7,287,118 | ||||||
| 36,665 | Sartorius Stedim Biotech (Pharmaceuticals, Biotechnology & Life Sciences) | 5,492,837 | ||||||
| 337,184 | Schneider Electric SE (Capital Goods) | 31,338,036 | ||||||
| 475,940 | SCOR SE (Insurance) | 20,074,739 | ||||||
| 191,592 | Societe Generale SA (Banks) | 5,448,671 | ||||||
| 55,934 | Teleperformance (Commercial & Professional Services) | 12,690,500 | ||||||
| 415,911 | TOTAL SA (Energy) | 21,988,485 | ||||||
|
| |||||||
| 314,507,427 | ||||||||
|
| |||||||
| Germany – 8.7% | ||||||||
| 237,162 | Aareal Bank AG (Banks) | 7,961,937 | ||||||
| 29,929 | BASF SE (Materials) | 2,275,180 | ||||||
| 465,965 | Bayer AG (Registered) (Pharmaceuticals, Biotechnology & Life Sciences) | 36,147,792 | ||||||
| 18,769 | CANCOM SE (Software & Services) | 1,003,802 | ||||||
| 392,267 | Covestro AG (Materials)(a) | 18,837,419 | ||||||
| 32,444 | Deutsche Boerse AG (Diversified Financials) | 5,024,268 | ||||||
|
| |||||||
| 28 | The accompanying notes are an integral part of these financial statements. |
GOLDMAN SACHS INTERNATIONAL EQUITY INSIGHTS FUND
| Shares | Description | Value | ||||||
| Common Stocks – (continued) | ||||||||
| Germany – (continued) | ||||||||
| 233,764 | Deutsche Lufthansa AG (Registered) (Transportation) | $ | 4,049,542 | |||||
| 155,633 | Deutsche Pfandbriefbank AG (Banks)(a) | 2,126,932 | ||||||
| 776,716 | Deutsche Post AG (Registered) (Transportation) | 27,515,218 | ||||||
| 623,253 | Evotec SE (Pharmaceuticals, Biotechnology & Life Sciences)*(b) | 14,276,033 | ||||||
| 36,117 | Hannover Rueck SE (Insurance) | 6,400,077 | ||||||
| 294,546 | HeidelbergCement AG (Materials) | 21,837,080 | ||||||
| 21,939 | Hella GmbH & Co. KGaA (Automobiles & Components) | 1,067,198 | ||||||
| 115,894 | Henkel AG & Co. KGaA (Preference) (Household & Personal Products)(c) | 12,038,231 | ||||||
| 43,470 | HOCHTIEF AG (Capital Goods) | 5,431,272 | ||||||
| 145,000 | Merck KGaA (Pharmaceuticals, Biotechnology & Life Sciences) | 17,293,653 | ||||||
| 26,352 | MTU Aero Engines AG (Capital Goods) | 7,047,344 | ||||||
| 101,425 | Muenchener Rueckversicherungs-Gesellschaft AG in Muenchen (Registered) (Insurance) | 28,179,902 | ||||||
| 197,727 | Nemetschek SE (Software & Services) | 10,088,511 | ||||||
| 120,212 | Porsche Automobil Holding SE (Preference) (Automobiles & Components)(c) | 8,851,286 | ||||||
| 729,868 | ProSiebenSat.1 Media SE (Media & Entertainment) | 10,777,648 | ||||||
| 10,626 | Rheinmetall AG (Capital Goods) | 1,281,567 | ||||||
| 93,706 | Siltronic AG (Semiconductors & Semiconductor Equipment) | 8,924,508 | ||||||
| 131,683 | Software AG (Software & Services) | 4,188,970 | ||||||
| 52,798 | TLG Immobilien AG (Real Estate) | 1,545,747 | ||||||
|
| |||||||
| 264,171,117 | ||||||||
|
| |||||||
| Hong Kong – 1.1% | ||||||||
| 2,593,400 | AIA Group Ltd. (Insurance) | 25,825,660 | ||||||
| 865,000 | CK Asset Holdings Ltd. (Real Estate) | 6,018,419 | ||||||
| 503,000 | Yue Yuen Industrial Holdings Ltd. (Consumer Durables & Apparel) | 1,417,549 | ||||||
|
| |||||||
| 33,261,628 | ||||||||
|
| |||||||
| Israel – 0.0% | ||||||||
| 106,445 | Plus500 Ltd. (Diversified Financials) | 1,103,068 | ||||||
|
| |||||||
| Italy – 3.3% | ||||||||
| 8,946,290 | A2A SpA (Utilities) | 17,959,486 | ||||||
| 121,036 | Banca Generali SpA (Diversified Financials) | 3,951,398 | ||||||
| 152,512 | Enav SpA (Transportation)(a) | 887,904 | ||||||
| 322,534 | Eni SpA (Energy) | 4,893,161 | ||||||
| 12,139,099 | Intesa Sanpaolo SpA (Banks) | 30,418,469 | ||||||
|
| |||||||
| Common Stocks – (continued) | ||||||||
| Italy – (continued) | ||||||||
| 484,194 | Iren SpA (Utilities) | 1,502,340 | ||||||
| 697,061 | Leonardo SpA (Capital Goods) | 8,098,189 | ||||||
| 1,663,387 | Mediobanca Banca di Credito Finanziario SpA (Banks) | 19,779,894 | ||||||
| 110,460 | Poste Italiane SpA (Insurance)(a) | 1,341,694 | ||||||
| 9,173 | Reply SpA (Software & Services) | 597,771 | ||||||
| 1,773,370 | Terna Rete Elettrica Nazionale SpA (Utilities) | 11,720,922 | ||||||
|
| |||||||
| 101,151,228 | ||||||||
|
| |||||||
| Japan – 23.3% | ||||||||
| 415,900 | AEON Financial Service Co. Ltd. (Diversified Financials) | 6,338,482 | ||||||
| 672,200 | Ajinomoto Co., Inc. (Food, Beverage & Tobacco) | 12,779,994 | ||||||
| 133,000 | Alps Alpine Co. Ltd. (Technology Hardware & Equipment) | 2,851,334 | ||||||
| 231,300 | Benesse Holdings, Inc. (Consumer Services) | 6,191,849 | ||||||
| 74,700 | Central Japan Railway Co. (Transportation) | 15,323,512 | ||||||
| 329,300 | Chubu Electric Power Co., Inc. (Utilities) | 4,940,240 | ||||||
| 617,700 | Dai Nippon Printing Co. Ltd. (Commercial & Professional Services) | 16,497,849 | ||||||
| 650,800 | Daiwa House Industry Co. Ltd. (Real Estate) | 22,403,862 | ||||||
| 1,370 | Daiwa House REIT Investment Corp. (REIT) | 3,989,171 | ||||||
| 1,017,400 | DeNA Co. Ltd. (Media & Entertainment) | 17,342,402 | ||||||
| 312,500 | Denso Corp. (Automobiles & Components) | 14,509,350 | ||||||
| 114,200 | East Japan Railway Co. (Transportation) | 10,367,194 | ||||||
| 147,000 | FamilyMart Co. Ltd. (Food & Staples Retailing) | 3,646,511 | ||||||
| 104,900 | Fancl Corp. (Household & Personal Products) | 2,964,374 | ||||||
| 60,200 | FUJIFILM Holdings Corp. (Technology Hardware & Equipment) | 2,642,915 | ||||||
| 299,400 | Fujitsu Ltd. (Software & Services) | 26,535,534 | ||||||
| 565,200 | Hitachi Ltd. (Technology Hardware & Equipment) | 21,094,656 | ||||||
| 23,400 | Hoya Corp. (Health Care Equipment & Services) | 2,068,027 | ||||||
| 167,800 | Ibiden Co. Ltd. (Technology Hardware & Equipment) | 3,874,629 | ||||||
| 275,500 | Idemitsu Kosan Co. Ltd. (Energy) | 8,098,398 | ||||||
| 247,400 | Japan Airlines Co. Ltd. (Transportation) | 7,709,501 | ||||||
| 3,328 | Japan Retail Fund Investment Corp. (REIT) | 7,766,052 | ||||||
| 4,443,700 | JXTG Holdings, Inc. (Energy) | 20,770,923 | ||||||
|
| |||||||
| The accompanying notes are an integral part of these financial statements. | 29 |
GOLDMAN SACHS INTERNATIONAL EQUITY INSIGHTS FUND
Schedule of Investments(continued)
October 31, 2019
| Shares | Description | Value | ||||||
| Common Stocks – (continued) | ||||||||
| Japan – (continued) | ||||||||
| 252,400 | Kao Corp. (Household & Personal Products) | $ | 20,292,629 | |||||
| 33,100 | KDDI Corp. (Telecommunication Services) | 915,915 | ||||||
| 120,900 | Kewpie Corp. (Food, Beverage & Tobacco) | 2,744,089 | ||||||
| 16,500 | Koito Manufacturing Co. Ltd. (Automobiles & Components) | 863,168 | ||||||
| 415,900 | Konami Holdings Corp. (Media & Entertainment) | 18,257,510 | ||||||
| 179,500 | K’s Holdings Corp. (Retailing) | 2,050,845 | ||||||
| 8,600 | Kureha Corp. (Materials) | 549,659 | ||||||
| 204,100 | Kyocera Corp. (Technology Hardware & Equipment) | 13,390,363 | ||||||
| 1,020,600 | LIXIL Group Corp. (Capital Goods) | 18,981,030 | ||||||
| 54,800 | Matsumotokiyoshi Holdings Co. Ltd. (Food & Staples Retailing) | 1,930,288 | ||||||
| 1,347,100 | Mazda Motor Corp. (Automobiles & Components) | 12,366,806 | ||||||
| 47,800 | Mitsubishi Heavy Industries Ltd. (Capital Goods) | 1,934,436 | ||||||
| 215,900 | Mitsubishi Materials Corp. (Materials) | 6,208,213 | ||||||
| 3,965,800 | Mitsubishi UFJ Financial Group, Inc. (Banks) | 20,559,850 | ||||||
| 16,095,100 | Mizuho Financial Group, Inc. (Banks) | 24,987,265 | ||||||
| 23,300 | NET One Systems Co. Ltd. (Software & Services) | 628,181 | ||||||
| 30,400 | Nippon Electric Glass Co. Ltd. (Technology Hardware & Equipment) | 684,807 | ||||||
| 227,000 | Nippon Telegraph & Telephone Corp. (Telecommunication Services) | 11,268,941 | ||||||
| 571,400 | Nippon Yusen KK (Transportation) | 10,265,250 | ||||||
| 135,700 | Nitto Denko Corp. (Materials) | 7,507,700 | ||||||
| 594,500 | Nomura Research Institute Ltd. (Software & Services) | 12,621,659 | ||||||
| 12,900 | NS Solutions Corp. (Software & Services) | 438,576 | ||||||
| 1,440,500 | NTT Data Corp. (Software & Services) | 18,914,991 | ||||||
| 1,050,100 | ORIX Corp. (Diversified Financials) | 16,502,211 | ||||||
| 827,400 | Osaka Gas Co. Ltd. (Utilities) | 16,179,542 | ||||||
| 25,300 | Otsuka Holdings Co. Ltd. (Pharmaceuticals, Biotechnology & Life Sciences) | 1,054,764 | ||||||
| 209,100 | SAMTY Co. Ltd. (Real Estate)(b) | 3,939,734 | ||||||
| 45,700 | SCSK Corp. (Software & Services) | 2,326,330 | ||||||
| 79,700 | Secom Co. Ltd. (Commercial & Professional Services) | 7,385,276 | ||||||
| 1,538,400 | Sega Sammy Holdings, Inc. (Consumer Durables & Apparel) | 21,650,052 | ||||||
|
| |||||||
| Common Stocks – (continued) | ||||||||
| Japan – (continued) | ||||||||
| 71,400 | Sekisui Chemical Co. Ltd. (Consumer Durables & Apparel) | 1,244,912 | ||||||
| 1,001,900 | Sekisui House Ltd. (Consumer Durables & Apparel) | 21,605,351 | ||||||
| 385,500 | Shionogi & Co. Ltd. (Pharmaceuticals, Biotechnology & Life Sciences) | 23,138,827 | ||||||
| 379,900 | SoftBank Group Corp. (Telecommunication Services) | 14,613,391 | ||||||
| 17,100 | St Marc Holdings Co. Ltd. (Consumer Services) | 381,453 | ||||||
| 891,900 | Subaru Corp. (Automobiles & Components) | 25,559,637 | ||||||
| 143,700 | Sugi Holdings Co. Ltd. (Food & Staples Retailing) | 7,976,407 | ||||||
| 410,200 | Sumitomo Heavy Industries Ltd. (Capital Goods) | 12,741,646 | ||||||
| 120,700 | Sumitomo Realty & Development Co. Ltd. (Real Estate) | 4,381,201 | ||||||
| 54,000 | Sundrug Co. Ltd. (Food & Staples Retailing) | 1,786,899 | ||||||
| 112,100 | Taisei Corp. (Capital Goods) | 4,420,487 | ||||||
| 133,200 | Takara Holdings, Inc. (Food, Beverage & Tobacco) | 1,322,216 | ||||||
| 239,800 | TDK Corp. (Technology Hardware & Equipment) | 23,661,974 | ||||||
| 164,600 | TIS, Inc. (Software & Services) | 9,980,279 | ||||||
| 95,700 | Tokyo Electron Ltd. (Semiconductors & Semiconductor Equipment) | 19,388,684 | ||||||
| 481,900 | Toppan Printing Co. Ltd. (Commercial & Professional Services) | 8,912,899 | ||||||
| 3,701 | United Urban Investment Corp. (REIT) | 7,466,513 | ||||||
| 983,100 | Yamada Denki Co. Ltd. (Retailing) | 4,751,796 | ||||||
|
| |||||||
| 711,441,411 | ||||||||
|
| |||||||
| Netherlands – 9.4% | ||||||||
| 307,480 | Akzo Nobel NV (Materials) | 28,347,644 | ||||||
| 103,342 | ASM International NV (Semiconductors & Semiconductor Equipment) | 10,419,126 | ||||||
| 78,740 | ASML Holding NV (Semiconductors & Semiconductor Equipment) | 20,638,904 | ||||||
| 498,433 | ASR Nederland NV (Insurance) | 18,271,860 | ||||||
| 568,252 | BE Semiconductor Industries NV (Semiconductors & Semiconductor Equipment) | 21,066,723 | ||||||
| 33,948 | Euronext NV (Diversified Financials)(a) | 2,738,658 | ||||||
| 1,092,132 | Koninklijke Ahold Delhaize NV (Food & Staples Retailing) | 27,216,000 | ||||||
| 64,150 | Koninklijke DSM NV (Materials) | 7,613,839 | ||||||
| 157,769 | Koninklijke Philips NV (Health Care Equipment & Services) | 6,921,976 | ||||||
|
| |||||||
| 30 | The accompanying notes are an integral part of these financial statements. |
GOLDMAN SACHS INTERNATIONAL EQUITY INSIGHTS FUND
| Shares | Description | Value | ||||||
| Common Stocks – (continued) | ||||||||
| Netherlands – (continued) | ||||||||
| 551,022 | NN Group NV (Insurance) | $ | 21,025,304 | |||||
| 49,009 | NXP Semiconductors NV (Semiconductors & Semiconductor Equipment) | 5,571,343 | ||||||
| 1,315,218 | Royal Dutch Shell plc Class A (Energy) | 38,203,280 | ||||||
| 391,252 | Royal Dutch Shell plc Class B (Energy) | 11,267,972 | ||||||
| 392,279 | Royal Dutch Shell plc Class B ADR (Energy) | 22,865,943 | ||||||
| 509,501 | Signify NV (Capital Goods)(a) | 14,928,425 | ||||||
| 385,153 | Wolters Kluwer NV (Commercial & Professional Services) | 28,367,689 | ||||||
|
| |||||||
| 285,464,686 | ||||||||
|
| |||||||
| New Zealand – 0.2% | ||||||||
| 519,102 | a2 Milk Co. Ltd. (Food, Beverage & Tobacco)* | 4,309,770 | ||||||
|
| |||||||
| Norway – 2.2% | ||||||||
| 138,253 | Austevoll Seafood ASA (Food, Beverage & Tobacco) | 1,396,090 | ||||||
| 1,472,488 | DNB ASA (Banks) | 26,810,025 | ||||||
| 142,513 | Elkem ASA (Materials)(a) | 338,715 | ||||||
| 334,994 | Equinor ASA (Energy) | 6,219,392 | ||||||
| 49,408 | Grieg Seafood ASA (Food, Beverage & Tobacco) | 605,922 | ||||||
| 835,173 | Leroy Seafood Group ASA (Food, Beverage & Tobacco) | 5,610,273 | ||||||
| 1,902,135 | Orkla ASA (Food, Beverage & Tobacco) | 18,283,015 | ||||||
| 86,438 | Salmar ASA (Food, Beverage & Tobacco) | 4,033,864 | ||||||
| 63,505 | Schibsted ASA Class A (Media & Entertainment) | 1,865,045 | ||||||
|
| |||||||
| 65,162,341 | ||||||||
|
| |||||||
| Portugal – 0.0% | ||||||||
| 71,325 | NOS SGPS SA (Media & Entertainment) | 424,045 | ||||||
|
| |||||||
| Singapore – 0.5% | ||||||||
| 2,285,200 | Singapore Exchange Ltd. (Diversified Financials) | 15,003,574 | ||||||
|
| |||||||
| Spain – 2.0% | ||||||||
| 470,918 | ACS Actividades de Construccion y Servicios SA (Capital Goods) | 19,108,985 | ||||||
| 2,637 | Aena SME SA (Transportation)(a) | 484,053 | ||||||
| 3,598,859 | Banco Bilbao Vizcaya Argentaria SA (Banks) | 18,954,587 | ||||||
| 72,728 | Grifols SA (Pharmaceuticals, Biotechnology & Life Sciences) | 2,346,248 | ||||||
| 1,054,745 | Merlin Properties Socimi SA (REIT) | 15,526,721 | ||||||
| 695,358 | Telefonica SA (Telecommunication Services) | 5,339,852 | ||||||
|
| |||||||
| 61,760,446 | ||||||||
|
| |||||||
| Common Stocks – (continued) | ||||||||
| Sweden – 3.6% | ||||||||
| 19,932 | Atlas Copco AB Class B (Capital Goods) | 618,456 | ||||||
| 991,072 | Boliden AB (Materials) | 26,726,707 | ||||||
| 388,720 | Cloetta AB Class B (Food, Beverage & Tobacco) | 1,319,911 | ||||||
| 541,050 | Electrolux ABSeries B (Consumer Durables & Apparel) | 14,224,929 | ||||||
| 84,325 | Essity AB Class B (Household & Personal Products) | 2,634,376 | ||||||
| 49,645 | Hemfosa Fastigheter AB (Real Estate) | 511,324 | ||||||
| 762,190 | Sandvik AB (Capital Goods) | 13,465,862 | ||||||
| 141,583 | SKF AB Class B (Capital Goods) | 2,563,524 | ||||||
| 563,348 | Swedish Match AB (Food, Beverage & Tobacco) | 26,465,156 | ||||||
| 1,486,720 | Volvo AB Class B (Capital Goods) | 22,279,655 | ||||||
|
| |||||||
| 110,809,900 | ||||||||
|
| |||||||
| Switzerland – 10.6% | ||||||||
| 320,024 | Adecco Group AG (Registered) (Commercial & Professional Services) | 19,024,195 | ||||||
| 98,007 | Baloise Holding AG (Registered) (Insurance) | 18,126,732 | ||||||
| 85,094 | Coca-Cola HBC AG (Food, Beverage & Tobacco)* | 2,590,999 | ||||||
| 36,081 | Flughafen Zurich AG (Registered) (Transportation) | 6,501,515 | ||||||
| 41,220 | Helvetia Holding AG (Registered) (Insurance) | 5,790,060 | ||||||
| 480,333 | LafargeHolcim Ltd. (Registered) (Materials)* | 24,794,061 | ||||||
| 66,431 | Lonza Group AG (Registered) (Pharmaceuticals, Biotechnology & Life Sciences)* | 23,943,895 | ||||||
| 129,259 | Nestle SA (Registered) (Food, Beverage & Tobacco) | 13,828,302 | ||||||
| 527,864 | Novartis AG (Registered) (Pharmaceuticals, Biotechnology & Life Sciences) | 46,122,263 | ||||||
| 219,384 | Roche Holding AG (Pharmaceuticals, Biotechnology & Life Sciences) | 66,024,927 | ||||||
| 99,179 | Sonova Holding AG (Registered) (Health Care Equipment & Services) | 22,759,432 | ||||||
| 45,135 | Swiss Life Holding AG (Registered) (Insurance) | 22,604,381 | ||||||
| 207,627 | Swiss Re AG (Insurance) | 21,777,734 | ||||||
| 2,361,641 | UBS Group AG (Registered) (Diversified Financials)* | 27,950,425 | ||||||
|
| |||||||
| 321,838,921 | ||||||||
|
| |||||||
| United Kingdom – 11.8% | ||||||||
| 1,324,297 | 3i Group plc (Diversified Financials) | 19,351,794 | ||||||
| 4,641,693 | Aviva plc (Insurance) | 25,018,932 | ||||||
| 926,710 | Barratt Developments plc (Consumer Durables & Apparel) | 7,578,458 | ||||||
|
| |||||||
| The accompanying notes are an integral part of these financial statements. | 31 |
GOLDMAN SACHS INTERNATIONAL EQUITY INSIGHTS FUND
Schedule of Investments(continued)
October 31, 2019
| Shares | Description | Value | ||||||
| Common Stocks – (continued) | ||||||||
| United Kingdom – (continued) | ||||||||
| 102,269 | Bellway plc (Consumer Durables & Apparel) | $ | 4,185,813 | |||||
| 620,840 | BP plc ADR (Energy) | 23,536,044 | ||||||
| 1,006,576 | Diageo plc (Food, Beverage & Tobacco) | 41,200,139 | ||||||
| 59,213 | Dialog Semiconductor plc (Semiconductors & Semiconductor Equipment)* | 2,663,420 | ||||||
| 4,094,678 | Direct Line Insurance Group plc (Insurance) | 14,436,815 | ||||||
| 719,702 | Experian plc (Commercial & Professional Services) | 22,685,954 | ||||||
| 73,257 | Fevertree Drinks plc (Food, Beverage & Tobacco) | 1,765,206 | ||||||
| 1,680,129 | Fiat Chrysler Automobiles NV (Automobiles & Components) | 26,073,545 | ||||||
| 343,720 | Great Portland Estates plc (REIT) | 3,506,692 | ||||||
| 42,770 | Greggs plc (Consumer Services) | 983,761 | ||||||
| 303,446 | GVC Holdings plc (Consumer Services) | 3,500,779 | ||||||
| 537,907 | Halma plc (Technology Hardware & Equipment) | 13,052,546 | ||||||
| 580,304 | HSBC Holdings plc (Banks) | 4,384,262 | ||||||
| 343,391 | Imperial Brands plc (Food, Beverage & Tobacco) | 7,532,441 | ||||||
| 2,024,296 | International Consolidated Airlines Group SA (Transportation) | 13,934,459 | ||||||
| 96,520 | Intertek Group plc (Commercial & Professional Services) | 6,692,292 | ||||||
| 4,557,907 | Legal & General Group plc (Insurance) | 15,580,472 | ||||||
| 11,594 | London Stock Exchange Group plc (Diversified Financials) | 1,044,838 | ||||||
| 1,916,608 | National Grid plc (Utilities) | 22,409,526 | ||||||
| 609,398 | Persimmon plc (Consumer Durables & Apparel) | 17,974,980 | ||||||
| 1,123,109 | Smith & Nephew plc (Health Care Equipment & Services) | 24,109,120 | ||||||
| 66,388 | SSP Group plc (Consumer Services) | 547,444 | ||||||
| 7,329,715 | Taylor Wimpey plc (Consumer Durables & Apparel) | 15,720,063 | ||||||
| 130,139 | Unilever NV (Household & Personal Products) | 7,692,090 | ||||||
| 219,733 | Unilever plc ADR (Household & Personal Products) | 13,208,151 | ||||||
|
| |||||||
| 360,370,036 | ||||||||
|
| |||||||
| United States – 0.6% | ||||||||
| 207,332 | Carnival plc ADR (Consumer Services) | 8,430,119 | ||||||
| 118,386 | Ferguson plc (Capital Goods) | 10,109,375 | ||||||
|
| |||||||
| 18,539,494 | ||||||||
|
| |||||||
| | TOTAL INVESTMENTS BEFORE SECURITIES LENDING REINVESTMENT VEHICLE | | ||||||
| (Cost $2,824,300,831) | $ | 3,006,865,188 | ||||||
|
| |||||||
| Shares | Dividend Rate | Value | ||||||
| Securities Lending Reinvestment Vehicle(d) – 1.0% | ||||||||
| | Goldman Sachs Financial Square Government Fund – | | ||||||
| 30,387,872 | 1.701% | $ | 30,387,872 | |||||
| (Cost $30,387,872) | ||||||||
|
| |||||||
| TOTAL INVESTMENTS – 99.6% | ||||||||
| (Cost $2,854,688,703) | $ | 3,037,253,060 | ||||||
|
| |||||||
| | OTHER ASSETS IN EXCESS OF LIABILITIES – 0.4% | 12,051,831 | ||||||
|
| |||||||
| NET ASSETS – 100.0% | $ | 3,049,304,891 | ||||||
|
| |||||||
| The percentage shown for each investment category reflects the value of investments in that category as a percentage of net assets. | ||
* | Non-income producing security. | |
(a) | Exempt from registration under Rule 144A of the Securities Act of 1933. | |
(b) | All or a portion of security is on loan. | |
(c) | Preference Shares are a special type of equity investment that shares in the earnings of the company, has limited voting rights, and receives a greater dividend than applicable Common Shares. | |
(d) | Represents an Affiliated Issuer. | |
| ||
Investment Abbreviations: | ||
ADR | —American Depositary Receipt | |
REIT | —Real Estate Investment Trust | |
| ||
| 32 | The accompanying notes are an integral part of these financial statements. |
GOLDMAN SACHS INTERNATIONAL SMALL CAP INSIGHTS FUND
Schedule of Investments
October 31, 2019
| Shares | Description | Value | ||||||
| Common Stocks – 98.7% | ||||||||
| Australia – 7.8% | ||||||||
| 1,006,349 | Altium Ltd. (Software & Services) | $ | 22,277,754 | |||||
| 695,953 | Ansell Ltd. (Health Care Equipment & Services) | 13,234,786 | ||||||
| 8,036,589 | Beach Energy Ltd. (Energy) | 12,641,389 | ||||||
| 1,003,522 | Breville Group Ltd. (Consumer Durables & Apparel) | 10,627,903 | ||||||
| 3,770,168 | BWP Trust (REIT) | 10,779,073 | ||||||
| 4,994,566 | Charter Hall Group (REIT) | 38,917,179 | ||||||
| 304,664 | Collins Foods Ltd. (Consumer Services) | 2,148,616 | ||||||
| 511,252 | Estia Health Ltd. (Health Care Equipment & Services) | 990,241 | ||||||
| 223,756 | FlexiGroup Ltd. (Diversified Financials) | 300,611 | ||||||
| 4,049,428 | G8 Education Ltd. (Consumer Services) | 7,187,736 | ||||||
| 4,686,718 | Genworth Mortgage Insurance Australia Ltd. (Banks) | 12,602,157 | ||||||
| 643,712 | GWA Group Ltd. (Capital Goods) | 1,291,172 | ||||||
| 883,146 | Independence Group NL (Materials) | 3,867,796 | ||||||
| 3,471,807 | Inghams Group Ltd. (Food, Beverage & Tobacco)(a) | 7,432,846 | ||||||
| 3,066,243 | IPH Ltd. (Commercial & Professional Services) | 17,056,545 | ||||||
| 981,797 | JB Hi-Fi Ltd. (Retailing)(a) | 25,090,489 | ||||||
| 19,809 | Lovisa Holdings Ltd. (Retailing) | 183,718 | ||||||
| 178,873 | McMillan Shakespeare Ltd. (Commercial & Professional Services) | 1,978,689 | ||||||
| 6,458,612 | Metcash Ltd. (Food & Staples Retailing) | 12,554,954 | ||||||
| 2,529,091 | Northern Star Resources Ltd. (Materials) | 17,142,991 | ||||||
| 70,174 | Perpetual Ltd. (Diversified Financials) | 1,739,680 | ||||||
| 10,060,046 | Regis Resources Ltd. (Materials) | 34,094,095 | ||||||
| 6,149,348 | Saracen Mineral Holdings Ltd. (Materials)* | 15,910,925 | ||||||
| 914,400 | SmartGroup Corp. Ltd. (Commercial & Professional Services) | 7,196,479 | ||||||
| 1,266,657 | Super Retail Group Ltd. (Retailing) | 8,321,334 | ||||||
| 2,230,462 | Tassal Group Ltd. (Food, Beverage & Tobacco) | 6,368,571 | ||||||
| 1,046,233 | Viva Energy Group Ltd. (Energy)(b) | 1,441,017 | ||||||
| 1,128,639 | Viva Energy REIT (REIT) | 2,249,192 | ||||||
| 511,372 | WiseTech Global Ltd. (Software & Services) | 9,183,600 | ||||||
|
| |||||||
| 304,811,538 | ||||||||
|
| |||||||
| Austria – 0.8% | ||||||||
| 797,297 | UNIQA Insurance Group AG (Insurance) | 7,667,415 | ||||||
| 27,914 | Vienna Insurance Group AG Wiener Versicherung Gruppe (Insurance) | 756,519 | ||||||
|
| |||||||
| Common Stocks – (continued) | ||||||||
| Austria – (continued) | ||||||||
| 823,909 | Wienerberger AG (Materials) | 22,316,061 | ||||||
|
| |||||||
| 30,739,995 | ||||||||
|
| |||||||
| Belgium – 1.2% | ||||||||
| 178,901 | D’ieteren SA/NV (Retailing) | 11,299,127 | ||||||
| 122,909 | Galapagos NV (Pharmaceuticals, Biotechnology & Life Sciences)* | 22,629,619 | ||||||
| 37,853 | Gimv NV (Diversified Financials) | 2,273,126 | ||||||
| 188,089 | KBC Ancora (Diversified Financials) | 8,967,632 | ||||||
|
| |||||||
| 45,169,504 | ||||||||
|
| |||||||
| China – 0.2% | ||||||||
| 17,686,000 | CITIC Telecom International Holdings Ltd. (Telecommunication Services) | 6,713,268 | ||||||
| 923,000 | SITC International Holdings Co. Ltd. (Transportation) | 1,016,314 | ||||||
|
| |||||||
| 7,729,582 | ||||||||
|
| |||||||
| Denmark – 1.7% | ||||||||
| 4,354 | FLSmidth & Co. A/S (Capital Goods) | 156,062 | ||||||
| 1,013,676 | GN Store Nord A/S (Health Care Equipment & Services) | 44,594,618 | ||||||
| 83,202 | Per Aarsleff Holding A/S (Capital Goods) | 2,595,871 | ||||||
| 14,333 | Rockwool International A/S Class B (Capital Goods) | 2,816,983 | ||||||
| 32,881 | Royal Unibrew A/S (Food, Beverage & Tobacco) | 2,697,533 | ||||||
| 233,688 | Scandinavian Tobacco Group A/S Class A (Food, Beverage & Tobacco)(b) | 2,761,152 | ||||||
| 119,292 | SimCorp A/S (Software & Services) | 10,673,982 | ||||||
|
| |||||||
| 66,296,201 | ||||||||
|
| |||||||
| Finland – 1.3% | ||||||||
| 363,743 | Cramo OYJ (Capital Goods) | 3,853,984 | ||||||
| 706,647 | Finnair OYJ (Transportation) | 4,614,844 | ||||||
| 48,813 | Kemira OYJ (Materials) | 792,953 | ||||||
| 77,937 | Rovio Entertainment OYJ (Media & Entertainment)(b) | 349,899 | ||||||
| 96,271 | Tokmanni Group Corp. (Retailing) | 1,232,620 | ||||||
| 234,591 | Uponor OYJ (Capital Goods) | 3,068,706 | ||||||
| 1,673,555 | Valmet OYJ (Capital Goods) | 37,455,057 | ||||||
|
| |||||||
| 51,368,063 | ||||||||
|
| |||||||
| France – 2.1% | ||||||||
| 3,045,803 | Air France-KLM (Transportation)* | 36,307,407 | ||||||
| 316,168 | Beneteau SA (Consumer Durables & Apparel) | 2,952,843 | ||||||
| 681,419 | Coface SA (Insurance) | 7,447,869 | ||||||
| 643,781 | Derichebourg SA (Commercial & Professional Services) | 2,320,894 | ||||||
|
| |||||||
| The accompanying notes are an integral part of these financial statements. | 33 |
GOLDMAN SACHS INTERNATIONAL SMALL CAP INSIGHTS FUND
Schedule of Investments(continued)
October 31, 2019
| Shares | Description | Value | ||||||
| Common Stocks – (continued) | ||||||||
| France – (continued) | ||||||||
| 178,057 | Gaztransport Et Technigaz SA (Energy) | $ | 16,245,648 | |||||
| 139,498 | IPSOS (Media & Entertainment) | 4,203,764 | ||||||
| 89,431 | Kaufman & Broad SA (Consumer Durables & Apparel) | 3,411,737 | ||||||
| 76,842 | Maisons du Monde SA (Retailing)(b) | 1,063,376 | ||||||
| 340,666 | Quadient (Technology Hardware & Equipment) | 7,295,800 | ||||||
|
| |||||||
| 81,249,338 | ||||||||
|
| |||||||
| Germany – 8.0% | ||||||||
| 783,035 | Aareal Bank AG (Banks) | 26,287,834 | ||||||
| 827,666 | alstria office REIT-AG (REIT) | 15,508,011 | ||||||
| 31,988 | Amadeus Fire AG (Commercial & Professional Services) | 4,029,559 | ||||||
| 521,878 | Borussia Dortmund GmbH & Co. KGaA (Media & Entertainment) | 4,932,878 | ||||||
| 150,495 | CANCOM SE (Software & Services) | 8,048,759 | ||||||
| 429,151 | CompuGroup Medical SE (Health Care Equipment & Services) | 27,473,483 | ||||||
| 2,245,428 | Deutsche Pfandbriefbank AG (Banks)(b) | 30,686,759 | ||||||
| 1,142,472 | Deutz AG (Capital Goods) | 6,356,338 | ||||||
| 1,620,640 | Evotec SE (Pharmaceuticals, Biotechnology & Life Sciences)*(a) | 37,121,859 | ||||||
| 396,740 | Gerresheimer AG (Pharmaceuticals, Biotechnology & Life Sciences) | 31,995,168 | ||||||
| 16,492 | Isra Vision AG (Technology Hardware & Equipment) | 780,053 | ||||||
| 434,550 | Jungheinrich AG (Preference) (Capital Goods)(c) | 11,024,611 | ||||||
| 324,888 | Nemetschek SE (Software & Services) | 16,576,573 | ||||||
| 15,660 | New Work SE (Media & Entertainment) | 4,934,032 | ||||||
| 408,514 | ProSiebenSat.1 Media SE (Media & Entertainment) | 6,032,351 | ||||||
| 297,513 | Rheinmetall AG (Capital Goods) | 35,882,057 | ||||||
| 245,781 | Siltronic AG (Semiconductors & Semiconductor Equipment) | 23,408,046 | ||||||
| 5,580 | Software AG (Software & Services) | 177,506 | ||||||
| 1,646 | STO SE & Co. KGaA (Preference) (Materials)(c) | 179,907 | ||||||
| 246,531 | Takkt AG (Retailing) | 2,931,031 | ||||||
| 534,563 | TLG Immobilien AG (Real Estate) | 15,650,200 | ||||||
|
| |||||||
| 310,017,015 | ||||||||
|
| |||||||
| Hong Kong – 1.2% | ||||||||
| 2,350,000 | Cafe de Coral Holdings Ltd. (Consumer Services) | 6,412,204 | ||||||
| 13,403,000 | Haitong International Securities Group Ltd. (Diversified Financials) | 3,886,192 | ||||||
|
| |||||||
| Common Stocks – (continued) | ||||||||
| Hong Kong – (continued) | ||||||||
| 1,282,000 | Li & Fung Ltd. (Consumer Durables & Apparel) | 140,201 | ||||||
| 9,547,000 | Melco International Development Ltd. (Consumer Services) | 25,302,850 | ||||||
| 6,560,000 | Shun Tak Holdings Ltd. (Capital Goods) | 2,689,545 | ||||||
| 653,000 | Sun Hung Kai & Co. Ltd. (Diversified Financials) | 282,259 | ||||||
| 274,000 | Sunlight REIT (REIT) | 185,882 | ||||||
| 13,677,000 | Value Partners Group Ltd. (Diversified Financials) | 7,199,869 | ||||||
|
| |||||||
| 46,099,002 | ||||||||
|
| |||||||
| Ireland – 0.1% | ||||||||
| 599,646 | C&C Group plc (Food, Beverage & Tobacco) | 2,951,655 | ||||||
| 487,311 | Greencore Group plc (Food, Beverage & Tobacco) | 1,465,107 | ||||||
| 107,248 | UDG Healthcare plc (Health Care Equipment & Services) | 1,075,082 | ||||||
|
| |||||||
| 5,491,844 | ||||||||
|
| |||||||
| Israel – 0.6% | ||||||||
| 2,060,711 | Plus500 Ltd. (Diversified Financials) | 21,354,735 | ||||||
|
| |||||||
| Italy – 3.6% | ||||||||
| 5,460,115 | A2A SpA (Utilities) | 10,961,064 | ||||||
| 230,080 | ACEA SpA (Utilities) | 4,579,031 | ||||||
| 539,401 | ASTM SpA (Transportation) | 17,001,044 | ||||||
| 542,748 | Azimut Holding SpA (Diversified Financials) | 11,160,872 | ||||||
| 1,075,311 | Banca Generali SpA (Diversified Financials) | 35,105,103 | ||||||
| 196,118 | Banca Popolare di Sondrio SCPA (Banks) | 392,218 | ||||||
| 6,957 | Biesse SpA (Capital Goods) | 87,137 | ||||||
| 399,335 | De’ Longhi SpA (Consumer Durables & Apparel) | 7,355,675 | ||||||
| 2,460,925 | Enav SpA (Transportation)(b) | 14,327,175 | ||||||
| 40,379 | Falck Renewables SpA (Utilities) | 179,977 | ||||||
| 5,228,152 | Iren SpA (Utilities) | 16,221,725 | ||||||
| 76,224 | Reply SpA (Software & Services) | 4,967,241 | ||||||
| 6,408,540 | Saras SpA (Energy) | 12,307,056 | ||||||
| 202,743 | Societa Cattolica di Assicurazioni SC (Insurance) | 1,768,571 | ||||||
| 898,652 | Unipol Gruppo SpA (Insurance) | 5,015,440 | ||||||
|
| |||||||
| 141,429,329 | ||||||||
|
| |||||||
| Japan – 34.6% | ||||||||
| 349,400 | ADEKA Corp. (Materials) | 5,000,286 | ||||||
| 4,905 | AEON REIT Investment Corp. (REIT) | 7,058,404 | ||||||
| 298,500 | AOKI Holdings, Inc. (Retailing) | 3,036,911 | ||||||
| 185,300 | Arcland Sakamoto Co. Ltd. (Retailing) | 2,185,838 | ||||||
| 143,300 | Arcs Co. Ltd. (Food & Staples Retailing) | 2,875,586 | ||||||
|
| |||||||
| 34 | The accompanying notes are an integral part of these financial statements. |
GOLDMAN SACHS INTERNATIONAL SMALL CAP INSIGHTS FUND
| Shares | Description | Value | ||||||
| Common Stocks – (continued) | ||||||||
| Japan – (continued) | ||||||||
| 42,900 | Argo Graphics, Inc. (Software & Services) | $ | 1,185,739 | |||||
| 48,800 | Aruhi Corp. (Banks)(a) | 1,097,119 | ||||||
| 17,100 | Autobacs Seven Co. Ltd. (Retailing) | 282,289 | ||||||
| 156,600 | BayCurrent Consulting, Inc. (Commercial & Professional Services) | 7,895,109 | ||||||
| 844,000 | Broadleaf Co. Ltd. (Software & Services) | 4,741,854 | ||||||
| 516,500 | Bunka Shutter Co. Ltd. (Capital Goods) | 4,483,232 | ||||||
| 753,200 | Capcom Co. Ltd. (Media & Entertainment) | 17,778,247 | ||||||
| 16,000 | Cawachi Ltd. (Food & Staples Retailing) | 326,399 | ||||||
| 216,600 | Central Glass Co. Ltd. (Capital Goods) | 5,220,819 | ||||||
| 38,700 | Chiyoda Integre Co. Ltd. (Capital Goods) | 867,448 | ||||||
| 81,400 | Chugoku Marine Paints Ltd. (Materials) | 787,006 | ||||||
| 121,600 | cocokara fine, Inc. (Food & Staples Retailing) | 6,704,860 | ||||||
| 150,900 | Computer Engineering & Consulting Ltd. (Software & Services) | 2,739,964 | ||||||
| 453,900 | Cosmo Energy Holdings Co. Ltd. (Energy) | 9,706,372 | ||||||
| 9,100 | Cosmos Pharmaceutical Corp. (Food & Staples Retailing) | 1,879,249 | ||||||
| 19,500 | Create SD Holdings Co. Ltd. (Food & Staples Retailing) | 483,138 | ||||||
| 36,600 | Daiichi Jitsugyo Co. Ltd. (Capital Goods) | 1,181,413 | ||||||
| 402,500 | Daiichikosho Co. Ltd. (Media & Entertainment) | 19,133,774 | ||||||
| 14,200 | Dainichiseika Color & Chemicals Manufacturing Co. Ltd. (Materials) | 427,331 | ||||||
| 39,600 | Daiseki Co. Ltd. (Commercial & Professional Services) | 1,150,347 | ||||||
| 653,300 | DCM Holdings Co. Ltd. (Retailing) | 6,467,145 | ||||||
| 2,038,700 | DeNA Co. Ltd. (Media & Entertainment) | 34,751,284 | ||||||
| 27,700 | Dexerials Corp. (Technology Hardware & Equipment) | 244,519 | ||||||
| 184,000 | Dowa Holdings Co. Ltd. (Materials) | 6,352,449 | ||||||
| 506,600 | DTS Corp. (Software & Services) | 10,728,978 | ||||||
| 584,300 | EDION Corp. (Retailing) | 5,806,854 | ||||||
| 253,200 | EPS Holdings, Inc. (Pharmaceuticals, Biotechnology & Life Sciences) | 3,087,468 | ||||||
| 16,700 | ESPEC Corp. (Technology Hardware & Equipment) | 301,536 | ||||||
| 29,600 | Ferrotec Holdings Corp. (Semiconductors & Semiconductor Equipment) | 293,573 | ||||||
| 721,400 | Financial Products Group Co. Ltd. (Diversified Financials) | 7,311,410 | ||||||
|
| |||||||
| Common Stocks – (continued) | ||||||||
| Japan – (continued) | ||||||||
| 33,400 | Foster Electric Co. Ltd. (Consumer Durables & Apparel) | 597,135 | ||||||
| 1,697 | Frontier Real Estate Investment Corp. (REIT) | 7,576,095 | ||||||
| 160,400 | Fuji Oil Holdings, Inc. (Food, Beverage & Tobacco) | 4,824,114 | ||||||
| 103,700 | Fujibo Holdings, Inc. (Consumer Durables & Apparel) | 3,257,683 | ||||||
| 444,200 | Fujikura Ltd. (Capital Goods) | 2,061,119 | ||||||
| 42,700 | Fukui Computer Holdings, Inc. (Software & Services) | 1,141,410 | ||||||
| 255,700 | Furukawa Electric Co. Ltd. (Capital Goods) | 7,147,159 | ||||||
| 67,300 | Fuyo General Lease Co. Ltd. (Diversified Financials) | 4,386,527 | ||||||
| 500,000 | Geo Holdings Corp. (Retailing) | 6,231,015 | ||||||
| 659,600 | Glory Ltd. (Capital Goods) | 19,420,315 | ||||||
| 269,700 | Goldcrest Co. Ltd. (Real Estate) | 5,571,172 | ||||||
| 8,700 | Goldwin, Inc. (Consumer Durables & Apparel) | 666,160 | ||||||
| 2,087,900 | Gree, Inc. (Media & Entertainment) | 9,913,373 | ||||||
| 1,245,700 | Hachijuni Bank Ltd. (The) (Banks) | 5,358,574 | ||||||
| 13,500 | Hamakyorex Co. Ltd. (Transportation) | 460,629 | ||||||
| 474,000 | Hazama Ando Corp. (Capital Goods) | 3,672,602 | ||||||
| 247,700 | Heiwa Corp. (Consumer Durables & Apparel) | 5,098,337 | ||||||
| 12,025 | Heiwa Real Estate REIT, Inc. (REIT) | 15,901,195 | ||||||
| 222,400 | Hogy Medical Co. Ltd. (Health Care Equipment & Services) | 7,421,516 | ||||||
| 1,526,500 | Hokuetsu Corp. (Materials) | 7,774,158 | ||||||
| 148,700 | Hosiden Corp. (Technology Hardware & Equipment) | 1,562,113 | ||||||
| 1,273,000 | Ibiden Co. Ltd. (Technology Hardware & Equipment) | 29,394,531 | ||||||
| 19,530 | Ichigo Office REIT Investment (REIT) | 20,092,444 | ||||||
| 220,100 | Ines Corp. (Software & Services) | 2,476,302 | ||||||
| 4,200 | Information Services International-Dentsu Ltd. (Software & Services) | 145,834 | ||||||
| 23,600 | Izumi Co. Ltd. (Retailing) | 887,793 | ||||||
| 140,500 | Jafco Co. Ltd. (Diversified Financials) | 5,277,448 | ||||||
| 560,100 | Japan Aviation Electronics Industry Ltd. (Technology Hardware & Equipment) | 10,433,997 | ||||||
| 9,172 | Japan Excellent, Inc. (REIT) | 15,789,192 | ||||||
| 5,028 | Japan Logistics Fund, Inc. (REIT) | 12,789,995 | ||||||
| 936 | Japan Rental Housing Investments, Inc. (REIT) | 897,950 | ||||||
| 3,242,000 | JVCKenwood Corp. (Consumer Durables & Apparel) | 9,449,499 | ||||||
| 179,400 | Kadokawa Corp. (Media & Entertainment) | 2,564,356 | ||||||
| 59,500 | Kanamoto Co. Ltd. (Capital Goods) | 1,590,680 | ||||||
|
| |||||||
| The accompanying notes are an integral part of these financial statements. | 35 |
GOLDMAN SACHS INTERNATIONAL SMALL CAP INSIGHTS FUND
Schedule of Investments(continued)
October 31, 2019
| Shares | Description | Value | ||||||
| Common Stocks – (continued) | ||||||||
| Japan – (continued) | ||||||||
| 1,491,300 | Kandenko Co. Ltd. (Capital Goods) | $ | 14,100,787 | |||||
| 31,800 | Kanematsu Electronics Ltd. (Software & Services) | 990,399 | ||||||
| 45,700 | Kawasaki Kisen Kaisha Ltd. (Transportation)*(a) | 680,013 | ||||||
| 38,400 | Keihin Corp. (Automobiles & Components) | 912,870 | ||||||
| 19 | Kenedix Office Investment Corp. (REIT) | 148,847 | ||||||
| 7,144 | Kenedix Retail REIT Corp. (REIT) | 19,687,512 | ||||||
| 677,200 | Kewpie Corp. (Food, Beverage & Tobacco) | 15,370,530 | ||||||
| 292,600 | Kintetsu World Express, Inc. (Transportation) | 4,732,017 | ||||||
| 830,700 | Kitz Corp. (Capital Goods) | 5,661,172 | ||||||
| 182,100 | Kohnan Shoji Co. Ltd. (Retailing) | 4,228,803 | ||||||
| 917,400 | Kokuyo Co. Ltd. (Commercial & Professional Services) | 13,462,303 | ||||||
| 572,300 | KOMEDA Holdings Co. Ltd. (Consumer Services) | 11,123,457 | ||||||
| 26,400 | Komeri Co. Ltd. (Retailing) | 565,760 | ||||||
| 37,300 | Konoike Transport Co. Ltd. (Transportation) | 568,535 | ||||||
| 2,405,700 | K’s Holdings Corp. (Retailing) | 27,485,899 | ||||||
| 231,800 | Kureha Corp. (Materials) | 14,815,218 | ||||||
| 146,500 | Kyokuto Kaihatsu Kogyo Co. Ltd. (Capital Goods) | 1,963,385 | ||||||
| 370,200 | Macnica Fuji Electronics Holdings, Inc. (Technology Hardware & Equipment) | 6,275,177 | ||||||
| 897,900 | Maeda Corp. (Capital Goods) | 8,333,253 | ||||||
| 303,600 | Makino Milling Machine Co. Ltd. (Capital Goods) | 15,094,745 | ||||||
| 453,600 | Mandom Corp. (Household & Personal Products) | 12,570,110 | ||||||
| 5,600 | Maruwa Co. Ltd. (Technology Hardware & Equipment) | 364,916 | ||||||
| 428,000 | Matsumotokiyoshi Holdings Co. Ltd. (Food & Staples Retailing) | 15,075,969 | ||||||
| 12,195 | MCUBS MidCity Investment Corp. (REIT) | 14,143,313 | ||||||
| 317,800 | Meiko Network Japan Co. Ltd. (Consumer Services)(a) | 2,823,222 | ||||||
| 24,800 | Mimasu Semiconductor Industry Co. Ltd. (Semiconductors & Semiconductor Equipment) | 484,414 | ||||||
| 34,500 | Mitsubishi Pencil Co. Ltd. (Commercial & Professional Services) | 544,758 | ||||||
| 32,900 | Mitsubishi Research Institute, Inc. (Software & Services) | 1,164,948 | ||||||
| 618,100 | Mitsui E&S Holdings Co. Ltd. (Capital Goods)* | 6,256,208 | ||||||
| 1,084,200 | Mitsui Mining & Smelting Co. Ltd. (Materials) | 30,300,844 | ||||||
| 179,300 | Mitsui Sugar Co. Ltd. (Food, Beverage & Tobacco) | 3,898,717 | ||||||
|
| |||||||
| Common Stocks – (continued) | ||||||||
| Japan – (continued) | ||||||||
| 4,000 | Morinaga & Co. Ltd. (Food, Beverage & Tobacco) | 197,598 | ||||||
| 20,300 | Nagase & Co. Ltd. (Capital Goods) | 306,957 | ||||||
| 442,500 | NEC Networks & System Integration Corp. (Software & Services) | 13,967,077 | ||||||
| 703,700 | NET One Systems Co. Ltd. (Software & Services) | 18,972,146 | ||||||
| 38,400 | Nichiha Corp. (Capital Goods) | 1,104,164 | ||||||
| 891,700 | Nichi-iko Pharmaceutical Co. Ltd. (Pharmaceuticals, Biotechnology & Life Sciences) | 10,448,052 | ||||||
| 100,300 | Nihon Chouzai Co. Ltd. (Food & Staples Retailing) | 3,652,146 | ||||||
| 259,800 | Nihon M&A Center, Inc. (Commercial & Professional Services) | 7,899,245 | ||||||
| 401,800 | Nihon Unisys Ltd. (Software & Services) | 13,263,207 | ||||||
| 322,300 | Nikkon Holdings Co. Ltd. (Transportation) | 7,834,405 | ||||||
| 435,400 | Nippon Flour Mills Co. Ltd. (Food, Beverage & Tobacco) | 6,992,273 | ||||||
| 10,796,500 | Nippon Light Metal Holdings Co. Ltd. (Materials) | 20,999,610 | ||||||
| 91,900 | Nippon Paper Industries Co. Ltd. (Materials) | 1,584,137 | ||||||
| 1,464 | NIPPON REIT Investment Corp. (REIT) | 6,358,144 | ||||||
| 278,100 | Nishi-Nippon Financial Holdings, Inc. (Banks) | 2,060,783 | ||||||
| 140,900 | Nishio Rent All Co. Ltd. (Capital Goods) | 3,785,303 | ||||||
| 374,300 | Nisshin Oillio Group Ltd. (The) (Food, Beverage & Tobacco) | 13,106,755 | ||||||
| 217,000 | Nisshinbo Holdings, Inc. (Capital Goods) | 1,806,693 | ||||||
| 21,900 | Nitto Kogyo Corp. (Capital Goods) | 460,123 | ||||||
| 82,400 | Nojima Corp. (Retailing) | 1,461,715 | ||||||
| 264,900 | Nomura Co. Ltd. (Commercial & Professional Services) | 3,269,352 | ||||||
| 12,600 | Noritake Co. Ltd. (Capital Goods) | 578,864 | ||||||
| 1,134,700 | North Pacific Bank Ltd. (Banks) | 2,439,864 | ||||||
| 263,500 | NS Solutions Corp. (Software & Services) | 8,958,508 | ||||||
| 332,000 | NSD Co. Ltd. (Software & Services) | 10,233,774 | ||||||
| 85,400 | OBIC Business Consultants Co. Ltd. (Software & Services) | 3,421,429 | ||||||
| 73,900 | Okamura Corp. (Commercial & Professional Services) | 741,107 | ||||||
| 276,250 | Okinawa Electric Power Co., Inc. (The) (Utilities) | 4,577,387 | ||||||
| 229,900 | OKUMA Corp. (Capital Goods) | 13,736,579 | ||||||
| 706 | One REIT, Inc. (REIT) | 2,218,270 | ||||||
|
| |||||||
| 36 | The accompanying notes are an integral part of these financial statements. |
GOLDMAN SACHS INTERNATIONAL SMALL CAP INSIGHTS FUND
| Shares | Description | Value | ||||||
| Common Stocks – (continued) | ||||||||
| Japan – (continued) | ||||||||
| 210,900 | Paramount Bed Holdings Co. Ltd. (Health Care Equipment & Services) | $ | 8,064,187 | |||||
| 18,232 | Premier Investment Corp. (REIT) | 27,367,415 | ||||||
| 506,400 | Pressance Corp. (Consumer Durables & Apparel) | 8,275,254 | ||||||
| 252,100 | Relia, Inc. (Commercial & Professional Services) | 3,291,486 | ||||||
| 937,500 | Rengo Co. Ltd. (Materials) | 6,797,850 | ||||||
| 23,500 | Riken Vitamin Co. Ltd. (Food, Beverage & Tobacco) | 838,050 | ||||||
| 713,600 | Riso Kyoiku Co. Ltd. (Consumer Services) | 2,739,639 | ||||||
| 1,349,400 | Round One Corp. (Consumer Services) | 17,399,962 | ||||||
| 841,300 | SAMTY Co. Ltd. (Real Estate)(a) | 15,851,260 | ||||||
| 6,500 | Sangetsu Corp. (Consumer Durables & Apparel) | 122,894 | ||||||
| 516,200 | Sanwa Holdings Corp. (Capital Goods) | 6,037,279 | ||||||
| 299,800 | Sato Holdings Corp. (Commercial & Professional Services) | 8,825,046 | ||||||
| 340,100 | Sawai Pharmaceutical Co. Ltd. (Pharmaceuticals, Biotechnology & Life Sciences) | 19,190,787 | ||||||
| 602,000 | SCSK Corp. (Software & Services) | 30,644,435 | ||||||
| 748,200 | Seiko Holdings Corp. (Consumer Durables & Apparel) | 18,372,790 | ||||||
| 811,900 | Seino Holdings Co. Ltd. (Transportation) | 10,439,403 | ||||||
| 25,819 | Sekisui House Reit, Inc. (REIT) | 23,829,149 | ||||||
| 38,800 | Shikoku Electric Power Co., Inc. (Utilities) | 384,640 | ||||||
| 121,200 | Shimachu Co. Ltd. (Retailing) | 3,287,707 | ||||||
| 29,200 | Shin-Etsu Polymer Co. Ltd. (Materials) | 250,206 | ||||||
| 1,576,500 | Shinko Electric Industries Co. Ltd. (Semiconductors & Semiconductor Equipment) | 15,385,697 | ||||||
| 70,600 | Ship Healthcare Holdings, Inc. (Health Care Equipment & Services) | 3,009,096 | ||||||
| 138,300 | Sintokogio Ltd. (Capital Goods) | 1,334,108 | ||||||
| 1,546,100 | SKY Perfect JSAT Holdings, Inc. (Media & Entertainment) | 6,385,392 | ||||||
| 114,100 | St Marc Holdings Co. Ltd. (Consumer Services) | 2,545,250 | ||||||
| 3,017 | Star Asia Investment Corp. (REIT) | 3,284,307 | ||||||
| 76,900 | Starts Corp., Inc. (Consumer Durables & Apparel) | 1,983,264 | ||||||
| 223,800 | Sugi Holdings Co. Ltd. (Food & Staples Retailing) | 12,422,546 | ||||||
| 536,000 | Sumitomo Warehouse Co. Ltd. (The) (Transportation) | 7,264,159 | ||||||
| 110,600 | Taiyo Yuden Co. Ltd. (Technology Hardware & Equipment) | 2,924,922 | ||||||
| 92,400 | Takara Holdings, Inc. (Food, Beverage & Tobacco) | 917,213 | ||||||
| 2,482,000 | Takara Leben Co. Ltd. (Real Estate) | 10,566,448 | ||||||
|
| |||||||
| Common Stocks – (continued) | ||||||||
| Japan – (continued) | ||||||||
| 43,900 | Takasago Thermal Engineering Co. Ltd. (Capital Goods) | 794,209 | ||||||
| 149,300 | Takashimaya Co. Ltd. (Retailing) | 1,733,078 | ||||||
| 857,800 | Takuma Co. Ltd. (Capital Goods) | 10,207,745 | ||||||
| 386,100 | Tanseisha Co. Ltd. (Commercial & Professional Services) | 4,058,913 | ||||||
| 769,500 | TIS, Inc. (Software & Services) | 46,657,503 | ||||||
| 16,500 | TKC Corp. (Software & Services) | 695,079 | ||||||
| 111,100 | Toa Corp. (Capital Goods) | 1,494,668 | ||||||
| 716,300 | Toho Holdings Co. Ltd. (Health Care Equipment & Services) | 18,167,101 | ||||||
| 1,726,100 | Tokyo Dome Corp. (Consumer Services) | 15,223,661 | ||||||
| 150,600 | Tokyo Seimitsu Co. Ltd. (Semiconductors & Semiconductor Equipment) | 4,837,136 | ||||||
| 1,970,800 | Tokyo Tatemono Co. Ltd. (Real Estate) | 28,039,531 | ||||||
| 135,300 | Tokyotokeiba Co. Ltd. (Consumer Services) | 4,272,368 | ||||||
| 1,020,900 | Tosei Corp. (Real Estate) | 12,877,400 | ||||||
| 530,600 | Towa Pharmaceutical Co. Ltd. (Pharmaceuticals, Biotechnology & Life Sciences) | 13,606,056 | ||||||
| 43,100 | Toyo Ink SC Holdings Co. Ltd. (Materials) | 1,050,438 | ||||||
| 287,200 | Toyo Tanso Co. Ltd. (Capital Goods) | 6,785,827 | ||||||
| 70,500 | Transcosmos, Inc. (Software & Services) | 1,773,523 | ||||||
| 204,700 | Ube Industries Ltd. (Materials) | 4,382,868 | ||||||
| 208,500 | Universal Entertainment Corp. (Consumer Durables & Apparel)(a) | 6,957,625 | ||||||
| 260,100 | Ushio, Inc. (Capital Goods) | 3,887,154 | ||||||
| 413,100 | Vision, Inc. (Telecommunication Services)* | 6,058,189 | ||||||
| 99,700 | Wacoal Holdings Corp. (Consumer Durables & Apparel) | 2,621,254 | ||||||
| 268,900 | Wakita & Co. Ltd. (Capital Goods) | 2,718,043 | ||||||
| 67,100 | Yamaguchi Financial Group, Inc. (Banks) | 470,794 | ||||||
| 305,200 | Yellow Hat Ltd. (Retailing) | 4,968,791 | ||||||
| 374,600 | Zenrin Co. Ltd. (Media & Entertainment) | 6,784,206 | ||||||
| 16,000 | Zeon Corp. (Materials) | 182,267 | ||||||
|
| |||||||
| 1,347,007,408 | ||||||||
|
| |||||||
| Jersey – 0.0% | ||||||||
| 243,139 | Sanne Group plc (Diversified Financials) | 1,662,936 | ||||||
|
| |||||||
| Netherlands – 5.1% | ||||||||
| 387,442 | ASM International NV (Semiconductors & Semiconductor Equipment) | 39,062,599 | ||||||
| 1,086,973 | ASR Nederland NV (Insurance) | 39,846,917 | ||||||
|
| |||||||
| The accompanying notes are an integral part of these financial statements. | 37 |
GOLDMAN SACHS INTERNATIONAL SMALL CAP INSIGHTS FUND
Schedule of Investments(continued)
October 31, 2019
| Shares | Description | Value | ||||||
| Common Stocks – (continued) | ||||||||
| Netherlands – (continued) | ||||||||
| 991,689 | BE Semiconductor Industries NV (Semiconductors & Semiconductor Equipment) | $ | 36,764,741 | |||||
| 308,115 | Euronext NV (Diversified Financials)(b) | 24,856,302 | ||||||
| 223,262 | Intertrust NV (Commercial & Professional Services)(b) | 4,250,099 | ||||||
| 277,953 | Koninklijke Volkerwessels NV (Capital Goods) | 6,462,860 | ||||||
| 1,429,393 | Signify NV (Capital Goods)(b) | 41,881,343 | ||||||
| 349,050 | SRH NV (Diversified Financials)*(a)(d) | — | ||||||
| 555,264 | TomTom NV (Consumer Durables & Apparel)* | 6,288,113 | ||||||
|
| |||||||
| 199,412,974 | ||||||||
|
| |||||||
| New Zealand – 0.3% | ||||||||
| 2,861,896 | Air New Zealand Ltd. (Transportation) | 5,181,045 | ||||||
| 1,667,343 | Contact Energy Ltd. (Utilities) | 7,885,876 | ||||||
|
| |||||||
| 13,066,921 | ||||||||
|
| |||||||
| Norway – 2.5% | ||||||||
| 20,549 | Atea ASA (Software & Services)* | 259,645 | ||||||
| 955,993 | Austevoll Seafood ASA (Food, Beverage & Tobacco) | 9,653,692 | ||||||
| 5,868,545 | Elkem ASA (Materials)(b) | 13,947,968 | ||||||
| 215,531 | Entra ASA (Real Estate)(b) | 3,227,614 | ||||||
| 1,444,967 | Europris ASA (Retailing)(b) | 3,921,459 | ||||||
| 411,643 | Golden Ocean Group Ltd. (Transportation) | 2,379,739 | ||||||
| 638,642 | Grieg Seafood ASA (Food, Beverage & Tobacco) | 7,832,081 | ||||||
| 1,337,864 | Leroy Seafood Group ASA (Food, Beverage & Tobacco) | 8,987,099 | ||||||
| 333,210 | Nordic Semiconductor ASA (Semiconductors & Semiconductor Equipment)* | 1,897,883 | ||||||
| 588,615 | Salmar ASA (Food, Beverage & Tobacco) | 27,469,318 | ||||||
| 351,218 | SpareBank 1 Nord Norge (Banks) | 2,724,643 | ||||||
| 524,953 | SpareBank 1 SMN (Banks) | 5,656,168 | ||||||
| 635,250 | Storebrand ASA (Insurance) | 4,490,897 | ||||||
| 296,580 | Veidekke ASA (Capital Goods) | 3,216,054 | ||||||
|
| |||||||
| 95,664,260 | ||||||||
|
| |||||||
| Portugal – 0.3% | ||||||||
| 369,976 | Altri SGPS SA (Materials) | 2,258,387 | ||||||
| 1,240,592 | NOS SGPS SA (Media & Entertainment) | 7,375,630 | ||||||
| 129,740 | Sonae SGPS SA (Food & Staples Retailing) | 130,900 | ||||||
|
| |||||||
| 9,764,917 | ||||||||
|
| |||||||
| Singapore – 0.2% | ||||||||
| 1,383,100 | China Aviation Oil Singapore Corp. Ltd. (Energy) | 1,238,613 | ||||||
|
| |||||||
| Common Stocks – (continued) | ||||||||
| Singapore – (continued) | ||||||||
| 252,400 | Japfa Ltd. (Food, Beverage & Tobacco) | 90,870 | ||||||
| 269,500 | Parkway Life REIT (REIT) | 647,619 | ||||||
| 6,028,610 | Yanlord Land Group Ltd. (Real Estate) | 5,350,784 | ||||||
|
| |||||||
| 7,327,886 | ||||||||
|
| |||||||
| Spain – 2.4% | ||||||||
| 451,567 | Applus Services SA (Commercial & Professional Services) | 5,456,922 | ||||||
| 23,475 | Befesa SA (Commercial & Professional Services)(b) | 870,982 | ||||||
| 696,190 | Cia de Distribucion Integral Logista Holdings SA (Transportation) | 14,597,031 | ||||||
| 125,386 | Construcciones y Auxiliar de Ferrocarriles SA (Capital Goods) | 5,628,681 | ||||||
| 537,432 | Ence Energia y Celulosa SA (Materials) | 2,122,245 | ||||||
| 732,601 | Global Dominion Access SA (Software & Services)*(b) | 3,072,183 | ||||||
| 803,964 | Lar Espana Real Estate Socimi SA (REIT) | 7,280,888 | ||||||
| 30,191 | Let’s GOWEX SA (Telecommunication Services)*(d)(e) | — | ||||||
| 3,180,159 | Merlin Properties Socimi SA (REIT) | 46,814,577 | ||||||
| 540,029 | Neinor Homes SA (Consumer Durables & Apparel)*(b) | 7,119,488 | ||||||
| 24,696 | Talgo SA (Capital Goods)*(b) | 154,361 | ||||||
|
| |||||||
| 93,117,358 | ||||||||
|
| |||||||
| Sweden – 4.8% | ||||||||
| 1,700,731 | Arjo AB Class B (Health Care Equipment & Services) | 7,014,372 | ||||||
| 528,745 | Betsson AB (Consumer Services)* | 2,604,384 | ||||||
| 639,909 | Bilia AB Class A (Retailing) | 6,421,706 | ||||||
| 223,477 | BillerudKorsnas AB (Materials) | 2,687,776 | ||||||
| 6,938 | BioGaia AB Class B (Pharmaceuticals, Biotechnology & Life Sciences) | 264,351 | ||||||
| 457,137 | Biotage AB (Pharmaceuticals, Biotechnology & Life Sciences) | 4,722,289 | ||||||
| 408,924 | Bure Equity AB (Diversified Financials) | 6,320,688 | ||||||
| 391,824 | Castellum AB (Real Estate) | 8,007,177 | ||||||
| 1,417,024 | Cloetta AB Class B (Food, Beverage & Tobacco) | 4,811,551 | ||||||
| 804,128 | Dios Fastigheter AB (Real Estate) | 6,699,004 | ||||||
| 305,716 | Dometic Group AB (Automobiles & Components)(b) | 2,838,338 | ||||||
| 5,496 | Evolution Gaming Group AB (Consumer Services)(b) | 131,452 | ||||||
| 1,880,677 | Getinge AB Class B (Health Care Equipment & Services) | 32,153,094 | ||||||
| 2,022,443 | Hemfosa Fastigheter AB (Real Estate) | 20,830,386 | ||||||
| 689,874 | Hexpol AB (Materials) | 6,155,175 | ||||||
|
| |||||||
| 38 | The accompanying notes are an integral part of these financial statements. |
GOLDMAN SACHS INTERNATIONAL SMALL CAP INSIGHTS FUND
| Shares | Description | Value | ||||||
| Common Stocks – (continued) | ||||||||
| Sweden – (continued) | ||||||||
| 87,962 | Holmen AB Class B (Materials) | $ | 2,595,818 | |||||
| 1,406,594 | Klovern AB Class B (Real Estate) | 2,456,921 | ||||||
| 271,897 | Kungsleden AB (Real Estate) | 2,470,803 | ||||||
| 836,049 | Lindab International AB (Capital Goods) | 9,351,511 | ||||||
| 7,609 | Loomis AB Class B (Commercial & Professional Services) | 294,616 | ||||||
| 418,647 | Mycronic AB (Technology Hardware & Equipment) | 6,968,454 | ||||||
| 3,291,742 | NetEnt AB (Consumer Services)* | 9,306,892 | ||||||
| 1,603,059 | Nobia AB (Consumer Durables & Apparel) | 10,235,535 | ||||||
| 1,347,811 | Nobina AB (Transportation)(b) | 8,537,699 | ||||||
| 214,295 | Nolato AB Class B (Capital Goods) | 12,006,901 | ||||||
| 398,492 | Resurs Holding AB (Diversified Financials)(b) | 2,346,771 | ||||||
| 742,003 | Svenska Cellulosa AB SCA Class B (Materials) | 7,571,496 | ||||||
| 44,571 | Trelleborg AB Class B (Capital Goods) | 720,742 | ||||||
| 143,894 | Vitrolife AB (Pharmaceuticals, Biotechnology & Life Sciences) | 2,245,114 | ||||||
|
| |||||||
| 188,771,016 | ||||||||
|
| |||||||
| Switzerland – 4.6% | ||||||||
| 112,264 | Bucher Industries AG (Registered) (Capital Goods) | 34,748,186 | ||||||
| 18,428 | dormakaba Holding AG Class B (Capital Goods)* | 11,804,468 | ||||||
| 218,178 | Flughafen Zurich AG (Registered) (Transportation) | 39,313,977 | ||||||
| 2,887 | Forbo Holding AG (Registered) (Consumer Durables & Apparel) | 4,600,409 | ||||||
| 260,024 | Helvetia Holding AG (Registered) (Insurance) | 36,524,855 | ||||||
| 201,663 | Huber + Suhner AG (Registered) (Capital Goods) | 13,435,364 | ||||||
| 1,905 | Inficon Holding AG (Registered) (Technology Hardware & Equipment) | 1,365,266 | ||||||
| 38,410 | Kardex AG (Registered) (Capital Goods) | 5,581,710 | ||||||
| 1,060,953 | OC Oerlikon Corp. AG (Registered) (Capital Goods) | 10,887,663 | ||||||
| 320 | Siegfried Holding AG (Registered) (Pharmaceuticals, Biotechnology & Life Sciences)* | 130,442 | ||||||
| 94,025 | Tecan Group AG (Registered) (Pharmaceuticals, Biotechnology & Life Sciences) | 22,244,381 | ||||||
|
| |||||||
| 180,636,721 | ||||||||
|
| |||||||
| United Kingdom – 15.3% | ||||||||
| 1,122,071 | Abcam plc (Pharmaceuticals, Biotechnology & Life Sciences) | 16,918,445 | ||||||
| 28,136 | Aggreko plc (Commercial & Professional Services) | 288,451 | ||||||
|
| |||||||
| Common Stocks – (continued) | ||||||||
| United Kingdom – (continued) | ||||||||
| 1,034,182 | Ascential plc (Media & Entertainment)(b) | 4,685,910 | ||||||
| 2,244,569 | Assura plc (REIT) | 2,174,812 | ||||||
| 2,353,305 | B&M European Value Retail SA (Retailing) | 11,289,715 | ||||||
| 779,425 | Beazley plc (Insurance) | 5,923,884 | ||||||
| 1,039,174 | Bellway plc (Consumer Durables & Apparel) | 42,532,811 | ||||||
| 96,644 | Big Yellow Group plc (REIT) | 1,430,308 | ||||||
| 1,055,949 | Bodycote plc (Capital Goods) | 9,790,678 | ||||||
| 8,581,216 | boohoo Group plc (Retailing)* | 29,333,862 | ||||||
| 1,115,790 | Bovis Homes Group plc (Consumer Durables & Apparel) | 16,910,461 | ||||||
| 245,069 | Brewin Dolphin Holdings plc (Diversified Financials) | 1,056,463 | ||||||
| 433,335 | Britvic plc (Food, Beverage & Tobacco) | 5,537,934 | ||||||
| 214,406 | Close Brothers Group plc (Diversified Financials) | 3,844,563 | ||||||
| 480,277 | Computacenter plc (Software & Services) | 8,499,137 | ||||||
| 289,315 | ConvaTec Group plc (Health Care Equipment & Services)(b) | 739,120 | ||||||
| 859,221 | Daily Mail & General Trust plc Class A (Media & Entertainment) | 9,784,234 | ||||||
| 85,230 | Dart Group plc (Transportation) | 1,396,594 | ||||||
| 334,404 | Dialog Semiconductor plc (Semiconductors & Semiconductor Equipment)* | 15,041,602 | ||||||
| 223,995 | Diploma plc (Capital Goods) | 4,639,529 | ||||||
| 1,091,106 | Drax Group plc (Utilities) | 4,194,650 | ||||||
| 302,222 | Dunelm Group plc (Retailing) | 3,090,760 | ||||||
| 96,488 | Empiric Student Property plc (REIT) | 117,487 | ||||||
| 310,997 | Euromoney Institutional Investor plc (Media & Entertainment) | 5,688,241 | ||||||
| 626,341 | Fevertree Drinks plc (Food, Beverage & Tobacco) | 15,092,362 | ||||||
| 95,389 | Forterra plc (Materials)(b) | 330,529 | ||||||
| 48,178 | Games Workshop Group plc (Consumer Durables & Apparel) | 2,789,693 | ||||||
| 53,546 | Go-Ahead Group plc (The) (Transportation) | 1,417,265 | ||||||
| 3,947,985 | Great Portland Estates plc (REIT) | 40,278,039 | ||||||
| 960,275 | Greggs plc (Consumer Services) | 22,087,463 | ||||||
| 6,520,630 | Hansteen Holdings plc (REIT) | 8,658,235 | ||||||
| 1,948,692 | Hays plc (Commercial & Professional Services) | 3,965,724 | ||||||
| 1,864,050 | HomeServe plc (Commercial & Professional Services) | 27,985,180 | ||||||
| 848,012 | Howden Joinery Group plc (Capital Goods) | 6,346,762 | ||||||
| 3,104,037 | Ibstock plc (Materials)(b) | 9,699,591 | ||||||
| 5,114,574 | IG Group Holdings plc (Diversified Financials) | 42,096,287 | ||||||
| 1,320,966 | Inchcape plc (Retailing) | 11,044,002 | ||||||
|
| |||||||
| The accompanying notes are an integral part of these financial statements. | 39 |
GOLDMAN SACHS INTERNATIONAL SMALL CAP INSIGHTS FUND
Schedule of Investments(continued)
October 31, 2019
| Shares | Description | Value | ||||||
| Common Stocks – (continued) | ||||||||
| United Kingdom – (continued) | ||||||||
| 885,335 | Intermediate Capital Group plc (Diversified Financials) | $ | 17,038,903 | |||||
| 2,426,469 | JD Sports Fashion plc (Retailing) | 24,137,345 | ||||||
| 3,102,687 | Jupiter Fund Management plc (Diversified Financials) | 13,775,371 | ||||||
| 12,450,901 | Man Group plc (Diversified Financials) | 23,173,330 | ||||||
| 613,880 | Marshalls plc (Materials) | 5,657,773 | ||||||
| 6,362,029 | Moneysupermarket.com Group plc (Retailing) | 28,308,869 | ||||||
| 404,885 | OneSavings Bank plc (Banks) | 1,888,689 | ||||||
| 1,167,321 | Pagegroup plc (Commercial & Professional Services) | 6,725,805 | ||||||
| 1,409,222 | Paragon Banking Group plc (Banks) | 9,186,255 | ||||||
| 1,395,819 | Playtech plc (Consumer Services) | 7,104,518 | ||||||
| 554,555 | QinetiQ Group plc (Capital Goods) | 2,260,724 | ||||||
| 637,485 | Redrow plc (Consumer Durables & Apparel) | 4,969,723 | ||||||
| 224,750 | Regional REIT Ltd. (REIT)(b) | 306,894 | ||||||
| 3,954,649 | Rotork plc (Capital Goods) | 15,443,599 | ||||||
| 422,528 | RWS Holdings plc (Commercial & Professional Services) | 3,283,930 | ||||||
| 1,164,032 | Safestore Holdings plc (REIT) | 10,562,341 | ||||||
| 1,852,968 | SSP Group plc (Consumer Services) | 15,279,823 | ||||||
| 38,643 | St Modwen Properties plc (Real Estate) | 225,564 | ||||||
| 113,887 | Stagecoach Group plc (Transportation) | 202,550 | ||||||
| 28,806 | Travis Perkins plc (Capital Goods) | 535,047 | ||||||
| 4,750,559 | Tritax Big Box REIT plc (REIT) | 9,252,835 | ||||||
| 20,363 | Ultra Electronics Holdings plc (Capital Goods) | 514,325 | ||||||
|
| |||||||
| 596,534,996 | ||||||||
|
| |||||||
| | TOTAL INVESTMENTS BEFORE SECURITIES LENDING REINVESTMENT VEHICLE | | ||||||
| (Cost $3,611,658,761) | $ | 3,844,723,539 | ||||||
|
| |||||||
| Shares | Dividend Rate | Value | ||||||
| Securities Lending Reinvestment Vehicle(f) – 0.8% | ||||||||
| | Goldman Sachs Financial Square Government Fund – | | ||||||
| 32,107,743 | 1.701% | $ | 32,107,743 | |||||
| (Cost $32,107,743) | ||||||||
|
| |||||||
| TOTAL INVESTMENTS – 99.5% | ||||||||
| (Cost $3,643,766,504) | $ | 3,876,831,282 | ||||||
|
| |||||||
| | OTHER ASSETS IN EXCESS OF LIABILITIES – 0.5% | 19,852,857 | ||||||
|
| |||||||
| NET ASSETS – 100.0% | $ | 3,896,684,139 | ||||||
|
| |||||||
| The percentage shown for each investment category reflects the value of investments in that category as a percentage of net assets. | ||
* | Non-income producing security. | |
(a) | All or a portion of security is on loan. | |
(b) | Exempt from registration under Rule 144A of the Securities Act of 1933. | |
(c) | Preference Shares are a special type of equity investment that shares in the earnings of the company, has limited voting rights, and receives a greater dividend than applicable Common Shares. | |
(d) | Significant unobservable inputs were used in the valuation of this portfolio security; i.e., Level 3. | |
(e) | Restricted securities are not registered under the Securities Act of 1933 and are subject to legal restrictions on resale. These securities generally may be resold in transactions exempt from registration or to the public if the securities are subsequently registered and the registration statement is effective. Disposal of these securities may involve time consuming negotiations and prompt sale at an acceptable price may be difficult. Total market value of restricted securities amounts to $–, which represents approximately 0.0% of the Fund’s net assets as of October 31, 2019. | |
| Restricted Security | Acquisition Date | Cost | ||||||||
| Let’s GOWEX SA(Common Stocks) | 05/14/14 - 05/30/14 | $ | 782,023 | |||||||
(f) | Represents an Affiliated Issuer. | |
| ||
Investment Abbreviation: | ||
REIT | —Real Estate Investment Trust | |
| ||
| ADDITIONAL INVESTMENT INFORMATION |
FUTURES CONTRACTS — At October 31, 2019, the Fund had the following futures contracts:
| Description | Number of Contracts | Expiration Date | Notional Amount | Unrealized Appreciation/ (Depreciation) | ||||||||||||
Long position contracts: | ||||||||||||||||
Hang Seng Index | 5 | 11/28/2019 | $ | 860,904 | $ | 8,231 | ||||||||||
| 40 | The accompanying notes are an integral part of these financial statements. |
GOLDMAN SACHS INTERNATIONAL EQUITY INSIGHTS FUNDS
Statements of Assets and Liabilities
October 31, 2019
| Emerging Markets Equity Insights Fund | International Equity Insights Fund | International Small Cap Insights Fund | ||||||||||||
| Assets: |
| |||||||||||||
Investments in unaffiliated issuers, at value (cost $1,620,520,709, $2,824,300,831 and $3,611,658,761)(a) | $ | 1,779,315,774 | $ | 3,006,865,188 | $ | 3,844,723,539 | ||||||||
Investments in affiliated securities lending reinvestment vehicle, at value (cost $121,709, $30,387,872 and $32,107,743) | 121,709 | 30,387,872 | 32,107,743 | |||||||||||
Cash | 5,060,032 | 5,582,907 | 5,288,877 | |||||||||||
Foreign currencies, at value (cost $3,411,077, $8,880,176 and $26,367,499) | 3,419,789 | 8,909,070 | 26,587,388 | |||||||||||
Receivables: | ||||||||||||||
Investments sold | 40,047,846 | 76,639,652 | 53,777,537 | |||||||||||
Dividends | 1,404,130 | 8,705,912 | 11,281,898 | |||||||||||
Fund shares sold | 828,361 | 2,686,911 | 8,334,908 | |||||||||||
Foreign tax reclaims | 275,860 | 4,128,540 | 5,816,120 | |||||||||||
Reimbursement from investment adviser | 193,738 | 213,192 | 313,479 | |||||||||||
Securities lending income | 4,956 | 10,131 | 32,547 | |||||||||||
Due from custodian | — | — | 3,424,823 | |||||||||||
Collateral on certain derivative contracts(b) | — | — | 66,520 | |||||||||||
Variation margin on futures | — | 3,047 | 11,654 | |||||||||||
Other assets | 82,880 | 113,244 | 87,716 | |||||||||||
| Total assets | 1,830,755,075 | 3,144,245,666 | 3,991,854,749 | |||||||||||
| Liabilities: |
| |||||||||||||
Payables: | ||||||||||||||
Investments purchased | 39,902,576 | 56,405,335 | 53,669,222 | |||||||||||
Fund shares redeemed | 5,353,632 | 5,269,439 | 4,972,921 | |||||||||||
Management fees | 1,517,624 | 1,905,585 | 2,624,275 | |||||||||||
Foreign capital gains taxes | 142,984 | — | — | |||||||||||
Payable upon return of securities loaned | 121,709 | 30,387,872 | 32,107,743 | |||||||||||
Distribution and Service fees and Transfer Agency fees | 115,899 | 262,111 | 249,863 | |||||||||||
Accrued expenses | 1,003,933 | 710,433 | 1,546,586 | |||||||||||
| Total liabilities | 48,158,357 | 94,940,775 | 95,170,610 | |||||||||||
| Net Assets: |
| |||||||||||||
Paid-in capital | 1,781,779,428 | 3,031,788,561 | 3,895,472,797 | |||||||||||
Total distributable earnings (loss) | 817,290 | 17,516,330 | 1,211,342 | |||||||||||
| NET ASSETS | $ | 1,782,596,718 | $ | 3,049,304,891 | $ | 3,896,684,139 | ||||||||
Net Assets: | ||||||||||||||
Class A | $ | 72,886,106 | $ | 237,898,209 | $ | 163,427,439 | ||||||||
Class C | 8,302,683 | 22,426,853 | 51,727,705 | |||||||||||
Institutional | 938,156,810 | 1,256,781,958 | 2,134,382,319 | |||||||||||
Service | — | 5,385,700 | — | |||||||||||
Investor | 118,727,179 | 549,732,048 | 274,078,894 | |||||||||||
Class P | 125,428,703 | 372,535,646 | 80,925,665 | |||||||||||
Class R | 27,789,710 | 9,280,537 | — | |||||||||||
Class R6 | 491,305,527 | 595,263,940 | 1,192,142,117 | |||||||||||
Total Net Assets | $ | 1,782,596,718 | $ | 3,049,304,891 | $ | 3,896,684,139 | ||||||||
Shares outstanding $0.001 par value (unlimited shares authorized): | ||||||||||||||
Class A | 7,806,682 | 19,094,818 | 13,886,040 | |||||||||||
Class C | 903,516 | 1,848,773 | 4,563,040 | |||||||||||
Institutional | 100,510,255 | 97,994,203 | 181,211,282 | |||||||||||
Service | — | 428,476 | — | |||||||||||
Investor | 12,745,731 | 44,965,265 | 23,387,797 | |||||||||||
Class P | 13,448,175 | 29,089,546 | 6,856,785 | |||||||||||
Class R | 3,019,701 | 767,098 | — | |||||||||||
Class R6 | 52,678,004 | 46,446,893 | 100,999,009 | |||||||||||
Net asset value, offering and redemption price per share:(c) | ||||||||||||||
Class A | $ | 9.34 | $ | 12.46 | $ | 11.77 | ||||||||
Class C | 9.19 | 12.13 | 11.34 | |||||||||||
Institutional | 9.33 | 12.83 | 11.78 | |||||||||||
Service | — | 12.57 | — | |||||||||||
Investor | 9.32 | 12.23 | 11.72 | |||||||||||
Class P | 9.33 | 12.81 | 11.80 | |||||||||||
Class R | 9.20 | 12.10 | — | |||||||||||
Class R6 | 9.33 | 12.82 | 11.80 | |||||||||||
| (a) | Includes loaned securities having a market value of $115,665, $29,110,401 and $30,634,072, for the Emerging Markets Equity Insights, International Equity Insights and International Small Cap Insights Funds, respectively. |
| (b) | Includes amount segregated for initial margin and/or collateral on futures transactions for the International Small Cap Insights Fund. |
| (c) | Maximum public offering price per share for Class A Shares of the Emerging Markets Equity Insights, International Equity Insights and International Small Cap Insights Funds is $9.88, $13.19 and $12.46, respectively. At redemption, Class C Shares may be subject to a contingent deferred sales charge assessed on the amount equal to the lesser of the current NAV or the original purchase price of the shares. |
| The accompanying notes are an integral part of these financial statements. | 41 |
GOLDMAN SACHS INTERNATIONAL EQUITY INSIGHTS FUNDS
Statements of Operations
For the Fiscal Year Ended October 31, 2019
| Emerging Markets Equity Insights Fund | International Equity Insights Fund | International Small Cap Insights Fund | ||||||||||||
| Investment income: |
| |||||||||||||
Dividends — unaffiliated issuers (net of foreign taxes withheld of $5,242,222, $9,205,514 and $11,199,809) | $ | 58,510,321 | $ | 91,470,225 | $ | 109,829,256 | ||||||||
Securities lending income — affiliated issuer | 319,428 | 911,015 | 1,310,378 | |||||||||||
Dividends — affiliated issuers | 20,373 | 127,553 | 6,723 | |||||||||||
| Total investment income | 58,850,122 | 92,508,793 | 111,146,357 | |||||||||||
| Expenses: |
| |||||||||||||
Management fees | 19,163,924 | 21,466,180 | 31,779,625 | |||||||||||
Custody, accounting and administrative services | 1,786,597 | 861,727 | 1,562,049 | |||||||||||
Transfer Agency fees(a) | 1,031,543 | 2,017,546 | 2,234,327 | |||||||||||
Distribution and Service fees(a) | 401,746 | 817,238 | 988,335 | |||||||||||
Printing and mailing costs | 263,181 | 306,490 | 910,104 | |||||||||||
Registration fees | 200,453 | 325,919 | 570,864 | |||||||||||
Professional fees | 128,502 | 129,139 | 129,317 | |||||||||||
Trustee fees | 19,143 | 20,913 | 22,666 | |||||||||||
Service share fees — Service and Shareholder Administration Plan | — | 25,568 | — | |||||||||||
Other | 229,915 | 230,329 | 546,523 | |||||||||||
| Total expenses | 23,225,004 | 26,201,049 | 38,743,810 | |||||||||||
Less — expense reductions | (1,554,261 | ) | (1,809,224 | ) | (2,845,387 | ) | ||||||||
| Net expenses | 21,670,743 | 24,391,825 | 35,898,423 | |||||||||||
| NET INVESTMENT INCOME | 37,179,379 | 68,116,968 | 75,247,934 | |||||||||||
| Realized and unrealized gain (loss): |
| |||||||||||||
Net realized gain (loss) from: | ||||||||||||||
Investments — unaffiliated issuers | (149,475,598 | ) | (212,021,718 | ) | (257,524,573 | ) | ||||||||
Futures contracts | (1,972,516 | ) | 2,455,133 | (5,964,532 | ) | |||||||||
Foreign currency transactions | (3,823,235 | ) | (2,280,291 | ) | (805,113 | ) | ||||||||
Net change in unrealized gain on: |
| |||||||||||||
Investments — unaffiliated issuers (including the effects of the net change in the foreign capital gains tax liability of $704,863, $0 and $0) | 227,576,874 | 341,694,807 | 422,819,928 | |||||||||||
Futures contracts | — | 1,587,009 | 3,394,640 | |||||||||||
Foreign currency translation | 1,274,047 | 731,590 | 1,481,384 | |||||||||||
| Net realized and unrealized gain | 73,579,572 | 132,166,530 | 163,401,734 | |||||||||||
| NET INCREASE IN NET ASSETS RESULTING FROM OPERATIONS | $ | 110,758,951 | $ | 200,283,498 | $ | 238,649,668 | ||||||||
| (a) | Class specific Distribution and/or Service, and Transfer Agency fees were as follows: |
| Distribution and/or Service Fees | Transfer Agency Fees | |||||||||||||||||||||||||||||||||||||||||||
Fund | Class A | Class C | Class R | Class A | Class C | Institutional | Service | Investor | Class P | Class R | Class R6 | |||||||||||||||||||||||||||||||||
Emerging Markets Equity Insights | $ | 199,501 | $ | 92,086 | $ | 110,159 | $ | 141,061 | $ | 16,279 | $ | 418,751 | $ | — | $ | 227,603 | $ | 41,344 | $ | 38,871 | $ | 147,634 | ||||||||||||||||||||||
International Equity Insights | 500,462 | 272,995 | 43,781 | 352,210 | 48,343 | 510,848 | 2,045 | 820,318 | 106,576 | 15,450 | 161,756 | |||||||||||||||||||||||||||||||||
International Small Cap Insights | 404,645 | 583,690 | — | 285,957 | 103,276 | 864,027 | — | 625,178 | 23,715 | — | 332,174 | |||||||||||||||||||||||||||||||||
| 42 | The accompanying notes are an integral part of these financial statements. |
GOLDMAN SACHS INTERNATIONAL EQUITY INSIGHTS FUNDS
Statements of Changes in Net Assets
| Emerging Markets Equity Insights Fund | International Equity Insights Fund | |||||||||||||||||
| For the Fiscal Year Ended October 31, 2019 | For the Fiscal Year Ended October 31, 2018 | For the Fiscal Year Ended October 31, 2019 | For the Fiscal Year Ended October 31, 2018 | |||||||||||||||
| From operations: |
| |||||||||||||||||
Net investment income | $ | 37,179,379 | $ | 42,689,312 | $ | 68,116,968 | $ | 44,538,895 | ||||||||||
Net realized loss | (155,271,349 | ) | (33,728,994 | ) | (211,846,876 | ) | (8,358,918 | ) | ||||||||||
Net change in unrealized gain (loss) | 228,850,921 | (341,728,940 | ) | 344,013,406 | (308,376,122 | ) | ||||||||||||
| Net increase (decrease) in net assets resulting from operations | 110,758,951 | (332,768,622 | ) | 200,283,498 | (272,196,145 | ) | ||||||||||||
| Distributions to shareholders: |
| |||||||||||||||||
From distributable earnings: | ||||||||||||||||||
Class A Shares | (1,382,695 | ) | (4,884,471 | ) | (2,441,498 | ) | (1,955,352 | ) | ||||||||||
Class C Shares | (82,497 | ) | (418,669 | ) | (230,590 | ) | (228,068 | ) | ||||||||||
Institutional Shares | (21,025,697 | ) | (82,036,966 | ) | (21,903,837 | ) | (18,269,075 | ) | ||||||||||
Service Shares | — | — | (64,202 | ) | (60,270 | ) | ||||||||||||
Investor Shares | (2,145,536 | ) | (4,097,352 | ) | (7,168,724 | ) | (3,049,706 | ) | ||||||||||
Class P Shares(a) | (3,090,275 | ) | — | (5,642,654 | ) | — | ||||||||||||
Class R Shares | (318,449 | ) | (967,288 | ) | (107,227 | ) | (101,979 | ) | ||||||||||
Class R6 Shares | (11,923,948 | ) | (834,501 | ) | (8,467,600 | ) | (1,354,479 | ) | ||||||||||
| Total distributions to shareholders | (39,969,097 | ) | (93,239,247 | ) | (46,026,332 | ) | (25,018,929 | ) | ||||||||||
| From share transactions: |
| |||||||||||||||||
Proceeds from sales of shares | 878,269,720 | 1,970,419,112 | 1,976,021,453 | 2,495,327,761 | ||||||||||||||
Reinvestment of distributions | 37,448,911 | 88,340,977 | 36,692,122 | 20,407,591 | ||||||||||||||
Cost of shares redeemed | (1,146,688,181 | ) | (1,381,190,121 | ) | (1,724,995,996 | ) | (1,015,368,858 | ) | ||||||||||
| Net increase (decrease) in net assets resulting from share transactions | (230,969,550 | ) | 677,569,968 | 287,717,579 | 1,500,366,494 | |||||||||||||
| TOTAL INCREASE (DECREASE) | (160,179,696 | ) | 251,562,099 | 441,974,745 | 1,203,151,420 | |||||||||||||
| Net Assets: |
| |||||||||||||||||
Beginning of year | 1,942,776,414 | 1,691,214,315 | 2,607,330,146 | 1,404,178,726 | ||||||||||||||
End of year | $ | 1,782,596,718 | $ | 1,942,776,414 | $ | 3,049,304,891 | $ | 2,607,330,146 | ||||||||||
| (a) | Commenced operations on April 16, 2018. |
| The accompanying notes are an integral part of these financial statements. | 43 |
GOLDMAN SACHS INTERNATIONAL EQUITY INSIGHTS FUNDS
Statements of Changes in Net Assets(continued)
| International Small Cap Insights Fund | ||||||||||
| For the Fiscal Year Ended October 31, 2019 | For the Fiscal Year Ended October 31, 2018 | |||||||||
| From operations: |
| |||||||||
Net investment income | $ | 75,247,934 | $ | 58,615,743 | ||||||
Net realized loss | (264,294,218 | ) | (18,031,737 | ) | ||||||
Net change in unrealized gain (loss) | 427,695,952 | (559,493,790 | ) | |||||||
| Net increase (decrease) in net assets resulting from operations | 238,649,668 | (518,909,784 | ) | |||||||
| Distributions to shareholders: | ||||||||||
From distributable earnings: | ||||||||||
Class A Shares | (1,847,569 | ) | (16,242,694 | ) | ||||||
Class C Shares | (140,227 | ) | (5,141,152 | ) | ||||||
Institutional Shares | (35,596,707 | ) | (147,741,062 | ) | ||||||
Investor Shares | (5,911,450 | ) | (29,731,157 | ) | ||||||
Class P Shares(a) | (1,347,821 | ) | — | |||||||
Class R6 Shares | (16,511,878 | ) | (9,645,435 | ) | ||||||
| Total distributions to shareholders | (61,355,652 | ) | (208,501,500 | ) | ||||||
| From share transactions: | ||||||||||
Proceeds from sales of shares | 1,411,878,385 | 3,620,112,324 | ||||||||
Reinvestment of distributions | 56,353,633 | 188,604,742 | ||||||||
Cost of shares redeemed | (1,960,823,746 | ) | (1,404,160,241 | ) | ||||||
| Net increase (decrease) in net assets resulting from share transactions | (492,591,728 | ) | 2,404,556,825 | |||||||
| TOTAL INCREASE (DECREASE) | (315,297,712 | ) | 1,677,145,541 | |||||||
| Net Assets: | ||||||||||
Beginning of year | 4,211,981,851 | 2,534,836,310 | ||||||||
End of year | $ | 3,896,684,139 | $ | 4,211,981,851 | ||||||
| (a) | Commenced operations on April 16, 2018. |
| 44 | The accompanying notes are an integral part of these financial statements. |
GOLDMAN SACHS EMERGING MARKETS EQUITY INSIGHTS FUND
Selected Data for a Share Outstanding Throughout Each Year
| (a) | Calculated based on the average shares outstanding methodology. |
| (b) | Assumes investment at the net asset value at the beginning of the year, reinvestment of all distributions, a complete redemption of the investment at the net asset value at the end of the year and no sales or redemption charges (if any). Total returns would be reduced if a sales or redemption charge was taken into account. Returns do not reflect the impact of taxes to shareholders relating to Fund distributions or the redemption of Fund shares. |
| (c) | The Fund’s portfolio turnover rate is calculated in accordance with regulatory requirements, without regard to transactions involving short term investments and certain derivatives. If such transactions were included, the Fund’s portfolio turnover rate may be higher. |
| The accompanying notes are an integral part of these financial statements. | 45 |
GOLDMAN SACHS EMERGING MARKETS EQUITY INSIGHTS FUND
Financial Highlights(continued)
Selected Data for a Share Outstanding Throughout Each Year
| Goldman Sachs Emerging Markets Equity Insights Fund | ||||||||||||||||||||||
| Class C Shares | ||||||||||||||||||||||
| Year Ended October 31, | ||||||||||||||||||||||
| 2019 | 2018 | 2017 | 2016 | 2015 | ||||||||||||||||||
| Per Share Data |
| |||||||||||||||||||||
Net asset value, beginning of year | $ | 8.83 | $ | 10.88 | $ | 8.45 | $ | 7.84 | $ | 8.88 | ||||||||||||
Net investment income(a) | 0.08 | 0.10 | 0.07 | 0.04 | 0.05 | |||||||||||||||||
Net realized and unrealized gain (loss) | 0.36 | (1.64 | ) | 2.39 | 0.58 | (0.98 | ) | |||||||||||||||
Total from investment operations | 0.44 | (1.54 | ) | 2.46 | 0.62 | (0.93 | ) | |||||||||||||||
Distributions to shareholders from net investment income | (0.08 | ) | (0.09 | ) | (0.03 | ) | (0.01 | ) | (0.04 | ) | ||||||||||||
Distributions to shareholders from net realized gains | — | (0.42 | ) | — | — | (0.07 | ) | |||||||||||||||
Total distributions | (0.08 | ) | (0.51 | ) | (0.03 | ) | (0.01 | ) | (0.11 | ) | ||||||||||||
Net asset value, end of year | $ | 9.19 | $ | 8.83 | $ | 10.88 | $ | 8.45 | $ | 7.84 | ||||||||||||
| Total return(b) | 5.09 | % | (14.80 | )% | 29.20 | % | 7.97 | % | (10.50 | )% | ||||||||||||
Net assets, end of year (in 000s) | $ | 8,303 | $ | 8,975 | $ | 7,563 | $ | 1,132 | $ | 1,053 | ||||||||||||
Ratio of net expenses to average net assets | 2.23 | % | 2.23 | % | 2.26 | % | 2.31 | % | 2.33 | % | ||||||||||||
Ratio of total expenses to average net assets | 2.31 | % | 2.29 | % | 2.29 | % | 2.39 | % | 2.42 | % | ||||||||||||
Ratio of net investment income to average net assets | 0.85 | % | 0.98 | % | 0.72 | % | 0.47 | % | 0.60 | % | ||||||||||||
Portfolio turnover rate(c) | 165 | % | 147 | % | 172 | % | 216 | % | 199 | % | ||||||||||||
| (a) | Calculated based on the average shares outstanding methodology. |
| (b) | Assumes investment at the net asset value at the beginning of the year, reinvestment of all distributions, a complete redemption of the investment at the net asset value at the end of the year and no sales or redemption charges (if any). Total returns would be reduced if a sales or redemption charge was taken into account. Returns do not reflect the impact of taxes to shareholders relating to Fund distributions or the redemption of Fund shares. |
| (c) | The Fund’s portfolio turnover rate is calculated in accordance with regulatory requirements, without regard to transactions involving short term investments and certain derivatives. If such transactions were included, the Fund’s portfolio turnover rate may be higher. |
| 46 | The accompanying notes are an integral part of these financial statements. |
GOLDMAN SACHS EMERGING MARKETS EQUITY INSIGHTS FUND
Financial Highlights(continued)
Selected Data for a Share Outstanding Throughout Each Year
| Goldman Sachs Emerging Markets Equity Insights Fund | ||||||||||||||||||||||
| Institutional Shares | ||||||||||||||||||||||
| Year Ended October 31, | ||||||||||||||||||||||
| 2019 | 2018 | 2017 | 2016 | 2015 | ||||||||||||||||||
| Per Share Data |
| |||||||||||||||||||||
Net asset value, beginning of year | $ | 8.99 | $ | 11.01 | $ | 8.54 | $ | 7.91 | $ | 8.98 | ||||||||||||
Net investment income(a) | 0.19 | 0.19 | 0.17 | 0.13 | 0.14 | |||||||||||||||||
Net realized and unrealized gain (loss) | 0.35 | (1.64 | ) | 2.41 | 0.60 | (0.98 | ) | |||||||||||||||
Total from investment operations | 0.54 | (1.45 | ) | 2.58 | 0.73 | (0.84 | ) | |||||||||||||||
Distributions to shareholders from net investment income | (0.20 | ) | (0.15 | ) | (0.11 | ) | (0.10 | ) | (0.16 | ) | ||||||||||||
Distributions to shareholders from net realized gains | — | (0.42 | ) | — | — | (0.07 | ) | |||||||||||||||
Total distributions | (0.20 | ) | (0.57 | ) | (0.11 | ) | (0.10 | ) | (0.23 | ) | ||||||||||||
Net asset value, end of year | $ | 9.33 | $ | 8.99 | $ | 11.01 | $ | 8.54 | $ | 7.91 | ||||||||||||
| Total return(b) | 6.18 | % | (13.83 | )% | 30.67 | % | 9.35 | % | (9.52 | )% | ||||||||||||
Net assets, end of year (in 000s) | $ | 938,157 | $ | 981,091 | $ | 1,488,246 | $ | 852,853 | $ | 508,685 | ||||||||||||
Ratio of net expenses to average net assets | 1.10 | % | 1.10 | % | 1.15 | % | 1.16 | % | 1.18 | % | ||||||||||||
Ratio of total expenses to average net assets | 1.18 | % | 1.14 | % | 1.15 | % | 1.22 | % | 1.27 | % | ||||||||||||
Ratio of net investment income to average net assets | 2.01 | % | 1.84 | % | 1.74 | % | 1.70 | % | 1.69 | % | ||||||||||||
Portfolio turnover rate(c) | 165 | % | 147 | % | 172 | % | 216 | % | 199 | % | ||||||||||||
| (a) | Calculated based on the average shares outstanding methodology. |
| (b) | Assumes investment at the net asset value at the beginning of the year, reinvestment of all distributions, a complete redemption of the investment at the net asset value at the end of the year and no sales or redemption charges (if any). Total returns would be reduced if a sales or redemption charge was taken into account. Returns do not reflect the impact of taxes to shareholders relating to Fund distributions or the redemption of Fund shares. |
| (c) | The Fund’s portfolio turnover rate is calculated in accordance with regulatory requirements, without regard to transactions involving short term investments and certain derivatives. If such transactions were included, the Fund’s portfolio turnover rate may be higher. |
| The accompanying notes are an integral part of these financial statements. | 47 |
GOLDMAN SACHS EMERGING MARKETS EQUITY INSIGHTS FUND
Financial Highlights(continued)
Selected Data for a Share Outstanding Throughout Each Year
| Goldman Sachs Emerging Markets Equity Insights Fund | ||||||||||||||||||||||
| Investor Shares(a) | ||||||||||||||||||||||
| Year Ended October 31, | ||||||||||||||||||||||
| 2019 | 2018 | 2017 | 2016 | 2015 | ||||||||||||||||||
| Per Share Data |
| |||||||||||||||||||||
Net asset value, beginning of year | $ | 8.97 | $ | 10.99 | $ | 8.53 | $ | 7.91 | $ | 8.97 | ||||||||||||
Net investment income(b) | 0.18 | 0.21 | 0.18 | 0.12 | 0.14 | |||||||||||||||||
Net realized and unrealized gain (loss) | 0.36 | (1.66 | ) | 2.38 | 0.59 | (0.99 | ) | |||||||||||||||
Total from investment operations | 0.54 | (1.45 | ) | 2.56 | 0.71 | (0.85 | ) | |||||||||||||||
Distributions to shareholders from net investment income | (0.19 | ) | (0.15 | ) | (0.10 | ) | (0.09 | ) | (0.14 | ) | ||||||||||||
Distributions to shareholders from net realized gains | — | (0.42 | ) | — | — | (0.07 | ) | |||||||||||||||
Total distributions | (0.19 | ) | (0.57 | ) | (0.10 | ) | (0.09 | ) | (0.21 | ) | ||||||||||||
Net asset value, end of year | $ | 9.32 | $ | 8.97 | $ | 10.99 | $ | 8.53 | $ | 7.91 | ||||||||||||
| Total return(c) | 6.06 | % | (13.90 | )% | 30.47 | % | 9.13 | % | (9.63 | )% | ||||||||||||
Net assets, end of year (in 000s) | $ | 118,727 | $ | 96,779 | $ | 67,068 | $ | 2,565 | $ | 798 | ||||||||||||
Ratio of net expenses to average net assets | 1.23 | % | 1.23 | % | 1.26 | % | 1.31 | % | 1.33 | % | ||||||||||||
Ratio of total expenses to average net assets | 1.31 | % | 1.29 | % | 1.29 | % | 1.37 | % | 1.42 | % | ||||||||||||
Ratio of net investment income to average net assets | 1.92 | % | 1.99 | % | 1.81 | % | 1.53 | % | 1.63 | % | ||||||||||||
Portfolio turnover rate(d) | 165 | % | 147 | % | 172 | % | 216 | % | 199 | % | ||||||||||||
| (a) | Effective August 15, 2017, Class IR changed its name to Investor Shares. |
| (b) | Calculated based on the average shares outstanding methodology. |
| (c) | Assumes investment at the net asset value at the beginning of the year, reinvestment of all distributions, a complete redemption of the investment at the net asset value at the end of the year and no sales or redemption charges (if any). Total returns would be reduced if a sales or redemption charge was taken into account. Returns do not reflect the impact of taxes to shareholders relating to Fund distributions or the redemption of Fund shares. |
| (d) | The Fund’s portfolio turnover rate is calculated in accordance with regulatory requirements, without regard to transactions involving short term investments and certain derivatives. If such transactions were included, the Fund’s portfolio turnover rate may be higher. |
| 48 | The accompanying notes are an integral part of these financial statements. |
GOLDMAN SACHS EMERGING MARKETS EQUITY INSIGHTS FUND
Financial Highlights(continued)
Selected Data for a Share Outstanding Throughout Each Period
| Goldman Sachs Emerging Markets Equity Insights Fund | ||||||||||
| Class P Shares | ||||||||||
| Year Ended October 31, 2019 | April 16, 2018* to October 31, 2018 | |||||||||
| Per Share Data |
| |||||||||
Net asset value, beginning of period | $ | 8.98 | $ | 10.84 | ||||||
Net investment income(a) | 0.18 | 0.18 | ||||||||
Net realized and unrealized gain (loss) | 0.37 | (2.04 | ) | |||||||
Total from investment operations | 0.55 | (1.86 | ) | |||||||
Distributions to shareholders from net investment income | (0.20 | ) | — | |||||||
Net asset value, end of period | $ | 9.33 | $ | 8.98 | ||||||
| Total return(b) | 6.33 | % | (17.16 | )% | ||||||
Net assets, end of period (in 000s) | $ | 125,429 | $ | 130,763 | ||||||
Ratio of net expenses to average net assets | 1.09 | % | 1.08 | %(c) | ||||||
Ratio of total expenses to average net assets | 1.17 | % | 1.17 | %(c) | ||||||
Ratio of net investment income to average net assets | 1.96 | % | 3.36 | %(c) | ||||||
Portfolio turnover rate(d) | 165 | % | 147 | % | ||||||
| * | Commencement of operations. |
| (a) | Calculated based on the average shares outstanding methodology. |
| (b) | Assumes investment at the net asset value at the beginning of the period, reinvestment of all distributions, a complete redemption of the investment at the net asset value at the end of the period and no sales or redemption charges (if any). Total returns would be reduced if a sales or redemption charge was taken into account. Returns do not reflect the impact of taxes to shareholders relating to Fund distributions or the redemption of Fund shares. Total returns for periods less than one full year are not annualized. |
| (c) | Annualized. |
| (d) | The Fund’s portfolio turnover rate is calculated in accordance with regulatory requirements, without regard to transactions involving short term investments and certain derivatives. If such transactions were included, the Fund’s portfolio turnover rate may be higher. |
| The accompanying notes are an integral part of these financial statements. | 49 |
GOLDMAN SACHS EMERGING MARKETS EQUITY INSIGHTS FUND
Financial Highlights(continued)
Selected Data for a Share Outstanding Throughout Each Year
| Goldman Sachs Emerging Markets Equity Insights Fund | ||||||||||||||||||||||
| Class R Shares | ||||||||||||||||||||||
| Year Ended October 31, | ||||||||||||||||||||||
| 2019 | 2018 | 2017 | 2016 | 2015 | ||||||||||||||||||
| Per Share Data |
| |||||||||||||||||||||
Net asset value, beginning of year | $ | 8.86 | $ | 10.87 | $ | 8.44 | $ | 7.84 | $ | 8.94 | ||||||||||||
Net investment income(a) | 0.12 | 0.15 | 0.10 | 0.08 | 0.09 | |||||||||||||||||
Net realized and unrealized gain (loss) | 0.36 | (1.64 | ) | 2.40 | 0.59 | (0.98 | ) | |||||||||||||||
Total from investment operations | 0.48 | (1.49 | ) | 2.50 | 0.67 | (0.89 | ) | |||||||||||||||
Distributions to shareholders from net investment income | (0.14 | ) | (0.10 | ) | (0.07 | ) | (0.07 | ) | (0.14 | ) | ||||||||||||
Distributions to shareholders from net realized gains | — | (0.42 | ) | — | — | (0.07 | ) | |||||||||||||||
Total distributions | (0.14 | ) | (0.52 | ) | (0.07 | ) | (0.07 | ) | (0.21 | ) | ||||||||||||
Net asset value, end of year | $ | 9.20 | $ | 8.86 | $ | 10.87 | $ | 8.44 | $ | 7.84 | ||||||||||||
| Total return(b) | 5.52 | % | (14.34 | )% | 29.86 | % | 8.57 | % | (10.06 | )% | ||||||||||||
Net assets, end of year (in 000s) | $ | 27,790 | $ | 20,852 | $ | 19,243 | $ | 9,363 | $ | 4,547 | ||||||||||||
Ratio of net expenses to average net assets | 1.73 | % | 1.73 | % | 1.77 | % | 1.81 | % | 1.83 | %�� | ||||||||||||
Ratio of total expenses to average net assets | 1.82 | % | 1.79 | % | 1.79 | % | 1.88 | % | 1.93 | % | ||||||||||||
Ratio of net investment income to average net assets | 1.27 | % | 1.46 | % | 1.06 | % | 1.01 | % | 1.10 | % | ||||||||||||
Portfolio turnover rate(c) | 165 | % | 147 | % | 172 | % | 216 | % | 199 | % | ||||||||||||
| (a) | Calculated based on the average shares outstanding methodology. |
| (b) | Assumes investment at the net asset value at the beginning of the year, reinvestment of all distributions, a complete redemption of the investment at the net asset value at the end of the year and no sales or redemption charges (if any). Total returns would be reduced if a sales or redemption charge was taken into account. Returns do not reflect the impact of taxes to shareholders relating to Fund distributions or the redemption of Fund shares. |
| (c) | The Fund’s portfolio turnover rate is calculated in accordance with regulatory requirements, without regard to transactions involving short term investments and certain derivatives. If such transactions were included, the Fund’s portfolio turnover rate may be higher. |
| 50 | The accompanying notes are an integral part of these financial statements. |
GOLDMAN SACHS EMERGING MARKETS EQUITY INSIGHTS FUND
Financial Highlights(continued)
Selected Data for a Share Outstanding Throughout Each Period
| Goldman Sachs Emerging Markets Equity Insights Fund | ||||||||||||||||||||||
| Class R6 Shares | ||||||||||||||||||||||
| Year Ended October 31, | July 31, 2015* to October 31, 2015 | |||||||||||||||||||||
| 2019 | 2018 | 2017 | 2016 | |||||||||||||||||||
| Per Share Data |
| |||||||||||||||||||||
Net asset value, beginning of period | $ | 8.98 | $ | 11.00 | $ | 8.53 | $ | 7.91 | $ | 8.40 | ||||||||||||
Net investment income(a) | 0.17 | 0.29 | 0.19 | 0.10 | 0.01 | |||||||||||||||||
Net realized and unrealized gain (loss) | 0.38 | (1.73 | ) | 2.39 | 0.62 | (0.50 | ) | |||||||||||||||
Total from investment operations | 0.55 | (1.44 | ) | 2.58 | 0.72 | (0.49 | ) | |||||||||||||||
Distributions to shareholders from net investment income | (0.20 | ) | (0.16 | ) | (0.11 | ) | (0.10 | ) | — | |||||||||||||
Distributions to shareholders from net realized gains | — | (0.42 | ) | — | — | — | ||||||||||||||||
Total distributions | (0.20 | ) | (0.58 | ) | (0.11 | ) | (0.10 | ) | — | |||||||||||||
Net asset value, end of period | $ | 9.33 | $ | 8.98 | $ | 11.00 | $ | 8.53 | $ | 7.91 | ||||||||||||
| Total return(b) | 6.32 | % | (13.84 | )% | 30.74 | % | 9.27 | % | (5.83 | )% | ||||||||||||
Net assets, end of period (in 000s) | $ | 491,306 | $ | 621,590 | $ | 13,164 | $ | 1,637 | $ | 9 | ||||||||||||
Ratio of net expenses to average net assets | 1.09 | % | 1.08 | % | 1.13 | % | 1.13 | % | 1.17 | %(c) | ||||||||||||
Ratio of total expenses to average net assets | 1.17 | % | 1.15 | % | 1.13 | % | 1.16 | % | 1.28 | %(c) | ||||||||||||
Ratio of net investment income to average net assets | 1.89 | % | 2.78 | % | 1.87 | % | 1.26 | % | 0.59 | %(c) | ||||||||||||
Portfolio turnover rate(d) | 165 | % | 147 | % | 172 | % | 216 | % | 199 | % | ||||||||||||
| * | Commencement of operations. |
| (a) | Calculated based on the average shares outstanding methodology. |
| (b) | Assumes investment at the net asset value at the beginning of the period, reinvestment of all distributions, a complete redemption of the investment at the net asset value at the end of the period and no sales or redemption charges (if any). Total returns would be reduced if a sales or redemption charge was taken into account. Returns do not reflect the impact of taxes to shareholders relating to Fund distributions or the redemption of Fund shares. Total returns for periods less than one full year are not annualized. |
| (c) | Annualized. |
| (d) | The Fund’s portfolio turnover rate is calculated in accordance with regulatory requirements, without regard to transactions involving short term investments and certain derivatives. If such transactions were included, the Fund’s portfolio turnover rate may be higher. |
| The accompanying notes are an integral part of these financial statements. | 51 |
GOLDMAN SACHS INTERNATIONAL EQUITY INSIGHTS FUND
Financial Highlights(continued)
Selected Data for a Share Outstanding Throughout Each Year
| (a) | Calculated based on the average shares outstanding methodology. |
| (b) | Assumes investment at the net asset value at the beginning of the year, reinvestment of all distributions, a complete redemption of the investment at the net asset value at the end of the year and no sales or redemption charges (if any). Total returns would be reduced if a sales or redemption charge was taken into account. Returns do not reflect the impact of taxes to shareholders relating to Fund distributions or the redemption of Fund shares. |
| (c) | The Fund’s portfolio turnover rate is calculated in accordance with regulatory requirements, without regard to transactions involving short term investments and certain derivatives. If such transactions were included, the Fund’s portfolio turnover rate may be higher. |
| 52 | The accompanying notes are an integral part of these financial statements. |
GOLDMAN SACHS INTERNATIONAL EQUITY INSIGHTS FUND
Financial Highlights(continued)
Selected Data for a Share Outstanding Throughout Each Year
| Goldman Sachs International Equity Insights Fund | ||||||||||||||||||||||
| Class C Shares | ||||||||||||||||||||||
| Year Ended October 31, | ||||||||||||||||||||||
| 2019 | 2018 | 2017 | 2016 | 2015 | ||||||||||||||||||
| Per Share Data |
| |||||||||||||||||||||
Net asset value, beginning of year | $ | 11.56 | $ | 12.91 | $ | 10.32 | $ | 10.36 | $ | 10.51 | ||||||||||||
Net investment income(a) | 0.14 | 0.14 | 0.09 | 0.10 | 0.10 | |||||||||||||||||
Net realized and unrealized gain (loss) | 0.52 | (1.34 | ) | 2.66 | (0.08 | ) | 0.08 | |||||||||||||||
Total from investment operations | 0.66 | (1.20 | ) | 2.75 | 0.02 | 0.18 | ||||||||||||||||
Distributions to shareholders from net investment income | (0.09 | ) | (0.15 | ) | (0.16 | ) | (0.06 | ) | (0.33 | ) | ||||||||||||
Net asset value, end of year | $ | 12.13 | $ | 11.56 | $ | 12.91 | $ | 10.32 | $ | 10.36 | ||||||||||||
| Total return(b) | 5.79 | % | (9.45 | )% | 27.11 | % | 0.22 | % | 1.82 | % | ||||||||||||
Net assets, end of year (in 000s) | $ | 22,427 | $ | 32,338 | $ | 14,886 | $ | 6,164 | $ | 4,409 | ||||||||||||
Ratio of net expenses to average net assets | 1.91 | % | 1.89 | % | 1.95 | % | 2.00 | % | 2.01 | % | ||||||||||||
Ratio of total expenses to average net assets | 1.99 | % | 2.01 | % | 2.09 | % | 2.14 | % | 2.12 | % | ||||||||||||
Ratio of net investment income to average net assets | 1.25 | % | 1.11 | % | 0.79 | % | 1.02 | % | 0.93 | % | ||||||||||||
Portfolio turnover rate(c) | 136 | % | 124 | % | 161 | % | 176 | % | 154 | % | ||||||||||||
| (a) | Calculated based on the average shares outstanding methodology. |
| (b) | Assumes investment at the net asset value at the beginning of the year, reinvestment of all distributions, a complete redemption of the investment at the net asset value at the end of the year and no sales or redemption charges (if any). Total returns would be reduced if a sales or redemption charge was taken into account. Returns do not reflect the impact of taxes to shareholders relating to Fund distributions or the redemption of Fund shares. |
| (c) | The Fund’s portfolio turnover rate is calculated in accordance with regulatory requirements, without regard to transactions involving short term investments and certain derivatives. If such transactions were included, the Fund’s portfolio turnover rate may be higher. |
| The accompanying notes are an integral part of these financial statements. | 53 |
GOLDMAN SACHS INTERNATIONAL EQUITY INSIGHTS FUND
Financial Highlights(continued)
Selected Data for a Share Outstanding Throughout Each Year
| Goldman Sachs International Equity Insights Fund | ||||||||||||||||||||||
| Institutional Shares | ||||||||||||||||||||||
| Year Ended October 31, | ||||||||||||||||||||||
| 2019 | 2018 | 2017 | 2016 | 2015 | ||||||||||||||||||
| Per Share Data |
| |||||||||||||||||||||
Net asset value, beginning of year | $ | 12.22 | $ | 13.57 | $ | 10.82 | $ | 10.83 | $ | 10.97 | ||||||||||||
Net investment income(a) | 0.29 | 0.28 | 0.23 | 0.24 | 0.22 | |||||||||||||||||
Net realized and unrealized gain (loss) | 0.54 | (1.41 | ) | 2.79 | (0.10 | ) | 0.09 | |||||||||||||||
Total from investment operations | 0.83 | (1.13 | ) | 3.02 | 0.14 | 0.31 | ||||||||||||||||
Distributions to shareholders from net investment income | (0.22 | ) | (0.22 | ) | (0.27 | ) | (0.15 | ) | (0.45 | ) | ||||||||||||
Net asset value, end of year | $ | 12.83 | $ | 12.22 | $ | 13.57 | $ | 10.82 | $ | 10.83 | ||||||||||||
| Total return(b) | 7.07 | % | (8.48 | )% | 28.57 | % | 1.34 | % | 3.05 | % | ||||||||||||
Net assets, end of year (in 000s) | $ | 1,256,782 | $ | 1,323,745 | $ | 1,012,010 | $ | 500,930 | $ | 642,473 | ||||||||||||
Ratio of net expenses to average net assets | 0.79 | % | 0.81 | % | 0.85 | % | 0.85 | % | 0.87 | % | ||||||||||||
Ratio of total expenses to average net assets | 0.85 | % | 0.87 | % | 0.94 | % | 0.99 | % | 0.97 | % | ||||||||||||
Ratio of net investment income to average net assets | 2.41 | % | 2.08 | % | 1.92 | % | 2.25 | % | 2.08 | % | ||||||||||||
Portfolio turnover rate(c) | 136 | % | 124 | % | 161 | % | 176 | % | 154 | % | ||||||||||||
| (a) | Calculated based on the average shares outstanding methodology. |
| (b) | Assumes investment at the net asset value at the beginning of the year, reinvestment of all distributions, a complete redemption of the investment at the net asset value at the end of the year and no sales or redemption charges (if any). Total returns would be reduced if a sales or redemption charge was taken into account. Returns do not reflect the impact of taxes to shareholders relating to Fund distributions or the redemption of Fund shares. |
| (c) | The Fund’s portfolio turnover rate is calculated in accordance with regulatory requirements, without regard to transactions involving short term investments and certain derivatives. If such transactions were included, the Fund’s portfolio turnover rate may be higher. |
| 54 | The accompanying notes are an integral part of these financial statements. |
GOLDMAN SACHS INTERNATIONAL EQUITY INSIGHTS FUND
Financial Highlights(continued)
Selected Data for a Share Outstanding Throughout Each Year
| Goldman Sachs International Equity Insights Fund | ||||||||||||||||||||||
| Service Shares | ||||||||||||||||||||||
| Year Ended October 31, | ||||||||||||||||||||||
| 2019 | 2018 | 2017 | 2016 | 2015 | ||||||||||||||||||
| Per Share Data |
| |||||||||||||||||||||
Net asset value, beginning of year | $ | 11.98 | $ | 13.32 | $ | 10.63 | $ | 10.64 | $ | 10.76 | ||||||||||||
Net investment income(a) | 0.23 | 0.21 | 0.18 | 0.17 | 0.16 | |||||||||||||||||
Net realized and unrealized gain (loss) | 0.52 | (1.38 | ) | 2.73 | (0.08 | ) | 0.09 | |||||||||||||||
Total from investment operations | 0.75 | (1.17 | ) | 2.91 | 0.09 | 0.25 | ||||||||||||||||
Distributions to shareholders from net investment income | (0.16 | ) | (0.17 | ) | (0.22 | ) | (0.10 | ) | (0.37 | ) | ||||||||||||
Net asset value, end of year | $ | 12.57 | $ | 11.98 | $ | 13.32 | $ | 10.63 | $ | 10.64 | ||||||||||||
| Total return(b) | 6.45 | % | (8.92 | )% | 27.89 | % | 0.87 | % | 2.48 | % | ||||||||||||
Net assets, end of year (in 000s) | $ | 5,386 | $ | 4,538 | $ | 4,073 | $ | 1,898 | $ | 1,641 | ||||||||||||
Ratio of net expenses to average net assets | 1.29 | % | 1.31 | % | 1.35 | % | 1.35 | % | 1.37 | % | ||||||||||||
Ratio of total expenses to average net assets | 1.35 | % | 1.37 | % | 1.45 | % | 1.49 | % | 1.47 | % | ||||||||||||
Ratio of net investment income to average net assets | 1.93 | % | 1.57 | % | 1.51 | % | 1.60 | % | 1.51 | % | ||||||||||||
Portfolio turnover rate(c) | 136 | % | 124 | % | 161 | % | 176 | % | 154 | % | ||||||||||||
| (a) | Calculated based on the average shares outstanding methodology. |
| (b) | Assumes investment at the net asset value at the beginning of the year, reinvestment of all distributions, a complete redemption of the investment at the net asset value at the end of the year and no sales or redemption charges (if any). Total returns would be reduced if a sales or redemption charge was taken into account. Returns do not reflect the impact of taxes to shareholders relating to Fund distributions or the redemption of Fund shares. |
| (c) | The Fund’s portfolio turnover rate is calculated in accordance with regulatory requirements, without regard to transactions involving short term investments and certain derivatives. If such transactions were included, the Fund’s portfolio turnover rate may be higher. |
| The accompanying notes are an integral part of these financial statements. | 55 |
GOLDMAN SACHS INTERNATIONAL EQUITY INSIGHTS FUND
Financial Highlights(continued)
Selected Data for a Share Outstanding Throughout Each Year
| Goldman Sachs International Equity Insights Fund | ||||||||||||||||||||||
| Investor Shares(a) | ||||||||||||||||||||||
| Year Ended October 31, | ||||||||||||||||||||||
| 2019 | 2018 | 2017 | 2016 | 2015 | ||||||||||||||||||
| Per Share Data |
| |||||||||||||||||||||
Net asset value, beginning of year | $ | 11.67 | $ | 12.97 | $ | 10.36 | $ | 10.38 | $ | 10.53 | ||||||||||||
Net investment income(b) | 0.27 | 0.27 | 0.23 | 0.17 | 0.16 | |||||||||||||||||
Net realized and unrealized gain (loss) | 0.50 | (1.35 | ) | 2.64 | (0.05 | ) | 0.12 | |||||||||||||||
Total from investment operations | 0.77 | (1.08 | ) | 2.87 | 0.12 | 0.28 | ||||||||||||||||
Distributions to shareholders from net investment income | (0.21 | ) | (0.22 | ) | (0.26 | ) | (0.14 | ) | (0.43 | ) | ||||||||||||
Net asset value, end of year | $ | 12.23 | $ | 11.67 | $ | 12.97 | $ | 10.36 | $ | 10.38 | ||||||||||||
| Total return(c) | 6.90 | % | (8.52 | )% | 28.44 | % | 1.22 | % | 2.85 | % | ||||||||||||
Net assets, end of year (in 000s) | $ | 549,732 | $ | 393,993 | $ | 147,186 | $ | 6,639 | $ | 1,666 | ||||||||||||
Ratio of net expenses to average net assets | 0.91 | % | 0.89 | % | 0.94 | % | 1.00 | % | 1.01 | % | ||||||||||||
Ratio of total expenses to average net assets | 0.99 | % | 1.01 | % | 1.07 | % | 1.14 | % | 1.13 | % | ||||||||||||
Ratio of net investment income to average net assets | 2.29 | % | 2.09 | % | 1.87 | % | 1.65 | % | 1.54 | % | ||||||||||||
Portfolio turnover rate(d) | 136 | % | 124 | % | 161 | % | 176 | % | 154 | % | ||||||||||||
| (a) | Effective August 15, 2017, Class IR changed its name to Investor Shares. |
| (b) | Calculated based on the average shares outstanding methodology. |
| (c) | Assumes investment at the net asset value at the beginning of the year, reinvestment of all distributions, a complete redemption of the investment at the net asset value at the end of the year and no sales or redemption charges (if any). Total returns would be reduced if a sales or redemption charge was taken into account. Returns do not reflect the impact of taxes to shareholders relating to Fund distributions or the redemption of Fund shares. |
| (d) | The Fund’s portfolio turnover rate is calculated in accordance with regulatory requirements, without regard to transactions involving short term investments and certain derivatives. If such transactions were included, the Fund’s portfolio turnover rate may be higher. |
| 56 | The accompanying notes are an integral part of these financial statements. |
GOLDMAN SACHS INTERNATIONAL EQUITY INSIGHTS FUND
Financial Highlights(continued)
Selected Data for a Share Outstanding Throughout Each Period
| Goldman Sachs International Equity Insights Fund | ||||||||||
| Class P Shares | ||||||||||
| Year Ended October 31, 2019 | April 16, 2018* to October 31, 2018 | |||||||||
| Per Share Data |
| |||||||||
Net asset value, beginning of period | $ | 12.21 | $ | 13.79 | ||||||
Net investment income(a) | 0.30 | 0.12 | ||||||||
Net realized and unrealized gain (loss) | 0.52 | (1.70 | ) | |||||||
Total from investment operations | 0.82 | (1.58 | ) | |||||||
Distributions to shareholders from net investment income | (0.22 | ) | — | |||||||
Net asset value, end of period | $ | 12.81 | $ | 12.21 | ||||||
| Total return(b) | 7.03 | % | (11.46 | )% | ||||||
Net assets, end of period (in 000s) | $ | 372,536 | $ | 245,618 | ||||||
Ratio of net expenses to average net assets | 0.78 | % | 0.78 | %(c) | ||||||
Ratio of total expenses to average net assets | 0.84 | % | 0.87 | %(c) | ||||||
Ratio of net investment income to average net assets | 2.43 | % | 1.65 | %(c) | ||||||
Portfolio turnover rate(d) | 136 | % | 124 | % | ||||||
| * | Commencement of operations. |
| (a) | Calculated based on the average shares outstanding methodology. |
| (b) | Assumes investment at the net asset value at the beginning of the period, reinvestment of all distributions, a complete redemption of the investment at the net asset value at the end of the period and no sales or redemption charges (if any). Total returns would be reduced if a sales or redemption charge was taken into account. Returns do not reflect the impact of taxes to shareholders relating to Fund distributions or the redemption of Fund shares. Total returns for periods less than one full year are not annualized. |
| (c) | Annualized. |
| (d) | The Fund’s portfolio turnover rate is calculated in accordance with regulatory requirements, without regard to transactions involving short term investments and certain derivatives. If such transactions were included, the Fund’s portfolio turnover rate may be higher. |
| The accompanying notes are an integral part of these financial statements. | 57 |
GOLDMAN SACHS INTERNATIONAL EQUITY INSIGHTS FUND
Financial Highlights(continued)
Selected Data for a Share Outstanding Throughout Each Year
| Goldman Sachs International Equity Insights Fund | ||||||||||||||||||||||
| Class R Shares | ||||||||||||||||||||||
| Year Ended October 31, | ||||||||||||||||||||||
| 2019 | 2018 | 2017 | 2016 | 2015 | ||||||||||||||||||
| Per Share Data |
| |||||||||||||||||||||
Net asset value, beginning of year | $ | 11.54 | $ | 12.85 | $ | 10.29 | $ | 10.34 | $ | 10.52 | ||||||||||||
Net investment income(a) | 0.21 | 0.19 | 0.16 | 0.13 | 0.14 | |||||||||||||||||
Net realized and unrealized gain (loss) | 0.50 | (1.33 | ) | 2.64 | (0.06 | ) | 0.09 | |||||||||||||||
Total from investment operations | 0.71 | (1.14 | ) | 2.80 | 0.07 | 0.23 | ||||||||||||||||
Distributions to shareholders from net investment income | (0.15 | ) | (0.17 | ) | (0.24 | ) | (0.12 | ) | (0.41 | ) | ||||||||||||
Net asset value, end of year | $ | 12.10 | $ | 11.54 | $ | 12.85 | $ | 10.29 | $ | 10.34 | ||||||||||||
| Total return(b) | 6.36 | % | (9.01 | )% | 27.81 | % | 0.67 | % | 2.32 | % | ||||||||||||
Net assets, end of year (in 000s) | $ | 9,281 | $ | 7,548 | $ | 7,071 | $ | 2,152 | $ | 186 | ||||||||||||
Ratio of net expenses to average net assets | 1.41 | % | 1.40 | % | 1.45 | % | 1.50 | % | 1.52 | % | ||||||||||||
Ratio of total expenses to average net assets | 1.49 | % | 1.51 | % | 1.59 | % | 1.64 | % | 1.62 | % | ||||||||||||
Ratio of net investment income to average net assets | 1.79 | % | 1.49 | % | 1.39 | % | 1.28 | % | 1.33 | % | ||||||||||||
Portfolio turnover rate(c) | 136 | % | 124 | % | 161 | % | 176 | % | 154 | % | ||||||||||||
| (a) | Calculated based on the average shares outstanding methodology. |
| (b) | Assumes investment at the net asset value at the beginning of the year, reinvestment of all distributions, a complete redemption of the investment at the net asset value at the end of the year and no sales or redemption charges (if any). Total returns would be reduced if a sales or redemption charge was taken into account. Returns do not reflect the impact of taxes to shareholders relating to Fund distributions or the redemption of Fund shares. |
| (c) | The Fund’s portfolio turnover rate is calculated in accordance with regulatory requirements, without regard to transactions involving short term investments and certain derivatives. If such transactions were included, the Fund’s portfolio turnover rate may be higher. |
| 58 | The accompanying notes are an integral part of these financial statements. |
GOLDMAN SACHS INTERNATIONAL EQUITY INSIGHTS FUND
Financial Highlights(continued)
Selected Data for a Share Outstanding Throughout Each Period
| Goldman Sachs International Equity Insights Fund | ||||||||||||||||||||||
| Class R6 Shares | ||||||||||||||||||||||
| Year Ended October 31, | July 31, 2015* to October 31, 2015 | |||||||||||||||||||||
| 2019 | 2018 | 2017 | 2016 | |||||||||||||||||||
| Per Share Data |
| |||||||||||||||||||||
Net asset value, beginning of period | $ | 12.22 | $ | 13.56 | $ | 10.82 | $ | 10.83 | $ | 11.23 | ||||||||||||
Net investment income(a) | 0.30 | 0.33 | 0.23 | 0.14 | 0.04 | |||||||||||||||||
Net realized and unrealized gain (loss) | 0.52 | (1.45 | ) | 2.78 | 0.01 | (0.44 | ) | |||||||||||||||
Total from investment operations | 0.82 | (1.12 | ) | 3.01 | 0.15 | (0.40 | ) | |||||||||||||||
Distributions to shareholders from net investment income | (0.22 | ) | (0.22 | ) | (0.27 | ) | (0.16 | ) | — | |||||||||||||
Net asset value, end of period | $ | 12.82 | $ | 12.22 | $ | 13.56 | $ | 10.82 | $ | 10.83 | ||||||||||||
| Total return(b) | 7.10 | % | (8.48 | )% | 28.51 | % | 1.37 | % | (3.56 | )% | ||||||||||||
Net assets, end of period (in 000s) | $ | 595,264 | $ | 415,327 | $ | 80,686 | $ | 46,707 | $ | 10 | ||||||||||||
Ratio of net expenses to average net assets | 0.78 | % | 0.79 | % | 0.83 | % | 0.83 | % | 0.84 | %(c) | ||||||||||||
Ratio of total expenses to average net assets | 0.84 | % | 0.86 | % | 0.93 | % | 0.96 | % | 0.93 | %(c) | ||||||||||||
Ratio of net investment income to average net assets | 2.49 | % | 2.45 | % | 1.96 | % | 1.32 | % | 1.56 | %(c) | ||||||||||||
Portfolio turnover rate(d) | 136 | % | 124 | % | 161 | % | 176 | % | 154 | % | ||||||||||||
| * | Commencement of operations. |
| (a) | Calculated based on the average shares outstanding methodology. |
| (b) | Assumes investment at the net asset value at the beginning of the period, reinvestment of all distributions, a complete redemption of the investment at the net asset value at the end of the period and no sales or redemption charges (if any). Total returns would be reduced if a sales or redemption charge was taken into account. Returns do not reflect the impact of taxes to shareholders relating to Fund distributions or the redemption of Fund shares. Total returns for periods less than one full year are not annualized. |
| (c) | Annualized. |
| (d) | The Fund’s portfolio turnover rate is calculated in accordance with regulatory requirements, without regard to transactions involving short term investments and certain derivatives. If such transactions were included, the Fund’s portfolio turnover rate may be higher. |
| The accompanying notes are an integral part of these financial statements. | 59 |
GOLDMAN SACHS INTERNATIONAL SMALL CAP INSIGHTS FUND
Financial Highlights(continued)
Selected Data for a Share Outstanding Throughout Each Year
| (a) | Calculated based on the average shares outstanding methodology. |
| (b) | Assumes investment at the net asset value at the beginning of the year, reinvestment of all distributions, a complete redemption of the investment at the net asset value at the end of the year and no sales or redemption charges (if any). Total returns would be reduced if a sales or redemption charge was taken into account. Returns do not reflect the impact of taxes to shareholders relating to Fund distributions or the redemption of Fund shares. |
| (c) | The Fund’s portfolio turnover rate is calculated in accordance with regulatory requirements, without regard to transactions involving short term investments and certain derivatives. If such transactions were included, the Fund’s portfolio turnover rate may be higher. |
| 60 | The accompanying notes are an integral part of these financial statements. |
GOLDMAN SACHS INTERNATIONAL SMALL CAP INSIGHTS FUND
Financial Highlights(continued)
Selected Data for a Share Outstanding Throughout Each Year
| Goldman Sachs International Small Cap Insights Fund | ||||||||||||||||||||||
| Class C Shares | ||||||||||||||||||||||
| Year Ended October 31, | ||||||||||||||||||||||
| 2019 | 2018 | 2017 | 2016 | 2015 | ||||||||||||||||||
| Per Share Data |
| |||||||||||||||||||||
Net asset value, beginning of year | $ | 10.73 | $ | 12.95 | $ | 10.35 | $ | 10.11 | $ | 9.76 | ||||||||||||
Net investment income(a) | 0.09 | 0.08 | 0.07 | 0.08 | 0.08 | |||||||||||||||||
Net realized and unrealized gain (loss) | 0.54 | (1.35 | ) | 2.70 | 0.25 | 0.49 | ||||||||||||||||
Total from investment operations | 0.63 | (1.27 | ) | 2.77 | 0.33 | 0.57 | ||||||||||||||||
Distributions to shareholders from net investment income | (0.02 | ) | (0.12 | ) | (0.17 | ) | (0.09 | ) | (0.12 | ) | ||||||||||||
Distributions to shareholders from net realized gains | — | (0.83 | ) | — | — | (0.10 | ) | |||||||||||||||
Total distributions | (0.02 | ) | (0.95 | ) | (0.17 | ) | (0.09 | ) | (0.22 | ) | ||||||||||||
Net asset value, end of year | $ | 11.34 | $ | 10.73 | $ | 12.95 | $ | 10.35 | $ | 10.11 | ||||||||||||
| Total return(b) | 5.94 | % | (10.59 | )% | 27.20 | % | 3.27 | % | 5.96 | % | ||||||||||||
Net assets, end of year (in 000s) | $ | 51,728 | $ | 68,767 | $ | 65,194 | $ | 44,643 | $ | 38,777 | ||||||||||||
Ratio of net expenses to average net assets | 2.01 | % | 2.01 | % | 2.04 | % | 2.05 | % | 2.05 | % | ||||||||||||
Ratio of total expenses to average net assets | 2.08 | % | 2.06 | % | 2.09 | % | 2.14 | % | 2.14 | % | ||||||||||||
Ratio of net investment income to average net assets | 0.82 | % | 0.61 | % | 0.60 | % | 0.83 | % | 0.82 | % | ||||||||||||
Portfolio turnover rate(c) | 131 | % | 110 | % | 129 | % | 140 | % | 131 | % | ||||||||||||
| (a) | Calculated based on the average shares outstanding methodology. |
| (b) | Assumes investment at the net asset value at the beginning of the year, reinvestment of all distributions, a complete redemption of the investment at the net asset value at the end of the year and no sales or redemption charges (if any). Total returns would be reduced if a sales or redemption charge was taken into account. Returns do not reflect the impact of taxes to shareholders relating to Fund distributions or the redemption of Fund shares. |
| (c) | The Fund’s portfolio turnover rate is calculated in accordance with regulatory requirements, without regard to transactions involving short term investments and certain derivatives. If such transactions were included, the Fund’s portfolio turnover rate may be higher. |
| The accompanying notes are an integral part of these financial statements. | 61 |
GOLDMAN SACHS INTERNATIONAL SMALL CAP INSIGHTS FUND
Financial Highlights(continued)
Selected Data for a Share Outstanding Throughout Each Year
| Goldman Sachs International Small Cap Insights Fund | ||||||||||||||||||||||
| Institutional Shares | ||||||||||||||||||||||
| Year Ended October 31, | ||||||||||||||||||||||
| 2019 | 2018 | 2017 | 2016 | 2015 | ||||||||||||||||||
| Per Share Data |
| |||||||||||||||||||||
Net asset value, beginning of year | $ | 11.19 | $ | 13.42 | $ | 10.73 | $ | 10.44 | $ | 10.05 | ||||||||||||
Net investment income(a) | 0.22 | 0.21 | 0.21 | 0.21 | 0.20 | |||||||||||||||||
Net realized and unrealized gain (loss) | 0.54 | (1.38 | ) | 2.77 | 0.26 | 0.49 | ||||||||||||||||
Total from investment operations | 0.76 | (1.17 | ) | 2.98 | 0.47 | 0.69 | ||||||||||||||||
Distributions to shareholders from net investment income | (0.17 | ) | (0.23 | ) | (0.29 | ) | (0.18 | ) | (0.20 | ) | ||||||||||||
Distributions to shareholders from net realized gains | — | (0.83 | ) | — | — | (0.10 | ) | |||||||||||||||
Total distributions | (0.17 | ) | (1.06 | ) | (0.29 | ) | (0.18 | ) | (0.30 | ) | ||||||||||||
Net asset value, end of year | $ | 11.78 | $ | 11.19 | $ | 13.42 | $ | 10.73 | $ | 10.44 | ||||||||||||
| Total return(b) | 7.10 | % | (9.53 | )% | 28.59 | % | 4.50 | % | 7.11 | % | ||||||||||||
Net assets, end of year (in 000s) | $ | 2,134,382 | $ | 2,250,288 | $ | 1,796,887 | $ | 1,118,478 | $ | 888,071 | ||||||||||||
Ratio of net expenses to average net assets | 0.87 | % | 0.87 | % | 0.90 | % | 0.90 | % | 0.90 | % | ||||||||||||
Ratio of total expenses to average net assets | 0.95 | % | 0.92 | % | 0.94 | % | 0.98 | % | 0.99 | % | ||||||||||||
Ratio of net investment income to average net assets | 1.96 | % | 1.67 | % | 1.77 | % | 1.98 | % | 1.97 | % | ||||||||||||
Portfolio turnover rate(c) | 131 | % | 110 | % | 129 | % | 140 | % | 131 | % | ||||||||||||
| (a) | Calculated based on the average shares outstanding methodology. |
| (b) | Assumes investment at the net asset value at the beginning of the year, reinvestment of all distributions, a complete redemption of the investment at the net asset value at the end of the year and no sales or redemption charges (if any). Total returns would be reduced if a sales or redemption charge was taken into account. Returns do not reflect the impact of taxes to shareholders relating to Fund distributions or the redemption of Fund shares. |
| (c) | The Fund’s portfolio turnover rate is calculated in accordance with regulatory requirements, without regard to transactions involving short term investments and certain derivatives. If such transactions were included, the Fund’s portfolio turnover rate may be higher. |
| 62 | The accompanying notes are an integral part of these financial statements. |
GOLDMAN SACHS INTERNATIONAL SMALL CAP INSIGHTS FUND
Financial Highlights(continued)
Selected Data for a Share Outstanding Throughout Each Year
| Goldman Sachs International Small Cap Insights Fund | ||||||||||||||||||||||
| Investor Shares(a) | ||||||||||||||||||||||
| Year Ended October 31, | ||||||||||||||||||||||
| 2019 | 2018 | 2017 | 2016 | 2015 | ||||||||||||||||||
| Per Share Data |
| |||||||||||||||||||||
Net asset value, beginning of year | $ | 11.12 | $ | 13.36 | $ | 10.68 | $ | 10.40 | $ | 10.01 | ||||||||||||
Net investment income(b) | 0.19 | 0.21 | 0.21 | 0.19 | 0.19 | |||||||||||||||||
Net realized and unrealized gain (loss) | 0.56 | (1.40 | ) | 2.75 | 0.26 | 0.49 | ||||||||||||||||
Total from investment operations | 0.75 | (1.19 | ) | 2.96 | 0.45 | 0.68 | ||||||||||||||||
Distributions to shareholders from net investment income | (0.15 | ) | (0.22 | ) | (0.28 | ) | (0.17 | ) | (0.19 | ) | ||||||||||||
Distributions to shareholders from net realized gains | — | (0.83 | ) | — | — | (0.10 | ) | |||||||||||||||
Total distributions | (0.15 | ) | (1.05 | ) | (0.28 | ) | (0.17 | ) | (0.29 | ) | ||||||||||||
Net asset value, end of year | $ | 11.72 | $ | 11.12 | $ | 13.36 | $ | 10.68 | $ | 10.40 | ||||||||||||
| Total return(c) | 7.01 | % | (9.72 | )% | 28.48 | % | 4.33 | % | 7.00 | % | ||||||||||||
Net assets, end of year (in 000s) | $ | 274,079 | $ | 532,484 | $ | 344,700 | $ | 99,365 | $ | 40,890 | ||||||||||||
Ratio of net expenses to average net assets | 1.01 | % | 1.01 | % | 1.04 | % | 1.05 | % | 1.05 | % | ||||||||||||
Ratio of total expenses to average net assets | 1.08 | % | 1.06 | % | 1.09 | % | 1.13 | % | 1.14 | % | ||||||||||||
Ratio of net investment income to average net assets | 1.74 | % | 1.68 | % | 1.76 | % | 1.83 | % | 1.83 | % | ||||||||||||
Portfolio turnover rate(d) | 131 | % | 110 | % | 129 | % | 140 | % | 131 | % | ||||||||||||
| (a) | Effective August 15, 2017, Class IR changed its name to Investor Shares. |
| (b) | Calculated based on the average shares outstanding methodology. |
| (c) | Assumes investment at the net asset value at the beginning of the year, reinvestment of all distributions, a complete redemption of the investment at the net asset value at the end of the year and no sales or redemption charges (if any). Total returns would be reduced if a sales or redemption charge was taken into account. Returns do not reflect the impact of taxes to shareholders relating to Fund distributions or the redemption of Fund shares. |
| (d) | The Fund’s portfolio turnover rate is calculated in accordance with regulatory requirements, without regard to transactions involving short term investments and certain derivatives. If such transactions were included, the Fund’s portfolio turnover rate may be higher. |
| The accompanying notes are an integral part of these financial statements. | 63 |
GOLDMAN SACHS INTERNATIONAL SMALL CAP INSIGHTS FUND
Financial Highlights(continued)
Selected Data for a Share Outstanding Throughout Each Period
| Goldman Sachs International Small Cap Insights Fund | ||||||||||
| Class P Shares | ||||||||||
| Year Ended October 31, 2019 | April 16, 2018* to October 31, 2018 | |||||||||
| Per Share Data |
| |||||||||
Net asset value, beginning of period | $ | 11.21 | $ | 13.08 | ||||||
Net investment income(a) | 0.22 | 0.08 | ||||||||
Net realized and unrealized gain (loss) | 0.54 | (1.95 | ) | |||||||
Total from investment operations | 0.76 | (1.87 | ) | |||||||
Distributions to shareholders from net investment income | (0.17 | ) | — | |||||||
Net asset value, end of period | $ | 11.80 | $ | 11.21 | ||||||
| Total return(b) | 7.11 | % | (14.30 | )% | ||||||
Net assets, end of period (in 000s) | $ | 80,926 | $ | 90,943 | ||||||
Ratio of net expenses to average net assets | 0.86 | % | 0.85 | %(c) | ||||||
Ratio of total expenses to average net assets | 0.94 | % | 0.93 | %(c) | ||||||
Ratio of net investment income to average net assets | 1.96 | % | 1.20 | %(c) | ||||||
Portfolio turnover rate(d) | 131 | % | 110 | % | ||||||
| * | Commencement of operations. |
| (a) | Calculated based on the average shares outstanding methodology. |
| (b) | Assumes investment at the net asset value at the beginning of the period, reinvestment of all distributions, a complete redemption of the investment at the net asset value at the end of the period and no sales or redemption charges (if any). Total returns would be reduced if a sales or redemption charge was taken into account. Returns do not reflect the impact of taxes to shareholders relating to Fund distributions or the redemption of Fund shares. Total returns for periods less than one full year are not annualized. |
| (c) | Annualized. |
| (d) | The Fund’s portfolio turnover rate is calculated in accordance with regulatory requirements, without regard to transactions involving short term investments and certain derivatives. If such transactions were included, the Fund’s portfolio turnover rate may be higher. |
| 64 | The accompanying notes are an integral part of these financial statements. |
GOLDMAN SACHS INTERNATIONAL SMALL CAP INSIGHTS FUND
Financial Highlights(continued)
Selected Data for a Share Outstanding Throughout Each Period
| Goldman Sachs International Small Cap Insights Fund | ||||||||||||||||||||||
| Class R6 Shares | ||||||||||||||||||||||
| Year Ended October 31, | July 31, 2015* to October 31, 2015 | |||||||||||||||||||||
| 2019 | 2018 | 2017 | 2016 | |||||||||||||||||||
| Per Share Data |
| |||||||||||||||||||||
Net asset value, beginning of period | $ | 11.21 | $ | 13.45 | $ | 10.75 | $ | 10.44 | $ | 10.75 | ||||||||||||
Net investment income(a) | 0.22 | 0.22 | 0.20 | 0.26 | 0.05 | |||||||||||||||||
Net realized and unrealized gain (loss) | 0.54 | (1.40 | ) | 2.79 | 0.23 | (0.36 | ) | |||||||||||||||
Total from investment operations | 0.76 | (1.18 | ) | 2.99 | 0.49 | (0.31 | ) | |||||||||||||||
Distributions to shareholders from net investment income | (0.17 | ) | (0.23 | ) | (0.29 | ) | (0.18 | ) | — | |||||||||||||
Distributions to shareholders from net realized gains | — | (0.83 | ) | — | — | — | ||||||||||||||||
Total distributions | (0.17 | ) | (1.06 | ) | (0.29 | ) | (0.18 | ) | — | |||||||||||||
Net asset value, end of period | $ | 11.80 | $ | 11.21 | $ | 13.45 | $ | 10.75 | $ | 10.44 | ||||||||||||
| Total return(b) | 7.11 | % | (9.57 | )% | 28.67 | % | 4.72 | % | (2.88 | )% | ||||||||||||
Net assets, end of period (in 000s) | $ | 1,192,142 | $ | 1,076,035 | $ | 116,788 | $ | 18,566 | $ | 10 | ||||||||||||
Ratio of net expenses to average net assets | 0.86 | % | 0.85 | % | 0.88 | % | 0.88 | % | 0.90 | %(c) | ||||||||||||
Ratio of total expenses to average net assets | 0.94 | % | 0.92 | % | 0.92 | % | 0.97 | % | 0.96 | %(c) | ||||||||||||
Ratio of net investment income to average net assets | 2.01 | % | 1.72 | % | 1.58 | % | 2.39 | % | 1.94 | %(c) | ||||||||||||
Portfolio turnover rate(d) | 131 | % | 110 | % | 129 | % | 140 | % | 131 | % | ||||||||||||
| * | Commencement of operations. |
| (a) | Calculated based on the average shares outstanding methodology. |
| (b) | Assumes investment at the net asset value at the beginning of the period, reinvestment of all distributions, a complete redemption of the investment at the net asset value at the end of the period and no sales or redemption charges (if any). Total returns would be reduced if a sales or redemption charge was taken into account. Returns do not reflect the impact of taxes to shareholders relating to Fund distributions or the redemption of Fund shares. Total returns for periods less than one full year are not annualized. |
| (c) | Annualized. |
| (d) | The Fund’s portfolio turnover rate is calculated in accordance with regulatory requirements, without regard to transactions involving short term investments and certain derivatives. If such transactions were included, the Fund’s portfolio turnover rate may be higher. |
| The accompanying notes are an integral part of these financial statements. | 65 |
GOLDMAN SACHS INTERNATIONAL EQUITY INSIGHTS FUNDS
October 31, 2019
| 1. ORGANIZATION |
Goldman Sachs Trust (the “Trust”) is a Delaware statutory trust registered under the Investment Company Act of 1940, as amended (the “Act”), as an open-end management investment company. The following table lists those series of the Trust that are included in this report (collectively, the “Funds” or individually a “Fund”), along with their corresponding share classes and respective diversification status under the Act:
| Fund | Share Classes Offered | Diversified/ Non-diversified | ||
Emerging Markets Equity Insights | A, C, Institutional, Investor, P, R and R6 | Diversified | ||
International Equity Insights | A, C, Institutional, Service, Investor, P, R and R6 | Diversified | ||
International Small Cap Insights | A, C, Institutional, Investor, P and R6 | Diversified |
Class A Shares are sold with a front-end sales charge of up to 5.50%. Class C Shares are sold with a contingent deferred sales charge (“CDSC”) of 1.00%, which is imposed on redemptions made within 12 months of purchase. Institutional, Service, Investor, Class P, Class R and Class R6 Shares are not subject to a sales charge.
Goldman Sachs Asset Management, L.P. (“GSAM”), an affiliate of Goldman Sachs & Co. LLC (“Goldman Sachs”), serves as investment adviser to the Funds pursuant to a management agreement (the “Agreement”) with the Trust.
| 2. SIGNIFICANT ACCOUNTING POLICIES |
The financial statements have been prepared in accordance with accounting principles generally accepted in the United States of America (“GAAP”) and require management to make estimates and assumptions that may affect the reported amounts and disclosures. Actual results may differ from those estimates and assumptions. Each Fund is an investment company under GAAP and follows the accounting and reporting guidance applicable to investment companies.
A. Investment Valuation— The Funds’ valuation policy is to value investments at fair value.
B. Investment Income and Investments— Investment income includes interest income, dividend income, and securities lending income, if any. Interest income is accrued daily and adjusted for amortization of premiums and accretion of discounts. Dividend income is recognized on ex-dividend date or, for certain foreign securities, as soon as such information is obtained subsequent to the ex-dividend date. Non-cash dividends, if any, are recorded at the fair market value of the securities received. Investment transactions are reflected on trade date. Realized gains and losses are calculated using identified cost. Investment transactions are recorded on the following business day for daily net asset value (“NAV”) calculations. Investment income is recorded net of any foreign withholding taxes, less any amounts reclaimable. The Funds may file withholding tax reclaims in certain jurisdictions to recover a portion of amounts previously withheld. Any foreign capital gains tax is accrued daily based upon net unrealized gains, and is payable upon sale of such investments.
For derivative contracts, realized gains and losses are recorded upon settlement of the contract.
C. Class Allocations and Expenses— Investment income, realized and unrealized gain (loss), if any, and non-class specific expenses of each Fund are allocated daily based upon the proportion of net assets of each class.Non-class specific expenses directly incurred by a Fund are charged to that Fund, while such expenses incurred by the Trust are allocated across the applicable Funds on a straight-line and/orpro-rata basis depending upon the nature of the expenses. Class specific expenses, where applicable, are borne by the respective share classes and include Distribution and Service, Transfer Agency and Service and Shareholder Administration fees.
D. Federal Taxes and Distributions to Shareholders— It is each Fund’s policy to comply with the requirements of the Internal Revenue Code of 1986, as amended (the “Code”), applicable to regulated investment companies and to distribute each year substantially all of its investment company taxable income and capital gains to its shareholders. Accordingly, each Fund is not required to make any provisions for the payment of federal income tax. Distributions to shareholders are recorded on the ex-dividend date. Income and capital gains distributions, if any, are declared and paid at least annually.
66
GOLDMAN SACHS INTERNATIONAL EQUITY INSIGHTS FUNDS
| 2. SIGNIFICANT ACCOUNTING POLICIES (continued) |
Net capital losses, if any, are carried forward to future fiscal years and may be used to the extent allowed by the Code to offset any future capital gains. Losses that are carried forward will retain their character as eithershort-term orlong-term capital losses. Utilization of capital loss carryforwards will reduce the requirement of future capital gains distributions.
The characterization of distributions to shareholders for financial reporting purposes is determined in accordance with federal income tax rules, which may differ from GAAP. The source of each Fund’s distributions may be shown in the accompanying financial statements as either from distributable earnings or capital. Certain components of the Funds’ net assets on the Statements of Assets and Liabilities reflect permanent GAAP/tax differences based on the appropriate tax character.
E. Foreign Currency Translation— The accounting records and reporting currency of a Fund are maintained in U.S. dollars. Assets and liabilities denominated in foreign currencies are translated into U.S. dollars using the current exchange rates at the close of each business day. The effect of changes in foreign currency exchange rates on investments is included within net realized and unrealized gain (loss) on investments. Changes in the value of other assets and liabilities as a result of fluctuations in foreign exchange rates are included in the Statements of Operations within net change in unrealized gain (loss) on foreign currency translation. Transactions denominated in foreign currencies are translated into U.S. dollars on the date the transaction occurred, the effects of which are included within net realized gain (loss) on foreign currency transactions.
| 3. INVESTMENTS AND FAIR VALUE MEASUREMENTS |
U.S. GAAP defines the fair value of a financial instrument as the amount that would be received to sell an asset or paid to transfer a liability in an orderly transaction between market participants at the measurement date (i.e., the exit price); the Funds’ policy is to use the market approach. GAAP establishes a fair value hierarchy that prioritizes the inputs to valuation techniques used to measure fair value. The hierarchy gives the highest priority to unadjusted quoted prices in active markets for identical assets or liabilities (Level 1 measurements) and the lowest priority to unobservable inputs (Level 3 measurements). The levels used for classifying investments are not necessarily an indication of the risk associated with investing in these investments. The three levels of the fair value hierarchy are described below:
Level 1 — Unadjusted quoted prices in active markets that are accessible at the measurement date for identical, unrestricted assets or liabilities;
Level 2 — Quoted prices in markets that are not active or financial instruments for which significant inputs are observable (including, but not limited to, quoted prices for similar investments, interest rates, foreign exchange rates, volatility and credit spreads), either directly or indirectly;
Level 3 — Prices or valuations that require significant unobservable inputs (including GSAM’s assumptions in determining fair value measurement).
The Board of Trustees (“Trustees”) has approved Valuation Procedures that govern the valuation of the portfolio investments held by the Funds, including investments for which market quotations are not readily available. The Trustees have delegated to GSAMday-to-day responsibility for implementing and maintaining internal controls and procedures related to the valuation of the Funds’ investments. To assess the continuing appropriateness of pricing sources and methodologies, GSAM regularly performs price verification procedures and issues challenges as necessary to third party pricing vendors or brokers, and any differences are reviewed in accordance with the Valuation Procedures.
A. Level 1 and Level 2 Fair Value Investments— The valuation techniques and significant inputs used in determining the fair values for investments classified as Level 1 and Level 2 are as follows:
Equity Securities — Equity securities traded on a United States (“U.S.”) securities exchange or the NASDAQ system, or those located on certain foreign exchanges, including but not limited to the Americas, are valued daily at their last sale price or official closing price on the principal exchange or system on which they are traded. If there is no sale or official closing price or such price is believed by GSAM to not represent fair value, equity securities may be valued at the closing bid price for long positions and at the closing ask price for short positions. To the extent these investments are actively traded, they are classified as Level 1 of the fair value hierarchy, otherwise they are generally classified as Level 2.
67
GOLDMAN SACHS INTERNATIONAL EQUITY INSIGHTS FUNDS
Notes to Financial Statements(continued)
October 31, 2019
| 3. INVESTMENTS AND FAIR VALUE MEASUREMENTS (continued) |
Unlisted equity securities for which market quotations are available are valued at the last sale price on the valuation date, or if no sale occurs, at the last bid price for long positions or the last ask price for short positions, and are generally classified as Level 2. Securities traded on certain foreign securities exchanges are valued daily at fair value determined by an independent fair value service (if available) under Valuation Procedures approved by the Trustees and consistent with applicable regulatory guidance. The independent fair value service takes into account multiple factors including, but not limited to, movements in the securities markets, certain depositary receipts, futures contracts and foreign currency exchange rates that have occurred subsequent to the close of the foreign securities exchange. These investments are generally classified as Level 2 of the fair value hierarchy.
Money Market Funds — Investments in the Goldman Sachs Financial Square Government Fund (“Underlying Fund”) are valued at the NAV per share of the Institutional Share class on the day of valuation. These investments are generally classified as Level 1 of the fair value hierarchy. For information regarding the Underlying Fund’s accounting policies and investment holdings, please see the Underlying Fund’s shareholder report.
Derivative Contracts — A derivative is an instrument whose value is derived from underlying assets, indices, reference rates or a combination of these factors. A Fund enters into derivative transactions to hedge against changes in interest rates, securities prices, and/or currency exchange rates, to increase total return, or to gain access to certain markets or attain exposure to other underliers. For financial reporting purposes, cash collateral that has been pledged to cover obligations of a Fund and cash collateral received, if any is reported separately on the Statements of Assets and Liabilities as receivables/payables for collateral on certain derivatives contracts.Non-cash collateral pledged by a Fund, if any, is noted in the Schedules of Investments.
Exchange-traded derivatives, including futures and options contracts, are generally valued at the last sale or settlement price on the exchange where they are principally traded. Exchange-traded options without settlement prices are generally valued at the midpoint of the bid and ask prices on the exchange where they are principally traded (or, in the absence of two-way trading, at the last bid price for long positions and the last ask price for short positions). Exchange-traded derivatives typically fall within Level 1 of the fair value hierarchy.Over-the-counter (“OTC”) and centrally cleared derivatives are valued using market transactions and other market evidence, including market-based inputs to models, calibration to market-clearing transactions, broker or dealer quotations, or other alternative pricing sources. Where models are used, the selection of a particular model to value OTC and centrally cleared derivatives depends upon the contractual terms of, and specific risks inherent in, the instrument, as well as the availability of pricing information in the market. Valuation models require a variety of inputs, including contractual terms, market prices, yield curves, credit curves, measures of volatility, voluntary and involuntary prepayment rates, loss severity rates and correlations of such inputs. For OTC and centrally cleared derivatives that trade in liquid markets, model inputs can generally be verified and model selection does not involve significant management judgment. OTC and centrally cleared derivatives are classified within Level 2 of the fair value hierarchy when significant inputs are corroborated by market evidence.
i. Futures Contracts — Futures contracts are contracts to buy or sell a standardized quantity of a specified commodity or security. Upon entering into a futures contract, a Fund deposits cash or securities in an account on behalf of the broker in an amount sufficient to meet the initial margin requirement. Subsequent payments are made or received by a Fund equal to the daily change in the contract value and are recorded as variation margin receivable or payable with a corresponding offset to unrealized gains or losses.
B. Level 3 Fair Value Investments— To the extent that significant inputs to valuation models and other alternative pricing sources are unobservable, or if quotations are not readily available, or if GSAM believes that such quotations do not accurately reflect fair value, the fair value of a Fund’s investments may be determined under Valuation Procedures approved by the Trustees. GSAM, consistent with its procedures and applicable regulatory guidance, may make an adjustment to the most recent valuation prices of either domestic or foreign securities in light of significant events to reflect what it believes to be the fair value of the securities at the time of determining a Fund’s NAV. To the extent investments are valued using single source broker quotations obtained directly from the broker or passed through from third party pricing vendors, such investments are classified as Level 3 investments. GSAM did not develop the unobservable inputs for valuation of Level 3 Assets and Liabilities.
68
GOLDMAN SACHS INTERNATIONAL EQUITY INSIGHTS FUNDS
| 3. INVESTMENTS AND FAIR VALUE MEASUREMENTS (continued) |
C. Fair Value Hierarchy— The following is a summary of the Funds’ investments and derivatives classified in the fair value hierarchy as of October 31, 2019:
| EMERGING MARKETS EQUITY INSIGHTS | ||||||||||||
| Investment Type | Level 1 | Level 2 | Level 3 | |||||||||
| Assets | ||||||||||||
Common Stock and/or Other Equity Investments(a) | ||||||||||||
Africa | $ | 22,097,986 | $ | 39,852,737 | $ | — | ||||||
Asia | 261,735,184 | 1,183,832,166 | — | |||||||||
Europe | — | 30,693,409 | — | |||||||||
North America | 82,850,591 | — | — | |||||||||
South America | 126,055,563 | 32,198,138 | — | |||||||||
Securities Lending Reinvestment Vehicle | 121,709 | — | — | |||||||||
| Total | $ | 492,861,033 | $ | 1,286,576,450 | $ | — | ||||||
| INTERNATIONAL EQUITY INSIGHTS | ||||||||||||
| Investment Type | Level 1 | Level 2 | Level 3 | |||||||||
| Assets | ||||||||||||
Common Stock and/or Other Equity Investments(a) | ||||||||||||
Asia | $ | — | $ | 762,094,300 | $ | — | ||||||
Australia and Oceania | 14,309,615 | 216,104,801 | — | |||||||||
Europe | 65,181,481 | 1,930,635,497 | — | |||||||||
North America | 8,430,119 | 10,109,375 | — | |||||||||
Securities Lending Reinvestment Vehicle | 30,387,872 | — | — | |||||||||
| Total | $ | 118,309,087 | $ | 2,918,943,973 | $ | — | ||||||
| INTERNATIONAL SMALL CAP INSIGHTS | ||||||||||||
| Investment Type | Level 1 | Level 2 | Level 3 | |||||||||
| Assets | ||||||||||||
Common Stock and/or Other Equity Investments(a) | ||||||||||||
Asia | $ | 148,847 | $ | 1,429,369,766 | $ | — | ||||||
Australia and Oceania | — | 317,878,459 | — | |||||||||
Europe | — | 2,097,326,467 | — | |||||||||
Securities Lending Reinvestment Vehicle | 32,107,743 | — | — | |||||||||
| Total | $ | 32,256,590 | $ | 3,844,574,692 | $ | — | ||||||
| Derivative Type | ||||||||||||
| Assets(b) | ||||||||||||
Futures Contracts | $ | 8,231 | $ | — | $ | — | ||||||
| (a) | Amounts are disclosed by continent to highlight the impact of time zone differences between local market close and the calculation of NAV. Security valuations are based on the principal exchange or system on which they are traded, which may differ from country of domicile. The Funds utilize fair value model prices provided by an independent fair value service for certain international equity securities, resulting in a Level 2 classification. |
| (b) | Amount shown represents unrealized gain (loss) at fiscal year end. |
For further information regarding security characteristics, see the Schedules of Investments.
69
GOLDMAN SACHS INTERNATIONAL EQUITY INSIGHTS FUNDS
Notes to Financial Statements(continued)
October 31, 2019
| 4. INVESTMENTS IN DERIVATIVES |
The following table sets forth, by certain risk types, the gross value of derivative contracts (not considered to be hedging instruments for accounting disclosure purposes) as of October 31, 2019. These instruments were used as part of the Funds’ investment strategies and to obtain and/or manage exposure related to the risks below. The values in the tables below exclude the effects of cash collateral received or posted pursuant to these derivative contracts, and therefore are not representative of the Funds’ net exposure:
| Fund | Risk | Statements of Assets and Liabilities | Assets(a) | Statements of Assets and Liabilities | Liabilities | |||||||||
International Small Cap Insights | Equity | Variation margin on futures contracts | $ | 8,231 | — | $ | — | |||||||
| (a) | Includes unrealized gain (loss) on futures contracts described in the Additional Investment Information sections of the Schedules of Investments. Only the variation margin as of October 31, 2019 is reported within the Statements of Assets and Liabilities. |
The following table sets forth, by certain risk types, the Funds’ gains (losses) related to these derivatives and their indicative volumes for the fiscal year ended October 31, 2019. These gains (losses) should be considered in the context that these derivative contracts may have been executed to create investment opportunities and/or economically hedge certain investments, and accordingly, certain gains (losses) on such derivative contracts may offset certain (losses) gains attributable to investments. These gains (losses) are included in “Net realized gain (loss)” or “Net change in unrealized gain (loss)” on the Statements of Operations:
| Fund | Risk | Statements of Operations | Net Realized Gain (Loss) | Net Change in Unrealized Gain (Loss) | Average Number of Contracts(a) | |||||||||||
Emerging Markets Equity Insights | Equity | Net realized gain (loss) from futures contracts/Net change in unrealized gain (loss) on futures contracts | $ | (1,972,516 | ) | $ | — | 192 | ||||||||
International Equity Insights | Equity | Net realized gain (loss) from futures contracts/Net change in unrealized gain (loss) on futures contracts | 2,455,133 | 1,587,009 | 632 | |||||||||||
International Small Cap Insights | Equity | Net realized gain (loss) from futures contracts/Net change in unrealized gain (loss) on futures contracts | (5,964,532 | ) | 3,394,640 | 395 | ||||||||||
| (a) | Average number of contracts is based on the average of month end balances for the fiscal year ended October 31, 2019. |
| 5. AGREEMENTS AND AFFILIATED TRANSACTIONS |
A. Management Agreement— Under the Agreement, GSAM manages the Funds, subject to the general supervision of the Trustees.
As compensation for the services rendered pursuant to the Agreement, the assumption of the expenses related thereto and administration of the Funds’ business affairs, including providing facilities, GSAM is entitled to a management fee, accrued daily and paid monthly, equal to an annual percentage rate of each Fund’s average daily net assets.
70
GOLDMAN SACHS INTERNATIONAL EQUITY INSIGHTS FUNDS
| 5. AGREEMENTS AND AFFILIATED TRANSACTIONS (continued) |
For the fiscal year ended October 31, 2019, contractual and effective net management fees with GSAM were at the following rates:
| Contractual Management Rate | Effective Net Management Rate^ | |||||||||||||||||||||||||||||
| Fund | First $1 billion | Next $1 billion | Next $3 billion | Next $3 billion | Over $8 billion | Effective Rate | ||||||||||||||||||||||||
Emerging Markets Equity Insights | 1.00 | % | 1.00 | % | 0.90 | % | 0.86 | % | 0.84 | % | 1.00 | % | 1.00 | % | ||||||||||||||||
International Equity Insights | 0.81 | 0.73 | 0.69 | 0.68 | 0.67 | 0.75 | 0.75 | |||||||||||||||||||||||
International Small Cap Insights | 0.85 | 0.85 | 0.77 | 0.73 | 0.72 | 0.81 | 0.81 | |||||||||||||||||||||||
| ^ | Effective Net Management Rate includes the impact of management fee waivers of affiliated underlying funds, if any. |
The Emerging Markets Equity Insights, International Equity Insights and International Small Cap Insights Funds invest in Institutional Shares of the Goldman Sachs Financial Square Government Fund, which is an affiliated Underlying Fund. GSAM has agreed to waive a portion of its management fee payable by the Funds in an amount equal to the management fee it earns as an investment adviser to the affiliated Underlying Fund in which the Funds invest, except those management fees it earns from the Funds’ investments of cash collateral received in connection with securities lending transactions in the Goldman Sachs Financial Square Government Fund. For the fiscal year ended October 31, 2019, GSAM waived $1,450, $8,937 and $516 of the Emerging Markets Equity Insights, International Equity Insights and International Small Cap Insights Funds’ management fees, respectively.
B. Distribution and/or Service (12b-1) Plans— The Trust, on behalf of Class A and Class R Shares of each applicable Fund, has adopted Distribution and Service Plans subject to Rule 12b-1 under the Act. Under the Distribution and Service Plans, Goldman Sachs, which serves as distributor (the “Distributor”), is entitled to a fee accrued daily and paid monthly for distribution services and personal and account maintenance services, which may then be paid by Goldman Sachs to authorized dealers. These fees are equal to an annual percentage rate of the average daily net assets attributable to Class A or Class R Shares of the Funds, as applicable, as set forth below.
The Trust, on behalf of Class C Shares of each applicable Fund, has adopted a Distribution Plan subject to Rule 12b-1 under the Act. Under the Distribution Plan, Goldman Sachs as Distributor is entitled to a fee accrued daily and paid monthly for distribution services, which may then be paid by Goldman Sachs to authorized dealers. These fees are equal to an annual percentage rate of the average daily net assets attributable to Class C Shares of the Funds, as set forth below.
The Trust, on behalf of Service Shares of each applicable Fund, has adopted a Service Plan subject to Rule 12b-1 under the Act to allow Service Shares to compensate service organizations (including Goldman Sachs) for providing personal and account maintenance services to their customers who are beneficial owners of such shares. The Service Plan provides for compensation to the service organizations equal to an annual percentage rate of the average daily net assets attributable to Service Shares of the Funds, as set forth below.
| Distribution and/or Service Plan Rates | ||||||||||||||||
| Class A* | Class C | Class R* | Service | |||||||||||||
Distribution and/or Service Plan | 0.25 | % | 0.75 | % | 0.50 | % | 0.25 | % | ||||||||
| * | With respect to Class A and Class R Shares, the Distributor at its discretion may use compensation for distribution services paid under the Distribution and Service Plans to compensate service organizations for personal and account maintenance services and expenses as long as such total compensation does not exceed the maximum cap on “service fees” imposed by the Financial Industry Regulatory Authority. |
71
GOLDMAN SACHS INTERNATIONAL EQUITY INSIGHTS FUNDS
Notes to Financial Statements(continued)
October 31, 2019
| 5. AGREEMENTS AND AFFILIATED TRANSACTIONS (continued) |
C. Distribution Agreement— Goldman Sachs, as Distributor of the shares of the Funds pursuant to a Distribution Agreement, may retain a portion of the Class A Shares’ front end sales charge and Class C Shares’ CDSC. During the fiscal year ended October 31, 2019, Goldman Sachs retained the following amounts:
| Front End Sales Charge | Contingent Deferred Sales Charge | |||||||||
| Fund | Class A | Class C | ||||||||
Emerging Markets Equity Insights | $ | 6,606 | $ | — | ||||||
International Equity Insights | 8,051 | 100 | ||||||||
International Small Cap Insights | 3,695 | — | ||||||||
D. Service and Shareholder Administration Plans— The Trust, on behalf of each applicable Fund, has adopted Service Plans to allow Class C Shares and Shareholder Administration Plans to allow Service Shares, respectively, to compensate service organizations (including Goldman Sachs) for providing varying levels of personal and account maintenance or shareholder administration services to their customers who are beneficial owners of such shares. The Service and Shareholder Administration Plans each provide for compensation to the service organizations equal to an annual percentage rate of 0.25% of the average daily net assets attributable to Class C and Service Shares of the Funds, respectively.
E. Transfer Agency Agreement— Goldman Sachs also serves as the transfer agent of the Funds for a fee pursuant to the Transfer Agency Agreement. The fees charged for such transfer agency services are accrued daily and paid monthly at annual rates as follows: 0.17% of the average daily net assets of Class A, Class C, Investor and Class R Shares; 0.03% of the average daily net assets of Class P and Class R6 Shares; and 0.04% of the average daily net assets of Institutional and Service Shares. Prior to July 1, 2019, the annual rates were as follows: 0.18% of the average daily net assets of Class A, Class C, Investor and Class R Shares. Prior to February 28, 2019, the transfer agency waiver was 0.05% for Class A, Class C, Investor and Class R Shares of the International Equity Insights Fund.
F. Other Expense Agreements and Affiliated Transactions— GSAM has agreed to reduce or limit certain “Other Expenses” of the Funds (excluding acquired fund fees and expenses, transfer agency fees and expenses, service fees and shareholder administration fees (as applicable), taxes, interest, brokerage fees, expenses of shareholder meetings, litigation and indemnification, and extraordinary expenses) to the extent such expenses exceed, on an annual basis, a percentage rate of the average daily net assets of each Fund. Such Other Expense reimbursements, if any, are accrued daily and paid monthly. In addition, the Funds are not obligated to reimburse GSAM for prior fiscal year expense reimbursements, if any. The Other Expense limitations as an annual percentage rate of average daily net assets for Emerging Markets Equity Insights, International Equity Insights and International Small Cap Insights Funds are 0.054%, 0.004% and 0.014%, respectively. These Other Expense limitations will remain in place through at least February 28, 2020, and prior to such date GSAM may not terminate the arrangements without the approval of the Trustees. In addition, the Funds have entered into certain offset arrangements with the custodian and the transfer agent, which may result in a reduction of the Funds’ expenses and are received irrespective of the application of the “Other Expense” limitations described above.
For the fiscal year ended October 31, 2019, these expense reductions, including any fee waivers and Other Expense reimbursements, were as follows:
| Fund | Management Fee Waiver | Custody Fee Credits | Transfer Agency Waiver/Credits | Other Expense Reimbursement | Total Expense Reductions | |||||||||||||||||
Emerging Markets Equity Insights | $ | 1,450 | $ | 33,835 | $ | — | $ | 1,518,976 | $ | 1,554,261 | ||||||||||||
International Equity Insights | 8,937 | 89,465 | 95,122 | 1,615,700 | 1,809,224 | |||||||||||||||||
International Small Cap Insights | 516 | 58,293 | — | 2,786,578 | 2,845,387 | |||||||||||||||||
72
GOLDMAN SACHS INTERNATIONAL EQUITY INSIGHTS FUNDS
| 5. AGREEMENTS AND AFFILIATED TRANSACTIONS (continued) |
G. Line of Credit Facility— As of October 31, 2019, the Funds participated in a $580,000,000 committed, unsecured revolving line of credit facility (the “facility”) together with other funds of the Trust and certain registered investment companies having management agreements with GSAM or its affiliates. This facility is to be used for temporary emergency purposes, or to allow for an orderly liquidation of securities to meet redemption requests. The interest rate on borrowings is based on the federal funds rate. The facility also requires a fee to be paid by the Funds based on the amount of the commitment that has not been utilized. For the fiscal year ended October 31, 2019, the Funds did not have any borrowings under the facility. Prior to April 30, 2019 the facility was $770,000,000.
H. Other Transactions with Affiliates— For the fiscal year ended October 31, 2019, Goldman Sachs earned $2,610, $1,449 and $352 in brokerage commissions from portfolio transactions, including futures transactions executed with Goldman Sachs as the Futures Commission Merchant, on behalf of the Emerging Markets Equity Insights, International Equity Insights and International Small Cap Insights Funds, respectively.
The following table provides information about the Funds’ investments in the Goldman Sachs Financial Square Government Fund as of and for the fiscal year ended October 31, 2019:
| Fund | Beginning Value as of October 31, 2018 | Purchases at Cost | Proceeds from Sales | Ending Value as of October 31, 2019 | Shares as of October 31, 2019 | Dividend Income from Affiliated Investment Company | ||||||||||||||||||||
Emerging Markets Equity Insights | $ | 3,324 | $ | 86,066,618 | $ | (86,069,942 | ) | $ | — | — | $ | 20,373 | ||||||||||||||
International Equity Insights | 2,516 | 435,751,294 | (435,753,810 | ) | — | — | 127,553 | |||||||||||||||||||
International Small Cap Insights | — | 101,702,551 | (101,702,551 | ) | — | — | 6,723 | |||||||||||||||||||
As of October 31, 2019, the Goldman Sachs Global Tax-Aware Equity Portfolio was a beneficial owner of 5% or more of total outstanding shares of the following Fund:
| Fund | Goldman Sachs Tax-Advantaged Global Equity Portfolio | |||||
Emerging Markets Equity Insights | 9 | % | ||||
| 6. PORTFOLIO SECURITIES TRANSACTIONS |
The cost of purchases and proceeds from sales and maturities oflong-term securities for the fiscal year ended October 31, 2019, were as follows:
| Fund | Purchases | Sales and Maturities | ||||||||
Emerging Markets Equity Insights | $ | 3,099,976,508 | $ | 3,317,429,224 | ||||||
International Equity Insights | 4,164,539,383 | 3,805,329,640 | ||||||||
International Small Cap Insights | 5,059,544,388 | 5,463,401,664 | ||||||||
73
GOLDMAN SACHS INTERNATIONAL EQUITY INSIGHTS FUNDS
Notes to Financial Statements(continued)
October 31, 2019
| 7. SECURITIES LENDING |
Pursuant to exemptive relief granted by the Securities and Exchange Commission (“SEC”) and the terms and conditions contained therein, the Funds may lend their securities through a securities lending agent, Goldman Sachs Agency Lending (“GSAL”), awholly-owned subsidiary of Goldman Sachs, to certain qualified borrowers including Goldman Sachs and affiliates. In accordance with the Funds’ securities lending procedures, the Funds receive cash collateral at least equal to the market value of the securities on loan. The market value of the loaned securities is determined at the close of business of the Funds, at their last sale price or official closing price on the principal exchange or system on which they are traded, and any additional required collateral is delivered to the Funds on the next business day. As with other extensions of credit, the Funds may experience delay in the recovery of their securities or incur a loss should the borrower of the securities breach its agreement with the Funds or become insolvent at a time when the collateral is insufficient to cover the cost of repurchasing securities on loan. Dividend income received from securities on loan may not be subject to withholding taxes and therefore withholding taxes paid may differ from the amounts listed in the Statements of Operations. Loans of securities are terminable at any time and as such 1) the remaining contractual maturities of the outstanding securities lending transactions are considered to be overnight and continuous and 2) the borrower, after notice, is required to return borrowed securities within the standard time period for settlement of securities transactions.
The Funds invest the cash collateral received in connection with securities lending transactions in the Goldman Sachs Financial Square Government Fund (“Government Money Market Fund”), an affiliated series of the Goldman Sachs Trust. The Government Money Market Fund is registered under the Act as an open end investment company, is subject to Rule 2a-7 under the Act, and is managed by GSAM, for which GSAM may receive a management fee of up to 0.16% on an annualized basis of the average daily net assets of the Government Money Market Fund.
In the event of a default by a borrower with respect to any loan, GSAL will exercise any and all remedies provided under the applicable borrower agreement to make the Funds whole. These remedies include purchasing replacement securities by applying the collateral held from the defaulting broker against the purchase cost of the replacement securities. If GSAL is unable to purchase replacement securities, GSAL will indemnify the Funds by paying the Funds an amount equal to the market value of the securities loaned minus the value of cash collateral received from the borrower for the loan, subject to an exclusion for any shortfalls resulting from a loss of value in such cash collateral due to reinvestment risk. The Funds’ master netting agreements with certain borrowers provide the right, in the event of a default (including bankruptcy or insolvency), for the non-defaulting party to liquidate the collateral and calculate net exposure to the defaulting party or request additional collateral. However, in the event of a default by a borrower, a resolution authority could determine that such rights are not enforceable due to the restrictions or prohibitions against the right of set-off that may be imposed in accordance with a particular jurisdiction’s bankruptcy or insolvency laws. The Funds’ loaned securities were all subject to enforceable Securities Lending Agreements and the value of the collateral was at least equal to the value of the cash received. The amounts of the Funds’ overnight and continuous agreements, which represent the gross amounts of recognized liabilities for securities lending transactions outstanding as of October 31, 2019 are disclosed as “Payable upon return of securities loaned” on the Statements of Assets and Liabilities, where applicable.
Each of the Funds and GSAL received compensation relating to the lending of the Funds’ securities. The amounts earned, if any, by the Funds for the fiscal year ended October 31, 2019, are reported under Investment Income on the Statements of Operations.
The table below details securities lending activity with affiliates of Goldman Sachs:
| For the fiscal year ended October 31, 2019 | Amounts Payable to Goldman Sachs upon Return of Securities Loaned as of October 31, 2019 | |||||||||||||
| Fund | Earnings of GSAL Relating to Securities Loaned | Amounts Received by the Funds from Lending to Goldman Sachs | ||||||||||||
Emerging Markets Equity Insights | $ | 35,330 | $ | 49,735 | $ | 121,709 | ||||||||
International Equity Insights | 102,179 | 43,001 | — | |||||||||||
International Small Cap Insights | 144,524 | 128,473 | 3,833,550 | |||||||||||
74
GOLDMAN SACHS INTERNATIONAL EQUITY INSIGHTS FUNDS
| 7. SECURITIES LENDING (continued) |
The following table provides information about the Funds’ investment in the Government Money Market Fund for the fiscal year ended October 31, 2019:
| Fund | Beginning Value as of | Purchases at Cost | Proceeds from Sales | Ending Value as of October 31, 2019 | ||||||||||||||
Emerging Markets Equity Insights | $ | 13,774,705 | $ | 272,202,199 | $ | (285,855,195 | ) | $ | 121,709 | |||||||||
International Equity Insights | 37,685,400 | 566,438,801 | (573,736,329 | ) | 30,387,872 | |||||||||||||
International Small Cap Insights | 95,184,269 | 481,400,171 | (544,476,697 | ) | 32,107,743 | |||||||||||||
| 8. TAX INFORMATION |
The tax character of distributions paid during the fiscal year ended October 31, 2019, was as follows:
| Emerging Markets Equity Insights | International Equity Insights | International Small Cap Insights | ||||||||||
Distributions paid from: | ||||||||||||
Ordinary income | $ | 39,969,097 | $ | 46,026,332 | $ | 61,355,652 | ||||||
The tax character of distributions paid during the fiscal year ended October 31, 2018, was as follows:
| Emerging Markets Equity Insights | International Equity Insights | International Small Cap Insights | ||||||||||
Distributions paid from: | ||||||||||||
Ordinary income | $ | 77,070,023 | $ | 25,018,929 | $ | 141,813,044 | ||||||
Netlong-term capital gains | 16,169,224 | — | 66,688,456 | |||||||||
Total | $ | 93,239,247 | $ | 25,018,929 | $ | 208,501,500 | ||||||
As of October 31, 2019, the components of accumulated earnings (losses) on a tax-basis were as follows:
| Emerging Markets Equity Insights | International Equity Insights | International Small Cap Insights | ||||||||||
Undistributed ordinary income — net | $ | 32,660,178 | $ | 71,845,097 | $ | 133,002,945 | ||||||
Capital loss carryforwards:(1) | ||||||||||||
Perpetual long-term | $ | — | $ | (34,611,262 | ) | $ | (18,187,000 | ) | ||||
Perpetual short-term | (177,999,895 | ) | (177,052,399 | ) | (278,049,826 | ) | ||||||
Total capital loss carryforwards | $ | (177,999,895 | ) | $ | (211,663,661 | ) | $ | (296,236,826 | ) | |||
Unrealized gains — net | 146,157,007 | 157,334,894 | 164,445,223 | |||||||||
Total accumulated earnings — net | $ | 817,290 | $ | 17,516,330 | $ | 1,211,342 | ||||||
| (1) | The International Equity Insights Fund had capital loss carryforwards of $2,867,280 which expired in the current fiscal year. |
75
GOLDMAN SACHS INTERNATIONAL EQUITY INSIGHTS FUNDS
Notes to Financial Statements(continued)
October 31, 2019
| 8. TAX INFORMATION (continued) |
As of October 31, 2019, the Funds’ aggregate security unrealized gains and losses based on cost for U.S. federal income tax purposes were as follows:
| Emerging Markets Equity Insights | International Equity Insights | International Small Cap Insights | ||||||||||
Tax cost | $ | 1,633,297,992 | $ | 2,879,968,909 | $ | 3,712,576,548 | ||||||
Gross unrealized gain | 193,287,113 | 212,563,085 | 343,821,064 | |||||||||
Gross unrealized loss | (47,130,106 | ) | (55,228,191 | ) | (179,375,841 | ) | ||||||
Net unrealized gain | $ | 146,157,007 | $ | 157,334,894 | $ | 164,445,223 | ||||||
The difference between GAAP-basis and tax-basis unrealized gains (losses) is attributable primarily to wash sales, net mark to market gains (losses) on regulated futures, net mark to market gains (losses) on foreign currency contracts and differences in the tax treatment of passive foreign investment company investments.
The International Equity Insights Fund reclassified $2,867,280 from paid in capital to distributable earnings for the year ending October 31, 2019. In order to present certain components of the Fund’s capital accounts on a tax-basis, certain reclassifications have been recorded to the Fund’s accounts. These reclassifications have no impact on the net asset value of the Fund and result primarily from expired capital loss carryforwards.
GSAM has reviewed the Funds’ tax positions for all open tax years (the current and prior three years, as applicable) and has concluded that no provision for income tax is required in the Funds’ financial statements. Such open tax years remain subject to examination and adjustment by tax authorities.
| 9. OTHER RISKS |
The Funds’ risks include, but are not limited to, the following:
Derivatives Risk — The Funds’ use of derivatives may result in loss. Derivative instruments, which may pose risks in addition to and greater than those associated with investing directly in securities, currencies or other instruments, may be illiquid or less liquid, volatile, difficult to price and leveraged so that small changes in the value of the underlying instruments may produce disproportionate losses to the Funds. Derivatives are also subject to counterparty risk, which is the risk that the other party in the transaction will not fulfill its contractual obligation. The use of derivatives is a highly specialized activity that involves investment techniques and risks different from those associated with investments in more traditional securities and instruments. Losses from derivatives can also result from a lack of correlation between changes in the value of derivative instruments and the portfolio assets (if any) being hedged.
Foreign and Emerging Countries Risk — Investing in foreign markets may involve special risks and considerations not typically associated with investing in the U.S. Foreign securities may be subject to risk of loss because of more or less foreign government regulation, less public information and less economic, political and social stability in the countries in which a Fund invests. The imposition of exchange controls (including repatriation restrictions), confiscation of assets and property, trade restrictions (including tariffs) and other government restrictions by the U.S. or other governments, or from problems in share registration, settlement or custody, may also result in losses. Foreign risk also involves the risk of negative foreign currency rate fluctuations, which may cause the value of securities denominated in such foreign currency (or other instruments through which a Fund has exposure to foreign currencies) to decline in value. Currency exchange rates may fluctuate significantly over short periods of time. To the extent that a Fund also invests in securities of issuers located in emerging markets, these risks may be more pronounced.
Foreign Custody Risk — If a Fund invests in foreign securities, the Fund may hold such securities and cash with foreign banks, agents, and securities depositories appointed by the Fund’s custodian (each a “Foreign Custodian”). Some foreign custodians may be recently organized or new to the foreign custody business. In some countries, Foreign Custodians may be subject to little or no regulatory oversight over, or independent evaluation of, their operations. Further, the laws of certain countries may place limitations on a Fund’s ability to recover its assets if a Foreign Custodian enters bankruptcy. Investments in emerging markets may be subject to even greater custody risks than investments in more developed markets. Custody services in emerging market
76
GOLDMAN SACHS INTERNATIONAL EQUITY INSIGHTS FUNDS
| 9. OTHER RISKS (continued) |
countries are very often undeveloped and may be considerably less well regulated than in more developed countries, and thus may not afford the same level of investor protection as would apply in developed countries.
Investments in Other Investment Companies Risk — As a shareholder of another investment company, a Fund will indirectly bear its proportionate share of any net management fees and other expenses paid by such other investment companies, in addition to the fees and expenses regularly borne by the Fund.
Large Shareholder Transactions Risk — A Fund may experience adverse effects when certain large shareholders, such as other funds, institutional investors (including those trading by use of non-discretionary mathematical formulas), financial intermediaries (who may make investment decisions on behalf of underlying clients and/or include a Fund in their investment model), individuals, accounts and Goldman Sachs affiliates, purchase or redeem large amounts of shares of a Fund. Such large shareholder redemptions, which may occur rapidly or unexpectedly, may cause a Fund to sell portfolio securities at times when it would not otherwise do so, which may negatively impact a Fund’s NAV and liquidity. These transactions may also accelerate the realization of taxable income to shareholders if such sales of investments resulted in gains, and may also increase transaction costs. In addition, a large redemption could result in a Fund’s current expenses being allocated over a smaller asset base, leading to an increase in the Fund’s expense ratio. Similarly, large Fund share purchases may adversely affect a Fund’s performance to the extent that the Fund is delayed in investing new cash or otherwise maintains a larger cash position than it ordinarily would.
Liquidity Risk — A Fund may make investments that are illiquid or that may become less liquid in response to market developments or adverse investor perceptions. Illiquid investments may be more difficult to value. Liquidity risk may also refer to the risk that a Fund will not be able to pay redemption proceeds within the allowable time period or without significant dilution to remaining investors’ interests because of unusual market conditions, an unusually high volume of redemption requests, or other reasons. To meet redemption requests, a Fund may be forced to sell investments at an unfavorable time and/or under unfavorable conditions. If a Fund is forced to sell securities at an unfavorable time and/or under unfavorable conditions, such sales may adversely affect the Fund’s NAV and dilute remaining investors’ interests. These risks may be more pronounced in connection with a Fund’s investments in securities of issuers located in emerging market countries. Redemptions by large shareholders may have a negative impact on a Fund’s liquidity.
Market and Credit Risks — In the normal course of business, a Fund trades financial instruments and enters into financial transactions where risk of potential loss exists due to changes in the market (market risk). Additionally, a Fund may also be exposed to credit risk in the event that an issuer or guarantor fails to perform or that an institution or entity with which the Fund has unsettled or open transactions defaults.
| 10. INDEMNIFICATIONS |
Under the Trust’s organizational documents, its Trustees, officers, employees and agents are indemnified, to the extent permitted by the Act and state law, against certain liabilities that may arise out of performance of their duties to the Funds. Additionally, in the course of business, the Funds enter into contracts that contain a variety of indemnification clauses. The Funds’ maximum exposure under these arrangements is unknown, as this would involve future claims that may be made against the Funds that have not yet occurred. However, GSAM believes the risk of loss under these arrangements to be remote.
| 11. OTHER MATTERS |
On November 5, 2019, a definitive proxy statement (“proxy”) was filed with the SEC to elect certain Trustees to the Trust. The Funds will bear their respective share of the proxy, shareholder meeting and other related costs and GSAM has agreed to reimburse each Fund to the extent such expenses exceed a specified percentage of the Fund’s net assets.
| 12. SUBSEQUENT EVENTS |
Subsequent events after the Statements of Assets and Liabilities date other than the above have been evaluated, and GSAM has concluded that there is no impact requiring adjustment or disclosure in the financial statements.
77
GOLDMAN SACHS INTERNATIONAL EQUITY INSIGHTS FUNDS
Notes to Financial Statements(continued)
October 31, 2019
| 13. SUMMARY OF SHARE TRANSACTIONS |
Share activity is as follows:
| Emerging Markets Equity Insights Fund | ||||||||||||||||
|
| |||||||||||||||
| For the Fiscal Year Ended October 31, 2019 | For the Fiscal Year Ended October 31, 2018 | |||||||||||||||
|
| |||||||||||||||
| Shares | Dollars | Shares | Dollars | |||||||||||||
|
| |||||||||||||||
| Class A Shares | ||||||||||||||||
Shares sold | 2,966,653 | $ | 27,441,781 | 6,011,484 | $ | 64,604,928 | ||||||||||
Reinvestment of distributions | 158,620 | 1,368,888 | 460,132 | 4,851,613 | ||||||||||||
Shares redeemed | (4,534,826 | ) | (41,438,386 | ) | (5,975,175 | ) | (61,902,681 | ) | ||||||||
| (1,409,553 | ) | (12,627,717 | ) | 496,441 | 7,553,860 | |||||||||||
| Class C Shares | ||||||||||||||||
Shares sold | 256,648 | 2,349,700 | 532,926 | 5,660,930 | ||||||||||||
Reinvestment of distributions | 9,579 | 81,900 | 39,630 | 412,747 | ||||||||||||
Shares redeemed | (379,019 | ) | (3,461,810 | ) | (251,334 | ) | (2,520,831 | ) | ||||||||
| (112,792 | ) | (1,030,210 | ) | 321,222 | 3,552,846 | |||||||||||
| Institutional Shares | ||||||||||||||||
Shares sold | 52,061,873 | 482,572,337 | 75,219,315 | 791,620,923 | ||||||||||||
Reinvestment of distributions | 2,189,583 | 18,830,413 | 7,319,387 | 77,185,740 | ||||||||||||
Shares redeemed | (62,919,172 | ) | (577,944,922 | ) | (108,575,239 | ) | (1,138,039,633 | ) | ||||||||
| (8,667,716 | ) | (76,542,172 | ) | (26,036,537 | ) | (269,232,970 | ) | |||||||||
| Investor Shares | ||||||||||||||||
Shares sold | 10,841,603 | 100,200,063 | 10,050,495 | 103,888,715 | ||||||||||||
Reinvestment of distributions | 249,709 | 2,145,005 | 388,023 | 4,089,088 | ||||||||||||
Shares redeemed | (9,135,724 | ) | (84,201,328 | ) | (5,748,668 | ) | (57,976,922 | ) | ||||||||
| 1,955,588 | 18,143,740 | 4,689,850 | 50,000,881 | |||||||||||||
| Class P Shares(a) | ||||||||||||||||
Shares sold | 6,605,230 | 59,494,143 | 16,111,028 | 167,993,767 | ||||||||||||
Reinvestment of distributions | 359,752 | 3,090,275 | — | — | ||||||||||||
Shares redeemed | (8,075,477 | ) | (73,381,775 | ) | (1,552,358 | ) | (15,297,333 | ) | ||||||||
| (1,110,495 | ) | (10,797,357 | ) | 14,558,670 | 152,696,434 | |||||||||||
| Class R Shares | ||||||||||||||||
Shares sold | 1,277,600 | 11,619,066 | 823,248 | 8,559,179 | ||||||||||||
Reinvestment of distributions | 37,333 | 318,449 | 92,882 | 967,288 | ||||||||||||
Shares redeemed | (649,444 | ) | (5,943,448 | ) | (332,000 | ) | (3,382,408 | ) | ||||||||
| 665,489 | 5,994,067 | 584,130 | 6,144,059 | |||||||||||||
| Class R6 Shares | ||||||||||||||||
Shares sold | 21,229,915 | 194,592,630 | 78,639,507 | 828,090,670 | ||||||||||||
Reinvestment of distributions | 1,352,035 | 11,613,981 | 79,132 | 834,501 | ||||||||||||
Shares redeemed | (39,121,967 | ) | (360,316,512 | ) | (10,696,992 | ) | (102,070,313 | ) | ||||||||
| (16,540,017 | ) | (154,109,901 | ) | 68,021,647 | 726,854,858 | |||||||||||
NET INCREASE (DECREASE) | (25,219,496 | ) | $ | (230,969,550 | ) | 62,635,423 | $ | 677,569,968 | ||||||||
| (a) | Commenced operations on April 16, 2018. |
78
GOLDMAN SACHS INTERNATIONAL EQUITY INSIGHTS FUNDS
| 13. SUMMARY OF SHARE TRANSACTIONS (continued) |
| International Equity Insights Fund | ||||||||||||||||
|
| |||||||||||||||
| For the Fiscal Year Ended October 31, 2019 | For the Fiscal Year Ended October 31, 2018 | |||||||||||||||
|
| |||||||||||||||
| Shares | Dollars | Shares | Dollars | |||||||||||||
|
| |||||||||||||||
| Class A Shares | ||||||||||||||||
Shares sold | 13,259,688 | $ | 159,153,653 | 11,261,835 | $ | 149,431,245 | ||||||||||
Reinvestment of distributions | 204,537 | 2,186,506 | 141,506 | 1,870,712 | ||||||||||||
Shares redeemed | (9,882,575 | ) | (116,821,278 | ) | (6,369,387 | ) | (82,885,765 | ) | ||||||||
| 3,581,650 | 44,518,881 | 5,033,954 | 68,416,192 | |||||||||||||
| Class C Shares | ||||||||||||||||
Shares sold | 456,513 | 5,141,424 | 2,264,501 | 29,449,733 | ||||||||||||
Reinvestment of distributions | 19,962 | 209,198 | 16,331 | 211,493 | ||||||||||||
Shares redeemed | (1,425,650 | ) | (16,400,371 | ) | (636,002 | ) | (8,029,059 | ) | ||||||||
| (949,175 | ) | (11,049,749 | ) | 1,644,830 | 21,632,167 | |||||||||||
| Institutional Shares | ||||||||||||||||
Shares sold | 54,720,178 | 657,831,323 | 91,478,909 | 1,238,574,962 | ||||||||||||
Reinvestment of distributions | 1,221,357 | 13,398,286 | 1,043,352 | 14,147,857 | ||||||||||||
Shares redeemed | (66,250,331 | ) | (798,357,316 | ) | (58,797,412 | ) | (784,509,924 | ) | ||||||||
| (10,308,796 | ) | (127,127,707 | ) | 33,724,849 | 468,212,895 | |||||||||||
| Service Shares | ||||||||||||||||
Shares sold | 142,546 | 1,698,529 | 215,964 | 2,915,060 | ||||||||||||
Reinvestment of distributions | 5,670 | 61,236 | 4,253 | 56,775 | ||||||||||||
Shares redeemed | (98,679 | ) | (1,177,739 | ) | (147,124 | ) | (1,961,399 | ) | ||||||||
| 49,537 | 582,026 | 73,093 | 1,010,436 | |||||||||||||
| Investor Shares | ||||||||||||||||
Shares sold | 38,817,614 | 453,063,492 | 28,185,890 | 366,783,622 | ||||||||||||
Reinvestment of distributions | 684,659 | 7,168,380 | 235,317 | 3,049,705 | ||||||||||||
Shares redeemed | (28,303,390 | ) | (326,016,478 | ) | (6,001,354 | ) | (76,167,177 | ) | ||||||||
| 11,198,883 | 134,215,394 | 22,419,853 | 293,666,150 | |||||||||||||
| Class P Shares(a) | ||||||||||||||||
Shares sold | 24,463,775 | 282,043,576 | 20,839,126 | 278,586,234 | ||||||||||||
Reinvestment of distributions | 514,841 | 5,642,654 | — | — | ||||||||||||
Shares redeemed | (16,007,445 | ) | (190,246,857 | ) | (720,751 | ) | (9,528,009 | ) | ||||||||
| 8,971,171 | 97,439,373 | 20,118,375 | 269,058,225 | |||||||||||||
| Class R Shares | ||||||||||||||||
Shares sold | 363,618 | 4,188,056 | 266,168 | 3,412,945 | ||||||||||||
Reinvestment of distributions | 7,899 | 82,224 | 5,144 | 66,202 | ||||||||||||
Shares redeemed | (258,509 | ) | (2,987,023 | ) | (167,569 | ) | (2,121,039 | ) | ||||||||
| 113,008 | 1,283,257 | 103,743 | 1,358,108 | |||||||||||||
| Class R6 Shares | ||||||||||||||||
Shares sold | 34,080,931 | 412,901,400 | 31,719,574 | 426,173,960 | ||||||||||||
Reinvestment of distributions | 724,784 | 7,943,638 | 74,104 | 1,004,847 | ||||||||||||
Shares redeemed | (22,360,220 | ) | (272,988,934 | ) | (3,741,875 | ) | (50,166,486 | ) | ||||||||
| 12,445,495 | 147,856,104 | 28,051,803 | 377,012,321 | |||||||||||||
NET INCREASE | 25,101,773 | $ | 287,717,579 | 111,170,500 | $ | 1,500,366,494 | ||||||||||
| (a) | Commenced operations on April 16, 2018. |
79
GOLDMAN SACHS INTERNATIONAL EQUITY INSIGHTS FUNDS
Notes to Financial Statements(continued)
October 31, 2019
| 13. SUMMARY OF SHARE TRANSACTIONS (continued) |
| International Small Cap Insights Fund | ||||||||||||||||
|
| |||||||||||||||
| For the Fiscal Year Ended October 31, 2019 | For the Fiscal Year Ended October 31, 2018 | |||||||||||||||
|
| |||||||||||||||
| Shares | Dollars | Shares | Dollars | |||||||||||||
|
| |||||||||||||||
| Class A Shares | ||||||||||||||||
Shares sold | 5,084,350 | $ | 57,542,690 | 10,629,498 | $ | 136,561,855 | ||||||||||
Reinvestment of distributions | 174,144 | 1,724,026 | 1,228,989 | 15,454,307 | ||||||||||||
Shares redeemed | (8,714,983 | ) | (95,912,370 | ) | (10,291,665 | ) | (129,158,676 | ) | ||||||||
| (3,456,489 | ) | (36,645,654 | ) | 1,566,822 | 22,857,486 | |||||||||||
| Class C Shares | ||||||||||||||||
Shares sold | 166,083 | 1,768,839 | 2,369,851 | 29,581,255 | ||||||||||||
Reinvestment of distributions | 14,011 | 134,359 | 405,443 | 4,916,449 | ||||||||||||
Shares redeemed | (2,026,719 | ) | (21,560,049 | ) | (1,399,827 | ) | (16,949,764 | ) | ||||||||
| (1,846,625 | ) | (19,656,851 | ) | 1,375,467 | 17,547,940 | |||||||||||
| Institutional Shares | ||||||||||||||||
Shares sold | 88,905,949 | 988,567,614 | 131,991,496 | 1,677,126,324 | ||||||||||||
Reinvestment of distributions | 3,192,108 | 31,506,109 | 10,223,847 | 128,887,373 | ||||||||||||
Shares redeemed | (112,062,966 | ) | (1,226,702,768 | ) | (74,897,320 | ) | (941,892,126 | ) | ||||||||
| (19,964,909 | ) | (206,629,045 | ) | 67,318,023 | 864,121,571 | |||||||||||
| Investor Shares | ||||||||||||||||
Shares sold | 6,007,193 | 66,017,326 | 34,703,673 | 441,487,215 | ||||||||||||
Reinvestment of distributions | 601,289 | 5,910,668 | 2,370,410 | 29,722,703 | ||||||||||||
Shares redeemed | (31,099,022 | ) | (340,121,004 | ) | (14,999,067 | ) | (184,268,946 | ) | ||||||||
| (24,490,540 | ) | (268,193,010 | ) | 22,075,016 | 286,940,972 | |||||||||||
| Class P Shares(a) | ||||||||||||||||
Shares sold | 593,597 | 6,725,342 | 8,452,181 | 106,889,938 | ||||||||||||
Reinvestment of distributions | 136,281 | 1,347,821 | — | — | ||||||||||||
Shares redeemed | (1,986,467 | ) | (21,379,469 | ) | (338,807 | ) | (3,996,343 | ) | ||||||||
| (1,256,589 | ) | (13,306,306 | ) | 8,113,374 | 102,893,595 | |||||||||||
| Class R6 Shares | ||||||||||||||||
Shares sold | 26,323,470 | 291,256,574 | 96,609,922 | 1,228,465,737 | ||||||||||||
Reinvestment of distributions | 1,590,561 | 15,730,650 | 761,556 | 9,623,910 | ||||||||||||
Shares redeemed | (22,908,629 | ) | (255,148,086 | ) | (10,061,202 | ) | (127,894,386 | ) | ||||||||
| 5,005,402 | 51,839,138 | 87,310,276 | 1,110,195,261 | |||||||||||||
NET INCREASE (DECREASE) | (46,009,750 | ) | $ | (492,591,728 | ) | 187,758,978 | $ | 2,404,556,825 | ||||||||
| (a) | Commenced operations on April 16, 2018. |
80
Report of Independent Registered Public
Accounting Firm
Tothe Board of Trustees of Goldman Sachs Trust and Shareholders of Goldman Sachs Emerging Markets Equity Insights Fund, Goldman Sachs International Equity Insights Fund, and Goldman Sachs International Small Cap Insights Fund
Opinions on the Financial Statements
We have audited the accompanying statements of assets and liabilities, including the schedules of investments, of Goldman Sachs Emerging Markets Equity Insights Fund, Goldman Sachs International Equity Insights Fund, and Goldman Sachs International Small Cap Insights Fund (three of the funds constituting Goldman Sachs Trust, hereafter collectively referred to as the “Funds”) as of October 31, 2019, the related statements of operations for the year ended October 31, 2019, the statements of changes in net assets for each of the two years in the period ended October 31, 2019, including the related notes,and the financial highlights for each of the periods indicated therein (collectively referred to as the “financial statements”). In our opinion, the financial statements present fairly, in all material respects, the financial position of each of the Funds as of October 31, 2019, the results of each of their operations for the year then ended, the changes in each of their net assets for each of the two years in the period ended October 31, 2019 and each of the financial highlights for each of the periods indicated therein in conformity with accounting principles generally accepted in the United States of America.
Basis for Opinions
These financial statements are the responsibility of the Funds’ management. Our responsibility is to express an opinion on the Funds’ financial statements based on our audits. We are a public accounting firm registered with the Public Company Accounting Oversight Board (United States) (PCAOB) and are required to be independent with respect to the Funds in accordance with the U.S. federal securities laws and the applicable rules and regulations of the Securities and Exchange Commission and the PCAOB.
We conducted our audits of these financial statements in accordance with the standards of the PCAOB. Those standards require that we plan and perform the audit to obtain reasonable assurance about whether the financial statements are free of material misstatement, whether due to error or fraud.
Our audits included performing procedures to assess the risks of material misstatement of the financial statements, whether due to error or fraud, and performing procedures that respond to those risks. Such procedures included examining, on a test basis, evidence regarding the amounts and disclosures in the financial statements. Our audits also included evaluating the accounting principles used and significant estimates made by management, as well as evaluating the overall presentation of the financial statements. Our procedures included confirmation of securities owned as of October 31, 2019 by correspondence with the custodian, transfer agent and brokers; when replies were not received from brokers, we performed other auditing procedures. We believe that our audits provide a reasonable basis for our opinions.
PricewaterhouseCoopers LLP
Boston, Massachusetts
December 23, 2019
We have served as the auditor of one or more investment companies in the Goldman Sachs fund complex since 2000.
81
GOLDMAN SACHS INTERNATIONAL EQUITY INSIGHTS FUNDS
Fund Expenses — Six Month Period Ended October 31, 2019 (Unaudited)
As a shareholder of Class A, Class C, Institutional, Service, Investor, Class P, Class R or Class R6 Shares of a Fund you incur two types of costs: (1) transaction costs, including sales charges on purchase payments (with respect to Class A Shares) and contingent deferred sales charges on redemptions (with respect to Class C Shares); and (2) ongoing costs, including management fees; distribution and/or service(12b-1) fees (with respect to Class A, Class C, Service and Class R Shares); and other Fund expenses. This example is intended to help you understand your ongoing costs (in dollars) of investing in Class A, Class C, Institutional, Service, Investor, Class P, Class R and Class R6 Shares of the Funds and to compare these costs with the ongoing costs of investing in other mutual funds.
The example is based on an investment of $1,000 invested at the beginning of the period and held for the entire period from May 1, 2019 through October 31, 2019, which represents a period of 184 days of a 365 day year.
Actual Expenses— The first line under each share class in the table below provides information about actual account values and actual expenses. You may use the information in this line, together with the amount you invested, to estimate the expenses that you paid over the period. Simply divide your account value by $1,000 (for example, an $8,600 account value divided by $1,000=8.6), then multiply the result by the number in the first line under the heading entitled “Expenses Paid” to estimate the expenses you paid on your account during this period.
Hypothetical Example for Comparison Purposes— The second line under each share class in the table below provides information about hypothetical account values and hypothetical expenses based on the Funds’ actual net expense ratio and an assumed rate of return of 5% per year before expenses, which is not the Funds’ actual return. The hypothetical account values and expenses may not be used to estimate the actual ending account balance or expenses you paid for the period. You may use this information to compare the ongoing costs of investing in the Funds and other funds. To do so, compare this 5% hypothetical example with the 5% hypothetical examples that appear in the shareholder reports of the other funds.
Please note that the expenses shown in the table are meant to highlight your ongoing costs only and do not reflect any transactional costs, such as sales charges, redemption fees or exchange fees. Therefore, the second line of the table is useful in comparing ongoing costs only, and will not help you determine the relative total costs of owning different funds. In addition, if these transactional costs were included, your costs would have been higher.
| Emerging Markets Equity Insights Fund | International Equity Insights Fund | International Small Cap Insights Fund | ||||||||||||||||||||||||||||||||||
| Share Class | Beginning Value | Ending Value | Expenses Paid for the 6 Months Ended 10/31/19* | Beginning Value | Ending Value | Expenses Paid for the 6 Months Ended 10/31/19* | Beginning Value | Ending Value | Expenses Paid for the 6 Months Ended 10/31/19* | |||||||||||||||||||||||||||
| Class A | ||||||||||||||||||||||||||||||||||||
Actual | $ | 1,000 | $ | 961.90 | $ | 7.32 | $ | 1,000 | $ | 1,018.00 | $ | 5.95 | $ | 1,000 | $ | 1,020.80 | $ | 6.42 | ||||||||||||||||||
Hypothetical 5% return | 1,000 | 1,017.74 | + | 7.53 | 1,000 | 1,019.31 | + | 5.96 | 1,000 | 1,018.85 | + | 6.41 | ||||||||||||||||||||||||
| Class C | ||||||||||||||||||||||||||||||||||||
Actual | 1,000 | 959.30 | 11.01 | 1,000 | 1,014.20 | 9.75 | 1,000 | 1,018.00 | 10.22 | |||||||||||||||||||||||||||
Hypothetical 5% return | 1,000 | 1,013.96 | + | 11.32 | 1,000 | 1,015.53 | + | 9.75 | 1,000 | 1,015.07 | + | 10.21 | ||||||||||||||||||||||||
| Institutional | ||||||||||||||||||||||||||||||||||||
Actual | 1,000 | 963.80 | 5.40 | 1,000 | 1,020.70 | 4.02 | 1,000 | 1,023.50 | 4.44 | |||||||||||||||||||||||||||
Hypothetical 5% return | 1,000 | 1,019.71 | + | 5.55 | 1,000 | 1,021.22 | + | 4.02 | 1,000 | 1,020.82 | + | 4.43 | ||||||||||||||||||||||||
| Service | ||||||||||||||||||||||||||||||||||||
Actual | N/A | N/A | N/A | 1,000 | 1,017.80 | 6.56 | N/A | N/A | N/A | |||||||||||||||||||||||||||
Hypothetical 5% return | N/A | N/A | N/A | 1,000 | 1,018.70 | + | 6.56 | N/A | N/A | N/A | ||||||||||||||||||||||||||
| Investor | ||||||||||||||||||||||||||||||||||||
Actual | 1,000 | 963.80 | 6.09 | 1,000 | 1,020.00 | 4.68 | 1,000 | 1,022.70 | 5.15 | |||||||||||||||||||||||||||
Hypothetical 5% return | 1,000 | 1,019.00 | + | 6.26 | 1,000 | 1,020.57 | + | 4.69 | 1,000 | 1,020.11 | + | 5.14 | ||||||||||||||||||||||||
| Class P | ||||||||||||||||||||||||||||||||||||
Actual | 1,000 | 964.80 | 5.35 | 1,000 | 1,020.70 | 3.97 | 1,000 | 1,022.50 | 4.38 | |||||||||||||||||||||||||||
Hypothetical 5% return | 1,000 | 1,019.76 | + | 5.50 | 1,000 | 1,021.27 | + | 3.97 | 1,000 | 1,020.87 | + | 4.38 | ||||||||||||||||||||||||
| Class R | ||||||||||||||||||||||||||||||||||||
Actual | 1,000 | 961.30 | 8.55 | 1,000 | 1,016.80 | 7.22 | N/A | N/A | N/A | |||||||||||||||||||||||||||
Hypothetical 5% return | 1,000 | 1,016.48 | + | 8.79 | 1,000 | 1,018.05 | + | 7.22 | N/A | N/A | N/A | |||||||||||||||||||||||||
| Class R6 | ||||||||||||||||||||||||||||||||||||
Actual | 1,000 | 964.80 | 5.40 | 1,000 | 1,020.70 | 3.97 | 1,000 | | 1,022.50 | | 4.38 | |||||||||||||||||||||||||
Hypothetical 5% return | 1,000 | 1,019.71 | + | 5.55 | 1,000 | 1,021.27 | + | 3.97 | 1,000 | 1,020.87 | + | 4.38 | ||||||||||||||||||||||||
| + | Hypothetical expenses are based on each Fund’s actual annualized net expense ratios and an assumed rate of return of 5% per year before expenses. |
| * | Expenses are calculated using each Fund’s annualized net expense ratio for each class, which represents the ongoing expenses as a percentage of net assets for the six months ended October 31, 2019. Expenses are calculated by multiplying the annualized net expense ratio by the average account value for the period; then multiplying the result by the number of days in the most recent fiscal half year; and then dividing that result by the number of days in the fiscal year. The annualized net expense ratios for the period were as follows: |
| Fund | Class A | Class C | Institutional | Service | Investor | Class P | Class R | Class R6 | ||||||||||||||||||||||||
Emerging Markets Equity Insights | 1.48 | % | 2.23 | % | 1.10 | % | N/A | 1.23 | % | 1.09 | % | 1.73 | % | 1.09 | % | |||||||||||||||||
International Equity Insights | 1.17 | 1.92 | 0.79 | 1.29 | % | 0.92 | 0.78 | 1.42 | 0.78 | |||||||||||||||||||||||
International Small Cap Insights | 1.27 | 2.02 | 0.88 | N/A | 1.02 | 0.87 | N/A | 0.87 | ||||||||||||||||||||||||
82
GOLDMAN SACHS INTERNATIONAL EQUITY INSIGHTS FUNDS
Statement Regarding Basis for Approval of Management Agreement (Unaudited)
Background
The Goldman Sachs Emerging Markets Equity Insights Fund, Goldman Sachs International Equity Insights Fund, and Goldman Sachs International Small Cap Insights Fund (the “Funds”) are investment portfolios of Goldman Sachs Trust (the “Trust”). The Board of Trustees oversees the management of the Trust and reviews the investment performance and expenses of the Funds at regularly scheduled meetings held throughout the year. In addition, the Board of Trustees determines annually whether to approve the continuance of the Trust’s investment management agreement (the “Management Agreement”) with Goldman Sachs Asset Management, L.P. (the “Investment Adviser”) on behalf of the Funds.
The Management Agreement was most recently approved for continuation until June 30, 2020 by the Board of Trustees, including those Trustees who are not parties to the Management Agreement or “interested persons” (as defined in the Investment Company Act of 1940, as amended) of any party thereto (the “Independent Trustees”), at a meeting held onJune 11-12, 2019 (the “Annual Meeting”).
The review process undertaken by the Trustees spans the course of the year and culminates with the Annual Meeting. To assist the Trustees in their deliberations, the Trustees have established a Contract Review Committee (the “Committee”), comprised of the Independent Trustees. The Committee held four meetings over the course of the year since the Management Agreement was last approved. At those Committee meetings, regularly scheduled Board or other committee meetings, and/or the Annual Meeting, matters relevant to the renewal of the Management Agreement were considered by the Board, or the Independent Trustees, as applicable. With respect to each Fund, such matters included:
| (a) | the nature and quality of the advisory, administrative, and other services provided to the Fund by the Investment Adviser and its affiliates, including information about: |
| (i) | the structure, staff, and capabilities of the Investment Adviser and its portfolio management teams; |
| (ii) | the groups within the Investment Adviser and its affiliates that support the portfolio management teams or provide other types of necessary services, including fund services groups (e.g., accounting and financial reporting, tax, shareholder services, and operations); controls and risk management groups (e.g., legal, compliance, valuation oversight, credit risk management, internal audit, compliance testing, market risk analysis, finance, and central funding); sales and distribution support groups, and others (e.g., information technology and training); |
| (iii) | trends in employee headcount; |
| (iv) | the Investment Adviser’s financial resources and ability to hire and retain talented personnel and strengthen its operations; and |
| (v) | the parent company’s support of the Investment Adviser and its mutual fund business, as expressed by the firm’s senior management; |
| (b) | information on the investment performance of the Fund, including comparisons to the performance of similar mutual funds, as provided by a third-party mutual fund data provider engaged as part of the contract review process (the “Outside Data Provider”), a benchmark performance index, and (in the case of the Emerging Markets Equity Insights Fund and International Small Cap Insights Fund) a composite of accounts with comparable investment strategies managed by the Investment Adviser; and information on general investment outlooks in the markets in which the Fund invests; |
| (c) | information provided by the Investment Adviser indicating the Investment Adviser’s views on whether the Fund’s peer group and/or benchmark index had high, medium, or low relevance given the Fund’s particular investment strategy; |
| (d) | the terms of the Management Agreement and other agreements with affiliated service providers entered into by the Trust on behalf of the Fund; |
| (e) | fee and expense information for the Fund, including: |
| (i) | the relative management fee and expense levels of the Fund as compared to those of comparable funds managed by other advisers, as provided by the Outside Data Provider; |
| (ii) | the Fund’s expense trends over time; and |
| (iii) | to the extent the Investment Adviser manages other types of accounts (such as bank collective trusts, private wealth management accounts, institutional separate accounts,sub-advised mutual funds, andnon-U.S. funds) having investment objectives and policies similar to those of the Fund, comparative information on the advisory fees charged and services provided to those accounts by the Investment Adviser; |
| (f) | with respect to the extensive investment performance and expense comparison data provided by the Outside Data Provider, its processes in producing that data for the Fund; |
| (g) | the undertakings of the Investment Adviser and its affiliates to implement fee waivers and/or expense limitations; |
| (h) | information relating to the profitability of the Management Agreement and the transfer agency and distribution and service arrangements of the Fund to the Investment Adviser and its affiliates; |
83
GOLDMAN SACHS INTERNATIONAL EQUITY INSIGHTS FUNDS
Statement Regarding Basis for Approval of Management Agreement (Unaudited) (continued)
| (i) | whether the Fund’s existing management fee schedule adequately addressed any economies of scale; |
| (j) | a summary of the“fall-out” benefits derived by the Investment Adviser and its affiliates from their relationships with the Fund, including the fees received by the Investment Adviser’s affiliates from the Fund for transfer agency, securities lending, portfolio trading, distribution and other services; |
| (k) | a summary of potential benefits derived by the Fund as a result of its relationship with the Investment Adviser; |
| (l) | information regarding commissions paid by the Fund and broker oversight, other information regarding portfolio trading, and how the Investment Adviser carries out its duty to seek best execution; |
| (m) | portfolio manager ownership of Fund shares; the manner in which portfolio manager compensation is determined; and the number and types of accounts managed by the portfolio managers; |
| (n) | the nature and quality of the services provided to the Fund by its unaffiliated service providers, and the Investment Adviser’s general oversight and evaluation (including reports on due diligence) of those service providers as part of the administrative services provided under the Management Agreement; and |
| (o) | the Investment Adviser’s processes and policies addressing various types of potential conflicts of interest; its approach to risk management; the annual review of the effectiveness of the Fund’s compliance program; and periodic compliance reports. |
The Trustees also received an overview of the Funds’ distribution arrangements. They received information regarding the Funds’ assets, share purchase and redemption activity, and payment of distribution, service, and shareholder administration fees, as applicable. Information was also provided to the Trustees relating to revenue sharing payments made by and services provided by the Investment Adviser and its affiliates to intermediaries that promote the sale, distribution, and/or servicing of Fund shares. The Independent Trustees also discussed the broad range of other investment choices that are available to Fund investors, including the availability of comparable funds managed by other advisers.
The presentations made at the Board and Committee meetings and at the Annual Meeting encompassed the Funds and other mutual funds for which the Board of Trustees has responsibility. In evaluating the Management Agreement at the Annual Meeting, the Trustees relied upon their knowledge, resulting from their meetings and other interactions throughout the year, of the Investment Adviser and its affiliates, their services, and the Funds. In conjunction with these meetings, the Trustees received written materials and oral presentations on the topics covered, and the Investment Adviser addressed the questions and concerns of the Trustees, including concerns regarding the investment performance of certain of the funds they oversee. The Independent Trustees were advised by their independent legal counsel regarding their responsibilities and other regulatory requirements related to the approval and continuation of mutual fund investment management agreements under applicable law. In addition, the Investment Adviser and its affiliates provided the Independent Trustees with a written response to a formal request for information sent on behalf of the Independent Trustees by their independent legal counsel. During the course of their deliberations, the Independent Trustees met in executive sessions with their independent legal counsel, without representatives of the Investment Adviser or its affiliates present.
Nature, Extent, and Quality of the Services Provided Under the Management Agreement
As part of their review, the Trustees considered the nature, extent, and quality of the services provided to the Funds by the Investment Adviser. In this regard, the Trustees considered both the investment advisory services andnon-advisory services that are provided by the Investment Adviser and its affiliates. The Trustees noted the transition in the leadership and changes in personnel of various of the Investment Adviser’s portfolio management teams that had occurred in recent periods, and the ongoing recruitment efforts aimed at bringing high quality investment talent to the Investment Adviser. They also noted the Investment Adviser’s commitment to maintaining high quality systems and expending substantial resources to respond to ongoing changes to the regulatory and control environment in which the Funds and their service providers operate, as well as the efforts of the Investment Adviser and its affiliates to combat cyber security risks. The Trustees concluded that the Investment Adviser continued to commit substantial financial and operational resources to the Funds and expressed confidence that the Investment Adviser would continue to do so in the future. The Trustees also recognized that the Investment Adviser had made significant commitments to address regulatory compliance requirements applicable to the Funds and the Investment Adviser and its affiliates.
Investment Performance
The Trustees also considered the investment performance of the Funds. In this regard, they compared the investment performance of each Fund to its peers usingrankings and ratings compiled by the Outside Data Provider as of December 31, 2018, and updated performance information prepared by the Investment Adviser using the peer group identified by the Outside Data Provider as of March 31, 2019. The information on each Fund’s investment performance was provided for theone-, three-, five-, andten-year periods ending on the applicable dates. The Trustees also reviewed each Fund’s investment performance relative to its
84
GOLDMAN SACHS INTERNATIONAL EQUITY INSIGHTS FUNDS
Statement Regarding Basis for Approval of Management Agreement (Unaudited) (continued)
performance benchmark. As part of this review, they considered the investment performance trends of the Funds over time, and reviewed the investment performance of each Fund in light of its investment objective and policies and market conditions. The Trustees also received information comparing the Emerging Markets Equity Insights Fund’s and International Small Cap Insights Fund’s performance to that of composites of accounts with comparable investment strategies managed by the Investment Adviser.
In addition, the Trustees considered materials prepared and presentations made by the Investment Adviser’s senior management and portfolio management personnel in which Fund performance was assessed. The Trustees also considered the Investment Adviser’s periodic reports with respect to the Funds’ risk profiles, and how the Investment Adviser’s approach to risk monitoring and management influences portfolio management. They noted the efforts of the Funds’ portfolio management team to continue to enhance the investment models used in managing the Funds.
The Trustees observed that the Emerging Markets Equity Insights Fund’s Institutional Shares had placed the top half of the Fund’s peer group for the three-, five-, andten-year periods and in the third quartile for theone-year period, and had outperformed the Fund’s benchmark index for the five- andten-year periods and underperformed for theone- and three-year periods ended March 31, 2019. They noted that the International Equity Insights Fund’s Institutional Shares had placed in the top half of the Fund’s peer group for the three-, five-, andten-year periods and in the fourth quartile for theone-year period, and had outperformed the Fund’s benchmark index for the three-, five-, andten-year periods and underperformed for theone-year period ended March 31, 2019. The Trustees observed that the International Small Cap Insights Fund’s Institutional Shares had placed in the top half of the Fund’s peer group for theone-, three-, five-, andten-year periods, and had underperformed the Fund’s benchmark index for theone-,three-, and five-year periods and outperformed for theten-year period ended March 31, 2019.
Costs of Services Provided and Competitive Information
The Trustees considered the contractual terms of the Management Agreement and the fee rates payable by each Fund thereunder. In this regard, the Trustees considered information on the services rendered by the Investment Adviser to the Funds, which included both advisory and administrative services that were directed to the needs and operations of the Funds as registered mutual funds.
In particular, the Trustees reviewed analyses prepared by the Outside Data Provider regarding the expense rankings of the Funds. The analyses provided a comparison of each Fund’s management fee and breakpoints to those of a relevant peer group and category universe; an expense analysis which compared each Fund’s overall net and gross expenses to a peer group and a category universe; and data comparing each Fund’s net expenses to the peer and category medians. The analyses also compared each Fund’s other expenses and fee waivers/reimbursements to those of the peer group and category medians. The Trustees concluded that the comparisons provided by the Outside Data Provider were useful in evaluating the reasonableness of the management fees and total expenses paid by the Funds.
In addition, the Trustees considered the Investment Adviser’s undertakings to implement fee waivers and/or expense limitations.They also considered, to the extent that the Investment Adviser manages other types of accounts having investment objectives and policies similar to those of the Funds, comparative fee information for services provided by the Investment Adviser to those accounts, and information that indicated that services provided to the Funds differed in various significant respects from the services provided to other types of accounts which, in many cases, operated under less stringent legal and regulatory structures, required fewer services from the Investment Adviser to a smaller number of client contact points, and were less time-intensive.
In addition, the Trustees noted that shareholders are able to redeem their Fund shares at any time if shareholders believe that the Fund fees and expenses are too high or if they are dissatisfied with the performance of the Fund.
Profitability
The Trustees reviewed each Fund’s contribution to the Investment Adviser’s revenues andpre-tax profit margins. In this regard the Trustees noted that they had received, among other things, profitability analyses and summaries, revenue and expense schedules by Fund and by function (i.e., investment management, transfer agency and distribution and service), and information on the Investment Adviser’s expense allocation methodology. They observed that the profitability and expense figures are substantially similar to those used by the Investment Adviser for many internal purposes, including compensation decisions among various business groups, and are thus subject to a vigorous internal debate about how certain revenue and expenses should be allocated. The Trustees also noted that the internal audit group within the Goldman Sachs organization periodically audits the expense allocation methodology and that the internal audit group was satisfied with the reasonableness, consistency, and accuracy of the Investment Adviser’s expense allocation methodology. Profitability data for each Fund was provided for 2018 and 2017, and the Trustees considered this information in relation to the Investment Adviser’s overall profitability.
85
GOLDMAN SACHS INTERNATIONAL EQUITY INSIGHTS FUNDS
Statement Regarding Basis for Approval of Management Agreement (Unaudited) (continued)
Economies of Scale
The Trustees considered the information that had been provided regarding whether there have been economies of scale with respect to the management of the Funds. The Trustees also considered the breakpoints in the fee rate payable under the Management Agreement for each of the Funds at the following annual percentage rates of the average daily net assets of the Funds:
| Emerging Markets Equity Insights Fund | International Equity Insights Fund | International Small Cap Insights Fund | ||||||||||
| First $1 billion | 1.00 | % | 0.81 | % | 0.85 | % | ||||||
| Next $1 billion | 1.00 | 0.73 | 0.85 | |||||||||
| Next $3 billion | 0.90 | 0.69 | 0.77 | |||||||||
| Next $3 billion | 0.86 | 0.68 | 0.73 | |||||||||
| Over $8 billion | 0.84 | 0.67 | 0.72 | |||||||||
The Trustees noted that the breakpoints were designed to share potential economies of scale, if any, with the Funds and their shareholders as assets under management reach those asset levels. The Trustees considered the amounts of assets in the Funds; the Funds’ recent share purchase and redemption activity; the information provided by the Investment Adviser relating to the costs of the services provided by the Investment Adviser and its affiliates and their realized profits; information comparing fee rates charged by the Investment Adviser with fee rates charged to other funds in the peer groups; and the Investment Adviser’s undertaking to limit certain expenses of the Funds that exceed specified levels. Upon reviewing these matters at the Annual Meeting, the Trustees concluded that the fee breakpoints represented a means of assuring that benefits of scalability, if any, would be passed along to shareholders at the specified asset levels. They also noted that the Investment Adviser had passed along savings to shareholders of each Fund, which had asset levels above at least the first breakpoint during the prior fiscal year.
Other Benefits to the Investment Adviser and Its Affiliates
The Trustees also considered the other benefits derived by the Investment Adviser and its affiliates from their relationships with the Funds as stated above, including: (a) transfer agency fees received by Goldman Sachs & Co. LLC (“Goldman Sachs”); (b) brokerage and futures commissions earned by Goldman Sachs for executing securities and futures transactions on behalf of the Funds; (c) trading efficiencies resulting from aggregation of orders of the Funds with those for other funds or accounts managed by the Investment Adviser; (d) fees earned by Goldman Sachs Agency Lending (“GSAL”), an affiliate of the Investment Adviser, as securities lending agent (and fees earned by the Investment Adviser for managing the fund in which the Funds’ cash collateral is invested); (e) the Investment Adviser’s ability to leverage the infrastructure designed to service the Funds on behalf of its other clients; (f) the Investment Adviser’s ability to cross-market other products and services to Fund shareholders; (g) Goldman Sachs’ retention of certain fees as Fund Distributor; (h) the Investment Adviser’s ability to negotiate better pricing with custodians on behalf of its other clients, as a result of the relationship with the Funds; and (i) the possibility that the working relationship between the Investment Adviser and the Funds’ third-party service providers may cause those service providers to be more likely to do business with other areas of Goldman Sachs. In the course of considering the foregoing, the Independent Trustees requested and received further information quantifying certain of thesefall-out benefits.
Other Benefits to the Funds and Their Shareholders
The Trustees also noted that the Funds receive certain other potential benefits as a result of their relationship with the Investment Adviser, including: (a) trading efficiencies resulting from aggregation of orders of the Funds with those of other funds or accounts managed by the Investment Adviser; (b) enhanced servicing from vendors due to the volume of business generated by the Investment Adviser and its affiliates; (c) enhanced servicing from broker-dealers due to the volume of business generated by the Investment Adviser and its affiliates; (d) the Investment Adviser’s ability to negotiate favorable terms with derivatives counterparties on behalf of the Funds as a result of the size and reputation of the Goldman Sachs organization; (e) the advantages received from the Investment Adviser’s knowledge and experience gained from managing other accounts and products; (f) the Investment Adviser’s ability to hire and retain qualified personnel to provide services to the Funds because of the reputation of the Goldman Sachs organization; (g) the Funds’ access, through the Investment Adviser, to certain firm-wide resources (e.g., proprietary risk management systems and databases), subject to certain restrictions; (h) the Funds’ ability to participate in the securities lending program administered by GSAL, as measured by the revenue received by the Funds in connection with the program; and (i) the Funds’ access to certain affiliated distribution channels. In addition, the Trustees noted the competitive nature of the mutual fund marketplace, and considered that many of the Funds’ shareholders invested in the Funds in part because of the Funds’ relationship with the Investment Adviser and that those shareholders have a general expectation that the relationship will continue.
86
GOLDMAN SACHS INTERNATIONAL EQUITY INSIGHTS FUNDS
Statement Regarding Basis for Approval of Management Agreement (Unaudited) (continued)
Conclusion
In connection with their consideration of the Management Agreement, the Trustees gave weight to each of the factors described above, but did not identify any particular factor as controlling their decision. After deliberation and consideration of all of the information provided, including the factors described above, the Trustees concluded, in the exercise of their business judgment, that the management fees paid by each of the Funds were reasonable in light of the services provided to it by the Investment Adviser, the Investment Adviser’s costs and each Fund’s current and reasonably foreseeable asset levels. The Trustees unanimously concluded that the Investment Adviser’s continued management likely would benefit each Fund and its shareholders and that the Management Agreement should be approved and continued with respect to each Fund until June 30, 2020.
87
GOLDMAN SACHS INTERNATIONAL EQUITY INSIGHTS FUNDS
Trustees and Officers (Unaudited)
Independent Trustees
| Name, Address and Age1 | Position(s) Held with the Trust | Term of Office and | Principal Occupation(s) During Past 5 Years | Number of Portfolios in Fund Complex Overseen by Trustee3 | Other Directorships Held by Trustee4 | |||||
Jessica Palmer Age: 70 | Chair of the Board of Trustees | Since 2018 (Trustee since 2007) | Ms. Palmer is retired. She was formerly Consultant, Citigroup Human Resources Department (2007-2008); Managing Director, Citigroup Corporate and Investment Banking (previously, Salomon Smith Barney/Salomon Brothers) (1984-2006). Ms. Palmer was a Member of the Board of Trustees of Indian Mountain School (private elementary and secondary school) (2004-2009).
Chair of the Board of Trustees — Goldman Sachs Trust and Goldman Sachs Variable Insurance Trust. | 102 | None | |||||
Kathryn A. Cassidy Age: 65 | Trustee | Since 2015 | Ms. Cassidy is retired. Formerly, she was Advisor to the Chairman (May 2014-December 2014); and Senior Vice President and Treasurer (2008-2014), General Electric Company & General Electric Capital Corporation (technology and financial services companies).
Trustee — Goldman Sachs Trust and Goldman Sachs Variable Insurance Trust. | 102 | None | |||||
Diana M. Daniels Age: 70 | Trustee | Since 2007 | Ms. Daniels is retired. Formerly, she was Vice President, General Counsel and Secretary, The Washington Post Company (1991-2006). Ms. Daniels is a Trustee Emeritus and serves as a Presidential Councillor of Cornell University (2013-Present); former Member of the Legal Advisory Board, New York Stock Exchange(2003-2006) and of the Corporate Advisory Board, Standish Mellon Management Advisors (2006-2007).
Trustee — Goldman Sachs Trust and Goldman Sachs Variable Insurance Trust. | 102 | None | |||||
Roy W. Templin Age: 59 | Trustee | Since 2013 | Mr. Templin is retired. He is Director, Armstrong World Industries, Inc. (a designer and manufacturer of ceiling, wall and suspension system solutions) (2016-Present); and was formerly Chairman of the Board of Directors, Con-Way Incorporated (a transportation, logistics and supply chain management service company) (2014-2015); Executive Vice President and Chief Financial Officer, Whirlpool Corporation (an appliance manufacturer and marketer)(2004-2012). Previously, Mr. Templin served as an Advisory Board Member of Goldman Sachs Trust and Goldman Sachs Variable Insurance Trust (June 2013-October 2013).
Trustee — Goldman Sachs Trust and Goldman Sachs Variable Insurance Trust. | 102 | Armstrong World Industries, Inc. (a ceiling, wall and suspension systems solutions manufacturer) | |||||
Gregory G. Weaver Age: 68 | Trustee | Since 2015 | Mr. Weaver is retired. He is Director, Verizon Communications Inc. (2015-Present); and was formerly Chairman and Chief Executive Officer, Deloitte & Touche LLP (a professional services firm) (2001-2005 and 2012-2014); and Member of the Board of Directors, Deloitte & Touche LLP (2006-2012).
Trustee — Goldman Sachs Trust and Goldman Sachs Variable Insurance Trust. | 102 | Verizon Communications Inc. | |||||
88
GOLDMAN SACHS INTERNATIONAL EQUITY INSIGHTS FUNDS
Trustees and Officers (Unaudited) (continued)
Interested Trustee*
| Name, Address and Age1 | Position(s) Held with the Trust | Term of Office and | Principal Occupation(s) During Past 5 Years | Number of Portfolios in Fund Complex Overseen by Trustee3 | Other Directorships Held by Trustee4 | |||||
James A. McNamara Age: 57 | President and Trustee | Since 2007 | Advisory Director, Goldman Sachs (January 2018-Present); Managing Director, Goldman Sachs (January 2000-December 2017); Director of Institutional Fund Sales, GSAM (April 1998-December 2000); and Senior Vice President and Manager, Dreyfus Institutional Service Corporation (January 1993-April 1998).
President and Trustee — Goldman Sachs Trust; Goldman Sachs Variable Insurance Trust; Goldman Sachs Trust II; Goldman Sachs MLP Income Opportunities Fund; Goldman Sachs MLP and Energy Renaissance Fund; and Goldman Sachs ETF Trust. | 162 | None | |||||
Advisory Board Members
| Name, Address, Age1 | Position(s) Held with the Trust | Term of Office and | Principal Occupation(s) During Past 5 Years | Number of Portfolios in Fund Complex Overseen by Advisory Board Member3 | Other Directorships Held by Advisory Board Member4 | |||||
Dwight L. Bush Age: 62 | Advisory Board Member | Since 2019 | Ambassador Bush is President and CEO of D.L. Bush & Associates (a financial advisory and private investment firm) (2002-2014 and 2017-present); and was formerly U.S. Ambassador to the Kingdom of Morocco (2014-2017) and a Member of the Board of Directors of Santander Bank, N.A. (2018-2019).
Advisory Board Member — Goldman Sachs Trust and Goldman Sachs Variable Insurance Trust. | 102 | None | |||||
Joaquin Delgado Age: 59 | Advisory Board Member | Since 2019 | Dr. Delgado is retired. He is Director, Hexion Inc. (a specialty chemical manufacturer) (2019-present); and Director, Stepan Company (a specialty chemical manufacturer) (2011-present); and was formerly Executive Vice President, Consumer Business Group of 3M Company (July 2016-July 2019); and Executive Vice President, Health Care Business Group of 3M Company (October 2012-July 2016).
Advisory Board Member — Goldman Sachs Trust and Goldman Sachs Variable Insurance Trust. | 102 | Stepan Company (a specialty chemical manufacturer) | |||||
| * | Mr. McNamara is considered to be an “Interested Trustee” because he holds positions with Goldman Sachs and owns securities issued by The Goldman Sachs Group, Inc. Mr. McNamara holds comparable positions with certain other companies of which Goldman Sachs, GSAM or an affiliate thereof is the investment adviser, administrator and/or distributor. |
| 1 | Each Trustee and Advisory Board Member may be contacted by writing to the Trustee or Advisory Board Member, c/o Goldman Sachs, 200 West Street, New York, New York, 10282, Attn: Caroline Kraus. Information is provided as of October 31, 2019. |
| 2 | Subject to such policies as may be adopted by the Board from time-to-time, each Trustee holds office for an indefinite term, until the earliest of: (a) the election of his or her successor; (b) the date the Trustee resigns or is removed by the Board or shareholders, in accordance with the Trust’s Declaration of Trust; or (c) the termination of the Trust. The Board has adopted policies which provide that (a) no Trustee shall hold office for more than 15 years and (b) a Trustee shall retire as of December 31st of the calendar year in which he or she reaches his or her 74th birthday, unless a waiver of such requirements shall have been adopted by a majority of the other Trustees. These policies may be changed by the Trustees without shareholder vote. |
| 3 | The Goldman Sachs Fund Complex includes certain other companies listed above for each respective Trustee. As of October 31, 2019, Goldman Sachs Trust consisted of 89 portfolios (88 of which offered shares to the public); Goldman Sachs Variable Insurance Trust consisted of 13 portfolios; Goldman Sachs Trust II consisted of 19 portfolios (17 of which offered shares to the public); Goldman Sachs MLP Income Opportunities Fund and Goldman Sachs MLP and Energy Renaissance Fund each consisted of one portfolio; and Goldman Sachs ETF Trust consisted of 39 portfolios (21 of which offered shares to the public). |
| 4 | This column includes only directorships of companies required to report to the Securities and Exchange Commission under the Securities Exchange Act of 1934 (i.e., “public companies”) or other investment companies registered under the Act. |
Additional information about the Trustees is available in the Funds’ Statement of Additional Information, which can be obtained from Goldman Sachs free of charge by calling this toll-free number (in the United States of America): 1-800-526-7384. Additional information about the Advisory Board Members will be available in the Funds’ Statement of Additional Information dated February 28, 2020, which will be available from Goldman Sachs free of charge by calling this toll-free number (in the United States of America): 1-800-526-7384.
89
GOLDMAN SACHS INTERNATIONAL EQUITY INSIGHTS FUNDS
Trustees and Officers (Unaudited) (continued)
Officers of the Trust*
| Name, Address and Age1 | Position(s) Held with the Trust | Term of Office and | Principal Occupation(s) During Past 5 Years | |||
James A. McNamara 200 West Street New York, NY 10282 Age: 57 | Trustee and President | Since 2007 | Advisory Director, Goldman Sachs (January 2018-Present); Managing Director, Goldman Sachs (January 2000-December 2017); Director of Institutional Fund Sales, GSAM (April 1998-December 2000); and Senior Vice President and Manager, Dreyfus Institutional Service Corporation (January 1993-April 1998).
President and Trustee — Goldman Sachs Trust; Goldman Sachs Variable Insurance Trust; Goldman Sachs Trust II; Goldman Sachs MLP Income Opportunities Fund; Goldman Sachs MLP and Energy Renaissance Fund; and Goldman Sachs ETF Trust. | |||
Caroline L. Kraus 200 West Street New York, NY 10282 Age: 42 | Secretary | Since 2012 | Managing Director, Goldman Sachs (January 2016-Present); Vice President, Goldman Sachs (August 2006-December 2015); Associate General Counsel, Goldman Sachs (2012-Present); Assistant General Counsel, Goldman Sachs (August 2006-December 2011); and Associate, Weil, Gotshal & Manges, LLP (2002-2006).
Secretary — Goldman Sachs Trust (previously Assistant Secretary (2012)); Goldman Sachs Variable Insurance Trust (previously Assistant Secretary (2012)); Goldman Sachs Trust II; Goldman Sachs BDC, Inc.; Goldman Sachs Private Middle Market Credit LLC; Goldman Sachs Middle Market Lending Corp.; Goldman Sachs MLP Income Opportunities Fund; Goldman Sachs MLP and Energy Renaissance Fund; and Goldman Sachs ETF Trust. | |||
Joseph F. DiMaria 30 Hudson Street Jersey City, NJ 07302 Age: 51 | Treasurer, Principal Financial Officer and Principal Accounting Officer | Since 2017 (Treasurer and Principal Financial Officer since 2019) | Managing Director, Goldman Sachs (November 2015-Present) and Vice President — Mutual Fund Administration, Columbia Management Investment Advisers, LLC (May 2010-October 2015).
Treasurer, Principal Financial Officer and Principal Accounting Officer — Goldman Sachs Trust (previously Assistant Treasurer (2016)); Goldman Sachs Variable Insurance Trust (previously Assistant Treasurer (2016)); Goldman Sachs Trust II (previously Assistant Treasurer (2017)); Goldman Sachs MLP Income Opportunities Fund (previously Assistant Treasurer (2017)); Goldman Sachs MLP and Energy Renaissance Fund (previously Assistant Treasurer (2017)); and Goldman Sachs ETF Trust (previously Assistant Treasurer (2017)). | |||
| * | Represents a partial list of officers of the Trust. Additional information about all the officers is available in the Funds’ Statement of Additional Information, which can be obtained from Goldman Sachs free of charge by calling this toll-free number (in the United States): 1-800-526-7384. |
| 1 | Information is provided as of October 31, 2019. |
| 2 | Officers hold office at the pleasure of the Board of Trustees or until their successors are duly elected and qualified. Each officer holds comparable positions with certain other companies of which Goldman Sachs, GSAM or an affiliate thereof is the investment adviser, administrator and/or distributor. |
Goldman Sachs Trust — International Equity Insights Funds — Tax Information (Unaudited)
From distributions paid during the year ended October 31, 2019, the total amount of income received by the Emerging Markets Equity Insights, International Equity Insights, and International Small Cap Insights Funds from sources within foreign countries and possessions of the United States was $0.2267, $0.2000, and $0.1653 per share, respectively, all of which is attributable to qualified passive income. The percentage of net investment income dividends paid from foreign sources by the Emerging Markets Equity Insights, International Equity Insights, and International Small Cap Insights Funds were 96.14%, 89.13%, and 91.73 %, respectively. The total amount of taxes paid by the Emerging Markets Equity Insights, International Equity Insights and International Small Cap Insights Funds to such countries was $0.0357, $0.0190, and $0.0203 per share, respectively.
For the year ended October 31, 2019, 83.82%, 96.79%, and 100.00% of the dividends paid from net investment company taxable income by the Emerging Markets Equity Insights, International Equity Insights, and International Small Cap Insights Funds, respectively, qualify for the reduced tax rate under the Jobs and Growth Tax Relief and Reconciliation Act of 2003.
90
FUNDS PROFILE
Goldman Sachs Funds
Goldman Sachs is a premier financial services firm, known since 1869 for creating thoughtful and customized investment solutions in complex global markets.
Today, theConsumer and Investment Management Division of Goldman Sachs serves a diverse set of clients worldwide, including private institutions, public entities and individuals. With approximately $1.60 trillion in assets under supervision as of September 30, 2019, Goldman Sachs Asset Management (“GSAM”) has portfolio management teams located around the world and our investment professionals bring firsthand knowledge of local markets to every investment decision. Assets under supervision includes assets under management and other client assets for which Goldman Sachs does not have full discretion. GSAM leverages the resources of Goldman Sachs & Co. LLC subject to legal, internal and regulatory restrictions.
Money Market
Financial Square FundsSM
| ∎ | Financial Square Treasury Solutions Fund1 |
| ∎ | Financial Square Government Fund1 |
| ∎ | Financial Square Money Market Fund2 |
| ∎ | Financial Square Prime Obligations Fund2 |
| ∎ | Financial Square Treasury Instruments Fund1 |
| ∎ | Financial Square Treasury Obligations Fund1 |
| ∎ | Financial Square Federal Instruments Fund1 |
Investor FundsSM
| ∎ | Investor Money Market Fund3 |
| ∎ | Investor Tax-Exempt Money Market Fund3 |
Fixed Income
Short Duration and Government
| ∎ | Enhanced Income Fund |
| ∎ | High Quality Floating Rate Fund |
| ∎ | Short-Term Conservative Income Fund |
| ∎ | Short Duration Government Fund |
| ∎ | Short Duration Income Fund |
| ∎ | Government Income Fund |
| ∎ | Inflation Protected Securities Fund |
Multi-Sector
| ∎ | Bond Fund |
| ∎ | Core Fixed Income Fund |
| ∎ | Global Income Fund |
| ∎ | Strategic Income Fund |
| ∎ | Income Fund |
Municipal and Tax-Free
| ∎ | High Yield Municipal Fund |
| ∎ | Dynamic Municipal Income Fund |
| ∎ | Municipal Income Completion Fund |
| ∎ | Short Duration Tax-Free Fund |
Single Sector
| ∎ | Investment Grade Credit Fund |
| ∎ | U.S. Mortgages Fund |
| ∎ | High Yield Fund |
| ∎ | High Yield Floating Rate Fund |
| ∎ | Emerging Markets Debt Fund |
| ∎ | Local Emerging Markets Debt Fund |
Fixed Income Alternatives
| ∎ | Long Short Credit Strategies Fund |
Fundamental Equity
| ∎ | Equity Income Fund |
| ∎ | Small Cap Growth Fund |
| ∎ | Small Cap Value Fund |
| ∎ | Small/Mid Cap Value Fund |
| ∎ | Mid Cap Value Fund |
| ∎ | Large Cap Value Fund |
| ∎ | Focused Value Fund |
| ∎ | Capital Growth Fund |
| ∎ | Strategic Growth Fund |
| ∎ | Small/Mid Cap Growth Fund |
| ∎ | Flexible Cap Fund |
| ∎ | Concentrated Growth Fund |
| ∎ | Technology Opportunities Fund |
| ∎ | Growth Opportunities Fund |
| ∎ | Rising Dividend Growth Fund |
| ∎ | Blue Chip Fund |
| ∎ | Income Builder Fund |
Tax-Advantaged Equity
| ∎ | U.S. Tax-Managed Equity Fund |
| ∎ | International Tax-Managed Equity Fund |
| ∎ | U.S. Equity Dividend and Premium Fund |
| ∎ | International Equity Dividend and Premium Fund |
Equity Insights
| ∎ | Small Cap Equity Insights Fund |
| ∎ | U.S. Equity Insights Fund |
| ∎ | Small Cap Growth Insights Fund |
| ∎ | Large Cap Growth Insights Fund |
| ∎ | Large Cap Value Insights Fund |
| ∎ | Small Cap Value Insights Fund |
| ∎ | International Small Cap Insights Fund |
| ∎ | International Equity Insights Fund |
| ∎ | Emerging Markets Equity Insights Fund |
Fundamental Equity International
| ∎ | International Equity Income Fund |
| ∎ | International Equity ESG Fund |
| ∎ | China Equity Fund4 |
| ∎ | Emerging Markets Equity Fund |
| ∎ | Imprint Emerging Markets Opportunities Fund5 |
| ∎ | ESG Emerging Markets Equity Fund |
Alternative
| ∎ | Real Estate Securities Fund |
| ∎ | International Real Estate Securities Fund |
| ∎ | Commodity Strategy Fund |
| ∎ | Global Real Estate Securities Fund |
| ∎ | Alternative Premia Fund |
| ∎ | Absolute Return Tracker Fund |
| ∎ | Managed Futures Strategy Fund |
| ∎ | MLP Energy Infrastructure Fund |
| ∎ | MLP & Energy Fund |
| ∎ | Multi-Manager Alternatives Fund |
| ∎ | Global Infrastructure Fund |
Total Portfolio Solutions
| ∎ | Global Managed Beta Fund |
| ∎ | Multi-Manager Non-Core Fixed Income Fund |
| ∎ | Multi-Manager U.S. Dynamic Equity Fund |
| ∎ | Multi-Manager Global Equity Fund |
| ∎ | Multi-Manager International Equity Fund |
| ∎ | Tactical Tilt Overlay Fund |
| ∎ | Balanced Strategy Portfolio |
| ∎ | Multi-Manager U.S. Small Cap Equity Fund |
| ∎ | Multi-Manager Real Assets Strategy Fund |
| ∎ | Growth and Income Strategy Portfolio |
| ∎ | Growth Strategy Portfolio |
| ∎ | Dynamic Global Equity Fund6 |
| ∎ | Satellite Strategies Portfolio |
| ∎ | Enhanced Dividend Global Equity Portfolio |
| ∎ | Tax-Advantaged Global Equity Portfolio |
| ∎ | Strategic Factor Allocation Fund |
| ∎ | Target Date 2020 Portfolio |
| ∎ | Target Date 2025 Portfolio |
| ∎ | Target Date 2030 Portfolio |
| ∎ | Target Date 2035 Portfolio |
| ∎ | Target Date 2040 Portfolio |
| ∎ | Target Date 2045 Portfolio |
| ∎ | Target Date 2050 Portfolio |
| ∎ | Target Date 2055 Portfolio |
| ∎ | Target Date 2060 Portfolio |
| ∎ | GQG Partners International Opportunities Fund |
| 1 | You could lose money by investing in the Fund. Although the Fund seeks to preserve the value of your investment at $1.00 per share, it cannot guarantee it will do so. An investment in the Fund is not a deposit of a bank and is not insured or guaranteed by the Federal Deposit Insurance Corporation or any other government agency. The Fund’s sponsor has no legal obligation to provide financial support to the Fund, and you should not expect that the sponsor will provide financial support to the Fund at any time. |
| 2 | You could lose money by investing in the Fund. Because the share price of the Fund will fluctuate, when you sell your shares they may be worth more or less than what you originally paid for them. The Fund may impose a fee upon sale of your shares or may temporarily suspend your ability to sell shares if the Fund’s liquidity falls below required minimums because of market conditions or other factors. An investment in the Fund is not a deposit of a bank and is not insured or guaranteed by the Federal Deposit Insurance Corporation or any other government agency. The Fund’s sponsor has no legal obligation to provide financial support to the Fund, and you should not expect that the sponsor will provide financial support to the Fund at any time. |
| 3 | You could lose money by investing in the Fund. Although the Fund seeks to preserve the value of your investment at $1.00 per share, it cannot guarantee it will do so. The Fund may impose a fee upon sale of your shares or may temporarily suspend your ability to sell shares if the Fund’s liquidity falls below required minimums because of market conditions or other factors. An investment in the Fund is not a deposit of a bank and is not insured or guaranteed by the Federal Deposit Insurance Corporation or any other government agency. The Fund’s sponsor has no legal obligation to provide financial support to the Fund, and you should not expect that the sponsor will provide financial support to the Fund at any time. |
| 4 | Effective after the close of business on November 20, 2019, the Goldman Sachs Asia Equity Fund was renamed the Goldman Sachs China Equity Fund. |
| 5 | Effective after the close of business on August 30, 2019, the Goldman Sachs N-11 Equity Fund was renamed the Goldman Sachs Imprint Emerging Markets Opportunities Fund. |
| 6 | Effective after the close of business on February 28, 2019, the Goldman Sachs Equity Growth Strategy Portfolio was renamed the Goldman Sachs Dynamic Global Equity Fund. |
Financial Square FundsSM and Investor FundsSM are registered service marks of Goldman Sachs & Co. LLC.
| * | This list covers open-end funds only. Please visit our website at www.GSAMFUNDS.com to learn about our closed-end funds and exchange-traded funds. |
TRUSTEES Jessica Palmer,Chair Kathryn A. Cassidy Diana M. Daniels James A. McNamara Roy W. Templin Gregory G. Weaver | OFFICERS James A. McNamara,President Joseph F. DiMaria, Principal Financial Officer, Principal Accounting Officer and Treasurer Caroline L. Kraus,Secretary | |
GOLDMAN SACHS & CO. LLC Distributor and Transfer Agent | GOLDMAN SACHS ASSET MANAGEMENT, L.P. Investment Adviser | |
Visit our Website atwww.GSAMFUNDS.com to obtain the most recent month-end returns.
Goldman Sachs Asset Management, L.P., 200 West Street, New York, New York 10282
The reports concerning the Funds included in this shareholder report may contain certain forward-looking statements about the factors that may affect the performance of the Funds in the future. These statements are based on Fund management’s predictions and expectations concerning certain future events and their expected impact on the Funds, such as performance of the economy as a whole and of specific industry sectors, changes in the levels of interest rates, the impact of developing world events, and other factors that may influence the future performance of the Funds. Management believes these forward-looking statements to be reasonable, although they are inherently uncertain and difficult to predict. Actual events may cause adjustments in portfolio management strategies from those currently expected to be employed.
A description of the policies and procedures that the Funds use to determine how to vote proxies relating to portfolio securities and information regarding how a Fund voted proxies relating to portfolio securities during the most recent 12-month period ended June 30 is available (i) without charge, upon request by calling 1-800-526-7384 (for Retail Shareholders) or 1-800-621-2550 (for Institutional Shareholders); and (ii) on the Securities and Exchange Commission web site at http://www.sec.gov.
Economic and market forecasts presented herein reflect a series of assumptions and judgments as of the date of this presentation and are subject to change without notice. These forecasts do not take into account the specific investment objectives, restrictions, tax and financial situation or other needs of any specific client. Actual data will vary and may not be reflected here. These forecasts are subject to high levels of uncertainty that may affect actual performance. Accordingly, these forecasts should be viewed as merely representative of a broad range of possible outcomes. These forecasts are estimated, based on assumptions, and are subject to significant revision and may change materially as economic and market conditions change. Goldman Sachs has no obligation to provide updates or changes to these forecasts. Case studies and examples are for illustrative purposes only.
The Global Industry Classification Standard (GICS) was developed by and is the exclusive property and a service mark of Morgan Stanley Capital International Inc. (MSCI) and Standard & Poor’s, a division of The McGraw-Hill Companies, Inc. (S&P) and is licensed for use by Goldman Sachs. Neither MSCI, S&P nor any other party involved in making or compiling the GICS or any GICS classifications makes any express or implied warranties or representations with respect to such standard or classification (or the results to be obtained by the use thereof), and all such parties hereby expressly disclaim all warranties of originality, accuracy, completeness, merchantability or fitness for a particular purpose with respect to any of such standard or classification. Without limiting any of the foregoing, in no event shall MSCI, S&P, any of their affiliates or any third party involved in making or compiling the GICS or any GICS classifications have any liability for any direct, indirect, special, punitive, consequential or any other damages (including lost profits) even if notified of the possibility of such damages.
The Funds will file their portfolio holdings for each month in a fiscal quarter within 60 days after the end of the relevant fiscal quarter on Form N-PORT. Portfolio holdings information for the third month of each fiscal quarter will be made available on the SEC’s web site at http://www.sec.gov. Portfolio holdings information may be obtained upon request and without charge by calling 1-800-526-7384 (for Retail Shareholders) or 1-800-621-2550 (for Institutional Shareholders).
Fund holdings and allocations shown are unaudited, and may not be representative of current or future investments. Fund holdings and allocations may not include the Fund’s entire investment portfolio, which may change at any time. Fund holdings should not be relied on in making investment decisions and should not be construed as research or investment advice regarding particular securities. Current and future holdings are subject to risk.
The portfolio risk management process includes an effort to monitor and manage risk, but does not imply low risk. Diversification does not protect an investor from market risk and does not ensure a profit.
This material is not authorized for distribution to prospective investors unless preceded or accompanied by a current Prospectus or summary prospectus, if applicable. Investors should consider a Fund’s objective, risks, and charges and expenses, and read the summary prospectus, if available, and/or the Prospectus carefully before investing or sending money. The summary prospectus, if available, and the Prospectus contain this and other information about a Fund and may be obtained from your authorized dealer or from Goldman Sachs & Co. LLC by calling (retail – 1-800-526-7384) (institutional – 1-800-621-2550).
© 2019 Goldman Sachs. All rights reserved. 187282-OTU-1103581 INTINSAR-19
| ITEM 2. | CODE OF ETHICS. |
| (a) | As of the end of the period covered by this report, the registrant has adopted a code of ethics that applies to the registrant’s principal executive officer, principal financial officer, principal accounting officer or controller, or persons performing similar functions, regardless of whether these individuals are employed by the registrant or a third party (the “Code of Ethics”). |
| (b) | During the period covered by this report, no amendments were made to the provisions of the Code of Ethics. |
| (c) | During the period covered by this report, the registrant did not grant any waivers, including an implicit waiver, from any provision of the Code of Ethics. |
| (d) | A copy of the Code of Ethics is available as provided in Item 13(a)(1) of this report. |
| ITEM 3. | AUDIT COMMITTEE FINANCIAL EXPERT. |
The registrant’s board of trustees has determined that the registrant has at least one “audit committee financial expert” (as defined in Item 3 of FormN-CSR) serving on its audit committee. Gregory G. Weaver is the “audit committee financial expert” and is “independent” (as each term is defined in Item 3 of FormN-CSR). |
| ITEM 4. | PRINCIPAL ACCOUNTANT FEES AND SERVICES. |
Table 1 — Items 4(a) - 4(d). The accountant fees below reflect the aggregate fees billed by all of the Funds of the Goldman Sachs Trust and includes the Goldman Sachs Funds to which this certified shareholder report relates.
| 2019 | 2018 | Description of Services Rendered | ||||||||||
|
|
|
|
| ||||||||
Audit Fees: | ||||||||||||
| • PricewaterhouseCoopers LLP (“PwC”) | $ | 4,119,730 | $ | 2,567,290 | Financial Statement audits. | |||||||
Audit-Related Fees: | ||||||||||||
• PwC | $ | 262,194 | $ | 398,872 | Other attest services. | |||||||
Tax Fees: | ||||||||||||
• PwC | $ | 1,171,431 | $ | 1,143,903 | Tax compliance services provided in connection with the preparation and review of registrant’s tax returns. | |||||||
Table 2 — Items 4(b)(c) & (d).Non-Audit Services to the Goldman Sachs Trust’s service affiliates * that werepre-approved by the Audit Committee of the Goldman Sachs Trust pursuant to Rule2-01(c)(7)(ii) of RegulationS-X.
| 2019 | 2018 | Description of Services Rendered | ||||||||||
|
|
|
|
| ||||||||
Audit-Related Fees: | ||||||||||||
• PwC | $ | 2,400,617 | $ | 1,897,685 | Internal control review performed in accordance with Statement on Standards for Attestation Engagements No. 16 and semi annual updates relating to withholding tax accrual for non-US jurisdictions. These fees are borne by the Funds’ Adviser. | |||||||
| * | These include the advisor (excludingsub-advisors) and any entity controlling, controlled by or under common control with the advisor that provides ongoing services to the registrant (hereinafter referred to as “service affiliates”). |
Item 4(e)(1) — Audit CommitteePre-Approval Policies and Procedures
Pre-Approval of Audit andNon-Audit Services Provided to the Funds of the Goldman Sachs Trust. The Audit andNon-Audit ServicesPre-Approval Policy (the “Policy”) adopted by the Audit Committee of Goldman Sachs Trust (“GST”) sets forth the procedures and the conditions pursuant to which services performed by an independent auditor for GST may bepre-approved. Services may bepre-approved specifically by the Audit Committee as a whole or, in certain circumstances, by the Audit Committee Chairman or the person designated as the Audit Committee Financial Expert. In addition, subject to specified cost limitations, certain services may bepre-approved under the provisions of the Policy. The Policy provides that the Audit Committee will consider whether the services provided by an independent auditor are consistent with the Securities and Exchange Commission’s rules on auditor independence. The Policy provides for periodic review andpre-approval by the Audit Committee of the services that may be provided by the independent auditor.
De Minimis Waiver. Thepre-approval requirements of the Policy may be waived with respect to the provision ofnon-audit services that are permissible for an independent auditor to perform, provided (1) the aggregate amount of all such services provided constitutes no more than five percent of the total amount of revenues subject topre-approval that was paid to the independent auditors during the fiscal year in which the services are provided; (2) such services were not recognized by GST at the time of the engagement to benon-audit services; and (3) such services are promptly brought to the attention of the Audit Committee and approved prior to the completion of the audit by the Audit Committee or by one or more members of the Audit Committee to whom authority to grant such approvals has been delegated by the Audit Committee, pursuant to thepre-approval provisions of the Policy.
Pre-Approval ofNon-Audit Services Provided to GST’s Investment Advisers. The Policy provides that, in addition to requiringpre-approval of audit andnon-audit services provided to GST, the Audit Committee willpre-approve thosenon-audit services provided to GST’s investment advisers (and entities controlling, controlled by or under common control with the investment advisers that provide ongoing services to GST) where the engagement relates directly to the operations or financial reporting of GST.
Item 4(e)(2) –0% of the audit-related fees, tax fees and other fees listed in Table 1 were approved by GST’s Audit Committee pursuant to the “de minimis” exception of Rule2-01(c)(7)(i)(C) of RegulationS-X. In addition, 0% of thenon-audit services to the GST’s service affiliates listed in Table 2 were approved by GST’s Audit Committee pursuant to the “de minimis” exception of Rule2-01(c)(7)(i)(C) of RegulationS-X.
Item 4(f) –Not applicable.
Item 4(g) AggregateNon-Audit Fees Disclosure
The aggregatenon-audit fees billed to GST by PwC for the twelve months ended October 31, 2019 and October 31, 2018 were approximately $1,433,614 and $1,542,775 respectively. The aggregatenon-audit fees billed to GST’s adviser and service affiliates by PwC fornon-audit services for the twelve months ended December 31, 2018 and December 31, 2017 were approximately $12.3 million and $9.4 million respectively. The figures for these entities are not yet available for the twelve months ended December 31, 2019. With regard to the aggregatenon-audit fees billed to GST’s adviser and service affiliates, the 2018 and 2017 amounts include fees fornon-audit services required to bepre-approved [see Table 2] and fees fornon-audit services that did not requirepre-approval since they did not directly relate to GST’s operations or financial reporting.
Item 4(h) —GST’s Audit Committee has considered whether the provision ofnon-audit services to GST’s investment adviser and service affiliates that did not requirepre-approval pursuant to paragraph (c)(7)(ii) of Rule2-01 of RegulationS-X is compatible with maintaining the auditors’ independence.
| ITEM 5. | AUDIT COMMITTEE OF LISTED REGISTRANTS. |
Not applicable. |
| ITEM 6. | SCHEDULE OF INVESTMENTS. |
Schedule of Investments is included as part of the Report to Shareholders filed under Item 1. |
| ITEM 7. | DISCLOSURE OF PROXY VOTING POLICIES AND PROCEDURES FORCLOSED-END MANAGEMENT INVESTMENT COMPANIES. |
Not applicable. |
| ITEM 8. | PORTFOLIO MANAGERS OFCLOSED-END MANAGEMENT INVESTMENT COMPANIES. |
Not applicable. |
| ITEM 9. | PURCHASES OF EQUITY SECURITIES BYCLOSED-END MANAGEMENT INVESTMENT COMPANY AND AFFILIATED PURCHASERS. |
Not applicable. |
| ITEM 10. | SUBMISSION OF MATTERS TO A VOTE OF SECURITY HOLDERS. |
There have been no material changes to the procedures by which shareholders may recommend nominees to the registrant’s board of trustees. |
| ITEM 11. | CONTROLS AND PROCEDURES. |
| (a) | The registrant’s principal executive and principal financial officers, or persons performing similar functions have concluded that the registrant’s disclosure controls and procedures (as defined in Rule30a-3(c) under the Investment Company Act of 1940, as amended (the “1940 Act”)) are effective as of a date within 90 days of the filing of this report that includes the disclosure required by this paragraph, based on the evaluation of these controls and procedures required by Rule30a-3(b) under the 1940 Act and15d-15(b) under the Securities Exchange Act of 1934, as amended. |
| (b) | There were no changes in the registrant’s internal control over financial reporting (as defined in Rule30a-3(d) under the 1940 Act) that occurred during the period covered by this report that have materially affected, or are reasonably likely to materially affect, the registrant’s internal control over financial reporting. |
| ITEM 12. | DISCLOSURE OF SECURITIES LENDING ACTIVITIES FOR CLOSED-END MANAGEMENT INVESTMENT COMPANIES |
Not applicable. |
| ITEM 13. | EXHIBITS. |
| (a)(1) | Goldman Sachs Trust’s Code of Ethics for Principal Executive and Senior Financial Officers is incorporated by reference to Exhibit 12(a)(1) of the registrant’s FormN-CSR filed on July 8, 2015 for its International Equity Insights Funds. | |||
| (a)(2) | Exhibit 99.CERT | Certifications pursuant to Section 302 of the Sarbanes-Oxley Act of 2002 filed herewith. | ||
| (a)(3) | Not applicable to open-end investment companies. | |||
| (a)(4) | There was no change in the registrant’s independent public accountant for the period covered by this report. | |||
| (b) | Exhibit 99.906CERT | Certifications pursuant to Section 906 of the Sarbanes-Oxley Act of 2002 filed herewith. | ||
SIGNATURES
Pursuant to the requirements of the Securities Exchange Act of 1934 and the Investment Company Act of 1940, the registrant has duly caused this report to be signed on its behalf by the undersigned, thereunto duly authorized.
| Goldman Sachs Trust | ||
| By: | /s/ James A. McNamara | |
| ||
James A. McNamara | ||
| President/Chief Executive Officer | ||
| Goldman Sachs Trust | ||
| Date: | December 30, 2019 | |
Pursuant to the requirements of the Securities Exchange Act of 1934 and the Investment Company Act of 1940, this report has been signed below by the following persons on behalf of the registrant and in the capacities and on the dates indicated.
| By: | /s/ James A. McNamara | |
| ||
James A. McNamara | ||
| President/Chief Executive Officer | ||
| Goldman Sachs Trust | ||
| Date: | December 30, 2019 | |
| By: | /s/ Joseph F. DiMaria | |
| ||
Joseph F. DiMaria | ||
| Principal Financial Officer | ||
| Goldman Sachs Trust | ||
| Date: | December 30, 2019 | |