OMB APPROVAL
OMB Number:
3235-0570
Expires: January
31, 2014
Estimated average
burden hours per
response: 20.6
UNITED STATES
SECURITIES AND EXCHANGE COMMISSION
Washington, D.C. 20549
FORM N-CSR
CERTIFIED SHAREHOLDER REPORT OF REGISTERED MANAGEMENT
INVESTMENT COMPANIES
Investment Company Act file number: 811-05371
Russell Investment Funds
(Exact name of registrant as specified in charter)
1301 2nd Avenue 18 th Floor, Seattle Washington 98101
(Address of principal executive offices) (Zip code)
Mary Beth Rhoden Albaneze, Secretary and Chief Legal Officer
Russell Investment Funds
1301 2nd Avenue
18 th Floor
Seattle, Washington 98101
206-505-4846
(Name and address of agent for service)
Registrant's telephone number, including area code: 800-787-7354
| Date of fiscal year end: | | December 31 |
| Date of reporting period: | | January 1, 2013 to December 31, 2013 |
Item 1. Reports to Stockholders

2013 ANNUAL REPORT
Russell Investment Funds
DECEMBER 31, 2013
FUND
Multi-Style Equity Fund
Aggressive Equity Fund
Non-U.S. Fund
Core Bond Fund
Global Real Estate Securities Fund
| Russell Investment Funds |
| |
| Russell Investment Funds is a |
| series investment company with |
| nine different investment portfolios |
| referred to as Funds. These |
| financial statements report on five |
| of these Funds. |
Russell Investment Funds
Annual Report
December 31, 2013
Table of Contents
To Our Shareholders ...........................................................................................3
Market Summary ...................................................................................................4
Multi-Style Equity Fund .......................................................................................14
Aggressive Equity Fund .....................................................................................32
Non-U.S. Fund .....................................................................................................54
Core Bond Fund .................................................................................................76
Global Real Estate Securities Fund ................................................................116
Notes to Schedule of Investments ..................................................................136
Notes to Financial Highlights ...........................................................................138
Notes to Financial Statements ........................................................................139
Report of Independent Registered Public Accounting Firm ..........................159
Tax Information ..................................................................................................160
Basis for Approval of Investment Advisory Contracts ....................................161
Shareholder Requests for Additional Information ...........................................168
Disclosure of Information about Fund Trustees and Officers ......................169
Advisor, Money Manager and Service Providers .............................................175
Russell Investment Funds
Copyright © Russell Investments 2014. All rights reserved.
Russell Investments is a Washington, USA corporation, which operates through subsidiaries worldwide and is a subsidiary of The Northwestern Mutual Life Insurance Company.
Fund objectives, risks, charges and expenses should be carefully considered before investing. A prospectus containing this and other important information must precede or accompany this material. Please read the prospectus carefully before investing.
Securities distributed through Russell Financial Services, Inc., member FINRA and part of Russell Investments.
Indices and benchmarks are unmanaged and cannot be invested in directly. Returns represent past performance, are not a guarantee of future performance, and are not indicative of any specific investment. Index return information is provided by vendors and although deemed reliable, is not guaranteed by Russell Investments or its affiliates.
Russell Investments is the owner of the trademarks, service marks, and copyrights related to its respective indexes.
Performance quoted represents past performance and does not guarantee future results. The investment return and principal value of an investment will fluctuate so that shares, when redeemed, may be worth more or less than their original cost. Current performance may be lower or higher than the performance data quoted.
To Our Shareholders
Dear Shareholder,
During 2013, investors endured their fair share of short-term political uncertainty here in the United States, but the equity markets continued to look beyond these events. In fact, the U.S. and world economies have generally shown consistent, stable growth that’s been in line with Russell’s expectations.
What’s more, the global equity markets enjoyed significant appreciation this past year. For example, the broad-based Russell 3000® Index returned 33.55% for the year 2013.
Looking forward into 2014, we maintain modest growth expectations for the U.S. and global economies. Although we remain optimistic, we don’t think it’s reasonable to expect double-digit gains like we saw in 2013.
However, as global markets and economies continue to evolve, we will continue to invest where we believe the world is going – not where it’s been – to seek to improve the overall return potential of our portfolios. This means being proactive and agile in the way we allocate assets on your behalf. It also means balancing the risk and return potential of the multi-asset solutions we build and manage for investors like you.
On the following pages you can gain additional insights by reviewing our Russell Investment Funds’ 2013 Annual Report for the fiscal year ended December 31, 2013, including portfolio management discussions and fund performance information.
Thank you for the trust you have placed in our firm. All of us at Russell Investments appreciate the opportunity to help you achieve financial security.

CEO, U.S Private Client Services
To Our Shareholders 3
Russell Investment Funds
Market Summary as of December 31, 2013 (Unaudited)
U.S. Equity Markets
The U.S. equity market performed very well over the fiscal year ending December 31, 2013 despite potentially encumbering macroeconomic and political news items. Broadly measured by the Russell 3000® Index, U.S. stocks returned 33.55% over the period, which is the strongest calendar year end return for the Index since 1995.
The Russell 3000® Index produced positive returns in ten of the fiscal year’s twelve months, with exceptions in June and August. The fiscal year was led by small capitalization stocks as the Russell 2000® Index returned 38.82% while the Russell 1000® Index returned 33.11%. The fiscal year was also led by dynamic stocks as the Russell 1000® Dynamic™ Index returned 35.29% while the Russell 1000® Defensive™ Index returned 30.90%. Within U.S. large capitalization stocks, the Russell 1000® Growth Index returned 33.48% compared with 32.53% for the Russell 1000® Value Index. Factor analysis reveals that high yield stocks underperformed, while high beta (beta is a measure of a portfolio’s volatility and its sensitivity to the direction of the market), high growth stocks as well as those with rising earnings estimates, price momentum and positive earnings surprises outperformed. Growth stocks led the way within small cap as well with the Russell 2000® Value Index returning 34.52% in contrast to the 43.30% returned by the Russell 2000® Growth Index.
Immediately before the beginning of 2013, U.S. equity investors had been dealing with concerns over the impending “fiscal cliff”, potential sequester, higher taxes and potential spending cuts in 2013. On January 1, 2013, congress partially addressed the fiscal issues and avoided the fiscal cliff for the moment. This allowed calendar year 2013 to begin with strong performance for the U.S. equity market as the Russell 3000® Index had a positive return in each of the first five months of the year. Despite the broad indexes rising, there were changes in market leadership during “risk off” times due to the Italian election, the events surrounding the Cyprus bailout, and speculation about Fed tapering of quantitative easing. When concerns about Europe increased, the Russell 1000® Defensive™ Index outperformed, and when they subsided, the Russell 1000® Dynamic™ Index outperformed.
Going into the summer of 2013, one of the most notable stories was the upward movement in bond yields and broader interest rates. The continued economic recovery and rising interest rates became important factors driving investor behavior as the year progressed. A key date was May 22nd, the day U.S. Federal Reserve (“Fed”) Chairman Ben Bernanke announced that the U.S. economy was strengthening and the Fed may start to taper its policy of quantitative easing. This news caused stocks with high dividend yields to underperform because they had been used as “bond substitutes” by some investors and rising interest rates made the dividend yields less enticing on a relative basis. Real Estate Investment Trusts (“REITs”) and utilities, which had been prized by investors for their high dividend yields in a period of low interest rates and low bond yields, underperformed during the second quarter. Given the evidence of the economic improvement, most sectors traditionally deemed to be non-cyclical underperformed for the second quarter. Among such sectors, health care was the only one to outperform for the second quarter and the fiscal year. Most of the more cyclical sectors outperformed the market, but the energy sector was a negative outlier for the fiscal year. The month of May was seen as a turning point that had a significant impact on the fiscal year in terms of which market segments outperformed.
During the summer of 2013, the U.S. equity market continued to rally but broad market leadership shifted strongly to growth stocks. Within U.S. large cap, growth stocks had lagged for nearly two years since the trough of the 2011 selloff. During the 3rd quarter of 2013, the Russell 1000® Growth Index beat the Russell 1000® Value Index by more than it had in any quarter of the past 4 years.
4 Market Summary
Russell Investment Funds
Market Summary as of December 31, 2013, continued — (Unaudited)
In September, the U.S. Federal Reserve ultimately decided to push back plans to taper its quantitative easing program and markets responded positively. October began with concerns about the U.S. government not reaching agreement on a spending bill or a plan to address the “fiscal cliff.” This led to a government “shutdown,” and despite some brief volatility, the market generally took the governmental chaos in stride. With an agreement reached to push the fiscal issues into 2014, the government was “re-opened” and the market produced a positive return for October. In December, Congress passed legislation to prevent another government “shutdown” that may have occurred in early 2014 if there had been no action. However, the issue of the debt ceiling remained unresolved.
The fourth quarter of 2013 ended up being very positive for U.S. equities with the Russell 3000® Index returning 10.10%. The largest capitalization stocks led for the quarter as the Russell Top 50® Mega Cap Index outperformed the Russell 3000® Index by 138 basis points, returning 11.48%. Small cap and mid-cap stocks lagged with the Russell 2000® Index returning 8.72% and the Russell Midcap® Index returning 8.39%. This was a major reversal of leadership as small and midcap stocks had led for the majority of the year. Within the Russell 1000® Index, dynamic stocks and growth stocks produced modest outperformance, but within the Russell 2000® Index, defensive stocks and value stocks outperformed. As expected in a rapidly rising market, the Russell 3000® Dynamic™ Index outperformed the Russell 3000® Defensive™ Index, but the performance of these two indexes was unusually similar, with respective returns of 10.20% and 10.00%.
Non-U.S. Developed Equity Markets
For the fÿÿiscal year ended December 31, 2013, the non-U.S. equity market, as measured by the Russell Developed ex-U.S. Large Cap® Index (the “Index”), was up 21.68 %. Equity prices increased to new highs during the period, despite the continued tepid global growth environment and elevated price multiples. Political forces were a large driver behind rising markets, as monetary authorities globally attempted to calm market participants and introduce expansionary polices aimed at promoting growth and investment. Most regions and countries generated positive absolute returns, although the more economically-exposed regions and those that lagged the broader market in recent years performed the best.
Non-U.S. equities started the fiscal year off strong, posting a 4.7% gain in the first quarter, as measured by the Index. Results in the quarter were fairly bifurcated across regions, as Japan’s aggressive monetary plans help push Japanese equities up over 12%, while political stumbles in Europe led European equities to be up only 2.8% as measured by the Russell Developed ex-UK Index. March elections in Italy failed to secure a political majority and left the region uncertain on who would succeed Mario Monti in leading the country. Also complicating issues was Cyprus’s need for a bailout in the quarter. Although Cyprus was not the first country to need rescuing from the Troika (European Union, International Monetary Fund, and European Central Bank), it was the first country to include depositors to share some of the pain. This jolted markets as they feared this “bail-in” approach would set a precedent for other, and much larger, rescue packages.
Second quarter 2013 started off much like the first quarter did; however, comments in May from U.S. Federal Reserve (the “Fed”) officials regarding a potential reduction in the Fed’s monetary stimulus program dampened market optimism towards the end of the quarter. The Index finished the period down 1.52% on what was colloquially described as “taper tantrum”. Commodities and commodity driven economies were the hardest hit during the period, with Australia down 15% and Canada down 7.7% according to the Russell Australian and Canadian Indices, respectively. Japan, Germany, and France posted some of the best relative returns in the quarter, as these countries are less reliant on U.S. monetary policy than others, while sector
Market Summary 5
Russell Investment Funds
Market Summary as of December 31, 2013, continued — (Unaudited)
performance in the quarter was led by consumer discretionary, telecommunications, and utilities.
In the third quarter, the much anticipated taper date came and went without any action from the Fed and optimism was restored to the markets. Markets bounced, as the Index gained 11.5%. Risky assets and lower quality securities were the most heavily rewarded, as banks in Spain, Italy, and France were up over 20% in the quarter, as measured by the Index. Japanese equities torrid rise slowed down, as the implementation of a value added tax increase worried investors, although gross domestic product (“GDP”) and the consumer price index (“CPI”) showed signs of elevated readings, which would be a positive for the country.
The final quarter of the fiscal year continued the upward trajectory of the third quarter, as global investors shrugged off both political and economic headwinds and non-U.S. markets finished the period up 5.81% as measured by the Index. The quarter began with a multi-week U.S. government shutdown, which prompted fears of a reduction in U.S. GDP. Despite the political malaise and a brief downturn in the Index, continued signs of moderate economic growth in the global economy were received positively by markets. Continental Europe was a stand-out performer, up 8.5% as measured by the Russell Developed ex-UK Index, while Asia/Pacific ex-Japan continued its relative underperformance, posting a loss of 0.61% as measured by the Russell Asia ex-Japan Index. Japan was also a relative underperformer in the quarter, as markets remain unsure how a 2014 Japanese sales tax increase will affect the massive efforts of Prime Minister Shinzo Abe’s administration to re-inflate the Japanese economy.
Over the entire fiscal year, however, Japanese equities were some of the strongest performing developed market equities in the period, up 55% in local terms and 27.5% in USD, as measured by the Russell Japan Large Cap Index. This sharp increase in equity prices came on the back of Prime Minister Abe’s three arrow approach to re-inflating the Japanese economy. The three arrows consist of monetary and fiscal stimulus, and structural reforms. Markets reacted positively to the first two arrows, making Japanese equities the best performing segment in the first three quarters of the fiscal year, while the uncertainty regarding the successful implementation of the third arrow caused a slight pause in optimism towards the end of summer. European equities also posted strong absolute returns, up 28.2% for the period, as measured by the Russell Developed Europe ex-UK Index. Europe emerged from its longest recession on record as the region posted positive growth in the second quarter of 2013. Signs of economic growth, coupled with massive corporate de-leveraging, helped European equities post some of the strongest returns since the beginning of the global financial crisis. Within the Index, the peripheral European nations were the best performers, as Spain, Italy, and Greece were all up over 20%. Despite improved optimism, not all regions benefited from the rising tide. Those markets exposed to commodity demand lagged most others. Australia returned 3.8% in the period, while Canada was up only 5.4%, as measured by the Russell Australia Large Cap Index and the Russell Canada Large Cap Index, respectively. Softening growth out of emerging markets, coupled with a shift to a consumer-led economy in China, weighed on commodity prices.
Sector performance over the period largely reflected the optimism in the markets and what typifies the early stages of an economic recovery. Consumer discretionary and information technology were some of the top performing sectors, followed closely by health care and industrials. Conversely, the traditional defensive sectors struggled during the fiscal year, with utilities and consumer staples relative underperformers and the health care sector just slightly outperforming the Index. Energy and materials were the two worst performing sectors, as cyclical headwinds and negative sentiment weighed on returns.
6 Market Summary
Russell Investment Funds
Market Summary as of December 31, 2013, continued — (Unaudited)
Emerging Markets
The Russell Emerging Markets® Index Net (the “Index”) was largely flat (up 0.02%) over the fiscal year ended December 31, 2013. It was another relatively volatile period in which macroeconomic, political and policy events frequently provided direction for emerging markets equities. With an economic recovery in some developed markets underway, investors focused on a timeline for the removal of quantitative easing measures, specifically from the U.S. Federal Reserve (the “Fed”), which had been a tailwind for emerging markets in recent years.
Emerging markets experienced a slightly negative first quarter of 2013 in which the Index slipped 0.7%. After a short-lived bounce at the end of 2012, brought about by the U.S.’s avoidance of the fiscal cliff and more encouraging economic data releases in China, markets retreated. A resurgence of Eurozone woes, precipitated by bailout negotiations in Cyprus, dented investor sentiment in March as many expected the outcome to set a precedent for the Eurozone and potentially negatively impact the outlook for global growth. Renewed fears over a hard-landing in China, amid speculation over monetary tightening, increased regulation of wealth management products and efforts to cool the real estate market also served to drag market performance lower.
The second quarter of 2013 was more challenging as speculation regarding the timeline for the end of the “quantitative easing era” hampered emerging markets and resulted in some sizeable net capital outflows. In May, comments from Fed Chairman Bernanke led markets to the conclusion that a wind down of stimulus measures, which had helped to drive net capital inflows to the asset class in recent years, would take place in 2013. This sparked a sell off in a number of emerging markets currencies, in particular those countries with the largest current account deficits and those most closely linked to commodities. The negative sentiment was exacerbated by fears of a credit crunch scenario in China, as the People’s Bank of China tightened credit provisioning. This was in reaction to the central bank’s concerns over lending in the banking and shadow banking segments. The Index dropped 7.4% through the second quarter in U.S. dollar terms.
The latter part of the fiscal year saw an extension of the high volatility in emerging markets equities and local currencies. Comments from Fed Chairman Bernanke that quantitative easing would be scaled back gradually, rather than immediately, spurred a rally in July. However, speculation that such a gradual reduction in stimulus may occur as soon as September reversed these gains. A rise in tensions over potential U.S. military strikes in Syria (which led to a spike in global oil prices) also negatively impacted select emerging markets, such as neighbouring country Turkey and those which are net oil importers such as India. The release of balance of payments data in certain countries, namely Indonesia, also hampered returns as several local currencies depreciated significantly against the U.S. dollar. However, a swift resolution to the threat of U.S. action in Syria and the Fed’s decision not to taper resulted in a strong rally for emerging markets. The political impasse in the U.S., which culminated in a government “shutdown” in October, was also a boon for the asset class as analysts forecast it may have delayed the removal of quantitative easing until 2014. When the news finally arrived in mid-December that the Fed was going to cut its quantitative easing program by $10 billion, emerging markets did not react too sharply and actually rallied into fiscal year-end.
For the one year period ended December 31, 2013, Poland (+8.54%) was one of the best performing markets in emerging Europe as its economy rebounded, boosted by the central bank’s rate cutting cycle, which took interest rates to a record low of 2.5%. Policymakers acted as gross domestic product (“GDP”) growth
Market Summary 7
Russell Investment Funds
Market Summary as of December 31, 2013, continued — (Unaudited)
for the country slowed to just 0.5% year over year in the first quarter of 2013, the lowest rate since 2009. Russia (-0.90%) slightly underperformed while Turkey (-24.87%) was the worst regional market as currency weakness, linked to increasing concerns over the country’s current account deficit, and an intensification of the unrest in neighbouring Syria negatively impacted the local market. In the last quarter of the fiscal year, the Turkish market was hampered by Fed tapering fears and a corruption scandal that engulfed Prime Minister Erdogan’s cabinet. The Czech Republic (-12.86%) lagged as the country’s economy extended the Republic’s longest ever recession. Domestic demand continued to suffer from the government’s austerity measures and the ongoing crisis in the Eurozone hit external demand, as the central bank maintained rates at 0.05%. GDP data showed that the country finally exited recession in the second quarter of 2013, the same time as the Eurozone bloc.
It was a challenging year for emerging Latin American markets as a decline in global commodities prices, notably precious metals gold and silver, and currency weakness hampered a number of regional markets. Peru (-30.45%), the Index’s worst performing market, succumbed to sizeable losses as a result of the economy’s metals and mining bias. Neighbouring country Chile (-20.45%), was another laggard, with a 7.20% decline in copper prices and the outlook for higher global interest rates hampering performance. Brazil (-16.71%) also underperformed as GDP growth in Latin America’s largest economy slowed to just 0.6% quarter over quarter in the first quarter of 2013 and the central bank’s rate cutting cycle was reversed in an effort to offset above target inflation. The central bank also intervened in the currency market as it sought to prop up the real and reduce inflation. In addition the tax on financial operations on foreign investments in fixed income markets (“IOF”) was also scrapped in a further attempt to support the currency. Social unrest in June, sparked by a planned increase in bus fares, further increased negative sentiment towards the country. However, a reversal of fare rises and President Rouseff’s spending and reform pledges helped to calm the demonstrations and restore some confidence in financial markets. The central bank’s moderate success in cooling inflation, combined with a strong upside surprise in second quarter GDP growth data helped the local market recoup some losses. In the last couple of months of the fiscal year, Brazilian equities fell again as macro fundamentals remained challenging and numbers showed that GDP growth slowed to 2.2% year over year in the third quarter. The central bank hiked rates twice in the fourth quarter taking the headline rate to 10% as it continued to fight high inflation. Mexico (+1.20%) was the only regional market to finish in positive territory, boosted by the election of Enrique Peña Nieto as president with a reformist agenda.
Asian markets in general performed well, with the larger Index countries of Taiwan (+11.71%), China (+10.81%) and South Korea (+4.10%) all outperforming. Despite some concern over the Chinese market, the underlying macroeconomic data remained relatively firm and GDP growth, whilst slower, remained at relatively high levels when contrasted with other developed and emerging countries and was in line with the government’s target on a year over year basis. The new government has also been proactive in managing the economy and took steps to limit property price rises in some cities. In addition, the government’s investment in industries such as telecommunications services was also a catalyst for positive returns. The market advanced further in the fourth quarter primarily boosted by a raft of reforms announced at the Third Plenary Session of the 18th Congress. South Korea performed well as GDP growth improved during the year. Efforts from policymakers to stimulate the economy appeared to be successful, in particular the central bank’s decision to cut rates to 2.5% and the government’s fiscal and monetary stimulus. Taiwan advanced with the country’s export sector recording strong acceleration in the first half of the year. Smaller Index countries Thailand (-9.45%), the Philippines (-7.09%) and Indonesia (-22.82%) came under pressure in the
8 Market Summary
Russell Investment Funds
Market Summary as of December 31, 2013, continued — (Unaudited)
second half of the year. Thailand was hit by anti-government protests while Indonesia was acutely impacted by concerns over its burgeoning current account deficit which sparked a major sell-off in the equity market and the rupiah. India (-5.14%) also underperformed with the central bank forced to maintain higher interest rates amid high inflation and in the face of sluggish GDP growth. The rupee also came under pressure and hit an all time low against the U.S. dollar during the period, with investors increasingly concerned about the country’s twin deficit (fiscal and current account). In the last quarter of the fiscal year, however, Indian equities rebounded strongly, boosted by a 3.8% drop in the price of oil, which may be perceived as helping to reduce inflation, and a GDP reading which showed the economy had grown 4.8% year over year.
At the sector level, the pro-cyclical sectors of technology (+17.68%) and consumer discretionary (+8.00%) registered some of the strongest returns. The health care sector, which advanced 14.41%, also performed strongly with Chinese bio-tech companies in particular faring well, supported by the government’s announcement that it planned to double the size of the industry as a percentage of GDP by 2015. Materials and processing (-12.64%) was the worst-performing sector, primarily due to a decline in global commodity prices linked to a slower growth outlook in China. Energy (-8.61%), financial services (-1.63%) and the traditionally more defensive utilities (-0.95%) sector also lagged.
U.S./Global Fixed Income Markets
For the fiscal year ended December 31, 2013, fixed income markets continued to be driven by macroeconomic factors and fiscal policy debates in Washington. Speculation surrounding the timing of the Federal Reserve’s (the “Fed”) tapering of its highly accommodative quantitative easing program was a major driver of volatility in the capital markets this year. Notably, U.S. treasury yields increased dramatically starting in the second half of the fiscal year in anticipation of a Fed tapering in September 2013. However, U.S. treasury yields sharply retracted a portion of prior increases after the Fed surprised markets by not beginning tapering in September. Three months later in December, the Fed finally announced the beginning of a modest taper to begin in January 2014, causing the 10-year U.S. treasury yields to end the year at 3.04%. Aside from the U.S. treasury market, currency and credit markets also experienced heightened volatility over Fed tapering speculations throughout the year.
At the beginning of the fiscal year, Congress reassured financial markets following the previous months of uncertainty regarding the government shutdown and debt ceiling debates that began in October 2012 by passing a continuing resolution on January 1st that diverted any material consequences in the short term by raising income, payroll, and capital gains taxes, and delaying spending cuts. Similarly on January 23rd, the “No Budget, No Pay Act” was passed, allowing the Treasury to borrow money until mid-May, defusing the debt ceiling threat for several months. Beginning in February, negative announcements from the U.S. and euro zone regarding slowed economic growth supported demand for safe-haven U.S. treasuries, resulting in a relative underperformance from non-treasury sectors. On February 26th, the Italian election reached a stalemate and the vote in the general election returned a three to two vote against the austerity policy, grinding both spending cuts and tax rises to a halt. Fears that the end of these austerity measures in Italy would lengthen its recession and potentially spill over into the rest of the euro zone quickly spread market volatility to Germany, France, and the U.K. In Cyprus, an agreement with the group of euro zone finance ministers was reached in late March to help restructure its financial sector along with a €10 billion euro bailout package to escape a financial meltdown. The terms of the agreement however, imposed strict capital controls in order to prevent a run on the banks, losses on bank depositors, and mandatory downsizing of the Cypriot banking sector, costing thousands of jobs. In the U.S., on February 28th, Capitol Hill failed to
Market Summary 9
Russell Investment Funds
Market Summary as of December 31, 2013, continued — (Unaudited)
reach a last-minute compromise before the budget sequestration deadline and the $85 billion across-the-board spending cuts went into effect on March 1st. The combined impact of both the automatic spending cuts and the downbeat European data led to a rally in U.S. treasuries in a flight to quality, with the 10-year U.S. treasury yields falling from 2.04% at the start of February to 1.87% by the end of March. In April, Bank of Japan’s new Governor, Haruhiko Kuroda, announced an open-ended quantitative easing program to inject approximately $1.4 trillion USD into the economy in less than two years to support economic activity by keeping the Japanese yen weak and boosting financial markets. As a result of the announcement, the Japanese yen fell more than 3% against the U.S. dollar and the Japanese 10-year government bond yield hit a record low of 0.44% on October 4th. Monetary policy in the U.S. remained unchanged and the Fed cited that although the housing industry and household spending data showed signs of improvement, the unemployment rate remained elevated and fiscal policy restraints were hindering economic growth. Fed Chairman Ben Bernanke even suggested that the Fed may increase purchase amounts of longer-dated U.S. treasuries and agency mortgage-backed securities within quantitative easing three (“QE3”). As a result of continued Fed easing, U.S. treasury rates fell and the yield curve flattened overall in April. From February to April 2013, the Barclays Investment Grade Corporate Index and the Barclays High Yield Corporate Index were the strongest performers, outperforming similar duration treasuries by 0.42% and 2.18%, respectively. The Barclays Tax-Exempt Municipal Bonds 1-10 Year Blend gained a total return of 0.33%, -0.23%, and 0.89% for February, March and April, respectively.
Markets in May to August 2013 were dominated by announcements from the Fed, driving U.S. treasury yields higher. On May 22nd, Bernanke announced that Fed officials were considering the policy option of tapering the current quantitative easing program, despite his warning that “premature tightening of the monetary policy…carries a substantial risk of slowing or ending the economic recovery and causing inflation to fall further”. The 10-year treasury yield started May at 1.66% and rose to 2.13% by the end of the month. Bernanke further stated on June 19th that the tapering could take place later in 2013, continuing to bolster the rise in yields. The global backdrop remained negative as the European recession reached a new low, notably with the high jobless rate among youth at 24.4% for the month of April. With 19.4 million unemployed across Europe, officials in the European Commission called on European Union member states to focus on boosting competitiveness and bringing down unemployment. They loosened austerity measures on six countries, including France, in order to give them more time to meet budget deficit targets. These concerns, amidst mixed U.S. economic indicators, caused credit sectors within the Barclays U.S. Aggregate Index to post negative to modest excess returns over equivalent duration U.S. treasuries in May. Agency MBS performance was bifurcated depending on the coupon of the security. Higher coupon (4% coupon and higher) mortgages outperformed similar duration treasuries, while lower coupon (below 4% coupon) mortgages, most heavily supported by Fed quantitative easing purchases, underperformed. High yield corporate bonds, as represented by the Barclays High Yield Corporate Index, returned 0.60% excess of similar duration treasuries in May. Municipal bonds took a hit after Detroit filed for bankruptcy on July 18th, reversing some of the inflows municipal bonds had been seeing over the previous few months. July and August continued to be dominated by the Fed, despite no new release of information regarding a taper schedule other than re-emphasizing that it would depend on the economic indicators given earlier of 2.5% inflation and 6.5% unemployment. Again, higher coupon agency MBS was one of the largest outperformers of similar duration U.S. treasuries for the month of August. The 10-year U.S. treasury yield gained over 1% from May to August, having ended August at 2.78% compared to the beginning of May at 1.66%.
10 Market Summary
Russell Investment Funds
Market Summary as of December 31, 2013, continued — (Unaudited)
A turning point in U.S. treasury yields occurred on September 18th when the Fed announced that it would not be tapering but maintaining its pace of $85 billion in monthly bond purchases. The yield on the 10-year U.S. treasury plunged 17 basis points that day following the Fed decision, partially reversing the uptrend in rates over the past four months that persisted in anticipation of a taper. The Fed’s taper decision was generally supportive of the fixed income market as a decrease in treasury yields and tightening of credit spreads support positive nominal returns. Despite a volatile year, investor demand for credit appeared to be robust as evidenced by oversubscription of Verizon’s $49 billion bond offering in September, the largest corporate bond sale to date. Heading into October, focus shifted from the Fed to Congress as they failed to enact a continuing resolution to appropriate funds for the fiscal year 2014 on October 1st. The government entered a shutdown, indefinitely furloughing approximately 800,000 federal employees. Markets reacted minimally to the government shutdown as the cause for real concern was the debt ceiling deadline on October 17th, which if not raised, would not allow the Treasury to issue any new debt. Although the Treasury would not effectively default on its debt on the 17th, the Treasury would likely default on its debt in late October to early November when the revenue inflows would be insufficient to cover the expenditures. Consequently, 1-month treasury bill yields spiked from a yield of 0.02% as of September month end to almost 0.35% on October 15th as investors demanded higher yields to compensate for default risk. The impact of default on financial markets would likely have been catastrophic, as treasuries have historically been considered by investors as risk-free. As the debt ceiling deadline approached, rates rose modestly on uncertainty over whether or not a deal would be struck in time before the 17th. The 10-year treasury yields rose to 2.75% on the 15th, just before falling back down to 2.69% on the 16th and 2.61% on the 17th as it became clear that Congress would pass a last-minute deal. On the 17th, Congress passed the Continuing Appropriations Act of 2014 ending the government shutdown and suspending the debt limit until February 7, 2014. On October 22nd, September nonfarm payroll data was released showing that the economy only added 148,000 nonfarm jobs, compared to expectations of 180,000. On news of the weak employment data, markets responded positively on expectations that the Fed will be less likely to taper when labor markets remained weak. The 10-year U.S. treasury yield fell 9 basis points to 2.51%, the lowest since July 2013, while the European periphery bond yields, notably Spain and Italy’s, fell to new lows as well, boosting demand for higher-yielding assets. The culmination of the various developments over September and October was highly supportive of risk assets. The Barclays Investment Grade Corporate Index, Barclays High Yield Corporate Index, and the Barclays Emerging Market Debt Index outperformed similar duration U.S. treasuries in October by 0.83%, 2.07%, and 1.52%, respectively.
November saw the release of strong positive U.S. economic data, raising anticipation that the Fed would begin to taper the asset purchase program sooner than expected. U.S. employers added 203,000 jobs to nonfarm payrolls in November, compared to the predicted 185,000 increase, while the unemployment rate dropped to 7%, a five-year low. Consumer spending also improved as retail sales climbed the most in five months with a 0.7% gain in November, following a 0.6% gain in October. Additionally the U.S. GDP for the third quarter increased 3.6% at an annualized rate, compared to estimations of 2.8%, the strongest since the first quarter of 2012. Housing prices also rose with a 13.3% year-over-year growth for September, the biggest gain since February 2006 according to the Case-Shiller index. Following the economic data indicating stronger financial stability, the 10-year treasury yields gained 24 basis points from the beginning of November to the December Fed meeting on the 18th in anticipation of a coming taper. Treasury markets were correct in their speculation as the Fed officially announced on December 18th that it would be trimming its monthly bond purchases by $10 billion to $75 billion beginning in January 2014. Bernanke
Market Summary 11
Russell Investment Funds
Market Summary as of December 31, 2013, continued — (Unaudited)
cited the improved outlook in the job market as a deciding factor in the modest reduction of its bond buying program. With the Fed’s strong commitment to maintain an accommodative policy and keep the federal funds rate low “well past the time that the unemployment rate declines below 6.5%, especially if projected inflation continues to run below” the Fed’s 2% target, stocks rallied, while 10-year treasuries pared losses with yields rising six basis points to 2.89% after climbing as much as nine basis points. Continuing through the rest of December following the Federal Open Market Committee meeting, the 10-year treasury yield climbed 13 basis points to 3.02%, its highest level in more than two years in anticipation of fewer bond purchases in the coming months. The strongest performers for the month of December were riskier assets, such as investment grade, high yield, and emerging markets debt. The Barclays Investment Grade Index, Barclays High Yield Corporate Index, and the Barclays Emerging Market Debt Index outperformed U.S. treasuries of similar duration by 0.92%, 1.28%, and 1.63%, respectively. U.S. 2-year interest rate swap spreads, a measure of debt market stress, narrowed to a 20-year low of 8.5% on November 26th indicating that investors were favoring riskier assets over government securities. The Barclays Tax-Exempt Municipal Bonds 1-10 Year Blend returned a total return of -0.18% in the month of December following the largest wave of withdrawals from municipal bond mutual funds since August and as yields on city and state debt hit a three-month high mid-December. Growing concerns over higher interest rates in 2014, coupled with the largest number of municipal bond issuances since 2010, helped drive yields higher.
12 Market Summary
(This page intentionally left blank)
Russell Investment Funds Multi-Style Equity Fund
Portfolio Management Discussion and Analysis — December 31, 2013 (Unaudited)

| Multi-Style Equity Fund | | | Russell 1000 ® Index *** | |
| | Total | | | Total |
| | Return | | | Return |
| 1 Year | 32 . 92% | | 1 Year | 33 . 11% |
| 5 Years | 18 . 30%§ | | 5 Years | 18 . 59%§ |
| 10 Years | 7 . 27%§ | | 10 Years | 7 . 78%§ |
14 Multi-Style Equity Fund
Russell Investment Funds
Multi-Style Equity Fund
Portfolio Management Discussion and Analysis, continued — December 31, 2013 (Unaudited)
| The Multi-Style Equity Fund (the “Fund”) employs a multi- | | However, the Fund had a benchmark relative overweight to the |
| manager approach whereby portions of the Fund are allocated to | | healthcare sector, which was the one broad non-cyclical sector |
| different money managers. Fund assets not allocated to money | | that outperformed for the fiscal year. As a result, sector allocation |
| managers are managed by Russell Investment Management | | decisions, specifically an underweight to the utilities sector and |
| Company (“RIMCo”), the Fund’s advisor. RIMCo may change | | overweight to the health care sector, were beneficial. |
| the allocation of the Fund’s assets among money managers at | | |
| any time. An exemptive order from the Securities and Exchange | | How did the investment strategies and techniques employed |
| Commission (“SEC”) permits RIMCo to engage or terminate a | | by the Fund and its money managers affect its benchmark |
| money manager at any time, subject to approval by the Fund’s | | relative performance? |
| Board, without a shareholder vote. Pursuant to the terms of the | | Stock selection within the health care sector detracted, although |
| exemptive order, the Fund is required to notify its shareholders | | stock selection within the financial services sector contributed |
| within 90 days of when a money manager begins providing | | positively to benchmark-relative performance. As of December |
| services. As of December 31, 2013, the Fund had seven money | | 31, 2013, the Fund had seven money managers. Four of the seven |
| managers. | | managers outperformed their respective benchmarks for the fiscal |
| | | year. |
| What is the Fund’s investment objective? | | |
| The Fund seeks to provide long term capital growth. | | Columbus Circle Investors (“Columbus Circle”) outperformed the |
| | | Russell 1000® Growth Index for the fiscal year. Many of Columbus |
| How did the Fund perform relative to its benchmark for the | | Circle’s portfolio exposures were rewarded, specifically tilts |
| fiscal year ended December 31, 2013? | | toward stocks with high beta, high growth rates, rising earnings |
| For the fiscal year ended December 31, 2013, the Fund gained | | estimates, and positive price momentum. Sector underweights to |
| 32.92%. This is compared to the Fund’s benchmark, the Russell | | consumer staples and technology were beneficial. An overweight |
| 1000 ® Index, which gained 33.11% during the same period. The | | to health care and stock selection within the sector (overweights to |
| Fund’s performance includes operating expenses, whereas index | | Gilead Sciences, Inc and Valeant Pharmaceuticals International, |
| returns are unmanaged and do not include expenses of any kind. | | Inc) contributed to positive benchmark-relative performance. |
| For the fiscal year ended December 31, 2013, the Lipper® Large- | | Sustainable Growth Advisers, LP (“Sustainable”) underperformed |
| Cap Core Funds Average, a group of funds that Lipper considers | | the Russell 1000 ® Growth Index for the fiscal year. Sector |
| to have investment strategies similar to those of the Fund, gained | | underweights to consumer staples and technology were beneficial. |
| 31.65%. This result serves as a peer comparison and is expressed | | However, stock selection within the health care sector (an |
| net of operating expenses. | | overweight to Intuitive Surgical, Inc), the consumer discretionary |
| | | sector (overweights to eBay, Inc and YUM! Brands, Inc) and the |
| RIMCo may assign a money manager a specific style or | | consumer staples sector (an overweight to Ambev SA) detracted |
| capitalization benchmark other than the Fund’s index. However, | | from benchmark-relative performance. |
| the Fund’s primary index remains the benchmark for the Fund | | |
| and is representative of the aggregate of each money manager’s | | Suffolk Capital Management, LLC (“Suffolk”) outperformed |
| benchmark index. | | the Russell 1000 ® Index for the fiscal year. Many of Suffolk’s |
| | | portfolio exposures were rewarded, specifically tilts toward stocks |
| How did the market conditions described in the Market | | with high beta, lower dividend yields, high growth rates and high |
| Summary report affect the Fund’s performance? | | price momentum. An underweight to the utilities sector and an |
| During the fiscal year, the U. S. large capitalization equity market | | overweight to the consumer discretionary sector were beneficial. |
| produced substantially positive returns. Fund exposures included | | Stock selection within the financial services sector (an overweight |
| benchmark-relative underweights to mega capitalization stocks | | to Prudential Financial, Inc) contributed to positive benchmark- |
| and high dividend yield stocks, including real estate investment | | relative performance. |
| trusts (“REITs”) and utilities. These underweights were beneficial | | Institutional Capital LLC (“ICAP”) underperformed the Russell |
| to Fund performance in this market environment because the | | 1000 ® Value Index for the fiscal year. ICAP’s performance |
| largest capitalization stocks and high dividend yield stocks didn’t | | was partially held back by an underweight to stocks with high |
| keep up with other segments of the Russell 1000® Index during | | |
| | | betas. However, an underweight to stocks with high dividend |
| the rising market. | | yields was beneficial. Stock selection within the materials & |
| With the backdrop of increased confidence in the continuation of | | processing sector (overweights to Barrick Gold Corporation and |
| the economic recovery, the Fund was underweighted in most of | | The Mosaic Company) and stock selection within the health care |
| the sectors that are traditionally considered to be “non-cyclical. ” | | |
Multi-Style Equity Fund 15
Russell Investment Funds
Multi-Style Equity Fund
Portfolio Management Discussion and Analysis, continued — December 31, 2013 (Unaudited)
| sector (an overweight to Baxter International, Inc) detracted from | | market environment of this fiscal year, low beta stocks (stocks |
| benchmark-relative performance. | | with low sensitivity to market movements) produced lower returns |
| Jacobs Levy Equity Management, Inc. (“Jacobs Levy”) | | than high beta stocks (stocks with high sensitivity to market |
| outperformed the Russell 1000 ® Value Index for the fiscal | | movements), which was reflected in the investment returns of this |
| year. Jacob’s underweight to stocks with high dividend yields | | strategy. | | |
| and overweights to stocks with positive earnings surprises | | During the period, RIMCo used index futures contracts to |
| were beneficial. An overweight to the technology sector and an | | equitize the money manager’s cash. The futures contracts |
| underweight to the materials & processing sector were rewarded | | included consumer staples sector futures and this helped provide |
| within the large cap value space. Stock selection within the | | exposure to a low beta, low volatility sector while exposing the |
| financial services sector (an overweight to MetLife, Inc) was a | | Fund’s cash to equity-like returns. The use of these derivatives |
| contributor to positive benchmark relative performance. | | provided performance in line with expectations and the decision |
| DePrince, Race & Zollo, Inc. (“DePrince”) slightly outperformed | | to equitize manager cash was beneficial to Fund performance for |
| the Russell 1000® Value Index during the fiscal year. DePrince’s | | the fiscal year. | | |
| underweight to stocks with high dividend yields and overweight | | | | |
| to stocks with high beta were beneficial. However, an underweight | | | | |
| to stocks with high price momentum detracted. From a sector | | Describe any changes to the Fund’s structure or the money |
| perspective, an underweight to utilities and an overweight to | | manager line-up. | | |
| technology were rewarded within the large cap value space. Stock | | There were no changes to the money manager lineup during the |
| selection within the materials & processing sector (overweights | | fiscal year. | | |
| to Sealed Air Corporation and E. I. du Pont de Nemours and | | Money Managers as of December 31, | | |
| Company) was beneficial to benchmark-relative performance. | | 2013 | | Styles |
| Mar Vista Investment Partners, LLC (“Mar Vista”) underperformed | | Columbus Circle Investors | | Growth |
| the Russell 1000® Index slightly for the fiscal year. Mar Vista’s | | DePrince, Race & Zollo, Inc. | | Value |
| tilt toward low beta stocks detracted from benchmark-relative | | Suffolk Capital Management LLC | | Market-Oriented |
| performance. However, an underweight to stocks with high | | Institutional Capital Management LLC | | Value |
| | | Mar Vista Investment Partners, LLC | | Market-Oriented |
| dividend yields was beneficial. An underweight to the utilities | | Sustainable Growth Advisers, LP | | Growth |
| sector was also beneficial. Stock selection within the technology | | Jacobs Levy Equity Management, Inc. | | Value |
| sector (overweights to EMC Corporation and Oracle Corporation) | | The views expressed in this report reflect those of the |
| detracted. | | portfolio managers only through the end of the period |
| RIMCo manages the portion of the Fund’s assets that RIMCo | | covered by the report. These views do not necessarily |
| determines not to allocate to the money managers. Assets not | | represent the views of RIMCo or any other person in RIMCo |
| allocated to managers include the Fund’s liquidity reserves and | | or any other affiliated organization. These views are |
| assets which may be managed directly by RIMCo to modify the | | subject to change at any time based upon market conditions |
| Fund’s overall portfolio characteristics to seek to achieve the | | or other events, and RIMCo disclaims any responsibility to |
| desired risk/return profile for the Fund. | | update the views contained herein. These views should not |
| | | be relied on as investment advice and, because investment |
| RIMCo pursues an investment strategy for the Fund that is a | | decisions for a Russell Investment Funds (“RIF”) Fund are |
| replication of the Russell Top 200® Defensive™ Index. This | | based on numerous factors, should not be relied on as an |
| strategy performed in-line with expectations, as it reduced the | | indication of investment decisions of any RIF Fund. |
| Fund’s beta and smoothed the Fund’s return pattern. During the | | | | |
| * | Assumes initial investment on January 1, 2004. |
| ** | The Russell 1000® Index includes the 1,000 largest companies in the Russell 3000® Index. The Russell 1000® Index represents the universe of stocks from which most active money managers typically select. The Russell 1000® Index return reflects adjustments from income dividends and capital gain distributions reinvested as of the ex-dividend dates. |
| § | Annualized. |
The performance shown in this section does not reflect any Insurance Company Separate Account or Policy Charges. Performance is historical and assumes reinvestment of all dividends and capital gains. Investment return and principal value will fluctuate so that an investor’s shares, when redeemed, may be worth more or less than when purchased. Past performance is not indicative of future results.
16 Multi-Style Equity Fund
Russell Investment Funds
Multi-Style Equity Fund
Shareholder Expense Example — December 31, 2013 (Unaudited)
| Fund Expenses | | Please note that the expenses shown in the table are meant |
| The following disclosure provides important information | | to highlight your ongoing costs only and do not reflect any |
| regarding the Fund’s Shareholder Expense Example | | transactional costs. Therefore, the information under the heading |
| (“Example”) . | | “Hypothetical Performance (5% return before expenses)” is |
| | | useful in comparing ongoing costs only, and will not help you |
| Example | | determine the relative total costs of owning different funds. In |
| As a shareholder of the Fund, you incur two types of costs: (1) | | addition, if these transactional costs were included, your costs |
| transaction costs, and (2) ongoing costs, including advisory and | | would have been higher. The fees and expenses shown in this |
| administrative fees and other Fund expenses. The Example is | | section do not reflect any Insurance Company Separate Account |
| intended to help you understand your ongoing costs (in dollars) | | or Policy Charges. | | | | | | | | | | | | |
| of investing in the Fund and to compare these costs with the | | | | | | | | | | | | |
| ongoing costs of investing in other mutual funds. The Example | | | | | | | | Actual | | | | Hypothetical |
| is based on an investment of $1,000 invested at the beginning of | | | | | | | | Performance | | | | Performance (5%expenses) |
| the period and held for the entire period indicated, which for this | | | | | | | | | | | | |
| | | Beginning Account Value | | | | | | | | | | | | |
| Fund is from July 1, 2013 to December 31, 2013. | | July 1, 2013 | | | | $ | | 1,000.00 | | | | $ | | 1,000.00 |
| Actual Expenses | | Ending Account Value | | | | | | | | | | | | |
| | | December 31, 2013 | | | | $ | | 1,168.50 | | | | $ | | 1,020.97 |
| The information in the table under the heading “Actual | | Expenses Paid During Period* | | | | $ | | 4.59 | | | | $ | | 4.28 |
| Performance” provides information about actual account values | | | | | | | | | | | | | | |
| and actual expenses. You may use the information in this column, | | * Expenses are equal to the Fund's annualized expense ratio of 0.84% |
| | | (representing the six month period annualized), multiplied by the average |
| together with the amount you invested, to estimate the expenses | | account value over the period, multiplied by 184/365 (to refÿÿlect the one-half |
| that you paid over the period. Simply divide your account value by | | year period) . | | | | | | | | | | | | |
| $1,000 (for example, an $8,600 account value divided by $1,000 | | | | | | | | | | | | | | |
| = 8.6), then multiply the result by the number in the first column | | | | | | | | | | | | | | |
| in the row entitled “Expenses Paid During Period” to estimate | | | | | | | | | | | | | | |
| the expenses you paid on your account during this period. | | | | | | | | | | | | | | |
| |
| Hypothetical Example for Comparison Purposes | | | | | | | | | | | | | | |
| The information in the table under the heading “Hypothetical | | | | | | | | | | | | | | |
| Performance (5% return before expenses)” provides information | | | | | | | | | | | | | | |
| about hypothetical account values and hypothetical expenses | | | | | | | | | | | | | | |
| based on the Fund’s actual expense ratio and an assumed rate of | | | | | | | | | | | | | | |
| return of 5% per year before expenses, which is not the Fund’s | | | | | | | | | | | | | | |
| actual return. The hypothetical account values and expenses | | | | | | | | | | | | | | |
| may not be used to estimate the actual ending account balance or | | | | | | | | | | | | | | |
| expenses you paid for the period. You may use this information | | | | | | | | | | | | | | |
| to compare the ongoing costs of investing in the Fund and other | | | | | | | | | | | | | | |
| funds. To do so, compare this 5% hypothetical example with the | | | | | | | | | | | | | | |
| 5% hypothetical examples that appear in the shareholder reports | | | | | | | | | | | | | | |
| of other funds. | | | | | | | | | | | | | | |
Multi-Style Equity Fund 17
Russell Investment Funds
Multi-Style Equity Fund
Schedule of Investments — December 31, 2013
| Amounts in thousands (except share amounts) | | | | Amounts in thousands (except share amounts) | | |
| |
| | | | | Principal | | Fair | | | | | | Principal | | Fair |
| | | | | Amount ($) | | Value | | | | | | Amount ($) | | Value |
| | | | | or Shares | | $ | | | | | | or Shares | | $ |
| |
| Common Stocks - 94.7% | | | | | | | | Consumer Staples - 4.5% | | | | | | |
| Consumer Discretionary - 14.4% | | | | | | | | Altria Group, Inc. | | | | 5,814 | | 223 |
| Abercrombie & Fitch Co. Class A(Ñ) | | | | 20,200 | | 665 | | Andersons, Inc. (The) | | | | 2,500 | | 223 |
| Amazon. com, Inc. (Æ) | | | | 4,433 | | 1,768 | | Anheuser-Busch InBev NV - ADR | | | | 12,700 | | 1,352 |
| American Eagle Outfitters, Inc. | | | | 63,000 | | 907 | | Archer-Daniels-Midland Co. | | | | 10,600 | | 460 |
| CBS Corp. Class B | | | | 8,500 | | 542 | | Bunge, Ltd. | | | | 9,000 | | 739 |
| Children's Place Retail Stores, Inc. (The)(Æ) | | 4,400 | | 251 | | Coca-Cola Co. (The) | | | | 49,362 | | 2,039 |
| Coach, Inc. | | | | 14,600 | | 819 | | Colgate-Palmolive Co. | | | | 35,610 | | 2,321 |
| Comcast Corp. Class A(Æ) | | | | 66,438 | | 3,390 | | Constellation Brands, Inc. Class A(Æ) | | | | 4,600 | | 324 |
| Costco Wholesale Corp. | | | | 1,265 | | 151 | | CVS Caremark Corp. | | | | 30,144 | | 2,157 |
| CST Brands, Inc. | | | | 14,000 | | 514 | | Energizer Holdings, Inc. | | | | 4,500 | | 487 |
| DIRECTV(Æ) | | | | 972 | | 67 | | General Mills, Inc. | | | | 1,886 | | 94 |
| DSW, Inc. Class A | | | | 3,400 | | 145 | | Ingredion, Inc. | | | | 8,000 | | 548 |
| eBay, Inc. (Æ) | | | | 45,640 | | 2,505 | | Kellogg Co. | | | | 9,947 | | 608 |
| Estee Lauder Cos. , Inc. (The) Class A | | | | 10,447 | | 787 | | Kimberly-Clark Corp. | | | | 1,113 | | 116 |
| Finish Line, Inc. (The) Class A | | | | 2,400 | | 68 | | Molson Coors Brewing Co. Class B | | | | 10,500 | | 590 |
| Foot Locker, Inc. | | | | 22,400 | | 928 | | Mondelez International, Inc. Class A | | | | 52,133 | | 1,840 |
| Ford Motor Co. | | | | 213,950 | | 3,301 | | PepsiCo, Inc. | | | | 22,580 | | 1,873 |
| GameStop Corp. Class A | | | | 2,700 | | 133 | | Philip Morris International, Inc. | | | | 13,258 | | 1,156 |
| General Motors Co. (Æ) | | | | 73,900 | | 3,020 | | Procter & Gamble Co. (The) | | | | 44,967 | | 3,661 |
| Guess?, Inc. (Ñ) | | | | 25,200 | | 783 | | Reynolds American, Inc. | | | | 894 | | 45 |
| Hanesbrands, Inc. | | | | 9,400 | | 661 | | Safeway, Inc. | | | | 13,800 | | 449 |
| Harman International Industries, Inc. | | | | 7,900 | | 647 | | Sysco Corp. | | | | 1,709 | | 62 |
| Hertz Global Holdings, Inc. (Æ) | | | | 42,787 | | 1,225 | | Walgreen Co. | | | | 1,428 | | 82 |
| Home Depot, Inc. | | | | 15,679 | | 1,291 | | | | | | | | 21,449 |
| Hyatt Hotels Corp. Class A(Æ) | | | | 5,300 | | 262 | | | | | | | | |
| Jack in the Box, Inc. (Æ) | | | | 8,000 | | 400 | | Energy - 10.4% | | | | | | |
| Johnson Controls, Inc. | | | | 62,791 | | 3,221 | | Anadarko Petroleum Corp. | | | | 12,500 | | 992 |
| Kohl's Corp. | | | | 13,600 | | 772 | | Atwood Oceanics, Inc. (Æ) | | | | 2,500 | | 133 |
| Las Vegas Sands Corp. | | | | 24,405 | | 1,924 | | Baker Hughes, Inc. | | | | 1,900 | | 105 |
| Liberty Global PLC(Æ) | | | | 13,656 | | 1,151 | | Chesapeake Energy Corp. | | | | 22,200 | | 603 |
| Liberty Media Corp. Class A(Æ) | | | | 5,530 | | 810 | | Chevron Corp. | | | | 30,888 | | 3,857 |
| Lowe's Cos. , Inc. | | | | 46,850 | | 2,321 | | Cimarex Energy Co. | | | | 5,800 | | 608 |
| Macy's, Inc. | | | | 32,800 | | 1,751 | | ConocoPhillips | | | | 2,913 | | 206 |
| McDonald's Corp. | | | | 8,200 | | 795 | | Diamond Offshore Drilling, Inc. (Ñ) | | | | 9,800 | | 558 |
| Michael Kors Holdings, Ltd. (Æ) | | | | 9,802 | | 796 | | EOG Resources, Inc. | | | | 2,690 | | 451 |
| Nike, Inc. Class B | | | | 40,042 | | 3,150 | | EQT Corp. | | | | 3,900 | | 350 |
| Nordstrom, Inc. | | | | 8,350 | | 516 | | Exxon Mobil Corp. | | | | 138,409 | | 14,006 |
| Norwegian Cruise Line Holdings, Ltd. (Æ) | | | | 5,900 | | 209 | | Halliburton Co. | | | | 71,720 | | 3,640 |
| priceline. com, Inc. (Æ) | | | | 219 | | 255 | | Kinder Morgan, Inc. | | | | 19,800 | | 713 |
| PVH Corp. | | | | 5,310 | | 722 | | Marathon Oil Corp. | | | | 111,541 | | 3,937 |
| Royal Caribbean Cruises, Ltd. | | | | 8,100 | | 384 | | Marathon Petroleum Corp. | | | | 6,377 | | 585 |
| Signet Jewelers, Ltd. | | | | 4,500 | | 354 | | Murphy Oil Corp. | | | | 21,100 | | 1,369 |
| Sirius XM Holdings, Inc. (Æ) | | | | 102,500 | | 358 | | National Oilwell Varco, Inc. | | | | 22,817 | | 1,815 |
| Starbucks Corp. | | | | 49,250 | | 3,861 | | Noble Energy, Inc. | | | | 18,896 | | 1,287 |
| Starwood Hotels & Resorts Worldwide, Inc. | | | | 21,940 | | 1,743 | | Occidental Petroleum Corp. | | | | 35,559 | | 3,382 |
| Target Corp. | | | | 1,856 | | 117 | | Pioneer Natural Resources Co. | | | | 8,452 | | 1,556 |
| Tiffany & Co. | | | | 11,990 | | 1,112 | | Precision Drilling Corp. (Æ) | | | | 51,400 | | 482 |
| Time Warner, Inc. | | | | 69,640 | | 4,856 | | Rowan Companies PLC(Æ) | | | | 19,100 | | 675 |
| TiVo, Inc. (Æ) | | | | 12,700 | | 167 | | Schlumberger, Ltd. | | | | 45,714 | | 4,120 |
| TJX Cos. , Inc. | | | | 2,079 | | 132 | | Southwestern Energy Co. (Æ) | | | | 37,700 | | 1,483 |
| Viacom, Inc. Class B | | | | 32,804 | | 2,866 | | Spectra Energy Corp. | | | | 1,924 | | 69 |
| Wal-Mart Stores, Inc. | | | | 17,181 | | 1,352 | | Statoil ASA - ADR | | | | 32,000 | | 772 |
| Walt Disney Co. (The) | | | | 55,534 | | 4,242 | | Total SA - ADR | | | | 7,900 | | 484 |
| Whirlpool Corp. | | | | 5,702 | | 895 | | Transocean, Ltd. (Ñ) | | | | 16,300 | | 806 |
| Yum! Brands, Inc. | | | | 30,916 | | 2,338 | | Whiting Petroleum Corp. (Æ) | | | | 9,300 | | 575 |
| | | | | | | 68,400 | | | | | | | | 49,619 |
See accompanying notes which are an integral part of the financial statements.
18 Multi-Style Equity Fund
Russell Investment Funds
Multi-Style Equity Fund
Schedule of Investments, continued — December 31, 2013
| Amounts in thousands (except share amounts) | | | | Amounts in thousands (except share amounts) | | |
| |
| | | | | Principal | | Fair | | | | | | Principal | | Fair |
| | | | | Amount ($) | | Value | | | | | | Amount ($) | | Value |
| | | | | or Shares | | $ | | | | | | or Shares | | $ |
| Financial Services - 17.4% | | | | | | | | Regions Financial Corp. | | | | 14,300 | | 141 |
| ACE, Ltd. | | | | 25,841 | | 2,676 | | Selective Insurance Group, Inc. | | | | 5,300 | | 143 |
| Aflac, Inc. | | | | 9,202 | | 614 | | SLM Corp. | | | | 26,500 | | 696 |
| Allstate Corp. (The) | | | | 27,527 | | 1,501 | | State Street Corp. | | | | 42,980 | | 3,155 |
| American Express Co. | | | | 25,290 | | 2,294 | | SunTrust Banks, Inc. | | | | 44,300 | | 1,631 |
| American International Group, Inc. | | | | 10,500 | | 536 | | SVB Financial Group(Æ)(Ñ) | | | | 1,400 | | 147 |
| American Tower Corp. Class A(ö) | | | | 33,570 | | 2,680 | | Symetra Financial Corp. | | | | 17,400 | | 330 |
| Ameriprise Financial, Inc. | | | | 6,520 | | 750 | | Taubman Centers, Inc. (ö) | | | | 5,800 | | 371 |
| Artisan Partners Asset Management, Inc. | | | | | | | | TCF Financial Corp. | | | | 2,600 | | 42 |
| Class A | | | | 1,200 | | 78 | | Thomson Reuters Corp. | | | | 969 | | 37 |
| Aspen Insurance Holdings, Ltd. | | | | 17,200 | | 711 | | Travelers Cos. , Inc. (The) | | | | 11,601 | | 1,051 |
| Assurant, Inc. | | | | 8,200 | | 544 | | US Bancorp | | | | 15,261 | | 616 |
| Axis Capital Holdings, Ltd. | | | | 15,500 | | 737 | | Valley National Bancorp(Ñ) | | | | 26,836 | | 272 |
| Bank of America Corp. | | | | 191,000 | | 2,974 | | Visa, Inc. Class A | | | | 21,143 | | 4,708 |
| Bank of New York Mellon Corp. (The) | | | | 24,400 | | 853 | | Wells Fargo & Co. | | | | 52,800 | | 2,397 |
| BB&T Corp. | | | | 30,900 | | 1,153 | | XL Group PLC Class A | | | | 17,600 | | 560 |
| Berkshire Hathaway, Inc. Class B(Æ) | | | | 27,163 | | 3,220 | | | | | | | | 82,479 |
| BlackRock, Inc. Class A | | | | 44 | | 14 | | | | | | | | |
| BOK Financial Corp. | | | | 2,030 | | 135 | | Health Care - 13.9% | | | | | | |
| Brown & Brown, Inc. | | | | 12,600 | | 396 | | Abbott Laboratories | | | | 38,903 | | 1,492 |
| Capital One Financial Corp. | | | | 39,500 | | 3,026 | | AbbVie, Inc. | | | | 10,000 | | 528 |
| Chubb Corp. (The) | | | | 10,262 | | 992 | | Actavis PLC(Æ) | | | | 6,000 | | 1,008 |
| CIT Group, Inc. | | | | 11,100 | | 579 | | Aetna, Inc. | | | | 12,900 | | 885 |
| Citigroup, Inc. | | | | 68,300 | | 3,559 | | Allergan, Inc. | | | | 17,170 | | 1,907 |
| CME Group, Inc. Class A | | | | 6,100 | | 479 | | Amgen, Inc. | | | | 1,542 | | 176 |
| Comerica, Inc. | | | | 21,300 | | 1,013 | | Baxter International, Inc. | | | | 69,851 | | 4,858 |
| Cullen/Frost Bankers, Inc. (Ñ) | | | | 7,100 | | 528 | | Becton Dickinson and Co. | | | | 552 | | 61 |
| DCT Industrial Trust, Inc. (ö) | | | | 34,500 | | 246 | | Biogen Idec, Inc. (Æ) | | | | 7,122 | | 1,991 |
| Discover Financial Services | | | | 31,787 | | 1,779 | | Bio-Rad Laboratories, Inc. Class A(Æ) | | | | 2,370 | | 293 |
| Douglas Emmett, Inc. (ö) | | | | 8,400 | | 196 | | Boston Scientific Corp. (Æ) | | | | 38,400 | | 462 |
| Extra Space Storage, Inc. (ö) | | | | 11,500 | | 484 | | Bristol-Myers Squibb Co. | | | | 9,642 | | 513 |
| FleetCor Technologies, Inc. (Æ) | | | | 5,113 | | 599 | | Cardinal Health, Inc. | | | | 4,800 | | 321 |
| Fotex Holding SE(Æ) | | | | 41,627 | | 1,464 | | Celgene Corp. (Æ) | | | | 3,921 | | 663 |
| Franklin Resources, Inc. | | | | 1,092 | | 63 | | Cerner Corp. (Æ) | | | | 29,400 | | 1,639 |
| Hanover Insurance Group, Inc. (The) | | | | 10,300 | | 615 | | Covidien PLC | | | | 42,503 | | 2,894 |
| Hartford Financial Services Group, Inc. | | | | 19,300 | | 699 | | Eli Lilly & Co. | | | | 24,864 | | 1,268 |
| JPMorgan Chase & Co. | | | | 121,150 | | 7,084 | | Forest Laboratories, Inc. (Æ) | | | | 20,800 | | 1,249 |
| Lincoln National Corp. | | | | 14,033 | | 724 | | Gilead Sciences, Inc. (Æ) | | | | 36,109 | | 2,713 |
| Loews Corp. | | | | 663 | | 32 | | Health Net, Inc. (Æ) | | | | 10,500 | | 312 |
| LPL Financial Holdings, Inc. | | | | 4,900 | | 230 | | Humana, Inc. | | | | 6,140 | | 634 |
| M&T Bank Corp. (Ñ) | | | | 4,600 | | 536 | | IDEXX Laboratories, Inc. (Æ) | | | | 7,670 | | 816 |
| Markel Corp. (Æ) | | | | 2,740 | | 1,590 | | Intuitive Surgical, Inc. (Æ) | | | | 36 | | 14 |
| Marsh & McLennan Cos. , Inc. | | | | 1,585 | | 77 | | Johnson & Johnson | | | | 73,164 | | 6,700 |
| MasterCard, Inc. Class A | | | | 2,257 | | 1,886 | | Magellan Health Services, Inc. (Æ) | | | | 5,600 | | 335 |
| Mercury General Corp. | | | | 6,000 | | 298 | | McKesson Corp. | | | | 3,894 | | 628 |
| MetLife, Inc. | | | | 44,679 | | 2,410 | | Medtronic, Inc. | | | | 24,959 | | 1,433 |
| Morgan Stanley | | | | 38,600 | | 1,211 | | Merck & Co. , Inc. | | | | 34,085 | | 1,707 |
| Northern Trust Corp. | | | | 19,700 | | 1,219 | | Mylan, Inc. (Æ) | | | | 16,100 | | 699 |
| Ocwen Financial Corp. (Æ) | | | | 5,200 | | 288 | | Novartis AG - ADR | | | | 16,350 | | 1,314 |
| Old Republic International Corp. | | | | 9,100 | | 157 | | Novo Nordisk A/S - ADR | | | | 5,820 | | 1,075 |
| PartnerRe, Ltd. - ADR | | | | 6,530 | | 688 | | Patterson Cos. , Inc. | | | | 11,100 | | 457 |
| People's United Financial, Inc. | | | | 22,200 | | 336 | | Perrigo Co. PLC(Ñ) | | | | 12,170 | | 1,867 |
| Plum Creek Timber Co. , Inc. (ö) | | | | 12,700 | | 591 | | Pfizer, Inc. | | | | 275,807 | | 8,448 |
| PNC Financial Services Group, Inc. (The) | | | | 60,700 | | 4,708 | | Pharmacyclics, Inc. (Æ) | | | | 7,127 | | 754 |
| PrivateBancorp, Inc. Class A | | | | 2,700 | | 78 | | Regeneron Pharmaceuticals, Inc. (Æ) | | | | 3,857 | | 1,062 |
| Progressive Corp. (The) | | | | 16,800 | | 458 | | Sanofi - ADR(Ñ) | | | | 32,127 | | 1,723 |
| Prudential Financial, Inc. | | | | 29,500 | | 2,721 | | St. Jude Medical, Inc. | | | | 26,725 | | 1,656 |
| Public Storage(ö) | | | | 1,802 | | 271 | | Stryker Corp. | | | | 954 | | 72 |
| Raymond James Financial, Inc. | | | | 7,700 | | 402 | | Teva Pharmaceutical Industries, Ltd. - ADR | | | | 11,850 | | 475 |
See accompanying notes which are an integral part of the financial statements.
Multi-Style Equity Fund 19
Russell Investment Funds
Multi-Style Equity Fund
Schedule of Investments, continued — December 31, 2013
| Amounts in thousands (except share amounts) | | | | Amounts in thousands (except share amounts) | | |
| |
| | | | | Principal | | Fair | | | | | | Principal | | Fair |
| | | | | Amount ($) | | Value | | | | | | Amount ($) | | Value |
| | | | | or Shares | | $ | | | | | | or Shares | | $ |
| Thermo Fisher Scientific, Inc. | | | | 17,751 | | 1,977 | | Illinois Tool Works, Inc. | | | | 1,085 | | 91 |
| UnitedHealth Group, Inc. | | | | 40,720 | | 3,065 | | Itron, Inc. (Æ) | | | | 1,200 | | 50 |
| Valeant Pharmaceuticals International, Inc. | | | | | | | | Jacobs Engineering Group, Inc. (Æ) | | | | 7,200 | | 454 |
| (Æ) | | | | 16,659 | | 1,956 | | L-3 Communications Holdings, Inc. Class 3 | | | | 7,200 | | 769 |
| Vertex Pharmaceuticals, Inc. (Æ) | | | | 8,510 | | 632 | | Lexmark International, Inc. Class A | | | | 19,910 | | 707 |
| WellPoint, Inc. | | | | 13,000 | | 1,201 | | Lockheed Martin Corp. | | | | 762 | | 113 |
| | | | | | | 65,933 | | Manpowergroup, Inc. | | | | 6,200 | | 532 |
| | | | | | | | | Norfolk Southern Corp. | | | | 130 | | 12 |
| Materials and Processing - 5.2% | | | | | | | | Northrop Grumman Corp. | | | | 662 | | 76 |
| Air Products & Chemicals, Inc. | | | | 599 | | 67 | | Orbital Sciences Corp. (Æ) | | | | 5,297 | | 123 |
| Bemis Co. , Inc. | | | | 13,000 | | 532 | | Pentair, Ltd. | | | | 7,839 | | 609 |
| Dow Chemical Co. (The) | | | | 11,900 | | 528 | | Raytheon Co. | | | | 2,250 | | 204 |
| Ecolab, Inc. | | | | 18,519 | | 1,931 | | Regal-Beloit Corp. | | | | 7,200 | | 531 |
| EI du Pont de Nemours & Co. | | | | 14,900 | | 968 | | Ryder System, Inc. | | | | 6,000 | | 443 |
| Fastenal Co. | | | | 36,420 | | 1,730 | | Sensata Technologies Holding NV(Æ) | | | | 27,435 | | 1,064 |
| Freeport-McMoRan Copper & Gold, Inc. | | | | 27,600 | | 1,042 | | Terex Corp. | | | | 14,200 | | 596 |
| Huntsman Corp. | | | | 64,900 | | 1,597 | | Tidewater, Inc. | | | | 22,400 | | 1,328 |
| International Paper Co. | | | | 11,900 | | 583 | | TransDigm Group, Inc. | | | | 9,564 | | 1,540 |
| LyondellBasell Industries Class A | | | | 6,200 | | 498 | | UniFirst Corp. | | | | 1,700 | | 182 |
| Mallinckrodt PLC | | | | 167 | | 9 | | Unilever NV | | | | 24,449 | | 984 |
| Masco Corp. | | | | 31,500 | | 717 | | Union Pacific Corp. | | | | 10,335 | | 1,736 |
| Monsanto Co. | | | | 47,274 | | 5,509 | | United Parcel Service, Inc. Class B | | | | 947 | | 100 |
| Mosaic Co. (The) | | | | 34,250 | | 1,619 | | United Technologies Corp. | | | | 16,592 | | 1,889 |
| MRC Global, Inc. (Æ) | | | | 11,400 | | 368 | | Waste Management, Inc. | | | | 1,349 | | 61 |
| Nucor Corp. | | | | 13,800 | | 737 | | Xerox Corp. | | | | 2,300 | | 28 |
| PPG Industries, Inc. | | | | 9,467 | | 1,796 | | Xylem, Inc. | | | | 15,300 | | 529 |
| Praxair, Inc. | | | | 22,145 | | 2,879 | | | | | | | | 45,939 |
| Precision Castparts Corp. | | | | 2,685 | | 723 | | | | | | | | |
| Reliance Steel & Aluminum Co. | | | | 9,000 | | 683 | | Technology - 16.4% | | | | | | |
| Steel Dynamics, Inc. | | | | 17,300 | | 338 | | Adobe Systems, Inc. (Æ) | | | | 12,153 | | 728 |
| | | | | | | 24,854 | | Altera Corp. | | | | 17,700 | | 576 |
| | | | | | | | | Analog Devices, Inc. | | | | 27,128 | | 1,382 |
| Producer Durables - 9.7% | | | | | | | | Apple, Inc. | | | | 17,017 | | 9,547 |
| 3M Co. | | | | 1,997 | | 280 | | ARRIS Group, Inc. (Æ) | | | | 13,000 | | 317 |
| ABM Industries, Inc. | | | | 9,200 | | 263 | | Avago Technologies, Ltd. Class A | | | | 13,600 | | 719 |
| Accenture PLC Class A | | | | 1,857 | | 153 | | Benchmark Electronics, Inc. (Æ) | | | | 11,200 | | 258 |
| AECOM Technology Corp. (Æ) | | | | 7,100 | | 209 | | Broadcom Corp. Class A | | | | 20,300 | | 602 |
| AGCO Corp. | | | | 13,100 | | 775 | | Brocade Communications Systems, Inc. (Æ) | | | | 96,600 | | 857 |
| Air Lease Corp. Class A | | | | 21,700 | | 674 | | Ciena Corp. (Æ)(Ñ) | | | | 8,000 | | 191 |
| AO Smith Corp. | | | | 16,300 | | 879 | | Cisco Systems, Inc. | | | | 247,300 | | 5,553 |
| Automatic Data Processing, Inc. | | | | 29,604 | | 2,392 | | Cognizant Technology Solutions Corp. Class | | | | | | |
| Boeing Co. (The) | | | | 33,984 | | 4,638 | | A(Æ) | | | | 746 | | 75 |
| Canadian Pacific Railway, Ltd. | | | | 5,307 | | 803 | | Cree, Inc. (Æ) | | | | 7,698 | | 482 |
| Caterpillar, Inc. | | | | 12,600 | | 1,144 | | Crown Castle International Corp. (Æ) | | | | 8,800 | | 646 |
| CH Robinson Worldwide, Inc. | | | | 12,800 | | 747 | | Electronic Arts, Inc. (Æ) | | | | 31,800 | | 729 |
| Con-way, Inc. | | | | 1,200 | | 48 | | EMC Corp. | | | | 69,777 | | 1,755 |
| CSX Corp. | | | | 665 | | 19 | | Facebook, Inc. Class A(Æ) | | | | 11,854 | | 648 |
| Danaher Corp. | | | | 1,751 | | 135 | | Google, Inc. Class A(Æ) | | | | 6,540 | | 7,329 |
| Deere & Co. | | | | 7,700 | | 703 | | Hewlett-Packard Co. | | | | 39,300 | | 1,100 |
| Delta Air Lines, Inc. | | | | 53,420 | | 1,467 | | Integrated Device Technology, Inc. (Æ) | | | | 28,300 | | 288 |
| Eaton Corp. PLC | | | | 8,623 | | 656 | | Intel Corp. | | | | 85,931 | | 2,232 |
| EMCOR Group, Inc. | | | | 7,800 | | 331 | | International Business Machines Corp. | | | | 12,148 | | 2,279 |
| Emerson Electric Co. | | | | 9,677 | | 679 | | Intersil Corp. Class A | | | | 18,900 | | 217 |
| FedEx Corp. | | | | 5,170 | | 744 | | Intuit, Inc. | | | | 16,266 | | 1,241 |
| Fluor Corp. | | | | 1,800 | | 145 | | Jabil Circuit, Inc. | | | | 32,200 | | 562 |
| General Electric Co. | | | | 272,350 | | 7,632 | | Juniper Networks, Inc. (Æ) | | | | 37,900 | | 855 |
| Harsco Corp. | | | | 20,900 | | 586 | | Lam Research Corp. (Æ) | | | | 6,456 | | 352 |
| Honeywell International, Inc. | | | | 47,566 | | 4,347 | | Linear Technology Corp. | | | | 17,000 | | 774 |
| IDEX Corp. | | | | 10,000 | | 739 | | LinkedIn Corp. Class A(Æ) | | | | 8,106 | | 1,758 |
See accompanying notes which are an integral part of the financial statements.
20 Multi-Style Equity Fund
Russell Investment Funds
Multi-Style Equity Fund
Schedule of Investments, continued — December 31, 2013
| Amounts in thousands (except share amounts) | | | | Amounts in thousands (except share amounts) | | | |
| |
| | | | | Principal | | Fair | | | | Principal | | Fair |
| | | | | Amount ($) | | Value | | | | Amount ($) | | Value |
| | | | | or Shares | | $ | | | | or Shares | | $ | |
| |
| Marvell Technology Group, Ltd. | | | | 49,900 | | 718 | | Other Securities - 2.1% | | | | | |
| Maxim Integrated Products, Inc. | | | | 18,600 | | 519 | | Russell U. S. Cash Collateral Fund(×) | | 10,066,031 (∞) | | 10,066 | |
| Mentor Graphics Corp. | | | | 14,000 | | 337 | | | | | | | |
| Microsoft Corp. | | | | 66,331 | | 2,483 | | Total Other Securities | | | | | |
| Motorola Solutions, Inc. | | | | 10,700 | | 722 | | (cost $10,066) | | | | 10,066 | |
| NetApp, Inc. | | | | 32,750 | | 1,347 | | Total Investments 101.6% | | | | | |
| NVIDIA Corp. | | | | 52,600 | | 843 | | (identified cost $373,899) | | | | 482,771 | |
| Oracle Corp. | | | | 151,758 | | 5,806 | | | | | | | |
| PMC Sierra, Inc. (Æ) | | | | 23,500 | | 151 | | Other Assets and Liabilities, | | | | | |
| Polycom, Inc. (Æ) | | | | 16,400 | | 184 | | Net - (1.6%) | | | | (7,671) | |
| QUALCOMM, Inc. | | | | 79,801 | | 5,925 | | | | | | | |
| Salesforce. com, Inc. (Æ) | | | | 21,300 | | 1,176 | | Net Assets - 100.0% | | | | 475,100 | |
| SAP AG - ADR(Ñ) | | | | 19,300 | | 1,682 | | | | | | | |
| ServiceNow, Inc. (Æ) | | | | 5,691 | | 319 | | | | | | | |
| Splunk, Inc. (Æ) | | | | 4,761 | | 327 | | | | | | | |
| Symantec Corp. | | | | 51,550 | | 1,216 | | | | | | | |
| SYNNEX Corp. (Æ) | | | | 1,700 | | 115 | | | | | | | |
| Synopsys, Inc. (Æ) | | | | 16,800 | | 682 | | | | | | | |
| Tech Data Corp. (Æ) | | | | 3,200 | | 165 | | | | | | | |
| Texas Instruments, Inc. | | | | 64,782 | | 2,844 | | | | | | | |
| Tyco International, Ltd. | | | | 17,300 | | 710 | | | | | | | |
| Vodafone Group PLC - ADR | | | | 103,000 | | 4,048 | | | | | | | |
| Western Digital Corp. | | | | 10,800 | | 906 | | | | | | | |
| Workday, Inc. Class A(Æ) | | | | 4,200 | | 349 | | | | | | | |
| Yahoo!, Inc. (Æ) | | | | 158 | | 6 | | | | | | | |
| Yelp, Inc. Class A(Æ) | | | | 5,351 | | 369 | | | | | | | |
| | | | | | | 78,001 | | | | | | | |
| |
| Utilities - 2.8% | | | | | | | | | | | | | |
| American Electric Power Co. , Inc. | | | | 20,484 | | 957 | | | | | | | |
| Aqua America, Inc. | | | | 9,300 | | 219 | | | | | | | |
| AT&T, Inc. | | | | 114,690 | | 4,034 | | | | | | | |
| CenturyLink, Inc. | | | | 157 | | 5 | | | | | | | |
| Dominion Resources, Inc. | | | | 740 | | 48 | | | | | | | |
| DTE Energy Co. | | | | 4,400 | | 292 | | | | | | | |
| Duke Energy Corp. | | | | 1,844 | | 127 | | | | | | | |
| Edison International | | | | 13,200 | | 611 | | | | | | | |
| Encana Corp. (Ñ) | | | | 61,450 | | 1,109 | | | | | | | |
| Exelon Corp. | | | | 71,978 | | 1,972 | | | | | | | |
| Great Plains Energy, Inc. | | | | 10,100 | | 245 | | | | | | | |
| National Fuel Gas Co. | | | | 6,700 | | 478 | | | | | | | |
| NextEra Energy, Inc. | | | | 7,226 | | 619 | | | | | | | |
| Penn West Petroleum, Ltd. Class A - ADR(Ñ) | | 41,900 | | 350 | | | | | | | |
| PG&E Corp. | | | | 14,063 | | 567 | | | | | | | |
| Pinnacle West Capital Corp. | | | | 12,700 | | 672 | | | | | | | |
| PNM Resources, Inc. | | | | 17,300 | | 417 | | | | | | | |
| Southern Co. | | | | 2,149 | | 88 | | | | | | | |
| Telephone & Data Systems, Inc. | | | | 5,800 | | 150 | | | | | | | |
| Verizon Communications, Inc. | | | | 3,306 | | 162 | | | | | | | |
| | | | | | | 13,122 | | | | | | | |
| |
| Total Common Stocks | | | | | | | | | | | | | |
| (cost $340,924) | | | | | | 449,796 | | | | | | | |
| |
| Short-Term Investments - 4.8% | | | | | | | | | | | | | |
| Russell U. S. Cash Management Fund | | 22,908,875 (∞) | | 22,909 | | | | | | | |
| Total Short-Term Investments | | | | | | | | | | | | | |
| (cost $22,909) | | | | | | 22,909 | | | | | | | |
See accompanying notes which are an integral part of the financial statements.
Multi-Style Equity Fund 21
Russell Investment Funds
Multi-Style Equity Fund
Schedule of Investments, continued — December 31, 2013
| Futures Contracts | | | | | | | | | | | |
| Amounts in thousands (except contract amounts) | | | | | | | | | | | |
| | | | | | | | | | | | Unrealized |
| | | | | | | | | | | | Appreciation |
| | | | | Number of | | Notional | | Expiration | | (Depreciation) |
| | | | | Contracts | | Amount | | Date | | $ |
| Long Positions | | | | | | | | | | | |
| S&P 500 E-Mini Index Futures (CME) | | | | 224 | | USD | 20,621 | | 03/14 | | 635 |
| S&P E-Mini Consumer Staples Select Sector Index Futures (CME) | | | | 82 | | USD | 3,520 | | 03/14 | | 36 |
| Total Unrealized Appreciation (Depreciation) on Open Futures Contracts (å) | | | | | | | | | | | 671 |
| Presentation of Portfolio Holdings | | | | | | | | | | | | | | | | | | | | | | | | |
| |
| Amounts in thousands | | | | | | | | | | | | | | | | | | | | | | | | |
| | | | | | | | | Fair Value | | | | | | | | | | | | | | |
| | | | | | | | | | | | | | | | | | | | | | | % of Net |
| Portfolio Summary | | | | Level 1 | | | | Level 2 | | | | Level 3 | | | | | | Total | | | | Assets |
| Common Stocks | | | | | | | | | | | | | | | | | | | | | | | | |
| Consumer Discretionary | | $ | | 68,400 | | $ | | — | | $ | | | | — | | $ | | 68,400 | | | | | | 14 . 4 |
| Consumer Staples | | | | 21,449 | | | | — | | | | | | — | | | | 21,449 | | | | | | 4 . 5 |
| Energy | | | | 49,619 | | | | — | | | | | | — | | | | 49,619 | | | | | | 10 . 4 |
| Financial Services | | | | 82,479 | | | | — | | | | | | — | | | | 82,479 | | | | | | 17 . 4 |
| Health Care | | | | 65,933 | | | | — | | | | | | — | | | | 65,933 | | | | | | 13 . 9 |
| Materials and Processing | | | | 24,854 | | | | — | | | | | | — | | | | 24,854 | | | | | | 5 . 2 |
| Producer Durables | | | | 45,939 | | | | — | | | | | | — | | | | 45,939 | | | | | | 9 . 7 |
| Technology | | | | 78,001 | | | | — | | | | | | — | | | | 78,001 | | | | | | 16 . 4 |
| Utilities | | | | 13,122 | | | | — | | | | | | — | | | | 13,122 | | | | | | 2 . 8 |
| Short-Term Investments | | | | — | | | | 22,909 | | | | | | — | | | | 22,909 | | | | | | 4 . 8 |
| Other Securities | | | | — | | | | 10,066 | | | | | | — | | | | 10,066 | | | | | | 2 . 1 |
| Total Investments | | | | 449,796 | | | | 32,975 | | | | | | — | | | | 482,771 | | | | | | 101 . 6 |
| Other Assets and Liabilities, Net | | | | | | | | | | | | | | | | | | | | | | | | (1.6) |
| | | | | | | | | | | | | | | | | | | | | | | | | 100 . 0 |
| Other Financial Instruments | | | | | | | | | | | | | | | | | | | | | | | | |
| Futures Contracts | | | | 671 | | | | — | | | | | | — | | | | 671 | | | | | | 0 . 1 |
| Total Other Financial Instruments * | | $ | | 671 | | $ | | — | | $ | | | | — | | $ | | 671 | | | | | | |
* Other financial instruments reflected in the Schedule of Investments, such as futures, forwards, interest rate swaps, and credit default swaps are valued at the unrealized appreciation/depreciation on the instruments.
For a description of the Levels see note 2 in the Notes to Financial Statements.
For disclosure on transfers between Levels 1, 2 and 3 during the period ended December 31, 2013, see note 2 in the Notes to Financial Statements.
See accompanying notes which are an integral part of the financial statements.
22 Multi-Style Equity Fund
Russell Investment Funds
Multi-Style Equity Fund
Fair Value of Derivative Instruments — December 31, 2013
| Amounts in thousands | | |
| |
| |
| | Equity |
| Derivatives not accounted for as hedging instruments | Contracts |
| Location: Statement of Assets and Liabilities - Assets | | |
| Variation margin on futures contracts* | $ | 671 |
| | | |
| | | |
| | Equity |
| Derivatives not accounted for as hedging instruments | Contracts |
| Location: Statement of Operations - Net realized gain (loss) | | |
| Futures contracts | $ | 4,859 |
| | | |
| | | |
| Location: Statement of Operations - Net change in unrealized appreciation (depreciation) | | |
| Futures contracts | $ | 660 |
| | | |
| * | Includes cumulative appreciation/depreciation of futures contracts as reported in the Schedule of Investments. Only variation margin is reported within the Statement of Assets and Liabilities. |
For further disclosure on derivatives see note 2 in the Notes to Financial Statements.
See accompanying notes which are an integral part of the financial statements.
Multi-Style Equity Fund 23
Russell Investment Funds
Multi-Style Equity Fund
Balance Sheet Offsetting of Financial and Derivative Instruments —
December 31, 2013
| Amounts in thousands | | | | | | | | | | | | |
| |
| Offsetting of Financial Assets and Derivative Assets | | | | | | | | | | |
| | | | | | | | Gross | | Net Amounts |
| | | | | | | | Amounts | | | of Assets |
| | | | | | Gross | | Offset in the | | Presented in |
| | | | | Amounts of | | Statement of | | the Statement |
| | | | | Recognized | | Assets and | | of Assets and |
| Description | | Location: Statement of Assets and Liabilities - Assets | | | Assets | | Liabilities | | | Liabilities |
| Securities on Loan* | | Investments, at fair value | | $ | 9,883 | | $ | | — | | $ | 9,883 |
| Futures Contracts** | | Variation margin on futures contracts | | | 671 | | | | — | | | 671 |
| Total | | | | $ | 10,554 | | $ | | — | | $ | 10,554 |
| | | | | | | | | | | | | |
| Financial Assets, Derivative Assets, and Collateral Held by Counterparty | | | | | | | | | |
| | | | | | Gross Amounts Not Offset in | |
| | | | | | the Statement of Assets and | |
| | | | | | | Liabilities | | |
| | | Net Amounts | | | | | | | | |
| | | | of Assets | | | | | | | | |
| | | Presented in | | | | | | | | |
| | | the Statement | | Financial and | | | | | |
| | | of Assets and | | Derivative | | | Collateral | | |
| Counterparty | | | Liabilities | | Instruments | | | Received Net Amount |
| Barclays | | $ | 2,575 | | $ | — $ | 2,575 | $ | — |
| Citigroup | | | 1,646 | | | — | 1,646 | | — |
| Credit Suisse | | | 3,460 | | | — | 3,460 | | — |
| Deutsche Bank | | | 343 | | | — | 343 | | — |
| Fidelity | | | 1,047 | | | — | 1,047 | | — |
| Goldman Sachs | | | 369 | | | — | 369 | | — |
| JPMorgan Chase | | | 291 | | | — | 291 | | — |
| Merrill Lynch | | | 671 | | | — | — | | 671 |
| Morgan Stanley | | | 152 | | | — | 152 | | — |
| Total | | $ | 10,554 | | $ | — $ | 9,883 | $ | 671 |
| | | | | | | | | | | | |
| * | Fair value of securities on loan as reported in the footnotes to the Statement of Assets and Liabilities. |
| ** | Includes cumulative appreciation/depreciation of futures contracts as reported in the Schedule of Investments. |
Only variation margin is reported within the Statement of Assets and Liabilities.
For further disclosure on derivatives and counterparty risk see note 2 in the Notes to Financial Statements.
24 Balance Sheet Offsetting of Financial and Derivative Instruments
Russell Investment Funds
Multi-Style Equity Fund
Statement of Assets and Liabilities — December 31, 2013
| Amounts in thousands | | |
| Assets | | |
| Investments, at identified cost | $ | 373,899 |
| Investments, at fair value(*)(>) | | 482,771 |
| Cash (restricted)(a) | | 1,220 |
| Receivables: | | |
| Dividends and interest | | 573 |
| Dividends from affiliated Russell funds | | 2 |
| Investments sold | | 2,508 |
| Variation margin on futures contracts | | 73 |
| Total assets | | 487,147 |
| |
| Liabilities | | |
| Payables: | | |
| Investments purchased | | 1,488 |
| Fund shares redeemed | | 111 |
| Accrued fees to affiliates | | 310 |
| Other accrued expenses | | 72 |
| Payable upon return of securities loaned | | 10,066 |
| Total liabilities | | 12,047 |
| |
| Net Assets | $ | 475,100 |
See accompanying notes which are an integral part of the financial statements.
Multi-Style Equity Fund 25
Russell Investment Funds
Multi-Style Equity Fund
Statement of Assets and Liabilities, continued — December 31, 2013
| Amounts in thousands | | |
| Net Assets Consist of: | | |
| Undistributed (overdistributed) net investment income | $ | 1,062 |
| Accumulated net realized gain (loss) | | 5,505 |
| Unrealized appreciation (depreciation) on: | | |
| Investments . | | 108,872 |
| Futures contracts | | 671 |
| Shares of beneficial interest | | 252 |
| Additional paid-in capital | | 358,738 |
| Net Assets | $ | 475,100 |
| Net Asset Value, offering and redemption price per share: | | |
| Net asset value per share: (#) | $ | 18 . 85 |
| Net assets | $ | 475,100,443 |
| Shares outstanding ($. 01 par value) | | 25,201,763 |
| Amounts in thousands | | |
| (*) Securities on loan included in investments | $ | 9,883 |
| (>) Investments in affiliates, Russell U. S. Cash Management Fund and Russell U. S. Cash Collateral Fund | $ | 32,975 |
| (a) Cash Collateral for Futures | $ | 1,220 |
| (#) Net asset value per share equals net assets divided by shares of beneficial interest outstanding. | | |
See accompanying notes which are an integral part of the financial statements.
26 Multi-Style Equity Fund
Russell Investment Funds
Multi-Style Equity Fund
Statement of Operations — For the Period Ended December 31, 2013
| Amounts in thousands | | |
| Investment Income | | |
| Dividends | $ | 8,261 |
| Dividends from affiliated Russell funds | | 22 |
| Securities lending income | | 46 |
| Total investment income | | 8,329 |
| |
| Expenses | | |
| Advisory fees | | 3,178 |
| Administrative fees | | 218 |
| Custodian fees | | 90 |
| Transfer agent fees | | 19 |
| Professional fees | | 72 |
| Trustees’ fees | | 10 |
| Printing fees | | 68 |
| Miscellaneous | | 20 |
| Total expenses | | 3,675 |
| Net investment income (loss) | | 4,654 |
| |
| Net Realized and Unrealized Gain (Loss) | | |
| Net realized gain (loss) on: | | |
| Investments . | | 51,355 |
| Futures contracts | | 4,859 |
| Net realized gain (loss) | | 56,214 |
| Net change in unrealized appreciation (depreciation) on: | | |
| Investments | | 61,725 |
| Futures contracts | | 660 |
| Net change in unrealized appreciation (depreciation) | | 62,385 |
| Net realized and unrealized gain (loss) | | 118,599 |
| Net Increase (Decrease) in Net Assets from Operations | $ | 123,253 |
See accompanying notes which are an integral part of the financial statements.
Multi-Style Equity Fund 27
Russell Investment Funds
Multi-Style Equity Fund
Statements of Changes in Net Assets
| | | For the Periods Ended December 31, |
| Amounts in thousands | | 2013 | | 2012 |
| Increase (Decrease) in Net Assets | | | | | | |
| Operations | | | | | | |
| Net investment income (loss) | | $ | 4,654 | | $ | 5,006 |
| Net realized gain (loss) | | | 56,214 | | | 32,075 |
| Net change in unrealized appreciation (depreciation) | | | 62,385 | | | 19,577 |
| Net increase (decrease) in net assets from operations | | | 123,253 | | | 56,658 |
| |
| Distributions | | | | | | |
| From net investment income | | | (5,303) | | | (4,388) |
| From net realized gain | | | (24,512) | | | — |
| Net decrease in net assets from distributions | | | (29,815) | | | (4,388) |
| |
| Share Transactions* | | | | | | |
| Net increase (decrease) in net assets from share transactions | | | (8,887) | | | (35,113) |
| Total Net Increase (Decrease) in Net Assets | | | 84,551 | | | 17,157 |
| |
| Net Assets | | | | | | |
| Beginning of period | | | 390,549 | | | 373,392 |
| End of period | | $ | 475,100 | | $ | 390,549 |
| Undistributed (overdistributed) net investment income included in net assets | | $ | 1,062 | | $ | 1,709 |
See accompanying notes which are an integral part of the financial statements.
28 Multi-Style Equity Fund
Russell Investment Funds
Multi-Style Equity Fund
Statements of Changes in Net Assets, continued
* Share transaction amounts (in thousands) for the periods ended December 31, 2013 and December 31, 2012 were as follows:
| | | | | 2013 | | | | | 2012 | |
| | | | | Shares | | | Dollars | | | | Shares | | | Dollars |
| |
| Proceeds from shares sold | | | | 838 | | $ | 14,637 | | | | 1,765 | | $ | 25,748 |
| Proceeds from reinvestment of distributions | | | | 1,630 | | | 29,815 | | | | 298 | | | 4,388 |
| Payments for shares redeemed | | | | (3,049) | | | (53,339) | | | | (4,472) | | | (65,249) |
| Total increase (decrease) | | | | (581) | | $ | (8,887) | | | | (2,409) | | $ | (35,113) |
| | | | | | | | | | | | | | | |
See accompanying notes which are an integral part of the financial statements.
Multi-Style Equity Fund 29
Russell Investment Funds
Multi-Style Equity Fund
Financial Highlights — For the Periods Ended
For a Share Outstanding Throughout Each Period.
| | | $ | $ | | $ | | $ | | $ | | $ |
| | Net Asset Value, | Net | | Net Realized | | Total from | | Distributions | | Distributions |
| | | Beginning of | Investment | | and Unrealized | | Investment | | from Net | | from Net |
| | | Period | Income (Loss)(a)(b) | | Gain (Loss) | | Operations | Investment Income | | Realized Gain |
| December 31, 2013 | | 15 . 15 | | . 19 | | 4 . 75 | | 4 . 94 | | ( . 22) | | (1 . 02) |
| December 31, 2012 | | 13 . 24 | | . 19 | | 1 . 88 | | 2 . 07 | | ( . 16) | | — |
| December 31, 2011 | | 13 . 58 | | . 14 | | ( . 35) | | ( . 21) | | ( . 13) | | — |
| December 31, 2010 | | 11 . 77 | | . 11 | | 1 . 81 | | 1 . 92 | | ( . 11) | | — |
| December 31, 2009 | | 9 . 00 | | . 10 | | 2 . 80 | | 2 . 90 | | ( . 13) | | — |
See accompanying notes which are an integral part of the financial statements.
30 Multi-Style Equity Fund
| | | | | % | | | % | % | |
| | $ | | $ | Ratio of Expenses | Ratio of Expenses | Ratio of Net | |
| | Net Asset Value, | % | Net Assets, | to Average | to Average | Investment Income | % |
| $ | End of | Total | End of Period | Net Assets, | Net Assets, | to Average | Portfolio |
| Total Distributions | Period | Return(d) | (000) | Gross | Net(b) | Net Assets(b) | Turnover Rate |
| (1 . 24) | 18 . 85 | 32 . 92 | 475,100 | | . 84 | | | . 84 | 1 . 07 | 86 |
| ( . 16) | 15 . 15 | 15 . 69 | 390,549 | | . 87 | | | . 87 | 1 . 28 | 109 |
| ( . 13) | 13 . 24 | (1 . 55) | 373,392 | | . 85 | | | . 85 | 1 . 03 | 133 |
| ( . 11) | 13 . 58 | 16 . 46 | 400,471 | | . 89 | | | . 89 | . 93 | 105 |
| ( . 13) | 11 . 77 | 32 . 72 | 376,751 | | . 86 | | | . 85 | 1 . 06 | 136 |
See accompanying notes which are an integral part of the financial statements.
Multi-Style Equity Fund 31
Russell Investment Funds
Aggressive Equity Fund
Portfolio Management Discussion and Analysis — December 31, 2013 (Unaudited)
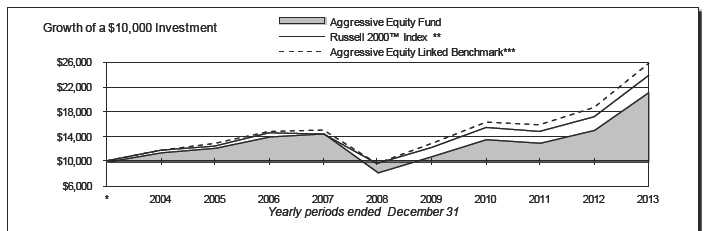
| Aggressive Equity Fund | | | Aggressive Equity Linked Benchmark*** | |
| | Total | | | Total |
| | Return | | | Return |
| 1 Year | 40 . 00% | | 1 Year | 38 . 82% |
| 5 Years | 20 . 58%§ | | 5 Years | 22 . 08%§ |
| 10 Years | 7 . 74%§ | | 10 Years | 9 . 95%§ |
| |
| |
| Russell 2000 ® Index ** | | | | |
| | Total | | | |
| | Return | | | |
| 1 Year | 38 . 82% | | | |
| 5 Years | 20 . 08%§ | | | |
| 10 Years | 9 . 07%§ | | | |
32 Aggressive Equity Fund
Russell Investment Funds
Aggressive Equity Fund
Portfolio Management Discussion and Analysis, continued — December 31, 2013 (Unaudited)
| The Aggressive Equity Fund (the “Fund”) employs a multi- | | resulted in a rotation away from higher yield areas of the market, |
| manager approach whereby portions of the Fund are allocated to | | in particular real estate investment trusts (“REITs”) and utilities, |
| different money managers. Fund assets not allocated to money | | which had been seen as bond proxy equities. |
| managers are managed by Russell Investment Management | | The combination of these factors created a favorable environment |
| Company (“RIMCo”), the Fund’s advisor. RIMCo may change | | for both the Fund’s positioning and stock selection. The largest |
| the allocation of the Fund’s assets among money managers at | | tailwinds came from the Fund’s underweight exposure to dividend |
| any time. An exemptive order from the Securities and Exchange | | yield, primarily REITs and utilities, and the Fund’s pro-recovery |
| Commission (“SEC”) permits RIMCo to engage or terminate a | | position that resulted in an overweight exposure to cyclical sectors. |
| money manager at any time, subject to approval by the Fund’s | | Stock selection was positive and accounted for the majority of the |
| Board, without a shareholder vote. Pursuant to the terms of the | | Fund’s performance. Favorable selection was a reflection of the |
| exemptive order, the Fund is required to notify its shareholders | | significantly positive performance of the Fund’s more dynamic, |
| within 90 days of when a money manager begins providing | | higher growth managers. |
| services. As of December 31, 2013, the Fund had six money | | |
| managers. | | How did the investment strategies and techniques employed |
| |
| What is the Fund’s investment objective? | | by the Fund and its money managers affect its benchmark |
| | | relative performance? |
| The Fund seeks to provide long term capital growth. | | The Fund employs six money managers: two growth-oriented, |
| How did the Fund perform relative to its benchmark for the | | one market-oriented and three value-oriented. Two of the six |
| fiscal year ended December 31, 2013? | | managers outperformed their respective benchmarks. |
| For the fiscal year ended December 31, 2013, the Fund gained | | The threat of high U. S. interest rates caused investors to rotate |
| 40.00%. This is compared to the Fund’s benchmark, the Russell | | out of REITs and other higher yielding areas of the market, |
| 2000 ® Index, which gained 38.82% during the same period. The | | which had become unattractive on a valuation basis. This proved |
| Fund’s performance includes operating expenses, whereas index | | a boon for many active investors, particularly the Fund’s value |
| returns are unmanaged and do not include expenses of any kind. | | focused managers. Paired with this was investors’ appetite for |
| For the fiscal year ended December 31, 2013, the Lipper ® Small- | | higher earnings growth companies, spurred on by U. S. economic |
| Cap Core Funds Average, a group of funds that Lipper considers | | optimism. This was a favorable tailwind for the Fund’s growth |
| to have investment strategies similar to those of the Fund, gained | | strategies, with secular growth and earnings momentum strategies |
| 37.30%. This result serves as a peer comparison and is expressed | | the most beneficial recipients. |
| net of operating expenses. | | Ranger Investment Management, L. P. (“Ranger”) underperformed |
| RIMCo may assign a money manager a specific style or | | the Russell 2000® Growth Index for the fiscal year. Performance |
| capitalization benchmark other than the Fund’s index. However, | | was primarily attributable to stock selection. Selection within |
| the Fund’s primary index remains the benchmark for the Fund | | technology was the largest detractor, particularly due to holdings |
| and is representative of the aggregate of each money manager’s | | in telecommunications equipment. |
| benchmark index. | | Conestoga Capital Advisors LLC (“Conestoga”) outperformed |
| | | the Russell 2000® Growth Index for the fiscal year. A favorable |
| How did the market conditions described in the Market | | tailwind from earnings growth aided positive stock selection, |
| Summary report affect the Fund’s performance? | | which accounted for the majority of the manager’s outperformance. |
| The fiscal year ended December 31, 2013 saw the Fund outperform | | Selection in producer durables was the largest positive contributor. |
| the Russell 2000 ® Index. The fiscal year was characterized by | | |
| investors’ positive disposition towards the U. S. economic recovery, | | RBC Global Asset Management (U. S. ) Inc. (“RBC”) narrowly |
| spurred by the fiscal cliff resolution in late 2012, despite political | | underperformed a blended 40% Russell 2000® Index / 60% |
| machinations in Washington and international growth concerns. | | Russell Microcap Index for the fiscal year. Performance was largely |
| The favorable relative conditions of the U. S. to other nations | | driven by negative stock selection within electronic components |
| resulted in a greater U. S. centric focus and this was reflected in | | and the decision to hold zero biotechnology holdings, reflecting a |
| the outperformance of smaller capitalization, more dynamic U. S. | | combination of unfavorable factor headwinds and stock missteps. |
| companies. | | However, the manager’s pro-cyclical sector exposures helped to |
| | | offset the majority of this detrimental performance impact. |
| The timing and magnitude of concerns around the “tapering” of | | |
| the Federal Reserve’s quantitative easing program constrained | | Signia Capital Management, LLC (“Signia”) underperformed the |
| investors’ risk appetites and spurred bond yields to rise. This | | Russell 2500™ Value Index for the fiscal year. Performance |
Aggressive Equity Fund 33
Russell Investment Funds
Aggressive Equity Fund
Portfolio Management Discussion and Analysis, continued — December 31, 2013 (Unaudited)
| was largely driven by negative stock selection within energy | | Effective December 31, 2013, Signia’s mandate was changed |
| and consumer discretionary. However, the manager’s decision | | from the Russell 2500™ Value Index to the Russell 2000 ® Value |
| to underweight the highest yielding market segments helped to | | Index. This decision was intended to better align the manager’s |
| offset the majority of this detrimental performance impact. | | mandate with the Fund’s benchmark and provide the Fund greater |
| DePrince, Race & Zollo, Inc. (“DePrince”) narrowly | | exposure to U. S. microcap stocks. | | | |
| underperformed the Russell 2000® Value Index for the fiscal year. | | Effective December 31, 2013, Jacob’s mandate was changed from |
| The manager’s dividend focused strategy faced headwinds from | | the Russell 2000 ® Value Index to a 50/50 blend of the Russell |
| investors’ rotation away from yield and as a consequence resulted | | 2000® Value Index and the Russel l 2000® Defensive™ Index. |
| in negative stock selection. Stock selection accounted for all of | | This decision was intended to provide the Fund greater exposure |
| the manager’s underperformance, with selection in technology the | | to U. S. defensive stocks. | | | |
| largest detractor. | | | | | |
| | | Money Managers as of December 31, | | | |
| Jacobs Levy Equity Management, Inc. (“Jacobs”) outperformed | | 2013 | | Styles |
| the Russell 2000 ® Value Index for the fiscal year. The manager’s | | | | | |
| | | Ranger Investment Management, L. P. | | Small Cap Growth |
| tilt towards smaller companies was rewarded during the period | | Conestoga Capital Advisors, LLC | | Small Cap Growth |
| and provided a strong tailwind to the manager’s quantitative | | RBC Global Asset Management (U. S. ), Inc. | | Micro/Small Cap |
| stock selection. Stock selection accounted for the majority of the | | Signia Capital Management, LLC | | Small Cap Value |
| manager’s outperformance, with selection in financial services | | DePrince, Race & Zollo, Inc. | | Small Cap Value |
| | | Jacobs Levy Equity Management, Inc. | | Small Cap Value/ |
| and energy the largest positive contributors. | | | | Small Cap |
| RIMCo manages the portion of the Fund’s assets that RIMCo | | | | Defensive |
| determines not to allocate to the money managers. Assets not | | The views expressed in this report reflect those of the |
| allocated to managers include the Fund’s liquidity reserves and | | portfolio managers only through the end of the period |
| assets which may be managed directly by RIMCo to modify | | covered by the report. These views do not necessarily |
| the Fund’s overall portfolio characteristics to seek to achieve | | represent the views of RIMCo, or any other person in RIMCo |
| the desired risk/return profile for the Fund. During the period, | | or any other affiliated organization. These views are |
| RIMCo equitized the Fund’s cash using index futures contracts | | subject to change at any time based upon market conditions |
| to ensure that the Fund had full market exposure. This had a | | or other events, and RIMCo disclaims any responsibility to |
| positive impact on the Fund’s performance. | | update the views contained herein. These views should not |
| | | be relied on as investment advice and, because investment |
| Describe any changes to the Fund’s structure or the money | | decisions for a Russell Investment Funds (“RIF”) Fund are |
| manager line-up. | | based on numerous factors, should not be relied on as an |
| No changes were made to the money manger line-up during fiscal | | indication of investment decisions of any RIF Fund. |
| year 2013. | | | | | |
| * | Assumes initial investment on January 1, 2004. |
| ** | The Russell 2000® Index measures the performance of the small-cap segment of the U. S. equity universe. The Russell 2000® Index is a subset of the Russell 3000® Index representing approximately 10% of the total market capitalization of that index. It includes approximately 2000 of the smallest securities base on a combination of their market cap and current index membership. The Russell 2000® Index is constructed to provide a comprehensive and unbiased small-cap barometer and is completely reconstituted annually to ensure larger stocks do not distort the performance and characteristics of the true small-cap opportunity set. |
| *** | The Aggressive Equity Linked Benchmark represents the returns of the Russell 2500 ™ Index through April 30, 2012 and the returns of the Russell 2000® Index thereafter. The Aggressive Equity Linked Benchmark provides a means to compare the Fund’s average annual returns to a secondary benchmark that takes into account historical changes in the Fund’s primary benchmark. |
| § | Annualized. |
The performance shown in this section does not reflect any Insurance Company Separate Account or Policy Charges. Performance is historical and assumes reinvestment of all dividends and capital gains. Investment return and principal value will fluctuate so that an investor’s shares, when redeemed, may be worth more or less than when purchased. Past performance is not indicative of future results.
34 Aggressive Equity Fund
Russell Investment Funds
Aggressive Equity Fund
Shareholder Expense Example — December 31, 2013 (Unaudited)
| Fund Expenses | | Please note that the expenses shown in the table are meant |
| The following disclosure provides important information | | to highlight your ongoing costs only and do not reflect any |
| regarding the Fund’s Shareholder Expense Example | | transactional costs. Therefore, the information under the heading |
| (“Example”) . | | “Hypothetical Performance (5% return before expenses)” is |
| | | useful in comparing ongoing costs only, and will not help you |
| Example | | determine the relative total costs of owning different funds. In |
| As a shareholder of the Fund, you incur two types of costs: (1) | | addition, if these transactional costs were included, your costs |
| transaction costs, and (2) ongoing costs, including advisory and | | would have been higher. The fees and expenses shown in this |
| administrative fees and other Fund expenses. The Example is | | section do not reflect any Insurance Company Separate Account |
| intended to help you understand your ongoing costs (in dollars) | | or Policy Charges. | | | | | | | | | | |
| of investing in the Fund and to compare these costs with the | | | | | | | | | | | Hypothetical |
| ongoing costs of investing in other mutual funds. The Example | | | | | | | Actual | | | | Performance (5% |
| is based on an investment of $1,000 invested at the beginning of | | | | | | | Performance | | | | return before expenses) |
| the period and held for the entire period indicated, which for this | | | | | | | | | | | |
| | | Beginning Account Value | | | | | | | | | | |
| Fund is from July 1, 2013 to December 31, 2013. | | July 1, 2013 | | | | $ | 1,000.00 | | | | $ | 1,000.00 |
| Actual Expenses | | Ending Account Value | | | | | | | | | | |
| | | December 31, 2013 | | | | $ | 1,204.10 | | | | $ | 1,020.32 |
| The information in the table under the heading “Actual | | Expenses Paid During Period* | | | | $ | 5.39 | | | | $ | 4.94 |
| Performance” provides information about actual account values | | | | | | | | | | | | |
| and actual expenses. You may use the information in this column, | | * Expenses are equal to the Fund's annualized expense ratio of 0.97% |
| | | (representing the six month period annualized), multiplied by the average |
| together with the amount you invested, to estimate the expenses | | account value over the period, multiplied by 184/365 (to reflect the one-half year |
| that you paid over the period. Simply divide your account value by | | period) . May reflect amounts waived, reimbursed and/or other credits. Without |
| $1,000 (for example, an $8,600 account value divided by $1,000 | | any waivers, reimbursements and/or other credits, expenses would have been |
| = 8.6), then multiply the result by the number in the first column | | higher. | | | | | | | | | | |
| in the row entitled “Expenses Paid During Period” to estimate | | | | | | | | | | | | |
| the expenses you paid on your account during this period. | | | | | | | | | | | | |
| |
| Hypothetical Example for Comparison Purposes | | | | | | | | | | | | |
| The information in the table under the heading “Hypothetical | | | | | | | | | | | | |
| Performance (5% return before expenses)” provides information | | | | | | | | | | | | |
| about hypothetical account values and hypothetical expenses | | | | | | | | | | | | |
| based on the Fund’s actual expense ratio and an assumed rate of | | | | | | | | | | | | |
| return of 5% per year before expenses, which is not the Fund’s | | | | | | | | | | | | |
| actual return. The hypothetical account values and expenses | | | | | | | | | | | | |
| may not be used to estimate the actual ending account balance or | | | | | | | | | | | | |
| expenses you paid for the period. You may use this information | | | | | | | | | | | | |
| to compare the ongoing costs of investing in the Fund and other | | | | | | | | | | | | |
| funds. To do so, compare this 5% hypothetical example with the | | | | | | | | | | | | |
| 5% hypothetical examples that appear in the shareholder reports | | | | | | | | | | | | |
| of other funds. | | | | | | | | | | | | |
Aggressive Equity Fund 35
Russell Investment Funds
Aggressive Equity Fund
Schedule of Investments — December 31, 2013
| Amounts in thousands (except share amounts) | | | | Amounts in thousands (except share amounts) | | |
| |
| | | | | Principal | | Fair | | | | | | Principal | | Fair |
| | | | | Amount ($) | | Value | | | | | | Amount ($) | | Value |
| | | | | or Shares | | $ | | | | | | or Shares | | $ |
| |
| Common Stocks - 94.0% | | | | | | | | Men's Wearhouse, Inc. (The) | | | | 10,323 | | 527 |
| | | | | | | | | Meritage Homes Corp. (Æ) | | | | 5,677 | | 272 |
| Consumer Discretionary - 13.6% | | | | | | | | National CineMedia, Inc. | | | | 4,100 | | 82 |
| 1-800-Flowers. com, Inc. Class A(Æ) | | | | 6,100 | | 33 | | New York & Co. , Inc. (Æ) | | | | 6,700 | | 29 |
| Abercrombie & Fitch Co. Class A(Ñ) | | | | 29,220 | | 962 | | NVR, Inc. (Æ) | | | | 100 | | 103 |
| Advance Auto Parts, Inc. | | | | 200 | | 22 | | Papa John's International, Inc. | | | | 4,600 | | 209 |
| AFC Enterprises, Inc. (Æ) | | | | 3,600 | | 139 | | PCM, Inc. (Æ) | | | | 100 | | 1 |
| AMC Networks, Inc. Class A(Æ) | | | | 1,500 | | 102 | | Perry Ellis International, Inc. (Æ) | | | | 1,800 | | 28 |
| American Eagle Outfitters, Inc. | | | | 2,200 | | 32 | | Pier 1 Imports, Inc. | | | | 28,926 | | 668 |
| ANN, Inc. (Æ) | | | | 900 | | 33 | | QuinStreet, Inc. (Æ) | | | | 1,200 | | 10 |
| Asbury Automotive Group, Inc. (Æ) | | | | 19,105 | | 1,026 | | RealD, Inc. (Æ)(Ñ) | | | | 3,000 | | 26 |
| Ascena Retail Group, Inc. (Æ) | | | | 3,502 | | 74 | | Red Robin Gourmet Burgers, Inc. (Æ) | | | | 12,813 | | 942 |
| Bridgepoint Education, Inc. (Æ)(Ñ) | | | | 12,527 | | 222 | | Regis Corp. | | | | 24,340 | | 353 |
| Brown Shoe Co. , Inc. | | | | 5,300 | | 149 | | RG Barry Corp. | | | | 20,711 | | 400 |
| Callaway Golf Co. | | | | 22,500 | | 190 | | Ritchie Bros Auctioneers, Inc. (Ñ) | | | | 46,890 | | 1,074 |
| Capella Education Co. | | | | 2,800 | | 186 | | Rocky Brands, Inc. | | | | 26,139 | | 381 |
| Chico's FAS, Inc. | | | | 48,290 | | 910 | | Ruby Tuesday, Inc. (Æ) | | | | 74,064 | | 513 |
| Children's Place Retail Stores, Inc. (The)(Æ) | | 6,910 | | 394 | | Sally Beauty Holdings, Inc. (Æ) | | | | 3,285 | | 99 |
| Citi Trends, Inc. (Æ) | | | | 47,332 | | 805 | | SeaWorld Entertainment, Inc. | | | | 1,000 | | 29 |
| Cracker Barrel Old Country Store, Inc. | | | | 1,900 | | 209 | | Skullcandy, Inc. (Æ) | | | | 23,900 | | 172 |
| CST Brands, Inc. | | | | 4,000 | | 147 | | Smith & Wesson Holding Corp. (Æ)(Ñ) | | | | 30,849 | | 416 |
| Deckers Outdoor Corp. (Æ)(Ñ) | | | | 13,200 | | 1,114 | | Sonic Automotive, Inc. Class A | | | | 2,200 | | 54 |
| Delta Apparel, Inc. (Æ) | | | | 11,000 | | 187 | | Sonic Corp. (Æ) | | | | 38,590 | | 779 |
| Destination Maternity Corp. | | | | 8,000 | | 239 | | Stage Stores, Inc. | | | | 23,890 | | 531 |
| Destination XL Group, Inc. (Æ) | | | | 71,375 | | 469 | | Stamps. com, Inc. (Æ) | | | | 15,830 | | 666 |
| Dorman Products, Inc. (Æ) | | | | 6,649 | | 373 | | Steiner Leisure, Ltd. (Æ) | | | | 600 | | 30 |
| Drew Industries, Inc. | | | | 3,076 | | 157 | | Steven Madden, Ltd. (Æ) | | | | 22,866 | | 836 |
| Einstein Noah Restaurant Group, Inc. | | | | 1,700 | | 25 | | Stoneridge, Inc. (Æ) | | | | 5,800 | | 74 |
| Ethan Allen Interiors, Inc. | | | | 26,495 | | 806 | | TiVo, Inc. (Æ) | | | | 16,760 | | 220 |
| Express, Inc. (Æ) | | | | 27,920 | | 521 | | Town Sports International Holdings, Inc. | | | | 1,200 | | 18 |
| Finish Line, Inc. (The) Class A | | | | 23,530 | | 663 | | TravelCenters of America LLC(Æ) | | | | 33,725 | | 328 |
| Fox Factory Holding Corp. (Æ) | | | | 3,300 | | 58 | | Universal Electronics, Inc. (Æ) | | | | 23,890 | | 910 |
| Franklin Covey Co. (Æ) | | | | 2,200 | | 44 | | Universal Technical Institute, Inc. | | | | 120 | | 2 |
| Fred's, Inc. Class A | | | | 9,900 | | 183 | | Vera Bradley, Inc. (Æ)(Ñ) | | | | 3,400 | | 82 |
| Fuel Systems Solutions, Inc. (Æ) | | | | 51,799 | | 718 | | Viad Corp. | | | | 600 | | 17 |
| G-III Apparel Group, Ltd. (Æ) | | | | 3,237 | | 239 | | VistaPrint NV(Æ) | | | | 100 | | 6 |
| Grand Canyon Education, Inc. (Æ) | | | | 26,864 | | 1,172 | | West Marine, Inc. (Æ) | | | | 36,746 | | 523 |
| Group 1 Automotive, Inc. (Ñ) | | | | 10,047 | | 714 | | Willis Lease Finance Corp. (Æ) | | | | 700 | | 12 |
| Guess?, Inc. (Ñ) | | | | 15,710 | | 488 | | XO Group, Inc. (Æ) | | | | 2,600 | | 39 |
| Harman International Industries, Inc. | | | | 400 | | 33 | | Zagg, Inc. (Æ)(Ñ) | | | | 35,021 | | 152 |
| Harte-Hanks, Inc. | | | | 6,600 | | 52 | | Zale Corp. (Æ) | | | | 2,400 | | 38 |
| Haverty Furniture Cos. , Inc. | | | | 7,400 | | 232 | | | | | | | | |
| HealthStream, Inc. (Æ) | | | | 24,600 | | 806 | | | | | | | | 32,366 |
| Helen of Troy, Ltd. (Æ) | | | | 4,100 | | 203 | | | | | | | | |
| Hibbett Sports, Inc. (Æ)(Ñ) | | | | 8,300 | | 558 | | Consumer Staples - 2.2% | | | | | | |
| Hooker Furniture Corp. | | | | 800 | | 13 | | Alliance One International, Inc. (Æ) | | | | 2,500 | | 8 |
| Inter Parfums, Inc. | | | | 22,230 | | 796 | | Andersons, Inc. (The) | | | | 8,651 | | 772 |
| Jack in the Box, Inc. (Æ) | | | | 8,100 | | 405 | | Annie's, Inc. (Æ) | | | | 8,500 | | 366 |
| JAKKS Pacific, Inc. (Ñ) | | | | 20,500 | | 138 | | Casey's General Stores, Inc. | | | | 3,400 | | 239 |
| Johnson Outdoors, Inc. Class A | | | | 1,313 | | 35 | | Chiquita Brands International, Inc. (Æ) | | | | 2,580 | | 30 |
| Jones Group, Inc. (The) | | | | 43,085 | | 645 | | Coca-Cola Bottling Co. | | | | 200 | | 15 |
| Kirkland's, Inc. (Æ) | | | | 8,100 | | 192 | | Core-Mark Holding Co. , Inc. | | | | 3,500 | | 266 |
| Kona Grill, Inc. (Æ) | | | | 8,200 | | 152 | | Dean Foods Co. (Æ) | | | | 32,055 | | 551 |
| Krispy Kreme Doughnuts, Inc. (Æ) | | | | 41,660 | | 804 | | Fresh Del Monte Produce, Inc. | | | | 6,200 | | 175 |
| Libbey, Inc. (Æ) | | | | 16,736 | | 351 | | Ingles Markets, Inc. Class A | | | | 4,272 | | 116 |
| Lincoln Educational Services Corp. | | | | 600 | | 3 | | J&J Snack Foods Corp. | | | | 1,500 | | 133 |
| Lumber Liquidators Holdings, Inc. (Æ)(Ñ) | | | | 1,000 | | 103 | | Medifast, Inc. (Æ) | | | | 7,480 | | 195 |
| Marchex, Inc. Class A(Æ) | | | | 4,800 | | 42 | | Omega Protein Corp. (Æ) | | | | 5,458 | | 67 |
| Marriott Vacations Worldwide Corp. (Æ) | | | | 4,600 | | 243 | | Pantry, Inc. (The)(Æ) | | | | 2,700 | | 45 |
| MDC Holdings, Inc. (Æ) | | | | 34,280 | | 1,104 | | Roundy's, Inc. | | | | 8,300 | | 82 |
See accompanying notes which are an integral part of the financial statements.
36 Aggressive Equity Fund
Russell Investment Funds
Aggressive Equity Fund
Schedule of Investments, continued — December 31, 2013
| Amounts in thousands (except share amounts) | | | | Amounts in thousands (except share amounts) | | |
| |
| | | | | Principal | | Fair | | | | | | Principal | | Fair |
| | | | | Amount ($) | | Value | | | | | | Amount ($) | | Value |
| | | | | or Shares | | $ | | | | | | or Shares | | $ |
| Sanderson Farms, Inc. | | | | 400 | | 29 | | Artisan Partners Asset Management, Inc. | | | | | | |
| SodaStream International, Ltd. (Æ)(Ñ) | | | | 5,712 | | 284 | | Class A | | | | 700 | | 46 |
| Spartan Stores, Inc. | | | | 2,200 | | 53 | | Ashford Hospitality Trust, Inc. (ö) | | | | 4,400 | | 36 |
| Synutra International, Inc. (Æ)(Ñ) | | | | 1,600 | | 14 | | Assurant, Inc. | | | | 2,500 | | 166 |
| TreeHouse Foods, Inc. (Æ) | | | | 10,025 | | 691 | | Asta Funding, Inc. (Æ) | | | | 10,938 | | 92 |
| Universal Corp. (Ñ) | | | | 17,230 | | 940 | | Astoria Financial Corp. | | | | 51,670 | | 715 |
| WD-40 Co. | | | | 700 | | 52 | | Baldwin & Lyons, Inc. Class B | | | | 1,100 | | 30 |
| | | | | | | 5,123 | | Bancfirst Corp. | | | | 1,500 | | 84 |
| | | | | | | | | Bancorp, Inc. (Æ) | | | | 47,604 | | 853 |
| Energy - 6.9% | | | | | | | | Bank of Marin Bancorp | | | | 600 | | 26 |
| Athlon Energy, Inc. (Æ) | | | | 1,600 | | 48 | | Bank of the Ozarks, Inc. | | | | 15,913 | | 901 |
| Atwood Oceanics, Inc. (Æ) | | | | 1,400 | | 75 | | BBCN Bancorp, Inc. | | | | 9,800 | | 163 |
| C&J Energy Services, Inc. (Æ)(Ñ) | | | | 600 | | 14 | | BioMed Realty Trust, Inc. (ö) | | | | 30,520 | | 553 |
| Cal Dive International, Inc. (Æ)(Ñ) | | | | 259,764 | | 522 | | Blackhawk Network Holdings, Inc. Class | | | | | | |
| CARBO Ceramics, Inc. (Ñ) | | | | 5,452 | | 636 | | A(Æ)(Ñ) | | | | 3,800 | | 96 |
| Comstock Resources, Inc. | | | | 28,000 | | 512 | | BlackRock Kelso Capital Corp. | | | | 15,800 | | 147 |
| Contango Oil & Gas Co. (Æ) | | | | 12,425 | | 587 | | BOK Financial Corp. | | | | 2,800 | | 186 |
| Dawson Geophysical Co. (Æ) | | | | 2,100 | | 71 | | Boston Private Financial Holdings, Inc. | | | | 8,058 | | 102 |
| Delek US Holdings, Inc. | | | | 34,815 | | 1,199 | | Bridge Bancorp, Inc. | | | | 800 | | 21 |
| Evolution Petroleum Corp. | | | | 1,600 | | 20 | | Brookline Bancorp, Inc. | | | | 87,030 | | 833 |
| Forum Energy Technologies, Inc. (Æ) | | | | 5,400 | | 153 | | Capitol Federal Financial, Inc. | | | | 71,911 | | 871 |
| Geospace Technologies Corp. (Æ) | | | | 15,116 | | 1,433 | | Capstead Mortgage Corp. (ö) | | | | 49,140 | | 594 |
| Green Plains Renewable Energy, Inc. | | | | 5,400 | | 105 | | CBL & Associates Properties, Inc. (ö) | | | | 1,100 | | 20 |
| Gulf Island Fabrication, Inc. | | | | 1,600 | | 37 | | Cedar Realty Trust, Inc. (ö) | | | | 6,386 | | 40 |
| Gulfport Energy Corp. (Æ) | | | | 21,134 | | 1,334 | | Centerstate Banks, Inc. | | | | 300 | | 3 |
| Hornbeck Offshore Services, Inc. (Æ)(Ñ) | | | | 3,300 | | 162 | | Central Pacific Financial Corp. | | | | 4,000 | | 80 |
| Key Energy Services, Inc. (Æ) | | | | 61,311 | | 484 | | Chemical Financial Corp. | | | | 24,130 | | 765 |
| Matador Resources Co. (Æ) | | | | 56,480 | | 1,053 | | Citizens & Northern Corp. | | | | 1,400 | | 29 |
| McDermott International, Inc. (Æ) | | | | 33,116 | | 303 | | CNB Financial Corp. | | | | 1,000 | | 19 |
| Nabors Industries, Ltd. | | | | 48,190 | | 819 | | CoBiz Financial, Inc. | | | | 12,389 | | 148 |
| Natural Gas Services Group, Inc. (Æ) | | | | 12,945 | | 356 | | Community Bank System, Inc. | | | | 3,391 | | 135 |
| Pacific Drilling SA(Æ) | | | | 45,007 | | 516 | | Community Trust Bancorp, Inc. | | | | 1,600 | | 72 |
| Patterson-UTI Energy, Inc. | | | | 26,694 | | 676 | | Crawford & Co. Class B | | | | 700 | | 6 |
| PDC Energy, Inc. (Æ) | | | | 12,370 | | 658 | | Credit Acceptance Corp. (Æ) | | | | 400 | | 52 |
| Pioneer Energy Services Corp. (Æ) | | | | 20,200 | | 162 | | CVB Financial Corp. | | | | 30,170 | | 515 |
| Precision Drilling Corp. (Æ) | | | | 41,060 | | 385 | | DiamondRock Hospitality Co. (ö) | | | | 53,774 | | 621 |
| Renewable Energy Group, Inc. (Æ) | | | | 10,800 | | 124 | | Dime Community Bancshares, Inc. | | | | 13,240 | | 224 |
| REX American Resources Corp. (Æ) | | | | 1,000 | | 45 | | Douglas Emmett, Inc. (ö) | | | | 2,700 | | 63 |
| Rowan Companies PLC(Æ) | | | | 27,948 | | 988 | | Eagle Bancorp, Inc. (Æ) | | | | 2,100 | | 64 |
| Superior Energy Services, Inc. | | | | 28,803 | | 766 | | EastGroup Properties, Inc. (ö) | | | | 4,800 | | 278 |
| Synergy Resources Corp. (Æ) | | | | 12,500 | | 116 | | Enstar Group, Ltd. (Æ) | | | | 700 | | 97 |
| Triangle Petroleum Corp. (Æ) | | | | 60,225 | | 501 | | Enterprise Financial Services Corp. | | | | 2,300 | | 47 |
| Unit Corp. (Æ) | | | | 18,076 | | 933 | | EPR Properties(ö) | | | | 5,092 | | 250 |
| Warren Resources, Inc. (Æ) | | | | 17,500 | | 55 | | Equity One, Inc. (ö) | | | | 1,100 | | 25 |
| Western Refining, Inc. (Ñ) | | | | 13,055 | | 554 | | Erie Indemnity Co. Class A | | | | 100 | | 7 |
| | | | | | | 16,402 | | FactSet Research Systems, Inc. | | | | 3,200 | | 347 |
| | | | | | | | | FBL Financial Group, Inc. Class A | | | | 1,500 | | 67 |
| | | | | | | | | First Bancorp | | | | 1,200 | | 20 |
| Financial Services - 18.3% | | | | | | | | First Busey Corp. | | | | 8,400 | | 49 |
| 1st United Bancorp, Inc. | | | | 1,100 | | 8 | | First Defiance Financial Corp. | | | | 1,700 | | 44 |
| Advent Software, Inc. | | | | 19,025 | | 666 | | First Financial Bancorp | | | | 50,980 | | 889 |
| Alexander & Baldwin, Inc. | | | | 13,328 | | 556 | | First Financial Corp. | | | | 2,200 | | 80 |
| American Financial Group, Inc. | | | | 1,100 | | 63 | | First Interstate Bancsystem, Inc. Class A | | | | 4,900 | | 139 |
| American National Bankshares, Inc. | | | | 1,100 | | 29 | | First Midwest Bancorp, Inc. | | | | 4,900 | | 86 |
| Amerisafe, Inc. | | | | 14,949 | | 631 | | First Republic Bank | | | | 3,700 | | 194 |
| AmREIT, Inc. Class B(ö) | | | | 600 | | 10 | | FirstMerit Corp. | | | | 4,800 | | 107 |
| Arbor Realty Trust, Inc. (ö) | | | | 5,100 | | 34 | | Forestar Group, Inc. (Æ) | | | | 23,574 | | 501 |
| Argo Group International Holdings, Ltd. | | | | 4,201 | | 195 | | Franklin Street Properties Corp. (ö) | | | | 45,888 | | 548 |
| Arlington Asset Investment Corp. Class A | | | | 1,000 | | 26 | | Gain Capital Holdings, Inc. | | | | 67,657 | | 509 |
| Armada Hoffler Properties, Inc. (ö) | | | | 1,000 | | 9 | | | | | | | | |
See accompanying notes which are an integral part of the financial statements.
Aggressive Equity Fund 37
Russell Investment Funds
Aggressive Equity Fund
Schedule of Investments, continued — December 31, 2013
| Amounts in thousands (except share amounts) | | | | Amounts in thousands (except share amounts) | | |
| |
| | | | | Principal | | Fair | | | | | | Principal | | Fair |
| | | | | Amount ($) | | Value | | | | | | Amount ($) | | Value |
| | | | | or Shares | | $ | | | | | | or Shares | | $ |
| German American Bancorp, Inc. | | | | 1,400 | | 40 | | Preferred Bank(Æ) | | | | 600 | | 12 |
| GFI Group, Inc. | | | | 119,582 | | 468 | | PrivateBancorp, Inc. Class A | | | | 55,020 | | 1,592 |
| Great Southern Bancorp, Inc. | | | | 2,478 | | 75 | | ProAssurance Corp. | | | | 2,922 | | 142 |
| Green Dot Corp. Class A(Æ)(Ñ) | | | | 11,643 | | 293 | | Provident Financial Services, Inc. | | | | 4,500 | | 87 |
| Hancock Holding Co. | | | | 31,044 | | 1,139 | | PS Business Parks, Inc. (ö) | | | | 1,400 | | 107 |
| Hanover Insurance Group, Inc. (The) | | | | 2,000 | | 119 | | RAIT Financial Trust(Ñ)(ö) | | | | 2,100 | | 19 |
| Heartland Financial USA, Inc. | | | | 700 | | 20 | | Regional Management Corp. (Æ) | | | | 3,800 | | 129 |
| Heritage Financial Corp. | | | | 1,900 | | 33 | | RLI Corp. | | | | 2,400 | | 234 |
| HFF, Inc. Class A(Æ) | | | | 2,700 | | 72 | | RLJ Lodging Trust(ö) | | | | 8,900 | | 216 |
| Hilltop Holdings, Inc. (Æ) | | | | 27,501 | | 636 | | Rockville Financial, Inc. | | | | 8,900 | | 126 |
| Home BancShares, Inc. | | | | 17,250 | | 645 | | S&T Bancorp, Inc. | | | | 1,000 | | 25 |
| Home Loan Servicing Solutions, Ltd. | | | | 2,800 | | 64 | | Sabra Health Care REIT, Inc. (ö) | | | | 9,700 | | 254 |
| HomeTrust Bancshares, Inc. (Æ) | | | | 3,000 | | 48 | | Safeguard Scientifics, Inc. (Æ) | | | | 3,781 | | 76 |
| Horace Mann Educators Corp. | | | | 8,700 | | 274 | | Safety Insurance Group, Inc. | | | | 2,200 | | 124 |
| Horizon Bancorp | | | | 1,700 | | 43 | | Sandy Spring Bancorp, Inc. | | | | 1,200 | | 34 |
| Iberiabank Corp. | | | | 28,970 | | 1,821 | | Saul Centers, Inc. (ö) | | | | 600 | | 29 |
| Infinity Property & Casualty Corp. | | | | 14,420 | | 1,035 | | Selective Insurance Group, Inc. | | | | 12,100 | | 327 |
| Interactive Brokers Group, Inc. Class A | | | | 1,000 | | 24 | | Sierra Bancorp | | | | 500 | | 8 |
| Investment Technology Group, Inc. (Æ) | | | | 13,500 | | 278 | | Simmons First National Corp. Class A | | | | 2,300 | | 85 |
| JER Investment Trust, Inc. (Æ)(Þ) | | | | 1,771 | | — | | Southwest Bancorp, Inc. (Æ) | | | | 200 | | 3 |
| KKR Financial Holdings LLC | | | | 7,402 | | 90 | | Sovran Self Storage, Inc. (ö) | | | | 3,400 | | 222 |
| Lakeland Financial Corp. | | | | 3,631 | | 142 | | Spirit Realty Capital, Inc. (ö) | | | | 6,000 | | 59 |
| LaSalle Hotel Properties(ö) | | | | 8,806 | | 272 | | State Auto Financial Corp. | | | | 500 | | 11 |
| LTC Properties, Inc. (ö) | | | | 3,400 | | 120 | | State Bank Financial Corp. | | | | 7,200 | | 131 |
| Maiden Holdings, Ltd. | | | | 29,300 | | 320 | | Stellus Capital Investment Corp. | | | | 500 | | 7 |
| MainSource Financial Group, Inc. | | | | 4,100 | | 74 | | Summit Hotel Properties, Inc. (ö) | | | | 51,590 | | 464 |
| Manning & Napier, Inc. Class A | | | | 5,810 | | 103 | | Susquehanna Bancshares, Inc. | | | | 58,300 | | 749 |
| MarketAxess Holdings, Inc. | | | | 15,022 | | 1,005 | | SVB Financial Group(Æ)(Ñ) | | | | 7,160 | | 751 |
| MB Financial, Inc. | | | | 9,400 | | 302 | | Symetra Financial Corp. | | | | 21,962 | | 416 |
| MCG Capital Corp. | | | | 17,300 | | 76 | | Taubman Centers, Inc. (ö) | | | | 1,000 | | 64 |
| Mercantile Bank Corp. | | | | 3,629 | | 78 | | Territorial Bancorp, Inc. | | | | 1,449 | | 34 |
| Merchants Bancshares, Inc. | | | | 1,219 | | 41 | | Texas Capital Bancshares, Inc. (Æ) | | | | 13,480 | | 838 |
| Metro Bancorp, Inc. (Æ) | | | | 1,200 | | 26 | | Trico Bancshares | | | | 3,600 | | 102 |
| MetroCorp Bancshares, Inc. | | | | 4,772 | | 72 | | UMB Financial Corp. | | | | 5,960 | | 383 |
| MoneyGram International, Inc. (Æ) | | | | 5,400 | | 112 | | United Fire Group, Inc. | | | | 3,978 | | 114 |
| Morningstar, Inc. | | | | 6,000 | | 469 | | ViewPoint Financial Group, Inc. | | | | 13,435 | | 369 |
| National Bank Holdings Corp. Class A | | | | 25,660 | | 549 | | Waddell & Reed Financial, Inc. Class A | | | | 2,900 | | 189 |
| National Bankshares, Inc. | | | | 500 | | 18 | | Washington Banking Co. | | | | 4,037 | | 72 |
| National Health Investors, Inc. (ö) | | | | 3,500 | | 196 | | Washington Federal, Inc. | | | | 35,505 | | 827 |
| National Interstate Corp. | | | | 5,156 | | 119 | | Washington Real Estate Investment Trust(ö) | | | | 10,770 | | 252 |
| National Penn Bancshares, Inc. | | | | 33,730 | | 382 | | Webster Financial Corp. | | | | 7,200 | | 224 |
| Navigators Group, Inc. (The)(Æ) | | | | 3,500 | | 221 | | WesBanco, Inc. | | | | 4,400 | | 141 |
| NBT Bancorp, Inc. | | | | 600 | | 16 | | Westamerica Bancorporation(Ñ) | | | | 13,820 | | 780 |
| Nelnet, Inc. Class A | | | | 800 | | 34 | | Westfield Financial, Inc. | | | | 1,200 | | 9 |
| New Residential Investment Corp. (ö) | | | | 132,013 | | 882 | | Westwood Holdings Group, Inc. | | | | 11,475 | | 710 |
| Northfield Bancorp, Inc. | | | | 27,540 | | 363 | | Wilshire Bancorp, Inc. | | | | 15,300 | | 167 |
| Northrim BanCorp, Inc. | | | | 7,445 | | 195 | | Winthrop Realty Trust(ö) | | | | 7,828 | | 86 |
| Northwest Bancshares, Inc. | | | | 12,670 | | 187 | | WSFS Financial Corp. | | | | 1,900 | | 147 |
| OceanFirst Financial Corp. | | | | 4,000 | | 69 | | | | | | | | 43,543 |
| Old National Bancorp | | | | 27,780 | | 427 | | | | | | | | |
| One Liberty Properties, Inc. (ö) | | | | 2,100 | | 42 | | Health Care - 8.6% | | | | | | |
| Oritani Financial Corp. | | | | 16,890 | | 271 | | Abaxis, Inc. (Æ) | | | | 19,100 | | 764 |
| Pacific Continental Corp. | | | | 4,676 | | 75 | | Accelrys, Inc. (Æ) | | | | 44,535 | | 425 |
| Park Sterling Corp. | | | | 6,100 | | 44 | | Affymetrix, Inc. (Æ)(Ñ) | | | | 14,700 | | 126 |
| Peoples Bancorp, Inc. | | | | 2,400 | | 54 | | Air Methods Corp. (Æ) | | | | 16,160 | | 943 |
| Piper Jaffray Cos. (Æ) | | | | 15,949 | | 631 | | Akorn, Inc. (Æ) | | | | 42,190 | | 1,039 |
| Platinum Underwriters Holdings, Ltd. | | | | 7,400 | | 453 | | Align Technology, Inc. (Æ) | | | | 17,570 | | 1,004 |
| Post Properties, Inc. (ö) | | | | 800 | | 36 | | Analogic Corp. | | | | 1,200 | | 106 |
| Potlatch Corp. (ö) | | | | 500 | | 21 | | Bio-Rad Laboratories, Inc. Class A(Æ) | | | | 700 | | 87 |
| |
| See accompanying notes which are an integral part of the financial statements. | | | | | | | | |
38 Aggressive Equity Fund
Russell Investment Funds
Aggressive Equity Fund
Schedule of Investments, continued — December 31, 2013
| Amounts in thousands (except share amounts) | | | | Amounts in thousands (except share amounts) | | |
| |
| | | | | Principal | | Fair | | | | | | Principal | | Fair |
| | | | | Amount ($) | | Value | | | | | | Amount ($) | | Value |
| | | | | or Shares | | $ | | | | | | or Shares | | $ |
| Bio-Reference Labs, Inc. (Æ) | | | | 2,800 | | 72 | | Insteel Industries, Inc. | | | | 5,771 | | 131 |
| BioScrip, Inc. (Æ) | | | | 48,608 | | 360 | | Interface, Inc. Class A | | | | 17,553 | | 385 |
| Cantel Medical Corp. | | | | 16,228 | | 550 | | Kaiser Aluminum Corp. | | | | 866 | | 61 |
| Centene Corp. (Æ) | | | | 19,340 | | 1,140 | | Koppers Holdings, Inc. | | | | 12,881 | | 589 |
| CONMED Corp. | | | | 21,427 | | 911 | | Kronos Worldwide, Inc. (Ñ) | | | | 47,495 | | 905 |
| Delcath Systems, Inc. (Æ) | | | | 12,300 | | 3 | | Landec Corp. (Æ) | | | | 12,812 | | 155 |
| Dynavax Technologies Corp. (Æ)(Ñ) | | | | 30,600 | | 60 | | LB Foster Co. Class A | | | | 3,100 | | 147 |
| Emergent Biosolutions, Inc. (Æ) | | | | 10,500 | | 241 | | Louisiana-Pacific Corp. (Æ) | | | | 700 | | 13 |
| Exactech, Inc. (Æ) | | | | 10,800 | | 257 | | LSI Industries, Inc. | | | | 500 | | 4 |
| Greatbatch, Inc. (Æ) | | | | 4,800 | | 212 | | Materion Corp. | | | | 3,000 | | 93 |
| Hanger, Inc. (Æ) | | | | 800 | | 31 | | Minerals Technologies, Inc. | | | | 1,400 | | 84 |
| Health Net, Inc. (Æ) | | | | 800 | | 24 | | MRC Global, Inc. (Æ) | | | | 5,800 | | 187 |
| HealthSouth Corp. | | | | 6,400 | | 213 | | Mueller Industries, Inc. | | | | 2,000 | | 126 |
| ICON PLC(Æ) | | | | 16,940 | | 685 | | Neenah Paper, Inc. | | | | 600 | | 26 |
| Lannett Co. , Inc. (Æ) | | | | 7,685 | | 254 | | NN, Inc. | | | | 10,328 | | 209 |
| LHC Group, Inc. (Æ) | | | | 1,700 | | 41 | | Noranda Aluminum Holding Corp. | | | | 11,900 | | 39 |
| Magellan Health Services, Inc. (Æ) | | | | 7,300 | | 437 | | Northwest Pipe Co. (Æ) | | | | 2,000 | | 76 |
| Masimo Corp. (Æ) | | | | 4,052 | | 118 | | Olympic Steel, Inc. | | | | 2,500 | | 72 |
| Medidata Solutions, Inc. (Æ) | | | | 26,230 | | 1,589 | | OM Group, Inc. (Æ) | | | | 28,462 | | 1,036 |
| Meridian Bioscience, Inc. (Ñ) | | | | 24,707 | | 655 | | Omnova Solutions, Inc. (Æ) | | | | 38,600 | | 352 |
| Molina Healthcare, Inc. (Æ) | | | | 3,800 | | 132 | | Packaging Corp. of America | | | | 1,800 | | 114 |
| National Research Corp. Class A(Æ) | | | | 25,785 | | 485 | | Patrick Industries, Inc. (Æ) | | | | 4,500 | | 130 |
| National Research Corp. Class B(Æ) | | | | 4,897 | | 170 | | PGT, Inc. (Æ) | | | | 27,400 | | 277 |
| Natus Medical, Inc. (Æ) | | | | 6,000 | | 135 | | Quaker Chemical Corp. | | | | 1,900 | | 146 |
| Neogen Corp. (Æ) | | | | 29,060 | | 1,328 | | Quanex Building Products Corp. | | | | 39,270 | | 782 |
| Omnicell, Inc. (Æ) | | | | 23,015 | | 588 | | Ring Energy, Inc. (Æ) | | | | 6,900 | | 84 |
| Pacific Biosciences of California, Inc. (Æ) | | | | 14,000 | | 73 | | RTI International Metals, Inc. (Æ) | | | | 16,768 | | 574 |
| PAREXEL International Corp. (Æ) | | | | 16,550 | | 748 | | Simpson Manufacturing Co. , Inc. | | | | 43,330 | | 1,591 |
| PharMerica Corp. (Æ) | | | | 4,400 | | 95 | | Steel Dynamics, Inc. | | | | 1,600 | | 31 |
| Prestige Brands Holdings, Inc. (Æ) | | | | 22,870 | | 819 | | Stillwater Mining Co. (Æ) | | | | 40,652 | | 502 |
| Quality Systems, Inc. | | | | 25,035 | | 527 | | Tronox, Ltd. Class A | | | | 31,740 | | 732 |
| Rigel Pharmaceuticals, Inc. (Æ) | | | | 23,800 | | 68 | | Universal Forest Products, Inc. | | | | 9,437 | | 492 |
| RTI Surgical, Inc. (Æ) | | | | 137,194 | | 486 | | Universal Stainless & Alloy Products, Inc. | | | | | | |
| SIGA Technologies, Inc. (Æ) | | | | 4,300 | | 14 | | (Æ) | | | | 17,919 | | 646 |
| STERIS Corp. | | | | 10,721 | | 515 | | Valspar Corp. | | | | 200 | | 14 |
| Streamline Health Solutions, Inc. (Æ) | | | | 15,400 | | 107 | | Watsco, Inc. | | | | 2,500 | | 240 |
| SurModics, Inc. (Æ) | | | | 400 | | 10 | | | | | | | | 16,651 |
| Techne Corp. | | | | 7,140 | | 676 | | | | | | | | |
| Thoratec Corp. (Æ) | | | | 6,100 | | 223 | | Producer Durables - 16.3% | | | | | | |
| Triple-S Management Corp. Class B(Æ) | | | | 9,300 | | 181 | | ABM Industries, Inc. | | | | 50,235 | | 1,436 |
| US Physical Therapy, Inc. | | | | 10,243 | | 361 | | ACCO Brands Corp. (Æ) | | | | 45,763 | | 308 |
| WellCare Health Plans, Inc. (Æ) | | | | 2,500 | | 176 | | Advisory Board Co. (The)(Æ) | | | | 29,840 | | 1,900 |
| West Pharmaceutical Services, Inc. | | | | 4,642 | | 228 | | Aerovironment, Inc. (Æ) | | | | 7,825 | | 228 |
| | | | | | | 20,492 | | AGCO Corp. | | | | 1,900 | | 112 |
| | | | | | | | | Air Lease Corp. Class A | | | | 6,900 | | 214 |
| Materials and Processing - 7.0% | | | | | | | | Air Transport Services Group, Inc. (Æ) | | | | 21,141 | | 171 |
| A Schulman, Inc. | | | | 1,900 | | 67 | | Aircastle, Ltd. | | | | 14,200 | | 272 |
| AAON, Inc. | | | | 28,930 | | 924 | | Alamo Group, Inc. | | | | 1,400 | | 85 |
| AEP Industries, Inc. (Æ) | | | | 1,800 | | 95 | | Albany International Corp. Class A | | | | 4,700 | | 169 |
| Balchem Corp. | | | | 14,330 | | 841 | | AO Smith Corp. | | | | 5,800 | | 313 |
| Beacon Roofing Supply, Inc. (Æ) | | | | 15,810 | | 637 | | Astec Industries, Inc. | | | | 29,995 | | 1,158 |
| Boise Cascade Co. (Æ) | | | | 1,300 | | 38 | | Astronics Corp. Class B(Æ) | | | | 699 | | 35 |
| Cabot Corp. | | | | 43,073 | | 2,215 | | Astronics Corp. (Æ) | | | | 3,299 | | 168 |
| Comfort Systems USA, Inc. | | | | 10,770 | | 209 | | Atlas Air Worldwide Holdings, Inc. (Æ) | | | | 6,331 | | 261 |
| Commercial Metals Co. | | | | 9,600 | | 195 | | AZZ, Inc. (Ñ) | | | | 14,566 | | 712 |
| FutureFuel Corp. | | | | 5,100 | | 81 | | Barrett Business Services, Inc. | | | | 1,100 | | 102 |
| Gibraltar Industries, Inc. (Æ) | | | | 2,400 | | 45 | | Booz Allen Hamilton Holding Corp. Class A | | | | 3,900 | | 75 |
| Haynes International, Inc. | | | | 4,230 | | 234 | | Briggs & Stratton Corp. | | | | 3,870 | | 84 |
| Huntsman Corp. | | | | 1,000 | | 25 | | Brink's Co. (The) | | | | 6,100 | | 208 |
See accompanying notes which are an integral part of the financial statements.
Aggressive Equity Fund 39
Russell Investment Funds
Aggressive Equity Fund
Schedule of Investments, continued — December 31, 2013
| Amounts in thousands (except share amounts) | | | | Amounts in thousands (except share amounts) | | |
| |
| | | | | Principal | | Fair | | | | | | Principal | | Fair |
| | | | | Amount ($) | | Value | | | | | | Amount ($) | | Value |
| | | | | or Shares | | $ | | | | | | or Shares | | $ |
| Bristow Group, Inc. | | | | 1,800 | | 135 | | Orion Marine Group, Inc. (Æ) | | | | 5,032 | | 61 |
| CDI Corp. | | | | 2,200 | | 41 | | Pacer International, Inc. (Æ) | | | | 7,300 | | 60 |
| Chart Industries, Inc. (Æ) | | | | 8,041 | | 769 | | Performant Financial Corp. (Æ) | | | | 8,200 | | 84 |
| CIRCOR International, Inc. | | | | 5,644 | | 456 | | Powell Industries, Inc. | | | | 1,300 | | 87 |
| Columbus McKinnon Corp. (Æ) | | | | 30,057 | | 816 | | PRGX Global, Inc. (Æ) | | | | 2,300 | | 15 |
| Compass Diversified Holdings | | | | 32,500 | | 638 | | Primoris Services Corp. | | | | 5,200 | | 162 |
| CoStar Group, Inc. (Æ) | | | | 8,000 | | 1,476 | | Proto Labs, Inc. (Æ)(Ñ) | | | | 8,710 | | 620 |
| Deluxe Corp. | | | | 2,200 | | 115 | | Quad/Graphics, Inc. | | | | 5,100 | | 139 |
| Ducommun, Inc. (Æ) | | | | 11,021 | | 329 | | Raven Industries, Inc. | | | | 26,780 | | 1,102 |
| Echo Global Logistics, Inc. (Æ) | | | | 400 | | 9 | | Regal-Beloit Corp. | | | | 12,140 | | 895 |
| EMCOR Group, Inc. | | | | 13,100 | | 556 | | Resources Connection, Inc. | | | | 53,930 | | 773 |
| Encore Wire Corp. | | | | 600 | | 33 | | Roadrunner Transportation Systems, Inc. (Æ) | | | | 1,400 | | 38 |
| EnerSys, Inc. | | | | 21,745 | | 1,524 | | Rollins, Inc. | | | | 19,115 | | 579 |
| Engility Holdings, Inc. (Æ) | | | | 3,000 | | 100 | | Ryder System, Inc. | | | | 1,000 | | 74 |
| Ennis, Inc. | | | | 13,095 | | 232 | | SkyWest, Inc. | | | | 9,400 | | 139 |
| Exponent, Inc. | | | | 1,800 | | 139 | | Sun Hydraulics Corp. | | | | 33,656 | | 1,375 |
| Faro Technologies, Inc. (Æ) | | | | 16,985 | | 990 | | Sykes Enterprises, Inc. (Æ) | | | | 1,600 | | 35 |
| Forward Air Corp. | | | | 14,720 | | 646 | | TeleTech Holdings, Inc. (Æ) | | | | 3,100 | | 74 |
| Fuel Tech, Inc. (Æ) | | | | 1,700 | | 12 | | Tennant Co. | | | | 1,000 | | 68 |
| G&K Services, Inc. Class A | | | | 2,000 | | 124 | | Tidewater, Inc. | | | | 12,571 | | 745 |
| General Cable Corp. | | | | 16,520 | | 486 | | Triumph Group, Inc. | | | | 5,930 | | 451 |
| Global Power Equipment Group, Inc. | | | | 3,500 | | 68 | | Tsakos Energy Navigation, Ltd. (Ñ) | | | | 46,840 | | 282 |
| GP Strategies Corp. (Æ) | | | | 10,400 | | 310 | | UniFirst Corp. | | | | 1,800 | | 193 |
| GrafTech International, Ltd. (Æ)(Ñ) | | | | 78,191 | | 878 | | Vishay Precision Group, Inc. (Æ) | | | | 3,400 | | 51 |
| Granite Construction, Inc. | | | | 60,325 | | 2,109 | | VSE Corp. | | | | 1,000 | | 48 |
| Greenbrier Cos. , Inc. (Æ) | | | | 13,763 | | 452 | | Wabtec Corp. | | | | 2,166 | | 161 |
| Gulfmark Offshore, Inc. Class A | | | | 1,200 | | 57 | | Wesco Aircraft Holdings, Inc. (Æ) | | | | 21,130 | | 463 |
| Healthcare Services Group, Inc. | | | | 43,190 | | 1,225 | | | | | | | | 38,629 |
| Heartland Express, Inc. | | | | 10,200 | | 200 | | | | | | | | |
| Heidrick & Struggles International, Inc. | | | | 1,300 | | 26 | | Technology - 18.4% | | | | | | |
| Herman Miller, Inc. | | | | 2,100 | | 62 | | Acacia Research Corp. (Ñ) | | | | 72,719 | | 1,057 |
| Houston Wire & Cable Co. | | | | 1,500 | | 20 | | ACI Worldwide, Inc. (Æ) | | | | 16,860 | | 1,097 |
| Hub Group, Inc. Class A(Æ) | | | | 5,400 | | 215 | | ADTRAN, Inc. | | | | 28,415 | | 767 |
| Hudson Technologies, Inc. (Æ)(Ñ) | | | | 22,300 | | 83 | | Aeroflex Holding Corp. (Æ) | | | | 4,900 | | 32 |
| Huntington Ingalls Industries, Inc. | | | | 1,400 | | 126 | | Agilysys, Inc. (Æ) | | | | 1,795 | | 25 |
| Hyster-Yale Materials Handling, Inc. | | | | 1,000 | | 93 | | American Science & Engineering, Inc. | | | | 500 | | 36 |
| ICF International, Inc. (Æ) | | | | 1,900 | | 66 | | American Software, Inc. Class A(Æ) | | | | 1,000 | | 10 |
| Insperity, Inc. | | | | 1,800 | | 65 | | ANADIGICS, Inc. (Æ) | | | | 22,800 | | 42 |
| Kadant, Inc. | | | | 2,153 | | 87 | | Applied Micro Circuits Corp. (Æ) | | | | 54,422 | | 728 |
| Kforce, Inc. | | | | 1,700 | | 35 | | Arris Group, Inc. (Æ) | | | | 8,100 | | 197 |
| Kimball International, Inc. Class B | | | | 2,500 | | 38 | | Aruba Networks, Inc. (Æ) | | | | 37,100 | | 664 |
| Knight Transportation, Inc. | | | | 37,400 | | 686 | | Aspen Technology, Inc. (Æ) | | | | 14,022 | | 586 |
| Korn/Ferry International(Æ) | | | | 14,228 | | 372 | | Aviat Networks, Inc. (Æ) | | | | 9,700 | | 22 |
| Layne Christensen Co. (Æ) | | | | 26,115 | | 446 | | Bel Fuse, Inc. Class B | | | | 2,100 | | 45 |
| Lexmark International, Inc. Class A | | | | 9,900 | | 352 | | Benchmark Electronics, Inc. (Æ) | | | | 8,700 | | 201 |
| Liquidity Services, Inc. (Æ) | | | | 3,700 | | 84 | | Blackbaud, Inc. | | | | 18,300 | | 689 |
| Mac-Gray Corp. | | | | 2,200 | | 47 | | Bottomline Technologies de, Inc. (Æ) | | | | 26,780 | | 968 |
| Manpowergroup, Inc. | | | | 1,800 | | 155 | | Brocade Communications Systems, Inc. (Æ) | | | | 2,100 | | 19 |
| Marten Transport, Ltd. | | | | 17,267 | | 349 | | Brooks Automation, Inc. | | | | 74,280 | | 779 |
| Matson, Inc. | | | | 3,000 | | 78 | | Calix, Inc. (Æ) | | | | 5,700 | | 55 |
| MAXIMUS, Inc. | | | | 41,010 | | 1,803 | | Ceva, Inc. (Æ) | | | | 26,490 | | 403 |
| Measurement Specialties, Inc. (Æ) | | | | 3,727 | | 226 | | Ciena Corp. (Æ)(Ñ) | | | | 10,970 | | 263 |
| Mesa Laboratories, Inc. | | | | 2,845 | | 224 | | Cohu, Inc. (Å) | | | | 37,150 | | 390 |
| Middleby Corp. (Æ) | | | | 1,000 | | 240 | | Commtouch Software, Ltd. (Æ)(Ñ) | | | | 17,100 | | 53 |
| Mistras Group, Inc. (Æ) | | | | 2,700 | | 56 | | CommVault Systems, Inc. (Æ) | | | | 3,000 | | 225 |
| Modine Manufacturing Co. (Æ) | | | | 9,200 | | 118 | | Computer Task Group, Inc. | | | | 21,751 | | 411 |
| MYR Group, Inc. (Æ) | | | | 800 | | 20 | | comScore, Inc. (Æ) | | | | 3,399 | | 97 |
| Old Dominion Freight Line, Inc. (Æ) | | | | 6,056 | | 321 | | Comtech Telecommunications Corp. | | | | 7,100 | | 224 |
| Orbital Sciences Corp. (Æ) | | | | 18,300 | | 426 | | CSG Systems International, Inc. | | | | 12,700 | | 373 |
See accompanying notes which are an integral part of the financial statements.
40 Aggressive Equity Fund
Russell Investment Funds
Aggressive Equity Fund
Schedule of Investments, continued — December 31, 2013
| Amounts in thousands (except share amounts) | | | | Amounts in thousands (except share amounts) | | |
| |
| | | | | Principal | | Fair | | | | | | Principal | | Fair |
| | | | | Amount ($) | | Value | | | | | | Amount ($) | | Value |
| | | | | or Shares | | $ | | | | | | or Shares | | $ |
| Daktronics, Inc. | | | | 6,200 | | 97 | | Procera Networks, Inc. (Æ)(Ñ) | | | | 23,814 | | 358 |
| Demand Media, Inc. (Æ) | | | | 13,200 | | 76 | | Pros Holdings, Inc. (Æ) | | | | 20,560 | | 820 |
| Diebold, Inc. | | | | 28,870 | | 953 | | Qlik Technologies, Inc. (Æ) | | | | 19,060 | | 508 |
| Digi International, Inc. (Æ) | | | | 7,100 | | 86 | | QLogic Corp. (Æ) | | | | 26,200 | | 310 |
| Digital River, Inc. (Æ) | | | | 11,843 | | 219 | | Quantum Corp. (Æ) | | | | 36,000 | | 43 |
| DSP Group, Inc. (Æ) | | | | 6,800 | | 66 | | RMG Networks Holding Corp. (Æ) | | | | 7,300 | | 35 |
| Echelon Corp. (Æ) | | | | 7,200 | | 15 | | Sapient Corp. (Æ) | | | | 1,962 | | 34 |
| Electro Scientific Industries, Inc. | | | | 77,588 | | 812 | | SciQuest, Inc. (Æ) | | | | 29,325 | | 835 |
| Electronic Arts, Inc. (Æ) | | | | 2,700 | | 62 | | Seachange International, Inc. (Æ) | | | | 15,912 | | 193 |
| Ellie Mae, Inc. (Æ)(Ñ) | | | | 26,160 | | 703 | | ShoreTel, Inc. (Æ) | | | | 37,800 | | 351 |
| Emulex Corp. (Æ) | | | | 24,060 | | 172 | | Sigma Designs, Inc. (Æ) | | | | 8,200 | | 39 |
| Entropic Communications, Inc. (Æ) | | | | 2,800 | | 13 | | Silicon Image, Inc. (Æ) | | | | 13,200 | | 81 |
| Envestnet, Inc. (Æ) | | | | 14,590 | | 588 | | Skyworks Solutions, Inc. (Æ) | | | | 4,853 | | 139 |
| ePlus, Inc. (Æ) | | | | 1,000 | | 57 | | Spansion, Inc. Class A(Æ) | | | | 23,681 | | 329 |
| Exa Corp. (Æ) | | | | 11,100 | | 147 | | Sparton Corp. (Æ) | | | | 4,650 | | 130 |
| Exar Corp. (Æ) | | | | 1,800 | | 21 | | SPS Commerce, Inc. (Æ) | | | | 18,645 | | 1,218 |
| Extreme Networks, Inc. (Æ) | | | | 67,410 | | 472 | | Stratasys, Ltd. (Æ)(Ñ) | | | | 5,180 | | 698 |
| FEI Co. | | | | 2,900 | | 259 | | Super Micro Computer, Inc. (Æ) | | | | 11,700 | | 201 |
| FleetMatics Group PLC(Æ)(Ñ) | | | | 15,525 | | 671 | | Synchronoss Technologies, Inc. (Æ) | | | | 27,040 | | 840 |
| FormFactor, Inc. (Æ) | | | | 52,535 | | 316 | | SYNNEX Corp. (Æ) | | | | 1,000 | | 67 |
| Glu Mobile, Inc. (Æ)(Ñ) | | | | 25,299 | | 98 | | Syntel, Inc. (Æ) | | | | 2,000 | | 182 |
| GSI Group, Inc. (Æ) | | | | 8,600 | | 97 | | Take-Two Interactive Software, Inc. (Æ) | | | | 9,308 | | 162 |
| Harmonic, Inc. (Æ) | | | | 53,107 | | 392 | | TeleNav, Inc. (Æ) | | | | 12,617 | | 83 |
| Hittite Microwave Corp. (Æ) | | | | 9,000 | | 556 | | Tessco Technologies, Inc. | | | | 14,872 | | 600 |
| iGATE Corp. (Æ) | | | | 3,000 | | 120 | | Tessera Technologies, Inc. | | | | 53,725 | | 1,060 |
| Imperva, Inc. (Æ) | | | | 14,670 | | 706 | | TTM Technologies, Inc. (Æ) | | | | 1,500 | | 13 |
| Inphi Corp. (Æ) | | | | 24,960 | | 322 | | Tyler Technologies, Inc. (Æ) | | | | 19,215 | | 1,964 |
| Insight Enterprises, Inc. (Æ) | | | | 6,400 | | 145 | | Ultimate Software Group, Inc. (Æ) | | | | 1,080 | | 165 |
| Integrated Device Technology, Inc. (Æ) | | | | 37,400 | | 381 | | United Online, Inc. | | | | 3,200 | | 44 |
| Inteliquent, Inc. | | | | 8,700 | | 99 | | Unwired Planet, Inc. (Æ) | | | | 5,300 | | 7 |
| Interactive Intelligence Group, Inc. (Æ) | | | | 10,533 | | 710 | | Vishay Intertechnology, Inc. (Æ) | | | | 72,981 | | 968 |
| InterDigital, Inc. | | | | 1,948 | | 57 | | Workday, Inc. Class A(Æ) | | | | 2,000 | | 166 |
| Intersil Corp. Class A | | | | 87,755 | | 1,007 | | Xyratex, Ltd. | | | | 25,760 | | 342 |
| InvenSense, Inc. Class A(Æ)(Ñ) | | | | 36,390 | | 756 | | | | | | | | 43,806 |
| Kemet Corp. (Æ) | | | | 5,500 | | 31 | | | | | | | | |
| KEYW Holding Corp. (The)(Æ)(Ñ) | | | | 13,664 | | 184 | | Utilities - 2.7% | | | | | | |
| Kulicke & Soffa Industries, Inc. (Æ) | | | | 74,153 | | 987 | | Allete, Inc. | | | | 1,400 | | 70 |
| KVH Industries, Inc. (Æ) | | | | 1,100 | | 14 | | American States Water Co. | | | | 14,400 | | 414 |
| Lattice Semiconductor Corp. (Æ) | | | | 24,513 | | 135 | | Artesian Resources Corp. Class A | | | | 400 | | 9 |
| Limelight Networks, Inc. (Æ) | | | | 5,800 | | 11 | | California Water Service Group | | | | 23,330 | | 538 |
| LTX-Credence Corp. (Æ) | | | | 52,016 | | 415 | | Cbeyond, Inc. (Æ) | | | | 7,100 | | 49 |
| MaxLinear, Inc. Class A(Æ) | | | | 4,700 | | 49 | | Chesapeake Utilities Corp. | | | | 100 | | 6 |
| MeetMe, Inc. (Æ) | | | | 6,200 | | 11 | | Cleco Corp. | | | | 2,500 | | 117 |
| Mentor Graphics Corp. | | | | 9,232 | | 222 | | Connecticut Water Service, Inc. | | | | 800 | | 28 |
| Mercury Systems, Inc. (Æ) | | | | 42,679 | | 467 | | Consolidated Water Co. , Ltd. | | | | 900 | | 13 |
| Micrel, Inc. | | | | 118,700 | | 1,173 | | El Paso Electric Co. | | | | 3,600 | | 126 |
| MKS Instruments, Inc. | | | | 29,160 | | 873 | | Energen Corp. | | | | 500 | | 35 |
| NeoPhotonics Corp. (Æ) | | | | 2,900 | | 20 | | Hawaiian Electric Industries, Inc. (Ñ) | | | | 28,470 | | 742 |
| Newport Corp. (Æ) | | | | 5,800 | | 105 | | IDT Corp. Class B | | | | 1,800 | | 32 |
| NIC, Inc. | | | | 38,230 | | 951 | | Laclede Group, Inc. (The) | | �� | | 9,530 | | 434 |
| Novatel Wireless, Inc. (Æ) | | | | 8,700 | | 21 | | magicJack VocalTec, Ltd. (Æ)(Ñ) | | | | 5,300 | | 63 |
| NVE Corp. (Æ) | | | | 4,765 | | 278 | | Northwest Natural Gas Co. (Ñ) | | | | 16,040 | | 687 |
| OpenTable, Inc. (Æ) | | | | 8,745 | | 694 | | NorthWestern Corp. | | | | 3,500 | | 152 |
| Oplink Communications, Inc. (Æ) | | | | 32,285 | | 601 | | NTELOS Holdings Corp. | | | | 1,200 | | 24 |
| PC Connection, Inc. | | | | 4,200 | | 104 | | Piedmont Natural Gas Co. , Inc. (Ñ) | | | | 8,570 | | 284 |
| Pericom Semiconductor Corp. (Æ) | | | | 4,100 | | 36 | | Pike Electric Corp. (Æ) | | | | 9,900 | | 105 |
| Photronics, Inc. (Æ) | | | | 77,235 | | 697 | | PNM Resources, Inc. | | | | 8,200 | | 198 |
| Plantronics, Inc. | | | | 4,500 | | 209 | | Portland General Electric Co. | | | | 27,545 | | 832 |
| Polycom, Inc. (Æ) | | | | 73,345 | | 824 | | Towerstream Corp. (Æ) | | | | 34,022 | | 101 |
See accompanying notes which are an integral part of the financial statements.
Aggressive Equity Fund 41
Russell Investment Funds
Aggressive Equity Fund
Schedule of Investments, continued — December 31, 2013
| Amounts in thousands (except share amounts) | | |
| | | | | Principal | | Fair |
| | | | | Amount ($) | | Value |
| | | | | or Shares | | $ |
| UIL Holdings Corp. | | | | 27,675 | | 1,072 |
| Unitil Corp. | | | | 5,018 | | 153 |
| WGL Holdings, Inc. | | | | 5,200 | | 208 |
| | | | | | | 6,492 |
| |
| Total Common Stocks | | | | | | |
| (cost $176,017) | | | | | | 223,504 |
| Short-Term Investments - 5.3% | | | | | | |
| Russell U. S. Cash Management Fund | | 12,524,428 (∞) | | 12,524 |
| Total Short-Term Investments | | | | | | |
| (cost $12,524) | | | | | | 12,524 |
| Other Securities - 8.0% | | | | | | |
| Russell U. S. Cash Collateral Fund(×) | | 19,123,460 (∞) | | 19,123 |
| Total Other Securities | | | | | | |
| (cost $19,123) | | | | | | 19,123 |
| Total Investments 107.3% | | | | | | |
| (identified cost $207,664) | | | | | | 255,151 |
| |
| Other Assets and Liabilities, | | | | | | |
| Net - (7.3%) | | | | | | (17,323) |
| |
| Net Assets - 100.0% | | | | | | 237,828 |
See accompanying notes which are an integral part of the financial statements.
42 Aggressive Equity Fund
Russell Investment Funds
Aggressive Equity Fund
Schedule of Investments, continued — December 31, 2013
| Restricted Securities | | | | | | | | | | | | | | | | | | | | | | | | |
| Amounts in thousands (except share and cost per unit amounts) | | | | | | | | | | | | | | | | | | | | | | |
| | | | | | Principal | | | | | | | Cost per | | | | | Cost | | | | | Fair Value |
| % of Net Assets | | Acquisition | | Amount ($) | | | | | | | Unit | | | | | (000) | | | | | | (000) |
| Securities | | Date | | or Shares | | | | | | | $ | | | | | | $ | | | | | | $ |
| 0.2% | | | | | | | | | | | | | | | | | | | | | | | | | |
| Cohu, Inc. | | 03/05/07 | | 37,150 | | | | | | 10.85 | | | 401 | | | | | | 390 |
| | | | | | | | | | | | | | | | | | | | | | | | | | 390 |
| For a description of restricted securities see note 9 in the Notes to Financial Statements. | | | | | | | | | | | | | | | | | |
| |
| Futures Contracts | | | | | | | | | | | | | | | | | | | | | | | | |
| Amounts in thousands (except contract amounts) | | | | | | | | | | | | | | | | | | | | | | | | |
| | | | | | | | | | | | | | | | | | | | | | | | | | Unrealized |
| | | | | | | | | | | | | | | | | | | | | | | | | | Appreciation |
| | | | | | Number of | | Notional | | Expiration | | | | | (Depreciation) |
| | | | | | Contracts | | Amount | | | | | Date | | | | | | | | $ |
| Long Positions | | | | | | | | | | | | | | | | | | | | | | | | |
| Russell 2000 Mini Index Futures (CME) | | | | 112 | | USD | 13,008 | | | | | 03/14 | | | | | | | | | 582 |
| Total Unrealized Appreciation (Depreciation) on Open Futures Contracts (å) | | | | | | | | | | | | | | | | | | | | | | 582 |
| Presentation of Portfolio Holdings | | | | | | | | | | | | | | | | | | | |
| |
| Amounts in thousands | | | | | | | | | | | | | | | | | | | |
| | | | | | | | | Fair Value | | | | | | | | | |
| | | | | | | | | | | | | | | | | | | | % of Net |
| Portfolio Summary | | | | Level 1 | | | | Level 2 | | | | Level 3 | | | | | | Total | Assets |
| Common Stocks | | | | | | | | | | | | | | | | | | | |
| Consumer Discretionary | | $ | | 32,366 | | $ | | — | | $ | | | | — | | $ | | 32,366 | 13 . 6 |
| Consumer Staples | | | | 5,123 | | | | — | | | | | | — | | | | 5,123 | 2 . 2 |
| Energy | | | | 16,402 | | | | — | | | | | | — | | | | 16,402 | 6 . 9 |
| Financial Services | | | | 43,543 | | | | — | | | | | | — | | | | 43,543 | 18 . 3 |
| Health Care | | | | 20,492 | | | | — | | | | | | — | | | | 20,492 | 8 . 6 |
| Materials and Processing | | | | 16,651 | | | | — | | | | | | — | | | | 16,651 | 7 . 0 |
| Producer Durables | | | | 38,629 | | | | — | | | | | | — | | | | 38,629 | 16 . 3 |
| Technology | | | | 43,806 | | | | — | | | | | | — | | | | 43,806 | 18 . 4 |
| Utilities | | | | 6,492 | | | | — | | | | | | — | | | | 6,492 | 2 . 7 |
| Short-Term Investments | | | | — | | | | 12,524 | | | | | | — | | | | 12,524 | 5 . 3 |
| Other Securities | | | | — | | | | 19,123 | | | | | | — | | | | 19,123 | 8 . 0 |
| Total Investments | | | | 223,504 | | | | 31,647 | | | | | | — | | | | 255,151 | 107 . 3 |
| Other Assets and Liabilities, Net | | | | | | | | | | | | | | | | | | | (7. 3) |
| | | | | | | | | | | | | | | | | | | | 100 . 0 |
| Other Financial Instruments | | | | | | | | | | | | | | | | | | | |
| Futures Contracts | | | | 582 | | | | — | | | | | | — | | | | 582 | 0 . 2 |
| Total Other Financial Instruments * | | $ | | 582 | | $ | | — | | $ | | | | — | | $ | | 582 | |
* Other financial instruments reflected in the Schedule of Investments, such as futures, forwards, interest rate swaps, and credit default swaps are valued at the unrealized appreciation/depreciation on the instruments.
For a description of the Levels see note 2 in the Notes to Financial Statements.
For disclosure on transfers between Levels 1, 2 and 3 during the period ended December 31, 2013, see note 2 in the Notes to Financial Statements.
See accompanying notes which are an integral part of the financial statements.
Aggressive Equity Fund 43
Russell Investment Funds
Aggressive Equity Fund
Fair Value of Derivative Instruments — December 31, 2013
| Amounts in thousands | | | |
| |
| |
| | | Equity |
| Derivatives not accounted for as hedging instruments | | Contracts |
| Location: Statement of Assets and Liabilities - Assets | | | |
| Variation margin on futures contracts* | | $ | 582 |
| | | | |
| | | | |
| | | Equity |
| Derivatives not accounted for as hedging instruments | | Contracts |
| Location: Statement of Operations - Net realized gain (loss) | | | |
| Futures contracts | | $ | 2,427 |
| | | | |
| | | | |
| Location: Statement of Operations - Net change in unrealized appreciation (depreciation) | | | |
| Futures contracts | | $ | 469 |
| | | | |
| * | Includes cumulative appreciation/depreciation of futures contracts as reported in the Schedule of Investments. Only variation margin is reported within the Statement of Assets and Liabilities. |
For further disclosure on derivatives see note 2 in the Notes to Financial Statements.
See accompanying notes which are an integral part of the financial statements.
44 Aggressive Equity Fund
Russell Investment Funds
Aggressive Equity Fund
Balance Sheet Offsetting of Financial and Derivative Instruments —
December 31, 2013
| Amounts in thousands | | | | | | | | | | | | | | | |
| |
| Offsetting of Financial Assets and Derivative Assets | | | | | | | | | | | | | |
| | | | | | | | | | Gross | | Net Amounts |
| | | | | | | | | | Amounts | | of Assets |
| | | | | | | | Gross | | Offset in the | | Presented in |
| | | | | | | Amounts of | | Statement of | | the Statement |
| | | | | | | Recognized | | Assets and | | of Assets and |
| Description | | Location: Statement of Assets and Liabilities - Assets | | | | | Assets | | Liabilities | | | | Liabilities |
| Securities on Loan* | | Investments, at fair value | | | | $ | 18,749 | | $ | | — | | $ | | 18,749 |
| Futures Contracts** | | Variation margin on futures contracts | | | | | 582 | | | | — | | | | 582 |
| Total | | | | | | $ | 19,331 | | $ | | — | | $ | | 19,331 |
| | | | | | | | | | | | | | | | |
| Financial Assets, Derivative Assets, and Collateral Held by Counterparty | | | | | | | | | |
| | | | | | Gross Amounts Not Offset in | |
| | | | | | the Statement of Assets and | |
| | | | | | | Liabilities | | | | | |
| | | Net Amounts | | | | | | | | |
| | | of Assets | | | | | | | | |
| | | Presented in | | | | | | | | |
| | | the Statement | | Financial and | | | | | |
| | | of Assets and | | Derivative | | | Collateral | | |
| Counterparty | | | Liabilities | | Instruments | | | Received Net Amount |
| Barclays | | $ | 6,292 | | $ | — | $ 6,292 | $ | — |
| Citigroup | | | 52 | | | — | 52 | | — |
| Credit Suisse | | | 827 | | | — | 827 | | — |
| Deutsche Bank | | | 2,043 | | | — | 2,043 | | — |
| Fidelity | | | 2,612 | | | — | 2,612 | | — |
| Goldman Sachs | | | 900 | | | — | 900 | | — |
| JPMorgan Chase | | | 1,605 | | | — | 1,605 | | — |
| Merrill Lynch | | | 582 | | | — | — | | 582 |
| Morgan Stanley | | | 4,418 | | | — | 4,418 | | — |
| Total | | $ | 19,331 | | $ | — | $ 18,749 | $ | 582 |
| | | | | | | | | | | | |
| * | Fair value of securities on loan as reported in the footnotes to the Statement of Assets and Liabilities. |
| ** | Includes cumulative appreciation/depreciation of futures contracts as reported in the Schedule of Investments. |
Only variation margin is reported within the Statement of Assets and Liabilities.
For further disclosure on derivatives and counterparty risk see note 2 in the Notes to Financial Statements.
Balance Sheet Offsetting of Financial and Derivative Instruments 45
Russell Investment Funds
Aggressive Equity Fund
Statement of Assets and Liabilities — December 31, 2013
| Amounts in thousands | | |
| Assets | | |
| Investments, at identified cost | $ | 207,664 |
| Investments, at fair value(*)(>) | | 255,151 |
| Cash (restricted)(a) | | 845 |
| Receivables: | | |
| Dividends and interest | | 229 |
| Dividends from affiliated Russell funds | | 1 |
| Investments sold | | 1,622 |
| Fund shares sold | | 12 |
| Variation margin on futures contracts | | 54 |
| Total assets | | 257,914 |
| |
| Liabilities | | |
| Payables: | | |
| Investments purchased | | 701 |
| Fund shares redeemed | | 27 |
| Accrued fees to affiliates | | 177 |
| Other accrued expenses | | 58 |
| Payable upon return of securities loaned | | 19,123 |
| Total liabilities | | 20,086 |
| |
| Net Assets | $ | 237,828 |
See accompanying notes which are an integral part of the financial statements.
46 Aggressive Equity Fund
Russell Investment Funds
Aggressive Equity Fund
Statement of Assets and Liabilities, continued — December 31, 2013
| Amounts in thousands | | |
| Net Assets Consist of: | | |
| Undistributed (overdistributed) net investment income | $ | 90 |
| Accumulated net realized gain (loss) | | 7,126 |
| Unrealized appreciation (depreciation) on: | | |
| Investments . | | 47,487 |
| Futures contracts | | 582 |
| Shares of beneficial interest | | 141 |
| Additional paid-in capital | | 182,402 |
| Net Assets | $ | 237,828 |
| Net Asset Value, offering and redemption price per share: | | |
| Net asset value per share: (#) | $ | 16 . 88 |
| Net assets | $ | 237,827,964 |
| Shares outstanding ($. 01 par value) | | 14,088,546 |
| Amounts in thousands | | |
| (*) Securities on loan included in investments | $ | 18,749 |
| (>) Investments in affiliates, Russell U. S. Cash Management Fund and Russell U. S. Cash Collateral Fund | $ | 31,647 |
| (a) Cash Collateral for Futures | $ | 845 |
| (#) Net asset value per share equals net assets divided by shares of beneficial interest outstanding. | | |
See accompanying notes which are an integral part of the financial statements.
Aggressive Equity Fund 47
Russell Investment Funds
Aggressive Equity Fund
Statement of Operations — For the Period Ended December 31, 2013
| Amounts in thousands | | |
| Investment Income | | |
| Dividends | $ | 2,984 |
| Dividends from affiliated Russell funds | | 10 |
| Securities lending income | | 175 |
| Total investment income | | 3,169 |
| |
| Expenses | | |
| Advisory fees | | 1,910 |
| Administrative fees | | 106 |
| Custodian fees | | 77 |
| Transfer agent fees | | 9 |
| Professional fees | | 57 |
| Trustees’ fees | | 5 |
| Printing fees | | 37 |
| Miscellaneous | | 17 |
| Expenses before reductions | | 2,218 |
| Expense reductions | | (106) |
| Net expenses | | 2,112 |
| Net investment income (loss) | | 1,057 |
| |
| Net Realized and Unrealized Gain (Loss) | | |
| Net realized gain (loss) on: | | |
| Investments . | | 29,801 |
| Futures contracts | | 2,427 |
| Net realized gain (loss) | | 32,228 |
| Net change in unrealized appreciation (depreciation) on: | | |
| Investments | | 37,211 |
| Futures contracts | | 469 |
| Net change in unrealized appreciation (depreciation) | | 37,680 |
| Net realized and unrealized gain (loss) | | 69,908 |
| Net Increase (Decrease) in Net Assets from Operations | $ | 70,965 |
See accompanying notes which are an integral part of the financial statements.
48 Aggressive Equity Fund
Russell Investment Funds
Aggressive Equity Fund
Statements of Changes in Net Assets
| | For the Periods Ended December 31, |
| Amounts in thousands | 2013 | | 2012 |
| Increase (Decrease) in Net Assets | | | | | |
| Operations | | | | | |
| Net investment income (loss) | $ | 1,057 | | $ | 1,993 |
| Net realized gain (loss) | | 32,228 | | | 27,867 |
| Net change in unrealized appreciation (depreciation) | | 37,680 | | | (2,620) |
| Net increase (decrease) in net assets from operations | | 70,965 | | | 27,240 |
| |
| Distributions | | | | | |
| From net investment income | | (929) | | | (1,994) |
| From net realized gain | | (16,473) | | | — |
| Net decrease in net assets from distributions | | (17,402) | | | (1,994) |
| |
| Share Transactions* | | | | | |
| Net increase (decrease) in net assets from share transactions | | (1,637) | | | (16,379) |
| Total Net Increase (Decrease) in Net Assets | | 51,926 | | | 8,867 |
| |
| Net Assets | | | | | |
| Beginning of period | | 185,902 | | | 177,035 |
| End of period | $ | 237,828 | | $ | 185,902 |
| Undistributed (overdistributed) net investment income included in net assets | $ | 90 | | $ | (30) |
See accompanying notes which are an integral part of the financial statements.
Aggressive Equity Fund 49
Russell Investment Funds
Aggressive Equity Fund
Statements of Changes in Net Assets, continued
* Share transaction amounts (in thousands) for the periods ended December 31, 2013 and December 31, 2012 were as follows:
| | | | | 2013 | | | | | 2012 | |
| | | | | Shares | | | Dollars | | | | Shares | | | Dollars |
| |
| Proceeds from shares sold | | | | 705 | | $ | 11,092 | | | | 646 | | $ | 8,034 |
| Proceeds from reinvestment of distributions | | | | 1,041 | | | 17,401 | | | | 154 | | | 1,994 |
| Payments for shares redeemed | | | | (1,934) | | | (30,130) | | | | (2,105) | | | (26,407) |
| Total increase (decrease) | | | | (188) | | $ | (1,637) | | | | (1,305) | | $ | (16,379) |
| | | | | | | | | | | | | | | |
See accompanying notes which are an integral part of the financial statements.
50 Aggressive Equity Fund
(This page intentionally left blank)
Russell Investment Funds
Aggressive Equity Fund
Financial Highlights — For the Periods Ended
For a Share Outstanding Throughout Each Period.
| | | $ | $ | $ | | $ | $ | | $ |
| | | Net Asset Value, | Net | Net Realized | | Total from | Distributions | | Distributions |
| | | Beginning of | Investment | and Unrealized | | Investment | from Net | | from Net |
| | | Period | Income (Loss)(a)(b) | Gain (Loss) | | Operations | Investment Income | | Realized Gain |
| December 31, 2013 | | 13 . 02 | . 08 | 5 . 11 | | 5 . 19 | ( . 07) | | (1 . 26) |
| December 31, 2012 | | 11 . 36 | . 13 | 1 . 67 | | 1 . 80 | ( . 14) | | — |
| December 31, 2011 | | 11 . 92 | . 04 | ( . 54) | | ( . 50) | ( . 06) | | — |
| December 31, 2010 | | 9 . 59 | . 04 | 2 . 34 | | 2 . 38 | ( . 05) | | — |
| December 31, 2009 | | 7 . 18 | . 05 | 2 . 40 | | 2 . 45 | ( . 04) | | — |
See accompanying notes which are an integral part of the financial statements.
52 Aggressive Equity Fund
| | | | | | | % | % | | % | |
| | | | $ | | $ | Ratio of Expenses | Ratio of Expenses | Ratio of Net | |
| | | | Net Asset Value, | % | Net Assets, | to Average | to Average | Investment Income | % |
| | | $ | End of | Total | End of Period | Net Assets, | Net Assets, | to Average | Portfolio |
| Total Distributions | Period | Return(d) | (000) | Gross | Net(b) | Net Assets(b) | Turnover Rate |
| | | (1 . 33) | 16 . 88 | 40 . 00 | 237,828 | 1 . 05 | 1 . 00 | | . 50 | 77 |
| | | ( . 14) | 13 . 02 | 15 . 84 | 185,902 | 1 . 09 | 1 . 04 | | 1 . 08 | 150 |
| | | ( . 06) | 11 . 36 | (4 . 20) | 177,035 | 1 . 08 | 1 . 02 | | . 37 | 105 |
| | | ( . 05) | 11 . 92 | 24 . 88 | 191,763 | 1 . 11 | 1 . 05 | | . 44 | 107 |
| | | ( . 04) | 9 . 59 | 34 . 32 | 158,671 | 1 . 13 | 1 . 02 | | . 65 | 161 |
See accompanying notes which are an integral part of the financial statements.
Aggressive Equity Fund 53
Russell Investment Funds
Non-U.S. Fund
Portfolio Management Discussion and Analysis — December 31, 2013 (Unaudited)
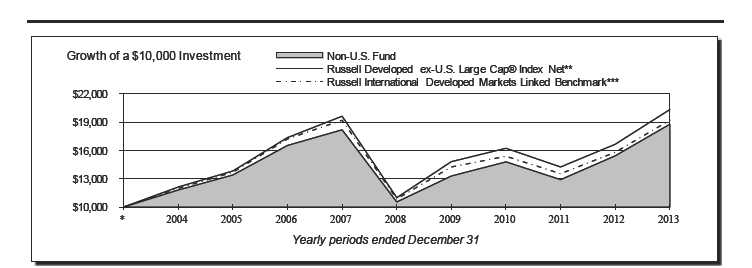
| Non-U. S. Fund | | | | | International Developed Markets Linked Benchmark*** |
| | | | Total | | | | Total |
| | | | Return | | | | Return |
| 1 Year | | | 21 . 91% | | 1 Year | | 21 . 68% |
| 5 Years | | | 12 . 39%§ | | 5 Years | | 12 . 07%§ |
| 10 Years | | | 6 . 58%§ | | 10 Years | | 6 . 74%§ |
| |
| |
| Russell Developed ex-U. S. Large Cap® Index Net** | | | | | |
| | | | Total | | | | | |
| | | | Return | | | | | |
| 1 Year | | | 21 . 68% | | | | | |
| 5 Years | | | 13 . 10%§ | | | | | |
| 10 Years | | | 7 . 33%§ | | | | | |
54 Non-U.S. Fund
Russell Investment Funds
Non-U.S. Fund
Portfolio Management Discussion and Analysis, continued — December 31, 2013 (Unaudited)
| The Non-U. S. Fund (the “Fund”) employs a multi-manager | | the Fund had above market exposure to momentum. As investor |
| approach whereby portions of the Fund are allocated to different | | confidence continued to rise during the period, investors |
| money managers. Fund assets not allocated to money managers | | continued to favor companies geared toward positive economic |
| are managed by Russell Investment Management Company | | growth. These companies were favored over more defensively |
| (“RIMCo”), the Fund’s advisor. RIMCo may change the allocation | | oriented, slower growing companies. Material stocks were an |
| of the Fund’s assets among money managers at any time. An | | exception to the economic growth scenario and lagged the broader |
| exemptive order from the Securities and Exchange Commission | | market. The Fund’s underweight position to this sector was a |
| (“SEC”) permits RIMCo to engage or terminate a money manager | | positive contributor. | | | | |
| at any time, subject to approval by the Fund’s Board, without a | | Barrow, Hanley, Mewhinney & Strauss, LLC (“Barrow”) |
| shareholder vote. Pursuant to the terms of the exemptive order, the | | underperformed the Fund’s benchmark for the fiscal year. |
| Fund is required to notify its shareholders within 90 days of when | | Barrow’s emerging markets exposure was the largest detractor |
| a money manager begins providing services. As of December 31, | | over the period primarily attributed to their position in two |
| 2013, the Fund had four money managers. | | consumer discretionary companies. Additionally, stock selection |
| What is the Fund’s investment objective? | | in the technology sector detracted value over the period. |
| The Fund seeks to provide long term capital growth | | Barrow’s limited exposure to Canada and above index exposure to |
| | | Continental Europe added meaningfully during the year. Barrow |
| How did the Fund perform relative to its benchmark for the | | also added value in the financials and materials sector through |
| fiscal year ended December 31, 2013? | | effective stock selection. | | | | |
| For the fiscal year ended December 31, 2013, the Fund gained | | MFS Institutional Advisors Inc. (“MFS”) underperformed the |
| 21.91%. This is compared to the Fund’s benchmark, the Russell | | Fund’s benchmark for the fiscal year. MFS was largely positioned |
| Developed ex-U. S. Large Cap™ Index Net, which gained 21.68% | | correctly across sectors and regions with positive performance |
| during the same period. The Fund’s performance includes | | coming from overweight positions in technology, consumer |
| operating expenses, whereas index returns are unmanaged and | | discretionary and Continental Europe and underweight positions |
| do not include expenses of any kind. | | in energy and Asia ex-Japan. However, stocks that favor |
| For the fiscal year ended December 31, 2013, the Lipper® | | stable earnings growth went unrewarded over the period, which |
| International Growth Funds Average, a group of funds that Lipper | | detracted from MFS’ performance. This was most prevalent in the |
| considers to have investment strategies similar to those of the | | financials and consumer discretionary sectors where MFS’ stock |
| Fund, gained 15.32%. This result serves as a peer comparison | | selection detracted meaningfully. | | | | |
| and is expressed net of operating expenses. | | Pzena Investment Management LLC (“Pzena”) outperformed the |
| How did the market conditions described in the Market | | Fund’s benchmark for the fiscal year. Pzena’s preference for stocks |
| Summary report affect the Fund’s performance? | | trading at a meaningful discount to the market and stocks that |
| The fiscal year ended December 31, 2013 was a beneficial | | are economically geared was strongly rewarded during the period |
| time frame for the Fund. Central banks continued their soft | | as low price-to-book stocks were among the best performing on |
| monetary policy through 2013, which continued to spur optimism | | the year. Strong stock selection within the financials, industrials |
| for economic growth and allowed investors to maintain a more | | and consumer discretionary sectors contributed most strongly |
| bullish outlook on equity markets. With investors having greater | | to the manager’s overall performance. Additionally, Pzena |
| confidence towards expanding economies, companies that were | | had very little exposure to Asia ex-Japan and strongly favored |
| more economically geared were rewarded during the period. | | Continental European companies, which contributed to their |
| Additionally, companies that exhibited potential for above- | | strong performance. | | | | |
| average earnings growth continued to be rewarded. Both of these | | William Blair & Company, LLC (“William Blair”) underperformed |
| factors were positive for the Fund. | | the Fund’s benchmark for the fiscal year. William Blair was |
| | | well positioned on a sector basis being overweight consumer |
| How did the investment strategies and techniques employed | | discretionary and information technology companies while |
| by the Fund and its money managers affect its benchmark | | being underweight materials and consumer staples companies. |
| relative performance? | | However, their significant exposure to emerging market companies |
| The Fund’s strategic emphasis was favorable given the market | | caused a significant shortfall in benchmark relative performance. |
| climate during the fiscal year. The Fund continued to favor | | William Blair’s favoring of higher quality companies (as measured |
| companies that exhibited slightly higher growth characteristics | | by return on equity) was also a meaningful detractor as these |
| than the market, particularly forecasted growth. Additionally, | | | | | | | | |
Non-U.S. Fund 55
Russell Investment Funds
Non-U.S. Fund
Portfolio Management Discussion and Analysis, continued — December 31, 2013 (Unaudited)
| companies were shunned during the period in favor of riskier | | and currency exposure as a substitute for holding securities |
| assets. | | directly and to facilitate the implementation of its investment |
| RIMCo manages the portion of the Fund’s assets that RIMCo | | strategy. In addition, the Fund used forward currency contracts to |
| determines not to allocate to the money managers. Assets not | | hedge against adverse currency exchange rate changes. The use of |
| allocated to managers include the Fund’s liquidity reserves and | | these derivatives did not have a material impact on performance. |
| assets which may be managed directly by RIMCo to modify | | Describe any changes to the Fund’s structure or the money |
| the Fund’s overall portfolio characteristics to seek to achieve | | manager line-up. There were no changes to the money manager lineup during the |
| the desired risk/return profile for the Fund. During the period | | fiscal year. |
| the Fund had a small allocation to defensive securities. This | | | | |
| allocation was a small detractor to performance as the market | | | | |
| favored riskier assets. | | Money Managers as of December 31, | | |
| During the period, RIMCo implemented a strategy that invests | | 2013 | | Styles |
| in securities that exhibit higher quality characteristics than the | | Barrow, Hanley, Mewhinney & Strauss, LLC | | Value |
| market in order to dampen Fund volatility and provide exposure | | MFS Institutional Advisors Inc. | | Growth |
| | | William Blair & Company, LLC | | Growth |
| to areas of the market that the money manager line up was not | | Pzena Investment Management LLC | | Value |
| accessing. The effect on Fund performance was slightly negative, | | | | |
| as the strategy slightly lagged the Fund’s benchmark since its | | | | |
| inception. During the time RIMCo employed the strategy in | | The views expressed in this report reflect those of the |
| the Fund, markets rewarded lower quality securities, which the | | portfolio managers only through the end of the period |
| strategy explicitly underweights. | | covered by the report. These views do not necessarily |
| | | represent the views of RIMCo or any other person in RIMCo |
| During the period, the Fund used regional and country index | | or any other affiliated organization. These views are |
| futures, as a substitute for holding securities directly and to | | subject to change at any time based upon market conditions |
| facilitate the implementation of its investment strategy. The use of | | or other events, and RIMCo disclaims any responsibility to |
| these derivatives had a modestly positive impact on performance | | update the views contained herein. These views should not |
| as the Fund allocated away from the poorer performing emerging | | be relied on as investment advice and, because investment |
| markets countries in favor of Europe and Japan. | | decisions for a Russell Investment Funds (“RIF”) Fund are |
| During the period, the Fund used derivatives, including country | | based on numerous factors, should not be relied on as an |
| index futures, swaps and currency forwards, to manage country | | indication of investment decisions of any RIF Fund. |
| * | Assumes initial investment on January 1, 2004. |
| ** | The Russell Developed ex-U. S. Large Cap® Index (net of tax on dividends from foreign holdings) is an index which offers investors access to the large-cap segment of the global equ8ity market, excluding companies assigned to the United States. It is constructed to provide a comprehensive and unbiased barometer for the large –cap segment and is completely reconstituted annually to accurately reflect the changes in the market over time. |
| *** | The International Developed Markets Linked Benchmark represents the returns of the MSCI EAFE Index (net) through December 31, 2010 and the returns of the Russell Developed ex-U. S. Large Cap Index (net) thereafter. The International Developed Markets Linked Benchmark provides a means to compare the Fund’s average annual returns to a secondary benchmark that takes into account historical changes in the Fund’s primary benchmark. |
| § | Annualized. |
The performance shown in this section does not reflect any Insurance Company Separate Account or Policy Charges. Performance is historical and assumes reinvestment of all dividends and capital gains. Investment return and principal value will fluctuate so that an investor’s shares, when redeemed, may be worth more or less than when purchased. Past performance is not indicative of future results.
56 Non-U.S. Fund
Russell Investment Funds
Non-U.S. Fund
Shareholder Expense Example — December 31, 2013 (Unaudited)
| Fund Expenses | | Please note that the expenses shown in the table are meant |
| The following disclosure provides important information | | to highlight your ongoing costs only and do not reflect any |
| regarding the Fund’s Shareholder Expense Example | | transactional costs. Therefore, the information under the heading |
| (“Example”) . | | “Hypothetical Performance (5% return before expenses)” is |
| | | useful in comparing ongoing costs only, and will not help you |
| Example | | determine the relative total costs of owning different funds. In |
| As a shareholder of the Fund, you incur two types of costs: (1) | | addition, if these transactional costs were included, your costs |
| transaction costs, and (2) ongoing costs, including advisory and | | would have been higher. The fees and expenses shown in this |
| administrative fees and other Fund expenses. The Example is | | section do not reflect any Insurance Company Separate Account |
| intended to help you understand your ongoing costs (in dollars) | | or Policy Charges. | | | | | | | | | | | |
| of investing in the Fund and to compare these costs with the | | | | | | | | | | | Hypothetical |
| ongoing costs of investing in other mutual funds. The Example | | | | | | | | Actual | | | Performance (5% |
| is based on an investment of $1,000 invested at the beginning of | | | | | | | | Performance | | | return before expenses) |
| the period and held for the entire period indicated, which for this | | | | | | | | | | | |
| | | Beginning Account Value | | | | | | | | | | | |
| Fund is from July 1, 2013 to December 31, 2013. | | July 1, 2013 | | | | $ | | 1,000.00 | | | $ | | 1,000.00 |
| Actual Expenses | | Ending Account Value | | | | | | | | | | | |
| | | December 31, 2013 | | | | $ | | 1,190.30 | | | $ | | 1,020.21 |
| The information in the table under the heading “Actual | | Expenses Paid During Period* | | | | $ | | 5.47 | | | $ | | 5.04 |
| Performance” provides information about actual account values | | | | | | | | | | | | | |
| and actual expenses. You may use the information in this column, | | * Expenses are equal to the Fund's annualized expense ratio of 0.99% |
| | | (representing the six month period annualized), multiplied by the average |
| together with the amount you invested, to estimate the expenses | | account value over the period, multiplied by 184/365 (to reflect the one-half year |
| that you paid over the period. Simply divide your account value by | | period) . May reflect amounts waived, reimbursed and/or other credits. Without |
| $1,000 (for example, an $8,600 account value divided by $1,000 | | any waivers, reimbursements and/or other credits, expenses would have been |
| = 8.6), then multiply the result by the number in the first column | | higher. | | | | | | | | | | | |
| in the row entitled “Expenses Paid During Period” to estimate | | | | | | | | | | | | | |
| the expenses you paid on your account during this period. | | | | | | | | | | | | | |
| |
| Hypothetical Example for Comparison Purposes | | | | | | | | | | | | | |
| The information in the table under the heading “Hypothetical | | | | | | | | | | | | | |
| Performance (5% return before expenses)” provides information | | | | | | | | | | | | | |
| about hypothetical account values and hypothetical expenses | | | | | | | | | | | | | |
| based on the Fund’s actual expense ratio and an assumed rate of | | | | | | | | | | | | | |
| return of 5% per year before expenses, which is not the Fund’s | | | | | | | | | | | | | |
| actual return. The hypothetical account values and expenses | | | | | | | | | | | | | |
| may not be used to estimate the actual ending account balance or | | | | | | | | | | | | | |
| expenses you paid for the period. You may use this information | | | | | | | | | | | | | |
| to compare the ongoing costs of investing in the Fund and other | | | | | | | | | | | | | |
| funds. To do so, compare this 5% hypothetical example with the | | | | | | | | | | | | | |
| 5% hypothetical examples that appear in the shareholder reports | | | | | | | | | | | | | |
| of other funds. | | | | | | | | | | | | | |
Non-U.S. Fund 57
Russell Investment Funds
Non-U.S. Fund
Schedule of Investments — December 31, 2013
| Amounts in thousands (except share amounts) | | | | Amounts in thousands (except share amounts) | | |
| | | | | Principal | | Fair | | | | | | Principal | | Fair |
| | | | | Amount ($) | | Value | | | | | | Amount ($) | | Value |
| | | | | or Shares | | $ | | | | | | or Shares | | $ |
| |
| Common Stocks - 93.5% | | | | | | | | Bank of Nova Scotia | | | | 3,551 | | 222 |
| | | | | | | | | BCE, Inc. | | | | 1,100 | | 48 |
| Australia - 0.8% | | | | | | | | Brookfield Asset Management, Inc. | | | | | | |
| Amcor, Ltd. Class A(Æ) | | | | 3,666 | | 35 | | Class A(Æ) | | | | 38,200 | | 1,483 |
| AMP, Ltd. | | | | 7,382 | | 29 | | Brookfield Asset Management, Inc. | | | | | | |
| Australia & New Zealand Banking | | | | | | | | Class A | | | | 966 | | 37 |
| Group, Ltd. - ADR | | | | 7,350 | | 212 | | Canadian Imperial Bank of Commerce(Þ) | | 822 | | 70 |
| BHP Billiton, Ltd. - ADR | | | | 9,573 | | 325 | | Canadian National Railway Co. (Æ)(Þ) | | | | 39,894 | | 2,275 |
| Brambles, Ltd. | | | | 4,724 | | 39 | | Canadian National Railway Co. | | | | 2,222 | | 127 |
| Commonwealth Bank of Australia - ADR | | 4,553 | | 316 | | Canadian Pacific Railway, Ltd. | | | | 263 | | 40 |
| CSL, Ltd. | | | | 25,902 | | 1,595 | | Cenovus Energy, Inc. | | | | 924 | | 26 |
| Insurance Australia Group, Ltd. | | | | 5,436 | | 28 | | Crescent Point Energy Corp. | | | | 847 | | 33 |
| National Australia Bank, Ltd. - ADR | | | | 6,088 | | 189 | | Enbridge, Inc. | | | | 1,859 | | 81 |
| Orica, Ltd. | | | | 1,109 | | 24 | | Great-West Lifeco, Inc. (Þ) | | | | 782 | | 24 |
| Origin Energy, Ltd. | | | | 1,598 | | 20 | | Husky Energy, Inc. | | | | 900 | | 29 |
| Orora, Ltd. | | | | 3,666 | | 4 | | Imperial Oil, Ltd. | | | | 800 | | 35 |
| Recall Holdings, Ltd. (Æ) | | | | 944 | | 3 | | Intact Financial Corp. | | | | 400 | | 26 |
| Suncorp Group, Ltd. | | | | 3,547 | | 41 | | National Bank of Canada | | | | 413 | | 34 |
| Telstra Corp. , Ltd. | | | | 12,673 | | 59 | | Pembina Pipeline Corp. | | | | 900 | | 32 |
| Wesfarmers, Ltd. | | | | 2,963 | | 117 | | Potash Corp. of Saskatchewan, Inc. | | | | 785 | | 26 |
| Westfield Group(ö) | | | | 4,663 | | 42 | | Power Corp. of Canada | | | | 991 | | 30 |
| Westpac Banking Corp. | | | | 8,317 | | 240 | | Power Financial Corp. | | | | 714 | | 24 |
| Woodside Petroleum, Ltd. | | | | 1,846 | | 64 | | Rogers Communications, Inc. Class B | | | | 1,044 | | 47 |
| Woolworths, Ltd. | | | | 3,713 | | 112 | | Royal Bank of Canada - GDR | | | | 4,061 | | 273 |
| | | | | | | 3,494 | | Shaw Communications, Inc. Class B | | | | 1,091 | | 27 |
| | | | | | | | | Shoppers Drug Mart Corp. | | | | 11,530 | | 632 |
| Austria - 0.5% | | | | | | | | Suncor Energy, Inc. | | | | 2,043 | | 72 |
| Erste Group Bank AG | | | | 62,100 | | 2,173 | | TELUS Corp. | | | | 613 | | 21 |
| | | | | | | | | Tim Hortons, Inc. | | | | 451 | | 26 |
| | | | | | | | | Toronto Dominion Bank | | | | 2,734 | | 258 |
| Belgium - 0.5% | | | | | | | | TransCanada Corp. | | | | 2,063 | | 94 |
| Anheuser-Busch InBev NV | | | | 9,796 | | 1,042 | | Valeant Pharmaceuticals International, | | | | | | |
| KBC Groep NV(Æ) | | | | 15,198 | | 862 | | Inc. (Æ) | | | | 9,498 | | 1,115 |
| | | | | | | 1,904 | | | | | | | | 7,414 |
| |
| Bermuda - 1.2% | | | | | | | | Cayman Islands - 1.1% | | | | | | |
| Jardine Matheson Holdings, Ltd. | | | | 400 | | 21 | | Baidu, Inc. - ADR(Æ) | | | | 2,384 | | 424 |
| Jardine Strategic Holdings, Ltd. | | | | 500 | | 16 | | CIMC Enric Holdings, Ltd. | | | | 238,000 | | 384 |
| Li & Fung, Ltd. | | | | 984,000 | | 1,270 | | Dongyue Group | | | | 1,272,800 | | 504 |
| PartnerRe, Ltd. - ADR | | | | 10,075 | | 1,062 | | MGM China Holdings, Ltd. | | | | 357,600 | | 1,526 |
| RenaissanceRe Holdings, Ltd. | | | | 10,425 | | 1,015 | | Tencent Holdings, Ltd. | | | | 26,200 | | 1,671 |
| Seadrill, Ltd. (Ñ) | | | | 15,200 | | 624 | | | | | | | | 4,509 |
| Seadrill, Ltd. | | | | 2,500 | | 102 | | | | | | | | |
| |
| Yue Yuen Industrial Holdings, Ltd. | | | | 320,600 | | 1,071 | | Czech Republic - 0.0% | | | | | | |
| | | | | | | 5,181 | | | | | | | | |
| | | | | | | | | Komercni Banka AS | | | | 822 | | 183 |
| |
| Brazil - 1.0% | | | | | | | | Denmark - 1.6% | | | | | | |
| BM&FBovespa SA | | | | 122,200 | | 574 | | | | | | | | |
| Brookfield Incorporacoes SA(Æ) | | | | 417,400 | | 204 | | AP Moeller - Maersk A/S Class B | | | | 3 | | 33 |
| Cielo SA | | | | 19,100 | | 532 | | Coloplast A/S Class B | | | | 19,411 | | 1,288 |
| Embraer SA - ADR(Ñ) | | | | 53,800 | | 1,730 | | Danske Bank A/S(Æ) | | | | 135,776 | | 3,126 |
| Itau Unibanco Holding SA - ADR | | | | 68,160 | | 925 | | Novo Nordisk A/S Class B | | | | 1,280 | | 236 |
| Kroton Educacional SA | | | | 26,800 | | 446 | | Novozymes A/S Class B | | | | 636 | | 27 |
| | | | | | | | | TDC A/S | | | | 216,900 | | 2,103 |
| | | | | | | 4,411 | | | | | | | | |
| | | | | | | | | | | | | | | 6,813 |
| |
| Canada - 1.7% | | | | | | | | Finland - 0.4% | | | | | | |
| Alimentation Couche Tard, Inc. Class B | | | | 346 | | 26 | | | | | | | | |
| Bank of Montreal | | | | 1,819 | | 121 | | Kone OYJ Class B | | | | 1,020 | | 46 |
See accompanying notes which are an integral part of the financial statements.
58 Non-U.S. Fund
Russell Investment Funds
Non-U.S. Fund
Schedule of Investments, continued — December 31, 2013
| Amounts in thousands (except share amounts) | | | | Amounts in thousands (except share amounts) | | |
| | | | | Principal | | Fair | | | | | | Principal | | Fair |
| | | | | Amount ($) | | Value | | | | | | Amount ($) | | Value |
| | | | | or Shares | | $ | | | | | | or Shares | | $ |
| Sampo Class A | | | | 31,412 | | 1,551 | | Volkswagen AG | | | | 8,341 | | 2,260 |
| | | | | | | 1,597 | | | | | | | | 33,941 |
| |
| France - 9.9% | | | | | | | | Hong Kong - 1.4% | | | | | | |
| Air Liquide SA Class A | | | | 16,335 | | 2,310 | | AIA Group, Ltd. | | | | 749,800 | | 3,762 |
| BNP Paribas SA | | | | 37,183 | | 2,897 | | Cheung Kong Holdings, Ltd. | | | | 2,000 | | 32 |
| Capital Gemini SA | | | | 51,421 | | 3,475 | | China Mobile, Ltd. | | | | 92,500 | | 959 |
| Casino Guichard Perrachon SA(Æ) | | | | 4,000 | | 461 | | China Unicom Hong Kong, Ltd. | | | | 508,000 | | 760 |
| Credit Agricole SA(Æ) | | | | 91,485 | | 1,171 | | CLP Holdings, Ltd. | | | | 5,500 | | 43 |
| Danone SA | | | | 30,573 | | 2,201 | | Guangdong Investment, Ltd. | | | | 300,100 | | 293 |
| Dassault Systemes SA | | | | 15,630 | | 1,940 | | Hang Seng Bank, Ltd. | | | | 2,200 | | 36 |
| Essilor International SA | | | | 609 | | 65 | | Hong Kong & China Gas Co. , Ltd. | | | | 17,600 | | 40 |
| GDF Suez | | | | 37,109 | | 873 | | Hong Kong Exchanges and Clearing, | | | | | | |
| Lagardere SCA | | | | 24,731 | | 919 | | Ltd. | | | | 2,000 | | 33 |
| Legrand SA - ADR | | | | 25,167 | | 1,387 | | Link REIT (The)(ö) | | | | 7,000 | | 34 |
| L'Oreal SA | | | | 685 | | 120 | | Power Assets Holdings, Ltd. | | | | 4,000 | | 32 |
| LVMH Moet Hennessy Louis Vuitton | | | | | | | | Swire Pacific, Ltd. Class A | | | | 2,000 | | 23 |
| SA - ADR | | | | 12,390 | | 2,260 | | | | | | | | 6,047 |
| Natixis | | | | 95,058 | | 559 | | | | | | | | |
| Pernod Ricard SA | | | | 18,167 | | 2,070 | | India - 1.1% | | | | | | |
| Publicis Groupe SA - ADR | | | | 14,990 | | 1,372 | | | | | | | | |
| Rallye SA | | | | 40,185 | | 1,685 | | Housing Development Finance Corp. | | | | 63,681 | | 818 |
| Sanofi - ADR | | | | 42,432 | | 4,501 | | ICICI Bank, Ltd. - ADR | | | | 19,387 | | 721 |
| Schneider Electric SA | | | | 55,547 | | 4,845 | | Reliance Industries, Ltd. | | | | 62,764 | | 908 |
| Sodexo | | | | 278 | | 28 | | Tata Motors, Ltd. - ADR | | | | 71,219 | | 2,194 |
| Technip SA | | | | 5,167 | | 497 | | | | | | | | 4,641 |
| Total SA | | | | 53,879 | | 3,300 | | | | | | | | |
| Vallourec SA | | | | 25,475 | | 1,388 | | Indonesia - 0.2% | | | | | | |
| Vinci SA | | | | 27,234 | | 1,788 | | Bank Rakyat Indonesia Persero Tbk PT | | | | 1,268,000 | | 760 |
| Vivendi SA - ADR | | | | 2,905 | | 77 | | Telekomunikasi Indonesia Persero Tbk | | | | | | |
| | | | | | | 42,189 | | PT | | | | 1,585,600 | | 281 |
| | | | | | | | | | | | | | | 1,041 |
| Germany - 7.9% | | | | | | | | | | | | | | |
| Adidas AG | | | | 629 | | 80 | | Ireland - 1.0% | | | | | | |
| BASF SE | | | | 1,303 | | 139 | | CRH PLC | | | | 83,100 | | 2,095 |
| Bayer AG | | | | 34,064 | | 4,779 | | DCC PLC | | | | 24,200 | | 1,190 |
| Bayerische Motoren Werke AG | | | | 16,970 | | 1,990 | | Kerry Group PLC Class A | | | | 442 | | 31 |
| Beiersdorf AG(Æ) | | | | 16,912 | | 1,717 | | Ryanair Holdings PLC - ADR(Æ) | | | | 21,810 | | 1,024 |
| Brenntag AG | | | | 5,812 | | 1,080 | | | | | | | | 4,340 |
| Continental AG | | | | 9,200 | | 2,018 | | | | | | | | |
| |
| Daimler AG | | | | 34,200 | | 2,960 | | Israel - 0.7% | | | | | | |
| Deutsche Boerse AG | | | | 49,908 | | 4,144 | | | | | | | | |
| Deutsche Post AG | | | | 939 | | 34 | | Check Point Software Technologies, Ltd. | | | | | | |
| E. ON SE | | | | 50,675 | | 934 | | (Æ) | | | | 30,957 | | 1,997 |
| Fresenius Medical Care AG & Co. | | | | | | | | Teva Pharmaceutical Industries, Ltd. | | | | | | |
| KGaA | | | | 626 | | 45 | | - ADR | | | | 23,600 | | 946 |
| Fresenius SE & Co. KGaA | | | | 382 | | 59 | | Teva Pharmaceutical Industries, Ltd. | | | | 2,492 | | 100 |
| Henkel AG & Co. KGaA | | | | 6,731 | | 701 | | | | | | | | 3,043 |
| Linde AG | | | | 12,923 | | 2,706 | | | | | | | | |
| Merck KGaA | | | | 10,306 | | 1,857 | | Italy - 2.0% | | | | | | |
| MTU Aero Engines AG | | | | 4,200 | | 413 | | Enel SpA | | | | 242,625 | | 1,063 |
| Muenchener Rueckversicherungs AG | | | | 527 | | 116 | | ENI SpA - ADR | | | | 158,507 | | 3,833 |
| OSRAM Licht AG(Æ) | | | | 275 | | 16 | | Luxottica Group SpA | | | | 432 | | 23 |
| ProSiebenSat. 1 Media AG | | | | 17,710 | | 879 | | Saipem SpA - ADR | | | | 24,917 | | 538 |
| Rational AG | | | | 1,207 | | 402 | | Snam Rete Gas SpA | | | | 317,812 | | 1,781 |
| SAP AG - ADR | | | | 25,318 | | 2,171 | | Telecom Italia SpA | | | | 1,108,100 | | 1,103 |
| Siemens AG | | | | 17,864 | | 2,441 | | | | | | | | 8,341 |
See accompanying notes which are an integral part of the financial statements.
Non-U.S. Fund 59
Russell Investment Funds
Non-U.S. Fund
Schedule of Investments, continued — December 31, 2013
| Amounts in thousands (except share amounts) | | | | Amounts in thousands (except share amounts) | | |
| | | | | Principal | | Fair | | | | | | Principal | | Fair |
| | | | | Amount ($) | | Value | | | | | | Amount ($) | | Value |
| | | | | or Shares | | $ | | | | | | or Shares | | $ |
| Japan - 12.4% | | | | | | | | SES SA | | | | 885 | | 29 |
| Amada Co. , Ltd. | | | | 260,700 | | 2,305 | | Tenaris SA | | | | 1,157 | | 25 |
| Asahi Group Holdings, Ltd. | | | | 1,000 | | 28 | | | | | | | | 1,260 |
| Asahi Kasei Corp. | | | | 3,000 | | 24 | | | | | | | | |
| Astellas Pharma, Inc. | | | | 15,300 | | 906 | | Netherlands - 6.7% | | | | | | |
| Canon, Inc. | | | | 67,200 | | 2,139 | | Aegon NV | | | | 455,639 | | 4,301 |
| Dai-ichi Life Insurance Co. , Ltd. (The) | | | | 85,000 | | 1,425 | | Akzo Nobel NV | | | | 51,220 | | 3,970 |
| Daikin Industries, Ltd. | | | | 24,300 | | 1,516 | | ASML Holding NV Class G | | | | 455 | | 43 |
| Denso Corp. | | | | 76,600 | | 4,051 | | Delta Lloyd NV | | | | 103,000 | | 2,556 |
| East Japan Railway Co. | | | | 600 | | 48 | | Heineken NV | | | | 31,811 | | 2,148 |
| Eisai Co. , Ltd. | | | | 700 | | 27 | | ING Groep NV(Æ) | | | | 489,058 | | 6,794 |
| FANUC Corp. | | | | 7,200 | | 1,320 | | Koninklijke Ahold NV | | | | 2,937 | | 53 |
| Fast Retailing Co. , Ltd. | | | | 100 | | 41 | | Koninklijke DSM NV(Æ) | | | | 309 | | 24 |
| Fuji Heavy Industries, Ltd. | | | | 57,000 | | 1,637 | | Koninklijke Philips NV | | | | 57,671 | | 2,114 |
| Honda Motor Co. , Ltd. | | | | 121,500 | | 5,013 | | Randstad Holding NV(Æ) | | | | 36,426 | | 2,363 |
| Hoya Corp. | | | | 59,500 | | 1,656 | | Reed Elsevier NV(Æ) | | | | 77,077 | | 1,633 |
| Inpex Corp. | | | | 82,700 | | 1,060 | | STMicroelectronics NV Class Y | | | | 196,775 | | 1,581 |
| ITOCHU Corp. | | | | 165,500 | | 2,048 | | Unilever NV | | | | 29,637 | | 1,194 |
| Japan Tobacco, Inc. | | | | 25,300 | | 823 | | | | | | | | 28,774 |
| Kao Corp. | | | | 1,500 | | 47 | | | | | | | | |
| KDDI Corp. | | | | 17,500 | | 1,080 | | | | | | | | |
| Keyence Corp. | | | | 3,900 | | 1,670 | | Norway - 1.4% | | | | | | |
| Kyocera Corp. | | | | 19,800 | | 990 | | DNB ASA | | | | 144,600 | | 2,590 |
| Lawson, Inc. | | | | 24,800 | | 1,856 | | Marine Harvest ASA | | | | 994,400 | | 1,214 |
| Mabuchi Motor Co. , Ltd. | | | | 33,500 | | 1,992 | | Orkla ASA | | | | 165,900 | | 1,297 |
| MISUMI Group, Inc. | | | | 25,600 | | 806 | | Statoil ASA Class N | | | | 3,157 | | 77 |
| Mitsubishi UFJ Financial Group, Inc. | | | | 156,700 | | 1,036 | | TE Connectivity, Ltd. | | | | 28,845 | | 689 |
| MS&AD Insurance Group Holdings | | | | 17,700 | | 476 | | | | | | | | 5,867 |
| Nippon Telegraph & Telephone Corp. | | | | 1,100 | | 59 | | | | | | | | |
| NKSJ Holdings, Inc. | | | | 50,200 | | 1,400 | | Russia - 0.6% | | | | | | |
| NTT DOCOMO, Inc. | | | | 63,600 | | 1,045 | | Gazprom OAO - ADR | | | | 222,815 | | 1,905 |
| ORIX Corp. | | | | 123,500 | | 2,176 | | Sberbank of Russia - ADR | | | | 37,465 | | 471 |
| Otsuka Holdings Co. , Ltd. | | | | 1,000 | | 29 | | Sberbank of Russia - ADR(Æ) | | | | 1,114 | | 14 |
| Rinnai Corp. | | | | 300 | | 23 | | | | | | | | |
| Secom Co. , Ltd. | | | | 24,500 | | 1,479 | | | | | | | | 2,390 |
| Seven & I Holdings Co. , Ltd. | | | | 2,200 | | 88 | | | | | | | | |
| Shin-Etsu Chemical Co. , Ltd. | | | | 76,800 | | 4,491 | | Singapore - 1.4% | | | | | | |
| SMC Corp. | | | | 200 | | 51 | | DBS Group Holdings, Ltd. | | | | 99,000 | | 1,341 |
| Start Today Co. , Ltd. | | | | 13,500 | | 336 | | Jardine Cycle & Carriage, Ltd. | | | | 76,500 | | 2,180 |
| Sumitomo Corp. | | | | 133,600 | | 1,680 | | Keppel Corp. , Ltd. - ADR | | | | 4,000 | | 35 |
| Sumitomo Mitsui Financial Group, Inc. | | | | 67,700 | | 3,496 | | Oversea-Chinese Banking Corp. , Ltd. | | | | 3,000 | | 24 |
| Takeda Pharmaceutical Co. , Ltd. | | | | 2,100 | | 96 | | Singapore Telecommunications, Ltd. (Ñ) | | | | 169,000 | | 490 |
| Tokyo Gas Co. , Ltd. | | | | 6,000 | | 30 | | United Overseas Bank, Ltd. | | | | 121,100 | | 2,038 |
| Toyota Motor Corp. | | | | 7,300 | | 444 | | | | | | | | 6,108 |
| Yokogawa Electric Corp. | | | | 21,700 | | 334 | | | | | | | | |
| | | | | | | 53,277 | | South Africa - 0.6% | | | | | | |
| | | | | | | | | Aspen Pharmacare Holdings, Ltd. | | | | 28,040 | | 718 |
| Jersey - 1.6% | | | | | | | | Bidvest Group, Ltd. (Æ) | | | | 37,165 | | 951 |
| Delphi Automotive PLC | | | | 13,466 | | 810 | | Discovery Holdings, Ltd. | | | | 132,149 | | 1,065 |
| Experian PLC | | | | 42,139 | | 777 | | | | | | | | 2,734 |
| WPP PLC | | | | 231,391 | | 5,288 | | | | | | | | |
| | | | | | | 6,875 | | South Korea - 1.3% | | | | | | |
| | | | | | | | | Hana Financial Group, Inc. | | | | 30,965 | | 1,289 |
| Kenya - 0.1% | | | | | | | | Hankook Tire Co. , Ltd. (Æ) | | | | 22,200 | | 1,279 |
| Safaricom, Ltd. | | | | 4,033,700 | | 507 | | Samsung Electronics Co. , Ltd. | | | | 1,368 | | 1,788 |
| | | | | | | | | Shinhan Financial Group Co. , Ltd. (Æ) | | | | 28,671 | | 1,304 |
| Luxembourg - 0.3% | | | | | | | | | | | | | | 5,660 |
See accompanying notes which are an integral part of the financial statements.
60 Non-U.S. Fund
Russell Investment Funds
Non-U.S. Fund
Schedule of Investments, continued — December 31, 2013
| Amounts in thousands (except share amounts) | | | | Amounts in thousands (except share amounts) | | |
| | | | | Principal | | Fair | | | | | | Principal | | Fair |
| | | | | Amount ($) | | Value | | | | | | Amount ($) | | Value |
| | | | | or Shares | | $ | | | | | | or Shares | | $ |
| Spain - 1.8% | | | | | | | | United Kingdom - 19.5% | | | | | | |
| Amadeus IT Holding SA Class A | | | | 48,796 | | 2,088 | | AMEC PLC - GDR | | | | 40,500 | | 730 |
| Banco Santander SA - ADR | | | | 337,503 | | 3,020 | | Anglo American PLC | | | | 46,174 | | 1,009 |
| Inditex SA | | | | 10,483 | | 1,728 | | ARM Holdings PLC | | | | 51,328 | | 934 |
| Indra Sistemas SA | | | | 48,650 | | 814 | | Associated British Foods PLC | | | | 1,094 | | 44 |
| | | | | | | 7,650 | | AstraZeneca PLC - ADR(Æ) | | | | 3,717 | | 220 |
| | | | | | | | | Aviva PLC | | | | 210,071 | | 1,564 |
| Sweden - 0.4% | | | | | | | | Babcock International Group PLC | | | | 53,312 | | 1,196 |
| | | | | | | | | BAE Systems PLC | | | | 76,555 | | 551 |
| Assa Abloy AB Class B | | | | 1,058 | | 56 | | Barclays PLC | | | | 964,315 | | 4,343 |
| Atlas Copco AB Class A | | | | 2,298 | | 64 | | Berkeley Group Holdings PLC | | | | 31,638 | | 1,392 |
| Atlas Copco AB Class B | | | | 1,059 | | 27 | | BG Group PLC | | | | 140,813 | | 3,026 |
| Hennes & Mauritz AB Class B | | | | 29,160 | | 1,347 | | BHP Billiton PLC | | | | 4,500 | | 139 |
| Svenska Cellulosa AB SCA Class B | | | | 1,477 | | 46 | | BP PLC | | | | 629,357 | | 5,086 |
| Svenska Handelsbanken AB Class A | | | | 647 | | 32 | | BP PLC - ADR | | | | 6,600 | | 321 |
| Telefonaktiebolaget LM Ericsson Class B | | 8,699 | | 107 | | British American Tobacco PLC | | | | 5,688 | | 305 |
| TeliaSonera AB | | | | 6,712 | | 56 | | British Land Co. PLC(ö) | | | | 2,333 | | 24 |
| | | | | | | 1,735 | | British Sky Broadcasting Group PLC | | | | 2,723 | | 38 |
| | | | | | | | | Capita PLC | | | | 1,986 | | 34 |
| Switzerland - 10.0% | | | | | | | | Carillion PLC | | | | 158,375 | | 867 |
| ABB, Ltd. (Æ) | | | | 64,581 | | 1,706 | | Centrica PLC | | | | 15,526 | | 89 |
| ABB, Ltd. - ADR(Æ)(Ñ) | | | | 26,400 | | 701 | | Compass Group PLC | | | | 318,029 | | 5,098 |
| ACE, Ltd. | | | | 9,950 | | 1,030 | | Dairy Crest Group PLC | | | | 170,909 | | 1,528 |
| Cie Financiere Richemont SA | | | | 17,868 | | 1,788 | | Diageo PLC | | | | 94,908 | | 3,143 |
| Credit Suisse Group AG(Æ) | | | | 135,937 | | 4,173 | | DS Smith PLC Class F | | | | 465,150 | | 2,557 |
| GAM Holding AG(Æ) | | | | 25,726 | | 501 | | GlaxoSmithKline PLC - ADR | | | | 132,371 | | 3,533 |
| Geberit AG(Æ) | | | | 4,449 | | 1,361 | | Hays PLC | | | | 285,695 | | 614 |
| Givaudan SA(Æ) | | | | 25 | | 36 | | HSBC Holdings PLC | | | | 593,250 | | 6,491 |
| Helvetia Holding AG | | | | 900 | | 452 | | IMI PLC - ADR | | | | 39,801 | | 1,005 |
| Julius Baer Group, Ltd. (Æ) | | | | 29,041 | | 1,400 | | Imperial Tobacco Group PLC | | | | 126,928 | | 4,915 |
| Kuehne & Nagel International AG | | | | 4,788 | | 630 | | InterContinental Hotels Group PLC | | | | | | |
| Lonza Group AG(Æ) | | | | 17,100 | | 1,628 | | - ADR | | | | 40,943 | | 1,364 |
| Nestle SA | | | | 70,651 | | 5,187 | | Intertek Group PLC | | | | 488 | | 25 |
| Novartis AG | | | | 72,830 | | 5,829 | | J Sainsbury PLC | | | | 4,248 | | 26 |
| Partners Group Holding AG | | | | 4,757 | | 1,269 | | Johnson Matthey PLC | | | | 23,654 | | 1,285 |
| Roche Holding AG | | | | 22,190 | | 6,219 | | Kingfisher PLC | | | | 6,249 | | 40 |
| SGS SA | | | | 16 | | 37 | | Marks & Spencer Group PLC | | | | 4,325 | | 31 |
| Sonova Holding AG(Æ) | | | | 6,109 | | 824 | | Meggitt PLC | | | | 141,376 | | 1,235 |
| Swatch Group AG (The) Class B | | | | 77 | | 51 | | National Grid PLC | | | | 196,243 | | 2,560 |
| Swiss Life Holding AG(Æ) | | | | 6,900 | | 1,436 | | Next PLC | | | | 459 | | 41 |
| Swiss Re AG(Æ) | | | | 11,257 | | 1,041 | | Pearson PLC | | | | 2,479 | | 55 |
| Swisscom AG | | | | 68 | | 36 | | Reckitt Benckiser Group PLC | | | | 23,778 | | 1,888 |
| Syngenta AG | | | | 273 | | 109 | | Reed Elsevier PLC | | | | 3,423 | | 51 |
| TE Connectivity, Ltd. | | | | 475 | | 26 | | Rio Tinto PLC(Æ) | | | | 33,942 | | 1,916 |
| Tyco International, Ltd. | | | | 843 | | 35 | | Rolls-Royce Holdings PLC(Æ) | | | | 53,208 | | 1,123 |
| UBS AG(Æ) | | | | 179,252 | | 3,415 | | Royal Bank of Scotland Group PLC(Æ) | | | | 203,924 | | 1,142 |
| Zurich Insurance Group AG(Æ) | | | | 6,694 | | 1,946 | | Royal Dutch Shell PLC Class A | | | | 160,127 | | 5,707 |
| | | | | | | 42,866 | | Royal Dutch Shell PLC Class B | | | | 7,597 | | 287 |
| | | | | | | | | SABMiller PLC - ADR | | | | 2,821 | | 145 |
| |
| Taiwan - 1.4% | | | | | | | | Scottish & Southern Energy PLC | | | | 1,711 | | 39 |
| | | | | | | | | Shire PLC - ADR(Æ) | | | | 1,649 | | 78 |
| Hon Hai Precision Industry Co. , Ltd. | | | | 956,924 | | 2,571 | | Smith & Nephew PLC | | | | 114,908 | | 1,639 |
| Hon Hai Precision Industry Co. , Ltd. | | | | | | | | Smiths Group PLC | | | | 55,700 | | 1,365 |
| - GDR | | | | 30,208 | | 161 | | St. James's Place PLC | | | | 110,547 | | 1,333 |
| Taiwan Semiconductor Manufacturing | | | | | | | | Standard Chartered PLC | | | | 93,187 | | 2,099 |
| Co. , Ltd. - ADR | | | | 92,008 | | 1,605 | | Tesco PLC | | | | 22,543 | | 125 |
| Teco Electric and Machinery Co. , Ltd. | | | | 1,364,800 | | 1,564 | | Travis Perkins PLC | | | | 83,325 | | 2,583 |
| | | | | | | 5,901 | | Tullow Oil PLC | | | | 53,219 | | 753 |
| | | | | | | | | Unilever PLC | | | | 3,901 | | 160 |
| | | | | | | | | Vodafone Group PLC - ADR(Æ) | | | | 887,093 | | 3,481 |
See accompanying notes which are an integral part of the financial statements.
Non-U.S. Fund 61
Russell Investment Funds
Non-U.S. Fund
Schedule of Investments, continued — December 31, 2013
Amounts in thousands (except share amounts)
| | | | | Principal | | Fair |
| | | | | Amount ($) | | Value |
| | | | | or Shares | | $ |
| Whitbread PLC | | | | 528 | | 33 |
| WM Morrison Supermarkets PLC | | | | 7,061 | | 31 |
| | | | | | | 83,436 |
| |
| United States - 1.0% | | | | | | |
| Joy Global, Inc. (Ñ) | | | | 13,200 | | 772 |
| NCR Corp. (Æ) | | | | 12,100 | | 412 |
| News Corp. (Æ) | | | | 35,235 | | 628 |
| News Corp. Class A | | | | 21,175 | | 382 |
| Philip Morris International, Inc. | | | | 10,000 | | 871 |
| Yum! Brands, Inc. | | | | 17,622 | | 1,333 |
| | | | | | | 4,398 |
| |
| Total Common Stocks | | | | | | |
| (cost $308,710) | | | | | | 400,700 |
| Preferred Stocks - 0.3% | | | | | | |
| Brazil - 0.3% | | | | | | |
| Usinas Siderurgicas de Minas Gerais | | | | | | |
| SA(Æ) | | | | 171,175 | | 1,031 |
| |
| Germany - 0.0% | | | | | | |
| Henkel AG & Co. KGaA | | | | 494 | | 57 |
| |
| Total Preferred Stocks | | | | | | |
| (cost $743) | | | | | | 1,088 |
| Short-Term Investments - 5.0% | | | | | | |
| United States - 5.0% | | | | | | |
| Russell U. S. Cash Management Fund | | | | 21,546,970 | | 21,547 |
| |
| Total Short-Term Investments | | | | | | |
| (cost $21,547) | | | | | | 21,547 |
| Other Securities - 1.0% | | | | | | |
| Russell U. S. Cash Collateral Fund(×) | | | | 4,192,399 | | 4,192 |
| Total Other Securities | | | | | | |
| (cost $4,192) | | | | | | 4,192 |
| Total Investments 99.8% | | | | | | |
| (identified cost $335,192) | | | | | | 427,527 |
| |
| Other Assets and Liabilities, | | | | | | |
| Net - 0.2% | | | | | | 990 |
| |
| Net Assets - 100.0% | | | | | | 428,517 |
See accompanying notes which are an integral part of the financial statements.
62 Non-U.S. Fund
Russell Investment Funds
Non-U.S. Fund
Schedule of Investments, continued — December 31, 2013
| Futures Contracts | | | | | | | | | | | | |
| |
| Amounts in thousands (except contract amounts) | | | | | | | | | | | | |
| | | | | | | | | | | | | Unrealized |
| | | | | | | | | | | | | Appreciation |
| | | | | Number of | | Notional | | Expiration | | (Depreciation) |
| | | | | Contracts | | Amount | | Date | | $ |
| |
| Long Positions | | | | | | | | | | | | |
| CAC 40 Index Futures (EOP) (France) | | | | 57 | | EUR | | 2,450 | | 01/14 | | 156 |
| DAX Index Futures (EUX) (Germany) | | | | 9 | | EUR | | 2,161 | | 03/14 | | 116 |
| EURO STOXX 50 Index Futures (Germany) | | | | 236 | | EUR | | 7,335 | | 03/14 | | 485 |
| FTSE 100 Index Futures (LIF) (United Kingdom) | | | | 40 | | GBP | | 2,679 | | 03/14 | | 175 |
| Hang Seng Index Futures (Hong Kong) | | | | 5 | | HKD | | 5,833 | | 01/14 | | 12 |
| NIKKEI 225 Index Futures (CME) (Japan) | | | | 163 | | JPY | | 1,331,711 | | 03/14 | | 488 |
| S&P TSX 60 Index Futures (Canada) | | | | 16 | | CAD | | 2,499 | | 03/14 | | 89 |
| SPI 200 Index Futures (SFE) (Australia) | | | | 15 | | AUD | | 1,994 | | 03/14 | | 77 |
| TOPIX Index Futures (TSE) (Japan) | | | | 38 | | JPY | | 494,950 | | 03/14 | | 158 |
| Short Positions | | | | | | | | | | | | |
| MSCI Emerging Markets Mini Index Futures (NYL) | | | | 346 | | USD | | 17,591 | | 03/14 | | (465) |
| Total Unrealized Appreciation (Depreciation) on Open Futures Contracts (å) | | | | | | | | | | | | 1,291 |
| Foreign Currency Exchange Contracts | | | | | | | | | | | | |
| Amounts in thousands | | | | | | | | | | | | |
| | | | | | | | | | | | | Unrealized |
| | | | | | | | | | | | | Appreciation |
| | | Amount | | Amount | | | | (Depreciation) |
| Counterparty | | | | Sold | | Bought | | Settlement Date | | $ |
| HSBC | | USD | | 4,408 | | GBP | | 2,695 | | 03/19/14 | | 52 |
| JPMorgan Chase | | USD | | 375 | | HKD | | 2,910 | | 03/19/14 | | — |
| JPMorgan Chase | | USD | | 3,114 | | JPY | | 318,890 | | 03/19/14 | | (85) |
| Morgan Stanley | | USD | | 3 | | JPY | | — | | 01/02/14 | | (3) |
| Morgan Stanley | | JPY | | — | | USD | | — | | 01/02/14 | | — |
| Royal Bank of Canada | | USD | | 2,092 | | CAD | | 2,225 | | 03/19/14 | | (2) |
| Standard Chartered | | USD | | 375 | | HKD | | 2,910 | | 03/19/14 | | — |
| State Street | | USD | | 1,632 | | AUD | | 1,813 | | 03/19/14 | | (21) |
| State Street | | USD | | 94 | | CAD | | 100 | | 03/19/14 | | — |
| State Street | | USD | | 1 | | EUR | | 1 | | 01/02/14 | | — |
| State Street | | USD | | 198 | | EUR | | 144 | | 01/02/14 | | — |
| State Street | | USD | | 62 | | EUR | | 45 | | 01/03/14 | | — |
| State Street | | USD | | 137 | | EUR | | 100 | | 03/19/14 | | — |
| State Street | | USD | | 410 | | EUR | | 300 | | 03/19/14 | | 2 |
| State Street | | USD | | 4,137 | | EUR | | 3,000 | | 03/19/14 | | (9) |
| State Street | | USD | | 163 | | GBP | | 100 | | 03/19/14 | | 2 |
| State Street | | USD | | 165 | | GBP | | 100 | | 03/19/14 | | 1 |
| State Street | | USD | | 96 | | JPY | | 10,000 | | 03/19/14 | | (1) |
| State Street | | CAD | | 100 | | USD | | 94 | | 03/19/14 | | — |
| State Street | | DKK | | 841 | | USD | | 154 | | 01/02/14 | | (1) |
| State Street | | DKK | | 1,640 | | USD | | 301 | | 01/02/14 | | (1) |
| State Street | | DKK | | 1,761 | | USD | | 324 | | 01/03/14 | | (1) |
| State Street | | EUR | | 200 | | USD | | 273 | | 03/19/14 | | (2) |
| State Street | | EUR | | 200 | | USD | | 275 | | 03/19/14 | | — |
| State Street | | GBP | | 100 | | USD | | 163 | | 03/19/14 | | (3) |
| State Street | | HKD | | 19 | | USD | | 2 | | 01/02/14 | | — |
| State Street | | HKD | | 18 | | USD | | 2 | | 01/03/14 | | — |
| State Street | | HKD | | 25 | | USD | | 3 | | 01/03/14 | | — |
| State Street | | JPY | | 10,000 | | USD | | 96 | | 03/19/14 | | 1 |
| State Street | | NOK | | 249 | | USD | | 40 | | 01/02/14 | | (1) |
| State Street | | NOK | | 359 | | USD | | 58 | | 01/03/14 | | (1) |
| State Street | | NOK | | 534 | | USD | | 88 | | 01/06/14 | | — |
| Westpac Bank | | USD | | 10,230 | | EUR | | 7,419 | | 03/19/14 | | (24) |
| Total Unrealized Appreciation (Depreciation) on Open Foreign Currency Exchange Contracts | | | | | | | | (97) |
See accompanying notes which are an integral part of the financial statements.
Non-U.S. Fund 63
Russell Investment Funds
Non-U.S. Fund
Schedule of Investments, continued — December 31, 2013
| Presentation of Portfolio Holdings | | | | | | | | | | | | | | |
| |
| Amounts in thousands | | | | | | | | | | | | | | |
| | | | | Fair Value | | | | | | | | |
| | | | | | | | | | | | | | | % of Net |
| Portfolio Summary | | | Level 1 | | | Level 2 | | | Level 3 | | | Total | | Assets |
| Common Stocks | | | | | | | | | | | | | | |
| Australia | | $ | 3,494 | | $ | — | | $ | — | | $ | 3,494 | | 0 . 8 |
| Austria | | | — | | | 2,173 | | | — | | | 2,173 | | 0 . 5 |
| Belgium | | | 1,904 | | | — | | | — | | | 1,904 | | 0 . 5 |
| Bermuda | | | 5,079 | | | 102 | | | — | | | 5,181 | | 1 . 2 |
| Brazil | | | 2,655 | | | 1,756 | | | — | | | 4,411 | | 1 . 0 |
| Canada | | | 7,414 | | | — | | | — | | | 7,414 | | 1 . 7 |
| Cayman Islands | | | 4,509 | | | — | | | — | | | 4,509 | | 1 . 1 |
| Czech Republic | | | — | | | 183 | | | — | | | 183 | | — * |
| Denmark | | | — | | | 6,813 | | | — | | | 6,813 | | 1 . 6 |
| Finland | | | — | | | 1,597 | | | — | | | 1,597 | | 0 . 4 |
| France | | | 42,189 | | | — | | | — | | | 42,189 | | 9 . 9 |
| Germany | | | — | | | 33,941 | | | — | | | 33,941 | | 7 . 9 |
| Hong Kong | | | 6,047 | | | — | | | — | | | 6,047 | | 1 . 4 |
| India | | | 4,641 | | | — | | | — | | | 4,641 | | 1 . 1 |
| Indonesia | | | — | | | 1,041 | | | — | | | 1,041 | | 0 . 2 |
| Ireland | | | 4,340 | | | — | | | — | | | 4,340 | | 1 . 0 |
| Israel | | | 3,043 | | | — | | | — | | | 3,043 | | 0 . 7 |
| Italy | | | — | | | 8,341 | | | — | | | 8,341 | | 2 . 0 |
| Japan | | | — | | | 53,277 | | | — | | | 53,277 | | 12 . 4 |
| Jersey | | | 6,875 | | | — | | | — | | | 6,875 | | 1 . 6 |
| Kenya | | | 507 | | | — | | | — | | | 507 | | 0 . 1 |
| Luxembourg | | | 1,235 | | | 25 | | | — | | | 1,260 | | 0 . 3 |
| Netherlands | | | 28,774 | | | — | | | — | | | 28,774 | | 6 . 7 |
| Norway | | | — | | | 5,867 | | | — | | | 5,867 | | 1 . 4 |
| Russia | | | 2,390 | | | — | | | — | | | 2,390 | | 0 . 6 |
| Singapore | | | 6,108 | | | — | | | — | | | 6,108 | | 1 . 4 |
| South Africa | | | 2,734 | | | — | | | — | | | 2,734 | | 0 . 6 |
| South Korea | | | — | | | 5,660 | | | — | | | 5,660 | | 1 . 3 |
| Spain | | | 7,650 | | | — | | | — | | | 7,650 | | 1 . 8 |
| Sweden | | | — | | | 1,735 | | | — | | | 1,735 | | 0 . 4 |
| Switzerland | | | 1,792 | | | 41,074 | | | — | | | 42,866 | | 10 . 0 |
| Taiwan | | | 5,901 | | | — | | | — | | | 5,901 | | 1 . 4 |
| United Kingdom | | | 83,436 | | | — | | | — | | | 83,436 | | 19 . 5 |
| United States | | | 4,398 | | | — | | | — | | | 4,398 | | 1 . 0 |
| Preferred Stocks | | | — | | | 1,088 | | | — | | | 1,088 | | 0 . 3 |
| Short-Term Investments | | | — | | | 21,547 | | | — | | | 21,547 | | 5 . 0 |
| Other Securities | | | — | | | 4,192 | | | — | | | 4,192 | | 1 . 0 |
| Total Investments | | | 237,115 | | | 190,412 | | | — | | | 427,527 | | 99 . 8 |
| Other Assets and Liabilities, Net | | | | | | | | | | | | | | 0 . 2 |
| | | | | | | | | | | | | | | 100 . 0 |
| |
| Other Financial Instruments | | | | | | | | | | | | | | |
| Futures Contracts | | | 1,291 | | | — | | | — | | | 1,291 | | 0 . 3 |
| Foreign Currency Exchange Contracts | | | (5 ) | | | (92 ) | | | — | | | (97 ) | | (— )* |
| Total Other Financial Instruments ** | | $ | 1,286 | | $ | (92 ) | | $ | — | | $ | 1,194 | | |
| * | Less than . 05% of net assets. |
| ** | Other financial instruments reflected in the Schedule of Investments, such as futures, forwards, interest rate swaps, and credit default swaps are valued at the unrealized appreciation/depreciation on the instruments. |
For a description of the Levels see note 2 in the Notes to Financial Statements.
For disclosure on transfers between Levels 1, 2 and 3 during the period ended December 31, 2013, see note 2 in the Notes to Financial Statements.
See accompanying notes which are an integral part of the financial statements.
64 Non-U.S. Fund
Russell Investment Funds
Non-U.S. Fund
Fair Value of Derivative Instruments — December 31, 2013
| Amounts in thousands | | | | | | | | |
| |
| |
| | | | | | | | Foreign |
| | | | | Equity | | Currency |
| Derivatives not accounted for as hedging instruments | | | | Contracts | | Contracts |
| Location: Statement of Assets and Liabilities - Assets | | | | | | | | |
| Unrealized appreciation on foreign currency exchange contracts | | | | $ | — | | $ | 58 |
| Variation margin on futures contracts* | | | | | 1,756 | | | — |
| Total | | | | $ | 1,756 | | $ | 58 |
| | | | | | | | | |
| Location: Statement of Assets and Liabilities - Liabilities | | | | | | | | |
| Variation margin on futures contracts* | | | | $ | 465 | | $ | — |
| Unrealized depreciation on foreign currency exchange contracts | | | | | — | | | 155 |
| Total | | | | $ | 465 | | $ | 155 |
| |
| | | | | | | | Foreign |
| | | | | Equity | | Currency |
| Derivatives not accounted for as hedging instruments | | | | Contracts | | Contracts |
| Location: Statement of Operations - Net realized gain (loss) | | | | | | | | |
| Futures contracts | | | | $ | (5,053) | | $ | — |
| Foreign currency-related transactions** | | | | | — | | | (249) |
| Total | | | | $ | (5,053) | | $ | (249) |
| | | | | | | | | |
| Location: Statement of Operations - Net change in unrealized appreciation (depreciation) | | | | | | | | |
| Futures contracts | | | | $ | 1,027 | | $ | — |
| Foreign currency-related transactions*** | | | | | — | | | (36) |
| Total | | | | $ | 1,027 | | $ | (36) |
| * | Includes cumulative appreciation/depreciation of futures contracts as reported in the Schedule of Investments. Only variation margin is reported within the Statement of Assets and Liabilities. |
| ** | Only includes net realized gain (loss) on forward and spot contracts. May differ from the net realized gain (loss) on foreign currency-related transactions reported within the Statement of Operations. |
| *** | Only includes change in unrealized gain (loss) on forward and spot contracts. May differ from the net change in unrealized gain (loss) on foreign currency-related transactions reported within the Statement of Operations. |
For further disclosure on derivatives see note 2 in the Notes to Financial Statements.
See accompanying notes which are an integral part of the financial statements.
Non-U.S. Fund 65
Russell Investment Funds
Non-U.S. Fund
Balance Sheet Offsetting of Financial and Derivative Instruments —December 31, 2013
| Amounts in thousands | | | | | | | | | | | |
| |
| Offsetting of Financial Assets and Derivative Assets | | | | | | | | | |
| | | | | | | | Gross | | Net Amounts |
| | | | | | | | Amounts | | of Assets |
| | | | | | Gross | | Offset in the | | Presented in |
| | | | | Amounts of | | Statement of | | the Statement |
| | | | | Recognized | | Assets and | | of Assets and |
| Description | | Location: Statement of Assets and Liabilities - Assets | | | Assets | | Liabilities | | | Liabilities |
| Securities on Loan* | | Investments, at fair value | | $ | 4,091 | | $ | — | | $ | 4,091 |
| Foreign Currency Exchange Contracts | | Unrealized appreciation on foreign currency exchange contracts | | | 58 | | | — | | | 58 |
| Futures Contracts** | | Variation margin on futures contracts | | | 1,756 | | | — | | | 1,756 |
| Total | | | | $ | 5,905 | | $ | — | | $ | 5,905 |
| | | | | | | | | | | | |
| Financial Assets, Derivative Assets, and Collateral Held by Counterparty | | | | | | | | | | | | | |
| | | | | | | Gross Amounts Not Offset in | |
| | | | | | | the Statement of Assets and | |
| | | | | | | | Liabilities | | | | | |
| | | Net Amounts | | | | | | | | | | | |
| | | | | of Assets | | | | | | | | | | | |
| | | Presented in | | | | | | | | | | | |
| | | the Statement | | | Financial and | | | | | | | |
| | | of Assets and | | | Derivative | Collateral | | | | |
| Counterparty | | | | Liabilities | | | Instruments | Received | | Net Amount |
| Barclays | | $ | | 2,219 | | $ | — | | 2,219 | $ | — |
| Citigroup | | | | 1,160 | | | — | | 1,160 | | — |
| Fidelity | | | | 679 | | | — | | 679 | | — |
| HSBC | | | | 52 | | | — | | — | | 52 |
| Morgan Stanley | | | | 1,755 | | | — | | — | | 1,755 |
| State Street | | | | 7 | | | 7 | | — | | — |
| UBS | | | | 33 | | | — | | 33 | | — |
| Total | | $ | | 5,905 | | $ | 7 | $ | 4,091 | $ | 1,807 |
| | | | | | | | | | | | | | | | |
| Amounts in thousands | | | | | | | | | | | |
| |
| Offsetting of Financial Liabilities and Derivative Liabilities | | | | | | | | | |
| | | | | | | | Gross | | Net Amounts |
| | | | | | | | Amounts | | of Liabilities |
| | | | | Gross | | Offset in the | | Presented in |
| | | | | Amounts of | | Statement of | | the Statement |
| | | | | Recognized | | Assets and | | of Assets and |
| Description | | Location: Statement of Assets and Liabilities - Liabilities | | Liabilities | | Liabilities | | | Liabilities |
| Futures Contracts** | | Variation margin on futures contracts | | $ | 465 | | $ | — | | $ | 465 |
| Foreign Currency Exchange Contracts | | Unrealized depreciation on foreign currency exchange contracts | | | 155 | | | — | | | 155 |
| Total | | | | $ | 620 | | $ | — | | $ | 620 |
| | | | | | | | | | | | |
66 Balance Sheet Offsetting of Financial and Derivative Instruments
Russell Investment Funds
Non-U.S. Fund
Balance Sheet Offsetting of Financial and Derivative Instruments, continued —December 31, 2013
| Financial Liabilities, Derivative Liabilities, and Collateral Pledged by Counterparty | | | | | | | | | | | | | | | |
| | | | | | | Gross Amounts Not Offset in | | |
| | | | | | | the Statement of Assets and | | |
| | | | | | | | Liabilities | | | | | | | |
| | | Net Amounts | | | | | | | | | | | | | | | |
| | | of Liabilities | | | | | | | | | | | | | | | |
| | | Presented in | | | | | | | | | | | | | | | |
| | | the Statement | | Financial and | | | | | | | | | | |
| | | of Assets and | | Derivative | | Collateral | | | | | |
| Counterparty | | | | Liabilities | | Instruments | | Pledged | | Net Amount |
| JPMorgan Chase | | | | $ 85 | $ | | — | $ | | — | $ | | 85 |
| Morgan Stanley | | | | 468 | | | — | | | 468 | | | — |
| Royal Bank of Canada | | | | 1 | | | — | | | — | | | 1 |
| State Street | | | | 42 | | | 7 | | | — | | | 35 |
| Westpac | | | | 24 | | | — | | | — | | | 24 |
| Total | | $ | | 620 | $ | | 7 | $ | | 468 | $ | | 145 |
| | | | | | | | | | | | | | | | | | | | |
| * | Fair value of securities on loan as reported in the footnotes to the Statement of Assets and Liabilities. |
| ** | Includes cumulative appreciation/depreciation of futures contracts as reported in the Schedule of Investments. |
Only variation margin is reported within the Statement of Assets and Liabilities.
For further disclosure on derivatives and counterparty risk see note 2 in the Notes to Financial Statements.
Balance Sheet Offsetting of Financial and Derivative Instruments 67
Russell Investment Funds
Non-U.S. Fund
Statement of Assets and Liabilities — December 31, 2013
| Amounts in thousands | | |
| Assets | | |
| Investments, at identified cost | $ | 335,192 |
| Investments, at fair value(*)(>) | | 427,527 |
| Cash (restricted)(a) | | 4,730 |
| Foreign currency holdings(^) | | 55 |
| Unrealized appreciation on foreign currency exchange contracts | | 58 |
| Receivables: | | |
| Dividends and interest | | 365 |
| Dividends from affiliated Russell funds | | 1 |
| Investments sold | | 1,011 |
| Foreign capital gains taxes recoverable | | 206 |
| Variation margin on futures contracts | | 72 |
| Other investments | | 3 |
| Total assets | | 434,028 |
| |
| Liabilities | | |
| Payables: | | |
| Due to custodian | | 2 |
| Investments purchased | | 535 |
| Fund shares redeemed | | 66 |
| Accrued fees to affiliates | | 320 |
| Other accrued expenses | | 81 |
| Variation margin on futures contracts | | 150 |
| Deferred capital gains tax liability | | 10 |
| Unrealized depreciation on foreign currency exchange contracts | | 155 |
| Payable upon return of securities loaned | | 4,192 |
| Total liabilities | | 5,511 |
| |
| Net Assets | $ | 428,517 |
See accompanying notes which are an integral part of the financial statements.
68 Non-U.S. Fund
Russell Investment Funds
Non-U.S. Fund
Statement of Assets and Liabilities, continued — December 31, 2013
| Amounts in thousands | | |
| Net Assets Consist of: | | |
| Undistributed (overdistributed) net investment income | $ | 3,050 |
| Accumulated net realized gain (loss) | | (70,676) |
| Unrealized appreciation (depreciation) on: | | |
| Investments (net of deferred tax liability for foreign capital gains taxes) . | | 92,325 |
| Futures contracts | | 1,291 |
| Foreign currency-related transactions | | (80) |
| Other investments | | 3 |
| Shares of beneficial interest | | 348 |
| Additional paid-in capital | | 402,256 |
| Net Assets | $ | 428,517 |
| Net Asset Value, offering and redemption price per share: | | |
| Net asset value per share: (#) | $ | 12 . 32 |
| Net assets | $ | 428,517,474 |
| Shares outstanding ($. 01 par value) | | 34,791,310 |
| Amounts in thousands | | |
| (^) Foreign currency holdings - cost | $ | 55 |
| (*) Securities on loan included in investments | $ | 4,091 |
| (>) Investments in affiliates, Russell U. S. Cash Management Fund and Russell U. S. Cash Collateral Fund | $ | 25,739 |
| (a) Cash Collateral for Futures | $ | 4,730 |
| (#) Net asset value per share equals net assets divided by shares of beneficial interest outstanding. | | |
See accompanying notes which are an integral part of the financial statements.
Non-U.S. Fund 69
Russell Investment Funds
Non-U.S. Fund
Statement of Operations — For the Period Ended December 31, 2013
| Amounts in thousands | | |
| Investment Income | | |
| Dividends | $ | 11,033 |
| Dividends from affiliated Russell funds | | 19 |
| Securities lending income | | 364 |
| Less foreign taxes withheld | | (891) |
| Total investment income | | 10,525 |
| |
| Expenses | | |
| Advisory fees | | 3,444 |
| Administrative fees | | 191 |
| Custodian fees | | 172 |
| Transfer agent fees | | 17 |
| Professional fees | | 80 |
| Trustees’ fees | | 9 |
| Printing fees | | 56 |
| Miscellaneous | | 14 |
| Expenses before reductions | | 3,983 |
| Expense reductions | | (191) |
| Net expenses | | 3,792 |
| Net investment income (loss) | | 6,733 |
| |
| Net Realized and Unrealized Gain (Loss) | | |
| Net realized gain (loss) on: | | |
| Investments (net of deferred tax liability for foreign capital gains taxes) | | 19,522 |
| Futures contracts | | 5,053 |
| Foreign currency-related transactions | | (273) |
| Net realized gain (loss) | | 24,302 |
| Net change in unrealized appreciation (depreciation) on: | | |
| Investments (net of deferred tax liability for foreign capital gains taxes) | | 45,427 |
| Futures contracts | | 1,027 |
| Foreign currency-related transactions | | (19) |
| Other investments | | (1) |
| Net change in unrealized appreciation (depreciation) | | 46,434 |
| Net realized and unrealized gain (loss) | | 70,736 |
| Net Increase (Decrease) in Net Assets from Operations | $ | 77,469 |
See accompanying notes which are an integral part of the financial statements.
70 Non-U.S. Fund
Russell Investment Funds
Non-U.S. Fund
Statements of Changes in Net Assets
| | | For the Periods Ended December 31, |
| Amounts in thousands | | 2013 | | 2012 |
| Increase (Decrease) in Net Assets | | | | | | |
| Operations | | | | | | |
| Net investment income (loss) | | $ | 6,733 | | $ | 6,625 |
| Net realized gain (loss) | | | 24,302 | | | 1,732 |
| Net change in unrealized appreciation (depreciation) | | | 46,434 | | | 54,010 |
| Net increase (decrease) in net assets from operations | | | 77,469 | | | 62,367 |
| |
| Distributions | | | | | | |
| From net investment income | | | (7,653) | | | (6,051) |
| Net decrease in net assets from distributions | | | (7,653) | | | (6,051) |
| |
| Share Transactions* | | | | | | |
| Net increase (decrease) in net assets from share transactions | | | 1,845 | | | (29,038) |
| Total Net Increase (Decrease) in Net Assets | | | 71,661 | | | 27,278 |
| |
| Net Assets | | | | | | |
| Beginning of period | | | 356,856 | | | 329,578 |
| End of period | | $ | 428,517 | | $ | 356,856 |
| Undistributed (overdistributed) net investment income included in net assets | | $ | 3,050 | | $ | 3,951 |
See accompanying notes which are an integral part of the financial statements.
Non-U.S. Fund 71
Russell Investment Funds
Non-U.S. Fund
Statements of Changes in Net Assets, continued
* Share transaction amounts (in thousands) for the periods ended December 31, 2013 and December 31, 2012 were as follows:
| | | | | 2013 | | | | | 2012 | |
| | | | | Shares | | | Dollars | | | | Shares | | | Dollars |
| |
| Proceeds from shares sold | | | | 2,484 | | $ | 27,097 | | | | 2,308 | | $ | 21,577 |
| Proceeds from reinvestment of distributions | | | | 691 | | | 7,653 | | | | 606 | | | 6,051 |
| Payments for shares redeemed | | | | (2,980) | | | (32,905) | | | | (5,992) | | | (56,666) |
| Total increase (decrease) | | | | 195 | | $ | 1,845 | | | | (3,078) | | $ | (29,038) |
| | | | | | | | | | | | | | | |
See accompanying notes which are an integral part of the financial statements.
72 Non-U.S. Fund
(This page intentionally left blank)
Russell Investment Funds
Non-U.S. Fund
Financial Highlights — For the Periods Ended
For a Share Outstanding Throughout Each Period.
| | $ | | | $ | | $ | | $ | | $ |
| | Net Asset Value, | | | Net | | | Net Realized | | Total from | | Distributions |
| | Beginning of | | | Investment | | | and Unrealized | | Investment | | from Net |
| | Period | | Income (Loss)(a)(b) | | | Gain (Loss) | | Operations | | Investment Income |
| December 31, 2013 | 10 . 31 | | | . 18 | | | 2 . 05 | | 2 . 23 | | ( . 22) |
| December 31, 2012 | 8 . 75 | | | . 18 | | | 1 . 55 | | 1 . 73 | | ( . 17) |
| December 31, 2011 | 10 . 21 | | | . 17 | | | (1 . 46) | | (1 . 29) | | ( . 17) |
| December 31, 2010 | 9 . 25 | | | . 12 | | | . 92 | | 1 . 04 | | ( . 08) |
| December 31, 2009 | 7 . 48 | | | . 12 | | | 1 . 88 | | 2 . 00 | | ( . 23) |
See accompanying notes which are an integral part of the financial statements.
74 Non-U.S. Fund
| | | | | | | % | % | % | |
| | | | $ | | $ | Ratio of Expenses | Ratio of Expenses | Ratio of Net | |
| | | Net Asset Value, | % | Net Assets, | to Average | to Average | Investment Income | % |
| | $ | | End of | Total | End of Period | Net Assets, | Net Assets, | to Average | Portfolio |
| Total Distributions | | Period | Return(d) | (000) | Gross | Net(b) | Net Assets(b) | Turnover Rate |
| | ( . 22) | | 12 . 32 | 21 . 91 | 428,517 | 1 . 04 | | | . 99 | 1 . 76 | 36 |
| | ( . 17) | | 10 . 31 | 19 . 81 | 356,856 | 1 . 07 | | | 1 . 01 | 1 . 94 | 47 |
| | ( . 17) | | 8 . 75 | (12 . 88) | 329,578 | 1 . 10 | | | 1 . 04 | 1 . 74 | 49 |
| | ( . 08) | | 10 . 21 | 11 . 42 | 366,870 | 1 . 12 | | | 1 . 06 | 1 . 30 | 49 |
| | ( . 23) | | 9 . 25 | 27 . 33 | 322,145 | 1 . 12 | | | 1 . 04 | 1 . 56 | 133 |
See accompanying notes which are an integral part of the financial statements.
Non-U.S. Fund 75
Russell Investment Funds
Core Bond Fund
Portfolio Management Discussion and Analysis — December 31, 2013 (Unaudited)
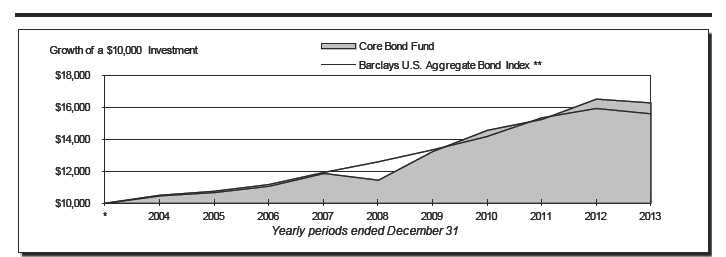
| Core Bond Fund | | | Barclays U. S. Aggregate Bond Index ** | | |
| | Total | | | | Total |
| | Return | | | | Return |
| 1 Year | -1 . 45% | | 1 Year | | -2 . 02% |
| 5 Years | 7 . 33%§ | | 5 Years | | 4 . 44%§ |
| 10 Years | 5 . 02%§ | | 10 Years | | 4 . 55%§ |
76 Core Bond Fund
Russell Investment Funds
Core Bond Fund
Portfolio Management Discussion and Analysis, continued — December 31, 2013 (Unaudited)
| The Core Bond Fund (the “Fund”) employs a multi-manager | | impacts of the treasury yield increases. In addition, the Fund’s |
| approach whereby portions of the Fund are allocated to different | | interest rate sensitivity, commonly referred to as “duration”, was |
| money managers. Fund assets not allocated to money managers | | generally positioned to be lower than the benchmark’s, which also |
| are managed by Russell Investment Management Company | | helped the Fund incur a lower loss than the benchmark. Signs of |
| (“RIMCo”), the Fund’s advisor. RIMCo may change the allocation | | a strengthening U. S. economy and tepid inflation outlook helped |
| of the Fund’s assets among money managers at any time. An | | the U. S. dollar rally over the year, which although favorable to |
| exemptive order from the Securities and Exchange Commission | | some underlying positions in the Fund, had an overall negative |
| (“SEC”) permits RIMCo to engage or terminate a money manager | | impact on the Fund’s currency strategies. |
| at any time, subject to approval by the Fund’s Board, without a | | | | |
| shareholder vote. Pursuant to the terms of the exemptive order, the | | How did the investment strategies and techniques employed |
| Fund is required to notify its shareholders within 90 days of when | | by the Fund and its money managers affect its benchmark |
| a money manager begins providing services. As of December 31, | | relative performance? |
| 2013, the Fund had five money managers. | | | | Macro Currency Group (“Macro”) underperformed the Barclays |
| | | | | | | U. S. Aggregate Bond Index for the fiscal year. A long position |
| What is the Fund’s investment objective? | | | | to the Japanese yen as part of the manager’s Macro-Japan |
| The Fund seeks to provide current income, and as a secondary | | theme negatively impacted the Fund in the first part of the year. |
| objective, capital appreciation. | | | | Although this position added value as interest rates began to |
| |
| How did the Fund perform relative to its benchmark for the | | rise in the U. S. , the manager’s Structural-USD theme at the time |
| fiscal year ended December 31, 2013? | | | | overwhelmed any positive attribution. Both themes detracted |
| | | | | | | from performance in the third quarter. The manager’s allocation |
| For the fiscal year ended December 31, 2013, the Fund lost | | to commodity currencies, such as the Canadian and Australian |
| 1.45%. This is compared to the Fund’s benchmark, the Barclays | | dollar, detracted as the U. S. dollar rallied in the fourth quarter. |
| U. S. Aggregate Bond Index, which lost 2.02% during the same | | | | |
| period. The Fund’s performance includes operating expenses, | | Metropolitan West Asset Management, LLC (“Met West”) |
| whereas index returns are unmanaged and do not include | | outperformed the Barclays U. S. Aggregate Bond Index for the |
| expenses of any kind. | | | | fiscal year. Exposure to non-agency residential mortgage-backed |
| For the fiscal year ended December 31, 2013, the Lipper® BBB | | securities was a consistent positive contributor throughout |
| | | | | | | the year. In particular, security selection within the subprime |
| Rated Corporate Debt Funds Average, a group of funds that | | subsector of non-agency mortgages was a primary contributor |
| Lipper considers to have investment strategies similar to those | | to results. A sizeable underweight duration position was also a |
| of the Fund, lost 1.83%. For the same period, the Lipper ® | | | | |
| | | | | | | material contributor to results, as were security selections in both |
| Intermediate Investment Grade Debt Funds Average, another | | high yield and investment grade corporate bonds. Yield curve |
| group of funds that Lipper considers to have investment strategies | | strategies and security selections within the agency mortgage- |
| similar to those of the Fund, lost 0.47%. These returns serve as | | backed securities sector were the largest detractors. |
| peer comparisons and are expressed net of operating expenses. | | | | |
| | | | | | | Logan Circle Partners, L. P. (“Logan Circle”) outperformed |
| How did the market conditions described in the Market | | the Barclays U. S. Aggregate Bond Index for the fiscal year. |
| Summary report affect the Fund’s performance? | | | | Outperformance was generated from across a variety of sectors. |
| Intermediate and long maturity treasury yields began to increase | | Overweights and security selection within both investment grade |
| materially starting in May, after the Federal Reserve expressed its | | and high yield corporate credit were the largest contributors. |
| intent to, by year end, reduce its purchases of agency mortgage- | | Overweights to non-agency mortgage-backed securities, emerging |
| backed securities and treasuries, which was part of a stimulus | | markets, asset-backed securities and non-U. S. developed |
| program commonly referred to as “Quantitative Easing 3”. All | | countries also contributed. Modest active duration strategies |
| else being equal, prices of bonds decline as yields increase. | | slightly detracted. |
| The steepening of the yield curve over the year led to negative | | Pacific Investment Management Company LLC (“PIMCO”) |
| nominal returns for both the Fund and its benchmark. However, | | outperformed the Barclays U. S. Aggregate Bond Index for the |
| the Fund outperformed from a benchmark-relative perspective | | fiscal year. Exposure to non-agency mortgage backed securities |
| as it incurred a lower loss than its benchmark. The Fund’s | | and an underweight duration relative to the benchmark were |
| overweight to credit risk assets, particularly exposure to out-of- | | consistent positive contributors throughout the year. However, |
| index sectors such as high yield corporate bonds and non-agency | | the manager’s underweight to the investment grade credit sector |
| mortgage-backed securities, partially helped offset the negative | | detracted. | | |
Core Bond Fund 77
Russell Investment Funds
Core Bond Fund
Portfolio Management Discussion and Analysis, continued — December 31, 2013 (Unaudited)
| Colchester Global Investors Limited (“Colchester”) outperformed | | Money Managers as of December 31, | | |
| the Barclays U. S. Aggregate Bond Index for the fiscal year. Despite | | 2013 | | | | Styles |
| starting the year off with an underperforming first quarter, the | | | | | | |
| | | Colchester Global Investors Limited | | Fully discretionary |
| manager bounced back in the second quarter with short positions | | Logan Circle Partners, L. P. | | | | Fully discretionary |
| to select commodity currencies, such as the Australian and New | | Macro Currency Group – an investment | | Sector Specialist |
| Zealand dollar, that performed well. Market selection in Europe | | group within Principal Global Investors LLC* | | |
| also benefitted performance in the latter part of the year. | | Metropolitan West Asset Management, LLC | | Fully discretionary |
| | | Pacific Investment Management Company, | | Fully discretionary |
| RIMCo manages the portion of the Fund’s assets that RIMCo | | LLC | | | | |
| determines not to allocate to the money managers. Assets not | | * Principal Global Investors LLC is the asset management arm |
| allocated to managers include the Fund’s liquidity reserves and | | of the Principal Financial Group® (The Principal® ), which |
| assets which may be managed directly by RIMCo to modify the | | includes various member companies including Principal Global |
| Fund’s overall portfolio characteristics to seek to achieve the | | Investors LLC, Principal Global Investors (Europe) Limited, and |
| desired risk/return profile for the Fund. | | others. The Macro Currency Group is the specialist currency |
| During the period, the Fund used derivatives primarily to manage | | investment group within Principal Global Investors. Where used |
| duration, yield-curve positioning, currency risk and credit risk. | | herein, Macro Currency Group means Principal Global Investors |
| For example, futures, forwards, options, interest-rate swaps, | | LLC. | | | | |
| credit default swaps, total return swaps and swaptions were used | | The views expressed in this report reflect those of the |
| for this purpose. The use of these derivatives had a mixed impact | | portfolio managers only through the end of the period |
| on performance, but most of these derivatives were used for risk | | covered by the report. These views do not necessarily |
| management purposes to hedge toward the benchmark. On this | | represent the views of RIMCo, or any other person in RIMCo |
| front, the derivatives performed as expected. | | or any other affiliated organization. These views are |
| | | subject to change at any time based upon market conditions |
| | | or other events, and RIMCo disclaims any responsibility to |
| Describe any changes to the Fund’s structure or the money | | update the views contained herein. These views should not |
| manager line-up. | | be relied on as investment advice and, because investment |
| There were no changes to the money manager lineup during the | | decisions for a Russell Investment Funds (“RIF”) Fund are |
| fiscal year. | | based on numerous factors, should not be relied on as an |
| | | indication of investment decisions of any RIF Fund. |
| * | Assumes initial investment on January 1, 2004. |
| ** | The Barclays U. S. Aggregate Bond Index is an index, with income reinvested, generally representative of of intermediate-term government bonds, investment- grade corporate debtsecurities and mortgage-backed securities. |
| § | Annualized. |
The perforformance shown in this section does not reflect any Insurance Company Separate Account or Policy Charges. Performance is historical and assumes reinvestment of all dividends and capital gains. Investment return and principal value will fluctuate so that an investor’s shares, when redeemed, may be worth more or less than when purchased. Past performance is not indicative of future results.
78 Core Bond Fund
Russell Investment Funds
Core Bond Fund
Shareholder Expense Example — December 31, 2013 (Unaudited)
| Fund Expenses | | Please note that the expenses shown in the table are meant |
| The following disclosure provides important information | | to highlight your ongoing costs only and do not reflect any |
| regarding the Fund’s Shareholder Expense Example | | transactional costs. Therefore, the information under the heading |
| (“Example”) . | | “Hypothetical Performance (5% return before expenses)” is |
| | | useful in comparing ongoing costs only, and will not help you |
| Example | | determine the relative total costs of owning different funds. In |
| As a shareholder of the Fund, you incur two types of costs: (1) | | addition, if these transactional costs were included, your costs |
| transaction costs, and (2) ongoing costs, including advisory and | | would have been higher. The fee and expenses shown in this |
| administrative fees and other Fund expenses. The Example is | | section do not reflect any Insurance Company Separate Account |
| intended to help you understand your ongoing costs (in dollars) | | or Policy Charges. | | | | | | | | | | | |
| of investing in the Fund and to compare these costs with the | | | | | | | | | | | Hypothetical |
| ongoing costs of investing in other mutual funds. The Example | | | | | | | | Actual | | | Performance (5% |
| is based on an investment of $1,000 invested at the beginning of | | | | | | | | Performance | | | return before expenses) |
| the period and held for the entire period indicated, which for this | | | | | | | | | | | |
| | | Beginning Account Value | | | | | | | | | | | |
| Fund is from July 1, 2013 to December 31, 2013. | | July 1, 2013 | | | | $ | | 1,000.00 | | | $ | | 1,000.00 |
| Actual Expenses | | Ending Account Value | | | | | | | | | | | |
| | | December 31, 2013 | | | | $ | | 1,008.80 | | | $ | | 1,022.13 |
| The information in the table under the heading “Actual | | Expenses Paid During Period* | | | | $ | | 3.09 | | | $ | | 3.11 |
| Performance” provides information about actual account values | | | | | | | | | | | | | |
| and actual expenses. You may use the information in this column, | | * Expenses are equal to the Fund's annualized expense ratio of 0.61% |
| | | (representing the six month period annualized), multiplied by the average |
| together with the amount you invested, to estimate the expenses | | account value over the period, multiplied by 184/365 (to reflect the one-half year |
| that you paid over the period. Simply divide your account value by | | period) . May reflect amounts waived, reimbursed and/or other credits. Without |
| $1,000 (for example, an $8,600 account value divided by $1,000 | | any waivers, reimbursements and/or other credits, expenses would have been |
| = 8.6), then multiply the result by the number in the first column | | higher. | | | | | | | | | | | |
| in the row entitled “Expenses Paid During Period” to estimate | | | | | | | | | | | | | |
| the expenses you paid on your account during this period. | | | | | | | | | | | | | |
| |
| Hypothetical Example for Comparison Purposes | | | | | | | | | | | | | |
| The information in the table under the heading “Hypothetical | | | | | | | | | | | | | |
| Performance (5% return before expenses)” provides information | | | | | | | | | | | | | |
| about hypothetical account values and hypothetical expenses | | | | | | | | | | | | | |
| based on the Fund’s actual expense ratio and an assumed rate of | | | | | | | | | | | | | |
| return of 5% per year before expenses, which is not the Fund’s | | | | | | | | | | | | | |
| actual return. The hypothetical account values and expenses | | | | | | | | | | | | | |
| may not be used to estimate the actual ending account balance or | | | | | | | | | | | | | |
| expenses you paid for the period. You may use this information | | | | | | | | | | | | | |
| to compare the ongoing costs of investing in the Fund and other | | | | | | | | | | | | | |
| funds. To do so, compare this 5% hypothetical example with the | | | | | | | | | | | | | |
| 5% hypothetical examples that appear in the shareholder reports | | | | | | | | | | | | | |
| of other funds. | | | | | | | | | | | | | |
Core Bond Fund 79
Russell Investment Funds
Core Bond Fund
Schedule of Investments — December 31, 2013
| Amounts in thousands (except share amounts) | | | | Amounts in thousands (except share amounts) | | |
| | | Principal | | Fair | | | | | | Principal | | Fair |
| | | Amount ($) | | Value | | | | | | Amount ($) | | Value |
| | | or Shares | | $ | | | | | | or Shares | | $ |
| Long-Term Investments - 73.7% | | | | | | Series 2013-1A Class A | | | | | | |
| Asset-Backed Securities - 6.3% | | | | | | 1.650% due 07/17/17 (Þ) | | | | 265 | | 265 |
| | | | | | | Chesapeake Funding LLC | | | | | | |
| Access Group, Inc. | | | | | | Series 2012-1A Class A | | | | | | |
| Series 2008-1 Class A | | | | | | 0.918% due 11/07/23 (Ê)(Þ) | | | | 690 | | 692 |
| 1.538% due 10/27/25 (Ê) | | 476 | | 481 | | | | | | | | |
| | | | | | | CIT Education Loan Trust | | | | | | |
| ACE Securities Corp. | | | | | | Series 2007-1 Class A | | | | | | |
| Series 2005-SD3 Class A | | | | | | 0.336% due 03/25/42 (Ê)(Þ) | | | | 429 | | 393 |
| 0.565% due 08/25/45 (Ê) | | 9 | | 9 | | | | | | | | |
| | | | | | | Citigroup Mortgage Loan Trust, Inc. | | | | | | |
| Ally Master Owner Trust | | | | | | Series 2007-WFH1 Class A3 | | | | | | |
| Series 2012-1 Class A2 | | | | | | 0.315% due 01/25/37 (Ê) | | | | 1,003 | | 977 |
| 1.440% due 02/15/17 | | 445 | | 448 | | | | | | | | |
| | | | | | | Series 2007-WFH1 Class A4 | | | | | | |
| Series 2013-1 Class A2 | | | | | | 0.365% due 01/25/37 (Ê) | | | | 934 | | 768 |
| 1.000% due 02/15/18 | | 835 | | 834 | | | | | | | | |
| | | | | | | Conseco Financial Corp. | | | | | | |
| Alm Loan Funding | | | | | | Series 1999-2 Class A5 | | | | | | |
| Series 2012-7A Class A1 | | | | | | 6.680% due 12/01/30 | | | | 193 | | 193 |
| 1.662% due 10/19/24 (Ê)(Þ) | | 450 | | 449 | | | | | | | | |
| | | | | | | Countrywide Asset-Backed Certificates | | | | | | |
| AmeriCredit Automobile Receivables | | | | | | Series 2006-3 Class 2A2 | | | | | | |
| Trust | | | | | | 0.345% due 06/25/36 (Ê) | | | | 111 | | 106 |
| Series 2010-4 Class B | | | | | | | | | | | | |
| 1.990% due 10/08/15 | | 40 | | 40 | | Series 2007-4 Class A2 | | | | | | |
| Series 2011-3 Class B | | | | | | 5.530% due 04/25/47 | | | | 220 | | 201 |
| 2.280% due 06/08/16 | | 450 | | 453 | | DT Auto Owner Trust | | | | | | |
| | | | | | | Series 2012-2A Class A | | | | | | |
| Series 2012-2 Class A2 | | | | | | 0.910% due 11/16/15 (Þ) | | | | 87 | | 87 |
| 0.760% due 10/08/15 | | 218 | | 218 | | | | | | | | |
| | | | | | | Series 2013-1A Class A | | | | | | |
| Series 2012-4 Class A2 | | | | | | 0.750% due 05/16/16 (Þ) | | | | 457 | | 457 |
| 0.490% due 04/08/16 | | 501 | | 501 | | | | | | | | |
| | | | | | | Series 2013-2A Class A | | | | | | |
| Series 2013-1 Class A2 | | | | | | 0.810% due 09/15/16 (Þ) | | | | 814 | | 814 |
| 0.490% due 06/08/16 | | 245 | | 245 | | | | | | | | |
| | | | | | | Educational Funding of the South, Inc. | | | | | | |
| Series 2013-2 Class A2 | | | | | | Series 2011-1 Class A2 | | | | | | |
| 0.530% due 11/08/16 | | 277 | | 277 | | 0.888% due 04/25/35 (Ê) | | | | 450 | | 449 |
| Series 2013-3 Class A2 | | | | | | EFS Volunteer LLC | | | | | | |
| 0.680% due 10/11/16 | | 165 | | 165 | | Series 2010-1 Class A2 | | | | | | |
| Asset Backed Securities Corp. Home | | | | | | 1.088% due 10/25/35 (Ê)(Þ) | | | | 500 | | 491 |
| Equity | | | | | | Enterprise Fleet Financing LLC | | | | | | |
| Series 2005-HE5 Class M3 | | | | | | Series 2011-3 Class A2 | | | | | | |
| 0.645% due 06/25/35 (Ê) | | 1,050 | | 902 | | 1.620% due 05/20/17 (Þ) | | | | 329 | | 330 |
| Series 2006-HE5 Class A5 | | | | | | Exeter Automobile Receivables Trust | | | | | | |
| 0.405% due 07/25/36 (Ê) | | 1,200 | | 936 | | Series 2013-1A Class A | | | | | | |
| Bank of America Auto Trust | | | | | | 1.290% due 10/16/17 (Þ) | | | | 223 | | 224 |
| Series 2012-1 Class A3 | | | | | | Fannie Mae Grantor Trust | | | | | | |
| 0.780% due 06/15/16 | | 1,875 | | 1,878 | | Series 2003-T4 Class 2A5 | | | | | | |
| Bayview Financial Acquisition Trust | | | | | | 5.407% due 09/26/33 | | | | 48 | | 53 |
| Series 2006-A Class 1A3 | | | | | | Federal Home Loan Mortgage Corp. | | | | | | |
| 5.865% due 02/28/41 | | 190 | | 197 | | Structured Pass Through Securities | | | | | | |
| Brazos Higher Education Authority | | | | | | Series 2000-30 Class A5 | | | | | | |
| Series 2010-1 Class A2 | | | | | | 7.791% due 12/25/30 | | | | 33 | | 33 |
| 1.438% due 02/25/35 (Ê) | | 500 | | 508 | | Ford Credit Auto Lease Trust | | | | | | |
| Series 2011-2 Class A3 | | | | | | Series 2011-B Class A4 | | | | | | |
| 1.238% due 10/27/36 (Ê) | | 410 | | 406 | | 1.420% due 01/15/15 | | | | 220 | | 220 |
| CCG Receivables Trust | | | | | | Series 2012-A Class A3 | | | | | | |
| Series 2013-1 Class A2 | | | | | | 0.850% due 01/15/15 | | | | 1,018 | | 1,019 |
| 1.050% due 08/14/20 (Þ) | | 355 | | 355 | | Ford Credit Auto Owner Trust | | | | | | |
| CFC LLC | | | | | | Series 2012-A Class A3 | | | | | | |
| | | | | | | 0.840% due 08/15/16 | | | | 436 | | 437 |
See accompanying notes which are an integral part of the financial statements.
80 Core Bond Fund
Russell Investment Funds
Core Bond Fund
Schedule of Investments, continued — December 31, 2013
| Amounts in thousands (except share amounts) | | | | Amounts in thousands (except share amounts) | | |
| | | Principal | | Fair | | | | Principal | | Fair |
| | | Amount ($) | | Value | | | | Amount ($) | | Value |
| | | or Shares | | $ | | | | or Shares | | $ |
| Gabs Dynegy Danskammer LLC | | | | | | | Series 2007-HE5 Class A2C | | | | |
| Class B | | | | | | | 0.415% due 03/25/37 (Ê) | | 758 | | 393 |
| 7.670% due 08/11/16(Ø) | | 700 | | | — | | Series 2007-HE5 Class A2D | | | | |
| Green Tree | | | | | | | 0.505% due 03/25/37 (Ê) | | 762 | | 399 |
| Series 2008-MH1 Class A2 | | | | | | | Motor PLC | | | | |
| 8.970% due 04/25/38 (Þ) | | 708 | | | 765 | | Series 2012-12A Class A1C | | | | |
| Honda Auto Receivables Owner Trust | | | | | | | 1.286% due 02/25/20 (Þ) | | 315 | | 315 |
| Series 2010-3 Class A4 | | | | | | | Nissan Auto Lease Trust | | | | |
| 0.940% due 12/21/16 | | 696 | | | 696 | | Series 2012-A Class A3 | | | | |
| Series 2011-3 Class A3 | | | | | | | 0.980% due 05/15/15 | | 1,579 | | 1,580 |
| 0.880% due 09/21/15 | | 703 | | | 705 | | Nissan Auto Receivables Owner Trust | | | | |
| HSBC Home Equity Loan Trust | | | | | | | Series 2011-A Class A3 | | | | |
| Series 2005-1 Class A | | | | | | | 1.180% due 02/16/15 | | 21 | | 21 |
| 0.457% due 01/20/34 (Ê) | | 100 | | | 100 | | NOB Hill CLO, Ltd. | | | | |
| Hyundai Auto Receivables Trust | | | | | | | Series 2006-1A Class A1 | | | | |
| Series 2011-B Class A3 | | | | | | | 0.491% due 08/15/18 (Ê)(Þ) | | 387 | | 385 |
| 1.040% due 09/15/15 | | 38 | | | 38 | | OHA Credit Partners VII, Ltd. | | | | |
| Series 2012-A Class A3 | | | | | | | Series 2012-7A Class A | | | | |
| 0.720% due 03/15/16 | | 224 | | | 225 | | 1.657% due 11/20/23 (Ê)(Þ) | | 450 | | 448 |
| JGWPT XXX LLC | | | | | | | Pacifica CDO V Corp. | | | | |
| Series 2013-3A Class A | | | | | | | Series 2006-5A Class A1 | | | | |
| 4.080% due 07/15/41 (Þ) | | 313 | | | 310 | | 0.498% due 01/26/20 (Ê)(Þ) | | 165 | | 164 |
| JPMorgan Mortgage Acquisition Corp. | | | | | | | Popular ABS Mortgage Pass-Through | | | | |
| Series 2007-HE1 Class AF6 | | | | | | | Trust | | | | |
| 4.585% due 03/25/47 | | 1,800 | | | 1,431 | | Series 2005-6 Class A3 | | | | |
| Lafayette CLO I, Ltd. | | | | | | | 4.600% due 01/25/36 | | 85 | | 78 |
| Series 2012-1A Class A | | | | | | | Series 2006-C Class A4 | | | | |
| 1.642% due 09/06/22 (Ê)(Þ) | | 72 | | | 72 | | 0.415% due 07/25/36 (Ê) | | 1,380 | | 1,131 |
| Landmark VII CDO, Ltd. | | | | | | | Series 2006-D Class A3 | | | | |
| Series 2006-7A Class A1L | | | | | | | 0.425% due 11/25/46 (Ê) | | 1,500 | | 1,115 |
| 0.519% due 07/15/18 (Ê)(Þ) | | 183 | | | 182 | | Prestige Auto Receivables Trust | | | | |
| Lehman XS Trust | | | | | | | Series 2013-1A Class A2 | | | | |
| Series 2006-9 Class A1B | | | | | | | 1.090% due 02/15/18 (Þ) | | 281 | | 282 |
| 0.325% due 05/25/46 (Ê) | | 149 | | | 118 | | RAMP Trust | | | | |
| Series 2006-13 Class 1A2 | | | | | | | Series 2003-RS9 Class AI6A | | | | |
| 0.335% due 09/25/36 (Ê) | | 140 | | | 112 | | 6.110% due 10/25/33 | | 328 | | 329 |
| Series 2006-19 Class A2 | | | | | | | Series 2003-RS11 Class AI6A | | | | |
| 0.335% due 12/25/36 (Ê) | | 142 | | | 112 | | 5.980% due 12/25/33 | | 109 | | 108 |
| Long Beach Mortgage Loan Trust | | | | | | | RASC Trust | | | | |
| Series 2004-4 Class 1A1 | | | | | | | Series 2003-KS4 Class AIIB | | | | |
| 0.725% due 10/25/34 (Ê) | | 5 | | | 4 | | 0.745% due 06/25/33 (Ê) | | 25 | | 19 |
| Series 2004-4 Class M1 | | | | | | | Red River CLO, Ltd. | | | | |
| 1.065% due 10/25/34 (Ê) | | 1,200 | | | 1,127 | | Series 2006-1A Class A | | | | |
| Merrill Lynch First Franklin Mortgage | | | | | | | 0.512% due 07/27/18 (Ê)(Þ) | | 446 | | 437 |
| Loan Trust | | | | | | | Renaissance Home Equity Loan Trust | | | | |
| Series 2007-1 Class A2B | | | | | | | Series 2005-2 Class AF4 | | | | |
| 0.335% due 04/25/37 (Ê) | | 118 | | | 66 | | 4.934% due 08/25/35 | | 85 | | 82 |
| Series 2007-4 Class 2A2 | | | | | | | Series 2006-1 Class AF6 | | | | |
| 0.285% due 07/25/37 (Ê) | | 838 | | | 508 | | 5.746% due 05/25/36 | | 145 | | 108 |
| Montana Higher Education Student | | | | | | | Series 2007-1 Class AF2 | | | | |
| Assistance Corp. | | | | | | | 5.512% due 04/25/37 | | 412 | | 212 |
| Series 2012-1 Class A3 | | | | | | | Series 2007-2 Class AF2 | | | | |
| 1.217% due 07/20/43 (Ê) | | 650 | | | 647 | | 5.675% due 06/25/37 | | 124 | | 66 |
| Morgan Stanley ABS Capital I, Inc. Trust | | | | | | | Santander Drive Auto Receivables Trust | | | | |
See accompanying notes which are an integral part of the financial statements.
Core Bond Fund 81
Russell Investment Funds
Core Bond Fund
Schedule of Investments, continued — December 31, 2013
| Amounts in thousands (except share amounts) | | | | Amounts in thousands (except share amounts) | | |
| | | Principal | | Fair | | | | Principal | | Fair |
| | | Amount ($) | | Value | | | | Amount ($) | | Value |
| | | or Shares | | $ | | | | or Shares | | $ |
| Series 2011-2 Class B | | | | | | Series 2008-8 Class B | | | | |
| 2.660% due 01/15/16 | | 125 | | 126 | | 2.488% due 10/25/29 (Ê) | | 205 | | 206 |
| Series 2012-1 Class B | | | | | | Series 2008-9 Class B | | | | |
| 2.720% due 05/16/16 | | 340 | | 344 | | 2.488% due 10/25/29 (Ê) | | 205 | | 207 |
| Series 2012-2 Class A2 | | | | | | Series 2012-7 Class A3 | | | | |
| 0.910% due 05/15/15 | | 1 | | 1 | | 0.815% due 05/26/26 (Ê) | | 475 | | 473 |
| Series 2012-2 Class A3 | | | | | | Series 2013-4 Class A | | | | |
| 1.220% due 12/15/15 | | 575 | | 576 | | 0.715% due 06/25/27 (Ê) | | 452 | | 451 |
| Series 2012-2 Class B | | | | | | Small Business Administration | | | | |
| 2.090% due 08/15/16 | | 430 | | 434 | | Participation Certificates | | | | |
| Series 2013-1 Class B | | | | | | Series 2005-20G Class 1 | | | | |
| 1.160% due 01/15/19 | | 230 | | 230 | | 4.750% due 07/01/25 | | 379 | | 403 |
| Series 2013-2 Class A2 | | | | | | Series 2013-20G Class 1 | | | | |
| 0.470% due 03/15/16 | | 120 | | 120 | | 3.150% due 07/01/33 | | 175 | | 172 |
| Series 2013-3 Class B | | | | | | SMART Trust | | | | |
| 1.190% due 05/15/18 | | 595 | | 592 | | Series 2011-2USA Class A4A | | | | |
| Series 2013-A Class A2 | | | | | | 2.310% due 04/14/17 (Þ) | | 770 | | 781 |
| 0.800% due 10/17/16 (Þ) | | 490 | | 490 | | Series 2012-1USA Class A4A | | | | |
| SLM Private Education Loan Trust | | | | | | 2.010% due 12/14/17 (Þ) | | 310 | | 313 |
| Series 2010-A Class 2A | | | | | | Series 2013-1US Class A4A | | | | |
| 3.417% due 05/16/44 (Ê)(Þ) | | 933 | | 989 | | 1.050% due 10/14/18 | | 305 | | 302 |
| Series 2012-B Class A2 | | | | | | Soundview Home Equity Loan Trust | | | | |
| 3.480% due 10/15/30 (Þ) | | 580 | | 606 | | Series 2005-1 Class M2 | | | | |
| Series 2013-B Class A2A | | | | | | 0.915% due 04/25/35 (Ê) | | 661 | | 652 |
| 1.850% due 06/17/30 (Þ) | | 1,250 | | 1,205 | | Series 2005-OPT3 Class A4 | | | | |
| SLM Student Loan Trust | | | | | | 0.465% due 11/25/35 (Ê) | | 216 | | 213 |
| Series 2003-11 Class A6 | | | | | | Washington Mutual Asset-Backed | | | | |
| 0.993% due 12/15/25 (Ê)(Þ) | | 350 | | 347 | | Certificates | | | | |
| Series 2004-8 Class B | | | | | | Series 2006-HE2 Class A3 | | | | |
| 0.698% due 01/25/40 (Ê) | | 143 | | 127 | | 0.315% due 05/25/36 (Ê) | | 452 | | 280 |
| Series 2005-5 Class A2 | | | | | | | | | | 48,148 |
| 0.318% due 10/25/21 (Ê) | | 38 | | 38 | | Corporate Bonds and Notes - 10.5% | | | | |
| Series 2006-2 Class A6 | | | | | | 21st Century Fox America, Inc. | | | | |
| 0.408% due 01/25/41 (Ê) | | 570 | | 497 | | 8.250% due 10/17/96 | | 20 | | 24 |
| Series 2006-8 Class A6 | | | | | | AbbVie, Inc. | | | | |
| 0.398% due 01/25/41 (Ê) | | 570 | | 497 | | 0.998% due 11/06/15 (Ê) | | 400 | | 404 |
| Series 2007-6 Class B | | | | | | Ally Financial, Inc. | | | | |
| 1.088% due 04/27/43 (Ê) | | 205 | | 180 | | 4.625% due 06/26/15 | | 400 | | 416 |
| Series 2008-2 Class B | | | | | | Alterra USA Holdings, Ltd. | | | | |
| 1.438% due 01/25/29 (Ê) | | 205 | | 179 | | 7.200% due 04/14/17 (Þ) | | 155 | | 170 |
| Series 2008-3 Class B | | | | | | Altria Group, Inc. | | | | |
| 1.438% due 04/25/29 (Ê) | | 205 | | 183 | | 10.200% due 02/06/39 | | 127 | | 198 |
| Series 2008-4 Class A4 | | | | | | Amazon. com, Inc. | | | | |
| 1.888% due 07/25/22 (Ê) | | 1,400 | | 1,460 | | 1.200% due 11/29/17 | | 295 | | 289 |
| Series 2008-4 Class B | | | | | | American Airlines Class A Pass Through | | | | |
| 2.088% due 04/25/29 (Ê) | | 205 | | 195 | | Trust | | | | |
| | | | | | | 4.950% due 01/15/23 (Þ) | | 475 | | 495 |
| Series 2008-5 Class B | | | | | | | | | | |
| 2.088% due 07/25/29 (Ê) | | 205 | | 201 | | Series 2013-1 | | | | |
| | | | | | | 4.000% due 07/15/25 (Þ) | | 450 | | 435 |
| Series 2008-6 Class B | | | | | | | | | | |
| 2.088% due 07/25/29 (Ê) | | 205 | | 196 | | American International Group, Inc. | | | | |
| | | | | | | 4.875% due 09/15/16 | | 440 | | 483 |
| Series 2008-7 Class A2 | | | | | | 8.175% due 05/15/58 | | 545 | | 659 |
| 0.738% due 10/25/17 (Ê) | | 1,284 | | 1,285 | | | | | | |
| | | | | | | Ameriprise Financial, Inc. | | | | |
| Series 2008-7 Class B | | | | | | 7.518% due 06/01/66 | | 210 | | 233 |
| 2.088% due 07/25/29 (Ê) | | 205 | | 196 | | | | | | |
| |
| See accompanying notes which are an integral part of the financial statements. | | | | | | |
82 Core Bond Fund
Russell Investment Funds
Core Bond Fund
Schedule of Investments, continued — December 31, 2013
| Amounts in thousands (except share amounts) | | | | Amounts in thousands (except share amounts) | | |
| | | Principal | | Fair | | | | Principal | | Fair |
| | | Amount ($) | | Value | | | | Amount ($) | | Value |
| | | or Shares | | $ | | | | or Shares | | $ |
| AmerisourceBergen Corp. | | | | | | 4.587% due 12/15/15 | | 700 | | 748 |
| 5.875% due 09/15/15 | | 155 | | 168 | | 5.850% due 08/02/16 | | 220 | | 245 |
| Anheuser-Busch InBev Worldwide, Inc. | | | | | | 6.000% due 08/15/17 | | 450 | | 513 |
| 6.875% due 11/15/19 | | 345 | | 423 | | 6.125% due 11/21/17 | | 405 | | 467 |
| Arch Coal, Inc. | | | | | | 5.375% due 08/09/20 | | 250 | | 284 |
| 7.000% due 06/15/19 | | 350 | | 278 | | | | | | |
| | | | | | | 3.500% due 05/15/23 | | 775 | | 722 |
| Ashland, Inc. | | | | | | | | | | |
| 4.750% due 08/15/22 | | 590 | | 561 | | CNH Capital LLC | | | | |
| | | | | | | 3.875% due 11/01/15 | | 330 | | 341 |
| 6.875% due 05/15/43 | | 145 | | 137 | | | | | | |
| | | | | | | Commonwealth Edison Co. | | | | |
| AT&T Corp. | | | | | | 5.800% due 03/15/18 | | 290 | | 333 |
| 8.000% due 11/15/31 | | 175 | | 233 | | | | | | |
| | | | | | | ConAgra Foods, Inc. | | | | |
| AT&T, Inc. | | | | | | 4.950% due 08/15/20 | | 410 | | 440 |
| 2.625% due 12/01/22 | | 280 | | 253 | | | | | | |
| | | | | | | Continental Airlines 2000-1 Class A-1 | | | | |
| Bank of America Corp. | | | | | | Pass Through Trust | | | | |
| 4.500% due 04/01/15 | | 400 | | 418 | | Series 00A1 | | | | |
| 4.750% due 08/01/15 | | 320 | | 339 | | 8.048% due 11/01/20 | | 307 | | 352 |
| 5.625% due 10/14/16 | | 200 | | 223 | | Continental Airlines Pass Through Trust | | | | |
| 5.750% due 12/01/17 | | 140 | | 159 | | Series 071A | | | | |
| 4.100% due 07/24/23 | | 860 | | 864 | | 5.983% due 04/19/22 | | 129 | | 141 |
| Bank of America NA | | | | | | Series 09-1 | | | | |
| 0.709% due 11/14/16 (Ê) | | 1,700 | | 1,703 | | 9.000% due 07/08/16 | | 201 | | 229 |
| Series BKNT | | | | | | Series 991A Class A | | | | |
| 0.523% due 06/15/16 (Ê) | | 600 | | 594 | | 6.545% due 02/02/19 | | 153 | | 167 |
| 5.300% due 03/15/17 | | 200 | | 220 | | Coventry Health Care, Inc. | | | | |
| 6.100% due 06/15/17 | | 775 | | 874 | | 5.450% due 06/15/21 | | 415 | | 462 |
| Bank of New York Mellon Corp. | | | | | | Crown Castle Towers LLC | | | | |
| 2.100% due 01/15/19 | | 385 | | 382 | | 3.214% due 08/15/15 (Þ) | | 130 | | 133 |
| Barrick NA Finance LLC | | | | | | CVS Caremark Corp. | | | | |
| 5.750% due 05/01/43 | | 385 | | 346 | | 3.250% due 05/18/15 | | 295 | | 305 |
| Bear Stearns Cos. LLC (The) | | | | | | Daimler Finance NA LLC | | | | |
| 5.550% due 01/22/17 | | 330 | | 368 | | 0.843% due 01/09/15 (Ê)(Þ) | | 400 | | 401 |
| 7.250% due 02/01/18 | | 195 | | 233 | | 1.300% due 07/31/15 (Þ) | | 1,300 | | 1,308 |
| Burlington Northern Santa Fe LLC | | | | | | Delta Air Lines Pass Through Trust | | | | |
| 6.875% due 12/01/27 | | 25 | | 30 | | Series 2002-1 Class G-1 | | | | |
| 6.750% due 03/15/29 | | 10 | | 11 | | 6.718% due 01/02/23 | | 108 | | 120 |
| Carlyle Holdings II Finance LLC | | | | | | DIRECTV Holdings LLC / DIRECTV | | | | |
| 5.625% due 03/30/43 (Þ) | | 500 | | 492 | | Financing Co. , Inc. | | | | |
| | | | | | | 5.000% due 03/01/21 | | 420 | | 441 |
| Cellco Partnership / Verizon Wireless | | | | | | | | | | |
| Capital LLC | | | | | | Discover Financial Services | | | | |
| 8.500% due 11/15/18 | | 455 | | 576 | | 5.200% due 04/27/22 | | 260 | | 271 |
| CenterPoint Energy Resources Corp. | | | | | | Duke Energy Progress, Inc. | | | | |
| 6.125% due 11/01/17 | | 50 | | 57 | | 4.100% due 03/15/43 | | 310 | | 286 |
| Chase Capital III | | | | | | El Paso Natural Gas Co. LLC | | | | |
| Series C | | | | | | 7.500% due 11/15/26 | | 100 | | 121 |
| 0.789% due 03/01/27 (Ê) | | 295 | | 240 | | Energy Transfer Partners, LP | | | | |
| Chevron Corp. | | | | | | 6.050% due 06/01/41 | | 205 | | 210 |
| 3.191% due 06/24/23 | | 325 | | 312 | | 3.259% due 11/01/66 (Ê) | | 1,380 | | 1,256 |
| CHS/Community Health Systems, Inc. | | | | | | Enterprise Products Operating LLC | | | | |
| 8.000% due 11/15/19 | | 180 | | 195 | | 5.250% due 01/31/20 | | 540 | | 602 |
| CIT Group, Inc. | | | | | | Series B | | | | |
| 6.625% due 04/01/18 (Þ) | | 390 | | 438 | | 7.034% due 01/15/68 | | 370 | | 409 |
| Citigroup, Inc. | | | | | | Express Scripts Holding Co. | | | | |
| 4.700% due 05/29/15 | | 50 | | 53 | | 3.500% due 11/15/16 | | 410 | | 433 |
| 2.250% due 08/07/15 | | 1,295 | | 1,322 | | Farmers Exchange Capital | | | | |
| |
| | | | | | | See accompanying notes which are an integral part of the financial statements. |
| | | | | | | | | Core Bond Fund 83 |
Russell Investment Funds
Core Bond Fund
Schedule of Investments, continued — December 31, 2013
| Amounts in thousands (except share amounts) | | | | Amounts in thousands (except share amounts) | | |
| | | Principal | | Fair | | | | | Principal | | Fair |
| | | Amount ($) | | Value | | | | | Amount ($) | | Value |
| | | or Shares | | $ | | | | | or Shares | | $ |
| 7.200% due 07/15/48 (Þ) | | 300 | | 343 | | 4.650% due 12/09/21 | | | 615 | | 633 |
| Farmers Exchange Capital II | | | | | | Historic TW, Inc. | | | | | |
| 6.151% due 11/01/53 (Þ) | | 975 | | 998 | | 8.050% due 01/15/16 | | | 195 | | 221 |
| First Data Corp. | | | | | | Hospira, Inc. | | | | | |
| 8.250% due 01/15/21 (Þ) | | 585 | | 622 | | 5.800% due 08/12/23 | | | 465 | | 480 |
| Ford Motor Credit Co. LLC | | | | | | HSBC Finance Corp. | | | | | |
| 7.000% due 04/15/15 | | 600 | | 646 | | 5.500% due 01/19/16 | | | 1,900 | | 2,059 |
| 2.750% due 05/15/15 | | 200 | | 205 | | HSBC USA, Inc. | | | | | |
| FPL Energy Wind Funding LLC | | | | | | 2.375% due 02/13/15 | | | 235 | | 240 |
| 6.876% due 06/27/17 (Þ) | | 68 | | 65 | | Humana, Inc. | | | | | |
| Freeport-McMoRan Copper & Gold, Inc. | | | | | | 6.450% due 06/01/16 | | | 160 | | 179 |
| 3.100% due 03/15/20 | | 340 | | 330 | | 8.150% due 06/15/38 | | | 285 | | 377 |
| General Electric Capital Corp. | | | | | | Indiantown Cogeneration, LP | | | | | |
| 4.375% due 09/16/20 | | 300 | | 325 | | Series A-10 | | | | | |
| Series A | | | | | | 9.770% due 12/15/20 | | | 177 | | 192 |
| 7.125% due 06/15/49 (Æ)(ƒ) | | 520 | | 581 | | International Lease Finance Corp. | | | | | |
| Series GMTN | | | | | | 4.875% due 04/01/15 | | | 350 | | 362 |
| 5.625% due 05/01/18 | | 230 | | 264 | | 6.750% due 09/01/16 (Þ) | | | 100 | | 112 |
| 6.875% due 01/10/39 | | 350 | | 450 | | 3.875% due 04/15/18 | | | 210 | | 211 |
| General Electric Co. | | | | | | IPALCO Enterprises, Inc. | | | | | |
| 5.250% due 12/06/17 | | 340 | | 385 | | 5.000% due 05/01/18 | | | 500 | | 524 |
| General Motors Co. | | | | | | JetBlue Airways Pass Through Trust | | | | | |
| 4.875% due 10/02/23 (Þ) | | 1,065 | | 1,078 | | Series 04-2 Class G-2 | | | | | |
| 6.250% due 10/02/43 (Þ) | | 275 | | 286 | | 0.691% due 11/15/16 (Ê) | | | 750 | | 722 |
| Genworth Holdings, Inc. | | | | | | JPMorgan Chase & Co. | | | | | |
| 6.150% due 11/15/66 | | 365 | | 323 | | 4.250% due 10/15/20 | | | 300 | | 318 |
| Georgia-Pacific LLC | | | | | | Series GMTN | | | | | |
| 8.875% due 05/15/31 | | 270 | | 375 | | 0.857% due 02/26/16 (Ê) | | | 1,400 | | 1,406 |
| Glencore Funding LLC | | | | | | JPMorgan Chase Bank NA | | | | | |
| 2.500% due 01/15/19 (Þ) | | 405 | | 392 | | Series BKNT | | | | | |
| Goldman Sachs Group, Inc. (The) | | | | | | 5.875% due 06/13/16 | | | 70 | | 78 |
| 6.150% due 04/01/18 | | 400 | | 459 | | 6.000% due 10/01/17 | | | 945 | | 1,082 |
| 5.750% due 01/24/22 | | 265 | | 298 | | JPMorgan Chase Capital XIII | | | | | |
| 6.750% due 10/01/37 | | 535 | | 595 | | Series M | | | | | |
| Series D | | | | | | 1.197% due 09/30/34 (Ê) | | | 480 | | 382 |
| 6.000% due 06/15/20 | | 150 | | 172 | | JPMorgan Chase Capital XXI | | | | | |
| | | | | | | Series U | | | | | |
| Series GMTN | | | | | | 1.192% due 02/02/37 (Ê) | | | 335 | | 248 |
| 7.500% due 02/15/19 | | 300 | | 365 | | | | | | | |
| | | | | | | JPMorgan Chase Capital XXIII | | | | | |
| Great Plains Energy, Inc. | | | | | | 1.241% due 05/15/47 (Ê) | | | 545 | | 392 |
| 5.292% due 06/15/22 | | 380 | | 408 | | | | | | | |
| | | | | | | Life Technologies Corp. | | | | | |
| HCA, Inc. | | | | | | 6.000% due 03/01/20 | | | 330 | | 379 |
| 7.250% due 09/15/20 | | 496 | | 541 | | | | | | | |
| | | | | | | Lorillard Tobacco Co. | | | | | |
| 4.750% due 05/01/23 | | 205 | | 193 | | 8.125% due 06/23/19 | | | 575 | | 700 |
| HCP, Inc. | | | | | | Manufacturers & Traders Trust Co. | | | | | |
| 2.625% due 02/01/20 | | 625 | | 596 | | 5.585% due 12/28/20 | | | 84 | | 86 |
| 5.375% due 02/01/21 | | 400 | | 435 | | Merrill Lynch & Co. , Inc. | | | | | |
| Health Care REIT, Inc. | | | | | | Series GMTN | | | | | |
| 4.950% due 01/15/21 | | 365 | | 386 | | 6.400% due 08/28/17 | | | 200 | | 231 |
| 5.250% due 01/15/22 | | 200 | | 213 | | MetLife, Inc. | | | | | |
| 6.500% due 03/15/41 | | 140 | | 155 | | 5.700% due 06/15/35 | | | 315 | | 344 |
| Healthcare Realty Trust, Inc. | | | | | | 10.750% due 08/01/39 | | | 570 | | 841 |
| 6.500% due 01/17/17 | | 700 | | 785 | | Metropolitan Life Global Funding I | | | | | |
| Hewlett-Packard Co. | | | | | | 1.875% due 06/22/18 (Þ) | | | 750 | | 736 |
See accompanying notes which are an integral part of the financial statements.
84 Core Bond Fund
Russell Investment Funds
Core Bond Fund
Schedule of Investments, continued — December 31, 2013
| Amounts in thousands (except share amounts) | | | | Amounts in thousands (except share amounts) | | |
| | | | | Principal | | Fair | | | | | | Principal | | Fair |
| | | | | Amount ($) | | Value | | | | | | Amount ($) | | Value |
| | | | | or Shares | | $ | | | | | | or Shares | | $ |
| Mirant Mid Atlantic Pass Through Trust | | | | | | | | Samsung Electronics America, Inc. | | | | | | |
| Series B | | | | | | | | 1.750% due 04/10/17 (Þ) | | | | 635 | | 631 |
| 9.125% due 06/30/17 | | | | 268 | | 286 | | Simon Property Group, LP | | | | | | |
| Monongahela Power Co. | | | | | | | | 10.350% due 04/01/19 | | | | 160 | | 217 |
| 4.100% due 04/15/24 (Þ) | | | | 235 | | 235 | | SL Green Realty Corp. / SL Green | | | | | | |
| 5.400% due 12/15/43 (Þ) | | | | 255 | | 265 | | Operating Partnership / Reckson | | | | | | |
| Morgan Stanley | | | | | | | | Operating Partnership | | | | | | |
| 0.724% due 10/15/15 (Ê) | | | | 180 | | 180 | | 7.750% due 03/15/20 | | | | 325 | | 382 |
| 5.550% due 04/27/17 | | | | 425 | | 474 | | SLM Corp. | | | | | | |
| 6.250% due 08/28/17 | | | | 500 | | 572 | | 6.250% due 01/25/16 | | | | 1,800 | | 1,944 |
| 5.625% due 09/23/19 | | | | 275 | | 313 | | South Carolina Electric & Gas Co. | | | | | | |
| | | | | | | | | 6.500% due 11/01/18 | | | | 150 | | 179 |
| 5.000% due 11/24/25 | | | | 435 | | 436 | | Springleaf Finance Corp. | | | | | | |
| Series GMTN | | | | | | | | 6.900% due 12/15/17 | | | | 300 | | 328 |
| 5.450% due 01/09/17 | | | | 225 | | 250 | | Series MTNI | | | | | | |
| National City Bank | | | | | | | | 5.400% due 12/01/15 | | | | 700 | | 728 |
| Series BKNT | | | | | | | | | | | | | | |
| 0.612% due 06/07/17 (Ê) | | | | 500 | | 494 | | Sprint Capital Corp. | | | | | | |
| | | | | | | | | 8.750% due 03/15/32 | | | | 995 | | 1,067 |
| Nationwide Mutual Insurance Company | | | | | | | | | | | | | | |
| 5.810% due 12/15/24 (Þ) | | | | 500 | | 506 | | Tennessee Gas Pipeline Co. LLC | | | | | | |
| | | | | | | | | 8.000% due 02/01/16 | | | | 200 | | 226 |
| Nisource Finance Corp. | | | | | | | | | | | | | | |
| 6.400% due 03/15/18 | | | | 145 | | 167 | | 8.375% due 06/15/32 | | | | 460 | | 593 |
| Nomura Holdings Inc. | | | | | | | | Time Warner Cable, Inc. | | | | | | |
| 2.000% due 09/13/16 | | | | 575 | | 580 | | 8.250% due 04/01/19 | | | | 425 | | 498 |
| NVR, Inc. | | | | | | | | 5.000% due 02/01/20 | | | | 120 | | 122 |
| 3.950% due 09/15/22 | | | | 380 | | 359 | | Time Warner, Inc. | | | | | | |
| Oncor Electric Delivery Co. LLC | | | | | | | | 5.875% due 11/15/16 | | | | 400 | | 451 |
| 6.800% due 09/01/18 | | | | 550 | | 646 | | UAL Pass Through Trust | | | | | | |
| Panhandle Eastern Pipe Line Co. , LP | | | | | | | | Series 09-1 | | | | | | |
| 8.125% due 06/01/19 | | | | 450 | | 540 | | 10.400% due 11/01/16 | | | | 46 | | 52 |
| Petrohawk Energy Corp. | | | | | | | | UnitedHealth Group, Inc. | | | | | | |
| 7.250% due 08/15/18 | | | | 230 | | 248 | | 6.000% due 06/15/17 | | | | 3 | | 3 |
| Plains Exploration & Production Co. | | | | | | | | Ventas Realty, LP / Ventas Capital Corp. | | | | | | |
| 6.875% due 02/15/23 | | | | 355 | | 396 | | 2.000% due 02/15/18 | | | | 200 | | 197 |
| Progress Energy, Inc. | | | | | | | | Verizon Communications, Inc. | | | | | | |
| 5.625% due 01/15/16 | | | | 40 | | 44 | | 2.500% due 09/15/16 | | | | 100 | | 103 |
| Prudential Holdings LLC | | | | | | | | 1.993% due 09/14/18 (Ê) | | | | 100 | | 105 |
| 8.695% due 12/18/23 (Þ) | | | | 526 | | 668 | | 3.650% due 09/14/18 | | | | 300 | | 318 |
| Public Service Co. of Colorado | | | | | | | | 5.150% due 09/15/23 | | | | 1,900 | | 2,040 |
| 2.500% due 03/15/23 | | | | 195 | | 178 | | 6.550% due 09/15/43 | | | | 370 | | 433 |
| Public Service Co. of New Mexico | | | | | | | | Wachovia Capital Trust III | | | | | | |
| 7.950% due 05/15/18 | | | | 260 | | 309 | | 5.570% due 03/29/49 (Ê)(ƒ) | | | | 415 | | 380 |
| QVC, Inc. | | | | | | | | WEA Finance LLC / WT Finance | | | | | | |
| 7.500% due 10/01/19 (Þ) | | | | 260 | | 280 | | Australia Pty, Ltd. | | | | | | |
| 4.375% due 03/15/23 | | | | 365 | | 341 | | 6.750% due 09/02/19 (Þ) | | | | 95 | | 113 |
| ROC Finance LLC / ROC Finance 1 | | | | | | | | Wells Fargo & Co. | | | | | | |
| Corp. | | | | | | | | 2.150% due 01/15/19 | | | | 255 | | 254 |
| 12.125% due 09/01/18 (Þ) | | | | 340 | | 349 | | 4.125% due 08/15/23 | | | | 800 | | 789 |
| Rock Tenn Co. | | | | | | | | Williams Cos. , Inc. (The) | | | | | | |
| 4.000% due 03/01/23 | | | | 425 | | 406 | | 7.875% due 09/01/21 | | | | 161 | | 186 |
| Rockwood Specialties Group, Inc. | | | | | | | | 7.750% due 06/15/31 | | | | 108 | | 116 |
| 4.625% due 10/15/20 | | | | 200 | | 204 | | Williams Partners, LP | | | | | | |
| Sabine Pass LNG, LP | | | | | | | | 4.125% due 11/15/20 | | | | 395 | | 405 |
| 7.500% due 11/30/16 | | | | 175 | | 198 | | 5.800% due 11/15/43 | | | | 270 | | 276 |
| 7.500% due 11/30/16 (Þ) | | | | 380 | | 416 | | | | | | | | |
See accompanying notes which are an integral part of the financial statements.
Core Bond Fund 85
Russell Investment Funds
Core Bond Fund
Schedule of Investments, continued — December 31, 2013
| Amounts in thousands (except share amounts) | | | | Amounts in thousands (except share amounts) | | |
| | | | | Principal | | Fair | | | | Principal | | Fair |
| | | | | Amount ($) | | Value | | | | Amount ($) | | Value |
| | | | | or Shares | | $ | | | | or Shares | | $ |
| Williams Partners, LP / Williams | | | | | | | | | 3.000% due 05/09/23 | | | | 600 | | | 536 |
| Partners Finance Corp. | | | | | | | | | Cooperatieve Centrale Raiffeisen- | | | | | | | |
| 7.250% due 02/01/17 | | | | 235 | | | 271 | | Boerenleenbank BA | | | | | | | |
| ZFS Finance USA Trust II | | | | | | | | | 3.950% due 11/09/22 | | | | 577 | | | 559 |
| 6.450% due 12/15/65 (Þ) | | | | 550 | | | 587 | | 4.625% due 12/01/23 | | | | 670 | | | 675 |
| ZFS Finance USA Trust V | | | | | | | | | Credit Suisse | | | | | | | |
| 6.500% due 05/09/37 (Þ) | | | | 750 | | | 797 | | 6.000% due 02/15/18 | | | | 770 | | | 892 |
| | | | | | | | 79,983 | | DP World, Ltd. | | | | | | | |
| International Debt - 5.4% | | | | | | | | | 6.850% due 07/02/37 (Þ) | | | | 330 | | | 324 |
| ABN AMRO Bank NV | | | | | | | | | Duane Street CLO III, Ltd. | | | | | | | |
| 1.036% due 10/28/16 (Ê)(Þ) | | | | 300 | | | 300 | | Series 2006-3A Class A1 | | | | | | | |
| Ainsworth Lumber Co. , Ltd. | | | | | | | | | 0.496% due 01/11/21 (Ê)(Þ) | | | | 484 | | | 481 |
| 7.500% due 12/15/17 (Þ) | | | | 205 | | | 220 | | Eksportfinans ASA | | | | | | | |
| America Movil SAB de CV | | | | | | | | | 2.375% due 05/25/16 | | | | 225 | | | 221 |
| 3.125% due 07/16/22 | | | | 175 | | | 162 | | Enel Finance International NV | | | | | | | |
| ArcelorMittal | | | | | | | | | 6.000% due 10/07/39 (Þ) | | | | 275 | | | 264 |
| 5.000% due 02/25/17 | | | | 350 | | | 375 | | Enel SpA | | | | | | | |
| AWAS Aviation Capital, Ltd. | | | | | | | | | 8.750% due 09/24/73 (Þ) | | | | 460 | | | 500 |
| 7.000% due 10/17/16 (Þ) | | | | 260 | | | 269 | | Export-Import Bank of Korea | | | | | | | |
| Baidu, Inc. | | | | | | | | | 5.875% due 01/14/15 | | | | 700 | | | 736 |
| 3.250% due 08/06/18 | | | | 400 | | | 404 | | Fomento Economico Mexicano SAB de | | | | | | | |
| Banco Nacional de Costa Rica | | | | | | | | | CV | | | | | | | |
| 4.875% due 11/01/18 (Þ) | | | | 165 | | | 162 | | 4.375% due 05/10/43 | | | | 204 | | | 168 |
| Banco Nacional de Desenvolvimento | | | | | | | | | Government of the Cayman Islands | | | | | | | |
| Economico e Social | | | | | | | | | 5.950% due 11/24/19 (Þ) | | | | 230 | | | 255 |
| 3.375% due 09/26/16 (Þ) | | | | 620 | | | 626 | | HBOS PLC | | | | | | | |
| Bank of Montreal | | | | | | | | | Series GMTN | | | | | | | |
| 2.850% due 06/09/15 (Þ) | | | | 100 | | | 103 | | 6.750% due 05/21/18 (Þ) | | | | 825 | | | 934 |
| Barrick Gold Corp. | | | | | | | | | HSBC Bank PLC | | | | | | | |
| 4.100% due 05/01/23 | | | | 910 | | | 822 | | 3.100% due 05/24/16 (Þ) | | | | 800 | | | 838 |
| BBVA Bancomer SA | | | | | | | | | Hutchison Whampoa International 11, | | | | | | | |
| 6.500% due 03/10/21 (Þ) | | | | 200 | | | 211 | | Ltd. | | | | | | | |
| BBVA US Senior SAU | | | | | | | | | 4.625% due 01/13/22 (Þ) | | | | 375 | | | 383 |
| 4.664% due 10/09/15 | | | | 450 | | | 473 | | Indian Oil Corp. , Ltd. | | | | | | | |
| BHP Billiton Finance USA, Ltd. | | | | | | | | | 4.750% due 01/22/15 | | | | 400 | | | 410 |
| 3.850% due 09/30/23 | | | | 320 | | | 321 | | ING Bank NV | | | | | | | |
| 5.000% due 09/30/43 | | | | 835 | | | 849 | | 5.800% due 09/25/23 (Þ) | | | | 560 | | | 586 |
| BP Capital Markets PLC | | | | | | | | | Intesa Sanpaolo SpA | | | | | | | |
| 3.245% due 05/06/22 | | | | 415 | | | 402 | | 3.125% due 01/15/16 | | | | 630 | | | 642 |
| BPCE SA | | | | | | | | | IPIC GMTN, Ltd. | | | | | | | |
| 2.500% due 12/10/18 | | | | 350 | | | 348 | | 5.500% due 03/01/22 (Þ) | | | | 125 | | | 136 |
| Brazil Minas SPE via State of Minas | | | | | | | | | Itau Unibanco Holding SA | | | | | | | |
| Gerais | | | | | | | | | 5.500% due 08/06/22 (Þ) | | | | 700 | | | 667 |
| 5.333% due 02/15/28 (Þ) | | | | 200 | | | 186 | | JPMorgan Chase & Co. | | | | | | | |
| Caisse Centrale Desjardins | | | | | | | | | Series MPLE | | | | | | | |
| 2.650% due 09/16/15 (Þ) | | | | 410 | | | 423 | | 2.920% due 09/19/17 (Þ) | | CAD | | 605 | | | 573 |
| Canadian Oil Sands, Ltd. | | | | | | | | | Kommunalbanken AS | | | | | | | |
| 6.000% due 04/01/42 (Þ) | | | | 190 | | | 194 | | 1.125% due 05/23/18 (Þ) | | | | 1,020 | | | 992 |
| CDP Financial, Inc. | | | | | | | | | Korea East-West Power Co. , Ltd. | | | | | | | |
| 5.600% due 11/25/39 (Þ) | | | | 265 | | | 296 | | 2.500% due 07/16/17 (Þ) | | | | 200 | | | 200 |
| Cent CLO 19, Ltd. | | | | | | | | | Korea Electric Power Corp. | | | | | | | |
| Series 2013-19A Class A1A | | | | | | | | | 5.125% due 04/23/34 (Þ) | | | | 60 | | | 58 |
| 1.567% due 10/29/25 (Ê)(Þ) | | | | 598 | | | 592 | | Korea Finance Corp. | | | | | | | |
| CNOOC Finance 2013, Ltd. | | | | | | | | | 2.875% due 08/22/18 | | | | 220 | | | 221 |
| | | | | | | | | | Lloyds Banking Group PLC | | | | | | | |
| See accompanying notes which are an integral part of the financial statements. | | | | | | | | | |
| 86 Core Bond Fund | | | | | | | | | | | | | | | | |
Russell Investment Funds
Core Bond Fund
Schedule of Investments, continued — December 31, 2013
| Amounts in thousands (except share amounts) | | | | | Amounts in thousands (except share amounts) | | |
| | | Principal | | | | Fair | | | | | | Principal | | Fair |
| | | Amount ($) | | | | Value | | | | | | Amount ($) | | Value |
| | | or Shares | | | | $ | | | | | | or Shares | | $ |
| 6.657% due 12/31/49 (ƒ)(Þ) | | 675 | | | | 651 | | 0.699% due 11/08/18 (Ê) | | | | 1,100 | | | 1,106 |
| LyondellBasell Industries NV | | | | | | | | Suncor Energy, Inc. | | | | | | | |
| 5.000% due 04/15/19 | | 780 | | | | 866 | | 5.950% due 12/01/34 | | | | 320 | | | 348 |
| Majapahit Holding BV | | | | | | | | Sydney Airport Finance Co. Pty, Ltd. | | | | | | | |
| Series REGS | | | | | | | | 3.900% due 03/22/23 (Þ) | | | | 640 | | | 607 |
| 7.750% due 10/17/16 | | 100 | | | | 110 | | Talisman Energy, Inc. | | | | | | | |
| Marfrig Holding Europe BV | | | | | | | | 7.750% due 06/01/19 | | | | 375 | | | 449 |
| 8.375% due 05/09/18 (Þ) | | 500 | | | | 465 | | Telefonos de Mexico SAB de CV | | | | | | | |
| Nexen Energy ULC | | | | | | | | 5.500% due 01/27/15 | | | | 360 | | | 375 |
| 7.500% due 07/30/39 | | 320 | | | | 408 | | Teva Pharmaceutical Finance Co. BV | | | | | | | |
| Nokia OYJ | | | | | | | | Series 2 | | | | | | | |
| 6.625% due 05/15/39 | | 280 | | | | 275 | | 3.650% due 11/10/21 | | | | 550 | | | 539 |
| OHA Credit Partners IX, Ltd. | | | | | | | | Thomson Reuters Corp. | | | | | | | |
| Series 2013-9A Class A1 | | | | | | | | 4.300% due 11/23/23 | | | | 290 | | | 291 |
| 1.629% due 10/20/25 (Ê)(Þ) | | 559 | | | | 557 | | Total Capital Canada, Ltd. | | | | | | | |
| Oi SA | | | | | | | | 0.624% due 01/15/16 (Ê) | | | | 1,500 | | | 1,509 |
| 5.750% due 02/10/22 (Þ) | | 395 | | | | 363 | | Total Capital SA | | | | | | | |
| Petrobras Global Finance BV | | | | | | | | 2.125% due 08/10/18 | | | | 510 | | | 512 |
| 5.625% due 05/20/43 | | 280 | | | | 229 | | 4.450% due 06/24/20 | | | | 260 | | | 283 |
| Petrobras International Finance Co. | | | | | | | | Trade Maps, Ltd. | | | | | | | |
| 3.875% due 01/27/16 | | 400 | | | | 412 | | Series 2013-1A Class A | | | | | | | |
| 7.875% due 03/15/19 | | 800 | | | | 906 | | 0.870% due 12/10/18 (Ê)(Þ) | | | | 640 | | | 641 |
| 5.750% due 01/20/20 | | 695 | | | | 715 | | Transocean, Inc. | | | | | | | |
| Petroleos Mexicanos | | | | | | | | 6.375% due 12/15/21 | | | | 560 | | | 629 |
| 4.875% due 01/18/24 | | 120 | | | | 120 | | Turkiye Garanti Bankasi AS | | | | | | | |
| 5.500% due 06/27/44 | | 250 | | | | 228 | | 2.742% due 04/20/16 (Ê)(Þ) | | | | 200 | | | 194 |
| Province of Quebec Canada | | | | | | | | Tyco Electronics Group SA | | | | | | | |
| 3.500% due 07/29/20 | | 200 | | | | 208 | | 6.550% due 10/01/17 | | | | 240 | | | 275 |
| Rabobank Nederland | | | | | | | | Vale Overseas, Ltd. | | | | | | | |
| 11.000% due 06/29/49 (ƒ)(Þ) | | 452 | | | | 598 | | 8.250% due 01/17/34 | | | | 160 | | | 184 |
| Ras Laffan Liquefied Natural Gas Co. , | | | | | | | | Validus Holdings, Ltd. | | | | | | | |
| Ltd. III | | | | | | | | 8.875% due 01/26/40 | | | | 240 | | | 317 |
| Series REGS | | | | | | | | VimpelCom Holdings BV | | | | | | | |
| 6.750% due 09/30/19 | | 300 | | | | 353 | | 7.504% due 03/01/22 (Þ) | | | | 420 | | | 439 |
| Rio Tinto Finance USA PLC | | | | | | | | Vnesheconombank Via VEB Finance | | | | | | | |
| 1.375% due 06/17/16 | | 365 | | | | 371 | | PLC | | | | | | | |
| 2.250% due 12/14/18 | | 435 | | | | 433 | | 6.902% due 07/09/20 (Þ) | | | | 360 | | | 397 |
| Royal Bank of Scotland Group PLC | | | | | | | | Volvo Treasury AB | | | | | | | |
| 6.000% due 12/19/23 | | 385 | | | | 388 | | 5.950% due 04/01/15 (Þ) | | | | 385 | | | 407 |
| 6.990% due 10/29/49 (ƒ)(Þ) | | 300 | | | | 320 | | Weatherford International, Ltd. | | | | | | | |
| Series 1 | | | | | | | | 5.125% due 09/15/20 | | | | 280 | | | 301 |
| 9.118% due 03/31/49 (ƒ) | | 300 | | | | 302 | | Willis Group Holdings PLC | | | | | | | |
| Saudi Electricity Global Sukuk Co. 2 | | | | | | | | 4.125% due 03/15/16 | | | | 210 | | | 220 |
| 5.060% due 04/08/43 (Þ) | | 500 | | | | 450 | | | | | | | | | 40,943 |
| Seagate HDD Cayman | | | | | | | | Loan Agreements - 0.2% | | | | | | | |
| 4.750% due 06/01/23 (Þ) | | 455 | | | | 425 | | HCA, Inc. Term Loan B4 | | | | | | | |
| Sirius International Group, Ltd. | | | | | | | | 2.945% due 05/01/18 (Ê) | | | | 506 | | | 506 |
| 7.506% due 05/29/49 (ƒ)(Þ) | | 365 | | | | 376 | | MacDermid, Inc. Term Loan B | | | | | | | |
| SMART Trust | | | | | | | | Zero coupon due 06/07/20 (Ê) | | | | 617 | | | 621 |
| Series 2011-2USA Class A3A | | | | | | | | Valeant Pharmaceuticals International, | | | | | | | |
| 1.540% due 03/14/15 (Þ) | | 368 | | | | 368 | | Inc. 1st Lien Term Loan B | | | | | | | |
| Series 2012-4US Class A2A | | | | | | | | 1.000% due 08/05/20 (Ê) | | | | 397 | | | 399 |
| 0.670% due 06/14/15 | | 34 | | | | 34 | | | | | | | | | 1,526 |
| Statoil ASA | | | | | | | | Mortgage-Backed Securities - 27.7% | | | | | |
See accompanying notes which are an integral part of the financial statements.
Core Bond Fund 87
Russell Investment Funds
Core Bond Fund
Schedule of Investments, continued — December 31, 2013
| Amounts in thousands (except share amounts) | | | | | | Amounts in thousands (except share amounts) | | |
| | | Principal | | | | | Fair | | | | | Principal | | Fair |
| | | Amount ($) | | | | | Value | | | | | Amount ($) | | Value |
| | | or Shares | | | | | $ | | | | | or Shares | | $ |
| Adjustable Rate Mortgage Trust | | | | | | | | | Series 2004-5 Class 2A | | | | | | |
| Series 2007-1 Class 1A1 | | | | | | | | | 3.174% due 07/25/34 (Ê) | | | 567 | | | 562 |
| 2.824% due 03/25/37 (Ê) | | 802 | | | | | 620 | | Series 2004-9 Class 22A1 | | | | | | |
| American Home Mortgage Investment | | | | | | | | | 3.082% due 11/25/34 (Ê) | | | 28 | | | 28 |
| Trust | | | | | | | | | Series 2005-2 Class A1 | | | | | | |
| Series 2004-4 Class 4A | | | | | | | | | 2.600% due 03/25/35 (Ê) | | | 420 | | | 423 |
| 2.355% due 02/25/45 (Ê) | | 51 | | | | | 50 | | Series 2007-3 Class 1A1 | | | | | | |
| Series 2007-1 Class GA1C | | | | | | | | | 2.861% due 05/25/47 (Ê) | | | 173 | | | 144 |
| 0.355% due 05/25/47 (Ê) | | 769 | | | | | 547 | | Bear Stearns Alt-A Trust | | | | | | |
| Series 2007-4 Class A2 | | | | | | | | | Series 2005-4 Class 23A1 | | | | | | |
| 0.355% due 08/25/37 (Ê) | | 235 | | | | | 215 | | 2.649% due 05/25/35 (Ê) | | | 132 | | | 124 |
| Aventura Mall Trust | | | | | | | | | Series 2005-7 Class 22A1 | | | | | | |
| Series 2013-AVM Class A | | | | | | | | | 2.708% due 09/25/35 (Ê) | | | 312 | | | 272 |
| 3.743% due 12/05/32 (Þ) | | 335 | | | | | 344 | | Series 2005-10 Class 24A1 | | | | | | |
| Banc of America Funding Corp. | | | | | | | | | 2.328% due 01/25/36 (Ê) | | | 272 | | | 192 |
| Series 2006-3 Class 5A8 | | | | | | | | | Series 2006-1 Class 21A2 | | | | | | |
| 5.500% due 03/25/36 | | 250 | | | | | 239 | | 2.481% due 02/25/36 (Ê) | | | 347 | | | 231 |
| Series 2006-G Class 2A3 | | | | | | | | | Bear Stearns ARM Trust 2003-1 | | | | | | |
| 0.337% due 07/20/36 (Ê) | | 263 | | | | | 261 | | Series 2003-1 Class 6A1 | | | | | | |
| Series 2006-I Class 5A1 | | | | | | | | | 2.572% due 04/25/33 (Ê) | | | 14 | | | 15 |
| 5.694% due 10/20/46 (Ê) | | 684 | | | | | 611 | | Bear Stearns ARM Trust 2003-8 | | | | | | |
| Series 2007-4 Class 3A1 | | | | | | | | | Series 2003-8 Class 4A1 | | | | | | |
| 0.535% due 06/25/37 (Ê) | | 867 | | | | | 680 | | 2.786% due 01/25/34 (Ê) | | | 55 | | | 55 |
| Banc of America Funding Trust | | | | | | | | | Bear Stearns Commercial Mortgage | | | | | | |
| Series 2006-3 Class 5A3 | | | | | | | | | Securities | | | | | | |
| 5.500% due 03/25/36 | | 834 | | | | | 790 | | Series 2004-PWR3 Class A4 | | | | | | |
| Banc of America Merrill Lynch | �� | | | | | | | | 4.715% due 02/11/41 | | | 120 | | | 120 |
| Commercial Mortgage, Inc. | | | | | | | | | Series 2006-T22 Class A4 | | | | | | |
| Series 2003-2 Class D | | | | | | | | | 5.579% due 04/12/38 | | | 505 | | | 546 |
| 5.345% due 03/11/41 | | 235 | | | | | 240 | | BNPP Mortgage Securities LLC | | | | | | |
| Series 2006-2 Class A4 | | | | | | | | | Series 2009-1 Class A1 | | | | | | |
| 5.734% due 05/10/45 | | 200 | | | | | 218 | | 6.000% due 08/27/37 (Þ) | | | 207 | | | 217 |
| Series 2008-1 Class A4 | | | | | | | | | Citicorp Mortgage Securities, Inc. | | | | | | |
| 6.207% due 02/10/51 | | 580 | | | | | 662 | | Series 2006-3 Class 1A9 | | | | | | |
| Banc of America Mortgage Securities, | | | | | | | | | 5.750% due 06/25/36 | | | 183 | | | 188 |
| Inc. | | | | | | | | | Citigroup Commercial Mortgage Trust | | | | | | |
| Series 2004-1 Class 5A1 | | | | | | | | | Series 2004-C1 Class E | | | | | | |
| 6.500% due 09/25/33 | | 3 | | | | | 3 | | 5.383% due 04/15/40 | | | 155 | | | 157 |
| Series 2004-11 Class 2A1 | | | | | | | | | Series 2006-C5 Class A4 | | | | | | |
| 5.750% due 01/25/35 | | 76 | | | | | 78 | | 5.431% due 10/15/49 | | | 135 | | | 147 |
| Series 2005-H Class 2A5 | | | | | | | | | Series 2009-RR1 Class MA4A | | | | | | |
| 2.774% due 09/25/35 (Ê) | | 166 | | | | | 155 | | 5.485% due 03/17/51 (Þ) | | | 300 | | | 331 |
| Bayview Commercial Asset Trust | | | | | | | | | Series 2013-GC17 Class A4 | | | | | | |
| Series 2005-3A Class A1 | | | | | | | | | 4.131% due 11/10/46 | | | 175 | | | 177 |
| 0.485% due 11/25/35 (Ê)(Þ) | | 384 | | | | | 329 | | Citigroup Mortgage Loan Trust, Inc. | | | | | | |
| Series 2008-4 Class A2 | | | | | | | | | Series 2005-11 Class A2A | | | | | | |
| 2.665% due 07/25/38 (Ê)(Þ) | | 294 | | | | | 292 | | 2.510% due 10/25/35 (Ê) | | | 29 | | | 29 |
| BCAP LLC Trust | | | | | | | | | Series 2006-AR7 Class 1A4A | | | | | | |
| Series 2011-R11 Class 15A1 | | | | | | | | | 2.726% due 11/25/36 (Ê) | | | 344 | | | 282 |
| 2.640% due 10/26/33 (Ê)(Þ) | | 445 | | | | | 456 | | Series 2007-10 Class 2A3A | | | | | | |
| Series 2011-RR4 Class 7A2 | | | | | | | | | 5.637% due 09/25/37 (Ê) | | | 364 | | | 305 |
| 12.533% due 04/26/37 (Þ) | | 326 | | | | | 94 | | Series 2007-10 Class 2A4A | | | | | | |
| Bear Stearns Adjustable Rate Mortgage | | | | | | | | | 5.996% due 09/25/37 (Ê) | | | 206 | | | 181 |
| Trust | | | | | | | | | | | | | | | |
See accompanying notes which are an integral part of the financial statements.
88 Core Bond Fund
Russell Investment Funds
Core Bond Fund
Schedule of Investments, continued — December 31, 2013
| Amounts in thousands (except share amounts) | | | | Amounts in thousands (except share amounts) | | |
| | | Principal | | Fair | | | | | | Principal | | Fair |
| | | Amount ($) | | Value | | | | | | Amount ($) | | Value |
| | | or Shares | | $ | | | | | | or Shares | | $ |
| Series 2007-AR8 Class 2A1A | | | | | | | Series 2004-C5 Class B | | | | | | |
| 2.754% due 07/25/37 (Ê) | | 438 | | | 365 | | 4.929% due 11/15/37 | | | | 350 | | 357 |
| Commercial Mortgage Asset Trust | | | | | | | Series 2005-9 Class 2A1 | | | | | | |
| Series 1999-C1 Class D | | | | | | | 5.500% due 10/25/35 | | | | 208 | | 200 |
| 7.084% due 01/17/32 | | 35 | | | 35 | | Series 2005-C2 Class A3 | | | | | | |
| Series 2001-J2A Class E | | | | | | | 4.691% due 04/15/37 | | | | 156 | | 158 |
| 6.922% due 07/16/34 (Þ) | | 200 | | | 230 | | Credit Suisse Mortgage Capital | | | | | | |
| Commercial Mortgage Pass Through | | | | | | | Certificates | | | | | | |
| Certificates | | | | | | | Series 2007-2 Class 3A4 | | | | | | |
| Series 2007-FL14 Class AJ | | | | | | | 5.500% due 03/25/37 | | | | 783 | | 738 |
| 0.347% due 06/15/22 (Ê)(Þ) | | 632 | | | 625 | | CSMC | | | | | | |
| Series 2013-CR6 Class A4 | | | | | | | Series 2011-4R Class 5A1 | | | | | | |
| 3.101% due 03/10/46 | | 295 | | | 280 | | 2.274% due 05/27/36 (Þ) | | | | 289 | | 265 |
| Commercial Mortgage Trust | | | | | | | DBRR Trust | | | | | | |
| Series 2005-GG3 Class A4 | | | | | | | Series 2011-LC2 Class A4A | | | | | | |
| 4.799% due 08/10/42 | | 100 | | | 103 | | 4.537% due 07/12/44 (Þ) | | | | 340 | | 358 |
| Commercial Mortgage Trust | | | | | | | Series 2012-EZ1 Class B | | | | | | |
| Series 2013-CR11 Class A4 | | | | | | | 1.393% due 09/25/45 (Þ) | | | | 210 | | 210 |
| 4.258% due 10/10/46 | | 350 | | | 360 | | DBUBS Mortgage Trust | | | | | | |
| Countrywide Alternative Loan Trust | | | | | | | Series 2011-LC2A Class A2 | | | | | | |
| Series 2005-81 Class A1 | | | | | | | 3.386% due 07/10/44 (Þ) | | | | 900 | | 939 |
| 0.445% due 02/25/37 (Ê) | | 252 | | | 189 | | Deutsche ALT-A Securities, Inc. | | | | | | |
| Series 2005-48T1 Class A6 | | | | | | | Alternate Loan Trust | | | | | | |
| 5.500% due 11/25/35 | | 698 | | | 598 | | Series 2005-AR1 Class 2A3 | | | | | | |
| Series 2006-36T2 Class 1A9 | | | | | | | 1.788% due 08/25/35 (Ê) | | | | 393 | | 300 |
| 1.065% due 12/25/36 (Ê) | | 185 | | | 118 | | Series 2007-OA1 Class A1 | | | | | | |
| Series 2006-45T1 Class 2A2 | | | | | | | 0.315% due 02/25/47 (Ê) | | | | 1,695 | | 1,183 |
| 6.000% due 02/25/37 | | 670 | | | 522 | | Extended Stay America Trust | | | | | | |
| Countrywide Home Loan Mortgage Pass | | | | | | | Series 2013-ESFL Class CFL | | | | | | |
| Through Trust | | | | | | | 1.668% due 12/05/31 (Ê)(Þ) | | | | 100 | | 100 |
| Series 2004-22 Class A3 | | | | | | | Series 2013-ESH7 Class A27 | | | | | | |
| 2.504% due 11/25/34 (Ê) | | 97 | | | 89 | | 2.958% due 12/05/31 (Þ) | | | | 325 | | 315 |
| Series 2004-HYB9 Class 1A1 | | | | | | | Series 2013-ESH7 Class B7 | | | | | | |
| 2.526% due 02/20/35 (Ê) | | 157 | | | 149 | | 3.604% due 12/05/31 (Þ) | | | | 100 | | 98 |
| Series 2005-3 Class 1A2 | | | | | | | Fannie Mae | | | | | | |
| 0.455% due 04/25/35 (Ê) | | 18 | | | 15 | | 2.634% due 2017(Ê) | | | | 11 | | 11 |
| Series 2005-HYB9 Class 3A2A | | | | | | | 6.000% due 2017 | | | | 6 | | 6 |
| 2.417% due 02/20/36 (Ê) | | 32 | | | 28 | | 3.584% due 2020 | | | | 568 | | 595 |
| Series 2007-2 Class A2 | | | | | | | 3.632% due 2020 | | | | 757 | | 787 |
| 6.000% due 03/25/37 | | 1,394 | | | 1,254 | | 3.665% due 2020 | | | | 787 | | 827 |
| | | | | | | | 3.763% due 2020 | | | | 766 | | 803 |
| Series 2007-4 Class 1A10 | | | | | | | 4.250% due 2020 | | | | 759 | | 820 |
| 6.000% due 05/25/37 | | 1,281 | | | 1,062 | | 5.500% due 2020 | | | | 37 | | 40 |
| Series 2007-HY5 Class 1A1 | | | | | | | 3.890% due 2021 | | | | 200 | | 211 |
| 2.842% due 09/25/47 (Ê) | | 1,138 | | | 936 | | 4.302% due 2021 | | | | 795 | | 863 |
| Credit Suisse Commercial Mortgage | | | | | | | 5.500% due 2021 | | | | 58 | | 61 |
| Trust | | | | | | | 3.017% due 2022 | | | | 294 | | 291 |
| Series 2006-C5 Class A1A | | | | | | | 5.500% due 2022 | | | | 127 | | 136 |
| 5.297% due 12/15/39 | | 1,205 | | | 1,295 | | 2.460% due 2023 | | | | 938 | | 880 |
| Series 2007-C1 Class A3 | | | | | | | 4.000% due 2025 | | | | 722 | | 766 |
| 5.383% due 02/15/40 | | 97 | | | 105 | | 4.500% due 2025 | | | | 1,100 | | 1,186 |
| Credit Suisse First Boston Mortgage | | | | | | | 3.500% due 2026 | | | | 2,821 | | 2,956 |
| Securities Corp. | | | | | | | 4.000% due 2026 | | | | 777 | | 824 |
| Series 2003-C5 Class D | | | | | | | 6.000% due 2026 | | | | 136 | | 151 |
| 5.116% due 12/15/36 | | 176 | | | 177 | | 2.870% due 2027 | | | | 100 | | 87 |
| | | | | | | | 3.000% due 2027 | | | | 2,547 | | 2,602 |
See accompanying notes which are an integral part of the financial statements.
Core Bond Fund 89
Russell Investment Funds
Core Bond Fund
Schedule of Investments, continued — December 31, 2013
| Amounts in thousands (except share amounts) | | | | Amounts in thousands (except share amounts) | | |
| | | | Principal | | Fair | | | | | | Principal | | Fair |
| | | | Amount ($) | | Value | | | | | | Amount ($) | | Value |
| | | | or Shares | | $ | | | | | | or Shares | | $ |
| 6.000% due 2027 | | 84 | | 93 | | Series 2006-369 Class 8 | | | | | | | |
| 5.500% due 2028 | | 45 | | 50 | | Interest Only STRIP | | | | | | | |
| 6.000% due 2028 | | 7 | | 8 | | 5.500% due 04/01/36 | | | | 31 | | | 6 |
| 3.000% due 2032 | | 1,884 | | 1,856 | | Fannie Mae Grantor Trust | | | | | | | |
| 3.500% due 2032 | | 578 | | 589 | | Series 2001-T4 Class A1 | | | | | | | |
| 6.000% due 2032 | | 102 | | 114 | | 7.500% due 07/25/41 | | | | 321 | | | 380 |
| 6.150% due 2032(Ê) | | 106 | | 115 | | Fannie Mae REMICS | | | | | | | |
| 3.000% due 2033 | | 3,920 | | 3,863 | | Series 1999-56 Class Z | | | | | | | |
| 3.500% due 2033 | | 1,819 | | 1,857 | | 7.000% due 12/18/29 | | | | 31 | | | 35 |
| 5.000% due 2033 | | 24 | | 26 | | Series 2003-32 Class FH | | | | | | | |
| 5.500% due 2033 | | 191 | | 210 | | 0.565% due 11/25/22 (Ê) | | | | 10 | | | 10 |
| 6.000% due 2033 | | 5 | | 5 | | | | | | | | | |
| 6.150% due 2033(Ê) | | 81 | | 87 | | Series 2003-35 Class FY | | | | | | | |
| 5.000% due 2034 | | 288 | | 312 | | 0.565% due 05/25/18 (Ê) | | | | 62 | | | 63 |
| 5.500% due 2034 | | 344 | | 380 | | Series 2003-W1 Class 1A1 | | | | | | | |
| 4.500% due 2035 | | 14 | | 15 | | 5.963% due 12/25/42 | | | | 21 | | | 23 |
| 5.500% due 2035 | | 195 | | 215 | | Series 2004-W2 Class 2A2 | | | | | | | |
| 3.386% due 2036(Ê) | | 158 | | 164 | | 7.000% due 02/25/44 | | | | 247 | | | 287 |
| 5.500% due 2036 | | 619 | | 680 | | Series 2005-110 Class MB | | | | | | | |
| 6.000% due 2036 | | 1,462 | | 1,625 | | 5.500% due 09/25/35 | | | | 81 | | | 87 |
| 5.500% due 2037 | | 909 | | 994 | | Series 2006-27 Class SH | | | | | | | |
| 6.000% due 2037 | | 368 | | 408 | | Interest Only STRIP | | | | | | | |
| 5.500% due 2038 | | 3,810 | | 4,189 | | 6.535% due 04/25/36 (Ê) | | | | 1,442 | | | 219 |
| 4.000% due 2040 | | 658 | | 680 | | | | | | | | | |
| 4.500% due 2040 | | 534 | | 566 | | Series 2007-30 Class AF | | | | | | | |
| 5.500% due 2040 | | 197 | | 217 | | 0.475% due 04/25/37 (Ê) | | | | 47 | | | 47 |
| 6.000% due 2040 | | 638 | | 706 | | Series 2009-39 Class LB | | | | | | | |
| 4.000% due 2041 | | 1,880 | | 1,939 | | 4.500% due 06/25/29 | | | | 405 | | | 429 |
| 4.500% due 2041 | | 17 | | 18 | | Series 2009-96 Class DB | | | | | | | |
| 5.500% due 2041 | | 88 | | 97 | | 4.000% due 11/25/29 | | | | 541 | | | 566 |
| 6.000% due 2041 | | 687 | | 761 | | Series 2010-95 Class S | | | | | | | |
| 15 Year TBA(Ï) | | | | | | Interest Only STRIP | | | | | | | |
| 2.500% | | | 3,530 | | 3,493 | | 6.435% due 09/25/40 (Ê) | | | | 1,426 | | | 270 |
| 3.000% | | | 8,540 | | 8,715 | | Series 2012-55 Class PC | | | | | | | |
| 3.500% | | | 3,940 | | 4,121 | | 3.500% due 05/25/42 | | | | 700 | | | 685 |
| 30 Year TBA(Ï) % | | | | | | Fannie Mae-Aces | | | | | | | |
| 3.000% | | | 5,045 | | 4,789 | | Series 2006-M2 Class A2F | | | | | | | |
| 3.500% | | | 11,580 | | 11,503 | | 5.259% due 05/25/20 | | | | 170 | | | 190 |
| 4.000% | | | 38,105 | | 39,830 | | Series 2011-M1 Class A3 | | | | | | | |
| 4.500% | | | 1,000 | | 1,056 | | 3.763% due 06/25/21 | | | | 875 | | | 908 |
| | | | | | | | Series 2012-M12 Class 1A | | | | | | | |
| 5.000% | | | 2,000 | | 2,166 | | 2.840% due 08/25/22 | | | | 950 | | | 928 |
| 5.500% | | | 1,785 | | 1,963 | | Series 2012-M15 Class A | | | | | | | |
| 6.000% | | | 1,700 | | 1,886 | | 2.656% due 10/25/22 | | | | 952 | | | 910 |
| Series 2003-343 Class 6 | | | | | | FDIC Trust | | | | | | | |
| Interest Only STRIP | | | | | | Series 2010-R1 Class A | | | | | | | |
| 5.000% due 10/01/33 | | 59 | | 11 | | 2.184% due 05/25/50 (Þ) | | | | 1,143 | | | 1,151 |
| Series 2003-345 Class 18 | | | | | | Series 2011-R1 Class A | | | | | | | |
| Interest Only STRIP | | | | | | 2.672% due 07/25/26 (Þ) | | | | 486 | | | 501 |
| 4.500% due 12/01/18 | | 99 | | 7 | | Federal Home Loan Mortgage Corp. | | | | | | | |
| Series 2003-345 Class 19 | | | | | | Multifamily Structured Pass Through | | | | | | | |
| Interest Only STRIP | | | | | | Certificates | | | | | | | |
| 4.500% due 01/01/19 | | 108 | | 8 | | Series 2011-K014 Class X1 | | | | | | | |
| Series 2005-365 Class 12 | | | | | | Interest Only STRIP | | | | | | | |
| Interest Only STRIP | | | | | | 1.259% due 04/25/21 | | | | 1,261 | | | 92 |
| 5.500% due 12/01/35 | | 196 | | 34 | | | | | | | | | |
| |
| See accompanying notes which are an integral part of the financial statements. | | | | | | | | | |
| 90 Core Bond Fund | | | | | | | | | | | | | |
Russell Investment Funds
Core Bond Fund
Schedule of Investments, continued — December 31, 2013
| Amounts in thousands (except share amounts) | | | | Amounts in thousands (except share amounts) | | |
| | | | | Principal | | Fair | | | | | | Principal | | Fair |
| | | | | Amount ($) | | Value | | | | | | Amount ($) | | Value |
| | | | | or Shares | | $ | | | | | | or Shares | | $ |
| Series 2011-K702 Class X1 | | | | | | | | | Series 2010-3640 Class JA | | | | | | |
| Interest Only STRIP | | | | | | | | | 1.500% due 03/15/15 | | | | 174 | | 175 |
| 1.543% due 02/25/18 | | | | 6,860 | | | 382 | | Series 2010-3653 Class B | | | | | | |
| Series 2012-K020 Class A2 | | | | | | | | | 4.500% due 04/15/30 | | | | 490 | | 520 |
| Interest Only STRIP | | | | | | | | | Series 2010-3704 Class DC | | | | | | |
| 2.373% due 05/25/22 | | | | 925 | | | 863 | | 4.000% due 11/15/36 | | | | 426 | | 451 |
| Series 2012-K020 Class X1 | | | | | | | | | Series 2011-3901 Class LA | | | | | | |
| Interest Only STRIP | | | | | | | | | 4.000% due 06/15/38 | | | | 230 | | 235 |
| 1.473% due 05/25/22 | | | | 2,374 | | | 223 | | Series 2012-4010 Class KM | | | | | | |
| Series 2012-K501 Class X1A | | | | | | | | | 3.000% due 01/15/42 | | | | 459 | | 450 |
| Interest Only STRIP | | | | | | | | | FREMF Mortgage Trust | | | | | | |
| 1.751% due 08/25/16 | | | | 4,753 | | | 148 | | Series 2010-K7 Class B | | | | | | |
| Series 2013-K024 Class X1 | | | | | | | | | 5.436% due 04/25/20 (Þ) | | | | 510 | | 544 |
| Interest Only STRIP | | | | | | | | | Series 2012-K705 Class B | | | | | | |
| 0.903% due 09/25/22 | | | | 2,780 | | | 166 | | 4.163% due 09/25/44 (Þ) | | | | 217 | | 222 |
| | | | | | | | | | Series 2013-K35 Class B | | | | | | |
| Series 2013-K025 Class A1 | | | | | | | | | 3.947% due 08/25/23 (Þ) | | | | 145 | | 133 |
| 1.875% due 04/25/22 | | | | 245 | | | 241 | | | | | | | | |
| | | | | | | | | | GE Business Loan Trust | | | | | | |
| Federal Home Loan Mortgage Corp. | | | | | | | | | Series 2003-2A Class A | | | | | | |
| Structured Pass Through Securities | | | | | | | | | | | | | | | |
| Series 2003-56 Class A5 | | | | | | | | | 0.537% due 11/15/31 (Ê)(Þ) | | | | 358 | | 342 |
| 5.231% due 05/25/43 | | | | 354 | | | 380 | | Ginnie Mae I | | | | | | |
| | | | | | | | | | 3.000% due 2027 | | | | 524 | | 538 |
| Series 2005-63 Class 1A1 | | | | | | | | | 5.000% due 2039 | | | | 950 | | 1,031 |
| 1.342% due 02/25/45 (Ê) | | | | 16 | | | 16 | | 4.564% due 2062 | | | | 1,206 | | 1,318 |
| First Horizon Asset Securities, Inc. | | | | | | | | | | | | | | | |
| Series 2005-AR4 Class 2A1 | | | | | | | | | Ginnie Mae II | | | | | | |
| | | | | | | | | | 1.625% due 2026(Ê) | | | | 74 | | 77 |
| 2.583% due 10/25/35 (Ê) | | | | 783 | | | 679 | | 1.625% due 2027(Ê) | | | | 6 | | 6 |
| First Horizon Mortgage Pass-Through | | | | | | | | | 1.625% due 2032(Ê) | | | | 30 | | 31 |
| Trust | | | | | | | | | 3.500% due 2040(Ê) | | | | 993 | | 1,050 |
| Series 2006-2 Class 1A3 | | | | | | | | | 4.000% due 2040(Ê) | | | | 373 | | 394 |
| 6.000% due 08/25/36 | | | | 807 | | | 805 | | 4.502% due 2061 | | | | 403 | | 435 |
| Freddie Mac | | | | | | | | | 4.700% due 2061 | | | | 297 | | 325 |
| 6.000% due 2016 | | | | 3 | | | 3 | | 4.810% due 2061 | | | | 1,153 | | 1,260 |
| 2.533% due 2030(Ê) | | | | 1 | | | 1 | | 5.245% due 2061 | | | | 688 | | 768 |
| 5.500% due 2037 | | | | 352 | | | 377 | | 4.652% due 2063 | | | | 118 | | 128 |
| 5.500% due 2038 | | | | 1,675 | | | 1,864 | | 4.661% due 2063 | | | | 43 | | 47 |
| 6.000% due 2038 | | | | 331 | | | 369 | | 4.732% due 2063 | | | | 219 | | 240 |
| 4.500% due 2039 | | | | 1,815 | | | 1,941 | | 30 Year TBA(Ï) | | | | | | |
| 4.000% due 2041 | | | | 2,711 | | | 2,801 | | 3.000% | | | | 1,895 | | 1,831 |
| 4.500% due 2041 | | | | 695 | | | 741 | | | | | | | | |
| 3.000% due 2042 | | | | 358 | | | 339 | | 3.500% | | | | 1,490 | | 1,503 |
| 3.500% due 2043 | | | | 978 | | | 973 | | GMAC Commercial Mortgage Securities, | | | | | | |
| Freddie Mac Reference REMIC | | | | | | | | | Inc. | | | | | | |
| Series 2006-R006 Class ZA | | | | | | | | | Series 2004-C3 Class A4 | | | | | | |
| 6.000% due 04/15/36 | | | | 268 | | | 292 | | 4.547% due 12/10/41 | | | | 69 | | 70 |
| Freddie Mac REMICS | | | | | | | | | GMAC Mortgage Corp. Loan Trust | | | | | | |
| Series 2000-2266 Class F | | | | | | | | | Series 2005-AR2 Class 4A | | | | | | |
| 0.617% due 11/15/30 (Ê) | | | | 5 | | | 5 | | 4.737% due 05/25/35 (Ê) | | | | 232 | | 226 |
| Series 2003-2624 Class QH | | | | | | | | | Government National Mortgage | | | | | | |
| | | | | | | | | | Association | | | | | | |
| 5.000% due 06/15/33 | | | | 272 | | | 290 | | Series 2007-12 Class C | | | | | | |
| Series 2007-3335 Class BF | | | | | | | | | 5.278% due 04/16/41 | | | | 340 | | 364 |
| 0.317% due 07/15/19 (Ê) | | | | 43 | | | 43 | | Series 2007-26 Class SD | | | | | | |
| Series 2007-3335 Class FT | | | | | | | | | Interest Only STRIP | | | | | | |
| 0.317% due 08/15/19 (Ê) | | | | 103 | | | 102 | | 6.633% due 05/16/37 (Ê) | | | | 1,404 | | 231 |
| Series 2009-3569 Class NY | | | | | | | | | | | | | | | |
| 5.000% due 08/15/39 | | | | 1,400 | | | 1,505 | | | | | | | | |
See accompanying notes which are an integral part of the financial statements.
Core Bond Fund 91
Russell Investment Funds
Core Bond Fund
Schedule of Investments, continued — December 31, 2013
| Amounts in thousands (except share amounts) | | | | Amounts in thousands (except share amounts) | | |
| | | Principal | | Fair | | | | | | Principal | | Fair |
| | | Amount ($) | | Value | | | | | | Amount ($) | | Value |
| | | or Shares | | $ | | | | | | or Shares | | $ |
| Series 2010-74 Class IO | | | | | | | HarborView Mortgage Loan Trust | | | | | | | |
| Interest Only STRIP | | | | | | | Series 2005-4 Class 3A1 | | | | | | | |
| 0.459% due 03/16/50 | | 2,338 | | | 68 | | 2.746% due 07/19/35 (Ê) | | | | 88 | | | 75 |
| Series 2010-116 Class MP | | | | | | | Hilton USA Trust | | | | | | | |
| 3.500% due 09/16/40 | | 1,381 | | | 1,446 | | Series 2013-HLT Class CFX | | | | | | | |
| Series 2010-124 Class C | | | | | | | 3.714% due 11/05/30 (Þ) | | | | 350 | | | 350 |
| 3.392% due 03/16/45 | | 75 | | | 78 | | IndyMac Index Mortgage Loan Trust | | | | | | | |
| Series 2010-H03 Class HI | | | | | | | Series 2005-AR31 Class 1A1 | | | | | | | |
| Interest Only STRIP | | | | | | | 2.326% due 01/25/36 (Ê) | | | | 469 | | | 366 |
| 1.471% due 03/20/60 | | 21,079 | | | 1,164 | | Series 2006-AR41 Class A3 | | | | | | | |
| | | | | | | | 0.345% due 02/25/37 (Ê) | | | | 942 | | | 658 |
| Series 2010-H04 Class BI | | | | | | | | | | | | | | |
| Interest Only STRIP | | | | | | | Irvine Core Office Trust | | | | | | | |
| | | | | | | | Series 2013-IRV Class A1 | | | | | | | |
| 1.386% due 04/20/60 | | 1,519 | | | 91 | | 2.068% due 05/15/48 (Þ) | | | | 219 | | | 211 |
| Series 2010-H12 Class PT | | | | | | | JPMBB Commercial Mortgage Securities | | | | | | | |
| 5.470% due 11/20/59 | | 660 | | | 708 | | Series 2013-C15 Class A4 | | | | | | | |
| Series 2010-H22 Class JI | | | | | | | 4.096% due 11/15/45 | | | | 390 | | | 397 |
| Interest Only STRIP | | | | | | | JPMorgan Alternative Loan Trust | | | | | | | |
| 2.497% due 11/20/60 | | 2,463 | | | 260 | | Series 2006-A2 Class 3A1 | | | | | | | |
| Series 2011-67 Class B | | | | | | | 2.637% due 05/25/36 (Ê) | | | | 1,022 | | | 789 |
| 3.863% due 10/16/47 | | 230 | | | 239 | | JPMorgan Chase Commercial Mortgage | | | | | | | |
| Series 2011-127 Class IO | | | | | | | Securities Corp. | | | | | | | |
| Interest Only STRIP | | | | | | | Series 2003-C1 Class D | | | | | | | |
| 1.361% due 03/16/47 | | 2,154 | | | 129 | | 5.192% due 01/12/37 | | | | 133 | | | 133 |
| Series 2011-H02 Class BI | | | | | | | Series 2004-LN2 Class B | | | | | | | |
| Interest Only STRIP | | | | | | | 5.151% due 07/15/41 | | | | 150 | | | 153 |
| 0.409% due 02/20/61 | | 10,499 | | | 184 | | Series 2006-LDP8 Class A3B | | | | | | | |
| Series 2012-99 Class CI | | | | | | | 5.447% due 05/15/45 | | | | 12 | | | 12 |
| Interest Only STRIP | | | | | | | Series 2006-LDP8 Class A4 | | | | | | | |
| 1.042% due 10/16/49 | | 1,888 | | | 145 | | 5.399% due 05/15/45 | | | | 770 | | | 839 |
| Series 2012-115 Class A | | | | | | | Series 2007-CB18 Class A4 | | | | | | | |
| 2.131% due 04/16/45 | | 220 | | | 214 | | 5.440% due 06/12/47 | | | | 1,200 | | | 1,319 |
| Series 2012-115 Class IO | | | | | | | Series 2007-LDPX Class A3 | | | | | | | |
| Interest Only STRIP | | | | | | | 5.420% due 01/15/49 | | | | 700 | | | 768 |
| 0.432% due 04/16/54 | | 783 | | | 39 | | JPMorgan Mortgage Trust | | | | | | | |
| | | | | | | | Series 2004-A2 Class 3A1 | | | | | | | |
| Series 2012-147 Class AE | | | | | | | 4.579% due 05/25/34 (Ê) | | | | 81 | | | 80 |
| 1.750% due 07/16/47 | | 393 | | | 375 | | Series 2005-A1 Class 6T1 | | | | | | | |
| GS Mortgage Securities Corp. II | | | | | | | 3.554% due 02/25/35 (Ê) | | | | 15 | | | 15 |
| Series 2004-GG2 Class A6 | | | | | | | | | | | | | | |
| 5.396% due 08/10/38 | | 387 | | | 391 | | Series 2005-A5 Class TA1 | | | | | | | |
| Series 2011-GC5 Class A4 | | | | | | | 5.250% due 08/25/35 (Ê) | | | | 126 | | | 129 |
| 3.707% due 08/10/44 | | 735 | | | 749 | | Series 2005-A8 Class 1A1 | | | | | | | |
| GSMPS Mortgage Loan Trust | | | | | | | 5.093% due 11/25/35 (Ê) | | | | 166 | | | 158 |
| Series 2006-RP1 Class 1A2 | | | | | | | Series 2005-S3 Class 1A2 | | | | | | | |
| 7.500% due 01/25/36 (Þ) | | 400 | | | 403 | | 5.750% due 01/25/36 | | | | 39 | | | 36 |
| GSR Mortgage Loan Trust | | | | | | | Series 2006-A6 Class 1A2 | | | | | | | |
| Series 2005-AR7 Class 6A1 | | | | | | | 2.665% due 10/25/36 (Ê) | | | | 134 | | | 111 |
| 5.032% due 11/25/35 (Ê) | | 72 | | | 70 | | Series 2006-A7 Class 2A4R | | | | | | | |
| Series 2006-2F Class 3A3 | | | | | | | 2.530% due 01/25/37 (Ê) | | | | 967 | | | 846 |
| 6.000% due 02/25/36 | | 794 | | | 691 | | Series 2007-S3 Class 1A8 | | | | | | | |
| Series 2006-3F Class 2A3 | | | | | | | 6.000% due 08/25/37 | | | | 735 | | | 647 |
| 5.750% due 03/25/36 | | 143 | | | 130 | | LB-UBS Commercial Mortgage Trust | | | | | | | |
| Series 2006-8F Class 4A17 | | | | | | | Series 2004-C7 Class A1A | | | | | | | |
| 6.000% due 09/25/36 | | 292 | | | 243 | | 4.475% due 10/15/29 | | | | 52 | | | 53 |
See accompanying notes which are an integral part of the financial statements.
92 Core Bond Fund
Russell Investment Funds
Core Bond Fund
Schedule of Investments, continued — December 31, 2013
| Amounts in thousands (except share amounts) | | | | Amounts in thousands (except share amounts) | | |
| | | Principal | | | Fair | | | | | | Principal | | Fair |
| | | Amount ($) | | | Value | | | | | | Amount ($) | | Value |
| | | or Shares | | | $ | | | | | | or Shares | | $ |
| Series 2006-C1 Class A3 | | | | | | | Northstar Education Finance, Inc. | | | | | | |
| 5.207% due 02/15/31 | | 249 | | | 254 | | Series 2007-1 Class A1 | | | | | | |
| Mastr Adjustable Rate Mortgages Trust | | | | | | | 0.338% due 04/28/30 (Ê) | | | | 475 | | 456 |
| Series 2006-2 Class 4A1 | | | | | | | NorthStar Mortgage Trust | | | | | | |
| 2.630% due 02/25/36 (Ê) | | 91 | | | 87 | | Series 2012-1 Class A | | | | | | |
| Series 2007-HF2 Class A1 | | | | | | | 1.368% due 08/25/29 (Ê)(Þ) | | | | 156 | | 156 |
| 0.475% due 09/25/37 (Ê) | | 533 | | | 447 | | OBP Depositor LLC Trust | | | | | | |
| Mastr Alternative Loan Trust | | | | | | | Series 2010-OBP Class A | | | | | | |
| Series 2003-4 Class B1 | | | | | | | 4.646% due 07/15/45 (Þ) | | | | 285 | | 309 |
| 5.872% due 06/25/33 | | 87 | | | 86 | | Prime Mortgage Trust | | | | | | |
| Series 2004-10 Class 5A6 | | | | | | | Series 2004-CL1 Class 1A2 | | | | | | |
| 5.750% due 09/25/34 | | 78 | | | 79 | | 0.565% due 02/25/34 (Ê) | | | | 9 | | 8 |
| Mellon Residential Funding Corp. | | | | | | | RALI Trust | | | | | | |
| Series 2000-TBC2 Class A1 | | | | | | | Series 2005-QS14 Class 2A1 | | | | | | |
| 0.647% due 06/15/30 (Ê) | | 61 | | | 59 | | 6.000% due 09/25/35 | | | | 236 | | 192 |
| Merrill Lynch Mortgage Trust | | | | | | | Residential Asset Securitization Trust | | | | | | |
| Series 2005-A10 Class A | | | | | | | Series 2003-A15 Class 1A2 | | | | | | |
| 0.375% due 02/25/36 (Ê) | | 64 | | | 58 | | 0.615% due 02/25/34 (Ê) | | | | 64 | | 60 |
| Series 2005-CIP1 Class AM | | | | | | | Series 2005-A10 Class A3 | | | | | | |
| 5.107% due 07/12/38 | | 440 | | | 465 | | 5.500% due 09/25/35 | | | | 125 | | 109 |
| Series 2008-C1 Class A4 | | | | | | | Series 2006-A9CB Class A6 | | | | | | |
| 5.690% due 02/12/51 | | 530 | | | 593 | | 6.000% due 09/25/36 | | | | 187 | | 117 |
| MLCC Mortgage Investors, Inc. | | | | | | | RFMSI Trust | | | | | | |
| Series 2005-3 Class 5A | | | | | | | Series 2006-SA4 Class 2A1 | | | | | | |
| 0.415% due 11/25/35 (Ê) | | 42 | | | 40 | | 3.577% due 11/25/36 (Ê) | | | | 192 | | 163 |
| ML-CFC Commercial Mortgage Trust | | | | | | | RREF 2013 LT1 LLC | | | | | | |
| Series 2007-6 Class A4 | | | | | | | Series 2013-LT2 Class A | | | | | | |
| 5.485% due 03/12/51 | | 100 | | | 110 | | 2.833% due 05/22/28 (Þ) | | | | 123 | | 123 |
| Morgan Stanley Bank of America Merrill | | | | | | | Sequoia Mortgage Trust | | | | | | |
| Lynch Trust | | | | | | | Series 2001-5 Class A | | | | | | |
| Series 2013-C7 Class AS | | | | | | | 0.866% due 10/19/26 (Ê) | | | | 22 | | 22 |
| 3.214% due 02/15/46 | | 210 | | | 196 | | SMA Issuer I LLC | | | | | | |
| Morgan Stanley Capital I, Inc. | | | | | | | Series 2012-LV1 Class A | | | | | | |
| Series 2003-IQ6 Class C | | | | | | | 3.500% due 08/20/25 (Þ) | | | | 52 | | 52 |
| 5.617% due 12/15/41 (Þ) | | 310 | | | 310 | | Structured Adjustable Rate Mortgage | | | | | | |
| Series 2006-T23 Class A4 | | | | | | | Loan Trust | | | | | | |
| 5.810% due 08/12/41 | | 780 | | | 858 | | Series 2004-12 Class 2A | | | | | | |
| Series 2007-T27 Class A4 | | | | | | | 2.402% due 09/25/34 (Ê) | | | | 981 | | 971 |
| 5.648% due 06/11/42 | | 720 | | | 809 | | Series 2005-23 Class 1A3 | | | | | | |
| Series 2011-C3 Class A2 | | | | | | | 2.737% due 01/25/36 (Ê) | | | | 128 | | 122 |
| 3.224% due 07/15/49 | | 187 | | | 196 | | Structured Asset Mortgage Investments | | | | | | |
| Series 2011-C3 Class A4 | | | | | | | II Trust | | | | | | |
| 4.118% due 07/15/49 | | 115 | | | 120 | | Series 2004-AR8 Class A1 | | | | | | |
| | | | | | | | 0.846% due 05/19/35 (Ê) | | | | 274 | | 266 |
| Morgan Stanley Dean Witter Capital I | | | | | | | | | | | | | |
| Trust | | | | | | | Series 2005-AR5 Class A3 | | | | | | |
| Series 2001-TOP3 Class C | | | | | | | 0.416% due 07/19/35 (Ê) | | | | 101 | | 99 |
| 6.790% due 07/15/33 | | 32 | | | 33 | | Series 2007-AR6 Class A1 | | | | | | |
| Motel 6 Trust | | | | | | | 1.628% due 08/25/47 (Ê) | | | | 925 | | 800 |
| Series 2012-MTL6 Class A1 | | | | | | | Structured Asset Securities Corp. | | | | | | |
| 1.500% due 10/05/25 (Þ) | | 326 | | | 324 | | Mortgage Pass-Through Certificates | | | | | | |
| Series 2012-MTL6 Class A2 | | | | | | | Series 2003-34A Class 5A4 | | | | | | |
| 1.948% due 10/05/25 (Þ) | | 455 | | | 450 | | 2.414% due 11/25/33 (Ê) | | | | 517 | | 517 |
| Series 2012-MTL6 Class XA1 | | | | | | | Wachovia Bank Commercial Mortgage | | | | | | |
| Interest Only STRIP | | | | | | | Trust | | | | | | |
See accompanying notes which are an integral part of the financial statements.
Core Bond Fund 93
Russell Investment Funds
Core Bond Fund
Schedule of Investments, continued — December 31, 2013
| Amounts in thousands (except share amounts) | | | | Amounts in thousands (except share amounts) | | |
| | | | | Principal | | Fair | | | | | | Principal | | Fair |
| | | | | Amount ($) | | Value | | | | | | Amount ($) | | Value |
| | | | | or Shares | | $ | | | | | | or Shares | | $ |
| Series 2003-C9 Class D | | | | | | | | | City of Houston Texas General | | | | | | | |
| 5.209% due 12/15/35 | | | | 250 | | | 250 | | Obligation Limited | | | | | | | |
| Series 2004-C14 Class E | | | | | | | | | 6.290% due 03/01/32 | | | | 475 | | | 537 |
| 5.358% due 08/15/41 (Þ) | | | | 185 | | | 188 | | City of New York New York General | | | | | | | |
| Series 2004-C14 Class F | | | | | | | | | Obligation Unlimited | | | | | | | |
| 5.526% due 08/15/41 (Þ) | | | | 140 | | | 142 | | 6.246% due 06/01/35 | | | | 1,100 | | | 1,170 |
| Series 2004-C15 Class A4 | | | | | | | | | County of Clark Nevada Airport System | | | | | | | |
| 4.803% due 10/15/41 | | | | 100 | | | 102 | | Revenue Bonds | | | | | | | |
| Series 2005-C17 Class A4 | | | | | | | | | 6.820% due 07/01/45 | | | | 100 | | | 122 |
| 5.083% due 03/15/42 | | | | 100 | | | 103 | | Illinois Municipal Electric Agency | | | | | | | |
| | | | | | | | | | Revenue Bonds | | | | | | | |
| Washington Mutual Mortgage Pass | | | | | | | | | 6.832% due 02/01/35 | | | | 100 | | | 106 |
| Through Certificates | | | | | | | | | | | | | | | | |
| Series 2005-AR13 Class A1A1 | | | | | | | | | Irvine Ranch Water District Special | | | | | | | |
| 0.455% due 10/25/45 (Ê) | | | | 20 | | | 18 | | Assessment | | | | | | | |
| | | | | | | | | | 6.622% due 05/01/40 | | | | 1,000 | | | 1,183 |
| Series 2006-AR7 Class A1A | | | | | | | | | | | | | | | | |
| 1.035% due 09/25/46 (Ê) | | | | 853 | | | 508 | | Los Angeles Unified School District | | | | | | | |
| | | | | | | | | | General Obligation Unlimited | | | | | | | |
| Series 2007-HY2 Class 2A3 | | | | | | | | | 4.500% due 07/01/22 (µ) | | | | 400 | | | 433 |
| 3.442% due 04/25/37 (Ê) | | | | 715 | | | 503 | | Metropolitan Government of Nashville & | | | | | | | |
| Series 2007-HY3 Class 4A1 | | | | | | | | | Davidson County Convention Center | | | | | | | |
| 2.528% due 03/25/37 (Ê) | | | | 277 | | | 259 | | Authority Revenue Bonds | | | | | | | |
| Wells Fargo Mortgage Backed Securities | | | | | | | | | 6.731% due 07/01/43 | | | | 100 | | | 110 |
| Trust | | | | | | | | | Municipal Electric Authority of Georgia | | | | | | | |
| Series 2004-P Class 2A1 | | | | | | | | | Revenue Bonds | | | | | | | |
| 2.614% due 09/25/34 (Ê) | | | | 310 | | | 313 | | 6.637% due 04/01/57 | | | | 370 | | | 389 |
| Series 2006-2 Class 2A3 | | | | | | | | | 7.055% due 04/01/57 | | | | 345 | | | 345 |
| 5.500% due 03/25/36 | | | | 95 | | | 88 | | New York City Water & Sewer System | | | | | | | |
| Series 2006-AR2 Class 2A1 | | | | | | | | | Revenue Bonds | | | | | | | |
| 2.628% due 03/25/36 | | | | 131 | | | 131 | | 5.375% due 06/15/43 | | | | 525 | | | 554 |
| Series 2006-AR2 Class 2A3 | | | | | | | | | New York State Dormitory Authority | | | | | | | |
| 2.628% due 03/25/36 (Ê) | | | | 197 | | | 195 | | Revenue Bonds | | | | | | | |
| Series 2006-AR4 Class 1A1 | | | | | | | | | 5.000% due 03/15/23 | | | | 200 | | | 228 |
| 5.765% due 04/25/36 (Ê) | | | | 351 | | | 330 | | 5.000% due 12/15/27 | | | | 200 | | | 220 |
| Series 2006-AR10 Class 4A1 | | | | | | | | | 5.000% due 03/15/29 | | | | 200 | | | 215 |
| 2.685% due 07/25/36 (Ê) | | | | 35 | | | 32 | | 5.000% due 03/15/41 | | | | 200 | | | 205 |
| Series 2006-AR17 Class A1 | | | | | | | | | North Carolina Turnpike Authority | | | | | | | |
| 2.612% due 10/25/36 (Ê) | | | | 635 | | | 579 | | Revenue Bonds | | | | | | | |
| Series 2007-8 Class 1A16 | | | | | | | | | 6.700% due 01/01/39 | | | | 100 | | | 107 |
| 6.000% due 07/25/37 | | | | 112 | | | 106 | | Public Power Generation Agency | | | | | | | |
| Series 2007-AR8 Class A1 | | | | | | | | | Revenue Bonds | | | | | | | |
| 5.917% due 11/25/37 (Ê) | | | | 180 | | | 161 | | 7.242% due 01/01/41 | | | | 100 | | | 106 |
| WF-RBS Commercial Mortgage Trust | | | | | | | | | San Diego County Regional Airport | | | | | | | |
| Series 2011-C5 Class A4 | | | | | | | | | Authority Revenue Bonds | | | | | | | |
| 3.667% due 11/15/44 | | | | 545 | | | 552 | | 6.628% due 07/01/40 | | | | 100 | | | 108 |
| | | | | | | | 211,669 | | State of California General Obligation | | | | | | | |
| Municipal Bonds - 1.5% | | | | | | | | | Unlimited | | | | | | | |
| | | | | | | | | | 6.650% due 03/01/22 | | | | 775 | | | 907 |
| Alabama Public School & College | | | | | | | | | | | | | | | | |
| Authority Revenue Bonds | | | | | | | | | 7.500% due 04/01/34 | | | | 100 | | | 128 |
| 5.150% due 09/01/27 | | | | 100 | | | 108 | | State of Illinois General Obligation | | | | | | | |
| Charlotte-Mecklenburg Hospital | | | | | | | | | Unlimited | | | | | | | |
| Authority (The) Revenue Bonds | | | | | | | | | 5.877% due 03/01/19 | | | | 375 | | | 410 |
| 5.000% due 01/15/30 | | | | 900 | | | 939 | | 5.100% due 06/01/33 | | | | 440 | | | 409 |
| Chicago Transit Authority Revenue | | | | | | | | | 7.350% due 07/01/35 | | | | 350 | | | 385 |
| Bonds | | | | | | | | | State of Louisiana Gasoline & Fuels Tax | | | | | | | |
| 6.899% due 12/01/40 | | | | 200 | | | 224 | | Revenue Bonds | | | | | | | |
See accompanying notes which are an integral part of the financial statements.
94 Core Bond Fund
Russell Investment Funds
Core Bond Fund
Schedule of Investments, continued — December 31, 2013
| Amounts in thousands (except share amounts) | | | | Amounts in thousands (except share amounts) | | |
| | Principal | | Fair | | | Principal | | Fair |
| | Amount ($) | | Value | | | Amount ($) | | Value |
| | or Shares | | $ | | | or Shares | | $ |
| 3.000% due 05/01/43 (Ê) | | | 400 | | | 401 | | Series 0113 | | | | | | |
| State of Texas General Obligation | | | | | | | | 3.172% due 07/15/16 | MYR | | 989 | | | 301 |
| Unlimited | | | | | | | | Mexican Bonos | | | | | | |
| 5.517% due 04/01/39 | | | 250 | | | 280 | | Series M 20 | | | | | | |
| State of Wisconsin Revenue Bonds | | | | | | | | 7.500% due 06/03/27 | MXN | | 11,412 | | | 932 |
| 5.050% due 05/01/18 (µ) | | | 100 | | | 109 | | Series M 30 | | | | | | |
| University of California Revenue Bonds | | | | | | | | 10.000% due 11/20/36 | MXN | | 20,149 | | | 1,960 |
| 5.000% due 05/15/28 | | | 300 | | | 327 | | Series M | | | | | | |
| 6.270% due 05/15/31 | | | 400 | | | 425 | | 8.000% due 06/11/20 | MXN | | 19,200 | | | 1,643 |
| | | | | | | 11,190 | | Muskrat Falls / Labrador Transmission | | | | | | |
| Non-US Bonds - 6.2% | | | | | | | | Assets Funding Trust | | | | | | |
| | | | | | | | | Series C | | | | | | |
| Australia Government Bond | | | | | | | | 3.860% due 12/01/48 (Þ) | CAD | | 300 | | | 288 |
| Series 120 | | | | | | | | | | | | | | |
| 6.000% due 02/15/17 | AUD | | 1,894 | | | 1,844 | | New Zealand Government Bond | | | | | | |
| Series 126 | | | | | | | | 2.000% due 09/20/25 | NZD | | 740 | | | 570 |
| 4.500% due 04/15/20 | AUD | | 4,540 | | | 4,239 | | Series 423 | | | | | | |
| Series 133 | | | | | | | | 5.500% due 04/15/23 | NZD | | 2,060 | | | 1,792 |
| 5.500% due 04/21/23 | AUD | | 2,060 | | | 2,032 | | Series 521 | | | | | | |
| Belgium Government Bond | | | | | | | | 6.000% due 05/15/21 | NZD | | 3,680 | | | 3,298 |
| Series 60 | | | | | | | | Norway Government Bond | | | | | | |
| 4.250% due 03/28/41 (Þ) | EUR | | 500 | | | 784 | | Series 472 | | | | | | |
| Brazil Notas do Tesouro Nacional | | | | | | | | 4.250% due 05/19/17 | NOK | | 15,120 | | | 2,687 |
| Series NTNB | | | | | | | | Peru Government Bond | | | | | | |
| 6.000% due 05/15/45 | BRL | | 964 | | | 909 | | 7.840% due 08/12/20 | PEN | | 3,220 | | | 1,311 |
| 6.000% due 08/15/50 | BRL | | 855 | | | 814 | | Poland Government Bond | | | | | | |
| | | | | | | | | Series 0417 | | | | | | |
| Series NTNF | | | | | | | | 4.750% due 04/25/17 | PLN | | 5,560 | | | 1,920 |
| 10.000% due 01/01/23 | BRL | | 2,068 | | | 740 | | Series 1019 | | | | | | |
| Colombia Government International | | | | | | | | 5.500% due 10/25/19 | PLN | | 3,210 | | | 1,150 |
| Bond | | | | | | | | | | | | | | |
| 7.750% due 04/14/21 | COP | | 2,112,000 | | | 1,208 | | Red & Black Auto Germany | | | | | | |
| | | | | | | | | Series 2012-1 Class A | | | | | | |
| 9.850% due 06/28/27 | COP | | 1,881,000 | | | 1,221 | | 1.189% due 12/15/20 (Ê) | EUR | | 30 | | | 42 |
| Granite Master Issuer PLC | | | | | | | | SC Germany Auto UG | | | | | | |
| Series 2005-1 Class A5 | | | | | | | | Series 2011-2 Class A | | | | | | |
| 0.425% due 12/20/54 (Ê) | EUR | | 241 | | | 329 | | 1.162% due 11/13/21 (Ê) | EUR | | 743 | | | 1,028 |
| Series 2005-4 Class A5 | | | | | | | | South Africa Government Bond | | | | | | |
| 0.445% due 12/20/54 (Ê) | EUR | | 103 | | | 141 | | Series R203 | | | | | | |
| Series 2006-4 Class A7 | | | | | | | | 8.250% due 09/15/17 | ZAR | | 14,670 | | | 1,458 |
| 0.465% due 12/20/54 (Ê) | EUR | | 258 | | | 351 | | Series R214 | | | | | | |
| Ireland Government Bond | | | | | | | | 6.500% due 02/28/41 | ZAR | | 13,020 | | | 915 |
| 5.000% due 10/18/20 | EUR | | 580 | | | 897 | | Spain Government Bond | | | | | | |
| 5.400% due 03/13/25 | EUR | | 1,850 | | | 2,894 | | 4.000% due 07/30/15 | EUR | | 2,300 | | | 3,283 |
| Italy Buoni Poliennali Del Tesoro | | | | | | | | 3.150% due 01/31/16 | EUR | | 200 | | | 284 |
| 4.500% due 07/15/15 | EUR | | 500 | | | 722 | | Wood Street CLO 1 BV | | | | | | |
| 3.000% due 11/01/15 | EUR | | 100 | | | 142 | | Series 2005-I Class A | | | | | | |
| 2.750% due 12/01/15 | EUR | | 400 | | | 566 | | 0.544% due 11/22/21 (Ê) | EUR | | 99 | | | 133 |
| 4.000% due 09/01/20 | EUR | | 730 | | | 1,054 | | | | | | | | 47,747 |
| Kingdom of Belgium | | | | | | | | United States Government Agencies - 1.5% | | | | | |
| 3.750% due 09/28/20 (Æ) | EUR | | 668 | | | 1,031 | | Fannie Mae | | | | | | |
| Malaysia Government Bond | | | | | | | | 5.000% due 05/11/17 | | | 100 | | | 113 |
| Series 0106 | | | | | | | | Federal Home Loan Banks | | | | | | |
| 4.262% due 09/15/16 | MYR | | 1,954 | | | 610 | | 2.500% due 05/26/15 | | | 1,020 | | | 971 |
| Series 0110 | | | | | | | | 0.550% due 06/03/16 | | | 1,075 | | | 1,072 |
| 3.835% due 08/12/15 | MYR | | 728 | | | 224 | | Federal Home Loan Mortgage Corp. | | | | | | |
| |
| | | | | | | | | See accompanying notes which are an integral part of the financial statements. |
| | | | | | | | | | | | Core Bond Fund 95 |
Russell Investment Funds
Core Bond Fund
Schedule of Investments, continued — December 31, 2013
| Amounts in thousands (except share amounts) | | | | Amounts in thousands (except share amounts) | | |
| | | | | Principal | | Fair | | | | | | | | Principal | | Fair |
| | | | | Amount ($) | | Value | | | | | | Amount ($) | | Value |
| | | | | or Shares | | $ | | | | | | | | or Shares | | $ |
| 2.000% due 08/25/16 | | | | 675 | | 698 | | 0.875% due 12/31/16 | | | | | | 600 | | 601 |
| 1.000% due 06/29/17 | | | | 200 | | 199 | | 0.875% due 01/31/17 | | | | | | 6,500 | | 6,506 |
| 1.000% due 09/29/17 | | | | 200 | | 198 | | 0.875% due 02/28/17 | | | | | | 700 | | 700 |
| 0.875% due 03/07/18 | | | | 400 | | 389 | | 3.000% due 02/28/17 | | | | | | 100 | | 107 |
| 3.750% due 03/27/19 | | | | 300 | | 327 | | 1.000% due 03/31/17 | | | | | | 200 | | 200 |
| 1.250% due 08/01/19 | | | | 100 | | 95 | | 3.250% due 03/31/17 | | | | | | 200 | | 215 |
| 1.250% due 10/02/19 | | | | 400 | | 379 | | 0.875% due 04/30/17 | | | | | | 1,300 | | 1,296 |
| Series 1 | | | | | | | | 0.625% due 05/31/17 | | | | | | 1,374 | | 1,356 |
| 1.000% due 07/28/17 | | | | 400 | | 397 | | 0.500% due 07/31/17 | | | | | | 300 | | 294 |
| 0.750% due 01/12/18 | | | | 800 | | 779 | | 0.625% due 08/31/17 | | | | | | 300 | | 294 |
| Federal National Mortgage Association | | | | | | | | 0.750% due 12/31/17 | | | | | | 1,675 | | 1,638 |
| 0.500% due 01/29/16 | | | | 1,895 | | 1,894 | | 3.500% due 02/15/18 | | | | | | 2,300 | | 2,497 |
| 1.250% due 01/30/17 | | | | 300 | | 304 | | 1.000% due 05/31/18 | | | | | | 800 | | 783 |
| 0.875% due 08/28/17 | | | | 100 | | 99 | | 1.500% due 08/31/18 | | | | | | 4,800 | | 4,776 |
| 0.875% due 10/26/17 | | | | 1,600 | | 1,573 | | 1.250% due 10/31/18 | | | | | | 3,600 | | 3,529 |
| 0.875% due 12/20/17 | | | | 100 | | 98 | | 1.250% due 11/30/18 | | | | | | 16,800 | | 16,440 |
| 0.875% due 02/08/18 | | | | 1,500 | | 1,462 | | 1.500% due 12/31/18 | | | | | | 2,880 | | 2,848 |
| 0.875% due 05/21/18 | | | | 300 | | 290 | | 6.250% due 08/15/23 | | | | | | 380 | | 488 |
| 1.875% due 09/18/18 | | | | 200 | | 201 | | 2.750% due 11/15/23 | | | | | | 15,180 | | 14,849 |
| Freddie Mac | | | | | | | | 2.750% due 08/15/42 | | | | | | 935 | | 741 |
| 5.500% due 08/23/17 | | | | 100 | | 115 | | 3.625% due 08/15/43 | | | | | | 2,435 | | 2,300 |
| | | | | | | 11,653 | | | | | | | | | | |
| | | | | | | | | 3.750% due 11/15/43 | | | | | | 4,500 | | 4,349 |
| United States Government Treasuries - 14.4% | | | | | | | | | | | | 109,789 |
| United States Treasury | | | | | | | | | | | | | | | | |
| Principal Only STRIP | | | | | | | | Total Long-Term Investments | | | | | | | | |
| Zero coupon due 11/15/27 | | | | 1,350 | | 812 | | (cost $559,444) | | | | | | | | 562,648 |
| United States Treasury Inflation Indexed | | | | | | | | Common Stocks - 0.0% | | | | | | | | |
| Bonds | | | | | | | | | | | | | | | | |
| 0.500% due 04/15/15 | | | | 577 | | 589 | | Financial Services - 0.0% | | | | | | | | |
| 0.125% due 04/15/16 | | | | 3,370 | | 3,461 | | Escrow GM Corp. (Å) | | | | | | 80,000 | | — |
| 0.125% due 04/15/17 | | | | 6,612 | | 6,796 | | Utilities - 0.0% | | | | | | | | |
| 0.125% due 04/15/18 | | | | 2,794 | | 2,849 | | Dynegy, Inc. Class A(Æ) | | | | | | 16,210 | | 349 |
| 1.250% due 07/15/20 | | | | 643 | | 687 | | Total Common Stocks | | | | | | | | |
| 0.125% due 07/15/22 | | | | 813 | | 778 | | (cost $324) | | | | | | | | 349 |
| 2.375% due 01/15/25 | | | | 3,965 | | 4,558 | | Preferred Stocks - 0.2% | | | | | | | | |
| 2.000% due 01/15/26 | | | | 353 | | 391 | | | | | | | | | | |
| 2.375% due 01/15/27 | | | | 3,127 | | 3,602 | | Financial Services - 0.2% | | | | | | | | |
| | | | | | | | | Centaur Funding Corp. | | | | | | 660 | | 801 |
| 1.750% due 01/15/28 | | | | 2,676 | | 2,865 | | DG Funding Trust (Å) | | | | | | 49 | | 347 |
| 2.125% due 02/15/41 | | | | 1,483 | | 1,666 | | XLIT, Ltd. | | | | | | 260 | | 222 |
| United States Treasury Notes | | | | | | | | | | | | | | | | 1,370 |
| 0.250% due 11/30/15 | | | | 2,685 | | 2,680 | | Total Preferred Stocks | | | | | | | | |
| 0.375% due 01/15/16 | | | | 600 | | 600 | | (cost $1,533) | | | | | | | | 1,370 |
| 1.750% due 05/31/16 | | | | 100 | | 103 | | | | | | | | | | |
| 0.625% due 07/15/16 | | | | 300 | | 300 | | Options Purchased - 0.1% | | | | | | | | |
| 1.500% due 07/31/16 | | | | 200 | | 205 | | (Number of Contracts) | | | | | | | | |
| 0.625% due 08/15/16 | | | | 400 | | 400 | | Swaptions | | | | | | | | |
| 1.000% due 08/31/16 | | | | 100 | | 101 | | (Fund Receives/Fund Pays) | | | | | | | | |
| 0.875% due 09/15/16 | | | | 1,200 | | 1,207 | | USD 4.50%/USD Three Month LIBOR | | | | | | | | |
| | | | | | | | | Apr 2018 0.00 Put (1) | | | | | | 1,680 (ÿ) | | 179 |
| 0.625% due 10/15/16 | | | | 1,700 | | 1,697 | | USD 4.500%/USD Three Month LIBOR | | | | | | | | |
| 0.625% due 11/15/16 | | | | 1,400 | | 1,396 | | Mar 2018 0.00 Put (2) | | | | | | 2,670 (ÿ) | | 284 |
| 0.625% due 12/15/16 | | | | 5,260 | | 5,239 | | | | | | | | | | |
See accompanying notes which are an integral part of the financial statements.
96 Core Bond Fund
Russell Investment Funds
Core Bond Fund
Schedule of Investments, continued — December 31, 2013
| Amounts in thousands (except share amounts) | | | | Amounts in thousands (except share amounts) | | |
| | Principal | | Fair | | | Principal | | Fair |
| | Amount ($) | | Value | | | Amount ($) | | Value |
| | or Shares | | $ | | | or Shares | | $ |
| |
| Total Options Purchased | | | | | | | 0.503% due 09/15/14 (Ê) | | | 420 | | 421 |
| | | | | | | | Goldman Sachs Group, Inc. (The) | | | | | |
| (cost $297) | | | | | 463 | | 6.000% due 05/01/14 | | | 150 | | 153 |
| | | | | | | | Honda Auto Receivables Owner Trust | | | | | |
| Short-Term Investments - 31.3% | | | | | | | Series 2013-2 Class A1 | | | | | |
| Abbey National Treasury Services PLC | | | | | | | 0.240% due 05/16/14 | | | 95 | | 95 |
| 3.875% due 11/10/14 (Þ) | | | 870 | | 894 | | Series 2013-3 Class A1 | | | | | |
| AmeriCredit Automobile Receivables | | | | | | | 0.220% due 08/15/14 | | | 870 | | 870 |
| Trust | | | | | | | International Lease Finance Corp. | | | | | |
| Series 2013-3 Class A1 | | | | | | | 6.500% due 09/01/14 (Þ) | | | 720 | | 744 |
| 0.250% due 06/09/14 | | | 11 | | 11 | | Intesa Sanpaolo SpA | | | | | |
| ARI Fleet Lease Trust | | | | | | | 2.638% due 02/24/14 (Ê)(Þ) | | | 200 | | 201 |
| Series 2013-A Class A1 | | | | | | | | | | | | |
| 0.260% due 04/15/14 (Þ) | | | 57 | | 57 | | Italy Buoni Ordinari del Tesoro BOT | | | | | |
| | | | | | | | Zero coupon due 08/14/14 | EUR | | 300 | | 411 |
| Autonomous Community of Valencia | | | | | | | | | | | | |
| Spain | | | | | | | Zero coupon due 09/12/14 | EUR | | 700 | | 957 |
| 4.750% due 03/20/14 | EUR | | 100 | | 138 | | Zero coupon due 10/14/14 | EUR | | 3,300 | | 4,511 |
| Banco Santander Brazil SA | | | | | | | Zero coupon due 11/14/14 | EUR | | 100 | | 137 |
| 2.343% due 03/18/14 (Å)(Ê) | | | 200 | | 200 | | JPMorgan Chase & Co. | | | | | |
| Bank of America Corp. | | | | | | | 5.375% due 01/15/14 | | | 170 | | 170 |
| 7.375% due 05/15/14 | | | 305 | | 313 | | Macquarie Bank, Ltd. | | | | | |
| British Telecommunications PLC | | | | | | | 0.010% due 02/25/14 (ç)(~) | | | 1,780 | | 1,779 |
| 0.800% due 03/10/14 (~) | | | 1,700 | | 1,699 | | Mercedes-Benz Auto Lease Trust | | | | | |
| CHS/Community Health Systems, Inc. | | | | | | | Series 2013-A Class A1 | | | | | |
| Non Extended Term Loan | | | | | | | 0.270% due 05/15/14 | | | 157 | | 157 |
| 2.445% due 07/25/14 | | | 288 | | 289 | | Metropolitan Life Global Funding I | | | | | |
| CIT Group, Inc. | | | | | | | 5.125% due 06/10/14 (Þ) | | | 200 | | 204 |
| 5.250% due 04/01/14 (Þ) | | | 1,200 | | 1,212 | | Morgan Stanley | | | | | |
| Citigroup, Inc. | | | | | | | 4.200% due 11/20/14 | | | 200 | | 206 |
| 5.500% due 10/15/14 | | | 405 | | 420 | | RBS Holdings USA, Inc. | | | | | |
| Dexia Credit Local SA | | | | | | | 0.366% due 01/22/14 (ç)(~) | | | 1,885 | | 1,885 |
| 0.717% due 04/29/14 (Ê)(Þ) | | | 500 | | 501 | | Russell U. S. Cash Management Fund | 176,390,299 | | 176,390 |
| Direct Capital Funding V LLC | | | | | | | Santander Drive Auto Receivables Trust | | | | | |
| Series 2013-2 Class A1 | | | | | | | Series 2010-A Class A3 | | | | | |
| 0.700% due 09/20/14 (Þ) | | | 544 | | 545 | | 1.830% due 11/17/14 (Þ) | | | 124 | | 124 |
| Electricite de France | | | | | | | Sempra Energy | | | | | |
| 5.500% due 01/26/14 (Å) | | | 200 | | 201 | | 2.000% due 03/15/14 | | | 255 | | 256 |
| Enterprise Fleet Financing LLC | | | | | | | SMART Trust | | | | | |
| Series 2013-1 Class A1 | | | | | | | Series 2013-2US Class A1 | | | | | |
| 0.260% due 03/20/14 (Þ) | | | 37 | | 37 | | 0.260% due 05/14/14 | | | 73 | | 73 |
| Federal Farm Credit Banks | | | | | | | Spain Letras del Tesoro | | | | | |
| 0.186% due 09/19/14 (Ê) | | | 1,230 | | 1,230 | | Zero coupon due 09/19/14 | EUR | | 300 | | 410 |
| Federal Home Loan Mortgage Corp. | | | | | | | Springleaf Finance Corp. | | | | | |
| 1.375% due 02/25/14 | | | 265 | | 265 | | Series INCM | | | | | |
| First Investors Auto Owner Trust | | | | | | | 6.000% due 11/15/14 | | | 200 | | 200 |
| Series 2013-3A Class A1 | | | | | | | TD Ameritrade Holding Corp. | | | | | |
| 0.330% due 11/17/14 (Þ) | | | 898 | | 898 | | 4.150% due 12/01/14 | | | 225 | | 232 |
| Gazprom OAO Via White Nights | | | | | | | Timken Co. | | | | | |
| Finance BV | | | | | | | 6.000% due 09/15/14 | | | 150 | | 155 |
| Series REGS | | | | | | | United States Treasury Bills | | | | | |
| 10.500% due 03/25/14 | | | 200 | | 204 | | Zero coupon due 03/20/14 (~) | | | 37 | | 37 |
| General Electric Capital Corp. | | | | | | | Zero coupon due 04/24/14 | | | 15,630 | | 15,627 |
| 5.900% due 05/13/14 | | | 350 | | 357 | | United States Treasury Inflation Indexed | | | | | |
| Series EMTN | | | | | | | Bonds | | | | | |
| 0.367% due 03/20/14 (Ê) | | | 400 | | 400 | | 1.250% due 04/15/14 | | | 1,330 | | 1,338 |
| Series MTNA | | | | | | | | | | | | |
See accompanying notes which are an integral part of the financial statements.
Core Bond Fund 97
Russell Investment Funds
Core Bond Fund
Schedule of Investments, continued — December 31, 2013
| Amounts in thousands (except share amounts) | | | | Amounts in thousands (except share amounts) | | |
| | | Principal | | Fair | | Principal | | Fair |
| | | Amount ($) | | Value | | Amount ($) | | Value |
| | | or Shares | | $ | | or Shares | | $ |
| |
| 2.000% due 07/15/14 | | 16,387 | | | 16,748 | | Total Investments 109.2% | | |
| Vodafone Group PLC | | | | | | | | | |
| 0.750% due 01/02/14 (ç)(~) | | 1,100 | | | 1,100 | | (identified cost $830,373) | | 833,803 |
| Volkswagen Auto Lease Trust | | | | | | | Other Assets and Liabilities, | | |
| Series 2013-A Class A1 | | | | | | | Net - (9.2%) | | (69,902) |
| 0.230% due 08/15/14 | | 293 | | | 293 | | | | |
| Volkswagen International Finance NV | | | | | | | Net Assets - 100.0% | | 763,901 |
| 0.857% due 04/01/14 (Ê)(Þ) | | 400 | | | 400 | | | | |
| Volvo Financial Equipment LLC | | | | | | | | | |
| Series 2013-1A Class A1 | | | | | | | | | |
| 0.260% due 04/15/14 (Þ) | | 68 | | | 68 | | | | |
| Westlake Automobile Receivables Trust | | | | | | | | | |
| Series 2013-1A Class A1 | | | | | | | | | |
| 0.550% due 10/15/14 (Þ) | | 1,022 | | | 1,022 | | | | |
| WM Wrigley Jr Co. | | | | | | | | | |
| 3.700% due 06/30/14 (Å) | | 1,800 | | | 1,828 | | | | |
| |
| Total Short-Term Investments | | | | | | | | | |
| (cost $238,875) | | | | | 239,073 | | | | |
| |
| Repurchase Agreements - 3.9% | | | | | | | | | |
| Agreement with JPMorgan and State | | | | | | | | | |
| Street Bank (Tri-Party) of $5,400 | | | | | | | | | |
| dated December 31, 2013 at 0.030% | | | | | | | | | |
| to be repurchased at $5,400 on | | | | | | | | | |
| January 2, 2014 collateralized by | | | | | | | | | |
| United States Treasury Note, valued | | | | | | | | | |
| at $5,522. | | 5,400 | | | 5,400 | | | | |
| Agreement with Barclays and State | | | | | | | | | |
| Street Bank (Tri-Party) of $3,000 | | | | | | | | | |
| dated December 31, 2013 at 0.010% | | | | | | | | | |
| to be repurchased at $3,000 on | | | | | | | | | |
| January 2, 2014 collateralized by | | | | | | | | | |
| United States Treasury Note, valued | | | | | | | | | |
| at $3,053. | | 3,000 | | | 3,000 | | | | |
| Agreement with Credit Suisse and State | | | | | | | | | |
| Street Bank (Tri-Party) of $12,000 | | | | | | | | | |
| dated December 31, 2013 at 0.010% | | | | | | | | | |
| to be repurchased at $12,000 on | | | | | | | | | |
| January 2, 2014 collateralized by | | | | | | | | | |
| United States Treasury Note, valued | | | | | | | | | |
| at $12,249. | | 12,000 | | | 12,000 | | | | |
| Agreement with JPMorgan and State | | | | | | | | | |
| Street Bank (Tri-Party) of $2,000 | | | | | | | | | |
| dated December 31, 2013 at 0.050% | | | | | | | | | |
| to be repurchased at $2,000 on | | | | | | | | | |
| January 2, 2014 collateralized by | | | | | | | | | |
| Freddie Mac, valued at $2,046. | | 2,000 | | | 2,000 | | | | |
| Agreement with Morgan Stanley and | | | | | | | | | |
| State Street Bank (Tri-Party) of | | | | | | | | | |
| $7,500 dated December 31, 2013 at | | | | | | | | | |
| 0.020% to be repurchased at $7,500 | | | | | | | | | |
| on January 2, 2014 collateralized by | | | | | | | | | |
| United States Treasury Note, valued | | | | | | | | | |
| at $7,584. | | 7,500 | | | 7,500 | | | | |
| |
| Total Repurchase Agreements | | | | | | | | | |
| (cost $29,900) | | | | | 29,900 | | | | |
See accompanying notes which are an integral part of the financial statements.
98 Core Bond Fund
Russell Investment Funds
Core Bond Fund
Schedule of Investments, continued — December 31, 2013
| Restricted Securities | | | | | | | | | | | | | | |
| |
| Amounts in thousands (except share and cost per unit amounts) | | | | | | | | | | | | |
| |
| | | | | | | | Principal | | Cost per | | | | Cost | | Fair Value |
| % of Net Assets | | Acquisition | | | | Amount ($) | | Unit | | | | (000) | | (000) |
| Securities | | Date | | | | or Shares | | $ | | | | $ | | $ |
| 0.3% | | | | | | | | | | | | | | |
| Banco Santander Brazil SA | | 03/17/11 | | | | 200,000 | | 100 . 00 | | | | 200 | | 200 |
| DG Funding Trust | | 11/04/03 | | | | 49 | | 10,537 . 12 | | | | 516 | | 347 |
| Electricite de France | | 01/21/09 | | | | 200,000 | | 99 . 99 | | | | 200 | | 201 |
| Escrow GM Corp. | | 04/21/11 | | | | 80,000 | | — | | | | — | | — |
| WM Wrigley Jr Co. | | 02/28/13 | | | | 1,800,000 | | 101 . 43 | | | | 1,826 | | 1,828 |
| | | | | | | | | | | | | | | | 2,576 |
| For a description of restricted securities see note 9 in the Notes to Financial Statements. | | | | | | | | |
| Futures Contracts | | | | | | | | | | | | |
| |
| Amounts in thousands (except contract amounts) | | | | | | | | | | | | |
| | | | | | | | | | | | | Unrealized |
| | | | | | | | | | | | | Appreciation |
| | | | | Number of | | Notional | | Expiration | | (Depreciation) |
| | | | | Contracts | | Amount | | Date | | $ |
| |
| Long Positions | | | | | | | | | | | | |
| Euribor Futures (Germany) | | | | 6 | | EUR | | 1,493 | | 03/15 | | (2) |
| Euribor Futures (Germany) | | | | 6 | | EUR | | 1,492 | | 06/15 | | (2) |
| Eurodollar Futures (CME) | | | | 27 | | USD | | 6,721 | | 12/14 | | 1 |
| Eurodollar Futures (CME) | | | | 17 | | USD | | 4,228 | | 03/15 | | — |
| Eurodollar Futures (CME) | | | | 57 | | USD | | 14,154 | | 06/15 | | (13) |
| Eurodollar Futures (CME) | | | | 313 | | USD | | 77,569 | | 09/15 | | 62 |
| Eurodollar Futures (CME) | | | | 360 | | USD | | 88,988 | | 12/15 | | (153) |
| Eurodollar Futures (CME) | | | | 121 | | USD | | 29,817 | | 03/16 | | (79) |
| Eurodollar Futures (CME) | | | | 21 | | USD | | 5,158 | | 06/16 | | (16) |
| Eurodollar Futures (CME) | | | | 54 | | USD | | 13,223 | | 09/16 | | (51) |
| Eurodollar Futures (CME) | | | | 7 | | USD | | 1,709 | | 12/16 | | (2) |
| Eurodollar Futures (CME) | | | | 1 | | USD | | 243 | | 03/17 | | 1 |
| Eurodollar Futures (CME) | | | | 2 | | USD | | 485 | | 06/17 | | 2 |
| Three Month Euribor Interest Rate Futures (Germany) | | | | 6 | | EUR | | 1,494 | | 12/14 | | (1) |
| Three Month Euribor Interest Rate Futures (Germany) | | | | 6 | | EUR | | 1,490 | | 09/15 | | (3) |
| United States Treasury 2 Year Note Futures | | | | 129 | | USD | | 28,357 | | 03/14 | | (51) |
| United States Treasury 5 Year Note Futures | | | | 336 | | USD | | 40,089 | | 03/14 | | (489) |
| United States Treasury 10 Year Note Futures | | | | 506 | | USD | | 62,262 | | 03/14 | | (1,194) |
| United States Treasury Long-Term Bond Futures | | | | 154 | | USD | | 19,760 | | 03/14 | | (367) |
| United States Treasury Ultra Long-Term Bond Futures | | | | 6 | | USD | | 818 | | 03/14 | | (14) |
| Short Positions | | | | | | | | | | | | |
| Canada Government 10 Year Bond Futures (Canada) | | | | 22 | | CAD | | 2,788 | | 03/14 | | 33 |
| Euro-Bobl Futures (EUX) (Germany) | | | | 27 | | EUR | | 3,360 | | 03/14 | | 51 |
| Euro-Bund Futures (EUX) (Germany) | | | | 1 | | EUR | | 139 | | 03/14 | | 3 |
| Eurodollar Futures (CME) | | | | 40 | | USD | | 9,857 | | 03/16 | | 21 |
| Euro-OAT Futures (Germany) | | | | 18 | | EUR | | 2,366 | | 03/14 | | 50 |
| Japan Government 10 Year Bond Futures (TSE) (Japan) | | | | 5 | | JPY | | 716,601 | | 03/14 | | 40 |
| United Kingdom Long Gilt Bond Futures (United Kingdom) | | | | 39 | | GBP | | 4,156 | | 03/14 | | 148 |
| United States Treasury 5 Year Note Futures | | | | 33 | | USD | | 3,937 | | 03/14 | | 56 |
| United States Treasury 10 Year Note Futures | | | | 69 | | USD | | 8,490 | | 03/14 | | 176 |
| United States Treasury Long-Term Bond Futures | | | | 8 | | USD | | 1,027 | | 03/14 | | 19 |
| Total Unrealized Appreciation (Depreciation) on Open Futures Contracts (å) | | | | | | | | | | | | (1,774) |
See accompanying notes which are an integral part of the financial statements.
Core Bond Fund 99
Russell Investment Funds
Core Bond Fund
Schedule of Investments, continued — December 31, 2013
| Options Written | | | | | | | | | | | | | | |
| Amounts in thousands (except contract amounts) | | | | | | | | | | | | |
| | | | | Number of | | Strike | | Notional | | Expiration | | Fair Value |
| | | Call/Put | | Contracts | | Price | | Amount | | Date | | $ |
| Eurodollar Mid CRV 3 Year Futures | | Put | | 17 | | 97.38 | | USD | | 43 | | 03/14/14 | | (9) |
| Inflationary Floor Options | | Call | | 1 | | 0.00 | | USD | | 810 | | 11/23/20 | | (1) |
| Inflationary Floor Options | | Put | | 1 | | 0.00 | | USD | | 1,400 | | 03/10/20 | | — |
| Inflationary Floor Options | | Put | | 1 | | 0.00 | | USD | | 1,000 | | 03/12/20 | | — |
| Inflationary Floor Options | | Put | | 1 | | 0.00 | | USD | | 5,500 | | 04/07/20 | | (1) |
| Inflationary Floor Options | | Put | | 1 | | 0.00 | | USD | | 300 | | 09/29/20 | | — |
| Swaptions | | | | | | | | | | | | | | |
| (Fund Receives/Fund Pays) | | | | | | | | | | | | | | |
| USD Three Month LIBOR/USD 0.400% | | Call | | 3 | | 0.00 | | | | 1,400 | | 03/12/14 | | (1) |
| USD Three Month LIBOR/USD 0.600% | | Call | | 1 | | 0.00 | | | | 500 | | 03/19/14 | | (1) |
| USD Three Month LIBOR/USD 0.700% | | Call | | 2 | | 0.00 | | | | 600 | | 03/19/14 | | (1) |
| USD Three Month LIBOR/USD 1.300% | | Call | | 1 | | 0.00 | | | | 2,600 | | 01/27/14 | | — |
| USD Three Month LIBOR/USD 1.400% | | Call | | 1 | | 0.00 | | | | 11,700 | | 01/27/14 | | — |
| USD Three Month LIBOR/USD 1.400% | | Call | | 2 | | 0.00 | | | | 10,100 | | 03/03/14 | | (1) |
| USD Three Month LIBOR/USD 1.400% | | Call | | 2 | | 0.00 | | | | 2,500 | | 05/06/14 | | (1) |
| USD Three Month LIBOR/USD 2.400% | | Call | | 1 | | 0.00 | | | | 600 | | 03/17/14 | | — |
| USD Three Month LIBOR/USD 2.500% | | Call | | 1 | | 0.00 | | | | 500 | | 01/27/14 | | — |
| USD Three Month LIBOR/USD 2.600% | | Call | | 1 | | 0.00 | | | | 600 | | 03/03/14 | | — |
| USD Three Month LIBOR/USD 2.900% | | Call | | 1 | | 0.00 | | | | 900 | | 03/03/14 | | — |
| USD 0.400%/USD Three Month LIBOR | | Put | | 3 | | 0.00 | | | | 1,400 | | 03/12/14 | | — |
| USD 0.900%/USD Three Month LIBOR | | Put | | 2 | | 0.00 | | | | 800 | | 03/19/14 | | — |
| USD 1.100%/USD Three Month LIBOR | | Put | | 1 | | 0.00 | | | | 300 | | 03/19/14 | | — |
| USD 1.800%/USD Three Month LIBOR | | Put | | 1 | | 0.00 | | | | 2,600 | | 01/27/14 | | (12) |
| USD 1.800%/USD Three Month LIBOR | | Put | | 1 | | 0.00 | | | | 9,800 | | 03/03/14 | | (85) |
| USD 1.900%/USD Three Month LIBOR | | Put | | 1 | | 0.00 | | | | 1,100 | | 05/06/14 | | (14) |
| USD 2.000%/USD Three Month LIBOR | | Put | | 1 | | 0.00 | | | | 11,700 | | 01/27/14 | | (17) |
| USD 2.000%/USD Three Month LIBOR | | Put | | 2 | | 0.00 | | | | 16,400 | | 03/31/14 | | (30) |
| USD 2.900%/USD Three Month LIBOR | | Put | | 1 | | 0.00 | | | | 600 | | 03/17/14 | | (18) |
| USD 3.100%/USD Three Month LIBOR | | Put | | 2 | | 0.00 | | | | 1,400 | | 03/03/14 | | (19) |
| USD 3.500%/USD Three Month LIBOR | | Put | | 1 | | 0.00 | | | | 500 | | 01/27/14 | | — |
| Total Liability for Options Written (premiums received $364) | | | | | | | | | | | | (211) |
| Transactions in options written contracts for the period ended December 31, 2013 were as follows: |
| | | Number of | | Premiums |
| | | | | Contracts | | | Received |
| Outstanding December 31, 2012 | | | | 163 | | $ | 296 |
| Opened | | | | 518 | | | 802 |
| Closed | | | | (480) | | | (487) |
| Expired | | | | (147) | | | (247) |
| Outstanding December 31, 2013 | | | | 54 | | $ | 364 |
| Foreign Currency Exchange Contracts | | | | | | | | | | | | |
| Amounts in thousands | | | | | | | | | | | | |
| | | | | | | | | | | | | Unrealized |
| | | | | | | | | | | | | Appreciation |
| | | Amount | | Amount | | | | (Depreciation) |
| Counterparty | | | | Sold | | Bought | | Settlement Date | | $ |
| Bank of America | | USD | | 912 | | CAD | | 968 | | 01/15/14 | | (1) |
| Bank of America | | USD | | 2,085 | | CAD | | 2,234 | | 01/15/14 | | 17 |
| Bank of America | | USD | | 3,596 | | NOK | | 22,020 | | 01/15/14 | | 33 |
| Bank of America | | EUR | | 11,406 | | USD | | 15,438 | | 01/02/14 | | (253) |
| Bank of America | | NOK | | 4,317 | | GBP | | 428 | | 01/15/14 | | (3) |
| Barclays | | AUD | | 1,549 | | USD | | 1,374 | | 01/15/14 | | (9) |
| Barclays | | AUD | | 1,549 | | USD | | 1,374 | | 01/17/14 | | (8) |
| Barclays | | GBP | | 75 | | USD | | 123 | | 03/12/14 | | (1) |
See accompanying notes which are an integral part of the financial statements.
100 Core Bond Fund
Russell Investment Funds
Core Bond Fund
Schedule of Investments, continued — December 31, 2013
| Foreign Currency Exchange Contracts | | | | | | | | | | | | |
| Amounts in thousands | | | | | | | | | | | | |
| | | | | | | | | | | | | Unrealized |
| | | | | | | | | | | | | Appreciation |
| | | Amount | | Amount | | | | (Depreciation) |
| Counterparty | | | | Sold | | Bought | | Settlement Date | | $ |
| Barclays | | NOK | | 10,305 | | GBP | | 1,021 | | 01/15/14 | | (8) |
| BNP Paribas | | JPY | | 19,100 | | USD | | 185 | | 02/18/14 | | 4 |
| BNP Paribas | | JPY | | 39,300 | | USD | | 382 | | 02/18/14 | | 8 |
| Citibank | | USD | | 2,086 | | CAD | | 2,237 | | 01/15/14 | | 19 |
| Citibank | | USD | | 1,832 | | EUR | | 1,351 | | 01/02/14 | | 26 |
| Citibank | | USD | | 14,158 | | EUR | | 10,284 | | 01/02/14 | | (10) |
| Citibank | | CAD | | 4,653 | | USD | | 4,347 | | 01/15/14 | | (33) |
| Citibank | | CHF | | 2,444 | | EUR | | 1,992 | | 01/15/14 | | 1 |
| Citibank | | EUR | | 10,284 | | USD | | 14,158 | | 02/04/14 | | 10 |
| Citibank | | NZD | | 6,395 | | USD | | 5,228 | | 01/15/14 | | (28) |
| Credit Suisse | | USD | | 3,566 | | NOK | | 21,830 | | 01/15/14 | | 32 |
| Credit Suisse | | JPY | | 31,471 | | USD | | 300 | | 01/06/14 | | 1 |
| Credit Suisse | | NOK | | 17,962 | | GBP | | 1,780 | | 01/15/14 | | (13) |
| Deutsche Bank | | USD | | 468 | | EUR | | 342 | | 02/04/14 | | 3 |
| Deutsche Bank | | CHF | | 1,115 | | EUR | | 909 | | 01/15/14 | | 1 |
| Deutsche Bank | | EUR | | 1,530 | | GBP | | 1,278 | | 01/15/14 | | 11 |
| Deutsche Bank | | JPY | | 10,400 | | USD | | 101 | | 02/18/14 | | 3 |
| Deutsche Bank | | JPY | | 10,600 | | USD | | 103 | | 02/18/14 | | 2 |
| Deutsche Bank | | JPY | | 31,600 | | USD | | 303 | | 02/18/14 | | 2 |
| Deutsche Bank | | NOK | | 12,291 | | EUR | | 1,448 | | 01/15/14 | | (33) |
| Deutsche Bank | | NOK | | 8,296 | | GBP | | 824 | | 01/15/14 | | (3) |
| Deutsche Bank | | NOK | | 17,957 | | GBP | | 1,780 | | 01/15/14 | | (12) |
| Deutsche Bank | | NZD | | 6,518 | | USD | | 5,328 | | 01/15/14 | | (29) |
| Goldman Sachs | | USD | | 2,188 | | CAD | | 2,322 | | 01/15/14 | | (3) |
| Goldman Sachs | | USD | | 3,568 | | NOK | | 21,830 | | 01/15/14 | | 30 |
| Goldman Sachs | | AUD | | 2,361 | | GBP | | 1,290 | | 01/15/14 | | 30 |
| Goldman Sachs | | CHF | | 2,666 | | EUR | | 2,173 | | 01/15/14 | | — |
| HSBC | | JPY | | 37,747 | | USD | | 380 | | 02/18/14 | | 22 |
| JPMorgan Chase | | USD | | 757 | | AUD | | 794 | | 01/29/14 | | (49) |
| JPMorgan Chase | | USD | | 628 | | BRL | | 1,401 | | 01/29/14 | | (38) |
| JPMorgan Chase | | USD | | 6,386 | | GBP | | 3,957 | | 01/29/14 | | 166 |
| JPMorgan Chase | | USD | | 4,763 | | KRW 5,090,466 | | 01/29/14 | | 51 |
| JPMorgan Chase | | USD | | 1,224 | | MXN | | 15,870 | | 01/29/14 | | (11) |
| JPMorgan Chase | | USD | | 541 | | MYR | | 1,714 | | 01/29/14 | | (19) |
| JPMorgan Chase | | USD | | 4,426 | | MYR | | 14,154 | | 01/29/14 | | (112) |
| JPMorgan Chase | | USD | | 3,863 | | NOK | | 23,650 | | 01/15/14 | | 35 |
| JPMorgan Chase | | USD | | 3,642 | | NOK | | 21,509 | | 01/29/14 | | (99) |
| JPMorgan Chase | | USD | | 375 | | PLN | | 1,142 | | 01/29/14 | | 2 |
| JPMorgan Chase | | USD | | 1,060 | | PLN | | 3,235 | | 01/29/14 | | 9 |
| JPMorgan Chase | | USD | | 6,252 | | SEK | | 39,840 | | 01/29/14 | | (61) |
| JPMorgan Chase | | USD | | 3,177 | | TWD | | 92,809 | | 01/29/14 | | (61) |
| JPMorgan Chase | | USD | | 492 | | ZAR | | 4,907 | | 01/29/14 | | (26) |
| JPMorgan Chase | | AUD | | 18,164 | | USD | | 17,339 | | 01/29/14 | | 1,146 |
| JPMorgan Chase | | BRL | | 1,188 | | USD | | 525 | | 01/29/14 | | 25 |
| JPMorgan Chase | | BRL | | 9,322 | | USD | | 4,203 | | 01/29/14 | | 277 |
| JPMorgan Chase | | CAD | | 160 | | USD | | 153 | | 01/29/14 | | 3 |
| JPMorgan Chase | | CLP | | 1,812,046 | | USD | | 3,581 | | 01/29/14 | | 142 |
| JPMorgan Chase | | COP | | 728,778 | | USD | | 375 | | 01/29/14 | | (3) |
| JPMorgan Chase | | COP | | 6,724,816 | | USD | | 3,543 | | 01/29/14 | | 61 |
| JPMorgan Chase | | CZK | | 45,788 | | USD | | 2,457 | | 01/29/14 | | 150 |
| JPMorgan Chase | | EUR | | 29 | | USD | | 40 | | 01/02/14 | | — |
| JPMorgan Chase | | EUR | | 4,687 | | USD | | 6,369 | | 01/15/14 | | (78) |
| JPMorgan Chase | | EUR | | 1,690 | | USD | | 2,325 | | 01/29/14 | | 1 |
| JPMorgan Chase | | EUR | | 7,557 | | USD | | 10,440 | | 01/29/14 | | 44 |
| JPMorgan Chase | | GBP | | 1,847 | | USD | | 2,965 | | 01/29/14 | | (93) |
| JPMorgan Chase | | IDR 10,192,285 | | USD | | 917 | | 01/29/14 | | 83 |
| JPMorgan Chase | | IDR 57,400,597 | | USD | | 5,188 | | 01/29/14 | | 491 |
| JPMorgan Chase | | MXN | | 2,925 | | USD | | 223 | | 01/29/14 | | — |
See accompanying notes which are an integral part of the financial statements.
Core Bond Fund 101
Russell Investment Funds
Core Bond Fund
Schedule of Investments, continued — December 31, 2013
| Foreign Currency Exchange Contracts | | | | | | | | | | | | |
| Amounts in thousands | | | | | | | | | | | | |
| | | | | | | | | | | | | Unrealized |
| | | | | | | | | | | | | Appreciation |
| | | Amount | | Amount | | | | (Depreciation) |
| Counterparty | | | | Sold | | Bought | | Settlement Date | | $ |
| JPMorgan Chase | | NZD | | 1,614 | | USD | | 1,327 | | 01/29/14 | | 2 |
| JPMorgan Chase | | NZD | | 18,783 | | USD | | 15,521 | | 01/29/14 | | 99 |
| JPMorgan Chase | | PEN | | 315 | | USD | | 111 | | 01/29/14 | | (1) |
| JPMorgan Chase | | PEN | | 8,586 | | USD | | 3,070 | | 01/29/14 | | 14 |
| JPMorgan Chase | | RUB | | 26,454 | | USD | | 815 | | 01/29/14 | | 14 |
| JPMorgan Chase | | RUB | | 52,693 | | USD | | 1,634 | | 01/29/14 | | 39 |
| JPMorgan Chase | | SGD | | 5,970 | | USD | | 4,825 | | 01/29/14 | | 94 |
| JPMorgan Chase | | TRY | | 5,550 | | USD | | 2,764 | | 01/29/14 | | 196 |
| JPMorgan Chase | | ZAR | | 644 | | USD | | 65 | | 01/29/14 | | 4 |
| Morgan Stanley | | USD | | 5 | | BRL | | 11 | | 01/03/14 | | — |
| Morgan Stanley | | BRL | | 11 | | USD | | 5 | | 01/03/14 | | — |
| Royal Bank of Canada | | CAD | | 11,184 | | USD | | 10,501 | | 01/15/14 | | (25) |
| Royal Bank of Scotland | | AUD | | 3,210 | | USD | | 2,847 | | 01/15/14 | | (17) |
| Royal Bank of Scotland | | AUD | | 3,210 | | USD | | 2,848 | | 01/15/14 | | (16) |
| Royal Bank of Scotland | | AUD | | 3,210 | | USD | | 2,847 | | 01/17/14 | | (16) |
| Royal Bank of Scotland | | CHF | | 3,921 | | EUR | | 3,197 | | 01/15/14 | | 3 |
| Royal Bank of Scotland | | EUR | | 200 | | USD | | 272 | | 01/02/14 | | (3) |
| Royal Bank of Scotland | | EUR | | 4,614 | | USD | | 6,270 | | 01/15/14 | | (78) |
| Royal Bank of Scotland | | NOK | | 2,088 | | GBP | | 207 | | 01/15/14 | | (1) |
| UBS | | USD | | 3,286 | | CAD | | 3,487 | | 01/15/14 | | (5) |
| UBS | | USD | | 376 | | EUR | | 273 | | 01/15/14 | | (1) |
| UBS | | AUD | | 2,321 | | USD | | 2,102 | | 01/15/14 | | 32 |
| UBS | | CHF | | 1,048 | | EUR | | 854 | | 01/15/14 | | — |
| UBS | | NOK | | 16,173 | | GBP | | 1,604 | | 01/15/14 | | (9) |
| Total Unrealized Appreciation (Depreciation) on Open Foreign Currency Exchange Contracts | | | | | | | | 2,169 |
| |
| |
| |
| Index Swap Contracts | | | | | | | | | | | | |
| Amounts in thousands | | | | | | | | | | | | | |
| | | | | | | | | | | | | | Fair |
| Fund Receives | | | | Notional | | | | Termination | | Value |
| Underlying Security | | Counterparty | | Amount | | Terms | | Date | | $ |
| | | | | | | | | | 1 Month LIBOR plus | | | | |
| Barclays Capital U. S. Aggregate Bond Index | | Bank of America | | USD | | 5,063 | | | 0.120% | | 03/01/14 | | (30) |
| | | | | | | | | | 1 Month LIBOR plus | | | | |
| Barclays Capital U. S. Aggregate Bond Index | | Barclays | | USD | | 4,962 | | | 0.120% | | 03/01/14 | | (29) |
| | | | | | | | | | 1 Month LIBOR plus | | | | |
| Barclays Capital U. S. Aggregate Bond Index | | Barclays | | USD | | 1,975 | | | 0.120% | | 03/01/14 | | (12) |
| | | | | | | | | | 1 Month LIBOR plus | | | | |
| Barclays Capital U. S. Aggregate Bond Index | | Barclays | | USD | | 15,046 | | | 0.090% | | 04/01/14 | | (89) |
| | | | | | | | | | 1 Month LIBOR plus | | | | |
| Barclays Capital U. S. Aggregate Bond Index | | Barclays | | USD | | 40,401 | | | 0.090% | | 04/01/14 | | (237) |
| | | | | | | | | | 1 Month LIBOR plus | | | | |
| Barclays Capital U. S. Aggregate Bond Index | | Barclays | | USD | | 10,164 | | | 0.130% | | 09/01/14 | | (76) |
| | | | | | | | | | 1 Month LIBOR plus | | | | |
| Barclays Capital U. S. Aggregate Bond Index | | Barclays | | USD | | 10,043 | | | 0.080% | | 10/01/14 | | (59) |
| | | | | | | | | | 1 Month LIBOR plus | | | | |
| Barclays Capital U. S. Aggregate Bond Index | | Barclays | | USD | | 9,963 | | | 0.100% | | 10/31/14 | | (59) |
| Total Fair Value of Open Index Swap Contracts Premiums Paid (Received) - $ - (å) | | | | | | | | | | | (591) |
See accompanying notes which are an integral part of the financial statements.
102 Core Bond Fund
Russell Investment Funds Core Bond Fund
Schedule of Investments, continued — December 31, 2013
| Interest Rate Swaps | | | | | | | | | | | | | |
| |
| Amounts in thousands | | | | | | | | | | | | | |
| | | | | | | | | | | | | | Fair |
| | | | | | | | | | | | Termination | | Value |
| Counterparty | | Notional Amount | | Fund Receives | | Fund Pays | | Date | | $ |
| Bank of America | | BRL | | 100 | | 8.860 | % | | Brazil Interbank Deposit Rate | | 01/02/17 | | (3) |
| Bank of America | | MXN | | 1,000 | | 5.500 | % | | Mexico Interbank 28 Day Deposit Rate | | 09/13/17 | | 1 |
| Barclays | | MXN | | 700 | | 5.600 | % | | Mexico Interbank 28 Day Deposit Rate | | 09/06/16 | | 1 |
| Barclays | | MXN | | 5,000 | | 5.500 | % | | Mexico Interbank 28 Day Deposit Rate | | 09/13/17 | | 7 |
| Barclays | | USD | | 2,090 | | 3.145 | % | | Three Month LIBOR | | 03/15/26 | | (165) |
| Barclays | | USD | | 425 | | Three Month LIBOR | | 2.417% | | 11/15/27 | | 60 |
| Barclays | | USD | | 425 | | Three Month LIBOR | | 2.481% | | 11/15/27 | | 56 |
| Barclays | | USD | | 940 | | Three Month LIBOR | | 3.490% | | 03/15/46 | | 139 |
| Citigroup | | USD | | 2,600 | | 1.000 | % | | Federal Fund Effective Rate - 1 Year | | 10/15/17 | | (36) |
| Citigroup | | JPY | 169,999 | | Six Month LIBOR | | 1.000% | | 09/18/23 | | (18) |
| Citigroup | | USD | | 850 | | Three Month LIBOR | | 2.714% | | 08/15/42 | | 172 |
| Citigroup | | USD | | 685 | | Three Month LIBOR | | 3.676% | | 11/15/43 | | (33) |
| Credit Suisse | | USD | | 3,200 | | 1.500 | % | | Three Month LIBOR | | 12/16/16 | | (3) |
| Credit Suisse | | USD | | 3,800 | | 3.000 | % | | Three Month LIBOR | | 09/21/17 | | 19 |
| Goldman Sachs | | USD | | 11,900 | | 1.500 | % | | Three Month LIBOR | | 03/18/16 | | 79 |
| Goldman Sachs | | BRL | | 100 | | 9.095 | % | | Brazil Interbank Deposit Rate | | 01/02/17 | | (3) |
| Goldman Sachs | | USD | | 11,400 | | 3.000 | % | | Three Month LIBOR | | 09/21/17 | | 56 |
| Goldman Sachs | | USD | | 2,600 | | 1.000 | % | | Federal Fund Effective Rate - 1 Year | | 10/15/17 | | (36) |
| Goldman Sachs | | USD | | 2,270 | | 2.804 | % | | Three Month LIBOR | | 04/09/26 | | (247) |
| Goldman Sachs | | USD | | 1,020 | | Three Month LIBOR | | 3.125% | | 04/09/46 | | 214 |
| HSBC | | MXN | | 1,300 | | 5.600 | % | | Mexico Interbank 28 Day Deposit Rate | | 09/06/16 | | 3 |
| HSBC | | MXN | | 1,000 | | 5.500 | % | | Mexico Interbank 28 Day Deposit Rate | | 09/13/17 | | 1 |
| JPMorgan Chase | | HKD | | 19,900 | | Three Month HIBOR | | 1.085% | | 10/25/19 | | 139 |
| | | | | | | Six Month Singapore | | | | | | |
| JPMorgan Chase | | SGD | | 3,150 | | Offered Rate | | 1.315% | | 10/30/19 | | 92 |
| JPMorgan Chase | | HKD | | 1,050 | | Three Month HIBOR | | 1.260% | | 02/14/20 | | 7 |
| | | | | | | Six Month Singapore | | | | | | |
| JPMorgan Chase | | SGD | | 175 | | Offered Rate | | 1.440% | | 02/17/20 | | 5 |
| JPMorgan Chase | | HKD | | 2,300 | | Three Month HIBOR | | 1.140% | | 04/29/20 | | 19 |
| | | | | | | Six Month Singapore | | | | | | |
| JPMorgan Chase | | SGD | | 350 | | Offered Rate | | 1.185% | | 05/04/20 | | 16 |
| | | | | | | Six Month Singapore | | | | | | |
| JPMorgan Chase | | SGD | | 250 | | Offered Rate | | 2.120% | | 10/12/20 | | 1 |
| JPMorgan Chase | | HKD | | 1,700 | | Three Month HIBOR | | 2.160% | | 10/12/20 | | 2 |
| Morgan Stanley | | USD | | 3,600 | | 1.500 | % | | Three Month LIBOR | | 03/18/16 | | 24 |
| Morgan Stanley | | MXN | | 38,000 | | 5.500 | % | | Mexico Interbank 28 Day Deposit Rate | | 09/13/17 | | 52 |
| Morgan Stanley | | USD | | 1,700 | | 3.000 | % | | Three Month LIBOR | | 09/21/17 | | 8 |
| Morgan Stanley | | MXN | | 500 | | 6.350 | % | | Mexico Interbank 28 Day Deposit Rate | | 06/02/21 | | — |
| Morgan Stanley | | USD | | 7,400 | | Three Month LIBOR | | 3.500% | | 12/18/43 | | 588 |
| Total Fair Value on Open Interest Rate Swap Contracts Premiums Paid (Received) - $581 (å) | | | | 1,217 |
| Credit Default Swap Contracts | | | | | | | | | | | | |
| Amounts in thousands | | | | | | | | | | | | | | |
| Corporate Issues | | | | | | | | | | | | | | |
| | | | | Implied | | | | Fund (Pays)/ | | | | Fair |
| | | | | Credit | | Notional | | Receives | | Termination | | Value |
| Reference Entity | | Counterparty | | Spread | | Amount | | Fixed Rate | | Date | | $ |
| MetLife, Inc. | | Barclays | | 0.261 | % | | USD 1,700 | | 1.000 | % | | 09/20/15 | | 23 |
| Total Fair Value on Open Corporate Issues Premiums Paid (Received) - $18 | | | | | | | | | | | | 23 |
See accompanying notes which are an integral part of the financial statements.
Core Bond Fund 103
Russell Investment Funds
Core Bond Fund
Schedule of Investments, continued — December 31, 2013
| Credit Indices | | | | | | | | | | | | |
| | | | | | | | | Fund (Pays)/ | | | | Fair |
| | | | | Notional | | Receives | | Termination | | Value |
| Reference Entity | | Counterparty | | Amount | | Fixed Rate | | Date | | $ |
| CDX Emerging Markets Index | | Barclays | | USD | | 800 | | 5.000% | | 06/20/15 | | 25 |
| CDX Emerging Markets Index | | Deutsche Bank | | USD | | 900 | | 5.000% | | 06/20/15 | | 30 |
| CDX Emerging Markets Index | | Morgan Stanley | | USD | | 800 | | 5.000% | | 06/20/15 | | 25 |
| CDX Investment Grade Index | | Pershing | | USD | | 193 | | 0.548% | | 12/20/17 | | 3 |
| CDX NA Investment Grade Index | | JPMorgan Chase | | USD | | 386 | | 0.553% | | 12/20/17 | | 6 |
| iTraxx Europe Index | | Goldman Sachs | | EUR | | 500 | | 1.000% | | 12/20/18 | | 10 |
| Total Fair Value on Open Credit Indices Premiums Paid (Received) - $82 | | | | | | | | | | 99 |
| Sovereign Issues | | | | | | | | | | | | | | |
| | | | | Implied | | | | | | Fund (Pays)/ | | | | Fair |
| | | | | Credit | | Notional | | Receives | | Termination | | Value |
| Reference Entity | | Counterparty | | Spread | | Amount | | Fixed Rate | | Date | | $ |
| Brazil Government International Bond | | Barclays | | 0.776% | | USD | | 500 | | 1.000% | | 06/20/15 | | 2 |
| Brazil Government International Bond | | Deutsche Bank | | 0.776% | | USD | | 1,000 | | 1.000% | | 06/20/15 | | 4 |
| Brazil Government International Bond | | Goldman Sachs | | 0.776% | | USD | | 500 | | 1.000% | | 06/20/15 | | 2 |
| Brazil Government International Bond | | HSBC | | 0.895% | | USD | | 100 | | 1.000% | | 09/20/15 | | — |
| Brazil Government International Bond | | JPMorgan Chase | | 0.895% | | USD | | 100 | | 1.000% | | 09/20/15 | | — |
| Brazil Government International Bond | | Barclays | | 0.982% | | USD | | 700 | | 1.000% | | 12/20/15 | | 1 |
| Brazil Government International Bond | | Bank of America | | 1.051% | | USD | | 500 | | 1.000% | | 03/20/16 | | — |
| Brazil Government International Bond | | Credit Suisse | | 1.166% | | USD | | 200 | | 1.000% | | 06/20/16 | | (1) |
| Mexico Government International Bond | | HSBC | | 0.360% | | USD | | 500 | | 1.000% | | 03/20/16 | | 7 |
| United Kingdom Gilt | | Societe Generale | | 0.062% | | USD | | 200 | | 1.000% | | 03/20/15 | | 2 |
| Total Fair Value on Open Sovereign Issues Premiums Paid (Received) - ($13) | | | | | | | | | | | | 17 |
| Total Fair Value on Open Credit Default Swap Contracts Premiums Paid (Received) - $87 (å) | | | | | | | | | | 139 |
| Presentation of Portfolio Holdings | | | | | | | | | | | | | | | | | | | | |
| |
| Amounts in thousands | | | | | | | | | | | | | | | | | | | | |
| | | | | | | | | Fair Value | | | | | | | | | | |
| | | | | | | | | | | | | | | | | | | | % of Net |
| Portfolio Summary | | | | Level 1 | | | | Level 2 | | | | Level 3 | | | | Total | | | Assets |
| Long-Term Investments | | | | | | | | | | | | | | | | | | | | |
| Asset-Backed Securities | | $ | | — | | $ | | 47,835 | | $ | | 313 | | $ | | 48,148 | | | | 6 . 3 |
| Corporate Bonds and Notes | | | | — | | | | 77,270 | | | | 2,713 | | | | 79,983 | | | | 10 . 5 |
| International Debt | | | | — | | | | 40,302 | | | | 641 | | | | 40,943 | | | | 5 . 4 |
| Loan Agreements | | | | — | | | | 1,526 | | | | — | | | | 1,526 | | | | 0 . 2 |
| Mortgage-Backed Securities | | | | — | | | | 209,666 | | | | 2,003 | | | | 211,669 | | | | 27 . 7 |
| Municipal Bonds | | | | — | | | | 11,190 | | | | — | | | | 11,190 | | | | 1 . 5 |
| Non-US Bonds | | | | — | | | | 47,747 | | | | — | | | | 47,747 | | | | 6 . 2 |
| United States Government Agencies | | | | — | | | | 11,653 | | | | — | | | | 11,653 | | | | 1 . 5 |
| United States Government Treasuries | | | | — | | | | 109,789 | | | | — | | | | 109,789 | | | | 14 . 4 |
| Common Stocks | | | | | | | | | | | | | | | | | | | | |
| Utilities | | | | 349 | | | | — | | | | — | | | | 349 | | | | — * |
| Preferred Stocks | | | | 1,023 | | | | — | | | | 347 | | | | 1,370 | | | | 0 . 2 |
| Options Purchased | | | | — | | | | 463 | | | | — | | | | 463 | | | | 0 . 1 |
| Short-Term Investments | | | | — | | | | 239,073 | | | | — | | | | 239,073 | | | | 31 . 3 |
| Repurchase Agreements | | | | — | | | | 29,900 | | | | — | | | | 29,900 | | | | 3 . 9 |
| Total Investments | | | | 1,372 | | | | 826,414 | | | | 6,017 | | | | 833,803 | | | | 109 . 2 |
| Other Assets and Liabilities, Net | | | | | | | | | | | | | | | | | | | (9.2) |
| | | | | | | | | | | | | | | | | | | | | 100 . 0 |
See accompanying notes which are an integral part of the financial statements.
104 Core Bond Fund
Russell Investment Funds
Core Bond Fund
Schedule of Investments, continued — December 31, 2013
| Presentation of Portfolio Holdings | | | | | | | | | | | | | | | | | | | | |
| Amounts in thousands | | | | | | | | | | | | | | | | | | | | |
| | | | | | | Fair Value | | | | | | | | | | | | |
| | | | | | | | | | | | | | | | | | | % of Net |
| Portfolio Summary | | | Level 1 | | | Level 2 | | | | | | Level 3 | | | | Total | | Assets |
| Other Financial Instruments | | | | | | | | | | | | | | | | | | | | |
| Futures Contracts | | | (1,774 ) | | | — | | | | | | — | | | | (1,774 ) | | | | (0. 2) |
| Options Written | | | (9 ) | | | (200 ) | | | | | | (2 ) | | | | (211 ) | | | | (— *) |
| Foreign Currency Exchange Contracts | | | — | | | 2,169 | | | | | | — | | | | 2,169 | | | | 0 . 3 |
| Index Swaps | | | — | | | (591 ) | | | | | | — | | | | (591 ) | | | | (0. 1) |
| Interest Rate Swap Contracts | | | — | | | 636 | | | | | | — | | | | 636 | | | | 0 . 1 |
| Credit Default Swap Contracts | | | — | | | 52 | | | | | | — | | | | 52 | | | | — * |
| Total Other Financial Instruments** | | $ | (1,783 ) | | $ | 2,066 | | | | $ | | (2 ) | | $ | | 281 | | | | |
| * | Less than . 05% of net assets. |
| ** | Other financial instruments reflected in the Schedule of Investments, such as futures, forwards, interest rate swaps, and credit default swaps are valued at the |
unrealized appreciation/depreciation on the instruments.
For a description of the Levels see note 2 in the Notes to Financial Statements.
For disclosure on transfers between Levels 1, 2 and 3 during the period ended December 31, 2013, see note 2 in the Notes to Financial Statements.
Investments in which non broker quoted price source (Level 3) were used in determining a fair value for the period ended December 31, 2013 were less than 1% of net assets.
See accompanying notes which are an integral part of the financial statements.
Core Bond Fund 105
Russell Investment Funds
Core Bond Fund
Fair Value of Derivative Instruments — December 31, 2013
| Amounts in thousands | | | | | | | | | |
| |
| |
| | | | | Foreign | | | | |
| | | Credit | Currency | | Interest Rate |
| Derivatives not accounted for as hedging instruments | | Contracts | Contracts | | Contracts |
| Location: Statement of Assets and Liabilities - Assets | | | | | | | | | |
| Investments, at fair value* | | $ | — | | — | | $ | | 463 |
| Unrealized appreciation on foreign currency exchange contracts | | | — | | 3,438 | | | | — |
| Variation margin on futures contracts** | | | — | | — | | | | 663 |
| Interest rate swap contracts, at fair value | | | — | | — | | | | 1,761 |
| Credit default swap contracts, at fair value | | | 140 | | — | | | | — |
| Total | | $ | 140 | | 3,438 | | $ | | 2,887 |
| | | | | | | | | | |
| Location: Statement of Assets and Liabilities - Liabilities | | | | | | | | | |
| Variation margin on futures contracts** | | $ | — | | — | | $ | | 2,437 |
| Unrealized depreciation on foreign currency exchange contracts | | | — | | 1,269 | | | | — |
| Options written, at fair value | | | — | | — | | | | 211 |
| Index swap contracts, at fair value | | | — | | — | | | | 591 |
| Interest rate swap contracts, at fair value | | | — | | — | | | | 544 |
| Credit default swap contracts, at fair value | | | 1 | | — | | | | — |
| Total | | $ | 1 | | 1,269 | | $ | | 3,783 |
| |
| | | | | Foreign | | | | |
| | | Credit | Currency | | Interest Rate |
| Derivatives not accounted for as hedging instruments | | Contracts | Contracts | | Contracts |
| Location: Statement of Operations - Net realized gain (loss) | | | | | | | | | |
| Investments*** | | $ | — | $ | — | | $ | | 72 |
| Futures contracts | | | — | | — | | | | (212) |
| Options written | | | — | | — | | | | 384 |
| Index swap contracts | | | — | | — | | | | (1,273) |
| Interest rate swap contracts | | | — | | — | | | | (1,139) |
| Credit default swap contracts | | | 529 | | — | | | | — |
| Foreign currency-related transactions**** | | | — | | (2,641) | | | | — |
| Total | | $ | 529 | $ (2,641) | | $ (2,168) |
| | | | | | | | | | |
| Location: Statement of Operations - Net change in unrealized appreciation (depreciation) | | | | | | | | | |
| Investments***** | | $ | — | $ | — | | $ | | 170 |
| Futures contracts | | | — | | — | | | | (1,527) |
| Options written | | | — | | — | | | | (57) |
| Index swap contracts | | | — | | — | | | | (483) |
| Interest rate swap contracts | | | — | | — | | | | 543 |
| Credit default swap contracts | | | (273) | | — | | | | — |
| Foreign currency-related transactions****** | | | — | | 2,624 | | | | — |
| Total | | $ | (273) | $ | 2,624 | | $ (1,354) |
| |
| * Fair value of purchased options. | | | | | | | | | |
| ** | Includes cumulative appreciation/depreciation of futures contracts as reported in the Schedule of Investments. Only variation margin is reported within the Statement of Assets and Liabilities. |
| *** | Includes net realized gain (loss) on purchased options as reported in the Statement of Operations. |
| **** | Only includes net realized gain (loss) on forward and spot contracts. May differ from the net realized gain (loss) on foreign currency-related transactions reported within the Statement of Operations. |
| ***** | Includes net unrealized gain (loss) on purchased options as reported in the Schedule of Investments. |
| ****** | Only includes change in unrealized gain (loss) on forward and spot contracts. May differ from the net change in unrealized gain (loss) on foreign currency-related transactions reported within the Statement of Operations. |
For further disclosure on derivatives see note 2 in the Notes to Financial Statements.
See accompanying notes which are an integral part of the financial statements.
106 Core Bond Fund
Russell Investment Funds
Core Bond Fund
Balance Sheet Offsetting of Financial and Derivative Instruments —
December 31, 2013
| Amounts in thousands | | | | | | | | | | | | | | |
| |
| Offsetting of Financial Assets and Derivative Assets | | | | | | | | | | | | |
| | | | | | | | | Gross | | Net Amounts |
| | | | | | | | | Amounts | | of Assets |
| | | | | | | Gross | | Offset in the | | Presented in |
| | | | | Amounts of | | Statement of | | the Statement |
| | | | | Recognized | | Assets and | | of Assets and |
| Description | | Location: Statement of Assets and Liabilities - Assets | | | | Assets | | Liabilities | | Liabilities |
| Options Purchased Contracts* | | Investments, at fair value | | $ | | 463 | | $ | | — | | $ | | 463 |
| Repurchase Agreements** | | Investments, at fair value | | | | 29,900 | | | | — | | | | 29,900 |
| Foreign Currency Exchange Contracts | | Unrealized appreciation on foreign currency exchange contracts | | | | 3,438 | | | | — | | | | 3,438 |
| Futures Contracts*** | | Variation margin on futures contracts | | | | 663 | | | | — | | | | 663 |
| Interest Rate Swap Contracts | | Interest rate swap contracts, at fair value | | | | 1,761 | | | | — | | | | 1,761 |
| Credit Default Swap Contracts | | Credit default swap contracts, at fair value | | | | 140 | | | | — | | | | 140 |
| Total | | | | $ | | 36,365 | | $ | | — | | $ | | 36,365 |
| | | | | | | | | | | | | | | |
| Financial Assets, Derivative Assets, and Collateral Held by Counterparty | | | | | | | | | | | | |
| | | | | | | Gross Amounts Not Offset in | |
| | | | | | | the Statement of Assets and | |
| | | | | | | | Liabilities | | | | | |
| | | Net Amounts | | | | | | | | | | |
| | | | | of Assets | | | | | | | | | | |
| | | Presented in | | | | | | | | | | |
| | | the Statement | | Financial and | | | | | | | |
| | | of Assets and | | Derivative | | | Collateral | | |
| Counterparty | | | | Liabilities | | Instruments | | | Received Net Amount |
| Bank of America | | $ | | 51 | | $ | 35 | $ | — | $ | 16 |
| Barclays | | | | 4,050 | | | 166 | | 3,000 | | 884 |
| BNP Paribas | | | | 12 | | | 1 | | — | | 11 |
| Citigroup | | | | 392 | | | 88 | | 21 | | 283 |
| Credit Suisse | | | | 12,052 | | | 17 | | 12,019 | | 16 |
| Deutsche Bank | | | | 197 | | | 44 | | — | | 153 |
| Goldman Sachs | | | | 420 | | | 229 | | 161 | | 30 |
| HSBC | | | | 53 | | | — | | — | | 53 |
| JPMorgan Chase | | | | 10,836 | | | 695 | | 10,034 | | 107 |
| Morgan Stanley | | | | 8,263 | | | 45 | | 8,054 | | 164 |
| Pershing | | | | 3 | | | — | | — | | 3 |
| Royal Bank of Scotland | | | | 3 | | | 3 | | — | | — |
| Societe Generale | | | | 2 | | | — | | — | | 2 |
| UBS | | | | 31 | | | 14 | | — | | 17 |
| Total | | $ | | 36,365 | | $ | 1,337 | $ | 33,289 | $ | 1,739 |
| | | | | | | | | | | | | | | |
Balance Sheet Offsetting of Financial and Derivative Instruments 107
Russell Investment Funds
Core Bond Fund
Balance Sheet Offsetting of Financial and Derivative Instruments, continued —December 31, 2013
| Amounts in thousands | | | | | | | | | | | | | | |
| |
| Offsetting of Financial Liabilities and Derivative Liabilities | | | | | | | | | | | | |
| | | | | | | | | Gross | | Net Amounts |
| | | | | | | | | Amounts | | of Liabilities |
| | | | | Gross | | Offset in the | | Presented in |
| | | | | Amounts of | | Statement of | | the Statement |
| | | | | Recognized | | Assets and | | of Assets and |
| Description | | Location: Statement of Assets and Liabilities - Liabilities | | Liabilities | | Liabilities | | Liabilities |
| Futures Contracts*** | | Variation margin on futures contracts | | $ | | 2,437 | | $ | | — | | $ | | 2,437 |
| Foreign Currency Exchange Contracts | | Unrealized depreciation on foreign currency exchange contracts | | | | 1,269 | | | | — | | | | 1,269 |
| Options Written Contracts | | Options written, at fair value | | | | 211 | | | | — | | | | 211 |
| Index Swap Contracts | | Index swap contracts, at fair value | | | | 591 | | | | — | | | | 591 |
| Interest Rate Swap Contracts | | Interest rate swap contracts, at fair value | | | | 544 | | | | — | | | | 544 |
| Credit Default Swap Contracts | | Credit default swap contracts, at fair value | | | | 1 | | | | — | | | | 1 |
| Total | | | | $ | | 5,053 | | $ | | — | | $ | | 5,053 |
| | | | | | | | | | | | | | | | | | |
| |
| |
| Financial Liabilities, Derivative Liabilities, and Collateral Pledged by Counterparty | | | | | | | | | | | | | | |
| | | | | | Gross Amounts Not Offset in | | |
| | | | | | the Statement of Assets and | | |
| | | | | | | | Liabilities | | | | | | | |
| | | Net Amounts | | | | | | | | | | | | | | |
| | | of Liabilities | | | | | | | | | | | | | | |
| | | Presented in | | | | | | | | | | | | | | |
| | | the Statement | | Financial and | | | | | | | | | | |
| | | of Assets and | | Derivative | | Collateral | | | | | |
| Counterparty | | | Liabilities | | Instruments | | Pledged | | Net Amount |
| Bank of America | | $ | 292 | | $ | | 35 | $ | | 257 | $ | | — |
| Barclays | | | 752 | | | | 166 | | | 586 | | | — |
| BNP Paribas | | | 2 | | | | 1 | | | — | | | 1 |
| Citigroup | | | 167 | | | | 88 | | | 79 | | | — |
| Credit Suisse | | | 17 | | | | 17 | | | — | | | — |
| Deutsche Bank | | | 110 | | | | 44 | | | — | | | 66 |
| Goldman Sachs | | | 1,590 | | | | 229 | | | 1,361 | | | — |
| HSBC | | | 179 | | | | — | | | — | | | 179 |
| JPMorgan Chase | | | 738 | | | | 695 | | | — | | | 43 |
| Morgan Stanley | | | 1,036 | | | | 45 | | | 991 | | | — |
| Royal Bank of Canada | | | 25 | | | | — | | | — | | | 25 |
| Royal Bank of Scotland | | | 131 | | | | 3 | | | — | | | 128 |
| UBS | | | 14 | | | | 14 | | | — | | | — |
| Total | | $ | 5,053 | | $ | | 1,337 | $ | | 3,274 | $ | | 442 |
| | | | | | | | | | | | | | | | | | |
| * | Fair value of options purchased as reported in the Schedule of Investments. |
| ** | Fair value of repurchase agreements as reported in the Schedule of Investments. |
| *** | Includes cumulative appreciation/depreciation of futures contracts as reported in the Schedule of Investments. |
Only variation margin is reported within the Statement of Assets and Liabilities.
For further disclosure on derivatives and counterparty risk see note 2 in the Notes to Financial Statements.
108 Balance Sheet Offsetting of Financial and Derivative Instruments
Russell Investment Funds
Core Bond Fund
Statement of Assets and Liabilities — December 31, 2013
| Amounts in thousands | | |
| Assets | | |
| Investments, at identified cost | $ | 830,373 |
| Investments, at fair value(*)(>) | | 833,803 |
| Cash | | 1,315 |
| Cash (restricted)(a)(b) | | 4,281 |
| Foreign currency holdings(^) | | 972 |
| Unrealized appreciation on foreign currency exchange contracts | | 3,438 |
| Receivables: | | |
| Dividends and interest | | 3,943 |
| Dividends from affiliated Russell funds | | 13 |
| Investments sold | | 29,257 |
| Fund shares sold | | 192 |
| Investments matured(~) | | 1 |
| Variation margin on futures contracts | | 2,085 |
| Interest rate swap contracts, at fair value(•) | | 1,761 |
| Credit default swap contracts, at fair value(+) | | 140 |
| Total assets | | 881,201 |
| |
| Liabilities | | |
| Payables: | | |
| Due to broker (c) | | 756 |
| Investments purchased | | 113,027 |
| Fund shares redeemed | | 50 |
| Accrued fees to affiliates | | 359 |
| Other accrued expenses | | 146 |
| Variation margin on futures contracts | | 346 |
| Unrealized depreciation on foreign currency exchange contracts | | 1,269 |
| Options written, at fair value(x) | | 211 |
| Index swap contracts, at fair value(∞) | | 591 |
| Interest rate swap contracts, at fair value(•) | | 544 |
| Credit default swap contracts, at fair value(+) | | 1 |
| Total liabilities | | 117,300 |
| |
| Net Assets | $ | 763,901 |
See accompanying notes which are an integral part of the financial statements.
Core Bond Fund 109
Russell Investment Funds
Core Bond Fund
Statement of Assets and Liabilities, continued — December 31, 2013
| Amounts in thousands | | |
| Net Assets Consist of: | | |
| Undistributed (overdistributed) net investment income | $ | (886) |
| Accumulated net realized gain (loss) | | (1,775) |
| Unrealized appreciation (depreciation) on: | | |
| Investments . | | 3,430 |
| Futures contracts | | (1,774) |
| Options written | | 153 |
| Index swap contracts | | (591) |
| Interest rate swap contracts | | 636 |
| Credit default swap contracts | | 52 |
| Investments matured | | (54) |
| Foreign currency-related transactions | | 2,179 |
| Shares of beneficial interest | | 730 |
| Additional paid-in capital | | 761,801 |
| Net Assets | $ | 763,901 |
| Net Asset Value, offering and redemption price per share: | | |
| Net asset value per share:(#) | $ | 10 . 46 |
| Net assets | $ | 763,901,097 |
| Shares outstanding ($. 01 par value) | | 72,998,573 |
| Amounts in thousands | | |
| (^) Foreign currency holdings - cost | $ | 962 |
| (x) Premiums received on options written | $ | 364 |
| (+) Credit default swap contracts - premiums paid (received) | $ | 87 |
| (•) Interest rate swap contracts - premiums paid (received) | $ | 581 |
| (~) Investments matured - cost | $ | 55 |
| (>) Investments in affiliates, Russell U. S. Cash Management Fund | $ | 176,390 |
| (∞) Index swap contracts - premiums paid (received) | $ | — |
| (a) Cash Collateral for Futures | $ | 2,142 |
| (b) Cash Collateral for Swaps | $ | 2,139 |
| (c) Due to Broker for Swaps | $ | 756 |
| (#) Net asset value per share equals net assets divided by shares of beneficial interest outstanding. | | |
See accompanying notes which are an integral part of the financial statements.
110 Core Bond Fund
Russell Investment Funds
Core Bond Fund
Statement of Operations — For the Period Ended December 31, 2013
| Amounts in thousands | | |
| Investment Income | | |
| Dividends | $ | 34 |
| Dividends from affiliated Russell funds | | 155 |
| Interest | | 16,587 |
| Total investment income | | 16,776 |
| |
| Expenses | | |
| Advisory fees | | 3,921 |
| Administrative fees | | 356 |
| Custodian fees | | 253 |
| Transfer agent fees | | 31 |
| Professional fees | | 123 |
| Trustees’ fees | | 18 |
| Printing fees | | 43 |
| Miscellaneous | | 43 |
| Expenses before reductions | | 4,788 |
| Expense reductions | | (356) |
| Net expenses | | 4,432 |
| Net investment income (loss) | | 12,344 |
| |
| Net Realized and Unrealized Gain (Loss) | | |
| Net realized gain (loss) on: | | |
| Investments . | | (583) |
| Futures contracts | | (212) |
| Options written | | 384 |
| Index swap contracts | | (1,273) |
| Interest rate swap contracts | | (1,139) |
| Credit default swap contracts | | 529 |
| Foreign currency-related transactions | | (2,682) |
| Net realized gain (loss) | | (4,976) |
| Net change in unrealized appreciation (depreciation) on: | | |
| Investments | | (18,730) |
| Futures contracts | | (1,527) |
| Options written | | (57) |
| Index swap contracts | | (483) |
| Interest rate swap contracts | | 543 |
| Credit default swap contracts | | (273) |
| Investment matured | | (55) |
| Foreign currency-related transactions | | 2,617 |
| Net change in unrealized appreciation (depreciation) | | (17,965) |
| Net realized and unrealized gain (loss) | | (22,941) |
| Net Increase (Decrease) in Net Assets from Operations | $ | (10,597) |
See accompanying notes which are an integral part of the financial statements.
Core Bond Fund 111
Russell Investment Funds
Core Bond Fund
Statements of Changes in Net Assets
| | | For the Periods Ended December 31, |
| Amounts in thousands | | 2013 | | 2012 |
| Increase (Decrease) in Net Assets | | | | | | |
| Operations | | | | | | |
| Net investment income (loss) | | $ | 12,344 | | $ | 14,225 |
| Net realized gain (loss) | | | (4,976) | | | 15,276 |
| Net change in unrealized appreciation (depreciation) | | | (17,965) | | | 18,790 |
| Net increase (decrease) in net assets from operations | | | (10,597) | | | 48,291 |
| |
| Distributions | | | | | | |
| From net investment income | | | (10,239) | | | (14,526) |
| From net realized gain | | | (2,007) | | | (16,006) |
| Net decrease in net assets from distributions | | | (12,246) | | | (30,532) |
| |
| Share Transactions* | | | | | | |
| Net increase (decrease) in net assets from share transactions | | | 110,726 | | | 112,651 |
| Total Net Increase (Decrease) in Net Assets | | | 87,883 | | | 130,410 |
| |
| Net Assets | | | | | | |
| Beginning of period | | | 676,018 | | | 545,608 |
| End of period | | $ | 763,901 | | $ | 676,018 |
| Undistributed (overdistributed) net investment income included in net assets | | $ | (886) | | $ | 122 |
See accompanying notes which are an integral part of the financial statements.
112 Core Bond Fund
Russell Investment Funds
Core Bond Fund
* Share transaction amounts (in thousands) for the periods ended December 31, 2013 and December 31, 2012 were as follows:
| | | | | 2013 | | | | | 2012 | |
| | | | | Shares | | | Dollars | | | | Shares | | | Dollars |
| |
| Proceeds from shares sold | | | | 13,149 | | $ | 139,458 | | | | 11,229 | | $ | 121,112 |
| Proceeds from reinvestment of distributions | | | | 1,157 | | | 12,244 | | | | 2,840 | | | 30,526 |
| Payments for shares redeemed | | | | (3,859) | | | (40,976) | | | | (3,608) | | | (38,987) |
| Total increase (decrease) | | | | 10,447 | | $ | 110,726 | | | | 10,461 | | $ | 112,651 |
| | | | | | | | | | | | | | | |
See accompanying notes which are an integral part of the financial statements.
Core Bond Fund 113
Russell Investment Funds
Core Bond Fund
Financial Highlights — For the Periods Ended
| For a Share Outstanding Throughout Each Period. | | | | | | |
| |
| | | $ | | $ | | | $ | | $ | $ | | $ |
| | Net Asset Value, | | Net | | | Net Realized | | Total from | Distributions | | Distributions |
| | | Beginning of | | Investment | | | and Unrealized | | Investment | from Net | | from Net |
| | | Period | Income(Loss) (a)(b) | | | Gain (Loss) | | Operations | Investment Income | | Realized Gain |
| December 31, 2013 | | 10 . 81 | | . 18 | | | ( . 35) | | ( . 17) | ( . 15) | | ( . 03) |
| December 31, 2012 | | 10 . 47 | | . 25 | | | . 61 | | . 86 | ( . 25) | | ( . 27) |
| December 31, 2011 | | 10 . 51 | | . 35 | | | . 14 | | . 49 | ( . 34) | | ( . 19) |
| December 31, 2010 | | 10 . 20 | | . 37 | | | . 63 | | 1 . 00 | ( . 40) | | ( . 29) |
| December 31, 2009 | | 9 . 33 | | . 44 | | | 1 . 02 | | 1 . 46 | ( . 46) | | ( . 13) |
See accompanying notes which are an integral part of the financial statements.
114 Core Bond Fund
| | | | | | | | | | % | % | | % | |
| | | | $ | | | | $ | Ratio of Expenses | Ratio of Expenses | | Ratio of Net | |
| | | Net Asset Value, | | % | | Net Assets, | | to Average | to Average | Investment Income | % |
| | $ | | End of | | Total | | End of Period | | Net Assets, | Net Assets, | | to Average | Portfolio |
| Total Distributions | | Period | | Return(d) | | (000) | | Gross | Net(b) | | Net Assets(b) | Turnover Rate |
| | ( . 18) | | 10 . 46 | | (1 . 55) | | 763,901 | | . 67 | . 62 | | 1 . 73 | 133 |
| | ( . 52) | | 10 . 81 | | 8 . 38 | | 676,018 | | . 72 | . 66 | | 2 . 32 | 192 |
| | ( . 53) | | 10 . 47 | | 4 . 68 | | 545,608 | | . 72 | . 65 | | 3 . 29 | 203 |
| | ( . 69) | | 10 . 51 | | 10 . 02 | | 471,898 | | . 75 | . 68 | | 3 . 48 | 195 |
| | ( . 59) | | 10 . 20 | | 16 . 18 | | 400,569 | | . 73 | . 66 | | 4 . 49 | 151 |
See accompanying notes which are an integral part of the financial statements.
Core Bond Fund 115
Russell Investment Funds
Global Real Estate Securities Fund
Portfolio Management Discussion and Analysis — December 31, 2013 (Unaudited)
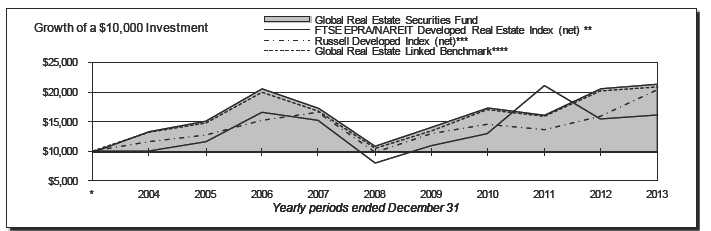
| Global Real Estate Securities Fund | | | Russell Developed Index (Net) *** | |
| | Total | | | Total |
| | Return | | | Return |
| 1 Year | 3 . 65% | | 1 Year | 3 . 67% |
| 5 Years | 14 . 26%§ | | 5 Years | 14 . 89%§ |
| 10 Years | 7 . 94%§ | | 10 Years | 7 . 67%§ |
| |
| |
| FTSE EPRA/NAREIT Developed Real Estate Index (net)** | | Global Real Estate Linked Benchmark**** | |
| | Total | | | Total |
| | Return | | | Return |
| 1 Year | 3 . 67% | | 1 Year | 21 . 68% |
| 5 Years | 15 . 24%§ | | 5 Years | 13 . 10%§ |
| 10 Years | N /A | | 10 Years | 7 . 33%§ |
116 Global Real Estate Securities Fund
Russell Investment Funds
Global Real Estate Securities Fund
Portfolio Management Discussion and Analysis, continued — December 31, 2013
(Unaudited)
| The Global Real Estate Securities Fund (the “Fund”) employs | | led relative to investor companies. From a regional perspective, |
| a multi-manager approach whereby portions of the Fund | | Europe outperformed relative to North America and the Asia- |
| are allocated to different money managers. Fund assets not | | Pacific region. With respect to property sectors, the shorter lease |
| allocated to money managers are managed by Russell Investment | | duration categories, including lodging and storage, generally |
| Management Company (“RIMCo”), the Fund’s advisor. RIMCo | | delivered the strongest performance, while the more defensive, |
| may change the allocation of the Fund’s assets among money | | yield-oriented health care sector was among the weakest- |
| managers at any time. An exemptive order from the Securities | | performing property types. |
| and Exchange Commission (“SEC”) permits RIMCo to engage | | |
| or terminate a money manager at any time, subject to approval | | How did the investment strategies and techniques employed |
| by the Fund’s Board, without a shareholder vote. Pursuant to the | | by the Fund and its money managers affect its benchmark |
| terms of the exemptive order, the Fund is required to notify its | | relative performance? |
| shareholders within 90 days of when a money manager begins | | AEW Capital Management, L. P. (“AEW”) modestly outperformed |
| providing services. As of December 31, 2013, the Fund had three | | the Fund’s benchmark for the fiscal year. AEW utilizes a value- |
| money managers. | | oriented strategy that integrates quantitative analysis with |
| | | property and capital markets expertise. Effective stock selection |
| What is the Fund’s investment objective? | | within Singapore, Hong Kong, and the U. S. diversified and |
| The Fund seeks to provide current income and long term capital | | storage sectors drove outperformance, overwhelming the negative |
| growth. | | effect of stock selection in the U. S. office sector. From a regional |
| |
| How did the Fund perform relative to its benchmark for the | | allocation perspective, detractors from performance included out |
| fiscal year ended December 31, 2013? | | of benchmark exposure to Brazil and an overweight to Singapore. |
| |
| For the fiscal year ended December 31, 2013, the Fund gained | | Cohen & Steers Capital Management, Inc. (“Cohen”) |
| 3.65%. This is compared to the Fund’s benchmark, the FTSE | | outperformed the Fund’s benchmark for the fiscal year. Cohen |
| EPRA/NAREIT Developed Real Estate Index (Net), which gained | | invests in a portfolio of companies that it believes are mispriced |
| 3.67% during the same period. The Fund’s performance includes | | relative to net asset value and cash flow estimates. Cohen seeks to |
| operating expenses, whereas index returns are unmanaged and do | | generate excess returns through a combination of bottom-up stock |
| not include expenses of any kind. | | selection and top-down regional allocation decisions. Key drivers |
| For the fiscal year ended December 31, 2013, the Lipper® Global | | of performance were stock selection within the U. S. residential |
| Real Estate Funds Average, a group of funds that Lipper considers | | sector and an underweight to health care REITs. Stock selection in |
| to have investment strategies similar to those of the Fund, gained | | Hong Kong and Continental Europe detracted from performance. |
| 1.48%. This result serves as a peer comparison and is expressed | | |
| net of operating expenses. | | INVESCO Advisers, Inc. (“Invesco”) marginally outperformed |
| | | the Fund’s benchmark for the fiscal year. Invesco manages a |
| How did the market conditions described in the Market | | broadly diversified portfolio with a focus on companies that it |
| Summary report affect the Fund’s performance? | | believes are operating in the most attractive markets with quality |
| For the fiscal year ended December 31, 2013, the global listed | | assets, strong management teams, and sound balance sheets. |
| property market, as measured by the FTSE EPRA/NAREIT | | Invesco’s investment style incorporates fundamental property |
| Developed Real Estate Index (Net), delivered a 3.67% return. | | market research and bottom-up quantitative securities analysis. |
| Real estate securities began the fiscal year in an environment of | | Security selection, particularly within Japan and Canada, had a |
| relative optimism, supported by low interest rates and global macro- | | positive impact on benchmark relative performance. With respect |
| economic stability. However, concerns arose in May with indications | | to property type, an overweight to the U. S. residential sector |
| that the U. S. Federal Reserve might scale back its quantitative | | detracted from performance. Regional allocation had a negative |
| easing policy sooner than expected. As bond yields increased, | | effect on performance due to an underweight position in Europe. |
| the property sector sold off sharply before staging a gradual and | | |
| uneven recovery, significantly underperforming relative to the | | RIMCo manages the portion of the Fund’s assets that RIMCo |
| broader equity market during the second half of the fiscal year. | | determines not to allocate to the money managers. Assets |
| | | not allocated to managers include the Fund’s liquidity |
| Within the global property securities market, higher-beta stocks | | reserves and assets which may be managed directly by |
| (stocks with high sensitivity to market movements) and more | | RIMCo to modify the Fund’s overall portfolio characteristics |
| highly levered companies tended to outperform relative to lower | | to seek to achieve the desired risk/return profile for the Fund. |
| beta and low leverage companies, while property developers | | |
Global Real Estate Securities Fund 117
Russell Investment Funds
Global Real Estate Securities Fund
Portfolio Management Discussion and Analysis, continued — December 31, 2013
(Unaudited)
| During the period, RIMCo introduced a strategy to | | Money Managers as of December 31, | | |
| implement regional tilting through the direct purchase of | | 2013 | | Styles |
| real estate stocks. The strategy underperformed relative | | | | |
| | | AEW Capital Management, L. P. | | Value |
| to the Fund’s benchmark as a result of an underweight to | | Cohen & Steers Capital Management, Inc. | | Market-Oriented |
| Japan, which was among the stronger markets globally. | | INVESCO Advisers, Inc. which acts as a | | Market-Oriented |
| | | money manager to the Fund through its | | |
| During the period, the Fund used index futures contracts | | INVESCO Real Estate Division | | |
| to equitize the Fund’s cash. The use of these derivatives | | | | |
| had a modestly positive impact on performance, as | | The views expressed in this report reflect those of the |
| equity markets delivered positive returns ahead of cash. | | portfolio managers only through the end of the period |
| | | covered by the report. These views do not necessarily |
| Describe any changes to the Fund’s structure or the money | | represent the views of RIMCo or any other person in RIMCo |
| manager line-up. | | or any other affiliated organization. These views are |
| There were no changes to the money manager | | subject to change at any time based upon market conditions |
| lineup during the fiscal year. In June, 2013, RIMCo | | or other events, and RIMCo disclaims any responsibility to |
| implemented the regional tilting strategy described above. | | update the views contained herein. These views should not |
| | | be relied on as investment advice and, because investment |
| | | decisions for a Russell Investment Funds (“RIF”) Fund are |
| | | based on numerous factors, should not be relied on as an |
| | | indication of investment decisions of any RIF Fund. |
| * | Assumes initial investment on January 1, 2004. |
| ** | The FTSE EPRA/NAREIT Developed Real Estate Index (net) is an index composed of all the data based on the last closing price of the month for all tax- qualified REITs listed on the New York Stock exchange, American Stock Exchange, and the NASDAQ National Market System. The data is market value- weighted. The total-return calculation is based upon whether it is 1-month, 3-months or 12-months. Only those REITs listed for the entire period are used in the total return calculation. FTSE EPRA/NAREIT Developed Real Estate Index (net) is designed to represent general trends in eligible listed real estate stocks worldwide. Relevant real estate activities are defined as the ownership, trading and development of income-producing real estate. The index also includes a range of regional and country indices, Dividend+ indices, Global Sectors, Investment Focus, and a REITs and Non-REITs series. |
| *** | The Russell Developed Index (Net) measures the performance of the investable securities in developed countries globally. |
| **** | The Global Real Estate Linked Benchmark represents the return of the FTSE EPRA/NAREIT Equity REIT Index through September 30, 2010 and the returns of the FTSE EPRA/NAREIT Developed Real Estate Index (net) thereafter. The Global Real Estate Linked Benchmark provides a means to compare the Fund’s average annual returns to a secondary benchmark that takes into account historical changes in the Fund’s primary benchmark. |
| § | Annualized. |
The performance shown in this section does not reflect any Insurance Company Separate Account or Policy Charges. Performance is historical and assumes reinvestment of all dividends and capital gains. Investment return and principal value will fluctuate so that an investor’s shares, when redeemed, may be worth more or less than when purchased. Past performance is not indicative of future results.
118 Global Real Estate Securities Fund
Russell Investment Funds
Global Real Estate Securities Fund
Shareholder Expense Example — December 31, 2013 (Unaudited)
| Fund Expenses | | Please note that the expenses shown in the table are meant |
| The following disclosure provides important information | | to highlight your ongoing costs only and do not reflect any |
| regarding the Fund’s Shareholder Expense Example | | transactional costs. Therefore, the information under the heading |
| (“Example”) . | | “Hypothetical Performance (5% return before expenses)” is |
| | | useful in comparing ongoing costs only, and will not help you |
| Example | | determine the relative total costs of owning different funds. In |
| As a shareholder of the Fund, you incur two types of costs: (1) | | addition, if these transactional costs were included, your costs |
| transaction costs, and (2) ongoing costs, including advisory and | | would have been higher. The fees and expenses shown in this |
| administrative fees and other Fund expenses. The Example is | | section do not reflect any Insurance Company Separate Account or Policy Charges. |
| intended to help you understand your ongoing costs (in dollars) | | | | | | | | | | | | | |
| of investing in the Fund and to compare these costs with the | | | | | | | | | | | Hypothetical |
| ongoing costs of investing in other mutual funds. The Example | | | | | | | | Actual | | | Performance (5% |
| is based on an investment of $1,000 invested at the beginning of | | | | | | | | Performance | | | return before expenses) |
| the period and held for the entire period indicated, which for this | | | | | | | | | | | |
| | | Beginning Account Value | | | | | | | | | | | |
| Fund is from July 1, 2013 to December 31, 2013. | | July 1, 2013 | | | | $ | | 1,000.00 | | | $ | | 1,000.00 |
| Actual Expenses | | Ending Account Value | | | | | | | | | | | |
| | | December 31, 2013 | | | | $ | | 1,023.50 | | | $ | | 1,020.52 |
| The information in the table under the heading “Actual | | Expenses Paid During Period* | | | | $ | | 4.74 | | | $ | | 4.74 |
| Performance” provides information about actual account values | | | | | | | | | | | | | |
| and actual expenses. You may use the information in this column, | | * Expenses are equal to the Fund's annualized expense ratio of 0.93% |
| | | (representing the six month period annualized), multiplied by the average |
| together with the amount you invested, to estimate the expenses | | account value over the period, multiplied by 184/365 (to reflect the one-half |
| that you paid over the period. Simply divide your account value by | | year period) . | | | | | | | | | | | |
| $1,000 (for example, an $8,600 account value divided by $1,000 | | | | | | | | | | | | | |
| = 8.6), then multiply the result by the number in the first column | | | | | | | | | | | | | |
| in the row entitled “Expenses Paid During Period” to estimate | | | | | | | | | | | | | |
| the expenses you paid on your account during this period. | | | | | | | | | | | | | |
| |
| Hypothetical Example for Comparison Purposes | | | | | | | | | | | | | |
| The information in the table under the heading “Hypothetical | | | | | | | | | | | | | |
| Performance (5% return before expenses)” provides information | | | | | | | | | | | | | |
| about hypothetical account values and hypothetical expenses | | | | | | | | | | | | | |
| based on the Fund’s actual expense ratio and an assumed rate of | | | | | | | | | | | | | |
| return of 5% per year before expenses, which is not the Fund’s | | | | | | | | | | | | | |
| actual return. The hypothetical account values and expenses | | | | | | | | | | | | | |
| may not be used to estimate the actual ending account balance or | | | | | | | | | | | | | |
| expenses you paid for the period. You may use this information | | | | | | | | | | | | | |
| to compare the ongoing costs of investing in the Fund and other | | | | | | | | | | | | | |
| funds. To do so, compare this 5% hypothetical example with the | | | | | | | | | | | | | |
| 5% hypothetical examples that appear in the shareholder reports | | | | | | | | | | | | | |
| of other funds. | | | | | | | | | | | | | |
Global Real Estate Securities Fund 119
Russell Investment Funds
Global Real Estate Securities Fund
Schedule of Investments — December 31, 2013
| Amounts in thousands (except share amounts) | | | | Amounts in thousands (except share amounts) | | |
| | | | | Principal | | Fair | | | | | | Principal | | Fair |
| | | | | Amount ($) | | Value | | | | | | Amount ($) | | Value |
| | | | | or Shares | | $ | | | | | | or Shares | | $ |
| |
| Common Stocks - 95.0% | | | | | | | | Sponda OYJ | | | | 64,600 | | 304 |
| Australia - 6.5% | | | | | | | | | | | | | | 800 |
| |
| Australand Property Group(ö) | | | | 309,512 | | 1,064 | | France - 3.5% | | | | | | |
| BGP Holdings PLC(Å)(Æ) | | | | 926,311 | | — | | | | | | | | |
| CFS Retail Property Trust Group(ö) | | | | 1,652,922 | | 2,871 | | Fonciere Des Regions(ö) | | | | 975 | | 84 |
| Commonwealth Property Office Fund(ö) | | | | 130,700 | | 145 | | Gecina SA(ö) | | | | 16,067 | | 2,123 |
| Cromwell Property Group(ö) | | | | 905,932 | | 789 | | Klepierre - GDR(ö) | | | | 129,652 | | 6,007 |
| Dexus Property Group(ö) | | | | 6,313,688 | | 5,666 | | Mercialys SA(ö) | | | | 51,703 | | 1,085 |
| Federation Centres, Ltd. (ö) | | | | 2,644,112 | | 5,525 | | Unibail-Rodamco SE(ö) | | | | 54,435 | | 13,948 |
| Goodman Group(ö) | | | | 1,648,932 | | 6,963 | | | | | | | | 23,247 |
| GPT Group(ö) | | | | 125,700 | | 382 | | | | | | | | |
| Mirvac Group(ö) | | | | 3,609,846 | | 5,415 | | Germany - 1.6% | | | | | | |
| Stockland(ö) | | | | 985,968 | | 3,178 | | Deutsche Euroshop AG | | | | 12,188 | | 533 |
| Westfield Group(ö) | | | | 612,666 | | 5,520 | | Deutsche Wohnen AG | | | | 240,632 | | 4,646 |
| Westfield Retail Trust(ö) | | | | 1,979,676 | | 5,249 | | Deutsche Wohnen AG(Æ) | | | | 108,347 | | 2,012 |
| | | | | | | 42,767 | | Gagfah SA(Æ) | | | | 92,470 | | 1,362 |
| | | | | | | | | GSW Immobilien AG | | | | 1,856 | | 72 |
| Austria - 0.1% | | | | | | | | LEG Immobilien AG | | | | 32,417 | | 1,915 |
| CA Immobilien Anlagen AG(Æ) | | | | 4,941 | | 88 | | TAG Immobilien AG | | | | 12,681 | | 153 |
| Conwert Immobilien Invest SE(Æ) | | | | 54,285 | | 696 | | | | | | | | 10,693 |
| | | | | | | 784 | | | | | | | | |
| | | | | | | | | Hong Kong - 7.9% | | | | | | |
| Belgium - 0.0% | | | | | | | | Agile Property Holdings, Ltd. | | | | 523,000 | | 560 |
| Cofinimmo(ö) | | | | 914 | | 113 | | Champion REIT(Æ)(ö) | | | | 471,000 | | 208 |
| | | | | | | | | Cheung Kong Holdings, Ltd. | | | | 54,000 | | 852 |
| Brazil - 0.2% | | | | | | | | Franshion Properties China, Ltd. | | | | 1,042,000 | | 363 |
| | | | | | | | | Hang Lung Properties, Ltd. - ADR | | | | 835,000 | | 2,638 |
| Multiplan Empreendimentos | | | | | | | | Henderson Land Development Co. , Ltd. | | | | 677,000 | | 3,863 |
| Imobiliarios SA | | | | 50,400 | | 1,066 | | Hongkong Land Holdings, Ltd. | | | | 1,456,501 | | 8,594 |
| | | | | | | | | Hysan Development Co. , Ltd. | | | | 780,000 | | 3,360 |
| Canada - 2.5% | | | | | | | | Kerry Logistics Network, Ltd. (Æ) | | | | 127,750 | | 182 |
| Allied Properties Real Estate Investment | | | | | | | | Kerry Properties, Ltd. | | | | 157,500 | | 547 |
| Trust (ö) | | | | 127,387 | | 3,928 | | Link REIT (The)(ö) | | | | 927,500 | | 4,497 |
| Boardwalk Real Estate Investment Trust | | | | | | | | New World Development Co. , Ltd. | | | | 2,808,053 | | 3,546 |
| (ö) | | | | 31,800 | | 1,792 | | Shimao Property Holdings, Ltd. | | | | 1,640,500 | | 3,769 |
| Brookfield Office Properties, Inc. | | | | 33,465 | | 644 | | Sino Land Co. , Ltd. | | | | 98,000 | | 134 |
| Calloway Real Estate Investment Trust | | | | | | | | Sun Hung Kai Properties, Ltd. | | | | 806,246 | | 10,225 |
| (ö) | | | | 21,700 | | 514 | | Swire Properties, Ltd. | | | | 78,200 | | 198 |
| Canadian Apartment Properties REIT (ö) | | 106,800 | | 2,137 | | Wharf Holdings, Ltd. | | | | 1,100,789 | | 8,419 |
| Canadian Real Estate Investment | | | | | | | | | | | | | | 51,955 |
| Trust(ö) | | | | 42,000 | | 1,715 | | | | | | | | |
| Chartwell Retirement Residences (ö) | | | | 68,064 | | 640 | | Israel - 0.0% | | | | | | |
| Dundee Real Estate Investment Trust (ö) | | 40,900 | | 1,110 | | Azrieli Group | | | | 1,077 | | 36 |
| First Capital Realty, Inc. Class A | | | | 29,800 | | 497 | | | | | | | | |
| H&R Real Estate Investment Trust(ö) | | | | 109,192 | | 2,200 | | | | | | | | |
| RioCan Real Estate Investment Trust (ö) | | 58,900 | | 1,373 | | Japan - 13.6% | | | | | | |
| | | | | | | 16,550 | | Activia Properties, Inc. (ö) | | | | 323 | | 2,542 |
| | | | | | | | | Advance Residence Investment Corp. | | | | | | |
| |
| China - 0.7% | | | | | | | | Class A(ö) | | | | 73 | | 157 |
| | | | | | | | | Aeon Mall Co. , Ltd. | | | | 31,800 | | 891 |
| China Overseas Land & Investment, Ltd. | | 1,503,600 | | 4,228 | | AEON REIT Investment Corp. (ö) | | | | 249 | | 306 |
| Guangzhou R&F Properties Co. , Ltd. | | | | 77,600 | | 113 | | Frontier Real Estate Investment Corp. (ö) | | 254 | | 1,254 |
| | | | | | | 4,341 | | GLP J(ö) | | | | 674 | | 658 |
| | | | | | | | | Hulic Co. , Ltd. | | | | 143,500 | | 2,119 |
| Finland - 0.1% | | | | | | | | Industrial & Infrastructure Fund | | | | | | |
| Citycon OYJ | | | | 140,756 | | 496 | | Investment Corp. (ö) | | | | 281 | | 2,340 |
| | | | | | | | | Japan Logistics Fund, Inc. Class A(ö) | | | | 66 | | 699 |
See accompanying notes which are an integral part of the financial statements.
120 Global Real Estate Securities Fund
Russell Investment Funds
Global Real Estate Securities Fund
Schedule of Investments, continued — December 31, 2013
| Amounts in thousands (except share amounts) | | | | Amounts in thousands (except share amounts) | | |
| | | | | Principal | | Fair | | | | | | Principal | | Fair |
| | | | | Amount ($) | | Value | | | | | | Amount ($) | | Value |
| | | | | or Shares | | $ | | | | | | or Shares | | $ |
| Japan Prime Realty Investment Corp. | | | | | | | | UOL Group, Ltd. | | | | 18,000 | | 88 |
| Class A(ö) | | | | 951 | | 3,043 | | | | | | | | 27,664 |
| Japan Real Estate Investment Corp. | | | | | | | | | | | | | | |
| Class A(ö) | | | | 682 | | 3,652 | | Sweden - 0.9% | | | | | | |
| Japan Retail Fund Investment Corp. | | | | | | | | | | | | | | |
| Class A(ö) | | | | 1,631 | | 3,318 | | Castellum AB | | | | 185,092 | | 2,881 |
| Kenedix Realty Investment Corp. Class | | | | | | | | Fabege AB | | | | 129,855 | | 1,551 |
| A(ö) | | | | 480 | | 2,276 | | Fastighets AB Balder (Æ) | | | | 3,631 | | 37 |
| Mitsubishi Estate Co. , Ltd. | | | | 701,867 | | 20,960 | | Hufvudstaden AB Class A | | | | 56,655 | | 759 |
| Mitsui Fudosan Co. , Ltd. | | | | 681,129 | | 24,481 | | Wallenstam AB | | | | 73 | | 1 |
| Mori Hills REIT Investment Corp. Class | | | | | | | | Wihlborgs Fastigheter AB | | | | 22,114 | | 396 |
| A(ö) | | | | 258 | | 1,710 | | | | | | | | 5,625 |
| Nippon Building Fund, Inc. (ö) | | | | 344 | | 1,999 | | | | | | | | |
| Nippon Prologis REIT, Inc. Class A(ö) | | | | 94 | | 898 | | Switzerland - 0.3% | | | | | | |
| NTT Urban Development Corp. | | | | 27,588 | | 317 | | PSP Swiss Property AG(Æ) | | | | 18,472 | | 1,564 |
| Orix J(ö) | | | | 506 | | 633 | | Swiss Prime Site AG Class A(Æ) | | | | 753 | | 58 |
| Sumitomo Realty & Development Co. , | | | | | | | | | | | | | | 1,622 |
| Ltd. | | | | 243,000 | | 12,068 | | | | | | | | |
| |
| Tokyo Tatemono Co. , Ltd. | | | | 90,000 | | 998 | | United Kingdom - 6.5% | | | | | | |
| Tokyu Fudosan Holdings Corp. | | | | 109,100 | | 1,026 | | | | | | | | |
| United Urban Investment Corp. Class | | | | | | | | Big Yellow Group PLC(ö) | | | | 223,242 | | 1,767 |
| A(ö) | | | | 689 | | 990 | | British Land Co. PLC(ö) | | | | 254,251 | | 2,648 |
| | | | | | | 89,335 | | Capital & Counties Properties PLC | | | | 123,944 | | 676 |
| | | | | | | | | Derwent London PLC(Ñ)(ö) | | | | 90,717 | | 3,748 |
| | | | | | | | | Great Portland Estates PLC(ö) | | | | 475,313 | | 4,714 |
| Netherlands - 1.1% | | | | | | | | Hammerson PLC(ö) | | | | 1,289,950 | | 10,722 |
| Corio NV(ö) | | | | 67,414 | | 3,020 | | Intu Properties PLC (ö) | | | | 187,470 | | 962 |
| Eurocommercial Properties NV | | | �� | 10,051 | | 427 | | Land Securities Group PLC(ö) | | | | 646,804 | | 10,320 |
| Nieuwe Steen Investments NV(Ñ)(ö) | | | | 402,284 | | 2,546 | | Londonmetric Property PLC(ö) | | | | 806,892 | | 1,848 |
| Vastned Retail NV(ö) | | | | 6,469 | | 294 | | Quintain Estates & Development | | | | | | |
| Wereldhave NV(ö) | | | | 14,103 | | 1,109 | | PLC(Æ) | | | | 286,686 | | 449 |
| | | | | | | 7,396 | | Safestore Holdings PLC(ö) | | | | 53,177 | | 142 |
| | | | | | | | | Segro PLC(Ñ)(ö) | | | | 390,165 | | 2,158 |
| Norway - 0.3% | | | | | | | | Shaftesbury PLC(ö) | | | | 115,230 | | 1,197 |
| Norwegian Property ASA | | | | 1,547,429 | | 1,855 | | ST Modwen Properties PLC | | | | 19,427 | | 118 |
| | | | | | | | | Unite Group PLC | | | | 213,464 | | 1,424 |
| | | | | | | | | Workspace Group PLC(ö) | | | | 20,228 | | 177 |
| Singapore - 4.2% | | | | | | | | | | | | | | 43,070 |
| Ascendas Real Estate Investment | | | | | | | | | | | | | | |
| Trust(ö) | | | | 769,000 | | 1,340 | | United States - 45.0% | | | | | | |
| CapitaCommercial Trust(Æ)(ö) | | | | 1,086,000 | | 1,248 | | | | | | | | |
| CapitaLand, Ltd. | | | | 3,401,300 | | 8,166 | | Acadia Realty Trust(ö) | | | | 38,600 | | 958 |
| CapitaMall Trust Class A(ö) | | | | 1,952,000 | | 2,947 | | Alexander & Baldwin, Inc. | | | | 5,500 | | 230 |
| CapitaMalls Asia, Ltd. | | | | 1,530,000 | | 2,376 | | Alexandria Real Estate Equities, Inc. (ö) | | | | 27,600 | | 1,756 |
| CDL Hospitality Trusts(Æ)(ö) | | | | 481,000 | | 625 | | American Assets Trust, Inc. (ö) | | | | 46,008 | | 1,446 |
| City Developments, Ltd. | | | | 85,000 | | 647 | | American Campus Communities, Inc. (ö) | | 23,441 | | 755 |
| Fortune Real Estate Investment Trust(Æ) | | | | | | | | American Homes 4 Rent Class A(ö) | | | | 43,630 | | 707 |
| (ö) | | | | 116,000 | | 93 | | American Realty Capital Properties, Inc. | | | | | | |
| Global Logistic Properties, Ltd. (Ñ) | | | | 1,850,000 | | 4,237 | | (Ñ)(ö) | | | | 6,225 | | 80 |
| Keppel Land, Ltd. | | | | 416,697 | | 1,103 | | Apartment Investment & Management | | | | | | |
| Keppel REIT(ö) | | | | 392,000 | | 368 | | Co. Class A(ö) | | | | 95,050 | | 2,463 |
| Mapletree Commercial Trust(ö) | | | | 1,000,570 | | 944 | | Armada Hoffler Properties, Inc. (ö) | | | | 34,800 | | 323 |
| Mapletree Greater China Commercial | | | | | | | | Ashford Hospitality Prime, Inc. (ö) | | | | 999 | | 18 |
| Trust(Æ)(ö) | | | | 1,117,900 | | 744 | | Ashford Hospitality Trust, Inc. (ö) | | | | 4,997 | | 41 |
| Mapletree Industrial Trust(Æ)(ö) | | | | 290,000 | | 307 | | AvalonBay Communities, Inc. (ö) | | | | 94,813 | | 11,209 |
| Mapletree Logistics Trust(Æ)(ö) | | | | 342,000 | | 286 | | Aviv REIT, Inc. (ö) | | | | 43,984 | | 1,043 |
| Perennial China Retail Trust(Æ)(Ñ) | | | | 1,174,000 | | 493 | | BioMed Realty Trust, Inc. (ö) | | | | 87,100 | | 1,578 |
| Suntec Real Estate Investment Trust(Æ) | | | | | | | | Boston Properties, Inc. (ö) | | | | 105,951 | | 10,635 |
| (Ñ)(ö) | | | | 1,353,000 | | 1,652 | | BRE Properties, Inc. Class A(ö) | | | | 23,716 | | 1,298 |
| | | | | | | | | Brixmor Property Group, Inc. (ö) | | | | 68,759 | | 1,398 |
See accompanying notes which are an integral part of the financial statements.
Global Real Estate Securities Fund 121
Russell Investment Funds
Global Real Estate Securities Fund
Schedule of Investments, continued — December 31, 2013
| Amounts in thousands (except share amounts) | | | | Amounts in thousands (except share amounts) | | |
| | | | | Principal | | Fair | | | | | | Principal | | Fair |
| | | | | Amount ($) | | Value | | | | | | Amount ($) | | Value |
| | | | | or Shares | | $ | | | | | | or Shares | | $ |
| Brookdale Senior Living, Inc. Class | | | | | | | | Ramco-Gershenson Properties Trust(ö) | | | | 39,987 | | | 630 |
| A(Æ) | | | | 39,615 | | 1,077 | | Realty Income Corp. (ö) | | | | 76,797 | | | 2,867 |
| Camden Property Trust(ö) | | | | 32,800 | | 1,866 | | Regency Centers Corp. (ö) | | | | 119,648 | | | 5,540 |
| Cole Real Estate Investment, Inc. (ö) | | | | 9,767 | | 137 | | Retail Opportunity Investments Corp. (ö) | | 181,682 | | | 2,674 |
| Corporate Office Properties Trust(ö) | | | | 99,465 | | 2,356 | | RLJ Lodging Trust(ö) | | | | 152,658 | | | 3,713 |
| Cousins Properties, Inc. (ö) | | | | 251,747 | | 2,594 | | Sabra Health Care REIT, Inc. (ö) | | | | 2,680 | | | 70 |
| CubeSmart Class A(ö) | | | | 111,145 | | 1,771 | | Senior Housing Properties Trust(ö) | | | | 76,739 | | | 1,706 |
| DDR Corp. (ö) | | | | 555,281 | | 8,534 | | Simon Property Group, Inc. (ö) | | | | 233,729 | | | 35,561 |
| Digital Realty Trust, Inc. (Ñ)(ö) | | | | 75,895 | | 3,728 | | SL Green Realty Corp. (ö) | | | | 108,085 | | | 9,985 |
| Douglas Emmett, Inc. (ö) | | | | 151,172 | | 3,521 | | Sovran Self Storage, Inc. (ö) | | | | 47,169 | | | 3,074 |
| Duke Realty Corp. (ö) | | | | 120 | | 2 | | Starwood Hotels & Resorts Worldwide, | | | | | | | |
| DuPont Fabros Technology, Inc. (ö) | | | | 70,632 | | 1,746 | | Inc. | | | | 833 | | | 66 |
| EastGroup Properties, Inc. (ö) | | | | 28,643 | | 1,660 | | Strategic Hotels & Resorts, Inc. (Æ)(ö) | | | | 197,418 | | | 1,866 |
| Empire State Realty Trust, Inc. Class | | | | | | | | Tanger Factory Outlet Centers, Inc. (ö) | | | | 60,504 | | | 1,937 |
| A(Ñ)(ö) | | | | 260,138 | | 3,980 | | Taubman Centers, Inc. (ö) | | | | 24,200 | | | 1,547 |
| EPR Properties(ö) | | | | 77,795 | | 3,824 | | UDR, Inc. (ö) | | | | 302,557 | | | 7,065 |
| Equity Lifestyle Properties, Inc. Class | | | | | | | | Ventas, Inc. (ö) | | | | 155,230 | | | 8,892 |
| A(ö) | | | | 75,637 | | 2,741 | | Vornado Realty Trust(ö) | | | | 123,119 | | | 10,931 |
| Equity Residential(ö) | | | | 223,999 | | 11,620 | | WP Carey, Inc. (ö) | | | | 451 | | | 28 |
| Essex Property Trust, Inc. (Ñ)(ö) | | | | 20,512 | | 2,944 | | | | | | | | | 296,432 |
| Extra Space Storage, Inc. (ö) | | | | 105,827 | | 4,458 | | | | | | | | | |
| Federal Realty Investment Trust(ö) | | | | 42,000 | | 4,259 | | Total Common Stocks | | | | | | | |
| FelCor Lodging Trust, Inc. (ö) | | | | 13,735 | | 112 | | (cost $531,694) | | | | | | | 625,351 |
| First Industrial Realty Trust, Inc. (ö) | | | | 86,593 | | 1,511 | | | | | | | | | |
| First Potomac Realty Trust(ö) | | | | 53,800 | | 626 | | Short-Term Investments - 4.2% | | | | | | | |
| Forest City Enterprises, Inc. Class A(Æ) | | 256,368 | | 4,896 | | United States - 4.2% | | | | | | | |
| Franklin Street Properties Corp. (ö) | | | | 6,523 | | 78 | | Russell U. S. Cash Management Fund | | | | 28,005,935 | (∞) | | 28,006 |
| General Growth Properties, Inc. (ö) | | | | 120,262 | | 2,414 | | | | | | | | | |
| Glimcher Realty Trust(ö) | | | | 102,384 | | 958 | | Total Short-Term Investments | | | | | | | |
| HCP, Inc. (ö) | | | | 161,778 | | 5,876 | | (cost $28,006) | | | | | | | 28,006 |
| Health Care REIT, Inc. (ö) | | | | 167,349 | | 8,964 | | Other Securities - 2.7% | | | | | | | |
| Healthcare Trust of America, Inc. Class | | | | | | | | Russell U. S. Cash Collateral Fund(×) | | | | 17,596,240 | (∞) | | 17,596 |
| A(ö) | | | | 106,368 | | 1,047 | | | | | | | | | |
| Hersha Hospitality Trust Class A(ö) | | | | 161,957 | | 902 | | Total Other Securities | | | | | | | |
| Highwoods Properties, Inc. (ö) | | | | 1,748 | | 63 | | (cost $17,596) | | | | | | | 17,596 |
| Hilton Worldwide Holdings, Inc. (Æ) | | | | 42,600 | | 948 | | Total Investments 101.9% | | | | | | | |
| Home Properties, Inc. (ö) | | | | 45,370 | | 2,433 | | (identified cost $577,296) | | | | | | | 670,953 |
| Hospitality Properties Trust(ö) | | | | 2,103 | | 57 | | | | | | | | | |
| Host Hotels & Resorts, Inc. (ö) | | | | 491,452 | | 9,554 | | Other Assets and Liabilities, | | | | | | | |
| Hudson Pacific Properties, Inc. (ö) | | | | 74,500 | | 1,629 | | Net - (1.9%) | | | | | | | (12,540) |
| Icad, Inc. (ö) | | | | 1,510 | | 141 | | | | | | | | | |
| Inland Real Estate Corp. (ö) | | | | 13,103 | | 138 | | Net Assets - 100.0% | | | | | | | 658,413 |
| Kilroy Realty Corp. (ö) | | | | 64,132 | | 3,218 | | | | | | | | | |
| Kimco Realty Corp. (ö) | | | | 192,009 | | 3,792 | | | | | | | | | |
| Kite Realty Group Trust(ö) | | | | 10,398 | | 68 | | | | | | | | | |
| LaSalle Hotel Properties(ö) | | | | 68,237 | | 2,105 | | | | | | | | | |
| Liberty Property Trust(ö) | | | | 85,200 | | 2,885 | | | | | | | | | |
| Macerich Co. (The)(ö) | | | | 67,363 | | 3,967 | | | | | | | | | |
| Mid-America Apartment Communities, | | | | | | | | | | | | | | | |
| Inc. (Ñ)(ö) | | | | 43,855 | | 2,664 | | | | | | | | | |
| National Health Investors, Inc. (ö) | | | | 24,500 | | 1,374 | | | | | | | | | |
| National Retail Properties, Inc. (Ñ)(ö) | | | | 107,162 | | 3,251 | | | | | | | | | |
| Omega Healthcare Investors, Inc. (ö) | | | | 2,909 | | 87 | | | | | | | | | |
| Orient-Express Hotels, Ltd. Class A(Æ) | | | | 142,673 | | 2,156 | | | | | | | | | |
| Pebblebrook Hotel Trust(ö) | | | | 33 | | 1 | | | | | | | | | |
| Piedmont Office Realty Trust, Inc. Class | | | | | | | | | | | | | | | |
| A(Ñ)(ö) | | | | 173,847 | | 2,872 | | | | | | | | | |
| Prologis, Inc. (ö) | | | | 453,338 | | 16,749 | | | | | | | | | |
| PS Business Parks, Inc. (ö) | | | | 25,393 | | 1,941 | | | | | | | | | |
| Public Storage(ö) | | | | 66,752 | | 10,047 | | | | | | | | | |
| |
| See accompanying notes which are an integral part of the financial statements. | | | | | | | | | |
| 122 Global Real Estate Securities Fund | | | | | | | | | | | | | | | |
Russell Investment Funds
Global Real Estate Securities Fund
Schedule of Investments, continued — December 31, 2013
| Restricted Securities | | | | | | | | | | | | | | | | | | |
| Amounts in thousands (except share and cost per unit amounts) | | | | | | | | | | | | | | | | |
| | | | | | | | Principal | | Cost per | | | | Cost | | | | Fair Value |
| % of Net Assets | | Acquisition | | | | Amount ($) | | Unit | | | | (000) | | | | | (000) |
| Securities | | Date | | | | or Shares | | $ | | | | $ | | | | | $ |
| 0.0% | | | | | | | | | | | | | | | | | | |
| BGP Holdings PLC | | 08/06/09 | | AUD | | 926,311 | | | — | | | | | | | — | | — |
| | | | | | | | | | | | | | | | | | | | — |
| For a description of restricted securities see note 9 in the Notes to Financial Statements. | | | | | | | | | | | |
| Futures Contracts | | | | | | | | | | | | |
| |
| Amounts in thousands (except contract amounts) | | | | | | | | | | | | |
| | | | | | | | | | | | | Unrealized |
| | | | | | | | | | | | | Appreciation |
| | | | | Number of | | Notional | | Expiration | | (Depreciation) |
| | | | | Contracts | | Amount | | Date | | $ |
| |
| Long Positions | | | | | | | | | | | | |
| Dow Jones US Real Estate Index Futures | | | | 172 | | USD | | 4,197 | | 03/14 | | (10) |
| FTSE EPRA Europe Index Futures (France) | | | | 416 | | EUR | | 6,569 | | 03/14 | | 287 |
| Hang Seng Index Futures (Hong Kong) | | | | 14 | | HKD | | 16,333 | | 01/14 | | 32 |
| MSCI Singapore Index Futures | | | | 18 | | SGD | | 1,315 | | 01/14 | | 23 |
| S&P Midcap 400 E-Mini Index Futures (Canada) | | | | 46 | | USD | | 6,161 | | 03/14 | | 191 |
| S&P TSX 60 Index Futures (Canada) | | | | 7 | | CAD | | 1,093 | | 03/14 | | 31 |
| SPI 200 Index Futures (Australia) | | | | 13 | | AUD | | 1,728 | | 03/14 | | 71 |
| TOPIX Index Futures (Japan) | | | | 28 | | JPY | | 364,700 | | 03/14 | | 130 |
| Total Unrealized Appreciation (Depreciation) on Open Futures Contracts (å) | | | | | | | | | | | | 755 |
| Foreign Currency Exchange Contracts | | | | | | | | | | | | |
| Amounts in thousands | | | | | | | | | | | | |
| | | | | | | | | | | | | Unrealized |
| | | | | | | | | | | | | Appreciation |
| | | Amount | | Amount | | | | (Depreciation) |
| Counterparty | | | | Sold | | Bought | | Settlement Date | | $ |
| Brown Brothers Harriman | | USD | | 89 | | AUD | | 100 | | 03/19/14 | | — |
| Brown Brothers Harriman | | USD | | 412 | | EUR | | 300 | | 03/19/14 | | — |
| Brown Brothers Harriman | | USD | | 291 | | JPY | | 30,000 | | 03/19/14 | | (5) |
| Citibank | | USD | | 89 | | AUD | | 100 | | 03/19/14 | | — |
| Citibank | | USD | | 94 | | CAD | | 100 | | 03/19/14 | | — |
| Citibank | | USD | | 137 | | EUR | | 100 | | 03/19/14 | | 1 |
| HSBC | | USD | | 914 | | CAD | | 972 | | 03/19/14 | | (1) |
| JPMorgan Chase | | USD | | 129 | | HKD | | 1,000 | | 03/19/14 | | — |
| JPMorgan Chase | | USD | | 879 | | HKD | | 6,814 | | 03/19/14 | | — |
| Royal Bank of Canada | | USD | | 4,256 | | EUR | | 3,086 | | 03/19/14 | | (10) |
| Royal Bank of Canada | | USD | | 2,897 | | JPY | | 296,695 | | 03/19/14 | | (80) |
| Standard Chartered | | USD | | 879 | | HKD | | 6,814 | | 03/19/14 | | — |
| Standard Chartered | | USD | | 441 | | SGD | | 551 | | 03/19/14 | | (4) |
| State Street | | USD | | 27 | | AUD | | 30 | | 01/03/14 | | — |
| State Street | | USD | | 89 | | AUD | | 100 | | 03/19/14 | | — |
| State Street | | USD | | 94 | | CAD | | 100 | | 03/19/14 | | — |
| State Street | | USD | | 137 | | EUR | | 100 | | 03/19/14 | | — |
| State Street | | USD | | 138 | | EUR | | 100 | | 03/19/14 | | — |
| State Street | | USD | | 274 | | EUR | | 200 | | 03/19/14 | | 2 |
| State Street | | USD | | 275 | | EUR | | 200 | | 03/19/14 | | — |
| State Street | | USD | | 4,255 | | EUR | | 3,086 | | 03/19/14 | | (11) |
| State Street | | USD | | 17 | | HKD | | 133 | | 01/02/14 | | — |
| State Street | | USD | | 26 | | HKD | | 200 | | 01/03/14 | | — |
| State Street | | USD | | 129 | | HKD | | 1,000 | | 03/19/14 | | — |
| State Street | | USD | | 21 | | JPY | | 2,167 | | 01/06/14 | | — |
See accompanying notes which are an integral part of the financial statements.
Global Real Estate Securities Fund 123
Russell Investment Funds
Global Real Estate Securities Fund
Schedule of Investments, continued — December 31, 2013
| Foreign Currency Exchange Contracts | | | | | | | | | | | | |
| Amounts in thousands | | | | | | | | | | | | |
| | | | | | | | | | | | | Unrealized |
| | | | | | | | | | | | | Appreciation |
| | | Amount | | Amount | | | | (Depreciation) |
| Counterparty | | | | Sold | | Bought | | Settlement Date | | $ |
| State Street | | USD | | 27 | | JPY | | 2,808 | | 01/06/14 | | — |
| State Street | | USD | | 31 | | JPY | | 3,251 | | 01/06/14 | | — |
| State Street | | USD | | 25 | | JPY | | 2,596 | | 01/07/14 | | — |
| State Street | | USD | | 36 | | JPY | | 3,767 | | 01/07/14 | | — |
| State Street | | USD | | 39 | | JPY | | 4,065 | | 01/08/14 | | — |
| State Street | | USD | | 71 | | JPY | | 7,453 | | 01/08/14 | | — |
| State Street | | USD | | 85 | | JPY | | 8,989 | | 01/08/14 | | — |
| State Street | | USD | | 198 | | JPY | | 20,778 | | 01/08/14 | | — |
| State Street | | USD | | 95 | | JPY | | 10,000 | | 03/19/14 | | — |
| State Street | | USD | | 97 | | JPY | | 10,000 | | 03/19/14 | | (2) |
| State Street | | USD | | 29 | | SGD | | 37 | | 01/06/14 | | — |
| State Street | | USD | | 159 | | SGD | | 200 | | 03/19/14 | | — |
| State Street | | USD | | 441 | | SGD | | 551 | | 03/19/14 | | (6) |
| State Street | | AUD | | 100 | | USD | | 89 | | 03/19/14 | | — |
| State Street | | AUD | | 150 | | USD | | 132 | | 03/19/14 | | (1) |
| State Street | | CAD | | 150 | | USD | | 140 | | 03/19/14 | | (1) |
| State Street | | EUR | | 300 | | USD | | 410 | | 03/19/14 | | (2) |
| State Street | | EUR | | 500 | | USD | | 683 | | 03/19/14 | | (6) |
| State Street | | HKD | | 145 | | USD | | 19 | | 01/02/14 | | — |
| State Street | | HKD | | 50 | | USD | | 6 | | 01/03/14 | | — |
| State Street | | HKD | | 63 | | USD | | 8 | | 01/03/14 | | — |
| State Street | | HKD | | 1,000 | | USD | | 129 | | 03/19/14 | | — |
| State Street | | JPY | | 8,150 | | USD | | 78 | | 01/06/14 | | — |
| State Street | | JPY | | 11,411 | | USD | | 109 | | 01/06/14 | | 1 |
| State Street | | JPY | | 2,532 | | USD | | 24 | | 01/07/14 | | — |
| State Street | | JPY | | 3,929 | | USD | | 37 | | 01/07/14 | | — |
| State Street | | JPY | | 30,000 | | USD | | 288 | | 03/19/14 | | 3 |
| State Street | | SGD | | 26 | | USD | | 20 | | 01/02/14 | | — |
| State Street | | SGD | | 92 | | USD | | 72 | | 01/02/14 | | — |
| State Street | | SGD | | 34 | | USD | | 27 | | 01/03/14 | | — |
| State Street | | SGD | | 146 | | USD | | 116 | | 01/03/14 | | (1) |
| State Street | | SGD | | 78 | | USD | | 62 | | 01/06/14 | | — |
| State Street | | SGD | | 304 | | USD | | 240 | | 01/06/14 | | — |
| State Street | | SGD | | 120 | | USD | | 95 | | 03/19/14 | | — |
| UBS | | USD | | 2 | | AUD | | 3 | | 01/02/14 | | — |
| UBS | | USD | | — | | JPY | | — | | 01/02/14 | | — |
| UBS | | CAD | | 2 | | USD | | 2 | | 01/02/14 | | — |
| UBS | | EUR | | 17 | | USD | | 22 | | 01/02/14 | | — |
| UBS | | HKD | | 55 | | USD | | 7 | | 01/02/14 | | — |
| UBS | | JPY | | — | | USD | | — | | 01/02/14 | | — |
| UBS | | SGD | | 9 | | USD | | 7 | | 01/02/14 | | — |
| Westpac Bank | | USD | | 1,437 | | AUD | | 1,595 | | 03/19/14 | | (19) |
| Total Unrealized Appreciation (Depreciation) on Open Foreign Currency Exchange Contracts | | | | | | | | (142) |
See accompanying notes which are an integral part of the financial statements.
124 Global Real Estate Securities Fund
Russell Investment Funds
Global Real Estate Securities Fund
Schedule of Investments, continued — December 31, 2013
| Presentation of Portfolio Holdings | | | | | | | | | | | | | | | | | | | | | | | | |
| |
| Amounts in thousands | | | | | | | | | | | | | | | | | | | | | | | | |
| | | | | | | | | Fair Value | | | | | | | | | | | | | | |
| | | | | | | | | | | | | | | | | | | | | | | % of Net |
| Portfolio Summary | | | | Level 1 | | | | Level 2 | | | | Level 3 | | | | | | Total | | | | Assets |
| Common Stocks | | | | | | | | | | | | | | | | | | | | | | | | |
| Australia | | $ | | 42,767 | | $ | | — | | $ | | | | — | | $ | | 42,767 | | | | | | 6 . 5 |
| Austria | | | | 784 | | | | — | | | | | | — | | | | 784 | | | | | | 0 . 1 |
| Belgium | | | | 113 | | | | — | | | | | | — | | | | 113 | | | | | | — * |
| Brazil | | | | 1,066 | | | | — | | | | | | — | | | | 1,066 | | | | | | 0 . 2 |
| Canada | | | | 16,550 | | | | — | | | | | | — | | | | 16,550 | | | | | | 2 . 5 |
| China | | | | 4,341 | | | | — | | | | | | — | | | | 4,341 | | | | | | 0 . 7 |
| Finland | | | | 800 | | | | — | | | | | | — | | | | 800 | | | | | | 0 . 1 |
| France | | | | 23,247 | | | | — | | | | | | — | | | | 23,247 | | | | | | 3 . 5 |
| Germany | | | | 10,693 | | | | — | | | | | | — | | | | 10,693 | | | | | | 1 . 6 |
| Hong Kong | | | | 51,955 | | | | — | | | | | | — | | | | 51,955 | | | | | | 7 . 9 |
| Israel | | | | 36 | | | | — | | | | | | — | | | | 36 | | | | | | — * |
| Japan | | | | 89,335 | | | | — | | | | | | — | | | | 89,335 | | | | | | 13 . 6 |
| Netherlands | | | | 7,396 | | | | — | | | | | | — | | | | 7,396 | | | | | | 1 . 1 |
| Norway | | | | 1,855 | | | | — | | | | | | — | | | | 1,855 | | | | | | 0 . 3 |
| Singapore | | | | 27,664 | | | | — | | | | | | — | | | | 27,664 | | | | | | 4 . 2 |
| Sweden | | | | 5,625 | | | | — | | | | | | — | | | | 5,625 | | | | | | 0 . 9 |
| Switzerland | | | | 1,622 | | | | — | | | | | | — | | | | 1,622 | | | | | | 0 . 3 |
| United Kingdom | | | | 43,070 | | | | — | | | | | | — | | | | 43,070 | | | | | | 6 . 5 |
| United States | | | | 296,432 | | | | — | | | | | | — | | | | 296,432 | | | | | | 45 . 0 |
| Short-Term Investments | | | | — | | | | 28,006 | | | | | | — | | | | 28,006 | | | | | | 4 . 2 |
| Other Securities | | | | — | | | | 17,596 | | | | | | — | | | | 17,596 | | | | | | 2 . 7 |
| Total Investments | | | | 625,351 | | | | 45,602 | | | | | | — | | | | 670,953 | | | | | | 101 . 9 |
| Other Assets and Liabilities, Net | | | | | | | | | | | | | | | | | | | | | | | | (1 . 9) |
| | | | | | | | | | | | | | | | | | | | | | | | | 100 . 0 |
| |
| Other Financial Instruments | | | | | | | | | | | | | | | | | | | | | | | | |
| Futures Contracts | | | | 755 | | | | — | | | | | | — | | | | 755 | | | | | | 0 . 1 |
| Foreign Currency Exchange Contracts | | | | (2 ) | | | | (140 ) | | | | | | — | | | | (142 ) | | | | | | (—) * |
| Total Other Financial Instruments** | | $ | | 753 | | $ | | (140 ) | | $ | | | | — | | $ | | 613 | | | | | | |
| * Less than . 05% of net assets. | | | | | | | | | | | | | | | | | | | | | | | | |
| ** | Other financial instruments reflected in the Schedule of Investments, such as futures, forwards, interest rate swaps, and credit default swaps are valued at the unrealized appreciation/depreciation on the instruments. |
For a description of the Levels see note 2 in the Notes to Financial Statements.
For disclosure on transfers between Levels 1, 2 and 3 during the period ended December 31, 2013, see note 2 in the Notes to Financial Statements.
See accompanying notes which are an integral part of the financial statements.
Global Real Estate Securities Fund 125
Russell Investment Funds
Global Real Estate Securities Fund
Fair Value of Derivative Instruments — December 31, 2013
Amounts in thousands
| | | | | | | | | Foreign |
| | | | | Equity | | Currency |
| Derivatives not accounted for as hedging instruments | | | | Contracts | | Contracts |
| Location: Statement of Assets and Liabilities - Assets | | | | | | | | | | |
| Unrealized appreciation on foreign currency exchange contracts | | | | $ | | — | | $ | | 7 |
| Variation margin on futures contracts* | | | | | | 765 | | | | — |
| Total | | | | $ | | 765 | | $ | | 7 |
| | | | | | | | | | | |
| Location: Statement of Assets and Liabilities - Liabilities | | | | | | | | | | |
| Variation margin on futures contracts* | | | | $ | | 10 | | $ | | — |
| Unrealized depreciation on foreign currency exchange contracts | | | | | | — | | | | 149 |
| Total | | | | $ | | 10 | | $ | | 149 |
| |
| | | | | | | | | Foreign |
| | | | | Equity | | Currency |
| Derivatives not accounted for as hedging instruments | | | | Contracts | | Contracts |
| Location: Statement of Operations - Net realized gain (loss) | | | | | | | | | | |
| Futures contracts | | | | $ | | 3,717 | | $ | | — |
| Foreign currency-related transactions** | | | | | | — | | | | (382) |
| Total | | | | $ | | 3,717 | | $ | | (382) |
| | | | | | | | | | | |
| Location: Statement of Operations - Net change in unrealized appreciation (depreciation) | | | | | | | | | | |
| Futures contracts | | | | $ | | 342 | | $ | | — |
| Foreign currency-related transactions*** | | | | | | — | | | | (114) |
| Total | | | | $ | | 342 | | $ | | (114) |
| * | Includes cumulative appreciation/depreciation of futures contracts as reported in the Schedule of Investments. Only variation margin is reported within the Statement of Assets and Liabilities. |
| ** | Only includes net realized gain (loss) on forward and spot contracts. May differ from the net realized gain (loss) on foreign currency-related transactions reported within the Statement of Operations. |
| *** | Only includes change in unrealized gain (loss) on forward and spot contracts. May differ from the net change in unrealized gain (loss) on foreign currency-related transactions reported within the Statement of Operations. |
For further disclosure on derivatives see note 2 in the Notes to Financial Statements.
See accompanying notes which are an integral part of the financial statements.
126 Global Real Estate Securities Fund
Russell Investment Funds
Global Real Estate Securities Fund
Balance Sheet Offsetting of Financial and Derivative Instruments —
December 31, 2013
| Amounts in thousands | | | | | | | | | | | | | |
| |
| Offsetting of Financial Assets and Derivative Assets | | | | | | | | | | | |
| | | | | | | | Gross | | Net Amounts |
| | | | | | | | Amounts | | of Assets |
| | | | | Gross | | Offset in the | | Presented in |
| | | | | Amounts of | | Statement of | | the Statement |
| | | | | Recognized | | Assets and | | of Assets and |
| Description | | Location: Statement of Assets and Liabilities - Assets | | | Assets | | Liabilities | | Liabilities |
| Securities on Loan* | | Investments, at fair value | | $ | 17,120 | | $ | | — | | $ | | 17,120 |
| Foreign Currency Exchange Contracts | | Unrealized appreciation on foreign currency exchange contracts | | | 7 | | | | — | | | | 7 |
| Futures Contracts** | | Variation margin on futures contracts | | | 765 | | | | — | | | | 765 |
| Total | | | | $ | 17,892 | | $ | | — | | $ | | 17,892 |
| | | | | | | | | | | | | | |
| Financial Assets, Derivative Assets, and Collateral Held by Counterparty | | | | | | | | | | | | | | | | |
| | | | | | | Gross Amounts Not Offset in | | |
| | | | | | | the Statement of Assets and | | |
| | | | | | | Liabilities | | | | | | | |
| | | Net Amounts | | | | | | | | | | | | | | |
| | | of Assets | | | | | | | | | | | | | | |
| | | Presented in | | | | | | | | | | | | | | |
| | | the Statement | | Financial and | | | | | | | | | | |
| | | of Assets and | | Derivative | | Collateral | | | | | |
| Counterparty | | | | Liabilities | | Instruments | | Received | | Net Amount |
| Barclays | | $ | | 6,620 | | $ | | — $ | | | 6,620 | $ | | — |
| Citigroup | | | | 2,382 | | | | — | | | 2,382 | | | — |
| Credit Suisse | | | | 1,059 | | | | — | | | 1,059 | | | — |
| Deutsche Bank | | | | 321 | | | | — | | | 321 | | | — |
| Fidelity | | | | 1,325 | | | | — | | | 1,325 | | | — |
| Goldman Sachs | | | | 792 | | | | — | | | 792 | | | — |
| Merrill Lynch | | | | 473 | | | | — | | | 473 | | | — |
| Morgan Stanley | | | | 4,148 | | | | — | | | 4,148 | | | — |
| State Street | | | | 6 | | | | 5 | | | — | | | 1 |
| UBS | | | | 766 | | | | — | | | — | | | 766 |
| Total | | $ | | 17,892 | | $ | | 5 | $ | | 17,120 | $ | | 767 |
| | | | | | | | | | | | | | | | | | | |
| Amounts in thousands | | | | | | | | | | | | |
| |
| Offsetting of Financial Liabilities and Derivative Liabilities | | | | | | | | | | |
| | | | | | | | Gross | | Net Amounts |
| | | | | | | | Amounts | | of Liabilities |
| | | | | Gross | | Offset in the | | Presented in |
| | | | | Amounts of | | Statement of | | the Statement |
| | | | | Recognized | | Assets and | | of Assets and |
| Description | | Location: Statement of Assets and Liabilities - Liabilities | | Liabilities | | Liabilities | | Liabilities |
| Futures Contracts** | | Variation margin on futures contracts | | $ | 10 | | $ | | — | | $ | 10 |
| Foreign Currency Exchange Contracts | | Unrealized depreciation on foreign currency exchange contracts | | | 149 | | | | — | | | 149 |
| Total | | | | $ | 159 | | $ | | — | | $ | 159 |
| | | | | | | | | | | | | |
Balance Sheet Offsetting of Financial and Derivative Instruments 127
Russell Investment Funds
Global Real Estate Securities Fund
Balance Sheet Offsetting of Financial and Derivative Instruments, continued —
December 31, 2013
| Financial Liabilities, Derivative Liabilities, and Collateral Pledged by Counterparty | | | | | | | | | |
| | | | | | | Gross Amounts Not Offset in | | | |
| | | | | | | the Statement of Assets and | | | |
| | | | | | | Liabilities | | | | |
| | | Net Amounts | | | | | | | | | |
| | | of Liabilities | | | | | | | | | |
| | | Presented in | | | | | | | | | |
| | | the Statement | | Financial and | | | | | | |
| | | of Assets and | | Derivative | | Collateral | | | |
| Counterparty | | | Liabilities | | Instruments | | Pledged | | Net Amount |
| Brown Brothers Harriman | | $ | 6 | | $ | — | | $ | — | | $ | 6 |
| HSBC | | | 1 | | | — | | | — | | | 1 |
| Royal Bank of Canada | | | 89 | | | — | | | — | | | 89 |
| Standard Chartered | | | 4 | | | — | | | — | | | 4 |
| State Street | | | 29 | | | 5 | | | — | | | 24 |
| UBS | | | 11 | | | — | | | 11 | | | — |
| Westpac | | | 19 | | | — | | | — | | | 19 |
| Total | | $ | 159 | | $ | 5 | | $ | 11 | | $ | 143 |
| | | | | | | | | | | | | |
| * | Fair value of securities on loan as reported in the footnotes to the Statement of Assets and Liabilities. |
| ** | Includes cumulative appreciation/depreciation of futures contracts as reported in the Schedule of Investments. |
Only variation margin is reported within the Statement of Assets and Liabilities.
For further disclosure on derivatives and counterparty risk see note 2 in the Notes to Financial Statements.
128 Balance Sheet Offsetting of Financial and Derivative Instruments
Russell Investment Funds
Global Real Estate Securities Fund
Statement of Assets and Liabilities — December 31, 2013
| Amounts in thousands | | |
| Assets | | |
| Investments, at identified cost | $ | 577,296 |
| Investments, at fair value(*)(>) | | 670,953 |
| Cash (restricted)(a) | | 1,570 |
| Foreign currency holdings(^) | | 1,778 |
| Unrealized appreciation on foreign currency exchange contracts | | 7 |
| Receivables: | | |
| Dividends and interest | | 2,294 |
| Dividends from affiliated Russell funds | | 2 |
| Investments sold | | 2,091 |
| Fund shares sold | | 26 |
| Foreign capital gains taxes recoverable | | 170 |
| Variation margin on futures contracts | | 38 |
| Total assets | | 678,929 |
| |
| Liabilities | | |
| Payables: | | |
| Investments purchased | | 2,124 |
| Fund shares redeemed | | 49 |
| Accrued fees to affiliates | | 472 |
| Other accrued expenses | | 112 |
| Variation margin on futures contracts | | 14 |
| Unrealized depreciation on foreign currency exchange contracts | | 149 |
| Payable upon return of securities loaned | | 17,596 |
| Total liabilities | | 20,516 |
| |
| Net Assets | $ | 658,413 |
See accompanying notes which are an integral part of the financial statements.
Global Real Estate Securities Fund 129
Russell Investment Funds
Global Real Estate Securities Fund
Statement of Assets and Liabilities, continued — December 31, 2013
| Amounts in thousands | | |
| Net Assets Consist of: | | |
| Undistributed (overdistributed) net investment income | $ | (14,384) |
| Accumulated net realized gain (loss) | | (8,732) |
| Unrealized appreciation (depreciation) on: | | |
| Investments . | | 93,657 |
| Futures contracts | | 755 |
| Foreign currency-related transactions | | (130) |
| Shares of beneficial interest | | 449 |
| Additional paid-in capital | | 586,798 |
| Net Assets | $ | 658,413 |
| Net Asset Value, offering and redemption price per share: | | |
| Net asset value per share: (#) | $ | 14 . 68 |
| Net assets | $ | 658,413,459 |
| Shares outstanding ($. 01 par value) | | 44,862,588 |
| Amounts in thousands | | |
| (^) Foreign currency holdings - cost | $ | 1,770 |
| (*) Securities on loan included in investments | $ | 17,120 |
| (>) Investments in affiliates, Russell U. S. Cash Management Fund and Russell U. S. Cash Collateral Fund | $ | 45,602 |
| (a) Cash Collateral for Futures | $ | 1,570 |
| (#) Net asset value per share equals net assets divided by shares of beneficial interest outstanding. | | |
See accompanying notes which are an integral part of the financial statements.
130 Global Real Estate Securities Fund
Russell Investment Funds
Global Real Estate Securities Fund
Statement of Operations — For the Period Ended December 31, 2013
| Amounts in thousands | | |
| Investment Income | | |
| Dividends | $ | 19,419 |
| Dividends from affiliated Russell funds | | 24 |
| Securities lending income | | 144 |
| Less foreign taxes withheld | | (757) |
| Total investment income | | 18,830 |
| |
| Expenses | | |
| Advisory fees | | 5,195 |
| Administrative fees | | 325 |
| Custodian fees | | 266 |
| Transfer agent fees | | 29 |
| Professional fees | | 86 |
| Trustees’ fees | | 17 |
| Printing fees | | 92 |
| Miscellaneous | | 21 |
| Net expenses | | 6,031 |
| Net investment income (loss) | | 12,799 |
| |
| Net Realized and Unrealized Gain (Loss) | | |
| Net realized gain (loss) on: | | |
| Investments | | 40,909 |
| Futures contracts | | 3,717 |
| Foreign currency-related transactions | | (586) |
| Net realized gain (loss) | | 44,040 |
| Net change in unrealized appreciation (depreciation) on: | | |
| Investments | | (35,013) |
| Futures contracts | | 342 |
| Foreign currency-related transactions | | (90) |
| Net change in unrealized appreciation (depreciation) | | (34,761) |
| Net realized and unrealized gain (loss) | | 9,279 |
| Net Increase (Decrease) in Net Assets from Operations | $ | 22,078 |
See accompanying notes which are an integral part of the financial statements.
Global Real Estate Securities Fund 131
Russell Investment Funds
Global Real Estate Securities Fund
Statements of Changes in Net Assets
| | | For the Periods Ended December 31, |
| Amounts in thousands | | 2013 | | 2012 |
| Increase (Decrease) in Net Assets | | | | | | |
| Operations | | | | | | |
| Net investment income (loss) | | $ | 12,799 | | $ | 11,257 |
| Net realized gain (loss) | | | 44,040 | | | 23,971 |
| Net change in unrealized appreciation (depreciation) | | | (34,761) | | | 95,274 |
| Net increase (decrease) in net assets from operations | | | 22,078 | | | 130,502 |
| |
| Distributions | | | | | | |
| From net investment income | | | (25,921) | | | (27,834) |
| From net realized gain | | | (25,990) | | | — |
| Net decrease in net assets from distributions | | | (51,911) | | | (27,834) |
| |
| Share Transactions* | | | | | | |
| Net increase (decrease) in net assets from share transactions | | | 79,886 | | | 34,728 |
| Total Net Increase (Decrease) in Net Assets | | | 50,053 | | | 137,396 |
| |
| Net Assets | | | | | | |
| Beginning of period | | | 608,360 | | | 470,964 |
| End of period | | $ | 658,413 | | $ | 608,360 |
| Undistributed (overdistributed) net investment income included in net assets | | $ | (14,384) | | $ | (10,059) |
See accompanying notes which are an integral part of the financial statements.
132 Global Real Estate Securities Fund
Russell Investment Funds
Global Real Estate Securities Fund
Statements of Changes in Net Assets, continued
* Share transaction amounts (in thousands) for the periods ended December 31, 2013 and December 31, 2012 were as follows:
| | | | | 2013 | | | | | 2012 | |
| | | | | Shares | | | Dollars | | | | Shares | | | Dollars |
| |
| Proceeds from shares sold | | | | 4,093 | | $ | 63,978 | | | | 2,073 | | $ | 29,853 |
| Proceeds from reinvestment of distributions | | | | 3,486 | | | 51,911 | | | | 1,873 | | | 27,834 |
| Payments for shares redeemed | | | | (2,308) | | | (36,003) | | | | (1,596) | | | (22,959) |
| Total increase (decrease) | | | | 5,271 | | $ | 79,886 | | | | 2,350 | | $ | 34,728 |
| | | | | | | | | | | | | | | |
See accompanying notes which are an integral part of the financial statements.
Global Real Estate Securities Fund 133
Russell Investment Funds
Global Real Estate Securities Fund
Financial Highlights — For the Periods Ended
For a Share Outstanding Throughout Each Period.
| | $ | $ | $ | $ | $ | | $ |
| | Net Asset Value, | Net | Net Realized | Total from | Distributions | | Distributions |
| | Beginning of | Investment | and Unrealized | Investment | from Net | | from Net |
| | Period | Income (Loss)(a)(b) | Gain (Loss) | Operations | Investment Income | | Realized Gain |
| December 31, 2013 | 15 . 37 | . 31 | . 24 | . 55 | ( . 63) | | ( . 61) |
| December 31, 2012 | 12 . 65 | . 30 | 3 . 15 | 3 . 45 | ( . 73) | | — |
| December 31, 2011 | 13 . 92 | . 29 | (1 . 25) | ( . 96) | ( . 31) | | — |
| December 31, 2010 | 11 . 58 | . 33 | 2 . 29 | 2 . 62 | ( . 28) | | — |
| December 31, 2009 | 9 . 30 | . 30 | 2 . 41 | 2 . 71 | ( . 43) | | — |
See accompanying notes which are an integral part of the financial statements.
134 Global Real Estate Securities Fund
| | | | | % | % | % | |
| | $ | | $ | Ratio of Expenses | Ratio of Expenses | Ratio of Net | |
| | Net Asset Value, | % | Net Assets, | to Average | to Average | Investment Income | % |
| $ | End of | Total | End of Period | Net Assets, | Net Assets, | to Average | Portfolio |
| Total Distributions | Period | Return(d) | (000) | Gross | Net(b) | Net Assets(b) | Turnover Rate |
| (1 . 24) | 14 . 68 | 3 . 70 | 658,413 | . 93 | . 93 | 1 . 97 | 72 |
| ( . 73) | 15 . 37 | 27 . 56 | 608,360 | . 95 | . 95 | 2 . 08 | 59 |
| ( . 31) | 12 . 65 | (7 . 05) | 470,964 | . 95 | . 95 | 2 . 11 | 57 |
| ( . 28) | 13 . 92 | 22 . 92 | 493,896 | . 99 | . 99 | 2 . 62 | 150 |
| ( . 43) | 11 . 58 | 31 . 16 | 410,708 | . 97 | . 97 | 3 . 36 | 110 |
See accompanying notes which are an integral part of the financial statements.
Global Real Estate Securities Fund 135
Russell Investment Funds
Notes to Schedules of Investments — December 31, 2013
| Footnotes: |
| (Æ) | | Nonincome-producing security. |
| (ö) | | Real Estate Investment Trust (REIT) . |
| (§) | | All or a portion of the shares of this security are held as collateral in connection with futures contracts purchased (sold), options |
| | | written, or swaps entered into by the Fund. |
| (~ ) | | Rate noted is yield-to-maturity from date of acquisition. |
| (ç) | | At amortized cost, which approximates market. |
| (Ê) | | Adjustable or floating rate security. Rate shown reflects rate in effect at period end. |
| (Ï) | | Forward commitment. |
| (ƒ) | | Perpetual floating rate security. Rate shown reflects rate in effect at period end. |
| (µ) | | Bond is insured by a guarantor. |
| (æ) | | Pre-refunded: These bonds are collateralized by U. S. Treasury securities, which are held in escrow by a trustee and used to pay |
| | | principal and interest in the tax-exempt issue and to retire the bonds in full at the earliest refunding date. |
| (Ø) | | In default. |
| (ß) | | Illiquid security. |
| (x) | | The security is purchased with the cash collateral from the securities loaned. |
| (Ñ) | | All or a portion of the shares of this security are on loan. |
| (Þ) | | Restricted security. Security may have contractual restrictions on resale, may have been offered in a private placement transaction, |
| | | and may not be registered under the Securities Act of 1933. |
| (Å) | | Illiquid and restricted security. |
| (å) | | Currency balances were held in connection with futures contracts purchased (sold), options written, or swaps entered into by the |
| | | Fund. See Note 2. |
| (∞) | | Unrounded units |
Abbreviations:
144A - Represents private placement security for qualified buyers according to rule 144A of the Securities Act of 1933. ADR - American Depositary Receipt ADS - American Depositary Share BBSW - Bank Bill Swap Reference Rate CIBOR - Copenhagen Interbank Offered Rate CME - Chicago Mercantile Exchange CMO - Collateralized Mortgage Obligation CVO - Contingent Value Obligation EMU - European Economic and Monetary Union EURIBOR - Euro Interbank Offered Bank FDIC - Federal Deposit Insurance Company GDR - Global Depositary Receipt GDS - Global Depositary Share LIBOR - London Interbank Offered Rate NIBOR - Norwegian Interbank Offered Rate PIK - Payment in Kind REMIC - Real Estate Mortgage Investment Conduit STRIP - Separate Trading of Registered Interest and Principal of Securities TBA - To Be Announced Security UK - United Kingdom
136 Notes to Schedules of Investments
Russell Investment Funds
Notes to Schedules of Investments, continued — December 31, 2013
| Foreign Currency Abbreviations: | | | | |
| ARS - Argentine peso | | HUF - Hungarian forint | | PKR - Pakistani rupee |
| AUD - Australian dollar | | IDR - Indonesian rupiah | | PLN - Polish zloty |
| BRL - Brazilian real | | ILS - Israeli shekel | | RUB - Russian ruble |
| CAD - Canadian dollar | | INR - Indian rupee | | SEK - Swedish krona |
| CHF - Swiss franc | | ISK - Iceland krona | | SGD - Singapore dollar |
| CLP - Chilean peso | | ITL - Italian lira | | SKK - Slovakian koruna |
| CNY - Chinese renminbi yuan | | JPY - Japanese yen | | THB - Thai baht |
| COP - Colombian peso | | KES - Kenyan schilling | | TRY - Turkish lira |
| CRC - Costa Rica colon | | KRW - South Korean won | | TWD - Taiwanese dollar |
| CZK - Czech koruna | | MXN - Mexican peso | | USD - United States dollar |
| DKK - Danish krone | | MYR – Malaysian ringgit | | VEB - Venezuelan bolivar |
| EGP - Egyptian pound | | NOK - Norwegian krone | | VND - Vietnam dong |
| EUR - Euro | | NZD - New Zealand dollar | | ZAR - South African rand |
| GBP - British pound sterling | | PEN - Peruvian nuevo sol | | |
| HKD – Hong Kong dollar | | PHP – Philippine peso | | |
Notes to Schedules of Investments 137
Russell Investment Funds
Notes to Financial Highlights — December 31, 2013
| (a) | | Average daily shares outstanding were used for this calculation. |
| (b) | | May reflect amounts waived and/or reimbursed by Russell Investment Management Company (“RIMCo”) and for certain funds, custody credit |
| | | arrangements. |
| (c) | | Less than $. 01 per share. |
| (d) | | The total return does not reflect any Insurance Company Separate Account or Policy Charges. |
| | | |
See accompanying notes which are an integral part of the financial statements.
138 Notes to Financial Highlights
Russell Investment Funds
Notes to Financial Statements — December 31, 2013
1. Organization
Russell Investment Funds (the “Investment Company” or “RIF”) is a series investment company with 9 different investment portfolios
referred to as Funds. These financial statements report on five of these Funds (each a “Fund” and collectively the “Funds”). The
Investment Company provides the investment base for one or more variable insurance products issued by one or more insurance
companies. These Funds are offered at net asset value (“NAV”) to qualified insurance company separate accounts offering variable
insurance products. The Investment Company is registered under the Investment Company Act of 1940, as amended (“Investment
Company Act”), as an open-end management investment company. It is organized and operated as a Massachusetts business trust
under an Amended and Restated Master Trust Agreement dated October 1, 2008, as amended (“Master Trust Agreement”). The
Investment Company’s Master Trust Agreement permits the Board of Trustees (the “Board”) to issue an unlimited number of shares
of beneficial interest.
2. Significant Accounting Policies
The Funds’ financial statements are prepared in accordance with U.S. generally accepted accounting principles (“U.S. GAAP”),
which require the use of management estimates and assumptions at the date of the financial statements. Actual results could differ
from those estimates. The following is a summary of the significant accounting policies consistently followed by each Fund in the
preparation of its financial statements.
Security Valuation
The Funds value portfolio securities according to Board-approved securities valuation procedures which include market and fair
value procedures. Debt obligation securities maturing within 60 days at the time of purchase are priced using the amortized cost
method of valuation, unless the Board determines that amortized cost does not represent the fair value of such short-term debt
obligation securities. The Board has delegated the responsibility for administration of the securities valuation procedures to Russell
Fund Services Company (“RFSC”).
U.S. GAAP defines fair value as the price that a Fund would receive to sell an asset or pay to transfer a liability in an orderly
transaction between market participants at the measurement date. It establishes a fair value hierarchy that prioritizes inputs to
valuation methods and requires a separate disclosure of the fair value hierarchy for each major category of assets and liabilities,
that segregates fair value measurements into levels (Level 1, 2, and 3). The inputs or methodology used for valuing securities are
not necessarily an indication of the risk associated with investing in those securities. Levels 1, 2 and 3 of the fair value hierarchy
are defined as follows:
• Level 1 — Quoted prices (unadjusted) in active markets or exchanges for identical assets and liabilities.
• Level 2 — Inputs other than quoted prices included within Level 1 that are observable, which may include, but are not
limited to, quoted prices for similar assets or liabilities in markets that are active, quoted prices for identical or similar assets
or liabilities in markets that are not active, inputs such as interest rates, yield curves, implied volatilities, credit spreads or
other market corroborated inputs.
• Level 3 — Significant unobservable inputs based on the best information available in the circumstances, to the extent
observable inputs are not available, which may include assumptions made by RFSC, acting at the discretion of the Board,
that are used in determining the fair value of investments.
The availability of observable inputs can vary from security to security and is affected by a wide variety of factors, including, for
example, the type of security, whether the security is new and not yet established in the marketplace, the liquidity of markets, and
other characteristics particular to the security. To the extent that valuation is based on models or inputs that are less observable or
unobservable in the market, the determination of fair value requires more judgment. Accordingly, the degree of judgment exercised
in determining fair value is greatest for instruments categorized in Level 3.
The inputs used to measure fair value may fall into different levels of the fair value hierarchy. In such cases, for disclosure purposes,
the level in the fair value hierarchy within which the fair value measurement falls in its entirety is determined based on the lowest
level input that is significant to the fair value measurement in its entirety.
The valuation techniques and significant inputs used in determining the fair market values of financial instruments categorized as
Level 1 and Level 2 of the fair value hierarchy are as follows:
Equity securities, including common and preferred stock, that are traded on a national securities exchange (or reported on the
NASDAQ national market) are stated at the last reported sales price on the day of valuation. To the extent these securities are
actively traded, and valuation adjustments are not applied, they are categorized as Level 1 of the fair value hierarchy. Certain
Notes to Financial Statements 139
Russell Investment Funds
Notes to Financial Statements, continued — December 31, 2013
foreign equity securities may be fair valued using a pricing service that considers the correlation of the trading patterns of the foreign security to the intraday trading in the U.S. markets for investments such as American Depositary Receipts, financial futures, exchange traded funds, and the movement of certain indexes of securities, based on the statistical analysis of historical relationships. Preferred stock and other equities traded on inactive markets or valued by reference to similar instruments are categorized as Level 2 of the fair value hierarchy.
Fixed income securities including corporate, convertible, U.S. government agency, municipal bonds and notes, U.S. treasury obligations, sovereign issues, bank loans, bank notes and non-U.S. bonds are normally valued by pricing service providers that use broker dealer quotations or valuation estimates from their internal pricing models. The pricing service providers’ internal models use inputs that are observable such as issuer details, interest rates, yield curves, prepayment speeds, credit risks/spreads and default rates. Such fixed income securities that use similar valuation techniques and inputs as described above are categorized as Level 2 of the fair value hierarchy.
Fixed income securities purchased on a delayed-delivery basis and marked-to-market daily until settlement at the forward settlement date are categorized as Level 2 of the fair value hierarchy.
Mortgage and asset-backed securities are usually issued as separate tranches, or classes, of securities within each deal. These securities are also normally valued by pricing service providers that use broker dealer quotations or valuation estimates from their internal pricing models. The pricing models for these securities usually consider tranche-level attributes including estimated cash flows of each tranche, market-based yield spreads for each tranche, and current market data, as well as incorporate deal collateral performance, as available. Mortgage and asset-backed securities that use these and similar valuation techniques and inputs as described above are categorized as Level 2 of the fair value hierarchy.
Investments in privately held investment funds will be valued based upon the NAV of such investments and are categorized as Level 2 of the fair value hierarchy if the privately-held investment funds’ redemption terms require 90 days notice or less. If the redemption terms require greater than 90 days notice for redemptions, then the investment will be categorized as Level 3. The Funds have adopted the authoritative guidance under U.S. GAAP for estimating the fair value of investments in funds that have calculated NAV per share in accordance with the specialized accounting guidance for investment companies. Accordingly, the Funds estimate the fair value of an investment in a fund using the NAV per share without further adjustment as a practical expedient, if the NAV per share of the investment is determined in accordance with the specialized accounting guidance for investment companies as of the reporting entity’s measurement date.
Short-term investments having a maturity of 60 days or less are generally valued at amortized cost, which approximates fair market value. These investments are categorized as Level 2 of the fair value hierarchy.
Derivative instruments are instruments such as foreign currency contracts, futures contracts, options contracts, or swap agreements that derive their value from underlying asset prices, indices, reference rates, and other inputs or a combination of these factors. Derivatives may be classified into two groups depending upon the way that they are traded: privately traded over-the-counter (“OTC”) derivatives that do not go through an exchange or intermediary and exchange-traded derivatives that are traded through specialized derivatives exchanges or other regulated exchanges. OTC derivatives are normally valued on the basis of broker-dealer quotations or pricing service providers. Depending on the product and the terms of the transaction, the value of the derivative instrument can be estimated by a pricing service provider using a series of techniques, including simulation pricing models. The pricing models use inputs that are observed from actively quoted markets such as issuer details, indices, spreads, interest rates, yield curves, dividends and exchange rates. OTC derivatives that use these and similar valuation techniques and inputs as described above are categorized as Level 2 of the fair value hierarchy. Exchange-traded derivatives are valued based on the last reported sales price on the day of valuation and are categorized as Level 1 of the fair value hierarchy.
Centrally cleared swaps listed or traded on a multilateral or trade facility platform, such as a registered exchange, are valued at the daily settlement price determined by the respective exchange. For centrally cleared credit default swaps the clearing facility requires its members to provide actionable levels across complete term structures. These levels along with external third party prices are used to produce daily settlement prices. These securities are categorized as Level 2 of the fair value hierarchy. Centrally cleared interest rate swaps are valued using a pricing model that references the underlying rates including the overnight index swap rate and London Interbank Offered Rate (“LIBOR”) forward rate to produce the daily settlement price. These securities are categorized as Level 2 of the fair value hierarchy.
Events or circumstances affecting the values of Fund securities that occur between the closing of the principal markets on which they trade and the time the NAV of Fund shares is determined may be reflected in the calculation of NAV for each applicable Fund when the Fund deems that the particular event or circumstance would materially affect such Fund’s NAV. Funds that invest
140 Notes to Financial Statements
Russell Investment Funds
Notes to Financial Statements, continued — December 31, 2013
primarily in frequently traded exchange-listed securities will use fair value pricing in limited circumstances since reliable market quotations will often be readily available. Funds that invest in foreign securities are likely to use fair value pricing more often since significant events may occur between the close of foreign markets and the time of pricing which would trigger fair value pricing of the foreign securities. Although there are observable inputs assigned on a security level, prices are derived from factors using proprietary models or matrix pricing. For this reason, significant events will cause movement between Levels 1 and 2. Examples of significant events that could trigger fair value pricing of one or more securities are: a material market movement of the U.S. securities market (defined in the fair value procedures as the movement by a single major U.S. index greater than a certain percentage) or other significant event; foreign market holidays if, on a daily basis, a Fund’s foreign exposure exceeds 20% in aggregate (all closed markets combined); a company development; a natural disaster or emergency situation; or an armed conflict.
The NAV of a Fund’s portfolio that includes foreign securities may change on days when shareholders will not be able to purchase or redeem Fund shares, since foreign securities can trade on non-business days.
The Multi-Style Equity, Global Real Estate Securities and Aggressive Equity Funds had no transfers between Levels 1, 2, and 3 for the period ended December 31, 2013.
At the beginning of the period, the Non-U.S. Fund had transfers out of Level 1 into Level 2 representing financial instruments for which restrictions existed and adjustments were made to the otherwise observable price to reflect their fair value. At the end of the period, the Non-U.S. Fund has transfers out of Level 2 back into Level 1 since no fair value pricing was applied. As of December 31, 2013, the amount transferred from Level 2 to Level 1 was $174,792,620.
The Core Bond Fund had transfers out of Level 3 into Level 2 representing financial instruments for which approved pricing became available. The amounts transferred were as follows:
Core Bond Fund
$ 1,268,043
Level 3 Fair Value Investments
The valuation techniques and significant inputs used in determining the fair values of financial instruments classified as Level 3 of the fair value hierarchy are as follows: Securities and other assets for which market quotes are not readily available, or are not reliable, are valued at fair value as determined in good faith by RFSC and are categorized as Level 3 of the fair value hierarchy. Market quotes are considered not readily available in circumstances where there is an absence of current or reliable market-based data (e.g., trade information or broker quotes). When RFSC applies fair valuation methods that use significant unobservable inputs to determine a Fund’s NAV, securities will not be priced on the basis of quotes from the primary market in which they are traded, but instead may be priced by another method that RFSC believes accurately reflects fair value and will be categorized as Level 3 of the fair value hierarchy. Fair value pricing may require subjective determinations about the value of a security. While the securities valuation procedures are intended to result in a calculation of a Fund’s NAV that fairly reflects security values as of the time of pricing, the process cannot guarantee that fair values determined by RFSC would accurately reflect the price that a Fund could obtain for a security if it were to dispose of that security as of the time of pricing (for instance, in a forced or distressed sale). The prices used by a Fund may differ from the value that would be realized if the securities were sold.
RFSC employs third party pricing vendors to provide fair value measurements. RFSC oversees third-party pricing service providers in order to support the valuation process throughout the year.
The significant unobservable input used in fair value measurement of certain of the Funds’ preferred equity securities is the redemption value calculated on a fully-diluted basis if converted to common stock. Significant increases (decreases) in the redemption value would have a direct and proportional impact to fair value.
The significant unobservable input used in the fair value measurement of certain of the Funds’ debt securities is the yield to worst ratio. Significant increases (decreases) in the yield to worst ratio would result in a lower (higher) fair value measurement.
If third party evaluated vendor pricing is neither available or deemed to be indicative of fair value, RFSC may elect to obtain indicative market quotations (“broker quotes”) directly from the broker or passed through from a third party vendor. In the event that the source of fair value is from a single source broker quote, these securities are classified as Level 3 per the fair value hierarchy. Broker quotes are typically received from established market participants. Although independently received on a daily basis, RFSC does not have the transparency to view the underlying inputs which support the broker quotes. Significant changes in the broker quote would have direct and proportional changes in the fair value of the security. There is a third-party pricing exception to the quantitative disclosure requirement when prices are not determined by the reporting entity. RFSC is exercising
Notes to Financial Statements 141
Russell Investment Funds
Notes to Financial Statements, continued — December 31, 2013
this exception and has made a reasonable attempt to obtain quantitative information from the third party pricing vendors regarding the unobservable inputs used.
For fair valuations using significant unobservable inputs, U.S. GAAP requires a reconciliation of the beginning to ending balances for reported fair values that present changes attributable to total realized and unrealized gains or losses, purchases and sales, and transfers in/out of the Level 3 category during the period. Additionally, U.S. GAAP requires quantitative information regarding the significant unobservable inputs used in the determination of fair value of assets categorized as Level 3 in the fair value hierarchy. In accordance with the requirements of U.S. GAAP, a fair value hierarchy, Level 3 reconciliation and additional disclosure about fair value measurements, if any, have been included in the Presentation of Portfolio Holdings for each respective Fund.
Investment Transactions
Investment transactions are reflected as of the trade date for financial reporting purposes. This may cause the NAV stated in the financial statements to be different from the NAV at which shareholders may transact. Realized gains and losses from securities transactions, if applicable, are recorded on the basis of specific identified cost incurred by each money manager within a particular Fund.
Investment Income
Dividend income is recorded net of applicable withholding taxes on the ex-dividend date, except that certain dividends from foreign securities are recorded as soon thereafter as the Funds are informed subsequent to the ex-dividend date. Interest income is recorded daily on the accrual basis. The Core Bond Fund classifies gains and losses realized on prepayments received on mortgage-backed securities as an adjustment to interest income. All premiums and discounts, including original issue discounts, are amortized/ accreted using the effective interest method. Debt obligation securities may be placed in a non-accrual status and related interest income may be reduced by stopping current accruals and writing off interest receivable when the collection of all or a portion of interest has become doubtful.
Federal Income Taxes
Since the Investment Company is a Massachusetts business trust, each Fund is a separate corporate taxpayer and determines its net investment income and capital gains (or losses) and the amounts to be distributed to each Fund’s shareholders without regard to the income and capital gains (or losses) of the other Funds.
For each year, each Fund intends to qualify as a regulated investment company under sub-chapter M of the Internal Revenue Code (the “Code”) and intends to distribute all of its taxable income and capital gains. Therefore, no federal income tax provision is required for the Funds.
The Funds comply with the authoritative guidance for uncertainty in income taxes which requires management to determine whether a tax position of the Funds is more likely than not to be sustained upon examination, including resolution of any related appeals or litigation processes, based on the technical merits of the position. For tax positions meeting the more likely than not threshold, the tax amount recognized in the financial statements is reduced by the largest benefit that has a greater than 50% likelihood of being realized upon ultimate settlement with the relevant taxing authority. Management determined that no accruals need to be made in the financial statements due to uncertain tax positions. Management continually reviews and adjusts its liability for income taxes based on analyses of tax laws and regulations, as well as their interpretations, and other relevant factors.
Each Fund files a U.S. tax return. At December 31, 2013, the Funds had recorded no liabilities for net unrecognized tax benefits relating to uncertain income tax positions they have taken or expect to take in future tax returns. While the statute of limitations remains open to examine the Funds’ U.S. tax returns filed for the fiscal years ending December 31, 2010 through December 31, 2012, no examinations are in progress or anticipated at this time. The Funds are not aware of any tax positions for which it is reasonably possible that the total amounts of unrecognized tax benefits will significantly change in the next twelve months.
Dividends and Distributions to Shareholders
For all Funds, income and capital gain distributions, if any, are recorded on the ex-dividend date. Income distributions are generally declared and paid according to the following schedule:
| Declared | | Payable | | Funds |
| Quarterly | | April, July, October and mid-December | | Multi-Style Equity, Aggressive Equity, Core Bond and Global |
| | | | | Real Estate Securities Funds |
| Annually | | Mid-December | | Non-U. S. Fund |
142 Notes to Financial Statements
Russell Investment Funds
Notes to Financial Statements, continued — December 31, 2013
Capital gain distributions are generally declared and paid annually. An additional distribution may be paid by the Funds to avoid imposition of federal income and excise tax on any remaining undistributed capital gains and net investment income.
The timing and characterization of certain income and capital gain distributions are determined in accordance with federal tax regulations which may differ from U.S. GAAP. As a result, net investment income and net realized gain (or loss) on investment and foreign currency-related transactions for a reporting period may differ significantly from distributions during such period. The differences between tax regulations and U.S. GAAP primarily relate to investments in options, futures, forward contracts, swap contracts, passive foreign investment companies, foreign-denominated investments, mortgage-backed securities, certain securities sold at a loss and capital loss carryforwards. Accordingly, the Funds may periodically make reclassifications among certain of their capital accounts without impacting their net asset values.
Expenses
The Funds pay their own expenses other than those expressly assumed by Russell Investment Management Company (“RIMCo”), the Funds’ adviser, or RFSC. Most expenses can be directly attributed to the individual Funds. Expenses which cannot be directly attributed to a specific Fund are allocated among all Funds principally based on their relative net assets.
Foreign Currency Translations
The books and records of the Funds are maintained in U.S. dollars. Foreign currency amounts and transactions of the Funds are translated into U.S. dollars on the following basis:
| (a) | Fair value of investment securities, other assets and liabilities at the closing rate of exchange on the valuation date. |
| (b) | Purchases and sales of investment securities and income at the closing rate of exchange prevailing on the respective trade |
dates of such transactions.
Net realized gains or losses from foreign currency-related transactions arise from: sales and maturities of short-term securities; sales of foreign currencies; currency gains or losses realized between the trade and settlement dates on securities transactions; the difference between the amounts of dividends, interest, and foreign withholding taxes recorded on the Funds’ books and the U.S. dollar equivalent of the amounts actually received or paid. Net unrealized gains or losses from foreign currency-related transactions arise from changes in the value of assets and liabilities, other than investments in securities, as a result of changes in the exchange rates.
The Funds do not isolate that portion of the results of operations of the Funds that arises as a result of changes in exchange rates from that portion that arises from changes in market prices of investments during the year. Such fluctuations are included with the net realized and unrealized gain or loss from investments. However, for federal income tax purposes, the Funds do isolate the effects of changes in foreign exchange rates from the fluctuations arising from changes in market prices for realized gain (or loss) on debt obligations.
Capital Gains Taxes
The Non-U.S. and Global Real Estate Securities Funds may be subject to capital gains taxes and repatriation taxes imposed by certain countries in which they invest. The Non-U.S. and Global Real Estate Securities Funds may record a deferred capital gains tax liability with respect to the unrealized appreciation on foreign securities for potential capital gains and repatriation taxes at December 31, 2013. The accrual for capital gains and repatriation taxes is included in net unrealized appreciation (depreciation) on investments in the Statements of Assets and Liabilities. The amounts related to capital gains and repatriation taxes paid are included in net realized gain (loss) on investments in the Statements of Operations. The Non-U.S. and Global Real Estate Securities Funds had deferred capital gains tax liability of $9,587 and $0, respectively, as of December 31, 2013. The Non-U.S. Fund had a $527 included in net realized gain (loss) on investments in the statements of operations related to capital gains taxes for the period ended December 31, 2013.
Derivatives
To the extent permitted by the investment objectives, restrictions and policies set forth in the Funds’ Prospectuses and Statement of Additional Information, the Funds may participate in various derivative-based transactions. Derivative securities are instruments or agreements whose value is derived from an underlying security or index. They include options, futures, swaps and forwards. These instruments offer unique characteristics and risks that facilitate the Funds’ investment strategies.
The Funds typically use derivatives in three ways: exposing cash to markets, hedging and return enhancement. In addition, the Non-U.S. and Global Real Estate Securities Funds may enter into foreign exchange contracts for trade settlement purposes. The
Notes to Financial Statements 143
Russell Investment Funds
Notes to Financial Statements, continued — December 31, 2013
Funds may pursue their strategy of being fully invested by exposing cash to the performance of appropriate markets by purchasing securities and/or derivatives. This is intended to cause the Funds to perform as though cash were actually invested in those markets.
Hedging may be used by certain Funds to limit or control risks, such as adverse movements in exchange rates and interest rates. Return enhancement can be accomplished through the use of derivatives in a Fund, including using derivatives as a substitute for holding physical securities, and using them to express various macro views (e.g., interest rate movements, currency movements, and macro credit strategies). By purchasing certain instruments, the Funds may more effectively achieve the desired portfolio characteristics that assist them in meeting their investment objectives. Depending on how the derivatives are structured and utilized, the risks associated with them may vary widely. These risks include, but are not limited to, market risk, liquidity risk, counterparty risk, basis risk, reinvestment risk, political risk, prepayment risk, extension risk and credit risk.
Futures, certain options and cleared swaps are traded or cleared on an exchange or central exchange clearing house. Exchange traded or cleared transactions generally present less counterparty risk to a Fund. The exchange’s clearinghouse stands between the Fund and the broker to the contract and therefore, credit risk is generally limited to the failure of the clearinghouse and the clearing member. Cleared swap contracts are subject to clearing house rules, including initial and variation margin requirement, daily settlement of obligations and the clearinghouse guarantee of payments to the broker. There is, however, still counterparty risk due to the insolvency of the broker with respect to any margin held in the brokers’ customer accounts. While clearing members are required to segregate customer assets from their own assets, in the event of insolvency, there may be a shortfall in the amount of margin held by the broker for its clients. Collateral and margin requirements for exchange-traded or cleared derivatives are set by the broker or applicable clearinghouse. Margin for exchange-traded and exchange cleared transactions are detailed in the Statements of Assets and Liabilities as cash held at the broker for futures contracts and cash held at the broker for swap contracts, respectively. Securities pledged by a Fund for exchange-traded and cleared transactions are noted as collateral or margin requirements in the Schedule of Investments.
The effects of derivative instruments, categorized by risk exposure, on the Statements of Assets and Liabilities and the Statements of Operations, for the period ended December 31, 2013, if applicable, are disclosed in the Fair Value of Derivative Instruments table following each applicable Fund’s Schedule of Investments.
Foreign Currency Exchange Contracts
In connection with investment transactions consistent with the Funds’ investment objectives and strategies, certain Funds may enter into foreign currency exchange spot contracts and forward foreign currency exchange contracts (“FX contracts”). From time to time, certain Funds may enter into FX contracts to hedge certain foreign currency-denominated assets. FX contracts are recorded at fair value. Certain risks may arise upon entering into these FX contracts from the potential inability of counterparties to meet the terms of their FX contracts and are generally limited to the amount of unrealized gain on the FX contracts, if any, that are disclosed in the Statements of Assets and Liabilities.
For the period ended December 31, 2013, the following Funds entered into foreign currency exchange contracts primarily for the strategies listed below:
Funds
Strategies
Non-U.S. Fund Exposing cash to markets and trade settlement Core Bond Fund Return enhancement and hedging Global Real Estate Securities Fund Exposing cash to markets and trade settlement
The Funds’ foreign currency contract notional dollar values outstanding fluctuate throughout the fiscal year as required to meet strategic requirements. The following tables illustrate the quarterly volume of foreign currency contracts. For the purpose of this disclosure, volume is measured by the amounts bought and sold in USD.
| | | | | | | | | Outstanding Contract Amounts Bought | | |
| Quarter Ended | March 31, 2013 | | June 30, 2013 | | September 30, 2013 | December 31, 2013 |
| Non-U. S. Fund | $ | | 20,245,033 | $ | | 25,910,875 | $ | | 34,749,898 | | $29,561,688 |
| Core Bond Fund | | | 224,133,730 | | | 244,800,863 | | | 186,966,391 | | 274,727,541 |
| Global Real Estate Securities Fund | | | 17,240,083 | | | 13,606,584 | | | 28,186,323 | | 22,458,128 |
| | | | | | | | | Outstanding Contract Amounts Sold | | |
| Quarter Ended | March 31, 2013 | | June 30, 2013 | | September 30, 2013 | December 31, 2013 |
| Non-U. S. Fund | $ | | 20,164,938 | $ | | 26,355,711 | $ | | 34,385,109 | | $29,647,401 |
| Core Bond Fund | | | 217,408,778 | | | 229,931,399 | | | 187,866,585 | | 272,702,022 |
| Global Real Estate Securities Fund | | | 17,244,672 | | | 13,779,493 | | | 28,036,958 | | 22,592,115 |
| |
| Options | | | | | | | | | | | | | | | |
| |
| 144 Notes to Financial Statements | | | | | | | | | | | | | | | |
Russell Investment Funds
Notes to Financial Statements, continued — December 31, 2013
The Funds may purchase and sell (write) call and put options on securities and securities indices, provided such options are traded on a national securities exchange or in an over-the-counter market. The Funds may also purchase and sell (write) call and put options on foreign currencies. The Funds may utilize options to expose cash to markets.
When a Fund writes a covered call or a put option, an amount equal to the premium received by the Fund is included in the Fund’s Statement of Assets and Liabilities as an asset and as an equivalent liability. The amount of the liability is subsequently marked-to-market to reflect the current fair value of the option written. The Fund receives a premium on the sale of a call option but gives up the opportunity to profit from any increase in the value of the underlying instrument above the exercise price of the option, and when the Fund writes a put option it is exposed to a decline in the price of the underlying instrument.
Whether an option which the Fund has written expires on its stipulated expiration date or the Fund enters into a closing purchase transaction, the Fund realizes a gain (or loss, if the cost of a closing purchase transaction exceeds the premium received when the option was sold) without regard to any unrealized gain or loss on the underlying security, and the liability related to such option is extinguished. If a call option which the Fund has written is exercised, the Fund realizes a capital gain or loss from the sale of the underlying security, and the proceeds from such sale are increased by the premium originally received. When a put option which a Fund has written is exercised, the amount of the premium originally received will reduce the cost of the security which a Fund purchases upon exercise of the option.
The Funds’ use of written options involves, to varying degrees, elements of market risk in excess of the amount recognized in the Statements of Assets and Liabilities. The face or contract amounts of these instruments reflect the extent of the Funds’ exposure to market risk. The risks may be caused by an imperfect correlation between movements in the price of the instrument and the price of the underlying securities and interest rates.
A Fund may enter into a swaption (swap option). In a swaption, the buyer gains the right but not the obligation to enter into a specified swap agreement with the issuer on a specified future date. The writer of the contract receives the premium and bears the risk of unfavorable changes in the preset rate on the underlying interest rate swap.
For the period ended December 31, 2013, the Core Bond Fund purchased/sold options primarily for return enhancement, hedging and exposing cash to markets.
The Core Bond Fund’s options contracts outstanding fluctuate throughout the fiscal year as required to meet strategic requirements. The following table illustrates the quarterly volume of options contracts. For purpose of this disclosure, volume is measured by contracts outstanding at period end.
| | | | Number of Option Contracts Outstanding | | |
| Quarter Ended | March 31, 2013 | | June 30, 2013 | | September 30, 2013 | December 31, 2013 |
| Core Bond Fund | 179 | | 81 | | 26 | | 54 |
Futures Contracts
The Funds may invest in futures contracts (i.e., interest rate, foreign currency and index futures contracts). The face or contract amounts of these instruments reflect the extent of the Funds’ exposure to off balance-sheet risk. The primary risks associated with the use of futures contracts are an imperfect correlation between the change in fair value of the securities held by the Funds and the prices of futures contracts and the possibility of an illiquid market. Upon entering into a futures contract, the Funds are required to deposit with a broker an amount, termed the initial margin, which typically represents 5% to 10% of the purchase price indicated in the futures contract. Payments to and from the broker, known as variation margin, are typically required to be made on a daily basis as the price of the futures contract fluctuates. Changes in initial settlement value are accounted for as unrealized appreciation (depreciation) until the contracts are terminated, at which time realized gains and losses are recognized.
For the period ended December 31, 2013, the following Funds entered into futures contracts primarily for the strategies listed below:
Funds
Multi-Style Equity Fund
Aggressive Equity Fund
Non-U.S. Fund
Core Bond Fund
Global Real Estate Securities Fund
Strategies
Exposing cash to markets
Exposing cash to markets
Hedging and exposing cash to markets
Return enhancement, hedging and exposing cash to markets
Exposing cash to markets
The Funds’ futures contracts outstanding fluctuate throughout the fiscal year as required to meet strategic requirements. The following table illustrates the quarterly volume of all futures contracts. For purpose of this disclosure, volume is measured by contracts outstanding at period end.
Notes to Financial Statements 145
Russell Investment Funds
Notes to Financial Statements, continued — December 31, 2013
| | | | | Number of Futures Contracts Outstanding | | |
| Quarter Ended | | March 31, 2013 | | June 30, 2013 | September 30, 2013 | December 31, 2013 |
| Multi-Style Equity Fund | | 305 | | 282 | | 337 | | 306 |
| Aggressive Equity Fund | | 64 | | 70 | | 119 | | 112 |
| Non-U. S. Fund | | 244 | | 655 | | 868 | | 925 |
| Core Bond Fund | | 1,033 | | 908 | | 1,657 | | 2,397 |
| Global Real Estate Securities Fund | | 588 | | 392 | | 405 | | 714 |
Swap Agreements
The Funds may enter into swap agreements, on either an asset-based or liability-based basis, depending on whether they are hedging their assets or their liabilities, and will usually enter into swaps on a net basis, i.e., the two payment streams are netted out, with the Funds receiving or paying, as the case may be, only the net amount of the two payments. When a Fund engages in a swap, it exchanges its obligations to pay or rights to receive payments for the obligations or rights to receive payments of another party (i.e., an exchange of floating rate payments for fixed rate payments).
Certain Funds may enter into several different types of swap agreements including credit default, interest rate, index (total return) and currency swaps. Credit default swaps are a counterparty agreement which allows the transfer of third party credit risk (the possibility that an issuer will default on its obligation by failing to pay principal or interest in a timely manner) from one party to another. The lender faces the credit risk from a third party and the counterparty in the swap agrees to insure this risk in exchange for regular periodic payments. Interest rate swaps are a counterparty agreement, can be customized to meet each party’s needs, and involve the exchange of a fixed or variable payment per period for a payment that is not fixed. The Funds may enter into index swap agreements to expose cash to markets or to effect investment transactions consistent with those Funds’ investment objectives and strategies. Currency swaps are an agreement where two parties exchange specified amounts of different currencies which are followed by each paying the other a series of interest payments that are based on the principal cash flow. At maturity the principal amounts are returned.
The Funds expect to enter into these transactions primarily to preserve a return or spread on a particular investment or portion of their portfolios or to protect against any increase in the price of securities they anticipate purchasing at a later date or for return enhancement. The net amount of the excess, if any, of the Funds’ obligations over their entitlements with respect to each swap will be accrued on a daily basis and an amount of cash or liquid assets having an aggregate NAV at least equal to the accrued excess will be segregated. To the extent that the Funds enter into swaps on other than a net basis, the amount earmarked on the Funds’ records will be the full amount of the Funds’ obligations, if any, with respect to such swaps, accrued on a daily basis. If there is a default by the other party to such a transaction, the Funds will have contractual remedies pursuant to the agreement related to the transaction.
A Fund may not receive the expected amount under a swap agreement if the other party to the agreement defaults or becomes bankrupt. The market for swap agreements is largely unregulated. The Funds may enter into swap agreements with counterparties that meet the credit quality limitations of RIMCo. The Funds will not enter into any swap unless the counterparty has a minimum senior unsecured credit rating or long-term counterparty credit rating, including reassignments, of BBB- or better as defined by Standard & Poor’s or an equivalent rating from any nationally recognized statistical rating organization (using highest of split ratings) at the time of entering into such transaction.
Credit Default Swaps
The Core Bond Fund may enter into credit default swaps. A credit default swap can refer to corporate or government issues, asset-backed securities or an index of assets, each known as the reference entity or underlying asset. The Fund may act as either the buyer or the seller of a credit default swap involving one party making a stream of payments to another party in exchange for the right to receive a specified return in the event of a default or other credit event. Depending upon the terms of the contract, the credit default swap may be closed via physical settlement or cash settlement. However, due to the possible or potential instability in the market, there is a risk that the Fund may be unable to deliver the underlying debt security to the other party to the agreement. Additionally, the Fund may not receive the expected amount under the swap agreement if the other party to the agreement defaults or becomes bankrupt. In an unhedged credit default swap, the Fund enters into a credit default swap without owning the underlying asset or debt issued by the reference entity. Credit default swaps allow the Fund to acquire or reduce credit exposure to a particular issuer, asset or basket of assets.
As the seller of protection in a credit default swap, the Fund would be required to pay the par or other agreed-upon value (or otherwise perform according to the swap contract) of a reference debt obligation to the counterparty in the event of a default (or other specified credit event); the counterparty would be required to surrender the reference debt obligation. In return, the Fund would receive from the counterparty a periodic stream of payments over the term of the contract provided that no credit event has
146 Notes to Financial Statements
Russell Investment Funds
Notes to Financial Statements, continued — December 31, 2013
occurred. If no credit event occurs, the Fund would keep the stream of payments and would have no payment obligations. As a seller of protection, the Fund would effectively add leverage to its portfolio because, in addition to its total net assets, that Fund would be subject to investment exposure on the notional amount of the swap.
The Fund may also purchase protection via credit default swap contracts in order to offset the risk of default of debt securities held in its portfolio or to take a short position in a debt security, in which case the Fund would function as the counterparty referenced in the preceding paragraph.
If a credit event occurs and cash settlement is not elected, a variety of other obligations may be delivered in lieu of the specific referenced obligation. The ability to deliver other obligations may result in a cheapest-to-deliver option (the buyer of protection’s right to choose the deliverable obligation with the lowest value following a credit event). The Fund may use credit default swaps to provide a measure of protection against defaults of the issuers (i.e., to reduce risk where the Fund owns or has exposure to the referenced obligation) or to take an active long or short position with respect to the likelihood (as measured by the credit default swap’s spread) of a particular issuer’s default.
Deliverable obligations for credit default swaps on asset-backed securities in most instances are limited to the specific referenced obligation as performance for asset-backed securities can vary across deals. Prepayments, principal paydowns, and other writedown or loss events on the underlying mortgage loans will reduce the outstanding principal balance of the referenced obligation. These reductions may be temporary or permanent as defined under the terms of the swap agreement and the notional amount for the swap agreement generally will be adjusted by corresponding amounts. The Core Bond Fund may use credit default swaps on asset-backed securities to provide a measure of protection against defaults (or other defined credit events) of the referenced obligation or to take an active long or short position with respect to the likelihood of a particular referenced obligation’s default (or other defined credit events).
Credit default swap agreements on credit indices involve one party making a stream of payments to another party in exchange for the right to receive a specified return in the event of a write-down, principal shortfall, interest shortfall or default of all or part of the referenced entities comprising the credit index. A credit index is a basket of credit instruments or exposures designed to be representative of some part of the credit market as a whole. These indices are made up of reference credits that are judged by a poll of dealers to be the most liquid entities in the credit default swap market based on the sector of the index. Components of the indices may include, but are not limited to, investment grade securities, high yield securities, asset-backed securities, emerging markets, and/or various credit ratings within each sector. Credit indices are traded using credit default swaps with standardized terms including a fixed spread and standard maturity dates. An index credit default swap references all the names in the index, and if there is a default, the credit event is settled based on that name’s weight in the index. The composition of the indices changes periodically, usually every six months, and for most indices, each name has an equal weight in the index. Traders may use credit default swaps on indices to speculate on changes in credit quality.
Implied credit spreads, represented in absolute terms, utilized in determining the fair value of credit default swap agreements on corporate issues as of period end are disclosed in the Schedules of Investments and generally serve as an indicator of the current status of the payment/performance risk and represent the likelihood or risk of default (or other defined credit event) for the credit derivative. The implied credit spread of a particular referenced entity reflects the cost of entering into a credit default swap and may include upfront payments required to be made to enter into the agreement. For credit default swap agreements on asset-backed securities and credit indices, the quoted market prices and resulting values serve as the indicator of the current status of the payment/performance risk. Wider credit spreads and increasing fair values, in absolute terms when compared to the notional amount of the swap, generally represent a deterioration of the referenced entity’s credit soundness and a greater likelihood or risk of default or other credit event occurring as defined under the terms of the agreement. The maximum potential amount of future payments (undiscounted) that the Fund as a seller of protection could be required to make under a credit default swap agreement equals the notional amount of the agreement. Notional amounts of all credit default swap agreements outstanding as of December 31, 2013, for which the Fund is the seller of protection, are disclosed in the Schedules of Investments. These potential amounts would be partially offset by any recovery values of the respective referenced obligations, upfront payments received upon entering into the agreement, or net amounts received from the settlement of buy protection credit default swap agreements entered into by the Fund for the same referenced entity or entities.
Credit default swaps could result in losses if the Fund does not correctly evaluate the creditworthiness of the company or companies on which the credit default swap is based. Credit default swap agreements may involve greater risks than if the Fund had invested in the reference obligation directly since, in addition to risks relating to the reference obligation, credit default swaps are subject to illiquidity and counterparty risk. The Fund will generally incur a greater degree of risk when it sells a credit default swap than when it purchases a credit default swap. As a buyer of a credit default swap, the Fund may lose its investment and recover nothing should
Notes to Financial Statements 147
Russell Investment Funds
Notes to Financial Statements, continued — December 31, 2013
a credit event fail to occur and the swap is held to its termination date. As seller of a credit default swap, if a credit event were to occur, the value of any deliverable obligation received by the Fund, coupled with the upfront or periodic payments previously received, may be less than what it pays to the buyer, resulting in a loss of value to the Fund.
If the creditworthiness of the Fund’s swap counterparty declines, the risk that the counterparty may not perform could increase, potentially resulting in a loss to the Fund. To limit the counterparty risk involved in swap agreements, the Fund will only enter into swap agreements with counterparties that meet certain standards of creditworthiness. Although there can be no assurance that the Fund will be able to do so, the Fund may be able to reduce or eliminate its exposure under a swap agreement either by assignment or other disposition, or by entering into an offsetting swap agreement with the same party or another creditworthy party. The Fund may have limited ability to eliminate its exposure under a credit default swap if the credit of the reference entity or underlying asset ha declined.
For the period ended December 31, 2013, the Core Bond Fund entered into credit default swaps primarily for return enhancement, hedging and exposing cash to markets.
The Core Bond Fund’s credit default swap contract notional amounts outstanding fluctuate throughout the fiscal year as required to meet the strategic requirements. The following table illustrates the quarterly volume of credit default swap contracts. For the purpose of this disclosure, the volume is measured by the notional amounts outstanding at each quarter end.
| | | | Credit Default Swap Notional Amounts Outstanding | | |
| Quarter Ended | | March 31, 2013 | June 30, 2013 | | September 30, 2013 | December 31, 2013 |
| Core Bond Fund | | $ 43,878,699 | $ | 38,478,699 | $ | 15,178,699 | | $ 9,578,699 |
Interest Rate Swaps
The use of interest rate swaps is a highly specialized activity which involves investment techniques and risks different from those associated with ordinary portfolio securities transactions. If RIMCo or a money manager using this technique is incorrect in its forecast of fair values, interest rates and other applicable factors, the investment performance of a Fund might diminish compared to what it would have been if this investment technique were not used.
Interest rate swaps do not involve the delivery of securities or other underlying assets or principal. Accordingly, the risk of loss with respect to interest rate swaps is limited to the net amount of interest payments that the Funds are contractually obligated to make. If the other party to an interest rate swap defaults, the Funds’ risk of loss consists of the net amount of interest payments that the Funds are contractually entitled to receive. Since interest rate swaps are individually negotiated, the Funds expect to achieve an acceptable degree of correlation between their rights to receive interest on their portfolio securities and their rights and obligations to receive and pay interest pursuant to interest rate swaps.
For the period ended December 31, 2013, the Core Bond Fund entered into interest rate swaps primarily for return enhancement, hedging and exposing cash to markets.
The Core Bond Fund’s interest rate swap contract notional amounts outstanding fluctuate throughout the fiscal year as required to meet strategic requirements. The following table illustrates the quarterly volume of interest rate swap contracts. For the purpose of this disclosure, the volume is measured by the notional amounts outstanding at each quarter end.
| | | | | Interest Rate Swap Notional Amounts Outstanding |
| Quarter Ended | | March 31, 2013 | | June 30, 2013 | | September 30, 2013 | | December 31, 2013 |
| Core Bond Fund | | $ 108,905,000 | | $ 116,845,000 | | $ 115,795,000 | | $ 303,430,000 |
Index Swaps
Certain Funds may enter into index swap agreements to expose cash to markets or to effect investment transactions consistent with these Funds’ investment objectives and strategies. Index swap agreements are two party contracts entered into primarily by institutional investors for periods ranging from a few weeks to more than one year. In a standard index swap transaction, the two parties agree to exchange the returns (or differentials in rates of return) earned or realized on particular investments or instruments. The returns to be exchanged between the parties are calculated with respect to a “notional amount” (i.e. a specified dollar amount that is hypothetically invested in a “basket” of securities representing a particular index).
For the period ended December 31, 2013, the Core Bond Fund entered into index swaps primarily for the strategy of exposing cash to markets.
The Core Bond Fund’s index swap contract notional amounts outstanding fluctuate throughout the fiscal year as required to meet the strategic requirements. The following table illustrates the quarterly volume of index swap contracts. For the purpose of this disclosure, the volume is measured by the notional amounts outstanding at each quarter end.
148 Notes to Financial Statements
Russell Investment Funds
Notes to Financial Statements, continued — December 31, 2013
| | | | Index Swap Notional Amounts Outstanding | | |
| Quarter Ended | | March 31, 2013 | June 30, 2013 | | September 30, 2013 | December 31, 2013 |
| Core Bond Fund | | $ 72,438,494 | $ | 55,913,955 | $ 101,136,139 | | $ 97,616,049 |
Certain Funds may enter into currency swap agreements to enhance returns or for hedging purposes. Currency swap agreements are agreements where two parties exchange specified amounts of different currencies which are followed by paying the other a series of interest payments that are based on the principal cash flow. At maturity, the principal amounts are exchanged.
For the period ended December 31, 2013, none of the Funds entered into currency swaps.
Master Agreements
The Funds are parties to International Swaps and Derivatives Association, Inc. Master Agreements (“ISDA Master Agreements”) with counterparties that govern transactions in over-the-counter derivative and foreign exchange contracts entered into by the Funds and those counterparties. The ISDA Master Agreements contain provisions for general obligations, representations, agreements, collateral and events of default or termination. Events of termination include conditions that may entitle counterparties to elect to terminate early and cause settlement of all outstanding transactions under the applicable ISDA Master Agreement. Any election to terminate early could be material to the financial statements. Since different types of forward and OTC financial derivative transactions have different mechanics and are sometimes traded out of different legal entities of particular counterparty organization, each type of transaction may be covered by a different ISDA Master Agreement, resulting in the need for multiple agreements with a single counterparty. As the ISDA Master Agreements are specific to unique operations of different asset types, they allow a Fund to net its total exposure to a counterparty in the event of a default with respect to all the transactions governed under a single agreement with a counterparty.
Master Repurchase Agreements (“Master Repo Agreements”) govern transactions between a Fund and select counterparties. The Master Repo Agreements maintain provisions for, among other things, initiation, income payments, events of default, and maintenance of collateral for Repurchase and Reverse Repurchase Agreements.
Master Securities Forward Transaction Agreements (“Master Forward Agreements”) govern the considerations and factors surrounding the settlement of certain forward settling transactions, such as delayed delivery or sale-buyback financing transactions by and between a Fund and select counterparties. The Master Forward Agreements maintain provisions for, among other things, initiation and confirmation, payment and transfer, events of default, termination, and maintenance of collateral.
Disclosure about Offsetting Assets and Liabilities
Effective during interim and annual periods beginning on or after January 1, 2013, U.S. GAAP requires entities to disclose information about offsetting and related arrangements to enable financial statement users to understand the effects of such arrangements on the balance sheet. This Accounting Standards Update (“ASU”) requires an entity to disclose certain financial and derivative instruments, including derivatives, repurchase and reverse repurchase agreements and securities lending arrangements, on a gross basis as well as applicable amounts related to financial collateral.
Balance sheet disclosure is based on various netting agreements between brokers and counterparties, such as ISDA, Master Repo and Master Forward Agreements. The Funds employ multiple money managers and counterparties. The quantitative disclosure begins with disaggregation of counterparties by legal entity and the roll up of the data to reflect a single counterparty in the table within the Funds’ financial statements. Net exposure represents the net receivable (payable) that would be due from/to the counterparty in the event of default. Exposure from OTC derivatives can only be netted across transactions governed under the same Master Agreement with the same legal entity.
Loan Agreements
The Core Bond Fund may invest in direct debt instruments which are interests in amounts owed by corporate, governmental, or other borrowers to lenders or lending syndicates. The Fund’s investments in loans may be in the form of participations in loans or assignments of all or a portion of loans from third parties. A loan is often administered by a bank or other financial institution (the “agent”) that acts as agent for all holders. The agent administers the terms of the loan, as specified in the loan agreement. When investing in a loan participation, the Fund has the right to receive payments of principal, interest and any fees to which it is entitled only from the agent selling the loan agreement and only upon receipt by the agent of payments from the borrower. The Fund generally has no right to enforce compliance with the terms of the loan agreement with the borrower. As a result, the Fund
Notes to Financial Statements 149
Russell Investment Funds
Notes to Financial Statements, continued — December 31, 2013
may be subject to the credit risk of both the borrower and the agent that is selling the loan agreement. When the Fund purchases assignments from agents it acquires direct rights against the borrower on the loan. As of December 31, 2013, the Core Bond Fund had no unfunded loan commitments.
Certificates of Participation
Certain Funds may purchase certificates of participation, also known as participation notes or participation interest notes. Certificates of participation are issued by banks or broker-dealers and are designed to replicate the performance of foreign companies or foreign securities markets and can be used by the Fund as an alternative means to access the securities market of a frontier emerging market country. The performance results of certificates of participation will not replicate exactly the performance of the foreign companies or foreign securities markets that they seek to replicate due to transaction and other expenses. Investments in certificates of participation involve certain risks in addition to those associated with a direct investment in the underlying foreign companies or foreign securities markets whose return they seek to replicate. There can be no assurance that there will be a trading market or that the trading price of certificates of participation will equal the underlying value of the foreign company or foreign securities market that it seeks to replicate. The Funds rely on the creditworthiness of the counterparty issuing the certificates of participation and have no rights against the issuer of the underlying security. The Funds minimize this risk by entering into agreements only with counterparties that RIMCo deems creditworthy. Due to liquidity and transfer restrictions, the secondary markets on which the certificates of participation are traded may be less liquid than the markets for other securities, or may be completely illiquid.
Emerging Markets Securities
The Funds may invest in emerging markets securities. Investing in emerging markets securities can pose some risks different from, and greater than, risks of investing in U.S. or developed markets securities. These risks include: a risk of loss due to political instability; exposure to economic structures that are generally less diverse and mature, and to political systems which may have less stability than those of more developed countries; smaller market capitalization of securities markets, which may suffer periods of relative illiquidity; significant price volatility; restrictions on foreign investment; and possible difficulties in the repatriation of investment income and capital. In addition, foreign investors may be required to register the proceeds of sales and future economic or political crises could lead to price controls, forced mergers, expropriation or confiscatory taxation, seizure, nationalization, or creation of government monopolies. The currencies of emerging market countries may experience significant declines against the U.S. dollar, and devaluation may occur subsequent to investments in these currencies by the Funds. Emerging market securities may be subject to currency transfer restrictions and may experience delays and disruptions in settlement procedures for a Fund’s portfolio securities. Inflation and rapid fluctuations in inflation rates have had, and may continue to have, negative effects on the economies and securities markets of certain emerging market countries.
Emerging Markets Debt
The Core Bond Fund may invest in emerging markets debt. The Fund’s emerging markets debt securities may include obligations of governments and corporations. As with any fixed income securities, emerging markets debt securities are subject to the risk of being downgraded in credit rating and to the risk of default. In the event of a default on any investments in foreign debt obligations, it may be more difficult for the Fund to obtain or to enforce a judgment against the issuers of such securities. With respect to debt issued by emerging market governments, such issuers may be unwilling to pay interest and repay principal when due, either due to an inability to pay or submission to political pressure not to pay, and as a result may default, declare temporary suspensions of interest payments or require that the conditions for payment be renegotiated.
Repurchase Agreements
The Core Bond Fund may enter into repurchase agreements. A repurchase agreement is an agreement under which the Fund acquires a fixed income security from a commercial bank, broker or dealer and simultaneously agrees to resell such security to the seller at an agreed upon price and date (normally within a few days or weeks). The resale price reflects an agreed upon interest rate effective for the period the security is held by the Fund and is unrelated to the interest rate on the security. The securities acquired by the Fund constitute collateral for the repurchase obligation. In these transactions, the securities acquired by the Fund (including accrued interest earned thereon) must have a total value in excess of the value of the repurchase agreement and must be held by the custodian bank until repurchased. The Fund will not invest more than 15% of its net assets (taken at current fair value) in repurchase agreements maturing in more than seven days.
Mortgage-Related and Other Asset-Backed Securities
150 Notes to Financial Statements
Russell Investment Funds
Notes to Financial Statements, continued — December 31, 2013
The Core Bond Fund may invest in mortgage or other asset-backed securities (“ABS”). These securities may include mortgage instruments issued by U.S. government agencies (“agency mortgages”) or those issued by private entities (“non-agency mortgages”). Specific types of instruments may include mortgage pass-through securities, collateralized mortgage obligations (“CMOs”), commercial mortgage-backed securities, mortgage dollar rolls, CMO residuals, stripped mortgage-backed securities and other securities that directly or indirectly represent a participation in, or are secured by a payable from, mortgage loans on real property. The value of the Fund’s mortgage-backed securities (“MBS”) may be affected by, among other things, changes or perceived changes in interest rates, factors concerning the interests in and structure of the issuer or the originator of the mortgage, or the quality of the underlying assets. The mortgages underlying the securities may default or decline in quality or value. Through its investments in MBS, a Fund has exposure to subprime loans, Alt-A loans and non-conforming loans as well as to the mortgage and credit markets generally. Underlying collateral related to subprime, Alt-A and non-conforming mortgage loans has become increasingly susceptible to defaults and declines in quality or value, especially in a declining residential real estate market. In addition, regulatory or tax changes may adversely affect the mortgage securities markets as a whole.
Mortgage-Backed Securities
MBS often have stated maturities of up to thirty years when they are issued, depending upon the length of the mortgages underlying the securities. In practice, however, unscheduled or early payments of principal and interest on the underlying mortgages may make the securities’ effective maturity shorter than this, and the prevailing interest rates may be higher or lower than the current yield of the Fund’s portfolio at the time resulting in reinvestment risk.
Rising or high interest rates may result in slower than expected principal payments which may tend to extend the duration of MBS, making them more volatile and more sensitive to changes in interest rates. This is known as extension risk.
MBS may have less potential for capital appreciation than comparable fixed income securities due to the likelihood of increased prepayments of mortgages resulting from foreclosures or declining interest rates. These foreclosed or refinanced mortgages are paid off at face value (par) or less, causing a loss, particularly for any investor who may have purchased the security at a premium or a price above par. In such an environment, this risk limits the potential price appreciation of these securities.
Agency Mortgage-Backed Securities
Certain MBS may be issued or guaranteed by the U.S. government or a government sponsored entity, such as Fannie Mae (the Federal National Mortgage Association) or Freddie Mac (the Federal Home Loan Mortgage Corporation). Although these instruments may be guaranteed by the U.S. government or a government sponsored entity, many such MBS are not backed by the full faith and credit of the United States and are still exposed to the risk of non-payment.
Privately Issued Mortgage-Backed Securities
MBS held by a Fund may be issued by private issuers including commercial banks, savings associations, mortgage companies, investment banking firms, finance companies and special purpose finance entities (called special purpose vehicles or SPVs) and other entities that acquire and package mortgage loans for resale as MBS. These privately issued non-agency MBS may offer higher yields than those issued by government agencies, but also may be subject to greater price changes than governmental issues. Subprime loans refer to loans made to borrowers with weakened credit histories or with a lower capacity to make timely payments on their loans. Alt-A loans refer to loans extended to borrowers who have incomplete documentation of income, assets, or other variables that are important to the credit underwriting processes. Non-conforming mortgages are loans that do not meet the standards that allow purchase by government-sponsored enterprises. MBS with exposure to subprime loans, Alt-A loans or nonconforming loans have had in many cases higher default rates than those loans that meet government underwriting requirements. The risk of non-payment is greater for MBS that are backed by mortgage pools that contain subprime, Alt-A and non-conforming loans, but a level of risk exists for all loans.
Unlike agency MBS issued or guaranteed by the U.S. government or a government-sponsored entity (e.g., Fannie Mae (the Federal National Mortgage Association) and Freddie Mac (the Federal Home Loan Mortgage Corporation)), MBS issued by private issuers do not have a government or government-sponsored entity guarantee, but may have credit enhancements provided by external entities such as banks or financial institutions or achieved through the structuring of the transaction itself. Examples of such credit support arising out of the structure of the transaction include the issue of senior and subordinated securities (e.g., the issuance of securities by an SPV in multiple classes or “tranches,” with one or more classes being senior to other subordinated classes as to the payment of principal and interest, with the result that defaults on the underlying mortgage loans are borne first by the holders of the subordinated class); creation of “reserve funds” (in which case cash or investments, sometimes funded from a portion of the payments on the underlying mortgage loans, are held in reserve against future losses); and “overcollateralization” (in which case
Notes to Financial Statements 151
Russell Investment Funds
Notes to Financial Statements, continued — December 31, 2013
the scheduled payments on, or the principal amount of, the underlying mortgage loans exceeds that required to make payment on the securities and pay any servicing or other fees). However, there can be no guarantee that credit enhancements, if any, will be sufficient to prevent losses in the event of defaults on the underlying mortgage loans. In addition, MBS that are issued by private issuers are not subject to the underwriting requirements for the underlying mortgages that are applicable to those MBS that have a government or government-sponsored entity guarantee. As a result, the mortgage loans underlying private MBS may, and frequently do, have less favorable collateral, credit risk or other underwriting characteristics than government or government-sponsored MBS and have wider variances in a number of terms including interest rate, term, size, purpose and borrower characteristics. Privately issued pools more frequently include second mortgages, high loan-to-value mortgages and manufactured housing loans. The coupon rates and maturities of the underlying mortgage loans in a private-label MBS pool may vary to a greater extent than those included in a government guaranteed pool, and the pool may include subprime mortgage loans.
Privately issued MBS are not traded on an exchange and there may be a limited market for the securities, especially when there is a perceived weakness in the mortgage and real estate market sectors. Without an active trading market, MBS held in the Fund’s portfolio may be particularly difficult to value because of the complexities involved in assessing the value of the underlying mortgage loans.
Asset-Backed Securities
ABS may include MBS, loans, receivables or other assets. The value of the Fund’s ABS may be affected by, among other things, actual or perceived changes in interest rates, factors concerning the interests in and structure of the issuer or the originator of the receivables, the market’s assessment of the quality of underlying assets or actual or perceived changes in the credit worthiness of the individual borrowers, the originator, the servicing agent or the financial institution providing the credit support.
Payment of principal and interest may be largely dependent upon the cash flows generated by the assets backing the securities. Rising or high interest rates tend to extend the duration of ABS, making them more volatile and more sensitive to changes in interest rates. The underlying assets are sometimes subject to prepayments which can shorten the security’s weighted average life and may lower its return. Defaults on loans underlying ABS have become an increasing risk for ABS that are secured by home equity loans related to sub-prime, Alt-A or non-conforming mortgage loans, especially in a declining residential real estate market.
ABS (other than MBS) present certain risks that are not presented by MBS. Primarily, these securities may not have the benefit of any security interest in the related assets. Credit card receivables are generally unsecured and the debtors are entitled to the protection of a number of state and federal consumer credit laws, many of which give such debtors the right to set off certain amounts owed on the credit cards, thereby reducing the balance due. There is the possibility that recoveries on repossessed collateral may not, in some cases, be available to support payments on these securities. ABS are often backed by a pool of assets representing the obligations of a number of different parties. To lessen the effect of failures by obligors on underlying assets to make payments, the securities may contain elements of credit support which fall into two categories: (i) liquidity protection, and (ii) protection against losses resulting from ultimate default by an obligor on the underlying assets. Liquidity protection refers to the provision of advances, generally by the entity administering the pool of assets, to ensure that the receipt of payments on the underlying pool occurs in a timely fashion. Protection against losses results from payment of the insurance obligations on at least a portion of the assets in the pool. This protection may be provided through guarantees, policies or letters of credit obtained by the issuer or sponsor from third parties, through various means of structuring the transaction or through a combination of such approaches. The Fund will not pay any additional or separate fees for credit support. The degree of credit support provided for each issue is generally based on historical information respecting the level of credit risk associated with the underlying assets.
Delinquency or loss in excess of that anticipated or failure of the credit support could adversely affect the return on an investment in such a security. The availability of ABS may be affected by legislative or regulatory developments. It is possible that such developments may require the Fund to dispose of any then existing holdings of such securities.
Forward Commitments
The Core Bond Fund may contract to purchase securities for a fixed price at a future date beyond customary settlement time consistent with the Fund’s investment strategies. The price of the underlying securities and the date when the securities will be delivered and paid for are fixed at the time the transaction is negotiated. The Funds may dispose of a forward commitment transaction prior to settlement if it is appropriate to do so and may realize short-term gains (or losses) upon such sale. When effecting such transactions, cash or liquid high-grade debt obligations of the Funds in a dollar amount sufficient to make payment for the portfolio securities to be purchased will be earmarked on the Fund’s records at the trade date and until the transaction is settled. A forward commitment transaction involves a risk of loss if the value of the security to be purchased declines prior to the settlement date or the other party to the transaction fails to complete the transaction.
152 Notes to Financial Statements
Russell Investment Funds
Notes to Financial Statements, continued — December 31, 2013
A to be announced (“TBA”) security is a forward mortgage-backed securities trade which the Core Bond Fund may invest in. The securities are purchased and sold on a forward commitment basis with an approximate principal amount and maturity date. The actual principal amount and maturity date will be determined upon settlement when the specific mortgage pools are assigned. These securities are within the parameters of industry “good delivery” standards.
Inflation-Indexed Bonds
The Core Bond Fund may invest in inflation-indexed securities, which are typically bonds or notes designed to provide a return higher than the rate of inflation (based on a designated index) if held to maturity. A common type of inflation-indexed security is a U.S. Treasury Inflation-Protected Security (“TIPS”). The principal of a TIPS increases with inflation and decreases with deflation, as measured by the Consumer Price Index. When a TIPS matures, the adjusted principal or original principal is paid, whichever is greater. TIPS pay interest twice a year, at a fixed rate. The rate is applied to the adjusted principal; so like the principal, interest payments rise with inflation and fall with deflation.
Guarantees
In the normal course of business, the Funds enter into contracts that contain a variety of representations which provide general indemnifications. The Funds’ maximum exposure under these arrangements is unknown as this would involve future claims that may be made against the Funds that have not yet occurred. However, the Funds expect the risk of loss to be remote.
Market, Credit and Counterparty Risk
In the normal course of business, the Funds trade financial instruments and enter into financial transactions where risk of potential loss exists due to changes in the market (market risk) or failure of the other party to a transaction to perform (credit risk). Similar to credit risk, the Funds may also be exposed to counterparty risk or risk that an institution or other entity with which the Funds have unsettled or open transactions will default. The potential loss could exceed the value of the relevant assets recorded in the financial statements (the “Assets”). The Assets consist principally of cash due from counterparties and investments. The extent of the Funds’ exposure to market, credit and counterparty risks with respect to the Assets approximates their carrying value as recorded in the Funds’ Statements of Assets and Liabilities.
Global economies and financial markets are becoming increasingly interconnected and political and economic conditions (including recent instability and volatility) and events (including natural disasters) in one country, region or financial market may adversely impact issuers in a different country, region or financial market. As a result, issuers of securities held by a Fund may experience significant declines in the value of their assets and even cease operations. Such conditions and/or events may not have the same impact on all types of securities and may expose a Fund to greater market and liquidity risk and potential difficulty in valuing portfolio instruments held by a Fund. This could cause a Fund to underperform other types of investments.
3. Investment Transactions
Securities
During the period ended December 31, 2013, purchases and sales of investment securities (excluding U.S. Government and Agency obligations, short-term investments, options, futures and repurchase agreements) were as follows:
| | | | | Purchases | | | | Sales |
| Multi-Style Equity Fund | | $ | | 352,686,230 | | $ | | 386,266,229 |
| Aggressive Equity Fund | | | | 154,989,576 | | | | 180,321,373 |
| Non-U. S. Fund | | | | 131,369,739 | | | | 133,256,161 |
| Core Bond Fund | | | | 330,910,542 | | | | 278,015,886 |
| Global Real Estate Securities Fund | | | | 494,296,161 | | | | 448,509,217 |
Purchases and sales of U.S. Government and Agency obligations (excluding short-term investments, options, futures and repurchase agreements) were as follows:
| | | | | Purchases | | | | Sales |
| Core Bond Fund | | $ | | 579,197,449 | | | $ | | 515,291,801 | |
Securities Lending
The Investment Company has a securities lending program whereby each Fund can loan securities with a value up to 33 1/3% of each Fund’s total assets. The Fund receives cash (U.S. currency), U.S. Government or U.S. Government Agency obligations as collateral against the loaned securities. As of December 31, 2013, to the extent that a loan was collateralized by cash, such collateral
Notes to Financial Statements 153
Russell Investment Funds
Notes to Financial Statements, continued — December 31, 2013
was invested by the securities lending agent, Brown Brothers Harriman & Co. (“BBH”), in the Russell U.S. Cash Collateral Fund, an unregistered fund advised by RIMCo. The collateral received is recorded on a lending Fund’s Statement of Assets and Liabilities along with the related obligation to return the collateral.
Income generated from the investment of cash collateral, less negotiated rebate fees paid to participating brokers and transaction costs, is divided between the Fund and BBH and is recorded as income for the Fund. To the extent that a loan is secured by non-cash collateral, brokers pay the Fund negotiated lenders’ fees, which are divided between the Fund and BBH and are recorded as securities lending income for the Fund. All collateral received will be in an amount at least equal to 102% (for loans of U.S. securities) or 105% (for loans of non-U.S. securities) of the fair value of the loaned securities at the inception of each loan. The fair value of the loaned securities is determined at the close of business of the Fund and any additional required collateral is delivered to the Fund the next day. Should the borrower of the securities fail financially, there is a risk of delay in recovery of the securities or loss of rights in the collateral. Consequently, loans are made only to borrowers which are deemed to be creditworthy by BBH and approved by RIMCo. Each Fund that participates in the securities lending program has cash collateral invested in the Russell U.S. Cash Collateral Fund.
Custodian
The Funds have entered into arrangements with their custodian whereby custody credits realized as a result of uninvested cash balances are used to reduce a portion of the Funds’ expenses. During the period ended December 31, 2013, the Funds’ custodian fees were not reduced under these arrangements.
Brokerage Commissions
The Funds effect certain transactions through Recapture Services, a division of BNY ConvergeEX Execution Solutions LLC (“BNY”) and its global network of unaffiliated correspondent brokers as well as State Street Global Markets, LLC (“SSGM”) and its global network of unaffiliated correspondent brokers. BNY and SSGM are registered brokers and are not affiliates of the Funds or RIMCo. Trades placed through Recapture Services and SSGM and their correspondents are used (i) to obtain brokerage and research services for RIMCo to assist RIMCo in its investment decision-making process in its capacity as Adviser to the Funds or (ii) to generate commission rebates to the Funds on whose behalf the trades were made. For purposes of trading to obtain brokerage and research services for RIMCo or to generate commission rebates to the Funds, the Funds’ money managers are requested to, and RIMCo may, with respect to transactions it places, effect transactions with or through Recapture Services, SSGM and their correspondents or other brokers only to the extent that the money managers or RIMCo believe that the Funds will receive best execution. In addition, RIMCo recommends targets for the amount of trading that money managers direct through Recapture Services and SSGM based upon several factors including asset class and investment style, among others. Research services provided to RIMCo by Recapture Services, SSGM or other brokers include performance measurement statistics, fund analytics systems and market monitoring systems. Research services will generally be obtained from unaffiliated third parties at market rates, which may be included in commission costs. Research provided to RIMCo may benefit the particular Funds generating the trading activity and may also benefit other Funds within Russell Investment Company (“RIC”) and other funds and clients managed or advised by RIMCo or its affiliates. Similarly, the Funds may benefit from research provided with respect to trading by those other funds and clients.
Decisions concerning the acquisition of research services by RIMCo are approved and monitored by a FRC Soft Commission Committee (“SCC”), which consists principally of employees in research and investment management roles. The SCC acts as an oversight body with respect to purchases of research services acquired by RIMCo using soft commissions generated by funds managed by FRC affiliates, including the Funds.
Recapture Services, SSGM or other brokers may also rebate to the Funds a portion of commissions earned on certain trading by the Funds through Recapture Services, and SSGM and their correspondents in the form of commission recapture. Commission recapture is paid solely to those Funds generating the applicable commission. Commission recapture is generated on the instructions of the SCC once RIMCo’s research needs have been met, as determined annually in the Soft Money Commission budgeting process.
Recapture Services and SSGM retain a portion of all commissions generated, regardless of whether the trades were used to provide research services to RIMCo or commission recapture to the Funds. Trades through Recapture Services, SSGM and their correspondents for transition services and manager funding (i.e. brokerage arrangements designed to reduce costs and optimize performance during the transition of Fund assets upon the hiring, termination or additional funding of a money manager) are at ordinary and customary commission rates and do not result in commission rebates or accrued credits for the procurement of research related services.
154 Notes to Financial Statements
Russell Investment Funds
Notes to Financial Statements, continued — December 31, 2013
Additionally, a money manager may independently effect transactions through Recapture Services, SSGM and their correspondents or a broker affiliated with the money manager or another broker to obtain research services for its own use. Research services provided to a money manager may benefit the Fund generating the trading activity but may also benefit other funds and clients managed or advised by the money manager. Similarly, the Funds may benefit from research services provided with respect to trading by those other funds and clients.
Additionally, the Funds paid brokerage commissions to non-affiliated brokers who provided brokerage and research services to RIMCo.
4. Related Party Transactions, Fees and Expenses
Adviser and Administrator
RIMCo is the Funds’ adviser and RFSC, a wholly-owned subsidiary of RIMCo, is the Funds’ administrator and transfer agent. RIMCo is a wholly-owned subsidiary of Frank Russell Company (a subsidiary of The Northwestern Mutual Life Insurance Company). Frank Russell Company provides ongoing money manager research and trade placement services to RIF and RIMCo.
The Funds are permitted to invest their cash (i.e., cash awaiting investment or cash held to meet redemption requests or to pay expenses) in the Russell U.S. Cash Management Fund, an unregistered Fund advised by RIMCo. As of December 31, 2013, the Funds had invested $261,376,507 in the Russell U.S. Cash Management Fund. In addition, a portion of the collateral received from the Investment Company’s securities lending program in the amount of $50,978,130 is invested in the Russell U.S. Cash Collateral Fund, an unregistered fund advised by RIMCo.
The advisory and administrative fees specified in the table below are based upon the average daily net assets of each Fund and are payable monthly.
The following shows the respective totals for advisory and administrative fees for the period ended December 31, 2013:
| | | | | | | Annual Rate |
| Funds | | | | Adviser | | | | | | Administrator |
| Multi-Style Equity Fund | | | | | | . 73 % | | | | . 05 % |
| Aggressive Equity Fund | | | | | | . 90 | | | | . 05 |
| Non-U. S. Fund | | | | | | . 90 | | | | . 05 |
| Core Bond Fund | | | | | | . 55 | | | | . 05 |
| Global Real Estate Securities Fund | | | | | | . 80 | | | | . 05 |
| | | | | Advisory | | | | Administrative |
| Multi-Style Equity Fund | | $ | | 3,177,534 | | $ | | 217,605 |
| Aggressive Equity Fund | | | | 1,910,412 | | | | 106,117 |
| Non-U. S. Fund | | | | 3,444,343 | | | | 191,320 |
| Core Bond Fund | | | | 3,920,971 | | | | 356,391 |
| Global Real Estate Securities Fund | | | | 5,194,702 | | | | 324,613 |
RIMCo has agreed to certain waivers of its advisory fees as follows:
For the Aggressive Equity Fund, RIMCo has contractually agreed, until April 30, 2014, to waive 0.05% of its 0.90% advisory fee. The waiver may not be terminated during the relevant period except with Board approval. The total amount of the waiver for the period ended December 31, 2013 was $106,134. There were no reimbursements during the period.
For the Non-U.S. Fund, RIMCo has contractually agreed, until April 30, 2014, to waive 0.05% of its 0.90% advisory fee. The waiver may not be terminated during the relevant period except with Board approval. The total amount of the waiver for the period ended December 31, 2013 was $191,352. There were no reimbursements during the period.
For the Core Bond Fund, RIMCo has contractually agreed, until April 30, 2014, to waive 0.05% of its 0.55% advisory fee. The waiver may not be terminated during the relevant period except with Board approval. The total amount of the waiver for the period ended December 31, 2013 was $356,452. There were no reimbursements during the period.
Transfer and Dividend Disbursing Agent
RFSC serves as transfer agent and provides dividend disbursing services to the Funds. For this service, RFSC is paid a fee based upon the average daily net assets of the Funds for transfer agency and dividend disbursing services. RFSC retains a portion of this fee for services provided to the Funds and pays the balance to unaffiliated agents who assist in providing these services. Transfer agency fees paid by the Funds presented herein for the period ended December 31, 2013 were as follows:
Notes to Financial Statements 155
Russell Investment Funds
Notes to Financial Statements, continued — December 31, 2013
| | | | | Amount |
| Multi-Style Equity Fund | | $ | | 19,152 |
| Aggressive Equity Fund | | | | 9,340 |
| Non-U. S. Fund | | | | 16,839 |
| Core Bond Fund | | | | 31,368 |
| Global Real Estate Securities Fund | | | | 28,571 |
Distributor
Russell Financial Services, Inc. (the “Distributor”), a wholly-owned subsidiary of RIMCo, serves as distributor for RIF, pursuant to the distribution agreement with RIF. The Distributor receives no compensation from the Investment Company for its services.
Accrued Fees Payable to Affiliates
Accrued fees payable to affiliates for the period ended December 31, 2013 were as follows:
| | | Multi-Style Equity Fund |
| Aggressive Equity | | Non-U. S. Fund | | Core Bond | | Global Real Estate Securities Fund |
| Advisory fees | | $ 287,124 | | $ 165,784 | | $299,446 | | $ 321,310 | | $439,475 |
| Administration fees | | 19,423 | | 9,637 | | 17,403 | | 31,734 | | 27,113 |
| Transfer agent fees | | 1,708 | | 845 | | 1,530 | | 2,788 | | 2,363 |
| Trustee fees | | 1,800 | | 819 | | 1,594 | | 3,108 | | 2,700 |
| | | $310,055 | | $ 177,085 | | $ 319,973 | | $358,940 | | $471,651 |
Affiliated Brokerage Commissions
The Funds effect certain transactions through Russell Implementation Services Inc. (“RIS”) and its global network of unaffiliated correspondent brokers. RIS is a registered broker and investment adviser and an affiliate of RIMCo. Trades placed through RIS and its correspondents are made (i) to manage trading associated with changes in money managers, rebalancing across existing money managers, cash flows and other portfolio transitions or (ii) to execute portfolio securities transactions for each Fund’s assets that RIMCo determines not to allocate to money managers including assets RIMCo may manage to manage risk in a Fund’s investment portfolio and for each Fund’s cash reserves.
Amounts retained by RIS for the period ended December 31, 2013 were as follows:
| | | | | Amount |
| Multi-Style Equity Fund | | $ | | 19,152 |
| Aggressive Equity Fund | | | | 9,340 |
| Non-U. S. Fund | | | | 16,839 |
| Core Bond Fund | | | | 31,368 |
| Global Real Estate Securities Fund | | | | 28,571 |
The Funds are permitted to purchase or sell securities from or to certain related affiliated funds under specified conditions outlined in procedures adopted by the Board. The procedures have been designed to ensure that any purchase or sale of securities by the Funds from or to another fund or portfolio that are, or could be, considered an affiliate by virtue of having a common investment adviser (or affiliated investment advisers), common Trustees and/or common officers complies with Rule 17a-7 of the Act.
During the period ended December 31, 2013, the Funds have engaged in purchases and sales of securities pursuant to Rule 17a-7 of the Act. As defined by the procedures, each transaction is effected at the current market price.
Board of Trustees
The Russell Fund Complex consists of RIC, which has 37 funds, RIF, which has 9 funds, and Russell Exchange Traded Funds Trust (“RET”), which has 1 fund. Each of the Trustees is a Trustee of RIC, RIF and RET. During the period, the Russell Fund Complex paid each of its independent Trustees a retainer of $87,000 per year (effective January 1, 2014, $96,000), each of its interested Trustees a retainer of $75,000 per year and each Trustee $7,000 for each regularly scheduled meeting attended in person and $3,500 for each special meeting and the Annual 38a-1 meeting attended in person, and for each Audit Committee meeting, Nominating and Governance Committee meeting, Investment Committee meeting or any other committee meeting established and approved by the Board that is attended in person. Each Trustee receives a $1,000 fee for attending regularly scheduled and special meetings by phone instead of receiving the full fee had the member attended in person (except for telephonic meetings called pursuant to the
156 Notes to Financial Statements
Russell Investment Funds
Notes to Financial Statements, continued — December 31, 2013
Funds’ valuation and pricing procedures) and a $500 fee for attending the committee meeting by phone instead of receiving the full fee had the member attended in person. Trustees’ out-of-pocket expenses are also paid by the Russell Fund Complex. The Audit Committee Chair and Investment Committee Chair are each paid a fee of $15,000 per year and the Nominating and Governance Committee Chair is paid a fee of $12,000 per year. The chairman of the Board receives additional annual compensation of $75,000 (effective January 1, 2014, $85,000). Ms. Cavanaugh and the Trustee Emeritus are not compensated by the Russell Fund Complex for service as a Trustee.
5. Federal Income Taxes
At December 31, 2013, the following Funds had net tax basis capital loss carryforwards which may be applied against any net realized taxable gains in each succeeding year or until their respective expiration dates, whichever occurs first. Available capital loss carryforwards and expiration dates are as follows:
| | | | | | | | | No | | |
| | | | | | | | | Expiration | | |
| | | Funds | | 12/31/2016 | | 12/31/2017 | | Short-Term | | Totals |
| |
| Non-U. S. Fund | | | | $16,972,958 | | $51,040,031 | | $ — | | $68,012,989 |
| Core Bond Fund | | | | $ — | | $ — | | 16,432 | | 16,432 |
Under the Regulated Investment Company Modernization Act of 2010, the Funds will be permitted to carry forward capital losses incurred in taxable years beginning after December 22, 2010 for an unlimited period. However, any losses incurred during those future taxable years will be required to be utilized prior to the losses incurred in pre-enactment taxable years. As a result of this ordering rule, pre-enactment capital loss carryforwards may be more likely to expire unused. Additionally, post-enactment capital losses that are carried forward will retain their character as either short-term or long-term capital losses rather than being considered all short-term as under previous law.
At December 31, 2013, the cost of investments and net unrealized appreciation (depreciation), undistributed ordinary income and undistributed long-term capital gains for income tax purposes were as follows:
| | | | | | Global Real Estate |
| | Multi-Style Equity Fund | Aggressive Equity Fund Non-U. S. Fund | Core Bond Fund | Securities Fund |
| Cost of Investments | $ 376,960,568 | $ 208,425,399 | | $ 338,670,655 | | 830,833,302 | | $ 597,897,236 |
| Unrealized Appreciation | $ 108,364,270 | $ 49,640,727 | | $ 96,536,044 | | 12,166,091 | | $86,555,439 |
| Unrealized Depreciation | $ (2,554,087 ) | $ (2,915,027 ) | | $ (7,680,292 ) | | (9,196,599) | | $(13,499,431 ) |
| Net Unrealized Appreciation (Depreciation) | $ 105,810,183 | $ 46,725,700 | | $ 88,855,752 | | 2,969,492 | | $73,056,008 |
| Undistributed Ordinary Income | $ 1,130,290 | $ 1,647,844 | | $ 4,583,104 | | 2,939,466 | | $ — |
| Undistributed Long-Term Capital Gains | | | | | | | | | |
| (Capital Loss Carryforward) | $ 9,169,992 | $ 6,881,814 | | $ (68,012,989) | | (16,432) $ | | $ — |
| Tax Composition of Distributions | | | | | | | | | |
| Ordinary Income | $ 5,309,543 | $ 5,324,281 | | $ 7,652,712 | | 10,400,872 | | $ 24,830,706 |
| Long-Term Capital Gains | $ 24,505,012 | $ 12,077,067 | | $ — | | 1,844,824 | | $ 27,080,244 |
| Distributions in Excess | $ — | $ — | | $ — | | — $ | | — |
As permitted by tax regulations, the Funds intend to defer a net realized capital loss incurred from November 1, 2013 to December 31, 2013, and treat it as arising in the fiscal year 2014. As of December 31, 2013, the Funds had realized a capital loss as follows:
| Global Real Estate Securities Fund | | $ | | 1,367,788 |
| Core Bond Fund | | $ | | 3,194,176 |
As permitted by tax regulations, Global Real Estate Securities Fund intends to defer a late year ordinary loss incurred from November 1, 2013 to December 31, 2013, and treat it as arising in the fiscal year 2014. As of December 31, 2013, the Fund had deferred an ordinary loss of $ 1,097,226.
6. Interfund Lending Program
The Funds have been granted permission from the Securities and Exchange Commission to participate in a joint lending and borrowing facility (the “Credit Facility”). Funds may borrow money from each other for temporary purposes. All such borrowing and lending will be subject to a participating Fund’s fundamental investment limitations. A Fund will lend through the program only when the returns are higher than those available from an investment in repurchase agreements or short-term reserves and
Notes to Financial Statements 157
Russell Investment Funds
Notes to Financial Statements, continued — December 31, 2013
the portfolio manager determines it is in the best interest of the Fund. The Funds will borrow through the program only when the costs are equal to or lower than the cost of bank loans. Interfund loans and borrowings normally extend overnight, but can have a maximum duration of seven days. Loans may be called on one business day’s notice. A participating Fund may have to borrow from a bank at a higher interest rate if an interfund loan is called or not renewed. Any delay in repayment to the lending fund could result in reduced returns or additional borrowing costs. For the period ended December 31, 2013, the Funds presented herein did not borrow or lend through the interfund lending program.
7. Record Ownership
As of December 31, 2013, the following table includes shareholders of record with greater than 10% of the total outstanding shares of each respective Fund. The Northwestern Mutual Life Insurance Company accounts were the largest shareholder in each Fund.
| | | | # of | | | | |
| | | | Shareholders | | | | % |
| Multi-Style Equity Fund | | 2 | | | | 79 . 7 |
| Aggressive Equity Fund | | 2 | | | | 81 . 8 |
| Non-U. S. Fund | | 3 | | | | 80 . 7 |
| Core Bond Fund | | 3 | | | | 83 . 8 |
| Global Real Estate Securities Fund | | 2 | | | | 91 . 8 |
| |
| 8 . Pending Legal Proceedings | | | | | | |
On October 17, 2013, Fred McClure filed a derivative lawsuit against RIMCo on behalf of ten RIC funds, the Russell Commodity Strategies Fund, Russell Emerging Markets Fund, Russell Global Equity Fund, Russell Global Infrastructure Fund, Russell Global Opportunistic Credit Fund, Russell International Developed Markets Fund, Russell Multi-Strategy Alternative Fund, Russell Strategic Bond Fund, Russell U.S. Small Cap Equity Fund and Russell Global Real Estate Securities Fund. The lawsuit, which was filed in the United States District Court for the District of Massachusetts, seeks recovery under Section 36(b) of the Investment Company Act of 1940, as amended, for the alleged payment of excessive investment management fees to RIMCo. Although this action was purportedly filed on behalf of these ten Funds, none of these ten Funds are themselves parties to the suit. For this reason, no accrual for litigation relating to this matter has been recorded in the financial statements of these funds. The plaintiffs seek recovery of the amount of compensation or payments received from these ten Funds and earnings that would have accrued to plaintiff had that compensation not been paid or, alternatively, rescission of the contracts and restitution of all excessive fees paid. RIMCo intends to vigorously defend the action.
9. Restricted Securities
Restricted securities are subject to contractual limitations on resale, are often issued in private placement transactions, and are not registered under the Securities Act of 1933, as amended (the “Act”). The most common types of restricted securities are those sold under Rule 144A of the Act and commercial paper sold under Section 4(2) of the Act.
A Fund may invest a portion of its net assets not to exceed 15% in securities that are illiquid. This limitation is applied at the time of purchase. Illiquid securities are securities that may not be readily marketable, and that cannot be sold within seven days in the ordinary course of business at the approximate amount at which the Fund has valued the securities. Restricted securities are generally considered to be illiquid.
See each Fund’s Schedule of Investments for a list of restricted securities held by a Fund that are illiquid.
10. Subsequent Events
Management has evaluated the events and /or transactions that have occurred through the date the financial statements were issued and noted no items requiring adjustments of the financial statements or additional disclosures.
158 Notes to Financial Statements
Report of Independent Registered Public Accounting Firm
To the Board of Trustees and Shareholders
of Russell Investment Funds
In our opinion, the accompanying statements of assets and liabilities, including the schedules of investments, and the related statements of operations and of changes in net assets and the financial highlights present fairly, in all material respects, the financial position of Multi-Style Equity Fund, Aggressive Equity Fund, Non-U.S. Fund, Core Bond Fund, and Global Real Estate Securities Fund (five of the portfolios constituting Russell Investment Funds, hereafter collectively referred to as the "Funds") at December 31, 2013, the results of each of their operations for the year then ended, the changes in each of their net assets for each of the two years in the period then ended and the financial highlights for each of the five years in the period then ended, in conformity with accounting principles generally accepted in the United States of America. These financial statements and financial highlights (hereafter referred to as “financial statements”) are the responsibility of the Funds’ management; our responsibility is to express an opinion on these financial statements based on our audits. We conducted our audits of these financial statements in accordance with the standards of the Public Company Accounting Oversight Board (United States). Those standards require that we plan and perform the audit to obtain reasonable assurance about whether the financial statements are free of material misstatement. An audit includes examining, on a test basis, evidence supporting the amounts and disclosures in the financial statements, assessing the accounting principles used and significant estimates made by management, and evaluating the overall financial statement presentation. We believe that our audits, which included confirmation of securities at December 31, 2013 by correspondence with the custodian, brokers and transfer agent and the application of alternative auditing procedures where securities purchased confirmations had not been received, provide a reasonable basis for our opinion.

Report of Independent Registered Public Accounting Firm 159
Russell Investment Funds
Tax Information — December 31, 2013 (Unaudited)
For the tax year ended December 31, 2013, the Funds hereby designate 100% or the maximum amount allowable, of its net taxable income as qualified dividends taxed at individual net capital gain rates.
The Form 1099 you receive in January 2014 will show the tax status of all distributions paid to your account in calendar year 2013.
The Funds designate dividends distributed during the fiscal year as qualifying for the dividends received deduction for corporate shareholders as follows:
| Multi-Style Equity | | 100.0% |
| Aggressive Equity | | 32.0% |
| Non-U. S. | | 0% |
| Global Real Estate Securities | | 0% |
| Core Bond | | 0% |
Pursuant to Section 852 of the Internal Revenue Code, the Funds designate the following amounts as long-term capital gain dividends for their taxable year ended December 31, 2013:
| Multi-Style Equity | | $ | 24,505,012 |
| Aggressive Equity | | $ | 12,077,067 |
| Global Real Estate Securities | | $ | 27,080,244 |
| Core Bond | | $ | 1,844,824 |
The Funds listed below paid foreign taxes and recognized foreign source income during the taxable year ended December 31, 2013. Pursuant to Section 853 of the Internal Revenue Code, the Funds designate the following per share amounts of foreign taxes paid and income earned from foreign sources:
| | | | | | | Foreign | | | | | | Foreign |
| | | | | | | Taxes | | | | | | Source |
| | | Foreign | | Paid | | Foreign Source | | Income Per |
| Fund Name | | Taxes Paid | | Per Share | | Income | | Share |
| |
| Non-US | | $ | | 891,821 | | $ | | 0.0256 | | $ | | 10,201,784 | | $ | | 0.2932 |
| |
| Global Real Estate Securities | | | | 655,530 | | | | 0.0179 | | | | 10,715,161 | | | | 0.2388 |
Please consult a tax adviser for any questions about federal or state income tax laws.
160 Tax Information
Russell Investment Funds
Basis for Approval of Investment Advisory Contracts — (Unaudited)
Approval of Investment Advisory Agreement
The Investment Company Act of 1940, as amended (the “1940 Act”), requires that the Board of Trustees (the “Board”), including a majority of its members who are not considered to be “interested persons” under the 1940 Act (the “Independent Trustees”) voting separately, approve the continuation of the advisory agreement with RIMCo (the “RIMCo Agreement”) and the portfolio management contract with each Money Manager of the Funds (collectively, the “portfolio management contracts”) on at least an annual basis and that the terms and conditions of the RIMCo Agreement and the terms and conditions of each portfolio management contract provide for its termination if continuation is not approved annually. The Board, including all of the Independent Trustees, considered and approved the continuation of the RIMCo Agreement and the portfolio management contracts at a meeting held in person on April 18, 2013 (the “Annual Agreement Evaluation Meeting”) and considered and approved the continuation again at a meeting held in person on August 26-27, 2013 (the “August Agreement Evaluation Meeting,” and with the Annual Agreement Evaluation Meeting, the “2013 Agreement Evaluation Meetings”). Approval of the continuation of the RIMCo Agreement and each portfolio management contract at the August Agreement Evaluation Meeting was not required under the 1940 Act or by the terms and conditions of the RIMCo Agreement or portfolio management contracts but rather was considered again to allow a rescheduling of the annual agreement evaluation meetings to later in the calendar year, beginning in 2014, in line with the terms and conditions of the RIMCo Agreement and the portfolio management contracts and the provisions of the 1940 Act requiring that the RIMCo Agreement be approved on an annual basis. During the course of a year, the Trustees receive a wide variety of materials regarding, among other things, the investment performance of the Funds, sales and redemptions of the Funds’ shares, management of the Funds and other services provided by RIMCo and compliance with applicable regulatory requirements. In preparation for the review of the RIMCo Agreement at the Annual Agreement Evaluation Meeting, the Independent Trustees, with the advice and assistance of their independent counsel (“Independent Counsel”), also requested and the Board considered (1) information and reports prepared by RIMCo relating to the services provided by RIMCo (and its affiliates) to the Funds; and (2) information (the “Third-Party Information”) received from an independent, nationally recognized provider of investment company information comparing the performance of each of the Funds and their respective operating expenses over various periods of time ended December 31, 2012 with other peer funds not managed by RIMCo, believed by the provider to be generally comparable in investment objectives to the Funds. In the case of each Fund, its other peer funds are collectively hereinafter referred to as the Fund’s “Comparable Funds,” and, with the Fund, such Comparable Funds are collectively hereinafter referred to as the Fund’s “Performance Universe” in the case of performance comparisons and the Fund’s “Expense Universe” in the case of operating expense comparisons. In preparing the Third-Party Information for the Annual Agreement Evaluation Meeting, the third-party service provider initially changed its methodology for selection of the Expense Universe Comparable Funds from that used in prior years to exclude peer funds with distribution or shareholder servicing fees even though their investment objectives were generally comparable to the Funds’ objectives. In RIMCo’s judgment, this change in methodology arbitrarily resulted in a significant reduction in the number of funds in the Expense Universe and made the operating expense comparisons in the Third-Party Information less meaningful. After discussions with the Board’s independent Chair, RIMCo requested, and the third-party information provider furnished supplementally, the Third-Party Information reflecting the methodologies for selection of the Expense Universe Comparable Funds by the third-party service provider used in 2012. The Board focused on the supplemental Third-Party Information in conducting its evaluations. In general, the operating expense comparisons between the Funds and their Comparable Funds in the supplemental Third-Party Information were more favorable. In the case of certain, but not all, Funds, the Third-Party Information also reflected changes in the Comparable Funds requested by RIMCo, which changes were noted in the Third-Party Information. The foregoing and other information received by the Board, including the Independent Trustees, in connection with its evaluations of the RIMCo Agreement and portfolio management contracts are collectively called the “Agreement Evaluation Information.” The Trustees’ evaluations at the 2013 Agreement Evaluation Meetings also reflected the knowledge and familiarity gained as Board members of the Funds and the other RIMCo-managed funds for which the Board has supervisory responsibility (“Other Russell Funds”) with respect to services provided by RIMCo, RIMCo’s affiliates and each Money Manager. Prior to the 2013 Agreement Evaluation Meetings, the Trustees received a memorandum from counsel to the Funds (“Fund Counsel”) discussing the legal standards for their consideration of the continuations of the RIMCo Agreement and the portfolio management contracts, and the Independent Trustees separately received a memorandum regarding their responsibilities from Independent Counsel.
On April 9, 2013, the Independent Trustees, in preparation for the Annual Agreement Evaluation Meeting, met by conference telephone call to review the Agreement Evaluation Information received to that date in a private session with Independent Counsel at which no representatives of RIMCo or the Funds’ management were present and, on the basis of that review, requested additional Agreement Evaluation Information. On April 17, 2013, the Independent Trustees met in person in a private session with Independent Counsel to review additional Agreement Evaluation Information received to that date. At the Annual Agreement Evaluation Meeting, the Board, including the Independent Trustees, reviewed the proposed continuance of the RIMCo Agreement and the portfolio management contracts with RIMCo, Fund management, Independent Counsel and Fund Counsel. Presentations made by RIMCo at the Annual
Basis for Approval of Investment Advisory Contracts 161
Russell Investment Funds
Basis for Approval of Investment Advisory Contracts, continued — (Unaudited)
Agreement Evaluation Meeting as part of this review encompassed the Funds and all Other Russell Funds. Information received by the Board, including the Independent Trustees, at the Annual Agreement Evaluation Meeting is included in the Agreement Evaluation Information. Prior to voting at the Annual Agreement Evaluation Meeting, the non-management members of the Board, including the Independent Trustees, met in executive session with Fund Counsel and Independent Counsel to consider additional Agreement Evaluation Information received from RIMCo and management at the Annual Agreement Evaluation Meeting.
In preparation for the August Agreement Evaluation Meeting, the Independent Trustees informed RIMCo of their intention to rely substantially upon the Agreement Evaluation Information in considering the continuation of the RIMCo Agreement if, and to the extent that, such information continued to be accurate and complete as of the date of the August Agreement Evaluation Meeting and such Agreement Evaluation Information continued to provide such information as would be reasonably necessary to evaluate the terms of the RIMCo Agreement. The Board requested that RIMCo provide any and all updated or supplemental information which, taken together with the Agreement Evaluation Information, would be reasonably necessary for the Board to consider at the August Agreement Evaluation Meeting the continuation of the RIMCo Agreement and the portfolio management contracts (“Supplemental Agreement Evaluation Information”).
At the August Agreement Evaluation Meeting, the Independent Trustees met in a private session with Independent Counsel, at which no representatives of RIMCo or the Fund’s management were present, to review the proposed continuance of the RIMCo Agreement and the portfolio management contracts in light of the Agreement Evaluation Information, including the Third-Party Information and the Supplemental Agreement Evaluation Information. The Independent Trustees recalled and considered the factors and the findings that they reached in respect of those factors at the Annual Agreement Evaluation Meeting based upon the Agreement Evaluation Information, including the presentations made and the discussions that took place at that meeting, and reviewed the Supplemental Agreement Evaluation Information received to that date. The Independent Trustees noted that the Annual Agreement Evaluation Meeting preceded the August Agreement Evaluation Meeting by only four months and that the Supplemental Agreement Evaluation Information did not include any information that, in their judgment, adversely affected the bases of their evaluations and findings at the Annual Agreement Evaluation Meeting. At the August Agreement Evaluation Meeting, materials provided and presentations made by RIMCo again encompassed the Funds. Among other things, RIMCo provided updated performance information for the Funds in the quarterly information and reports. Information received by the Board, including the Independent Trustees, at the August Agreement Evaluation Meeting, including regular quarterly information and reports, is included in the Supplemental Agreement Evaluation Information. Prior to voting at the August Agreement Evaluation Meeting, the non-management members of the Board, including the Independent Trustees, met in executive session with Fund Counsel and Independent Counsel to consider continuation of the RIMCo Agreement and the portfolio management contracts in light of the Agreement Evaluation Information, the Supplemental Agreement Evaluation Information and discussions and reviews conducted at the 2013 Agreement Evaluation Meetings.
The discussion below reflects all of the above reviews.
In evaluating the portfolio management contracts at the 2013 Agreement Evaluation Meetings, the Board considered that each of the Funds employs a manager-of-managers method of investment and RIMCo’s advice that the Funds, in employing a manager-of-managers method of investment, operate in a manner that is distinctly different from most other investment companies. In the case of most other investment companies, an advisory fee is paid by the investment company to its adviser which, in turn, employs and compensates individual portfolio managers to make specific securities selections consistent with the adviser’s style and investment philosophy. RIMCo has engaged multiple unaffiliated Money Managers for all Funds.
The Board considered that RIMCo (rather than any Money Manager) is responsible under the RIMCo Agreement for determining, implementing and maintaining the investment program for each Fund. Assets of each Fund generally have been allocated among the multiple Money Managers selected by RIMCo, subject to Board approval, for that Fund. RIMCo manages the investment of each Fund’s cash and also may manage directly any portion of each Fund’s assets that RIMCo determines not to allocate to the Money Managers and portions of a Fund during transitions between Money Managers. In all cases, Fund assets are managed directly by RIMCo pursuant to authority provided by the RIMCo Agreement.
RIMCo is responsible for selecting, subject to Board approval, Money Managers for each Fund and for actively managing allocations and reallocations of its assets among the Money Managers. The Board has been advised that RIMCo’s goal is to construct and manage diversified portfolios in a risk-aware manner. Each Money Manager for a Fund in effect performs the function of an individual portfolio manager who is responsible for selecting portfolio securities for the portion of the Fund assigned to it by RIMCo (each, a “segment”) in accordance with the Fund’s applicable investment objective, policies and restrictions, any constraints placed by RIMCo upon their selection of portfolio securities and the Money Manager’s specified role in a Fund. For each Fund, RIMCo is responsible for, among
162 Basis for Approval of Investment Advisory Contracts
Russell Investment Funds
Basis for Approval of Investment Advisory Contracts, continued — (Unaudited)
other things, communicating performance expectations to each Money Manager; supervising compliance by each Money Manager with each Fund’s investment objective and policies; authorizing Money Managers to engage in certain investment strategies for a Fund; and recommending annually to the Board whether portfolio management contracts should be renewed, modified or terminated. In addition to its annual recommendation as to the renewal, modification or termination of portfolio management contracts, RIMCo is responsible for recommending to the Board additions of new Money Managers or replacements of existing Money Managers at any time when, based on RIMCo’s research and ongoing review and analysis, such actions are appropriate. RIMCo may impose specific investment constraints from time to time for each Money Manager intended to capitalize on the strengths of that Money Manager or to coordinate the investment activities of Money Managers for the Fund in a complementary manner. Therefore, RIMCo’s selection of Money Managers is made not only on the basis of performance considerations but also on the basis of anticipated compatibility with other Money Managers in the same Fund. In light of the foregoing, the overall performance of each Fund over appropriate periods reflects, in great part, the performance of RIMCo in designing the Fund’s investment program, structuring the Fund, selecting an effective Money Manager with a particular investment style or sub-style for a segment that is complementary to the styles of the Money Managers of other Fund segments, and allocating assets among the Money Managers in a manner designed to achieve the objectives of the Fund.
The Board considered that the prospectuses for the Funds and other public disclosures emphasize to investors RIMCo’s role as the principal investment manager for each Fund, rather than the investment selection role of the Funds’ Money Managers, and describe the manner in which the Funds operate so that investors may take that information into account when deciding to purchase shares of any Fund. The Board further considered that Fund investors in pursuing their investment goals and objectives likely purchased their shares on the basis of this information and RIMCo’s reputation for and performance record in managing the Funds’ manager-of-managers structure.
The Board also considered the demands and complexity of managing the Funds pursuant to the manager-of-managers structure, the special expertise of RIMCo with respect to the manager-of-managers structure of the Funds and the likelihood that, at the current expense ratio of each Fund, there would be no acceptable alternative investment managers to replace RIMCo on comparable terms given the need to continue the manager-of-managers strategy of such Fund selected by shareholders in purchasing their shares.
In addition to these general factors relating to the manager-of-managers structure of the Funds, the Trustees at the 2013 Agreement Evaluation Meetings considered, with respect to each Fund, various specific factors in evaluating renewal of the RIMCO Agreement, including the following:
| 1 | . | The nature, scope and overall quality of the investment management and other services provided, and expected to be provided, |
| | | to the Fund by RIMCo; |
| 2 | . | The advisory fee paid by the Fund to RIMCo (the “Advisory Fee”) and the fact that it encompasses all investment advisory fees |
| | | paid by the Fund, including the fees for any Money Managers of such Fund; |
| 3 | . | Information provided by RIMCo as to other fees and benefits received by RIMCo or its affiliates from the Fund, including any |
| | | administrative or transfer agent fees and any fees received for management of securities lending cash collateral, soft dollar |
| | | arrangements and commissions in connection with portfolio securities transactions; |
| 4 | . | Information provided by RIMCo as to expenses incurred by the Fund; |
| 5 | . | Information provided by RIMCo as to the profits that RIMCo derives from its mutual fund operations generally and from the |
| | | Fund; and |
6. Information provided by RIMCo concerning economies of scale and whether any scale economies are adequately shared with the Fund.
In evaluating the nature, scope and overall quality of the investment management and other services provided, and which are expected to be provided, to the Funds, including Fund portfolio management services, the Board at the 2013 Agreement Evaluation Meetings discussed with senior representatives of RIMCo the impact on the Funds’ operations of changes in RIMCo’s senior management and other personnel providing investment management and other services to the Funds during the prior year. The Board was not advised of any expected diminution in the nature, scope or quality of the investment advisory or other services provided to the Funds from such changes at either of the 2013 Agreement Evaluation Meetings. The Board also discussed the impact of organizational changes on the compliance programs of the Funds and RIMCo with the Funds’ Chief Compliance Officer (the “CCO”) and received assurances from the CCO that such changes have not resulted in any diminution in the scope and quality of the Funds’ compliance programs.
As noted above, RIMCo, in addition to managing the investment of each Fund’s cash, may directly manage a portion of certain Funds (the “Participating Funds”) pursuant to the RIMCo Agreement, the actual allocation being determined from time to time by the
Basis for Approval of Investment Advisory Contracts 163
Russell Investment Funds
Basis for Approval of Investment Advisory Contracts, continued — (Unaudited)
Participating Funds’ RIMCo portfolio manager. During 2012, RIMCo implemented a strategy of managing a portion of the assets of the Participating Funds to modify such Funds’ overall portfolio characteristics by investing in securities or other instruments that RIMCo believes will achieve the desired risk/return profiles for such Funds. RIMCo monitors and assesses Fund characteristics, including risk, using a variety of measurements, such as tracking error, and may seek to manage Fund characteristics consistent with the Participating Funds’ investment objectives and strategies. Participating Fund characteristics may be managed with the goal to increase or decrease exposures (such as volatility, momentum, value, growth, capitalization size, industry or sector) or to offset undesired relative over or underweights in order to seek to achieve the desired risk/return profile for the Participating Fund. RIMCo may use an index replication or sampling strategy by selecting an index which represents the desired exposure, or may utilize quantitative or qualitative analysis or quantitative models designed to assess Participating Fund characteristics and identify a portfolio which provides the desired exposure. Based on this, for the portion of a Participating Fund’s assets directly managed by RIMCo, RIMCo may purchase common stocks, exchange-traded funds, exchange-traded notes, short-term investments or derivatives, including futures, forwards, options and/or swaps, in order to seek to achieve the desired risk/return profile for the Participating Fund. RIMCo’s direct management of assets for these purposes is hereinafter referred to as the “Direct Management Services.” RIMCo also may reallocate Fund assets among Money Managers, increase Fund cash reserves, determine to not be fully invested, or adjust exposures through the cash equitization process. RIMCo’s Direct Management Services are not intended, and are not expected to be, a primary driver of Participating Funds’ investment results, although the services may have a positive or negative impact on investment results, but rather are intended to enhance incrementally the ability of the Participating Funds to carry out their investment programs. The Board considered that during the period, and to the extent that RIMCo employs its Direct Management Services in respect of Participating Funds, RIMCo is not required to pay investment advisory fees to a Money Manager with respect to assets that are directly managed and that the profits derived by RIMCo generally and from the Participating Funds consequently may be increased incrementally. The Board, however, also considered the potential benefits of the Direct Management Services to Participating Funds; the limited amount of assets that are managed directly by RIMCo pursuant to the Direct Management Services; and the fact that the aggregate investment Advisory Fees paid by the Participating Funds are not increased as a result of RIMCo’s direct management of Participating Fund assets as part of the Direct Management Services or otherwise.
In evaluating the reasonableness of the Funds’ Advisory Fees in light of Fund performance, the Board considered that, in the Agreement Evaluation Information and at past meetings, RIMCo noted differences between the investment strategies of certain Funds and their respective Comparable Funds in pursuing their investment objectives. The Board noted RIMCo’s further past advice that the strategies pursued by the Funds, among other things, are intended to result in less volatile, more moderate returns relative to each Fund’s performance benchmark rather than more volatile, more extreme returns that its Comparable Funds may experience over time.
The Third-Party Information included, among other things, comparisons of the Funds’ Advisory Fees with the advisory fees of their Comparable Funds on an actual basis (i.e., giving effect to any voluntary fee waivers implemented by RIMCo and the advisers to such Fund’s Comparable Funds). The Third-Party Information, among other things, showed that each Fund had an Advisory Fee which, compared with its Comparable Funds’ advisory fees on an actual basis, was ranked in the fourth or fifth quintile of its Expense Universe for that expense component. In these rankings, the first quintile represents funds with the lowest investment advisory fees among funds in the Expense Universe and the fifth quintile represents funds with the highest investment advisory fees among the Expense Universe funds. The comparisons were based upon the latest fiscal years for the Expense Universe funds. The Board considered RIMCo’s explanation of the reasons for these Funds’ actual Advisory Fee rankings and its belief that the Funds’ Advisory Fees are fair and reasonable under the circumstances, notwithstanding such comparisons. Among other things, RIMCo noted that meaningful comparisons of advisory fees between funds affiliated with insurance companies issuing variable annuity and life policies and non-affiliated funds, such as the Funds, are difficult as insurance companies may allocate fees between the investment policies and their underlying funds. The Board determined that it would continue to monitor the Funds’ Advisory Fees against the Funds’ Comparable Funds’ advisory fees.
In discussing the Funds’ Advisory Fees generally, RIMCo noted, among other things, that its Advisory Fees for the Funds encompass services that may not be provided by investment advisers to the Funds’ Comparable Funds, such as cash equitization and management of portfolio transition costs when Money Managers are added, terminated or replaced. RIMCo also observed that its “margins” in providing investment advisory services to the Funds tend to be lower than competitors’ margins because of the demands and complexities of managing the Funds’ manager-of-managers structure, including RIMCo’s payment of a significant portion of the Funds’ Advisory Fees to their Money Managers. RIMCo expressed the view that Advisory Fees should be considered in the context of a Fund’s total expense ratio to obtain a complete picture. The Board, however, considered each Fund’s Advisory Fee on both a standalone basis and in the context of the Fund’s total expense ratio.
164 Basis for Approval of Investment Advisory Contracts
Russell Investment Funds
Basis for Approval of Investment Advisory Contracts, continued — (Unaudited)
Based upon information provided by RIMCo, the Board considered for each Fund whether economies of scale have been realized and whether the Advisory Fee for such Fund appropriately reflects or should be revised to reflect any such economies. The Funds are distributed exclusively through variable annuity and variable life insurance contracts issued by insurance companies. Currently, the Funds are made available to holders of such insurance policies by two insurance companies. At the Annual Agreement Evaluation Meeting, RIMCo advised the Board that it does not expect that additional insurance companies will make the Funds available to their variable annuity or variable life insurance policyholders in the near or long term because of a declining interest by the insurance companies generally in variable insurance trusts, such as the Funds, as investment vehicles supporting their products. Notwithstanding this expectation, RIMCo expressed its belief that the Funds will remain viable in light of their cash inflows from current participating insurance companies. The Board considered, among other things, the negative implications for significant future Fund asset growth of RIMCo’s expectation that no additional insurance companies will make the Funds available to their variable annuity and variable life insurance policyholders and other factors associated with the manager-of-managers structure employed by the Funds, including the variability of Money Manager investment advisory fees.
The Board also considered, as a general matter, that fees payable to RIMCo by institutional clients with investment objectives similar to those of the Funds and Other Russell Funds are lower, and, in some cases, may be substantially lower, than the rates paid by the Funds and Other Russell Funds. The Trustees considered the differences in the nature and scope of services RIMCo provides to institutional clients and the Funds. RIMCo explained, among other things, that institutional clients have fewer compliance, administrative and other needs than the Funds. RIMCo also noted that since the Funds must constantly issue and redeem their shares, they are more difficult to manage than institutional accounts, where assets are relatively stable. In addition, RIMCo noted that the Funds are subject to heightened regulatory requirements relative to institutional clients. The Board noted that RIMCo provides office space and facilities to the Funds and all of the Funds’ officers. Accordingly, the Trustees concluded that the services provided to the Funds are sufficiently different from the services provided to the other clients that comparisons are not probative and should not be given significant weight.
With respect to the Funds’ total expenses, the Third-Party Information showed that the total expenses for the RIF Multi-Style Equity Fund and the RIF Core Bond Fund ranked in the third quintile of its Expense Universe. The total expenses for each of the other Funds ranked in the second quintile of its Expense Universe. In these rankings, the first quintile represents the funds with the lowest total expenses among funds in the Expense Universe and the fifth quintile represents funds with the highest total expenses among the Expense Universe funds
On the basis of the Agreement Evaluation Information, and other information previously received by the Board from RIMCo during the course of the current year or prior years, or presented at or in connection with the Annual Agreement Evaluation Meeting by RIMCo, the Board, in respect of each Fund, at the Annual Agreement Evaluation Meeting found, after giving effect to any applicable waivers and/or reimbursements and considering any differences in the composition and investment strategies of their respective Comparable Funds, (1) the Advisory Fee charged by RIMCo was reasonable in light of the nature, scope and overall quality of the investment management and other services provided, and expected to be provided, to the Funds; (2) the relative expense ratio of the Fund either was comparable to those of its Comparable Funds or RIMCo had provided an explanation satisfactory to the Board as to why the relative expense ratio was not comparable to those of its Comparable Funds; (3) RIMCo’s methodology of allocating expenses of operating funds in the complex was reasonable; (4) other benefits and fees received by RIMCo or its affiliates from the Funds were not excessive; (5) RIMCo’s profitability with respect to the Fund was not excessive in light of the nature, scope and overall quality of the investment management and other services provided by RIMCo; and (6) the Advisory Fee charged by RIMCo appropriately reflects any economies of scale realized by such Fund in light of various factors, including the the negative implications for significant future Fund asset growth of RIMCo’s expectation that no additional insurance companies will make the Funds available to their variable annuity and variable life insurance policyholders and other factors associated with the manager-of-managers structure employed by the Funds, including the variability of Money Manager investment advisory fees. Based upon the Agreement Evaluation Information, the Supplemental Agreement Evaluation Information and other information previously received by the Board from RIMCo during the course of the year, or presented at or in connection with the 2013 Agreement Evaluation Meetings by RIMCo, the Board confirmed each of the foregoing findings at the August Agreement Evaluation Meeting.
The Board at the 2013 Agreement Evaluation Meetings concluded that, under the circumstances and based on RIMCo’s performance information and reviews for each Fund at the 2013 Agreement Evaluation Meetings, the performance of each of the Funds would be consistent with continuation of the RIMCo Agreement. The Board, in assessing the Funds’ performance, focused upon each Fund’s performance for the 3-year period ended December 31, 2012 as most relevant but also considered Fund performance for the 1-year and5-year periods ended such date. In reviewing the Funds’ performance generally, the Board took into consideration various steps taken by RIMCo during 2012 to enhance the performance of certain Funds, including a large number of changes in Money Managers
Basis for Approval of Investment Advisory Contracts 165
Russell Investment Funds
Basis for Approval of Investment Advisory Contracts, continued — (Unaudited)
and, in the case of Participating Funds, RIMCo’s implementation of its Direct Management Services which were not yet reflected in Fund investment results.
With respect to the RIF Aggressive Equity Fund, the Third-Party Information showed that the Fund’s performance was ranked in the third quintile of its Performance Universe for the 1-year period ended December 31, 2012 and was ranked in the fourth and fifth quintiles for the 3- and 5-year periods ended such date, respectively. RIMCo noted that, effective May 1, 2012, the Fund’s investment strategy changed from investing principally in small and mid-cap securities to investing principally in small cap securities. RIMCo attributed the Fund’s relative underperformance for the 3-year period to the smaller cap profile of the Performance Universe before the Fund’s investment strategy change. Prior to the Fund’s investment strategy change, the Fund’s larger market cap profile resulted in a larger cap, higher quality investment strategy which underperformed the smaller cap, higher risk profile of the other Performance Universe funds significantly in the market environments during the 3- and 5-year periods.
With respect to the RIF Non-U.S. Fund, the Third-Party Information showed that the Fund’s performance for the 1- and 5-year periods ended December 31, 2012 was ranked in the third quintile of its Performance Universe and ranked in the fourth quintile of the Performance Universe for the 3-year period ended such date. RIMCo noted that the Fund’s performance relative to its Performance Universe has been affected negatively by its holdings in European financials, although these positions had produced more positive results recently, and its underweight to Australian banks which were leading bank performers but, among other things, were viewed by the Fund’s Money Managers as expensive relative to global peers. Moreover, the Fund’s allocation to sectors that are more sensitive to economic growth than traditional defensive sectors detracted from Fund performance as the global economic crisis continued and consumers and businesses reduced spending. RIMCo noted that the Fund outperformed its benchmark over the 3-year period.
In evaluating performance, the Board considered each Fund’s absolute performance and performance relative to appropriate benchmarks and indices in addition to such Fund’s performance relative to its Comparable Funds. In assessing the Funds’ performance relative to their Comparable Funds or benchmarks or in absolute terms, the Board also considered RIMCo’s stated investment strategy of managing the Funds in a risk-aware manner and the extraordinary capital market conditions during 2008 and early 2009 that continue to impact relative performance for the 3- and 5-year periods ended December 31, 2012. The Board also considered the large number of Money Manager changes that were made in 2012 and that the performance of Money Managers continues to impact Fund performance for periods prior and subsequent to their termination, and that any incremental positive or negative impact of the Direct Management Services was not yet reflected in the investment results for Participating Funds.
Based upon its consideration of the foregoing and other relevant factors, the Board at each of the 2013 Agreement Evaluation Meetings concluded that continuation of the RIMCo Agreement on its current terms and conditions would be in the best interests of each Fund and its respective shareholders and voted to approve the continuation of the RIMCo Agreement.
In connection with the 2013 Agreement Evaluation Meetings, with respect to the evaluation of the terms of portfolio management contracts with Money Managers, the Board received and considered information from RIMCo reporting, among other things, for each Money Manager, the Money Manager’s performance over various periods; RIMCo’s assessment of the performance of each Money Manager; any significant business relationships between the Money Manager and RIMCo or Russell Financial Services, Inc., the Funds’ underwriter; and RIMCo’s recommendation to retain the Money Manager at the current fee rate, to retain the Money Manager at a reduced fee rate or to terminate the Money Manager. The Board received reports during the course of the year and at the 2013 Agreement Evaluation Meetings from the Funds’ CCO regarding her assessments of Money Manager compliance programs and any compliance issues. RIMCo did not identify any benefits received by Money Managers or their affiliates as a result of their relationships with the Funds other than benefits from their soft dollar arrangements. The Agreement Evaluation Information described, and at the Annual Agreement Evaluation Meeting the Funds’ CCO discussed, oversight of Money Manager soft dollar arrangements. The Agreement Evaluation Information expressed RIMCo’s belief that, based upon certifications from Money Managers and pre-hire and ongoing reviews of Money Manager soft dollar arrangements, policies and procedures, the Money Managers’ soft dollar arrangements, policies and procedures are consistent with applicable legal standards and with disclosures made by Money Managers in their investment adviser registration statements filed with the Securities and Exchange Commission and by the Funds in their registration statements. At the Annual Agreement Evaluation Meeting, the Board was advised that, in the case of Money Managers using soft dollar arrangements, the CCO monitors, among other things, the commissions paid by the Funds and percentage of Fund transactions effected pursuant to the soft dollar arrangements, as well as the products or services purchased by the Money Managers with soft dollars generated by Fund portfolio transactions. The CCO and RIMCo do not obtain, and therefore neither the Agreement Evaluation Information nor the Supplemental Agreement Evaluation Information included, information regarding the value of soft dollar benefits derived by Money Managers from Fund portfolio transactions. RIMCo recommended at each of the 2013 Agreement Evaluation Meetings that each Money Manager be retained at its current fee rate. RIMCo recommended at the August Agreement
166 Basis for Approval of Investment Advisory Contracts
Russell Investment Funds
Basis for Approval of Investment Advisory Contracts, continued — (Unaudited)
Evaluation Meeting that each Money Manager be retained at its current fee rate. In doing so, RIMCo, as it has in the past, advised the Board that it does not regard Money Manager profitability as relevant to its evaluation of the portfolio management contracts with Money Managers because the willingness of Money Managers to serve in such capacity depends upon arm’s-length negotiations with RIMCo; RIMCo is aware of the fees charged by Money Managers to other clients; and RIMCo believes that the fees agreed upon with Money Managers are reasonable in light of the anticipated quality of investment advisory services to be rendered. In its evaluations at the 2013 Agreement Evaluation Meetings, the Board accepted RIMCo’s explanation of the relevance of Money Manager profitability in light of RIMCo’s belief that such fees are reasonable; the Board’s findings as to the reasonableness of the Advisory Fee paid by each Fund; and the fact that each Money Manager’s fee is paid by RIMCo.
Based substantially upon RIMCo’s recommendations, together with the Agreement Evaluation Information, the Board at the Annual Agreement Evaluation Meeting concluded that the fees paid to the Money Managers of each Fund are reasonable in light of the quality of the investment advisory services provided and that continuation of the portfolio management contract with each Money Manager of each Fund would be in the best interests of the Fund and its shareholders. The Board on the basis of the Agreement Evaluation Information and the Supplemental Agreement Evaluation Information confirmed such conclusions at the August Agreement Evaluation Meeting.
In their deliberations at the 2013 Agreement Evaluation Meetings, the Trustees did not identify any particular information as to the RIMCo Agreement or, other than RIMCo’s recommendation, the portfolio management contract with any Money Manager that was all-important or controlling and each Trustee attributed different weights to the various factors considered. The Trustees evaluated all information available to them on a Fund-by-Fund basis and their determinations were made in respect of each Fund.
Basis for Approval of Investment Advisory Contracts 167
Russell Investment Funds
Shareholder Requests for Additional Information — December 31, 2013 (Unaudited)
A complete unaudited schedule of investments is made available generally no later than 60 days after the end of the first and third quarters each year. These reports are available (i) free of charge, upon request, by calling the Funds at (800) 787-7354, (ii) on the Securities and Exchange Commission’s website at www.sec.gov, and (iii) at the Securities and Exchange Commission’s public reference room.
The Board has delegated to RIMCo, as RIF’s investment adviser, the primary responsibility for monitoring, evaluating and voting proxies solicited by or with respect to issuers of securities in which assets of the Funds may be invested. RIMCo has established a proxy voting committee and has adopted written proxy voting policies and procedures (“P&P”) and proxy voting guidelines (“Guidelines”). The Funds maintain a Portfolio Holdings Disclosure Policy that governs the timing and circumstances of disclosure to shareholders and third parties of information regarding the portfolio investments held by the Funds. A description of the P&P, Guidelines, Portfolio Holdings Disclosure Policy and additional information about Fund Trustees are contained in the Funds’ Statement of Additional Information (“SAI”). The SAI and information regarding how the Funds voted proxies relating to portfolio securities during the most recent 12 month period ended June 30, 2013 are available (i) free of charge, upon request, by calling the Funds at (800) 787-7354, and (ii) on the Securities and Exchange Commission’s website at www.sec.gov.
If possible, depending on contract owner registration and address information, and unless you have otherwise opted out, only one copy of the RIF prospectus and each annual and semi-annual report will be sent to contract owners at the same address. If you would like to receive a separate copy of these documents, please contact your Insurance Company. If you currently receive multiple copies of the prospectus, annual report and semi-annual report and would like to request to receive a single copy of these documents in the future, please call your insurance company.
Some insurance companies may offer electronic delivery of the Funds’ prospectus and annual and semi-annual reports. Please contact your insurance company for further details.
168 Shareholder Requests for Additional Information
Russell Investment Funds
Disclosure of Information about Fund Trustees and Officers — December 31, 2013 (Unaudited)
The following tables provide information for each officer and trustee of the Russell Fund Complex. The Russell Fund Complex consists of Russell Investment Company (“RIC”), which has 37 funds, Russell Investment Funds (“RIF”), which has 9 funds, and Russell Exchange Traded Funds Trust (“RET”), which has 1 fund. Each of the trustees is a trustee of RIC, RIF and RET. The first table provides information for the interested trustees. The second table provides information for the independent trustees. The third table provides information for the trustee emeritus. The fourth table provides information for the officers. Furthermore, each Trustee possesses the following specific attributes: Mr. Alston has business, financial and investment experience as a senior executive of an international real estate firm and is trained as a lawyer; Ms. Blake has had experience as a certified public accountant and has had experience as a member of boards of directors/trustees of other investment companies; Ms. Burgermeister has had experience as a certified public accountant and as a member of boards of directors/trustees of other investment companies; Mr. Connealy has had experience with other investment companies and their investment advisers first as a partner in the investment management practice of PricewaterhouseCoopers LLP and, subsequently, as the senior financial executive of two other investment organizations sponsoring and managing investment companies; Mr. Fine has had financial, business and investment experience as a senior executive of a non-profit organization and previously, as a senior executive of a large regional financial services organization with management responsibility for such activities as investments, asset management and securities brokerage; Mr. Tennison has had business, financial and investment experience as a senior executive of a corporation with international activities and was trained as an accountant; Mr. Thompson has had experience in business, governance, investment and financial reporting matters as a senior executive of an organization sponsoring and managing other investment companies, and, subsequently, has served as a board member of other investment companies, and has been determined by the Board to be an audit committee financial expert; and Ms. Weston has had experience as a tax and corporate lawyer, has served as general counsel of several corporations and has served as a director of another investment company. Ms. Cavanaugh has had experience with other financial services companies, including companies engaged in the sponsorship, management and distribution of investment companies. As a senior officer of the Funds, the Adviser and various affiliates of the Adviser providing services to the Funds, Ms. Cavanaugh is in a position to provide the Board with such parties’ perspectives on the management, operations and distribution of the Funds. Effective December 31, 2013, Mr. Fine and Ms. Weston retired from the Board and no longer serve as Trustees of the Russell Fund Complex. Effective January 1, 2014, Katherine W. Krysty was elected to the Board and began serving as a Trustee of the Russell Fund Complex. Ms. Krysty has had business, financial and investment experience as the founder and senior executive of a registered investment adviser focusing on high net worth individual as well as experience as a certified public accountant and a member of the boards of other corporations and non-profit organizations.
Disclosure of Information about Fund Trustees and Officers 169
Russell Investment Funds
Disclosure of Information about Fund Trustees and Officers, continued —
December 31, 2013 (Unaudited)
| | | | | | | | | | | No. of | | |
| | | | | | | | | | | Portfolios | | |
| | | | | | | | | | | in Russell | | Other |
| | | Position(s) Held | | | | | | | | Fund | | Directorships |
| Name, | | With Fund and | | Term | | | | Principal Occupation(s) | | Complex | | Held by Trustee |
| Age, | | Length of | | of | | | | During the | | Overseen | | During the |
| Address | | Time Served | | Office* | | | | Past 5 Years | | by Trustee | | Past 5 Years |
| |
| INTERESTED TRUSTEES | | | | | | | | | | | | |
| # Sandra Cavanaugh, | | President and Chief | | Until successor | | • | | President and CEO RIC, RIF and | | 47 | | None |
| Born May 10, 1954 | | Executive Officer since | | is chosen and | | | | RET | | | | |
| | | 2010 | | qualified by | | • | | Chairman of the Board, Co- | | | | |
| 1301 Second Avenue, | | | | Trustees | | | | President and CEO, Russell | | | | |
| 18th Floor, Seattle, WA | | Trustee since 2010 | | | | | | Financial Services, Inc. (RFS) | | | | |
| 98101 | | | | Appointed until | | • | | Chairman of the Board, President | | | | |
| | | | | successor is | | | | and CEO, Russell Fund Services | | | | |
| | | | | duly elected and | | | | Company (“RFSC”) | | | | |
| | | | | qualified | | • | | Director, RIMCo | | | | |
| | | | | | | • | | Chairman of the Board, President | | | | |
| | | | | | | | | and CEO, Russell Insurance | | | | |
| | | | | | | | | Agency, Inc. (“RIA”) (insurance | | | | |
| | | | | | | | | agency) | | | | |
| | | | | | | • | | May 2009 to December 2009, | | | | |
| | | | | | | | | Executive Vice President, Retail | | | | |
| | | | | | | | | Channel, SunTrust Bank | | | | |
| | | | | | | • | | 2007 to January 2009, Senior Vice | | | | |
| | | | | | | | | President, National Sales — Retail | | | | |
| | | | | | | | | Distribution, JPMorgan Chase/ | | | | |
| | | | | | | | | Washington Mutual, Inc. | | | | |
| | | | | | | | | (investment company) | | | | |
| |
| |
| |
| ## Daniel P. Connealy, | | Trustee since 2003 | | Appointed until | | • | | June 2004 to present, Senior Vice | | 47 | | None |
| Born June 6, 1946 | | | | successor is | | | | President and Chief Financial | | | | |
| | | | | duly elected and | | | | Officer, Waddell & Reed Financial, | | | | |
| 1301 Second Avenue, 18th | | | | qualified | | | | Inc. (investment company) | | | | |
| Floor, Seattle, WA | | | | | | | | | | | | |
| 98101 | | | | | | | | | | | | |
| |
| |
| ### Jonathan Fine, | | Trustee since 2004 | | Appointed until | | • | | President and Chief Executive | | 47 | | None |
| Born July 8, 1954 | | | | successor is | | | | Officer, United Way of King | | | | |
| | | | | duly elected and | | | | County, WA (charitable | | | | |
| 1301 Second Avenue, | | | | qualified | | | | organization) | | | | |
| 18 th Floor, Seattle, WA | | | | | | | | | | | | |
| 98101 | | | | | | | | | | | | |
* Each Trustee is subject to mandatory retirement at age 72.
# Ms. Cavanaugh is also an officer and/or director of one or more affiliates of RIC, RIF and RET and is therefore classified as an Interested Trustee.
## Mr. Connealy is an officer of a broker-dealer that distributes shares of the Funds and is therefore classified as an Interested Trustee.
### Mr. Fine is classified as an Interested Trustee due to Ms. Cavanaugh’s service on the Board of Directors of the United Way of King County, WA (“UWKC”) and in light of charitable contributions made by Russell Investments to UWKC. Effective December 31, 2013, Mr. Fine retired from the Board and no longer serves as a Trustee.
170 Disclosure of Information about Fund Trustees and Officers
Russell Investment Funds
Disclosure of Information about Fund Trustees and Officers, continued —
December 31, 2013 (Unaudited)
| | | | | | | | | | | No. of | | |
| | | | | | | | | | | Portfolios | | |
| | | | | | | | | | | in Russell | | Other |
| | | Positions(s) Held | | | | | | | | Fund | | Directorships |
| Name, | | With Fund and | | Term | | | | Principal Occupation(s) | | Complex | | Held by Trustee |
| Age, | | Length of | | of | | | | During the | | Overseen | | During the |
| Address | | Time Served | | Office | | | | Past 5 Years | | by Trustee | | Past 5 Years |
| |
| INDEPENDENT TRUSTEES | | | | | | | | | | | | |
| Thaddas L. Alston, | | Trustee since 2006 | | Appointed until | | • | | Senior Vice President, Larco | | 47 | | None |
| Born April 7, 1945 | | | | successor is | | | | Investments, Ltd. (real estate firm) | | | | |
| | | Chairman of the | | duly elected and | | | | | | | | |
| 1301 Second Avenue, | | Investment Committee | | qualified | | | | | | | | |
| 18th Floor, Seattle, WA | | since 2010 | | | | | | | | | | |
| 98101 | | | | Appointed until | | | | | | | | |
| | | | | successor is | | | | | | | | |
| | | | | duly elected and | | | | | | | | |
| | | | | qualified | | | | | | | | |
| |
| |
| |
| |
| Kristianne Blake, | | Trustee since 2000 | | Appointed until | | • | | Director and Chairman of the | | 47 | | •Director, |
| Born January 22, 1954 | | | | successor is | | | | Audit Committee, Avista Corp | | | | Avista Corp |
| | | Chairman since 2005 | | duly elected and | | | | (electric utilities) | | | | (electric |
| 1301 Second Avenue, | | | | qualified | | • | | Regent, University of Washington | | | | utilities); |
| 18 th Floor, Seattle, WA | | | | | | • | | President, Kristianne Gates Blake, | | | | •Until |
| 98101 | | | | Annual | | | | P. S. (accounting services) | | | | December 31, |
| | | | | | | • | | Until December 31, 2013, Trustee | | | | 2013, Trustee, |
| | | | | | | | | and Chairman of the Operations | | | | Principal |
| | | | | | | | | Committee, Principal Investors | | | | Investors Funds |
| | | | | | | | | Funds and Principal Variable | | | | (investment |
| | | | | | | | | Contracts Funds (investment | | | | company); |
| | | | | | | | | company) | | | | •Until |
| | | | | | | | | | | | | December 31, |
| | | | | | | | | | | | | 2013, Trustee |
| | | | | | | | | | | | | Principal |
| | | | | | | | | | | | | Variable |
| | | | | | | | | | | | | Contracts |
| | | | | | | | | | | | | Funds |
| | | | | | | | | | | | | (investment |
| | | | | | | | | | | | | company) |
| |
| |
| Cheryl Burgermeister, | | Trustee since 2012 | | Appointed until | | • | | Retired | | 47 | | •Trustee and |
| Born June 26, 1951 | | | | successor is | | • | | Trustee and Chairperson of Audit | | | | Chairperson |
| | | | | duly elected and | | | | Committee, Select Sector SPDR | | | | of Audit |
| 1301 Second Avenue, | | | | qualified | | | | Funds (investment company) | | | | Committee, |
| 18 th Floor, Seattle, WA | | | | | | • | | Trustee and Finance Committee | | | | Select Sector |
| 98101 | | | | | | | | Member/Chairman, Portland | | | | SPDR Funds |
| | | | | | | | | Community College (charitable | | | | (investment |
| | | | | | | | | organization) | | | | company) |
| | | | | | | | | | | | | •Trustee, ALPS |
| | | | | | | | | | | | | Series Trust |
| | | | | | | | | | | | | (investment |
| | | | | | | | | | | | | company) |
Disclosure of Information about Fund Trustees and Officers 171
Russell Investment Funds
Disclosure of Information about Fund Trustees and Officers, continued —
December 31, 2013 (Unaudited)
| | | | | | | | | | | No. of | | |
| | | | | | | | | | | Portfolios | | |
| | | | | | | | | | | in Russell | | Other |
| | | Position(s) Held | | | | | | | | Fund | | Directorships |
| Name, | | With Fund and | | Term | | | | Principal Occupation(s) | | Complex | | Held by Trustee |
| Age, | | Length of | | of | | | | During the | | Overseen | | During the |
| Address | | Time Served | | Office* | | | | Past 5 Years | | by Trustee | | Past 5 Years |
| |
| INDEPENDENT TRUSTEES (continued) | | | | | | | | | | |
| Katherine W. Krysty**, | | Trustee since 2014 | | Appointed until | | • | | Retired | | 47 | | None |
| Born December 3, 1951 | | | | successor is | | • | | Until February 2013, President | | | | |
| | | | | duly elected and | | | | Emerita, Laird Norton Wealth | | | | |
| 1301 Second Avenue, | | | | qualified | | | | Management (investments company) | | | | |
| 18th Floor, Seattle, WA | | | | | | • | | April 2003 to December 2010, Chief | | | | |
| 98101 | | | | | | | | Executive Officer of Laird Norton | | | | |
| | | | | | | | | Wealth Management (investment | | | | |
| | | | | | | | | company) | | | | |
| |
| |
| Raymond P. Tennison, Jr. , | | Trustee since 2000 | | Appointed until | | • | | Vice Chairman of the Board, | | 47 | | None |
| Born December 21, 1955 | | | | successor is | | | | Simpson Investment Company | | | | |
| | | Chairman of | | duly elected and | | | | (paper and forest products) | | | | |
| 1301 Second Avenue | | the Nominating | | qualified | | • | | Until November 2010, President, | | | | |
| 18 th Floor, Seattle, WA | | and Governance | | | | | | Simpson Investment Company | | | | |
| 98101 | | Committee since | | Appointed until | | | | and several additional subsidiary | | | | |
| | | 2007 | | successor is | | | | companies, including Simpson | | | | |
| | | | | duly elected and | | | | Timber Company, Simpson Paper | | | | |
| | | | | qualified | | | | Company and Simpson Tacoma | | | | |
| | | | | | | | | Kraft Company | | | | |
| |
| |
| Jack R. Thompson, | | Trustee since 2005 | | Appointed until | | • | | September 2003 to September | | 47 | | •Director, |
| Born March 21, 1949 | | | | successor is | | | | 2009, Independent Board Chair | | | | Board Chairman |
| | | Chairman of the | | duly elected and | | | | and Chairman of the Audit | | | | and Chairman |
| 1301 Second Avenue, | | Audit Committee | | qualified | | | | Committee, Sparx Asia Funds | | | | of the Audit |
| 18 th Floor, Seattle, WA | | since 2012 | | | | | | (investment company) | | | | Committee, |
| 98101 | | | | Appointed until | | • | | September 2007 to September | | | | Life Vantage |
| | | | | successor is | | | | 2010, Director, Board Chairman | | | | Corporation |
| | | | | duly elected and | | | | and Chairman of the Audit | | | | until September |
| | | | | qualified | | | | Committee, LifeVantage | | | | 2010 (health |
| | | | | | | | | Corporation (health products | | | | products |
| | | | | | | | | company) | | | | company); |
| | | | | | | | | | | | | •Director, Sparx |
| | | | | | | | | | | | | Asia Funds |
| | | | | | | | | | | | | until 2009 |
| | | | | | | | | | | | | (investment |
| | | | | | | | | | | | | company) |
| |
| |
| Julie W. Weston***, | | Trustee since 2002 | | Appointed until | | • | | Retired | | 47 | | None |
| Born October 2, 1943 | | | | successor is | | | | | | | | |
| | | | | duly elected and | | | | | | | | |
| 1301 Second Avenue, | | | | qualified | | | | | | | | |
| 18 th Floor, Seattle, WA | | | | | | | | | | | | |
| 98101 | | | | | | | | | | | | |
* Each Trustee is subject to mandatory retirement at age 72.
** Ms. Krysty was elected to the Board of Trustees effective January 1, 2014.
***Effective December 31, 2013, Ms. Weston retired from the board and no longer serves as Trustee.
172 Disclosure of Information about Fund Trustees and Officers
Russell Investment Funds
Disclosure of Information about Fund Trustees and Officers, continued —
December 31, 2013 (Unaudited)
| | | | | | | | | | | No. of | | |
| | | | | | | | | | | Portfolios | | |
| | | | | | | | | | | in Russell | | Other |
| | | Position(s) Held | | | | | | | | Fund | | Directorships |
| Name, | | With Fund and | | Term | | | | Principal Occupation(s) | | Complex | | Held by Trustee |
| Age, | | Length of | | of | | | | During the | | Overseen | | During the |
| Address | | Time Served | | Office* | | | | Past 5 Years | | by Trustee | | Past 5 Years |
| |
| TRUSTEE EMERITUS | | | | | | | | | | | | |
| George F. Russell, Jr. , | | Trustee Emeritus and | | Until resignation | | • | | Director Emeritus, Frank Russell | | 47 | | None |
| Born July 3, 1932 | | Chairman Emeritus | | or removal | | | | Company (investment consultant | | | | |
| | | since 1999 | | | | | | to institutional investors (“FRC”)) | | | | |
| 1301 Second Avenue, | | | | | | | | and RIMCo | | | | |
| 18th Floor, Seattle, WA | | | | | | • | | Chairman Emeritus, RIC and | | | | |
| 98101 | | | | | | | | RIF; Russell Implementation | | | | |
| | | | | | | | | Services Inc. (broker-dealer and | | | | |
| | | | | | | | | investment adviser (“RIS”)); | | | | |
| | | | | | | | | Russell 20-20 Association | | | | |
| | | | | | | | | (non-profit corporation); and | | | | |
| | | | | | | | | Russell Trust Company | | | | |
| | | | | | | | | (non-depository trust company | | | | |
| | | | | | | | | (“RTC”)) | | | | |
| | | | | | | • | | Chairman, Sunshine Management | | | | |
| | | | | | | | | Services, LLC (investment adviser) | | | | |
Disclosure of Information about Fund Trustees and Officers 173
Russell Investment Funds
Disclosure of Information about Fund Trustees and Officers, continued —
December 31, 2013 (Unaudited)
| | | Positions(s) Held | | | | | | |
| Name, | | With Fund and | | Term | | | | Principal Occupation(s) |
| Age, | | Length of | | of | | | | During the |
| Address | | Time Served | | Office | | | | Past 5 Years |
| |
| OFFICERS | | | | | | | | |
| Cheryl Wichers, | | Chief Compliance | | Until removed | | • | | Chief Compliance Officer, RIC, RIF and RET |
| Born December 16, 1966 | | Officer since 2005 | | by Independent | | • | | Chief Compliance Officer, RFSC and U. S. One Inc. |
| | | | | Trustees | | • | | 2005-2011 Chief Compliance Officer, RIMCo |
| 1301 Second Avenue | | | | | | | | |
| 18th Floor, Seattle, WA | | | | | | | | |
| 98101 | | | | | | | | |
| |
| |
| Sandra Cavanaugh, | | President and Chief | | Until successor | | • | | CEO, U. S. Private Client Services, Russell Investments |
| Born May 10, 1954 | | Executive Officer | | is chosen and | | • | | President and CEO, RIC, RIF and RET |
| | | since 2010 | | qualified by | | • | | Chairman of the Board, Co-President and CEO, RFS |
| 1301 Second Avenue, | | | | Trustees | | • | | Chairman of the Board, President and CEO, RFSC |
| 18 th Floor, Seattle, WA | | | | | | • | | Director, RIMCo |
| 98101 | | | | | | • | | May 2009 to December 2009, Executive Vice President, Retail |
| | | | | | | | | Channel, SunTrust Bank |
| | | | | | | • | | 2007 to January 2009, Senior Vice President, National Sales — |
| | | | | | | | | Retail Distribution, JPMorgan Chase/Washington Mutual, Inc. |
| |
| |
| |
| Mark E. Swanson, | | Treasurer and Chief | | Until successor | | • | | Treasurer, Chief Accounting Officer and CFO, RIC, RIF and |
| Born November 26, 1963 | | Accounting Officer | | is chosen and | | | | RET |
| | | since 1998 | | qualified by | | • | | Director, RIMCo, RFSC, Russell Trust Company (“RTC”) |
| 1301 Second Avenue | | | | Trustees | | | | and RFS |
| 18 th Floor, Seattle, WA | | | | | | • | | Head of North America Operations, Russell Investments |
| 98101 | | | | | | • | | May 2009 to October 2011, Global Head of Fund Operations, |
| | | | | | | | | Russell Investments |
| | | | | | | • | | 1999 to May 2009, Director, Fund Administration |
| |
| |
| Jeffrey T. Hussey | | Chief Investment | | Until removed by | | • | | Global Chief Investment Officer, Russell Investments |
| Born May 2, 1969 | | Officer since 2013 | | Trustees | | • | | Chief Investment Officer, RIC, RIF and RET |
| | | | | | | • | | Chairman of the Board, President and CEO, RIMCo |
| 1301 Second Avenue, | | | | | | • | | Director, RTC, RIS and Russell Investments Delaware, Inc. |
| 18 th Floor, Seattle WA | | | | | | • | | Board of Managers, Russell Institutional Funds |
| 98101 | | | | | | | | Management, Inc. |
| | | | | | | • | | 2008 to 2013 Chief Investment Officer, Fixed Income, |
| | | | | | | | | Russell Investments |
| |
| |
| Mary Beth Rhoden | | Secretary since 2010 | | Until successor | | • | | Associate General Counsel, Russell Investments |
| Albaneze, | | | | is chosen and | | • | | Secretary, RIMCo, RFSC and RFS |
| Born April 25, 1969 | | | | qualified by | | • | | Secretary and Chief Legal Officer, RIC, RIF and RET |
| | | | | Trustees | | • | | Assistant Secretary, RFS, RIA and U. S. One Inc. |
| 1301 Second Avenue, | | | | | | • | | 1999 to 2010 Assistant Secretary, RIC and RIF |
| 18 th Floor, Seattle, WA | | | | | | | | |
| 98101 | | | | | | | | |
174 Disclosure of Information about Fund Trustees and Officers
Russell Investment Funds
1301 Second Avenue, Seattle, Washington 98101
(800) 787-7354
| Interested Trustees | | Seattle, WA 98101 |
| Sandra Cavanaugh | | Independent Registered Public Accounting Firm |
| Daniel P. Connealy | | PricewaterhouseCoopers LLP |
| Jonathan Fine(1) | | 1420 5th Avenue, Suite 1900 |
| Independent Trustees | | Seattle, WA 98101 |
| Thaddas L. Alston | | Money Managers as of December 31, 2013 |
| Kristianne Blake | | Multi-Style Equity Fund |
| Cheryl Burgermeister | | Columbus Circle Investors, Stamford, CT |
| Katherine W. Krysty(2) | | DePrince, Race & Zollo, Inc. , Winter Park, FL |
| Raymond P. Tennison, Jr. | | Institutional Capital LLC, Chicago, IL |
| Jack R. Thompson | | Jacobs Levy Equity Management, Inc. , Florham Park, NJ |
| Julie W. Weston(1) | | Mar Vista Investment Partners, LLC, Los Angeles, CA |
| Trustee Emeritus | | Suffolk Capital Management, LLC, New York, NY |
| George F. Russell, Jr. | | Sustainable Growth Advisers, LP, Stamford, CT |
| Officers | | Aggressive Equity Fund |
| Sandra Cavanaugh, President and Chief Executive Officer | | Conestoga Capital Advisors, LLC, Radnor, PA |
| Cheryl Wichers, Chief Compliance Officer | | DePrince, Race & Zollo, Inc. , Winter Park, FL |
| Jeffrey T. Hussey, Chief Investment Officer | | Jacobs Levy Equity Management, Inc. , Florham Park, NJ |
| Mark E. Swanson, Treasurer and Chief Accounting Officer | | Ranger Investment Management, L. P. , Dallas, TX |
| Mary Beth Rhoden Albaneze, Secretary | | RBC Global Asset Management (U. S. ) Inc. , Minneapolis, MN |
| Adviser | | J. P. Morgan Investment Management Inc. , New York, NY |
| Russell Investment Management Company | | Signia Capital Management LLC, Spokane, WA |
| 1301 Second Avenue | | Non-U. S. Fund |
| Seattle, WA 98101 | | Barrow, Hanley, Mewhinney & Strauss, LLC, Dallas, TX |
| Administrator and Transfer and Dividend Disbursing | | MFS Institutional Advisors Inc. , Boston, MA |
| Agent | | Pzena Investment Management LLC, New York, NY |
| | | William Blair & Company L. L. C. , Chicago, IL |
| |
| 1301 Russell Second Fund Avenue Services Company | | Core Bond Fund |
| Seattle, WA 98101 | | Colchester Global Investors Ltd, London, England |
| Custodian | | Logan Circle Partners, L. P. , Philadelphia, PA |
| | | Macro Currency Group — an investment group within |
| State Street Bank and Trust Company | | Principal Global Investors, LLC, Des Moines, IA* |
| 1200 Crown Colony Drive | | Metropolitan West Asset Management LLC, Los Angeles, CA |
| Crown Colony Office Park | | Barrow, Hanley, Mewhinney & Strauss, LLC, Dallas, TX |
| Quincy, MA 02169 | | Pacific Investment Management Company LLC, Newport |
| Office of Shareholder Inquiries | | Beach, CA |
| 1301 Second Avenue | | Global Real Estate Securities Fund |
| Seattle, WA 98101 | | AEW Capital Management LP, Boston, MA |
| (800) 787-7354 | | Cohen & Steers Capital Management, Inc. , New York, NY |
| Legal Counsel | | INVESCO Advisers, Inc. which acts as a money manager to |
| Dechert LLP | | the Fund through its INVESCO Real Estate Division, |
| One International Place, 40th Floor | | Dallas, TX |
| 100 Oliver Street | | *Principal Global Investors LLC is the asset management arm of the Principal |
| Boston, MA 02110 | | Financial Group® (The Principal®), which includes various member com- |
| Distributor | | panies including Principal Global Investors, LLC, Principal Global Investors |
| Russell Financial Services, Inc. | | (Europe) Limited, and others. The Macro Currency Group is the specialist |
| 1301 Second Avenue | | currency investment group within Principal Global Investors. Where used |
| | | herein, Macro Currency Group means Principal Global Investors, LLC. |
(1) Effective December 31, 2013, Mr. Fine and Ms. Weston retired from the Board and no longer serve as Trustees of the Trust. (2) Ms. Krysty was elected to the Board of Trustees effective January 1, 2014.
This report is prepared from the books and records of the Funds and is submitted for the general information of shareholders and is not authorized for distribution to prospective investors unless accompanied or preceded by an effective Prospectus. Nothing herein contained is to be considered an offer of sale or a solicitation of an offer to buy shares of Russell Investment Funds. Such offering is made only by Prospectus, which includes details as to offering price and other material information.
Advisor, Money Manager and Service Providers 175


2013 ANNUAL REPORT
Russell Investment Funds
LifePoints ® Funds Variable Target Portfolio Series
DECEMBER 31, 2013
FUND
Moderate Strategy Fund
Balanced Strategy Fund
Growth Strategy Fund
Equity Growth Strategy Fund
| Russell Investment Funds |
| |
| Russell Investment Funds is a |
| series investment company with |
| nine different investment portfolios |
| referred to as Funds. These |
| financial statements report on four |
| of these Funds. |
Russell Investment Funds
LifePoints ® Funds
Variable Target Portfolio Series
Annual Report
December 31, 2013
Table of Contents
To Our Shareholders .........................................................................................5
Market Summary ............................................................................................... 6
Moderate Strategy Fund .................................................................................... 16
Balanced Strategy Fund .................................................................................... 28
Growth Strategy Fund ....................................................................................... 40
Equity Growth Strategy Fund ............................................................................ 52
Notes to Financial Highlights ........................................................................... 64
Notes to Financial Statements .......................................................................... 65
Report of Independent Registered Public Accounting Firm ............................... 72
Tax Information ................................................................................................ 73
Basis for Approval of Investment Advisory Contracts ...................................... 74
Shareholder Requests for Additional Information ............................................. 82
Disclosure of Information about Fund Trustees and Officers ............................83
Adviser and Service Providers .......................................................................... 89
Russell Investment Funds - LifePoints ® Funds Variable Target Portfolio Series
Copyright © Russell Investments 2014. All rights reserved.
Russell Investments is a Washington, USA corporation, which operates through subsidiaries worldwide and is a subsidiary of The Northwestern Mutual Life Insurance Company.
Fund objectives, risks, charges and expenses should be carefully considered before investing. A prospectus containing this and other important information must precede or accompany this material. Please read the prospectus carefully before investing.
Securities distributed through Russell Financial Services, Inc., member FINRA and part of Russell Investments.
Indices and benchmarks are unmanaged and cannot be invested in directly. Returns represent past performance, are not a guarantee of future performance, and are not indicative of any specific investment. Index return information is provided by vendors and although deemed reliable, is not guaranteed by Russell Investments or its affiliates.
Russell Investments is the owner of the trademarks, service marks, and copyrights related to its respective indexes.
Performance quoted represents past performance and does not guarantee future results. The investment return and principal value of an investment will fluctuate so that shares, when redeemed, may be worth more or less than their original cost. Current performance may be lower or higher than the performance data quoted.
To Our Shareholders
Dear Shareholder,
During 2013, investors endured their fair share of short-term political uncertainty here in the United States, but the equity markets continued to look beyond these events. In fact, the U.S. and world economies have generally shown consistent, stable growth that’s been in line with Russell’s expectations.
What’s more, the global equity markets enjoyed significant appreciation this past year. For example, the broad-based Russell 3000® Index returned 33.55% for the year 2013.
Looking forward into 2014, we maintain modest growth expectations for the U.S. and global economies. Although we remain optimistic, we don’t think it’s reasonable to expect double-digit gains like we saw in 2013.
However, as global markets and economies continue to evolve, we will continue to invest where we believe the world is going – not where it’s been – to seek to improve the overall return potential of our portfolios. This means being proactive and agile in the way we allocate assets on your behalf. It also means balancing the risk and return potential of the multi-asset solutions we build and manage for investors like you.
On the following pages you can gain additional insights by reviewing our Russell Investment Funds’ 2013 Annual Report for the fiscal year ended December 31, 2013, including portfolio management discussions and fund performance information.
Thank you for the trust you have placed in our firm. All of us at Russell Investments appreciate the opportunity to help you achieve financial security.

CEO, U.S. Private Client Services
To Our Shareholders 5
Russell Investment Funds
Market Summary as of December 31, 2013 (Unaudited)
U.S. Equity Markets
The U.S. equity market performed very well over the fiscal year ending December 31, 2013 despite potentially encumbering macroeconomic and political news items. Broadly measured by the Russell 3000® Index, U.S. stocks returned 33.55% over the period, which is the strongest calendar year end return for the Index since 1995.
The Russell 3000® Index produced positive returns in ten of the fiscal year’s twelve months, with exceptions in June and August. The fiscal year was led by small capitalization stocks as the Russell 2000® Index returned 38.82% while the Russell 1000® Index returned 33.11%. The fiscal year was also led by dynamic stocks as the Russell 1000® Dynamic™ Index returned 35.29% while the Russell 1000® Defensive™ Index returned 30.90%. Within U.S. large capitalization stocks, the Russell 1000® Growth Index returned 33.48% compared with 32.53% for the Russell 1000® Value Index. Factor analysis reveals that high yield stocks underperformed, while high beta (beta is a measure of a portfolio’s volatility and its sensitivity to the direction of the market), high growth stocks as well as those with rising earnings estimates, price momentum and positive earnings surprises outperformed. Growth stocks led the way within small cap as well with the Russell 2000® Value Index returning 34.52% in contrast to the 43.30% returned by the Russell 2000® Growth Index.
Immediately before the beginning of 2013, U.S. equity investors had been dealing with concerns over the impending “fiscal cliff”, potential sequester, higher taxes and potential spending cuts in 2013. On January 1, 2013, Congress partially addressed the fiscal issues and avoided the fiscal cliff for the moment. This allowed calendar year 2013 to begin with strong performance for the U.S. equity market as the Russell 3000® Index had a positive return in each of the first five months of the year. Despite the broad indexes rising, there were changes in market leadership during “risk off” times due to the Italian election, the events surrounding the Cyprus bailout, and speculation about Fed tapering of quantitative easing. When concerns about Europe increased, the Russell 1000® Defensive™ Index outperformed, and when they subsided, the Russell 1000® Dynamic™ Index outperformed.
Going into the summer of 2013, one of the most notable stories was the upward movement in bond yields and broader interest rates. The continued economic recovery and rising interest rates became important factors driving investor behavior as the year progressed. A key date was May 22nd, the day U.S. Federal Reserve (“Fed”) Chairman Ben Bernanke announced that the U.S. economy was strengthening and the Fed may start to taper its policy of quantitative easing. This news caused stocks with high dividend yields to underperform because they had been used as “bond substitutes” by some investors and rising interest rates made the dividend yields less enticing on a relative basis. Real Estate Investment Trusts (“REITs”) and utilities, which had been prized by investors for their high dividend yields in a period of low interest rates and low bond yields, underperformed during the second quarter. Given the evidence of the economic improvement, most sectors traditionally deemed to be non-cyclical underperformed for the second quarter. Among such sectors, health care was the only one to outperform for the second quarter and the fiscal year. Most of the more cyclical sectors outperformed the market, but the energy sector was a negative outlier for the fiscal year. The month of May was seen as a turning point that had a significant impact on the fiscal year in terms of which market segments outperformed.
During the summer of 2013, the U.S. equity market continued to rally but broad market leadership shifted strongly to growth stocks. Within U.S. large cap, growth stocks had lagged for nearly two years since the trough of the 2011 selloff. During the 3rd quarter of 2013, the Russell 1000® Growth Index beat the Russell 1000® Value Index by more than it had in any quarter of the past 4 years.
6 Market Summary
Russell Investment Funds
Market Summary as of December 31, 2013, continued — (Unaudited)
In September, the U.S. Federal Reserve ultimately decided to push back plans to taper its quantitative easing program and markets responded positively. October began with concerns about the U.S. government not reaching agreement on a spending bill or a plan to address the “fiscal cliff.” This led to a government “shutdown,” and despite some brief volatility, the market generally took the governmental chaos in stride. With an agreement reached to push the fiscal issues into 2014, the government was “re-opened” and the market produced a positive return for October. In December, Congress passed legislation to prevent another government “shutdown” that may have occurred in early 2014 if there had been no action. However, the issue of the debt ceiling remained unresolved.
The fourth quarter of 2013 ended up being very positive for U.S. equities with the Russell 3000® Index returning 10.10%. The largest capitalization stocks led for the quarter as the Russell Top 50® Mega Cap Index outperformed the Russell 3000® Index by 138 basis points, returning 11.48%. Small cap and mid-cap stocks lagged with the Russell 2000® Index returning 8.72% and the Russell Midcap® Index returning 8.39%. This was a major reversal of leadership as small and midcap stocks had led for the majority of the year. Within the Russell 1000® Index, dynamic stocks and growth stocks produced modest outperformance, but within the Russell 2000® Index, defensive stocks and value stocks outperformed. As expected in a rapidly rising market, the Russell 3000® Dynamic™ Index outperformed the Russell 3000® Defensive™ Index, but the performance of these two indexes was unusually similar, with respective returns of 10.20% and 10.00%.
Non-U.S. Developed Equity Markets
For the fiscal year ended December 31, 2013, the non-U.S. equity market, as measured by the Russell Developed ex-U.S. Large Cap® Index (the “Index”), was up 21.68%. Equity prices increased to new highs during the period, despite the continued tepid global growth environment and elevated price multiples. Political forces were a large driver behind rising markets, as monetary authorities globally attempted to calm market participants and introduce expansionary polices aimed at promoting growth and investment. Most regions and countries generated positive absolute returns, although the more economically-exposed regions and those that lagged the broader market in recent years performed the best.
Non-U.S. equities started the fiscal year off strong, posting a 4.7% gain in the first quarter, as measured by the Index. Results in the quarter were fairly bifurcated across regions, as Japan’s aggressive monetary plans helped push Japanese equities up over 12%, while political stumbles in Europe led European equities to be up only 2.8% as measured by the Russell Developed ex-UK Index. March elections in Italy failed to secure a political majority and left the region uncertain on who would succeed Mario Monti in leading the country. Also complicating issues was Cyprus’s need for a bailout in the quarter. Although Cyprus was not the first country to need rescuing from the Troika (European Union, International Monetary Fund, and European Central Bank), it was the first country to include depositors to share some of the pain. This jolted markets as they feared this “bail-in” approach would set a precedent for other, and much larger, rescue packages.
Second quarter 2013 started off much like the first quarter did; however, comments in May from U.S. Federal Reserve (the “Fed”) officials regarding a potential reduction in the Fed’s monetary stimulus program dampened market optimism towards the end of the quarter. The Index finished the period down 1.52% on what was colloquially described as “taper tantrum”. Commodities and commodity driven economies were the hardest hit during the period, with Australia down 15% and Canada down 7.7% according to the Russell Australian and Canadian Indices, respectively. Japan, Germany, and France posted some of the best relative returns in the quarter, as these countries are less reliant on U.S. monetary policy than others, while sector
Market Summary 7
Russell Investment Funds
Market Summary as of December 31, 2013, continued — (Unaudited)
performance in the quarter was led by consumer discretionary, telecommunications, and utilities.
In the third quarter, the much anticipated taper date came and went without any action from the Fed and optimism was restored to the markets. Markets bounced, as the Index gained 11.5%. Risky assets and lower quality securities were the most heavily rewarded, as banks in Spain, Italy, and France were up over 20% in the quarter, as measured by the Index. Japanese equities’ torrid rise slowed down, as the implementation of a value added tax increase worried investors, although gross domestic product (“GDP”) and the consumer price index (“CPI”) showed signs of elevated readings, which would be a positive for the country.
The final quarter of the fiscal year continued the upward trajectory of the third quarter, as global investors shrugged off both political and economic headwinds and non-U.S. markets finished the period up 5.81% as measured by the Index. The quarter began with a multi-week U.S. government shutdown, which prompted fears of a reduction in U.S. GDP. Despite the political malaise and a brief downturn in the Index, continued signs of moderate economic growth in the global economy were received positively by markets. Continental Europe was a stand-out performer, up 8.5% as measured by the Russell Developed ex-UK Index, while Asia/Pacific ex-Japan continued its relative underperformance, posting a loss of 0.61% as measured by the Russell Asia ex-Japan Index. Japan was also a relative underperformer in the quarter, as markets remain unsure how a 2014 Japanese sales tax increase will affect the massive efforts of Prime Minister Shinzo Abe’s administration to re-inflate the Japanese economy.
Over the entire fiscal year, however, Japanese equities were some of the strongest performing developed market equities in the period, up 55% in local terms and 27.5% in USD, as measured by the Russell Japan Large Cap Index. This sharp increase in equity prices came on the back of Prime Minister Abe’s three arrow approach to re-inflating the Japanese economy. The three arrows consist of monetary and fiscal stimulus, and structural reforms. Markets reacted positively to the first two arrows, making Japanese equities the best performing segment in the first three quarters of the fiscal year, while the uncertainty regarding the successful implementation of the third arrow caused a slight pause in optimism towards the end of summer. European equities also posted strong absolute returns, up 28.2% for the period, as measured by the Russell Developed Europe ex-UK Index. Europe emerged from its longest recession on record as the region posted positive growth in the second quarter of 2013. Signs of economic growth, coupled with massive corporate de-leveraging, helped European equities post some of the strongest returns since the beginning of the global financial crisis. Within the Index, the peripheral European nations were the best performers, as Spain, Italy, and Greece were all up over 20%. Despite improved optimism, not all regions benefited from the rising tide. Those markets exposed to commodity demand lagged most others. Australia returned 3.8% in the period, while Canada was up only 5.4%, as measured by the Russell Australia Large Cap Index and the Russell Canada Large Cap Index, respectively. Softening growth out of emerging markets, coupled with a shift to a consumer-led economy in China, weighed on commodity prices.
Sector performance over the period largely reflected the optimism in the markets and what typifies the early stages of an economic recovery. Consumer discretionary and information technology were some of the top performing sectors, followed closely by health care and industrials. Conversely, the traditional defensive sectors struggled during the fiscal year, with utilities and consumer staples relative underperformers and the health care sector just slightly outperforming the Index. Energy and materials were the two worst performing sectors, as cyclical headwinds and negative sentiment weighed on returns.
8 Market Summary
Russell Investment Funds
Market Summary as of December 31, 2013, continued — (Unaudited)
Emerging Markets
The Russell Emerging Markets® Index Net (the “Index”) was largely flat (up 0.02%) over the fiscal year ended December 31, 2013. It was another relatively volatile period in which macroeconomic, political and policy events frequently provided direction for emerging markets equities. With an economic recovery in some developed markets underway, investors focused on a timeline for the removal of quantitative easing measures, specifically from the U.S. Federal Reserve (the “Fed”), which had been a tailwind for emerging markets in recent years.
Emerging markets experienced a slightly negative first quarter of 2013 in which the Index slipped 0.7%. After a short-lived bounce at the end of 2012, brought about by the U.S.’s avoidance of the fiscal cliff and more encouraging economic data releases in China, markets retreated. A resurgence of Eurozone woes, precipitated by bailout negotiations in Cyprus, dented investor sentiment in March as many expected the outcome to set a precedent for the Eurozone and potentially negatively impact the outlook for global growth. Renewed fears over a hard-landing in China, amid speculation over monetary tightening, increased regulation of wealth management products and efforts to cool the real estate market also served to drag market performance lower.
The second quarter of 2013 was more challenging as speculation regarding the timeline for the end of the “quantitative easing era” hampered emerging markets and resulted in some sizeable net capital outflows. In May, comments from Fed Chairman Bernanke led markets to the conclusion that a wind down of stimulus measures, which had helped to drive net capital inflows to the asset class in recent years, would take place in 2013. This sparked a sell off in a number of emerging markets currencies, in particular those countries with the largest current account deficits and those most closely linked to commodities. The negative sentiment was exacerbated by fears of a credit crunch scenario in China, as the People’s Bank of China tightened credit provisioning. This was in reaction to the central bank’s concerns over lending in the banking and shadow banking segments. The Index dropped 7.4% through the second quarter in U.S. dollar terms.
The latter part of the fiscal year saw an extension of the high volatility in emerging markets equities and local currencies. Comments from Fed Chairman Bernanke that quantitative easing would be scaled back gradually, rather than immediately, spurred a rally in July. However, speculation that such a gradual reduction in stimulus may occur as soon as September reversed these gains. A rise in tensions over potential U.S. military strikes in Syria (which led to a spike in global oil prices) also negatively impacted select emerging markets, such as neighbouring country Turkey and those which are net oil importers such as India. The release of balance of payments data in certain countries, namely Indonesia, also hampered returns as several local currencies depreciated significantly against the U.S. dollar. However, a swift resolution to the threat of U.S. action in Syria and the Fed’s decision not to taper resulted in a strong rally for emerging markets. The political impasse in the U.S., which culminated in a government “shutdown” in October, was also a boon for the asset class as analysts forecast it may have delayed the removal of quantitative easing until 2014. When the news finally arrived in mid-December that the Fed was going to cut its quantitative easing program by $10 billion, emerging markets did not react too sharply and actually rallied into fiscal year-end.
For the one year period ended December 31, 2013, Poland (+8.54%) was one of the best performing markets in emerging Europe as its economy rebounded, boosted by the central bank’s rate cutting cycle, which took interest rates to a record low of 2.5%. Policymakers acted as gross domestic product (“GDP”) growth
Market Summary 9
Russell Investment Funds
Market Summary as of December 31, 2013, continued — (Unaudited)
for the country slowed to just 0.5% year over year in the first quarter of 2013, the lowest rate since 2009. Russia (-0.90%) slightly underperformed while Turkey (-24.87%) was the worst regional market as currency weakness, linked to increasing concerns over the country’s current account deficit, and an intensification of the unrest in neighbouring Syria negatively impacted the local market. In the last quarter of the fiscal year, the Turkish market was hampered by Fed tapering fears and a corruption scandal that engulfed Prime Minister Erdogan’s cabinet. The Czech Republic (-12.86%) lagged as the country’s economy extended the Republic’s longest ever recession. Domestic demand continued to suffer from the government’s austerity measures and the ongoing crisis in the Eurozone hit external demand, as the central bank maintained rates at 0.05%. GDP data showed that the country finally exited recession in the second quarter of 2013, the same time as the Eurozone bloc.
It was a challenging year for emerging Latin American markets as a decline in global commodities prices, notably precious metals gold and silver, and currency weakness hampered a number of regional markets. Peru (-30.45%), the Index’s worst performing market, succumbed to sizeable losses as a result of the economy’s metals and mining bias. Neighbouring country Chile (-20.45%) was another laggard, with a 7.20% decline in copper prices and the outlook for higher global interest rates hampering performance. Brazil (-16.71%) also underperformed as GDP growth in Latin America’s largest economy slowed to just 0.6% quarter over quarter in the first quarter of 2013 and the central bank’s rate cutting cycle was reversed in an effort to offset above target inflation. The central bank also intervened in the currency market as it sought to prop up the real and reduce inflation. In addition the tax on financial operations on foreign investments in fixed income markets (“IOF”) was scrapped in a further attempt to support the currency. Social unrest in June, sparked by a planned increase in bus fares, further increased negative sentiment towards the country. However, a reversal of fare rises and President Rousseff’s spending and reform pledges helped to calm the demonstrations and restore some confidence in financial markets. The central bank’s moderate success in cooling inflation, combined with a strong upside surprise in second quarter GDP growth data helped the local market recoup some losses. In the last couple of months of the fiscal year, Brazilian equities fell again as macro fundamentals remained challenging and numbers showed that GDP growth slowed to 2.2% year over year in the third quarter. The central bank hiked rates twice in the fourth quarter taking the headline rate to 10% as it continued to fight high inflation. Mexico (+1.20%) was the only regional market to finish in positive territory, boosted by the election of Enrique Peña Nieto as president with a reformist agenda.
Asian markets in general performed well, with the larger Index countries of Taiwan (+11.71%), China (+10.81%) and South Korea (+4.10%) all outperforming. Despite some concern over the Chinese market, the underlying macroeconomic data remained relatively firm and GDP growth, whilst slower, remained at relatively high levels when contrasted with other developed and emerging countries and was in line with the government’s target on a year over year basis. The new government has also been proactive in managing the economy and took steps to limit property price rises in some cities. In addition, the government’s investment in industries such as telecommunications services was also a catalyst for positive returns. The market advanced further in the fourth quarter primarily boosted by a raft of reforms announced at the Third Plenary Session of the 18th Congress. South Korea performed well as GDP growth improved during the year. Efforts from policymakers to stimulate the economy appeared to be successful, in particular the central bank’s decision to cut rates to 2.5% and the government’s fiscal and monetary stimulus. Taiwan advanced with the country’s export sector recording strong acceleration in the first half of the year. Smaller Index countries Thailand (-9.45%), the Philippines (-7.09%) and Indonesia (-22.82%) came under pressure in the
10 Market Summary
Russell Investment Funds
Market Summary as of December 31, 2013, continued — (Unaudited)
second half of the year. Thailand was hit by anti-government protests while Indonesia was acutely impacted by concerns over its burgeoning current account deficit which sparked a major sell-off in the equity market and the rupiah. India (-5.14%) also underperformed with the central bank forced to maintain higher interest rates amid high inflation and in the face of sluggish GDP growth. The rupee also came under pressure and hit an all time low against the U.S. dollar during the period, with investors increasingly concerned about the country’s twin deficit (fiscal and current account). In the last quarter of the fiscal year, however, Indian equities rebounded strongly, boosted by a 3.8% drop in the price of oil, which may be perceived as helping to reduce inflation, and a GDP reading which showed the economy had grown 4.8% year over year.
At the sector level, the pro-cyclical sectors of technology (+17.68%) and consumer discretionary (+8.00%) registered some of the strongest returns. The health care sector, which advanced 14.41%, also performed strongly with Chinese bio-tech companies in particular faring well, supported by the government’s announcement that it planned to double the size of the industry as a percentage of GDP by 2015. Materials and processing (-12.64%) was the worst-performing sector, primarily due to a decline in global commodity prices linked to a slower growth outlook in China. Energy (-8.61%), financial services (-1.63%) and the traditionally more defensive utilities (-0.95%) sector also lagged.
U.S./Global Fixed Income Markets
For the fiscal year ended December 31, 2013, fixed income markets continued to be driven by macroeconomic factors and fiscal policy debates in Washington. Speculation surrounding the timing of the Federal Reserve’s (the “Fed”) tapering of its highly accommodative quantitative easing program was a major driver of volatility in the capital markets this year. Notably, U.S. treasury yields increased dramatically starting in the second half of the fiscal year in anticipation of a Fed tapering in September 2013. However, U.S. treasury yields sharply retracted a portion of prior increases after the Fed surprised markets by not beginning tapering in September. Three months later in December, the Fed finally announced the beginning of a modest taper to begin in January 2014, causing the 10-year U.S. treasury yields to end the year at 3.04%. Aside from the U.S. treasury market, currency and credit markets also experienced heightened volatility over Fed tapering speculation throughout the year.
At the beginning of the fiscal year, Congress reassured financial markets following the previous months of uncertainty regarding the government shutdown and debt ceiling debates that began in October 2012 by passing a continuing resolution on January 1st that diverted any material consequences in the short term by raising income, payroll, and capital gains taxes, and delaying spending cuts. Similarly on January 23rd, the “No Budget, No Pay Act” was passed, allowing the Treasury to borrow money until mid-May, defusing the debt ceiling threat for several months. Beginning in February, negative announcements from the U.S. and euro zone regarding slowed economic growth supported demand for safe-haven U.S. treasuries, resulting in a relative underperformance from non-treasury sectors. On February 26th, the Italian election reached a stalemate and the vote in the general election returned a three to two vote against the austerity policy, grinding both spending cuts and tax rises to a halt. Fears that the end of these austerity measures in Italy would lengthen its recession and potentially spill over into the rest of the euro zone quickly spread market volatility to Germany, France, and the U.K. In Cyprus, an agreement with the group of euro zone finance ministers was reached in late March to help restructure its financial sector along with a €10 billion euro bailout package to escape a financial meltdown. The terms of the agreement, however, imposed strict capital controls in order to prevent a run on the banks, losses on bank depositors, and mandatory downsizing of the Cypriot banking sector, costing thousands of jobs. In the U.S., on February 28th, Capitol Hill failed to
Market Summary 11
Russell Investment Funds
Market Summary as of December 31, 2013, continued — (Unaudited)
reach a last-minute compromise before the budget sequestration deadline and the $85 billion across-the-board spending cuts went into effect on March 1st. The combined impact of both the automatic spending cuts and the downbeat European data led to a rally in U.S. treasuries in a flight to quality, with the 10-year U.S. treasury yields falling from 2.04% at the start of February to 1.87% by the end of March. In April, Bank of Japan’s new Governor, Haruhiko Kuroda, announced an open-ended quantitative easing program to inject approximately $1.4 trillion USD into the economy in less than two years to support economic activity by keeping the Japanese yen weak and boosting financial markets. As a result of the announcement, the Japanese yen fell more than 3% against the U.S. dollar and the Japanese 10-year government bond yield hit a record low of 0.44% on October 4th. Monetary policy in the U.S. remained unchanged and the Fed cited that although the housing industry and household spending data showed signs of improvement, the unemployment rate remained elevated and fiscal policy restraints were hindering economic growth. Fed Chairman Ben Bernanke even suggested that the Fed may increase purchase amounts of longer-dated U.S. treasuries and agency mortgage-backed securities within quantitative easing three (“QE3”). As a result of continued Fed easing, U.S. treasury rates fell and the yield curve flattened overall in April. From February to April 2013, the Barclays Investment Grade Corporate Index and the Barclays High Yield Corporate Index were the strongest performers, outperforming similar duration treasuries by 0.42% and 2.18%, respectively. The Barclays Tax-Exempt Municipal Bonds 1-10 Year Blend gained a total return of 0.33%, -0.23%, and 0.89% for February, March and April, respectively.
Markets in May to August 2013 were dominated by announcements from the Fed, driving U.S. treasury yields higher. On May 22nd, Bernanke announced that Fed officials were considering the policy option of tapering the current quantitative easing program, despite his warning that “premature tightening of the monetary policy…carries a substantial risk of slowing or ending the economic recovery and causing inflation to fall further”. The 10-year treasury yield started May at 1.66% and rose to 2.13% by the end of the month. Bernanke further stated on June 19th that the tapering could take place later in 2013, continuing to bolster the rise in yields. The global backdrop remained negative as the European recession reached a new low, notably with the high jobless rate among youth at 24.4% for the month of April. With 19.4 million unemployed across Europe, officials in the European Commission called on European Union member states to focus on boosting competitiveness and bringing down unemployment. They loosened austerity measures on six countries, including France, in order to give them more time to meet budget deficit targets. These concerns, amidst mixed U.S. economic indicators, caused credit sectors within the Barclays U.S. Aggregate Index to post negative to modest excess returns over equivalent duration U.S. treasuries in May. Agency MBS performance was bifurcated depending on the coupon of the security. Higher coupon (4% coupon and higher) mortgages outperformed similar duration treasuries, while lower coupon (below 4% coupon) mortgages, most heavily supported by Fed quantitative easing purchases, underperformed. High yield corporate bonds, as represented by the Barclays High Yield Corporate Index, returned 0.60% excess of similar duration treasuries in May. Municipal bonds took a hit after Detroit filed for bankruptcy on July 18th, reversing some of the inflows municipal bonds had been seeing over the previous few months. July and August continued to be dominated by the Fed, despite no new release of information regarding a taper schedule other than re-emphasizing that it would depend on the economic indicators given earlier of 2.5% inflation and 6.5% unemployment. Again, higher coupon agency MBS was one of the largest outperformers of similar duration U.S. treasuries for the month of August. The 10-year U.S. treasury yield gained over 1% from May to August, having ended August at 2.78% compared to the beginning of May at 1.66%.
12 Market Summary
Russell Investment Funds
Market Summary as of December 31, 2013, continued — (Unaudited)
A turning point in U.S. treasury yields occurred on September 18th when the Fed announced that it would not be tapering but maintaining its pace of $85 billion in monthly bond purchases. The yield on the 10-year U.S. treasury plunged 17 basis points that day following the Fed decision, partially reversing the uptrend in rates over the past four months that persisted in anticipation of a taper. The Fed’s taper decision was generally supportive of the fixed income market as a decrease in treasury yields and tightening of credit spreads support positive nominal returns. Despite a volatile year, investor demand for credit appeared to be robust as evidenced by oversubscription of Verizon’s $49 billion bond offering in September, the largest corporate bond sale to date. Heading into October, focus shifted from the Fed to Congress as they failed to enact a continuing resolution to appropriate funds for the fiscal year 2014 on October 1st. The government entered a shutdown, indefinitely furloughing approximately 800,000 federal employees. Markets reacted minimally to the government shutdown as the cause for real concern was the debt ceiling deadline on October 17th, which if not raised, would not allow the Treasury to issue any new debt. Although the Treasury would not effectively default on its debt on the 17th, the Treasury would likely default on its debt in late October to early November when the revenue inflows would be insufficient to cover the expenditures. Consequently, 1-month treasury bill yields spiked from a yield of 0.02% as of September month end to almost 0.35% on October 15th as investors demanded higher yields to compensate for default risk. The impact of default on financial markets would likely have been catastrophic, as treasuries have historically been considered by investors as risk-free. As the debt ceiling deadline approached, rates rose modestly on uncertainty over whether or not a deal would be struck in time before the 17th. The 10-year treasury yields rose to 2.75% on the 15th, just before falling back down to 2.69% on the 16th and 2.61% on the 17th as it became clear that Congress would pass a last-minute deal. On the 17th, Congress passed the Continuing Appropriations Act of 2014 ending the government shutdown and suspending the debt limit until February 7, 2014. On October 22nd, September nonfarm payroll data was released showing that the economy only added 148,000 nonfarm jobs, compared to expectations of 180,000. On news of the weak employment data, markets responded positively on expectations that the Fed will be less likely to taper when labor markets remained weak. The 10-year U.S. treasury yield fell 9 basis points to 2.51%, the lowest since July 2013, while the European periphery bond yields, notably Spain’s and Italy’s, fell to new lows as well, boosting demand for higher-yielding assets. The culmination of the various developments over September and October was highly supportive of risk assets. The Barclays Investment Grade Corporate Index, Barclays High Yield Corporate Index, and Barclays Emerging Market Debt Index outperformed similar duration U.S. treasuries in October by 0.83%, 2.07%, and 1.52%, respectively.
November saw the release of strong positive U.S. economic data, raising anticipation that the Fed would begin to taper the asset purchase program sooner than expected. U.S. employers added 203,000 jobs to nonfarm payrolls in November, compared to the predicted 185,000 increase, while the unemployment rate dropped to 7%, a five-year low. Consumer spending also improved as retail sales climbed the most in five months with a 0.7% gain in November, following a 0.6% gain in October. Additionally the U.S. GDP for the third quarter increased 3.6% at an annualized rate, compared to estimations of 2.8%, the strongest since the first quarter of 2012. Housing prices also rose with a 13.3% year-over-year growth for September, the biggest gain since February 2006 according to the Case-Shiller index. Following the economic data indicating stronger financial stability, the 10-year treasury yield gained 24 basis points from the beginning of November to the December Fed meeting on the 18th in anticipation of a coming taper. Treasury markets were correct in their speculation as the Fed officially announced on December 18th that it would be trimming its monthly bond purchases by $10 billion to $75 billion beginning in January 2014. Bernanke cited the improved
Market Summary 13
Russell Investment Funds
Market Summary as of December 31, 2013, continued — (Unaudited)
outlook in the job market as a deciding factor in the modest reduction of its bond buying program. With the Fed’s strong commitment to maintain an accommodative policy and keep the federal funds rate low “well past the time that the unemployment rate declines below 6.5%, especially if projected inflation continues to run below” the Fed’s 2% target, stocks rallied, while 10-year treasuries pared losses with yields rising six basis points to 2.89% after climbing as much as nine basis points. Continuing through the rest of December following the Federal Open Market Committee meeting, the 10-year treasury yield climbed 13 basis points to 3.02%, its highest level in more than two years in anticipation of fewer bond purchases in the coming months. The strongest performers for the month of December were riskier assets, such as investment grade, high yield, and emerging markets debt. The Barclays Investment Grade Index, Barclays High Yield Corporate Index, and the Barclays Emerging Market Debt Index outperformed U.S. treasuries of similar duration by 0.92%, 1.28%, and 1.63%, respectively. U.S. 2-year interest rate swap spreads, a measure of debt market stress, narrowed to a 20-year low of 0.085% on November 26th indicating that investors were favoring riskier assets over government securities. The Barclays Tax-Exempt Municipal Bonds 1-10 Year Blend returned a total return of -0.18% in the month of December following the largest wave of withdrawals from municipal bond mutual funds since August and as yields on city and state debt hit a three-month high mid-December. Growing concerns over higher interest rates in 2014, coupled with the largest number of municipal bond issuances since 2010, helped drive yields higher.
14 Market Summary
(This page intentionally left blank)
Russell Investment Funds Moderate Strategy Fund
Portfolio Management Discussion and Analysis — December 31, 2013 (Unaudited)
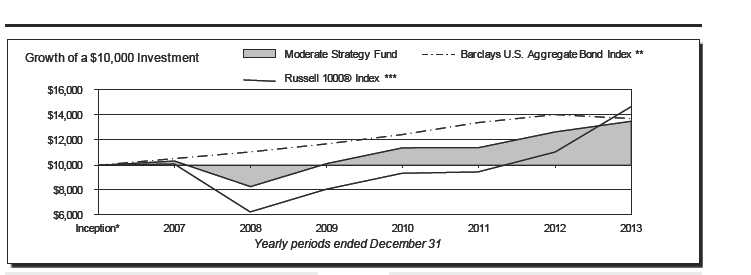
| Moderate Strategy Fund | | | Russell 1000 ® Index *** | |
| | Total | | | Total |
| | Return | | | Return |
| 1 Year | 6 . 79% | | 1 Year | 33 . 11% |
| 5 Years | 10 . 37%§ | | 5 Year | 18 . 59%§ |
| Inception* | 4 . 68%§ | | Inception* | 5 . 92%§ |
| |
| |
| Barclays U. S. Aggregate Bond Index ** | | | | |
| | Total | | | |
| | Return | | | |
| 1 Year | -2 . 02% | | | |
| 5 Year | 4 . 44%§ | | | |
| Inception* | 4 . 84%§ | | | |
16 Moderate Strategy Fund
Russell Investment Funds
Moderate Strategy Fund
Portfolio Management Discussion and Analysis, continued — December 31, 2013 (Unaudited)
| The Moderate Strategy Fund (the “Fund”) is a fund of funds that | | U. S. Aggregate Bond Index. U. S. equity markets benefited from |
| invests in other Russell Investment Funds and Russell Investment | | an improving macroeconomic outlook and positive political |
| Company mutual funds (the “Underlying Funds”) . The Underlying | | developments through the year. The U. S. federal government’s |
| Funds employ a multi-manager approach whereby portions of the | | avoidance of a “fiscal cliff” in January helped catalyze a strong |
| Underlying Funds are allocated to different money managers. | | start for U. S. equities in 2013. In non-U. S. markets, expansionary |
| Underlying Fund assets not allocated to money managers | | policies in Japan and positive economic news in Europe were |
| are managed by Russell Investment Management Company | | beneficial. |
| (“RIMCo”), the Fund’s and Underlying Funds’ advisor. RIMCo, as | | Alternative asset classes also fared well over the year, as the S&P |
| the Underlying Funds’ advisor, may change the allocation of the | | Global Infrastructure Index posted a 14.00% gain while global |
| Underlying Funds’ assets among money managers at any time. An | | real estate securities finished up 3.67% as measured by the FTSE |
| exemptive order from the Securities and Exchange Commission | | EPRA/NAREIT Developed Index. However, infrastructure and |
| (“SEC”) permits RIMCo to engage or terminate a money manager | | global real estate generally lagged equities, as these interest |
| in an Underlying Fund at any time, subject to approval by the | | rate sensitive asset classes were negatively impacted by the U. S. |
| Underlying Fund’s Board, without a shareholder vote. Pursuant to | | Federal Reserve’s (“Fed”) indication of potential tapering of its |
| the terms of the exemptive order, an Underlying Fund is required | | stimulus program earlier than markets had anticipated. Despite |
| to notify its shareholders within 90 days of when a money manager | | lagging broad equities for the year, infrastructure and real estate |
| begins providing services. | | outperformed bonds for the year, benefiting the Fund due to its |
| What is the Fund’s investment objective? | | exposure to these two asset classes. Commodity markets, however, |
| The Fund seeks to provide high current income and moderate | | didn’t fare as well, as the Dow Jones UBS Commodity Index lost |
| long term capital appreciation. | | 9.52% for the year, hurt by softening demand in emerging markets |
| | | such as China. The broad underperformance of commodities to |
| How did the Fund perform relative to its benchmark for the | | bonds detracted from the Fund’s benchmark relative performance. |
| fiscal year ended December 31, 2013? | | Alternative strategies contributed positively, as the Russell Multi- |
| For the fiscal year ended December 31, 2013, the Moderate | | Strategy Alternative Fund posted returns above the Fund’s fixed |
| Strategy Fund gained 6.79%. This is compared to the Fund’s | | income benchmark. |
| primary benchmark, the Barclays U. S. Aggregate Bond | | Fixed income markets ended the year down, largely impacted by |
| Index, which lost 2.02% during the same period. The Fund’s | | a volatile interest rate environment. Interest rates sharply rose in |
| performance includes operating expenses, whereas index returns | | the first half of the year off concerns of Fed tapering in the near |
| are unmanaged and do not include expenses of any kind. | | term, only to fall later in the year after a surprise announcement |
| For the fiscal year ended December 31, 2013, the Lipper® Mixed | | by the Fed that tapering would not occur in September as many |
| Asset Target Allocation Moderate Funds Average (VIP), a group | | expected. Overall, exposure to other asset classes in addition |
| of funds that Lipper considers to have investment strategies | | to fixed income benefited the Fund’s benchmark relative |
| similar to those of the Fund, gained 14.12%. This result serves | | performance. |
| as a peer comparison and is expressed net of operating expenses. | | |
| | | How did the investment strategies and techniques employed |
| The Fund’s outperformance relative to the Barclays U. S. Aggregate | | by the Fund and the Underlying Funds affect the Fund’s |
| Bond Index was primarily due to the Fund’s out-of-benchmark | | performance? |
| allocation to equities, listed infrastructure and global real estate | | The Fund is a fund of funds and its performance is based on |
| securities, which outperformed fixed income securities over the | | RIMCo’s strategic assetallocations and the performance of the |
| period. | | Underlying Funds in which the Fund invests. |
| How did the market conditions described in the Market | | The Fund’s strategic allocation to U. S. equity Underlying Funds |
| Summary report affect the Fund’s performance? | | was beneficial to benchmark relative performance, though |
| Global equity markets ended the fiscal year on a strong note, led | | underlying active management effects were mixed. The Aggressive |
| by the U. S. where markets gained 33.55% for the year as measured | | Equity Fund outperformed its benchmark for the period, while |
| by the Russell 3000 ® Index. Non-U. S. markets also finished up, | | the Multi-Style Equity Fund underperformed. For the Aggressive |
| posting returns of 21.68% as measured by the Russell Developed | | Equity Fund, underweight exposure to high yielding sectors |
| ex-U. S. Large Cap Index. The Fund’s exposure to broad equities | | such as REITs and utilities and overweight exposure to cyclicals |
| was a large driver to positive benchmark relative returns, | | contributed to positive performance. For the Multi-Style Equity |
| as bonds fell 2.02% for the year as measured by the Barclays | | |
Moderate Strategy Fund 17
Russell Investment Funds
Moderate Strategy Fund
Portfolio Management Discussion and Analysis, continued — December 31, 2013 (Unaudited)
| Fund, stock selection within the health care sector detracted from | | the target strategic allocation given mitigation of large tail risk by |
| the Fund’s performance. | | positive European Central Bank and Fed policy announcements, |
| Strategic exposure to non-U. S. Underlying Funds also contributed | | but continued economic concerns over Europe. |
| positively to the Fund’s benchmark relative performance, as non- | | On February 1, 2013, the Fund tilted 1.00% away from the |
| U. S. equities outperformed bonds for the year. Underlying active | | Russell Investment Grade Bond Fund and 0.50% towards the |
| management was mixed, as the Russell Global Equity Fund | | Russell Emerging Markets Fund to express a positive equity |
| and Non-U. S. Fund outperformed their benchmarks, while the | | outlook relative to fixed income for the 2013 calendar year. |
| Russell Emerging Markets Fund underperformed its benchmark. | | On June 18, 2013, the Fund tilted 0.75% away from the Russell |
| For the Non-U. S. Fund, exposure to companies with higher than | | Commodity Strategies Fund and 0.75% towards the Russell |
| forecasted growth and overweight exposure to momentum was | | Global Infrastructure Fund to express a negative near to medium |
| beneficial to performance. An underweight position in materials | | term outlook for commodities and the desire to increase the Fund’s |
| stocks also contributed. For the Russell Emerging Markets Fund, | | equity beta exposure (beta is a measure of a portfolio’s volatility |
| an underweight to Malaysia and Taiwan and an overweight to | | and its sensitivity to the direction of the market) . |
| Turkey detracted. | | |
| | | On July 5, 2013, the Fund partially removed its 1.75% |
| The Fund’s strategic allocation to fixed income Underlying Funds | | underweight to the Non-U. S. Fund by 0.75% and moved 0.75% |
| had a positive impact on benchmark relative performance, while | | underweight to the Russell Investment Grade Bond Fund, as the |
| underlying active management was mixed. The Core Bond Fund | | portfolio manager continued to expect a positive equity market |
| outperformed its benchmark for the period, while the Russell | | and a muted outlook on fixed income for the second half of 2013. |
| Global Opportunistic Credit Fund underperformed. For the Core | | |
| Bond Fund, exposure to non-agency mortgage-backed securities, | | On October 7, 2013, the Fund tilted 0.75% away from the Global |
| duration positioning as well as exposure to non-U. S. interest rates | | Real Estate Securities Fund and 1.00% away from the Multi-Style |
| contributed to performance. For the Russell Global Opportunistic | | Equity Fund, while increasing the Non-U. S. Fund by 1.00% and |
| Credit Fund, hard currency sovereign debt selection within | | the Russell Investment Grade Bond Fund by 0.75%. These tilts |
| emerging markets detracted from performance, as well as well | | were implemented to remove the negative outlook on the non- |
| as bank loan exposures, as spreads on high yield bonds rallied, | | U. S. developed equity markets and to move the Fund to a neutral |
| particularly near the end of the year. | | equity and fixed income weight. The underweight to the Global |
| | | Real Estate Securities Fund was taken to mitigate the Fund’s |
| The Fund’s strategic allocation to alternative Underlying Funds | | exposure to this interest rate sensitive asset class, given potential |
| had mixed effects on performance. Infrastructure, real estate, | | for rising interest rates in the near term. |
| and alternative strategies outperformed fixed income, while | | |
| commodities underperformed. Underlying active management | | On October 9, 2013, the Fund tilted 1.00% away from the |
| was generally positive, with the exception of the Global Real | | Aggressive Equity Fund and 1.00% towards the Russell |
| Estate Securities Fund. For the Global Real Estate Securities | | Investment Grade Bond Fund, bringing these allocations back |
| Fund, an underweight position taken in Japan detracted, as Japan | | to policy weight. This tilt was driven by a more cautious outlook |
| was among the stronger performing markets. Other detractors | | on equity markets for the remainder of the fiscal year, particularly |
| included an out of benchmark exposure to Brazil and stock | | small cap equities, which performed strongly over the fiscal year. |
| selection in Hong Kong. | | The views expressed in this report reflect those of the |
| Describe any changes to the Fund’s structure or allocation | | portfolio managers only through the end of the period |
| to the Underlying Funds. | | covered by the report. These views do not necessarily |
| RIMCo has the discretion to modify the target strategic asset | | represent the views of RIMCo, or any other person in RIMCo |
| allocation of the Fund by up to +/- 3% at the equities, fixed income | | or any other affiliated organization. These views are |
| or alternative category level based on RIMCo’s assessment of | | subject to change at any time based upon market conditions |
| relative market valuation of the asset classes represented by each | | or other events, and RIMCo disclaims any responsibility to |
| Underlying Fund. Performance of the Fund’s short-term asset | | update the views contained herein. These views should not |
| allocation modifications ended the fiscal year positively. | | be relied on as investment advice and, because investment |
| | | decisions for a Russell Investment Funds (“RIF”) Fund are |
| Entering the fiscal year, the Fund maintained its underweight to | | based on numerous factors, should not be relied on as an |
| the Non-U. S. Fund at 1.75% below the target strategic allocation | | indication of investment decisions of any RIF Fund. |
| and its overweight to the Multi-Style Equity Fund at 1.75% above | | |
18 Moderate Strategy Fund
Russell Investment Funds
Moderate Strategy Fund
Portfolio Management Discussion and Analysis, continued — December 31, 2013 (Unaudited)
| * | Assumes initial investment on April 30, 2007. |
| ** | The Barclays U. S. Aggregate Bond Index is an index, with income reinvested, generally representative of intermediate-term government bonds, investment- grade corporate debt securities and mortgage-backed securities. |
| *** | The Russell 1000® Index includes the 1,000 largest companies in the Russell 3000® Index. The Russell 1000® Index represents the universe of stocks from which most active money managers typically select. The Russell 1000® Index return reflects adjustments from income dividends and capital gain distributions reinvested as of the ex-dividend dates. |
| § | Annualized. |
The performance shown in this section does not reflect any Insurance Company Separate Account or Policy Charges. Performance is historical and assumes reinvestment of all dividends and capital gains. Investment return and principal value will fluctuate so that an investor’s shares, when redeemed, may be worth more or less than when purchased. Past performance is not indicative of future results.
Moderate Strategy Fund 19
Russell Investment Funds
Moderate Strategy Fund
Shareholder Expense Example — December 31, 2013 (Unaudited)
| Fund Expenses | | Please note that the expenses shown in the table are meant |
| The following disclosure provides important information | | to highlight your ongoing costs only and do not reflect any |
| regarding the Fund’s Shareholder Expense Example | | transactional costs. Therefore, the information under the heading |
| (“Example”) . | | “Hypothetical Performance (5% return before expenses)” is |
| | | useful in comparing ongoing costs only, and will not help you |
| Example | | determine the relative total costs of owning different funds. In |
| As a shareholder of the Fund, you incur two types of costs: (1) | | addition, if these transactional costs were included, your costs |
| transaction costs, and (2) ongoing costs, including advisory and | | would have been higher. The fees and expenses shown in this |
| administrative fees and other Fund expenses. The Example is | | section do not reflect any Insurance Company Separate Account |
| intended to help you understand your ongoing costs (in dollars) | | or Policy Charges. | | | | | | | | | | | | |
| of investing in the Fund and to compare these costs with the | | | | | | | | | | | | Hypothetical |
| ongoing costs of investing in other mutual funds. The Example | | | | | | | | Actual | | | | Performance (5% |
| is based on an investment of $1,000 invested at the beginning of | | | | | | | | Performance | | | | return before |
| the period and held for the entire period indicated, which for this | | | | | | | | | | | | |
| Fund is from July 1, 2013 to December 31, 2013. | | Beginning Account Value | | | | | | | | | | | | |
| | July 1, 2013 | | | | $ | | 1,000.00 | | | | $ | | 1,000.00 |
| Actual Expenses | | Ending Account Value | | | | | | | | | | | | |
| | | December 31, 2013 | | | | $ | | 1,059.40 | | | | $ | | 1,024.70 |
| The information in the table under the heading “Actual | | Expenses Paid During Period* | | | | $ | | 0.52 | | | | $ | | 0.51 |
| Performance” provides information about actual account values | | | | | | | | | | | | | | |
| and actual expenses. You may use the information in this column, | | * Expenses are equal to the Fund's annualized expense ratio of 0.10% |
| | | (representing the six month period annualized), multiplied by the average |
| together with the amount you invested, to estimate the expenses | | account value over the period, multiplied by 184/365 (to reflect the one-half year |
| that you paid over the period. Simply divide your account value by | | period) . May reflect amounts waived, reimbursed and/or other credits. Without |
| $1,000 (for example, an $8,600 account value divided by $1,000 | | any waivers, reimbursements and/or other credits, expenses would have been |
| = 8.6), then multiply the result by the number in the first column | | higher. | | | | | | | | | | | | |
| in the row entitled “Expenses Paid During Period” to estimate | | | | | | | | | | | | | | |
| the expenses you paid on your account during this period. | | | | | | | | | | | | | | |
| |
| Hypothetical Example for Comparison Purposes | | | | | | | | | | | | | | |
| The information in the table under the heading “Hypothetical | | | | | | | | | | | | | | |
| Performance (5% return before expenses)” provides information | | | | | | | | | | | | | | |
| about hypothetical account values and hypothetical expenses | | | | | | | | | | | | | | |
| based on the Fund’s actual expense ratio and an assumed rate of | | | | | | | | | | | | | | |
| return of 5% per year before expenses, which is not the Fund’s | | | | | | | | | | | | | | |
| actual return. The hypothetical account values and expenses | | | | | | | | | | | | | | |
| may not be used to estimate the actual ending account balance or | | | | | | | | | | | | | | |
| expenses you paid for the period. You may use this information | | | | | | | | | | | | | | |
| to compare the ongoing costs of investing in the Fund and other | | | | | | | | | | | | | | |
| funds. To do so, compare this 5% hypothetical example with the | | | | | | | | | | | | | | |
| 5% hypothetical examples that appear in the shareholder reports | | | | | | | | | | | | | | |
| of other funds. | | | | | | | | | | | | | | |
20 Moderate Strategy Fund
Russell Investment Fund
Moderate Strategy Fund
Schedule of Investments — December 31, 2013
| Amounts in thousands (except share amounts) | | | Amounts in thousands (except share amounts) | | |
| |
| | | Fair | | | | | | Fair |
| | | Value | | | | | | Value |
| | | $ | | | | Shares | | $ |
| |
| Investments 100.0% | | | | Fixed Income - 57.6% | | | | |
| Russell Investment Company | | | | RIC Russell Global Opportunistic Credit | | | | |
| ("RIC") and other Russell | | | | Fund Class Y | | 206,619 | | 2,050 |
| Investment Funds ("RIF") Series | | | | RIC Russell Investment Grade Bond Fund | | | | |
| Mutual Funds | | | | Class Y | | 946,599 | | 20,484 |
| | | | | RIF Core Bond Fund | | 3,524,195 | | 36,898 |
| Alternative Funds - 11.3% | | | | | | | | 59,432 |
| RIC Russell Commodity Strategies Fund | | | | | | | | |
| Class Y | | 2,300 | | International Equities - 19.2% | | | | |
| RIC Russell Global Infrastructure Fund | | | | RIC Russell Emerging Markets Fund | | | | |
| Class Y | | 3,902 | | Class Y | | 201,404 | | 3,625 |
| RIC Russell Multi-Strategy Alternative | | | | RIC Russell Global Equity Fund Class Y | | 684,528 | | 7,824 |
| Fund Class Y | | 3,102 | | RIF Non-U. S. Fund | | 679,346 | | 8,370 |
| RIF Global Real Estate Securities Fund | | 2,329 | | | | | | 19,819 |
| | | 11,633 | | | | | | |
| |
| Domestic Equities - 11.9% | | | | Total Investments 100.0% | | | | |
| RIC Russell U. S. Defensive Equity Fund | | | | (identified cost $91,885) | | | | 103,115 |
| Class Y | | 4,159 | | | | | | |
| RIC Russell U. S. Dynamic Equity Fund | | | | Other Assets and Liabilities, | | | | |
| Class Y | | 2,085 | | Net - (0.0%) | | | | (22 |
| RIF Aggressive Equity Fund | | 1,041 | | | | | | |
| RIF Multi-Style Equity Fund | | 4,946 | | Net Assets - 100.0% | | | | 103,093 |
| | | 12,231 | | | | | | |
| |
| |
| |
| Presentation of Portfolio Holdings | | | | | | |
| |
| |
| | | % of Net | | | | | | |
| Categories | | Assets | | | | | | |
| Alternative Funds | | 11 . 3 | | | | | | |
| Domestic Equities | | 11 . 9 | | | | | | |
| Fixed Income | | 57 . 6 | | | | | | |
| International Equities | | 19 . 2 | | | | | | |
| Total Investments | | 100 . 0 | | | | | | |
| Other Assets and Liabilities, Net | | (—*) | | | | | | |
| | | 100 . 0 | | | | | | |
| |
| * Less than . 05% of net assets. | | | | | | | | |
See accompanying notes which are an integral part of the financial statements.
Moderate Strategy Fund 21
Russell Investment Funds
Moderate Strategy Fund
Statement of Assets and Liabilities — December 31, 2013
| Amounts in thousands | | |
| Assets | | |
| Investments, at identified cost | $ | 91,885 |
| Investments, at fair value | | 103,115 |
| Receivables: | | |
| Fund shares sold | | 64 |
| From affiliates | | 7 |
| Total assets | | 103,186 |
| Liabilities | | |
| Payables: | | |
| Investments purchased | | 64 |
| Accrued fees to affiliates | | 5 |
| Other accrued expenses | | 24 |
| Total liabilities | | 93 |
| Net Assets | $ | 103,093 |
| Net Assets Consist of: | | |
| Undistributed (overdistributed) net investment income | $ | 73 |
| Accumulated net realized gain (loss) | | (2,355) |
| Unrealized appreciation (depreciation) on investments | | 11,230 |
| Shares of beneficial interest | | 99 |
| Additional paid-in capital | | 94,046 |
| Net Assets | $ | 103,093 |
| Net Asset Value, offering and redemption price per share: | | |
| Net asset value per share: (#) | $ | 10 . 41 |
| Net assets | $ | 103,093,136 |
| Shares outstanding ($. 01 par value) | | 9,905,376 |
| (#) Net asset value per share equals net assets divided by shares of beneficial interest outstanding. | | |
See accompanying notes which are an integral part of the financial statements.
22 Moderate Strategy Fund
Russell Investment Funds
Moderate Strategy Fund
Statement of Operations — For the Period Ended December 31, 2013
| Amounts in thousands | | | |
| Investment Income | | | |
| Income distributions from Underlying Funds | | $ | 1,791 |
| |
| Expenses | | | |
| Advisory fees | | | 200 |
| Administrative fees | | | 50 |
| Custodian fees | | | 20 |
| Transfer agent fees | | | 4 |
| Professional fees | | | 42 |
| Trustees’ fees | | | 3 |
| Printing fees | | | 24 |
| Miscellaneous | | | 7 |
| Expenses before reductions | | | 350 |
| Expense reductions | | | (250) |
| Net expenses | | | 100 |
| Net investment income (loss) | | | 1,691 |
| |
| Net Realized and Unrealized Gain (Loss) | | | |
| Net realized gain (loss) on: | | | |
| Investments | | | 1,320 |
| Capital gain distributions from Underlying Funds | | | 889 |
| Net realized gain (loss) | | | 2,209 |
| Net change in unrealized appreciation (depreciation) on investments | | | 2,584 |
| Net realized and unrealized gain (loss) | | | 4,793 |
| Net Increase (Decrease) in Net Assets from Operations | | $ | 6,484 |
See accompanying notes which are an integral part of the financial statements.
Moderate Strategy Fund 23
Russell Investment Funds
Moderate Strategy Fund
Statements of Changes in Net Assets
| | | | | | | | | For the Periods Ended December 31, |
| Amounts in thousands | | | | | | | | 2013 | | 2012 |
| Increase (Decrease) in Net Assets | | | | | | | | | | | | | |
| Operations | | | | | | | | | | | | | |
| Net investment income (loss) | | | | | | | | $ | 1,691 | | $ | | 2,590 |
| Net realized gain (loss) | | | | | | | | | 2,209 | | | | 558 |
| Net change in unrealized appreciation (depreciation) | | | | | | | | | 2,584 | | | | 5,568 |
| Net increase (decrease) in net assets from operations | | | | | | | | | 6,484 | | | | 8,716 |
| |
| Distributions | | | | | | | | | | | | | |
| From net investment income | | | | | | | | | (1,705) | | | | (2,603) |
| From net realized gain | | | | | | | | | (1,854) | | | | (420) |
| Net decrease in net assets from distributions | | | | | | | | | (3,559) | | | | (3,023) |
| |
| Share Transactions* | | | | | | | | | | | | | |
| Net increase (decrease) in net assets from share transactions | | | | | | | | | 5,947 | | | | 13,472 |
| Total Net Increase (Decrease) in Net Assets | | | | | | | | | 8,872 | | | | 19,165 |
| |
| Net Assets | | | | | | | | | | | | | |
| Beginning of period | | | | | | | | | 94,221 | | | | 75,056 |
| End of period | | | | | | | | $ | 103,093 | | $ | | 94,221 |
| Undistributed (overdistributed) net investment income included in net assets | | | | | | $ | 73 | | $ | | 87 |
| |
| |
| |
| * Share transaction amounts (in thousands) for the periods ended December 31, 2013 and December 31, 2012 were as follows: | | | | |
| | | | | 2013 | | | | | 2012 | | |
| | | | | Shares | | | | Dollars | Shares | | Dollars |
| |
| Proceeds from shares sold | | | | 1,656 | | $ | | 17,055 | 1,944 | | 19,209 |
| Proceeds from reinvestment of distributions | | | | 346 | | | | 3,559 | 304 | | 3,023 |
| Payments for shares redeemed | | | | (1,428) | | | | (14,667) | (890) | | (8,760) |
| Total increase (decrease) | | | | 574 | | $ | | 5,947 | 1,358 | | 13,472 |
| | | | | | | | | | | | | | |
See accompanying notes which are an integral part of the financial statements.
24 Moderate Strategy Fund
(This page intentionally left blank)
Russell Investment Funds
Moderate Strategy Fund
Financial Highlights — For the Periods Ended
For a Share Outstanding Throughout Each Period.
| | | | | | | $ | | | | | | | | | | | | | | | | | | | |
| | | $ | | | | Net | | | | | | $ | | | | $ | | | | $ | | | $ |
| | Net Asset Value, | | | | Investment | | | | Net Realized | | | | Total from | | | | Distributions | | | Distributions |
| | | Beginning of | | | | Income | | | | and Unrealized | | | | Investment | | | | from Net | | | from Net |
| | | Period | | (Loss) (a)(b)(d) | | | | Gain (Loss) | | | | Operations | | Investment Income | | | Realized Gain |
| December 31, 2013 | | 10 . 10 | | | | | | . 18 | | | | | | . 50 | | | | | | . 68 | | | | ( . 18) | | | ( . 19) |
| December 31, 2012 | | 9 . 41 | | | | | | . 30 | | | | | | . 73 | | | | | | 1 . 03 | | | | ( . 29) | | | ( . 05) |
| December 31, 2011 | | 9 . 64 | | | | | | . 27 | | | | | | ( . 26) | | | | | | . 01 | | | | ( . 24) | | | — |
| December 31, 2010 | | 8 . 95 | | | | | | . 42 | | | | | | . 69 | | | | | | 1 . 11 | | | | ( . 41) | | | — |
| December 31, 2009 | | 7 . 67 | | | | | | . 36 | | | | | | 1 . 34 | | | | | | 1 . 70 | | | | ( . 37) | | | ( . 05) |
See accompanying notes which are an integral part of the financial statements.
26 Moderate Strategy Fund
| | | | | | | | | | | | | | | % | | % | | % | | |
| | | | | | | $ | | | | $ | Ratio of Expenses | | Ratio of Expenses | | Ratio of Net | | |
| | | $ | | $ | | Net Asset Value, | | % | | Net Assets, | | to Average | | | | to Average | | Investment Income | | % |
| | | Return of | | Total | | End of | Total | | End of Period | | Net Assets, | | | | Net Assets, | | to Average | | Portfolio |
| | | Capital | | Distributions | | Period | Return(e) | | (000) | | Gross(c) | | | | Net(c)(d) | | Net Assets(b)(d) | | Turnover Rate |
| | | — | | ( . 37) | | | | 10 . 41 | | 6 . 79 | | 103,093 | | . 35 | | | | | | . 10 | | | | 1 . 69 | | 18 |
| | | — | | ( . 34) | | | | 10 . 10 | | 11 . 07 | | 94,221 | | . 36 | | | | | | . 10 | | | | 3 . 01 | | 20 |
| | | — | | ( . 24) | | | | 9 . 41 | | . 12 | | 75,056 | | . 38 | | | | | | . 10 | | | | 2 . 80 | | 10 |
| | | ( . 01) | | ( . 42) | | | | 9 . 64 | | 12 . 62 | | 54,573 | | . 44 | | | | | | . 10 | | | | 4 . 56 | | 45 |
| | | — | | ( . 42) | | | | 8 . 95 | | 23 . 09 | | 35,671 | | . 48 | | | | | | . 10 | | | | 4 . 40 | | 21 |
See accompanying notes which are an integral part of the financial statements.
Moderate Strategy Fund 27
Russell Investment Funds
Balanced Strategy Fund
Portfolio Management Discussion and Analysis — December 31, 2013 (Unaudited)
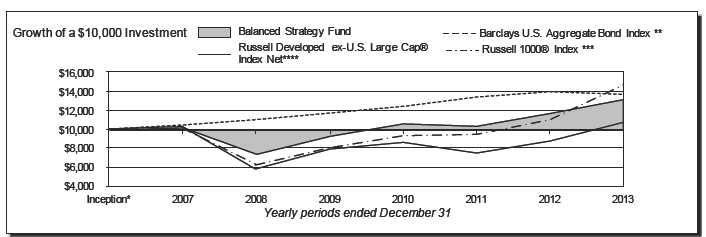
| Balanced Strategy Fund | | | Russell 1000 ® Index *** | |
| | Total | | | Total |
| | Return | | | Return |
| 1 Year | 12 . 43% | | 1 Year | 33 . 11% |
| 5 Years | 12 . 15%§ | | 5 Years | 18 . 59%§ |
| Inception* | 4 . 31%§ | | Inception* | 5 . 92%§ |
| |
| |
| Barclays U. S. Aggregate Bond Index ** | | | Russell Developed ex-U. S. Large Cap® Index Net **** |
| | Total | | | Total |
| | Return | | | Return |
| 1 Year | -2 . 02% | | 1 Year | 21 . 68% |
| 5 Years | 4 . 44%§ | | 5 Years | 13 . 10%§ |
| Inception* | 4 . 84%§ | | Inception* | 1 . 04%§ |
28 Balanced Strategy Fund
Russell Investment Funds
Balanced Strategy Fund
Portfolio Management Discussion and Analysis, continued — December 31, 2013 (Unaudited)
| The Balanced Strategy Fund (the “Fund”) is a fund of funds that | | U. S. Aggregate Bond Index. U. S. equity markets benefited from |
| invests in other Russell Investment Funds and Russell Investment | | an improving macroeconomic outlook and positive political |
| Company mutual funds (the “Underlying Funds”) . The Underlying | | developments through the year. The U. S. federal government’s |
| Funds employ a multi-manager approach whereby portions of the | | avoidance of a “fiscal cliff” in January helped catalyze a strong |
| Underlying Funds are allocated to different money managers. | | start for U. S. equities in 2013. In non-U. S. markets, expansionary |
| Underlying Fund assets not allocated to money managers | | policies in Japan and positive economic news in Europe were |
| are managed by Russell Investment Management Company | | beneficial. |
| (“RIMCo”), the Fund’s and Underlying Funds’ advisor. RIMCo, as | | Alternative asset classes also fared well over the year, as the S&P |
| the Underlying Funds’ advisor, may change the allocation of the | | Global Infrastructure Index posted a 14.00% gain while global |
| Underlying Funds’ assets among money managers at any time. An | | real estate securities finished up 3.67% as measured by the FTSE |
| exemptive order from the Securities and Exchange Commission | | EPRA/NAREIT Developed Index. However, infrastructure and |
| (“SEC”) permits RIMCo to engage or terminate a money manager | | global real estate generally lagged equities, as these interest |
| in an Underlying Fund at any time, subject to approval by the | | rate sensitive asset classes were negatively impacted by the U. S. |
| Underlying Fund’s Board, without a shareholder vote. Pursuant to | | Federal Reserve’s (“Fed”) indication of potential tapering of its |
| the terms of the exemptive order, an Underlying Fund is required | | stimulus program earlier than markets had anticipated. Despite |
| to notify its shareholders within 90 days of when a money manager | | lagging broad equities for the year, infrastructure and real estate |
| begins providing services. | | outperformed bonds for the year, benefiting the Fund due to its |
| What is the Fund’s investment objective? | | exposure to these two asset classes. Commodity markets, however, |
| The Fund seeks to provide high current income and moderate | | didn’t fare as well, as the Dow Jones UBS Commodity Index lost |
| long term capital appreciation. | | 9.52% for the year, hurt by softening demand in emerging markets |
| | | such as China. The broad underperformance of commodities to |
| How did the Fund perform relative to its benchmark for the | | bonds detracted from the Fund’s benchmark relative performance. |
| fiscal year ended December 31, 2013? | | Alternative strategies contributed positively, as the Russell Multi- |
| For the fiscal year ended December 31, 2013, the Balanced | | Strategy Alternative Fund posted returns above the Fund’s fixed |
| Strategy Fund gained 12.43%. This is compared to the | | income benchmark. |
| Fund’s primary benchmark, the Barclays U. S. Aggregate Bond | | Fixed income markets ended the year down, largely impacted by |
| Index, which lost 2.02% during the same period. The Fund’s | | a volatile interest rate environment. Interest rates sharply rose in |
| performance includes operating expenses, whereas index returns | | the first half of the year off concerns of Fed tapering in the near |
| are unmanaged and do not include expenses of any kind. | | term, only to fall later in the year after a surprise announcement |
| For the fiscal year ended December 31, 2013, the Lipper® Mixed | | by the Fed that tapering would not occur in September as many |
| Asset Target Allocation Moderate Funds Average (VIP), a group | | expected. Overall, exposure to other asset classes in addition |
| of funds that Lipper considers to have investment strategies | | to fixed income benefited the Fund’s benchmark relative |
| similar to those of the Fund, gained 14.12%. This result serves as | | performance. |
| a peer comparison and is expressed net of operating expenses. | | |
| | | How did the investment strategies and techniques employed |
| The Fund’s outperformance relative to the Barclays U. S. Aggregate | | by the Fund and the Underlying Funds affect the Fund’s |
| Bond Index was primarily due to the Fund’s out-of-benchmark | | performance? |
| allocation to equities, listed infrastructure and global real estate | | The Fund is a fund of funds and its performance is based on |
| securities, which outperformed fixed income securities over the | | RIMCo’s strategic asset allocations and the performance of the |
| period. | | Underlying Funds in which the Fund invests. |
| How did the market conditions described in the Market | | The Fund’s strategic allocation to U. S. equity Underlying Funds |
| Summary report affect the Fund’s performance? | | was beneficial to benchmark relative performance, though |
| Global equity markets ended the fiscal year on a strong note, led | | underlying active management effects were mixed. The Aggressive |
| by the U. S. where markets gained 33.55% for the year as measured | | Equity Fund outperformed its benchmark for the period, while |
| by the Russell 3000 ® Index. Non-U. S. markets also finished up, | | the Multi-Style Equity Fund underperformed. For the Aggressive |
| posting returns of 21.68% as measured by the Russell Developed | | Equity Fund, underweight exposure to high yielding sectors |
| ex-U. S. Large Cap Index. The Fund’s exposure to broad equities | | such as REITs and utilities and overweight exposure to cyclicals |
| was a large driver to positive benchmark relative returns, | | contributed to positive performance. For the Multi-Style Equity |
| as bonds fell 2.02% for the year as measured by the Barclays | | |
Balanced Strategy Fund 29
Russell Investment Funds
Balanced Strategy Fund
Portfolio Management Discussion and Analysis, continued — December 31, 2013 (Unaudited)
| Fund, stock selection within the health care sector detracted from | | the target strategic allocation given mitigation of large tail risk by |
| the Fund’s performance. | | positive European Central Bank and Fed policy announcements, |
| Strategic exposure to non-U. S. Underlying Funds also contributed | | but continued economic concerns over Europe. |
| positively to the Fund’s benchmark relative performance, as non- | | On February 1, 2013, the Fund tilted 1.00% away from the Core |
| U. S. equities outperformed bonds for the year. Underlying active | | Bond Fund and 1.00% towards the Russell Emerging Markets |
| management was mixed, as the Russell Global Equity Fund | | Fund to express a positive equity outlook relative to fixed income |
| and Non-U. S. Fund outperformed their benchmarks, while the | | for the 2013 calendar year. |
| Russell Emerging Markets Fund underperformed its benchmark. | | On June 18, 2013, the Fund tilted 1.00% away from the Russell |
| For the Non-U. S. Fund, exposure to companies with higher than | | Commodity Strategies Fund and 1.00% towards the Russell |
| forecasted growth and overweight exposure to momentum was | | Global Infrastructure Fund to express a negative near to medium |
| beneficial to performance. An underweight position in materials | | term outlook for commodities and the desire to increase the Fund’s |
| stocks also contributed. For the Russell Emerging Markets Fund, | | equity beta exposure (beta is a measure of a portfolio’s volatility |
| an underweight to Malaysia and Taiwan and an overweight to | | and its sensitivity to the direction of the market) . |
| Turkey detracted. | | |
| | | On July 5, 2013, the Fund partially removed its 2.00% underweight |
| The Fund’s strategic allocation to fixed income Underlying Funds | | to the Non-U. S. Fund by 1.00% and moved 1.00% underweight to |
| had a positive impact on benchmark relative performance, while | | the Core Bond Fund, as the portfolio manager continued to expect |
| underlying active management was mixed. The Core Bond Fund | | a positive equity market and a muted outlook on fixed income for |
| outperformed its benchmark for the period, while the Russell | | the second half of 2013. |
| Global Opportunistic Credit Fund underperformed. For the Core | | |
| Bond Fund, exposure to non-agency mortgage-backed securities, | | On October 7, 2013, the Fund tilted 1.00% away from the Russell |
| duration positioning as well as exposure to non-U. S. interest rates | | Global Real Estate Securities Fund and 1.00% away from the |
| contributed to performance. For the Russell Global Opportunistic | | Multi-Style Equity Fund, while increasing the allocation to the |
| Credit Fund, hard currency sovereign debt selection within | | Non-U. S. Fund by 1.00% and the Core Bond Fund by 1.00%. |
| emerging markets detracted from performance, as well as well | | These tilts were implemented to remove the negative outlook on |
| as bank loan exposures as spreads on high yield bonds rallied, | | the non-U. S. developed equity markets and to move the Fund to |
| particularly near the end of the year. | | a neutral equity and fixed income weight. The underweight to the |
| | | Russell Global Real Estate Securities Fund was taken to mitigate |
| The Fund’s strategic allocation to alternative Underlying Funds | | the Fund’s exposure in this interest rate sensitive asset class, |
| had mixed effects on performance. Infrastructure, real estate, | | given potential for rising interest rates in the near term. |
| and alternative strategies outperformed fixed income, while | | |
| commodities underperformed. Underlying active management | | On October 9, 2013, the Fund tilted 1.00% away from the |
| was generally positive, with the exception of the Global Real | | Aggressive Equity Fund and 1.00% towards the Core Bond |
| Estate Securities Fund. For the Global Real Estate Securities | | Fund, bringing these allocations back to policy weight. This tilt |
| Fund, an underweight position taken in Japan detracted, as Japan | | was driven by a more cautious outlook on equity markets for the |
| was among the stronger performing markets. Other detractors | | remainder of the year, particularly small cap equities, which |
| included an out of benchmark exposure to Brazil and stock | | performed strongly over the year. |
| selection in Hong Kong. | | The views expressed in this report reflect those of the |
| Describe any changes to the Fund’s structure or allocation | | portfolio managers only through the end of the period |
| to the Underlying Funds. | | covered by the report. These views do not necessarily |
| RIMCo has the discretion to modify the target strategic asset | | represent the views of RIMCo or any other person in RIMCo |
| allocation of the Fund by up to +/- 3% at the equities, fixed income | | or any other affiliated organization. These views are subject |
| or alternative category level based on RIMCo’s assessment of | | to change at any time based upon market conditions or |
| relative market valuation of the asset classes represented by each | | other events, and RIMCo disclaims any responsibility to |
| Underlying Fund. Performance of the Fund’s short-term asset | | update the views contained herein. These views should not |
| allocation modifications ended the fiscal year positively. | | be relied on as investment advice and, because investment |
| | | decisions for a Russell Investment Funds (“RIF”) Fund are |
| Entering the fiscal year, the Fund maintained its underweight to | | based on numerous factors, should not be relied on as an |
| the Non-U. S. Fund at 2.00% below the target strategic allocation | | indication of investment decisions of any RIF Fund. |
| and its overweight to the Multi-Style Equity Fund at 2.00% above | | |
30 Balanced Strategy Fund
Russell Investment Funds
Balanced Strategy Fund
Portfolio Management Discussion and Analysis, continued — December 31, 2013 (Unaudited)
| * | Assumes initial investment on April 30, 2007. |
| ** | The Barclays U. S. Aggregate Bond Index is an index, with income reinvested, generally representative of intermediate-term government bonds, investment- grade corporate debt securities and mortgage-backed securities. |
| *** | The Russell 1000® Index includes the 1,000 largest companies in the Russell 3000® Index. The Russell 1000® Index represents the universe of stocks from which most active money managers typically select. The Russell 1000® Index return reflects adjustments from income dividends and capital gain distributions reinvested as of the ex-dividend dates. |
| **** | The Russell Developed ex-U. S. Large Cap® Index (net of tax on dividends from foreign holdings) is an index which offers investors access to the large-cap segment of the global equity market, excluding companies assigned to the United States. It is constructed to provide a comprehensive and unbiased barometer for the large-cap segment and is completely reconstituted annually to accurately reflect the changes in the market over time. |
| § | Annualized. |
The performance shown in this section does not reflect any Insurance Company Separate Account or Policy Charges. Performance is historical and assumes reinvestment of all dividends and capital gains. Investment return and principal value will fluctuate so that an investor’s shares, when redeemed, may be worth more or less than when purchased. Past performance is not indicative of future results.
Balanced Strategy Fund 31
Russell Investment Funds
Balanced Strategy Fund
Shareholder Expense Example — December 31, 2013 (Unaudited)
| Fund Expenses | | Please note that the expenses shown in the table are meant |
| The following disclosure provides important information | | to highlight your ongoing costs only and do not reflect any |
| regarding the Fund’s Shareholder Expense Example | | transactional costs. Therefore, the information under the heading |
| (“Example”) . | | “Hypothetical Performance (5% return before expenses)” is |
| | | useful in comparing ongoing costs only, and will not help you |
| Example | | determine the relative total costs of owning different funds. In |
| As a shareholder of the Fund, you incur two types of costs: (1) | | addition, if these transactional costs were included, your costs |
| transaction costs, and (2) ongoing costs, including advisory and | | would have been higher. The fees and expenses shown in this |
| administrative fees and other Fund expenses. The Example is | | section do not reflect any Insurance Company Separate Account Policy Charges. |
| intended to help you understand your ongoing costs (in dollars) | | | | | | | | | | | | | | |
| of investing in the Fund and to compare these costs with the | | | | | | | | | | | | Hypothetical |
| ongoing costs of investing in other mutual funds. The Example | | | | | | | | Actual | | | | Performance (5% |
| is based on an investment of $1,000 invested at the beginning of | | | | | | | | Performance | | | | return before expenses) |
| the period and held for the entire period indicated, which for this | | | | | | | | | | | | |
| | | Beginning Account Value | | | | | | | | | | | | |
| Fund is from July 1, 2013 to December 31, 2013. | | July 1, 2013 | | | | $ | | 1,000.00 | | | | $ | | 1,000.00 |
| Actual Expenses | | Ending Account Value | | | | | | | | | | | | |
| | | December 31, 2013 | | | | $ | | 1,093.20 | | | | $ | | 1,024.70 |
| The information in the table under the heading “Actual | | Expenses Paid During Period* | | | | $ | | 0.53 | | | | $ | | 0.51 |
| Performance” provides information about actual account values | | | | | | | | | | | | | | |
| and actual expenses. You may use the information in this column, | | * Expenses are equal to the Fund's annualized expense ratio of 0.10% |
| | | (representing the six month period annualized), multiplied by the average |
| together with the amount you invested, to estimate the expenses | | account value over the period, multiplied by 184/365 (to reflect the one-half year |
| that you paid over the period. Simply divide your account value by | | period) . May reflect amounts waived, reimbursed and/or other credits. Without |
| $1,000 (for example, an $8,600 account value divided by $1,000 | | any waivers, reimbursements and/or other credits, expenses would have been |
| = 8.6), then multiply the result by the number in the first column | | higher. | | | | | | | | | | | | |
| in the row entitled “Expenses Paid During Period” to estimate | | | | | | | | | | | | | | |
| the expenses you paid on your account during this period. | | | | | | | | | | | | | | |
| |
| Hypothetical Example for Comparison Purposes | | | | | | | | | | | | | | |
| The information in the table under the heading “Hypothetical | | | | | | | | | | | | | | |
| Performance (5% return before expenses)” provides information | | | | | | | | | | | | | | |
| about hypothetical account values and hypothetical expenses | | | | | | | | | | | | | | |
| based on the Fund’s actual expense ratio and an assumed rate of | | | | | | | | | | | | | | |
| return of 5% per year before expenses, which is not the Fund’s | | | | | | | | | | | | | | |
| actual return. The hypothetical account values and expenses | | | | | | | | | | | | | | |
| may not be used to estimate the actual ending account balance or | | | | | | | | | | | | | | |
| expenses you paid for the period. You may use this information | | | | | | | | | | | | | | |
| to compare the ongoing costs of investing in the Fund and other | | | | | | | | | | | | | | |
| funds. To do so, compare this 5% hypothetical example with the | | | | | | | | | | | | | | |
| 5% hypothetical examples that appear in the shareholder reports | | | | | | | | | | | | | | |
| of other funds. | | | | | | | | | | | | | | |
32 Balanced Strategy Fund
Russell Investment Funds
Balanced Strategy Fund
Schedule of Investments — December 31, 2013
| Amounts in thousands (except share amounts) | | | | Amounts in thousands (except share amounts) | | |
| |
| | | | | | | Fair | | | | | | | | | Fair |
| | | | | | | Value | | | | | | | | | Value |
| | | | | Shares | | $ | | | | | | Shares | | $ |
| Investments 100.0% | | | | | | | | RIF Multi-Style Equity Fund | | | | 1,389,562 | | | 26,193 |
| Russell Investment Company | | | | | | | | | | | | | | | 67,895 |
| ("RIC") and other Russell | | | | | | | | Fixed Income - 37.2% | | | | | | | |
| Investment Funds ("RIF") Series | | | | | | | | RIC Russell Global Opportunistic Credit | | | | | | | |
| Mutual Funds | | | | | | | | Fund Class Y | | | | 903,064 | | | 8,958 |
| | | | | | | | | RIF Core Bond Fund | | | | 9,962,175 | | | 104,304 |
| Alternative Funds - 12.0% | | | | | | | | | | | | | | | 113,262 |
| RIC Russell Commodity Strategies Fund | | | | | | | | | | | | | | | |
| Class Y | | | | 1,062,711 | | 8,969 | | International Equities - 28.5% | | | | | | | |
| RIC Russell Global Infrastructure Fund | | | | | | | | RIC Russell Emerging Markets Fund | | | | | | | |
| Class Y | | | | 1,040,735 | | 12,260 | | Class Y | | | | 754,100 | | | 13,574 |
| RIC Russell Multi-Strategy Alternative | | | | | | | | RIC Russell Global Equity Fund Class Y | | | | 2,573,125 | | | 29,411 |
| Fund Class Y | | | | 877,271 | | 9,089 | | RIF Non-U. S. Fund | | | | 3,541,636 | | | 43,633 |
| RIF Global Real Estate Securities Fund | | | | 411,986 | | 6,048 | | | | | | | | | 86,618 |
| | | | | | | 36,366 | | | | | | | | | |
| |
| Domestic Equities - 22.3% | | | | | | | | Total Investments 100.0% | | | | | | | |
| RIC Russell U. S. Defensive Equity Fund | | | | | | | | (identified cost $257,456) | | | | | | | 304,141 |
| Class Y | | | | 365,986 | | 15,375 | | | | | | | | | |
| RIC Russell U. S. Dynamic Equity Fund | | | | | | | | Other Assets and Liabilities, | | | | | | | |
| Class Y | | | | 1,445,126 | | 17,024 | | Net - (0.0%) | | | | | | | (38) |
| |
| RIF Aggressive Equity Fund | | | | 551,128 | | 9,303 | | Net Assets - 100.0% | | | | | | | 304,103 |
Presentation of Portfolio Holdings
| | % of Net | |
| Categories | Assets | |
| Alternative Funds | 12 . 0 | |
| Domestic Equities | 22 . 3 | |
| Fixed Income | 37 . 2 | |
| International Equities | 28 . 5 | |
| Total Investments | 100 . 0 | |
| Other Assets and Liabilities, Net | (—*) |
| | 100 . 0 | |
| |
| * Less than . 05% of net assets. | | |
See accompanying notes which are an integral part of the financial statements.
Balanced Strategy Fund 33
Russell Investment Funds
Balanced Strategy Fund
Statement of Assets and Liabilities — December 31, 2013
| Amounts in thousands | | |
| Assets | | |
| Investments, at identified cost | $ | 257,456 |
| Investments, at fair value | | 304,141 |
| Receivables: | | |
| Fund shares sold | | 43 |
| From affiliates | | 12 |
| Total assets | | 304,196 |
| Liabilities | | |
| Payables: | | |
| Investments purchased | | 43 |
| Accrued fees to affiliates | | 15 |
| Other accrued expenses | | 35 |
| Total liabilities | | 93 |
| Net Assets | $ | 304,103 |
| Net Assets Consist of: | | |
| Undistributed (overdistributed) net investment income | $ | (1) |
| Accumulated net realized gain (loss) | | (4,248) |
| Unrealized appreciation (depreciation) on investments | | 46,685 |
| Shares of beneficial interest | | 291 |
| Additional paid-in capital | | 261,376 |
| Net Assets | $ | 304,103 |
| Net Asset Value, offering and redemption price per share: | | |
| Net asset value per share: (#) | $ | 10 . 44 |
| Net assets | $ | 304,102,556 |
| Shares outstanding ($. 01 par value) | | 29,136,346 |
| (#) Net asset value per share equals net assets divided by shares of beneficial interest outstanding. | | |
See accompanying notes which are an integral part of the financial statements.
34 Balanced Strategy Fund
Russell Investment Funds
Balanced Strategy Fund
Statement of Operations — For the Period Ended December 31, 2013
| Amounts in thousands | | |
| Investment Income | | |
| Income distributions from Underlying Funds | $ | 6,138 |
| |
| Expenses | | |
| Advisory fees | | 559 |
| Administrative fees | | 140 |
| Custodian fees | | 18 |
| Transfer agent fees | | 12 |
| Professional fees | | 57 |
| Trustees’ fees | | 7 |
| Printing fees | | 67 |
| Miscellaneous | | 10 |
| Expenses before reductions | | 870 |
| Expense reductions | | (590) |
| Net expenses | | 280 |
| Net investment income (loss) | | 5,858 |
| |
| Net Realized and Unrealized Gain (Loss) | | |
| Net realized gain (loss) on: | | |
| Investments | | 2,359 |
| Capital gain distributions from Underlying Funds | | 4,011 |
| Net realized gain (loss) | | 6,370 |
| Net change in unrealized appreciation (depreciation) on investments | | 20,452 |
| Net realized and unrealized gain (loss) | | 26,822 |
| Net Increase (Decrease) in Net Assets from Operations | $ | 32,680 |
See accompanying notes which are an integral part of the financial statements.
Balanced Strategy Fund 35
Russell Investment Funds
Balanced Strategy Fund
Statements of Changes in Net Assets
| | | For the Periods Ended December 31, |
| Amounts in thousands | | 2013 | 2012 |
| Increase (Decrease) in Net Assets | | | | | |
| Operations | | | | | |
| Net investment income (loss) | | $ | 5,858 | $ | 5,701 |
| Net realized gain (loss) | | | 6,370 | | (706) |
| Net change in unrealized appreciation (depreciation) | | | 20,452 | | 22,155 |
| Net increase (decrease) in net assets from operations | | | 32,680 | | 27,150 |
| |
| Distributions | | | | | |
| From net investment income | | | (6,020) | | (5,712) |
| From net realized gain | | | (2,128) | | — |
| Net decrease in net assets from distributions | | | (8,148) | | (5,712) |
| |
| Share Transactions* | | | | | |
| Net increase (decrease) in net assets from share transactions | | | 26,491 | | 30,573 |
| Total Net Increase (Decrease) in Net Assets | | | 51,023 | | 52,011 |
| |
| Net Assets | | | | | |
| Beginning of period | | | 253,080 | | 201,069 |
| End of period | | $ | 304,103 | $ | 253,080 |
| Undistributed (overdistributed) net investment income included in net assets | | $ | (1) | $ | 161 |
* Share transaction amounts (in thousands) for the periods ended December 31, 2013 and December 31, 2012 were as follows:
| | | | | 2013 | | 2012 |
| | | | | Shares | | | Dollars | | Shares | | | | Dollars |
| |
| Proceeds from shares sold | | | | 3,613 | $ | | 36,153 | | 4,174 | | $ | | 38,630 |
| Proceeds from reinvestment of distributions | | | | 798 | | | 8,148 | | 609 | | | | 5,712 |
| Payments for shares redeemed | | | | (1,778) | | | (17,810) | | (1,496) | | | | (13,769) |
| Total increase (decrease) | | | | 2,633 | $ | | 26,491 | | 3,287 | | $ | | 30,573 |
| | | | | | | | | | | | | | |
See accompanying notes which are an integral part of the financial statements.
36 Balanced Strategy Fund
(This page intentionally left blank)
Russell Investment Funds
Balanced Strategy Fund
Financial Highlights — For the Periods Ended
| For a Share Outstanding Throughout Each Period. | | | | | | | | | | | | | |
| |
| | | $ | | $ | | | | $ | | | | $ | | | | $ | | | $ |
| | Net Asset Value, | Net | | | Net Realized | | | | Total from | | | | Distributions | | | Distributions |
| | | Beginning of | Investment Income | | | and Unrealized | | | | Investment | | | | from Net | | | from Net |
| | | Period | (Loss)(a)(b)(d) | | | Gain (Loss) | | | | Operations | | Investment Income | | | Realized Gain |
| December 31, 2013 | | 9 . 55 | | . 21 | | | | . 96 | | | | 1 . 17 | | | | ( . 21) | | | ( . 07) |
| December 31, 2012 | | 8 . 66 | | . 23 | | | | . 89 | | | | 1 . 12 | | | | ( . 23) | | | — |
| December 31, 2011 | | 9 . 07 | | . 21 | | | | ( . 42) | | | | ( . 21) | | | | ( . 20) | | | — |
| December 31, 2010 | | 8 . 25 | | . 31 | | | | . 84 | | | | 1 . 15 | | | | ( . 31) | | | — |
| December 31, 2009 | | 6 . 80 | | . 26 | | | | 1 . 47 | | | | 1 . 73 | | | | ( . 24) | | | ( . 04) |
See accompanying notes which are an integral part of the financial statements.
38 Balanced Strategy Fund
| | | | | | | | | | | % | | | % | | % | | |
| | | | | $ | | | | $ | Ratio of Expenses | Ratio of Expenses | | Ratio of Net | | |
| $ | | $ | Net Asset Value, | | % | | Net Assets, | to Average | to Average | Investment Income | | % |
| Return of | | Total | | End of | | Total | | End of Period | Net Assets, | Net Assets, | | to Average | | Portfolio |
| Capital | Distributions | | Period | | Return(e) | | (000) | Gross(c) | Net(c)(d) | Net Assets (b)(d) | | Turnover Rate |
| — | | ( . 28) | | 10 . 44 | | 12 . 43 | | 304,103 | | . 31 | | | . 10 | | 2 . 09 | | 11 |
| — | | ( . 23) | | 9 . 55 | | 12 . 95 | | 253,080 | | . 32 | | | . 10 | | 2 . 49 | | 21 |
| — | | ( . 20) | | 8 . 66 | | (2 . 40) | | 201,069 | | . 31 | | | . 10 | | 2 . 36 | | 8 |
| ( . 02) | | ( . 33) | | 9 . 07 | | 14 . 06 | | 157,122 | | . 36 | | | . 10 | | 3 . 67 | | 23 |
| — | | ( . 28) | | 8 . 25 | | 26 . 23 | | 105,185 | | . 35 | | | . 09 | | 3 . 62 | | 8 |
See accompanying notes which are an integral part of the financial statements.
Balanced Strategy Fund 39
Russell Investment Funds
Growth Strategy Fund
Portfolio Management Discussion and Analysis — December 31, 2013 (Unaudited)
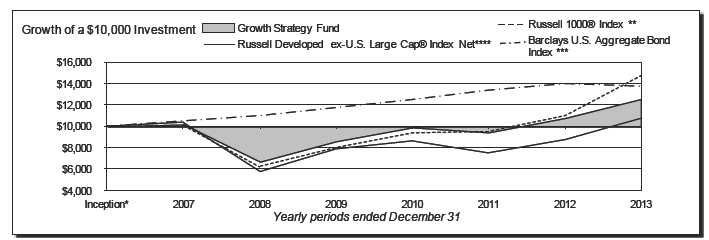
| Growth Strategy Fund | | | Barclays U. S. Aggregate Bond Index *** | |
| | Total | | | Total |
| | Return | | | Return |
| 1 Year | 16 . 56% | | 1 Year | -2. 02% |
| 5 Years | 13 . 42%§ | | 5 Years | 4 . 44%§ |
| Inception* | 3 . 51%§ | | Inception* | 4 . 84%§ |
| |
| |
| Russell 1000 ® Index ** | | | Russell Developed ex-U. S. Large Cap® Index Net **** |
| | Total | | | Total |
| | Return | | | Return |
| 1 Year | 33 . 11% | | 1 Year | 21 . 68% |
| 5 Years | 18 . 59%§ | | 5 Years | 13 . 10%§ |
| Inception* | 5 . 92%§ | | Inception* | 1 . 04%§ |
40 Growth Strategy Fund
Russell Investment Funds
Growth Strategy Fund
Portfolio Management Discussion and Analysis, continued — December 31, 2013 (Unaudited)
| The Growth Strategy Fund (the “Fund”) is a fund of funds that | | markets detracted, as emerging markets finished the year up |
| invests in other Russell Investment Funds and Russell Investment | | 0.02% as measured by the Russell Emerging Markets Index. |
| Company mutual funds (the “Underlying Funds”) . The Underlying | | U. S. equity markets benefited from an improving macroeconomic |
| Funds employ a multi-manager approach whereby portions of the | | outlook and positive political developments through the year. The |
| Underlying Funds are allocated to different money managers. | | U. S. federal government’s avoidance of a “fiscal cliff” in January |
| Underlying Fund assets not allocated to money managers | | helped catalyze a strong start for U. S. equities in 2013. In non-U. S. |
| are managed by Russell Investment Management Company | | markets, expansionary policies in Japan and positive economic |
| (“RIMCo”), the Fund’s and Underlying Funds’ advisor. RIMCo, as | | news in Europe were beneficial. In emerging markets, flat returns |
| the Underlying Funds’ advisor, may change the allocation of the | | were generally driven by macroeconomic, political, and policy |
| Underlying Funds’ assets among money managers at any time. An | | events. The anticipation of the Fed’s tapering of quantitative |
| exemptive order from the Securities and Exchange Commission | | easing negatively impacted emerging market equities. |
| (“SEC”) permits RIMCo to engage or terminate a money manager | | Alternative asset classes generally fared well over the year, as |
| in an Underlying Fund at any time, subject to approval by the | | the S&P Global Infrastructure Index posted a 14.00% gain while |
| Underlying Fund’s Board, without a shareholder vote. Pursuant to | | global real estate securities finished up 3.67% as measured by the |
| the terms of the exemptive order, an Underlying Fund is required | | FTSE EPRA/NAREIT Developed Index. However, infrastructure |
| to notify its shareholders within 90 days of when a money manager | | and global real estate generally lagged equities, as these interest |
| begins providing services. | | | | rate sensitive asset classes were negatively impacted by the |
| What is the Fund’s investment objective? | | | | U. S. Federal Reserve’s (“Fed”) indication of potential tapering |
| The Fund seeks to provide high long term capital appreciation | | of its stimulus program earlier than markets had anticipated. |
| with low current income. | | | | Commodity markets also struggled relative to equity markets as |
| | | | | the Dow Jones UBS Commodity Index lost 9.52% for the year, |
| How did the Fund perform relative to its benchmark for the | | hurt by softening demand in emerging markets such as China. |
| fiscal year ended December 31, 2013? | | | | Alternative strategies detracted from a benchmark relative |
| For the fiscal year ended December 31, 2013, the Growth Strategy | | perspective, as the Russell Multi-Strategy Alternative Fund |
| Fund gained 16.56%. This is compared to the Fund’s primary | | also lagged the equity markets for the year. Overall, exposure to |
| benchmark, the Russell 1000 ® Index, which gained 33.11% | | these alternative asset classes detracted from benchmark relative |
| during the same period. The Fund’s performance includes | | performance. |
| operating expenses, whereas index returns are unmanaged and | | Fixed income markets ended the year down, largely impacted by |
| do not include expenses of any kind. | | | | a volatile interest rate environment. Interest rates sharply rose in |
| For the fiscal year ended December 31, 2013, the Lipper® Mixed | | the first half of the year off concerns of Fed tapering in the near |
| Asset Target Allocation Growth Funds Average (VIP), a group of | | term, only to fall later in the year after a surprise announcement |
| funds that Lipper considers to have investment strategies similar | | by the Fed that tapering would not occur in September as many |
| to those of the Fund, gained 19.20%. This result serves as a peer | | expected. Overall, exposure to fixed income hurt the Fund’s |
| comparison and is expressed net of operating expenses. | | benchmark relative performance. |
| |
| The Fund’s underperformance relative to the Russell 1000 ® Index | | How did the investment strategies and techniques employed |
| was primarily due to the Fund’s out-of-benchmark allocations to | | by the Fund and the Underlying Funds affect the Fund’s |
| non-U. S. equity, real assets and fixed income Underlying Funds, | | performance? |
| which generally underperformed the U. S. large cap equity market | | The Fund is a fund of funds and its performance is based on |
| as represented by the Russell 1000® Index. | | | | |
| | | | | RIMCo’s strategic asset allocations and the performance of the |
| How did the market conditions described in the Market | | Underlying Funds in which the Fund invests. |
| Summary report affect the Fund’s performance? | | | | The Fund’s strategic allocation to U. S. large cap and small cap |
| Global equity markets ended the fiscal year on a strong note, led | | Underlying Funds provided mixed results. Exposure to the |
| by the U. S. where markets gained 33.55% for the year as measured | | Aggressive Equity Fund benefited the Fund’s benchmark relative |
| by the Russell 3000 ® Index. Non-U. S. markets also finished up, | | performance, as U. S. small cap equities outperformed U. S. large |
| posting returns of 21.68% as measured by the Russell Developed | | cap equities and this Underlying Fund outperformed its small cap |
| ex-U. S. Large Cap Index, but lagged U. S. markets. The Fund’s | | primary benchmark. However, underlying active management |
| exposure to non-U. S. equities was a large driver to negative | | within the U. S. large cap equity Underlying Funds detracted, as |
| benchmark relative returns. In particular, exposure to emerging | | each underperformed its respective U. S. equity market segment |
Growth Strategy Fund 41
Russell Investment Funds
Growth Strategy Fund
Portfolio Management Discussion and Analysis, continued — December 31, 2013 (Unaudited)
| as represented by its primary benchmark. For the Aggressive | | the target strategic allocation given mitigation of large tail risk by |
| Equity Fund, underweight exposure to high yielding sectors | | positive European Central Bank and Fed policy announcements, |
| such as REITs and utilities and overweight exposure to cyclicals | | but continued economic concerns over Europe. |
| contributed to positive performance. For the Multi-Style Equity | | On February 1, 2013, the Fund tilted 1.25% away from the Core |
| Fund, stock selection within the health care sector detracted from | | Bond Fund and 1.25% towards the Russell Emerging Markets |
| the Fund’s performance. | | Fund to express a positive equity outlook relative to fixed income |
| Strategic exposure to non-U. S. equity Underlying Funds detracted, | | for the 2013 calendar year. |
| as non-U. S. equities underperformed U. S. equities for the year. | | On June 18, 2013, the Fund tilted 1.25% away from the Russell |
| Underlying active management was mixed, as the Russell Global | | Commodity Strategies Fund and 1.25% towards the Russell |
| Equity Fund and Non-U. S. Fund outperformed their benchmarks, | | Global Infrastructure Fund to express a negative near to medium |
| while the Russell Emerging Markets fund underperformed its | | term outlook for commodities and the desire to increase the Fund’s |
| benchmark. For the Non-U. S. Fund, exposure to companies | | equity beta exposure (beta is a measure of a portfolio’s volatility |
| with higher than forecasted growth and overweight exposure | | and its sensitivity to the direction of the market) . |
| to momentum was beneficial to performance. An underweight | | |
| position in materials stocks also contributed. For the Russell | | On July 5, 2013, the Fund partially removed its 2.00% underweight |
| Emerging Markets Fund, an underweight to Malaysia and Taiwan | | to the Non-U. S. Fund by 1.00% and moved 1.00% underweight to |
| and an overweight to Turkey detracted. | | the Core Bond Fund, as the portfolio manager continued to expect |
| | | | | a positive equity market and a muted outlook on fixed income for |
| The Fund’s strategic allocation to fixed income Underlying Funds | | the second half of 2013. |
| negatively impacted the Fund’s benchmark relative performance, | | |
| while underlying active management was mixed. The Core Bond | | On October 7, 2013, the Fund tilted 1.25% away from the Global |
| Fund outperformed its benchmark for the period, while the | | Real Estate Securities Fund and 1.00% away from the Multi-Style |
| Russell Global Opportunistic Credit Fund underperformed. For | | Equity Fund, while increasing the Non-U. S. Fund by 1.25% and |
| the Core Bond Fund, exposure to non-agency mortgage-backed | | the Core Bond Fund by 1.00%. These tilts were implemented to |
| securities, duration positioning as well as exposure to non- | | remove the negative outlook on the non-U. S. developed equity |
| U. S. interest rates contributed to performance. For the Russell | | markets and to move the Fund to a neutral equity and fixed income |
| Global Opportunistic Credit Fund, hard currency sovereign debt | | weight. The underweight to the Global Real Estate Securities |
| selection within emerging markets detracted from performance, | | Fund was taken to mitigate the Fund’s exposure in this interest |
| as well as well as bank loan exposures as spreads on high yield | | rate sensitive asset class, given potential for rising interest rates |
| bonds rallied, particularly near the end of the year. | | in the near term. |
| The Fund’s strategic allocation to alternative Underlying Funds | | On October 9, 2013, the Fund tilted 1.25% away from the |
| detracted, though underlying active management was generally | | Aggressive Equity Fund and 1.25% towards the Core Bond |
| positive, with the exception of the Global Real Estate Securities | | Fund, bringing these allocations back to policy weight. This tilt |
| Fund. For the Global Real Estate Securities Fund, an underweight | | was driven by a more cautious outlook on equity markets for the |
| position taken in Japan detracted, as Japan was among the | | remainder of the year, particularly small cap equities, which have |
| stronger performing markets. Other detractors included an out of | | performed strongly for the year. |
| benchmark exposure to Brazil and stock selection in Hong Kong. | | The views expressed in this report reflect those of the |
| Describe any changes to the Fund’s structure or allocation | | portfolio managers only through the end of the period |
| to the Underlying Funds. | | covered by the report. These views do not necessarily |
| RIMCo has the discretion to modify the target strategic asset | | represent the views of RIMCo, or any other person in RIMCo |
| allocation of the Fund by up to +/- 3% at the equities, fixed income | | or any other affiliated organization. These views are |
| or alternative category level based on RIMCo’s assessment of | | subject to change at any time based upon market conditions |
| relative market valuation of the asset classes represented by each | | or other events, and RIMCo disclaims any responsibility to |
| Underlying Fund. Performance of the Fund’s short-term asset | | update the views contained herein. These views should not |
| allocation modifications ended the fiscal year positively. | | be relied on as investment advice and, because investment |
| | | | | decisions for a Russell Investment Funds (“RIF”) Fund are |
| Entering the fiscal year, the Fund maintained its underweight to | | based on numerous factors, should not be relied on as an |
| the Non-U. S. Fund at 2.25% below the target strategic allocation | | indication of investment decisions of any RIF Fund. |
| and its overweight to the Multi-Style Equity Fund at 2.25% above | | |
42 Growth Strategy Fund
Russell Investment Funds
Growth Strategy Fund
Portfolio Management Discussion and Analysis, continued — December 31, 2013 (Unaudited)
| * | Assumes initial investment on April 30, 2007. |
| ** | The Russell 1000® Index includes the 1,000 largest companies in the Russell 3000® Index. The Russell 1000® Index represents the universe of stocks from which most active money managers typically select. The Russell 1000® Index return reflects adjustments from income dividends and capital gain distributions reinvested as of the ex-dividend dates. |
| *** | The Barclays U. S. Aggregate Bond Index is an index, with income reinvested, generally representative of intermediate-term government bonds, investment- grade corporate debt securities and mortgage-backed securities. |
| **** | The Russell Developed ex-U. S. Large Cap® Index (net of tax on dividends from foreign holdings) is an index which offers investors access to the large-cap segment of the global equity market, excluding companies assigned to the United States. It is constructed to provide a comprehensive and unbiased barometer for the large-cap segment and is completely reconstituted annually to accurately reflect the changes in the market over time. |
| § | Annualized. |
The performance shown in this section does not reflect any Insurance Company Separate Account or Policy Charges. Performance is historical and assumes reinvestment of all dividends and capital gains. Investment return and principal value will fluctuate so that an investor’s shares, when redeemed, may be worth more or less than when purchased. Past performance is not indicative of future results.
Growth Strategy Fund 43
Russell Investment Funds
Growth Strategy Fund
Shareholder Expense Example — December 31, 2013 (Unaudited)
| Fund Expenses | | Please note that the expenses shown in the table are meant |
| The following disclosure provides important information | | to highlight your ongoing costs only and do not reflect any |
| regarding the Fund’s Shareholder Expense Example | | transactional costs. Therefore, the information under the heading |
| (“Example”) . | | “Hypothetical Performance (5% return before expenses)” is |
| | | useful in comparing ongoing costs only, and will not help you |
| Example | | determine the relative total costs of owning different funds. In |
| As a shareholder of the Fund, you incur two types of costs: (1) | | addition, if these transactional costs were included, your costs |
| transaction costs, and (2) ongoing costs, including advisory and | | would have been higher. The fees and expenses shown in this |
| administrative fees and other Fund expenses. The Example is | | section do not reflect any Insurance Company Separate Account or Policy Charges. |
| intended to help you understand your ongoing costs (in dollars) | | | | | | | | | | | | |
| of investing in the Fund and to compare these costs with the | | | | | | | | | | Hypothetical |
| ongoing costs of investing in other mutual funds. The Example | | | | | | | | Actual | | Performance (5% |
| is based on an investment of $1,000 invested at the beginning of | | | | | | | | Performance | | return before expenses) |
| the period and held for the entire period indicated, which for this | | | | | | | | | | |
| | | Beginning Account Value | | | | | | | | | | |
| Fund is from July 1, 2013 to December 31, 2013. | | July 1, 2013 | | | | $ | | 1,000.00 | | $ | | 1,000.00 |
| Actual Expenses | | Ending Account Value | | | | | | | | | | |
| | | December 31, 2013 | | | | $ | | 1,118.50 | | $ | | 1,024.70 |
| The information in the table under the heading “Actual | | Expenses Paid During Period* | | | | $ | | 0.53 | | $ | | 0.51 |
| Performance” provides information about actual account values | | | | | | | | | | | | |
| and actual expenses. You may use the information in this column, | | * Expenses are equal to the Fund's annualized expense ratio of 0.10% |
| | | (representing the six month period annualized), multiplied by the average |
| together with the amount you invested, to estimate the expenses | | account value over the period, multiplied by 184/365 (to reflect the one-half year |
| that you paid over the period. Simply divide your account value by | | period) . May reflect amounts waived, reimbursed and/or other credits. Without |
| $1,000 (for example, an $8,600 account value divided by $1,000 | | any waivers, reimbursements and/or other credits, expenses would have been |
| = 8.6), then multiply the result by the number in the first column | | higher. | | | | | | | | | | |
| in the row entitled “Expenses Paid During Period” to estimate | | | | | | | | | | | | |
| the expenses you paid on your account during this period. | | | | | | | | | | | | |
| |
| Hypothetical Example for Comparison Purposes | | | | | | | | | | | | |
| The information in the table under the heading “Hypothetical | | | | | | | | | | | | |
| Performance (5% return before expenses)” provides information | | | | | | | | | | | | |
| about hypothetical account values and hypothetical expenses | | | | | | | | | | | | |
| based on the Fund’s actual expense ratio and an assumed rate of | | | | | | | | | | | | |
| return of 5% per year before expenses, which is not the Fund’s | | | | | | | | | | | | |
| actual return. The hypothetical account values and expenses | | | | | | | | | | | | |
| may not be used to estimate the actual ending account balance or | | | | | | | | | | | | |
| expenses you paid for the period. You may use this information | | | | | | | | | | | | |
| to compare the ongoing costs of investing in the Fund and other | | | | | | | | | | | | |
| funds. To do so, compare this 5% hypothetical example with the | | | | | | | | | | | | |
| 5% hypothetical examples that appear in the shareholder reports | | | | | | | | | | | | |
| of other funds. | | | | | | | | | | | | |
44 Growth Strategy Fund
Russell Investment Funds
Growth Strategy Fund
Schedule of Investments — December 31, 2013
| Amounts in thousands (except share amounts) | | | | Amounts in thousands (except share amounts) | | |
| |
| | | | | | | Fair | | | | | | | | | Fair |
| | | | | | | Value | | | | | | | | | Value |
| | | | | Shares | | $ | | | | | | Shares | | $ |
| Investments 100.0% | | | | | | | | RIF Multi-Style Equity Fund | | | | 1,135,716 | | | 21,408 |
| Russell Investment Company | | | | | | | | | | | | | | | 52,327 |
| ("RIC") and other Russell | | | | | | | | Fixed Income - 18.8% | | | | | | | |
| Investment Funds ("RIF") Series | | | | | | | | RIC Russell Global Opportunistic Credit | | | | | | | |
| Mutual Funds | | | | | | | | Fund Class Y | | | | 758,755 | | | 7,527 |
| | | | | | | | | RIF Core Bond Fund | | | | 2,698,206 | | | 28,250 |
| Alternative Funds - 16.7% | | | | | | | | | | | | | | | 35,777 |
| RIC Russell Commodity Strategies Fund | | | | | | | | | | | | | | | |
| Class Y | | | | 1,055,281 | | 8,907 | | International Equities - 37.0% | | | | | | | |
| RIC Russell Global Infrastructure Fund | | | | | | | | RIC Russell Emerging Markets Fund | | | | | | | |
| Class Y | | | | 847,724 | | 9,986 | | Class Y | | | | 606,250 | | | 10,912 |
| RIC Russell Multi-Strategy Alternative | | | | | | | | RIC Russell Global Equity Fund Class Y | | | | 2,168,213 | | | 24,783 |
| Fund Class Y | | | | 730,907 | | 7,572 | | RIF Non-U. S. Fund | | | | 2,801,145 | | | 34,510 |
| RIF Global Real Estate Securities Fund | | | | 354,863 | | 5,209 | | | | | | | | | 70,205 |
| | | | | | | 31,674 | | | | | | | | | |
| |
| Domestic Equities - 27.5% | | | | | | | | Total Investments 100.0% | | | | | | | |
| RIC Russell U. S. Defensive Equity Fund | | | | | | | | (identified cost $156,719) | | | | | | | 189,983 |
| Class Y | | | | 248,965 | | 10,459 | | | | | | | | | |
| RIC Russell U. S. Dynamic Equity Fund | | | | | | | | Other Assets and Liabilities, | | | | | | | |
| Class Y | | | | 1,050,560 | | 12,376 | | Net - (0.0%) | | | | | | | (27) |
| |
| RIF Aggressive Equity Fund | | | | 478,904 | | 8,084 | | Net Assets - 100.0% | | | | | | | 189,956 |
Presentation of Portfolio Holdings
| | % of Net |
| Categories | Assets |
| Alternative Funds | 16 . 7 |
| Domestic Equities | 27 . 5 |
| Fixed Income | 18 . 8 |
| International Equities | 37 . 0 |
| Total Investments | 100 . 0 |
| Other Assets and Liabilities, Net | (—*) |
| | 100 . 0 |
| |
| * Less than . 05% of net assets. | |
See accompanying notes which are an integral part of the financial statements.
Growth Strategy Fund 45
Russell Investment Funds
Growth Strategy Fund
Statement of Assets and Liabilities — December 31, 2013
| Amounts in thousands | | |
| Assets | | |
| Investments, at identified cost | $ | 156,719 |
| Investments, at fair value | | 189,983 |
| Receivables: | | |
| Fund shares sold | | 75 |
| From affiliates | | 9 |
| Total assets | | 190,067 |
| Liabilities | | |
| Payables: | | |
| Investments purchased | | 74 |
| Accrued fees to affiliates | | 9 |
| Other accrued expenses | | 28 |
| Total liabilities | | 111 |
| Net Assets | $ | 189,956 |
| Net Assets Consist of: | | |
| Undistributed (overdistributed) net investment income | $ | 64 |
| Accumulated net realized gain (loss) | | (2,984) |
| Unrealized appreciation (depreciation) on investments | | 33,264 |
| Shares of beneficial interest | | 186 |
| Additional paid-in capital | | 159,426 |
| Net Assets | $ | 189,956 |
| Net Asset Value, offering and redemption price per share: | | |
| Net asset value per share: (#) | $ | 10 . 23 |
| Net assets | $ | 189,955,966 |
| Shares outstanding ($. 01 par value) | | 18,571,124 |
| (#) Net asset value per share equals net assets divided by shares of beneficial interest outstanding. | | |
See accompanying notes which are an integral part of the financial statements.
46 Growth Strategy Fund
Russell Investment Funds
Growth Strategy Fund
Statement of Operations — For the Period Ended December 31, 2013
| Amounts in thousands | | |
| Investment Income | | |
| Income distributions from Underlying Funds | $ | 4,014 |
| |
| Expenses | | |
| Advisory fees | | 336 |
| Administrative fees | | 84 |
| Custodian fees | | 19 |
| Transfer agent fees | | 7 |
| Professional fees | | 47 |
| Trustees’ fees | | 4 |
| Printing fees | | 38 |
| Miscellaneous | | 7 |
| Expenses before reductions | | 542 |
| Expense reductions | | (374) |
| Net expenses | | 168 |
| Net investment income (loss) | | 3,846 |
| |
| Net Realized and Unrealized Gain (Loss) | | |
| Net realized gain (loss) on: | | |
| Investments | | 922 |
| Capital gain distributions from Underlying Funds | | 3,140 |
| Net realized gain (loss) | | 4,062 |
| Net change in unrealized appreciation (depreciation) on investments | | 17,906 |
| Net realized and unrealized gain (loss) | | 21,968 |
| Net Increase (Decrease) in Net Assets from Operations | $ | 25,814 |
See accompanying notes which are an integral part of the financial statements.
Growth Strategy Fund 47
Russell Investment Funds
Growth Strategy Fund
Statements of Changes in Net Assets
| | For the Periods Ended December 31, |
| Amounts in thousands | 2013 | 2012 |
| Increase (Decrease) in Net Assets | | | | |
| Operations | | | | |
| Net investment income (loss) | $ | 3,846 | $ | 2,694 |
| Net realized gain (loss) | | 4,062 | | (785) |
| Net change in unrealized appreciation (depreciation) | | 17,906 | | 14,971 |
| Net increase (decrease) in net assets from operations | | 25,814 | | 16,880 |
| |
| Distributions | | | | |
| From net investment income | | (3,852) | | (2,688) |
| Net decrease in net assets from distributions | | (3,852) | | (2,688) |
| |
| Share Transactions* | | | | |
| Net increase (decrease) in net assets from share transactions | | 22,839 | | 19,484 |
| Total Net Increase (Decrease) in Net Assets | | 44,801 | | 33,676 |
| |
| Net Assets | | | | |
| Beginning of period | | 145,155 | | 111,479 |
| End of period | $ | 189,956 | $ | 145,155 |
| Undistributed (overdistributed) net investment income included in net assets | $ | 64 | $ | 70 |
* Share transaction amounts (in thousands) for the periods ended December 31, 2013 and December 31, 2012 were as follows:
| | | | | 2013 | | | 2012 | |
| | | | | Shares | | Dollars | | Shares | | | Dollars |
| |
| Proceeds from shares sold | | | | 2,991 | $ | 28,562 | | 3,017 | | $ | 25,939 |
| Proceeds from reinvestment of distributions | | | | 391 | | 3,852 | | 306 | | | 2,689 |
| Payments for shares redeemed | | | | (994) | | (9,575) | | (1,059) | | | (9,144) |
| Total increase (decrease) | | | | 2,388 | $ | 22,839 | | 2,264 | | $ | 19,484 |
| | | | | | | | | | | | |
See accompanying notes which are an integral part of the financial statements.
48 Growth Strategy Fund
(This page intentionally left blank)
Russell Investment Funds
Growth Strategy Fund
Financial Highlights — For the Periods Ended
| For a Share Outstanding Throughout Each Period. | | | | | | | |
| | | | $ | | | | | | | | |
| | | $ | Net | | $ | | $ | | $ | | $ |
| | | Net Asset Value, | Investment | | Net Realized | | Total from | | Distributions | | Distributions |
| | | Beginning of | Income(Loss)(a) | | and Unrealized | | Investment | | from Net | | from Net |
| | | Period | (b)(d) | | Gain (Loss) | | Operations | Investment Income | | Realized Gain |
| December 31, 2013 | | 8 . 97 | . 22 | | 1 . 26 | | 1 . 48 | | ( . 22) | | — |
| December 31, 2012 | | 8 . 01 | . 18 | | . 95 | | 1 . 13 | | ( . 17) | | — |
| December 31, 2011 | | 8 . 57 | . 17 | | ( . 57) | | ( . 40) | | ( . 16) | | — |
| December 31, 2010 | | 7 . 66 | . 23 | | . 91 | | 1 . 14 | | ( . 22) | | — |
| December 31, 2009 | | 6 . 11 | . 19 | | 1 . 56 | | 1 . 75 | | ( . 17) | | ( . 03) |
See accompanying notes which are an integral part of the financial statements.
50 Growth Strategy Fund
| | | | | | | | | | | | | |
| | | | | | % | | % | % | |
| | | $ | | $ | Ratio of Expenses | Ratio of Expenses | Ratio of Net | |
| $ | $ | Net Asset Value, | % | Net Assets, | to Average | to Average | Investment Income | % |
| Return of | Total | End of | Total | End of Period | Net Assets, | Net Assets, | to Average Net | Portfolio |
| Capital | Distributions | Period | Return(e) | (000) | Gross(c) | Net(c)(d) | Assets(b)(d) | Turnover Rate |
| — | ( . 22) | 10 . 23 | 16 . 56 | 189,956 | . 32 | | . 10 | 2 . 29 | 12 |
| — | ( . 17) | 8 . 97 | 14 . 22 | 145,155 | . 34 | | . 10 | 2 . 07 | 25 |
| — | ( . 16) | 8 . 01 | (4 . 73) | 111,479 | . 34 | | . 10 | 2 . 02 | 10 |
| ( . 01) | ( . 23) | 8 . 57 | 15 . 06 | 90,592 | . 39 | | . 10 | 2 . 88 | 29 |
| — | ( . 20) | 7 . 66 | 29 . 43 | 61,506 | . 40 | | . 09 | 2 . 80 | 6 |
See accompanying notes which are an integral part of the financial statements.
Growth Strategy Fund 51
Russell Investment Funds Equity Growth Strategy Fund
Portfolio Management Discussion and Analysis — December 31, 2013 (Unaudited)
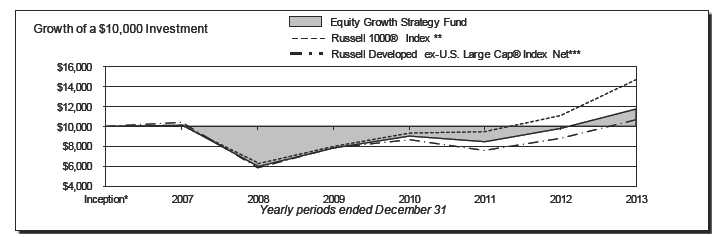
| Equity Growth Strategy Fund | | | Russell Developed ex-U. S. Large Cap® Index Net *** |
| | Total | | | Total |
| | Return | | | Return |
| 1 Year | 19 . 81% | | 1 Year | 21 . 68% |
| 5 Years | 14 . 37%§ | | 5 Years | 13 . 10%§ |
| Inception* | 2 . 43%§ | | Inception* | 1 . 04%§ |
| |
| |
| Russell 1000 ® Index ** | | | | | |
| | Total | | | | |
| | Return | | | | |
| 1 Year | 33 . 11% | | | | |
| 5 Years | 18 . 59%§ | | | | |
| Inception* | 5 . 92%§ | | | | |
52 Equity Growth Strategy Fund
Russell Investment Funds
Equity Growth Strategy Fund
Portfolio Management Discussion and Analysis, continued — December 31, 2013 (Unaudited)
| The Equity Growth Strategy Fund (the “Fund”) is a fund of funds | | 0.02% as measured by the Russell Emerging Markets Index. |
| that invests in other Russell Investment Funds and Russell | | U. S. equity markets benefited from an improving macroeconomic |
| Investment Company mutual funds (the “Underlying Funds”) . | | outlook and positive political developments through the year. The |
| The Underlying Funds employ a multi-manager approach whereby | | U. S. federal government’s avoidance of a “fiscal cliff” in January |
| portions of the Underlying Funds are allocated to different | | helped catalyze a strong start for U. S. equities in 2013. In non-U. S. |
| money managers. Underlying Fund assets not allocated to money | | markets, expansionary policies in Japan and positive economic |
| managers are managed by Russell Investment Management | | news in Europe were beneficial. In emerging markets, flat returns |
| Company (“RIMCo”), the Fund’s and Underlying Funds’ | | were generally driven by macroeconomic, political, and policy |
| advisor. RIMCo, as the Underlying Funds’ advisor, may change | | events. The anticipation of the Fed’s tapering of quantitative |
| the allocation of the Underlying Funds’ assets among money | | easing negatively impacted emerging market equities. |
| managers at any time. An exemptive order from the Securities | | Alternative asset classes generally fared well over the year, as |
| and Exchange Commission (“SEC”) permits RIMCo to engage or | | the S&P Global Infrastructure Index posted a 14.00% gain while |
| terminate a money manager in an Underlying Fund at any time, | | global real estate securities finished up 3.67% as measured by the |
| subject to approval by the Underlying Fund’s Board, without a | | FTSE EPRA/NAREIT Developed Index. However, infrastructure |
| shareholder vote. Pursuant to the terms of the exemptive order, an | | and global real estate generally lagged equities, as these interest |
| Underlying Fund is required to notify its shareholders within 90 | | rate sensitive asset classes were negatively impacted by the |
| days of when a money manager begins providing services. | | U. S. Federal Reserve’s (“Fed”) indication of potential tapering |
| What is the Fund’s investment objective? | | of its stimulus program earlier than markets had anticipated. |
| The Fund seeks to provide high long term capital appreciation. | | Commodity markets also struggled relative to equity markets as |
| | | the Dow Jones UBS Commodity Index lost 9.52% for the year, |
| How did the Fund perform relative to its benchmark for the | | hurt by softening demand in emerging markets such as China. |
| fiscal year ended December 31, 2013? | | Alternative strategies detracted from a benchmark relative |
| For the fiscal year ended December 31, 2013, the Equity Growth | | perspective, as the Russell Multi-Strategy Alternative Fund |
| Strategy Fund gained 19.81%. This is compared to the Fund’s | | also lagged the equity markets for the year. Overall, exposure to |
| primary benchmark, the Russell 1000 ® Index, which gained | | these alternative asset classes detracted from benchmark relative |
| 33.11% during the same period. The Fund’s performance includes | | performance. |
| operating expenses, whereas index returns are unmanaged and do | | Fixed income markets ended the year down, largely impacted by |
| not include expenses of any kind. | | a volatile interest rate environment. Interest rates sharply rose in |
| For the fiscal year ended December 31, 2013, the Lipper® Global | | the first half of the year off concerns of Fed tapering in the near |
| Core Funds Average (VIP), a group of funds that Lipper considers | | term, only to fall later in the year after a surprise announcement |
| to have investment strategies similar to those of the Fund, gained | | by the Fed that tapering would not occur in September as many |
| 25.43%. This result serves as a peer comparison and is expressed | | expected. Overall, exposure to fixed income hurt the Fund’s |
| net of operating expenses. | | benchmark relative performance. |
| |
| The Fund’s underperformance relative to the Russell 1000 ® Index | | How did the investment strategies and techniques employed |
| was primarily due to the Fund’s out-of-benchmark allocations to | | by the Fund and the Underlying Funds affect the Fund’s |
| non-U. S. equity, real assets and fixed income Underlying Funds, | | performance? |
| which generally underperformed the U. S. large cap equity market | | The Fund is a fund of funds and its performance is based on |
| as represented by the Russell 1000® Index. | | |
| | | RIMCo’s strategic asset allocations and the performance of the |
| How did the market conditions described in the Market | | Underlying Funds in which the Fund invests. |
| Summary report affect the Fund’s performance? | | The Fund’s strategic allocation to U. S. large cap and small cap |
| Global equity markets ended the fiscal year on a strong note, led | | Underlying Funds provided mixed results. Exposure to the |
| by the U. S. where markets gained 33.55% for the year as measured | | Aggressive Equity Fund benefited the Fund’s benchmark relative |
| by the Russell 3000 ® Index. Non-U. S. markets also finished up, | | performance, as U. S. small cap equities outperformed U. S. large |
| posting returns of 21.68% as measured by the Russell Developed | | cap equities and this Underlying Fund outperformed its small cap |
| ex-U. S. Large Cap Index, but lagged U. S. markets. The Fund’s | | primary benchmark. However, underlying active management |
| exposure to non-U. S. equities was a large driver to negative | | within the U. S. large cap equity Underlying Funds detracted, as |
| benchmark relative returns. In particular, exposure to emerging | | each underperformed its respective U. S. equity market segment |
| markets detracted, as emerging markets finished the year up | | as represented by its primary benchmark. For the Aggressive |
Equity Growth Strategy Fund 53
Russell Investment Funds
Equity Growth Strategy Fund
Portfolio Management Discussion and Analysis, continued — December 31, 2013 (Unaudited)
| Equity Fund, underweight exposure to high yielding sectors | | On February 1, 2013, the Fund tilted 1.25% away from the |
| such as REITs and utilities and overweight exposure to cyclicals | | Russell Global Opportunistic Credit Fund and 1.25% towards |
| contributed to positive performance. For the Multi-Style Equity | | the Russell Emerging Markets Fund to express a positive equity |
| Fund, stock selection within the health care sector detracted | | outlook relative to fixed income for the 2013 calendar year. |
| from the Fund’s performance. Strategic exposure to non-U. S. | | On June 18, 2013, the Fund tilted 1.25% away from the Russell |
| equity Underlying Funds detracted, as non-U. S. equities | | Commodity Strategies Fund and 1.25% towards the Russell |
| underperformed U. S. equities for the year. Underlying active | | Global Infrastructure Fund to express a negative near to medium |
| management was mixed, as the Russell Global Equity Fund | | term outlook for commodities and the desire to increase the Fund’s |
| and Non-U. S. Fund outperformed their benchmarks, while the | | equity beta exposure (beta is a measure of a portfolio’s volatility |
| Russell Emerging Markets fund underperformed its benchmark. | | and its sensitivity to the direction of the market) . |
| For the Non-U. S. Fund, exposure to companies with higher than | | |
| forecasted growth and overweight exposure to momentum was | | On July 5, 2013, the Fund partially removed its 2.00% underweight |
| beneficial to performance. An underweight position in materials | | to the Non-U. S. Fund by 1.00% and moved 1.00% underweight to |
| stocks also contributed. For the Russell Emerging Markets Fund, | | the Core Bond Fund, as the portfolio manager continued to expect |
| an underweight to Malaysia and Taiwan and an overweight to | | a positive equity market and a muted outlook on fixed income for |
| Turkey detracted. | | the second half of 2013. |
| The Fund’s strategic allocation to the Russell Global Opportunistic | | On October 7, 2013, the Fund tilted 1.25% away from the Global |
| Credit Fund negatively impacted the Fund’s benchmark relative | | Real Estate Securities Fund and 1.25% away from the Multi-Style |
| performance, as fixed income markets generally underperformed | | Equity Fund, while increasing the Non-U. S. Fund by 1.25% and |
| equities and the Russell Global Opportunistic Credit Fund | | the Russell Global Opportunistic Credit Fund by 1.00%. These |
| underperformed its benchmark. | | tilts were implemented to remove the negative outlook on the non- |
| | | U. S. developed equity markets and to move the Fund to a neutral |
| The Fund’s strategic allocation to alternative Underlying Funds | | equity and fixed income weight. The underweight to global real |
| detracted, though underlying active management was generally | | estate was taken to mitigate the Fund’s exposure in this interest |
| positive, with the exception of the Global Real Estate Securities | | rate sensitive asset class, given potential for rising interest rates |
| Fund. For the Global Real Estate Securities Fund, an underweight | | in the near term. |
| position taken in Japan detracted, as Japan was among the | | |
| stronger performing markets. Other detractors included an out of | | On October 9, 2013, the Fund tilted 1.25% away from the |
| benchmark exposure to Brazil and stock selection in Hong Kong. | | Aggressive Equity Fund and 1.25% towards the Russell Global |
| | | Opportunistic Credit Fund, bringing these allocations back to |
| Describe any changes to the Fund’s structure or allocation | | policy weight. This tilt was driven by a more cautious outlook on |
| to the Underlying Funds. | | equity markets for the remainder of the year, particularly small |
| RIMCo has the discretion to modify the target strategic asset | | cap equities, which have performed strongly for the year. |
| allocation of the Fund by up to +/- 3% at the equities, fixed income | | |
| or alternative category level based on RIMCo’s assessment of | | The views expressed in this report reflect those of the |
| relative market valuation of the asset classes represented by each | | portfolio managers only through the end of the period |
| Underlying Fund. Performance of the Fund’s short-term asset | | covered by the report. These views do not necessarily |
| allocation modifications ended the fiscal year positively. | | represent the views of RIMCo, or any other person in RIMCo |
| | | or any other affiliated organization. These views are |
| Entering the fiscal year, the Fund maintained its underweight to | | subject to change at any time based upon market conditions |
| the Non-U. S. Fund at 2.25% below the target strategic allocation | | or other events, and RIMCo disclaims any responsibility to |
| and its overweight to the Multi-Style Equity Fund at 2.25% above | | update the views contained herein. These views should not |
| the target strategic allocation given mitigation of large tail risk by | | be relied on as investment advice and, because investment |
| positive European Central Bank and Fed policy announcements, | | decisions for a Russell Investment Funds (“RIF”) Fund are |
| but continued economic concerns over Europe. | | based on numerous factors, should not be relied on as an |
| | | indication of investment decisions of any RIF Fund. |
54 Equity Growth Strategy Fund
Russell Investment Funds
Equity Growth Strategy Fund
Portfolio Management Discussion and Analysis, continued — December 31, 2013 (Unaudited)
| * | Assumes initial investment on April 30, 2007. |
| ** | The Russell 1000® Index includes the 1,000 largest companies in the Russell 3000® Index. The Russell 1000® Index represents the universe of stocks from which most active money managers typically select. The Russell 1000® Index return reflects adjustments from income dividends and capital gain distributions reinvested as of the ex-dividend dates. |
| *** | The Russell Developed ex-U. S. Large Cap® Index (net of tax on dividends from foreign holdings) is an index which offers investors access to the large-cap segment of the global equity market, excluding companies assigned to the United States. It is constructed to provide a comprehensive and unbiased barometer for the large-cap segment and is completely reconstituted annually to accurately reflect the changes in the market over time. |
| § | Annualized. |
The performance shown in this section does not reflect any Insurance Company Separate Account or Policy Charges. Performance is historical and assumes reinvestment of all dividends and capital gains. Investment return and principal value will fluctuate so that an investor’s shares, when redeemed, may be worth more or less than when purchased. Past performance is not indicative of future results.
Equity Growth Strategy Fund 55
Russell Investment Funds
Equity Growth Strategy Fund
Shareholder Expense Example — December 31, 2013 (Unaudited)
| Fund Expenses | | Please note that the expenses shown in the table are meant |
| The following disclosure provides important information | | to highlight your ongoing costs only and do not reflect any |
| regarding the Fund’s Shareholder Expense Example | | transactional costs. Therefore, the information under the heading |
| (“Example”) . | | “Hypothetical Performance (5% return before expenses)” is |
| | | useful in comparing ongoing costs only, and will not help you |
| Example | | determine the relative total costs of owning different funds. In |
| As a shareholder of the Fund, you incur two types of costs: (1) | | addition, if these transactional costs were included, your costs |
| transaction costs, and (2) ongoing costs, including advisory and | | would have been higher. The fees and expenses shown in this |
| administrative fees and other Fund expenses. The Example is | | section do not reflect any Insurance Company Separate Account or Policy Charges. |
| intended to help you understand your ongoing costs (in dollars) | | | | | | | | | | | | |
| of investing in the Fund and to compare these costs with the | | | | | | | | | | | Hypothetical |
| ongoing costs of investing in other mutual funds. The Example | | | | | | | Actual | | | | Performance (5% |
| is based on an investment of $1,000 invested at the beginning of | | | | | | | Performance | | | | return before expenses) |
| the period and held for the entire period indicated, which for this | | | | | | | | | | | |
| | | Beginning Account Value | | | | | | | | | | |
| Fund is from July 1, 2013 to December 31, 2013. | | July 1, 2013 | | | | $ | 1,000.00 | | | | $ | 1,000.00 |
| Actual Expenses | | Ending Account Value | | | | | | | | | | |
| | | December 31, 2013 | | | | $ | 1,138.10 | | | | $ | 1,024.70 |
| The information in the table under the heading “Actual | | Expenses Paid During Period* | | | | $ | 0.54 | | | | $ | 0.51 |
| Performance” provides information about actual account values | | | | | | | | | | | | |
| and actual expenses. You may use the information in this column, | | * Expenses are equal to the Fund's annualized expense ratio of 0.10% |
| | | (representing the six month period annualized), multiplied by the average |
| together with the amount you invested, to estimate the expenses | | account value over the period, multiplied by 184/365 (to reflect the one-half year |
| that you paid over the period. Simply divide your account value by | | period) . May reflect amounts waived, reimbursed and/or other credits. Without |
| $1,000 (for example, an $8,600 account value divided by $1,000 | | any waivers, reimbursements and/or other credits, expenses would have been |
| = 8.6), then multiply the result by the number in the first column | | higher. | | | | | | | | | | |
| in the row entitled “Expenses Paid During Period” to estimate | | | | | | | | | | | | |
| the expenses you paid on your account during this period. | | | | | | | | | | | | |
| |
| Hypothetical Example for Comparison Purposes | | | | | | | | | | | | |
| The information in the table under the heading “Hypothetical | | | | | | | | | | | | |
| Performance (5% return before expenses)” provides information | | | | | | | | | | | | |
| about hypothetical account values and hypothetical expenses | | | | | | | | | | | | |
| based on the Fund’s actual expense ratio and an assumed rate of | | | | | | | | | | | | |
| return of 5% per year before expenses, which is not the Fund’s | | | | | | | | | | | | |
| actual return. The hypothetical account values and expenses | | | | | | | | | | | | |
| may not be used to estimate the actual ending account balance or | | | | | | | | | | | | |
| expenses you paid for the period. You may use this information | | | | | | | | | | | | |
| to compare the ongoing costs of investing in the Fund and other | | | | | | | | | | | | |
| funds. To do so, compare this 5% hypothetical example with the | | | | | | | | | | | | |
| 5% hypothetical examples that appear in the shareholder reports | | | | | | | | | | | | |
| of other funds. | | | | | | | | | | | | |
56 Equity Growth Strategy Fund
Russell Investment Fund
Equity Growth Strategy Fund
Schedule of Investments — December 31, 2013
| Amounts in thousands (except share amounts) | | | | Amounts in thousands (except share amounts) | | |
| |
| | | | | | | Fair | | | | | | | | | Fair |
| | | | | | | Value | | | | | | | | | Value |
| | | | | Shares | | $ | | | | | | Shares | | $ |
| Investments 100.0% | | | | | | | | RIF Multi-Style Equity Fund | | | | 353,844 | | | 6,670 |
| Russell Investment Company | | | | | | | | | | | | | | | 16,900 |
| ("RIC") and other Russell | | | | | | | | Fixed Income - 4.9% | | | | | | | |
| Investment Funds ("RIF") Series | | | | | | | | RIC Russell Global Opportunistic Credit | | | | | | | |
| Mutual Funds | | | | | | | | Fund Class Y | | | | 248,034 | | | 2,460 |
| |
| Alternative Funds - 18.5% | | | | | | | | | | | | | | | |
| RIC Russell Commodity Strategies Fund | | | | | | | | International Equities - 43.0% | | | | | | | |
| Class Y | | | | 276,726 | | 2,336 | | RIC Russell Emerging Markets Fund | | | | | | | |
| RIC Russell Global Infrastructure Fund | | | | | | | | Class Y | | | | 214,121 | | | 3,854 |
| Class Y | | | | 223,388 | | 2,631 | | RIC Russell Global Equity Fund Class Y | | | | 573,629 | | | 6,556 |
| RIC Russell Multi-Strategy Alternative | | | | | | | | RIF Non-U. S. Fund | | | | 907,271 | | | 11,178 |
| Fund Class Y | | | | 240,079 | | 2,487 | | | | | | | | | 21,588 |
| RIF Global Real Estate Securities Fund | | | | 127,218 | | 1,868 | | | | | | | | | |
| | | | | | | 9,322 | | Total Investments 100.0% | | | | | | | |
| Domestic Equities - 33.6% | | | | | | | | (identified cost $38,641) | | | | | | | 50,270 |
| |
| RIC Russell U. S. Defensive Equity Fund | | | | | | | | Other Assets and Liabilities, | | | | | | | |
| Class Y | | | | 65,731 | | 2,762 | | | | | | | | | |
| RIC Russell U. S. Dynamic Equity Fund | | | | | | | | Net - (0.0%) | | | | | | | (16) |
| |
| Class Y | | | | 408,739 | | 4,815 | | Net Assets - 100.0% | | | | | | | 50,254 |
| RIF Aggressive Equity Fund | | | | 157,188 | | 2,653 | | | | | | | | | |
Presentation of Portfolio Holdings
| | % of Net | |
| Categories | Assets | |
| Alternative Funds | 18 . 5 | |
| Domestic Equities | 33 . 6 | |
| Fixed Income | 4 . 9 | |
| International Equities | 43 . 0 | |
| Total Investments | 100 . 0 | |
| Other Assets and Liabilities, Net | (—*) |
| | 100 . 0 | |
| |
| * Less than . 05% of net assets. | | |
See accompanying notes which are an integral part of the financial statements.
Equity Growth Strategy Fund 57
Russell Investment Funds
Equity Growth Strategy Fund
Statement of Assets and Liabilities — December 31, 2013
| Amounts in thousands | | |
| Assets | | |
| Investments, at identified cost | $ | 38,641 |
| Investments, at fair value | | 50,270 |
| Receivables: | | |
| Fund shares sold | | 2 |
| From affiliates | | 7 |
| Total assets | | 50,279 |
| Liabilities | | |
| Payables: | | |
| Investments purchased | | 1 |
| Fund shares redeemed | | 1 |
| Accrued fees to affiliates | | 2 |
| Other accrued expenses | | 21 |
| Total liabilities | | 25 |
| Net Assets | $ | 50,254 |
| Net Assets Consist of: | | |
| Undistributed (overdistributed) net investment income | $ | 49 |
| Accumulated net realized gain (loss) | | (4,011) |
| Unrealized appreciation (depreciation) on investments | | 11,629 |
| Shares of beneficial interest | | 52 |
| Additional paid-in capital | | 42,535 |
| Net Assets | $ | 50,254 |
| Net Asset Value, offering and redemption price per share: | | |
| Net asset value per share: (#) | $ | 9 . 60 |
| Net assets | $ | 50,253,890 |
| Shares outstanding ($. 01 par value) | | 5,233,648 |
| (#) Net asset value per share equals net assets divided by shares of beneficial interest outstanding. | | |
See accompanying notes which are an integral part of the financial statements.
58 Equity Growth Strategy Fund
Russell Investment Funds
Equity Growth Strategy Fund
Statement of Operations — For the Period Ended December 31, 2013
| Amounts in thousands | | |
| Investment Income | | |
| Income distributions from Underlying Funds | $ | 1,192 |
| |
| Expenses | | |
| Advisory fees | | 90 |
| Administrative fees | | 23 |
| Custodian fees | | 18 |
| Transfer agent fees | | 2 |
| Professional fees | | 37 |
| Trustees’ fees | | 1 |
| Printing fees | | 10 |
| Miscellaneous | | 6 |
| Expenses before reductions | | 187 |
| Expense reductions | | (142) |
| Net expenses | | 45 |
| Net investment income (loss) | | 1,147 |
| |
| Net Realized and Unrealized Gain (Loss) | | |
| Net realized gain (loss) on: | | |
| Investments | | 488 |
| Capital gain distributions from Underlying Funds | | 989 |
| Net realized gain (loss) | | 1,477 |
| Net change in unrealized appreciation (depreciation) on investments | | 5,517 |
| Net realized and unrealized gain (loss) | | 6,994 |
| Net Increase (Decrease) in Net Assets from Operations | $ | 8,141 |
See accompanying notes which are an integral part of the financial statements.
Equity Growth Strategy Fund 59
Russell Investment Funds
Equity Growth Strategy Fund
Statements of Changes in Net Assets
| | | For the Periods Ended December 31, |
| Amounts in thousands | | 2013 | 2012 |
| Increase (Decrease) in Net Assets | | | | | |
| Operations | | | | | |
| Net investment income (loss) | | $ | 1,147 | $ | 661 |
| Net realized gain (loss) | | | 1,477 | | 27 |
| Net change in unrealized appreciation (depreciation) | | | 5,517 | | 4,502 |
| Net increase (decrease) in net assets from operations | | | 8,141 | | 5,190 |
| |
| Distributions | | | | | |
| From net investment income | | | (1,148) | | (652) |
| Net decrease in net assets from distributions | | | (1,148) | | (652) |
| |
| Share Transactions* | | | | | |
| Net increase (decrease) in net assets from share transactions | | | 4,121 | | 3,757 |
| Total Net Increase (Decrease) in Net Assets | | | 11,114 | | 8,295 |
| |
| Net Assets | | | | | |
| Beginning of period | | | 39,140 | | 30,845 |
| End of period | | $ | 50,254 | $ | 39,140 |
| Undistributed (overdistributed) net investment income included in net assets | | $ | 49 | $ | 50 |
* Share transaction amounts (in thousands) for the periods ended December 31, 2013 and December 31, 2012 were as follows:
| | | | 2013 | | | | | 2012 | |
| | | | Shares | | | Dollars | | | | Shares | | | Dollars |
| |
| Proceeds from shares sold | | | 894 | | $ | 7,903 | | | | 1,330 | | $ | 10,387 |
| Proceeds from reinvestment of distributions | | | 125 | | | 1,148 | | | | 81 | | | 652 |
| Payments for shares redeemed | | | (554) | | | (4,930) | | | | (915) | | | (7,282) |
| Total increase (decrease) | | | 465 | | $ | 4,121 | | | | 496 | | $ | 3,757 |
| | | | | | | | | | | | | | |
See accompanying notes which are an integral part of the financial statements.
60 Equity Growth Strategy Fund
(This page intentionally left blank)
Russell Investment Funds
Equity Growth Strategy Fund
Financial Highlights — For the Periods Ended
| For a Share Outstanding Throughout Each Period. | | | | | | | | | |
| |
| | | | | $ | | | $ | | | $ | | $ | | $ | | $ |
| | | Net Asset Value, | | Net Investment | | Net Realized | | Total from | | Distributions | | Distributions |
| | | | | Beginning of | | Income(Loss) (a) | | and Unrealized | | Investment | | from Net | | from Net |
| | | | | Period | | | (b)(d) | | Gain (Loss) | | Operations | Investment Income | | Realized Gain |
| December 31, 2013 | | | | 8 . 21 | | | . 23 | | | 1 . 39 | | 1 . 62 | | ( . 23) | | — |
| December 31, 2012 | | | | 7 . 22 | | | . 15 | | | . 98 | | 1 . 13 | | ( . 14) | | — |
| December 31, 2011 | | | | 7 . 82 | | | . 13 | | | ( . 61) | | ( . 48) | | ( . 12) | | — |
| December 31, 2010 | | | | 6 . 98 | | | . 14 | | | . 91 | | 1 . 05 | | ( . 15) | | — |
| December 31, 2009 | | | | 5 . 42 | | | . 12 | | | 1 . 56 | | 1 . 68 | | ( . 09) | | ( . 03) |
See accompanying notes which are an integral part of the financial statements.
62 Equity Growth Strategy Fund
| | | | | | | | | | | | |
| | | | | | % | % | % | |
| | | $ | | $ | Ratio of Expenses | Ratio of Expenses | Ratio of Net | |
| $ | $ | Net Asset Value, | % | Net Assets, | to Average | to Average | Investment Income | % |
| Return of | Total | End of | Total | End of Period | Net Assets, | Net Assets, | to Average Net | Portfolio |
| Capital | Distributions | Period | Return(e) | (000) | Gross(c) | Net(c)(d) | Assets(b)(d) | Turnover Rate |
| — | ( . 23) | 9 . 60 | 19 . 81 | 50,254 | . 41 | . 10 | 2 . 55 | 17 |
| — | ( . 14) | 8 . 21 | 15 . 68 | 39,140 | . 44 | . 10 | 1 . 79 | 37 |
| — | ( . 12) | 7 . 22 | (6 . 22) | 30,845 | . 49 | . 10 | 1 . 72 | 15 |
| ( . 06) | ( . 21) | 7 . 82 | 15 . 09 | 26,816 | . 53 | . 10 | 1 . 89 | 42 |
| — | ( . 12) | 6 . 98 | 31 . 79 | 20,057 | . 59 | . 08 | 2 . 02 | 21 |
See accompanying notes which are an integral part of the financial statements.
Equity Growth Strategy Fund 63
Russell Investment Funds
LifePoints® Funds Variable Target Portfolio Series
Notes to Financial Highlights — December 31, 2013
| (a) | Average daily shares outstanding were used for this calculation. |
| (b) | Recognition of net investment income by the Fund is affected by the timing of the declaration of dividends by the Underlying Funds in which the Fund invests. |
| (c) | The calculation includes only those expenses charged directly to the Fund and does not include expenses charged to the Underlying Funds in which the Fund invests. |
| (d) | May reflect amounts waived and reimbursed by Russell Investment Management Company (“RIMCo”) . |
| (e) | The total return does not reflect any Insurance Company Separate Account or Policy Charges. |
64 Notes to Financial Highlights
Russell Investment Funds
LifePoints® Funds Variable Target Portfolio Series
Notes to Financial Statements — December 31, 2013
1. Organization
Russell Investment Funds (the “Investment Company” or “RIF”) is a series investment company with 9 different investment portfolios referred to as Funds. These financial statements report on four of these Funds (each a “Fund” and collectively the “Funds”). The Investment Company provides the investment base for one or more variable insurance products issued by one or more insurance companies. These Funds are offered at net asset value to qualified insurance company separate accounts offering variable insurance products. The Investment Company is registered under the Investment Company Act of 1940, as amended, as an open-end management investment company. It is organized and operates as a Massachusetts business trust under an Amended and Restated Master Trust Agreement dated October 1, 2008, as amended (“Master Trust Agreement”). The Investment Company’s Master Trust Agreement permits the Board of Trustees (the “Board”) to issue an unlimited number of shares of beneficial interest.
Each of the Funds is a “fund of funds” and diversifies its assets by investing, at present, in Shares of several other Russell Investment Company (“RIC”) Funds and other of the Investment Company’s Funds (together, the “Underlying Funds”). Each Fund seeks to achieve its specific investment objective by investing in different combinations of the Underlying Funds. Each Fund currently intends to invest only in the Underlying Funds. Each Fund intends its strategy of investing in combinations of equity, fixed income and alternative Underlying Funds to result in investment diversification that an investor could otherwise achieve only by holding numerous individual investments. Russell Investment Management Company (“RIMCo”), the Funds’ investment adviser, may modify the target asset allocation for any Fund including changes to the Underlying Funds in which a Fund invests from time to time based on capital markets research or on factors such as RIMCo’s outlook for the economy, financial markets generally and/or relative market valuation of the asset classes represented by each Underlying Fund. Modifications in the allocations to the Underlying Funds are typically based on strategic, long-term allocation decisions. A Fund’s actual allocation may vary from the target strategic asset allocation at any point in time (1) due to market movements, (2) by up to +/- 3% at the equity, fixed income or alternative category level based on RIMCo’s assessment of relative market valuation of the asset classes represented by each Underlying Fund, and/or (3) due to the implementation over a period of time of a change to the target strategic asset allocation including the addition of a new Underlying Fund. There may be no changes in the asset allocation or to the Underlying Funds in a given year or such changes may be made one or more times in a year. In the future, the Funds may also invest in other Underlying Funds that pursue investment strategies not pursued by the current Underlying Funds or represent asset classes which are not currently represented by the Underlying Funds.
The following table shows the Underlying Funds in which each Fund invests and the target strategic asset allocation effective May 1, 2013 to each Underlying Fund.
| | | | | | | | |
| | Asset Allocation Targets as of May 1, 2013* |
| | Moderate | Balanced | Growth | Equity Growth |
| Underlying Funds | Strategy Fund | Strategy Fund | Strategy Fund | Strategy Fund |
| Alternative Funds** | | | | |
| RIC Russell Commodity Strategies Fund | 0-8% | 0-9% | 0-11% | 1-11% |
| RIC Russell Global Infrastructure Fund | 0-8 | 0-8 | 0-9 | 0-9 |
| RIC Russell Multi-Strategy Alternative Fund | 0-8 | 0-8 | 0-9 | 0-10 |
| RIF Global Real Estate Securities Fund | 0-8 | 0-8 | 0-9 | 0-10 |
| Domestic Equity Funds | | | | |
| RIC Russell U. S. Defensive Equity Fund | 0-9 | 1-10 | 1-10 | 1-11 |
| RIC Russell U. S. Dynamic Equity Fund | 0-7 | 1-11 | 1-11 | 4-14 |
| RIF Aggressive Equity Fund | 0-7 | 0-9 | 1-11 | 2-12 |
| RIF Multi-Style Equity Fund | 0-9 | 2-12 | 5-15 | 7-17 |
| Fixed Income Funds | | | | |
| RIC Russell Global Opportunistic Credit Fund | 0-8 | 0-8 | 0-9 | 0-10 |
| RIC Russell Investment Grade Bond Fund | 15-25 | 0 | 0 | 0 |
| RIF Core Bond Fund | 31-41 | 30-40 | 10-20 | 0 |
| International Equity Funds | | | | |
| RIC Russell Emerging Markets Fund | 0-8 | 0-9 | 0-10 | 1-11 |
| RIC Russell Global Equity Fund | 2-12 | 4-14 | 8-18 | 8-18 |
| RIF Non-U. S. Fund | 3-13 | 9-19 | 13-23 | 17-27 |
| * | Prospectus dated May 1, 2013. |
| ** | Alternative Funds pursue investment strategies that differ from those of traditional broad market equity or fixed income funds or seek returns with a low |
correlation to global equity markets.
Notes to Financial Statements 65
Russell Investment Funds
LifePoints® Funds Variable Target Portfolio Series
Notes to Financial Statements, continued — December 31, 2013
2. Significant Accounting Policies
The Funds’ financial statements are prepared in accordance with U.S. generally accepted accounting principles (“U.S. GAAP”) which require the use of management estimates and assumptions at the date of the financial statements. Actual results could differ from those estimates. The following is a summary of the significant accounting policies consistently followed by each Fund in the preparation of its financial statements.
Security Valuation
The Funds value their portfolio securities, the shares of the Underlying Funds, at the current net asset value per share of each Underlying Fund.
Fair value of securities is defined as the price that the Funds would receive upon selling an investment in a timely transaction to an independent buyer in the principal or most advantageous market for the investment. To increase consistency and comparability in fair value measurement, the fair value hierarchy was established to maximize the use of observable market data and minimize the use of unobservable inputs and to establish classification of fair value measurements for disclosure purposes. Inputs refer broadly to the assumptions that market participants would use in pricing the asset or liability, including assumptions about risk (e.g., the risk inherent in a particular valuation technique, such as a pricing model or the risks inherent in the inputs to a particular valuation technique). Inputs may be observable or unobservable. Observable inputs are inputs that reflect the assumptions market participants would use in pricing the asset or liability developed based on market data obtained from sources independent of the reporting entity. Unobservable inputs are inputs that reflect the reporting entity’s own assumptions about the assumptions market participants would use in pricing the asset or liability developed based on the best information available in the circumstances.
The fair value hierarchy of inputs is summarized in the three broad levels listed below.
| • | Level 1 — Quoted prices (unadjusted) in active markets or exchanges for identical assets and liabilities. |
| • | Level 2 — Inputs other than quoted prices included within Level 1 that are observable, which may include, but are not |
| | limited to, quoted prices for similar assets or liabilities in markets that are active, quoted prices for identical or similar assets |
| | or liabilities in markets that are not active, inputs such as interest rates, yield curves, implied volatilities, credit spreads or |
| | other market corroborated inputs. |
| • | Level 3 — Significant unobservable inputs based on the best information available in the circumstances, to the extent |
| | observable inputs are not available, which may include assumptions made by Russell Fund Services Company, acting at the |
| | discretion of the Board, that are used in determining the fair value of investments. |
The levels associated with valuing the Funds’ investments for the period ended December 31, 2013 were Level 1 for all Funds.
Investment Transactions
Investment transactions are reflected as of the trade date for financial reporting purposes. This may cause the net asset value stated in the financial statements to be different from the net asset value at which shareholders may transact. Realized gains and losses from securities transactions, if applicable, are recorded on the basis of specific identified cost.
Investment Income
Distributions of income and capital gains from the Underlying Funds are recorded on the ex-dividend date.
Federal Income Taxes
Since the Investment Company is a Massachusetts business trust, each Fund is a separate corporate taxpayer and determines its net investment income and capital gains (or losses) and the amounts to be distributed to each Fund’s shareholders without regard to the income and capital gains (or losses) of the other Funds.
For each year, each Fund intends to qualify as a regulated investment company under sub-chapter M of the Internal Revenue Code (the “Code”) and intends to distribute all of its taxable income and capital gains. Therefore, no federal income tax provision is required for the Funds.
The Funds comply with the authoritative guidance for uncertainty in income taxes which requires management to determine whether a tax position of the Funds is more likely than not to be sustained upon examination, including resolution of any related appeals or litigation processes, based on the technical merits of the position. For tax positions meeting the more likely than not threshold, the tax amount recognized in the financial statements is reduced by the largest benefit that has a greater than 50% likelihood of being realized upon ultimate settlement with the relevant taxing authority. Management determined that no accruals need to be made in
66 Notes to Financial Statements
Russell Investment Funds
LifePoints® Funds Variable Target Portfolio Series
Notes to Financial Statements, continued — December 31, 2013
the financial statements due to uncertain tax positions. Management continually reviews and adjusts the Funds’ liability for income taxes based on analyses of tax laws and regulations, as well as their interpretations, and other relevant factors.
Each Fund files a U.S. tax return. At December 31, 2013, the Funds had recorded no liabilities for net unrecognized tax benefits relating to uncertain income tax positions they have taken or expect to take in future tax returns. While the statute of limitations remains open to examine the Funds’ U.S. tax returns filed for the fiscal years ended December 31, 2010 through December 31, 2012, no examinations are in progress or anticipated at this time. The Funds are not aware of any tax positions for which it is reasonably possible that the total amounts of unrecognized tax benefits will significantly change in the next twelve months.
Dividends and Distributions to Shareholders
Income dividends, capital gain distributions and return of capital, if any, are recorded on the ex-dividend date. Income dividends are generally declared and paid quarterly. Capital gain distributions are generally declared and paid annually. An additional distribution may be paid by the Funds to avoid imposition of federal income and excise tax on any remaining undistributed capital gains and net investment income.
The timing and characterization of certain income and capital gain distributions are determined in accordance with federal tax regulations which may differ from U.S. GAAP. As a result, net investment income and net realized gain (or loss) from investment transactions for a reporting period may differ significantly from distributions during such period. The differences between tax regulations and U.S. GAAP relate primarily to investments in the Underlying Funds sold at a loss, wash sale deferrals and capital loss carryforwards. Accordingly, the Funds may periodically make reclassifications among certain of their capital accounts without impacting their net asset values.
Expenses
Expenses included in the accompanying financial statements reflect the expenses of each Fund and do not include those expenses incurred by the Underlying Funds. Because the Underlying Funds have varied expense and fee levels and the Funds may own different proportions of the Underlying Funds at different times, the amount of the Underlying Funds’ fees and expenses incurred indirectly by the Funds will vary.
Guarantees
In the normal course of business, the Funds enter into contracts that contain a variety of representations which provide general indemnifications. The Funds’ maximum exposure under these arrangements is unknown as this would involve future claims that may be made against the Funds that have not yet occurred. However, the Funds expect the risk of loss to be remote.
Market, Credit and Counterparty Risk
In the normal course of business, the Underlying Funds trade financial instruments and enter into financial transactions where risk of potential loss exists due to changes in the market (market risk) or failure of the other party to a transaction to perform (credit risk). Similar to credit risk, the Underlying Funds may also be exposed to counterparty risk or the risk that an institution or other entity with which the Underlying Funds have unsettled or open transactions will default. The potential loss could exceed the value of the relevant assets recorded in the Underlying Funds’ financial statements (the “Assets”). The Assets consist principally of cash due from counterparties and investments. The extent of the Underlying Funds’ exposure to market, credit and counterparty risks with respect to the Assets approximates their carrying value as recorded in the Underlying Funds’ Statements of Assets and Liabilities.
Global economies and financial markets are becoming increasingly interconnected and political and economic conditions (including recent instability and volatility) and events (including natural disasters) in one country, region or financial market may adversely impact issuers in a different country, region or financial market. As a result, issuers of securities held by an Underlying Fund may experience significant declines in the value of their assets and even cease operations. Such conditions and/or events may not have the same impact on all types of securities and may expose an Underlying Fund to greater market and liquidity risk and potential difficulty in valuing portfolio instruments held by an Underlying Fund. This could cause an Underlying Fund to underperform other types of investments.
Notes to Financial Statements 67
Russell Investment Funds
LifePoints® Funds Variable Target Portfolio Series
Notes to Financial Statements, continued — December 31, 2013
| 3 . Investment Transactions | | | | | | |
| |
| Securities | | | | | | |
| During the period ended December 31, 2013, purchases and sales of the Underlying Funds (excluding short-term |
| were as follows: | | | | | | |
| | | | | Purchases | | | Sales |
| Moderate Strategy Fund | | $ | 22,617,439 | $ | | 17,649,204 |
| Balanced Strategy Fund | | | 59,077,101 | �� | | 30,861,244 |
| Growth Strategy Fund | | | 45,958,292 | | | 19,986,388 |
| Equity Growth Strategy Fund | | | 12,805,622 | | | 7,697,967 |
| 4 . Related Party Transactions, Fees and Expenses | | | | |
| |
| Adviser, Administrator, Transfer and Dividend Disbursing Agent | | |
| RIMCo advises the Funds and Russell Fund Services Company (“RFSC”) is the Funds’ administrator and transfer and disbursing |
| agent. RFSC is a wholly-owned subsidiary of RIMCo. RIMCo is a wholly-owned subsidiary of Frank Russell Company (a subsidiary |
| of The Northwestern Mutual Life Insurance Company) . Frank Russell Company provides ongoing money manager research and |
| trade placement services to RIF and RIMCo. | | | | | | | |
| The advisory fee of 0.20% and administrative fee of up to 0.05% are based upon the average daily net assets of the Funds and are |
| payable monthly. The following shows the total amount of each of these fees paid by the Funds for the period ended December 31, |
| 2013 | . | | | | | | | | | |
| | | | | | Advisory | | | | Administrative |
| Moderate Strategy Fund | | $ | | 200,153 | | | $ | | 50,030 |
| Balanced Strategy Fund | | | | 559,471 | | | | | 139,844 |
| Growth Strategy Fund | | | | 336,076 | | | | | 84,006 |
| Equity Growth Strategy Fund | | | | 90,068 | | | | | 22,513 |
| RIMCo has contractually agreed, until April 30, 2014, to waive up to the full amount of its 0.20% advisory fee and then reimburse |
| each Fund for other Fund level direct expenses to the extent that direct Fund level expenses exceed 0.10% of the average daily net |
| assets of the Fund on an annual basis. Direct Fund level expenses do not include extraordinary expenses or the expenses of other |
| investment companies in which the Funds invest, including the Underlying Funds, which are borne indirectly by the Funds. These |
| waivers and reimbursements may not be terminated during the relevant period except with Board approval. |
| For the period ended December 31, 2013, RIMCo waived/reimbursed the following expenses: | | | | |
| | | | | Waiver | | Reimbursement | | | | Total |
| Moderate Strategy Fund | | $ | | 200,153 | | $ | | 49,521 | | $ | | 249,674 |
| Balanced Strategy Fund | | | | 559,471 | | | | 30,090 | | | | 589,561 |
| Growth Strategy Fund | | | | 336,076 | | | | 37,950 | | | | 374,026 |
| Equity Growth Strategy Fund | | | | 90,068 | | | | 51,612 | | | | 141,680 |
| RIMCo does not have the ability to recover amounts waived or reimbursed from previous periods. |
| RFSC is paid a fee based upon the average daily net assets of the Funds for transfer agency and dividend disbursing services. RFSC |
| retains a portion of this fee for its services provided to the Funds and pays the balance to unaffiliated agents who assist in providing |
| these services. The following shows the total amount of the fees paid by the Funds for the period ended December 31, 2013: |
| | | | Amount |
| Moderate Strategy Fund | | $ | 4,403 |
| Balanced Strategy Fund | | | 12,308 |
| Growth Strategy Fund | | | 7,394 |
| Equity Growth Strategy Fund | | | 1,981 |
68 Notes to Financial Statements
Russell Investment Funds
LifePoints® Funds Variable Target Portfolio Series
Notes to Financial Statements, continued — December 31, 2013
Distributor
Russell Financial Services, Inc. (the “Distributor”), a wholly-owned subsidiary of RIMCo, is the distributor for the Investment Company pursuant to a distribution agreement with the Investment Company. The Distributor receives no compensation from the Investment Company for its services.
Accrued Fees Payable to Affiliates
Accrued fees payable to affiliates for the period ended December 31, 2013 were as follows:
| | Moderate Strategy Fund | Balanced Strategy Fund | Growth Strategy Fund | Equity Growth Strategy Fund |
| Administration fees | $ 4,284 | $ 12,532 | $ 7,773 | $2,044 |
| Transfer agent fees | 378 | 1,106 | 684 | 181 |
| Trustee fees | 434 | 1,129 | 631 | 180 |
| | $ 5,096 | $14,767 | $ 9,088 | $2,405 |
Board of Trustees
The Russell Fund Complex consists of RIC, which has 37 funds, RIF, which has 9 funds, and Russell Exchange Traded Funds Trust (“RET”) which has 1 fund. Each of the Trustees is a Trustee of RIC, RIF and RET. During the period, the Russell Fund Complex paid each of its independent Trustees a retainer of $87,000 per year (effective January 1, 2014, $96,000); each of its interested Trustees a retainer of $75,000 per year; and each Trustee $7,000 for each regularly scheduled meeting attended in person and $3,500 for each special meeting and the Annual 38a-1 meeting attended in person, and for each Audit Committee meeting, Nominating and Governance Committee meeting, Investment Committee meeting or any other committee meeting established and approved by the Board that is attended in person. Each Trustee receives a $1,000 fee for attending regularly scheduled and special meetings by phone instead of receiving the full fee had the member attended in person (except for telephonic meetings called pursuant to the Funds’ valuation and pricing procedures) and a $500 fee for attending the committee meeting by phone instead of receiving the full fee had the member attended in person. Trustees’ out-of-pocket expenses are also paid by the Russell Fund Complex. The Audit Committee Chair and Investment Committee Chair are each paid a fee of $15,000 per year and the Nominating and Governance Committee Chair is paid a fee of $12,000 per year. The chairman of the Board receives additional annual compensation of $75,000 (effective January 1, 2014, $85,000). Ms. Cavanaugh and the Trustee Emeritus are not compensated by the Russell Fund Complex for service as a Trustee.
Transactions with Affiliated Companies (amounts in thousands)
An affiliated company is a company in which a Fund has ownership of at least 5% of the voting securities or which the Fund controls, is controlled by or is under common control with. Transactions during the period ended December 31, 2013 with Underlying Funds which are, or were, an affiliated company are as follows:
| | | | | | | | | | | | | | | Realized Gain | | Income | | Capital Gains |
| | | | | Fair Value | | Purchases Cost | | Sales Cost | | | | (Loss) | | Distributions | Distributions |
| Moderate Strategy Fund | | | | | | | | | | | | | | | | | | | | | | | |
| RIC Russell Commodity Strategies Fund | | $ | | 2,300 | | $ | | 818 | | $ | | 1,145 | | $ | | (93) | | $ | | — | | $ | — |
| RIC Russell Global Infrastructure Fund | | | | 3,902 | | | | 1,455 | | | | 608 | | | | 7 | | | | 198 | | | 98 |
| RIC Russell Multi-Strategy Alternative Fund | | | | 3,102 | | | | 482 | | | | 268 | | | | (2) | | | | 36 | | | — |
| RIF Global Real Estate Securities Fund | | | | 2,329 | | | | 939 | | | | 1,281 | | | | 97 | | | | 112 | | | 92 |
| RIC Russell U. S. Defensive Equity Fund | | | | 4,159 | | | | 308 | | | | 783 | | | | 122 | | | | 55 | | | — |
| RIC Russell U. S. Dynamic Equity Fund | | | | 2,085 | | | | 407 | | | | 489 | | | | 69 | | | | 175 | | | 65 |
| RIF Aggressive Equity Fund | | | | 1,041 | | | | 472 | | | | 1,250 | | | | 572 | | | | 28 | | | 54 |
| RIF Multi-Style Equity Fund | | | | 4,946 | | | | 759 | | | | 2,020 | | | | 435 | | | | 71 | | | 257 |
| RIC Russell Global Opportunistic Credit Fund | | | | 2,050 | | | | 417 | | | | 140 | | | | (4) | | | | 109 | | | 12 |
| RIC Russell Investment Grade Bond Fund | | | | 20,484 | | | | 5,080 | | | | 2,785 | | | | (78) | | | | 227 | | | — |
| RIF Core Bond Fund | | | | 36,898 | | | | 6,238 | | | | 2,053 | | | | (70) | | | | 533 | | | 88 |
| RIC Russell Emerging Markets Fund | | | | 3,625 | | | | 1,929 | | | | 549 | | | | (27) | | | | 32 | | | 105 |
| RIC Russell Global Equity Fund | | | | 7,824 | | | | 750 | | | | 1,536 | | | | 218 | | | | 78 | | | 118 |
| RIF Non-U. S. Fund | | | | 8,370 | | | | 2,563 | | | | 1,422 | | | | 74 | | | | 137 | | | — |
| | | $ | | 103,115 | | $ | | 22,617 | | $ | | 16,329 | | $ | | 1,320 | | $ 1,791 | | $ | 889 |
| Balanced Strategy Fund | | | | | | | | | | | | | | | | | | | | | | | |
| RIC Russell Commodity Strategies Fund | | $ | | 8,969 | | $ | | 2,936 | | $ | | 3,319 | | $ | | (252) | | $ | | — | | $ | — |
| RIC Russell Global Infrastructure Fund | | | | 12,260 | | | | 4,460 | | | | 405 | | | | 13 | | | | 602 | | | 305 |
Notes to Financial Statements 69
Russell Investment Funds
LifePoints® Funds Variable Target Portfolio Series
Notes to Financial Statements, continued — December 31, 2013
| | | | | | | | | | | | | | | Realized Gain | | Income | | Capital Gains |
| | | | | Fair Value | | Purchases Cost | | Sales Cost | | | | (Loss) | | Distributions | Distributions |
| RIC Russell Multi-Strategy Alternative Fund | | | | 9,089 | | | | 1,475 | | | | 134 | | | | (2) | | | | 105 | | | | — |
| RIF Global Real Estate Securities Fund | | | | 6,048 | | | | 2,088 | | | | 3,188 | | | | 232 | | | | 305 | | | | 239 |
| RIC Russell U. S. Defensive Equity Fund | | | | 15,375 | | | | 675 | | | | 1,364 | | | | 143 | | | | 194 | | | | — |
| RIC Russell U. S. Dynamic Equity Fund | | | | 17,024 | | | | 2,546 | | | | 1,800 | | | | 254 | | | | 1,419 | | | | 528 |
| RIF Aggressive Equity Fund | | | | 9,303 | | | | 1,115 | | | | 3,788 | | | | 1,049 | | | | 220 | | | | 475 |
| RIF Multi-Style Equity Fund | | | | 26,193 | | | | 2,381 | | | | 4,915 | | | | 1,026 | | | | 327 | | | | 1,350 |
| RIC Russell Global Opportunistic Credit Fund | | | | 8,958 | | | | 1,929 | | | | 77 | | | | (1) | | | | 457 | | | | 53 |
| RIF Core Bond Fund | | | | 104,304 | | | | 24,047 | | | | 5,158 | | | | (133) | | | | 1,382 | | | | 229 |
| RIC Russell Emerging Markets Fund | | | | 13,574 | | | | 5,655 | | | | 430 | | | | (15) | | | | 120 | | | | 394 |
| RIC Russell Global Equity Fund | | | | 29,411 | | | | 1,593 | | | | 2,086 | | | | 106 | | | | 290 | | | | 438 |
| RIF Non-U. S. Fund | | | | 43,633 | | | | 8,177 | | | | 1,838 | | | | (61) | | | | 717 | | | | — |
| | | $ | | 304,141 | | $ | | 59,077 | | $ | | 28,502 | | $ | | 2,359 | | $ 6,138 | | $ 4,011 |
| Growth Strategy Fund | | | | | | | | | | | | | | | | | | | | | | | | |
| RIC Russell Commodity Strategies Fund | | $ | | 8,907 | | $ | | 3,475 | | $ | | 2,458 | | $ | | (178) | | $ | | — | | $ | | — |
| RIC Russell Global Infrastructure Fund | | | | 9,986 | | | | 3,946 | | | | 238 | | | | 1 | | | | 484 | | | | 247 |
| RIC Russell Multi-Strategy Alternative Fund | | | | 7,572 | | | | 1,764 | | | | 126 | | | | (2) | | | | 87 | | | | — |
| RIF Global Real Estate Securities Fund | | | | 5,209 | | | | 2,100 | | | | 2,440 | | | | 101 | | | | 243 | | | | 204 |
| RIC Russell U. S. Defensive Equity Fund | | | | 10,459 | | | | 765 | | | | 496 | | | | 20 | | | | 129 | | | | — |
| RIC Russell U. S. Dynamic Equity Fund | | | | 12,376 | | | | 2,268 | | | | 1,011 | | | | 69 | | | | 1,036 | | | | 386 |
| RIF Aggressive Equity Fund | | | | 8,084 | | | | 1,363 | | | | 2,947 | | | | 682 | | | | 191 | | | | 416 |
| RIF Multi-Style Equity Fund | | | | 21,408 | | | | 2,643 | | | | 2,859 | | | | 426 | | | | 249 | | | | 1,107 |
| RIC Russell Global Opportunistic Credit Fund | | | | 7,527 | | | | 2,201 | | | | 80 | | | | (3) | | | | 369 | | | | 44 |
| RIF Core Bond Fund | | | | 28,250 | | | | 10,879 | | | | 3,649 | | | | (83) | | | | 332 | | | | 53 |
| RIC Russell Emerging Markets Fund | | | | 10,912 | | | | 5,157 | | | | 421 | | | | (18) | | | | 96 | | | | 313 |
| RIC Russell Global Equity Fund | | | | 24,783 | | | | 2,226 | | | | 1,238 | | | | (1) | | | | 245 | | | | 370 |
| RIF Non-U. S. Fund | | | | 34,510 | | | | 7,171 | | | | 1,101 | | | | (92) | | | | 553 | | | | — |
| | | $ | | 189,983 | | $ | | 45,958 | | $ | | 19,064 | | $ | | 922 | | $ 4,014 | | $ 3,140 |
| Equity Growth Strategy Fund | | | | | | | | | | | | | | | | | | | | | | | | |
| RIC Russell Commodity Strategies Fund | | $ | | 2,336 | | $ | | 1,030 | | $ | | 853 | | $ | | (53) | | $ | | — | | $ | | — |
| RIC Russell Global Infrastructure Fund | | | | 2,631 | | | | 1,140 | | | | 200 | | | | 1 | | | | 129 | | | | 65 |
| RIC Russell Multi-Strategy Alternative Fund | | | | 2,487 | | | | 662 | | | | 172 | | | | (3) | | | | 28 | | | | — |
| RIF Global Real Estate Securities Fund | | | | 1,868 | | | | 830 | | | | 812 | | | | 27 | | | | 84 | | | | 74 |
| RIC Russell U. S. Defensive Equity Fund | | | | 2,762 | | | | 206 | | | | 209 | | | | 7 | | | | 34 | | | | — |
| RIC Russell U. S. Dynamic Equity Fund | | | | 4,815 | | | | 800 | | | | 365 | | | | 40 | | | | 401 | | | | 149 |
| RIF Aggressive Equity Fund | | | | 2,653 | | | | 574 | | | | 930 | | | | 268 | | | | 62 | | | | 135 |
| RIF Multi-Style Equity Fund | | | | 6,670 | | | | 740 | | | | 943 | | | | 175 | | | | 79 | | | | 344 |
| RIC Russell Global Opportunistic Credit Fund | | | | 2,460 | | | | 1,772 | | | | 1,152 | | | | 3 | | | | 94 | | | | 14 |
| RIC Russell Emerging Markets Fund | | | | 3,854 | | | | 1,825 | | | | 374 | | | | (18) | | | | 34 | | | | 111 |
| RIC Russell Global Equity Fund | | | | 6,556 | | | | 584 | | | | 382 | | | | 21 | | | | 65 | | | | 97 |
| RIF Non-U. S. Fund | | | | 11,178 | | | | 2,643 | | | | 818 | | | | 20 | | | | 182 | | | | — |
| | | $ | | 50,270 | | $ | | 12,806 | | $ | | 7,210 | | $ | | 488 | | $ 1,192 | | $ | | 989 |
5. Federal Income Taxes
Under the Regulated Investment Company Modernization Act of 2010, the Funds will be permitted to carry forward capital losses incurred in taxable years beginning after December 22, 2010 for an unlimited period. However, any losses incurred during those future taxable years will be required to be utilized prior to the losses incurred in pre-enactment taxable years. As a result of this ordering rule, pre-enactment capital loss carryforwards may be more likely to expire unused. Additionally, post-enactment capital losses that are carried forward will retain their character as either short-term or long-term capital losses rather than being considered all short-term as under previous law. At December 31, 2013, none of the Funds had capital losses available for carryforwards.
At December 31, 2013, the cost of investments and net unrealized appreciation (depreciation), undistributed ordinary income and undistributed long-term capital gains for income tax purposes were as follows:
| | | Moderate Strategy Fund | | Balanced Strategy Fund | | Growth Strategy Fund | Equity Growth Strategy Fund |
| Cost of Investments | | $ 95,159,946 | | $ 265,795,229 | | $ 162,225,067 | | $ 42,873,187 |
| Unrealized Appreciation | | $ 8,366,470 | | $ 39,683,144 | | $ 28,978,407 | | $ 7,610,591 |
| Unrealized Depreciation | | (411,176 ) | | (1,337,864 ) | | (1,220,017 ) | | (213,493 ) |
70 Notes to Financial Statements
Russell Investment Funds
LifePoints® Funds Variable Target Portfolio Series
Notes to Financial Statements, continued — December 31, 2013
| | | | | |
| | | | | Moderate Strategy Fund | | Balanced Strategy Fund | | Growth Strategy Fund | | Equity Growth Strategy Fund |
| Net Unrealized Appreciation (Depreciation) | | | $ | 7,955,294 | $ | 38,345,280 | $ | 27,758,390 | | $ | | 7,397,098 |
| Undistributed Ordinary Income | | | $ | 81,038 | $ | — | $ | 63,968 | $ | | 48,415 |
| Undistributed Long-Term Capital Gains | | | | | | | | | | | | |
| (Capital Loss Carryforward) | | | $ | 911,194 | $ | 4,090,045 | $ | 2,521,699 | $ | | 221,171 |
| Tax Composition of Distributions | | | | | | | | | | | | |
| Ordinary Income | | | $ | 1,863,030 | $ | 6,019,047 | $ | 3,851,675 | $ | | 1,148,063 |
| Long-Term Capital Gains | | | $ | 1,696,035 | $ | 2,128,675 | $ | — | $ | | — |
6. Interfund Lending Program
The Funds have been granted permission from the Securities and Exchange Commission to participate in a joint lending and borrowing facility. Funds may borrow money from each other for temporary purposes. All such borrowing and lending will be subject to a participating Fund’s fundamental investment limitations. A Fund will lend through the program only when the returns are higher than those available from an investment in repurchase agreements or short-term reserves and the portfolio manager determines it is in the best interest of the Fund. The Funds will borrow through the program only when the costs are equal to or lower than the cost of bank loans. Interfund loans and borrowings normally extend overnight, but can have a maximum duration of seven days. Loans may be called on one business day’s notice. A participating Fund may have to borrow from a bank at a higher interest rate if an interfund loan is called or not renewed. Any delay in repayment to a Fund could result in reduced returns or additional borrowing costs. For the period ended December 31, 2013, the Funds did not borrow or loan through the interfund lending program.
7. Record Ownership
As of December 31, 2013, the following table includes shareholders of record with greater than 10% of the total outstanding shares of each respective Fund. The Northwestern Life Insurance Company accounts were the largest shareholder in each Fund.
| | | | | | # of | | | | |
| | | | | | Shareholders | | | | % |
| Moderate Strategy Fund | | | | 1 | | | | 94 . 7 |
| Balanced Strategy Fund | | | | 1 | | | | 92 . 8 |
| Growth Strategy Fund | | | | 1 | | | | 89 . 5 |
| Equity Growth Strategy Fund | | | | 2 | | | | 97 . 4 |
| |
| 8. Pending Legal Proceedings | | | | | | | | | |
On October 17, 2013, Fred McClure filed a derivative lawsuit against Russell Investment Management Company (“RIMCo”) on behalf of ten RIC funds, some of which are Underlying Funds in which the Funds invest: the Russell Commodity Strategies Fund, Russell Emerging Markets Fund, Russell Global Equity Fund, Russell Global Infrastructure Fund, Russell Global Opportunistic Credit Fund, Russell International Developed Markets Fund, Russell Multi-Strategy Alternative Fund, Russell Strategic Bond Fund, Russell U.S. Small Cap Equity Fund and Russell Global Real Estate Securities Fund. The lawsuit, which was filed in the United States District Court for the District of Massachusetts, seeks recovery under Section 36(b) of the Investment Company Act of 1940, as amended, for the alleged payment of excessive investment management fees to RIMCo. Although this action was purportedly filed on behalf of these ten Funds, none of these ten Funds are themselves parties to the suit. For this reason, no accrual for litigation relating to this matter has been recorded in the financial statements of these funds. The plaintiffs seek recovery of the amount of compensation or payments received from these ten Funds and earnings that would have accrued to plaintiff had that compensation not been paid or, alternatively, rescission of the contracts and restitution of all excessive fees paid. RIMCo intends to vigorously defend the action.
9. Subsequent Events
Management has evaluated the events and /or transactions that have occurred through the date the financial statements were issued and noted no items requiring adjustments of the financial statements or additional disclosures.
Notes to Financial Statements 71
Report of Independent Registered Public Accounting Firm
To the Board of Trustees and Shareholders
of Russell Investment Funds
In our opinion, the accompanying statements of assets and liabilities, including the schedules of investments, and the related statements of operations and of changes in net assets and the financial highlights present fairly, in all material respects, the financial position of Moderate Strategy Fund, Balanced Strategy Fund, Growth Strategy Fund, and Equity Growth Strategy Fund (four of the portfolios constituting Russell Investment Funds, hereafter collectively referred to as the “Funds”) at December 31, 2013, the results of each of their operations for the year then ended, the changes in each of their net assets for each of the two years in the period then ended and the financial highlights for each of the five years in the period then ended, in conformity with accounting principles generally accepted in the United States of America. These financial statements and financial highlights (hereafter referred to as “financial statements”) are the responsibility of the Funds’ management; our responsibility is to express an opinion on these financial statements based on our audits. We conducted our audits of these financial statements in accordance with the standards of the Public Company Accounting Oversight Board (United States). Those standards require that we plan and perform the audit to obtain reasonable assurance about whether the financial statements are free of material misstatement. An audit includes examining, on a test basis, evidence supporting the amounts and disclosures in the financial statements, assessing the accounting principles used and significant estimates made by management, and evaluating the overall financial statement presentation. We believe that our audits, which included confirmation of securities at December 31, 2013 by correspondence with the transfer agent and the application of alternative auditing procedures where securities purchased confirmations had not been received, provide a reasonable basis for our opinion.

72 Report of Independent Registered Public Accounting Firm
Russell Investment Funds
LifePoints® Funds Variable Target Portfolio Series
Tax Information — December 31, 2013 (Unaudited)
For the tax year ended December 31, 2013, the Funds hereby designate 100% or the maximum amount allowable, of its net taxable income as qualified dividends taxed at individual net capital gain rates.
The Form 1099 you receive in January 2014 will show the tax status of all distributions paid to your account in calendar year 2013.
The Funds designate dividends distributed during the fiscal year as qualifying for the dividends received deduction for corporate shareholders as follows:
| | |
| Moderate Strategy | 13.2% |
| Balanced Strategy | 18.7% |
| Growth Strategy | 21.7% |
| Equity Growth Strategy | 22.5% |
Pursuant to Section 852 of the Internal Revenue Code, the Funds designate the following amounts as long-term capital gain dividends for their taxable year ended December 31, 2013:
| | |
| Moderate Strategy | $ | 1,696,035 |
| Balanced Strategy | $ | 2,128,675 |
Tax Information 73
Russell Investment Funds
LifePoints® Funds Variable Target Portfolio Series
Basis for Approval of Investment Advisory Contracts — (Unaudited)
The Investment Company Act of 1940, as amended (the “1940 Act”), requires that the Board of Trustees (the “Board”), including a majority of its members who are not considered to be “interested persons” under the 1940 Act (the “Independent Trustees”) voting separately, approve the continuation of the advisory agreement with RIMCo (the “RIMCo Agreement”) and the portfolio management contract with each Money Manager of the funds (collectively, the “portfolio management contracts”) in which the Funds invest (the “Underlying Funds”) on at least an annual basis and that the terms and conditions of the RIMCo Agreement and the terms and conditions of each portfolio management contract provide for its termination if continuation is not approved annually. The Board, including all of the Independent Trustees, considered and approved the continuation of the RIMCo Agreement and the portfolio management contracts at a meeting held in person on April 18, 2013 (the “Annual Agreement Evaluation Meeting”) and considered and approved the continuation again at a meeting held in person on August 26-27, 2013 (the “August Agreement Evaluation Meeting,” and with the Annual Agreement Evaluation Meeting, the “2013 Agreement Evaluation Meetings”). Approval of the continuation of the RIMCo Agreement and each portfolio management contract at the August Agreement Evaluation Meeting was not required under the 1940 Act or by the terms and conditions of the RIMCo Agreement or portfolio management contracts but rather was considered again to allow a rescheduling of the annual agreement evaluation meetings to later in the calendar year, beginning in 2014, in line with the terms and conditions of the RIMCo Agreement and the portfolio management contracts and the provisions of the 1940 Act requiring that the RIMCo Agreement be approved on an annual basis. During the course of a year, the Trustees receive a wide variety of materials regarding, among other things, the investment performance of the Funds, sales and redemptions of the Funds’ and Underlying Funds’ shares, management of the Funds and the Underlying Funds and other services provided by RIMCo and compliance with applicable regulatory requirements. In preparation for the review of the RIMCo Agreement at the Annual Agreement Evaluation Meeting, the Independent Trustees, with the advice and assistance of their independent counsel (“Independent Counsel”), also requested and the Board considered (1) information and reports prepared by RIMCo relating to the services provided by RIMCo (and its affiliates) to the Funds and the Underlying Funds; and (2) information (the “Third-Party Information”) received from an independent, nationally recognized provider of investment company information comparing the performance of each of the Funds and the Underlying Funds over various periods of time ended December 31, 2012 and their respective operating expenses over various periods of time ended December 31, 2012 or earlier with other peer funds not managed by RIMCo, believed by the provider to be generally comparable in investment objectives to the Funds and the Underlying Funds. In the case of each Fund, its other peer funds are collectively hereinafter referred to as the Fund’s “Comparable Funds,” and, with the Fund, such Comparable Funds are collectively hereinafter referred to as the Fund’s “Performance Universe” in the case of performance comparisons and the Fund’s “Expense Universe” in the case of operating expense comparisons. In preparing the Third-Party Information for the Annual Agreement Evaluation Meeting, the third-party service provider initially changed its methodology for selection of the Expense Universe Comparable Funds from that used in prior years to exclude peer funds with distribution or shareholder servicing fees even though their investment objectives were generally comparable to the Funds’ objectives. In RIMCo’s judgment, this change in methodology arbitrarily resulted in a significant reduction in the number of funds in the Expense Universe and made the operating expense comparisons in the Third-Party Information less meaningful. After discussions with the Board’s independent Chair, RIMCo requested, and the third-party information provider furnished supplementally, the Third-Party Information reflecting the methodologies for selection of the Expense Universe Comparable Funds by the third-party service provider used in 2012. The Board focused on the supplemental Third-Party Information in conducting its evaluations. In general, the operating expense comparisons between the Funds and their Comparable Funds in the supplemental Third-Party Information were more favorable. In the case of certain Funds, the Third-Party Information reflected changes in the Comparable Funds requested by RIMCo, which changes were noted in the Third-Party Information. The foregoing and other information received by the Board, including the Independent Trustees, in connection with its evaluations of the RIMCo Agreement and portfolio management contracts are collectively called the “Agreement Evaluation Information.” The Trustees’ evaluations at the 2013 Agreement Evaluation Meetings also reflected the knowledge and familiarity gained as Board members of the Funds and the other RIMCo-managed funds for which the Board has supervisory responsibility (“Other Russell Funds”) with respect to services provided by RIMCo, RIMCo’s affiliates and each Money Manager. Prior to the 2013 Agreement Evaluation Meetings, the Trustees received a memorandum from counsel to the Funds and the Underlying Funds (“Fund Counsel”) discussing the legal standards for their consideration of the continuations of the RIMCo Agreement and the portfolio management contracts, and the Independent Trustees separately received a memorandum regarding their responsibilities from Independent Counsel.
On April 9, 2013, the Independent Trustees, in preparation for the Annual Agreement Evaluation Meeting, met by conference telephone call to review the Agreement Evaluation Information received to that date in a private session with Independent Counsel at which no representatives of RIMCo or the Funds’ management were present and, on the basis of that review, requested additional Agreement Evaluation Information. On April 17, 2013, the Independent Trustees met in person in a private session with Independent Counsel to review additional Agreement Evaluation Information received to that date. At the Annual Agreement Evaluation Meeting, the Board,
74 Basis for Approval of Investment Advisory Contracts
Russell Investment Funds
LifePoints® Funds Variable Target Portfolio Series
Basis for Approval of Investment Advisory Contracts, continued — (Unaudited)
including the Independent Trustees, reviewed the proposed continuance of the RIMCo Agreement and the portfolio management contracts with RIMCo, Fund management, Independent Counsel and Fund Counsel. Presentations made by RIMCo at the Annual Agreement Evaluation Meeting as part of this review encompassed the Funds and all Other Russell Funds. Information received by the Board, including the Independent Trustees, at the Annual Agreement Evaluation Meeting is included in the Agreement Evaluation Information. Prior to voting at the Annual Agreement Evaluation Meeting, the non-management members of the Board, including the Independent Trustees, met in executive session with Fund Counsel and Independent Counsel to consider additional Agreement Evaluation Information received from RIMCo and management at the Annual Agreement Evaluation Meeting.
In preparation for the August Agreement Evaluation Meeting, the Independent Trustees informed RIMCo of their intention to rely substantially upon the Agreement Evaluation Information in considering the continuation of the RIMCo Agreement if, and to the extent that, such information continued to be accurate and complete as of the date of the August Agreement Evaluation Meeting and such Agreement Evaluation Information continued to provide such information as would be reasonably necessary to evaluate the terms of the RIMCo Agreement. The Board requested that RIMCo provide any and all updated or supplemental information which, taken together with the Agreement Evaluation Information, would be reasonably necessary for the Board to consider at the August Agreement Evaluation Meeting the continuation of the RIMCo Agreement and the portfolio management contracts (“Supplemental Agreement Evaluation Information”).
At the August Agreement Evaluation Meeting, the Independent Trustees met in a private session with Independent Counsel, at which no representatives of RIMCo or the Fund’s management were present, to review the proposed continuance of the RIMCo Agreement and the portfolio management contracts in light of the Agreement Evaluation Information, including the Third-Party Information and the Supplemental Agreement Evaluation Information. The Independent Trustees recalled and considered the factors and the findings that they reached in respect of those factors at the Annual Agreement Evaluation Meeting based upon the Agreement Evaluation Information, including the presentations made and the discussions that took place at that meeting, and reviewed the Supplemental Agreement Evaluation Information received to that date. The Independent Trustees noted that the Annual Agreement Evaluation Meeting preceded the August Agreement Evaluation Meeting by only four months and that the Supplemental Agreement Evaluation Information did not include any information that, in their judgment, adversely affected the bases of their evaluations and findings at the Annual Agreement Evaluation Meeting. At the August Agreement Evaluation Meeting, materials provided and presentations made by RIMCo again encompassed the Funds. Among other things, RIMCo provided updated performance information for the Funds in the quarterly information and reports. Information received by the Board, including the Independent Trustees, at the August Agreement Evaluation Meeting, including regular quarterly information and reports, is included in the Supplemental Agreement Evaluation Information. Prior to voting at the August Agreement Evaluation Meeting, the non-management members of the Board, including the Independent Trustees, met in executive session with Fund Counsel and Independent Counsel to consider continuation of the RIMCo Agreement and the portfolio management contracts in light of the Agreement Evaluation Information, the Supplemental Agreement Evaluation Information and discussions and reviews conducted at the 2013 Agreement Evaluation Meetings.
The discussion below reflects all of the above reviews.
In evaluating the portfolio management contracts at the 2013 Agreement Evaluation Meetings, the Board considered that each of the Underlying Funds employs a manager-of-managers method of investment and RIMCo’s advice that the Underlying Funds, in employing a manager-of-managers method of investment, operate in a manner that is distinctly different from most other investment companies. In the case of most other investment companies, an advisory fee is paid by the investment company to its adviser which, in turn, employs and compensates individual portfolio managers to make specific securities selections consistent with the adviser’s style and investment philosophy. RIMCo has engaged multiple unaffiliated Money Managers for all Underlying Funds.
The Board considered that RIMCo (rather than any Money Manager) is responsible under the RIMCo Agreement for allocating assets of each Fund among its Underlying Funds and for determining, implementing and maintaining the investment program for each Underlying Fund. The assets of each Fund are invested in different combinations of the Underlying Funds pursuant to target asset allocations set by RIMCo. RIMCo may modify the target asset allocation for any Fund and/or the Underlying Funds in which the Funds invest. Assets of each Underlying Fund generally have been allocated among the multiple Money Managers selected by RIMCo, subject to Board approval, for that Underlying Fund. RIMCo manages the investment of each Underlying Fund’s cash and also may manage directly any portion of each Underlying Fund’s assets that RIMCo determines not to allocate to the Money Managers and portions of an Underlying Fund during transitions between Money Managers. In all cases, Underlying Fund assets are managed directly by RIMCo pursuant to authority provided by the RIMCo Agreement.
Basis for Approval of Investment Advisory Contracts 75
Russell Investment Funds
LifePoints® Funds Variable Target Portfolio Series
Basis for Approval of Investment Advisory Contracts, continued — (Unaudited)
RIMCo is responsible for selecting, subject to Board approval, Money Managers for each Underlying Fund and for actively managing allocations and reallocations of its assets among the Money Managers. The Board has been advised that RIMCo’s goal with respect to the Underlying Funds is to construct and manage diversified portfolios in a risk-aware manner. Each Money Manager for an Underlying Fund in effect performs the function of an individual portfolio manager who is responsible for selecting portfolio securities for the portion of the Underlying Fund assigned to it by RIMCo (each, a “segment”) in accordance with the Underlying Fund’s applicable investment objective, policies and restrictions, any constraints placed by RIMCo upon their selection of portfolio securities and the Money Manager’s specified role in an Underlying Fund. RIMCo is responsible for, among other things, communicating performance expectations to each Money Manager; supervising compliance by each Money Manager with each Underlying Fund’s investment objective and policies; authorizing Money Managers to engage in certain investment strategies for an Underlying Fund; and recommending annually to the Board whether portfolio management contracts should be renewed, modified or terminated. In addition to its annual recommendation as to the renewal, modification or termination of portfolio management contracts, RIMCo is responsible for recommending to the Board additions of new Money Managers or replacements of existing Money Managers at any time when, based on RIMCo’s research and ongoing review and analysis, such actions are appropriate. RIMCo may impose specific investment constraints from time to time for each Money Manager intended to capitalize on the strengths of that Money Manager or to coordinate the investment activities of Money Managers for an Underlying Fund in a complementary manner. Therefore, RIMCo’s selection of Money Managers is made not only on the basis of performance considerations but also on the basis of anticipated compatibility with other Money Managers in the same Underlying Fund. In light of the foregoing, the overall performance of each Underlying Fund over appropriate periods reflects, in great part, the performance of RIMCo in designing the Underlying Fund’s investment program, structuring an Underlying Fund, selecting an effective Money Manager with a particular investment style or sub-style for a segment that is complementary to the styles of the Money Managers of other Underlying Fund segments, and allocating assets among the Money Managers in a manner designed to achieve the objectives of the Underlying Fund.
The Board considered that the prospectuses for the Funds and the Underlying Funds and other public disclosures emphasize to investors RIMCo’s role as the principal investment manager for each Underlying Fund, rather than the investment selection role of the Underlying Funds’ Money Managers, and describe the manner in which the Funds or Underlying Funds operate so that investors may take that information into account when deciding to purchase shares of any such Fund. The Board further considered that Fund investors in pursuing their investment goals and objectives likely purchased their shares on the basis of this information and RIMCo’s reputation for and performance record in managing the Underlying Funds’ manager-of-managers structure.
The Board also considered the demands and complexity of managing the Underlying Funds pursuant to the manager-of-managers structure, the special expertise of RIMCo with respect to the manager-of-managers structure of the Underlying Funds and the likelihood that, at the current expense ratio of each Underlying Fund, there would be no acceptable alternative investment managers to replace RIMCo on comparable terms given the need to continue the manager-of-managers strategy of such Underlying Fund selected by shareholders in purchasing their shares of a Fund or Underlying Fund.
In addition to these general factors relating to the manager-of-managers structure of the Underlying Funds, the Trustees at the 2013 Agreement Evaluation Meetings considered, with respect to each Fund and Underlying Fund, various specific factors in evaluating renewal of the RIMCo Agreement, including the following:
1. The nature, scope and overall quality of the investment management and other services provided, and expected to be provided, to the Fund or the Underlying Fund by RIMCo;
2. The advisory fee paid by the Fund or the Underlying Fund to RIMCo (the “Advisory Fee”) and the fact that it encompasses all investment advisory fees paid by the Fund or Underlying Fund, including the fees for any Money Managers of such Underlying Fund;
3. Information provided by RIMCo as to other fees and benefits received by RIMCo or its affiliates from the Fund or Underlying Fund, including any administrative or transfer agent fees and any fees received for management of securities lending cash collateral, soft dollar arrangements and commissions in connection with portfolio securities transactions;
4. Information provided by RIMCo as to expenses incurred by the Fund or the Underlying Fund;
5. Information provided by RIMCo as to the profits that RIMCo derives from its mutual fund operations generally and from the Fund or Underlying Fund; and
76 Basis for Approval of Investment Advisory Contracts
Russell Investment Funds
LifePoints® Funds Variable Target Portfolio Series
Basis for Approval of Investment Advisory Contracts, continued — (Unaudited)
6. Information provided by RIMCo concerning economies of scale and whether any scale economies are adequately shared with the Fund or the Underlying Fund.
In evaluating the nature, scope and overall quality of the investment management and other services provided, and which are expected to be provided, to the Funds, including Fund portfolio management services, the Board at the 2013 Agreement Evaluation Meetings discussed with senior representatives of RIMCo the impact on the Funds’ operations of changes in RIMCo’s senior management and other personnel providing investment management and other services to the Funds during the prior year. The Board was not advised of any expected diminution in the nature, scope or quality of the investment advisory or other services provided to the Funds or the Underlying Funds from such changes at either of the 2013 Agreement Evaluation Meetings. The Board also discussed the impact of organizational changes on the compliance programs of the Funds, the Underlying Funds and RIMCo with the Funds’ Chief Compliance Officer (the “CCO”) and received assurances from the CCO that such changes have not resulted in any diminution in the scope and quality of the compliance programs of the Funds or the Underlying Funds.
As noted above, RIMCo, in addition to managing the investment of each Underlying Fund’s cash, may directly manage a portion of certain Underlying Funds (the “Participating Underlying Funds”) pursuant to the RIMCo Agreement, the actual allocation being determined from time to time by the Participating Underlying Funds’ RIMCo portfolio manager. During 2012, RIMCo implemented a strategy of managing a portion of the assets of the Participating Underlying Funds to modify such Funds’ overall portfolio characteristics by investing in securities or other instruments that RIMCo believes will achieve the desired risk/return profiles for such Participating Underlying Funds. RIMCo monitors and assesses Participating Underlying Fund characteristics, including risk, using a variety of measurements, such as tracking error, and may seek to manage Participating Underlying Fund characteristics consistent with the Funds’ investment objectives and strategies. Participating Underlying Fund characteristics may be managed with the goal to increase or decrease exposures (such as volatility, momentum, value, growth, capitalization size, industry or sector) or to offset undesired relative over or underweights in order to seek to achieve the desired risk/return profile for the Participating Underlying Fund. RIMCo may use an index replication or sampling strategy by selecting an index which represents the desired exposure, or may utilize quantitative or qualitative analysis or quantitative models designed to assess Participating Underlying Fund characteristics and identify a portfolio which provides the desired exposure. Based on this, for the portion of a Participating Underlying Fund’s assets directly managed by RIMCo, RIMCo may purchase common stocks, exchange-traded funds, exchange-traded notes, short-term investments or derivatives, including futures, forwards, options and/or swaps, in order to seek to achieve the desired risk/return profile for the Participating Underlying Fund. RIMCo’s direct management of assets for these purposes is hereinafter referred to as the “Direct Management Services.” RIMCo also may reallocate Underlying Fund assets among Money Managers, increase Underlying Fund cash reserves, determine to not be fully invested, or adjust exposures through the cash equitization process. RIMCo’s Direct Management Services are not intended, and are not expected, to be a primary driver of Participating Underlying Funds’ investment results, although the services may have a positive or negative impact on investment results, but rather are intended to enhance incrementally the ability of Funds to carry out their investment programs. The Board considered that during the period, and to the extent that RIMCo employs its Direct Management Services in respect of Participating Underlying Funds, RIMCo is not required to pay investment advisory fees to a Money Manager with respect to Participating Underlying Fund assets that are directly managed and that the profits derived by RIMCo generally and from the Participating Underlying Funds consequently may be increased incrementally. The Board, however, also considered the potential benefits of the Direct Management Services to Participating Underlying Funds and the Funds; the limited amount of assets that are managed directly by RIMCo pursuant to the Direct Management Services; and the fact that the aggregate investment Advisory Fees paid by the Participating Underlying Funds are not increased as a result of RIMCo’s direct management of Participating Underlying Fund assets as part of the Direct Management Services or otherwise.
In evaluating the reasonableness of the Funds’ and Underlying Funds’ Advisory Fees in light of Fund and Underlying Fund performance, the Board considered that, in the Agreement Evaluation Information and at past meetings, RIMCo noted differences between the investment strategies of certain Underlying Funds and their respective Comparable Funds in pursuing their investment objectives. The Board noted RIMCo’s further past advice that the strategies pursued by the Underlying Funds, among other things, are intended to result in less volatile, more moderate returns relative to each Underlying Fund’s performance benchmark rather than more volatile, more extreme returns that its Comparable Funds may experience over time.
The Third-Party Information included, among other things, comparisons of the Funds’ Advisory Fees with the advisory fees of their Comparable Funds on an actual basis (i.e., giving effect to any voluntary fee waivers implemented by RIMCo and the advisers to such Fund’s Comparable Funds). The Third-Party Information, among other things, showed that each Fund had an Advisory Fee which, compared with its Comparable Funds’ advisory fees on an actual basis, was ranked in the first quintile of its Expense Universe for that
Basis for Approval of Investment Advisory Contracts 77
Russell Investment Funds
LifePoints® Funds Variable Target Portfolio Series
Basis for Approval of Investment Advisory Contracts, continued — (Unaudited)
expense component. In these rankings, the first quintile represents funds with the lowest investment advisory fees among funds in the Expense Universe and the fifth quintile represents funds with the highest investment advisory fees among the Expense Universe funds. The comparisons were based upon the latest fiscal years for the Expense Universe funds.
In discussing the Advisory Fees for the Underlying Funds generally, RIMCo noted, among other things, that its Advisory Fees for the Underlying Funds encompass services that may not be provided by investment advisers to the Underlying Funds’ Comparable Funds, such as cash equitization and management of portfolio transition costs when Money Managers are added, terminated or replaced. RIMCo also observed that its “margins” in providing investment advisory services to the Underlying Funds tend to be lower than competitors’ margins because of the demands and complexities of managing the Underlying Funds’ manager-of-managers structure, including RIMCo’s payment of a significant portion of the Underlying Funds’ Advisory Fees to their Money Managers. RIMCo expressed the view that Advisory Fees should be considered in the context of a Fund’s or Underlying Fund’s total expense ratio to obtain a complete picture. The Board, however, considered each Fund’s and Underlying Fund’s Advisory Fee on both a standalone basis and in the context of the Fund’s or Underlying Fund’s total expense ratio.
Based upon information provided by RIMCo, the Board considered for each Fund and Underlying Fund whether economies of scale have been realized and whether the Advisory Fee for such Fund or Underlying Fund appropriately reflects or should be revised to reflect any such economies. The Funds are distributed exclusively through variable annuity and variable life insurance contracts issued by insurance companies. Currently, the Funds are made available to holders of such insurance policies by two insurance companies. At the Annual Agreement Evaluation Meeting, RIMCo advised the Board that it does not expect that additional insurance companies will make the Funds available to their variable annuity or variable life insurance policyholders in the near or long term because of a declining interest by the insurance companies generally in variable insurance trusts, such as the Funds, as investment vehicles supporting their products. Notwithstanding this expectation, RIMCo expressed its belief that the Funds will remain viable in light of their cash inflows from current participating insurance companies. The Board considered, among other things, the negative implications for significant future Fund asset growth of RIMCo’s expectation that no additional insurance companies will make the Funds available to their variable annuity and variable life insurance policyholders and other factors associated with the manager-of-managers structure employed by the Underlying Funds, including the variability of Money Manager investment advisory fees.
The Board also considered, as a general matter, that fees payable to RIMCo by institutional clients with investment objectives similar to those of the Funds, the Underlying Funds and Other Russell Funds are lower, and, in some cases, may be substantially lower, than the rates paid by the Funds, the Underlying Funds and Other Russell Funds. The Trustees considered the differences in the nature and scope of services RIMCo provides to institutional clients and the Funds and the Underlying Funds. RIMCo explained, among other things, that institutional clients have fewer compliance, administrative and other needs than the Funds and the Underlying Funds. RIMCo also noted that since the Funds and the Underlying Funds must constantly issue and redeem their shares, they are more difficult to manage than institutional accounts, where assets are relatively stable. In addition, RIMCo noted that the Funds and the Underlying Funds are subject to heightened regulatory requirements relative to institutional clients. The Board noted that RIMCo provides office space and facilities to the Funds and the Underlying Funds and all of the Funds’ and Underlying Funds’ officers. Accordingly, the Trustees concluded that the services provided to the Funds and Underlying Funds are sufficiently different from the services provided to the other clients that comparisons are not probative and should not be given significant weight.
With respect to the Funds’ total expenses, the Third-Party Information showed that the total expenses for the Balanced Strategy Fund, Growth Strategy Fund and Equity Growth Strategy Fund ranked in the fourth quintile of its Expense Universe. The total expenses for the Moderate Strategy Fund ranked in the second quintile of its Expense Universe. In these rankings, the first quintile represents funds with the lowest total expenses among funds in the Expense Universe and the fifth quintile represents funds with the highest total expenses among the Expense Universe funds. The Board considered RIMCo’s explanation of the rankings and its advice that the Balanced Strategy Fund was less than 5 basis points from the third quintile of its Expense Universe. The Board also considered RIMCo’s explanation that administration fees and custodian fees contributed to the differential to the third quintile for the Growth Strategy Fund and the Equity Growth Strategy Fund. With respect to the Equity Growth Strategy Fund, the Board considered RIMCo’s explanation that the Fund has a higher equity allocation than its Comparable Funds and that Comparable Funds in the first quintile invested predominantly in passive (i.e., index) products with lower expense ratios than actively managed products, such as the Underlying Funds. Equity funds generally have higher expense ratios than fixed income funds. The higher equity allocation of the Equity Growth Strategy Fund, and resulting higher indirect expenses of the Underlying Fund investments, made meaningful comparisons with its Comparable Funds difficult. RIMCo advised the Board that its internal analysis based upon a more appropriate peer groups of its own selection showed improved comparative results.
78 Basis for Approval of Investment Advisory Contracts
Russell Investment Funds
LifePoints® Funds Variable Target Portfolio Series
Basis for Approval of Investment Advisory Contracts, continued — (Unaudited)
On the basis of the Agreement Evaluation Information, and other information previously received by the Board from RIMCo during the course of the current year or prior years, or presented at or in connection with the Annual Agreement Evaluation Meeting by RIMCo, the Board, in respect of each Fund and Underlying Fund, at the Annual Agreement Evaluation Meeting found, after giving effect to any applicable waivers and/or reimbursements and considering any differences in the composition and investment strategies of their respective Comparable Funds (1) the Advisory Fee charged by RIMCo was reasonable in light of the nature, scope and overall quality of the investment management and other services provided, and expected to be provided, to the Funds or Underlying Funds; (2) the relative expense ratio of each Fund and Underlying Fund either was comparable to those of its Comparable Funds or RIMCo had provided an explanation satisfactory to the Board as to why the relative expense ratio was not comparable to those of its Comparable Funds; (3) RIMCo’s methodology of allocating expenses of operating funds in the complex was reasonable; (4) other benefits and fees received by RIMCo or its affiliates from the Funds or Underlying Funds were not excessive; (5) RIMCo’s profitability with respect to the Funds and each Underlying Fund was not excessive in light of the nature, scope and overall quality of the investment management and other services provided by RIMCo; and (6) the Advisory Fee charged by RIMCo appropriately reflects any economies of scale realized by such Fund or Underlying Fund in light of various factors, including the negative implications for significant future Fund asset growth of RIMCo’s expectation that no additional insurance companies will make the Funds available to their variable annuity and variable life insurance policyholders and other factors associated with the manager-of-managers structure employed by the Underlying Funds, including the variability of Money Manager investment advisory fees. Based upon the Agreement Evaluation Information, the Supplemental Agreement Evaluation Information and other information previously received by the Board from RIMCo during the course of the year, or presented at or in connection with the 2013 Agreement Evaluation Meetings by RIMCo, the Board confirmed each of the foregoing findings at the August Agreement Evaluation Meeting.
The Board at the 2013 Agreement Evaluation Meetings concluded that, under the circumstances and based upon RIMCo’s performance information and reviews for each Fund and Underlying Fund at the 2013 Agreement Evaluation Meetings, the performance of each of the Funds would be consistent with continuation of the RIMCo Agreement. The Board, in assessing the performance of Funds and Underlying Funds with at least three years of performance history, focused upon performance for the 3-year period ended December 31, 2012 as most relevant but also considered the Funds’ and Underlying Funds’ performance for the 1- year and, where applicable, 5-year periods ended such date. In reviewing the performance of the Funds and the Underlying Funds generally, the Board, in addition to the factors described above, took into consideration the various steps taken by RIMCo during 2012 to enhance the performance of certain Underlying Funds, including a large number of changes in Money Managers and RIMCo’s implementation of its Direct Management Services which were not yet reflected in Participating Underlying Fund and Fund investment results.
With respect to the Growth Strategy Fund, the Third-Party Information showed that the Fund’s performance was ranked in the second quintile of its Performance Universe for the 1-year period ended December 31, 2012, but was ranked in the fourth quintile of its Performance Universe for each of the 3- and 5-year periods ended such date.
With respect to the Equity Growth Strategy Fund, the Third-Party Information showed that the performance of the Fund was ranked in the fourth quintile of its Performance Universe for the 1-, 3-, and 5-year periods ended December 31, 2012.
In explaining the periods of underperformance of the Funds relative to the Comparable Funds, RIMCo noted, among other things, that the performance of the Growth Strategy Fund and the Equity Growth Strategy Fund relative to each Fund’s respective Performance Universe was affected negatively by its notable exposure to listed infrastructure securities and commodities, both of which have lagged in the strong equity markets. This exposure, according to RIMCo, is intended to provide diversification benefits and to enhance risk-adjusted returns compared to Comparable Funds, which generally have higher concentrations in equities as growth assets and RIMCo believes that the exposures remain appropriate because of the diversification benefits and potential for enhancing the Funds’ overall risk-adjusted returns.
In evaluating performance, the Board considered each Fund’s and Underlying Fund’s absolute performance and performance relative to appropriate benchmarks and indices in addition to such Fund’s performance relative to its Comparable Funds. In assessing the Funds’ performance relative to their Comparable Funds or benchmarks or in absolute terms, the Board also considered RIMCo’s stated investment strategy of managing the Underlying Funds in a risk-aware manner and the extraordinary capital market conditions during 2008 and early 2009 that continue to impact relative performance for the 3- and 5-year periods ended December 31, 2012. The Board also considered the large number of Underlying Fund Money Manager changes that were made in 2012 and that the performance of Money Managers continues to impact Fund and Underlying Fund performances for periods prior and subsequent to their termination, and that any incremental positive or negative impact of the Direct Management Services to Underlying Funds was not yet reflected in the investment results of the Underlying Funds or the Funds.
Basis for Approval of Investment Advisory Contracts 79
Russell Investment Funds
LifePoints® Funds Variable Target Portfolio Series
Basis for Approval of Investment Advisory Contracts, continued — (Unaudited)
Based upon its consideration of the foregoing and other relevant factors, the Board at each of the 2013 Agreement Evaluation Meetings concluded that continuation of the RIMCo Agreement on its current terms and conditions would be in the best interests of each Fund and its respective shareholders and voted to approve the continuation of the RIMCo Agreement.
In connection with the 2013 Agreement Evaluation Meetings, with respect to the evaluation of the terms of portfolio management contracts with Money Managers for the Underlying Funds, the Board received and considered information from RIMCo reporting, among other things, for each Money Manager, the Money Manager’s performance over various periods; RIMCo’s assessment of the performance of each Money Manager; any significant business relationships between the Money Manager and RIMCo or Russell Financial Services, Inc., the Funds’ and Underlying Funds’ underwriter; and RIMCo’s recommendation to retain the Money Manager at the current fee rate, to retain the Money Manager at a reduced fee rate or to terminate the Money Manager. The Board received reports during the course of the year and at the 2013 Agreement Evaluation Meetings from the Funds’ CCO regarding her assessments of Money Manager compliance programs and any compliance issues. RIMCo did not identify any benefits received by Money Managers or their affiliates as a result of their relationships with the Underlying Funds other than benefits from their soft dollar arrangements. The Agreement Evaluation Information described, and at the Annual Agreement Evaluation Meeting the Funds’ CCO discussed, oversight of Money Manager soft dollar arrangements. The Agreement Evaluation Information expressed RIMCo’s belief that, based upon certifications from Money Managers and pre-hire and ongoing reviews of Money Manager soft dollar arrangements, policies and procedures, the Money Managers’ soft dollar arrangements, policies and procedures are consistent with applicable legal standards and with disclosures made by Money Managers in their investment adviser registration statements filed with the Securities and Exchange Commission and by the Underlying Funds in their registration statements. At the Annual Agreement Evaluation Meeting, the Board was advised that, in the case of Money Managers using soft dollar arrangements, the CCO monitors, among other things, the commissions paid by the Underlying Funds and percentage of Underlying Fund transactions effected pursuant to the soft-dollar arrangements, as well as the products or services purchased by the Money Managers with soft dollars generated by Underlying Fund portfolio transactions. The CCO and RIMCo do not obtain, and therefore neither the Agreement Evaluation Information nor the Supplemental Agreement Evaluation Information included information regarding the value of soft dollar benefits derived by Money Managers from Underlying Fund portfolio transactions. At the Annual Agreement Evaluation Meeting, RIMCo noted that it planned to recommend termination of certain Money Managers to the Board at the May 2013 meeting, with each recommended termination to become effective on a date following the Annual Agreement Evaluation Meeting. Notwithstanding these planned terminations, RIMCo recommended at the Annual Agreement Evaluation Meeting that each Money Manager be retained at its current fee rate. At the August 27, 2013 meeting, RIMCo recommended and the Board approved the termination of certain Money Managers, with each termination to become effective prior to the expiration of the Money Manager’s existing portfolio management contract. With the exception of these Money Managers, RIMCo recommended at the August Agreement Evaluation Meeting that each Money Manager be retained at its current fee rate. In doing so, RIMCo, as it has in the past, advised the Board that it does not regard Money Manager profitability as relevant to its evaluation of the portfolio management contracts with Money Managers because the willingness of Money Managers to serve in such capacity depends upon arm’s-length negotiations with RIMCo; RIMCo is aware of the fees charged by Money Managers to other clients; and RIMCo believes that the fees agreed upon with Money Managers are reasonable in light of the anticipated quality of investment advisory services to be rendered. In its evaluations at the 2013 Agreement Evaluation Meetings, the Board accepted RIMCo’s explanation of the relevance of Money Manager profitability in light of RIMCo’s belief that such fees are reasonable; the Board’s findings as to the reasonableness of the Advisory Fee paid by each Fund and Underlying Fund; and the fact that each Money Manager’s fee is paid by RIMCo.
Based substantially upon RIMCo’s recommendations, together with the Agreement Evaluation Information, the Board at the Annual Agreement Evaluation Meeting concluded that the fees paid to the Money Managers of each Underlying Fund are reasonable in light of the quality of the investment advisory services provided and that continuation of the portfolio management contract with each Money Manager of each Underlying Fund would be in the best interests of such Underlying Fund and its shareholders. The Board on the basis of the Agreement Evaluation Information and the Supplemental Agreement Evaluation Information confirmed such conclusions at the August Agreement Evaluation Meeting.
In their deliberations at the 2013 Agreement Evaluation Meetings, the Trustees did not identify any particular information as to the RIMCo Agreement or, other than RIMCo’s recommendation, the portfolio management contract with any Money Manager for an Underlying Fund that was all-important or controlling and each Trustee attributed different weights to the various factors considered. The Trustees evaluated all information available to them on a Fund-by-Fund basis and their determinations were made in respect of each Fund and Underlying Fund.
80 Basis for Approval of Investment Advisory Contracts
Russell Investment Funds
LifePoints® Funds Variable Target Portfolio Series
Basis for Approval of Investment Advisory Contracts, continued — (Unaudited)
Prior to the August Agreement Evaluation Meeting, the Board received a proposal from RIMCo at a meeting held on May 21, 2013, to effect Money Manager changes for the Russell Investment Company Russell Global Equity and Russell Multi-Strategy Alternative Funds. In the case of each proposed change, the Trustees approved the terms of the proposed portfolio management contract based substantially upon RIMCo’s recommendation to hire the Money Manager at the proposed fee rate; information as to any significant business relationships between the Money Manager and RIMCo or Russell Financial Services, Inc., the Fund’s underwriter; the CCO’s evaluation of the Money Manager’s compliance program, policies and procedures, and certification that they were consistent with applicable legal standards; RIMCo’s explanation as to the lack of relevance of profitability to the evaluation of portfolio management contracts with Money Managers because the willingness of Money Managers to serve in such capacity depends upon arm’s-length negotiations with RIMCo; RIMCo’s awareness of the fees charged by the Money Manager to other clients; and RIMCo’s belief that the proposed investment advisory fees would be reasonable in light of the anticipated quality of investment advisory services to be rendered. The Trustees also considered their findings at the Annual Agreement Evaluation Meeting as to the reasonableness of the aggregate investment advisory fees paid by the Funds, and the fact that the aggregate investment advisory fees paid by the Funds would not increase as a result of the implementation of the proposed Money Manager changes because the Money Managers’ investment advisory fees are paid by RIMCo.
At the August Agreement Evaluation Meeting, the Board received a proposal from RIMCo to effect Money Manager changes for the Russell Investment Company Russell Emerging Markets and Russell Multi-Strategy Alternative Funds, and at that same meeting to effect a Money Manager change for the Russell Investment Company Russell Commodity Strategies Fund resulting from a Money Manager change of control for one of the Fund’s Money Managers. In the case of each proposed change, the Trustees approved the terms of the proposed portfolio management contract based upon RIMCo’s recommendation to hire the Money Manager at the proposed fee rate; information as to any significant business relationships between the Money Manager and RIMCo or Russell Financial Services, Inc., the Fund’s underwriter; the CCO’s evaluation of the Money Manager’s compliance program, policies and procedures, and certification that they were consistent with applicable legal standards; RIMCo’s explanation as to the lack of relevance of profitability to the evaluation of portfolio management contracts with Money Managers because the willingness of Money Managers to serve in such capacity depends upon arm’s-length negotiations with RIMCo; RIMCo’s awareness of the fees charged by the Money Manager to other clients; and RIMCo’s belief that the proposed investment advisory fees would be reasonable in light of the anticipated quality of investment advisory services to be rendered. The Trustees also considered their findings at the 2013 Agreement Evaluation Meetings as to the reasonableness of the aggregate investment advisory fees paid by the Funds, and the fact that the aggregate investment advisory fees paid by the Funds would not increase as a result of the implementation of the proposed Money Manager changes because the Money Managers’ investment advisory fees are paid by RIMCo.
Basis for Approval of Investment Advisory Contracts 81
Russell Investment Funds
LifePoints® Funds Variable Target Portfolio Series
Shareholder Requests for Additional Information — December 31, 2013 (Unaudited)
A complete unaudited schedule of investments is made available generally no later than 60 days after the end of the first and third quarters of each year. These reports are available (i) free of charge, upon request, by calling the Funds at (800) 787-7354, (ii) on the Securities and Exchange Commission’s website at www.sec.gov, and (iii) at the Securities and Exchange Commission’s public reference room.
The Board has delegated to RIMCo, as RIF’s investment adviser, the primary responsibility for monitoring, evaluating and voting proxies solicited by or with respect to issuers of securities in which assets of the Underlying Funds may be invested. RIMCo has established a proxy voting committee and has adopted written proxy voting policies and procedures (“P&P”) and proxy voting guidelines (“Guidelines”). The Funds maintain a Portfolio Holdings Disclosure Policy that governs the timing and circumstances of disclosure to shareholders and third parties of information regarding the portfolio investments held by the Funds. A description of the P&P, Guidelines, Portfolio Holdings Disclosure Policy and additional information about Fund Trustees are contained in the Funds’ Statement of Additional Information (“SAI”). The SAI and information regarding how the Underlying Funds voted proxies relating to portfolio securities during the most recent 12-month period ended June 30, 2013 are available (i) free of charge, upon request, by calling the Funds at (800) 787-7354, and (ii) on the Securities and Exchange Commission’s website at www.sec.gov.
If possible, depending on contract owner registration and address information, and unless you have otherwise opted out, only one copy of the RIF prospectus and each annual and semi-annual report will be sent to contract owners at the same address. If you would like to receive a separate copy of these documents, please contact your Insurance Company. If you currently receive multiple copies of the prospectus, annual report and semi-annual report and would like to request to receive a single copy of these documents in the future, please call your Insurance Company.
Some Insurance Companies may offer electronic delivery of the Funds’ prospectuses and annual and semi-annual reports. Please contact your Insurance Company for further details.
Financial statements of the Underlying Funds can be obtained at no charge by calling the Funds at (800)787-7354.
82 Shareholder Requests for Additional Information
Russell Investment Funds
LifePoints® Funds Variable Target Portfolio Series
Disclosure of Information about Fund Trustees and Officers — December 31, 2013 (Unaudited)
The following tables provide information for each officer and trustee of the Russell Fund Complex. The Russell Fund Complex consists of Russell Investment Company (“RIC”), which has 37 funds, Russell Investment Funds (“RIF”), which has 9 funds, and Russell Exchange Traded Funds Trust (“RET”), which has 1 fund. Each of the trustees is a trustee of RIC, RIF and RET. The first table provides information for the interested trustees. The second table provides information for the independent trustees. The third table provides information for the trustee emeritus. The fourth table provides information for the officers. Furthermore, each Trustee possesses the following specific attributes: Mr. Alston has business, financial and investment experience as a senior executive of an international real estate firm and is trained as a lawyer; Ms. Blake has had experience as a certified public accountant and has had experience as a member of boards of directors/trustees of other investment companies; Ms. Burgermeister has had experience as a certified public accountant and as a member of boards of directors/trustees of other investment companies; Mr. Connealy has had experience with other investment companies and their investment advisers first as a partner in the investment management practice of PricewaterhouseCoopers LLP and, subsequently, as the senior financial executive of two other investment organizations sponsoring and managing investment companies; Mr. Fine has had financial, business and investment experience as a senior executive of a non-profit organization and previously, as a senior executive of a large regional financial services organization with management responsibility for such activities as investments, asset management and securities brokerage; Mr. Tennison has had business, financial and investment experience as a senior executive of a corporation with international activities and was trained as an accountant; Mr. Thompson has had experience in business, governance, investment and financial reporting matters as a senior executive of an organization sponsoring and managing other investment companies, and, subsequently, has served as a board member of other investment companies, and has been determined by the Board to be an audit committee financial expert; and Ms. Weston has had experience as a tax and corporate lawyer, has served as general counsel of several corporations and has served as a director of another investment company. Ms. Cavanaugh has had experience with other financial services companies, including companies engaged in the sponsorship, management and distribution of investment companies. As a senior officer of the Funds, the Adviser and various affiliates of the Adviser providing services to the Funds, Ms. Cavanaugh is in a position to provide the Board with such parties’ perspectives on the management, operations and distribution of the Funds. Effective December 31, 2013, Mr. Fine and Ms. Weston retired from the Board and no longer serve as Trustees of the Russell Fund Complex. Effective January 1, 2014, Katherine W. Krysty was elected to the Board and began serving as a Trustee of the Russell Fund Complex. Ms. Krysty has had business, financial and investment experience as the founder and senior executive of a registered investment adviser focusing on high net worth individual as well as experience as a certified public accountant and a member of the boards of other corporations and non-profit organizations.
Disclosure of Information about Fund Trustees and Officers 83
Russell Investment Funds
LifePoints® Funds Variable Target Portfolio Series
Disclosure of Information about Fund Trustees and Officers, continued —December 31, 2013 (Unaudited)
| | | | | | | | | | | No. of | | |
| | | | | | | | | | | Portfolios | | |
| | | | | | | | | | | in Russell | | Other |
| | | Position(s) Held | | | | | | | | Fund | | Directorships |
| Name, | | With Fund and | | Term | | | | Principal Occupation(s) | | Complex | | Held by Trustee |
| Age, | | Length of | | of | | | | During the | | Overseen | | During the |
| Address | | Time Served | | Office* | | | | Past 5 Years | | by Trustee | | Past 5 Years |
| |
| INTERESTED TRUSTEES | | | | | | | | | | | | |
| # Sandra Cavanaugh, | | President and Chief | | Until successor | | • | | President and CEO RIC, RIF and | | 47 | | None |
| Born May 10, 1954 | | Executive Officer since | | is chosen and | | | | RET | | | | |
| | | 2010 | | qualified by | | • | | Chairman of the Board, Co- | | | | |
| 1301 Second Avenue, | | | | Trustees | | | | President and CEO, Russell | | | | |
| 18th Floor, Seattle, WA | | Trustee since 2010 | | | | | | Financial Services, Inc. (RFS) | | | | |
| 98101 | | | | Appointed until | | • | | Chairman of the Board, President | | | | |
| | | | | successor is | | | | and CEO, Russell Fund Services | | | | |
| | | | | duly elected and | | | | Company (“RFSC”) | | | | |
| | | | | qualified | | • | | Director, RIMCo | | | | |
| | | | | | | • | | Chairman of the Board, President | | | | |
| | | | | | | | | and CEO, Russell Insurance | | | | |
| | | | | | | | | Agency, Inc. (“RIA”) (insurance | | | | |
| | | | | | | | | agency) | | | | |
| | | | | | | • | | May 2009 to December 2009, | | | | |
| | | | | | | | | Executive Vice President, Retail | | | | |
| | | | | | | | | Channel, SunTrust Bank | | | | |
| | | | | | | • | | 2007 to January 2009, Senior Vice | | | | |
| | | | | | | | | President, National Sales — Retail | | | | |
| | | | | | | | | Distribution, JPMorgan Chase/ | | | | |
| | | | | | | | | Washington Mutual, Inc. | | | | |
| | | | | | | | | (investment company) | | | | |
| |
| |
| |
| ## Daniel P. Connealy, | | Trustee since 2003 | | Appointed until | | • | | June 2004 to present, Senior Vice | | 47 | | None |
| Born June 6, 1946 | | | | successor is | | | | President and Chief Financial | | | | |
| | | | | duly elected and | | | | Officer, Waddell & Reed Financial, | | | | |
| 1301 Second Avenue, 18th | | | | qualified | | | | Inc. (investment company) | | | | |
| Floor, Seattle, WA | | | | | | | | | | | | |
| 98101 | | | | | | | | | | | | |
| |
| |
| ### Jonathan Fine, | | Trustee since 2004 | | Appointed until | | • | | President and Chief Executive | | 47 | | None |
| Born July 8, 1954 | | | | successor is | | | | Officer, United Way of King | | | | |
| | | | | duly elected and | | | | County, WA (charitable | | | | |
| 1301 Second Avenue, | | | | qualified | | | | organization) | | | | |
| 18 th Floor, Seattle, WA | | | | | | | | | | | | |
| 98101 | | | | | | | | | | | | |
* Each Trustee is subject to mandatory retirement at age 72.
# Ms. Cavanaugh is also an officer and/or director of one or more affiliates of RIC, RIF and RET and is therefore classified as an Interested Trustee.
## Mr. Connealy is an officer of a broker-dealer that distributes shares of the Funds and is therefore classified as an Interested Trustee.
### Mr. Fine is classified as an Interested Trustee due to Ms. Cavanaugh’s service on the Board of Directors of the United Way of King County, WA (“UWKC”) and in light of charitable contributions made by Russell Investments to UWKC. Effective December 31, 2013, Mr. Fine retired from the Board and no longer serves as a Trustee.
84 Disclosure of Information about Fund Trustees and Officers
Russell Investment Funds
LifePoints® Funds Variable Target Portfolio Series
Disclosure of Information about Fund Trustees and Officers, continued —
December 31, 2013 (Unaudited)
| | | | | | | | | | | No. of | | |
| | | | | | | | | | | Portfolios | | |
| | | | | | | | | | | in Russell | | Other |
| | | Positions(s) Held | | | | | | | | Fund | | Directorships |
| Name, | | With Fund and | | Term | | | | Principal Occupation(s) | | Complex | | Held by Trustee |
| Age, | | Length of | | of | | | | During the | | Overseen | | During the |
| Address | | Time Served | | Office | | | | Past 5 Years | | by Trustee | | Past 5 Years |
| |
| INDEPENDENT TRUSTEES | | | | | | | | | | | | |
| Thaddas L. Alston, | | Trustee since 2006 | | Appointed until | | • | | Senior Vice President, Larco | | 47 | | None |
| Born April 7, 1945 | | | | successor is | | | | Investments, Ltd. (real estate firm) | | | | |
| | | Chairman of the | | duly elected and | | | | | | | | |
| 1301 Second Avenue, | | Investment Committee | | qualified | | | | | | | | |
| 18th Floor, Seattle, WA | | since 2010 | | | | | | | | | | |
| 98101 | | | | Appointed until | | | | | | | | |
| | | | | successor is | | | | | | | | |
| | | | | duly elected and | | | | | | | | |
| | | | | qualified | | | | | | | | |
| |
| |
| |
| |
| Kristianne Blake, | | Trustee since 2000 | | Appointed until | | • | | Director and Chairman of the | | 47 | | •Director, |
| Born January 22, 1954 | | | | successor is | | | | Audit Committee, Avista Corp | | | | Avista Corp |
| | | Chairman since 2005 | | duly elected and | | | | (electric utilities) | | | | (electric |
| 1301 Second Avenue, | | | | qualified | | • | | Regent, University of Washington | | | | utilities); |
| 18 th Floor, Seattle, WA | | | | | | • | | President, Kristianne Gates Blake, | | | | •Until |
| 98101 | | | | Annual | | | | P. S. (accounting services) | | | | December 31, |
| | | | | | | • | | Until December 31, 2013, Trustee | | | | 2013, Trustee, |
| | | | | | | | | and Chairman of the Operations | | | | Principal |
| | | | | | | | | Committee, Principal Investors | | | | Investors Funds |
| | | | | | | | | Funds and Principal Variable | | | | (investment |
| | | | | | | | | Contracts Funds (investment | | | | company); |
| | | | | | | | | company) | | | | •Until |
| | | | | | | | | | | | | December 31, |
| | | | | | | | | | | | | 2013, Trustee |
| | | | | | | | | | | | | Principal |
| | | | | | | | | | | | | Variable |
| | | | | | | | | | | | | Contracts |
| | | | | | | | | | | | | Funds |
| | | | | | | | | | | | | (investment |
| | | | | | | | | | | | | company) |
| |
| |
| Cheryl Burgermeister, | | Trustee since 2012 | | Appointed until | | • | | Retired | | 47 | | •Trustee and |
| Born June 26, 1951 | | | | successor is | | • | | Trustee and Chairperson of Audit | | | | Chairperson |
| | | | | duly elected and | | | | Committee, Select Sector SPDR | | | | of Audit |
| 1301 Second Avenue, | | | | qualified | | | | Funds (investment company) | | | | Committee, |
| 18 th Floor, Seattle, WA | | | | | | • | | Trustee and Finance Committee | | | | Select Sector |
| 98101 | | | | | | | | Member/Chairman, Portland | | | | SPDR Funds |
| | | | | | | | | Community College (charitable | | | | (investment |
| | | | | | | | | organization) | | | | company) |
| | | | | | | | | | | | | •Trustee, ALPS |
| | | | | | | | | | | | | Series Trust |
| | | | | | | | | | | | | (investment |
| | | | | | | | | | | | | company) |
Disclosure of Information about Fund Trustees and Officers 85
Russell Investment Funds
LifePoints® Funds Variable Target Portfolio Series
Disclosure of Information about Fund Trustees and Officers, continued —
December 31, 2013 (Unaudited)
| | | | | | | | | | | No. of | | |
| | | | | | | | | | | Portfolios | | |
| | | | | | | | | | | in Russell | | Other |
| | | Position(s) Held | | | | | | | | Fund | | Directorships |
| Name, | | With Fund and | | Term | | | | Principal Occupation(s) | | Complex | | Held by Trustee |
| Age, | | Length of | | of | | | | During the | | Overseen | | During the |
| Address | | Time Served | | Office* | | | | Past 5 Years | | by Trustee | | Past 5 Years |
| |
| INDEPENDENT TRUSTEES (continued) | | | | | | | | | | |
| Katherine W. Krysty**, | | Trustee since 2014 | | Appointed until | | • | | Retired | | 47 | | None |
| Born December 3, 1951 | | | | successor is | | • | | Until February 2013, President | | | | |
| | | | | duly elected and | | | | Emerita, Laird Norton Wealth | | | | |
| 1301 Second Avenue, | | | | qualified | | | | Management (investments company) | | | | |
| 18th Floor, Seattle, WA | | | | | | • | | April 2003 to December 2010, Chief | | | | |
| 98101 | | | | | | | | Executive Officer of Laird Norton | | | | |
| | | | | | | | | Wealth Management (investment | | | | |
| | | | | | | | | company) | | | | |
| |
| |
| Raymond P. Tennison, Jr. , | | Trustee since 2000 | | Appointed until | | • | | Vice Chairman of the Board, | | 47 | | None |
| Born December 21, 1955 | | | | successor is | | | | Simpson Investment Company | | | | |
| | | Chairman of | | duly elected and | | | | (paper and forest products) | | | | |
| 1301 Second Avenue | | the Nominating | | qualified | | • | | Until November 2010, President, | | | | |
| 18 th Floor, Seattle, WA | | and Governance | | | | | | Simpson Investment Company | | | | |
| 98101 | | Committee since | | Appointed until | | | | and several additional subsidiary | | | | |
| | | 2007 | | successor is | | | | companies, including Simpson | | | | |
| | | | | duly elected and | | | | Timber Company, Simpson Paper | | | | |
| | | | | qualified | | | | Company and Simpson Tacoma | | | | |
| | | | | | | | | Kraft Company | | | | |
| |
| |
| Jack R. Thompson, | | Trustee since 2005 | | Appointed until | | • | | September 2003 to September | | 47 | | •Director, |
| Born March 21, 1949 | | | | successor is | | | | 2009, Independent Board Chair | | | | Board Chairman |
| | | Chairman of the | | duly elected and | | | | and Chairman of the Audit | | | | and Chairman |
| 1301 Second Avenue, | | Audit Committee | | qualified | | | | Committee, Sparx Asia Funds | | | | of the Audit |
| 18 th Floor, Seattle, WA | | since 2012 | | | | | | (investment company) | | | | Committee, |
| 98101 | | | | Appointed until | | • | | September 2007 to September | | | | Life Vantage |
| | | | | successor is | | | | 2010, Director, Board Chairman | | | | Corporation |
| | | | | duly elected and | | | | and Chairman of the Audit | | | | until September |
| | | | | qualified | | | | Committee, LifeVantage | | | | 2010 (health |
| | | | | | | | | Corporation (health products | | | | products |
| | | | | | | | | company) | | | | company); |
| | | | | | | | | | | | | •Director, Sparx |
| | | | | | | | | | | | | Asia Funds |
| | | | | | | | | | | | | until 2009 |
| | | | | | | | | | | | | (investment |
| | | | | | | | | | | | | company) |
| |
| |
| Julie W. Weston***, | | Trustee since 2002 | | Appointed until | | • | | Retired | | 47 | | None |
| Born October 2, 1943 | | | | successor is | | | | | | | | |
| | | | | duly elected and | | | | | | | | |
| 1301 Second Avenue, | | | | qualified | | | | | | | | |
| 18 th Floor, Seattle, WA | | | | | | | | | | | | |
| 98101 | | | | | | | | | | | | |
| * | Each Trustee is subject to mandatory retirement at age 72. |
| ** | Ms. Krysty was elected to the Board of Trustees effective January 1, 2014. |
***Effective December 31, 2013, Ms. Weston retired from the board and no longer serves as Trustee.
86 Disclosure of Information about Fund Trustees and Officers
Russell Investment Funds
LifePoints® Funds Variable Target Portfolio Series
Disclosure of Information about Fund Trustees and Officers, continued —December 31, 2013 (Unaudited)
| | | | | | | | | | | No. of | | |
| | | | | | | | | | | Portfolios | | |
| | | | | | | | | | | in Russell | | Other |
| | | Position(s) Held | | | | | | | | Fund | | Directorships |
| Name, | | With Fund and | | Term | | | | Principal Occupation(s) | | Complex | | Held by Trustee |
| Age, | | Length of | | of | | | | During the | | Overseen | | During the |
| Address | | Time Served | | Office* | | | | Past 5 Years | | by Trustee | | Past 5 Years |
| |
| TRUSTEE EMERITUS | | | | | | | | | | | | |
| George F. Russell, Jr. , | | Trustee Emeritus and | | Until resignation | | • | | Director Emeritus, Frank Russell | | 47 | | None |
| Born July 3, 1932 | | Chairman Emeritus | | or removal | | | | Company (investment consultant | | | | |
| | | since 1999 | | | | | | to institutional investors (“FRC”)) | | | | |
| 1301 Second Avenue, | | | | | | | | and RIMCo | | | | |
| 18th Floor, Seattle, WA | | | | | | • | | Chairman Emeritus, RIC and | | | | |
| 98101 | | | | | | | | RIF; Russell Implementation | | | | |
| | | | | | | | | Services Inc. (broker-dealer and | | | | |
| | | | | | | | | investment adviser (“RIS”)); | | | | |
| | | | | | | | | Russell 20-20 Association | | | | |
| | | | | | | | | (non-profit corporation); and | | | | |
| | | | | | | | | Russell Trust Company | | | | |
| | | | | | | | | (non-depository trust company | | | | |
| | | | | | | | | (“RTC”)) | | | | |
| | | | | | | • | | Chairman, Sunshine Management | | | | |
| | | | | | | | | Services, LLC (investment adviser) | | | | |
Disclosure of Information about Fund Trustees and Officers 87
Russell Investment Funds
LifePoints® Funds Variable Target Portfolio Series
Disclosure of Information about Fund Trustees and Officers, continued —December 31, 2013 (Unaudited)
| | | Positions(s) Held | | | | | | |
| Name, | | With Fund and | | Term | | | | Principal Occupation(s) |
| Age, | | Length of | | of | | | | During the |
| Address | | Time Served | | Office | | | | Past 5 Years |
| |
| OFFICERS | | | | | | | | |
| Cheryl Wichers, | | Chief Compliance | | Until removed | | • | | Chief Compliance Officer, RIC, RIF and RET |
| Born December 16, 1966 | | Officer since 2005 | | by Independent | | • | | Chief Compliance Officer, RFSC and U. S. One Inc. |
| | | | | Trustees | | • | | 2005-2011 Chief Compliance Officer, RIMCo |
| 1301 Second Avenue | | | | | | | | |
| 18th Floor, Seattle, WA | | | | | | | | |
| 98101 | | | | | | | | |
| |
| |
| Sandra Cavanaugh, | | President and Chief | | Until successor | | • | | CEO, U. S. Private Client Services, Russell Investments |
| Born May 10, 1954 | | Executive Officer | | is chosen and | | • | | President and CEO, RIC, RIF and RET |
| | | since 2010 | | qualified by | | • | | Chairman of the Board, Co-President and CEO, RFS |
| 1301 Second Avenue, | | | | Trustees | | • | | Chairman of the Board, President and CEO, RFSC |
| 18 th Floor, Seattle, WA | | | | | | • | | Director, RIMCo |
| 98101 | | | | | | • | | May 2009 to December 2009, Executive Vice President, Retail |
| | | | | | | | | Channel, SunTrust Bank |
| | | | | | | • | | 2007 to January 2009, Senior Vice President, National Sales — |
| | | | | | | | | Retail Distribution, JPMorgan Chase/Washington Mutual, Inc. |
| |
| |
| |
| Mark E. Swanson, | | Treasurer and Chief | | Until successor | | • | | Treasurer, Chief Accounting Officer and CFO, RIC, RIF and |
| Born November 26, 1963 | | Accounting Officer | | is chosen and | | | | RET |
| | | since 1998 | | qualified by | | • | | Director, RIMCo, RFSC, Russell Trust Company (“RTC”) |
| 1301 Second Avenue | | | | Trustees | | | | and RFS |
| 18 th Floor, Seattle, WA | | | | | | • | | Head of North America Operations, Russell Investments |
| 98101 | | | | | | • | | May 2009 to October 2011, Global Head of Fund Operations, |
| | | | | | | | | Russell Investments |
| | | | | | | • | | 1999 to May 2009, Director, Fund Administration |
| |
| |
| Jeffrey T. Hussey | | Chief Investment | | Until removed by | | • | | Global Chief Investment Officer, Russell Investments |
| Born May 2, 1969 | | Officer since 2013 | | Trustees | | • | | Chief Investment Officer, RIC, RIF and RET |
| | | | | | | • | | Chairman of the Board, President and CEO, RIMCo |
| 1301 Second Avenue, | | | | | | • | | Director, RTC, RIS and Russell Investments Delaware, Inc. |
| 18 th Floor, Seattle WA | | | | | | • | | Board of Managers, Russell Institutional Funds |
| 98101 | | | | | | | | Management, Inc. |
| | | | | | | • | | 2008 to 2013 Chief Investment Officer, Fixed Income, |
| | | | | | | | | Russell Investments |
| |
| |
| Mary Beth Rhoden | | Secretary since 2010 | | Until successor | | • | | Associate General Counsel, Russell Investments |
| Albaneze, | | | | is chosen and | | • | | Secretary, RIMCo, RFSC and RFS |
| Born April 25, 1969 | | | | qualified by | | • | | Secretary and Chief Legal Officer, RIC, RIF and RET |
| | | | | Trustees | | • | | Assistant Secretary, RFS, RIA and U. S. One Inc. |
| 1301 Second Avenue, | | | | | | • | | 1999 to 2010 Assistant Secretary, RIC and RIF |
| 18 th Floor, Seattle, WA | | | | | | | | |
| 98101 | | | | | | | | |
88 Disclosure of Information about Fund Trustees and Officers
Russell Investment Funds
LifePoints® Funds Variable Target Portfolio Series
1301 Second Avenue, Seattle, Washington 98101
(800) 787-7354
| Interested Trustees | | Administrator, Transfer and Dividend Disbursing |
| Sandra Cavanaugh | | Agent |
| Daniel P. Connealy | | Russell Fund Services Company |
| Jonathan Fine(1) | | 1301 Second Avenue |
| Independent Trustees | | Seattle, WA 98101 |
| Thaddas L. Alston | | Custodian |
| Kristianne Blake | | State Street Bank and Trust Company |
| Cheryl Burgermeister | | 1200 Crown Colony Drive |
| Katherine W. Krysty(2) | | Crown Colony Office Park |
| Raymond P. Tennison, Jr. | | Quincy, MA 02169 |
| Jack R. Thompson | | |
| Julie W. Weston(1) | | Office of Shareholder Inquiries |
| | | 1301 Second Avenue |
| Trustee Emeritus | | Seattle, WA 98101 |
| George F. Russell, Jr. | | (800) 787-7354 |
| Officers | | Legal Counsel |
| Sandra Cavanaugh, President and Chief Executive Officer | | Dechert LLP |
| Cheryl Wichers, Chief Compliance Officer | | One International Place, 40th Floor |
| Jeffrey T. Hussey, Chief Investment Officer | | 100 Oliver Street |
| Mark E. Swanson, Treasurer and Chief Accounting Officer | | Boston, MA 02110-2605 |
| Mary Beth Rhoden Albaneze, Secretary | | Distributor |
| Adviser | | Russell Financial Services, Inc. |
| Russell Investment Management Company | | 1301 Second Avenue |
| 1301 Second Avenue | | Seattle, WA 98101 |
| Seattle, WA 98101 | | Independent Registered Public Accounting Firm |
| | | PricewaterhouseCoopers LLP |
| | | 1420 5th Avenue, Suite 1900 |
| | | Seattle, WA 98101 |
(1) Effective December 31, 2013, Mr. Fine and Ms. Weston retired from the Board and no longer serve as Trustees of the Trust.
(2) Ms. Krysty was elected to the Board of Trustees effective January 1, 2014.
This report is prepared from the books and records of the Funds and is submitted for the general information of shareholders and is not authorized for distribution to prospective investors unless accompanied or preceded by an effective Prospectus. Nothing herein contained is to be considered an offer of sale or a solicitation of an offer to buy shares of Russell Investment Funds. Such offering is made only by Prospectus, which includes details as to offering price and other material information.
Adviser and Service Providers 89

Russell Investment Funds 1301 Second Avenue 800-787-7354 Seattle, Washington 98101 Fax: 206-505-3495 www.russell.com
Item 2. Code of Ethics. [Annual Report Only]
| (a) | As of the end of the period covered by the report, the registrant has adopted a code of ethics that applies to the registrant's principal executive officer and principal financial officer (“Code”) . |
| (b) | That Code comprises written standards that are reasonably designed to deter wrongdoing and to promote: |
| | 1) | honest and ethical conduct, including the ethical handling of actual or apparent conflicts of interest between personal and professional relationships; |
| | 2) | full, fair, accurate, timely and understandable disclosure in reports and documents that a registrant files with, or submits to, the Securities and Exchange Commission (“SEC”) and in other public communications made by each Mutual Fund; |
| | 3) | compliance with applicable governmental laws, rules and regulations; |
| | 4) | the prompt internal reporting of violations of the Code to an appropriate person or persons identified in the Code; and |
| | 5) | accountability for adherence to the Code. |
| (c) | The Code was restated as of August 2013; the restatement did not involve any material change. |
| (d) | As of the end of the period covered by the report, there have been no waivers granted from a provision of the Code that applies to the registrant’s principal executive officer and principal financial officer. |
| (e) | Not applicable. |
| (f) | The registrant has filed with the SEC, pursuant to Item 12(a)(1), a copy of the Code that applies to the registrant’s principal executive officer, principal financial officer, principal accounting officer or controller, or persons performing similar functions, as an exhibit to its annual report on this Form N-CSR. |
Item 3. Audit Committee Financial Expert. [Annual Report Only]
Registrant's board of trustees has determined that the Registrant has at least one audit committee financial expert serving on its audit committee. Jack R. Thompson has been determined to be the Audit Committee Financial Expert and is also determined to be “independent” for purposes of Item 3, paragraph (a)(2)(i) and (ii) of Form N-CSR
Item 4. Principal Accountant Fees and Services. [Annual Report Only] Audit Fees
(a) The aggregate fees billed for each of the last two fiscal years for professional services rendered by the principal accountant for the audit of the registrant’s annual financial statements or services that are normally provided by the accountant in connection with statutory and regulatory filings or engagements for those fiscal years were as follows: 2012 $240,000 2013 $226,456
Audit-Related Fees
(b) The aggregate fees billed in each of the last two fiscal years for assurance and related services by the principal accountant that are reasonably related to the performance of the audit of the registrant’s financial statements and are not reported under paragraph (a) of this Item and the nature of the services comprising those fees were as follows:
| | | Fees | | Nature of Services |
| |
| 2012 | | $ | | 86,500 | | Tax auditing services |
| 2013 | | $ | | 80,000 | | Tax auditing services |
Tax Fees
(c) The aggregate fees billed in each of the last two fiscal years for professional services rendered by the principal accountant for tax compliance, tax advice, and tax planning and the nature of the services comprising the fees were as follows:
| | | Fees | | Nature of Services |
| |
| 2012 | | $ | | 73,500 | | Tax filing services |
| 2013 | | $ | | 56,650 | | Tax filing services |
All Other Fees
(d) The aggregate fees billed in each of the last two fiscal years for products and services provided by the principal accountant, other than the services reported in paragraphs (a) through (c) of this Item and the nature of the services comprising those fees were as follows:
| | | Fees | | Nature of Services |
| |
| 2012 | | $ | | 0 | | |
| 2013 | | $ | | 0 | | |
(e) (1) Registrant’s audit committee has adopted the following pre-approval policies and procedures for certain services provided by Registrant’s accountants:
Russell Investment Company
Russell Investment Funds
Russell Exchange Traded Funds Trust
Audit and Non-Audit Services Pre-Approval Policy
Effective Date: August 30, 2013
I. Statement of Purpose.
This Policy has been adopted by the joint Audit Committee (the “Audit Committee”) of Russell Investment Company (“RIC”), Russell Investment Funds (“RIF”) and Russell Exchange Traded Funds Trust (“RET”) to apply to any and all engagements of the independent auditor to RIC, RIF and RET, respectively, for audit, non-audit, tax or other services. The term “Fund” shall collectively refer to RIC, RIF and RET. The term “Investment Adviser” shall refer to the Funds’ advisor, Russell Investment Management Company (“RIMCo”). This Policy does not delegate to management the responsibilities set forth herein for the pre-approval of services performed by the Funds’ independent auditor.
II. Statement of Principles.
Under the Sarbanes-Oxley Act of 2002 (the “Act”), the Audit Committee of a Fund’s Board of Trustees (the “Audit Committee”) is charged with responsibility for the appointment, compensation and oversight of the work of the independent auditor for the fund. As part of these responsibilities, the Audit Committee is required to pre-approve the audit services and permissible non-audit services (“non-audit services”) performed by the independent auditor for the fund to assure that the independence of the auditor is not in any way compromised or impaired. In determining whether an auditor is independent, there are three guiding principles under the Act that must be considered. In general, the independence of the auditor to the fund would be deemed impaired if the auditor provides a service whereby it:
Functions in the role of management of the fund, the adviser of the fund or any other affiliate* of the fund;
Is in the position of auditing its own work; or
Serves in an advocacy role for the fund, the adviser of the fund or any other affiliate of the fund.
Accordingly, it is the Funds’ policy that the independent auditor for the Funds must not be engaged to perform any service that contravenes any of the three guidelines set forth above, or which in any way could be deemed to impair or compromise the independence of the auditor for the Funds. This Policy is designed to accomplish those requirements and will henceforth be applied to all engagements by the Funds of its independent auditor, whether for audit, audit-related, tax, or other non-audit services.
* For purposes of this Policy, an affiliate of the Funds is defined as the Funds’ investment adviser (but not a sub-adviser whose role is primarily portfolio management and whose activities are overseen by the principal investment adviser), and any entity controlling, controlled by, or under common control with the investment adviser that provides ongoing services to the Fund.
Rules adopted by the United States Securities and Exchange Commission (the “SEC”) establish two distinct approaches to the pre-approval of services by the Audit Committee. The proposed services either may receive general pre-approval through adoption by the Audit Committee of a list of authorized services for the fund, together with a budget of expected costs for those services (“general pre-approval”), or specific pre-approval by the Audit Committee of all services provided to the fund on a case-by-case basis (“specific pre-approval”).
The Funds’ Audit Committee believes that the combination of these two approaches reflected in this Policy will result in an effective and efficient procedure for the pre-approval of permissible services performed by the Funds’ independent audit. The Funds’ Audit and Non-Audit Pre-Approved Services Schedule lists the audit, audit-related, tax and other services that have the general pre-approval of the Audit Committee. As set forth in this Policy, unless a particular service has received general pre-approval, those services will require specific pre-approval by the Audit Committee before any such services can be provided by the independent auditor. Any proposed service to the Funds that exceeds the pre-approved budget for those services will also require specific pre-approval by the appropriate Audit Committee.
In assessing whether a particular audit or non-audit service should be approved, the Audit Committee will take into account the ratio between the total amounts paid for audit, audit-related, tax and other services, based on historical patterns, with a view toward assuring that the level of fees paid for non-audit services as they relate to the fees paid for audit services does not compromise or impair the independence of the auditor. The Audit Committee will review the list of general pre-approved services, including the pre-approved budget for those services, at least annually and more frequently if deemed appropriate by the Audit Committee, and may implement changes thereto from time to time.
III. Delegation.
As provided in the Act and in the SEC’s rules, the Audit Committee from time to time may delegate either general or specific pre-approval authority to one or more of its members. Any member to whom such authority is delegated must report, for informational purposes only, any pre-approval decisions to the Audit Committee at its next scheduled meeting.
IV. Audit Services.
The annual audit services engagement terms and fees for the independent auditor for the Funds require specific pre-approval of the Audit Committee. Audit services include the annual financial statement audit and other procedures required to be performed by the independent auditor in order to be able to form an opinion on the financial statements for the Funds for that year. These other procedures include reviews of information systems, procedural reviews and testing performed in order to understand and rely on the Funds’ systems of internal control, and consultations relating to the audit. Audit services also include the attestation engagement for the independent auditor’s report on the report from management on financial reporting internal controls. The Audit Committee will review the audit services engagement as necessary or appropriate in the sole judgment of the Audit Committee.
In addition to the pre-approval by the Audit Committee of the annual engagement of the independent auditor to perform audit services, the Audit Committee may grant general pre-approval to other audit services, which are those services that only the independent auditor reasonably can provide. These may include statutory audits and services associated with the Funds’ SEC registration statement on Form N-1A, periodic reports and documents filed with the SEC or other documents issued in connection with the Funds’ securities offerings.
The Audit Committee has pre-approved the audit services set forth in Schedule A of the Audit and Non-Audit Pre-Approved Services Schedule. All other audit services not listed in Schedule A of the Audit and Non-Audit Pre-Approved Services Schedule must be specifically pre-approved by the Audit Committee.
V. Audit-Related Services.
Audit-related services are assurance and related services that are reasonably related to the performance of the audit or review of the financial statements for the Funds, or the separate financial statements for a series of the Funds that are traditionally performed by the independent auditor. Because the Audit Committee believes that the provision of audit-related services does not compromise or impair the independence of the auditor and is consistent with the SEC’s rules on auditor independence, the Audit Committee may grant pre-approval to audit related services. “Audit related services” include, among others, accounting consultations related to accounting, financial reporting or disclosure matters not classified as “audit services;” assistance with understanding and implementing new accounting and financial report or disclosure matters not classified as “audit services;” assistance with understanding and implementing new accounting and financial reporting guidance from rulemaking authorities; agreed upon or expanded audit procedures related to accounting and/or billing records required to respond to or comply with financial, accounting or regulatory reporting matters; and assistance with internal reporting requirements under Form N-SAR and Form N-CSR.
The Audit Committee has pre-approved the audit-related services set forth in Schedule B of the Audit and Non-Audit Pre-Approved Services Schedule. All other audit-related services not listed in Schedule B of the Audit and Non-Audit Pre-Approved Services Schedule must be specifically pre-approved by the Audit Committee.
VI. Tax Services.
The Audit Committee believes that the independent auditor can provide tax services to the Funds, such as tax compliance, tax planning and tax advice, without impairing the auditor’s independence and the SEC has stated that the independent auditor may provide such services. Consequently, the Audit Committee believes that it may grant general pre-approval to those tax services that have historically been provided by the auditor, that the Audit Committee has reviewed and believes would not impair the independence of the auditor, and that are consistent with the SEC’s rules on auditor independence. However, the Audit Committee will not permit the retention of the independent auditor to provide tax advice in connection with any transaction recommended by the independent auditor, the sole business purpose of which may be tax
avoidance and the tax treatment of which may not be supported by the United States Internal Revenue Code and related regulations or the applicable tax statutes and regulations that apply to the Funds’ investments outside the United States. The Audit Committees will consult with the Treasurer of the Funds or outside counsel to determine that the Funds’ tax planning and reporting positions are consistent with this policy.
The Audit Committee has pre-approved the tax services set forth in Schedule C of the Audit and Non-Audit Pre-Approved Services Schedule. All other tax services not listed in Schedule C of the Audit and Non-Audit Pre-Approved Services Schedule must be specifically pre-approved by the Audit Committee.
VII. All Other Services.
The Audit Committee believes, based on the SEC’s rules prohibiting the independent auditor from providing specific non-audit services, that other types of non-audit services are permitted. Accordingly, the Audit Committee believes that it may grant general pre-approval to those permissible non-audit services classified as “all other” services that the Audit Committee believes are routine and recurring services, would not impair or compromise the independence of the auditor and are consistent with the SEC’s rules on auditor independence.
The Audit Committee has pre-approved the permissible “all other services” set forth in Schedule D of the Audit and Non-Audit Pre-Approved Services Schedule. Permissible “all other services” not listed in Schedule D of the Audit and Non-Audit Pre-Approved Services Schedule must be specifically pre-approved by the Audit Committee.
A list of the SEC’s prohibited non-audit services are as follows:
Bookkeeping or other services relating to the accounting records or financial statements of the Funds
Financial information system design and implementation
Appraisal or valuation services, fairness opinions or contribution-in-kind reports
Actuarial services
Internal audit outsourcing services
Management functions
Human resources services
Broker-dealer, investment adviser or investment banking services
Legal services
· Expert services unrelated to the audit
The SEC’s rules and relevant official interpretations and guidance should be consulted to determine the scope of these prohibited services and the applicability of any exceptions to certain of the prohibitions. Under no circumstance may an executive, manager or associate of the Funds, or the Investment Advisor, authorize the independent auditor for the Funds to provide prohibited non-audit services.
VIII. Pre-Approval Fee Levels or Budgeted Amounts.
Pre-Approval fee levels or budgeted amounts for all services to be provided by the independent auditor will be established annually by the Audit Committee and shall be subject to periodic subsequent review during the year if deemed appropriate by the Audit Committee (separate amounts may be specified for the Fund and for other affiliates in the investment company complex subject to pre-approval). Any proposed services exceeding these levels or amounts will require specific pre-approval by the Audit Committee. The Audit Committee will be mindful of the overall relationship of fees for audit and non-audit services in determining whether to pre-approve any such services. For each fiscal year, the Audit Committee may determine the appropriateness of the ratio between the total amount of fees for Audit, Audit-related, and Tax services for the Funds (including any Audit-related or Tax services fees for affiliates subject to pre-approval), and the total amount of fees for certain permissible non-audit services classified as “all other services” for the Funds (including any such services for affiliates subject to pre-approval by the Audit Committee).
IX. Procedures.
All requests or applications for services to be provided by the independent auditor that do not require specific pre-approval by the Audit Committee will be submitted to the “RIC/RIF/RET Clearance Committee” (the “Clearance Committee”) (which shall be comprised of not less than three members, including the Treasurer of the Funds who shall serve as its Chairperson) and must include a detailed description of the services to be rendered and the estimated costs of those services. The Clearance Committee will determine whether such services are included within the list of services that have received general pre-approval by the Audit Committee. The Audit Committee will be informed not less frequently than quarterly by the Chairperson of the Clearance Committee of any such services rendered by the independent auditor for the Funds and the fees paid to the independent auditors for such services.
Requests or applications to provide services that require specific pre-approval by the Audit Committee will be submitted to the Audit Committee by both the independent auditor and the Clearance Committee and must include a joint certification by the engagement partner of the independent auditor and the Chairperson of the Clearing Committee that, in their view, the request or application is consistent with the SEC’s rules governing auditor independence.
The Internal Audit Department of Frank Russell Company, the parent company of RIMCo, and the officers of RIC, RIF and RET will report to the Chairman of the Audit Committee any breach
of this Policy that comes to the attention of the Internal Audit Department of Frank Russell Company or an officer of RIC, RIF or RET.
X. Additional Requirements.
The Audit Committee has determined to take additional measures on an annual basis to meet its responsibility to oversee the work performed by the independent auditor and to assure the independent auditor’s continuing independence from the Funds and its affiliates, including Frank Russell Company. Such efforts will include, but not be limited to, reviewing a written annual statement from the independent auditor delineating all relationships between the independent auditor and RIC, RIF, RET and Frank Russell Company and its subsidiaries and affiliates, consistent with Independence Standards Board Standard No. 1, and discussing with the independent auditor its methods and procedures for ensuring its independence.
(e) (2) The percentage of services described in each of paragraphs (b) through (d) of this Item that were approved by the audit committee pursuant to paragraph (c)(7)(i)(C) of Rule 2-01 of Regulation S-X is as follows:
| Audit Fees | | 0% |
| Audit-Related Fees | | 0% |
| Tax Fees | | 0% |
| All Other Fees | | 0% |
(f) For services, 50 percent or more of which were pre-approved, the percentage of hours expended on the principal accountant’s engagement to audit the registrant’s financial statements for the most recent fiscal year that were attributed to work performed by persons other than the principal accountant’s full-time, permanent employees was 0%.
(g) The aggregate non-audit fees billed by registrant’s accountant for services rendered to the registrant, and rendered to the registrant’s investment adviser (not including any sub-adviser whose role is primarily portfolio management and is subcontracted with or overseen by another investment adviser), and any entity controlling, controlled by, or under common control with the adviser that provides ongoing services to the registrant for each of the last two fiscal years of the registrant were as follows: 2012 $ 0 2013 $ 0
(h) The registrant’s audit committee of the board of trustees has considered whether the provision of nonaudit services that were rendered to the registrant’s investment adviser (not including any subadviser whose role is primarily portfolio management and is subcontracted with or overseen by another investment adviser), and any entity controlling, controlled by, or under common control with the investment adviser that provides ongoing services to the registrant that were not pre-approved pursuant to paragraph (c)(7)(ii) of Rule 2-01 of Regulation S-X is compatible with maintaining the principal accountant’s independence.
Item 5. Audit Committee of Listed Registrants. [Not Applicable]
Item 6. [Schedules of Investments are included as part of the Report to Shareholders filed under Item 1 of this form]
Items 7-9. [Not Applicable]
Item 10. Submission of Matters to a Vote of Security Holders
There have been no changes to the procedures by which shareholders may recommend nominees to the Registrant’s Board of Trustees that would require disclosure herein.
Item 11. Controls and Procedures
(a) Registrant's principal executive officer and principal financial officer have concluded that Registrant's disclosure controls and procedures (as defined in Rule 30a-2(c) under the Investment Company Act of 1940 (the “Act”)) are effective, based on their evaluation of these controls and procedures as of a date within 90 days of the date this report is filed with the Securities and Exchange Commission.
(b) There were no significant changes in Registrant's internal control over financial reporting that occurred during the period covered by this report that has materially affected or is likely to materially affect Registrant's internal control over financial reporting.
Item 12. Exhibit List
(a) Registrant’s code of ethics described in Item 2.
(b) Certification for principal executive officer of Registrant as required by Rule 30a-2(a) under the Act and certification for principal financial officer of Registrant as required by Rule 30a-2(a) under the Act.
SIGNATURES
Pursuant to the requirements of the Securities Exchange Act of 1934 and the Investment Company Act of 1940, the Registrant has duly caused this report to be signed on its behalf by the undersigned, thereunto duly authorized.
Russell Investment Funds
| By: | | /s/ Sandra Cavanaugh |
| | | Sandra Cavanaugh |
| | | Principal Executive Officer and Chief Executive Officer |
Date: February 24, 2014
Pursuant to the requirements of the Securities Exchange Act of 1934 and the Investment Company Act of 1940, this report has been signed below by the following persons on behalf of the Registrant and in the capacities and on the dates indicated.
| By: | | /s/ Sandra Cavanaugh |
| | | Sandra Cavanaugh |
| | | Principal Executive Officer and Chief Executive Officer |
Date: February 24, 2014
| By: | | /s/ Mark E. Swanson |
| | | Mark E. Swanson |
| | | Principal Financial Officer, Principal Accounting Officer and Treasurer |
Date: February 24, 2014
Exhibit (a)
RUSSELL INVESTMENT COMPANY RUSSELL INVESTMENT FUNDS
RUSSELL EXCHANGE TRADED FUNDS TRUST
CODE OF ETHICS FOR
SENIOR MUTUAL FUND OFFICERS
This Code of Ethics applies to the Chief Executive Officer and Chief Financial Officer (each, a “Senior Mutual Fund Officer”) of Russell Investment Company, Russell Investment Funds and Russell Exchange Traded Funds Trust (each, a “Mutual Fund”) and, pursuant to the Sarbanes-Oxley Act of 2002 is designated to promote:
| n | honest and ethical conduct, including the ethical handling of actual or apparent conflicts of interest between personal and professional relationships; |
| n | full, fair, accurate, timely and understandable disclosure in reports and documents that a registrant files with, or submits to, the Securities Exchange Commission (“SEC”) and in other public communications made by each Mutual Fund; |
| n | compliance with applicable laws and governmental rules and regulations; |
| n | the prompt internal reporting to an appropriate person or persons identified in this section of the Code of violations of this section of the Code; and |
| n | accountability for adherence to this section of the Code. |
I. SENIOR MUTUAL FUND OFFICERS SHOULD ACT HONESTLY AND CANDIDLY
Each Senior Mutual Fund Officer owes a duty to the Mutual Fund to act with integrity. Integrity requires, among other things, being honest and candid. Deceit and subordination of principle are inconsistent with integrity.
Each Senior Mutual Fund Officer must:
| n | act with integrity, including being honest and candid while still maintaining the confidentiality of information where required by law or the Mutual Fund’s policies; |
| n | observe both the form and spirit of laws and governmental rules and regulations, accounting standards and Mutual Fund policies; |
| n | adhere to a high standard of business ethics; and |
| n | place the interests of the Mutual Fund before the Senior Mutual Fund Officer’s own personal interests. |
| n | All activities of Senior Mutual Fund Officers should be guided by and adhere to these fiduciary standards. |
II. SENIOR MUTUAL FUND OFFICERS SHOULD HANDLE ETHICALLY ACTUAL AND APPARENT CONFLICTS OF INTEREST
Guiding Principles. A “conflict of interest” occurs when a Mutual Fund Officer’s private interest interferes with the interests of his or her service to the Mutual Fund. A conflict of interest can arise when a Senior Mutual Fund Officer takes actions or has interests that may make it difficult to perform his or her Mutual Fund work objectively and effectively. For example, a conflict of interest would arise if a Senior Mutual Fund Officer, or a member or his family, receives improper personal benefits as a result of his or her position in the Mutual Fund. In addition, Senior Mutual Fund Officers should be sensitive to situations that create apparent, not actual, conflicts of interest. Service to the Mutual Fund should never be subordinated to personal gain and advantage.
Certain conflicts of interest arise out of the relationships between Senior Mutual Fund Officers and the Mutual Fund that already are subject to conflict of interest provisions in the Investment Company Act and the Investment Advisers Act. For example, Senior Mutual Fund Officers may not individually engage in certain transactions (such as the purchase or sale of securities or other property) with the Mutual Fund because of their status as “affiliated persons” of the Mutual Fund. Therefore, the existing statutory and regulatory prohibitions on individual behavior will be deemed to be incorporated into this section of the Code and therefore any such violation will also be deemed a violation of this section of the Code. Senior Mutual Fund Officers must in all cases comply with applicable statutes and regulations.
As to conflicts arising from, or as a result of the contractual relationship between each Mutual Fund and its investment adviser of which the Senior Mutual Fund Officers are also officers or employees, it is recognized by the Board that, subject to the adviser’s fiduciary duties to the Mutual Fund, the Senior Mutual Fund Officers will in the normal course of their duties (whether formally for the Mutual Fund or for the adviser, or for both) be involved in establishing policies and implementing decisions which will have different effects on the adviser and the Mutual Fund. The Board recognizes that the participation of the Senior Mutual Fund Officers in such activities is inherent in the contractual relationship between the Mutual Fund and the adviser and is consistent with the expectation of the Board of the performance by the Senior Mutual Fund Officers of their duties as officers of the Mutual Fund. In addition, it is recognized by the Board that the Senior Mutual Fund Officers may also be officers or employees of other investment companies advised by the same adviser and the codes of those investment companies will apply to the Senior Mutual Fund Officers acting in those distinct capacities.
Each Senior Mutual Fund Officer must:
| n | avoid conflicts of interest wherever possible; |
| n | handle any actual or apparent conflict of interest ethically; |
| n | not use his or her personal influence or personal relationships to influence investment decisions or financial reporting by the Mutual Fund whereby the Senior Mutual Fund Officer would benefit personally to the detriment of the Mutual Fund; |
| n | not cause the Mutual Fund to take action, or fail to take action, for the personal benefit of the Senior Mutual Fund Officer rather than the benefit of the Mutual Fund; |
| n | not use material non-public knowledge of portfolio transactions made or contemplated for the Mutual Fund to trade personally or cause others to trade personally in contemplation of the market effect of such transactions; |
| n | as described in more detail below, discuss any material transaction or relationship that could reasonably be expected to give rise to a conflict of interest with the Mutual Fund’s Chief Legal Officer; and |
| n | report at least annually any affiliations or other relationships related to conflicts of interest as requested from time to time in the Mutual Fund’s directors & officers questionnaire. |
| | The Senior Mutual Fund Officers should follow the precepts and requirements of the |
Code as adopted by the Mutual Fund from time to time, including its policies regarding personal securities accounts, outside business affiliations, gifts and entertainment and conflicts of interests.
III. DISCLOSURE
Each Senior Mutual Fund Officer is required to be familiar with, and comply with the Mutual Fund's disclosure controls and procedures so that the Mutual Fund's reports and documents filed with the SEC and other public communications comply in all material respects with the applicable federal securities laws and SEC rules. In addition, each Senior Mutual Fund Officer having direct or supervisory authority regarding these SEC filings or the Mutual Fund's other public communications should, to the extent appropriate within his area of responsibility, consult with other Mutual Fund officers and employees and the adviser and take other appropriate steps regarding these disclosures with the goal of making full, fair, accurate, timely and understandable disclosure.
Each Senior Mutual Fund Officer must:
| n | familiarize himself or herself with the disclosure requirements generally applicable to the Mutual Fund; and |
| n | not knowingly misrepresent, or cause others to misrepresent, facts about the Mutual Fund to others, whether within or outside the Mutual Fund, including to the Mutual Fund’s auditors, independent directors, independent auditors, and to governmental regulators and self-regulatory organizations. |
IV. COMPLIANCE
It is the Mutual Fund’s policy to comply with all applicable laws and governmental rules and regulations. It is the personal responsibility of each Senior Mutual Fund Officer to adhere to the standards and restrictions imposed by those laws, rules and regulations, including those relating to affiliated transactions, accounting and auditing matters.
V. REPORTING AND ACCOUNTABILITY
Each Senior Mutual Fund Officer must:
| n | upon receipt of this Code, and annually thereafter acknowledge that he or she has read the Code, understood its provisions and agrees to abide by its requirements as set forth elsewhere in this Code; |
| n | not retaliate against any officer or employee of the Mutual Fund or their affiliated persons for reports of potential violations that are made in good faith; and |
| n | notify the Mutual Fund’s Chief Legal Officer promptly if he or she becomes aware of any existing or potential violation of this section of the Code. Failure to do so is itself a violation of this section of the Code. |
Except as described otherwise below, the Investment Company’s Chief Compliance
Officer is responsible for applying this section of the Code to specific situations in which
questions are presented to him or her and has the authority to interpret this section of the Code in any particular situation. The Investment Company’s Chief Compliance Officer shall take all action he or she considers appropriate to investigate any actual or potential violations reported to him or her.
The Mutual Fund’s Chief Compliance Officer is authorized to consult, as appropriate, with the Mutual Fund’s Chief Legal Officer, legal counsel to the Mutual Fund’s independent trustees, or the chair of the Audit Committee (the “Committee”), and is encouraged to do so.
The Committee is responsible for granting waivers and determining sanctions, as appropriate 1 . In addition, approvals, interpretations, or waivers sought by the Chief Executive Officer will be considered by the Committee.
The Funds will follow these procedures in investigating and enforcing this section of the Code:
| § | the Chief Legal Officer will take all appropriate action to investigate any potential violations reported to him or her; |
| § | if, after such investigation, the Chief Legal Officer believes that no violation has occurred, the Chief Legal Officer is not required to take any further action; |
| § | any matter that the Chief Legal Officer believes is a violation will be reported to the Committee; |
| § | if the Committee concurs that a violation has occurred, it will inform and make a recommendation to the Board, which will consider appropriate action, which may include review of, and appropriate modifications to, applicable policies and procedures; |
1 Item 2 of Form N-CSR defines “waiver” as “the approval by the registrant of a material departure from a provision of the code of ethics” and “implicit waiver,” which must also be disclosed, as “the registrant’s failure to take action within a reasonable period of time regarding a material departure from a provision of the code of ethics that has been made known to an executive officer” of the registrant.
notification to appropriate personnel of the adviser or its board; or a recommendation to dismiss the Mutual Fund Officer;
| § | the Committee will be responsible for granting waivers, as appropriate; and |
| § | any changes to or waivers of this section of the Code will, to the extent required, be disclosed as provided by SEC rules. |
VI. OTHER POLICIES AND PROCEDURES
The rest of this Code, including the Mutual Fund’s adviser’s and principal underwriter’s codes of ethics under Rule 17j-1 under the Investment Company Act and the more detailed policies and procedures set forth therein, are separate requirements applying to Senior Mutual Fund Officers and others, and are not part of this Section of the Code.
VII. AMENDMENTS
This section of the Code may not be amended except in a written document that is specifically approved by a majority vote of the Mutual Fund’s Board of Trustees, including a majority of independent trustees.
VIII. CONFIDENTIALITY
All reports and records prepared or maintained pursuant to this section of the Code shall be considered confidential and shall be maintained and protected accordingly. Except as otherwise required by law or this section of the Code, such matters shall not be disclosed to anyone other than the Mutual Fund’s Chief Compliance Officer, Chief Legal Officer, the members of the Board of Trustees and their counsels, the Mutual Fund and its adviser and principal underwriter and their legal counsel.
IX. INTERNAL USE
This section of the Code is intended solely for the internal use by each Mutual Fund and does not constitute an admission, by or on behalf of any Mutual Fund, as to any fact, circumstance, or legal conclusion.
Last Updated: August 26, 2013