UNITED STATES
SECURITIES AND EXCHANGE COMMISSION
Washington, D.C. 20549
FORM N-CSR
CERTIFIED SHAREHOLDER REPORT OF REGISTERED
MANAGEMENT INVESTMENT COMPANIES
Investment Company Act file number: 811-05371
Russell Investment Funds
(Exact name of registrant as specified in charter)
1301 2nd Avenue 18th Floor, Seattle Washington 98101
(Address of principal executive offices) (Zip code)
Mary Beth Rhoden, Secretary and Chief Legal Officer
Russell Investment Funds
1301 2nd Avenue
18th Floor
Seattle, Washington 98101
206-505-4846
(Name and address of agent for service)
Registrant’s telephone number, including area code: 206-505-7877
Date of fiscal year end: December 31
Date of reporting period: January 1, 2011 to December 31, 2011
Item 1. Reports to Stockholders

2011 ANNUAL REPORT
Russell
Investment Funds
DECEMBER 31, 2011
FUND
Multi-Style Equity Fund
Aggressive Equity Fund
Non-U.S. Fund
Core Bond Fund
Global Real Estate Securities Fund

Russell Investment Funds
Russell Investment Funds is a
series investment company with
ten different investment portfolios referred to as Funds. These
financial statements report on five
of these Funds.
Russell Investment Funds
Annual Report
December 31, 2011
Table of Contents
Russell Investment Funds
Copyright © Russell Investments 2012. All rights reserved.
Russell Investments is a Washington, USA corporation, which operates through subsidiaries worldwide and is a subsidiary of The Northwestern Mutual Life Insurance Company.
Fund objectives, risks, charges and expenses should be carefully considered before investing. A prospectus containing this and other important information must precede or accompany this material. Please read the prospectus carefully before investing.
Securities distributed through Russell Financial Services, Inc., member FINRA and part of Russell Investments.
Indices and benchmarks are unmanaged and cannot be invested in directly. Returns represent past performance, are not a guarantee of future performance, and are not indicative of any specific investment. Index return information is provided by vendors and although deemed reliable, is not guaranteed by Russell Investments or its affiliates.
Russell Investments is the owner of the trademarks, service marks, and copyrights related to its respective indexes.
Performance quoted represents past performance and does not guarantee future results. The investment return and principal value of an investment will fluctuate so that shares, when redeemed, may be worth more or less than their original cost. Current performance may be lower or higher than the performance data quoted.
To Our Shareholders
I am pleased to present you with Russell Investment Funds’ 2011 Annual Report for the fiscal year ending December 31, 2011. Inside you’ll find portfolio management discussions and fund performance information.
Although 2011 proved to be a challenging year for world markets, all of us at Russell remain focused on our primary mission — improving financial security for people.
For over 75 years, we’ve helped clients invest in all kinds of markets throughout the market cycle. During good times and uncertain times, we are guided by the same disciplined, long-term investment approach. We conduct our own objective research of worldwide capital markets and independent money managers, which allows us to build portfolios with a global perspective.
In 2011, we witnessed non-stop assaults on the world economy: an earthquake, tsunami and nuclear disaster in Japan; ongoing conflicts in the Middle East; a financial crisis in Europe centered in Greece, Italy and Spain; the downgrade of U.S. debt in the summer; and continued market volatility throughout the fall.
As of December 31, 2011, the broad global equity market, represented by the Russell Global Index, was down 7.67% year-to-date. Market volatility made the journey even more unsettling for many investors. To help you cope with such uncertain times, we suggest you work closely with your financial advisor.
Your advisor can help you focus on your investment goals and the plan to help you reach them. We also believe it’s important to talk with your advisor about the mix of investments in your portfolio to make sure you are comfortable with them and your investment time horizon.
Volatile markets — like those we endured in 2011 — are often driven by emotions in the short-term. Longer-term, we believe underlying fundamentals drive the market. This belief, along with a thoughtful plan and globally diversified portfolio, can help you look past the day-to-day market gyrations and help you reach your long-term goals.
From all of us at Russell Investments, thank you for the trust you have placed in our firm.
Best regards,

Sandra Cavanaugh
CEO, Americas Private Client Services
Russell Investment Management Company
Russell Investment Funds
Market Summary as of December 31, 2011 (Unaudited)
U.S. Equity Markets
The fiscal year ended December 31, 2011 was a relatively tumultuous period for the U.S. equity market. Despite macroeconomic uncertainty and high levels of volatility, the Russell 1000® Index rose 1.50%, while the Russell 2000® Index lost 4.18% over the year.
The U.S. equity market started off strongly in 2011. Investor confidence was buoyed by the Federal Reserve’s second round of quantitative easing (“QE2”), which demonstrated the Federal Reserve’s willingness to take action to stimulate the U.S. economy. This, in combination with positive corporate earnings numbers, drove up both equity and real asset markets. The energy sector was the largest beneficiary of this expansion through early 2011, as rising crude oil prices contributed to rising share prices of oil producers and distributors. The strong performance of energy and other cyclically-oriented sectors resulted in factors such as high beta (a stock’s sensitivity to market movement) and high earnings variability being rewarded during the first quarter.
The strength of the U.S. equity market rally was underlined by four months of consecutive positive returns for U.S. large capitalization stocks, as the Russell 1000® Index rose 9.44% between January 1, 2011 and April 30, 2011. U.S. small capitalization stocks were even larger beneficiaries of investors’ elevated appetite for risk, with the Russell 2000® Index appreciating 10.79% over the same period.
Though there was some economic optimism that underlined relatively strong equity returns during the first four months of 2011, the period was also marked by high volatility and macroeconomic concerns. In January, oil prices began to rise due to unrest across the Arab world. Beginning with the ousting of Tunisia’s president on January 14th, 2011, a number of Arab nations ruled by authoritarian regimes experienced popular uprisings in what became known as the “Arab Spring.” The initial upheaval in Tunisia and Egypt quickly led to the overthrow of both governments. However, unrest in Libya and growing concern about unrest in Saudi Arabia caused many investors to fear a potential oil supply disruption. While Saudi Arabia managed to avert a serious crisis, Libya disintegrated into civil war and this turmoil helped drive crude oil prices above $100 per barrel, a psychologically important number for investors.
With the market struggling to digest the potential impact of the “Arab Spring,” on March 11th, 2011, a large earthquake and tsunami ravaged a significant portion of Japan, the world’s third largest economy. The natural disaster devastated key parts of Japan’s industrial heartland, including the country’s automotive industry, and caused a nuclear crisis at the Fukushima nuclear plant. The Fukushima crisis fomented global criticism of nuclear power and provided a further tailwind to rising oil prices.
In the month following Japan’s disaster and bolstered by the ongoing war in Libya, West Texas Intermediate crude oil prices, which are a key input to U.S. gasoline prices, peaked at over $110 dollars a barrel. These were price levels not seen since the oil price rally of 2007. The negative economic impacts of such elevated prices on inflation and the consumer caused many investors and governments to become more concerned about the detrimental effect these prices would have on the fragile global economic recovery. In June 2011, the International Energy Agency released 60 million barrels of oil into the market in an effort to push oil prices down. This contributed to a decrease in oil prices over the following months. After leading markets during early 2011, energy stocks struggled throughout the second and third quarters of 2011 in response to lower oil prices and global economic concerns and were among the worst performing stocks in the Russell 1000® and Russell 2000® Indexes.
While economic concerns remained, the positive impact of lower oil prices on consumer spending and the diminishing risks of inflation provided investors with some hope that the global economic recovery could continue. However, the optimism quickly dissipated in June with the re-emergence of the European debt crisis, as Greece, Italian and Spanish bond yields rose rapidly. With fears that the sovereign debt contagion had spread to Italy and Spain, investors questioned the viability of both the Eurozone and the European Union.
Russell Investment Funds
Sovereign debt issues became the key market theme for the next several months. While Europe continued to be mired in uncertainty, the U.S. became the focal point of investor concern in late July and early August, as political contention over the budget deficit threatened to result in a U.S. government debt default. While this outcome was eventually avoided, the uncertainty resulted in Standards & Poor’s downgrade of U.S. sovereign debt from its prestigious AAA credit rating. This downgrade, along with weakening U.S. economic data such as disappointing housing data and increasing unemployment, was a catalyst for a U.S. equity market sell-off, which was further exacerbated by the political gridlock in Europe on a solution to the ongoing sovereign debt crisis. Consequentially, the Russell 1000® Index and the Russell 2000® Index both experienced one of the largest quarterly declines in their history, falling 14.68% and 21.87% in the third quarter, respectively.
The market’s focus on macroeconomic news, especially coming out of Europe, drove correlations among stocks higher and was a large determinant of overall market performance. The fear and macro-driven market environment during the second and third quarters of 2011 saw higher risk stocks penalized. Consequently, stocks perceived to be sensitive to economic growth, including those with higher betas and more cyclical earnings patterns, struggled. Investors sought stocks in categories that are traditionally viewed as “safe” investments, such as consumer staples and utilities. As a result, stocks with low volatility and high dividend yields performed best, as investors looked to reduce their sensitivity to a potentially weakening economic environment.
While the sell off pushed the market into bear market territory, October saw the U.S. equity market rebound as fears about another global economic meltdown eased. Many market commentators viewed the magnitude of the rebound as the result of the deeply depressed valuations witnessed in September. The dividend yield on the Russell 1000® Index and the S&P 500® Index both surpassed the yield on 10-Year Treasury notes. Investors began to show more willingness to take the risk of owning high growth stocks and stocks with very low price-to-earnings and price-to-book ratios as a result of the sell off. With economic data showing positive but slow economic growth and European governments making progress on the sovereign debt crisis, market fears declined through October.
The month of October was particularly strong for U.S. equities. The Russell 1000® Index finished up 11.21%, just 61 basis points shy of the overall fourth quarter return and the Russell 1000® Index’s highest one-month return since December of 1991. The Russell 2000® Index rose 11.21%. Following October, the U.S. equity market began to exhibit some of the same trends from earlier in 2011. As a whole, the fourth quarter was different from a factor and characteristics perspective than the rest of 2011, though much of the difference was due to the month of October. November was slightly more turbulent, with the market ending close to even for the month. After the optimism of October, investors became increasingly worried about the implications of the ongoing European debt crisis. These fears were evidenced by the rapid increase in Italian bond yields, which rose above the psychologically important 7% threshold, and by a weak German bond auction during November. The failure to stem the continuing European debt crisis caused equity markets to fall throughout much of November. However, in response to news of a coordinated monetary easing from the European Central Bank and the central banks of the U.S., Canada, Switzerland, Japan, and the U.K., equity markets rallied in the last week of November. December was the least volatile month of the quarter, partially due to low trading volumes. The market was also supported by declining U.S. unemployment figures (9.1% for September, 9.0% for October, 8.6% for November as measured by U.S. Bureau of Labor Statistics), declining year-over-year inflation figures (3.9% for September, 3.6% for October, 3.4% for November as measured by U.S. Bureau of Labor Statistics) and positive U.S. housing market news, including an increase in housing starts. However it was low beta stocks that led the market’s positive move during December.
The overall style environment during the year favored growth managers. The Russell 1000® Growth Index returned 2.64% and the Russell 1000® Value Index returned 0.39%. As the market struggled during the second and third quarters of 2011, growth managers were better able to limit losses. Quality elements of many growth companies, including high profitability and low amounts of debt, were beneficial to growth stock performance. However, many growth managers struggled to match their benchmarks as their higher beta positioning was out of favor during the market’s most risk averse portions of the year. Some more cyclical exposures that are commonly held among value managers, including high earnings variability, leverage and low valuations, all provided headwinds to performance during the fiscal year. Market leadership was narrow overall, with the Russell 1000® Index utilities sector outperforming the Russell 1000® Index by approximately 1100 basis points during the year. Although the Top 50 capitalization tier of the Russell 1000® Index generated a positive return for the year, the remaining 950 stocks, in aggregate, produced negative returns.
Russell Investment Funds
Non-U.S. Developed Equity Markets
For the fiscal year ended December 31, 2011, the non-U.S. equity market as measured by the Russell Developed ex-U.S. Large Cap® Index (the “Index”) was down 12.35%. The period was marked by volatile swings in stock prices and a series of unfavorable global developments. With the depressed U.S. housing market continuing to negatively affect the global economy and an increasingly difficult credit crisis gripping Europe, Japan’s earthquake and tsunami dealt a serious blow to Japan’s already struggling economy and added to the difficult global market environment. Japan’s earthquake severely damaged its Fukushima nuclear power facility, and the economic ripple effects of the nuclear disaster were evident in major changes to national energy policies and global supply chains, most notably in the global auto and technology industries. With the added threats of mounting inflationary pressures in emerging markets due to rising commodity prices, including food and energy, and civil unrest in the Middle East, investors grew increasingly risk averse as 2011 progressed.
Amidst the uncertainty in the global economy, corporate earnings proved resilient through the period as expectations for sharp deterioration in earnings were not realized. The European Union’s decision to write down Greece’s debt and recapitalize many European banks was welcomed by investors. While markets rallied in October on the European Union’s assurances that it would reach a successful resolution of the sovereign debt crisis, the lack of tangible details eroded much of the confidence provided by this plan.
After weakening sharply in the first half of 2011, the U.S. dollar rapidly recovered versus other major currencies as investor outlook dimmed with worsening global economic conditions. The net impact over the full year was a slight degradation of international equity market performance for U.S. dollar investors. The Index fell 11.9% in local currencies. The U.S. Federal Reserve’s first and second rounds of quantitative easing (a form of monetary policy used to increase the money supply through the Federal Reserve’s purchase of government securities or other securities from the market), combined with indications that there could be more rounds of such activity to come, kept the dollar down for much of the period, even as the global market’s flight to quality continued to support U.S. debt issuance at historically low yields.
In a world increasingly concerned with flagging economic growth, investors gravitated to areas of the market most likely able to sustain growth in a weak global economy. This favored stable growth sectors such as consumer staples and health care and growth oriented investment strategies in general. The Russell Developed ex-U.S. Large Cap Growth® Index ended the 12-month period down 9.60%. In contrast, the Russell Developed ex-U.S. Large Cap Value® Index was down more than 14.5%, with its heavy exposure to financial stocks a major factor in its underperformance.
Regionally, the United Kingdom (U.K.) offered some downside protection to market declines. The U.K. is home to many of the world’s largest consumer staples, health care and energy companies. Unilever, British American Tobacco, GlaxoSmithKline, British Petroleum and Shell are the types of stable earning companies investors favored during the period. Stocks in the Russell Europe ex-U.K. Index fell a less dramatic 4.8%.
Japan’s geographic and economic distance from Europe should have proved an advantage as Japanese share prices started the period at already depressed levels. However, the March earthquake and ensuing nuclear disaster eroded Japan’s position as a relative safe haven. Japanese shares ended the period down 12.6% in U.S. dollars as measured by the Russell Asia ex-Japan Index. A strengthening yen continued to challenge Japanese export companies, but benefited foreign investors. The Japanese market was down over 17% in Yen terms as measured by the Russell Asia ex-Japan Index.
Given its link to global economics, Asia/Pacific ex-Japan as a region performed in line with the broad non-US equity markets, falling slightly more than 12% as measured by the Index. The outlook of potentially weakening future demand had an erosive impact on commodity producing countries, specifically Australia. Within the region, Hong Kong fell sharply, down 18.5%, on fears that China’s anti-inflationary measures would cause an economic slowdown.
Europe ex-U.K. was the worst performing region within the developed markets, declining 15.2% for the period. Europe’s greatest detriment remained the increasing risk of a sovereign debt default in Greece, Ireland, Italy, Portugal, and Spain. A default represents a serious threat to the survival of the European Union, as the economically healthier nations would be forced to bail out their more fiscally stressed members. While the stock markets of the distressed European nations fell collectively, led by the nearly 57% drop in the value of Greek shares, the stock markets of more fiscally sound Germany and France also reflected the strains, and ended the period down 18.1% and 16.7%, respectively, as measured by the Index.
Russell Investment Funds
The woes of Asia/Pacific ex-Japan and Europe ex-U.K. were reflected in sector performance. Classically defensive sectors, such as consumer staples, health care and telecommunications, led the non-U.S. equity market, with health care faring best at a 6.1% gain for the period as measured by the Index. While areas most dependent on economic expansion, such as financials, consumer discretionary and technology, experienced short-lived rallies during the year, the faltering global recovery took its toll, with these sectors slumping 14-20% as measured by the Russell Large Cap Developed ex-U.S. Financial, Consumer Discretionary and Technology Indexes. An outlier were energy stocks, which only fell 3.7% as measured by the Russell Large Cap Developed ex-U.S. Energy Index, as unrest within a number of energy producing nations kept global oil prices at elevated levels.
Mining/materials stocks were the worst performers in the period, down 22.9% as measured by the Russell Large Cap Developed ex-U.S. Materials Index on the outlook for slower growth in the developed economies and in China, which is a major buyer of iron ore and copper. Beyond this, the stresses facing the global financial sector, including persistent weakness in the U.S. housing/mortgage market, exposure to distressed sovereign debts and the additional threats of high unemployment and anemic capital markets, contributed to the financial sector falling 19.9% as measured by the Russell Large Cap Developed ex-U.S. Financials Index. European bank stocks slid on fears that degradation in the value of holdings in “risk free” sovereign debt securities such as Greece and other highly indebted nations might result in a bank collapse. Technology stocks also lagged, falling 20% during the year as measured by the Russell Large Cap Developed ex-U.S. Technology Index, given slower demand for European tech hardware used in manufacturing and renewed corporate reduction in capital expenditures and use of consulting services.
Emerging Markets
The Russell Emerging Markets Index (the “Index”) was down 19.40% over the fiscal year ended December 31, 2011. The period was characterized by high levels of volatility and macro-economic events that impacted the market, such as Middle East conflict in early 2011 and the European sovereign debt crisis in the second half of the year. Inflationary pressures remained strong during the most of the fiscal year. However, emerging markets central banks raised interest rates to contain inflation and emerging markets’ currencies appreciated in value relative to the U.S. dollar until the summer of 2011, when, driven by market fears, investors redeemed capital out of emerging markets, causing a market decline. After late summer 2011, as concerns regarding inflation decreased, emerging markets eased their anti-inflationary monetary policies, providing some relief to their capital markets. However, inflationary concerns were replaced with concerns regarding slowdown of global demand and the negative effect on economic growth.
In early 2011, investors lost some of their appetite for emerging market stocks, as pro-democracy movements swept through oil-producing regions in North Africa and the Middle East. This pushed up the price of crude oil, prompted worries about global economic growth, and served as a reminder of the political risks that can accompany investments in emerging markets. Investors’ risk appetite was further diminished by an earthquake, tsunami and nuclear disaster in Japan, which disrupted global manufacturing supply chains. The Index held up relatively well in the first quarter of 2011 given the magnitude of these events, returning 1.41% over that period.
During the second quarter of 2011, rising prices, particularly of food and energy, became a concern for policymakers in the developing world. Central banks in emerging markets weighed the need to control inflation against the possibility of encouraging destabilizing capital inflows from developed markets, where interest rates remained at or close to historic lows. Despite these concerns, policymakers across the developing world opted to increase interest rates. While this strengthened the currencies of some countries, equity markets suffered as a result of the increases and the Index declined 0.85% during the quarter.
The third quarter of 2011 was characterized by a deepening sovereign debt crisis in Europe, caused by the excessive debt of Greece and other European countries. By September, the International Monetary Fund (“IMF”) warned that the global economy had entered a “dangerous new phase.” IMF estimates showed that the chance of a serious slowdown in the global economy had doubled since earlier in the year. In a reminder that slowdown in the developed world carried risks for emerging markets, the IMF also warned that the developing world faced the risk of sharp reversals or even a sudden stop in economic growth. The overall effect of this economic uncertainty was a sharp rise in risk aversion during the third quarter of 2011, which caused investors to flee from emerging market equities in favor of safe-haven investments such as U.S., German and United Kingdom government bonds. The Index declined 22.38% during the third quarter.
The fourth quarter started off positively, as a resolution to the European debt crisis seemed possible. The Index recovered 12.59% in October. However, this optimism quickly unraveled as continental European governments reacted negatively to the U.K. Prime Minister’s decision to seek an exemption to pending regulations that might have a deleterious impact to London’s financial center. Purchasing Managers Index data showed contractionary signals, both in
Russell Investment Funds
developed and emerging markets nations, while earnings revisions continued to fall. The remainder of the quarter was a difficult and volatile period for emerging markets. Stocks across the developing world tumbled on slowing global economic activity and continued uncertainty about European sovereign debt crisis. Emerging markets’ returns were further impacted by currency volatility. As European banks sought to shore up their balance sheets, they sharply curtailed loans to emerging markets and the resulting capital flight caused the value of many emerging markets currencies to fall. Emerging markets were mixed at the individual country level, but overall ended the period 3.27% higher as measured by the Index.
As energy companies comprise a large percentage of the Russian market, a double-digit rise in the price of crude oil contributed to Russia’s strong performance through November. In December, however, Russian equities fell due to political protests over the outcome of recent elections and the Russian market finished the year lower, declining 20.72% over the year as measured by the Index. The Czech Republic was the best performing emerging market in the European region during the year, declining 9.19% as measured by the Index, while Hungary and Turkey were among the worst performers. The Hungarian market fell by 34.07% as measured by the Index as its sovereign-debt crisis deepened. The problem was intensified when Hungary’s currency, the forint, fell to a record low against the Swiss franc, which is the currency in which most Hungarian mortgages are denominated. The Turkish stock market fell by 35.40% as measured by the Index as investors grew concerned that Turkey’s central bank was failing to address the country’s widening current-account deficit. Turkey’s foreign trade deficit, the key driver of the country’s increasing current account gap, grew significantly over the period, fueling market concerns that Turkish policy makers have failed to manage the fast-growing economy. Egypt was the worst performing country in the Europe, Middle East and Africa region. The Egyptian market fell 45.31% as measured by the Index as protests against military rulers continued.
In Latin America, Mexico was one of the best performing emerging markets in 2011. The Mexican market experienced a 13.23% loss as measured by the Index. High oil prices (which caused higher transportation costs) made Mexico’s proximity to the United States more valuable, while a fall in the peso made the country’s exports more competitive. Other Latin American markets followed the global trend downward due to the lower price of some mined commodities such as copper, since mined commodities represent a significant portion of the exports of some Latin American economies. The Chilean market, an important copper exporter, was the worst performing country in Latin America, falling 22.69% as measured by the Index. The one-year period also saw a dramatic change in Brazil’s monetary policy. Initially, the Brazilian interest rate was raised in an effort to control inflation. By August, however, Brazilian policymakers were lowering interest rates in order to shield the country’s economy from an expected global slowdown. By the end of October, Brazilian industrial output had contracted for two consecutive quarters, prompting recession worries. The central bank responded quickly and cut interest rates again in November and December, triggering a positive market response. Brazilian equities advanced 8.86% in third quarter and finished the year down 20.09% as measured by the Index.
In Asia, there was significant difference in country-by-country performance. Indonesia was the standout performer, gaining 3.94% as measured by the Index. Indonesia’s strong performance stood in contrast to weakening in two of Asia’s larger markets, as India and China were down 37.56% and 20.91%, respectively, as measured by the Index. The Reserve Bank of India undertook the fastest interest rate increase in its history and seven interest rate hikes in 2011 took India’s interest rate to 8.5% by the end of the period. In China, inflation hit a 37-month-high in July, even as the central bank raised interest rates. Chinese policymakers increased the required reserve ratio for banks on multiple occasions in the first half of the year, prompting renewed fears of a ‘hard landing’ in the Chinese economy. However, in the fourth quarter of 2011, Chinese policymakers took steps to loosen monetary policy and protect growth by reducing the reserve requirement ratio. Small Southeast Asian countries also performed strongly. Philippines and Malaysia gained 2.05% and 0.04%, respectively, as measured by the Index.
Throughout the year, political, economic, and corporate uncertainty caused defensive industries to be in favor across the globe. Specifically, consumer staples and utilities were the best performing sectors in 2011, falling 0.92% and 8.54%, respectively, as measured by the Index. While the materials and processing sector performed poorly on broad moderation in global demand for commodities, it was paradoxically gold mining that did the worst, largely as a result of relative optimism for equities (which increasingly appeared undervalued). Large capitalization stocks did significantly better than small capitalization stocks over the period.
U.S. Global Fixed Income Markets
The fiscal year ended December 31, 2011 started off strong for fixed income markets, with the continuation of the global credit rally. Fixed income sectors that carry credit risk (i.e., credit sectors) generally outperformed similar duration U.S.
Russell Investment Funds
Treasury securities. However, investors became increasingly pessimistic starting in May, when negative economic data caused investors to revise growth forecasts downward. The less optimistic growth outlook started a flight-to-quality trend, which led to substantially positive performance for U.S. Treasuries, while nearly all other fixed income sectors suffered. This dynamic generally persisted until the fourth quarter, when the market environment for credit sectors was more favorable given positive economic data releases. However, overarching concerns over the European sovereign debt crisis continued to linger and contributed to a flight-to-quality in November despite a positive environment for credit sectors in the other months of the quarter. For the fiscal year ended December 31, 2011, the Barclays Capital U.S. Aggregate Bond Index and the BofAML Global High Yield Index (USD hedged) returned 7.84% and 3.18%, respectively. However, reflective of the generally poor environment for credit risk in 2011, these Indexes lost 1.14% and 4.22%, respectively, relative to similar duration U.S. Treasury securities. The difference in yields between longer maturity (e.g., 10-year note) and shorter maturity (e.g., 2-year note) U.S. Treasury securities decreased materially this year, which is known as “yield curve flattening.” The yield difference decreased the most in August when yields of longer maturity Treasury securities declined significantly during the flight-to-quality. Yields of shorter maturity Treasuries had a smaller magnitude of decline as yields on short maturity Treasuries were already at very low levels due to the U.S. Federal Reserve’s (the “Fed”) quantitative easing efforts to keep short-term interest rates low in order to stimulate economic growth. Thus, longer maturity Treasuries outperformed shorter maturity Treasuries in 2011.
Credit sectors performed well relative to similar duration U.S. Treasury securities during the first four months of the year, as the economy showed signs that it was stabilizing, which lead to economic growth forecasts that generally supported the performance of riskier assets. With Treasury prices falling and a continued market demand for riskier credit sector securities, credit sectors generally outperformed similar duration Treasuries through May 2011. During this same period, investors also faced a series geopolitical events occurring abroad that dampened investor optimism. In January, the markets focused on Egypt as an uprising of civil resistance resulted in protests, labor strikes and demonstrations in an effort to overthrow the Egyptian president. In February, while the Egyptian protests continued, the markets simultaneously focused their attention on the violent civil war in Libya. With Libya being a large producer of the world’s oil supply, investors had concerns over the Libyan civil war’s impact on oil prices, which rose 10% from the end of February through April as measured by the price change in West Texas Intermediate Crude Oil futures contracts.
The non-agency mortgage sector performance was generally strong during the first four months of the year. In April, the Fed began selling sub-prime securities that were acquired from American International Group (“AIG”) in 2008 and held in a trust called Maiden Lane II. The initial sales were received well by investors, who welcomed the additional supply in the marketplace as the non-agency mortgage market had been shrinking with little to no new issuance since the start of the financial crisis. However, the Fed announced an indefinite halt to the Maiden Lane II sales in June after watching the market prices for sub-prime mortgages drop materially since the initial sales due to a drawn out sales process. The sale of the Maiden Lane II assets involved frequent periodic sales that gave little time for investors to analyze and value the securities being sold, which dampened investors demand. The overall impact of the Fed’s sales was mixed as it demonstrated that there was pent-up demand for non-agency mortgages but also revealed the limits of the incremental demand and ultimately left non-agency mortgage prices lower. Generally, performance of non-agency mortgages was negative for the year.
The last eight months of the year were much more unfavorable than the first four. While credit sectors were able to push through many headwinds in the first part of the year, they began to underperform similar duration Treasury securities in May as investors started to lose optimism given the growing concerns over the European debt crisis, slowing U.S. economic growth, stagnant job market and negative housing market news. A renewed focus on these concerns sparked a flight-to-quality whereby investors sought the safety and liquidity of Treasuries over riskier credit sectors. Consequently, despite the formal end of the Fed’s quantitative easing in June, Treasury securities remained in demand and Treasury yields across all parts of the yield curve continued to decline.
Given the flight-to-quality and concerns over the negative impact of the European debt crisis on financial companies, financial-related corporate bonds performed poorly compared to non-financial corporate bonds. Generally, investors perceived non-financial corporate bond sub-sectors, such as industrials and utilities, to be less tied to the European debt crisis. Broadly, corporate bonds continued to exhibit low default rates and strong fundamentals, as many corporate bond issuers were able to refinance their debt after the peak of the financial crisis in 2008, putting them in a better financial position to repay their corporate debt going forward. As a relative comparison, global high yield corporate bonds generally underperformed emerging market debt in 2011 as emerging market debt securities tend to be longer in maturity and more interest rate sensitive than global high yield bonds. However, from a credit perspective, emerging market debt underperformed similar duration U.S. Treasury securities more than global high yield corporate bonds did.
Russell Investment Funds
In July, concerns regarding a possible default and/or downgrade of U.S. government debt increased due to political gridlock and the possibility that the U.S. debt ceiling would not be raised in time to prevent a default. Ultimately, the debt ceiling was raised. However, Standard and Poor’s downgraded the U.S. debt rating to AA+ from the highest rating of AAA. Generally, a rating agency downgrade signals increased credit risk, which typically leads to higher yields to compensate investors for the additional risk. However, with serious concerns about the European debt crisis, U.S. Treasury securities reinforced their status as the world’s safe haven asset and saw their yields decline following the ratings downgrade. The dramatic flight-to-quality in early August caused Treasury yields to drop to historically low levels while credit sector yields lagged considerably or even rose in some instances.
With investors on edge and fearing the possibility of a recession, the Fed explicitly stated its intent to keep short-term interest rates low until at least mid-2013. Additionally, in September, the Fed formally announced a stimulus program to sell $400 billion in Treasury securities with maturities less than 3 years while purchasing the same amount in Treasury securities with maturities longer than 6 years. This was designed to lower longer term interest rates without the Fed having to take on additional debt. While the structure of the program was largely anticipated, investors underestimated its size. Thus, after the announcement, long term Treasury bonds saw a downward correction in yield to reflect the amount of the Fed’s buying. In addition, investors were surprised by the Fed’s simultaneous announcement of its intent to reinvest principal payments from its agency debt and agency mortgage-backed securities holdings back into agency mortgages-backed securities. This reinvestment plan was designed to keep mortgage rates low by creating demand for mortgage securities, thereby encouraging lenders to issue more mortgages to borrowers. This led to more divergent performance within agency mortgages depending on coupon and maturity date. The year ended on a higher note with a generally positive environment for credit sectors in the fourth quarter due to better than expected economic data and positive developments around the European debt crisis. For example, non-farm payrolls bested consensus estimates at the end of September. In addition, labor markets showed signs of improvement as the unemployment rate decreased from September to December. As seen by November’s flight-to-quality, in which the BofAML Global High Yield Index (USD hedged) lost 3.11% relative to similar duration Treasuries, investors still remained cautious throughout the quarter given the lack of a long term solution for the European debt crisis. However, some positive developments around the European debt crisis occurred near the end of November, including the expansion of the purview of the European Financial Stability Facility. In addition, a group of central banks (European Union, United States, Canada, Japan, England, and Switzerland) agreed to provide cheaper access to the U.S. dollar currency to commercial banks in each central bank’s respective jurisdiction. This coordinated effort by the central banks to improve financial market liquidity was a positive development for credit sectors.
(This page intentionally left blank)
Russell Investment Funds
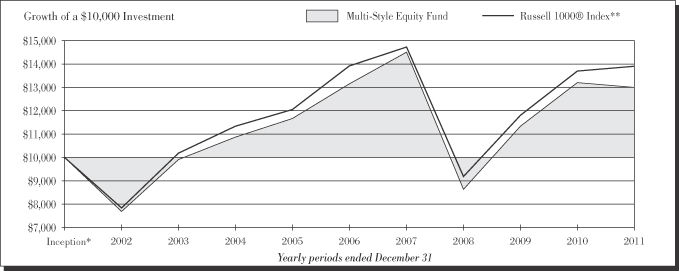
Multi-Style Equity Fund
Portfolio Management Discussion and Analysis — December 31, 2011 (Unaudited)
| | | | |
|
| Multi-Style Equity Fund | |
| | Total
Return | |
1 Year | | | (1.55 | )% |
5 Years | | | (0.24 | )%§ |
10 Years | | | 2.65 | %§ |
| | | | |
|
| Russell 1000® Index** | |
| | Total
Return | |
1 Year | | | 1.50 | % |
5 Years | | | (0.02 | )%§ |
10 Years | | | 3.34 | %§ |
| | | | |
| | 12 | | | Multi-Style Equity Fund |
\
Russell Investment Funds
Multi-Style Equity Fund
Portfolio Management Discussion and Analysis — December 31, 2011 (Unaudited)
The Multi-Style Equity Fund (the “Fund”) allocates most of its assets among multiple money managers. Russell Investment Management Company (“RIMCo”), as the Fund’s advisor, may change the allocation of the Fund’s assets among money managers at any time. An exemptive order from the Securities and Exchange Commission (“SEC”) permits RIMCo to engage or terminate a money manager at any time, subject to approval by the Fund’s Board, without a shareholder vote. Pursuant to the terms of the exemptive order, the Fund is required to notify its shareholders within 60 days of when a money manager begins providing services. The Fund currently has seven money managers.
What is the Fund’s investment objective?
The Fund seeks to provide long term capital growth.
How did the Fund perform relative to its benchmark for the fiscal year ended December 31, 2011?
For the fiscal year ended December 31, 2011, the Multi-Style Equity Fund lost 1.55%. This is compared to the Fund’s benchmark, the Russell 1000® Index, which gained 1.50% during the same period. The Fund’s performance includes operating expenses, whereas index returns are unmanaged and do not include expenses of any kind.
For the fiscal year ended December 31, 2011, the Lipper® Large-Cap Core Funds (VIP) Average, a group of funds that Lipper considers to have investment strategies similar to those of the Fund, lost 1.08%. This result serves as a peer comparison and is expressed net of operating expenses.
RIMCo may assign a money manager a specific style or capitalization benchmark other than the Fund’s index. However, the Fund’s primary index remains the benchmark for the Fund and is representative of the aggregate of each money manager’s benchmark index.
How did the market conditions described in the Market Summary report affect the Fund’s performance?
The year ended December 31, 2011 was driven almost entirely by defensively-oriented factors. Despite periods of more mixed factor and sector leadership, the strongly defensive second and third quarters of 2011 had a significant enough impact to largely determine investment outcomes for the entire period. Stocks with high betas were severely penalized during the year, as were stocks with low price-to-book ratios and debt-laden balance sheets. As investors began to lend more influence to the possibility of a double dip recession in the United States and a sovereign debt default in Europe, high quality and less economically sensitive stocks were rewarded. Stocks of companies with high returns-on-assets and high returns-on-equity fared best during the fiscal year. The largest capitalization stocks and those with high dividend yields also did well as investors became increasingly focused on owning more stable securities perceived to be better able to weather uncertain and difficult economic conditions.
The Fund was able to perform well during periods when economically sensitive sectors were rewarded and the market rotated toward stocks that would benefit from a continued economic recovery. In contrast, the Fund struggled during the more risk-averse environment during the second and third quarters of 2011. The third quarter alone accounted for more than half of the Fund’s underperformance for fiscal year.
Defensive stocks (i.e., less economically sensitive, less financially leveraged, and less volatile stocks) outperformed dynamic stocks (i.e., more economically sensitive, more financially leveraged, and more volatile stocks) both in the Russell 1000® Index and the Russell 2000® Index for the fiscal year. As the European market began to seriously price in the risk of a European sovereign debt default scenario in the third quarter of 2011, the Russell 1000® Index experienced its worst quarter of performance in almost 20 years. Not surprisingly, more defensive securities were able to perform better during this period. The Fund was positioned for a moderate economic recovery and was underweight to the more defensive stocks that performed best during that time period. This was detrimental to the Fund’s performance.
Similar to fiscal year 2010, growth stocks outperformed value stocks during fiscal year 2011. By far, the worst-performing sector within the Russell 1000® Index was financial services. Fears of a sovereign debt default and a double dip recession within the U.S. and Europe had an asymmetrical impact on the sector. In addition, the share price of many insurers was negatively impacted by the earthquake, tsunami and nuclear crisis in Japan. The best-performing sector in the Russell 1000® Index was consumer staples, followed by utilities. The utilities sector outperformed the Russell 1000® Index by more than 1100 basis points for the year. The strong performance of the consumer staples and utilities sectors evidences the year’s overall market trend, as investors sold stocks of economically sensitive companies and bought stocks of companies that may be less volatile but are subject to greater regulation and/or have limited growth potential.
How did the investment strategies and techniques employed by the Fund and its money managers affect its benchmark relative performance?
During the course of the fiscal year, the Fund was positioned for a continued U.S. economic recovery. The Fund performed well when investors were not focused on macroeconomic risks. During the second and third quarters of 2011, the Fund struggled amid a highly correlated global sell off of risky assets and a factor environment in which most measures of economic cyclicality and market sensitivity were severely penalized. The larger cap and more defensive managers were able to withstand this environment better than those with more economically sensitive exposures, including overweights to stocks with high betas and high earnings variability. The Fund was able to perform well during the month of October, when correlations fell, concerns over Europe receded and U.S. economic data began to show a brighter outlook, and the market rewarded stocks that were positioned to benefit from a
| | |
| Multi-Style Equity Fund | | 13 |
Russell Investment Funds
Multi-Style Equity Fund
Portfolio Management Discussion and Analysis — December 31, 2011 (Unaudited)
continued economic recovery. The Fund’s underweight to stocks with high dividend yields and underweight to the largest cap stocks within the Russell 1000® Index both detracted from performance.
The largest detractor from Fund performance was stock selection. The impact was most significant from negative stock selection in the technology sector. Stock selection effects also detracted from returns within the financial services sector. The Fund saw little impact from sector weighting decisions during the year. It benefited from a slight overweight to the consumer discretionary sector during the period, but over the course of the fiscal year the impact was negligible.
BlackRock Capital Management, Inc. (“Blackrock”) underperformed the Russell 1000® Growth Index for the year. BlackRock’s earnings momentum strategy was unsuccessful during the year as the market rewarded more defensive and lower risk stocks. BlackRock’s overweight to stocks with high betas and underweight to stocks with high returns-on-equity both detracted from performance during the year. Stock selection effects were the largest driver of negative returns in the BlackRock portfolio.
Columbus Circle Investors (“Columbus Circle”) underperformed the Russell 1000® Growth Index for the year. Columbus Circle’s higher beta earnings momentum strategy faced severe factor headwinds during the year. A large underweight to stocks with high dividend yields detracted from returns during the year, as did a large underweight to stocks with high returns-on-equity. Stock selection effects detracted significantly within the technology and energy sectors.
DePrince, Race & Zollo, Inc. (“DePrince”) underperformed the Russell 1000® Value Index for the year. DePrince was well positioned from a factor and characteristic perspective, with an underweight to stocks with high betas and an overweight to stocks with high dividend yields. Stock selection effects were negative for DePrince and enough to offset the gains derived from factor exposures. Stock selection detracted from returns within the materials and processing and consumer discretionary sectors.
First Eagle Investment Management Company, LLC (“First Eagle”) underperformed the Russell 1000® Index from January 1, 2011 to its termination on December 8, 2011. During that time, First Eagle’s sector exposures detracted most significantly from its returns, due primarily to underweights to the more defensively positioned consumer staples and health care sectors. Stock selection effects detracted from returns within the materials and processing and producer durables sectors.
Institutional Capital LLC (“ICAP”) outperformed the Russell 1000® Value Index for the year. ICAP benefited from being underweight to the smallest cap stocks within the Russell 1000® Value Index. ICAP’s underweight to stocks with high betas was
also beneficial during the year. An overweight to stocks with strong returns-on-equity also contributed positively to excess return.
Jacobs Levy Equity Management Inc’s (“Jacobs Levy”) quantitatively oriented value strategy outperformed the Russell 1000® Value Index for the year. Jacobs Levy benefited from being underweight to stocks with high betas during the year. The manager’s overweight to the consumer staples sector and underweight to the financial services sector both contributed positively to performance.
Montag & Caldwell, LLC (“Montag”) outperformed the Russell 1000® Growth Index from January 1, 2011 to its termination on December 9, 2011. During that time, Montag benefited from positive sector exposure effects, specifically from an overweight to consumer staples and an underweight to materials and processing. Montag also benefited from positive stock selection effects within the consumer discretionary sector.
Suffolk Capital Management, LLC (“Suffolk”) underperformed the Russell 1000® Index for the year. Suffolk’s large overweight to stocks with high betas and large underweight to stocks with high dividend yields both detracted from performance during the year. Sector exposure effects detracted from returns due to underweights to the utilities, consumer staples, and energy sectors. Stock selection detracted from returns within the financial services and energy sectors.
Sustainable Growth Advisers, LP (“SGA”) was hired on December 23, 2011. For the period of December 23, 2011 to December 31, 2011, SGA performed in line with the Russell 1000® Growth Index and had a moderately positive impact on the Fund’s performance. During this time, SGA benefited from positive stock selection effects, especially within the consumer staples and technology sectors.
Describe any changes to the Fund’s structure or the money manager line-up.
First Eagle Investment Management, LLC and Montag & Caldwell, LLC were terminated in December 2011. Sustainable Growth Advisers, LP was hired in December 2011.
| | |
| |
| Money Managers as of December 31, 2011 | | Style |
BlackRock Capital Management, Inc. | | Growth |
Columbus Circle Investors | | Growth |
DePrince, Race & Zollo, Inc. | | Value |
Institutional Capital LLC | | Value |
Jacobs Levy Equity Management Inc. | | Value |
Suffolk Capital Management LLC | | Market Oriented |
Sustainable Growth Advisers, LP | | Growth |
| | | | |
| | 14 | | | Multi-Style Equity Fund |
Russell Investment Funds
Multi-Style Equity Fund
Portfolio Management Discussion and Analysis — December 11, 2011 (Unaudited)
The views expressed in this report reflect those of the portfolio managers only through the end of the period covered by the report. These views do not necessarily represent the views of RIMCo, or any other person in RIMCo or any other affiliated organization. These views are subject to change at any time based upon market conditions or other events, and RIMCo disclaims any responsibility to update the views contained herein. These views should not be relied on as investment advice and, because investment decisions for Russell Investment Funds (“RIF”) are based on numerous factors, should not be relied on as an indication of investment decisions of any RIF Fund.
| * | | Assumes initial investment on January 1, 2001. |
| ** | | Russell 1000® Index includes the 1,000 largest companies in the Russell 3000® Index. The Russell 1000® Index represents the universe of stocks from which most active money managers typically select. The Russell 1000® Index return reflects adjustments from income dividends and capital gain distributions reinvested as of the ex-dividend dates. |
The performance shown in this section does not reflect any Insurance Company Separate Account or Policy Charges. Performance is historical and assumes reinvestment of all dividends and capital gains. Investment return and principal value will fluctuate so that an investor’s shares, when redeemed, may be worth more or less than when purchased. Past performance is not indicative of future results.
| | |
| Multi-Style Equity Fund | | 15 |
Russell Investment Funds
Multi-Style Equity Fund
Shareholder Expense Example — December 31, 2011 (Unaudited)
Fund Expenses
The following disclosure provides important information regarding each Fund’s Expense Example, which appears on each Fund’s individual page in this Annual Report. Please refer to this information when reviewing the Expense Example for a Fund.
Example
As a shareholder of the Fund, you incur two types of costs: (1) transaction costs, and (2) ongoing costs, including advisory fees and other Fund expenses. The Example is intended to help you understand your ongoing costs (in dollars) of investing in the Fund and to compare these costs with the ongoing costs of investing in other mutual funds. The Example is based on an investment of $1,000 invested at the beginning of the period and held for the entire period indicated, which for this Fund is from July 1, 2011 to December 31, 2011.
Actual Expenses
The information in the table under the heading “Actual Performance” provides information about actual account values and actual expenses. You may use the information in this column, together with the amount you invested, to estimate the expenses that you paid over the period. Simply divide your account value by $1,000 (for example, an $8,600 account value divided by $1,000 = 8.6), then multiply the result by the number in the first column in the row entitled “Expenses Paid During Period” to estimate the expenses you paid on your account during this period.
Hypothetical Example for Comparison Purposes
The information in the table under the heading “Hypothetical Performance (5% return before expenses)” provides information about hypothetical account values and hypothetical expenses based on the Fund’s actual expense ratio and an assumed rate of return of 5% per year before expenses, which is not the Fund’s actual return. The hypothetical account values and expenses may not be used to estimate the actual ending account balance or expenses you paid for the period. You may use this information to compare the ongoing costs of investing in the Fund and other funds. To do so, compare this 5% hypothetical example with the 5% hypothetical examples that appear in the shareholder reports of other funds.
Please note that the expenses shown in the table are meant to highlight your ongoing costs only and do not reflect any transactional costs. Therefore, the information under the heading “Hypothetical Performance (5% return before expenses)” is useful in comparing ongoing costs only, and will not help you determine the relative total costs of owning different funds. In addition, if these transactional costs were included, your costs would have been higher. The fee and expenses shown in this section do not reflect any Insurance Company Separate Account or Policy Charges.
| | | | | | | | |
| | Actual
Performance | | | Hypothetical
Performance
(5% return
before expenses) | |
| | | | | | | | |
Beginning Account Value | | | | | | | | |
July 1, 2011 | | $ | 1,000.00 | | | $ | 1,000.00 | |
Ending Account Value | | | | | | | | |
December 31, 2011 | | $ | 935.60 | | | $ | 1,021.12 | |
Expenses Paid During Period* | | $ | 3.95 | | | $ | 4.13 | |
| * | Expenses are equal to the Fund’s annualized expense ratio of 0.81% (representing the six month period annualized), multiplied by the average account value over the period, multiplied by 184/365 (to reflect the one-half year period). May reflect amounts waived, reimbursed and/or other credits. Without any waivers, reimbursements and/or other credits, expenses would have been higher. |
| | | | |
| | 16 | | | Multi-Style Equity Fund |
Russell Investment Funds
Multi-Style Equity Fund
Schedule of Investments — December 31, 2011
Amounts in thousands (except share amounts)
| | | | | | | | |
| | | Principal
Amount ($)
or Shares | | | Market
Value
$ | |
| | | | | | | | |
| Common Stocks - 96.9% | | | | | | | | |
| Consumer Discretionary -14.1% | | | | | | | | |
Abercrombie & Fitch Co. Class A | | | 6,000 | | | | 293 | |
Amazon.com, Inc. (Æ) | | | 20,078 | | | | 3,475 | |
American Eagle Outfitters, Inc. | | | 31,600 | | | | 483 | |
Apollo Group, Inc. Class A (Æ) | | | 11,800 | | | | 636 | |
Avon Products, Inc. | | | 35,500 | | | | 620 | |
Bed Bath & Beyond, Inc. (Æ) | | | 20,754 | | | | 1,203 | |
BorgWarner, Inc. (Æ) | | | 2,300 | | | | 147 | |
Chipotle Mexican Grill, Inc. Class A (Æ) | | | 600 | | | | 203 | |
Coach, Inc. | | | 5,400 | | | | 330 | |
Comcast Corp. Class A (Æ) | | | 16,400 | | | | 389 | |
DIRECTV, Inc. Class A (Æ) | | | 10,090 | | | | 431 | |
DISH Network Corp. Class A | | | 6,500 | | | | 185 | |
DSW, Inc. Class A | | | 5,600 | | | | 248 | |
eBay, Inc. (Æ) | | | 75,800 | | | | 2,298 | |
Embraer SA - ADR (Æ) | | | 20,100 | | | | 507 | |
Estee Lauder Cos., Inc. (The) Class A | | | 6,589 | | | | 740 | |
Ford Motor Co. | | | 103,021 | | | | 1,109 | |
Gap, Inc. (The) | | | 49,900 | | | | 926 | |
General Motors Co. (Æ) | | | 37,900 | | | | 768 | |
Group 1 Automotive, Inc. | | | 500 | | | | 26 | |
Hanesbrands, Inc. (Æ) | | | 13,500 | | | | 295 | |
Harman International Industries, Inc. | | | 8,700 | | | | 331 | |
Home Depot, Inc. | | | 39,965 | | | | 1,680 | |
Hyatt Hotels Corp. Class A (Æ) | | | 2,400 | | | | 90 | |
International Game Technology | | | 16,700 | | | | 287 | |
Johnson Controls, Inc. | | | 139,808 | | | | 4,370 | |
Kohl’s Corp. | | | 13,300 | | | | 656 | |
Las Vegas Sands Corp. (Æ) | | | 52,754 | | | | 2,254 | |
Limited Brands, Inc. | | | 11,910 | | | | 481 | |
Lowe’s Cos., Inc. | | | 53,326 | | | | 1,354 | |
McDonald’s Corp. | | | 11,534 | | | | 1,157 | |
McGraw-Hill Cos., Inc. (The) | | | 12,100 | | | | 544 | |
Michael Kors Holdings, Ltd. (Æ) | | | 2,445 | | | | 67 | |
News Corp. Class A | | | 61,500 | | | | 1,097 | |
Nike, Inc. Class B | | | 9,600 | | | | 925 | |
priceline.com, Inc. (Æ) | | | 1,886 | | | | 882 | |
Snap-on, Inc. | | | 7,400 | | | | 375 | |
Stanley Black & Decker, Inc. | | | 12,400 | | | | 839 | |
Starbucks Corp. | | | 73,850 | | | | 3,398 | |
Starwood Hotels & Resorts Worldwide, Inc. | | | 24,300 | | | | 1,166 | |
Target Corp. | | | 13,600 | | | | 697 | |
Tesla Motors, Inc. (Æ)(Ñ) | | | 8,500 | | | | 243 | |
Tiffany & Co. | | | 11,500 | | | | 762 | |
Time Warner, Inc. | | | 126,661 | | | | 4,577 | |
TJX Cos., Inc. | | | 2,578 | | | | 166 | |
Tractor Supply Co. | | | 2,900 | | | | 203 | |
Ulta Salon Cosmetics & Fragrance, Inc. (Æ) | | | 3,500 | | | | 227 | |
VF Corp. | | | 5,440 | | | | 691 | |
Viacom, Inc. Class B | | | 58,323 | | | | 2,648 | |
VistaPrint NV (Æ)(Ñ) | | | 11,500 | | | | 352 | |
Wal-Mart Stores, Inc. | | | 25,600 | | | | 1,530 | |
Whirlpool Corp. | | | 7,900 | | | | 375 | |
| | | | | | | | |
| | | Principal
Amount ($)
or Shares | | | Market
Value
$ | |
Williams-Sonoma, Inc. | | | 9,200 | | | | 354 | |
Yum! Brands, Inc. | | | 41,300 | | | | 2,437 | |
| | | | | | | | |
| | | | | | | 52,527 | |
| | | | | | | | |
| Consumer Staples - 9.1% | | | | | | | | |
Andersons, Inc. (The) | | | 600 | | | | 26 | |
Anheuser-Busch InBev NV - ADR | | | 10,300 | | | | 628 | |
Archer-Daniels-Midland Co. | | | 99,200 | | | | 2,837 | |
Bunge, Ltd. | | | 10,900 | | | | 623 | |
Campbell Soup Co. (Ñ) | | | 12,700 | | | | 422 | |
Cia de Bebidas das Americas - ADR | | | 41,700 | | | | 1,505 | |
Clorox Co. (The) | | | 17,500 | | | | 1,165 | |
Coca-Cola Co. (The) | | | 87,075 | | | | 6,092 | |
Coca-Cola Enterprises, Inc. | | | 23,800 | | | | 614 | |
Colgate-Palmolive Co. | | | 16,300 | | | | 1,506 | |
ConAgra Foods, Inc. | | | 32,400 | | | | 855 | |
Dean Foods Co. (Æ) | | | 55,000 | | | | 616 | |
Green Mountain Coffee Roasters, Inc. (Æ) | | | 1,600 | | | | 72 | |
Hershey Co. (The) | | | 18,952 | | | | 1,171 | |
Kroger Co. (The) | | | 25,800 | | | | 625 | |
Lorillard, Inc. | | | 6,900 | | | | 787 | |
Mead Johnson Nutrition Co. Class A | | | 7,200 | | | | 495 | |
PepsiCo, Inc. | | | 50,537 | | | | 3,353 | |
Procter & Gamble Co. (The) | | | 100,145 | | | | 6,680 | |
Safeway, Inc. | | | 30,300 | | | | 638 | |
Sara Lee Corp. | | | 11,900 | | | | 225 | |
SUPERVALU, Inc. (Ñ) | | | 65,400 | | | | 531 | |
Tyson Foods, Inc. Class A | | | 51,000 | | | | 1,053 | |
Whole Foods Market, Inc. | | | 18,639 | | | | 1,297 | |
| | | | | | | | |
| | | | | | | 33,816 | |
| | | | | | | | |
| Energy - 10.7% | | | | | | | | |
Alpha Natural Resources, Inc. (Æ) | | | 29,800 | | | | 609 | |
Anadarko Petroleum Corp. | | | 21,400 | | | | 1,633 | |
Apache Corp. | | | 14,280 | | | | 1,294 | |
Arch Coal, Inc. | | | 43,700 | | | | 634 | |
Baker Hughes, Inc. | | | 16,700 | | | | 813 | |
Cabot Oil & Gas Corp. | | | 11,083 | | | | 841 | |
Chevron Corp. | | | 9,200 | | | | 979 | |
Cloud Peak Energy, Inc. (Æ) | | | 13,600 | | | | 263 | |
Devon Energy Corp. | | | 21,598 | | | | 1,339 | |
Dresser-Rand Group, Inc. (Æ) | | | 11,800 | | | | 589 | |
Ensco PLC - ADR | | | 13,090 | | | | 614 | |
EQT Corp. | | | 11,500 | | | | 630 | |
Exxon Mobil Corp. | | | 65,550 | | | | 5,557 | |
Forest Oil Corp. (Æ) | | | 38,600 | | | | 523 | |
Halliburton Co. | | | 15,747 | | | | 543 | |
Helmerich & Payne, Inc. | | | 5,500 | | | | 321 | |
Hess Corp. | | | 17,658 | | | | 1,003 | |
Kinder Morgan, Inc. (Ñ) | | | 15,600 | | | | 502 | |
Marathon Oil Corp. | | | 64,569 | | | | 1,890 | |
Marathon Petroleum Corp. | | | 39,600 | | | | 1,318 | |
Murphy Oil Corp. | | | 35,372 | | | | 1,971 | |
Nabors Industries, Ltd. (Æ) | | | 28,500 | | | | 494 | |
National Oilwell Varco, Inc. | | | 43,281 | | | | 2,943 | |
Noble Energy, Inc. | | | 5,000 | | | | 472 | |
Occidental Petroleum Corp. | | | 36,342 | | | | 3,405 | |
Patterson-UTI Energy, Inc. | | | 31,100 | | | | 621 | |
| | |
| Multi-Style Equity Fund | | 17 |
Russell Investment Funds
Multi-Style Equity Fund
Schedule of Investments, continued — December 31, 2011
Amounts in thousands (except share amounts)
| | | | | | | | |
| | | Principal
Amount ($)
or Shares | | | Market
Value
$ | |
| | | | | | | | |
Plains Exploration & Production Co. (Æ) | | | 13,700 | | | | 503 | |
QEP Resources, Inc. | | | 6,000 | | | | 176 | |
Range Resources Corp. | | | 9,300 | | | | 576 | |
Schlumberger, Ltd. | | | 40,500 | | | | 2,766 | |
SM Energy Co. | | | 4,200 | | | | 307 | |
Southwestern Energy Co. (Æ) | | | 24,330 | | | | 777 | |
Statoil ASA - ADR | | | 32,700 | | | | 837 | |
Total SA - ADR (Ñ) | | | 9,700 | | | | 496 | |
Transocean, Ltd. | | | 11,100 | | | | 426 | |
Unit Corp. (Æ) | | | 9,000 | | | | 418 | |
Valero Energy Corp. | | | 35,100 | | | | 739 | |
| | | | | | | | |
| | | | | | | 39,822 | |
| | | | | | | | |
| Financial Services - 14.9% | | | | | | | | |
ACE, Ltd. | | | 18,350 | | | | 1,287 | |
Allied World Assurance Co. Holdings AG | | | 10,500 | | | | 661 | |
Allstate Corp. (The) | | | 61,588 | | | | 1,688 | |
Amarin Corp Plc Sponsored ADR (Æ) | | | 35,300 | | | | 264 | |
American Express Co. | | | 19,288 | | | | 910 | |
Anworth Mortgage Asset Corp. (ö) | | | 36,600 | | | | 230 | |
Aspen Insurance Holdings, Ltd. | | | 22,000 | | | | 583 | |
Associated Banc-Corp. | | | 26,100 | | | | 292 | |
Assurant, Inc. | | | 10,100 | | | | 415 | |
Bank of New York Mellon Corp. (The) | | | 113,600 | | | | 2,262 | |
BB&T Corp. | | | 132,931 | | | | 3,346 | |
Berkshire Hathaway, Inc. Class B (Æ) | | | 1,200 | | | | 92 | |
BlackRock, Inc. Class A | | | 9,000 | | | | 1,604 | |
Capital One Financial Corp. | | | 45,244 | | | | 1,913 | |
Chubb Corp. (The) | | | 7,600 | | | | 526 | |
Citigroup, Inc. | | | 27,100 | | | | 713 | |
City National Corp. | | | 8,100 | | | | 358 | |
Cullen/Frost Bankers, Inc. | | | 9,000 | | | | 476 | |
Discover Financial Services | | | 70,513 | | | | 1,692 | |
EastGroup Properties, Inc. (ö) | | | 900 | | | | 39 | |
Everest Re Group, Ltd. | | | 7,700 | | | | 647 | |
Extra Space Storage, Inc. (ö) | | | 5,500 | | | | 133 | |
First American Financial Corp. | | | 13,400 | | | | 170 | |
Fulton Financial Corp. | | | 39,100 | | | | 384 | |
Hartford Financial Services Group, Inc. | | | 36,300 | | | | 590 | |
Hospitality Properties Trust (ö) | | | 6,300 | | | | 145 | |
Interactive Brokers Group, Inc. Class A | | | 28,700 | | | | 429 | |
Jefferies Group, Inc. (Ñ) | | | 20,400 | | | | 281 | |
Jones Lang LaSalle, Inc. | | | 1,300 | | | | 80 | |
JPMorgan Chase & Co. | | | 235,217 | | | | 7,819 | |
KeyCorp | | | 63,300 | | | | 487 | |
Liberty Property Trust (ö) | | | 19,300 | | | | 596 | |
Lincoln National Corp. | | | 30,100 | | | | 585 | |
Mastercard, Inc. Class A | | | 4,168 | | | | 1,554 | |
Mercury General Corp. | | | 10,300 | | | | 470 | |
MetLife, Inc. | | | 110,661 | | | | 3,450 | |
Morgan Stanley | | | 60,200 | | | | 911 | |
Northern Trust Corp. | | | 24,899 | | | | 987 | |
PartnerRe, Ltd. - ADR | | | 10,060 | | | | 646 | |
People’s United Financial, Inc. | | | 30,100 | | | | 387 | |
PNC Financial Services Group, Inc. | | | 9,700 | | | | 559 | |
ProAssurance Corp. | | | 900 | | | | 72 | |
Protective Life Corp. | | | 3,300 | | | | 74 | |
Prudential Financial, Inc. | | | 30,500 | | | | 1,529 | |
| | | | | | | | |
| | | Principal
Amount ($)
or Shares | | | Market
Value
$ | |
Reinsurance Group of America, Inc. Class A | | | 8,300 | | | | 434 | |
Simon Property Group, Inc. (ö) | | | 5,430 | | | | 700 | |
State Street Corp. | | | 37,200 | | | | 1,500 | |
SunTrust Banks, Inc. | | | 31,800 | | | | 563 | |
SVB Financial Group (Æ) | | | 2,800 | | | | 134 | |
Travelers Cos., Inc. (The) | | | 9,600 | | | | 568 | |
US Bancorp | | | 26,400 | | | | 714 | |
Validus Holdings, Ltd. | | | 13,600 | | | | 428 | |
Valley National Bancorp | | | 35,150 | | | | 435 | |
Visa, Inc. Class A | | | 28,169 | | | | 2,859 | |
Webster Financial Corp. | | | 2,500 | | | | 51 | |
Wells Fargo & Co. | | | 184,450 | | | | 5,083 | |
| | | | | | | | |
| | | | | | | 55,805 | |
| | | | | | | | |
| Health Care - 12.9% | | | | | | | | |
Abbott Laboratories | | | 17,190 | | | | 966 | |
Aetna, Inc. | | | 19,200 | | | | 810 | |
Alere, Inc. (Æ) | | | 11,800 | | | | 272 | |
Alexion Pharmaceuticals, Inc. (Æ) | | | 3,600 | | | | 257 | |
Allergan, Inc. | | | 23,380 | | | | 2,051 | |
AmerisourceBergen Corp. Class A | | | 19,316 | | | | 718 | |
Amgen, Inc. | | | 10,300 | | | | 661 | |
Baxter International, Inc. | | | 12,700 | | | | 628 | |
Biogen Idec, Inc. (Æ) | | | 6,300 | | | | 693 | |
Boston Scientific Corp. (Æ) | | | 126,700 | | | | 677 | |
Cardinal Health, Inc. | | | 22,900 | | | | 930 | |
Centene Corp. (Æ) | | | 1,900 | | | | 75 | |
Cerner Corp. (Æ) | | | 35,000 | | | | 2,144 | |
Cigna Corp. | | | 1,900 | | | | 80 | |
Cooper Cos., Inc. (The) | | | 2,200 | | | | 155 | |
Covidien PLC | | | 31,400 | | | | 1,413 | |
Dentsply International, Inc. | | | 20,900 | | | | 731 | |
Eli Lilly & Co. | | | 15,900 | | | | 661 | |
Gilead Sciences, Inc. (Æ) | | | 11,620 | | | | 476 | |
Health Net, Inc. (Æ) | | | 6,700 | | | | 204 | |
Hologic, Inc. (Æ) | | | 24,000 | | | | 420 | |
Humana, Inc. | | | 8,740 | | | | 766 | |
Intuitive Surgical, Inc. (Æ) | | | 2,200 | | | | 1,019 | |
Johnson & Johnson | | | 85,900 | | | | 5,634 | |
Medicis Pharmaceutical Corp. Class A | | | 1,500 | | | | 50 | |
Medtronic, Inc. | | | 17,016 | | | | 651 | |
Merck & Co., Inc. | | | 94,391 | | | | 3,558 | |
Mylan, Inc. (Æ) | | | 73,200 | | | | 1,571 | |
Novo Nordisk A/S - ADR | | | 9,900 | | | | 1,141 | |
Perrigo Co. | | | 5,700 | | | | 555 | |
Pfizer, Inc. | | | 405,892 | | | | 8,785 | |
Sanofi - ADR | | | 58,800 | | | | 2,149 | |
Stryker Corp. | | | 10,605 | | | | 527 | |
Teva Pharmaceutical Industries,
Ltd. - ADR | | | 11,250 | | | | 454 | |
UnitedHealth Group, Inc. | | | 44,800 | | | | 2,271 | |
Valeant Pharmaceuticals International, Inc. (Æ) | | | 10,210 | | | | 476 | |
Vertex Pharmaceuticals, Inc. (Æ) | | | 5,800 | | | | 193 | |
Warner Chilcott PLC Class A (Æ) | | | 45,100 | | | | 682 | |
Watson Pharmaceuticals, Inc. Class B (Æ) | | | 18,883 | | | | 1,139 | |
| | | | |
| | 18 | | | Multi-Style Equity Fund |
Russell Investment Funds
Multi-Style Equity Fund
Schedule of Investments, continued — December 31, 2011
Amounts in thousands (except share amounts)
| | | | | | | | |
| | | Principal
Amount ($)
or Shares | | | Market
Value
$ | |
| | | | | | | | |
WellPoint, Inc. | | | 22,900 | | | | 1,517 | |
| | | | | | | | |
| | | | | | | 48,160 | |
| | | | | | | | |
| Materials and Processing - 4.3% | | | | | | | | |
Alcoa, Inc. | | | 15,200 | | | | 131 | |
Bemis Co., Inc. | | | 17,700 | | | | 532 | |
Celanese Corp. Class A | | | 8,200 | | | | 363 | |
CF Industries Holdings, Inc. | | | 1,650 | | | | 239 | |
Dow Chemical Co. (The) | | | 33,900 | | | | 975 | |
Ecolab, Inc. | | | 27,000 | | | | 1,562 | |
Freeport-McMoRan Copper & Gold, Inc. | | | 20,600 | | | | 758 | |
Huntsman Corp. | | | 104,800 | | | | 1,048 | |
Martin Marietta Materials, Inc. (Ñ) | | | 8,000 | | | | 603 | |
MeadWestvaco Corp. | | | 10,200 | | | | 305 | |
Monsanto Co. | | | 69,486 | | | | 4,870 | |
Nucor Corp. | | | 17,800 | | | | 704 | |
Packaging Corp. of America | | | 11,900 | | | | 300 | |
Potash Corp. of Saskatchewan, Inc. | | | 13,840 | | | | 571 | |
Praxair, Inc. | | | 7,200 | | | | 770 | |
Precision Castparts Corp. | | | 2,900 | | | | 478 | |
Rockwood Holdings, Inc. (Æ) | | | 5,100 | | | | 201 | |
Sealed Air Corp. | | | 44,800 | | | | 771 | |
Steel Dynamics, Inc. | | | 47,500 | | | | 625 | |
WR Grace & Co. (Æ) | | | 5,100 | | | | 234 | |
| | | | | | | | |
| | | | | | | 16,040 | |
| | | | | | | | |
| Producer Durables - 11.3% | | | | | | | | |
Accenture PLC Class A | | | 29,042 | | | | 1,546 | |
AGCO Corp. (Æ) | | | 14,600 | | | | 627 | |
Automatic Data Processing, Inc. | | | 28,600 | | | | 1,546 | |
Boeing Co. (The) | | | 28,538 | | | | 2,094 | |
Booz Allen Hamilton Holding Corp. Class A (Æ) | | | 11,700 | | | | 202 | |
Brink’s Co. (The) | | | 10,700 | | | | 288 | |
Caterpillar, Inc. | | | 19,544 | | | | 1,770 | |
Con-way, Inc. | | | 21,000 | | | | 612 | |
Cummins, Inc. | | | 6,210 | | | | 547 | |
Danaher Corp. | | | 19,400 | | | | 913 | |
Danone - ADR | | | 90,800 | | | | 1,148 | |
Deere & Co. | | | 12,982 | | | | 1,004 | |
Eaton Corp. | | | 10,300 | | | | 448 | |
Emerson Electric Co. | | | 25,455 | | | | 1,186 | |
FedEx Corp. | | | 24,559 | | | | 2,051 | |
General Dynamics Corp. | | | 7,000 | | | | 465 | |
General Electric Co. | | | 206,300 | | | | 3,695 | |
Harsco Corp. | | | 23,000 | | | | 473 | |
Honeywell International, Inc. | | | 73,458 | | | | 3,994 | |
Illinois Tool Works, Inc. | | | 21,600 | | | | 1,009 | |
Itron, Inc. (Æ) | | | 12,100 | | | | 433 | |
ITT Corp. | | | 700 | | | | 14 | |
Joy Global, Inc. | | | 7,420 | | | | 556 | |
KBR, Inc. | | | 19,500 | | | | 543 | |
L-3 Communications Holdings, Inc. Class 3 | | | 10,100 | | | | 673 | |
Lockheed Martin Corp. | | | 11,600 | | | | 938 | |
Manpower, Inc. | | | 22,200 | | | | 793 | |
Monster Worldwide, Inc. (Æ) | | | 6,000 | | | | 48 | |
Navistar International Corp. (Æ) | | | 10,800 | | | | 409 | |
| | | | | | | | |
| | | Principal
Amount ($)
or Shares | | | Market
Value
$ | |
Norfolk Southern Corp. | | | 4,000 | | | | 291 | |
Northrop Grumman Corp. | | | 9,800 | | | | 573 | |
Parker Hannifin Corp. | | | 10,900 | | | | 831 | |
Pentair, Inc. | | | 26,614 | | | | 886 | |
Pitney Bowes, Inc. | | | 29,800 | | | | 552 | |
Republic Services, Inc. Class A | | | 27,000 | | | | 744 | |
Rockwell Automation, Inc. | | | 18,500 | | | | 1,358 | |
RR Donnelley & Sons Co. | | | 30,000 | | | | 433 | |
Ryder System, Inc. | | | 4,200 | | | | 223 | |
Synopsys, Inc. (Æ) | | | 11,800 | | | | 321 | |
Terex Corp. (Æ) | | | 12,800 | | | | 173 | |
Textron, Inc. | | | 27,800 | | | | 514 | |
Tidewater, Inc. | | | 13,600 | | | | 670 | |
Union Pacific Corp. | | | 6,450 | | | | 683 | |
United Continental Holdings, Inc. (Æ) | | | 32,000 | | | | 604 | |
United Parcel Service, Inc. Class B | | | 13,602 | | | | 995 | |
United Technologies Corp. | | | 14,400 | | | | 1,053 | |
URS Corp. (Æ ) | | | 18,000 | | | | 632 | |
UTi Worldwide, Inc. | | | 17,400 | | | | 231 | |
Werner Enterprises, Inc. | | | 6,700 | | | | 161 | |
Xerox Corp. | | | 40,000 | | | | 318 | |
| | | | | | | | |
| | | | | | | 42,271 | |
| | | | | | | | |
| Technology - 16.7% | | | | | | | | |
Altera Corp. | | | 15,600 | | | | 579 | |
American Tower Corp. Class A | | | 4,500 | | | | 270 | |
Apple, Inc. (Æ) | | | 22,145 | | | | 8,970 | |
Applied Materials, Inc. | | | 197,450 | | | | 2,115 | |
Avago Technologies, Ltd. | | | 14,200 | | | | 410 | |
BCE, Inc. | | | 14,050 | | | | 585 | |
Broadcom Corp. Class A | | | 9,300 | | | | 273 | |
Check Point Software Technologies, Ltd. (Æ)(Ñ) | | | 9,400 | | | | 494 | |
Cisco Systems, Inc. | | | 295,194 | | | | 5,337 | |
Citrix Systems, Inc. (Æ) | | | 9,700 | | | | 589 | |
Cognizant Technology Solutions Corp. Class A (Æ) | | | 11,633 | | | | 748 | |
Dell, Inc. (Æ) | | | 43,200 | | | | 632 | |
Diebold, Inc. | | | 10,900 | | | | 328 | |
Electronic Arts, Inc. (Æ) | | | 48,800 | | | | 1,005 | |
EMC Corp. (Æ) | | | 25,200 | | | | 543 | |
Google, Inc. Class A (Æ) | | | 7,390 | | | | 4,773 | |
Harris Corp. | | | 10,900 | | | | 393 | |
Hewlett-Packard Co. | | | 25,400 | | | | 654 | |
IAC/InterActiveCorp | | | 15,300 | | | | 652 | |
Integrated Device Technology, Inc. (Æ) | | | 71,400 | | | | 390 | |
International Business Machines Corp. | | | 5,100 | | | | 938 | |
Intersil Corp. Class A | | | 22,100 | | | | 231 | |
Koninklijke Philips Electronics NV | | | 33,000 | | | | 691 | |
Linear Technology Corp. | | | 21,000 | | | | 631 | |
LSI Corp. (Æ) | | | 109,600 | | | | 652 | |
Marvell Technology Group, Ltd. (Æ) | | | 51,900 | | | | 719 | |
Maxim Integrated Products, Inc. | | | 25,200 | | | | 656 | |
Mentor Graphics Corp. (Æ) | | | 9,000 | | | | 122 | |
Micron Technology, Inc. (Æ) | | | 58,600 | | | | 369 | |
Microsoft Corp. | | | 217,650 | | | | 5,651 | |
Motorola Solutions, Inc. | | | 16,142 | | | | 747 | |
NCR Corp. (Æ) | | | 34,400 | | | | 566 | |
| | |
| Multi-Style Equity Fund | | 19 |
Russell Investment Funds
Multi-Style Equity Fund
Schedule of Investments, continued — December 31, 2011
Amounts in thousands (except share amounts)
| | | | | | | | |
| | | Principal
Amount ($)
or Shares | | | Market
Value
$ | |
| | | | | | | | |
NetApp, Inc. (Æ) | | | 11,441 | | | | 415 | |
NXP Semiconductor NV (Æ) | | | 11,400 | | | | 175 | |
Oracle Corp. | | | 64,585 | | | | 1,656 | |
QUALCOMM, Inc. | | | 74,627 | | | | 4,081 | |
Rackspace Hosting, Inc. (Æ) | | | 6,500 | | | | 280 | |
Red Hat, Inc. (Æ) | | | 47,200 | | | | 1,949 | |
Riverbed Technology, Inc. (Æ) | | | 11,900 | | | | 280 | |
Salesforce.com, Inc. (Æ) | | | 13,970 | | | | 1,417 | |
SanDisk Corp. (Æ) | | | 16,068 | | | | 791 | |
Teradata Corp. (Æ) | | | 8,200 | | | | 398 | |
Texas Instruments, Inc. | | | 164,274 | | | | 4,782 | |
Unisys Corp. (Æ) | | | 3,900 | | | | 77 | |
VeriFone Systems, Inc. (Æ) | | | 8,400 | | | | 298 | |
VMware, Inc. Class A (Æ) | | | 7,400 | | | | 615 | |
Vodafone Group PLC - ADR | | | 116,100 | | | | 3,254 | |
Xilinx, Inc. | | | 8,500 | | | | 273 | |
Zynga, Inc. Class A (Æ)(Ñ) | | | 1,805 | | | | 17 | |
| | | | | | | | |
| | | | | | | 62,471 | |
| | | | | | | | |
| Utilities - 2.9% | | | | | | | | |
Ameren Corp. | | | 13,500 | | | | 447 | |
AT&T, Inc. | | | 92,400 | | | | 2,794 | |
California Water Service Group | | | 1,000 | | | | 18 | |
Edison International | | | 11,600 | | | | 480 | |
Encana Corp. | | | 18,200 | | | | 337 | |
Entergy Corp. | | | 6,600 | | | | 482 | |
Exelon Corp. | | | 9,700 | | | | 421 | |
FirstEnergy Corp. | | | 18,100 | | | | 802 | |
Frontier Communications Corp. | | | 65,200 | | | | 336 | |
MDU Resources Group, Inc. | | | 22,900 | | | | 491 | |
NextEra Energy, Inc. | | | 28,596 | | | | 1,741 | |
NII Holdings, Inc. (Æ) | | | 13,300 | | | | 283 | |
NV Energy, Inc. | | | 22,600 | | | | 370 | |
PG&E Corp. | | | 8,700 | | | | 359 | |
PPL Corp. | | | 8,500 | | | | 250 | |
Telephone & Data Systems, Inc. (Ñ) | | | 9,900 | | | | 256 | |
Time Warner Telecom, Inc. Class A (Æ) | | | 2,000 | | | | 39 | |
Verizon Communications, Inc. | | | 16,000 | | | | 642 | |
Xylem, Inc. | | | 18,900 | | | | 486 | |
| | | | | | | | |
| | | | | | | 11,034 | |
| | | | | | | | |
| | |
Total Common Stocks
(cost $334,389) | | | | | | | 361,946 | |
| | | | | | | | |
| | |
| Short-Term Investments - 2.7% | | | | | | | | |
Russell U.S. Cash Management Fund | | | 10,158,134 | (¥) | | | 10,158 | |
| | | | | | | | |
| | |
Total Short-Term Investments
(cost $10,158) | | | | | | | 10,158 | |
| | | | | | | | |
| | | | | | | | |
| | | Principal
Amount ($)
or Shares | | | Market
Value
$ | |
| | |
| Other Securities - 0.7% | | | | | | | | |
Russell Investment Funds Liquidating Trust (×) | | | 95,769 | (¥) | | | 97 | |
Russell U.S. Cash Collateral Fund (×) | | | 2,493,867 | (¥) | | | 2,494 | |
| | | | | | | | |
| | |
Total Other Securities
(cost $2,590) | | | | | | | 2,591 | |
| | | | | | | | |
| | |
| Total Investments - 100.3% | | | | | | | | |
(identified cost $347,137) | | | | | | | 374,695 | |
| | |
Other Assets and Liabilities,
Net - (0.3%) | | | | | | | (1,303 | ) |
| | | | | | | | |
| | |
| Net Assets - 100.0% | | | | | | | 373,392 | |
| | | | | | | | |
See accompanying notes which are an integral part of the financial statements.
| | | | |
| | 20 | | | Multi-Style Equity Fund |
Russell Investment Funds
Multi-Style Equity Fund
Schedule of Investments, continued — December 31, 2011
Amounts in thousands (except share amounts)
| | | | | | | | | | | | | | |
| Futures Contracts | | Number of
Contracts | | Notional
Amount | | Expiration
Date | | Unrealized
Appreciation
(Depreciation) $ | |
| | | | | | | | | | | | | | |
| Long Positions | | | | | | | | | | | | | | |
Russell 1000 Mini Index Futures (CME) | | 22 | | | USD | | | 1,520 | | 03/12 | | | 19 | |
S&P 500 E-Mini Index Futures (CME) | | 125 | | | USD | | | 7,829 | | 03/12 | | | 14 | |
S&P 500 Index Futures (CME) | | 7 | | | USD | | | 2,192 | | 03/12 | | | (10 | ) |
| | | | | | | | | | | | | | |
| |
Total Unrealized Appreciation (Depreciation) on Open Futures Contracts (å) | | | 23 | |
| | | | | | | | | | | | | | |
Presentation of Portfolio Holdings — December 31, 2011
Amounts in thousands
| | | | | | | | | | | | | | | | | | | | |
| | | Market Value | | | % of Net
Assets | |
| Portfolio Summary | | Level 1 | | | Level 2 | | | Level 3 | | | Total | | |
Common Stocks | | | | | | | | | | | | | | | | | | | | |
Consumer Discretionary | | $ | 52,527 | | | $ | — | | | $ | — | | | $ | 52,527 | | | | 14.1 | |
Consumer Staples | | | 33,816 | | | | — | | | | — | | | | 33,816 | | | | 9.1 | |
Energy | | | 39,822 | | | | — | | | | — | | | | 39,822 | | | | 10.7 | |
Financial Services | | | 55,805 | | | | — | | | | — | | | | 55,805 | | | | 14.9 | |
Health Care | | | 48,160 | | | | — | | | | — | | | | 48,160 | | | | 12.9 | |
Materials and Processing | | | 16,040 | | | | — | | | | — | | | | 16,040 | | | | 4.3 | |
Producer Durables | | | 42,271 | | | | — | | | | — | | | | 42,271 | | | | 11.3 | |
Technology | | | 62,471 | | | | — | | | | — | | | | 62,471 | | | | 16.7 | |
Utilities | | | 11,034 | | | | — | | | | — | | | | 11,034 | | | | 2.9 | |
Short-Term Investments | | | — | | | | 10,158 | | | | — | | | | 10,158 | | | | 2.7 | |
Other Securities | | | — | | | | 2,591 | | | | — | | | | 2,591 | | | | 0.7 | |
| | | | | | | | | | | | | | | | | | | | |
Total Investments | | | 361,946 | | | | 12,749 | | | | — | | | | 374,695 | | | | 100.3 | |
| | | | | | | | | | | | | | | | | | | | |
Other Assets and Liabilities, Net | | | | | | | | | | | | | | | | | | | (0.3 | ) |
| | | | | | | | | | | | | | | | | | | | |
| | | | | | | | | | | | | | | | | | | 100.0 | |
| | | | | | | | | | | | | | | | | | | | |
Other Financial Instruments | | | | | | | | | | | | | | | | | | | | |
Futures Contracts | | | 23 | | | | — | | | | — | | | | 23 | | | | — | * |
| | | | | | | | | | | | | | | | | | | | |
Total Other Financial Instruments** | | $ | 23 | | | $ | — | | | $ | — | | | $ | 23 | | | | | |
| | | | | | | | | | | | | | | | | | | | |
| * | | Less than .05% of net assets. |
| ** | | Other financial instruments reflected, such as futures, forwards, interest rate swaps, and credit default swaps are valued at the unrealized appreciation/depreciation on the instruments. |
For a description of the levels see note 2 in the Notes to Financial Statements.
There were no significant transfers in and out of levels 1, 2 and 3 during the period ending December 31, 2011.
See accompanying notes which are an integral part of the financial statements.
| | |
| Multi-Style Equity Fund | | 21 |
Russell Investment Funds
Multi-Style Equity Fund
Fair Value of Derivative Instruments — December 31, 2011
Amounts in thousands
| | | | |
| Derivatives not accounted for as hedging instruments | | Equity
Contracts | |
Location: Statement of Assets and Liabilities - Assets | | | | |
Daily variation margin on futures contracts* | | $ | 33 | |
| | | | |
Location: Statement of Assets and Liabilities - Liabilities | | | | |
Daily variation margin on futures contracts* | | $ | 10 | |
| | | | |
| | | | |
| Derivatives not accounted for as hedging instruments | | Equity
Contracts | |
Location: Statement of Operations - Net realized gain (loss) | | | | |
Futures contracts | | $ | (804 | ) |
| | | | |
Location: Statement of Operations - Net change in unrealized appreciation (depreciation) | | | | |
Futures contracts | | $ | (151 | ) |
| | | | |
| * | | Includes cumulative appreciation/depreciation of futures contracts as reported in Schedule of Investments. Only current day’s variation margin is reported within the Statements of Assets and Liabilities. |
For further disclosure on derivatives see note 2 in Notes to Financial Statements.
See accompanying notes which are an integral part of the financial statements.
| | | | |
| | 22 | | | Multi-Style Equity Fund |
(This page intentionally left blank)
Russell Investment Funds
Aggressive Equity Fund
Portfolio Management Discussion and Analysis — December 31, 2011 (Unaudited)
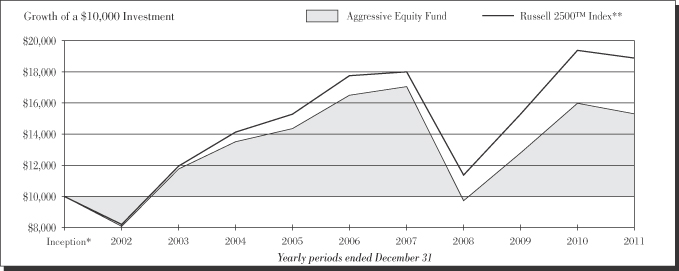
| | | | |
|
| Aggressive Equity Fund | |
| | Total
Return | |
1 Year | | | (4.20 | )% |
5 Years | | | (1.48 | )%§ |
10 Years | | | 4.36 | %§ |
| | | | |
|
| Russell 2500TM Index** | |
| | Total
Return | |
1 Year | | | (2.51 | )% |
5 Years | | | 1.24 | %§ |
10 Years | | | 6.57 | %§ |
| | | | |
| | 24 | | | Aggressive Equity Fund |
Russell Investment Funds
Aggressive Equity Fund
Portfolio Management Discussion and Analysis — December 31, 2011 (Unaudited)
The Aggressive Equity Fund (the “Fund”) allocates most of its assets among multiple money managers. Russell Investment Management Company (“RIMCo”), as the Fund’s advisor, may change the allocation of the Fund’s assets among money managers at any time. An exemptive order from the Securities and Exchange Commission (“SEC”) permits RIMCo to engage or terminate a money manager at any time, subject to approval by the Fund’s Board, without a shareholder vote. Pursuant to the terms of the exemptive order, the Fund is required to notify its shareholders within 60 days of when a money manager begins providing services. The Fund currently has six money managers.
What is the Fund’s investment objective?
The Fund seeks to provide long term capital growth.
How did the Fund perform relative to its benchmark for the fiscal year ended December 31, 2011?
For the fiscal year ended December 31, 2011, the Aggressive Equity Fund lost 4.20%. This is compared to the Fund’s benchmark, the Russell 2500™ Index, which lost 2.51% during the same period. The Fund’s performance includes operating expenses, whereas index returns are unmanaged and do not include expenses of any kind.
For the fiscal year ended December 31, 2011, the Lipper® Small-Cap Core Funds (VIP) Average, a group of funds that Lipper considers to have investment strategies similar to those of the Fund, lost 3.59%. This result serves as a peer comparison and is expressed net of operating expenses.
RIMCo may assign a money manager a specific style or capitalization benchmark other than the Fund’s index. However, the Fund’s primary index remains the benchmark for the Fund and is representative of the aggregate of each money manager’s benchmark index.
How did the market conditions described in the Market Summary report affect the Fund’s performance?
The fiscal year ended December 31, 2011 was a volatile, macro driven market environment. While the U.S. economy continued to show signs of improvement, the vulnerability of this recovery left investors highly sensitive to macroeconomic news. Consequently, investors spent much of the year oscillating between risk and defensiveness, as mixed U.S. economic data, U.S. budget deficit worries and a European sovereign debt crisis all stressed investors’ already frayed nerves. Investors’ focus on the macroeconomic news meant that less attention was paid to company fundamentals, causing stock correlations to be at elevated levels (i.e., similar as opposed to differentiated return patterns) for all of 2011. Stock correlations rose in late 2011 as the European crisis became the global economy’s largest concern. These elevated correlations inhibited excess returns from active management and therefore the money managers’ ability to add value through stock selection.
In response to the economic uncertainty, higher quality growth companies outperformed as investors sought the protection of
companies with greater earnings and operating certainty. These types of companies provided relative downside protection and had the capability to grow earnings despite the economic environment. This preference was beneficial for the Fund, which has a bias to higher quality growth stocks.
How did the investment strategies and techniques employed by the Fund and its money managers affect its benchmark relative performance?
The Fund employs six money managers: two growth-oriented, one market-oriented and three value-oriented. Three of the six managers outperformed for the one year period ending December 31, 2011. Two of the three managers that outperformed, ClariVest Asset Management, LLC (“ClariVest”) and Jacobs Levy Equity Management, Inc. (“Jacobs Levy”), are quantitative managers that benefited from a more favorable market environment for quantitative strategies. Despite the macroeconomic volatility, which resulted in elevated stock correlations, factor correlations remained at normalized levels. In addition factor payoffs were mostly linear in nature (i.e., exposures to factor tails, which are the extreme ends of factors such as high and low beta, were not dominating factor returns as they had in 2009 and 2010). This enabled quantitative managers to be rewarded for their factor bets and consequently outperform through positive stock selection.
For fundamental managers, the market was far more mixed. Investors’ preference for more defensive, higher quality growth stocks was a reflective of the economic uncertainty; however, this meant that higher beta, more cyclically focused managers struggled. In addition, the elevated stock correlations, which were a result of the macroeconomic focus, inhibited stock selection and this was an additional headwind to active managers. Consequently, while there was an even split of managers that outperformed and underperformed, the performance of the underperforming managers was skewed negatively, so that underperforming managers dominated performance.
ClariVest, a quantitative manager that focuses on attractively priced companies with sustainable earnings growth and positive earnings estimate revisions, outperformed its style benchmark, the Russell 2500™ Index. ClariVest benefited from a combination of favorable factor payoffs and a conducive environment for quantitative managers, where there was greater factor payoff stability. This provided positive tailwinds for the manager’s stock selection, which was positive across all but two sectors and accounted for all of the manager’s outperformance. Selection within the consumer discretionary sector was the largest positive contributor. In contrast, the manager’s cyclical sector exposure was penalized and this detracted meaningfully from performance.
DePrince, Race & Zollo, Inc. (“DePrince”), a yield-focused value manager, underperformed its style benchmark, the Russell 2500™ Value Index, for the fiscal year. 2011 was a mixed market environment for the manager. While benefiting
| | |
| Aggressive Equity Fund | | 25 |
Russell Investment Funds
Aggressive Equity Fund
Portfolio Management Discussion and Analysis — December 31, 2011 (Unaudited)
from an underweight exposure to risk and a focus on higher dividend yield, the manager was penalized for its bias to small cap stocks with negative price momentum. However, it was the negative factor headwinds and weak stock selection, primarily within financial services, that resulted in the manager’s negative performance.
Jacobs Levy, a quantitative manager that employs dynamic factor weighting, outperformed its style benchmark, the Russell 2500™ Value Index, for the fiscal year. The manager benefited from the relatively favorable environment for quantitative managers. The manager also benefited from a rotation in early 2011 away from smaller, riskier, more value oriented stocks towards companies with sustainable growth characteristics. The combination of the market conditions and positioning resulted in positive stock selection across all but two sectors, and this accounted for all of the manager’s outperformance.
Ranger Investment Management, L.P. (“Ranger”), a growth manager that focuses on higher quality stocks with accelerating earnings growth, outperformed its style benchmark, the Russell 2500™ Growth Index. Ranger’s focus on higher quality growth stocks was rewarded during the quarter and provided positive tailwinds to the manager’s stock selection. Aided by the favorable market environment and additive active decisions, stock selection was positive and accounted for almost all of the manager’s position. Stock selection within health care was the largest contributor to the manager’s performance.
Signia Capital Management, LLC. (“Signia”), a value-oriented manager, underperformed its style benchmark, the Russell 2500™ Value Index, for the fiscal year. While Signia struggled with an unfavorable environment that penalized its deeper value, higher risk strategy, its underperformance was magnified by weak stock selection. As a result, stock selection was negative across the majority of sectors, with selection in technology the largest detraction. While stock selection was
negative, the manager’s pro-cyclical sector exposure also detracted, primarily due to an underweight exposure to utilities.
Tygh Capital Management, Inc. (“Tygh”), a quality-focused growth-oriented manager, underperformed its style benchmark, the Russell 2500™ Growth Index, for the fiscal year. While the manager benefited from investors’ preference for quality growth, with an overweight exposure to return on equity and earnings growth rewarded, stock selection was negative due to a number of poor decisions made by the manager during the year. The largest of these was in health care, which was also the manager’s worst performing sector.
Describe any changes to the Fund’s structure or the money manager line-up.
There were no changes to the Fund’s structure or the money manager lineup during the period.
| | |
| |
| Money Managers as of December 31, 2011 | | Styles |
| ClariVest Asset Management LLC | | Market Oriented |
| DePrince, Race & Zollo, Inc. | | Value |
| Jacobs Levy Equity Management Inc. | | Value |
| Ranger Investment Management, L.P. | | Growth |
| Signia Capital Management, LLC | | Value |
| Tygh Capital Management, Inc. | | Growth |
The views expressed in this report reflect those of the portfolio managers only through the end of the period covered by the report. These views do not necessarily represent the views of RIMCo, or any other person in RIMCo or any other affiliated organization. These views are subject to change at any time based upon market conditions or other events, and RIMCo disclaims any responsibility to update the views contained herein. These views should not be relied on as investment advice and, because investment decisions for Russell Investment Funds (“RIF”) are based on numerous factors, should not be relied on as an indication of investment decisions of any RIF Fund.
| | | | |
| | 26 | | | Aggressive Equity Fund |
| * | | Assumes initial investment on January 1, 2001. |
| ** | | Russell 2500™ Index is composed of the bottom 500 stocks the Russell 1000® Index and all the stocks in the Russell 2000® Index. The Russell 2500™ Index return reflects adjustments for income dividends and capital gains distributions reinvested as of the ex-dividend dates. |
The performance shown in this section does not reflect any Insurance Company Separate Account or Policy Charges. Performance is historical and assumes reinvestment of all dividends and capital gains. Investment return and principal value will fluctuate so that an investor’s shares, when redeemed, may be worth more or less than when purchased. Past performance is not indicative of future results.
Russell Investment Funds
Aggressive Equity Fund
Shareholder Expense Example — December 31, 2011 (Unaudited)
Fund Expenses
The following disclosure provides important information regarding each Fund’s Expense Example, which appears on each Fund’s individual page in this Annual Report. Please refer to this information when reviewing the Expense Example for a Fund.
Example
As a shareholder of the Fund, you incur two types of costs: (1) transaction costs, and (2) ongoing costs, including advisory fees and other Fund expenses. The Example is intended to help you understand your ongoing costs (in dollars) of investing in the Fund and to compare these costs with the ongoing costs of investing in other mutual funds. The Example is based on an investment of $1,000 invested at the beginning of the period and held for the entire period indicated, which for this Fund is from July 1, 2011 to December 31, 2011.
Actual Expenses
The information in the table under the heading “Actual Performance” provides information about actual account values and actual expenses. You may use the information in this column, together with the amount you invested, to estimate the expenses that you paid over the period. Simply divide your account value by $1,000 (for example, an $8,600 account value divided by $1,000 = 8.6), then multiply the result by the number in the first column in the row entitled “Expenses Paid During Period” to estimate the expenses you paid on your account during this period.
Hypothetical Example for Comparison Purposes
The information in the table under the heading “Hypothetical Performance (5% return before expenses)” provides information about hypothetical account values and hypothetical expenses based on the Fund’s actual expense ratio and an assumed rate of return of 5% per year before expenses, which is not the Fund’s actual return. The hypothetical account values and expenses may not be used to estimate the actual ending account balance or expenses you paid for the period. You may use this information to compare the ongoing costs of investing in the Fund and other funds. To do so, compare this 5% hypothetical example with the 5% hypothetical examples that appear in the shareholder reports of other funds.
Please note that the expenses shown in the table are meant to highlight your ongoing costs only and do not reflect any transactional costs. Therefore, the information under the heading “Hypothetical Performance (5% return before expenses)” is useful in comparing ongoing costs only, and will not help you determine the relative total costs of owning different funds. In addition, if these transactional costs were included, your costs would have been higher. The fee and expenses shown in this section do not reflect any Insurance Company Separate Account or Policy Charges.
| | | | | | | | |
| | Actual
Performance | | | Hypothetical
Performance
(5% return
before expenses) | |
Beginning Account Value | | | | | | | | |
July 1, 2011 | | $ | 1,000 .00 | | | $ | 1,000.00 | |
Ending Account Value | | | | | | | | |
December 31, 2011 | | $ | 899 .30 | | | $ | 1,020.21 | |
Expenses Paid During Period* | | $ | 4 .74 | | | $ | 5 .04 | |
| * | Expenses are equal to the Fund’s annualized expense ratio of 0.99% (representing the six month period annualized), multiplied by the average account value over the period, multiplied by 184/365 (to reflect the one-half year period). May reflect amounts waived, reimbursed and/or other credits. Without any waivers, reimbursements and/or other credits, expenses would have been higher. |
| | |
| Aggressive Equity Fund | | 27 |
Russell Investment Funds
Aggressive Equity Fund
Schedule of Investments — December 31, 2011
Amounts in thousands (except share amounts)
| | | | | | | | |
| | | Principal
Amount ($)
or Shares | | | Market
Value
$ | |
| | | | | | | | |
| Common Stocks - 96.6% | | | | | | | | |
| Consumer Discretionary - 12.7% | | | | | | | | |
Aaron’s, Inc. Class A | | | 3,600 | | | | 96 | |
Abercrombie & Fitch Co. Class A | | | 5,300 | | | | 259 | |
AFC Enterprises, Inc. (Æ) | | | 14,000 | | | | 206 | |
Amerco, Inc. | | | 4,442 | | | | 393 | |
American Eagle Outfitters, Inc. | | | 14,044 | | | | 215 | |
America’s Car-Mart, Inc. (Æ) | | | 9,400 | | | | 368 | |
Ameristar Casinos, Inc. | | | 12,500 | | | | 216 | |
Arctic Cat, Inc. (Æ) | | | 20,691 | | | | 466 | |
Ascena Retail Group, Inc. (Æ) | | | 10,384 | | | | 309 | |
Avis Budget Group, Inc. (Æ) | | | 29,200 | | | | 313 | |
Bebe Stores, Inc. | | | 8,200 | | | | 68 | |
BJ’s Restaurants, Inc. (Æ) | | | 6,260 | | | | 284 | |
Buffalo Wild Wings, Inc. (Æ)(Ñ) | | | 3,591 | | | | 242 | |
Build-A-Bear Workshop, Inc. Class A (Æ) | | | 7,000 | | | | 59 | |
Callaway Golf Co. | | | 48,198 | | | | 267 | |
Carter’s, Inc. (Æ) | | | 3,300 | | | | 131 | |
Cenveo, Inc. (Æ) | | | 24,600 | | | | 84 | |
Charming Shoppes, Inc. (Æ) | | | 26,400 | | | | 129 | |
Chico’s FAS, Inc. | | | 42,820 | | | | 477 | |
Christopher & Banks Corp. | | | 17,096 | | | | 40 | |
Conn’s, Inc. (Æ) | | | 2,500 | | | | 28 | |
Cooper Tire & Rubber Co. | | | 25,630 | | | | 359 | |
Courier Corp. | | | 900 | | | | 11 | |
Cracker Barrel Old Country Store, Inc. | | | 1,018 | | | | 51 | |
Crocs, Inc. (Æ) | | | 9,545 | | | | 141 | |
Dick’s Sporting Goods, Inc. | | | 9,852 | | | | 363 | |
Domino’s Pizza, Inc. (Æ) | | | 9,500 | | | | 323 | |
DSW, Inc. Class A | | | 9,299 | | | | 411 | |
Federal-Mogul Corp. (Æ) | | | 11,500 | | | | 170 | |
Finish Line, Inc. (The) Class A | | | 7,727 | | | | 149 | |
Foot Locker, Inc. | | | 26,550 | | | | 633 | |
Fossil, Inc. (Æ) | | | 2,572 | | | | 204 | |
Fred’s, Inc. Class A | | | 13,800 | | | | 201 | |
Genesco, Inc. (Æ) | | | 6,360 | | | | 393 | |
Gentex Corp. | | | 33,564 | | | | 993 | |
Group 1 Automotive, Inc. | | | 13,340 | | | | 691 | |
Harman International Industries, Inc. | | | 8,600 | | | | 327 | |
Hillenbrand, Inc. | | | 15,300 | | | | 341 | |
HOT Topic, Inc. | | | 113,100 | | | | 748 | |
Jones Group, Inc. (The) | | | 75,710 | | | | 799 | |
Kenneth Cole Productions, Inc. Class A (Æ) | | | 20,509 | | | | 217 | |
Leapfrog Enterprises, Inc. Class A (Æ) | | | 25,900 | | | | 145 | |
Lear Corp. | | | 1,500 | | | | 60 | |
Lincoln Educational Services Corp. | | | 11,600 | | | | 92 | |
Lithia Motors, Inc. Class A | | | 25,800 | | | | 564 | |
LKQ Corp. (Æ) | | | 25,421 | | | | 765 | |
Men’s Wearhouse, Inc. (The) | | | 5,653 | | | | 183 | |
Meredith Corp. (Ñ) | | | 16,140 | | | | 527 | |
Movado Group, Inc. | | | 1,900 | | | | 35 | |
Multimedia Games Holding Co., Inc. (Æ) | | | 10,800 | | | | 86 | |
Newell Rubbermaid, Inc. | | | 2,000 | | | | 32 | |
NVR, Inc. (Æ) | | | 270 | | | | 185 | |
Panera Bread Co. Class A (Æ) | | | 4,462 | | | | 631 | |
Papa John’s International, Inc. (Æ) | | | 5,800 | | | | 219 | |
| | | | | | | | |
| | | Principal
Amount ($)
or Shares | | | Market
Value
$ | |
Penn National Gaming, Inc. (Æ) | | | 8,500 | | | | 324 | |
Polaris Industries, Inc. | | | 8,220 | | | | 460 | |
Pool Corp. | | | 7,800 | | | | 235 | |
RadioShack Corp. | | | 30,220 | | | | 293 | |
Red Robin Gourmet Burgers, Inc. (Æ) | | | 4,200 | | | | 116 | |
Regis Corp. | | | 21,340 | | | | 353 | |
Rick’s Cabaret International, Inc. (Æ) | | | 100 | | | | 1 | |
Rosetta Stone, Inc. (Æ) | | | 4,200 | | | | 32 | |
Ross Stores, Inc. | | | 13,960 | | | | 663 | |
Scholastic Corp. | | | 4,300 | | | | 129 | |
Skechers U.S.A., Inc. Class A (Æ) | | | 9,730 | | | | 118 | |
Smith & Wesson Holding Corp. (Æ) | | | 19,600 | | | | 85 | |
Sotheby’s Class A | | | 15,370 | | | | 439 | |
Standard Motor Products, Inc. | | | 20,800 | | | | 417 | |
Steven Madden, Ltd. (Æ) | | | 17,601 | | | | 607 | |
Stewart Enterprises, Inc. Class A | | | 23,060 | | | | 133 | |
Superior Industries International, Inc. | | | 9,632 | | | | 159 | |
True Religion Apparel, Inc. (Æ) | | | 8,300 | | | | 287 | |
Wendy’s Co. (The) | | | 43,080 | | | | 231 | |
Williams-Sonoma, Inc. | | | 20,960 | | | | 807 | |
Wolverine World Wide, Inc. | | | 23,651 | | | | 843 | |
XO Group, Inc. (Æ) | | | 1,600 | | | | 13 | |
Zale Corp. (Æ)(Ñ) | | | 20,000 | | | | 76 | |
| | | | | | | | |
| | | | | | | 22,520 | |
| | | | | | | | |
| Consumer Staples - 2.4% | | | | | | | | |
Andersons, Inc. (The) | | | 7,563 | | | | 330 | |
Cal-Maine Foods, Inc. (Ñ) | | | 1,390 | | | | 51 | |
Core-Mark Holding Co., Inc. | | | 700 | | | | 28 | |
Corn Products International, Inc. | | | 5,100 | | | | 268 | |
Dean Foods Co. (Æ) | | | 77,700 | | | | 870 | |
Fresh Del Monte Produce, Inc. | | | 10,325 | | | | 258 | |
Green Mountain Coffee Roasters, Inc. (Æ)(Ñ) | | | 4,922 | | | | 221 | |
Herbalife, Ltd. | | | 3,788 | | | | 196 | |
Nash Finch Co. | | | 3,900 | | | | 114 | |
Pantry, Inc. (The) (Æ) | | | 5,800 | | | | 69 | |
Ralcorp Holdings, Inc. (Æ) | | | 3,510 | | | | 300 | |
Rite Aid Corp. (Æ) | | | 97,500 | | | | 123 | |
Smart Balance, Inc. (Æ) | | | 48,100 | | | | 258 | |
SUPERVALU, Inc. (Ñ) | | | 41,100 | | | | 334 | |
Susser Holdings Corp. (Æ) | | | 5,600 | | | | 127 | |
TreeHouse Foods, Inc. (Æ)(Ñ) | | | 9,560 | | | | 625 | |
| | | | | | | | |
| | | | | | | 4,172 | |
| | | | | | | | |
| Energy - 6.6% | | | | | | | | |
Alon USA Energy, Inc. | | | 16,600 | | | | 145 | |
Approach Resources, Inc. (Æ)(Ñ) | | | 32,650 | | | | 960 | |
Arch Coal, Inc. | | | 21,200 | | | | 308 | |
Berry Petroleum Co. Class A | | | 7,034 | | | | 296 | |
Cabot Oil & Gas Corp. | | | 1,832 | | | | 139 | |
CARBO Ceramics, Inc. | | | 1,439 | | | | 177 | |
Cloud Peak Energy, Inc. (Æ) | | | 13,900 | | | | 269 | |
Complete Production Services, Inc. (Æ) | | | 10,743 | | | | 361 | |
Core Laboratories NV | | | 4,077 | | | | 465 | |
Crimson Exploration, Inc. (Æ) | | | 800 | | | | 2 | |
Crosstex Energy, Inc. | | | 13,900 | | | | 176 | |
Delek US Holdings, Inc. | | | 29,000 | | | | 331 | |
| | | | |
| | 28 | | | Aggressive Equity Fund |
Russell Investment Funds
Aggressive Equity Fund
Schedule of Investments, continued — December 31, 2011
Amounts in thousands (except share amounts)
| | | | | | | | |
| | | Principal
Amount ($)
or Shares | | | Market
Value
$ | |
| | | | | | | | |
Dril-Quip, Inc. (Æ) | | | 7,670 | | | | 505 | |
Helix Energy Solutions Group, Inc. (Æ) | | | 13,400 | | | | 212 | |
Helmerich & Payne, Inc. | | | 7,745 | | | | 452 | |
Hornbeck Offshore Services, Inc. (Æ) | | | 16,000 | | | | 496 | |
Lufkin Industries, Inc. | | | 5,430 | | | | 365 | |
Nabors Industries, Ltd. (Æ) | | | 13,257 | | | | 230 | |
Newpark Resources, Inc. (Æ) | | | 54,288 | | | | 515 | |
Oil States International, Inc. (Æ) | | | 4,100 | | | | 313 | |
Parker Drilling Co. (Æ) | | | 14,900 | | | | 107 | |
Patterson-UTI Energy, Inc. | | | 44,485 | | | | 889 | |
Plains Exploration & Production Co. (Æ) | | | 8,700 | | | | 319 | |
Precision Drilling Corp. (Æ) | | | 23,559 | | | | 242 | |
Rosetta Resources, Inc. (Æ) | | | 10,050 | | | | 437 | |
Rowan Cos., Inc. (Æ) | | | 8,685 | | | | 263 | |
SEACOR Holdings, Inc. (Æ) | | | 1,800 | | | | 160 | |
SM Energy Co. | | | 4,300 | | | | 314 | |
Stone Energy Corp. (Æ) | | | 12,100 | | | | 319 | |
Superior Energy Services, Inc. (Æ)(Ñ) | | | 31,139 | | | | 885 | |
Tetra Technologies, Inc. (Æ) | | | 21,172 | | | | 198 | |
Unit Corp. (Æ) | | | 11,867 | | | | 551 | |
USEC, Inc. (Æ)(Ñ) | | | 94,700 | | | | 108 | |
Western Refining, Inc. (Æ) | | | 6,900 | | | | 92 | |
Willbros Group, Inc. (Æ) | | | 4,395 | | | | 16 | |
| | | | | | | | |
| | | | | | | 11,617 | |
| | | | | | | | |
| Financial Services - 19.5% | | | | | | | | |
Affiliated Managers Group, Inc. (Æ) | | | 11,476 | | | | 1,102 | |
Allied World Assurance Co. Holdings AG | | | 6,100 | | | | 384 | |
American Assets Trust, Inc. (ö) | | | 9,250 | | | | 190 | |
American Campus Communities, Inc. (ö) | | | 5,900 | | | | 248 | |
American Financial Group, Inc. | | | 7,100 | | | | 262 | |
Ameriprise Financial, Inc. | | | 5,352 | | | | 266 | |
Arch Capital Group, Ltd. (Æ) | | | 2,900 | | | | 108 | |
Ares Capital Corp. | | | 10,739 | | | | 166 | |
Argo Group International Holdings, Ltd. | | | 4,500 | | | | 130 | |
Assurant, Inc. | | | 11,900 | | | | 489 | |
Assured Guaranty, Ltd. | | | 44,600 | | | | 586 | |
Axis Capital Holdings, Ltd. | | | 13,300 | | | | 425 | |
Baldwin & Lyons, Inc. Class B | | | 500 | | | | 11 | |
Banco Latinoamericano de Comercio Exterior SA Class E | | | 11,800 | | | | 190 | |
Bancorp, Inc. (Æ) | | | 10,405 | | | | 75 | |
Berkshire Hills Bancorp, Inc. | | | 4,800 | | | | 107 | |
BioMed Realty Trust, Inc. (ö) | | | 17,238 | | | | 312 | |
BOK Financial Corp. | | | 1,400 | | | | 77 | |
Boston Private Financial Holdings, Inc. | | | 40,397 | | | | 321 | |
Brookline Bancorp, Inc. | | | 20,790 | | | | 175 | |
Camden Property Trust (ö) | | | 4,700 | | | | 293 | |
Capital City Bank Group, Inc. | | | 1,600 | | | | 15 | |
Capitol Federal Financial, Inc. | | | 35,251 | | | | 407 | |
Cash America International, Inc. | | | 2,800 | | | | 131 | |
Centerstate Banks, Inc. | | | 1,100 | | | | 7 | |
Central Pacific Financial Corp. (Æ)(Ñ) | | | 4,700 | | | | 61 | |
Chesapeake Lodging Trust (ö) | | | 31,420 | | | | 486 | |
Citizens Republic Bancorp, Inc. (Æ) | | | 6,800 | | | | 78 | |
| | | | | | | | |
| | | Principal
Amount ($)
or Shares | | | Market
Value
$ | |
City National Corp. | | | 7,700 | | | | 340 | |
Cogdell Spencer, Inc. (ö) | | | 5,400 | | | | 23 | |
Cohen & Steers, Inc. (Ñ) | | | 15,470 | | | | 447 | |
Colonial Properties Trust (ö) | | | 11,162 | | | | 233 | |
Community Bank System, Inc. | | | 16,562 | | | | 460 | |
Community Trust Bancorp, Inc. | | | 1,000 | | | | 29 | |
DFC Global Corp. (Æ) | | | 19,238 | | | | 347 | |
DiamondRock Hospitality Co. (ö) | | | 32,211 | | | | 311 | |
Dime Community Bancshares, Inc. | | | 11,890 | | | | 149 | |
East West Bancorp, Inc. | | | 39,910 | | | | 789 | |
EastGroup Properties, Inc. (ö) | | | 4,400 | | | | 191 | |
Endurance Specialty Holdings, Ltd. | | | 5,800 | | | | 222 | |
Evercore Partners, Inc. Class A | | | 13,540 | | | | 360 | |
Everest Re Group, Ltd. | | | 2,000 | | | | 168 | |
Extra Space Storage, Inc. (ö) | | | 6,400 | | | | 155 | |
Factset Research Systems, Inc. | | | 2,468 | | | | 215 | |
Fair Isaac Corp. | | | 17,700 | | | | 634 | |
Fidelity National Financial, Inc. Class A | | | 20,600 | | | | 328 | |
First American Financial Corp. | | | 27,500 | | | | 348 | |
First Cash Financial Services, Inc. (Æ) | | | 4,300 | | | | 151 | |
First Industrial Realty Trust, Inc. (Æ)(ö) | | | 13,500 | | | | 138 | |
First Interstate Bancsystem, Inc. Class A | | | 1,100 | | | | 14 | |
FirstMerit Corp. | | | 12,500 | | | | 189 | |
Flagstone Reinsurance Holdings SA | | | 55,430 | | | | 460 | |
Forestar Group, Inc. (Æ) | | | 16,243 | | | | 246 | |
Franklin Street Properties Corp. (ö) | | | 22,243 | | | | 221 | |
Fulton Financial Corp. | | | 30,900 | | | | 303 | |
FXCM, Inc. Class A (Ñ) | | | 11,300 | | | | 110 | |
Gain Capital Holdings, Inc. | | | 1,500 | | | | 10 | |
GFI Group, Inc. | | | 16,300 | | | | 67 | |
Greenhill & Co., Inc. | | | 16,565 | | | | 602 | |
Hanmi Financial Corp. (Æ) | | | 1,700 | | | | 13 | |
Hanover Insurance Group, Inc. (The) | | | 9,325 | | | | 325 | |
Healthcare Realty Trust, Inc. (ö) | | | 19,980 | | | | 371 | |
Hercules Technology Growth Capital, Inc. | | | 28,480 | | | | 269 | |
Horace Mann Educators Corp. | | | 17,595 | | | | 241 | |
Hospitality Properties Trust (ö) | | | 30,264 | | | | 695 | |
Hudson Valley Holding Corp. | | | 855 | | | | 18 | |
Iberiabank Corp. | | | 5,210 | | | | 257 | |
Inland Real Estate Corp. (ö) | | | 13,000 | | | | 99 | |
Interactive Brokers Group, Inc. Class A | | | 19,300 | | | | 288 | |
Invesco Mortgage Capital, Inc. (ö) | | | 7,200 | | | | 101 | |
Investment Technology Group, Inc. (Æ) | | | 16,200 | | | | 175 | |
Investors Real Estate Trust (ö) | | | 6,600 | | | | 48 | |
Jack Henry & Associates, Inc. | | | 10,800 | | | | 363 | |
JER Investors Trust, Inc. (Æ)(Þ) | | | 1,771 | | | | — | |
Jones Lang LaSalle, Inc. | | | 2,500 | | | | 153 | |
KBW, Inc. | | | 41,917 | | | | 636 | |
KeyCorp | | | 48,780 | | | | 375 | |
Knight Capital Group, Inc. Class A (Æ) | | | 47,202 | | | | 558 | |
Kohlberg Capital Corp. | | | 5,700 | | | | 36 | |
Lakeland Financial Corp. | | | 9,820 | | | | 254 | |
LaSalle Hotel Properties (ö) | | | 12,491 | | | | 302 | |
Liberty Property Trust (ö) | | | 12,700 | | | | 392 | |
Mack-Cali Realty Corp. (ö) | | | 10,200 | | | | 272 | |
| | |
| Aggressive Equity Fund | | 29 |
Russell Investment Funds
Aggressive Equity Fund
Schedule of Investments, continued — December 31, 2011
Amounts in thousands (except share amounts)
| | | | | | | | |
| | | Principal
Amount ($)
or Shares | | | Market
Value
$ | |
| | | | | | | | |
Maiden Holdings, Ltd. | | | 18,700 | | | | 164 | |
Manning & Napier, Inc. Class A (Æ) | | | 24,470 | | | | 306 | |
MarketAxess Holdings, Inc. | | | 14,940 | | | | 450 | |
MCG Capital Corp. | | | 12,800 | | | | 51 | |
Meadowbrook Insurance Group, Inc. | | | 7,785 | | | | 83 | |
Medical Properties Trust, Inc. (ö) | | | 26,660 | | | | 263 | |
Medley Capital Corp. | | | 2,300 | | | | 24 | |
MFA Financial, Inc. (ö) | | | 12,800 | | | | 86 | |
Mission West Properties, Inc. (ö) | | | 300 | | | | 3 | |
MPG Office Trust, Inc. (Æ)(ö) | | | 1,000 | | | | 2 | |
Nelnet, Inc. Class A | | | 10,800 | | | | 264 | |
New Mountain Finance Corp. | | | 1,600 | | | | 21 | |
NorthStar Realty Finance Corp. (ö) | | | 25,500 | | | | 122 | |
OceanFirst Financial Corp. | | | 1,700 | | | | 22 | |
PennantPark Investment Corp. | | | 15,622 | | | | 158 | |
Pennsylvania Real Estate Investment Trust (ö) | | | 4,000 | | | | 42 | |
PennyMac Mortgage Investment Trust (ö) | | | 10,700 | | | | 178 | |
Piper Jaffray Cos. (Æ) | | | 11,716 | | | | 237 | |
ProAssurance Corp. | | | 6,700 | | | | 535 | |
Prosperity Bancshares, Inc. | | | 25,710 | | | | 1,038 | |
Protective Life Corp. | | | 21,800 | | | | 492 | |
PS Business Parks, Inc. (ö) | | | 2,300 | | | | 127 | |
Radian Group, Inc. (Ñ) | | | 26,800 | | | | 63 | |
Raymond James Financial, Inc. | | | 19,859 | | | | 614 | |
Reinsurance Group of America, Inc. Class A | | | 4,000 | | | | 209 | |
Resource Capital Corp. (ö) | | | 42,213 | | | | 237 | |
RLI Corp. | | | 3,400 | | | | 248 | |
Sabra Health Care REIT, Inc. (ö) | | | 12,400 | | | | 150 | |
SCBT Financial Corp. | | | 200 | | | | 6 | |
Selective Insurance Group, Inc. | | | 1,200 | | | | 21 | |
Signature Bank NY (Æ) | | | 20,190 | | | | 1,212 | |
Southside Bancshares, Inc. | | | 6,400 | | | | 139 | |
State Auto Financial Corp. | | | 200 | | | | 3 | |
State Bank Financial Corp. (Æ) | | | 8,600 | | | | 130 | |
StellarOne Corp. | | | 24,112 | | | | 274 | |
Sterling Bancorp Class N | | | 22,700 | | | | 196 | |
Sunstone Hotel Investors, Inc. (Æ)(ö) | | | 36,900 | | | | 301 | |
SVB Financial Group (Æ) | | | 14,010 | | | | 668 | |
Symetra Financial Corp. | | | 37,460 | | | | 339 | |
Texas Capital Bancshares, Inc. (Æ) | | | 26,633 | | | | 815 | |
THL Credit, Inc. | | | 1,700 | | | | 21 | |
Trustco Bank Corp. NY | | | 12,000 | | | | 67 | |
UMB Financial Corp. | | | 7,070 | | | | 263 | |
Umpqua Holdings Corp. | | | 24,200 | | | | 300 | |
United Financial Bancorp, Inc. | | | 1,500 | | | | 24 | |
Universal Health Realty Income Trust (ö) | | | 1,800 | | | | 70 | |
Urstadt Biddle Properties, Inc. Class A (ö) | | | 2,600 | | | | 47 | |
Walter Investment Management Corp. | | | 5,000 | | | | 103 | |
Washington Banking Co. | | | 1,400 | | | | 17 | |
Washington Federal, Inc. | | | 49,137 | | | | 687 | |
Webster Financial Corp. | | | 47,900 | | | | 977 | |
WesBanco, Inc. | | | 600 | | | | 12 | |
Wilshire Bancorp, Inc. (Æ) | | | 4,700 | | | | 17 | |
Zions Bancorporation | | | 1,400 | | | | 23 | |
| | | | | | | | |
| | | | | | | 34,524 | |
| | | | | | | | |
| | | | | | | | |
| | | Principal
Amount ($)
or Shares | | | Market
Value
$ | |
| Health Care - 11.4% | | | | | | | | |
Affymetrix, Inc. (Æ) | | | 39,700 | | | | 162 | |
Alere, Inc. (Æ) | | | 10,805 | | | | 249 | |
Allos Therapeutics, Inc. (Æ) | | | 32,600 | | | | 46 | |
Allscripts Healthcare Solutions, Inc. (Æ) | | | 18,605 | | | | 352 | |
AMERIGROUP Corp. Class A (Æ) | | | 6,400 | | | | 378 | |
Analogic Corp. | | | 4,446 | | | | 255 | |
Array Biopharma, Inc. (Æ) | | | 13,317 | | | | 29 | |
Astex Pharmaceuticals (Æ) | | | 14,600 | | | | 28 | |
athenahealth, Inc. (Æ)(Ñ) | | | 1,977 | | | | 97 | |
BioMimetic Therapeutics, Inc. (Æ) | | | 1,100 | | | | 3 | |
Bio-Rad Laboratories, Inc. Class A (Æ) | | | 1,750 | | | | 168 | |
Cambrex Corp. (Æ) | | | 19,800 | | | | 142 | |
Cantel Medical Corp. | | | 10,800 | | | | 302 | |
Catalyst Health Solutions, Inc. (Æ) | | | 19,490 | | | | 1,014 | |
Centene Corp. (Æ) | | | 14,470 | | | | 572 | |
Cerner Corp. (Æ) | | | 7,000 | | | | 429 | |
Computer Programs & Systems, Inc. | | | 8,081 | | | | 413 | |
CONMED Corp. (Æ) | | | 8,966 | | | | 230 | |
Cooper Cos., Inc. (The) | | | 10,851 | | | | 766 | |
Covance, Inc. (Æ) | | | 4,643 | | | | 212 | |
CryoLife, Inc. (Æ) | | | 100 | | | | — | |
Cynosure, Inc. Class A (Æ) | | | 15,620 | | | | 183 | |
Durect Corp. (Æ) | | | 14,400 | | | | 17 | |
Dyax Corp. (Æ) | | | 18,000 | | | | 24 | |
Epocrates, Inc. (Æ)(Ñ) | | | 6,800 | | | | 53 | |
Greatbatch, Inc. (Æ) | | | 1,700 | | | | 38 | |
Haemonetics Corp. (Æ) | | | 2,667 | | | | 163 | |
Harvard Bioscience, Inc. (Æ) | | | 11,813 | | | | 46 | |
Health Management Associates, Inc. Class A (Æ) | | | 15,900 | | | | 117 | |
Health Net, Inc. (Æ) | | | 25,050 | | | | 762 | |
HealthSouth Corp. (Æ) | | | 8,742 | | | | 154 | |
Henry Schein, Inc. (Æ) | | | 3,536 | | | | 228 | |
Hill-Rom Holdings, Inc. | | | 13,500 | | | | 455 | |
HMS Holdings Corp. (Æ) | | | 26,163 | | | | 837 | |
Hologic, Inc. (Æ) | | | 19,500 | | | | 341 | |
Human Genome Sciences, Inc. (Æ) | | | 10,121 | | | | 75 | |
IDEXX Laboratories, Inc. (Æ) | | | 2,510 | | | | 193 | |
Impax Laboratories, Inc. (Æ) | | | 11,775 | | | | 238 | |
IPC The Hospitalist Co., Inc. (Æ) | | | 14,110 | | | | 645 | |
Jazz Pharmaceuticals, Inc. (Æ) | | | 6,272 | | | | 242 | |
LifePoint Hospitals, Inc. (Æ) | | | 4,220 | | | | 157 | |
Masimo Corp. (Æ) | | | 9,004 | | | | 168 | |
Medicines Co. (The) (Æ) | | | 31,700 | | | | 591 | |
Medicis Pharmaceutical Corp. Class A | | | 12,557 | | | | 418 | |
Mednax, Inc. (Æ) | | | 11,469 | | | | 826 | |
Molina Healthcare, Inc. (Æ) | | | 18,950 | | | | 423 | |
Neurocrine Biosciences, Inc. (Æ) | | | 8,100 | | | | 69 | |
PerkinElmer, Inc. | | | 17,500 | | | | 350 | |
Perrigo Co. | | | 10,144 | | | | 987 | |
PharMerica Corp. (Æ) | | | 13,600 | | | | 206 | |
Progenics Pharmaceuticals, Inc. (Æ) | | | 6,300 | | | | 54 | |
Quality Systems, Inc. | | | 7,440 | | | | 275 | |
ResMed, Inc. (Æ) | | | 5,311 | | | | 135 | |
RTI Biologics, Inc. (Æ) | | | 70,300 | | | | 312 | |
STERIS Corp. | | | 18,250 | | | | 544 | |
| | | | |
| | 30 | | | Aggressive Equity Fund |
Russell Investment Funds
Aggressive Equity Fund
Schedule of Investments, continued — December 31, 2011
Amounts in thousands (except share amounts)
| | | | | | | | |
| | | Principal
Amount ($)
or Shares | | | Market
Value
$ | |
| | | | | | | | |
SurModics, Inc. (Æ) | | | 2,700 | | | | 40 | |
SXC Health Solutions Corp. (Æ) | | | 25,131 | | | | 1,420 | |
Techne Corp. | | | 3,136 | | | | 214 | |
Triple-S Management Corp. Class B (Æ) | | | 11,266 | | | | 226 | |
Universal American Corp. | | | 42,464 | | | | 540 | |
Universal Health Services, Inc. Class B | | | 3,750 | | | | 146 | |
Varian Medical Systems, Inc. (Æ) | | | 4,384 | | | | 294 | |
Viropharma, Inc. (Æ) | | | 7,600 | | | | 208 | |
WellCare Health Plans, Inc. (Æ) | | | 14,294 | | | | 751 | |
XenoPort, Inc. (Æ) | | | 12,300 | | | | 47 | |
Zalicus, Inc. (Æ)(Ñ) | | | 51,100 | | | | 62 | |
| | | | | | | | |
| | | | | | | 20,121 | |
| | | | | | | | |
| Materials and Processing - 6.1% | | | | | | | | |
Airgas, Inc. | | | 8,615 | | | | 673 | |
AK Steel Holding Corp. (Ñ) | | | 46,690 | | | | 386 | |
Albemarle Corp. | | | 8,140 | | | | 419 | |
Apogee Enterprises, Inc. | | | 23,200 | | | | 284 | |
Buckeye Technologies, Inc. | | | 8,687 | | | | 290 | |
Cabot Corp. | | | 34,883 | | | | 1,121 | |
Clarcor, Inc. | | | 8,255 | | | | 413 | |
Comfort Systems USA, Inc. | | | 1,400 | | | | 15 | |
Commercial Metals Co. | | | 38,190 | | | | 528 | |
Crown Holdings, Inc. (Æ) | | | 7,406 | | | | 249 | |
Cytec Industries, Inc. | | | 6,485 | | | | 290 | |
Eagle Materials, Inc. | | | 22,570 | | | | 579 | |
HB Fuller Co. | | | 18,026 | | | | 417 | |
Headwaters, Inc. (Æ) | | | 34,300 | | | | 76 | |
Interline Brands, Inc. (Æ) | | | 10,587 | | | | 165 | |
Kaiser Aluminum Corp. | | | 2,370 | | | | 109 | |
KapStone Paper and Packaging Corp. (Æ) | | | 16,600 | | | | 261 | |
Kaydon Corp. | | | 11,770 | | | | 359 | |
Lennox International, Inc. | | | 10,930 | | | | 369 | |
Minerals Technologies, Inc. | | | 2,900 | | | | 164 | |
Neenah Paper, Inc. | | | 1,800 | | | | 40 | |
OM Group, Inc. (Æ) | | | 11,223 | | | | 251 | |
Packaging Corp. of America | | | 13,900 | | | | 351 | |
PH Glatfelter Co. | | | 11,000 | | | | 155 | |
PolyOne Corp. | | | 32,670 | | | | 377 | |
Polypore International, Inc. (Æ)(Ñ) | | | 5,351 | | | | 235 | |
Rockwood Holdings, Inc. (Æ) | | | 9,970 | | | | 393 | |
RTI International Metals, Inc. (Æ) | | | 8,692 | | | | 202 | |
Scotts Miracle-Gro Co. (The) Class A (Ñ) | | | 5,886 | | | | 275 | |
Sensient Technologies Corp. | | | 8,026 | | | | 304 | |
TPC Group, Inc. (Æ) | | | 16,670 | | | | 389 | |
Universal Forest Products, Inc. | | | 10,220 | | | | 315 | |
Watsco, Inc. | | | 1,031 | | | | 68 | |
Wausau Paper Corp. | | | 7,620 | | | | 63 | |
WR Grace & Co. (Æ) | | | 6,500 | | | | 298 | |
| | | | | | | | |
| | | | | | | 10,883 | |
| | | | | | | | |
| Producer Durables - 18.9% | | | | | | | | |
Actuant Corp. Class A | | | 6,998 | | | | 159 | |
Advisory Board Co. (The) (Æ) | | | 4,300 | | | | 319 | |
AGCO Corp. (Æ) | | | 16,395 | | | | 704 | |
Alexander & Baldwin, Inc. | | | 5,868 | | | | 240 | |
Alliant Techsystems, Inc. | | | 5,200 | | | | 297 | |
AM Castle & Co. (Æ) | | | 4,000 | | | | 38 | |
| | | | | | | | |
| | | Principal
Amount ($)
or Shares | | | Market
Value
$ | |
Ametek, Inc. | | | 5,902 | | | | 248 | |
AO Smith Corp. | | | 8,200 | | | | 329 | |
Arkansas Best Corp. | | | 15,700 | | | | 303 | |
Astec Industries, Inc. (Æ) | | | 6,703 | | | | 216 | |
Avery Dennison Corp. | | | 2,100 | | | | 60 | |
Barrett Business Services, Inc. | | | 700 | | | | 14 | |
BE Aerospace, Inc. (Æ) | | | 28,933 | | | | 1,120 | |
Booz Allen Hamilton Holding
Corp. Class A (Æ) | | | 13,000 | | | | 224 | |
Brady Corp. Class A | | | 11,550 | | | | 365 | |
Brink’s Co. (The) | | | 13,900 | | | | 374 | |
Bristow Group, Inc. | | | 14,020 | | | | 664 | |
Cascade Corp. | | | 6,700 | | | | 316 | |
Celadon Group, Inc. | | | 10,400 | | | | 123 | |
Chart Industries, Inc. (Æ) | | | 5,310 | | | | 287 | |
Chicago Bridge & Iron Co. NV | | | 16,984 | | | | 642 | |
CIRCOR International, Inc. | | | 7,399 | | | | 261 | |
Columbus McKinnon Corp. (Æ) | | | 3,000 | | | | 38 | |
Consolidated Graphics, Inc. (Æ) | | | 2,280 | | | | 110 | |
Con-way, Inc. | | | 25,020 | | | | 730 | |
Corrections Corp. of America (Æ) | | | 4,400 | | | | 90 | |
CRA International, Inc. (Æ) | | | 2,300 | | | | 46 | |
Crane Co. | | | 5,300 | | | | 248 | |
Curtiss-Wright Corp. | | | 4,700 | | | | 166 | |
Diana Shipping, Inc. (Æ) | | | 28,485 | | | | 213 | |
Douglas Dynamics, Inc. | | | 4,900 | | | | 72 | |
DXP Enterprises, Inc. (Æ) | | | 7,900 | | | | 254 | |
Electro Rent Corp. | | | 5,099 | | | | 87 | |
Electronics for Imaging, Inc. (Æ) | | | 21,747 | | | | 310 | |
EMCOR Group, Inc. | | | 9,900 | | | | 265 | |
EnerSys (Æ) | | | 12,900 | | | | 335 | |
EnPro Industries, Inc. (Æ) | | | 7,686 | | | | 253 | |
Esterline Technologies Corp. (Æ) | | | 6,000 | | | | 336 | |
Exponent, Inc. (Æ) | | | 6,300 | | | | 290 | |
Flow International Corp. (Æ) | | | 9,800 | | | | 34 | |
G&K Services, Inc. Class A | | | 10,760 | | | | 313 | |
Genesee & Wyoming, Inc. Class A (Æ) | | | 5,402 | | | | 327 | |
GrafTech International, Ltd. (Æ) | | | 21,947 | | | | 300 | |
Granite Construction, Inc. | | | 9,751 | | | | 231 | |
Great Lakes Dredge & Dock Corp. | | | 19,200 | | | | 107 | |
Gulfmark Offshore, Inc. Class A (Æ) | | | 3,100 | | | | 130 | |
Harsco Corp. | | | 20,410 | | | | 420 | |
Hawaiian Holdings, Inc. (Æ) | | | 55,400 | | | | 321 | |
HEICO Corp. (Ñ) | | | 2,546 | | | | 149 | |
HUB Group, Inc. Class A (Æ) | | | 17,712 | | | | 575 | |
Hurco Cos., Inc. (Æ) | | | 800 | | | | 17 | |
Huron Consulting Group, Inc. (Æ) | | | 11,400 | | | | 441 | |
IHS, Inc. Class A (Æ) | | | 6,053 | | | | 522 | |
Joy Global, Inc. | | | 7,833 | | | | 587 | |
Kansas City Southern (Æ) | | | 4,900 | | | | 333 | |
KBR, Inc. | | | 18,305 | | | | 510 | |
Kelly Services, Inc. Class A | | | 6,000 | | | | 82 | |
Kennametal, Inc. | | | 12,200 | | | | 445 | |
Kirby Corp. (Æ) | | | 8,584 | | | | 565 | |
Knight Transportation, Inc. | | | 40,230 | | | | 629 | |
Layne Christensen Co. (Æ) | | | 11,787 | | | | 285 | |
Lexmark International, Inc. Class A | | | 5,000 | | | | 165 | |
| | |
| Aggressive Equity Fund | | 31 |
Russell Investment Funds
Aggressive Equity Fund
Schedule of Investments, continued — December 31, 2011
Amounts in thousands (except share amounts)
| | | | | | | | |
| | | Principal
Amount ($)
or Shares | | | Market
Value
$ | |
| | | | | | | | |
Lincoln Electric Holdings, Inc. | | | 3,520 | | | | 138 | |
Lydall, Inc. (Æ) | | | 1,800 | | | | 17 | |
Manpower, Inc. | | | 1,600 | | | | 57 | |
MAXIMUS, Inc. | | | 18,957 | | | | 784 | |
McGrath Rentcorp | | | 10,230 | | | | 297 | |
Middleby Corp. (Æ) | | | 3,597 | | | | 338 | |
MSC Industrial Direct Co., Inc. Class A | | | 5,612 | | | | 402 | |
MTS Systems Corp. | | | 6,000 | | | | 245 | |
NACCO Industries, Inc. Class A | | | 2,400 | | | | 214 | |
National Instruments Corp. | | | 14,501 | | | | 376 | |
Navigant Consulting, Inc. (Æ) | | | 14,800 | | | | 169 | |
Navistar International Corp. (Æ) | | | 8,400 | | | | 318 | |
Net 1 UEPS Technologies, Inc. (Æ) | | | 14,300 | | | | 110 | |
Orbital Sciences Corp. (Æ) | | | 800 | | | | 12 | |
Pall Corp. | | | 4,089 | | | | 234 | |
Primoris Services Corp. (Ñ) | | | 5,700 | | | | 85 | |
Quality Distribution, Inc. (Æ) | | | 6,700 | | | | 75 | |
Quanta Services, Inc. (Æ) | | | 7,024 | | | | 151 | |
Regal-Beloit Corp. | | | 8,580 | | | | 437 | |
Resources Connection, Inc. | | | 52,550 | | | | 557 | |
Roper Industries, Inc. | | | 5,693 | | | | 495 | |
RSC Holdings, Inc. (Æ)(Ñ) | | | 12,153 | | | | 225 | |
Ryder System, Inc. | | | 5,800 | | | | 308 | |
Saia, Inc. (Æ) | | | 3,500 | | | | 44 | |
SeaCube Container Leasing, Ltd. | | | 4,800 | | | | 71 | |
Sensata Technologies Holding NV (Æ) | | | 8,131 | | | | 214 | |
Southwest Airlines Co. | | | 37,627 | | | | 322 | |
Steelcase, Inc. Class A | | | 41,650 | | | | 311 | |
Stericycle, Inc. (Æ) | | | 3,889 | | | | 303 | |
SYKES Enterprises, Inc. (Æ) | | | 19,400 | | | | 304 | |
Synopsys, Inc. (Æ) | | | 11,300 | | | | 307 | |
Teledyne Technologies, Inc. (Æ) | | | 9,314 | | | | 511 | |
Thomas & Betts Corp. (Æ) | | | 2,900 | | | | 158 | |
Titan International, Inc. (Ñ) | | | 17,994 | | | | 350 | |
Titan Machinery, Inc. (Æ) | | | 11,700 | | | | 254 | |
Towers Watson & Co. Class A | | | 9,300 | | | | 557 | |
TransDigm Group, Inc. (Æ) | | | 4,223 | | | | 404 | |
Trimas Corp. (Æ) | | | 5,900 | | | | 106 | |
Trimble Navigation, Ltd. (Æ) | | | 15,874 | | | | 689 | |
Triumph Group, Inc. | | | 15,610 | | | | 912 | |
TrueBlue, Inc. (Æ) | | | 3,500 | | | | 49 | |
Tsakos Energy Navigation, Ltd. | | | 36,090 | | | | 173 | |
Tutor Perini Corp. (Æ) | | | 9,787 | | | | 121 | |
URS Corp. (Æ) | | | 16,402 | | | | 576 | |
UTi Worldwide, Inc. | | | 3,200 | | | | 43 | |
Wabtec Corp. | | | 7,100 | | | | 497 | |
Waste Connections, Inc. | | | 11,145 | | | | 369 | |
Waters Corp. (Æ) | | | 2,000 | | | | 148 | |
Werner Enterprises, Inc. | | | 12,700 | | | | 306 | |
Woodward, Inc. | | | 7,909 | | | | 324 | |
Zebra Technologies Corp. Class A (Æ) | | | 9,900 | | | | 354 | |
| | | | | | | | |
| | | | | | | 33,455 | |
| | | | | | | | |
| Technology - 15.7% | | | | | | | | |
Acacia Research-Acacia Technologies (Æ) | | | 18,440 | | | | 673 | |
ACI Worldwide, Inc. (Æ) | | | 9,600 | | | | 275 | |
Actuate Corp. (Æ) | | | 4,800 | | | | 28 | |
ADTRAN, Inc. | | | 13,930 | | | | 420 | |
| | | | | | | | |
| | | Principal
Amount ($)
or Shares | | | Market
Value
$ | |
Agilysys, Inc. (Æ) | | | 23,339 | | | | 186 | |
Akamai Technologies, Inc. (Æ) | | | 10,102 | | | | 326 | |
Allot Communications, Ltd. (Æ) | | | 29,998 | | | | 456 | |
American Software, Inc. Class A (Æ) | | | 31,300 | | | | 296 | |
Amphenol Corp. Class A | | | 5,527 | | | | 251 | |
Anadigics, Inc. (Æ) | | | 28,000 | | | | 61 | |
Ansys, Inc. (Æ) | | | 15,056 | | | | 861 | |
Arris Group, Inc. (Æ) | | | 13,000 | | | | 141 | |
Aruba Networks, Inc. (Æ) | | | 15,560 | | | | 288 | |
Avago Technologies, Ltd. | | | 8,456 | | | | 244 | |
Aviat Networks, Inc. (Æ) | | | 9,700 | | | | 18 | |
Axcelis Technologies, Inc. (Æ) | | | 27,514 | | | | 37 | |
Brightpoint, Inc. (Æ) | | | 14,100 | | | | 152 | |
Brooks Automation, Inc. | | | 26,430 | | | | 271 | |
Ceva, Inc. (Æ) | | | 17,020 | | | | 515 | |
Cohu, Inc. (Å) | | | 25,540 | | | | 290 | |
Cray, Inc. (Æ) | | | 7,300 | | | | 47 | |
Cree, Inc. (Æ) | | | 8,018 | | | | 177 | |
CSG Systems International, Inc. (Æ) | | | 7,800 | | | | 115 | |
DSP Group, Inc. (Æ) | | | 7,700 | | | | 40 | |
Electro Scientific Industries, Inc. | | | 49,758 | | | | 721 | |
Emulex Corp. (Æ) | | | 35,100 | | | | 241 | |
Equinix, Inc. (Æ) | | | 7,698 | | | | 780 | |
Exar Corp. (Æ) | | | 2,100 | | | | 14 | |
Extreme Networks (Æ) | | | 22,700 | | | | 66 | |
F5 Networks, Inc. (Æ) | | | 3,265 | | | | 346 | |
Formfactor, Inc. (Æ) | | | 3,900 | | | | 20 | |
Fortinet, Inc. (Æ) | | | 8,769 | | | | 191 | |
Hittite Microwave Corp. (Æ) | | | 7,630 | | | | 377 | |
IAC/InterActiveCorp | | | 28,856 | | | | 1,230 | |
Immersion Corp. (Æ) | | | 6,800 | | | | 35 | |
Informatica Corp. (Æ) | | | 15,779 | | | | 583 | |
Inphi Corp. (Æ) | | | 40,140 | | | | 480 | |
Insight Enterprises, Inc. (Æ) | | | 4,600 | | | | 70 | |
Integrated Device Technology, Inc. (Æ) | | | 48,800 | | | | 266 | |
Intermec, Inc. (Æ) | | | 2,800 | | | | 19 | |
International Rectifier Corp. (Æ) | | | 14,535 | | | | 282 | |
Intersil Corp. Class A | | | 51,710 | | | | 540 | |
Intevac, Inc. (Æ) | | | 4,000 | | | | 30 | |
IPG Photonics Corp. (Æ) | | | 2,445 | | | | 83 | |
JDA Software Group, Inc. (Æ) | | | 25,600 | | | | 829 | |
Kemet Corp. (Æ) | | | 56,801 | | | | 400 | |
Kulicke & Soffa Industries, Inc. (Æ) | | | 32,000 | | | | 296 | |
Lam Research Corp. (Æ) | | | 9,054 | | | | 335 | |
LSI Corp. (Æ) | | | 62,500 | | | | 372 | |
LTX-Credence Corp. (Æ) | | | 14,500 | | | | 78 | |
Manhattan Associates, Inc. (Æ) | | | 7,300 | | | | 296 | |
Mentor Graphics Corp. (Æ) | | | 75,500 | | | | 1,024 | |
Methode Electronics, Inc. | | | 31,870 | | | | 264 | |
Micrel, Inc. | | | 52,410 | | | | 530 | |
MICROS Systems, Inc. (Æ) | | | 11,730 | | | | 546 | |
Microsemi Corp. (Æ) | | | 16,288 | | | | 273 | |
Mindspeed Technologies, Inc. (Æ) | | | 17,300 | | | | 79 | |
MKS Instruments, Inc. | | | 11,670 | | | | 325 | |
Molex, Inc. (Ñ) | | | 13,900 | | | | 332 | |
Monolithic Power Systems, Inc. (Æ) | | | 5,900 | | | | 89 | |
NCR Corp. (Æ) | | | 18,100 | | | | 298 | |
| | | | |
| | 32 | | | Aggressive Equity Fund |
Russell Investment Funds
Aggressive Equity Fund
Schedule of Investments, continued — December 31, 2011
Amounts in thousands (except share amounts)
| | | | | | | | |
| | | Principal
Amount ($)
or Shares | | | Market
Value
$ | |
| | | | | | | | |
NeuStar, Inc. Class A (Æ) | | | 9,400 | | | | 321 | |
NICE Systems, Ltd.-ADR (Æ) | | | 16,263 | | | | 560 | |
Novatel Wireless, Inc. (Æ) | | | 13,000 | | | | 41 | |
Openwave Systems, Inc. (Æ) | | | 3,800 | | | | 6 | |
Opnet Technologies, Inc. | �� | | 8,600 | | | | 315 | |
Opnext, Inc. (Æ) | | | 3,175 | | | | 3 | |
Perficient, Inc. (Æ) | | | 21,570 | | | | 216 | |
PLX Technology, Inc. (Æ) | | | 7,700 | | | | 22 | |
PMC-Sierra, Inc. (Æ) | | | 1,670 | | | | 9 | |
Progress Software Corp. (Æ) | | | 15,736 | | | | 304 | |
QLIK Technologies, Inc. (Æ) | | | 11,960 | | | | 289 | |
Quantum Corp. (Æ) | | | 44,100 | | | | 106 | |
Radisys Corp. (Æ) | | | 6,000 | | | | 30 | |
RealNetworks, Inc. | | | 2,775 | | | | 21 | |
Riverbed Technology, Inc. (Æ) | | | 8,851 | | | | 208 | |
Rovi Corp. (Æ) | | | 14,450 | | | | 355 | |
Sanmina-SCI Corp. (Æ) | | | 48,000 | | | | 447 | |
SBA Communications Corp. Class A (Æ)(Ñ) | | | 13,711 | | | | 589 | |
Seachange International, Inc. (Æ) | | | 4,800 | | | | 34 | |
Sigma Designs, Inc. (Æ) | | | 11,600 | | | | 70 | |
Silicon Image, Inc. (Æ) | | | 26,900 | | | | 126 | |
Silicon Motion Technology Corp. - ADR (Æ) | | | 24,300 | | | | 498 | |
Skyworks Solutions, Inc. (Æ) | | | 14,328 | | | | 232 | |
SolarWinds, Inc. (Æ) | | | 13,600 | | | | 380 | |
Solera Holdings, Inc. | | | 4,326 | | | | 193 | |
Sourcefire, Inc. (Æ) | | | 19,210 | | | | 622 | |
Spansion, Inc. Class A (Æ) | | | 22,400 | | | | 185 | |
Standard Microsystems Corp. (Æ) | | | 4,600 | | | | 119 | |
Synchronoss Technologies, Inc. (Æ) | | | 20,040 | | | | 605 | |
SYNNEX Corp. (Æ) | | | 4,600 | | | | 140 | |
TeleCommunication Systems, Inc. Class A (Æ) | | | 17,000 | | | | 40 | |
TeleNav, Inc. (Æ) | | | 4,200 | | | | 33 | |
THQ, Inc. (Æ)(Ñ) | | | 47,500 | | | | 36 | |
Unisys Corp. (Æ) | | | 20,800 | | | | 410 | |
United Online, Inc. | | | 28,600 | | | | 156 | |
VeriFone Systems, Inc. (Æ) | | | 14,521 | | | | 516 | |
Vishay Intertechnology, Inc. (Æ) | | | 32,057 | | | | 288 | |
Xyratex, Ltd. | | | 26,000 | | | | 347 | |
| | | | | | | | |
| | | | | | | 27,780 | |
| | | | | | | | |
| Utilities - 3.3% | | | | | | | | |
Allete, Inc. | | | 2,830 | | | | 119 | |
Alliant Energy Corp. | | | 8,500 | | | | 375 | |
American States Water Co. | | | 2,580 | | | | 90 | |
Black Hills Corp. | | | 10,119 | | | | 340 | |
California Water Service Group | | | 32,852 | | | | 600 | |
Chesapeake Utilities Corp. | | | 1,200 | | | | 52 | |
Connecticut Water Service, Inc. | | | 1,300 | | | | 35 | |
Idacorp, Inc. | | | 2,300 | | | | 98 | |
Laclede Group, Inc. (The) | | | 2,400 | | | | 97 | |
Northwest Natural Gas Co. | | | 6,130 | | | | 294 | |
NorthWestern Corp. | | | 13,795 | | | | 493 | |
| | | | | | | | |
| | | Principal
Amount ($)
or Shares | | | Market
Value
$ | |
NTELOS Holdings Corp. (Æ) | | | 5,755 | | | | 117 | |
NV Energy, Inc. | | | 21,400 | | | | 350 | |
OGE Energy Corp. | | | 6,000 | | | | 340 | |
Otter Tail Corp. | | | 5,930 | | | | 131 | |
Pinnacle West Capital Corp. | | | 8,400 | | | | 405 | |
PNM Resources, Inc. | | | 52,100 | | | | 949 | |
Portland General Electric Co. | �� | | 10,900 | | | | 276 | |
Premiere Global Services, Inc. (Æ) | | | 381 | | | | 3 | |
Questar Corp. | | | 3,200 | | | | 64 | |
Telephone & Data Systems, Inc. (Ñ) | | | 14,000 | | | | 362 | |
UGI Corp. | | | 9,100 | | | | 268 | |
| | | | | | | | |
| | | | | | | 5,858 | |
| | | | | | | | |
| | |
Total Common Stocks
(cost $157,949) | | | | | | | 170,930 | |
| | | | | | | | |
| | |
| Short-Term Investments - 3.3% | | | | | | | | |
Russell U.S. Cash Management Fund | | | 5,927,424 | (¥) | | | 5,927 | |
| | | | | | | | |
| | |
Total Short-Term Investments
(cost $5,927) | | | | | | | 5,927 | |
| | | | | | | | |
| | |
| Other Securities - 3.4% | | | | | | | | |
Russell Investment Funds Liquidating
Trust (×) | | | 212,328 | (¥) | | | 216 | |
Russell U.S. Cash Collateral Fund (×) | | | 5,834,992 | (¥) | | | 5,835 | |
| | | | | | | | |
| | |
Total Other Securities
(cost $6,047) | | | | | | | 6,051 | |
| | | | | | | | |
| | |
| Total Investments - 103.3% (identified cost $169,923) | | | | | | | 182,908 | |
| | |
Other Assets and Liabilities, Net - (3.3%) | | | | | | | (5,873 | ) |
| | | | | | | | |
| | |
| Net Assets - 100.0% | | | | | | | 177,035 | |
| | | | | | | | |
A portion of the portfolio has been fair valued as of period end.
See accompanying notes which are an integral part of the financial statements.
| | |
| Aggressive Equity Fund | | 33 |
Russell Investment Funds
Aggressive Equity Fund
Schedule of Investments, continued — December 31, 2011
Amounts in thousands (except contract amounts)
| | | | | | | | | | | | | | |
| Futures Contracts | | Number of
Contracts | | | Notional
Amount | | | Expiration
Date | | Unrealized
Appreciation
(Depreciation)
$ | |
| | | | | | | | | | | | | | |
| Long Positions | | | | | | | | | | | | | | |
S&P Midcap 400 E-Mini Index Futures (CME) | | | 69 | | | | USD 6,053 | | | 03/12 | | | 24 | |
| | | | | | | | | | | | | | |
Total Unrealized Appreciation (Depreciation) on Open Futures Contracts (å) | | | 24 | |
| | | | | | | | | | | | | | |
Presentation of Portfolio Holdings — December 31, 2011
Amounts in thousands
| | | | | | | | | | | | | | | | | | | | |
| | | Market Value | | | % of Net
Assets | |
| Portfolio Summary | | Level 1 | | | Level 2 | | | Level 3 | | | Total | | |
| | | | | | | | | | | | | | | | | | | | |
Common Stocks | | | | | | | | | | | | | | | | | | | | |
Consumer Discretionary | | $ | 22,520 | | | $ | — | | | $ | — | | | $ | 22,520 | | | | 12.7 | |
Consumer Staples | | | 4,172 | | | | — | | | | — | | | | 4,172 | | | | 2.4 | |
Energy | | | 11,617 | | | | — | | | | — | | | | 11,617 | | | | 6.6 | |
Financial Services | | | 34,524 | | | | — | | | | — | | | | 34,524 | | | | 19.5 | |
Health Care | | | 20,121 | | | | — | | | | — | | | | 20,121 | | | | 11.4 | |
Materials and Processing | | | 10,883 | | | | — | | | | — | | | | 10,883 | | | | 6.1 | |
Producer Durables | | | 33,455 | | | | — | | | | — | | | | 33,455 | | | | 18.9 | |
Technology | | | 27,780 | | | | — | | | | — | | | | 27,780 | | | | 15.7 | |
Utilities | | | 5,858 | | | | — | | | | — | | | | 5,858 | | | | 3.3 | |
Short-Term Investments | | | — | | | | 5,927 | | | | — | | | | 5,927 | | | | 3.3 | |
Other Securities | | | — | | | | 6,051 | | | | — | | | | 6,051 | | | | 3.4 | |
| | | | | | | | | | | | | | | | | | | | |
Total Investments | | | 170,930 | | | | 11,978 | | | | — | | | | 182,908 | | | | 103.3 | |
| | | | | | | | | | | | | | | | | | | | |
Other Assets and Liabilities, Net | | | | | | | | | | | | | | | | | | | (3.3 | ) |
| | | | | | | | | | | | | | | | | | | | |
| | | | | | | | | | | | | | | | | | | 100.0 | |
| | | | | | | | | | | | | | | | | | | | |
Other Financial Instruments | | | | | | | | | | | | | | | | | | | | |
Futures Contracts | | | 24 | | | | — | | | | — | | | | 24 | | | | — | * |
| | | | | | | | | | | | | | | | | | | | |
Total Other Financial Instruments** | | $ | 24 | | | $ | — | | | $ | — | | | $ | 24 | | | | | |
| | | | | | | | | | | | | | | | | | | | |
| * | Less than .05% of net assets. |
| ** | Other financial instruments reflected, such as futures, forwards, interest rate swaps, and credit default swaps are valued at the unrealized appreciation/depreciation on the instruments. |
For a description of the levels see note 2 in the Notes to Financial Statements.
There were no significant transfers in and out of levels 1, 2 and 3 during the period ending December 31, 2011.
See accompanying notes which are an integral part of the financial statements.
| | | | |
| | 34 | | | Aggressive Equity Fund |
Russell Investment Funds
Aggressive Equity Fund
Fair Value of Derivative Instruments — December 31, 2011
Amounts in thousands
| | | | |
| Derivatives not accounted for as hedging instruments | | Equity
Contracts | |
| | | | |
| Location: Statement of Assets and Liabilities - Assets | | | | |
Daily variation margin on futures contracts* | | $ | 24 | |
| | | | |
| |
| Derivatives not accounted for as hedging instruments | | Equity
Contracts | |
| Location: Statement of Operations - Net realized gain (loss) | | | | |
Futures contracts | | $ | (427 | ) |
| | | | |
| Location: Statement of Operations - Net change in unrealized appreciation (depreciation) | | | | |
Futures contracts | | $ | (98 | ) |
| | | | |
| * | Includes cumulative appreciation/depreciation of futures contracts as reported in Schedule of Investments. Only current day’s variation margin is reported within the Statements of Assets and Liabilities. |
For further disclosure on derivatives see note 2 in Notes to Financial Statements.
See accompanying notes which are an integral part of the financial statements.
| | |
| Aggressive Equity Fund | | 35 |
Russell Investment Funds
Non-U.S. Fund
Portfolio Management Discussion and Analysis — December 31, 2011 (Unaudited)
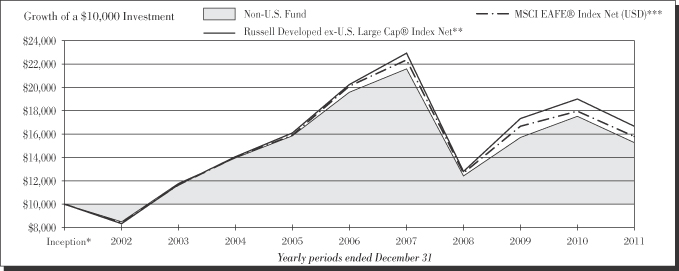
| | | | |
|
| Non-U.S. Fund | |
| | Total
Return | |
1 Year | | | (12.88 | )% |
5 Years | | | (4.88 | )%§ |
10 Years | | | 4.31 | %§ |
| | | | |
|
| Russell Developed ex-U.S. Large Cap® Index Net** | |
| | Total
Return | |
1 Year | | | (12.35 | )% |
5 Years | | | (3.82 | )%§ |
10 Years | | | 5.23 | %§ |
| | | | |
|
| MSCI EAFE® Index Net (USD)*** | |
| | Total
Return | |
1 Year | | | 12.14 | % |
5 Years | | | (4.72 | )%§ |
10 Years | | | 4.67 | %§ |
Russell Investment Funds
Non-U.S. Fund
Portfolio Management Discussion and Analysis — December 31, 2011 (Unaudited)
The Non-U.S. Fund (the “Fund”) allocates most of its assets among multiple money managers. Russell Investment Management Company (“RIMCo”), as the Fund’s advisor, may change the allocation of the Fund’s assets among money managers at any time. An exemptive order from the Securities and Exchange Commission (“SEC”) permits RIMCo to engage or terminate a money manager at any time, subject to approval by the Fund’s Board, without a shareholder vote. Pursuant to the terms of the exemptive order, the Fund is required to notify its shareholders within 60 days of when a money manager begins providing services. The Fund currently has four money managers.
What is the Fund’s investment objective?
The Fund seeks to provide long term capital growth.
How did the Fund perform relative to its benchmark for the fiscal year ended December 31, 2011?
For the fiscal year ended December 31, 2011, the Non-U.S. Fund lost 12.88%. This is compared to the Fund’s benchmark, the Russell Developed ex-U.S. Large Cap® Index Net, which lost 12.35% during the same period. The Fund’s performance includes operating expenses, whereas index returns are unmanaged and do not include expenses of any kind.
For the fiscal year ended December 31, 2011, the Lipper® International Core Funds (VIP) Average, a group of funds that Lipper considers to have investment strategies similar to those of the Fund, lost 13.20%. This result serves as a peer comparison and is expressed net of operating expenses.
RIMCo may assign a money manager a specific style or capitalization benchmark other than the Fund’s index. However, the Fund’s primary index remains the benchmark for the Fund and is representative of the aggregate of each money manager’s benchmark index.
How did the market conditions described in the Market Summary report affect the Fund’s performance?
The continuously volatile market conditions of 2011 proved difficult for Fund performance. The fiscal year ended December 31, 2011 was best characterized as a period where investors were skeptical of companies with high debt levels and variable earnings streams. Stocks with above average dividend yields were the best performers and the Fund’s underweight to such stocks was detractive to returns during the year. While the money managers generally preferred global franchises with strong cash flows and less levered balance sheets, holdings that were more pro-cyclically geared were penalized on weakening prospects for global economic growth and fears about sovereign defaults in Europe.
During the fiscal year, the Fund allocated approximately 9% of its assets to emerging markets because money managers saw relatively attractive opportunities in these regions. However, this allocation was the key source of Fund underperformance on a regional basis, as emerging markets underperformed developed non-U.S. markets by more than 5.5% during the
year, as measured by the Russell Emerging Markets Index. Concerns about geopolitical unrest, as exemplified by the “Arab spring,” in conjunction with high levels of inflation rates in China and Brazil, weighed upon country returns throughout 2011. These concerns were exacerbated by growing fears late in the year of renewed recession in Europe (a major trading partner and buyer of emerging markets’ exports), which further depressed emerging markets returns. The overweight exposure to emerging markets had a negative impact of roughly 1% on excess returns at the total Fund level.
The Fund’s 3% overweight to continental Europe was modestly beneficial given money managers’ preference for northern European markets such as Germany, the Netherlands, and Switzerland. These gains were entirely offset by holdings within the banking and industrial sectors, which fell sharply in response to the region’s unresolved debt crisis and potential for economic recession. While the Fund held a range of blue chip global companies in Europe, these were not immune to the impact of local events. Greater success was generated in Japan where an avoidance of companies that were impacted by the earthquake and nuclear disaster or the strong Yen helped.
Sector effects were similarly bifurcated with strong stock picking in technology and materials helping to blunt the shortfall generated by holdings in financials and consumer discretionary. Materials companies were the worst performing segment of the market in 2011, so unique holdings proved beneficial relative to mining firms that were under pressure by weaker demand forecasts. The Fund benefited from positive stock selection within technology, which was the second worst performing sector. However, positive stock selection was insufficient to overcome the drag from lackluster holdings in financials, which generally were negatively impacted by the European debt crisis. A number of consumer discretionary stocks also detracted as global consumption trends moderated.
How did the investment strategies and techniques employed by the Fund and its money managers affect its benchmark relative performance?
Investment strategies that favored companies with high historic earnings growth and that paid higher dividends, most of which resided in the defensive sectors of consumer staples and health care, tended to outperform the Fund’s benchmark during the period. Investment strategies that avoided Europe’s financial turmoil also outperformed. As global economic growth faltered, investors became increasingly skeptical of companies with aggressive growth forecasts. The Fund’s money managers were not well positioned on a number of these factors and this acted as a headwind to active returns during the year. For example, the Fund was underweight the top deciles of dividend yield and during a “risk off” year, this detracted from performance. Beyond this, an overweight to the highest forecast growth companies also had a negative impact. At a sector level, it was an overweight to technology coupled with underweights in health care and energy that detracted from the positive impact of stock selection. Country positioning was generally beneficial
Russell Investment Funds
Non-U.S. Fund
Portfolio Management Discussion and Analysis — December 31, 2011 (Unaudited)
(i.e., underweight Japan and overweight U.K.), however the 9% allocation to emerging markets more than offset these beneficial weights. Despite a volatile market environment, the money managers’ stock selection within technology and consumer staples was additive, though this effect was moderated by poor stock selection within financials. Over the course of the fiscal year, two of the Fund’s money managers outperformed the Fund’s benchmark and two underperformed, the latter by enough to cause the Fund to lag its benchmark.
Barrow, Hanley, Mewhinney & Strauss, Inc. (“Barrow Hanley”) outperformed the RGI Developed ex-U.S. Large Cap® Index for the fiscal year. Barrow’s strongest gains came from stock selection within the consumer staples and energy sectors. The manager’s returns were bolstered by a large overweight to stocks with the highest dividend yields.
Marsico Capital Management, LLC (“Marsico”) was the worst performing money manager in the Fund, trailing the RGI Developed ex-U.S. Large Cap® Index for the fiscal year. Notably high exposure to forecast earnings growth, emerging markets and price momentum were impediments to Marsico’s stock picks. In addition to being underweight defensive sectors that outperformed, stock selection was weak in financials, energy and consumer discretionary.
MFS Institutional Advisors, Inc. (“MFS”) outperformed the RGI Developed ex-U.S. Large Cap® Index during the fiscal year and was the best performer in the Fund. Its quality-growth strategy leads to selection of global companies with strong earnings growth and low financial leverage. This investment orientation was rewarded given investor sentiment during 2011. The manager’s strong stock selection in materials and continental Europe, both segments of the market that lagged the broader market, benefited the Fund’s performance.
Pzena Investment Management, LLC (“Pzena”) lagged the RGI Developed ex-U.S. Large Cap® Index during the period. Pzena is the Fund’s deep value manager and the manager with the
greatest exposure to the financials sector. While the allocation effect was not sizable, poor stock picks within that sector fully offset positive stock selection across the broader portfolio. Pzena’s holdings in Europe were generally stocks with higher levels of market beta, and these were most severely sold off by investors seeking safety during the year.
Describe any changes to the Fund’s structure or the money manager line-up.
There were no changes to the Fund’s structure or money manager line-up during the year.
| | |
| |
| Money Managers as of December 31, 2011 | | Styles |
| Barrow, Hanley, Mewhinney & Strauss, LLC | | Value |
| Marsico Capital Management LLC | | Growth |
| MFS Institutional Advisors Inc. | | Growth |
| Pzena Investment Management LLC | | Value |
The views expressed in this report reflect those of the portfolio managers only through the end of the period covered by the report. These views do not necessarily represent the views of RIMCo or any other person in RIMCo or any other affiliated organization. These views are subject to change at any time based upon market conditions or other events, and RIMCo disclaims any responsibility to update the views contained herein. These views should not be relied on as investment advice and, because investment decisions for Russell Investment Funds (“RIF”) are based on numerous factors, should not be relied on as an indication of investment decisions of any RIF Fund.
| * | | Assumes initial investment on January 1, 2001. |
| ** | | Effective January 1, 2011, RIMCo changed the Fund’s primary benchmark from the Morgan Stanley Capital International Europe, Australia, Far East (MSCI EAFE®) Index Net (USD) to the Russell Developed ex-U.S. Large Cap® Index Net. RIMCo believes the Russell Developed ex-U.S. Large Cap® Index Net is an appropriate benchmark which more broadly represents the investable universe of stocks. Russell Developed ex-U.S. Large Cap® Index Net is an index which offers investors access to the large-cap segment of the global equity market, excluding companies assigned to the United States. It is constructed to provide a comprehensive and unbiased barometer for the large-cap segment and is completely reconstituted annually to accurately reflect the changes in the market over time. |
| *** | | MSCI EAFE® Index Net (USD) is an index, with dividends reinvested, representative of the securities markets of 20 developed countries in Europe, Australasia and the Far East. |
The performance shown in this section does not reflect any Insurance Company Separate Account or Policy Charges. Performance is historical and assumes reinvestment of all dividends and capital gains. Investment return and principal value will fluctuate so that an investor’s shares, when redeemed, may be worth more or less than when purchased. Past performance is not indicative of future results.
Russell Investment Funds
Non-U.S. Fund
Shareholder Expense Example — December 31, 2011 (Unaudited)
Fund Expenses
The following disclosure provides important information regarding each Fund’s Expense Example, which appears on each Fund’s individual page in this Annual Report. Please refer to this information when reviewing the Expense Example for a Fund.
Example
As a shareholder of the Fund, you incur two types of costs: (1) transaction costs, and (2) ongoing costs, including advisory fees and other Fund expenses. The Example is intended to help you understand your ongoing costs (in dollars) of investing in the Fund and to compare these costs with the ongoing costs of investing in other mutual funds. The Example is based on an investment of $1,000 invested at the beginning of the period and held for the entire period indicated, which for this Fund is from July 1, 2011 to December 31, 2011.
Actual Expenses
The information in the table under the heading “Actual Performance” provides information about actual account values and actual expenses. You may use the information in this column, together with the amount you invested, to estimate the expenses that you paid over the period. Simply divide your account value by $1,000 (for example, an $8,600 account value divided by $1,000 = 8.6), then multiply the result by the number in the first column in the row entitled “Expenses Paid During Period” to estimate the expenses you paid on your account during this period.
Hypothetical Example for Comparison Purposes
The information in the table under the heading “Hypothetical Performance (5% return before expenses)” provides information about hypothetical account values and hypothetical expenses based on the Fund’s actual expense ratio and an assumed rate of return of 5% per year before expenses, which is not the Fund’s actual return. The hypothetical account values and expenses may not be used to estimate the actual ending account balance or expenses you paid for the period. You may use this information to compare the ongoing costs of investing in the Fund and other funds. To do so, compare this 5% hypothetical example with the 5% hypothetical examples that appear in the shareholder reports of other funds.
Please note that the expenses shown in the table are meant to highlight your ongoing costs only and do not reflect any transactional costs. Therefore, the information under the heading “Hypothetical Performance (5% return before expenses)” is useful in comparing ongoing costs only, and will not help you determine the relative total costs of owning different funds. In addition, if these transactional costs were included, your costs would have been higher. The fee and expenses shown in this section do not reflect any Insurance Company Separate Account or Policy Charges.
| | | | | | | | |
| | Actual
Performance | | | Hypothetical
Performance
(5% return
before expenses) | |
| | | | | | | | |
Beginning Account Value | | | | | | | | |
July 1, 2011 | | $ | 1,000.00 | | | $ | 1,000.00 | |
Ending Account Value | | | | | | | | |
December 31, 2011 | | $ | 831 .90 | | | $ | 1,020.06 | |
Expenses Paid During Period* | | $ | 4 .71 | | | $ | 5 .19 | |
| * | Expenses are equal to the Fund’s annualized expense ratio of 1.02% (representing the six month period annualized), multiplied by the average account value over the period, multiplied by 184/365 (to reflect the one-half year period). May reflect amounts waived, reimbursed and/or other credits. Without any waivers, reimbursements and/or other credits, expenses would have been higher. |
Russell Investment Funds
Non-U.S. Fund
Schedule of Investments — December 31, 2011
Amounts in thousands (except share amounts)
| | | | | | | | |
| | | Principal
Amount ($)
or Shares | | | Market
Value
$ | |
| | | | | | | | |
| Common Stocks - 92.1% | | | | | | | | |
| Australia - 1.0% | | | | | | | | |
Billabong International, Ltd. (Ñ) | | | 164,300 | | | | 297 | |
QBE Insurance Group, Ltd. | | | 81,038 | | | | 1,073 | |
Wesfarmers, Ltd. | | | 35,200 | | | | 1,062 | |
Westpac Banking Corp. (Ñ) | | | 43,780 | | | | 896 | |
| | | | | | | | |
| | | | | | | 3,328 | |
| | | | | | | | |
| Austria - 0.0% | | | | | | | | |
Erste Group Bank AG | | | 3,160 | | | | 56 | |
| | | | | | | | |
| | |
| Belgium - 0.8% | | | | | | | | |
Anheuser-Busch InBev NV Class 2 | | | 37,434 | | | | 2,292 | |
KBC Groep NV | | | 17,798 | | | | 224 | |
| | | | | | | | |
| | | | | | | 2,516 | |
| | | | | | | | |
| | |
| Bermuda - 1.0% | | | | | | | | |
Li & Fung, Ltd. (Ñ) | | | 1,180,000 | | | | 2,185 | |
RenaissanceRe Holdings, Ltd. | | | 13,200 | | | | 982 | |
Yue Yuen Industrial Holdings, Ltd. | | | 18,500 | | | | 58 | |
| | | | | | | | |
| | | | | | | 3,225 | |
| | | | | | | | |
| | |
| Brazil - 1.5% | | | | | | | | |
BM&FBovespa SA | | | 99,900 | | | | 525 | |
BR Malls Participacoes SA | | | 88,100 | | | | 856 | |
Brookfield Incorporacoes SA | | | 507,300 | | | | 1,346 | |
Embraer SA - ADR (Æ) | | | 5,500 | | | | 139 | |
OGX Petroleo e Gas Participacoes SA (Æ) | | | 209,200 | | | | 1,527 | |
Tim Participacoes SA - ADR (Æ) | | | 23,210 | | | | 599 | |
| | | | | | | | |
| | | | | | | 4,992 | |
| | | | | | | | |
| | |
| Canada - 1.7% | | | | | | | | |
Canadian National Railway Co. (Þ) | | | 50,619 | | | | 3,977 | |
Imax Corp. (Æ)(Ñ) | | | 22,055 | | | | 404 | |
Pacific Rubiales Energy Corp. | | | 31,734 | | | | 583 | |
Potash Corp. of Saskatchewan, Inc. | | | 16,523 | | | | 682 | |
| | | | | | | | |
| | | | | | | 5,646 | |
| | | | | | | | |
| | |
| Cayman Islands - 0.7% | | | | | | | | |
Baidu, Inc. - ADR (Æ) | | | 12,690 | | | | 1,478 | |
Belle International Holdings, Ltd. Class A | | | 474,000 | | | | 826 | |
| | | | | | | | |
| | | | | | | 2,304 | |
| | | | | | | | |
| | |
| Czech Republic - 0.2% | | | | | | | | |
Komercni Banka AS | | | 4,254 | | | | 717 | |
| | | | | | | | |
| | |
| Denmark - 1.3% | | | | | | | | |
Danske Bank A/S (Æ) | | | 156,376 | | | | 1,986 | |
Novo Nordisk A/S Class B | | | 12,779 | | | | 1,469 | |
Novozymes A/S Class B | | | 23,289 | | | | 719 | |
| | | | | | | | |
| | | | | | | 4,174 | |
| | | | | | | | |
| | | | | | | | |
| | | Principal
Amount ($)
or Shares | | | Market
Value
$ | |
| France - 7.4% | | | | | | | | |
Air Liquide SA Class A | | | 15,102 | | | | 1,868 | |
Capital Gemini SA | | | 51,500 | | | | 1,609 | |
Casino Guichard Perrachon SA (Æ) | | | 4,900 | | | | 413 | |
Credit Agricole SA | | | 99,985 | | | | 564 | |
Danone | | | 29,240 | | | | 1,838 | |
Dassault Systemes SA (Ñ) | | | 6,300 | | | | 505 | |
GDF Suez | | | 38,400 | | | | 1,050 | |
Lagardere SCA | | | 28,031 | | | | 740 | |
Legrand SA - ADR | | | 31,818 | | | | 1,023 | |
LVMH Moet Hennessy Louis Vuitton SA - ADR | | | 15,796 | | | | 2,237 | |
Natixis | | | 112,358 | | | | 283 | |
Pernod-Ricard SA | | | 25,006 | | | | 2,319 | |
Publicis Groupe SA - ADR | | | 14,442 | | | | 664 | |
Rallye SA | | | 48,885 | | | | 1,367 | |
Sanofi - ADR | | | 34,182 | | | | 2,511 | |
Schneider Electric SA | | | 55,517 | | | | 2,923 | |
SCOR SE - ADR | | | 20,080 | | | | 469 | |
Total SA | | | 26,600 | | | | 1,360 | |
UBISOFT Entertainment (Æ) | | | 110,845 | | | | 742 | |
| | | | | | | | |
| | | | | | | 24,485 | |
| | | | | | | | |
| | |
| Germany - 6.4% | | | | | | | | |
Adidas AG | | | 14,796 | | | | 962 | |
Bayer AG | | | 25,987 | | | | 1,662 | |
Bayerische Motoren Werke AG | | | 18,149 | | | | 1,216 | |
Beiersdorf AG (Æ) | | | 24,348 | | | | 1,381 | |
Deutsche Boerse AG (Æ) | | | 31,705 | | | | 1,662 | |
E.ON AG | | | 48,100 | | | | 1,038 | |
Henkel AG & Co. KGaA | | | 15,787 | | | | 764 | |
Infineon Technologies AG - ADR | | | 81,783 | | | | 616 | |
Linde AG | | | 21,395 | | | | 3,182 | |
Merck KGaA | | | 11,169 | | | | 1,114 | |
MTU Aero Engines Holding AG | | | 49,471 | | | | 3,166 | |
SAP AG - ADR | | | 27,041 | | | | 1,430 | |
Siemens AG | | | 14,925 | | | | 1,428 | |
Volkswagen AG | | | 11,066 | | | | 1,484 | |
| | | | | | | | |
| | | | | | | 21,105 | |
| | | | | | | | |
| | |
| Hong Kong - 1.6% | | | | | | | | |
AIA Group, Ltd. | | | 246,200 | | | | 769 | |
China Unicom Hong Kong, Ltd. (Ñ) | | | 1,206,000 | | | | 2,537 | |
CNOOC, Ltd. | | | 622,000 | | | | 1,088 | |
Hang Lung Properties, Ltd. - ADR | | | 312,000 | | | | 887 | |
| | | | | | | | |
| | | | | | | 5,281 | |
| | | | | | | | |
| | |
| India - 0.6% | | | | | | | | |
ICICI Bank, Ltd. - ADR | | | 57,525 | | | | 1,521 | |
Infosys, Ltd. - ADR (Ñ) | | | 11,160 | | | | 573 | |
| | | | | | | | |
| | | | | | | 2,094 | |
| | | | | | | | |
Russell Investment Funds
Non-U.S. Fund
Schedule of Investments, continued — December 31, 2011
Amounts in thousands (except share amounts)
| | | | | | | | |
| | | Principal
Amount ($)
or Shares | | | Market
Value
$ | |
| | | | | | | | |
| | |
| Ireland - 0.4% | | | | | | | | |
Accenture PLC Class A | | | 24,205 | | | | 1,288 | |
| | | | | | | | |
| | |
| Israel - 0.7% | | | | | | | | |
Check Point Software Technologies, Ltd. (Æ)(Ñ) | | | 12,243 | | | | 643 | |
Teva Pharmaceutical Industries,
Ltd. - ADR | | | 39,650 | | | | 1,601 | |
| | | | | | | | |
| | | | | | | 2,244 | |
| | | | | | | | |
| | |
| Italy - 2.3% | | | | | | | | |
Enel SpA | | | 309,700 | | | | 1,260 | |
ENI SpA - ADR | | | 146,907 | | | | 3,044 | |
Finmeccanica SpA (Ñ) | | | 102,046 | | | | 377 | |
Prada SpA (Æ)(Ñ) | | | 48,600 | | | | 220 | |
Snam Rete Gas SpA | | | 380,025 | | | | 1,676 | |
Telecom Italia SpA | | | 978,100 | | | | 1,052 | |
| | | | | | | | |
| | | | | | | 7,629 | |
| | | | | | | | |
| | |
| Japan - 13.7% | | | | | | | | |
Amada Co., Ltd. | | | 190,700 | | | | 1,209 | |
Canon, Inc. (Ñ) | | | 155,100 | | | | 6,872 | |
Dai-ichi Life Insurance Co., Ltd. (The) (Ñ) | | | 675 | | | | 664 | |
Denso Corp. | | | 41,900 | | | | 1,157 | |
FANUC Corp. | | | 16,500 | | | | 2,525 | |
Honda Motor Co., Ltd. (Ñ) | | | 63,800 | | | | 1,946 | |
Hoya Corp. | | | 79,800 | | | | 1,719 | |
Inpex Corp. | | | 269 | | | | 1,695 | |
ITOCHU Corp. | | | 266,100 | | | | 2,705 | |
Japan Tobacco, Inc. | | | 231 | | | | 1,086 | |
Lawson, Inc. (Ñ) | | | 22,200 | | | | 1,386 | |
Mabuchi Motor Co., Ltd. (Ñ) | | | 37,300 | | | | 1,553 | |
Marubeni Corp. | | | 107,000 | | | | 652 | |
Mitsubishi UFJ Financial Group, Inc. | | | 186,700 | | | | 793 | |
Mori Seiki Co., Ltd. (Ñ) | | | 94,400 | | | | 841 | |
MS&AD Insurance Group Holdings | | | 53,100 | | | | 984 | |
Nintendo Co., Ltd. | | | 8,700 | | | | 1,199 | |
Nissan Motor Co., Ltd. (Ñ) | | | 61,600 | | | | 554 | |
NTT DoCoMo, Inc. - ADR (Ñ) | | | 2,050 | | | | 38 | |
NTT DoCoMo, Inc. | | | 975 | | | | 1,792 | |
Rakuten, Inc. (Ñ) | | | 518 | | | | 557 | |
Shin-Etsu Chemical Co., Ltd. | | | 73,700 | | | | 3,629 | |
Sumitomo Corp. (Ñ) | | | 161,700 | | | | 2,189 | |
Sumitomo Mitsui Financial Group, Inc. | | | 39,900 | | | | 1,111 | |
Sumitomo Realty & Development Co., Ltd. | | | 36,000 | | | | 630 | |
THK Co., Ltd. (Ñ) | | | 61,600 | | | | 1,214 | |
Toshiba TEC Corp. | | | 109,479 | | | | 390 | |
Toyota Motor Corp. | | | 27,500 | | | | 916 | |
Yamada Denki Co., Ltd. | | | 9,540 | | | | 649 | |
Yokogawa Electric Corp. (Ñ) | | | 273,500 | | | | 2,470 | |
| | | | | | | | |
| | | | | | | 45,125 | |
| | | | | | | | |
| | |
| Jersey - 0.8% | | | | | | | | |
Experian PLC | | | 93,622 | | | | 1,273 | |
WPP PLC | | | 145,357 | | | | 1,525 | |
| | | | | | | | |
| | | | | | | 2,798 | |
| | | | | | | | |
| | | | | | | | |
| | | Principal
Amount ($)
or Shares | | | Market
Value
$ | |
| | |
| Luxembourg - 0.7% | | | | | | | | |
ArcelorMittal | | | 40,173 | | | | 735 | |
Millicom International Cellular SA | | | 16,297 | | | | 1,632 | |
| | | | | | | | |
| | | | | | | 2,367 | |
| | | | | | | | |
| | |
| Mexico - 0.2% | | | | | | | | |
Wal-Mart de Mexico SAB de CV | | | 243,900 | | | | 668 | |
| | | | | | | | |
| Netherlands - 6.4% | | | | | | | | |
Aegon NV | | | 237,157 | | | | 952 | |
Akzo Nobel NV | | | 72,534 | | | | 3,507 | |
ASML Holding NV Class G | | | 43,794 | | | | 1,841 | |
European Aeronautic Defence and Space Co. NV | | | 32,665 | | | | 1,021 | |
Heineken NV | | | 55,693 | | | | 2,577 | |
ING Groep NV (Æ) | | | 545,945 | | | | 3,929 | |
Koninklijke Philips Electronics NV | | | 94,804 | | | | 1,998 | |
Randstad Holding NV (Æ) | | | 30,674 | | | | 908 | |
Reed Elsevier NV (Æ) | | | 95,975 | | | | 1,119 | |
Sensata Technologies Holding NV (Æ) | | | 42,958 | | | | 1,129 | |
Unilever NV | | | 36,450 | | | | 1,253 | |
Wolters Kluwer NV | | | 27,014 | | | | 467 | |
Yandex NV Class A (Æ) | | | 16,795 | | | | 331 | |
| | | | | | | | |
| | | | | | | 21,032 | |
| | | | | | | | |
| | |
| Norway - 1.9% | | | | | | | | |
DNB ASA | | | 175,200 | | | | 1,715 | |
Orkla ASA | | | 200,800 | | | | 1,499 | |
Statoil ASA Class N | | | 55,900 | | | | 1,435 | |
Statoil Fuel & Retail ASA (Æ) | | | 213,500 | | | | 1,592 | |
| | | | | | | | |
| | | | | | | 6,241 | |
| | | | | | | | |
| | |
| Russia - 0.4% | | | | | | | | |
Gazprom OAO - ADR (Æ) | | | 134,490 | | | | 1,434 | |
| | | | | | | | |
| | |
| Singapore - 1.9% | | | | | | | | |
Jardine Cycle & Carriage, Ltd. (Ñ) | | | 102,900 | | | | 3,818 | |
Keppel Corp., Ltd. - ADR | | | 37,200 | | | | 267 | |
Singapore Telecommunications, Ltd. | | | 235,000 | | | | 560 | |
United Overseas Bank, Ltd. (Ñ) | | | 142,400 | | | | 1,676 | |
| | | | | | | | |
| | | | | | | 6,321 | |
| | | | | | | | |
| | |
| South Africa - 0.2% | | | | | | | | |
MTN Group, Ltd. | | | 39,432 | | | | 702 | |
| | | | | | | | |
| | |
| South Korea - 1.3% | | | | | | | | |
Samsung Electronics Co., Ltd. | | | 2,682 | | | | 2,463 | |
Shinhan Financial Group Co., Ltd. (Æ) | | | 48,371 | | | | 1,669 | |
| | | | | | | | |
| | | | | | | 4,132 | |
| | | | | | | | |
| | |
| Spain - 1.8% | | | | | | | | |
Amadeus IT Holding SA Class A (Ñ) | | | 61,353 | | | | 995 | |
Banco Santander SA - ADR | | | 345,982 | | | | 2,629 | |
Inditex SA | | | 13,818 | | | | 1,132 | |
Indra Sistemas SA (Ñ) | | | 47,450 | | | | 604 | |
Red Electrica Corp. SA (Ñ) | | | 9,980 | | | | 427 | |
| | | | | | | | |
| | | | | | | 5,787 | |
| | | | | | | | |
Russell Investment Funds
Non-U.S. Fund
Schedule of Investments, continued — December 31, 2011
Amounts in thousands (except share amounts)
| | | | | | | | |
| | | Principal
Amount ($)
or Shares | | | Market
Value
$ | |
| | | | | | | | |
| | |
| Sweden - 0.5% | | | | | | | | |
Hennes & Mauritz AB Class B | | | 44,837 | | | | 1,441 | |
Svenska Cellulosa AB Class B | | | 8,953 | | | | 133 | |
| | | | | | | | |
| | | | | | | 1,574 | |
| | | | | | | | |
| | |
| Switzerland - 9.2% | | | | | | | | |
ACE, Ltd. | | | 17,725 | | | | 1,243 | |
Cie Financiere Richemont SA | | | 11,035 | | | | 558 | |
Credit Suisse Group AG (Æ) | | | 32,224 | | | | 757 | |
GAM Holding AG (Æ) | | | 60,701 | | | | 659 | |
Givaudan SA (Æ) | | | 774 | | | | 737 | |
Helvetia Holding AG (Æ) | | | 5,815 | | | | 1,826 | |
Julius Baer Group, Ltd. (Æ) | | | 88,332 | | | | 3,455 | |
Nestle SA | | | 92,581 | | | | 5,323 | |
Novartis AG | | | 74,950 | | | | 4,286 | |
Roche Holding AG | | | 22,505 | | | | 3,814 | |
Sonova Holding AG (Æ) | | | 5,622 | | | | 588 | |
Swatch Group AG (The) Class B | | | 3,595 | | | | 1,345 | |
Swiss Re AG (Æ) | | | 11,484 | | | | 585 | |
TE Connectivity, Ltd. | | | 42,900 | | | | 1,322 | |
UBS AG (Æ) | | | 200,791 | | | | 2,390 | |
Zurich Financial Services AG (Æ) | | | 6,353 | | | | 1,437 | |
| | | | | | | | |
| | | | | | | 30,325 | |
| | | | | | | | |
| | |
| Taiwan - 1.8% | | | | | | | | |
Hon Hai Precision Industry Co., Ltd. | | | 660,624 | | | | 1,809 | |
Hon Hai Precision Industry Co., Ltd. - GDR | | | 99,784 | | | | 549 | |
HTC Corp. | | | 20,700 | | | | 340 | |
Taiwan Semiconductor Manufacturing Co., Ltd. - ADR | | | 256,719 | | | | 3,314 | |
| | | | | | | | |
| | | | | | | 6,012 | |
| | | | | | | | |
| | |
| Thailand - 0.3% | | | | | | | | |
Bangkok Bank PCL | | | 200,800 | | | | 1,044 | |
| | | | | | | | |
| | |
| United Kingdom - 20.7% | | | | | | | | |
Aegis Group plc (Æ) | | | 657,547 | | | | 1,475 | |
Anglo American PLC | | | 55,774 | | | | 2,061 | |
ARM Holdings PLC | | | 110,556 | | | | 1,016 | |
Aviva PLC | | | 145,971 | | | | 682 | |
BAE Systems PLC | | | 422,300 | | | | 1,870 | |
Barclays PLC | | | 952,910 | | | | 2,605 | |
BG Group PLC | | | 34,571 | | | | 739 | |
BP PLC | | | 598,699 | | | | 4,281 | |
BP PLC - ADR | | | 8,100 | | | | 346 | |
British Sky Broadcasting Group PLC | | | 144,063 | | | | 1,639 | |
Burberry Group PLC | | | 28,466 | | | | 524 | |
Carillion PLC | | | 158,375 | | | | 740 | |
Compass Group PLC | | | 153,830 | | | | 1,460 | |
Dairy Crest Group PLC | | | 208,609 | | | | 1,089 | |
| | | | | | | | |
| | | Principal
Amount ($)
or Shares | | | Market
Value
$ | |
Diageo PLC | | | 97,498 | | | | 2,130 | |
GlaxoSmithKline PLC - ADR | | | 55,900 | | | | 1,277 | |
Hays PLC | | | 265,342 | | | | 264 | |
Home Retail Group PLC | | | 270,828 | | | | 351 | |
HSBC Holdings PLC | | | 787,458 | | | | 6,005 | |
Imperial Tobacco Group PLC | | | 112,747 | | | | 4,264 | |
National Grid PLC | | | 280,439 | | | | 2,722 | |
Reckitt Benckiser Group PLC | | | 26,784 | | | | 1,323 | |
Reed Elsevier PLC | | | 79,951 | | | | 644 | |
Rio Tinto PLC (Æ) | | | 23,840 | | | | 1,157 | |
Rolls-Royce Holdings PLC (Å)(Æ) | | | 61,640 | | | | 715 | |
Royal Bank of Scotland Group PLC - ADR (Æ) | | | 1,407,623 | | | | 441 | |
Royal Dutch Shell PLC Class A | | | 198,176 | | | | 7,240 | |
Sage Group PLC (The) | | | 237,721 | | | | 1,086 | |
Shire PLC - ADR (Æ) | | | 38,152 | | | | 1,329 | |
Smith & Nephew PLC | | | 122,585 | | | | 1,191 | |
Smiths Group PLC | | | 57,089 | | | | 811 | |
Standard Chartered PLC | | | 149,578 | | | | 3,273 | |
Tesco PLC | | | 260,082 | | | | 1,630 | |
Travis Perkins PLC | | | 148,200 | | | | 1,831 | |
Tullow Oil PLC | | | 48,877 | | | | 1,064 | |
Vodafone Group PLC - ADR (Æ) | | | 1,964,492 | | | | 5,457 | |
Xstrata PLC | | | 91,435 | | | | 1,389 | |
| | | | | | | | |
| | | | | | | 68,121 | |
| | | | | | | | |
| | |
| United States - 2.5% | | | | | | | | |
Citigroup, Inc. | | | 36,765 | | | | 967 | |
Las Vegas Sands Corp. (Æ) | | | 14,958 | | | | 639 | |
MercadoLibre, Inc. | | | 11,135 | | | | 886 | |
Philip Morris International, Inc. | | | 52,300 | | | | 4,104 | |
Synthes, Inc. (Æ)(Þ) | | | 2,321 | | | | 389 | |
Wynn Resorts, Ltd. | | | 10,803 | | | | 1,194 | |
| | | | | | | | |
| | | | | | | 8,179 | |
| | | | | | | | |
| | |
| Virgin Islands, British - 0.2% | | | | | | | | |
Arcos Dorados Holdings, Inc. Class A | | | 32,203 | | | | 661 | |
| | | | | | | | |
Total Common Stocks
(cost $309,834) | | | | | | | 303,607 | |
| | | | | | | | |
| Preferred Stocks - 0.3% | | | | | | | | |
| Brazil - 0.2% | | | | | | | | |
Usinas Siderurgicas de Minas Gerais SA (Æ) | | | 107,300 | | | | 584 | |
| | | | | | | | |
| | |
| Germany - 0.1% | | | | | | | | |
Porsche Automobil Holding SE | | | 7,250 | | | | 388 | |
| | | | | | | | |
Total Preferred Stocks
(cost $1,327) | | | | | | | 972 | |
| | | | | | | | |
| Short-Term Investments - 7.0% | | | | | |
| United States - 7.0% | | | | | | | | |
Russell U.S. Cash Management Fund | | | 23,155,039 | (¥) | | | 23,155 | |
| | | | | | | | |
Total Short-Term Investments
(cost $23,155) | | | | | | | 23,155 | |
| | | | | | | | |
Russell Investment Funds
Non-U.S. Fund
Schedule of Investments, continued — December 31, 2011
Amounts in thousands (except share amounts)
| | | | | | | | |
| | | Principal
Amount ($)
or Shares | | | Market
Value
$ | |
| | | | | | | | |
| Other Securities - 7.5% | | | | | | | | |
Russell Investment Funds Liquidating Trust (×) | | | 731,421 | (¥) | | | 743 | |
Russell U.S. Cash Collateral Fund (×) | | | 23,969,002 | (¥) | | | 23,969 | |
| | | | | | | | |
Total Other Securities
(cost $24,700) | | | | | | | 24,712 | |
| | | | | | | | |
| Total Investments - 106.9% (identified cost $359,016) | | | | | | | 352,446 | |
Other Assets and Liabilities,
Net - (6.9%) | | | | | | | (22,868 | ) |
| | | | | | | | |
| Net Assets - 100.0% | | | | | | | 329,578 | |
| | | | | | | | |
See accompanying notes which are an integral part of the financial statements.
Russell Investment Funds
Non-U.S. Fund
Schedule of Investments, continued — December 31, 2011
Amounts in thousands (except contract amounts)
| | | | | | | | | | | | | | | | |
| Futures Contracts | | Number of
Contracts | | Notional
Amount | | | Expiration
Date | | Unrealized Appreciation (Depreciation) $ | |
| | | | | | | | | | | | | | | | |
| Long Positions | | | | | | | | | | | | | | | | |
ASX SPI 200 Index Futures (Australia) | | 19 | | | AUD | | | | 1,909 | | | 03/12 | | | (81 | ) |
CAC 40 Index Futures (France) | | 70 | | | EUR | | | | 2,216 | | | 01/12 | | | 54 | |
DAX Index Futures (Germany) | | 12 | | | EUR | | | | 1,770 | | | 03/12 | | | 20 | |
EURO STOXX 50 Index Futures (EMU) | | 170 | | | EUR | | | | 3,924 | | | 03/12 | | | 73 | |
FTSE 100 Index Futures (UK) | | 58 | | | GBP | | | | 3,211 | | | 03/12 | | | 100 | |
Hang Seng Index Futures (Hong Kong) | | 6 | | | HKD | | | | 5,537 | | | 01/12 | | | (6 | ) |
S&P TSE 60 Index Futures (Canada) | | 20 | | | CAD | | | | 2,716 | | | 03/12 | | | 4 | |
TOPIX Index Futures (Japan) | | 51 | | | JPY | | | | 371,279 | | | 03/12 | | | (71 | ) |
| | | | | | | | | | | | | | | | |
Total Unrealized Appreciation (Depreciation) on Open Futures Contracts (å) | | | 93 | |
| | | | | | | | | | | | | | | | |
| | | | | | | | | | | | | | | | | | | | |
| Foreign Currency Exchange Contracts | | | | | | | | | | | | | | | | |
Counterparty | | Amount
Sold | | | Amount
Bought | | Settlement
Date | | | Unrealized
Appreciation
(Depreciation)
$ | |
Barclays Bank PLC | | USD | | | 324 | | | | AUD | | | 319 | | | 03/21/12 | | | | — | |
Barclays Bank PLC | | USD | | | 477 | | | | CAD | | | 483 | | | 03/21/12 | | | | (4 | ) |
Barclays Bank PLC | | USD | | | 1,739 | | | | EUR | | | 1,298 | | | 03/21/12 | | | | (58 | ) |
Barclays Bank PLC | | USD | | | 778 | | | | GBP | | | 496 | | | 03/21/12 | | | | (9 | ) |
Barclays Bank PLC | | USD | | | 139 | | | | HKD | | | 1,079 | | | 03/21/12 | | | | — | |
Barclays Bank PLC | | USD | | | 810 | | | | JPY | | | 62,750 | | | 03/21/12 | | | | 7 | |
Brown Brothers Harriman & Co. | | USD | | | 101 | | | | AUD | | | 100 | | | 03/21/12 | | | | — | |
Brown Brothers Harriman & Co. | | USD | | | 147 | | | | CAD | | | 150 | | | 03/21/12 | | | | — | |
Brown Brothers Harriman & Co. | | USD | | | 402 | | | | EUR | | | 300 | | | 03/21/12 | | | | (13 | ) |
Brown Brothers Harriman & Co. | | USD | | | 235 | | | | GBP | | | 150 | | | 03/21/12 | | | | (2 | ) |
Brown Brothers Harriman & Co. | | USD | | | 39 | | | | HKD | | | 300 | | | 03/21/12 | | | | — | |
Brown Brothers Harriman & Co. | | USD | | | 259 | | | | JPY | | | 20,000 | | | 03/21/12 | | | | 2 | |
Citibank | | AUD | | | 46 | | | | USD | | | 46 | | | 01/04/12 | | | | (1 | ) |
Commonwealth Bank of Australia | | USD | | | 324 | | | | AUD | | | 319 | | | 03/21/12 | | | | — | |
Commonwealth Bank of Australia | | USD | | | 1,739 | | | | EUR | | | 1,298 | | | 03/21/12 | | | | (58 | ) |
Commonwealth Bank of Australia | | USD | | | 810 | | | | JPY | | | 62,750 | | | 03/21/12 | | | | 7 | |
Credit Suisse First Boston | | USD | | | 324 | | | | AUD | | | 319 | | | 03/21/12 | | | | — | |
Credit Suisse First Boston | | USD | | | 477 | | | | CAD | | | 483 | | | 03/21/12 | | | | (4 | ) |
Credit Suisse First Boston | | USD | | | 1,739 | | | | EUR | | | 1,298 | | | 03/21/12 | | | | (58 | ) |
Credit Suisse First Boston | | USD | | | 778 | | | | GBP | | | 496 | | | 03/21/12 | | | | (9 | ) |
Deutsche Bank AG | | USD | | | 324 | | | | AUD | | | 319 | | | 03/21/12 | | | | — | |
Deutsche Bank AG | | USD | | | 1,739 | | | | EUR | | | 1,298 | | | 03/21/12 | | | | (59 | ) |
Deutsche Bank AG | | USD | | | 139 | | | | HKD | | | 1,079 | | | 03/21/12 | | | | — | |
HSBC Bank PLC | | USD | | | 324 | | | | AUD | | | 319 | | | 03/21/12 | | | | — | |
HSBC Bank PLC | | USD | | | 477 | | | | CAD | | | 483 | | | 03/21/12 | | | | (4 | ) |
HSBC Bank PLC | | USD | | | 1,739 | | | | EUR | | | 1,298 | | | 03/21/12 | | | | (58 | ) |
HSBC Bank PLC | | USD | | | 778 | | | | GBP | | | 496 | | | 03/21/12 | | | | (9 | ) |
HSBC Bank PLC | | USD | | | 139 | | | | HKD | | | 1,079 | | | 03/21/12 | | | | — | |
HSBC Bank PLC | | USD | | | 809 | | | | JPY | | | 62,750 | | | 03/21/12 | | | | 7 | |
JP Morgan Chase Bank | | USD | | | 324 | | | | AUD | | | 319 | | | 03/21/12 | | | | — | |
JP Morgan Chase Bank | | USD | | | 477 | | | | CAD | | | 483 | | | 03/21/12 | | | | (4 | ) |
JP Morgan Chase Bank | | USD | | | 1,739 | | | | EUR | | | 1,298 | | | 03/21/12 | | | | (58 | ) |
JP Morgan Chase Bank | | USD | | | 779 | | | | GBP | | | 496 | | | 03/21/12 | | | | (9 | ) |
JP Morgan Chase Bank | | USD | | | 139 | | | | HKD | | | 1,079 | | | 03/21/12 | | | | — | |
JP Morgan Chase Bank | | USD | | | 810 | | | | JPY | | | 62,750 | | | 03/21/12 | | | | 7 | |
JP Morgan Chase Bank | | EUR | | | 200 | | | | USD | | | 261 | | | 03/21/12 | | | | 2 | |
JP Morgan Chase Bank | | GBP | | | 200 | | | | USD | | | 309 | | | 03/21/12 | | | | (1 | ) |
Morgan Stanley & Co., Inc. | | USD | | | 86 | | | | SEK | | | 593 | | | 01/04/12 | | | | — | |
See accompanying notes which are an integral part of the financial statements.
Russell Investment Funds
Non-U.S. Fund
Schedule of Investments, continued — December 31, 2011
Amounts in thousands
| | | | | | | | | | | | | | | | | | | | |
| Foreign Currency Exchange Contracts | | | | | | | | | | | | | | | | |
Counterparty | | Amount
Sold | | | Amount
Bought | | Settlement
Date | | | Unrealized
Appreciation
(Depreciation)
$ | |
Royal Bank of Canada | | USD | | | 477 | | | | CAD | | | 483 | | | 03/21/12 | | | | (4 | ) |
Royal Bank of Canada | | USD | | | 779 | | | | GBP | | | 496 | | | 03/21/12 | | | | (9 | ) |
Royal Bank of Canada | | USD | | | 139 | | | | HKD | | | 1,079 | | | 03/21/12 | | | | — | |
Royal Bank of Canada | | USD | | | 810 | | | | JPY | | | 62,750 | | | 03/21/12 | | | | 7 | |
Royal Bank of Scotland PLC | | USD | | | 57 | | | | CHF | | | 53 | | | 01/04/12 | | | | — | |
Royal Bank of Scotland PLC | | USD | | | 94 | | | | DKK | | | 540 | | | 01/03/12 | | | | — | |
Royal Bank of Scotland PLC | | USD | | | 124 | | | | EUR | | | 96 | | | 01/03/12 | | | | — | |
Royal Bank of Scotland PLC | | USD | | | 285 | | | | GBP | | | 185 | | | 01/04/12 | | | | 2 | |
Royal Bank of Scotland PLC | | USD | | | 168 | | | | HKD | | | 1,306 | | | 01/03/12 | | | | — | |
Royal Bank of Scotland PLC | | USD | | | 180 | | | | JPY | | | 13,957 | | | 01/05/12 | | | | 2 | |
Royal Bank of Scotland PLC | | USD | | | 24 | | | | SEK | | | 166 | | | 01/03/12 | | | | — | |
State Street Bank & Trust Co. | | USD | | | 17 | | | | AUD | | | 17 | | | 01/03/12 | | | | — | |
State Street Bank & Trust Co. | | USD | | | 2 | | | | BRL | | | 4 | | | 01/03/12 | | | | — | |
State Street Bank & Trust Co. | | USD | | | 10 | | | | BRL | | | 18 | | | 01/03/12 | | | | — | |
State Street Bank & Trust Co. | | USD | | | 24 | | | | BRL | | | 46 | | | 01/03/12 | | | | — | |
State Street Bank & Trust Co. | | USD | | | 26 | | | | BRL | | | 49 | | | 01/03/12 | | | | — | |
State Street Bank & Trust Co. | | USD | | | 477 | | | | CAD | | | 483 | | | 03/21/12 | | | | (4 | ) |
State Street Bank & Trust Co. | | USD | | | 260 | | | | EUR | | | 200 | | | 03/21/12 | | | | (1 | ) |
State Street Bank & Trust Co. | | USD | | | 778 | | | | GBP | | | 496 | | | 03/21/12 | | | | (9 | ) |
State Street Bank & Trust Co. | | USD | | | 12 | | | | HKD | | | 94 | | | 01/03/12 | | | | — | |
State Street Bank & Trust Co. | | USD | | | 22 | | | | HKD | | | 169 | | | 01/04/12 | | | | — | |
State Street Bank & Trust Co. | | USD | | | 2 | | | | THB | | | 53 | | | 01/04/12 | | | | — | |
State Street Bank & Trust Co. | | USD | | | 1 | | | | THB | | | 39 | | | 01/05/12 | | | | — | |
State Street Bank & Trust Co. | | AUD | | | 9 | | | | USD | | | 9 | | | 01/03/12 | | | | — | |
State Street Bank & Trust Co. | | AUD | | | 105 | | | | USD | | | 107 | | | 01/03/12 | | | | (1 | ) |
State Street Bank & Trust Co. | | AUD | | | — | | | | USD | | | — | | | 01/05/12 | | | | — | |
State Street Bank & Trust Co. | | AUD | | | 31 | | | | USD | | | 32 | | | 01/05/12 | | | | — | |
State Street Bank & Trust Co. | | AUD | | | 100 | | | | USD | | | 101 | | | 03/21/12 | | | | (1 | ) |
State Street Bank & Trust Co. | | CAD | | | 100 | | | | USD | | | 98 | | | 03/21/12 | | | | — | |
State Street Bank & Trust Co. | | EUR | | | 200 | | | | USD | | | 264 | | | 03/21/12 | | | | 5 | |
State Street Bank & Trust Co. | | EUR | | | 200 | | | | USD | | | 261 | | | 03/21/12 | | | | 2 | |
State Street Bank & Trust Co. | | JPY | | | 20,000 | | | | USD | | | 257 | | | 03/21/12 | | | | (4 | ) |
State Street Bank & Trust Co. | | THB | | | 359 | | | | USD | | | 11 | | | 01/04/12 | | | | — | |
State Street Bank & Trust Co. | | THB | | | 522 | | | | USD | | | 16 | | | 01/05/12 | | | | — | |
UBS AG | | CHF | | | 23 | | | | USD | | | 25 | | | 01/05/12 | | | | — | |
Westpac Banking Corp. | | USD | | | 139 | | | | HKD | | | 1,079 | | | 03/21/12 | | | | — | |
Westpac Banking Corp. | | USD | | | 810 | | | | JPY | | | 62,750 | | | 03/21/12 | | | | 7 | |
| | | | | | | | | | | | | | | | | | | | |
| | |
Total Unrealized Appreciation (Depreciation) on Open Foreign Currency Exchange Contracts | | | | | | | (394 | ) |
| | | | | | | | | | | | | | | | | | | | |
See accompanying notes which are an integral part of the financial statements.
Russell Investment Funds
Non-U.S. Fund
Presentation of Portfolio Holdings — December 31, 2011
Amounts in thousands
| | | | | | | | | | | | | | | | | | | | |
| | | Market Value | | | % of Net
Assets | |
| Portfolio Summary | | Level 1 | | | Level 2 | | | Level 3 | | | Total | | |
| | | | | | | | | | | | | | | | | | | | |
Common Stocks | | | | | | | | | | | | | | | | | | | | |
Australia | | $ | 3,328 | | | $ | — | | | $ | — | | | $ | 3,328 | | | | 1.0 | |
Austria | | | 56 | | | | — | | | | — | | | | 56 | | | | — | * |
Belgium | | | 2,516 | | | | — | | | | — | | | | 2,516 | | | | 0.8 | |
Bermuda | | | 3,225 | | | | — | | | | — | | | | 3,225 | | | | 1.0 | |
Brazil | | | 4,992 | | | | — | | | | — | | | | 4,992 | | | | 1.5 | |
Canada | | | 5,646 | | | | — | | | | — | | | | 5,646 | | | | 1.7 | |
Cayman Islands | | | 2,304 | | | | — | | | | — | | | | 2,304 | | | | 0.7 | |
Czech Republic | | | 717 | | | | — | | | | — | | | | 717 | | | | 0.2 | |
Denmark | | | 4,174 | | | | — | | | | — | | | | 4,174 | | | | 1.3 | |
France | | | 24,485 | | | | — | | | | — | | | | 24,485 | | | | 7.4 | |
Germany | | | 21,105 | | | | — | | | | — | | | | 21,105 | | | | 6.4 | |
Hong Kong | | | 5,281 | | | | — | | | | — | | | | 5,281 | | | | 1.6 | |
India | | | 2,094 | | | | — | | | | — | | | | 2,094 | | | | 0.6 | |
Ireland | | | 1,288 | | | | — | | | | — | | | | 1,288 | | | | 0.4 | |
Israel | | | 2,244 | | | | — | | | | — | | | | 2,244 | | | | 0.7 | |
Italy | | | 7,629 | | | | — | | | | — | | | | 7,629 | | | | 2.3 | |
Japan | | | 45,125 | | | | — | | | | — | | | | 45,125 | | | | 13.7 | |
Jersey | | | 2,798 | | | | — | | | | — | | | | 2,798 | | | | 0.8 | |
Luxembourg | | | 2,367 | | | | — | | | | — | | | | 2,367 | | | | 0.7 | |
Mexico | | | 668 | | | | — | | | | — | | | | 668 | | | | 0.2 | |
Netherlands | | | 21,032 | | | | — | | | | — | | | | 21,032 | | | | 6.4 | |
Norway | | | 6,241 | | | | — | | | | — | | | | 6,241 | | | | 1.9 | |
Russia | | | 1,434 | | | | — | | | | — | | | | 1,434 | | | | 0.4 | |
Singapore | | | 6,321 | | | | — | | | | — | | | | 6,321 | | | | 1.9 | |
South Africa | | | 702 | | | | — | | | | — | | | | 702 | | | | 0.2 | |
South Korea | | | 4,132 | | | | — | | | | — | | | | 4,132 | | | | 1.3 | |
Spain | | | 5,787 | | | | — | | | | — | | | | 5,787 | | | | 1.8 | |
Sweden | | | 1,574 | | | | — | | | | — | | | | 1,574 | | | | 0.5 | |
Switzerland | | | 30,325 | | | | — | | | | — | | | | 30,325 | | | | 9.2 | |
Taiwan | | | 6,012 | | | | — | | | | — | | | | 6,012 | | | | 1.8 | |
Thailand | | | 1,044 | | | | — | | | | — | | | | 1,044 | | | | 0.3 | |
United Kingdom | | | 68,121 | | | | — | | | | — | | | | 68,121 | | | | 20.7 | |
United States | | | 8,179 | | | | — | | | | — | | | | 8,179 | | | | 2.5 | |
Virgin Islands, British | | | 661 | | | | — | | | | — | | | | 661 | | | | 0.2 | |
Preferred Stocks | | | 972 | | | | — | | | | — | | | | 972 | | | | 0.3 | |
Short-Term Investments | | | — | | | | 23,155 | | | | — | | | | 23,155 | | | | 7.0 | |
Other Securities | | | — | | | | 24,712 | | | | — | | | | 24,712 | | | | 7.5 | |
| | | | | | | | | | | | | | | | | | | | |
Total Investments | | | 304,579 | | | | 47,867 | | | | — | | | | 352,446 | | | | 106.9 | |
| | | | | | | | | | | | | | | | | | | | |
Other Assets and Liabilities, Net | | | | | | | | | | | | | | | | | | | (6.9 | ) |
| | | | | | | | | | | | | | | | | | | | |
| | | | | | | | | | | | | | | | | | | 100.0 | |
| | | | | | | | | | | | | | | | | | | | |
Other Financial Instruments | | | | | | | | | | | | | | | | | | | | |
Futures Contracts | | | 93 | | | | — | | | | — | | | | 93 | | | | — | * |
Foreign Currency Exchange Contracts | | | 2 | | | | (396 | ) | | | — | | | | (394 | ) | | | (0.1 | ) |
| | | | | | | | | | | | | | | | | | | | |
Total Other Financial Instruments** | | $ | 95 | | | $ | (396 | ) | | $ | — | | | $ | (301 | ) | | | | |
| | | | | | | | | | | | | | | | | | | | |
| * | | Less than .05% of net assets. |
| ** | | Other financial instruments reflected, such as futures, forwards, interest rate swaps, and credit default swaps are valued at the unrealized appreciation/depreciation on the instruments. |
For a description of the levels see note 2 in the Notes to Financial Statements.
There were no significant transfers in and out of levels 1, 2 and 3 during the period ending December 31, 2011.
See accompanying notes which are an integral part of the financial statements.
Russell Investment Funds
Non-U.S. Fund
Fair Value of Derivative Instruments — December 31, 2011
Amounts in thousands
| | | | | | | | |
| Derivatives not accounted for as hedging instruments | | Equity
Contracts | | | Foreign
Currency
Contracts | |
Location: Statement of Assets and Liabilities - Assets | | | | | | | | |
Unrealized appreciation on foreign currency exchange contracts | | $ | — | | | $ | 57 | |
Daily variation margin on futures contracts* | | | 251 | | | | — | |
| | | | | | | | |
Total | | $ | 251 | | | $ | 57 | |
| | | | | | | | |
Location: Statement of Assets and Liabilities - Liabilities | | | | | | | | |
Unrealized depreciation on foreign currency exchange contracts | | $ | — | | | $ | 451 | |
Daily variation margin on futures contracts* | | | 158 | | | | — | |
| | | | | | | | |
Total | | $ | 158 | | | $ | 451 | |
| | | | | | | | |
| | | | | | | | |
| Derivatives not accounted for as hedging instruments | | Equity
Contracts | | | Foreign
Currency
Contracts | |
Location: Statement of Operations - Net realized gain (loss) | | | | | | | | |
Futures contracts | | $ | (3,234 | ) | | $ | — | |
Foreign currency-related transactions | | | — | | | | 120 | |
| | | | | | | | |
Total | | $ | (3,234 | ) | | $ | 120 | |
| | | | | | | | |
Location: Statement of Operations - Net change in unrealized appreciation (depreciation) | | | | | | | | |
Futures contracts | | $ | 82 | | | $ | — | |
Foreign currency-related transactions | | | — | | | | (634 | ) |
| | | | | | | | |
Total | | $ | 82 | | | $ | (634 | ) |
| | | | | | | | |
| | * | Includes cumulative appreciation/depreciation of futures contracts as reported in Schedule of Investments. Only current day’s variation margin is reported within the Statements of Assets and Liabilities. |
For further disclosure on derivatives see note 2 in Notes to Financial Statements.
See accompanying notes which are an integral part of the financial statements.
Russell Investment Funds
Core Bond Fund
Portfolio Management Discussion and Analysis — December 31, 2011 (Unaudited)
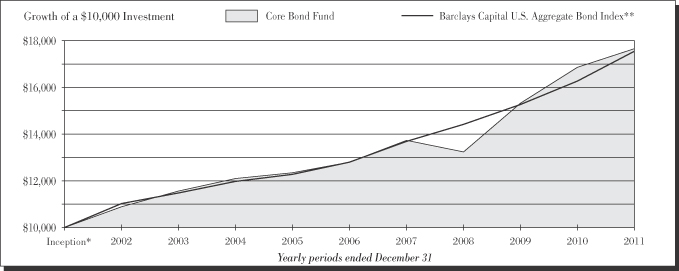
| | | | |
|
| Core Bond Fund | |
| | Total
Return | |
1 Year | | | 4.68 | % |
5 Years | | | 6.64 | %§ |
10 Years | | | 5.84 | %§ |
| | | | |
|
| Barclays Capital U.S. Aggregate Bond Index** | |
| | Total
Return | |
1 Year | | | 7.84 | % |
5 Years | | | 6.50 | %§ |
10 Years | | | 5.78 | %§ |
Russell Investment Funds
Core Bond Fund
Portfolio Management Discussion and Analysis — December 31, 2011 (Unaudited)
The Core Bond Fund (the “Fund”) allocates most of its assets among multiple money managers. Russell Investment Management Company (“RIMCo”), as the Fund’s advisor, may change the allocation of the Fund’s assets among money managers at any time. An exemptive order from the Securities and Exchange Commission (“SEC”) permits RIMCo to engage or terminate a money manager at any time, subject to approval by the Fund’s Board, without a shareholder vote. Pursuant to the terms of the exemptive order, the Fund is required to notify its shareholders within 60 days of when a money manager begins providing services. The Fund currently has three money managers.
What is the Fund’s investment objective?
The Fund seeks to provide current income, and as a secondary objective, capital appreciation.
How did the Fund perform relative to its benchmark for the fiscal year ended December 31, 2011?
For the fiscal year ended December 31, 2011, the Core Bond Fund gained 4.68%. This is compared to the Fund’s benchmark, the Barclays Capital U.S. Aggregate Bond Index (the “Index”), which gained 7.84% during the same period. The Fund’s performance includes operating expenses, whereas index returns are unmanaged and do not include expenses of any kind.
For the fiscal year ended December 31, 2011, the Lipper® BBB Rated Corp Debt Funds (VIP) Average, a group of funds that Lipper considers to have investment strategies similar to those of the Fund, gained 6.85%. This result serves as a peer comparison and is expressed net of operating expenses.
RIMCo may assign a money manager a specific style or capitalization benchmark other than the Fund’s index. However, the Fund’s primary index remains the benchmark for the Fund and is representative of the aggregate of each money manager’s benchmark index.
How did the market conditions described in the Market Summary report affect the Fund’s performance?
The Fund’s performance for the fiscal year reflected the up and down market environment that was dominated by the third quarter market sell-off. The Fund was well-positioned for the market rally that continued from 2010 into the first quarter of 2011. Overweight positions in corporate bonds and non-agency mortgages were positive for Fund performance in the first quarter. However, when market sentiment began to turn in May, so did the Fund’s performance. As the market became saturated by the Federal Reserve’s selling of Maiden Lane II assets, non-agency mortgage prices began to fall rapidly and additional sales occurred at distressed prices. In the third quarter, the market sell off became more broad-based, leading most of the Fund’s active credit positions to generate substantial underperformance. Investment grade and high yield corporate bonds, non-agency mortgages, emerging market debt and non-dollar positions all underperformed during this period, to
such an extent that the Fund’s third quarter relative underperformance dominated 2011 results. The Fund was particularly overweight in the financial sector with corporate bonds, but fears of financial contagion stemming from Europe led that segment of the market to substantially underperform, along with other industries within the corporate bond sector. As the market rallied in the fourth quarter, the Fund’s financials exposure continued to lag behind other credit-sensitive assets. The fourth quarter rally was particularly positive for more liquid credit sectors such as large-cap high yield debt, emerging market debt and non-dollar positions, which all benefited the Fund. However, the Fund’s exposure to less liquid segments of the market, like non-agency mortgages, which did not experience the same fourth quarter rally, prevented the Fund from recouping any of its third quarter losses relative to the Index.
With respect to interest rates exposure, the Fund came into the year short duration (i.e., underweight to interest rate risk), which was a positive in the first few month of the year, but similar to the Fund’s credit exposures, ultimately led to underperformance during the latter half of the year. The Fund’s underweight to duration remained substantial going into August when Treasuries and interest rates rallied in spite of an unsatisfactory resolution to the U.S. budget negotiations that led to an S&P downgrade of U.S. government debt. This dynamic was also negative for the Fund from a yield curve perspective, as the Fund was most underweight interest rates in the long end of the curve, which happened to rally the most in the third quarter. This underweight to the long end of the curve was reduced in the fourth quarter, which was beneficial to Fund performance since the long end continued to perform well.
How did the investment strategies and techniques employed by the Fund and its money managers affect its benchmark relative performance?
The Fund’s money managers tend to invest the Fund’s assets in non-Treasury sectors and types of securities that are not found within the Index (e.g., high yield credit, mortgage-backed securities and emerging market debt). As a result of having a more aggressive asset allocation relative to the Index, all three managers underperformed, with the third quarter risk off market environment dominating market returns. The underweight to interest rate risk, particularly on the long end of the yield curve, accounted for nearly half of the Fund’s underperformance, while exposures to non-agency mortgages and investment grade financials accounted for most of the remainder. The Fund did receive some positive performance from its holdings in commercial mortgage-backed securities.
Goldman Sachs Asset Management, L.P. underperformed the Fund’s Index to a lesser degree than the other managers in large part because it was less aggressive in expressing similar active views. It added value through security selection in agency mortgage-backed securities and successfully timed its rotation into and out of high yield corporate debt.
Russell Investment Funds
Core Bond Fund
Portfolio Management Discussion and Analysis — December 31, 2011 (Unaudited)
Metropolitan West Asset Management, LLC (“MetWest”) was consistently underweight to duration and overweight financials and non-agencies. Non-agency mortgage exposure was the most significant detractor from performance.
Pacific Investment Management Company LLC (“PIMCo”) struggled the most among managers in the Fund, as it was overweight financials and non-agency mortgages, and underweight to duration in generally larger magnitudes than the Fund’s other managers. PIMCo was particularly underweight the long end of the yield curve and also held a number of non-dollar positions that underperformed.
Describe any changes to the Fund’s structure or the money manager line-up.
There were no changes to the Fund’s structure or money manager line-up during the fiscal year.
| | |
| |
Money Managers as of
December 31, 2011 | | Styles |
| Goldman Sachs Asset Management, L.P. | | Fully Discretionary |
| Metropolitan West Asset Management LLC | | Sector Rotation |
| Pacific Investment Management Company LLC | | Fully Discretionary |
The views expressed in this report reflect those of the portfolio managers only through the end of the period covered by the report. These views do not necessarily represent the views of RIMCo, or any other person in RIMCo or any other affiliated organization. These views are subject to change at any time based upon market conditions or other events, and RIMCo disclaims any responsibility to update the views contained herein. These views should not be relied on as investment advice and, because investment decisions for Russell Investment Funds (“RIF”) are based on numerous factors, should not be relied on as an indication of investment decisions of any RIF Fund.
| * | | Assumes initial investment on January 1, 2001. |
| ** | | The Barclays Capital U.S. Aggregate Bond Index is an index, with income reinvested, generally representative of intermediate-term government bonds, investment-grade corporate debt securities and mortgage-backed securities. |
The performance shown in this section does not reflect any Insurance Company Separate Account or Policy Charges. Performance is historical and assumes reinvestment of all dividends and capital gains. Investment return and principal value will fluctuate so that an investor’s shares, when redeemed, may be worth more or less than when purchased. Past performance is not indicative of future results.
Russell Investment Funds
Core Bond Fund
Shareholder Expense Example — December 31, 2011 (Unaudited)
Fund Expenses
The following disclosure provides important information regarding each Fund’s Expense Example, which appears on each Fund’s individual page in this Annual Report. Please refer to this information when reviewing the Expense Example for a Fund.
Example
As a shareholder of the Fund, you incur two types of costs: (1) transaction costs, and (2) ongoing costs, including advisory fees and other Fund expenses. The Example is intended to help you understand your ongoing costs (in dollars) of investing in the Fund and to compare these costs with the ongoing costs of investing in other mutual funds. The Example is based on an investment of $1,000 invested at the beginning of the period and held for the entire period indicated, which for this Fund is from July 1, 2011 to December 31, 2011.
Actual Expenses
The information in the table under the heading “Actual Performance” provides information about actual account values and actual expenses. You may use the information in this column, together with the amount you invested, to estimate the expenses that you paid over the period. Simply divide your account value by $1,000 (for example, an $8,600 account value divided by $1,000 = 8.6), then multiply the result by the number in the first column in the row entitled “Expenses Paid During Period” to estimate the expenses you paid on your account during this period.
Hypothetical Example for Comparison Purposes
The information in the table under the heading “Hypothetical Performance (5% return before expenses)” provides information about hypothetical account values and hypothetical expenses based on the Fund’s actual expense ratio and an assumed rate of return of 5% per year before expenses, which is not the Fund’s actual return. The hypothetical account values and expenses may not be used to estimate the actual ending account balance or expenses you paid for the period. You may use this information to compare the ongoing costs of investing in the Fund and other funds. To do so, compare this 5% hypothetical example with the 5% hypothetical examples that appear in the shareholder reports of other funds.
Please note that the expenses shown in the table are meant to highlight your ongoing costs only and do not reflect any transactional costs. Therefore, the information under the heading “Hypothetical Performance (5% return before expenses)” is useful in comparing ongoing costs only, and will not help you determine the relative total costs of owning different funds. In addition, if these transactional costs were included, your costs would have been higher. The fee and expenses shown in this section do not reflect any Insurance Company Separate Account or Policy Charges.
| | | | | | | | |
| | Actual
Performance | | | Hypothetical
Performance
(5% return
before expenses) | |
| | | | | | | | |
Beginning Account Value July 1, 2011 | | $ | 1,000.00 | | | $ | 1,000.00 | |
Ending Account Value December 31, 2011 | | $ | 1,019.30 | | | $ | 1,022.08 | |
Expenses Paid During Period* | | $ | 3.16 | | | $ | 3.16 | |
| * | Expenses are equal to the Fund’s annualized expense ratio of 0.62% (representing the six month period annualized), multiplied by the average account value over the period, multiplied by 184/365 (to reflect the one-half year period). May reflect amounts waived, reimbursed and/or other credits. Without any waivers, reimbursements and/or other credits, expenses would have been higher. |
Russell Investment Funds
Core Bond Fund
Schedule of Investments — December 31, 2011
Amounts in thousands (except share amounts)
| | | | | | | | |
| | | Principal
Amount ($)
or Shares | | | Market
Value
$ | |
| | | | | | | | |
| Long-Term Investments - 89.7% | |
| Asset-Backed Securities - 5.3% | | | | | | | | |
Access Group, Inc.
Series 2008-1 Class A
1.718% due 10/27/25 (Ê) | | | 654 | | | | 655 | |
ACE Securities Corp.
Series 2005-SD3 Class A
0.657% due 08/25/45 (Ê) | | | 60 | | | | 57 | |
Ameriquest Mortgage Securities, Inc.
Series 2004-R10 Class A5
0.647% due 11/25/34 (Ê) | | | — | | | | — | |
Series 2005-R11 Class A2C 0.487% due 01/25/36 (Ê) | | | 766 | | | | 749 | |
Asset Backed Securities Corp. Home
Equity
Series 2005-HE5 Class M3
0.737% due 06/25/35 (Ê) | | | 1,050 | | | | 647 | |
Series 2006-HE5 Class A5 0.497% due 07/25/36 (Ê) | | | 1,200 | | | | 377 | |
Bayview Financial Acquisition Trust
Series 2006-A Class 1A3
5.865% due 02/28/41 | | | 190 | | | | 142 | |
Brazos Higher Education Authority
Series 2005-3 Class A14
0.468% due 09/25/23 (Ê) | | | 287 | | | | 281 | |
Series 2010-1 Class A1 1.406% due 05/25/29 (Ê) | | | 262 | | | | 260 | |
Series 2010-1 Class A2 1.706% due 02/25/35 (Ê) | | | 500 | | | | 469 | |
Series 2011-1 Class A2 1.306% due 02/25/30 (Ê) | | | 700 | | | | 681 | |
Series 2011-2 Class A2 1.268% due 07/25/29 (Ê) | | | 800 | | | | 778 | |
Carrington Mortgage Loan Trust
Series 2006-NC1 Class A4
0.567% due 01/25/36 (Ê) | | | 1,900 | | | | 589 | |
Centex Home Equity
Series 2006-A Class AV4
0.507% due 06/25/36 (Ê) | | | 700 | | | | 368 | |
CIT Education Loan Trust
Series 2007-1 Class A
0.448% due 03/25/42 (Ê)(Þ) | | | 526 | | | | 477 | |
CIT Mortgage Loan Trust
Series 2007-1 Class 2A1
1.257% due 10/25/37 (Å)(Ê) | | | 38 | | | | 37 | |
Series 2007-1 Class 2A2 1.507% due 10/25/37 (Å)(Ê) | | | 130 | | | | 97 | |
Series 2007-1 Class 2A3 1.707% due 10/25/37 (Å)(Ê) | | | 180 | | | | 72 | |
Citigroup Mortgage Loan Trust, Inc.
Series 2007-WFH1 Class A3
0.407% due 01/25/37 (Ê) | | | 1,045 | | | | 742 | |
Series 2007-WFH1 Class A4 0.457% due 01/25/37 (Ê) | | | 934 | | | | 392 | |
Series 2007-WFH4 Class A2B 1.307% due 07/25/37 (Ê) | | | 1,290 | | | | 651 | |
| | | | | | | | |
| | | Principal
Amount ($)
or Shares | | | Market
Value
$ | |
Conseco Financial Corp.
Series 1996-10 Class M1
7.240% due 11/15/28 | | | 700 | | | | 760 | |
Series 1999-2 Class A5 6.680% due 12/01/30 | | | 604 | | | | 608 | |
Countrywide Home Equity Loan Trust
Series 2006-HW Class 2A1B
0.393% due 11/15/36 (Ê) | | | 286 | | | | 204 | |
Educational Funding of the South, Inc.
Series 2011-1 Class A2
1.068% due 04/25/35 (Ê) | | | 210 | | | | 193 | |
EFS Volunteer LLC
Series 2010-1 Class A2
1.268% due 10/25/35 (Ê)(Þ) | | | 500 | | | | 472 | |
First Franklin Mortgage Loan Asset
Backed Certificates
Series 2007-FF1 Class A2B
0.347% due 01/25/38 (Ê) | | | 641 | | | | 310 | |
GCO Education Loan Funding Trust
Series 2006-1 Class A10L
0.696% due 02/27/28 (Ê) | | | 100 | | | | 85 | |
Series 2006-1 Class A11L 0.736% due 05/25/36 (Ê) | | | 100 | | | | 83 | |
GMAC Mortgage Corp. Loan Trust
Series 2007-HE3 Class 1A1
7.000% due 09/25/37 | | | 40 | | | | 29 | |
Series 2007-HE3 Class 2A1 7.000% due 09/25/37 | | | 53 | | | | 37 | |
Goal Capital Funding Trust
Series 2010-1 Class A
1.206% due 08/25/48 (Ê)(Þ) | | | 86 | | | | 82 | |
GSAA Trust
Series 2006-2 Class 2A3
0.527% due 12/25/35 (Ê) | | | 320 | | | | 281 | |
HASC 2007 OPT1 2A2
0.404% due 12/25/36 | | | 1,650 | | | | 909 | |
HSBC Home Equity Loan Trust
Series 2005-1 Class A
0.545% due 01/20/34 (Ê) | | | 148 | | | | 134 | |
Series 2006-4 Class A3V 0.405% due 03/20/36 (Ê) | | | 720 | | | | 693 | |
Series 2007-1 Class AS 0.455% due 03/20/36 (Ê) | | | 490 | | | | 409 | |
Series 2007-2 Class M2 0.625% due 07/20/36 (Ê) | | | 1,300 | | | | 564 | |
Series 2007-3 Class APT 1.455% due 11/20/36 (Ê) | | | 214 | | | | 189 | |
Indymac Residential Asset Backed
Trust
Series 2006-H2 Class A
0.407% due 06/28/36 (Ê) | | | 208 | | | | 91 | |
IXIS Real Estate Capital Trust
Series 2005-HE1 Class M2
0.992% due 06/25/35 (Ê) | | | 218 | | | | 203 | |
JPMorgan Mortgage Acquisition Corp.
Series 2006-HE1 Class A4
0.547% due 01/25/36 (Ê) | | | 2,350 | | | | 791 | |
Russell Investment Funds
Core Bond Fund
Schedule of Investments, continued — December 31, 2011
Amounts in thousands (except share amounts)
| | | | | | | | |
| | | Principal
Amount ($)
or Shares | | | Market
Value
$ | |
| | | | | | | | |
Knowledge Works Foundation
Series 2010-1 Class A
1.456% due 02/25/42 (Ê) | | | 271 | | | | 262 | |
Lehman XS Trust | | | | | | | | |
Series 2006-9 Class A1B 0.417% due 05/25/46 (Ê) | | | 210 | | | | 111 | |
Series 2006-13 Class 1A2 0.427% due 09/25/36 (Ê) | | | 201 | | | | 109 | |
Series 2006-19 Class A2 0.427% due 12/25/36 (Ê) | | | 222 | | | | 117 | |
Long Beach Mortgage Loan Trust
Series 2004-4 Class 1A1
0.817% due 10/25/34 (Ê) | | | 5 | | | | 3 | |
Series 2004-4 Class M1 1.157% due 10/25/34 (Ê) | | | 1,000 | | | | 702 | |
Mastr Asset Backed Securities Trust
Series 2005-WMC1 Class M1
0.677% due 03/25/35 (Ê) | | | 12 | | | | 12 | |
Merrill Lynch First Franklin Mortgage
Loan Trust
Series 2007-1 Class A2B
0.427% due 04/25/37 (Ê) | | | 154 | | | | 63 | |
Series 2007-4 Class 2A2 0.377% due 07/25/37 (Ê) | | | 1,160 | | | | 686 | |
Missouri Higher Education Loan
Authority
Series 2010-1 Class A1
1.456% due 11/26/32 (Ê) | | | 779 | | | | 780 | |
Morgan Stanley ABS Capital I
Series 2006-HE1 Class A4
0.547% due 01/25/36 (Ê) | | | 1,950 | | | | 783 | |
Series 2007-HE2 Class A2B 0.347% due 01/25/37 (Ê) | | | 1,043 | | | | 324 | |
Series 2007-HE5 Class A2C 0.507% due 03/25/37 (Ê) | | | 800 | | | | 225 | |
Northstar Education Finance, Inc.
Series 2004-1 Class A4
0.615% due 04/29/19 (Ê) | | | 1,000 | | | | 994 | |
Series 2007-1 Class A1 0.525% due 04/28/30 (Ê) | | | 475 | | | | 434 | |
Series 2007-1 Class A3 0.485% due 01/29/46 (Ê) | | | 500 | | | | 448 | |
Popular ABS Mortgage Pass-Through
Trust
Series 2005-6 Class A3
5.680% due 01/25/36 | | | 109 | | | | 94 | |
Series 2006-C Class A4 0.507% due 07/25/36 (Ê) | | | 1,480 | | | | 717 | |
Series 2006-D Class A3 0.517% due 11/25/46 (Ê) | | | 1,500 | | | | 711 | |
Renaissance Home Equity Loan Trust
Series 2005-2 Class AF4
4.934% due 08/25/35 | | | 85 | | | | 65 | |
Series 2006-1 Class AF6 5.746% due 05/25/36 | | | 166 | | | | 75 | |
| | | | | | | | |
| | | Principal
Amount ($)
or Shares | | | Market
Value
$ | |
Residential Asset Mortgage Products, Inc.
Series 2003-RS9 Class AI6A
6.110% due 10/25/33 | | | 381 | | | | 366 | |
Series 2003-RS11 Class AI6A 5.980% due 12/25/33 | | | 116 | | | | 107 | |
Residential Asset Securities Corp.
Series 2003-KS4 Class AIIB
0.837% due 06/25/33 (Ê) | | | 30 | | | | 17 | |
SG Mortgage Securities Trust
Series 2006-OPT2 Class A3C
0.407% due 10/25/36 (Ê) | | | 1,500 | | | | 381 | |
SLM Student Loan Trust
Series 2006-5 Class A6B
0.538% due 10/25/40 (Ê) | | | 490 | | | | 439 | |
Series 2008-2 Class A1 0.718% due 01/25/15 (Ê) | | | 10 | | | | 10 | |
Series 2008-7 Class A2 0.918% due 10/25/17 (Ê) | | | 2,800 | | | | 2,792 | |
Small Business Administration
Participation Certificates
Series 2005-20G Class 1
4.750% due 07/01/25 | | | 548 | | | | 600 | |
Soundview Home Equity Loan Trust
Series 2005-OPT3 Class A4
0.557% due 11/25/35 (Ê) | | | 471 | | | | 432 | |
Structured Asset Securities Corp.
Series 2006-BC6 Class A2
0.337% due 01/25/37 (Ê) | | | 387 | | | | 381 | |
Washington Mutual Asset-Backed
Certificates
Series 2006-HE2 Class A3
0.407% due 05/25/36 (Ê) | | | 587 | | | | 262 | |
| | | | | | | | |
| | | | | | | 29,150 | |
| | | | | | | | |
| |
| Corporate Bonds and Notes - 17.1% | | | | | |
ACCO Brands Corp.
10.625% due 03/15/15 | | | 225 | | | | 250 | |
Allstate Life Global Funding Trusts
5.375% due 04/30/13 | | | 200 | | | | 211 | |
Ally Financial, Inc.
7.500% due 12/31/13 | | | 1,900 | | | | 1,951 | |
7.500% due 09/15/20 | | | 100 | | | | 101 | |
Altria Group, Inc.
9.700% due 11/10/18 | | | 150 | | | | 202 | |
American Airlines 2011-2 Class A Pass
Through Trust
Series A
8.625% due 10/15/21 | | | 625 | | | | 638 | |
American Express Bank FSB
Series BKNT
5.500% due 04/16/13 | | | 300 | | | | 314 | |
6.000% due 09/13/17 (Ñ) | | | 400 | | | | 453 | |
American Express Centurion Bank
Series BKN1
6.000% due 09/13/17 | | | 400 | | | | 452 | |
Russell Investment Funds
Core Bond Fund
Schedule of Investments, continued — December 31, 2011
Amounts in thousands (except share amounts)
| | | | | | | | |
| | | Principal
Amount ($)
or Shares | | | Market
Value
$ | |
| | | | | | | | |
American Express Co.
7.000% due 03/19/18 (Ñ) | | | 200 | | | | 242 | |
American International Group, Inc.
5.600% due 10/18/16 (Ñ) | | | 700 | | | | 675 | |
5.450% due 05/18/17 | | | 1,000 | | | | 956 | |
5.850% due 01/16/18 | | | 900 | | | | 880 | |
Amgen, Inc.
3.875% due 11/15/21 | | | 400 | | | | 404 | |
6.900% due 06/01/38 | | | 1,000 | | | | 1,231 | |
Anadarko Petroleum Corp. | | | | | | | | |
6.375% due 09/15/17 | | | 325 | | | | 377 | |
8.700% due 03/15/19 | | | 150 | | | | 192 | |
Anheuser-Busch InBev Worldwide, Inc. | | | | | | | | |
4.125% due 01/15/15 | | | 225 | | | | 243 | |
Arch Coal, Inc. | | | | | | | | |
8.750% due 08/01/16 | | | 70 | | | | 76 | |
7.000% due 06/15/19 (Þ) | | | 350 | | | | 357 | |
Arizona Public Service Co. | | | | | | | | |
5.800% due 06/30/14 (Ñ) | | | 100 | | | | 111 | |
6.250% due 08/01/16 | | | 75 | | | | 88 | |
Ashtead Capital, Inc. | | | | | | | | |
9.000% due 08/15/16 (Þ) | | | 100 | | | | 104 | |
AT&T, Inc. | | | | | | | | |
4.950% due 01/15/13 | | | 200 | | | | 208 | |
2.950% due 05/15/16 | | | 350 | | | | 365 | |
5.500% due 02/01/18 | | | 200 | | | | 232 | |
3.875% due 08/15/21 | | | 150 | | | | 159 | |
6.300% due 01/15/38 | | | 900 | | | | 1,104 | |
6.400% due 05/15/38 | | | 175 | | | | 216 | |
Bank of America Corp. | | | | | | | | |
7.375% due 05/15/14 | | | 1,310 | | | | 1,357 | |
3.625% due 03/17/16 | | | 125 | | | | 115 | |
5.625% due 10/14/16 | | | 450 | | | | 432 | |
6.000% due 09/01/17 | | | 335 | | | | 327 | |
5.750% due 12/01/17 | | | 140 | | | | 132 | |
Bank of America NA | | | | | | | | |
Series BKNT | | | | | | | | |
0.627% due 06/15/16 (Ê) | | | 600 | | | | 485 | |
6.100% due 06/15/17 (Ñ) | | | 775 | | | | 729 | |
BB&T Corp. | | | | | | | | |
3.200% due 03/15/16 | | | 325 | | | | 339 | |
Bear Stearns Cos. LLC (The) | | | | | | | | |
7.250% due 02/01/18 | | | 445 | | | | 522 | |
Berkshire Hathaway, Inc. | | | | | | | | |
3.750% due 08/15/21 (Ñ) | | | 250 | | | | 260 | |
Boardwalk Pipelines, LP | | | | | | | | |
5.875% due 11/15/16 | | | 225 | | | | 253 | |
Brandywine Operating Partnership, LP | | | | | | | | |
4.950% due 04/15/18 | | | 275 | | | | 271 | |
Burlington Northern Santa Fe LLC | | | | | | | | |
6.875% due 12/01/27 | | | 25 | | | | 32 | |
6.750% due 03/15/29 | | | 10 | | | | 13 | |
Calpine Construction Finance Co., LP
and CCFC Finance Corp. | | | | | | | | |
8.000% due 06/01/16 (Þ) | | | 800 | | | | 864 | |
Capital One Capital III | | | | | | | | |
7.686% due 08/15/36 | | | 225 | | | | 224 | |
| | | | | | | | |
| | | Principal
Amount ($)
or Shares | | | Market
Value
$ | |
Case New Holland, Inc. | | | | | | | | |
7.750% due 09/01/13 | | | 125 | | | | 133 | |
Cellco Partnership / Verizon Wireless
Capital LLC | | | | | | | | |
8.500% due 11/15/18 | | | 175 | | | | 236 | |
CenterPoint Energy Resources Corp. | | | | | | | | |
6.125% due 11/01/17 | | | 50 | | | | 57 | |
Charter Communications Operating
LLC / Charter Communications
Operating Capital | | | | | | | | |
10.875% due 09/15/14 (Ø)(Þ) | | | 125 | | | | 134 | |
Chase Capital III | | | | | | | | |
Series C | | | | | | | | |
1.077% due 03/01/27 (Ê) | | | 295 | | | | 203 | |
CHS/Community Health Systems, Inc. | | | | | | | | |
8.875% due 07/15/15 (Ñ) | | | 471 | | | | 486 | |
Chubb Corp. (The) | | | | | | | | |
6.375% due 03/29/67 | | | 175 | | | | 173 | |
Cigna Corp. | | | | | | | | |
2.750% due 11/15/16 | | | 175 | | | | 175 | |
Cimarex Energy Co. | | | | | | | | |
7.125% due 05/01/17 | | | 50 | | | | 52 | |
CIT Group, Inc. | | | | | | | | |
7.000% due 05/01/15 | | | 285 | | | | 285 | |
7.000% due 05/04/15 (Þ) | | | 125 | | | | 125 | |
7.000% due 05/01/17 | | | 198 | | | | 198 | |
7.000% due 05/02/17 (Ñ)(Þ) | | | 400 | | | | 400 | |
6.625% due 04/01/18 (Ñ)(Þ) | | | 390 | | | | 404 | |
Series | | | | | | | | |
7.000% due 05/01/16 | | | 141 | | | | 141 | |
Citigroup Capital XXI | | | | | | | | |
8.300% due 12/21/57 | | | 830 | | | | 829 | |
Citigroup, Inc. | | | | | | | | |
5.500% due 04/11/13 | | | 700 | | | | 715 | |
5.850% due 07/02/13 | | | 100 | | | | 103 | |
2.453% due 08/13/13 (Ê) | | | 100 | | | | 98 | |
5.000% due 09/15/14 | | | 400 | | | | 396 | |
4.750% due 05/19/15 | | | 175 | | | | 177 | |
4.700% due 05/29/15 | | | 50 | | | | 51 | |
5.850% due 08/02/16 | | | 220 | | | | 231 | |
6.000% due 08/15/17 | | | 850 | | | | 891 | |
6.125% due 11/21/17 | | | 495 | | | | 528 | |
6.125% due 08/25/36 | | | 300 | | | | 260 | |
6.875% due 03/05/38 | | | 450 | | | | 494 | |
8.125% due 07/15/39 | | | 450 | | | | 551 | |
Columbus Southern Power Co. | | | | | | | | |
Series C | | | | | | | | |
5.500% due 03/01/13 | | | 10 | | | | 10 | |
CommScope, Inc. | | | | | | | | |
8.250% due 01/15/19 (Þ) | | | 225 | | | | 225 | |
Continental Airlines 1999-1 Class A
Pass Through Trust | | | | | | | | |
Series 991A | | | | | | | | |
6.545% due 02/02/19 | | | 182 | | | | 189 | |
Continental Airlines 2007-1 Class A
Pass Through Trust | | | | | | | | |
Series 071A | | | | | | | | |
5.983% due 04/19/22 (Ñ) | | | 139 | | | | 145 | |
Russell Investment Funds
Core Bond Fund
Schedule of Investments, continued — December 31, 2011
Amounts in thousands (except share amounts)
| | | | | | | | |
| | | Principal
Amount ($)
or Shares | | | Market
Value
$ | |
| | | | | | | | |
Continental Airlines 2009-1 Pass
Through Trust | | | | | | | | |
Series 09-1 | | | | | | | | |
9.000% due 07/08/16 | | | 228 | | | | 251 | |
Credit Suisse USA, Inc. | | | | | | | | |
5.500% due 08/15/13 (Ñ) | | | 45 | | | | 47 | |
CSC Holdings LLC | | | | | | | | |
8.500% due 04/15/14 | | | 460 | | | | 509 | |
DCP Midstream LLC | | | | | | | | |
9.750% due 03/15/19 (Þ) | | | 100 | | | | 130 | |
DDR Corp. | | | | | | | | |
9.625% due 03/15/16 | | | 85 | | | | 99 | |
7.500% due 04/01/17 | | | 250 | | | | 270 | |
Dell, Inc. | | | | | | | | |
4.700% due 04/15/13 | | | 400 | | | | 419 | |
Delta Air Lines 2002-1 Class G-1 Pass
Through Trust | | | | | | | | |
Series 02G1 | | | | | | | | |
6.718% due 01/02/23 | | | 127 | | | | 126 | |
Delta Air Lines, Inc. | | | | | | | | |
9.500% due 09/15/14 (Ñ)(Þ) | | | 207 | | | | 213 | |
DIRECTV Holdings LLC / DIRECTV
Financing Co., Inc. | | | | | | | | |
3.500% due 03/01/16 | | | 350 | | | | 361 | |
6.000% due 08/15/40 | | | 100 | | | | 109 | |
Discover Bank | | | | | | | | |
Series BKNT | | | | | | | | |
8.700% due 11/18/19 (Ñ) | | | 250 | | | | 285 | |
DJO Finance LLC / DJO Finance Corp. | | | | | | | | |
10.875% due 11/15/14 | | | 135 | | | | 126 | |
Dolphin Subsidiary II, Inc. | | | | | | | | |
7.250% due 10/15/21 (Þ) | | | 650 | | | | 702 | |
Dow Chemical Co. (The) | | | | | | | | |
7.600% due 05/15/14 | | | 424 | | | | 479 | |
Duke Realty, LP | | | | | | | | |
6.750% due 03/15/20 | | | 200 | | | | 219 | |
Dynegy Roseton / Danskammer Pass
Through Trust Series B | | | | | | | | |
Series B | | | | | | | | |
7.670% due 11/08/16 | | | 700 | | | | 427 | |
Ecolab, Inc. | | | | | | | | |
3.000% due 12/08/16 (Ñ) | | | 350 | | | | 362 | |
4.350% due 12/08/21 | | | 325 | | | | 347 | |
Edison Mission Energy | | | | | | | | |
7.000% due 05/15/17 | | | 675 | | | | 439 | |
El Paso Corp. | | | | | | | | |
Series GMTN | | | | | | | | |
8.050% due 10/15/30 | | | 200 | | | | 233 | |
El Paso Natural Gas Co. | | | | | | | | |
7.500% due 11/15/26 | | | 100 | | | | 123 | |
El Paso Pipeline Partners Operating Co. LLC | | | | | | | | |
6.500% due 04/01/20 | | | 300 | | | | 331 | |
5.000% due 10/01/21 | | | 650 | | | | 669 | |
Energy Transfer Partners, LP | | | | | | | | |
5.950% due 02/01/15 | | | 300 | | | | 324 | |
Enterprise Products Operating LLC | | | | | | | | |
6.650% due 04/15/18 | | | 125 | | | | 148 | |
| | | | | | | | |
| | | Principal
Amount ($)
or Shares | | | Market
Value
$ | |
Series A | | | | | | | | |
8.375% due 08/01/66 | | | 100 | | | | 107 | |
ERP Operating LP | | | | | | | | |
4.625% due 12/15/21 | | | 300 | | | | 306 | |
Farmers Exchange Capital | | | | | | | | |
7.050% due 07/15/28 (Þ) | | | 500 | | | | 529 | |
7.200% due 07/15/48 (Þ) | | | 300 | | | | 311 | |
Fifth Third Bancorp | | | | | | | | |
3.625% due 01/25/16 | | | 125 | | | | 127 | |
8.250% due 03/01/38 | | | 1,100 | | | | 1,345 | |
Fifth Third Bank | | | | | | | | |
Series BKNT | | | | | | | | |
0.576% due 05/17/13 (Ê) | | | 250 | | | | 245 | |
First Niagara Financial Group, Inc. | | | | | | | | |
6.750% due 03/19/20 | | | 125 | | | | 132 | |
FPL Energy Wind Funding LLC | | | | | | | | |
6.876% due 06/27/17 (Þ) | | | 184 | | | | 152 | |
Freeport-McMoRan Copper & Gold, Inc. | | | | | | | | |
8.375% due 04/01/17 | | | 300 | | | | 319 | |
Frontier Communications Corp. | | | | | | | | |
6.250% due 01/15/13 (Ñ) | | | 325 | | | | 332 | |
GE Capital Trust I | | | | | | | | |
6.375% due 11/15/67 (Ñ) | | | 198 | | | | 195 | |
General Electric Capital Corp. | | | | | | | | |
1.388% due 05/22/13 (Ê) | | | 75 | | | | 75 | |
5.900% due 05/13/14 (Ñ) | | | 350 | | | | 383 | |
5.625% due 05/01/18 | | | 230 | | | | 258 | |
4.375% due 09/16/20 | | | 300 | | | | 307 | |
5.875% due 01/14/38 | | | 300 | | | | 318 | |
Series EMTN | | | | | | | | |
0.595% due 03/20/14 (Ê) | | | 400 | | | | 392 | |
6.375% due 11/15/67 (Ñ) | | | 1,900 | | | | 1,871 | |
Series GMTN | | | | | | | | |
6.875% due 01/10/39 | | | 350 | | | | 419 | |
Series MTNA | | | | | | | | |
6.750% due 03/15/32 | | | 425 | | | | 498 | |
General Electric Co. | | | | | | | | |
5.250% due 12/06/17 | | | 150 | | | | 172 | |
GenOn REMA LLC | | | | | | | | |
Series B | | | | | | | | |
9.237% due 07/02/17 | | | 343 | | | | 336 | |
Goldman Sachs Group, Inc. (The) | | | | | | | | |
6.000% due 05/01/14 (Ñ) | | | 150 | | | | 156 | |
3.625% due 02/07/16 | | | 285 | | | | 275 | |
6.250% due 09/01/17 | | | 600 | | | | 627 | |
6.150% due 04/01/18 | | | 400 | | | | 413 | |
7.500% due 02/15/19 | | | 550 | | | | 607 | |
6.000% due 06/15/20 | | | 150 | | | | 154 | |
6.750% due 10/01/37 | | | 800 | | | | 744 | |
Series MTNB | | | | | | | | |
0.816% due 07/22/15 (Ê) | | | 100 | | | | 88 | |
Goodyear Tire & Rubber Co. (The) | | | | | | | | |
10.500% due 05/15/16 (Ñ) | | | 195 | | | | 215 | |
HCA, Inc. | | | | | | | | |
8.500% due 04/15/19 | | | 300 | | | | 329 | |
7.875% due 02/15/20 | | | 575 | | | | 621 | |
7.250% due 09/15/20 | | | 250 | | | | 264 | |
Russell Investment Funds
Core Bond Fund
Schedule of Investments, continued — December 31, 2011
Amounts in thousands (except share amounts)
| | | | | | | | |
| | | Principal
Amount ($)
or Shares | | | Market
Value
$ | |
| | | | | | | | |
HCP, Inc. | | | | | | | | |
6.000% due 01/30/17 | | | 175 | | | | 189 | |
6.700% due 01/30/18 | | | 425 | | | | 472 | |
5.375% due 02/01/21 | | | 125 | | | | 131 | |
Series MTNE | | | | | | | | |
6.000% due 06/15/14 | | | 400 | | | | 424 | |
Health Care REIT, Inc. | | | | | | | | |
4.700% due 09/15/17 | | | 400 | | | | 397 | |
4.950% due 01/15/21 | | | 300 | | | | 287 | |
5.250% due 01/15/22 | | | 200 | | | | 196 | |
6.500% due 03/15/41 | | | 200 | | | | 200 | |
Healthcare Realty Trust, Inc. | | | | | | | | |
6.500% due 01/17/17 | | | 950 | | | | 1,020 | |
Hewlett-Packard Co. | | | | | | | | |
0.786% due 05/24/13 (Ê)(Ñ) | | | 700 | | | | 693 | |
3.000% due 09/15/16 | | | 225 | | | | 227 | |
Historic TW, Inc. | | | | | | | | |
8.050% due 01/15/16 | | | 195 | | | | 229 | |
HSBC Bank USA | | | | | | | | |
4.875% due 08/24/20 | | | 250 | | | | 232 | |
Indiantown Cogeneration, LP | | | | | | | | |
Series A-10 | | | | | | | | |
9.770% due 12/15/20 | | | 248 | | | | 257 | |
International Lease Finance Corp. | | | | | | | | |
6.500% due 09/01/14 (Þ) | | | 720 | | | | 736 | |
6.750% due 09/01/16 (Þ) | | | 100 | | | | 103 | |
Ipalco Enterprises, Inc. | | | | | | | | |
5.000% due 05/01/18 | | | 125 | | | | 123 | |
iPCS, Inc. | | | | | | | | |
2.554% due 05/01/13 (Ê) | | | 440 | | | | 408 | |
JPMorgan Chase & Co. | | | | | | | | |
5.375% due 01/15/14 (Ñ) | | | 170 | | | | 181 | |
3.150% due 07/05/16 | | | 600 | | | | 603 | |
6.000% due 01/15/18 | | | 200 | | | | 223 | |
4.250% due 10/15/20 | | | 300 | | | | 302 | |
4.350% due 08/15/21 | | | 375 | | | | 379 | |
JPMorgan Chase Bank NA | | | | | | | | |
Series BKNT | | | | | | | | |
5.875% due 06/13/16 | | | 70 | | | | 76 | |
6.000% due 10/01/17 | | | 945 | | | | 1,016 | |
JPMorgan Chase Capital XIII | | | | | | | | |
Series M | | | | | | | | |
1.319% due 09/30/34 (Ê) | | | 480 | | | | 329 | |
JPMorgan Chase Capital XXI | | | | | | | | |
Series U | | | | | | | | |
1.379% due 02/02/37 (Ê) | | | 335 | | | | 237 | |
JPMorgan Chase Capital XXIII | | | | | | | | |
1.457% due 05/15/47 (Ê) | | | 545 | | | | 373 | |
Kinder Morgan Energy Partners, LP | | | | | | | | |
5.950% due 02/15/18 | | | 700 | | | | 800 | |
Kraft Foods, Inc. | | | | | | | | |
6.125% due 02/01/18 | | | 200 | | | | 234 | |
6.125% due 08/23/18 | | | 125 | | | | 147 | |
6.500% due 02/09/40 | | | 175 | | | | 228 | |
L-3 Communications Corp. | | | | | | | | |
Series B | | | | | | | | |
6.375% due 10/15/15 | | | 100 | | | | 103 | |
| | | | | | | | |
| | | Principal
Amount ($)
or Shares | | | Market
Value
$ | |
Lehman Brothers Holdings, Inc. | | | | | | | | |
5.625% due 01/24/13 (Æ)(Ø) | | | 200 | | | | 53 | |
6.200% due 09/26/14 (Æ)(Ø) | | | 200 | | | | 53 | |
Liberty Property, LP | | | | | | | | |
4.750% due 10/01/20 | | | 275 | | | | 279 | |
Manufacturers & Traders Trust Co. | | | | | | | | |
5.585% due 12/28/20 | | | 84 | | | | 82 | |
MBNA Corp. | | | | | | | | |
6.125% due 03/01/13 | | | 200 | | | | 201 | |
Merrill Lynch & Co., Inc. | | | | | | | | |
5.450% due 02/05/13 | | | 1,000 | | | | 1,007 | |
6.050% due 05/16/16 | | | 300 | | | | 283 | |
6.400% due 08/28/17 | | | 325 | | | | 315 | |
6.875% due 04/25/18 | | | 500 | | | | 493 | |
MetLife, Inc. | | | | | | | | |
4.750% due 02/08/21 | | | 350 | | | | 379 | |
6.400% due 12/15/36 (Ñ) | | | 100 | | | | 95 | |
Metropolitan Life Global Funding I | | | | | | | | |
5.125% due 06/10/14 (Þ) | | | 200 | | | | 215 | |
Mirant Mid Atlantic Pass Through
Trust B | | | | | | | | |
Series B | | | | | | | | |
9.125% due 06/30/17 | | | 362 | | | | 372 | |
Morgan Stanley | | | | | | | | |
0.855% due 10/18/16 (Ê) | | | 435 | | | | 349 | |
5.550% due 04/27/17 | | | 425 | | | | 410 | |
6.250% due 08/28/17 | | | 600 | | | | 587 | |
5.950% due 12/28/17 | | | 125 | | | | 119 | |
6.625% due 04/01/18 | | | 550 | | | | 543 | |
5.625% due 09/23/19 | | | 275 | | | | 255 | |
Series GMTN | | | | | | | | |
2.953% due 05/14/13 (Ê) | | | 200 | | | | 192 | |
5.450% due 01/09/17 | | | 225 | | | | 217 | |
National City Bank | | | | | | | | |
Series BKNT | | | | | | | | |
0.703% due 06/07/17 (Ê) | | | 700 | | | | 642 | |
Nationwide Financial Services, Inc. | | | | | | | | |
5.375% due 03/25/21 (Þ) | | | 375 | | | | 368 | |
NBCUniversal Media LLC | | | | | | | | |
4.375% due 04/01/21 | | | 525 | | | | 554 | |
NCUA Guaranteed Notes | | | | | | | | |
Series A4 | | | | | | | | |
3.000% due 06/12/19 | | | 400 | | | | 426 | |
Nevada Power Co. | | | | | | | | |
Series L | | | | | | | | |
5.875% due 01/15/15 | | | 100 | | | | 112 | |
Newfield Exploration Co. | | | | | | | | |
7.125% due 05/15/18 | | | 150 | | | | 160 | |
5.750% due 01/30/22 (Ñ) | | | 50 | | | | 54 | |
News America, Inc. | | | | | | | | |
8.250% due 10/17/96 | | | 20 | | | | 24 | |
Series WI | | | | | | | | |
6.150% due 02/15/41 | | | 300 | | | | 346 | |
Nextel Communications, Inc. | | | | | | | | |
Series C | | | | | | | | |
5.950% due 03/15/14 (Ñ) | | | 205 | | | | 198 | |
Series E | | | | | | | | |
6.875% due 10/31/13 (Ñ) | | | 260 | | | | 259 | |
Russell Investment Funds
Core Bond Fund
Schedule of Investments, continued — December 31, 2011
Amounts in thousands (except share amounts)
| | | | | | | | |
| | | Principal
Amount ($)
or Shares | | | Market
Value
$ | |
| | | | | | | | |
Nielsen Finance LLC / Nielsen Finance Co. | | | | | | | | |
11.500% due 05/01/16 | | | 312 | | | | 357 | |
Nisource Finance Corp. | | | | | | | | |
6.400% due 03/15/18 | | | 145 | | | | 167 | |
6.125% due 03/01/22 | | | 335 | | | | 386 | |
NRG Energy, Inc. | | | | | | | | |
7.375% due 01/15/17 (Ñ) | | | 100 | | | | 104 | |
7.625% due 01/15/18 | | | 160 | | | | 160 | |
8.500% due 06/15/19 (Ñ) | | | 155 | | | | 157 | |
7.875% due 05/15/21 (Þ) | | | 125 | | | | 122 | |
Oncor Electric Delivery Co. LLC | | | | | | | | |
6.800% due 09/01/18 | | | 550 | | | | 669 | |
Panhandle Eastern Pipeline Co., LP | | | | | | | | |
8.125% due 06/01/19 | | | 450 | | | | 551 | |
Philip Morris International, Inc. | | | | | | | | |
6.375% due 05/16/38 | | | 100 | | | | 130 | |
Plains Exploration & Production Co. | | | | | | | | |
7.625% due 06/01/18 | | | 350 | | | | 371 | |
Plastipak Holdings, Inc. | | | | | | | | |
8.500% due 12/15/15 (Þ) | | | 100 | | | | 102 | |
PNC Bank NA | | | | | | | | |
Series BKNT | | | | | | | | |
6.875% due 04/01/18 | | | 175 | | | | 198 | |
Progress Energy, Inc. | | | | | | | | |
5.625% due 01/15/16 | | | 40 | | | | 46 | |
7.050% due 03/15/19 | | | 200 | | | | 247 | |
ProLogis, LP | | | | | | | | |
1.875% due 11/15/37 | | | 150 | | | | 147 | |
Prudential Financial, Inc. | | | | | | | | |
3.875% due 01/14/15 | | | 375 | | | | 388 | |
4.500% due 11/15/20 (Ñ) | | | 100 | | | | 101 | |
Prudential Holdings LLC | | | | | | | | |
8.695% due 12/18/23 (Þ) | | | 550 | | | | 691 | |
Public Service Co. of New Mexico | | | | | | | | |
7.950% due 05/15/18 | | | 260 | | | | 304 | |
Puget Sound Energy, Inc. | | | | | | | | |
Series A | | | | | | | | |
6.974% due 06/01/67 (Ñ) | | | 125 | | | | 125 | |
PulteGroup, Inc. | | | | | | | | |
5.250% due 01/15/14 | | | 1,000 | | | | 980 | |
Qwest Communications International, Inc. | | | | | | | | |
8.000% due 10/01/15 | | | 365 | | | | 389 | |
Qwest Corp. | | | | | | | | |
7.625% due 06/15/15 | | | 100 | | | | 111 | |
8.375% due 05/01/16 | | | 175 | | | | 200 | |
Range Resources Corp. | | | | | | | | |
7.500% due 10/01/17 | | | 50 | | | | 53 | |
7.250% due 05/01/18 | | | 100 | | | | 107 | |
Reinsurance Group of America, Inc. | | | | | | | | |
6.750% due 12/15/65 | | | 275 | | | | 238 | |
Rensselaer Polytechnic Institute | | | | | | | | |
5.600% due 09/01/20 | | | 325 | | | | 366 | |
Rock-Tenn Co. | | | | | | | | |
5.625% due 03/15/13 | | | 25 | | | | 26 | |
RSC Equipment Rental, Inc./RSC
Holdings III LLC | | | | | | | | |
10.000% due 07/15/17 (Þ) | | | 325 | | | | 379 | |
| | | | | | | | |
| | | Principal
Amount ($)
or Shares | | | Market
Value
$ | |
Sabine Pass LNG, LP | | | | | | | | |
7.250% due 11/30/13 | | | 780 | | | | 788 | |
7.500% due 11/30/16 (Ñ) | | | 65 | | | | 65 | |
7.500% due 11/30/16 (Þ) | | | 380 | | | | 367 | |
Santander Holdings USA, Inc. | | | | | | | | |
4.625% due 04/19/16 | | | 130 | | | | 125 | |
Simon Property Group, LP | | | | | | | | |
6.100% due 05/01/16 | | | 130 | | | | 148 | |
5.650% due 02/01/20 | | | 275 | | | | 315 | |
SLM Corp. | | | | | | | | |
6.250% due 01/25/16 | | | 2,050 | | | | 1,992 | |
Southern Union Co. | | | | | | | | |
3.447% due 11/01/66 (Ê) | | | 1,005 | | | | 937 | |
Springleaf Finance Corp. | | | | | | | | |
6.900% due 12/15/17 | | | 300 | | | | 216 | |
State Street Capital Trust III | | | | | | | | |
5.337% due 01/29/49 (Ê)(ƒ)(Ñ) | | | 200 | | | | 197 | |
Steel Dynamics, Inc. | | | | | | | | |
7.750% due 04/15/16 | | | 275 | | | | 287 | |
SunTrust Banks, Inc. | | | | | | | | |
3.600% due 04/15/16 | | | 200 | | | | 204 | |
Tenet Healthcare Corp. | | | | | | | | |
10.000% due 05/01/18 | | | 400 | | | | 457 | |
Tennessee Gas Pipeline Co. | | | | | | | | |
8.000% due 02/01/16 | | | 200 | | | | 236 | |
7.500% due 04/01/17 | | | 75 | | | | 89 | |
8.375% due 06/15/32 | | | 100 | | | | 127 | |
Time Warner, Inc. | | | | | | | | |
5.875% due 11/15/16 | | | 400 | | | | 462 | |
Transatlantic Holdings, Inc. | | | | | | | | |
8.000% due 11/30/39 | | | 150 | | | | 170 | |
UAL 2009-1 Pass Through Trust | | | | | | | | |
Series 09-1 | | | | | | | | |
10.400% due 11/01/16 | | | 77 | | | | 85 | |
Union Electric Co. | | | | | | | | |
6.400% due 06/15/17 | | | 205 | | | | 245 | |
Union Pacific Corp. | | | | | | | | |
4.163% due 07/15/22 | | | 349 | | | | 379 | |
UnitedHealth Group, Inc. | | | | | | | | |
4.875% due 02/15/13 | | | 200 | | | | 208 | |
6.000% due 06/15/17 | | | 3 | | | | 4 | |
6.500% due 06/15/37 | | | 45 | | | | 57 | |
Verizon Communications, Inc. | | | | | | | | |
3.500% due 11/01/21 | | | 300 | | | | 312 | |
Wachovia Corp. | | | | | | | | |
5.625% due 10/15/16 | | | 100 | | | | 109 | |
5.750% due 02/01/18 | | | 500 | | | | 568 | |
WEA Finance LLC / WT Finance Aust
Pty, Ltd. | | | | | | | | |
7.500% due 06/02/14 (Þ) | | | 205 | | | | 225 | |
6.750% due 09/02/19 (Þ) | | | 95 | | | | 106 | |
Wells Fargo & Co. | | | | | | | | |
5.625% due 12/11/17 | | | 300 | | | | 342 | |
Series K | | | | | | | | |
7.980% due 03/29/49 (ƒ)(Ñ) | | | 3,300 | | | | 3,534 | |
Russell Investment Funds
Core Bond Fund
Schedule of Investments, continued — December 31, 2011
Amounts in thousands (except share amounts)
| | | | | | | | |
| | | Principal
Amount ($)
or Shares | | | Market
Value
$ | |
| | | | | | | | |
Williams Cos., Inc. (The) | | | | | | | | |
7.875% due 09/01/21 | | | 161 | | | | 198 | |
8.750% due 03/15/32 | | | 108 | | | | 142 | |
Xylem, Inc. | | | | | | | | |
3.550% due 09/20/16 (Þ) | | | 250 | | | | 258 | |
ZFS Finance USA Trust II | | | | | | | | |
6.450% due 12/15/65 (Þ) | | | 300 | | | | 273 | |
| | | | | | | | |
| | | | | | | 93,408 | |
| | | | | | | | |
| International Debt - 9.1% | | | | | | | | |
Abbey National Treasury Services PLC | | | | | | | | |
1.553% due 04/25/13 (ž) | | | 300 | | | | 299 | |
1.602% due 06/10/13 (ž) | | | 2,000 | | | | 1,996 | |
3.875% due 11/10/14 (Þ) | | | 870 | | | | 817 | |
4.000% due 04/27/16 (Ñ) | | | 275 | | | | 247 | |
Achmea Hypotheekbank NV | | | | | | | | |
3.200% due 11/03/14 (Þ) | | | 548 | | | | 575 | |
AK Transneft OJSC Via
TransCapitalInvest, Ltd. | | | | | | | | |
8.700% due 08/07/18 (Þ) | | | 100 | | | | 120 | |
ANZ National International, Ltd. | | | | | | | | |
6.200% due 07/19/13 (Þ) | | | 600 | | | | 636 | |
ARES CLO, Ltd. | | | | | | | | |
Series 2005-10A Class A3 | | | | | | | | |
0.590% due 09/18/17 (Å)(Ê) | | | 248 | | | | 241 | |
AstraZeneca PLC | | | | | | | | |
5.900% due 09/15/17 (Ñ) | | | 100 | | | | 121 | |
Australia & New Zealand Banking
Group, Ltd. | | | | | | | | |
1.288% due 05/08/13 (Å)(Ê) | | | 300 | | | | 300 | |
AWAS Aviation Capital, Ltd. | | | | | | | | |
7.000% due 10/17/16 (Þ) | | | 330 | | | | 330 | |
Banco Santander Brazil SA | | | | | | | | |
2.450% due 03/18/14 (Ê)(Þ) | | | 200 | | | | 191 | |
Bank of Montreal | | | | | | | | |
2.850% due 06/09/15 (Þ) | | | 100 | | | | 104 | |
Bank of New York Mellon SA
Institucion de Banca Multiple | | | | | | | | |
9.625% due 05/02/21 (Þ) | | | 199 | | | | 183 | |
Bank of Scotland PLC | | | | | | | | |
5.250% due 02/21/17 (Þ) | | | 200 | | | | 209 | |
Barclays Bank PLC | | | | | | | | |
6.050% due 12/04/17 (Þ) | | | 200 | | | | 181 | |
BBVA Bancomer SA | | | | | | | | |
7.250% due 04/22/20 (Ñ)(Þ) | | | 300 | | | | 300 | |
6.500% due 03/10/21 (Þ) | | | 200 | | | | 193 | |
Black Diamond CLO, Ltd. | | | | | | | | |
Series 2007-1A Class AD | | | | | | | | |
0.678% due 04/29/19 (Ê)(Þ) | | | 750 | | | | 676 | |
BM&FBovespa SA | | | | | | | | |
5.500% due 07/16/20 (Ñ)(Þ) | | | 100 | | | | 103 | |
BNP Paribas SA | | | | | | | | |
5.186% due 06/29/49 (ƒ)(Þ) | | | 300 | | | | 198 | |
Series MTn | | | | | | | | |
0.791% due 04/08/13 (Ê) | | | 680 | | | | 639 | |
Bolivarian Republic of Venezuela | | | | | | | | |
8.250% due 10/13/24 | | | 70 | | | | 46 | |
| | | | | | | | |
| | | Principal
Amount ($)
or Shares | | | Market
Value
$ | |
BP Capital Markets PLC | | | | | | | | |
3.200% due 03/11/16 | | | 200 | | | | 210 | |
4.500% due 10/01/20 | | | 350 | | | | 385 | |
Braskem Finance, Ltd. | | | | | | | | |
5.750% due 04/15/21 (Þ) | | | 300 | | | | 298 | |
BRFkredit AS | | | | | | | | |
2.050% due 04/15/13 (Þ) | | | 1,400 | | | | 1,426 | |
Chatham Light CLO, Ltd. | | | | | | | | |
Series 2005-2A Class A1 | | | | | | | | |
0.682% due 08/03/19 (Å)(Ê) | | | 454 | | | | 437 | |
Cie de Financement Foncier | | | | | | | | |
2.125% due 04/22/13 (Ñ)(Þ) | | | 100 | | | | 99 | |
Colombia Government International Bond | | | | | | | | |
4.375% due 07/12/21 | | | 550 | | | | 591 | |
Corp. Nacional del Cobre de Chile | | | | | | | | |
7.500% due 01/15/19 (Þ) | | | 200 | | | | 255 | |
Covidien International Finance SA | | | | | | | | |
4.200% due 06/15/20 | | | 175 | | | | 192 | |
Credit Suisse NY | | | | | | | | |
6.000% due 02/15/18 | | | 770 | | | | 759 | |
CSN Islands XI Corp. | | | | | | | | |
6.875% due 09/21/19 (Þ) | | | 200 | | | | 211 | |
Deutsche Bank AG | | | | | | | | |
6.000% due 09/01/17 | | | 600 | | | | 670 | |
Dexia Credit Local SA | | | | | | | | |
0.908% due 04/29/14 (Ê)(Þ) | | | 500 | | | | 454 | |
DnB Boligkreditt AS | | | | | | | | |
2.100% due 10/14/15 (Þ) | | | 1,600 | | | | 1,586 | |
Dolphin Energy, Ltd. | | | | | | | | |
5.888% due 06/15/19 (Þ) | | | 110 | | | | 119 | |
Electricite De France | | | | | | | | |
5.500% due 01/26/14 (Þ) | | | 200 | | | | 214 | |
6.500% due 01/26/19 (Ñ)(Þ) | | | 200 | | | | 226 | |
6.950% due 01/26/39 (Þ) | | | 200 | | | | 235 | |
Endurance Specialty Holdings, Ltd. | | | | | | | | |
6.150% due 10/15/15 | | | 100 | | | | 105 | |
Enel Finance International NV | | | | | | | | |
6.250% due 09/15/17 (Þ) | | | 300 | | | | 286 | |
Escrow GM Corp | | | | | | | | |
1.000% due 12/31/12 (Å) | | | 80 | | | | 30 | |
Export-Import Bank of Korea | | | | | | | | |
5.875% due 01/14/15 | | | 700 | | | | 751 | |
Gazprom International SA for Gazprom | | | | | | | | |
Series regs | | | | | | | | |
7.201% due 02/01/20 | | | 45 | | | | 48 | |
Gazprom OAO Via Gaz Capital SA | | | | | | | | |
Series REGS | | | | | | | | |
9.250% due 04/23/19 | | | 110 | | | | 131 | |
HBOS PLC | | | | | | | | |
Series GMTN | | | | | | | | |
6.750% due 05/21/18 (Þ) | | | 825 | | | | 661 | |
HSBC Bank PLC | | | | | | | | |
3.100% due 05/24/16 (Þ) | | | 800 | | | | 800 | |
HSBC Bank USA | | | | | | | | |
Series CLN | | | | | | | | |
Zero coupon due 08/15/40 | | | 590 | | | | 720 | |
Russell Investment Funds
Core Bond Fund
Schedule of Investments, continued — December 31, 2011
Amounts in thousands (except share amounts)
| | | | | | | | |
| | | Principal
Amount ($)
or Shares | | | Market
Value
$ | |
| | | | | | | | |
HSBC Finance Corp. | | | | | | | | |
1.807% due 04/05/13 (Ê) | | | 300 | | | | 375 | |
HSBC Holdings PLC | | | | | | | | |
6.500% due 05/02/36 | | | 100 | | | | 101 | |
6.500% due 09/15/37 | | | 100 | | | | 99 | |
Indian Oil Corp., Ltd. | | | | | | | | |
4.750% due 01/22/15 | | | 400 | | | | 402 | |
ING Bank NV | | | | | | | | |
1.397% due 03/15/13 (Ê)(Þ) | | | 600 | | | | 586 | |
1.737% due 06/09/14 (Ê)(Þ) | | | 300 | | | | 287 | |
2.375% due 06/09/14 (Þ) | | | 375 | | | | 366 | |
2.500% due 01/14/16 (Þ) | | | 700 | | | | 687 | |
Intelsat Jackson Holdings SA | | | | | | | | |
9.500% due 06/15/16 (Ñ) | | | 580 | | | | 606 | |
7.250% due 04/01/19 (Þ) | | | 375 | | | | 381 | |
Intesa Sanpaolo SpA | | | | | | | | |
2.906% due 02/24/14 (Ê)(Þ) | | | 200 | | | | 176 | |
Israel Government AID Bond | | | | | | | | |
5.500% due 09/18/33 | | | 400 | | | | 529 | |
Jasper CLO, Ltd. | | | | | | | | |
Series 2005-1A Class A | | | | | | | | |
0.699% due 08/01/17 (Ê)(Þ) | | | 1,871 | | | | 1,716 | |
Korea Electric Power Corp. | | | | | | | | |
5.125% due 04/23/34 (Þ) | | | 60 | | | | 63 | |
Majapahit Holding BV | | | | | | | | |
Series REGS | | | | | | | | |
7.750% due 10/17/16 | | | 100 | | | | 112 | |
Mexico Government International Bond | | | | | | | | |
6.050% due 01/11/40 | | | 260 | | | | 318 | |
Monument Park CDO, Ltd. | | | | | | | | |
Series 2004-1A Class A1 | | | | | | | | |
0.959% due 01/20/16 (Ê)(Þ) | | | 272 | | | | 267 | |
Morgan Stanley | | | | | | | | |
2.001% due 04/13/16 | | | 100 | | | | 105 | |
1.752% due 01/16/17 | | | 200 | | | | 201 | |
Series GMTN | | | | | | | | |
5.750% due 02/14/17 | | | 300 | | | | 440 | |
Morgan Stanley Bank AG for OAO
Gazprom | | | | | | | | |
Series REGS | | | | | | | | |
9.625% due 03/01/13 | | | 900 | | | | 959 | |
MUFG Capital Finance 1, Ltd. | | | | | | | | |
6.346% due 07/29/49 (ƒ)(Ñ) | | | 200 | | | | 203 | |
National Australia Bank, Ltd. | | | | | | | | |
5.350% due 06/12/13 (Þ) | | | 800 | | | | 835 | |
Newcrest Finance Pty, Ltd. | | | | | | | | |
4.450% due 11/15/21 (Þ) | | | 300 | | | | 296 | |
Nexen, Inc. | | | | | | | | |
7.500% due 07/30/39 | | | 150 | | | | 180 | |
Noble Group, Ltd. | | | | | | | | |
6.750% due 01/29/20 (Þ) | | | 100 | | | | 86 | |
Nordea Eiendomskreditt AS | | | | | | | | |
1.875% due 04/07/14 (Þ) | | | 1,000 | | | | 1,001 | |
North American Development Bank | | | | | | | | |
4.375% due 02/11/20 | | | 400 | | | | 449 | |
PE Paper Escrow GmbH | | | | | | | | |
12.000% due 08/01/14 (Þ) | | | 200 | | | | 213 | |
| | | | | | | | |
| | | Principal
Amount ($)
or Shares | | | Market
Value
$ | |
Petrobras International Finance Co. - Pifco | | | | | | | | |
3.875% due 01/27/16 | | | 400 | | | | 412 | |
7.875% due 03/15/19 | | | 800 | | | | 955 | |
5.750% due 01/20/20 | | | 30 | | | | 32 | |
5.375% due 01/27/21 | | | 420 | | | | 441 | |
Petroleos de Venezuela SA | | | | | | | | |
Series REGS | | | | | | | | |
8.500% due 11/02/17 | | | 160 | | | | 121 | |
Petroleos Mexicanos | | | | | | | | |
8.000% due 05/03/19 | | | 320 | | | | 399 | |
PPL WEM Holdings PLC | | | | | | | | |
5.375% due 05/01/21 (Þ) | | | 230 | | | | 241 | |
Province of Ontario Canada | | | | | | | | |
1.375% due 01/27/14 | | | 200 | | | | 202 | |
PTTEP Canada International Finance, Ltd. | | | | | | | | |
5.692% due 04/05/21 (Þ) | | | 210 | | | | 220 | |
Qatar Government International Bond | | | | | | | | |
5.250% due 01/20/20 (Þ) | | | 520 | | | | 571 | |
QBE Capital Funding III, Ltd. | | | | | | | | |
7.250% due 05/24/41 (Þ) | | | 250 | | | | 220 | |
Ras Laffan Liquefied Natural Gas Co.,
Ltd. III | | | | | | | | |
5.838% due 09/30/27 (Þ) | | | 250 | | | | 266 | |
Series REGS | | | | | | | | |
6.750% due 09/30/19 | | | 300 | | | | 355 | |
Republic of Venezuela | | | | | | | | |
7.750% due 10/13/19 | | | 180 | | | | 129 | |
Resona Bank, Ltd. | | | | | | | | |
5.850% due 09/29/49 (ƒ)(Þ) | | | 100 | | | | 99 | |
Royal Bank of Scotland Group PLC | | | | | | | | |
6.990% due 10/29/49 (ƒ)(Þ) | | | 300 | | | | 188 | |
Series 1 | | | | | | | | |
9.118% due 03/31/49 (ƒ) | | | 300 | | | | 201 | |
Royal Bank of Scotland PLC (The) | | | | | | | | |
3.250% due 01/11/14 | | | 500 | | | | 479 | |
4.875% due 08/25/14 (Þ) | | | 1,000 | | | | 979 | |
5.625% due 08/24/20 | | | 200 | | | | 192 | |
RZD Capital, Ltd. | | | | | | | | |
5.739% due 04/03/17 | | | 500 | | | | 503 | |
Santander US Debt SA Unipersonal | | | | | | | | |
2.991% due 10/07/13 (Þ) | | | 400 | | | | 382 | |
SLM Corp. | | | | | | | | |
1.044% due 06/17/13 (Ê) | | | 150 | | | | 183 | |
Sparebank 1 Boligkreditt AS | | | | | | | | |
2.625% due 05/27/16 (Þ) | | | 1,100 | | | | 1,110 | |
Swedbank AB | | | | | | | | |
2.900% due 01/14/13 (Þ) | | | 800 | | | | 819 | |
Teck Resources, Ltd. | | | | | | | | |
10.750% due 05/15/19 | | | 200 | | | | 244 | |
TNK-BP Finance SA | | | | | | | | |
Series REGS | | | | | | | | |
7.500% due 07/18/16 | | | 120 | | | | 127 | |
TransCanada PipeLines, Ltd. | | | | | | | | |
6.350% due 05/15/67 | | | 225 | | | | 226 | |
Transocean, Inc. | | | | | | | | |
6.000% due 03/15/18 | | | 100 | | | | 102 | |
6.500% due 11/15/20 | | | 325 | | | | 336 | |
6.375% due 12/15/21 (Ñ) | | | 450 | | | | 478 | |
Russell Investment Funds
Core Bond Fund
Schedule of Investments, continued — December 31, 2011
Amounts in thousands (except share amounts)
| | | | | | | | |
| | | Principal
Amount ($)
or Shares | | | Market
Value
$ | |
| | | | | | | | |
Turkiye Garanti Bankasi AS | | | | | | | | |
2.909% due 04/20/16 (Ê)(Þ) | | | 200 | | | | 180 | |
UBS AG | | | | | | | | |
5.850% due 12/31/17 (Å) | | | 270 | | | | 79 | |
Series BKNT | | | | | | | | |
5.875% due 12/20/17 | | | 400 | | | | 416 | |
5.750% due 04/25/18 | | | 100 | | | | 104 | |
Vale Overseas, Ltd. | | | | | | | | |
5.625% due 09/15/19 | | | 400 | | | | 441 | |
Venezuela Government International Bond | | | | | | | | |
9.000% due 05/07/23 | | | 40 | | | | 29 | |
9.250% due 05/07/28 | | | 20 | | | | 14 | |
Vimpel Communications Via VIP
Finance Ireland, Ltd. OJSC | | | | | | | | |
7.748% due 02/02/21 (Ñ)(Þ) | | | 200 | | | | 171 | |
Virgin Media Finance PLC | | | | | | | | |
Series 1 | | | | | | | | |
9.500% due 08/15/16 (Ñ) | | | 225 | | | | 253 | |
Vivendi SA | | | | | | | | |
5.750% due 04/04/13 (Þ) | | | 400 | | | | 418 | |
Weatherford International, Ltd. | | | | | | | | |
9.625% due 03/01/19 (Å) | | | 250 | | | | 323 | |
Westchester CLO, Ltd. | | | | | | | | |
Zero coupon due 08/01/22 (Å) | | | 1,282 | | | | 1,143 | |
Westpac Banking Corp. | | | | | | | | |
3.585% due 08/14/14 (Þ) | | | 700 | | | | 746 | |
WG Horizons CLO | | | | | | | | |
Series 2006-1A Class A1 | | | | | | | | |
0.772% due 05/24/19 (Ê)(Þ) | | | 800 | | | | 744 | |
White Nights Gazprom | | | | | | | | |
10.500% due 03/08/14 | | | 200 | | | | 224 | |
10.500% due 03/25/14 | | | 300 | | | | 336 | |
WPP Finance UK | | | | | | | | |
8.000% due 09/15/14 | | | 250 | | | | 278 | |
| | | | | | | | |
| | | | | | | 49,754 | |
| | | | | | | | |
| Loan Agreements - 0.3% | | | | | | | | |
Caesars Entertainment Operating Co., Inc.
Term Loan B2 | | | | | | | | |
3.294% due 01/28/15 (Ê) | | | 175 | | | | 152 | |
3.418% due 01/28/15 | | | 325 | | | | 282 | |
Chrysler Group LLC Term Loan B | | | | | | | | |
6.000% due 05/24/17 | | | 499 | | | | 471 | |
HCA, Inc. Extended Term Loan B3 | | | | | | | | |
3.546% due 05/01/18 | | | 507 | | | | 480 | |
| | | | | | | | |
| | | | | | | 1,385 | |
| | | | | | | | |
| Mortgage-Backed Securities - 38.4% | | | | | |
ABN Amro Mortgage Corp. | | | | | | | | |
Series 2003-13 Class A3 | | | | | | | | |
5.500% due 01/25/34 | | | 1,319 | | | | 1,330 | |
Adjustable Rate Mortgage Trust | | | | | | | | |
Series 2004-5 Class 2A1 | | | | | | | | |
2.689% due 04/25/35 | | | 46 | | | | 41 | |
Series 2007-1 Class 1A1 | | | | | | | | |
2.910% due 03/25/37 | | | 983 | | | | 452 | |
American Home Mortgage Assets | | | | | | | | |
Series 2007-4 Class A2 | | | | | | | | |
0.447% due 08/25/37 (Ê) | | | 741 | | | | 489 | |
| | | | | | | | |
| | | Principal
Amount ($)
or Shares | | | Market
Value
$ | |
American Home Mortgage Investment
Trust | | | | | | | | |
Series 2004-4 Class 4A | | | | | | | | |
2.245% due 02/25/45 (Ê) | | | 65 | | | | 48 | |
Banc of America Funding Corp. | | | | | | | | |
Series 2005-D Class A1 | | | | | | | | |
2.705% due 05/25/35 (Ê) | | | 72 | | | | 69 | |
Series 2006-3 Class 5A8 | | | | | | | | |
5.500% due 03/25/36 | | | 475 | | | | 435 | |
Series 2006-A Class 4A1 | | | | | | | | |
5.445% due 02/20/36 (Ê) | | | 303 | | | | 215 | |
Series 2006-I Class 5A1 | | | | | | | | |
5.964% due 10/20/46 (Ê) | | | 1,159 | | | | 872 | |
Series 2007-4 Class 3A1 | | | | | | | | |
0.627% due 06/25/37 (Ê) | | | 1,194 | | | | 621 | |
Banc of America Large Loan, Inc. | | | | | | | | |
Series 2010-HLTN Class HLTN | | | | | | | | |
1.999% due 11/15/15 (Ê)(Þ) | | | 96 | | | | 86 | |
Banc of America Merrill Lynch
Commercial Mortgage, Inc. | | | | | | | | |
Series 2002-PB2 Class A4 | | | | | | | | |
6.186% due 06/11/35 | | | 64 | | | | 64 | |
Series 2005-2 Class A4 | | | | | | | | |
4.783% due 07/10/43 | | | 30 | | | | 30 | |
Series 2005-2 Class A5 | | | | | | | | |
4.857% due 07/10/43 | | | 745 | | | | 807 | |
Series 2006-1 Class A4 | | | | | | | | |
5.372% due 09/10/45 | | | 280 | | | | 310 | |
Series 2006-2 Class A4 | | | | | | | | |
5.921% due 05/10/45 | | | 200 | | | | 224 | |
Banc of America Mortgage Securities, Inc. | | | | | | | | |
Series 2004-1 Class 5A1 | | | | | | | | |
6.500% due 09/25/33 | | | 5 | | | | 5 | |
Series 2004-11 Class 2A1 | | | | | | | | |
5.750% due 01/25/35 | | | 170 | | | | 174 | |
Series 2005-H Class 2A5 | | | | | | | | |
2.764% due 09/25/35 (Ê) | | | 220 | | | | 163 | |
Series 2006-B Class 1A1 | | | | | | | | |
2.327% due 10/20/46 (Ê) | | | 61 | | | | 25 | |
BCAP LLC Trust | | | | | | | | |
Series 2011-RR4 Class 7A2 | | | | | | | | |
11.189% due 04/26/37 (Þ) | | | 578 | | | | 153 | |
Bear Stearns Adjustable Rate Mortgage
Trust | | | | | | | | |
Series 2003-1 Class 6A1 | | | | | | | | |
2.725% due 04/25/33 | | | 21 | | | | 18 | |
Series 2003-8 Class 4A1 | | | | | | | | |
2.828% due 01/25/34 | | | 67 | | | | 62 | |
Series 2004-9 Class 22A1 | | | | | | | | |
3.208% due 11/25/34 (Ê) | | | 41 | | | | 38 | |
Series 2005-2 Class A1 | | | | | | | | |
2.710% due 03/25/35 (Ê) | | | 647 | | | | 600 | |
Series 2007-3 Class 1A1 | | | | | | | | |
5.174% due 05/25/47 | | | 246 | | | | 150 | |
Bear Stearns Alt-A Trust | | | | | | | | |
Series 2005-4 Class 23A1 | | | | | | | | |
2.588% due 05/25/35 | | | 154 | | | | 112 | |
Russell Investment Funds
Core Bond Fund
Schedule of Investments, continued — December 31, 2011
Amounts in thousands (except share amounts)
| | | | | | | | |
| | | Principal
Amount ($)
or Shares | | | Market
Value
$ | |
| | | | | | | | |
Series 2005-7 Class 22A1 | | | | | | | | |
2.772% due 09/25/35 | | | 369 | | | | 232 | |
Series 2005-10 Class 24A1 | | | | | | | | |
2.542% due 01/25/36 | | | 352 | | | | 170 | |
Series 2006-1 Class 21A2 | | | | | | | | |
2.700% due 02/25/36 | | | 441 | | | | 160 | |
Bear Stearns Commercial Mortgage
Securities | | | | | | | | |
Series 2002-PBW1 Class A2 | | | | | | | | |
4.720% due 11/11/35 | | | 665 | | | | 672 | |
Series 2005-T20 Class A4A | | | | | | | | |
5.295% due 10/12/42 | | | 890 | | | | 984 | |
Series 2006-PW14 Class A4 | | | | | | | | |
5.201% due 12/11/38 | | | 1,600 | | | | 1,756 | |
Series 2006-T22 Class A4 | | | | | | | | |
5.705% due 04/12/38 | | | 505 | | | | 568 | |
Citigroup Commercial Mortgage Trust | | | | | | | | |
Series 2007-C6 Class A4 | | | | | | | | |
5.885% due 12/10/49 | | | 330 | | | | 364 | |
Citigroup Mortgage Loan Trust, Inc. | | | | | | | | |
Series 2005-11 Class A2A | | | | | | | | |
2.580% due 10/25/35 (Ê) | | | 43 | | | | 35 | |
Series 2006-AR7 Class 1A4A | | | | | | | | |
5.302% due 11/25/36 | | | 536 | | | | 334 | |
Series 2007-10 Class 2A3A | | | | | | | | |
5.884% due 09/25/37 | | | 460 | | | | 272 | |
Series 2007-10 Class 2A4A | | | | | | | | |
6.118% due 09/25/37 (Ê) | | | 283 | | | | 183 | |
Series 2007-AR8 Class 2A1A | | | | | | | | |
5.216% due 07/25/37 | | | 653 | | | | 406 | |
Citigroup/Deutsche Bank Commercial
Mortgage Trust | | | | | | | | |
Series 2005-CD1 Class A4 | | | | | | | | |
5.400% due 07/15/44 | | | 340 | | | | 376 | |
Commercial Mortgage Pass Through Certificates | | | | | | | | |
Series 2006-C8 Class A4 | | | | | | | | |
5.306% due 12/10/46 | | | 200 | | | | 217 | |
Series 2007-C9 Class A4 | | | | | | | | |
6.008% due 12/10/49 | | | 165 | | | | 184 | |
Countrywide Alternative Loan Trust | | | | | | | | |
Series 2005-81 Class A1 | | | | | | | | |
0.537% due 02/25/37 (Ê) | | | 294 | | | | 139 | |
Series 2005-32T1 Class A7 | | | | | | | | |
0.507% due 08/25/35 (Ê) | | | 6 | | | | 6 | |
Series 2005-48T1 Class A6 | | | | | | | | |
5.500% due 11/25/35 | | | 897 | | | | 560 | |
Series 2006-36T2 Class 1A9 | | | | | | | | |
1.157% due 12/25/36 (Ê) | | | 258 | | | | 117 | |
Series 2006-45T1 Class 2A2 | | | | | | | | |
6.000% due 02/25/37 | | | 997 | | | | 605 | |
Series 2006-OA16 Class A2 | | | | | | | | |
0.447% due 10/25/46 (Ê) | | | 1,453 | | | | 764 | |
Series 2006-OA19 Class A1 | | | | | | | | |
0.435% due 02/20/47 (Ê) | | | 640 | | | | 285 | |
Series 2007-15CB Class A5 | | | | | | | | |
5.750% due 07/25/37 | | | 621 | | | | 430 | |
| | | | | | | | |
| | | Principal
Amount ($)
or Shares | | | Market
Value
$ | |
Series 2007-OA11 Class A1A | | | | | | | | |
1.598% due 11/25/47 (Ê) | | | 857 | | | | 362 | |
Countrywide Home Loan Mortgage
Pass Through Trust | | | | | | | | |
Series 2003-52 Class A1 | | | | | | | | |
2.647% due 02/19/34 | | | 98 | | | | 83 | |
Series 2004-22 Class A3 | | | | | | | | |
2.746% due 11/25/34 | | | 137 | | | | 98 | |
Series 2004-HYB9 Class 1A1 | | | | | | | | |
2.709% due 02/20/35 | | | 225 | | | | 172 | |
Series 2005-1 Class 2A1 | | | | | | | | |
0.547% due 03/25/35 (Ê) | | | 1,324 | | | | 665 | |
Series 2005-3 Class 1A2 | | | | | | | | |
0.547% due 04/25/35 (Ê) | | | 22 | | | | 12 | |
Series 2005-HYB9 Class 3A2A | | | | | | | | |
2.595% due 02/20/36 (Ê) | | | 43 | | | | 29 | |
Series 2007-1 Class A1 | | | | | | | | |
6.000% due 03/25/37 | | | 1,181 | | | | 934 | |
Series 2007-2 Class A2 | | | | | | | | |
6.000% due 03/25/37 | | | 2,100 | | | | 1,653 | |
Series 2007-4 Class 1A10 | | | | | | | | |
6.000% due 05/25/37 | | | 2,000 | | | | 1,506 | |
Series 2007-HY1 Class 1A2 | | | | | | | | |
5.326% due 04/25/37 | | | 2 | | | | — | |
Credit Suisse First Boston Mortgage
Securities Corp. | | | | | | | | |
Series 2005-9 Class 2A1 | | | | | | | | |
5.500% due 10/25/35 | | | 297 | | | | 270 | |
Credit Suisse Mortgage Capital
Certificates | | | | | | | | |
Series 2006-8 Class 4A1 | | | | | | | | |
6.500% due 10/25/21 | | | 354 | | | | 276 | |
Series 2006-C2 Class A3 | | | | | | | | |
5.850% due 03/15/39 | | | 100 | | | | 107 | |
Series 2007-2 Class 3A4 | | | | | | | | |
5.500% due 03/25/37 | | | 1,000 | | | | 852 | |
DBRR Trust | | | | | | | | |
Series 2011-LC2 Class A4A | | | | | | | | |
4.537% due 07/12/44 (Þ) | | | 340 | | | | 376 | |
DBUBS Mortgage Trust | | | | | | | | |
Series 2011-LC2A Class A2 | | | | | | | | |
3.386% due 07/10/44 (Þ) | | | 900 | | | | 931 | |
Deutsche ALT-A Securities, Inc. Alternate Loan Trust | | | | | | | | |
Series 2005-AR1 Class 2A3
1.857% due 08/25/35 | | | 465 | | | | 230 | |
Series 2007-AR3 Class 2A4
0.607% due 06/25/37 (Ê) | | | 500 | | | | 74 | |
Series 2007-OA1 Class A1
0.407% due 02/25/47 (Ê) | | | 2,018 | | | | 921 | |
Series 2007-OA2 Class A1
0.970% due 04/25/47 (Ê) | | | 1,135 | | | | 652 | |
Fannie Mae
2.659% due 2017 (Ê) | | | 23 | | | | 23 | |
6.000% due 2017 | | | 20 | | | | 22 | |
3.740% due 2018 | | | 893 | | | | 964 | |
3.840% due 2018 | | | 210 | | | | 228 | |
Russell Investment Funds
Core Bond Fund
Schedule of Investments, continued — December 31, 2011
Amounts in thousands (except share amounts)
| | | | | | | | |
| | | Principal
Amount ($)
or Shares | | | Market
Value
$ | |
| | | | | | | | |
4.500% due 2018 | | | 88 | | | | 95 | |
4.506% due 2019 (Ê) | | | 700 | | | | 778 | |
3.416% due 2020 (Ê) | | | 198 | | | | 210 | |
3.584% due 2020 (Ê) | | | 593 | | | | 634 | |
3.632% due 2020 (Ê) | | | 198 | | | | 212 | |
3.665% due 2020 (Ê) | | | 810 | | | | 871 | |
3.763% due 2020 (Ê) | | | 1,577 | | | | 1,703 | |
4.250% due 2020 | | | 781 | | | | 861 | |
5.500% due 2020 | | | 77 | | | | 84 | |
4.301% due 2021 | | | 495 | | | | 551 | |
5.500% due 2021 | | | 115 | | | | 125 | |
5.500% due 2022 | | | 226 | | | | 246 | |
5.500% due 2023 | | | 161 | | | | 178 | |
4.000% due 2024 | | | 279 | | | | 294 | |
4.000% due 2025 | | | 1,500 | | | | 1,585 | |
4.500% due 2025 | | | 1,095 | | | | 1,185 | |
3.500% due 2026 | | | 3,942 | | | | 4,169 | |
6.000% due 2026 | | | 326 | | | | 359 | |
6.000% due 2027 | | | 185 | | | | 204 | |
6.000% due 2028 | | | 14 | | | | 16 | |
6.000% due 2032 | | | 194 | | | | 217 | |
5.000% due 2033 | | | 69 | | | | 75 | |
5.500% due 2033 | | | 14 | | | | 15 | |
6.000% due 2033 | | | 10 | | | | 11 | |
5.000% due 2034 | | | 562 | | | | 608 | |
5.500% due 2034 | | | 517 | | | | 568 | |
4.500% due 2035 | | | 68 | | | | 73 | |
5.000% due 2035 | | | 3,727 | | | | 4,030 | |
5.500% due 2035 | | | 5 | | | | 5 | |
3.662% due 2036 (Ê) | | | 232 | | | | 235 | |
5.500% due 2037 | | | 2,227 | | | | 2,433 | |
6.000% due 2037 | | | 97 | | | | 109 | |
5.500% due 2038 | | | 3,825 | | | | 4,198 | |
6.000% due 2038 | | | 659 | | | | 733 | |
4.000% due 2039 | | | 1,926 | | | | 2,026 | |
4.500% due 2039 | | | 1,475 | | | | 1,600 | |
5.000% due 2039 | | | 38 | | | | 41 | |
4.000% due 2040 | | | 8,811 | | | | 9,285 | |
4.500% due 2040 | | | 1,880 | | | | 2,011 | |
5.500% due 2040 | | | 341 | | | | 371 | |
4.000% due 2041 | | | 10,224 | | | | 10,764 | |
4.500% due 2041 | | | 3,597 | | | | 3,831 | |
5.000% due 2041 | | | 2,887 | | | | 3,127 | |
15 Year TBA (Ï)
3.000% | | | 15,645 | | | | 16,151 | |
3.500% | | | 1,100 | | | | 1,151 | |
30 Year TBA (Ï)
3.500% | | | 5,000 | | | | 5,141 | |
4.000% | | | 5,000 | | | | 5,123 | |
5.000% | | | 2,000 | | | | 2,115 | |
6.500% | | | 1,000 | | | | 1,113 | |
Series 2003-343 Class 6 | | | | | | | | |
Interest Only STRIP
5.000% due 10/01/33 | | | 119 | | | | 18 | |
Series 2003-345 Class 18 | | | | | | | | |
Interest Only STRIP
4.500% due 12/01/18 | | | 245 | | | | 21 | |
| | | | | | | | |
| | | Principal
Amount ($)
or Shares | | | Market
Value
$ | |
Series 2003-345 Class 19 | | | | | | | | |
Interest Only STRIP
4.500% due 01/01/19 | | | 268 | | | | 22 | |
Series 2005-365 Class 12 | | | | | | | | |
Interest Only STRIP
5.500% due 12/01/35 | | | 453 | | | | 65 | |
Series 2006-369 Class 8 | | | | | | | | |
Interest Only STRIP
5.500% due 04/01/36 | | | 81 | | | | 13 | |
Fannie Mae REMICS
Series 1999-56 Class Z
7.000% due 12/18/29 | | | 52 | | | | 60 | |
Series 2003-32 Class FH
0.657% due 11/25/22 (Ê) | | | 76 | | | | 76 | |
Series 2003-35 Class FY
0.657% due 05/25/18 (Ê) | | | 143 | | | | 143 | |
Series 2006-27 Class SH | | | | | | | | |
Interest Only STRIP
6.443% due 04/25/36 (Ê) | | | 2,488 | | | | 371 | |
Series 2007-30 Class AF
0.567% due 04/25/37 (Ê) | | | 87 | | | | 87 | |
Series 2010-95 Class S | | | | | | | | |
Interest Only STRIP
6.343% due 09/25/40 (Ê) | | | 2,584 | | | | 383 | |
Series 2010-112 Class PI | | | | | | | | |
Interest Only STRIP
6.000% due 10/25/40 | | | 2,764 | | | | 427 | |
Fannie Mae Whole Loan
Series 2003-W1 Class 1A1
6.301% due 12/25/42 | | | 26 | | | | 30 | |
Federal Home Loan Mortgage Corp.
Multifamily Structured Pass Through Certificates
Series 2011-K703 Class A2
2.699% due 05/25/18 | | | 500 | | | | 514 | |
Federal Home Loan Mortgage Corp.
Structured Pass Through Securities
Series 2005-63 Class 1A1 | | | | | | | | |
1.431% due 02/25/45 (Ê) | | | 20 | | | | 19 | |
First Horizon Asset Securities, Inc.
Series 2005-AR4 Class 2A1
2.638% due 10/25/35 (Ê) | | | 910 | | | | 656 | |
Freddie Mac
6.000% due 2016 | | | 8 | | | | 8 | |
5.000% due 2018 | | | 120 | | | | 129 | |
5.000% due 2019 | | | 236 | | | | 255 | |
5.000% due 2020 | | | 225 | | | | 243 | |
3.500% due 2025 | | | 1,360 | | | | 1,428 | |
2.615% due 2030 (Ê) | | | 1 | | | | 1 | |
5.000% due 2035 | | | 775 | | | | 834 | |
5.139% due 2037 (Ê) | | | 178 | | | | 190 | |
5.500% due 2037 | | | 823 | | | | 888 | |
6.000% due 2037 | | | 209 | | | | 233 | |
5.500% due 2038 | | | 3,296 | | | | 3,643 | |
6.000% due 2038 | | | 1,179 | | | | 1,309 | |
4.500% due 2039 | | | 5,295 | | | | 5,673 | |
6.000% due 2039 | | | 77 | | | | 86 | |
4.000% due 2040 | | | 2,350 | | | | 2,483 | |
Russell Investment Funds
Core Bond Fund
Schedule of Investments, continued — December 31, 2011
Amounts in thousands (except share amounts)
| | | | | | | | |
| | | Principal
Amount ($)
or Shares | | | Market
Value
$ | |
| | | | | | | | |
4.500% due 2040 | | | 190 | | | | 201 | |
5.500% due 2040 | | | 683 | | | | 742 | |
4.000% due 2041 | | | 9,132 | | | | 9,666 | |
4.500% due 2041 | | | 6,572 | | | | 7,087 | |
Freddie Mac REMICS
Series 2000-2266 Class F
0.698% due 11/15/30 (Ê) | | | 9 | | | | 9 | |
Series 2005-3019 Class IM | | | | | | | | |
Interest Only STRIP
5.500% due 01/15/31 | | | 17 | | | | — | |
Series 2007-3335 Class BF
0.398% due 07/15/19 (Ê) | | | 101 | | | | 101 | |
Series 2007-3335 Class FT
0.398% due 08/15/19 (Ê) | | | 219 | | | | 219 | |
GE Capital Commercial Mortgage Corp.
Series 2002-1A Class A3
6.269% due 12/10/35 | | | 335 | | | | 336 | |
Series 2002-2A Class A3
5.349% due 08/11/36 | | | 684 | | | | 691 | |
Ginnie Mae I
3.950% due 2025 | | | 93 | | | | 102 | |
4.500% due 2039 | | | 1,684 | | | | 1,842 | |
30 Year TBA(Ï) | | | | | | | | |
3.500% | | | — | | | | — | |
4.000% | | | 2,000 | | | | 2,145 | |
Ginnie Mae II
2.375% due 2026 (Ê) | | | 105 | | | | 109 | |
1.625% due 2027 (Ê) | | | 7 | | | | 8 | |
1.750% due 2032 (Ê) | | | 37 | | | | 38 | |
Government National Mortgage
Association
Series 2000-29 Class F | | | | | | | | |
0.755% due 09/20/30 (Ê) | | | 11 | | | | 11 | |
Series 2007-26 Class SD | | | | | | | | |
Interest Only STRIP
6.550% due 05/16/37 (Ê) | | | 2,349 | | | | 372 | |
Series 2010-116 Class MP
3.500% due 09/16/40 | | | 1,906 | | | | 1,977 | |
Greenwich Capital Commercial
Funding Corp.
Series 2002-C1 Class A4
4.948% due 01/11/35 | | | 636 | | | | 646 | |
Series 2004-GG1 Class A7
5.317% due 06/10/36 | | | 880 | | | | 938 | |
Series 2006-GG7 Class A4
6.073% due 07/10/38 | | | 1,105 | | | | 1,228 | |
Series 2007-GG9 Class A4
5.444% due 03/10/39 | | | 315 | | | | 341 | |
GS Mortgage Securities Corp. II
Series 2006-GG6 Class A4
5.553% due 04/10/38 | | | 320 | | | | 348 | |
Series 2011-GC5 Class A4
3.707% due 08/10/44 | | | 1,165 | | | | 1,217 | |
GSR Mortgage Loan Trust
Series 2005-AR7 Class 6A1
5.149% due 11/25/35 | | | 127 | | | | 111 | |
Series 2006-2F Class 3A3
6.000% due 02/25/36 | | | 862 | | | | 645 | |
| | | | | | | | |
| | | Principal
Amount ($)
or Shares | | | Market
Value
$ | |
Series 2006-3F Class 2A3
5.750% due 03/25/36 | | | 281 | | | | 248 | |
Series 2006-8F Class 4A17
6.000% due 09/25/36 | | | 461 | | | | 385 | |
Series 2007-AR1 Class 1A1
2.772% due 03/25/37 | | | 1,538 | | | | 847 | |
Series 2007-AR2 Class 2A1
2.755% due 05/25/47 | | | 836 | | | | 558 | |
Harborview Mortgage Loan Trust
Series 2005-3 Class 2A1A
0.495% due 06/19/35 (Ê) | | | 1,284 | | | | 781 | |
Series 2005-4 Class 3A1
2.769% due 07/19/35 | | | 111 | | | | 72 | |
Indymac Index Mortgage Loan Trust
Series 2005-AR31 Class 1A1
2.411% due 01/25/36 | | | 522 | | | | 280 | |
Series 2006-AR35 Class 2A1A
0.427% due 01/25/37 (Ê) | | | 467 | | | | 205 | |
Series 2006-AR41 Class A3
0.437% due 02/25/37 (Ê) | | | 1,243 | | | | 516 | |
Series 2007-AR5 Class 1A1
4.872% due 05/25/37 | | | 526 | | | | 197 | |
JPMorgan Alternative Loan Trust
Series 2006-A2 Class 3A1 | | | | | | | | |
2.617% due 05/25/36 | | | 1,306 | | | | 678 | |
JPMorgan Chase Commercial Mortgage Securities Corp.
Series 2005-LDP5 Class A4 | | | | | | | | |
5.373% due 12/15/44 | | | 390 | | | | 431 | |
Series 2006-CB16 Class A4
5.552% due 05/12/45 | | | 220 | | | | 241 | |
Series 2006-LDP7 Class A4
6.072% due 04/15/45 | | | 650 | | | | 730 | |
Series 2006-LDP8 Class A3B
5.447% due 05/15/45 | | | 250 | | | | 258 | |
Series 2006-LDP8 Class A4
5.399% due 05/15/45 | | | 290 | | | | 319 | |
Series 2007-CB18 Class A4
5.440% due 06/12/47 | | | 1,200 | | | | 1,286 | |
Series 2007-LD12 Class A4
5.882% due 02/15/51 | | | 100 | | | | 109 | |
Series 2007-LDPX Class A3
5.420% due 01/15/49 | | | 700 | | | | 757 | |
JPMorgan Mortgage Trust
Series 2005-A1 Class 6T1
5.021% due 02/25/35 (Ê) | | | 40 | | | | 39 | |
Series 2005-A5 Class TA1
5.413% due 08/25/35 | | | 342 | | | | 316 | |
Series 2005-S3 Class 1A2
5.750% due 01/25/36 | | | 73 | | | | 67 | |
Series 2007-A1 Class 2A2
2.752% due 07/25/35 (Ê) | | | 332 | | | | 279 | |
Series 2007-A4 Class 3A1
5.714% due 06/25/37 | | | 1,549 | | | | 1,268 | |
Series 2007-S3 Class 1A8
6.000% due 08/25/37 | | | 1,178 | | | | 929 | |
Lehman Mortgage Trust
Series 2005-3 Class 1A3
5.500% due 01/25/36 | | | 190 | | | | 132 | |
Russell Investment Funds
Core Bond Fund
Schedule of Investments, continued — December 31, 2011
Amounts in thousands (except share amounts)
| | | | | | | | |
| | | Principal
Amount ($)
or Shares | | | Market
Value
$ | |
| | | | | | | | |
Series 2006-8 Class 2A1
0.677% due 12/25/36 (Ê) | | | 552 | | | | 228 | |
Series 2007-8 Class 3A1
7.250% due 09/25/37 | | | 757 | | | | 307 | |
Lehman XS Trust
Series 2007-7N Class 1A2
0.497% due 06/25/47 (Ê) | | | 708 | | | | 298 | |
Mastr Adjustable Rate Mortgages Trust
Series 2007-HF2 Class A1
0.567% due 09/25/37 (Ê) | | | 771 | | | | 465 | |
Mastr Alternative Loans Trust
Series 2003-4 Class B1
5.773% due 06/25/33 | | | 130 | | | | 113 | |
Series 2004-10 Class 5A6
5.750% due 09/25/34 | | | 130 | | | | 132 | |
Mellon Residential Funding Corp.
Series 2000-TBC2 Class A1
0.729% due 06/15/30 (Ê) | | | 87 | | | | 76 | |
Merrill Lynch Mortgage Investors, Inc.
Series 2005-A10 Class A
0.467% due 02/25/36 (Ê) | | | 78 | | | | 50 | |
Series 2006-A1 Class 1A1
2.750% due 03/25/36 | | | 731 | | | | 382 | |
Merrill Lynch/Countrywide
Commercial Mortgage Trust
Series 2007-6 Class A4
5.485% due 03/12/51 | | | 100 | | | | 105 | |
MLCC Mortgage Investors, Inc.
Series 2005-3 Class 5A
0.507% due 11/25/35 (Ê) | | | 47 | | | | 36 | |
Morgan Stanley Capital I
Series 2005-T19 Class A4A
4.890% due 06/12/47 | | | 750 | | | | 818 | |
Series 2006-HQ9 Class A4
5.731% due 07/12/44 | | | 515 | | | | 570 | |
Series 2006-T23 Class A4
5.990% due 08/12/41 | | | 490 | | | | 560 | |
Series 2007-IQ16 Class A4
5.809% due 12/12/49 | | | 805 | | | | 886 | |
Series 2007-T27 Class A4
5.794% due 06/11/42 | | | 720 | | | | 820 | |
Series 2011-C3 Class A2
3.224% due 07/15/49 | | | 195 | | | | 202 | |
Series 2011-C3 Class A4
4.118% due 07/15/49 | | | 115 | | | | 123 | |
NCUA Guaranteed Notes
Series 2010-C1 Class APT
2.650% due 10/29/20 | | | 484 | | | | 506 | |
Series 2010-R1 Class 1A
0.695% due 10/07/20 (Ê) | | | 1,320 | | | | 1,322 | |
Series 2010-R2 Class 1A
0.615% due 11/06/17 (Ê) | | | 1,204 | | | | 1,204 | |
Series 2010-R2 Class 2A
0.715% due 11/05/20 (Ê) | | | 751 | | | | 751 | |
Series 2011-R2 Class 1A
0.645% due 02/06/20 (Ê) | | | 1,001 | | | | 1,001 | |
| | | | | | | | |
| | | Principal
Amount ($)
or Shares | | | Market
Value
$ | |
Prime Mortgage Trust
Series 2004-CL1 Class 1A2
0.657% due 02/25/34 (Ê) | | | 15 | | | | 14 | |
Residential Accredit Loans, Inc.
Series 2005-QO5 Class A1
1.218% due 01/25/46 (Ê) | | | 1,562 | | | | 724 | |
Series 2005-QS13 Class 2A3
5.750% due 09/25/35 | | | 280 | | | | 195 | |
Series 2007-QO4 Class A1
0.457% due 05/25/47 (Ê) | | | 1,230 | | | | 661 | |
Residential Asset Securitization Trust
Series 2003-A15 Class 1A2
0.707% due 02/25/34 (Ê) | | | 111 | | | | 99 | |
Series 2005-A10 Class A3
5.500% due 09/25/35 | | | 248 | | | | 201 | |
Series 2006-A9CB Class A6
6.000% due 09/25/36 | | | 229 | | | | 120 | |
Residential Funding Mortgage Securities I
Series 2005-SA4 Class 2A1
2.939% due 09/25/35 | | | 406 | | | | 295 | |
Series 2006-SA4 Class 2A1
3.716% due 11/25/36 | | | 233 | | | | 153 | |
Sequoia Mortgage Trust
Series 2001-5 Class A
0.605% due 10/19/26 (Ê) | | | 33 | | | | 28 | |
Structured Adjustable Rate Mortgage
Loan Trust
Series 2004-12 Class 3A2
2.444% due 09/25/34 | | | 45 | | | | 37 | |
Series 2005-23 Class 1A3
2.532% due 01/25/36 | | | 245 | | | | 195 | |
Series 2006-12 Class 2A1
5.298% due 01/25/37 | | | 540 | | | | 323 | |
Structured Asset Mortgage Investments,
Inc.
Series 2005-AR5 Class A3
0.505% due 07/19/35 (Ê) | | | 128 | | | | 105 | |
Series 2007-AR6 Class A1
1.718% due 08/25/47 (Ê) | | | 1,177 | | | | 567 | |
Structured Asset Securities Corp.
Series 2003-34A Class 5A4
2.441% due 11/25/33 (Ê) | | | 682 | | | | 631 | |
Suntrust Adjustable Rate Mortgage
Loan Trust
Series 2007-2 Class 3A3
5.516% due 04/25/37 (Ê) | | | 2,383 | | | | 1,635 | |
Wachovia Bank Commercial Mortgage Trust
Series 2005-C16 Class A4
4.847% due 10/15/41 | | | 725 | | | | 781 | |
Series 2005-C20 Class A7
5.118% due 07/15/42 | | | 800 | | | | 877 | |
Washington Mutual Alternative Mortgage
Pass-Through Certificates
Series 2006-AR7 Class A1A
1.138% due 09/25/46 (Ê) | | | 1,267 | | | | 429 | |
Series 2006-AR9 Class 2A
1.058% due 11/25/46 (Ê) | | | 1,599 | | | | 586 | |
Russell Investment Funds
Core Bond Fund
Schedule of Investments, continued — December 31, 2011
Amounts in thousands (except share amounts)
| | | | | | | | |
| | | Principal
Amount ($)
or Shares | | | Market
Value
$ | |
| | | | | | | | |
Series 2007-HY2 Class 2A3
4.924% due 04/25/37 | | | 1,095 | | | | 567 | |
Series 2007-OA1 Class 2A
0.950% due 12/25/46 (Ê) | | | 536 | | | | 214 | |
Series 2007-OA5 Class A1A
1.058% due 05/25/47 (Ê) | | | 1,105 | | | | 509 | |
Washington Mutual Mortgage Pass
Through Certificates
Series 2005-AR6 Class B3
0.917% due 04/25/45 (Å)(Ê) | | | 183 | | | | 7 | |
Series 2005-AR13 Class A1A1
0.547% due 10/25/45 (Ê) | | | 25 | | | | 18 | |
Series 2006-AR2 Class 1A1
2.539% due 03/25/36 | | | 415 | | | | 284 | |
Series 2007-HY3 Class 4B1
2.610% due 03/25/37 | | | 84 | | | | 2 | |
Wells Fargo Mortgage Backed
Securities Trust
Series 2006-2 Class 2A3
5.500% due 03/25/36 | | | 182 | | | | 178 | |
Series 2006-6 Class 1A22
6.000% due 05/25/36 (Ê) | | | 1,232 | | | | 1,104 | |
Series 2006-AR2 Class 2A1
2.692% due 03/25/36 | | | 178 | | | | 138 | |
Series 2006-AR10 Class 4A1
2.739% due 07/25/36 (Ê) | | | 50 | | | | 33 | |
Series 2006-AR14 Class 1A7
5.678% due 10/25/36 | | | 1,700 | | | | 1,429 | |
Series 2006-AR17 Class A1
2.571% due 10/25/36 (Ê) | | | 922 | | | | 665 | |
Series 2007-8 Class 1A16
6.000% due 07/25/37 | | | 183 | | | | 167 | |
Series 2007-AR8 Class A1
6.050% due 11/25/37 | | | 310 | | | | 225 | |
WF-RBS Commercial Mortgage Trust
Series 2011-C5 Class A4
3.667% due 11/15/44 | | | 545 | | | | 555 | |
| | | | | | | | |
| | | | | | | 209,444 | |
| | | | | | | | |
| Municipal Bonds - 2.1% | | | | | | | | |
American Municipal Power, Inc.
Revenue Bonds
6.270% due 02/15/50 | | | 250 | | | | 282 | |
Chicago Transit Authority Revenue
Bonds
6.899% due 12/01/40 | | | 400 | | | | 466 | |
City of New York New York General
Obligation Unlimited
6.246% due 06/01/35 | | | 1,100 | | | | 1,226 | |
County of Clark Nevada Airport
System Revenue Bonds
6.820% due 07/01/45 | | | 100 | | | | 126 | |
Illinois Municipal Electric Agency
Revenue Bonds
6.832% due 02/01/35 | | | 100 | | | | 117 | |
Irvine Ranch Water District Revenue
Bonds
6.622% due 05/01/40 | | | 1,000 | | | | 1,341 | |
| | | | | | | | |
| | | Principal
Amount ($)
or Shares | | | Market
Value
$ | |
Los Angeles Unified School District
General Obligation Unlimited
4.500% due 07/01/22 (µ) | | | 400 | | | | 438 | |
New Jersey State Turnpike Authority Revenue Bonds
7.102% due 01/01/41 | | | 1,000 | | | | 1,370 | |
New York City Municipal Water
Finance Authority Revenue Bonds
5.375% due 06/15/43 | | | 525 | | | | 582 | |
New York Liberty Development Corp. Revenue Bonds
5.000% due 12/15/41 | | | 100 | | | | 107 | |
North Carolina Turnkpike Authority
Revenue Bonds | | | | | | | | |
6.700% due 01/01/39 | | | 100 | | | | 113 | |
Northern California Power Agency
Revenue Bonds | | | | | | | | |
7.311% due 06/01/40 | | | 1,000 | | | | 1,151 | |
Public Power Generation Agency
Revenue Bonds | | | | | | | | |
7.242% due 01/01/41 | | | 100 | | | | 114 | |
San Diego County Regional Airport
Authority Revenue Bonds | | | | | | | | |
6.628% due 07/01/40 | | | 100 | | | | 107 | |
State of California General Obligation Unlimited
7.500% due 04/01/34 | | | 100 | | | | 120 | |
7.950% due 03/01/36 | | | 110 | | | | 124 | |
5.650% due 04/01/39 (Ê) | | | 100 | | | | 105 | |
7.550% due 04/01/39 | | | 655 | | | | 800 | |
7.625% due 03/01/40 | | | 175 | | | | 215 | |
7.600% due 11/01/40 | | | 325 | | | | 401 | |
State of Illinois General Obligation Unlimited
4.071% due 01/01/14 | | | 100 | | | | 103 | |
5.665% due 03/01/18 | | | 750 | | | | 799 | |
7.350% due 07/01/35 | | | 525 | | | | 579 | |
State of Louisiana Gasoline & Fuels
Tax Revenue Bonds
3.000% due 05/01/43 (Ê) | | | 400 | | | | 405 | |
University of California Revenue Bonds 6.270% due 05/15/31 | | | 400 | | | | 440 | |
| | | | | | | | |
| | | | | | | 11,631 | |
| | | | | | | | |
| Non-US Bonds - 1.2% | | | | | | | | |
Canada Housing Trust No. 1
3.750% due 03/15/20 (Þ) | | | CAD 300 | | | | 328 | |
3.800% due 06/15/21 (Þ) | | | CAD 200 | | | | 219 | |
Canadian Government Bond
3.750% due 06/01/19 | | | CAD 200 | | | | 225 | |
FCE Bank plc
7.125% due 01/15/13 | | | EUR 600 | | | | 794 | |
Federative Republic of Brazil
12.500% due 01/05/22 | | | BRL 300 | | | | 206 | |
10.250% due 01/10/28 | | | BRL 1,400 | | | | 856 | |
Italy Buoni Poliennali Del Tesoro
Series CPI
2.100% due 09/15/21 | | | EUR 943 | | | | 904 | |
Russell Investment Funds
Core Bond Fund
Schedule of Investments, continued — December 31, 2011
Amounts in thousands (except share amounts)
| | | | | | | | |
| | | Principal
Amount ($)
or Shares | | | Market
Value
$ | |
| | | | | | | | |
Mexican Bonos
Series M 20
12.500% due 11/30/17 | | | MXN 3,663 | | | | 338 | |
Province of Ontario Canada
4.000% due 06/02/21 | | | CAD 300 | | | | 323 | |
4.700% due 06/02/37 | | | CAD 400 | | | | 476 | |
4.600% due 06/02/39 | | | CAD 100 | | | | 118 | |
Province of Quebec Canada
4.250% due 12/01/21 | | | CAD 300 | | | | 327 | |
South Africa Government Bond
Series R186
10.500% due 12/21/26 | | | ZAR 6,980 | | | | 1,011 | |
Series R207
7.250% due 01/15/20 | | | ZAR 520 | | | | 62 | |
Series R208
6.750% due 03/31/21 | | | ZAR 3,695 | | | | 422 | |
| | | | | | | | |
| | | | | | | 6,609 | |
| | | | | | | | |
| United States Government Agencies - 1.7% | | | | | |
Fannie Mae
4.125% due 04/15/14 | | | 200 | | | | 216 | |
Federal Home Loan Banks
0.210% due 01/04/13 | | | 2,200 | | | | 2,198 | |
5.375% due 05/15/19 | | | 500 | | | | 622 | |
4.500% due 09/13/19 | | | 1,100 | | | | 1,299 | |
Federal Home Loan Mortgage Corp.
0.700% due 11/04/13 | | | 1,820 | | | | 1,821 | |
0.625% due 12/29/14 | | | 1,800 | | | | 1,799 | |
Freddie Mac
4.875% due 06/13/18 | | | 600 | | | | 723 | |
Series 1
0.500% due 10/15/13 | | | 300 | | | | 300 | |
Tennessee Valley Authority
4.625% due 09/15/60 | | | 100 | | | | 119 | |
| | | | | | | | |
| | | | | | | 9,097 | |
| | | | | | | | |
| United States Government Treasuries - 14.5% | | | | | |
United States Treasury Inflation
Indexed Bonds
1.875% due 07/15/13 | | | 370 | | | | 387 | |
2.375% due 01/15/27 | | | 2,021 | | | | 2,610 | |
1.750% due 01/15/28 | | | 108 | | | | 130 | |
3.375% due 04/15/32 | | | 893 | | | | 1,375 | |
2.125% due 02/15/41 | | | 1,386 | | | | 1,871 | |
United States Treasury Notes
0.625% due 04/30/13 | | | 1,200 | | | | 1,207 | |
0.500% due 05/31/13 | | | 1,200 | | | | 1,205 | |
0.375% due 06/30/13 | | | 1,100 | | | | 1,103 | |
0.250% due 10/31/13 | | | 6,400 | | | | 6,401 | |
0.250% due 11/30/13 | | | 4,800 | | | | 4,801 | |
0.625% due 07/15/14 | | | 8,000 | | | | 8,062 | |
0.375% due 11/15/14 | | | 3,800 | | | | 3,802 | |
0.250% due 12/15/14 | | | 1,100 | | | | 1,096 | |
0.879% due 10/31/16 | | | 500 | | | | 505 | |
0.875% due 11/30/16 | | | 4,400 | | | | 4,413 | |
0.875% due 12/31/16 | | | 4,000 | | | | 4,007 | |
1.375% due 11/30/18 | | | 300 | | | | 301 | |
3.375% due 11/15/19 | | | 100 | | | | 114 | |
| | | | | | | | |
| | | Principal
Amount ($)
or Shares | | | Market
Value
$ | |
3.625% due 02/15/20 | | | 400 | | | | 464 | |
3.500% due 05/15/20 | | | 400 | | | | 460 | |
2.625% due 08/15/20 | | | 1,300 | | | | 1,402 | |
2.625% due 11/15/20 | | | 600 | | | | 646 | |
3.625% due 02/15/21 | | | 8,180 | | | | 9,498 | |
2.125% due 08/15/21 | | | 12,820 | | | | 13,149 | |
2.000% due 11/15/21 | | | 600 | | | | 607 | |
4.750% due 02/15/41 | | | 1,100 | | | | 1,516 | |
4.375% due 05/15/41 | | | 5,875 | | | | 7,655 | |
3.750% due 08/15/41 | | | 400 | | | | 470 | |
| | | | | | | | |
| | | | | | | 79,257 | |
| | | | | | | | |
| | |
Total Long-Term Investments
(cost $486,183) | | | | | | | 489,735 | |
| | | | | | | | |
| | |
| Preferred Stocks - 0.1% | | | | | | | | |
| Financial Services - 0.1% | | | | | | | | |
DG Funding Trust (Å)(Æ) | | | 49 | | | | 368 | |
| | | | | | | | |
| | |
Total Preferred Stocks
(cost $516) | | | | | | | 368 | |
| | | | | | | | |
| | |
| | | Notional
Amount
$ | | | | |
| Options Purchased - 0.0% | | | | | | | | |
| (Number of Contracts) | | | | | | | | |
| Swaptions | | | | | | | | |
(Fund Receives/Fund Pays) | | | | | | | | |
USD Three Month LIBOR/USD | | | | | | | | |
1.250% Apr 2012 0.00 Call (1) | | | 2,500 | | | | 14 | |
| | | | | | | | |
| | |
Total Options Purchased
(cost $10) | | | | | | | 14 | |
| | | | | | | | |
| | |
| | | Principal
Amount ($) or Shares | | | | |
| Short-Term Investments - 10.5% | | | | | | | | |
Adam Aircraft Industries, Inc.
Term Loan (Å)(Ø)(Æ)
15.130% due 05/23/12 | | | 49 | | | | — | |
Ally Financial, Inc.
Series UNRE
7.000% due 02/01/12 | | | 400 | | | | 401 | |
Appalachian Power Co.
Series O
5.650% due 08/15/12 | | | 65 | | | | 67 | |
Bank of America Corp.
0.837% due 09/11/12 (Ê) | | | 700 | | | | 680 | |
Barclays Bank PLC
5.450% due 09/12/12 | | | 1,300 | | | | 1,328 | |
Russell Investment Funds
Core Bond Fund
Schedule of Investments, continued — December 31, 2011
Amounts in thousands (except share amounts)
| | | | | | | | |
| | | Principal
Amount ($) or Shares | | | Market
Value
$ | |
| | | | | | | | |
Cellco Partnership / Verizon Wireless
Capital LLC
5.250% due 02/01/12 | | | 700 | | | | 702 | |
Citigroup, Inc.
5.500% due 08/27/12 | | | 200 | | | | 203 | |
5.625% due 08/27/12 | | | 200 | | | | 203 | |
Comcast Cable Holdings LLC
9.800% due 02/01/12 | | | 180 | | | | 181 | |
Comcast Holdings Corp.
10.625% due 07/15/12 | | | 125 | | | | 130 | |
Danske Bank A/S
2.500% due 05/10/12 (Þ) | | | 200 | | | | 201 | |
Erste Abwicklungsanstalt
0.350% due 01/11/12 (ž) | | | 1,000 | | | | 1,000 | |
Federal Home Loan Mortgage Corp.
0.210% due 10/12/12 (Ê) | | | 2,970 | | | | 2,971 | |
Federal National Mortgage Association
0.300% due 09/13/12 (Ê) | | | 1,455 | | | | 1,456 | |
0.315% due 10/18/12 (Ê) | | | 1,485 | | | | 1,486 | |
FIH Erhvervsbank A/S
2.450% due 08/17/12 (Þ) | | | 500 | | | | 505 | |
Ford Motor Credit Co. LLC
7.500% due 08/01/12 (Ñ) | | | 1,000 | | | | 1,032 | |
Fortis Bank Nederland Holding NV
3.000% due 04/17/12 | | | 200 | | | | 260 | |
Governor & Co. of the Bank of Ireland (The)
Series REGs
6.750% due 01/30/12 | | | 50 | | | | 77 | |
Series REGS
2.750% due 03/02/12 | | | 240 | | | | 238 | |
Itau Unibanco Holding SA
1.750% due 01/17/12 (ž) | | | 500 | | | | 500 | |
KCP&L Greater Missouri Operations Co.
11.875% due 07/01/12 | | | 640 | | | | 672 | |
Merrill Lynch & Co., Inc.
6.050% due 08/15/12 | | | 100 | | | | 101 | |
Mirant Mid Atlantic Pass Through
Trust A
Series A
8.625% due 06/30/12 | | | 60 | | | | 61 | |
NGPL PipeCo LLC
6.514% due 12/15/12 (Þ) | | | 200 | | | | 202 | |
Royal Bank of Scotland PLC (The)
2.625% due 05/11/12 (Þ) | | | 300 | | | | 304 | |
Russell U.S. Cash Management Fund | | | 40,489,645 | (¥) | | | 40,490 | |
Societe Financement de l’Economie
Francaise | | | | | | | | |
2.125% due 05/20/12 | | | 100 | | | | 130 | |
Springleaf Finance Corp. | | | | | | | | |
Series MTNI | | | | | | | | |
4.875% due 07/15/12 | | | 100 | | | | 96 | |
| | | | | | | | |
| | | Principal
Amount ($) or Shares | | | Market
Value
$ | |
United States Treasury Bills | | | | | | | | |
Zero coupon due 02/23/12 | | | 15 | | | | 15 | |
United States Treasury Inflation
Indexed Bonds | | | | | | | | |
3.000% due 07/15/12 | | | 1,253 | | | | 1,280 | |
WCI Finance LLC / WEA Finance LLC | | | | | | | | |
5.400% due 10/01/12 (Þ) | | | 75 | | | | 77 | |
| | | | | | | | |
| | |
Total Short-Term Investments
(cost $56,989) | | | | | | | 57,049 | |
| | | | | | | | |
| Repurchase Agreements - 6.2% | | | | | | | | |
Agreement with Bank of America
Securities LLC and State Street Bank
(Tri-Party) of $19,800 dated
December 30, 2011 at 0.25% to be
repurchased at $19,800 on January 3, 2012 collateralized by: $20,262 par
various United States Treasury
Obligations, valued at $20,166. | | | 19,800 | | | | 19,800 | |
Agreement with Morgan Stanley Co.,
Inc. and State Street Bank (Tri-Party)
of $14,200 dated December 30, 2011 at
2.625% to be repurchased at
$14,200 on January 3, 2012
collateralized by: $13,556 par
various United States Treasury
Obligations, valued at $14,505. | | | 14,200 | | | | 14,200 | |
| | | | | | | | |
| | |
Total Repurchase Agreements
(cost $34,000) | | | | | | | 34,000 | |
| | | | | | | | |
| | |
| Other Securities - 1.0% | | | | | | | | |
Russell Investment Funds Liquidating Trust (×) | | | 595,901 | (¥) | | | 606 | |
Russell U.S. Cash Collateral Fund (×) | | | 4,785,662 | (¥) | | | 4,786 | |
| | | | | | | | |
| | |
Total Other Securities
(cost $5,382) | | | | | | | 5,392 | |
| | | | | | | | |
| | |
Total Investments - 107.5%
(identified cost $583,080) | | | | | | | 586,558 | |
| | |
Other Assets and Liabilities,
Net - (7.5%) | | | | | | | (40,950) | |
| | | | | | | | |
| | |
| Net Assets - 100.0% | | | | | | | 545,608 | |
| | | | | | | | |
A portion of the portfolio has been fair valued as of period end.
See accompanying notes which are an integral part of the financial statements.
Russell Investment Funds
Core Bond Fund
Schedule of Investments, continued — December 31, 2011
Amounts in thousands (except contract amounts)
| | | | | | | | | | | | | | | | | | | | |
| Futures Contracts | | Number of
Contracts | | | Notional
Amount | | | Expiration
Date | | | Unrealized
Appreciation
(Depreciation)
$ | |
| | | | | | | | | | | | | | | | | | | | |
| | | | | | | | | | | | | | | | | | | | |
| Long Positions | | | | | | | | | | | | | | | | | | | | |
Eurodollar Futures (CME) | | | 7 | | | | USD | | | | 1,738 | | | | 06/12 | | | | (3) | |
Eurodollar Futures (CME) | | | 11 | | | | USD | | | | 2,729 | | | | 12/12 | | | | 5 | |
Eurodollar Futures (CME) | | | 40 | | | | USD | | | | 9,925 | | | | 03/13 | | | | (7) | |
Eurodollar Futures (CME) | | | 220 | | | | USD | | | | 54,579 | | | | 06/13 | | | | 238 | |
Eurodollar Futures (CME) | | | 79 | | | | USD | | | | 19,594 | | | | 09/13 | | | | 117 | |
Eurodollar Futures (CME) | | | 30 | | | | USD | | | | 7,430 | | | | 03/14 | | | | 91 | |
German Euro Bobl Futures | | | 6 | | | | EUR | | | | 751 | | | | 03/12 | | | | 2 | |
German Euro Bund Futures | | | 2 | | | | EUR | | | | 278 | | | | 03/12 | | | | (3) | |
Ultra Long Term United States Treasury Bond Futures | | | 48 | | | | USD | | | | 7,689 | | | | 03/12 | | | | 143 | |
United States Treasury Bonds | | | 185 | | | | USD | | | | 26,790 | | | | 03/12 | | | | 104 | |
United States Treasury 2 Year Note Futures | | | 41 | | | | USD | | | | 9,043 | | | | 03/12 | | | | 3 | |
United States Treasury 5 Year Note Futures | | | 89 | | | | USD | | | | 10,970 | | | | 03/12 | | | | 48 | |
United States Treasury 10 Year Note Futures | | | 69 | | | | USD | | | | 9,048 | | | | 03/12 | | | | 69 | |
| | | | | |
| Short Positions | | | | | | | | | | | | | | | | | | | | |
Japan Government 10 Year Bond Futures | | | 6 | | | | JPY | | | | 854,460 | | | | 03/12 | | | | (81) | |
United States Treasury 5 Year Note Futures | | | 3 | | | | USD | | | | 370 | | | | 03/12 | | | | (2) | |
| | | | | | | | | | | | | | | | | | | | |
| |
Total Unrealized Appreciation (Depreciation) on Open Futures Contracts (å) | | | | 724 | |
| | | | | | | | | | | | | | | | | | | | |
| | | | | | | | | | | | | | | | | | | | | | | | | | | | |
| Options Written | | Call/Put | | | Number of
Contracts | | | Strike
Price | | | Notional
Amount | | | Expiration
Date | | | Market
Value
$ | |
| | | | | | | | | | | | | | | | | | | | | | | | | | | | |
| | | | | | | | | | | | | | | | | | | | | | | | | | | | |
Eurodollar Futures | | | Put | | | | 18 | | | | 99.00 | | | | USD | | | | 45 | | | | 03/19/12 | | | | (1 | ) |
| | | | | | | | | | | | | | | | | | | | | | | | | | | | |
Inflationary Floor Options | | | Call | | | | 1 | | | | 0.00 | | | | USD | | | | 810 | | | | 11/23/20 | | | | (4 | ) |
Inflationary Floor Options | | | Put | | | | 1 | | | | 0.00 | | | | USD | | | | 1,400 | | | | 03/10/20 | | | | (6 | ) |
Inflationary Floor Options | | | Put | | | | 1 | | | | 0.00 | | | | USD | | | | 1,000 | | | | 03/12/20 | | | | (4 | ) |
Inflationary Floor Options | | | Put | | | | 1 | | | | 0.00 | | | | USD | | | | 5,500 | | | | 04/07/20 | | | | (23 | ) |
Inflationary Floor Options | | | Put | | | | 1 | | | | 0.00 | | | | USD | | | | 300 | | | | 09/29/20 | | | | (1 | ) |
| | | | | | | |
| Swaptions | | | | | | | | | | | | | | | | | | | | | | | | | | | | |
(Fund Receives/Fund Pays) | | | | | | | | | | | | | | | | | | | | | | | | | | | | |
USD 0.920%/USD Three Month LIBOR | | | Put | | | | 2 | | | | 0.00 | | | | | | | | 4,200 | | | | 11/14/12 | | | | (15 | ) |
USD 1.000%/USD Three Month LIBOR | | | Put | | | | 1 | | | | 0.00 | | | | | | | | 700 | | | | 08/13/12 | | | | (4 | ) |
USD 1.000%/USD Three Month LIBOR | | | Put | | | | 1 | | | | 0.00 | | | | | | | | 2,500 | | | | 11/19/12 | | | | (3 | ) |
USD 1.200%/USD Three Month LIBOR | | | Put | | | | 1 | | | | 0.00 | | | | | | | | 1,800 | | | | 07/11/13 | | | | (10 | ) |
USD 1.700%/USD Three Month LIBOR | | | Put | | | | 4 | | | | 0.00 | | | | | | | | 16,100 | | | | 08/13/12 | | | | (107 | ) |
USD 1.750%/USD Three Month LIBOR | | | Put | | | | 1 | | | | 0.00 | | | | | | | | 2,900 | | | | 11/19/12 | | | | (2 | ) |
USD 1.750%/USD Three Month LIBOR | | | Put | | | | 1 | | | | 0.00 | | | | | | | | 13,100 | | | | 07/11/13 | | | | (18 | ) |
USD 2.000%/USD Three Month LIBOR | | | Put | | | | 1 | | | | 0.00 | | | | | | | | 5,000 | | | | 04/30/12 | | | | — | |
USD 2.250%/USD Three Month LIBOR | | | Put | | | | 5 | | | | 0.00 | | | | | | | | 12,300 | | | | 09/24/12 | | | | (5 | ) |
USD 2.250%/USD Three Month LIBOR | | | Put | | | | 1 | | | | 0.00 | | | | | | | | 2,700 | | | | 05/28/13 | | | | (2 | ) |
USD 3.000%/USD Three Month LIBOR | | | Put | | | | 6 | | | | 0.00 | | | | | | | | 17,100 | | | | 06/18/12 | | | | — | |
USD 10.000%/USD Three Month LIBOR | | | Put | | | | 2 | | | | 0.00 | | | | | | | | 10,200 | | | | 07/10/12 | | | | — | |
| | | | | | | | | | | | | | | | | | | | | | | | | | | | |
| | | | | |
Total Liability for Options Written (premiums received $752) | | | | | | | | | | | | | | | | | | | | (205 | ) |
| | | | | | | | | | | | | | | | | | | | | | | | | | | | |
See accompanying notes which are an integral part of the financial statements.
Russell Investment Funds
Core Bond Fund
Schedule of Investments, continued — December 31, 2011
Amounts in thousands
| | | | | | | | | | | | | | | | | | | | | | | | |
| Foreign Currency Exchange Contracts | | | | | | | | | | | | | | | | | | |
Counterparty | | Amount
Sold | | | Amount
Bought | | | Settlement
Date | | | Unrealized
Appreciation
(Depreciation)
$ | |
| | | | | | | | | | | | | | | | | | | | | | | | |
Barclays Bank PLC | | | USD | | | | 10 | | | | MXN | | | | 135 | | | | 03/15/12 | | | | — | |
Barclays Bank PLC | | | CAD | | | | 5 | | | | USD | | | | 5 | | | | 02/09/12 | | | | — | |
Barclays Bank PLC | | | CAD | | | | 84 | | | | USD | | | | 83 | | | | 02/09/12 | | | | 1 | |
Barclays Bank PLC | | | CAD | | | | 102 | | | | USD | | | | 100 | | | | 02/09/12 | | | | — | |
Barclays Bank PLC | | | EUR | | | | 12 | | | | USD | | | | 16 | | | | 01/17/12 | | | | — | |
Barclays Bank PLC | | | EUR | | | | 21 | | | | USD | | | | 28 | | | | 01/17/12 | | | | 1 | |
Barclays Bank PLC | | | EUR | | | | 100 | | | | USD | | | | 134 | | | | 01/17/12 | | | | 6 | |
Barclays Bank PLC | | | EUR | | | | 101 | | | | USD | | | | 136 | | | | 01/17/12 | | | | 5 | |
Barclays Bank PLC | | | EUR | | | | 148 | | | | USD | | | | 197 | | | | 03/21/12 | | | | 5 | |
Barclays Bank PLC | | | GBP | | | | 135 | | | | EUR | | | | 161 | | | | 03/21/12 | | | | (1 | ) |
Barclays Bank PLC | | | NOK | | | | 1,148 | | | | SEK | | | | 1,351 | | | | 03/21/12 | | | | 4 | |
Barclays Bank PLC | | | TWD | | | | 1,489 | | | | USD | | | | 49 | | | | 01/11/12 | | | | (1 | ) |
Barclays Bank PLC | | | ZAR | | | | 12,046 | | | | USD | | | | 1,449 | | | | 02/09/12 | | | | (33 | ) |
Citibank | | | USD | | | | 191 | | | | GBP | | | | 123 | | | | 01/04/12 | | | | — | |
Citibank | | | AUD | | | | 100 | | | | USD | | | | 99 | | | | 02/23/12 | | | | (3 | ) |
Citibank | | | CAD | | | | 100 | | | | USD | | | | 98 | | | | 02/09/12 | | | | — | |
Citibank | | | CAD | | | | 100 | | | | USD | | | | 98 | | | | 02/09/12 | | | | — | |
Citibank | | | CAD | | | | 104 | | | | USD | | | | 100 | | | | 02/09/12 | | | | (2 | ) |
Citibank | | | CAD | | | | 105 | | | | USD | | | | 102 | | | | 02/09/12 | | | | (1 | ) |
Citibank | | | CHF | | | | 254 | | | | USD | | | | 272 | | | | 03/21/12 | | | | — | |
Citibank | | | EUR | | | | 121 | | | | CHF | | | | 148 | | | | 03/21/12 | | | | 1 | |
Citibank | | | EUR | | | | 150 | | | | JPY | | | | 15,331 | | | | 03/21/12 | | | | 5 | |
Citibank | | | EUR | | | | 12 | | | | USD | | | | 16 | | | | 01/17/12 | | | | 1 | |
Citibank | | | EUR | | | | 93 | | | | USD | | | | 124 | | | | 01/17/12 | | | | 4 | |
Citibank | | | EUR | | | | 99 | | | | USD | | | | 129 | | | | 01/17/12 | | | | 1 | |
Citibank | | | EUR | | | | 99 | | | | USD | | | | 129 | | | | 01/17/12 | | | | 1 | |
Citibank | | | EUR | | | | 200 | | | | USD | | | | 260 | | | | 01/17/12 | | | | 1 | |
Citibank | | | JPY | | | | 15,224 | | | | EUR | | | | 150 | | | | 03/21/12 | | | | (4 | ) |
Citibank | | | NOK | | | | 777 | | | | USD | | | | 129 | | | | 03/21/12 | | | | — | |
Credit Suisse First Boston | | | USD | | | | 198 | | | | EUR | | | | 152 | | | | 03/21/12 | | | | (1 | ) |
Credit Suisse First Boston | | | CHF | | | | 185 | | | | EUR | | | | 151 | | | | 03/21/12 | | | | (1 | ) |
Credit Suisse First Boston | | | EUR | | | | 1,977 | | | | USD | | | | 2,641 | | | | 01/04/12 | | | | 83 | |
Credit Suisse First Boston | | | EUR | | | | 1,976 | | | | USD | | | | 2,720 | | | | 01/17/12 | | | | 163 | |
Deutsche Bank AG | | | USD | | | | 2,041 | | | | CNY | | | | 12,944 | | | | 02/13/12 | | | | 14 | |
Deutsche Bank AG | | | USD | | | | 197 | | | | EUR | | | | 152 | | | | 03/21/12 | | | | — | |
Deutsche Bank AG | | | USD | | | | 79 | | | | GBP | | | | 51 | | | | 01/03/12 | | | | — | |
Deutsche Bank AG | | | USD | | | | 173 | | | | NZD | | | | 224 | | | | 03/21/12 | | | | 1 | |
Deutsche Bank AG | | | CAD | | | | 98 | | | | USD | | | | 95 | | | | 02/09/12 | | | | (1 | ) |
Deutsche Bank AG | | | CAD | | | | 102 | | | | USD | | | | 98 | | | | 02/09/12 | | | | (2 | ) |
Deutsche Bank AG | | | CAD | | | | 134 | | | | USD | | | | 131 | | | | 02/09/12 | | | | — | |
Deutsche Bank AG | | | CHF | | | | 148 | | | | EUR | | | | 121 | | | | 03/21/12 | | | | (1 | ) |
Deutsche Bank AG | | | CHF | | | | 187 | | | | EUR | | | | 152 | | | | 03/21/12 | | | | (2 | ) |
Deutsche Bank AG | | | EUR | | | | 148 | | | | CAD | | | | 201 | | | | 03/21/12 | | | | 5 | |
Deutsche Bank AG | | | EUR | | | | 193 | | | | USD | | | | 253 | | | | 01/17/12 | | | | 3 | |
Deutsche Bank AG | | | EUR | | | | 199 | | | | USD | | | | 261 | | | | 01/17/12 | | | | 3 | |
Deutsche Bank AG | | | EUR | | | | 200 | | | | USD | | | | 270 | | | | 01/17/12 | | | | 11 | |
Deutsche Bank AG | | | EUR | | | | 307 | | | | USD | | | | 401 | | | | 01/17/12 | | | | 4 | |
Deutsche Bank AG | | | GBP | | | | 51 | | | | USD | | | | 78 | | | | 01/03/12 | | | | (1 | ) |
Deutsche Bank AG | | | GBP | | | | 98 | | | | USD | | | | 152 | | | | 03/12/12 | | | | — | |
Deutsche Bank AG | | | MXN | | | | 4,856 | | | | USD | | | | 339 | | | | 01/30/12 | | | | (9 | ) |
Deutsche Bank AG | | | SEK | | | | 1,367 | | | | EUR | | | | 152 | | | | 03/21/12 | | | | (1 | ) |
Goldman Sachs | | | USD | | | | 2,594 | | | | EUR | | | | 1,977 | | | | 01/04/12 | | | | (34 | ) |
See accompanying notes which are an integral part of the financial statements.
Russell Investment Funds
Core Bond Fund
Schedule of Investments, continued — December 31, 2011
Amounts in thousands
| | | | | | | | | | | | | | | | | | | | | | | | |
| Foreign Currency Exchange Contracts | | | | | | | | | | | | | | | | | | |
Counterparty | | Amount
Sold | | | Amount
Bought | | | Settlement
Date | | | Unrealized
Appreciation
(Depreciation)
$ | |
| | | | | | | | | | | | | | | | | | | | | | | | |
Goldman Sachs | | | EUR | | | | 200 | | | | USD | | | | 262 | | | | 01/17/12 | | | | 3 | |
Goldman Sachs | | | EUR | | | | 295 | | | | USD | | | | 395 | | | | 01/17/12 | | | | 14 | |
Goldman Sachs | | | EUR | | | | 1,977 | | | | USD | | | | 2,594 | | | | 02/02/12 | | | | 36 | |
HSBC Bank PLC | | | USD | | | | 368 | | | | BRL | | | | 690 | | | | 01/04/12 | | | | 2 | |
HSBC Bank PLC | | | USD | | | | 415 | | | | JPY | | | | 32,201 | | | | 03/21/12 | | | | 4 | |
HSBC Bank PLC | | | BRL | | | | 181 | | | | USD | | | | 100 | | | | 01/04/12 | | | | 3 | |
HSBC Bank PLC | | | BRL | | | | 186 | | | | USD | | | | 100 | | | | 01/04/12 | | | | — | |
HSBC Bank PLC | | | BRL | | | | 323 | | | | USD | | | | 174 | | | | 01/04/12 | | | | 1 | |
HSBC Bank PLC | | | EUR | | | | 151 | | | | USD | | | | 197 | | | | 03/21/12 | | | | 1 | |
HSBC Bank PLC | | | SEK | | | | 1,190 | | | | USD | | | | 173 | | | | 03/21/12 | | | | 1 | |
HSBC Bank PLC | | | SEK | | | | 3,598 | | | | USD | | | | 513 | | | | 03/21/12 | | | | (8 | ) |
HSBC Bank PLC | | | SEK | | | | 4,723 | | | | USD | | | | 692 | | | | 03/21/12 | | | | 8 | |
JP Morgan Chase Bank | | | USD | | | | 897 | | | | BRL | | | | 1,682 | | | | 01/04/12 | | | | 5 | |
JP Morgan Chase Bank | | | USD | | | | 703 | | | | BRL | | | | 1,329 | | | | 03/02/12 | | | | — | |
JP Morgan Chase Bank | | | USD | | | | 49 | | | | EUR | | | | 38 | | | | 01/20/12 | | | | — | |
JP Morgan Chase Bank | | | USD | | | | 196 | | | | EUR | | | | 150 | | | | 03/21/12 | | | | (2 | ) |
JP Morgan Chase Bank | | | USD | | | | 197 | | | | EUR | | | | 151 | | | | 03/21/12 | | | | (1 | ) |
JP Morgan Chase Bank | | | USD | | | | 198 | | | | EUR | | | | 149 | | | | 03/21/12 | | | | (5 | ) |
JP Morgan Chase Bank | | | USD | | | | 198 | | | | EUR | | | | 150 | | | | 03/21/12 | | | | (4 | ) |
JP Morgan Chase Bank | | | BRL | | | | 353 | | | | USD | | | | 200 | | | | 01/04/12 | | | | 10 | |
JP Morgan Chase Bank | | | BRL | | | | 1,329 | | | | USD | | | | 711 | | | | 01/04/12 | | | | (1 | ) |
JP Morgan Chase Bank | | | CAD | | | | 80 | | | | USD | | | | 79 | | | | 01/13/12 | | | | 1 | |
JP Morgan Chase Bank | | | CAD | | | | 3 | | | | USD | | | | 3 | | | | 02/09/12 | | | | — | |
JP Morgan Chase Bank | | | CAD | | | | 18 | | | | USD | | | | 18 | | | | 02/09/12 | | | | — | |
JP Morgan Chase Bank | | | CAD | | | | 84 | | | | USD | | | | 82 | | | | 02/09/12 | | | | — | |
JP Morgan Chase Bank | | | CAD | | | | 91 | | | | USD | | | | 89 | | | | 02/09/12 | | | | — | |
JP Morgan Chase Bank | | | CAD | | | | 100 | | | | USD | | | | 97 | | | | 02/09/12 | | | | (1 | ) |
JP Morgan Chase Bank | | | CAD | | | | 310 | | | | USD | | | | 300 | | | | 02/09/12 | | | | (4 | ) |
JP Morgan Chase Bank | | | CHF | | | | 187 | | | | EUR | | | | 152 | | | | 03/21/12 | | | | (2 | ) |
JP Morgan Chase Bank | | | EUR | | | | 79 | | | | USD | | | | 106 | | | | 01/17/12 | | | | 4 | |
JP Morgan Chase Bank | | | EUR | | | | 92 | | | | USD | | | | 120 | | | | 01/17/12 | | | | 1 | |
JP Morgan Chase Bank | | | EUR | | | | 402 | | | | USD | | | | 543 | | | | 01/17/12 | | | | 23 | |
JP Morgan Chase Bank | | | EUR | | | | 151 | | | | USD | | | | 198 | | | | 03/21/12 | | | | 2 | |
JP Morgan Chase Bank | | | EUR | | | | 302 | | | | USD | | | | 395 | | | | 03/21/12 | | | | 4 | |
JP Morgan Chase Bank | | | EUR | | | | 405 | | | | USD | | | | 527 | | | | 03/21/12 | | | | 3 | |
JP Morgan Chase Bank | | | GBP | | | | 745 | | | | USD | | | | 1,168 | | | | 03/12/12 | | | | 12 | |
Morgan Stanley & Co., Inc. | | | USD | | | | 128 | | | | BRL | | | | 240 | | | | 01/04/12 | | | | 1 | |
Morgan Stanley & Co., Inc. | | | USD | | | | 1,706 | | | | BRL | | | | 3,033 | | | | 01/04/12 | | | | (79 | ) |
Morgan Stanley & Co., Inc. | | | USD | | | | 197 | | | | EUR | | | | 149 | | | | 03/21/12 | | | | (4 | ) |
Morgan Stanley & Co., Inc. | | | BRL | | | | 240 | | | | USD | | | | 130 | | | | 01/04/12 | | | | 1 | |
Morgan Stanley & Co., Inc. | | | BRL | | | | 3,033 | | | | USD | | | | 1,617 | | | | 01/04/12 | | | | (9 | ) |
Morgan Stanley & Co., Inc. | | | CAD | | | | 103 | | | | USD | | | | 100 | | | | 02/09/12 | | | | (1 | ) |
Morgan Stanley & Co., Inc. | | | EUR | | | | 94 | | | | USD | | | | 123 | | | | 01/17/12 | | | | 1 | |
Morgan Stanley & Co., Inc. | | | EUR | | | | 100 | | | | USD | | | | 131 | | | | 01/17/12 | | | | 1 | |
Morgan Stanley & Co., Inc. | | | EUR | | | | 152 | | | | USD | | | | 198 | | | | 03/21/12 | | | | 1 | |
Morgan Stanley & Co., Inc. | | | TWD | | | | 1,529 | | | | USD | | | | 50 | | | | 01/11/12 | | | | — | |
Royal Bank of Canada | | | USD | | | | 197 | | | | CAD | | | | 201 | | | | 03/21/12 | | | | — | |
Royal Bank of Canada | | | USD | | | | 396 | | | | CAD | | | | 406 | | | | 03/21/12 | | | | 2 | |
Royal Bank of Canada | | | USD | | | | 193 | | | | GBP | | | | 123 | | | | 02/02/12 | | | | (2 | ) |
Royal Bank of Canada | | | BRL | | | | 1,144 | | | | USD | | | | 619 | | | | 01/18/12 | | | | 8 | |
Royal Bank of Canada | | | CAD | | | | 202 | | | | EUR | | | | 152 | | | | 03/21/12 | | | | (1 | ) |
Royal Bank of Canada | | | CAD | | | | 101 | | | | USD | | | | 99 | | | | 02/09/12 | | | | — | |
See accompanying notes which are an integral part of the financial statements.
Russell Investment Funds
Core Bond Fund
Schedule of Investments, continued — December 31, 2011
Amounts in thousands
| | | | | | | | | | | | | | | | | | | | | | | | |
| Foreign Currency Exchange Contracts | | | | | | | | | | | | | | | | | | |
Counterparty | | Amount
Sold | | | Amount
Bought | | | Settlement
Date | | | Unrealized
Appreciation
(Depreciation)
$ | |
| | | | | | | | | | | | | | | | | | | | | | | | |
Royal Bank of Canada | | | CAD | | | | 103 | | | | USD | | | | 100 | | | | 02/09/12 | | | | (2 | ) |
Royal Bank of Canada | | | CAD | | | | 104 | | | | USD | | | | 101 | | | | 02/09/12 | | | | (1 | ) |
Royal Bank of Canada | | | CAD | | | | 80 | | | | USD | | | | 78 | | | | 03/21/12 | | | | (1 | ) |
Royal Bank of Canada | | | EUR | | | | 151 | | | | CAD | | | | 204 | | | | 03/21/12 | | | | 5 | |
Royal Bank of Canada | | | EUR | | | | 96 | | | | USD | | | | 128 | | | | 01/17/12 | | | | 4 | |
Royal Bank of Canada | | | EUR | | | | 98 | | | | USD | | | | 129 | | | | 01/17/12 | | | | 3 | |
Royal Bank of Canada | | | EUR | | | | 100 | | | | USD | | | | 134 | | | | 01/17/12 | | | | 4 | |
Royal Bank of Canada | | | GBP | | | | 123 | | | | USD | | | | 193 | | | | 01/04/12 | | | | 2 | |
Royal Bank of Scotland PLC | | | EUR | | | | 302 | | | | USD | | | | 395 | | | | 03/21/12 | | | | 4 | |
Royal Bank of Scotland PLC | | | SEK | | | | 2,657 | | | | EUR | | | | 293 | | | | 03/21/12 | | | | (5 | ) |
State Street Bank & Trust Co. | | | EUR | | | | 300 | | | | CAD | | | | 405 | | | | 03/21/12 | | | | 8 | |
State Street Bank & Trust Co. | | | EUR | | | | 589 | | | | USD | | | | 766 | | | | 03/21/12 | | | | 4 | |
State Street Bank & Trust Co. | | | GBP | | | | 533 | | | | USD | | | | 831 | | | | 03/21/12 | | | | 3 | |
State Street Bank & Trust Co. | | | NZD | | | | 1,010 | | | | USD | | | | 771 | | | | 03/21/12 | | | | (11 | ) |
UBS AG | | | USD | | | | 224 | | | | BRL | | | | 421 | | | | 01/04/12 | | | | 1 | |
UBS AG | | | USD | | | | 197 | | | | EUR | | | | 149 | | | | 03/21/12 | | | | (4 | ) |
UBS AG | | | USD | | | | 199 | | | | EUR | | | | 152 | | | | 03/21/12 | | | | (2 | ) |
UBS AG | | | USD | | | | 100 | | | | TWD | | | | 3,017 | | | | 01/11/12 | | | | — | |
UBS AG | | | BRL | | | | 180 | | | | USD | | | | 100 | | | | 01/04/12 | | | | 3 | |
UBS AG | | | BRL | | | | 240 | | | | USD | | | | 130 | | | | 01/04/12 | | | | 1 | |
UBS AG | | | CAD | | | | 200 | | | | EUR | | | | 147 | | | | 03/21/12 | | | | (6 | ) |
UBS AG | | | CAD | | | | 103 | | | | USD | | | | 99 | | | | 02/09/12 | | | | (2 | ) |
UBS AG | | | CHF | | | | 219 | | | | USD | | | | 236 | | | | 03/21/12 | | | | 3 | |
UBS AG | | | EUR | | | | 21 | | | | USD | | | | 27 | | | | 01/17/12 | | | | — | |
UBS AG | | | EUR | | | | 184 | | | | USD | | | | 249 | | | | 01/17/12 | | | | 11 | |
UBS AG | | | EUR | | | | 204 | | | | USD | | | | 273 | | | | 01/17/12 | | | | 9 | |
UBS AG | | | EUR | | | | 297 | | | | USD | | | | 387 | | | | 01/17/12 | | | | 3 | |
Westpac Banking Corp. | | | USD | | | | 189 | | | | NZD | | | | 253 | | | | 03/21/12 | | | | 7 | |
Westpac Banking Corp. | | | AUD | | | | 796 | | | | USD | | | | 782 | | | | 03/21/12 | | | | (25 | ) |
| | | | | | | | | | | | | | | | | | | | | | | | |
| |
Total Unrealized Appreciation (Depreciation) on Open Foreign Currency Exchange Contracts | | | | 270 | |
| | | | | | | | | | | | | | | | | | | | | | | | |
See accompanying notes which are an integral part of the financial statements.
Russell Investment Funds
Core Bond Fund
Schedule of Investments, continued — December 31, 2011
Amounts in thousands
| | | | | | | | | | | | | | | | |
| Interest Rate Swap Contracts | | | | | | | | | | | | | | |
Counterparty | | Notional
Amount | | | Fund Receives | | Fund Pays | | Termination
Date | | Market
Value
$ | |
| | | | | | | | | | | | | | | | |
Bank of America | | USD | | | 3,100 | | | Three Month LIBOR | | 2.000% | | 06/20/19 | | | (42 | ) |
Barclays Bank PLC | | BRL | | | 100 | | | 10.830% | | Brazil Interbank Deposit Rate | | 01/02/14 | | | — | |
Barclays Bank PLC | | EUR | | | 4,820 | | | Six Month EURIBOR | | 1.448% | | 12/27/14 | | | (15 | ) |
Barclays Bank PLC | | MXN | | | 700 | | | 5.600% | | Mexico Interbank 28 Day Deposit Rate | | 09/06/16 | | | — | |
Barclays Bank PLC | | EUR | | | 200 | | | 2.500% | | Six Month EURIBOR | | 09/21/18 | | | 8 | |
Barclays Bank PLC | | EUR | | | 5,170 | | | 2.430% | | Six Month EURIBOR | | 12/27/19 | | | 55 | |
Barclays Bank PLC | | EUR | | | 500 | | | 3.000% | | Six Month EURIBOR | | 09/21/21 | | | 39 | |
Barclays Bank PLC | | EUR | | | 500 | | | 2.500% | | Six Month EURIBOR | | 03/21/22 | | | 5 | |
Barclays Bank PLC | | EUR | | | 2,020 | | | Six Month EURIBOR | | 2.868% | | 12/27/27 | | | (29 | ) |
Barclays Bank PLC | | USD | | | 1,000 | | | Three Month LIBOR | | 2.750% | | 06/20/42 | | | (21 | ) |
BNP Paribas | | BRL | | | 200 | | | 12.110% | | Brazil Interbank Deposit Rate | | 01/02/14 | | | 5 | |
BNP Paribas | | USD | | | 1,000 | | | 1.000% | | Federal Fund Effective Rate - 1 Year | | 09/19/14 | | | 15 | |
Citibank | | AUD | | | 100 | | | 5.000% | | Six Month BBSW | | 06/15/17 | | | 3 | |
Citibank | | EUR | | | 5,480 | | | 2.623% | | Six Month EURIBOR | | 10/04/18 | | | 108 | |
Citibank | | AUD | | | 200 | | | 5.250% | | Six Month BBSW | | 06/15/22 | | | 10 | |
Citibank | | EUR | | | 2,980 | | | Six Month EURIBOR | | 2.983% | | 10/04/23 | | | (73 | ) |
Citibank | | USD | | | 600 | | | Three Month LIBOR | | 2.750% | | 06/20/27 | | | (21 | ) |
Credit Suisse First Boston | | BRL | | | 300 | | | 12.480% | | Brazil Interbank Deposit Rate | | 01/02/13 | | | 6 | |
Deutsche Bank | | USD | | | 6,000 | | | Three Month LIBOR | | 0.500% | | 09/30/13 | | | 22 | |
Deutsche Bank | | USD | | | 6,000 | | | 0.500% | | Three Month LIBOR | | 09/30/13 | | | (22 | ) |
Deutsche Bank | | AUD | | | 100 | | | 5.000% | | Six Month BBSW | | 06/15/17 | | | 3 | |
Deutsche Bank | | USD | | | 800 | | | Three Month LIBOR | | 2.500% | | 06/20/22 | | | (25 | ) |
Deutsche Bank | | USD | | | 1,100 | | | Three Month LIBOR | | 2.500% | | 06/20/22 | | | (35 | ) |
Goldman Sachs | | BRL | | | 1,200 | | | 11.890% | | Brazil Interbank Deposit Rate | | 01/02/13 | | | 20 | |
Goldman Sachs | | BRL | | | 400 | | | 12.650% | | Brazil Interbank Deposit Rate | | 01/02/14 | | | 13 | |
Goldman Sachs | | USD | | | 500 | | | 0.500% | | Federal Fund Effective Rate - 1 Year | | 09/19/14 | | | 2 | |
Goldman Sachs | | AUD | | | 1,200 | | | 5.000% | | Six Month BBSW | | 06/15/17 | | | 36 | |
HSBC | | BRL | | | 200 | | | 11.510% | | Brazil Interbank Deposit Rate | | 01/02/13 | | | 1 | |
HSBC | | BRL | | | 200 | | | 10.450% | | Brazil Interbank Deposit Rate | | 01/02/13 | | | — | |
HSBC | | BRL | | | 1,200 | | | 11.890% | | Brazil Interbank Deposit Rate | | 01/02/13 | | | 20 | |
HSBC | | BRL | | | 100 | | | 12.540% | | Brazil Interbank Deposit Rate | | 01/02/14 | | | 3 | |
HSBC | | BRL | | | 300 | | | 10.530% | | Brazil Interbank Deposit Rate | | 01/02/14 | | | — | |
HSBC | | BRL | | | 800 | | | 11.530% | | Brazil Interbank Deposit Rate | | 01/02/14 | | | 8 | |
HSBC | | MXN | | | 1,300 | | | 5.600% | | Mexico Interbank 28 Day Deposit Rate | | 09/06/16 | | | (1 | ) |
JPMorgan | | BRL | | | 500 | | | 12.170% | | Brazil Interbank Deposit Rate | | 01/02/13 | | | 10 | |
JPMorgan | | EUR | | | 13,000 | | | Six Month EURIBOR | | 1.870% | | 09/30/14 | | | (82 | ) |
JPMorgan | | EUR | | | 8,800 | | | 2.355% | | Six Month EURIBOR | | 09/30/16 | | | 150 | |
JPMorgan | | EUR | | | 2,000 | | | Six Month EURIBOR | | 2.816% | | 09/30/20 | | | (48 | ) |
JPMorgan | | USD | | | 600 | | | Three Month LIBOR | | 2.750% | | 06/20/42 | | | (13 | ) |
Merrill Lynch | | BRL | | | 700 | | | 11.980% | | Brazil Interbank Deposit Rate | | 01/02/12 | | | 15 | |
Merrill Lynch | | BRL | | | 800 | | | 12.540% | | Brazil Interbank Deposit Rate | | 01/02/12 | | | 25 | |
Morgan Stanley | | BRL | | | 100 | | | 12.590% | | Brazil Interbank Deposit Rate | | 01/02/13 | | | 2 | |
Morgan Stanley | | BRL | | | 700 | | | 10.455% | | Brazil Interbank Deposit Rate | | 01/02/13 | | | 1 | |
Morgan Stanley | | USD | | | 2,500 | | | 0.500% | | Federal Fund Effective Rate - 1 Year | | 09/19/13 | | | 8 | |
Morgan Stanley | | BRL | | | 200 | | | 11.670% | | Brazil Interbank Deposit Rate | | 01/02/14 | | | 2 | |
Morgan Stanley | | BRL | | | 400 | | | 12.510% | | Brazil Interbank Deposit Rate | | 01/02/14 | | | 12 | |
Morgan Stanley | | BRL | | | 800 | | | 10.580% | | Brazil Interbank Deposit Rate | | 01/02/14 | | | 1 | |
| | | | | | | | | | | | | | | | |
Morgan Stanley | | MXN | | | 500 | | | 6.350% | | Mexico Interbank 28 Day Deposit Rate | | 06/02/21 | | | (1 | ) |
Morgan Stanley/Citibank | | EUR | | | 900 | | | 2.500% | | Six Month EURIBOR | | 03/21/22 | | | 10 | |
Morgan Stanley | | USD | | | 825 | | | Three Month LIBOR | | 3.925% | | 05/15/41 | | | (232 | ) |
Morgan Stanley | | USD | | | 1,500 | | | Three Month LIBOR | | 2.750% | | 06/20/42 | | | (32 | ) |
See accompanying notes which are an integral part of the financial statements.
Russell Investment Funds
Core Bond Fund
Schedule of Investments, continued — December 31, 2011
Amounts in thousands
| | | | | | | | | | | | | | | | | | |
| Interest Rate Swap Contracts | | | | | | | | | | | | | | | |
Counterparty | | Notional
Amount | | | Fund Receives | | Fund Pays | | Termination
Date | | | Market
Value
$ | |
Royal Bank of Scotland | | AUD | | | 100 | | | 5.000% | | Six Month BBSW | | | 06/15/17 | | | | 3 | |
Royal Bank of Scotland | | CAD | | | 1,500 | | | 5.700% | | Canadian Dealer Offer Rate | | | 12/18/24 | | | | 115 | |
UBS | | BRL | | | 100 | | | 11.140% | | Brazil Interbank Deposit Rate | | | 01/02/12 | | | | 1 | |
UBS | | BRL | | | 100 | | | 10.605% | | Brazil Interbank Deposit Rate | | | 01/02/13 | | | | — | |
UBS | | BRL | | | 300 | | | 12.070% | | Brazil Interbank Deposit Rate | | | 01/02/13 | | | | 6 | |
UBS | | BRL | | | 100 | | | 10.990% | | Brazil Interbank Deposit Rate | | | 01/02/14 | | | | — | |
UBS | | BRL | | | 200 | | | 12.250% | | Brazil Interbank Deposit Rate | | | 01/02/14 | | | | 5 | |
UBS | | BRL | | | 200 | | | 10.770% | | Brazil Interbank Deposit Rate | | | 01/02/14 | | | | 1 | |
UBS | | BRL | | | 300 | | | 11.760% | | Brazil Interbank Deposit Rate | | | 01/02/14 | | | | 3 | |
UBS | | EUR | | | 1,310 | | | Six Month EURIBOR | | 1.940% | | | 08/26/14 | | | | (10 | ) |
UBS | | EUR | | | 890 | | | 2.518% | | Six Month EURIBOR | | | 08/26/16 | | | | 22 | |
UBS | | EUR | | | 200 | | | Six Month EURIBOR | | 3.070% | | | 08/26/20 | | | | (9 | ) |
| | | | | | | | | | | | | | | | | | |
| | |
Total Market Value on Open Interest Rate Swap Contracts Premiums Paid (Received) - ($47) | | | | | | | 63 | |
| | | | | | | | | | | | | | | | | | |
| | | | | | | | | | | | | | | | | | | | | | |
| Credit Default Swap Contracts | | | | | | | | | | | | | | | | | | |
| Corporate Issues | |
Reference
Entity | | Counterparty | | Implied
Credit
Spread | | Notional
Amount | | | Fund (Pays)/
Receives
Fixed Rate | | | Termination
Date | | | Market
Value
$ | |
| | | | | | | | | | | | | | | | | | | | | | |
D.R. Horton, Inc. | | Deutsche Bank | | 2.379% | | USD | | | 80 | | | | (1.000% | ) | | | 09/20/16 | | | | 5 | |
D.R. Horton, Inc. | | Goldman Sachs | | 2.379% | | USD | | | 80 | | | | (1.000% | ) | | | 09/20/16 | | | | 5 | |
GE Capital Corp. | | Citibank | | 1.936% | | USD | | | 200 | | | | 4.000% | | | | 12/20/13 | | | | 8 | |
GE Capital Corp. | | Deutsche Bank | | 1.936% | | USD | | | 100 | | | | 4.900% | | | | 12/20/13 | | | | 6 | |
Pulte Homes, Inc. | | JPMorgan | | 3.680% | | USD | | | 1,000 | | | | (3.870% | ) | | | 03/20/14 | | | | (5 | ) |
| | | | | | | | | | | | | | | | | | | | | | |
| | | |
Total Market Value on Open Corporate Issues Premiums Paid (Received) - $10 | | | | | | | | | | | | 19 | |
| | | | | | | | | | | | | | | | | | | | | | |
See accompanying notes which are an integral part of the financial statements.
Russell Investment Funds
Core Bond Fund
Schedule of Investments, continued — December 31, 2011
Amounts in thousands
| | | | | | | | | | | | | | | | | | | | | | |
| Credit Default Swap Contracts | | | | | | | | | | | | | | | | | | |
| Credit Indices | | | | | | | | | | | | | | | | | | |
Reference
Entity | | Counterparty | | | | Notional
Amount | | | Fund (Pays)/
Receives
Fixed Rate | | | Termination
Date | | | Market
Value
$ | |
| | | | | | | | | | | | | | | | | | | | | | |
CMBX AJ Index | | Barclays Bank PLC | | | | USD | | | 205 | | | | (0.840% | ) | | | 10/12/52 | | | | 38 | |
CMBX AJ Index | | Barclays Bank PLC | | | | USD | | | 360 | | | | (0.840% | ) | | | 10/12/52 | | | | 67 | |
CMBX AJ Index | | Credit Suisse First Boston | | | | USD | | | 930 | | | | (0.840% | ) | | | 10/12/52 | | | | 172 | |
Dow Jones CDX Index | | Bank of America | | | | USD | | | 3,500 | | | | (1.000% | ) | | | 06/20/14 | | | | (8 | ) |
Dow Jones CDX Index | | Bank of America | | | | USD | | | 3,500 | | | | 1.000% | | | | 06/20/16 | | | | (24 | ) |
Dow Jones CDX Index | | Barclays Bank PLC | | | | USD | | | 400 | | | | 5.000% | | | | 12/20/15 | | | | 32 | |
Dow Jones CDX Index | | Barclays Bank PLC | | | | USD | | | 1,200 | | | | 5.000% | | | | 06/20/15 | | | | 91 | |
Dow Jones CDX Index | | Citibank | | | | USD | | | 200 | | | | 5.000% | | | | 12/20/15 | | | | 16 | |
Dow Jones CDX Index | | Citibank | | | | USD | | | 956 | | | | (5.000% | ) | | | 12/20/16 | | | | 66 | |
Dow Jones CDX Index | | Deutsche Bank | | | | USD | | | 637 | | | | (5.000% | ) | | | 12/20/16 | | | | 44 | |
Dow Jones CDX Index | | Deutsche Bank | | | | USD | | | 900 | | | | 5.000% | | | | 06/20/15 | | | | 68 | |
Dow Jones CDX Index | | Deutsche Bank | | | | USD | | | 2,800 | | | | (1.000% | ) | | | 06/20/14 | | | | (6 | ) |
Dow Jones CDX Index | | Deutsche Bank | | | | USD | | | 123 | | | | (5.000% | ) | | | 12/20/16 | | | | 8 | |
Dow Jones CDX Index | | Deutsche Bank | | | | USD | | | 772 | | | | 0.708% | | | | 12/20/12 | | | | 5 | |
Dow Jones CDX Index | | Deutsche Bank | | | | USD | | | 1,450 | | | | 1.000% | | | | 06/20/16 | | | | (10 | ) |
Dow Jones CDX Index | | Deutsche Bank | | | | USD | | | 200 | | | | 5.000% | | | | 12/20/15 | | | | 16 | |
Dow Jones CDX Index | | JPMorgan | | | | USD | | | 686 | | | | (5.000% | ) | | | 12/20/16 | | | | 47 | |
Dow Jones CDX Index | | JPMorgan | | | | USD | | | 386 | | | | 0.553% | | | | 12/20/17 | | | | 5 | |
Dow Jones CDX Index | | JPMorgan | | | | USD | | | 3,799 | | | | (1.000% | ) | | | 06/20/14 | | | | (9 | ) |
Dow Jones CDX Index | | JPMorgan | | | | USD | | | 3,700 | | | | (1.000% | ) | | | 06/20/14 | | | | (8 | ) |
Dow Jones CDX Index | | JPMorgan | | | | USD | | | 319 | | | | (5.000% | ) | | | 12/20/16 | | | | 22 | |
Dow Jones CDX Index | | JPMorgan | | | | USD | | | 2,400 | | | | 1.000% | | | | 06/20/16 | | | | (17 | ) |
Dow Jones CDX Index | | JPMorgan | | | | USD | | | 1,100 | | | | 1.000% | | | | 06/20/16 | | | | (8 | ) |
Dow Jones CDX Index | | Morgan Stanley/Barclays Bank PLC/Credit Suisse | | | | USD | | | 54,099 | | | | (1.000% | ) | | | 12/20/16 | | | | 491 | |
Dow Jones CDX Index | | Morgan Stanley | | | | USD | | | 800 | | | | 5.000% | | | | 06/20/15 | | | | 61 | |
Dow Jones CDX Index | | Morgan Stanley | | | | USD | | | 300 | | | | 5.000% | | | | 12/20/15 | | | | 24 | |
Dow Jones CDX Index | | Goldman Sachs | | | | USD | | | 193 | | | | 0.548% | | | | 12/20/17 | | | | 3 | |
iTraxx SovX Western Europe Series 6 | | Citibank | | | | USD | | | 100 | | | | (1.000% | ) | | | 12/20/16 | | | | 11 | |
iTraxx SovX Western Europe Series 6 | | Deutsche Bank | | | | USD | | | 160 | | | | (1.000% | ) | | | 12/20/16 | | | | 17 | |
iTraxx SovX Western Europe Series 6 | | Deutsche Bank | | | | USD | | | 240 | | | | (1.000% | ) | | | 12/20/16 | | | | 26 | |
iTraxx SovX Western Europe Series 6 | | HSBC | | | | USD | | | 150 | | | | (1.000% | ) | | | 12/20/16 | | | | 16 | |
iTraxx SovX Western Europe Series 6 | | HSBC | | | | USD | | | 140 | | | | (1.000% | ) | | | 12/20/16 | | | | 15 | |
iTraxx SovX Western Europe Series 6 | | HSBC | | | | USD | | | 410 | | | | (1.000% | ) | | | 12/20/16 | | | | 44 | |
iTraxx SovX Western Europe Series 6 | | HSBC | | | | USD | | | 250 | | | | (1.000% | ) | | | 12/20/16 | | | | 27 | |
iTraxx SovX Western Europe Series 6 | | Royal Bank of Scotland | | | | USD | | | 140 | | | | (1.000% | ) | | | 12/20/16 | | | | 15 | |
iTraxx SovX Western Europe Series 6 | | UBS | | | | USD | | | 230 | | | | (1.000% | ) | | | 12/20/16 | | | | 25 | |
iTraxx SovX Western Europe Series 6 | | UBS | | | | USD | | | 270 | | | | (1.000% | ) | | | 12/20/16 | | | | 29 | |
| | | | | | | | | | | | | | | | | | | | | | |
| | |
Total Market Value on Open Credit Indices Premiums Paid (Received) - $2,227 | | | | | | | | 1,411 | |
| | | | | | | | | | | | | | | | | | | | | | |
| | | | | | | |
| Sovereign Issues | | | | | | | | | | | | | | | | | | |
Reference
Entity | | Counterparty | | Implied Credit
Spread | | Notional
Amount | | | Fund (Pays)/
Receives
Fixed Rate | | | Termination
Date | | | Market
Value
$ | |
| | | | | | | | | | | | | | | | | | | | | | |
Brazil Government International Bond | | Barclays Bank PLC | | 1.306% | | USD | | | 500 | | | | 1.000% | | | | 06/20/15 | | | | (5 | ) |
Brazil Government International Bond | | Deutsche Bank | | 1.306% | | USD | | | 1,000 | | | | 1.000% | | | | 06/20/15 | | | | (10 | ) |
Brazil Government International Bond | | Goldman Sachs | | 1.306% | | USD | | | 500 | | | | 1.000% | | | | 06/20/15 | | | | (5 | ) |
Brazil Government International Bond | | HSBC | | 1.350% | | USD | | | 100 | | | | 1.000% | | | | 09/20/15 | | | | (1 | ) |
Brazil Government International Bond | | JPMorgan | | 1.350% | | USD | | | 100 | | | | 1.000% | | | | 09/20/15 | | | | (1 | ) |
Brazil Government International Bond | | Barclays Bank PLC | | 1.388% | | USD | | | 700 | | | | 1.000% | | | | 12/20/15 | | | | (10 | ) |
Brazil Government International Bond | | Bank of America | | 1.422% | | USD | | | 500 | | | | 1.000% | | | | 03/20/16 | | | | (8 | ) |
See accompanying notes which are an integral part of the financial statements.
Russell Investment Funds
Core Bond Fund
Schedule of Investments, continued — December 31, 2011
Amounts in thousands
| | | | | | | | | | | | | | | | | | | | | | |
| Credit Default Swap Contracts | |
| Sovereign Issues | |
Reference
Entity | | Counterparty | | Implied
Credit
Spread | | | Notional
Amount | | Fund (Pays)/
Receives
Fixed Rate | | | Termination
Date | | | Market
Value
$ | |
| | | | | | | | | | | | | | | | | | | | | | |
Brazil Government International Bond | | Credit Suisse Financial Products | | | 1.476% | | | USD | | 200 | | | 1.000% | | | | 06/20/16 | | | | (4 | ) |
China Government International Bond | | Barclays Bank PLC | | | 1.350% | | | USD | | 800 | | | 1.000% | | | | 06/20/16 | | | | (11 | ) |
France Government International Bond | | Goldman Sachs | | | 2.082% | | | USD | | 400 | | | 0.250% | | | | 06/20/16 | | | | (30 | ) |
France Government International Bond | | Goldman Sachs | | | 2.168% | | | USD | | 800 | | | 0.250% | | | | 12/20/16 | | | | (69 | ) |
France Government International Bond | | Barclays Bank PLC | | | 2.097% | | | USD | | 1,555 | | | 0.250% | | | | 09/20/16 | | | | (125 | ) |
France Government International Bond | | HSBC | | | 2.128% | | | USD | | 100 | | | 0.250% | | | | 09/20/16 | | | | (8 | ) |
France Government International Bond | | UBS | | | 1.997% | | | USD | | 2,100 | | | 0.250% | | | | 12/20/15 | | | | (135 | ) |
Germany Government Internationa Bond | | Citibank | | | 0.989% | | | USD | | 100 | | | 0.250% | | | | 12/20/16 | | | | (4 | ) |
Germany Government Internationa Bond | | Goldman Sachs | | | 0.989% | | | USD | | 200 | | | 0.250% | | | | 12/20/16 | | | | (7 | ) |
Italy Government International Bond | | Deutsche Bank | | | 4.846% | | | USD | | 100 | | | 1.000% | | | | 06/20/16 | | | | (14 | ) |
Japan Government International Bond | | Bank of America | | | 1.254% | | | USD | | 200 | | | 1.000% | | | | 03/20/16 | | | | (2 | ) |
Japan Government International Bond | | Bank of America | | | 1.254% | | | USD | | 100 | | | 1.000% | | | | 03/20/16 | | | | (1 | ) |
Japan Government International Bond | | Goldman Sachs | | | 1.307% | | | USD | | 200 | | | 1.000% | | | | 06/20/16 | | | | (3 | ) |
Japan Government International Bond | | JPMorgan | | | 1.254% | | | USD | | 700 | | | 1.000% | | | | 03/20/16 | | | | (8 | ) |
Mexico Government International Bond | | Barclays Bank PLC | | | 1.362% | | | USD | | 100 | | | 1.000% | | | | 03/20/16 | | | | (1 | ) |
Mexico Government International Bond | | Citibank | | | 1.362% | | | USD | | 500 | | | 1.000% | | | | 03/20/16 | | | | (7 | ) |
Mexico Government International Bond | | HSBC | | | 1.362% | | | USD | | 500 | | | 1.000% | | | | 03/20/16 | | | | (7 | ) |
Mexico Government International Bond | | HSBC | | | 1.773% | | | USD | | 500 | | | 1.000% | | | | 03/20/21 | | | | (31 | ) |
Mexico Government International Bond | | Morgan Stanley | | | 0.550% | | | USD | | 100 | | | 0.750% | | | | 01/20/12 | | | | — | |
Russia Government International Bond | | Citibank | | | 1.564% | | | USD | | 500 | | | 1.000% | | | | 12/20/12 | | | | (2 | ) |
Russia Government International Bond | | Citibank | | | 2.616% | | | USD | | 700 | | | 1.000% | | | | 03/20/16 | | | | (44 | ) |
Spain Government International Bond | | Citibank | | | 3.736% | | | USD | | 300 | | | 1.000% | | | | 06/20/16 | | | | (32 | ) |
Spain Government International Band | | Citibank | | | 3.736% | | | USD | | 400 | | | 1.000% | | | | 06/20/16 | | | | (43 | ) |
United Kingdom Gilt | | Bank of America | | | 0.872% | | | USD | | 200 | | | 1.000% | | | | 06/20/16 | | | | 1 | |
United Kingdom Gilt | | Citibank | | | 0.872% | | | USD | | 200 | | | 1.000% | | | | 06/20/16 | | | | 1 | |
United Kingdom Gilt | | Citibank | | | 0.946% | | | USD | | 900 | | | 1.000% | | | | 12/20/16 | | | | 3 | |
United Kingdom Gilt | | Deutsche Bank | | | 0.828% | | | USD | | 200 | | | 1.000% | | | | 03/20/16 | | | | 2 | |
United Kingdom Gilt | | Goldman Sachs | | | 0.946% | | | USD | | 600 | | | 1.000% | | | | 12/20/16 | | | | 2 | |
United Kingdom Gilt | | JPMorgan | | | 0.648% | | | USD | | 100 | | | 1.000% | | | | 03/20/15 | | | | 1 | |
United Kingdom Gilt | | JPMorgan | | | 0.648% | | | USD | | 300 | | | 1.000% | | | | 03/20/15 | | | | 3 | |
United Kingdom Gilt | | Morgan Stanley | | | 0.872% | | | USD | | 400 | | | 1.000% | | | | 06/20/16 | | | | 2 | |
United Kingdom Gilt | | Societe Generale | | | 0.648% | | | USD | | 300 | | | 1.000% | | | | 03/20/15 | | | | 3 | |
United Kingdom Gilt | | UBS | | | 0.872% | | | USD | | 400 | | | 1.000% | | | | 06/20/16 | | | | 2 | |
| | | | | | | | | | | | | | | | | | | | | | |
| | | |
Total Market Value on Open Sovereign Issues Premiums Paid (Received) - ($396) | | | | | | | | | | | (608 | ) |
| | | | | | | | | | | | | | | | | | | | | | |
| | | |
Total Market Value on Open Credit Default Swap Contracts Premiums Paid (Received) - $1,841 | | | | | | | | | | | 822 | |
| | | | | | | | | | | | | | | | | | | | | | |
See accompanying notes which are an integral part of the financial statements.
Russell Investment Funds
Core Bond Fund
Presentation of Portfolio Holdings — December 31, 2011
Amounts in thousands
| | | | | | | | | | | | | | | | | | | | |
| | | Market Value | | | % of Net
Assets | |
| Portfolio Summary | | Level 1 | | | Level 2 | | | Level 3 | | | Total | | |
| | | | | | | | | | | | | | | | | | | | |
| | | | | | | | | | | | | | | | | | | | |
Long-Term Investments | | | | | | | | | | | | | | | | | | | | |
Asset-Backed Securities | | $ | — | | | $ | 29,150 | | | $ | — | | | $ | 29,150 | | | | 5.3 | |
Corporate Bonds and Notes | | | — | | | | 90,413 | | | | 2,995 | | | | 93,408 | | | | 17.1 | |
International Debt | | | — | | | | 49,004 | | | | 750 | | | | 49,754 | | | | 9.1 | |
Loan Agreements | | | — | | | | 1,385 | | | | — | | | | 1,385 | | | | 0.3 | |
Mortgage-Backed Securities | | | — | | | | 205,013 | | | | 4,431 | | | | 209,444 | | | | 38.4 | |
Municipal Bonds | | | — | | | | 11,631 | | | | — | | | | 11,631 | | | | 2.1 | |
Non-US Bonds | | | — | | | | 6,609 | | | | — | | | | 6,609 | | | | 1.2 | |
United States Government Agencies | | | — | | | | 9,097 | | | | — | | | | 9,097 | | | | 1.7 | |
United States Government Treasuries | | | — | | | | 79,257 | | | | — | | | | 79,257 | | | | 14.5 | |
Preferred Stocks | | | — | | | | — | | | | 368 | | | | 368 | | | | 0.1 | |
Options Purchased | | | — | | | | 14 | | | | — | | | | 14 | | | | — | * |
Short-Term Investments | | | — | | | | 56,988 | | | | 61 | | | | 57,049 | | | | 10.5 | |
Repurchase Agreements | | | — | | | | 34,000 | | | | — | | | | 34,000 | | | | 6.2 | |
Other Securities | | | — | | | | 5,392 | | | | — | | | | 5,392 | | | | 1.0 | |
| | | | | | | | | | | | | | | | | | | | |
Total Investments | | | — | | | | 577,953 | | | | 8,605 | | | | 586,558 | | | | 107.5 | |
| | | | | | | | | | | | | | | | | | | | |
Other Assets and Liabilities, Net | | | | | | | | | | | | | | | | | | | (7.5 | ) |
| | | | | | | | | | | | | | | | | | | | |
| | | | | | | | | | | | | | | | | | | 100.0 | |
| | | | | | | | | | | | | | | | | | | | |
Other Financial Instruments | | | | | | | | | | | | | | | | | | | | |
Futures Contracts | | | 724 | | | | — | | | | — | | | | 724 | | | | 0.1 | |
Options Written | | | (1 | ) | | | (167 | ) | | | (37 | ) | | | (205 | ) | | | (— | )* |
Foreign Currency Exchange Contracts | | | — | | | | 270 | | | | — | | | | 270 | | | | 0.1 | |
Interest Rate Swap Contracts | | | — | | | | 84 | | | | 26 | | | | 110 | | | | — | * |
Credit Default Swap Contracts | | | — | | | | (641 | ) | | | (378 | ) | | | (1,019 | ) | | | (0.2 | ) |
| | | | | | | | | | | | | | | | | | | | |
Total Other Financial Instruments** | | $ | 723 | | | $ | (454 | ) | | $ | (389 | ) | | $ | (120 | ) | | | | |
| | | | | | | | | | | | | | | | | | | | |
| * | Less than .05% of net assets. |
| ** | Other financial instruments reflected, such as futures, forwards, interest rate swaps, and credit default swaps are valued at the unrealized appreciation/depreciation on the instruments. |
For a description of the levels see note 2 in the Notes to Financial Statements.
There were no significant transfers in and out of levels 1, 2 and 3 during the period ending December 31, 2011.
See accompanying notes which are an integral part of the financial statements.
Russell Investment Funds
Core Bond Fund
Presentation of Portfolio Holdings, continued — December 31, 2011
Amounts in thousands
A reconciliation of investments in which significant unobservable inputs (Level 3) were used in determining a value for the period ending December 31, 2011 were as follows:
| | | | | | | | | | | | | | | | | | | | |
| Category and Subcategory | | Beginning
Balance
as of 1/1/11 | | | Gross
Purchases | | | Gross
Sales | | | Accrued
Discounts/
(Premium) | | | Realized
Gain/(Loss) | |
| | | | | | | | | | | | | | | | | | | | |
| | | | | | | | | | | | | | | | | | | | |
Long-Term Investments | | | | | | | | | | | | | | | | | | | | |
Asset-Backed Securities | | $ | 299 | | | $ | — | | | $ | — | | | $ | — | | | $ | — | |
Corporate Bonds and Notes | | | 2,177 | | | | 1,952 | | | | 1,106 | | | | (3 | ) | | | 18 | |
International Debt | | | 734 | | | | — | | | | — | | | | (3 | ) | | | — | |
Loan Agreements | | | — | | | | 56 | | | | 56 | | | | — | | | | 7 | |
Mortgage-Backed Securities | | | 3,962 | | | | 1,307 | | | | 814 | | | | 1 | | | | — | |
Municipal Bonds | | | — | | | | — | | | | — | | | | — | | | | — | |
Investments in Other Funds | | | — | | | | — | | | | — | | | | — | | | | — | |
Preferred Stocks | | | 374 | | | | — | | | | — | | | | — | | | | — | |
Short-Term Investments | | | 1,660 | | | | — | | | | 1,311 | | | | 12 | | | | (60 | ) |
| | | | | | | | | | | | | | | | | | | | |
Total-Term Investments | | | 9,206 | | | | 3,315 | | | | 3,287 | | | | 7 | | | | (35 | ) |
| | | | | | | | | | | | | | | | | | | | |
Other Financial Instruments | | | | | | | | | | | | | | | | | | | | |
Options Written | | | (193 | ) | | | — | | | | — | | | | — | | | | 67 | |
Interest Rate Swap Contracts | | | — | | | | — | | | | — | | | | — | | | | — | |
Credit Default Swap Contracts | | | — | | | | — | | | | — | | | | — | | | | — | |
| | | | | | | | | | | | | | | | | | | | |
Total Other Financial Instruments | | $ | (193 | ) | | $ | — | | | $ | — | | | $ | — | | | $ | 67 | |
| | | | | | | | | | | | | | | | | | | | |
| | | | | | | | | | | | | | | | |
| Category and Subcategory | | Net
Transfers
into Level 3 | | | Net Transfers
out of Level 3 | | | Net change in
Unrealized
Appreciation/
(Depreciation)
on Investments
held as of 12/31/11 | | | Ending
Balance at 12/31/11 | |
| | | | | | | | | | | | | | | | |
| | | | | | | | | | | | | | | | |
Long-Term Investments | | | | | | | | | | | | | | | | |
Asset-Backed Securities | | $ | — | | | $ | 299 | | | $ | — | | | $ | — | |
Corporate Bonds and Notes | | | 413 | | | | 155 | | | | (301 | ) | | | 2,995 | |
International Debt | | | — | | | | — | | | | 19 | | | | 750 | |
Loan Agreements | | | — | | | | — | | | | (7 | ) | | | — | |
Mortgage-Backed Securities | | | — | | | | — | | | | (25 | ) | | | 4,431 | |
Municipal Bonds | | | — | | | | — | | | | — | | | | — | |
Investments in Other Funds | | | — | | | | — | | | | — | | | | — | |
Preferred Stocks | | | — | | | | — | | | | (6 | ) | | | 368 | |
Short-Term Investments | | | 155 | | | | 413 | | | | 18 | | | | 61 | |
| | | | | | | | | | | | | | | | |
Total Investments | | | 568 | | | | 867 | | | | (302 | ) | | | 8,605 | |
| | | | | | | | | | | | | | | | |
Other Financial Instruments | | | — | | | | — | | | | — | | | | — | |
Options Written | | | — | | | | — | | | | 89 | | | | (37 | ) |
Interest Rate Swap Contracts | | | — | | | | — | | | | 26 | | | | 26 | |
Credit Default Swap Contracts | | | — | | | | — | | | | (378 | ) | | | (378 | ) |
| | | | | | | | | | | | | | | | |
Total Other Financial Instruments | | $ | — | | | $ | — | | | $ | (263 | ) | | $ | (389 | ) |
| | | | | | | | | | | | | | | | |
See accompanying notes which are an integral part of the financial statements.
Russell Investment Funds
Core Bond Fund
Fair Value of Derivative Instruments — December 31, 2011
Amounts in thousands
| | | | | | | | | | | | |
Derivatives not accounted for as hedging instruments | | Credit
Contracts | | | Foreign
Currency
Contracts | | | Interest Rate
Contracts | |
| | | | | | | | | | | | |
Location: Statement of Assets and Liabilities - Assets | | | | | | | | | | | | |
Investments, at market value | | $ | — | | | $ | — | | | $ | 14 | |
Unrealized appreciation on foreign currency exchange contracts | | | — | | | | 551 | | | | — | |
Daily variation margin on futures contracts* | | | — | | | | — | | | | 820 | |
Interest rate swap contracts, at market value | | | — | | | | — | | | | 774 | |
Credit default swap contracts, at market value | | | 1,545 | | | | — | | | | — | |
| | | | | | | | | | | | |
Total | | $ | 1,545 | | | $ | 551 | | | $ | 1,608 | |
| | | | | | | | | | | | |
Location: Statement of Assets and Liabilities - Liabilities | | | | | | | | | | | | |
Unrealized depreciation on foreign currency exchange contracts | | $ | — | | | $ | 281 | | | $ | — | |
Daily variation margin on futures contracts* | | | — | | | | — | | | | 96 | |
Interest rate swap contracts, at market value | | | — | | | | — | | | | 711 | |
Credit default swap contracts, at market value | | | 723 | | | | — | | | | — | |
Options written, at market value | | | — | | | | — | | | | 205 | |
| | | | | | | | | | | | |
Total | | $ | 723 | | | $ | 281 | | | $ | 1,012 | |
| | | | | | | | | | | | |
| | | |
Derivatives not accounted for as hedging instruments | | Credit
Contracts | | | Foreign
Currency
Contracts | | | Interest Rate
Contracts | |
Location: Statement of Operations - Net realized gain (loss) | | | | | | | | | | | | |
Investments** | | $ | — | | | $ | — | | | $ | 258 | |
Futures contracts | | | — | | | | — | | | | 6,072 | |
Options Written | | | — | | | | — | | | | (1,555 | ) |
Credit default swap contracts | | | 157 | | | | — | | | | — | |
Interest rate swap contracts | | | — | | | | — | | | | (2,844 | ) |
Foreign currency-related transactions | | | — | | | | 106 | | | | — | |
| | | | | | | | | | | | |
Total | | $ | 157 | | | $ | 106 | | | $ | 1,931 | |
| | | | | | | | | | | | |
Location: Statement of Operations - Net change in unrealized appreciation (depreciation) | | | | | | | | | | | | |
Investments*** | | $ | — | | | $ | — | | | $ | 4 | |
Futures contracts | | | — | | | | — | | | | 1,127 | |
Options Written | | | — | | | | — | | | | 775 | |
Credit default swap contracts | | | (435 | ) | | | — | | | | — | |
Interest rate swap contracts | | | — | | | | — | | | | 215 | |
Foreign currency-related transactions | | | — | | | | 58 | | | | — | |
| | | | | | | | | | | | |
Total | | $ | (435 | ) | | $ | 58 | | | $ | 2,121 | |
| | | | | | | | | | | | |
| * | Includes cumulative appreciation/depreciation of futures contracts as reported in Schedule of Investments. Only current day’s variation margin is reported within the Statements of Assets and Liabilities. |
| ** | Includes net realized gain (loss) on purchased options as reported in the Schedule of Investments. |
| *** | Includes net change in unrealized appreciation/depreciation on purchased options as reported in the Schedule of Investments. |
For further disclosure on derivatives see note 2 in Notes to Financial Statements.
See accompanying notes which are an integral part of the financial statements.
(This page intentionally left blank)
Russell Investment Funds
Global Real Estate Securities Fund
Portfolio Management Discussion and Analysis — December 31, 2011 (Unaudited)
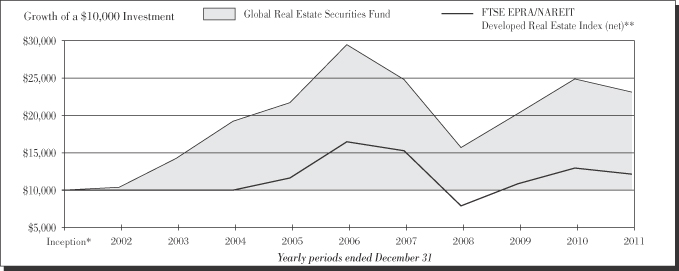
| | | | |
|
| Global Real Estate Securities Fund | |
| | Total
Return | |
1 Year | | | (7.05 | )% |
5 Years | | | (4.73 | )%§ |
10 Years | | | 8.75 | %§ |
| | | | |
|
| FTSE EPRA/NAREIT Developed Real Estate Index (net)** | |
| | Total
Return | |
1 Year | | | (6.46 | )% |
5 Years | | | (5.93 | )%§ |
10 Years | | | N/A | § |
| | | | |
| | 80 | | | Global Real Estate Securities Fund |
Russell Investment Funds
Global Real Estate Securities Fund
Portfolio Management Discussion and Analysis — December 31, 2011 (Unaudited)
The Global Real Estate Securities Fund (the “Fund”) allocates most of its assets among multiple money managers. Russell Investment Management Company (“RIMCo”), as the Fund’s advisor, may change the allocation of the Fund’s assets among money managers at any time. An exemptive order from the Securities and Exchange Commission (“SEC”) permits RIMCo to engage or terminate a money manager at any time, subject to approval by the Fund’s Board, without a shareholder vote. Pursuant to the terms of the exemptive order, the Fund is required to notify its shareholders within 60 days of when a money manager begins providing services. The Fund currently has three money managers.
What is the Fund’s investment objective?
The Fund seeks to provide current income and long term capital growth.
How did the Fund perform relative to its benchmark for the fiscal year ended December 31, 2011?
For the fiscal year ended December 31, 2011, the Global Real Estate Securities Fund lost 7.05%. This is compared to the Fund’s benchmark, the FTSE EPRA/NAREIT Developed Real Estate Index (Net), which lost 6.46% during the same period. The Fund’s performance includes operating expenses, whereas index returns are unmanaged and do not include expenses of any kind.
For the fiscal year ended December 31, 2011, the Lipper® Real Estate Funds (VIP) Average, a group of funds that Lipper considers to have investment strategies similar to those of the Fund, gained 1.79%. The Lipper® Real Estate Funds (VIP) Average includes funds that invest primarily in equity securities of domestic and foreign companies engaged in the real estate industry. The Lipper® Global Real Estate Funds Average, a group of funds that RIMCo considers to have investment strategies similar to those of the Fund, lost 7.41%. The Lipper® Global Real Estate Funds Average includes funds that invest at least 25% but less than 75% of their equity portfolio in shares of companies engaged in the real estate industry that are strictly outside of the U.S. or whose securities are principally traded outside of the United States. These results serve as peer comparisons and are expressed net of operating expenses.
How did the market conditions described in the Market Summary report affect the Fund’s performance?
The year began with marginally positive global property stock performance in an environment of moderating volatility and expectations of global economic growth. However, despite this apparent stability at the global level, there was significant dispersion in performance by region. Real estate securities in Europe and North America significantly outperformed relative to Asian property stocks, which lagged as a result of the natural disaster in Japan. Given the Fund’s overweight to Asia and underweights to the other regions, benchmark-relative performance was modestly negative early in the year.
The latter half of the fiscal year was characterized by a further decoupling of performance from company and property fundamentals. As concerns mounted over European sovereign debt and overall U.S. economic conditions weakened, real estate security performance continued to be driven by global macro-economic events, with limited consideration of net asset value or fundamental differences across companies, sectors, countries and regions. This environment was detrimental to the Fund’s performance relative to the benchmark.
In response to elevated volatility and unpredictable swings in the performance of the broader equity market, the managers in the Fund reduced deviations from regional benchmark weights. While this measure limited the potential negative impact of differences in performance among the regional equity markets, stock selection was challenged, particularly during August and September of 2011. Although property stocks globally delivered negative performance during this period, the worst performing companies tended to be those perceived to be more economically sensitive. Within the U.S., the Fund’s underweight to the defensive health care and self storage sectors detracted from benchmark relative performance, as did overweight exposure to the more cyclically exposed lodging and industrial sectors. However, the Fund outperformed relative to the benchmark during the final quarter of the fiscal year, largely due to underweight positions in several large, higher beta Asian developers.
How did the investment strategies and techniques employed by the Fund and its money managers affect its benchmark relative performance?
At the composite Fund level, stock selection contributed modestly to performance relative to the benchmark, as the positive impact of stock selection within the U.S. and Continental Europe outweighed the negative impact of weaker stock selection in Australia. Regional allocation drove fiscal year underperformance, as an overweight to Asia and an underweight to North America had a negative impact on Fund returns relative to the benchmark.
AEW Capital Management, L.P. (“AEW”) outperformed relative to the Fund’s benchmark for the fiscal year. AEW utilizes a value oriented strategy that focuses on identifying companies that appear to be mispriced relative to underlying real estate net asset value. An overweight to the underperforming Asia region was detrimental to relative performance, as was an underweight to North America, which outperformed relative to the broader index. Security selection was positive, with particularly strong selection in the U.S. that was partially offset by ineffective selection in Hong Kong. Overall sector allocation had a marginally positive impact on performance, due to overweight positions in the residential and health care sectors.
Cohen & Steers Capital Management, Inc. (“Cohen”) lagged relative to the Fund’s benchmark for the fiscal year, with most of the underperformance occurring during August and September of 2011. Of the three managers, Cohen’s
| | |
| Global Real Estate Securities Fund | | 81 |
Russell Investment Funds
Global Real Estate Securities Fund
Portfolio Management Discussion and Analysis — December 31, 2011 (Unaudited)
performance was most detrimental to Fund performance. Cohen manages a broadly diversified portfolio of global property securities. Stock selection within the U.S. and Japan, in addition to underweight positions in the health care and self storage sectors and overweights to industrial and lodging/resorts, accounted for the bulk of Cohen’s underperformance.
INVESCO Advisers, Inc. (“Invesco”) outperformed the Fund’s benchmark for the fiscal year. Invesco manages a broadly diversified portfolio with exposure to all major property sectors. Its investment style incorporates fundamental property market research and bottom-up quantitative securities analysis. Security selection had a positive impact on relative performance, with positive contributions from positions within the U.S. and Continental Europe, although these gains were partially offset by the negative impact of an overweight allocation to Asia. Sector allocation had a positive effect on performance, due to an overweight to the outperforming residential sector.
Describe any changes to the Fund’s structure or the money manager line-up.
Cash equitization was implemented on August 1, 2011 with the objective of reducing the impact of cash on Fund performance. Cash equitization is the exposure of the Fund’s cash reserves to the performance of certain real estate securities markets or, where there is no appropriate instrument that represents exposure to the various components of the Fund’s benchmark, broad global equity markets through the purchase of equity securities and/or derivatives. There were no changes to the money manager lineup during the fiscal year.
| | |
| |
| Money Managers as of December 31, 2011 | | Styles |
| AEW Capital Management, LP | | Value |
| Cohen & Steers Capital Management, Inc. | | Market-Oriented |
| INVESCO Advisers, Inc., which acts as a money manager to the Fund through its INVESCO Real Estate Division | | Market-Oriented |
The views expressed in this report reflect those of the portfolio managers only through the end of the period covered by the report. These views do not necessarily represent the views of RIMCo or any other person in RIMCo or any other affiliated organization. These views are subject to change at any time based upon market conditions or other events, and RIMCo disclaims any responsibility to update the views contained herein. These views should not be relied on as investment advice and, because investment decisions for Russell Investment Funds (“RIF”) are based on numerous factors, should not be relied on as an indication of investment decisions of any RIF Fund.
| * | | Assumes initial investment on January 1, 2001. |
| ** | | FTSE EPRA/NAREIT Developed Real Estate Index (net) is an index composed of all the data based on the last closing price of the month for all tax-qualified REITs listed on the New York Stock Exchange, American Stock Exchange, and the NASDAQ National Market System. The data is market value-weighted. The total-return calculation is based upon whether it is 1-month, 3-months or 12-months. Only those REITs listed for the entire period are used in the total return calculation. FTSE EPRA/NAREIT Developed Real Estate Index (net) is designed to represent general trends in eligible listed real estate stocks worldwide. Relevant real estate activities are defined as the ownership, trading and development of income-producing real estate. The index also includes a range of regional and country indices, Dividend+ indices, Global Sectors, Investment Focus, and a REITs and Non-REITs series. |
The performance shown in this section does not reflect any Insurance Company Separate Account or Policy Charges. Performance is historical and assumes reinvestment of all dividends and capital gains. Investment return and principal value will fluctuate so that an investor’s shares, when redeemed, may be worth more or less than when purchased. Past performance is not indicative of future results.
| | | | |
| | 82 | | | Global Real Estate Securities Fund |
Russell Investment Funds
Global Real Estate Securities Fund
Shareholder Expense Example — December 31, 2011 (Unaudited)
Fund Expenses
The following disclosure provides important information regarding each Fund’s Expense Example, which appears on each Fund’s individual page in this Annual Report. Please refer to this information when reviewing the Expense Example for a Fund.
Example
As a shareholder of the Fund, you incur two types of costs: (1) transaction costs, and (2) ongoing costs, including advisory fees and other Fund expenses. The Example is intended to help you understand your ongoing costs (in dollars) of investing in the Fund and to compare these costs with the ongoing costs of investing in other mutual funds. The Example is based on an investment of $1,000 invested at the beginning of the period and held for the entire period indicated, which for this Fund is from July 1, 2011 to December 31, 2011.
Actual Expenses
The information in the table under the heading “Actual Performance” provides information about actual account values and actual expenses. You may use the information in this column, together with the amount you invested, to estimate the expenses that you paid over the period. Simply divide your account value by $1,000 (for example, an $8,600 account value divided by $1,000 = 8.6), then multiply the result by the n umber in the first column in the row entitled “Expenses Paid During Period” to estimate the expenses you paid on your account during this period.
Hypothetical Example for Comparison Purposes
The information in the table under the heading “Hypothetical Performance (5% return before expenses)” provides information about hypothetical account values and hypothetical expenses based on the Fund’s actual expense ratio and an assumed rate of return of 5% per year before expenses, which is not the Fund’s actual return. The hypothetical account values and expenses may not be used to estimate the actual ending account balance or expenses you paid for the period. You may use this information to compare the ongoing costs of investing in the Fund and other funds. To do so, compare this 5% hypothetical example with the 5% hypothetical examples that appear in the shareholder reports of other funds.
Please note that the expenses shown in the table are meant to highlight your ongoing costs only and do not reflect any transactional costs. Therefore, the information under the heading “Hypothetical Performance (5% return before expenses)” is useful in comparing ongoing costs only, and will not help you determine the relative total costs of owning different funds. In addition, if these transactional costs were included, your costs would have been higher. The fee and expenses shown in this section do not reflect any Insurance Company Separate Account or Policy Charges.
| | | | | | | | |
| | Actual
Performance | | | Hypothetical
Performance
(5% return
before expenses) | |
| | | | | | | | |
Beginning Account Value July 1, 2011 | | $ | 1,000.00 | | | $ | 1,000.00 | |
Ending Account Value December 31, 2011 | | $ | 878.40 | | | $ | 1,020.82 | |
Expenses Paid During Period* | | $ | 4.12 | | | $ | 4.43 | |
| * | Expenses are equal to the Fund’s annualized expense ratio of 0.87% (representing the six month period annualized), multiplied by the average account value over the period, multiplied by 184/365 (to reflect the one-half year period). May reflect amounts waived, reimbursed and/or other credits. Without any waivers, reimbursements and/or other credits, expenses would have been higher. |
| | |
| Global Real Estate Securities Fund | | 83 |
Russell Investment Funds
Global Real Estate Securities Fund
Schedule of Investments — December 31, 2011
Amounts in thousands (except share amounts)
| | | | | | | | |
| | | Principal Amount ($) or Shares | | | Market Value $ | |
| | | | | | | | |
| Common Stocks - 95.2% | |
| Australia - 8.7% | | | | | | | | |
BGP Holdings PLC (Å)(Æ) | | | 926,311 | | | | — | |
CFS Retail Property Trust (ö) | | | 1,657,701 | | | | 2,856 | |
Charter Hall Office REIT (ö) | | | 162,000 | | | | 582 | |
Charter Hall Retail REIT (ö) | | | 162,000 | | | | 530 | |
Commonwealth Property Office Fund (ö) | | | 1,173,282 | | | | 1,146 | |
Dexus Property Group (ö) | | | 4,079,463 | | | | 3,463 | |
FKP Property Group (Ñ) | | | 1,078,433 | | | | 529 | |
Goodman Group (ö) | | | 1,716,529 | | | | 1,001 | |
GPT Group (ö) | | | 1,291,822 | | | | 4,056 | |
Investa Office Fund (ö) | | | 3,188,942 | | | | 1,957 | |
Mirvac Group Class REIT (ö) | | | 1,421,532 | | | | 1,716 | |
Stockland (ö) | | | 1,909,340 | | | | 6,230 | |
Westfield Group (ö) | | | 1,442,807 | | | | 11,526 | |
Westfield Retail Trust (ö) | | | 2,150,858 | | | | 5,478 | |
| | | | | | | | |
| | | | | | | 41,070 | |
| | | | | | | | |
| | |
| Austria - 0.2% | | | | | | | | |
Conwert Immobilien Invest SE (Ñ) | | | 85,070 | | | | 942 | |
| | | | | | | | |
| | |
| Brazil - 0.8% | | | | | | | | |
Aliansce Shopping Centers SA | | | 45,970 | | | | 351 | |
BR Malls Participacoes SA | | | 111,435 | | | | 1,083 | |
BR Properties SA | | | 161,397 | | | | 1,600 | |
Multiplan Empreendimentos Imobiliarios SA | | | 30,400 | | | | 624 | |
| | | | | | | | |
| | | | | | | 3,658 | |
| | | | | | | | |
| | |
| Canada - 4.4% | | | | | | | | |
Boardwalk Real Estate Investment Trust (ö) | | | 72,925 | | | | 3,611 | |
Brookfield Office Properties, Inc. (Ñ) | | | 283,523 | | | | 4,438 | |
Canadian Real Estate Investment Trust (ö) | | | 14,600 | | | | 507 | |
Chartwell Seniors Housing Real Estate Investment Trust Class Trust Unit (ö) | | | 122,164 | | | | 1,019 | |
Dundee Real Estate Investment Trust (ö) | | | 50,828 | | | | 1,630 | |
Dundee Real Estate Investment Trust (ö) | | | 11,999 | | | | 385 | |
First Capital Realty, Inc. Class A (Ñ) | | | 24,400 | | | | 414 | |
H&R Real Estate Investment Trust (ö) | | | 52,200 | | | | 1,192 | |
Primaris Retail Real Estate Investment Trust Class Common Subscription Recei (ö) | | | 131,800 | | | | 2,666 | |
RioCan Real Estate Investment Trust Class Trust Unit (ö) | | | 192,963 | | | | 5,006 | |
| | | | | | | | |
| | | | | | | 20,868 | |
| | | | | | | | |
| | |
| Finland - 0.2% | | | | | | | | |
Citycon OYJ | | | 124,468 | | | | 372 | |
Sponda OYJ | | | 174,317 | | | | 704 | |
| | | | | | | | |
| | | | | | | 1,076 | |
| | | | | | | | |
| | |
| France - 3.4% | | | | | | | | |
Fonciere Des Regions (ö) | | | 5,663 | | | | 364 | |
Gecina SA (ö) | | | 10,598 | | | | 892 | |
Klepierre - GDR (ö) | | | 49,518 | | | | 1,412 | |
Mercialys SA (ö) | | | 16,420 | | | | 529 | |
| | | | | | | | |
| | | Principal Amount ($) or Shares | | | Market Value $ | |
Societe de la Tour Eiffel (ö) | | | 320 | | | | 16 | |
Societe Immobiliere de Location pour l’Industrie et le Commerce (ö) | | | 8,519 | | | | 826 | |
Unibail-Rodamco SE (ö) | | | 66,953 | | | | 12,036 | |
| | | | | | | | |
| | | | | | | 16,075 | |
| | | | | | | | |
| | |
| Germany - 1.0% | | | | | | | | |
Alstria Office REIT - AG (ö) | | | 60,671 | | | | 722 | |
Deutsche Wohnen AG | | | 230,317 | | | | 3,060 | |
GSW Immobilien AG (Æ) | | | 36,956 | | | | 1,071 | |
| | | | | | | | |
| | | | | | | 4,853 | |
| | | | | | | | |
| | |
| Hong Kong - 12.3% | | | | | | | | |
Agile Property Holdings, Ltd. | | | 248,000 | | | | 222 | |
China Overseas Land & Investment,
Ltd. (Ñ) | | | 3,425,000 | | | | 5,724 | |
China Resources Land, Ltd. (Ñ) | | | 2,460,000 | | | | 3,952 | |
Country Garden Holdings Co., Ltd. (Ñ) | | | 3,585,000 | | | | 1,343 | |
Hang Lung Properties, Ltd. - ADR | | | 1,465,405 | | | | 4,171 | |
Henderson Land Development Co., Ltd. (Ñ) | | | 313,000 | | | | 1,556 | |
Hongkong Land Holdings, Ltd. | | | 1,523,000 | | | | 6,914 | |
Hysan Development Co., Ltd. | | | 555,248 | | | | 1,823 | |
Kerry Properties, Ltd. | | | 522,000 | | | | 1,727 | |
Link REIT (The) (Ñ)(ö) | | | 1,459,992 | | | | 5,376 | |
New World Development Co., Ltd. | | | 573,677 | | | | 462 | |
Shimao Property Holdings, Ltd. | | | 1,139,000 | | | | 972 | |
Sino Land Co., Ltd. (Ñ) | | | 2,006,000 | | | | 2,856 | |
Soho China, Ltd. (Ñ) | | | 831,000 | | | | 554 | |
Sun Hung Kai Properties, Ltd. | | | 1,344,000 | | | | 16,847 | |
Wharf Holdings, Ltd. | | | 554,789 | | | | 2,508 | |
Wheelock & Co., Ltd. | | | 335,000 | | | | 830 | |
| | | | | | | | |
| | | | | | | 57,837 | |
| | | | | | | | |
| | |
| Italy - 0.1% | | | | | | | | |
Beni Stabili SpA (ö) | | | 782,868 | | | | 350 | |
| | | | | | | | |
| | |
| Japan - 7.5% | | | | | | | | |
Advance Residence Investment Corp.
Class A (ö) | | | 525 | | | | 1,013 | |
Aeon Mall Co., Ltd.(Ñ) | | | 62,100 | | | | 1,318 | |
Japan Prime Realty Investment Corp.
Class A (Ñ)(ö) | | | 211 | | | | 497 | |
Japan Real Estate Investment Corp.
Class A (Ñ)(ö) | | | 155 | | | | 1,208 | |
Japan Retail Fund Investment Corp.
Class A (Ñ)(ö) | | | 738 | | | | 1,093 | |
Mitsubishi Estate Co., Ltd. (Ñ) | | | 624,480 | | | | 9,331 | |
Mitsui Fudosan Co., Ltd. | | | 665,496 | | | | 9,701 | |
Nippon Accommodations Fund, Inc.
Class A (ö) | | | 116 | | | | 781 | |
Nippon Building Fund, Inc. Class A (Ñ)(ö) | | | 450 | | | | 3,684 | |
Nomura Real Estate Holdings, Inc. (Ñ) | | | 75,100 | | | | 1,118 | |
Nomura Real Estate Office Fund, Inc.
Class A (Ñ)(ö) | | | 97 | | | | 498 | |
Sumitomo Realty & Development Co., Ltd. | | | 157,600 | | | | 2,760 | |
Tokyu Land Corp. | | | 104,000 | | | | 393 | |
| | | | |
| | 84 | | | Global Real Estate Securities Fund |
Russell Investment Funds
Global Real Estate Securities Fund
Schedule of Investments, continued — December 31, 2011
Amounts in thousands (except share amounts)
| | | | | | | | |
| | | Principal Amount ($) or Shares | | | Market Value $ | |
| | | | | | | | |
United Urban Investment Corp.
Class A (Ñ)(ö) | | | 1,835 | | | | 2,081 | |
| | | | | | | | |
| | | | | | | 35,476 | |
| | | | | | | | |
| | |
| Netherlands - 0.7% | | | | | | | | |
Corio NV (ö) | | | 45,602 | | | | 1,984 | |
Eurocommercial Properties NV (ö) | | | 35,595 | | | | 1,130 | |
Vastned Retail NV (ö) | | | 2,796 | | | | 125 | |
| | | | | | | | |
| | | | | | | 3,239 | |
| | | | | | | | |
| | |
| Norway - 0.1% | | | | | | | | |
Norwegian Property ASA | | | 478,588 | | | | 589 | |
| | | | | | | | |
| | |
| Philippines - 0.3% | | | | | | | | |
SM Prime Holdings, Inc. | | | 5,224,021 | | | | 1,584 | |
| | | | | | | | |
| | |
| Singapore - 3.5% | | | | | | | | |
Ascendas Real Estate Investment
Trust (Æ)(Ñ)(ö) | | | 701,000 | | | | 989 | |
CapitaCommercial Trust (Æ)(Ñ)(ö) | | | 1,698,000 | | | | 1,381 | |
CapitaLand, Ltd. | | | 1,659,000 | | | | 2,826 | |
CapitaMall Trust Class A (ö) | | | 2,674,000 | | | | 3,506 | |
CapitaMalls Asia, Ltd. (Ñ) | | | 438,000 | | | | 382 | |
City Developments, Ltd. (Ñ) | | | 87,000 | | | | 597 | |
Global Logistic Properties, Ltd. (Æ) | | | 2,328,896 | | | | 3,151 | |
Keppel Land, Ltd. (Ñ) | | | 110,697 | | | | 189 | |
Mapletree Industrial Trust (ö) | | | 1,148,885 | | | | 952 | |
Overseas Union Enterprise, Ltd. (Ñ) | | | 346,000 | | | | 560 | |
Perennial China Retail Trust (Æ)(Ñ) | | | 2,148,000 | | | | 787 | |
Suntec Real Estate Investment Trust (Ñ)(ö) | | | 1,528,500 | | | | 1,267 | |
| | | | | | | | |
| | | | | | | 16,587 | |
| | | | | | | | |
| | |
| Sweden - 1.1% | | | | | | | | |
Castellum AB | | | 156,883 | | | | 1,944 | |
Fabege AB | | | 212,398 | | | | 1,664 | |
Hufvudstaden AB Class A | | | 74,497 | | | | 758 | |
Wihlborgs Fastigheter AB | | | 54,739 | | | | 724 | |
| | | | | | | | |
| | | | | | | 5,090 | |
| | | | | | | | |
| | |
| Switzerland - 0.9% | | | | | | | | |
PSP Swiss Property AG (Æ) | | | 29,909 | | | | 2,503 | |
Swiss Prime Site AG Class A (Æ) | | | 20,093 | | | | 1,509 | |
| | | | | | | | |
| | | | | | | 4,012 | |
| | | | | | | | |
| | |
| United Kingdom - 4.7% | | | | | | | | |
Big Yellow Group PLC (ö) | | | 111,118 | | | | 423 | |
British Land Co. PLC (ö) | | | 783,657 | | | | 5,629 | |
Capital & Counties Properties PLC | | | 146,280 | | | | 419 | |
Capital Shopping Centres Group PLC
Class H (ö) | | | 107,311 | | | | 520 | |
Derwent London PLC (ö) | | | 81,655 | | | | 1,978 | |
Great Portland Estates PLC (ö) | | | 194,893 | | | | 978 | |
Hammerson PLC (ö) | | | 838,163 | | | | 4,686 | |
Land Securities Group PLC (ö) | | | 467,281 | | | | 4,611 | |
Metric Property Investments PLC (ö) | | | 172,700 | | | | 228 | |
Segro PLC (ö) | | | 341,921 | | | | 1,108 | |
| | | | | | | | |
| | | Principal Amount ($) or Shares | | | Market Value $ | |
Shaftesbury PLC (ö) | | | 114,378 | | | | 830 | |
Unite Group PLC | | | 276,739 | | | | 722 | |
| | | | | | | | |
| | | | | | | 22,132 | |
| | | | | | | | |
| | |
| United States - 45.3% | | | | | | | | |
Acadia Realty Trust (ö) | | | 36,000 | | | | 725 | |
Alexandria Real Estate Equities, Inc. (ö) | | | 77,452 | | | | 5,342 | |
American Assets Trust, Inc. (ö) | | | 66,135 | | | | 1,357 | |
American Campus Communities, Inc. (ö) | | | 35,200 | | | | 1,477 | |
Apartment Investment & Management Co. Class A (ö) | | | 72,123 | | | | 1,652 | |
AvalonBay Communities, Inc. (ö) | | | 65,997 | | | | 8,619 | |
BioMed Realty Trust, Inc. (ö) | | | 134,152 | | | | 2,426 | |
Boston Properties, Inc. (ö) | | | 87,456 | | | | 8,711 | |
BRE Properties, Inc. Class A (ö) | | | 45,138 | | | | 2,279 | |
Camden Property Trust (ö) | | | 45,400 | | | | 2,826 | |
Campus Crest Communities, Inc. (ö) | | | 23,100 | | | | 232 | |
CBL & Associates Properties, Inc. (ö) | | | 60,051 | | | | 943 | |
Colonial Properties Trust (ö) | | | 38,226 | | | | 797 | |
Coresite Realty Corp. (ö) | | | 14,800 | | | | 264 | |
CubeSmart (ö) | | | 113,114 | | | | 1,203 | |
DCT Industrial Trust, Inc. (ö) | | | 318,028 | | | | 1,629 | |
DDR Corp. (ö) | | | 124,700 | | | | 1,518 | |
DiamondRock Hospitality Co. (ö) | | | 92,538 | | | | 892 | |
Digital Realty Trust, Inc. (Ñ)(ö) | | | 41,286 | | | | 2,752 | |
Douglas Emmett, Inc. (ö) | | | 62,551 | | | | 1,141 | |
Duke Realty Corp. (ö) | | | 111,839 | | | | 1,348 | |
DuPont Fabros Technology, Inc. (Ñ)(ö) | | | 102,498 | | | | 2,482 | |
Education Realty Trust, Inc. (ö) | | | 110,892 | | | | 1,134 | |
Entertainment Properties Trust (ö) | | | 25,400 | | | | 1,110 | |
Equity Lifestyle Properties, Inc. (ö) | | | 40,443 | | | | 2,698 | |
Equity Residential (ö) | | | 223,860 | | | | 12,766 | |
Essex Property Trust, Inc. (ö) | | | 22,735 | | | | 3,195 | |
Extra Space Storage, Inc. (ö) | | | 136,347 | | | | 3,304 | |
Federal Realty Investment Trust (ö) | | | 47,081 | | | | 4,272 | |
First Industrial Realty Trust, Inc. (Æ)(ö) | | | 132,202 | | | | 1,352 | |
First Potomac Realty Trust (ö) | | | 67,100 | | | | 876 | |
Forest City Enterprises, Inc. Class A (Æ) | | | 94,958 | | | | 1,123 | |
General Growth Properties, Inc. (ö) | | | 246,178 | | | | 3,697 | |
HCP, Inc. (ö) | | | 286,928 | | | | 11,887 | |
Health Care REIT, Inc. (ö) | | | 69,600 | | | | 3,795 | |
Healthcare Realty Trust, Inc. (ö) | | | 19,400 | | | | 361 | |
Hersha Hospitality Trust Class A (ö) | | | 196,304 | | | | 958 | |
Highwoods Properties, Inc. (ö) | | | 30,500 | | | | 905 | |
Host Hotels & Resorts, Inc. (ö) | | | 542,979 | | | | 8,019 | |
Hyatt Hotels Corp. Class A (Æ) | | | 48,601 | | | | 1,829 | |
Icad, Inc. (Ñ)(ö) | | | 2,400 | | | | 189 | |
Kilroy Realty Corp. (ö) | | | 117,427 | | | | 4,471 | |
Kimco Realty Corp. (ö) | | | 137,366 | | | | 2,231 | |
Kite Realty Group Trust (ö) | | | 35,858 | | | | 162 | |
Liberty Property Trust (ö) | | | 86,052 | | | | 2,658 | |
Macerich Co. (The) (ö) | | | 86,029 | | | | 4,353 | |
Mid-America Apartment Communities,
Inc. (ö) | | | 17,600 | | | | 1,101 | |
National Retail Properties, Inc. (ö) | | | 66,900 | | | | 1,765 | |
Omega Healthcare Investors, Inc. (ö) | | | 65,400 | | | �� | 1,265 | |
| | |
| Global Real Estate Securities Fund | | 85 |
Russell Investment Funds
Global Real Estate Securities Fund
Schedule of Investments, continued — December 31, 2011
Amounts in thousands (except share amounts)
| | | | | | | | |
| | | Principal Amount ($) or Shares | | | Market Value $ | |
| | | | | | | | |
Pebblebrook Hotel Trust (ö) | | | 46,754 | | | | 896 | |
Piedmont Office Realty Trust, Inc.
Class A (Ñ)(ö) | | | 70,600 | | | | 1,203 | |
Post Properties, Inc. (ö) | | | 24,939 | | | | 1,090 | |
ProLogis, Inc. (ö) | | | 303,352 | | | | 8,673 | |
Public Storage (ö) | | | 73,548 | | | | 9,890 | |
Regency Centers Corp. (ö) | | | 97,135 | | | | 3,654 | |
Retail Opportunity Investments
Corp. (Ñ)(ö) | | | 114,740 | | | | 1,358 | |
RLJ Lodging Trust (ö) | | | 36,400 | | | | 613 | |
Senior Housing Properties Trust (ö) | | | 28,600 | | | | 642 | |
Simon Property Group, Inc. (ö) | | | 200,365 | | | | 25,837 | |
SL Green Realty Corp. (ö) | | | 42,442 | | | | 2,828 | |
Sovran Self Storage, Inc. (ö) | | | 15,500 | | | | 661 | |
Starwood Hotels & Resorts Worldwide,
Inc. (ö) | | | 25,172 | | | | 1,207 | |
Sunstone Hotel Investors, Inc. (Æ)(ö) | | | 43,000 | | | | 350 | |
Tanger Factory Outlet Centers (ö) | | | 15,900 | | | | 466 | |
Taubman Centers, Inc. (ö) | | | 25,867 | | | | 1,606 | |
UDR, Inc. (ö) | | | 107,853 | | | | 2,707 | |
Ventas, Inc. (ö) | | | 155,787 | | | | 8,589 | |
Vornado Realty Trust (ö) | | | 100,849 | | | | 7,751 | |
Weingarten Realty Investors (ö) | | | 55,273 | | | | 1,207 | |
| | | | | | | | |
| | | | | | | 213,319 | |
| | | | | | | | |
| | |
Total Common Stocks
(cost $415,181) | | | | | | | 448,757 | |
| | | | | | | | |
| |
| Short-Term Investments—3.6% | | | | | |
| United States - 3.6% | | | | | | | | |
Russell U.S. Cash Management Fund | | | 16,817,324 | (¥) | | | 16,817 | |
| | | | | | | | |
| | |
Total Short-Term Investments
(cost $16,817) | | | | | | | 16,817 | |
| | | | | | | | |
| | |
| Other Securities - 6.4% | | | | | | | | |
Russell Investment Funds Liquidating Trust (×) | | | 2,286,840 | (¥) | | | 2,324 | |
Russell U.S. Cash Collateral Fund (×) | | | 27,683,188 | (¥) | | | 27,683 | |
| | | | | | | | |
| | |
Total Other Securities
(cost $29,970) | | | | | | | 30,007 | |
| | | | | | | | |
| | |
Total Investments - 105.2%
(identified cost $461,968) | | | | | | | 495,581 | |
| | |
Other Assets and Liabilities,
Net - (5.2%) | | | | | | | (24,617 | ) |
| | | | | | | | |
| | |
| Net Assets - 100.0% | | | | | | | 470,964 | |
| | | | | | | | |
A portion of the portfolio has been fair valued as of period end.
See accompanying notes which are an integral part of the financial statements.
| | | | |
| | 86 | | | Global Real Estate Securities Fund |
Russell Investment Funds
Global Real Estate Securities Fund
Schedule of Investments, continued — December 31, 2011
Amounts in thousands
| | | | | | | | | | | | | | |
| Futures Contracts | | Number of
Contracts | | Notional
Amount | | | Expiration
Date | | Unrealized
Appreciation
(Depreciation)
$ |
| Long Positions | | | | | | | | | | | | | | |
ASX SPI 200 Index Futures (Australia) | | 13 | | | AUD | | | | 1,306 | | | 03/12 | | (46) |
FTSE EPRA Europe Index Futures | | 380 | | | EUR | | | | 4,684 | | | 03/12 | | 412 |
Hang Seng Index Futures (Hong Kong) | | 14 | | | HKD | | | | 12,919 | | | 01/12 | | 4 |
S&P Midcap 400 E-Mini Index Futures (CME) | | 78 | | | USD | | | | 6,843 | | | 03/12 | | (27) |
S&P TSE 60 Index Futures (Cananda) | | 6 | | | CAD | | | | 815 | | | 03/12 | | 14 |
SGX MSCI Singapore Index Futures | | 13 | | | SGD | | | | 781 | | | 01/12 | | (11) |
TOPIX Index Futures (Japan) | | 15 | | | JPY | | | | 109,199 | | | 03/12 | | (13) |
| | | | | | | | | | | | | | |
| |
Total Unrealized Appreciation (Depreciation) on Open Futures Contracts (å) | | 333 |
| | | | | | | | | | | | | | |
| | | | | | | | | | | | | | | | |
| Foreign Currency Exchange Contracts | | | | | | | | | | |
Counterparty | | Amount
Sold | | | Amount
Bought | | | Settlement
Date | | Unrealized Appreciation (Depreciation) $ |
Barclays Bank PLC | | USD | | | 150 | | | AUD | | | 148 | | | 03/21/12 | | — |
Barclays Bank PLC | | USD | | | 86 | | | CAD | | | 88 | | | 03/21/12 | | (1) |
Barclays Bank PLC | | USD | | | 808 | | | EUR | | | 603 | | | 03/21/12 | | (26) |
Barclays Bank PLC | | USD | | | 245 | | | HKD | | | 1,900 | | | 03/21/12 | | — |
Barclays Bank PLC | | USD | | | 165 | | | JPY | | | 12,750 | | | 03/21/12 | | 1 |
Barclays Bank PLC | | USD | | | 513 | | | SGD | | | 660 | | | 03/21/12 | | (4) |
Brown Brothers Harriman & Co. | | USD | | | 203 | | | AUD | | | 200 | | | 03/21/12 | | — |
Brown Brothers Harriman & Co. | | USD | | | 197 | | | CAD | | | 200 | | | 03/21/12 | | (1) |
Brown Brothers Harriman & Co. | | USD | | | 335 | | | EUR | | | 250 | | | 03/21/12 | | (12) |
Brown Brothers Harriman & Co. | | USD | | | 64 | | | HKD | | | 500 | | | 03/21/12 | | — |
Brown Brothers Harriman & Co. | | USD | | | 194 | | | JPY | | | 15,000 | | | 03/21/12 | | 2 |
Brown Brothers Harriman & Co. | | USD | | | 59 | | | SGD | | | 75 | | | 03/21/12 | | (1) |
Commonwealth Bank of Australia | | USD | | | 150 | | | AUD | | | 148 | | | 03/21/12 | | — |
Commonwealth Bank of Australia | | USD | | | 808 | | | EUR | | | 603 | | | 03/21/12 | | (26) |
Commonwealth Bank of Australia | | USD | | | 165 | | | JPY | | | 12,750 | | | 03/21/12 | | 1 |
Credit Suisse First Boston | | USD | | | 100 | | | AUD | | | 100 | | | 03/21/12 | | 1 |
Credit Suisse First Boston | | USD | | | 150 | | | AUD | | | 148 | | | 03/21/12 | | — |
Credit Suisse First Boston | | USD | | | 86 | | | CAD | | | 88 | | | 03/21/12 | | (1) |
Credit Suisse First Boston | | USD | | | 262 | | | EUR | | | 200 | | | 03/21/12 | | (3) |
Credit Suisse First Boston | | USD | | | 808 | | | EUR | | | 603 | | | 03/21/12 | | (26) |
Deutsche Bank AG | | USD | | | 150 | | | AUD | | | 148 | | | 03/21/12 | | — |
Deutsche Bank AG | | USD | | | 808 | | | EUR | | | 603 | | | 03/21/12 | | (26) |
Deutsche Bank AG | | USD | | | 245 | | | HKD | | | 1,900 | | | 03/21/12 | | — |
HSBC Bank PLC | | USD | | | 150 | | | AUD | | | 148 | | | 03/21/12 | | — |
HSBC Bank PLC | | USD | | | 86 | | | CAD | | | 88 | | | 03/21/12 | | (1) |
HSBC Bank PLC | | USD | | | 808 | | | EUR | | | 603 | | | 03/21/12 | | (27) |
HSBC Bank PLC | | USD | | | 245 | | | HKD | | | 1,900 | | | 03/21/12 | | — |
HSBC Bank PLC | | USD | | | 164 | | | JPY | | | 12,750 | | | 03/21/12 | | 1 |
JP Morgan Chase Bank | | USD | | | 150 | | | AUD | | | 148 | | | 03/21/12 | | — |
JP Morgan Chase Bank | | USD | | | 87 | | | CAD | | | 88 | | | 03/21/12 | | (1) |
JP Morgan Chase Bank | | USD | | | 808 | | | EUR | | | 603 | | | 03/21/12 | | (26) |
JP Morgan Chase Bank | | USD | | | 245 | | | HKD | | | 1,900 | | | 03/21/12 | | — |
JP Morgan Chase Bank | | USD | | | 165 | | | JPY | | | 12,750 | | | 03/21/12 | | 1 |
Royal Bank of Canada | | USD | | | 87 | | | CAD | | | 88 | | | 03/21/12 | | (1) |
Royal Bank of Canada | | USD | | | 245 | | | HKD | | | 1,900 | | | 03/21/12 | | — |
Royal Bank of Canada | | USD | | | 165 | | | JPY | | | 12,750 | | | 03/21/12 | | 1 |
See accompanying notes which are an integral part of the financial statements.
| | |
| Global Real Estate Securities Fund | | 87 |
Russell Investment Funds
Global Real Estate Securities Fund
Schedule of Investments, continued — December 31, 2011
Amounts in thousands
| | | | | | | | | | | | | | | | |
| Foreign Currency Exchange Contracts | | | | | | | | | | |
Counterparty | | Amount
Sold | | | Amount
Bought | | | Settlement
Date | | Unrealized Appreciation (Depreciation) $ |
Royal Bank of Scotland PLC | | USD | | | 100 | | | AUD | | | 100 | | | 03/21/12 | | 1 |
Royal Bank of Scotland PLC | | USD | | | 98 | | | CAD | | | 100 | | | 03/21/12 | | — |
Royal Bank of Scotland PLC | | USD | | | 129 | | | EUR | | | 100 | | | 03/21/12 | | — |
Royal Bank of Scotland PLC | | USD | | | 64 | | | HKD | | | 500 | | | 03/21/12 | | — |
Royal Bank of Scotland PLC | | USD | | | 129 | | | JPY | | | 10,000 | | | 03/21/12 | | 1 |
Royal Bank of Scotland PLC | | USD | | | 77 | | | SGD | | | 100 | | | 03/21/12 | | — |
State Street Bank & Trust Co. | | USD | | | 86 | | | CAD | | | 88 | | | 03/21/12 | | (1) |
State Street Bank & Trust Co. | | USD | | | 520 | | | EUR | | | 400 | | | 03/21/12 | | (2) |
State Street Bank & Trust Co. | | USD | | | 64 | | | HKD | | | 500 | | | 03/21/12 | | — |
State Street Bank & Trust Co. | | USD | | | 65 | | | JPY | | | 5,066 | | | 01/04/12 | | 1 |
State Street Bank & Trust Co. | | USD | | | 41 | | | JPY | | | 3,148 | | | 01/05/12 | | — |
State Street Bank & Trust Co. | | USD | | | 16 | | | JPY | | | 1,246 | | | 01/06/12 | | — |
State Street Bank & Trust Co. | | USD | | | 128 | | | JPY | | | 10,000 | | | 03/21/12 | | 2 |
State Street Bank & Trust Co. | | JPY | | | 2,557 | | | USD | | | 33 | | | 01/04/12 | | — |
State Street Bank & Trust Co. | | JPY | | | 6,880 | | | USD | | | 88 | | | 01/04/12 | | (1) |
State Street Bank & Trust Co. | | JPY | | | 11,172 | | | USD | | | 144 | | | 01/05/12 | | (1) |
State Street Bank & Trust Co. | | JPY | | | 1,857 | | | USD | | | 24 | | | 01/06/12 | | — |
State Street Bank & Trust Co. | | SGD | | | 50 | | | USD | | | 38 | | | 01/03/12 | | — |
State Street Bank & Trust Co. | | SGD | | | 79 | | | USD | | | 61 | | | 01/04/12 | | — |
State Street Bank & Trust Co. | | SGD | | | 36 | | | USD | | | 28 | | | 01/05/12 | | — |
Westpac Banking Corp. | | USD | | | 245 | | | HKD | | | 1,900 | | | 03/21/12 | | — |
Westpac Banking Corp. | | USD | | | 164 | | | JPY | | | 12,750 | | | 03/21/12 | | 1 |
| | | | | | | | | | | | | | | | |
| |
Total Unrealized Appreciation (Depreciation) on Open Foreign Currency Exchange Contracts | | (174) |
| | | | | | | | | | | | | | | | |
See accompanying notes which are an integral part of the financial statements.
| | | | |
| | 88 | | | Global Real Estate Securities Fund |
Russell Investment Funds
Global Real Estate Securities Fund
Presentation of Portfolio Holdings — December 31, 2011
Amounts in thousands
| | | | | | | | | | | | | | | | | | | | |
| | | Market Value | | | % of Net
Assets | |
| Portfolio Summary | | Level 1 | | | Level 2 | | | Level 3 | | | Total | | |
Common Stocks | | | | | | | | | | | | | | | | | | | | |
Australia | | $ | 41,070 | | | $ | — | | | $ | — | | | $ | 41,070 | | | | 8.7 | |
Austria | | | 942 | | | | — | | | | — | | | | 942 | | | | 0.2 | |
Brazil | | | 3,658 | | | | — | | | | — | | | | 3,658 | | | | 0.8 | |
Canada | | | 20,483 | | | | — | | | | 385 | | | | 20,868 | | | | 4.4 | |
Finland | | | 1,076 | | | | — | | | | — | | | | 1,076 | | | | 0.2 | |
France | | | 16,075 | | | | — | | | | — | | | | 16,075 | | | | 3.4 | |
Germany | | | 4,853 | | | | — | | | | — | | | | 4,853 | | | | 1.0 | |
Hong Kong | | | 57,837 | | | | — | | | | — | | | | 57,837 | | | | 12.3 | |
Italy | | | 350 | | | | — | | | | — | | | | 350 | | | | 0.1 | |
Japan | | | 35,476 | | | | — | | | | — | | | | 35,476 | | | | 7.5 | |
Netherlands | | | 3,239 | | | | — | | | | — | | | | 3,239 | | | | 0.7 | |
Norway | | | 589 | | | | — | | | | — | | | | 589 | | | | 0.1 | |
Philippines | | | 1,584 | | | | — | | | | — | | | | 1,584 | | | | 0.3 | |
Singapore | | | 16,587 | | | | — | | | | — | | | | 16,587 | | | | 3.5 | |
Sweden | | | 5,090 | | | | — | | | | — | | | | 5,090 | | | | 1.1 | |
Switzerland | | | 4,012 | | | | — | | | | — | | | | 4,012 | | | | 0.9 | |
United Kingdom | | | 22,132 | | | | — | | | | — | | | | 22,132 | | | | 4.7 | |
United States | | | 213,319 | | | | — | | | | — | | | | 213,319 | | | | 45.3 | |
Short-Term Investments | | | — | | | | 16,817 | | | | — | | | | 16,817 | | | | 3.6 | |
Other Securities | | | — | | | | 30,007 | | | | — | | | | 30,007 | | | | 6.4 | |
| | | | | | | | | | | | | | | | | | | | |
Total Investments | | | 448,372 | | | | 46,824 | | | | 385 | | | | 495,581 | | | | 105.2 | |
| | | | | | | | | | | | | | | | | | | | |
Other Assets and Liabilities, Net | | | | | | | | | | | | | | | | | | | (5.2 | ) |
| | | | | | | | | | | | | | | | | | | | |
| | | | | | | | | | | | | | | | | | | 100.0 | |
| | | | | | | | | | | | | | | | | | | | |
Other Financial Instruments | | | | | | | | | | | | | | | | | | | | |
Futures Contracts | | | 333 | | | | — | | | | — | | | | 333 | | | | 0.1 | |
Foreign Currency Exchange Contracts | | | (2 | ) | | | (172 | ) | | | — | | | | (174 | ) | | | (— | )* |
| | | | | | | | | | | | | | | | | | | | |
Total Other Financial Instruments** | | $ | 331 | | | $ | (172 | ) | | $ | — | | | $ | 159 | | | | | |
| | | | | | | | | | | | | | | | | | | | |
| * | Less than .05% of net assets. |
| ** | Other financial instruments reflected, such as futures, forwards, interest rate swaps, and credit default swaps are valued at the unrealized appreciation/depreciation on the instruments. |
For a description of the levels see note 2 in the Notes to Financial Statements.
Investments in which significant unobservable inputs (Level 3) used in determining a value for the period ending December 31, 2011 were less than 1% of net assets.
There were no significant transfers in and out of levels 1, 2 and 3 during the period ending December 31, 2011.
See accompanying notes which are an integral part of the financial statements.
| | |
| Global Real Estate Securities Fund | | 89 |
Russell Investment Funds
Global Real Estate Securities Fund
Fair Value of Derivative Instruments — December 31, 2011
Amounts in thousands
| | | | | | | | |
Derivatives not accounted for as hedging instruments | | Equity
Contracts | | | Foreign
Currency
Contracts | |
| Location: Statement of Assets and Liabilities - Assets | | | | | | | | |
Unrealized appreciation on foreign currency exchange contracts | | $ | — | | | $ | 14 | |
Daily variation margin on futures contracts* | | | 430 | | | | — | |
| | | | | | | | |
Total | | $ | 430 | | | $ | 14 | |
| | | | | | | | |
| | |
| Location: Statement of Assets and Liabilities - Liabilities | | | | | | | | |
Unrealized depreciation on foreign currency exchange contracts | | $ | — | | | $ | 188 | |
Daily variation margin on futures contracts* | | | 97 | | | | — | |
| | | | | | | | |
Total | | $ | 97 | | | $ | 188 | |
| | | | | | | | |
| | |
Derivatives not accounted for as hedging instruments | | Equity
Contracts | | | Foreign
Currency
Contracts | |
| Location: Statement of Operations - Net realized gain (loss) | | | | | | | | |
Futures contracts | | $ | (1,381 | ) | | $ | — | |
Foreign currency-related transactions | | | — | | | | (527 | ) |
| | | | | | | | |
Total | | $ | (1,381 | ) | | $ | (527 | ) |
| | | | | | | | |
| | |
| Location: Statement of Operations - Net change in unrealized appreciation (depreciation) | | | | | | | | |
Futures contracts | | $ | 333 | | | $ | — | |
Foreign currency-related transactions | | | — | | | | (172 | ) |
| | | | | | | | |
Total | | $ | 333 | | | $ | (172 | ) |
| | | | | | | | |
| * | Includes cumulative appreciation/depreciation of futures contracts as reported in Schedule of Investments. Only current day’s variation margin is reported within the Statements of Assets & Liabilities. |
For further disclosure on derivatives see note 2 in Notes to Financial Statements.
See accompanying notes which are an integral part of the financial statements.
| | | | |
| | 90 | | | Global Real Estate Securities Fund |
Russell Investment Funds
Notes to Schedules of Investments — December 31, 2011
Footnotes:
| (Æ) | Nonincome-producing security. |
| (ö) | Real Estate Investment Trust (REIT). |
| () | Rate noted is yield-to-maturity from date of acquisition. |
| (ç) | At amortized cost, which approximates market. |
| (Ê) | Adjustable or floating rate security. Rate shown reflects rate in effect at period end. |
| (ƒ) | Perpetual floating rate security. Rate shown reflects rate in effect at period end. |
| (µ) | Bond is insured by a guarantor. |
| (Ñ) | All or a portion of the shares of this security are on loan. |
| (×) | The security is purchased with the cash collateral from the securities loaned. |
| (Þ) | Restricted security. Security may have contractual restrictions on resale, may have been offered in a private placement transaction, and may not be registered under the Securities Act of 1933. |
| (Å) | Illiquid and restricted security. |
| (å) | Currency balances were held in connection with futures contracts purchased (sold), options written, or swaps entered into by the Fund. See Note 2. |
Abbreviations:
144A - Represents private placement security for qualified buyers according to rule 144A of the Securities Act of 1933.
ADR - American Depositary Receipt
BBSW - Bank Bill Swap Reference Rate
CME - Chicago Mercantile Exchange
EMU - European Economic and Monetary Union
EURIBOR - Euro Interbank Offered Rate
GDR - Global Depositary Receipt
LIBOR - London Interbank Offered Rate
REMIC - Real Estate Mortgage Investment Conduit
STRIP - Separate Trading of Registered Interest and Principal of Securities.
TBA - To Be Announced Security
UK - United Kingdom
Foreign Currency Abbreviations:
| | | | |
| ARS - Argentine peso | | HUF - Hungarian forint | | PKR - Pakistani rupee |
| AUD - Australian dollar | | IDR - Indonesian rupiah | | PLN - Polish zloty |
| BRL - Brazilian real | | ILS - Israeli shekel | | RUB - Russian ruble |
| CAD - Canadian dollar | | INR - Indian rupee | | SEK - Swedish krona |
| CHF - Swiss franc | | ISK - Iceland krona | | SGD - Singapore dollar |
| CLP - Chilean peso | | ITL - Italian lira | | SKK - Slovakian koruna |
| CNY - Chinese renminbi yuan | | JPY - Japanese yen | | THB - Thai baht |
| COP - Colombian peso | | KES - Kenyan schilling | | TRY - Turkish lira |
| CRC - Costa Rica colon | | KRW - South Korean won | | TWD - Taiwanese dollar |
| CZK - Czech koruna | | MXN - Mexican peso | | USD - United States dollar |
| DKK - Danish krone | | MYR - Malaysian ringgit | | VEB - Venezuelan bolivar |
| EGP - Egyptian pound | | NOK - Norwegion krone | | VND - Vietnam dong |
| EUR - Euro | | NZD - New Zealand dollar | | ZAR - South African rand |
| GBP - British pound sterling | | PEN - Peruvian nouveau sol | | |
| HKD - Hong Kong dollar | | PHP - Philippine peso | | |
| | |
| Notes to Schedules of Investments | | 91 |
Russell Investment Funds
Statements of Assets and Liabilities — December 31, 2011
| | | | | | | | | | | | | | | | | | | | |
| Amounts in thousands | | Multi-Style Equity
Fund | | | Aggressive Equity
Fund | | | Non-U.S. Fund | | | Core Bond Fund | | | Global Real Estate
Securities Fund | |
| | | | | | | | | | | | | | | | | | | | |
Assets | | | | | | | | | | | | | | | | | | | | |
Investments, at identified cost | | $ | 347,137 | | | $ | 169,923 | | | $ | 359,016 | | | $ | 583,080 | | | $ | 461,968 | |
Investments, at market value***,******* | | | 374,695 | | | | 182,908 | | | | 352,446 | | | | 586,558 | | | | 495,581 | |
Cash | | | — | | | | — | | | | — | | | | — | | | | — | |
Cash (restricted) | | | 1,750 | | | | 800 | | | | 2,700 | | | | 753 | | | | 1,570 | |
Foreign currency holdings* | | | — | | | | — | | | | 98 | | | | 85 | | | | 1,465 | |
Unrealized appreciation on foreign currency exchange contracts | | | — | | | | — | | | | 57 | | | | 551 | | | | 14 | |
Receivables: | | | | | | | | | | | | | | | | | | | | |
Dividends and interest | | | 506 | | | | 161 | | | | 640 | | | | 3,654 | | | | 1,974 | |
Dividends from affiliated Russell money market funds | | | 2 | | | | — | | | | 3 | | | | 7 | | | | 2 | |
Investments sold | | | 1,106 | | | | 6,580 | | | | 297 | | | | 44,705 | | | | 1,256 | |
Fund shares sold | | | 18 | | | | 47 | | | | 118 | | | | 93 | | | | 90 | |
Foreign taxes recoverable | | | — | | | | — | | | | 92 | | | | — | | | | 21 | |
Investments matured****** | | | — | | | | — | | | | — | | | | 306 | | | | — | |
Variation margin on futures contracts | | | — | | | | — | | | | 228 | | | | 276 | | | | 221 | |
Other receivable | | | — | | | | — | | | | 7 | | | | 2 | | | | — | |
Prepaid expenses | | | — | | | | 4 | | | | — | | | | — | | | | — | |
Interest rate swap contracts, at market value***** | | | — | | | | — | | | | — | | | | 774 | | | | — | |
Credit default swap contracts, at market value**** | | | — | | | | — | | | | — | | | | 1,545 | | | | — | |
| | | | | | | | | | | | | | | | | | | | |
Total assets | | | 378,077 | | | | 190,500 | | | | 356,686 | | | | 639,309 | | | | 502,194 | |
| | | | | | | | | | | | | | | | | | | | |
| | | | | |
Liabilities | | | | | | | | | | | | | | | | | | | | |
Payables: | | | | | | | | | | | | | | | | | | | | |
Due to custodian | | | — | | | | — | | | | — | | | | 39 | | | | 1 | |
Due to broker | | | — | | | | — | | | | — | | | | 1,903 | | | | — | |
Investments purchased | | | 1,729 | | | | 7,214 | | | | 1,573 | | | | 84,087 | | | | 586 | |
Fund shares redeemed | | | 53 | | | | 12 | | | | 14 | | | | — | | | | 21 | |
Accrued fees to affiliates | | | 249 | | | | 134 | | | | 251 | | | | 245 | | | | 338 | |
Other accrued expenses | | | 19 | | | | 33 | | | | 83 | | | | 113 | | | | 85 | |
Variation margin on futures contracts | | | 45 | | | | 25 | | | | 8 | | | | 12 | | | | 41 | |
Deferred tax liability | | | — | | | | — | | | | 28 | | | | — | | | | — | |
Unrealized depreciation on foreign currency exchange contracts | | | — | | | | — | | | | 451 | | | | 281 | | | | 188 | |
Options written, at market value** | | | — | | | | — | | | | — | | | | 205 | | | | — | |
Payable upon return of securities loaned | | | 2,590 | | | | 6,047 | | | | 24,700 | | | | 5,382 | | | | 29,970 | |
Interest rate swap contracts, at market value***** | | | — | | | | — | | | | — | | | | 711 | | | | — | |
Credit default swap contracts, at market value**** | | | — | | | | — | | | | — | | | | 723 | | | | — | |
| | | | | | | | | | | | | | | | | | | | |
Total liabilities | | | 4,685 | | | | 13,465 | | | | 27,108 | | | | 93,701 | | | | 31,230 | |
| | | | | | | | | | | | | | | | | | | | |
| | | | | | | | | | | | | | | | | | | | |
Net Assets | | $ | 373,392 | | | $ | 177,035 | | | $ | 329,578 | | | $ | 545,608 | | | $ | 470,964 | |
| | | | | | | | | | | | | | | | | | | | |
See accompanying notes which are an integral part of the financial statements.
| | | | |
| | 92 | | | Statements of Assets and Liabilities |
| | | | | | | | | | | | | | | | | | | | |
| Amounts in thousands | | Multi-Style Equity
Fund | | | Aggressive
Equity Fund | | | Non-U.S. Fund | | | Core Bond Fund | | | Global Real Estate Securities Fund | |
Net Assets Consist of: | | | | | | | | | | | | | | | | | | | | |
Undistributed (overdistributed) net investment income | | $ | 1,098 | | | | — | | | $ | 4,090 | | | $ | 1,403 | | | $ | 1,839 | |
Accumulated net realized gain (loss) | | | (58,264 | ) | | | (36,502 | ) | | | (97,422 | ) | | | 1,988 | | | | (36,833 | ) |
Unrealized appreciation (depreciation) on: | | | | | | | | | | | | | | | | | | | | |
Investments (Russell non-U.S. Funds — net of deferred tax liability for foreign capital gains taxes)(a) | | | 27,558 | | | | 12,985 | | | | (6,598 | ) | | | 3,478 | | | | 33,613 | |
Futures contracts | | | 23 | | | | 24 | | | | 93 | | | | 724 | | | | 333 | |
Options written | | | — | | | | — | | | | — | | | | 547 | | | | — | |
Credit default swap contracts | | | — | | | | — | | | | — | | | | (1,019 | ) | | | — | |
Interest rate swap contracts | | | — | | | | — | | | | — | | | | 110 | | | | — | |
Investments matured | | | — | | | | — | | | | — | | | | (894 | ) | | | — | |
Foreign currency-related transactions | | | — | | | | — | | | | (407 | ) | | | 258 | | | | (177 | ) |
Other investments | | | — | | | | — | | | | 7 | | | | 2 | | | | — | |
Shares of beneficial interest | | | 282 | | | | 156 | | | | 377 | | | | 521 | | | | 372 | |
Additional paid-in capital | | | 402,695 | | | | 200,372 | | | | 429,438 | | | | 538,490 | | | | 471,817 | |
| | | | | | | | | | | | | | | | | | | | |
Net Assets | | $ | 373,392 | | | $ | 177,035 | | | $ | 329,578 | | | $ | 545,608 | | | $ | 470,964 | |
| | | | | | | | | | | | | | | | | | | | |
Net Asset Value, offering and redemption price per share: | | | | | | | | | | | | | | | | | |
Net asset value per share: | | $ | 13.24 | | | $ | 11.36 | | | $ | 8.75 | | | $ | 10.47 | | | $ | 12.65 | |
Net assets | | $ | 373,391,586 | | | $ | 177,035,079 | | | $ | 329,578,459 | | | $ | 545,607,580 | | | $ | 470,964,369 | |
Shares outstanding ($.01 par value) | | | 28,191,732 | | | | 15,580,827 | | | | 37,673,589 | | | | 52,091,006 | | | | 37,240,988 | |
Amounts in thousands | | | | | | | | | | | | | | | | | | | | |
| | | | | | | | | | | | | | | | | | | | |
* Foreign currency holdings - cost | | $ | — | | | $ | — | | | $ | 100 | | | $ | 86 | | | $ | 1,475 | |
** Premiums received on options written | | $ | — | | | $ | — | | | $ | — | | | $ | 752 | | | $ | — | |
*** Securities on loan included in investments | | $ | 3,282 | | | $ | 7,070 | | | $ | 24,163 | | | $ | 5,269 | | | $ | 28,547 | |
**** Credit default swap contracts - premiums paid (received) | | $ | — | | | $ | — | | | $ | — | | | $ | 1,841 | | | $ | — | |
***** Interest rate swap contracts - premiums paid (received) | | $ | — | | | $ | — | | | $ | — | | | $ | (47 | ) | | $ | — | |
****** Investments matured - cost | | $ | — | | | $ | — | | | $ | — | | | $ | 1,200 | | | $ | — | |
******* Investments in affiliates, Russell U.S. Cash Management Fund, Russell Investment Funds Liquidating Trust, and Russell U.S. Cash Collateral Fund | | $ | 12,749 | | | $ | 11,978 | | | $ | 47,867 | | | $ | 45,882 | | | $ | 46,824 | |
| (a) | Non-U.S. Funds include Non-U.S. Fund and Global Real Estate Securities Fund. |
See accompanying notes which are an integral part of the financial statements.
| | |
| Statements of Assets and Liabilities | | 93 |
Russell Investment Funds
Statements of Operations — For the Period Ended December 31, 2011
| | | | | | | | | | | | | | | | | | | | |
| Amounts in thousands | | Multi-Style
Equity Fund | | | Aggressive
Equity Fund | | | Non-U.S.
Fund | | | Core Bond
Fund | | | Global Real Estate
Securities Fund | |
| | | | | | | | | | | | | | | | | | | | |
Investment Income | | | | | | | | | | | | | | | | | | | | |
Dividends | | $ | 7,330 | | | $ | 2,563 | | | $ | 10,531 | | | $ | 4 | | | $ | 15,661 | |
Dividends from affiliated Russell money market funds | | | 15 | | | | 8 | | | | 25 | | | | 55 | | | | 12 | |
Interest | | | — | | | | — | | | | — | | | | 20,027 | | | | 9 | |
Securities lending income | | | 82 | | | | 45 | | | | 385 | | | | 10 | | | | 227 | |
Other reimbursement | | | 7 | | | | 4 | | | | 13 | | | | 26 | | | | 6 | |
Less foreign taxes withheld | | | — | | | | — | | | | (868 | ) | | | — | | | | (739 | ) |
| | | | | | | | | | | | | | | | | | | | |
Total investment income | | | 7,434 | | | | 2,620 | | | | 10,086 | | | | 20,122 | | | | 15,176 | |
| | | | | | | | | | | | | | | | | | | | |
| | | | | |
Expenses | | | | | | | | | | | | | | | | | | | | |
Advisory fees | | | 2,874 | | | | 1,696 | | | | 3,252 | | | | 2,805 | | | | 3,955 | |
Administrative fees | | | 197 | | | | 94 | | | | 181 | | | | 255 | | | | 247 | |
Custodian fees | | | 161 | | | | 129 | | | | 316 | | | | 399 | | | | 318 | |
Transfer agent fees | | | 17 | | | | 8 | | | | 16 | | | | 22 | | | | 22 | |
Professional fees | | | 64 | | | | 55 | | | | 98 | | | | 86 | | | | 76 | |
Trustees’ fees | | | 8 | | | | 4 | | | | 8 | | | | 11 | | | | 11 | |
Printing fees | | | 18 | | | | 29 | | | | 64 | | | | 91 | | | | 58 | |
Miscellaneous | | | 24 | | | | 14 | | | | 23 | | | | 26 | | | | 34 | |
| | | | | | | | | | | | | | | | | | | | |
Expenses before reductions | | | 3,363 | | | | 2,029 | | | | 3,958 | | | | 3,695 | | | | 4,721 | |
Expense reductions | | | (— | )* | | | (113 | ) | | | (217 | ) | | | (357 | ) | | | (— | )* |
| | | | | | | | | | | | | | | | | | | | |
Net expenses | | | 3,363 | | | | 1,916 | | | | 3,741 | | | | 3,338 | | | | 4,721 | |
| | | | | | | | | | | | | | | | | | | | |
Net investment income (loss) | | | 4,071 | | | | 704 | | | | 6,345 | | | | 16,784 | | | | 10,455 | |
| | | | | | | | | | | | | | | | | | | | |
| | | | | |
Net Realized and Unrealized Gain (Loss) | | | | | | | | | | | | | | | | | | | | |
Net realized gain (loss) on: | | | | | | | | | | | | | | | | | | | | |
Investments (Russell non-U.S. funds - net of deferred tax liability for foreign capital gains taxes) | | | 36,112 | | | | 15,273 | | |
|
7,916 |
| | | 7,483 | | | | 1,011 | |
Futures contracts | | | (804 | ) | | | (427 | ) | | | (3,234 | ) | | | 6,072 | | | | (1,381 | ) |
Options written | | | — | | | | — | | | | — | | | | (1,555 | ) | | | — | |
Credit default swap contracts | | | — | | | | — | | | | — | | | | 157 | | | | — | |
Interest rate swap contracts | | | — | | | | — | | | | — | | | | (2,844 | ) | | | — | |
Foreign currency-related transactions | | | — | | | | — | | | | 51 | | | | 174 | | | | (367 | ) |
| | | | | | | | | | | | | | | | | | | | |
Net realized gain (loss) | | | 35,308 | | | | 14,846 | | | | 4,733 | | | | 9,487 | | | | (737 | ) |
| | | | | | | | | | | | | | | | | | | | |
Net change in unrealized appreciation (depreciation) on: | | | | | | | | | | | | | | | | | | | | |
Investments (Russell non-U.S. funds - net of deferred tax liability for foreign capital gains taxes) | | | (45,159 | ) | | | (22,877 | ) | |
|
(57,927 |
) | | | (4,648 | ) | | | (45,188 | ) |
Futures contracts | | | (151 | ) | | | (98 | ) | | | 82 | | | | 1,127 | | | | 333 | |
Options written | | | — | | | | — | | | | — | | | | 775 | | | | — | |
Credit default swap contracts | | | — | | | | — | | | | — | | | | (435 | ) | | | — | |
Interest rate swap contracts | | | — | | | | — | | | | — | | | | 215 | | | | — | |
Investment matured | | | — | | | | — | | | | — | | | | 31 | | | | — | |
Foreign currency-related transactions | | | — | | | | — | | | | (661 | ) | | | 36 | | | | (251 | ) |
| | | | | | | | | | | | | | | | | | | | |
Net change in unrealized appreciation (depreciation) | | | (45,310 | ) | | | (22,975 | ) | | | (58,506 | ) | | | (2,899 | ) | | | (45,106 | ) |
| | | | | | | | | | | | | | | | | | | | |
Net realized and unrealized gain (loss) | | | (10,002 | ) | | | (8,129 | ) | | | (53,773 | ) | | | 6,588 | | | | (45,843 | ) |
| | | | | | | | | | | | | | | | | | | | |
Net Increase (Decrease) in Net Assets from Operations | | $ | (5,931 | ) | | $ | (7,425 | ) | | $ | (47,428 | ) | | $ | 23,372 | | | $ | (35,388 | ) |
| | | | | | | | | | | | | | | | | | | | |
* Less than $500. | | | | | | | | | | | | | | | | | | | | |
See accompanying notes which are an integral part of the financial statements.
| | | | |
| | 94 | | | Statements of Operations |
(This page intentionally left blank)
Russell Investment Funds
Statements of Changes in Net Assets — For the Periods Ended December 31,
| | | | | | | | | | | | | | | | |
| | | Multi-Style Equity Fund | | | Aggressive Equity Fund | |
| Amounts in thousands | | 2011 | | | 2010 | | | 2011 | | | 2010 | |
| | | | | | | | | | | | | | | | |
Increase (Decrease) in Net Assets | | | | | | | | | | | | | | | | |
| | | | |
Operations | | | | | | | | | | | | | | | | |
Net investment income (loss) | | $ | 4,071 | | | $ | 3,462 | | | $ | 704 | | | $ | 740 | |
Net realized gain (loss) | | | 35,308 | | | | 28,981 | | | | 14,846 | | | | 22,788 | |
Net change in unrealized appreciation (depreciation) | | | (45,310 | ) | | | 24,656 | | | | (22,975 | ) | | | 14,828 | |
| | | | | | | | | | | | | | | | |
Net increase (decrease) in net assets from operations | | | (5,931 | ) | | | 57,099 | | | | (7,425 | ) | | | 38,356 | |
| | | | | | | | | | | | | | | | |
| | | | |
Distributions | | | | | | | | | | | | | | | | |
From net investment income | | | (3,847 | ) | | | (3,360 | ) | | | (943 | ) | | | (778 | ) |
From net realized gain | | | — | | | | — | | | | — | | | | — | |
| | | | | | | | | | | | | | | | |
Net decrease in net assets from distributions | | | (3,847 | ) | | | (3,360 | ) | | | (943 | ) | | | (778 | ) |
| | | | | | | | | | | | | | | | |
| | | | |
Share Transactions | | | | | | | | | | | | | | | | |
Net increase (decrease) in net assets from share transactions | | | (17,504 | ) | | | (30,019 | ) | | | (6,475 | ) | | | (4,486 | ) |
Fund Reimbursements | | | 203 | | | | — | | | | 115 | | | | — | |
| | | | | | | | | | | | | | | | |
Total Net Increase (Decrease) in Net Assets | | | (27,079 | ) | | | 23,720 | | | | (14,728 | ) | | | 33,092 | |
| | | | |
Net Assets | | | | | | | | | | | | | | | | |
Beginning of period | | | 400,471 | | | | 376,751 | | | | 191,763 | | | | 158,671 | |
| | | | | | | | | | | | | | | | |
End of period | | $ | 373,392 | | | $ | 400,471 | | | $ | 177,035 | | | $ | 191,763 | |
| | | | | | | | | | | | | | | | |
Undistributed (overdistributed) net investment income included in net assets | | $ | 1,098 | | | $ | 876 | | | $ | — | | | $ | 128 | |
See accompanying notes which are an integral part of the financial statements.
| | | | |
| | 96 | | | Statements of Changes in Net Assets |
| | | | | | | | | | | | | | | | | | | | | | |
| Non-U.S. Fund | | | Core Bond Fund | | | Global Real Estate
Securities Fund | |
| 2011 | | | 2010 | | | 2011 | | | 2010 | | | 2011 | | | 2010 | |
| | | | | | | | | | | | | | | | | | | | | | |
| | | | | | | | | | | | | | | | | | | | | | |
| | | | | |
| | | | | | | | | | | | | | | | | | | | | | |
| $ | 6,345 | | | $ | 4,253 | | | $ | 16,784 | | | $ | 15,453 | | | $ | 10,455 | | | $ | 11,746 | |
| | 4,733 | | | | 3,650 | | | | 9,487 | | | | 11,940 | | | | (737 | ) | | | 84,972 | |
| | (58,506 | ) | | | 29,671 | | | | (2,899 | ) | | | 13,660 | | | | (45,106 | ) | | | (4,335 | ) |
| | | | | | | | | | | | | | | | | | | | | | |
| | (47,428 | ) | | | 37,574 | | | | 23,372 | | | | 41,053 | | | | (35,388 | ) | | | 92,383 | |
| | | | | | | | | | | | | | | | | | | | | | |
| | | | | |
| | | | | | | | | | | | | | | | | | | | | | |
| | (6,022 | ) | | | (2,908 | ) | | | (16,396 | ) | | | (16,869 | ) | | | (11,195 | ) | | | (9,960 | ) |
| | — | | | | — | | | | (9,204 | ) | | | (12,359 | ) | | | — | | | | — | |
| | | | | | | | | | | | | | | | | | | | | | |
| | (6,022 | ) | | | (2,908 | ) | | | (25,600 | ) | | | (29,228 | ) | | | (11,195 | ) | | | (9,960 | ) |
| | | | | | | | | | | | | | | | | | | | | | |
| | | | | |
| | | | | | | | | | | | | | | | | | | | | | |
|
16,122 |
| | | 10,059 | | | | 75,878 | | | | 59,504 | | | | 23,302 | | | | 765 | |
| | 36 | | | | — | | | | 60 | | | | — | | | | 349 | | | | — | |
| | | | | | | | | | | | | | | | | | | | | | |
| | (37,292 | ) | | | 44,725 | | | | 73,710 | | | | 71,329 | | | | (22,932 | ) | | | 83,188 | |
| | | | | |
| | | | | | | | | | | | | | | | | | | | | | |
| | 366,870 | | | | 322,145 | | | | 471,898 | | | | 400,569 | | | | 493,896 | | | | 410,708 | |
| | | | | | | | | | | | | | | | | | | | | | |
| $ | 329,578 | | | $ | 366,870 | | | $ | 545,608 | | | $ | 471,898 | | | $ | 470,964 | | | $ | 493,896 | |
| | | | | | | | | | | | | | | | | | | | | | |
$ |
4,090 |
| | $ | 3,754 | | | $ | 1,403 | | | $ | 683 | | | $ | 1,839 | | | $ | 1,865 | |
See accompanying notes which are an integral part of the financial statements.
| | |
| Statements of Changes in Net Assets | | 97 |
Russell Investment Funds
Financial Highlights
For a Share Outstanding Throughout the Period
| | | | | | | | | | | | | | | | | | | | | | | | |
| | |
$
Net Asset Value,
Beginning of
Period | | | $
Net
Investment
Income (Loss)(a) | | | $
Net Realized
and Unrealized
Gain (Loss) | | | $
Total from
Investment
Operations | | | $
Distributions
from Net
Investment Income | | | $
Distributions
from Net
Realized Gain | |
Multi-Style Equity Fund | | | | | | | | | | | | | | | | | | | | | |
December 31, 2011 | | | 13.58 | | | | .14 | | | | (.35 | ) | | | (.21 | ) | | | (.13 | ) | | | — | |
December 31, 2010 | | | 11.77 | | | | .11 | | | | 1.81 | | | | 1.92 | | | | (.11 | ) | | | — | |
December 31, 2009 | | | 9.00 | | | | .10 | | | | 2.80 | | | | 2.90 | | | | (.13 | ) | | | — | |
December 31, 2008 | | | 15.65 | | | | .19 | | | | (6.52 | ) | | | (6.33 | ) | | | (.19 | ) | | | (.13 | ) |
December 31, 2007 | | | 14.93 | | | | .16 | | | | 1.37 | | | | 1.53 | | | | (.16 | ) | | | (.65 | ) |
Aggressive Equity Fund | | | | | | | | | | | | | | | | | | | | | |
December 31, 2011 | | | 11.92 | | | | .04 | | | | (.54 | ) | | | (.50 | ) | | | (.06 | ) | | | — | |
December 31, 2010 | | | 9.59 | | | | .04 | | | | 2.34 | | | | 2.38 | | | | (.05 | ) | | | — | |
December 31, 2009 | | | 7.18 | | | | .05 | | | | 2.40 | | | | 2.45 | | | | (.04 | ) | | | — | |
December 31, 2008 | | | 12.99 | | | | .09 | | | | (5.81 | ) | | | (5.72 | ) | | | (.09 | ) | | | — | (c) |
December 31, 2007 | | | 14.45 | | | | .06 | | | | .40 | | | | .46 | | | | (.05 | ) | | | (1.87 | ) |
Non-U.S. Fund | | | | | | | | | | | | | | | | | | | | | |
December 31, 2011 | | | 10.21 | | | | .17 | | | | (1.46 | ) | | | (1.29 | ) | | | (.17 | ) | | | — | |
December 31, 2010 | | | 9.25 | | | | .12 | | | | .92 | | | | 1.04 | | | | (.08 | ) | | | — | |
December 31, 2009 | | | 7.48 | | | | .12 | | | | 1.88 | | | | 2.00 | | | | (.23 | ) | | | — | |
December 31, 2008 | | | 13.20 | | | | .21 | | | | (5.83 | ) | | | (5.62 | ) | | | — | | | | (.10 | ) |
December 31, 2007 | | | 15.01 | | | | .25 | | | | 1.14 | | | | 1.39 | | | | (.38 | ) | | | (2.82 | ) |
Core Bond Fund | | | | | | | | | | | | | | | | | | | | | |
December 31, 2011 | | | 10.51 | | | | .35 | | | | .14 | | | | .49 | | | | (.34 | ) | | | (.19 | ) |
December 31, 2010 | | | 10.20 | | | | .37 | | | | .63 | | | | 1.00 | | | | (.40 | ) | | | (.29 | ) |
December 31, 2009 | | | 9.33 | | | | .44 | | | | 1.02 | | | | 1.46 | | | | (.46 | ) | | | (.13 | ) |
December 31, 2008 | | | 10.32 | | | | .47 | | | | (.86 | ) | | | (.39 | ) | | | (.39 | ) | | | (.21 | ) |
December 31, 2007 | | | 10.14 | | | | .51 | | | | .20 | | | | .71 | | | | (.53 | ) | | | — | |
Global Real Estate Securities Fund | | | | | | | | | | | | | | | | | | | | | |
December 31, 2011 | | | 13.92 | | | | .29 | | | | (1.25 | ) | | | (.96 | ) | | | (.31 | ) | | | — | |
December 31, 2010 | | | 11.58 | | | | .33 | | | | 2.29 | | | | 2.62 | | | | (.28 | ) | | | — | |
December 31, 2009 | | | 9.30 | | | | .30 | | | | 2.41 | | | | 2.71 | | | | (.43 | ) | | | — | |
December 31, 2008 | | | 15.22 | | | | .38 | | | | (6.03 | ) | | | (5.65 | ) | | | (.27 | ) | | | — | |
December 31, 2007 | | | 21.34 | | | | .35 | | | | (3.68 | ) | | | (3.33 | ) | | | (.47 | ) | | | (2.32 | ) |
See accompanying notes which are an integral part of the financial statements.
| | | | | | | | | | | | | | | | | | | | | | | | | | | | | | |
$
Total
Distributions | | | $
Net Asset Value,
End of
Period | | | %
Total
Return(d) | | | $
Net Assets,
End of Period
(000) | | | %
Ratio of Expenses
to Average
Net Assets,
Gross | | | %
Ratio of Expenses
to Average
Net Assets,
Net(b) | | | %
Ratio of Net
Investment Income
to Average
Net Assets | | | %
Portfolio
Turnover Rate | |
| | | | | | | | | | | | | | | | | | | | | | | | | | | | | | |
| | (.13 | ) | | | 13.24 | | | | (1.55 | ) | | | 373,392 | | | | .85 | | | | .85 | | | | 1.03 | | | | 133 | |
| | (.11 | ) | | | 13.58 | | | | 16.46 | | | | 400,471 | | | | .89 | | | | .89 | | | | .93 | | | | 105 | |
| | (.13 | ) | | | 11.77 | | | | 32.72 | | | | 376,751 | | | | .86 | | | | .85 | | | | 1.06 | | | | 136 | |
| | (.32 | ) | | | 9.00 | | | | (41.15 | ) | | | 298,211 | | | | .89 | | | | .87 | | | | 1.50 | | | | 135 | |
| | (.81 | ) | | | 15.65 | | | | 10.36 | | | | 479,922 | | | | .87 | | | | .87 | | | | 1.04 | | | | 136 | |
| | | | | | | | | | | | | | | | | | | | | | | | | | | | | | |
| | (.06 | ) | | | 11.36 | | | | (4.20 | ) | | | 177,035 | | | | 1.08 | | | | 1.02 | | | | .37 | | | | 105 | |
| | (.05 | ) | | | 11.92 | | | | 24.88 | | | | 191,763 | | | | 1.11 | | | | 1.05 | | | | .44 | | | | 107 | |
| | (.04 | ) | | | 9.59 | | | | 34.32 | | | | 158,671 | | | | 1.13 | | | | 1.02 | | | | .65 | | | | 161 | |
| | (.09 | ) | | | 7.18 | | | | (44.16 | ) | | | 123,088 | | | | 1.18 | | | | 1.05 | | | | .84 | | | | 161 | |
| | (1.92 | ) | | | 12.99 | | | | 3.42 | | | | 228,927 | | | | 1.13 | | | | 1.05 | | | | .39 | | | | 180 | |
| | | | | | | | | | | | | | | | | | | | | | | | | | | | | | |
| | (.17 | ) | | | 8.75 | | | | (12.88 | ) | | | 329,578 | | | | 1.10 | | | | 1.04 | | | | 1.74 | | | | 49 | |
| | (.08 | ) | | | 10.21 | | | | 11.42 | | | | 366,870 | | | | 1.12 | | | | 1.06 | | | | 1.30 | | | | 49 | |
| | (.23 | ) | | | 9.25 | | | | 27.33 | | | | 322,145 | | | | 1.12 | | | | 1.04 | | | | 1.56 | | | | 133 | |
| | (.10 | ) | | | 7.48 | | | | (42.79 | ) | | | 255,750 | | | | 1.21 | | | | 1.15 | | | | 2.01 | | | | 123 | |
| | (3.20 | ) | | | 13.20 | | | | 10.12 | | | | 431,686 | | | | 1.18 | | | | 1.15 | | | | 1.70 | | | | 106 | |
| | | | | | | | | | | | | | | | | | | | | | | | | | | | | | |
| | (.53 | ) | | | 10.47 | | | | 4.68 | | | | 545,608 | | | | .72 | | | | .65 | | | | 3.29 | | | | 203 | |
| | (.69 | ) | | | 10.51 | | | | 10.02 | | | | 471,898 | | | | .75 | | | | .68 | | | | 3.48 | | | | 195 | |
| | (.59 | ) | | | 10.20 | | | | 16.18 | | | | 400,569 | | | | .73 | | | | .66 | | | | 4.49 | | | | 151 | |
| | (.60 | ) | | | 9.33 | | | | (3.87 | ) | | | 319,109 | | | | .77 | | | | .70 | | | | 4.70 | | | | 164 | |
| | (.53 | ) | | | 10.32 | | | | 7.24 | | | | 346,067 | | | | .78 | | | | .70 | | | | 5.04 | | | | 965 | |
| | | | | | | | | | | | | | | | | | | | | | | | | | | | | | |
| | (.31 | ) | | | 12.65 | | | | (7.05 | ) | | | 470,964 | | | | .95 | | | | .95 | | | | 2.11 | | | | 57 | |
| | (.28 | ) | | | 13.92 | | | | 22.92 | | | | 493,896 | | | | .99 | | | | .99 | | | | 2.62 | | | | 150 | |
| | (.43 | ) | | | 11.58 | | | | 31.16 | | | | 410,708 | | | | .97 | | | | .97 | | | | 3.36 | | | | 110 | |
| | (.27 | ) | | | 9.30 | | | | (37.76 | ) | | | 303,416 | | | | .96 | | | | .96 | | | | 2.72 | | | | 71 | |
| | (2.79 | ) | | | 15.22 | | | | (15.86 | ) | | | 488,809 | | | | .92 | | | | .92 | | | | 1.75 | | | | 77 | |
See accompanying notes which are an integral part of the financial statements.
Russell Investment Funds
Notes to Financial Highlights — December 31, 2011
| (a) | Average daily shares outstanding were used for this calculation. |
| (b) | May reflect amounts waived and/or reimbursed by RIMCo, and for certain funds, custody credit arrangements. |
| (c) | Less than $.01 per share. |
| (d) | The total return does not reflect any Insurance Company Separate Account or Policy Charges. |
See accompanying notes which are an integral part of the financial statements.
| | | | |
| | 100 | | | Notes to Financial Highlights |
Russell Investment Funds
Notes to Financial Statements — December 31, 2011
Russell Investment Funds (the “Investment Company” or “RIF”) is a series investment company with 10 different investment portfolios referred to as Funds. These financial statements report on five of these Funds (each a “Fund” and collectively the “Funds”). The Investment Company provides the investment base for one or more variable insurance products issued by one or more insurance companies. These Funds are offered at net asset value (“NAV”) to qualified insurance company separate accounts offering variable insurance products. The Investment Company is registered under the Investment Company Act of 1940, as amended, as an open-end management investment company. It is organized and operated as a Massachusetts business trust under an Amended and Restated Master Trust Agreement dated October 1, 2008 (“Master Trust Agreement”), as amended. The Investment Company’s Master Trust Agreement permits the Board of Trustees (the “Board”) to issue an unlimited number of shares of beneficial interest.
2. Significant Accounting Policies
The Funds’ financial statements are prepared in accordance with U.S. generally accepted accounting principles (“U.S. GAAP”), which require the use of management estimates and assumptions at the date of the financial statements. Actual results could differ from those estimates. The following is a summary of the significant accounting policies consistently followed by each Fund in the preparation of its financial statements.
Security Valuation
The Funds value portfolio securities according to Board-approved securities valuation procedures which include market and fair value procedures. Debt obligation securities maturing within 60 days at the time of purchase are priced using the amortized cost method of valuation, unless the Board determines that amortized cost does not represent the market value of such short-term debt obligations. The Board has delegated the responsibility for administration of the securities valuation procedures to Russell Fund Services Company (“RFSC”).
U.S. GAAP defines fair market value as the price that a Fund would receive to sell an asset or pay to transfer a liability in an orderly transaction between market participants at the measurement date. It establishes a fair value hierarchy that prioritizes inputs to valuation methods and requires a separate disclosure of the fair value hierarchy, for each major category of assets and liabilities, that segregates fair value measurements into levels (Level 1, 2, and 3). The inputs or methodology used for valuing securities are not necessarily an indication of the risk associated with investing in those securities. Levels 1, 2 and 3 of the fair value hierarchy are defined as follows:
| | • | | Level 1 — Inputs using quoted prices in active markets or exchanges for identical assets and liabilities. |
| | • | | Level 2 — Significant other observable inputs, which may include, but are not limited to, quoted prices for similar assets or liabilities in markets that are active, quoted prices for identical or similar assets or liabilities in markets that are non-active, inputs other than quoted prices that are observable for the assets or liabilities (such as interest rates, yield curves, volatilities, prepayment speeds, loss severities, credit risks and default rates) or other market corroborated inputs. |
| | • | | Level 3 — Significant unobservable inputs based on the best information available in the circumstances, to the extent observable inputs are not available, which may include assumptions made by the Board or persons acting at their direction that are used in determining the fair market value of investments. |
The valuation techniques and significant inputs used in determining the fair market values of financial instruments classified as Level 1 and Level 2 of the fair value hierarchy are as follows:
Common stocks, exchange traded funds and derivatives that are traded on a national securities exchange are stated at the last reported sale or settlement price on the day of valuation. To the extent these securities are actively traded and valuation adjustments are not applied, they are categorized as Level 1 of the fair value hierarchy.
Fixed income securities including corporate, convertible and municipal bonds and notes, U.S. government agencies, U.S. Treasury obligations, sovereign issues, bank loans, bank notes and non-U.S. bonds are normally valued by pricing service providers that use broker-dealer quotations or valuation estimates from their internal pricing models. The service providers’ internal models use inputs that are observable, such as issuer details, interest rates, yield curves, prepayment speeds, credit risks/spreads and default rates. Securities that use similar valuation techniques and inputs as described above are categorized as Level 2 of the fair value hierarchy.
Fixed income securities purchased on a delayed-delivery basis and marked-to-market daily until settlement at the forward settlement date are categorized as Level 2 of the fair value hierarchy.
| | |
| Notes to Financial Statements | | 101 |
Russell Investment Funds
Notes to Financial Statements, continued — December 31, 2011
Mortgage and asset-backed securities are usually issued as separate tranches, or classes, of securities within each deal. These securities are also normally valued by pricing service providers that use broker-dealer quotations or valuation estimates from their internal pricing models. The pricing models for these securities usually consider tranche-level attributes, estimated cash flows of each tranche, market-based yield spreads for each tranche, current market data and incorporate deal collateral performance, as available. Mortgage and asset-backed securities that use similar valuation techniques and inputs as described above are categorized as Level 2 of the fair value hierarchy.
Investments in privately held investment funds will be valued based upon the NAV of such investments and are categorized as Level 2 of the fair value hierarchy. The Funds have adopted the authoritative guidance under U.S. GAAP for estimating the fair value of investments in funds that have calculated NAV per share in accordance with the specialized accounting guidance for investment companies. Accordingly, while NAV per share of an investment may not be determinative of fair value, as defined by U.S. GAAP, the Funds estimate the fair value of an investment in a fund using the NAV per share of the investment (or its equivalent) without further adjustment as a practical expedient, if the NAV per share of the investment is determined in accordance with the specialized accounting guidance for investment companies as of the reporting entity’s measurement date.
Short-term investments having a maturity of 60 days or less are generally valued at amortized cost, which approximates fair market value. These investments are categorized as Level 2 of the fair value hierarchy.
Financial over-the-counter derivative instruments are instruments such as foreign currency contracts, futures contracts, options contracts, or swap agreements that derive their value from underlying asset prices, indices, reference rates, and other inputs or a combination of these factors. These contracts are normally valued on the basis of broker-dealer quotations or pricing service providers. Depending on the product and the terms of the transaction, the value of the derivative contracts can be estimated by a pricing service provider using a series of techniques, including simulation pricing models. The pricing models use inputs that are observed from actively quoted markets such as issuer details, indices, spreads, interest rates, curves, dividends and exchange rates. Derivatives that use similar valuation techniques and inputs as described above are categorized as Level 2 of the fair value hierarchy.
Events or circumstances affecting the values of Fund securities that occur between the closing of the principal markets on which they trade and the time the NAV of Fund shares is determined may be reflected in the calculation of NAV for each applicable Fund when the Fund deems that the particular event or circumstance would materially affect such Fund’s NAV. Funds that invest primarily in frequently traded exchange-listed securities will use fair value pricing in limited circumstances since reliable market quotations will often be readily available. Funds that invest in foreign securities are likely to use fair value pricing more often since significant events may occur between the close of foreign markets and the time of pricing which would trigger fair value pricing of the foreign securities. Although there are observable inputs assigned on a security level, prices are derived from factors using proprietary models or matrix pricing. For this reason, significant events will cause movement between Levels 1 and 2. Funds that invest in low-rated debt securities are also likely to use fair value pricing more often since the markets in which such securities are traded are generally thinner, more limited and less active than those for higher rated securities. Examples of events that could trigger fair value pricing of one or more securities are: a material market movement of the U.S. securities market (defined in the fair value procedures as the movement by a single major U.S. index greater than a certain percentage) or other significant event; foreign market holidays if, on a daily basis, a Fund’s foreign exposure exceeds 20% in the aggregate (all closed markets combined); a company development; a natural disaster; or an armed conflict.
Preferred stock and other equities traded on inactive markets or valued by reference to similar instruments are also categorized as Level 2 of the fair value hierarchy.
The NAV of a Fund’s portfolio that includes foreign securities may change on days when shareholders will not be able to purchase or redeem fund shares, since foreign securities can trade on non-business days.
Level 3 Trading Assets and Trading Liabilities, at Fair Value
The valuation techniques and significant inputs used in determining the fair values of financial instruments classified as Level 3 of the fair value hierarchy are as follows:
Securities and other assets for which market quotes are not readily available are valued at fair value as determined in good faith by the Board and are categorized as Level 3 of the fair value hierarchy. Market quotes are considered not readily available in circumstances where there is an absence of current or reliable market-based data (e.g., trade information or broker quotes). When RFSC applies fair valuation methods that use significant unobservable inputs to determine a Fund’s NAV, securities will not be priced on the basis of quotes from the primary market in which they are traded, but instead may be priced by another method that the Board or persons acting at their direction believe accurately reflects fair value and are categorized as Level 3 of the fair value hierarchy. Fair value pricing may require subjective determinations about the value of a security. While the securities valuation
| | | | |
| | 102 | | | Notes to Financial Statements |
Russell Investment Funds
Notes to Financial Statements, continued — December 31, 2011
procedures are intended to result in a calculation of a Fund’s NAV that fairly reflects security values as of the time of pricing, the process cannot guarantee that fair values determined by the Board or persons acting at their direction would accurately reflect the price that a Fund could obtain for a security if it were to dispose of that security as of the time of pricing (for instance, in a forced or distressed sale). The prices used by a Fund may differ from the value that would be realized if the securities were sold.
For fair valuations using significant unobservable inputs, U.S. GAAP requires a reconciliation of the beginning to ending balances for reported market values that presents changes attributable to total realized and unrealized gains or losses, purchases and sales, and transfers in/out of the Level 3 category during the period. In accordance with the requirements of U.S. GAAP, a fair value hierarchy and Level 3 reconciliation, if any, have been included in the Notes to the Schedule of Investments for each respective Fund.
In 2011, the Financial Accounting Standards Board (“FASB”) issued an update to requirements relating to fair valuation measurements which represent amendments to achieve common fair value measurements and disclosure requirements in U.S. GAAP and International Financial Reporting Standards. The amendments are of two types: (i) those that clarify the FASB’s intent about the application of existing fair value measurements and disclosure requirements and (ii) those that change a particular principle or requirement for measuring fair value or for disclosing information about fair value measurements.
The amendments that change a particular principle or requirement for measuring fair value or disclosing information about fair value measurements relate to (i) measuring the fair value of the financial instruments that are managed within a portfolio; (ii) application of premium and discount in a fair value measurement; and (iii) additional disclosures about fair value measurements. The update is effective for interim and annual periods beginning after December 15, 2011. Management does not believe the adoption of this update will have a material impact on the Funds’ financial statements.
Investment Transactions
Investment transactions are reflected as of the trade date for financial reporting purposes. This may cause the NAV stated in the financial statements to be different from the NAV at which shareholders may transact. Realized gains and losses from securities transactions, if any, are recorded on the basis of specific identified cost incurred by each money manager within a particular Fund.
Investment Income
Dividend income is recorded net of applicable withholding taxes on the ex-dividend date, except that certain dividends from foreign securities are recorded as soon thereafter as the Funds are informed of the ex-dividend date. Interest income is recorded daily on the accrual basis. The Core Bond Fund classifies gains and losses realized on prepayments received on mortgage-backed securities as an adjustment to interest income. All premiums and discounts, including original issue discounts, are amortized/ accreted using the effective interest method.
Federal Income Taxes
Since the Investment Company is a Massachusetts business trust, each Fund is a separate corporate taxpayer and determines its net investment income and capital gains (or losses) and the amounts to be distributed to each Fund’s shareholders without regard to the income and capital gains (or losses) of the other Funds.
Each Fund qualifies as a regulated investment company under sub-chapter M of the Internal Revenue Code and intends to distribute all of its taxable income and capital gains. Therefore, no federal income tax provision is required for the Funds.
The Funds comply with the authoritative guidance for uncertainty in income taxes which requires management to determine whether a tax position of the Funds is more likely than not to be sustained upon examination, including resolution of any related appeals or litigation processes, based on the technical merits of the position. For tax positions meeting the more likely than not threshold, the tax amount recognized in the financial statements is reduced by the largest benefit that has a greater than 50% likelihood of being realized upon ultimate settlement with the relevant taxing authority. Management determined that no accruals need to be made in the financial statements due to uncertain tax positions. Management continually reviews and adjusts its liability for income taxes based on analyses of tax laws and regulations, as well as their interpretations, and other relevant factors.
Each Fund files a U.S. tax return. At December 31, 2011, the Funds had recorded no liabilities for net unrecognized tax benefits relating to uncertain income tax positions they have taken or expect to take in future tax returns. While the statute of limitations remains open to examine the Funds’ U.S. tax returns filed for the fiscal years ending December 31, 2008 through December 31, 2010, no examinations are in progress or anticipated at this time. The Funds are not aware of any tax positions for which it is reasonably possible that the total amounts of unrecognized tax benefits will significantly change in the next twelve months.
| | |
| Notes to Financial Statements | | 103 |
Russell Investment Funds
Notes to Financial Statements, continued — December 31, 2011
Dividends and Distributions to Shareholders
For all Funds, income dividend and capital gain distributions, if any, are recorded on the ex-dividend date. Income dividend distributions are generally declared and paid quarterly, except for the Non-U.S. Fund, which generally declares and pays income distributions annually. Capital gain distributions are generally declared and paid annually. An additional distribution may be paid by the Funds to avoid imposition of federal income and excise tax on any remaining undistributed capital gains and net investment income.
The timing and characterization of certain income and capital gain distributions are determined in accordance with federal tax regulations, which may differ from U.S. GAAP. As a result, net investment income and net realized gain (or loss) from investment and foreign currency-related transactions for a reporting period may differ significantly from distributions during such period. The differences between tax regulations and U.S. GAAP primarily relate to investments in options, futures, forward contracts, swap contracts, passive foreign investment companies, foreign-denominated investments, mortgage-backed securities, certain securities sold at a loss and capital loss carryforwards.
Expenses
The Funds pay their own expenses other than those expressly assumed by Russell Investment Management Company (“RIMCo”) or RFSC. Most expenses can be directly attributed to the individual Funds. Expenses which cannot be directly attributed to a specific Fund are allocated among all Funds principally based on their relative net assets.
Foreign Currency Translations
The books and records of the Funds are maintained in U.S. dollars. Foreign currency amounts and transactions of the Funds are translated into U.S. dollars on the following basis:
| | (a) | Market value of investment securities, other assets and liabilities at the closing rate of exchange on the valuation date. |
| | (b) | Purchases and sales of investment securities and income at the closing rate of exchange prevailing on the respective trade dates of such transactions. |
Net realized gains or losses from foreign currency-related transactions arise from: sales and maturities of short-term securities; sales of foreign currencies; currency gains or losses realized between the trade and settlement dates on securities transactions; the difference between the amounts of dividends, interest, and foreign withholding taxes recorded on the Funds’ books and the U.S. dollar equivalent of the amounts actually received or paid. Net unrealized gains or losses from foreign currency-related transactions arise from changes in the value of assets and liabilities, other than investments in securities, as a result of changes in the exchange rates.
The Funds do not isolate that portion of the results of operations of the Funds that arises as a result of changes in exchange rates from that portion that arises from changes in market prices of investments during the year. Such fluctuations are included within the net realized and unrealized gain or loss from investments. However, for federal income tax purposes, the Funds do isolate the effects of changes in foreign exchange rates from the fluctuations arising from changes in market prices for realized gain (or loss) on debt obligations.
Capital Gains Taxes
The Non-U.S. and Global Real Estate Securities Funds may be subject to capital gains taxes and repatriation taxes imposed by certain countries in which they invest. The Non-U.S. and Global Real Estate Securities Funds may record a deferred tax liability with respect to the unrealized appreciation on foreign securities for potential capital gains and repatriation taxes at December 31, 2011. The accrual for capital gains and repatriation taxes is included in net unrealized appreciation (depreciation) on investments in the Statements of Assets and Liabilities for the Funds. The amounts related to capital gains and repatriation taxes are included in net realized gain (loss) on investments in the Statements of Operations for the Funds. The Non-U.S. and Global Real Estate Securities Funds had $28,226 and $0, respectively in deferred tax liability as of December 31, 2011. The Non-U.S. and Global Real Estate Securities Funds had $3,770 and $0 respectively in realized gain (loss) on investments for capital gains taxes for the period ended December 31, 2011.
Derivatives
To the extent permitted by the investment objectives, restrictions and policies set forth in the Funds’ Prospectus and Statement of Additional Information, the Funds may participate in various derivative-based transactions. Derivative securities are instruments
| | | | |
| | 104 | | | Notes to Financial Statements |
Russell Investment Funds
Notes to Financial Statements, continued — December 31, 2011
or agreements whose value is derived from an underlying security or index. They include options, futures, swaps and forwards. These instruments offer unique characteristics and risks that facilitate the Funds’ investment strategies.
The Funds typically use derivatives in three ways: exposing cash reserves to markets, hedging and return enhancement. In addition, the Non-U.S. and Global Real Estate Securities Funds may enter into foreign exchange contracts for trade settlement purposes. The Funds may pursue their strategy of being fully invested by exposing cash reserves to the performance of appropriate markets by purchasing securities and/or derivatives. This is intended to cause the Funds to perform as though cash reserves were actually invested in those markets. Hedging may also be used by certain Funds to limit or control risks, such as adverse movements in exchange rates and interest rates. Return enhancement can be accomplished through the use of derivatives in a Fund including using derivatives as a substitute for holding physical bonds, and using them to express various macro views (e.g., interest rate movements, currency movements, and macro credit strategies). By purchasing certain instruments, the Funds may more effectively achieve the desired portfolio characteristics that assist them in meeting their investment objectives. Depending on how the derivatives are structured and utilized, the risks associated with them may vary widely. These risks include, but are not limited to, market risk, liquidity risk, counterparty risk, basis risk, reinvestment risk, political risk, prepayment risk, extension risk and credit risk.
The effects of derivative instruments, categorized by risk exposure, on the Statement of Assets and Liabilities and the Statement of Operations, for the period ended December 31, 2011, if applicable, are disclosed in the Fair Value of Derivative Instruments presentation following each Fund’s Schedule of Investments.
Foreign Currency Exchange Contracts
In connection with investment transactions consistent with the Funds’ investment objectives and strategies, certain Funds may enter into foreign currency exchange spot contracts and forward foreign currency exchange contracts (“FX contracts”). From time to time, certain Funds may enter into FX contracts to hedge certain foreign currency-denominated assets. FX contracts are recorded at market value. Certain risks may arise upon entering into these FX contracts from the potential inability of counterparties to meet the terms of their FX contracts and are generally limited to the amount of unrealized gain on the FX contracts, if any, that are disclosed in the Statements of Assets and Liabilities. Realized gains or losses arising from such transactions are included in net realized gain (or loss) from foreign currency-related transactions.
For the period ended December 31, 2011, the following Funds entered into foreign currency exchange contracts primarily for the strategies listed below:
| | | | |
| Funds | | Strategies | | |
| Non-U.S. Fund | | Exposing cash reserves to markets and trade settlement | | |
| Core Bond Fund | | Return enhancement and hedging | | |
| Global Real Estate Securities Fund | | Exposing cash reserves to markets and trade settlement | | |
The Funds’ foreign currency contract notional dollar values fluctuate throughout the operating year as required to meet strategic requirements. The following tables illustrate the quarterly volume of foreign currency contracts. For the purpose of this disclosure, volume is measured by the amounts bought and sold in USD.
| | | | | | | | | | | | | | | | |
| | | Outstanding Contract Amounts Bought | |
| Quarter Ended | | March 31, 2011 | | | June 30, 2011 | | | September 30, 2011 | | | December 31, 2011 | |
Non-U.S. Fund | | $ | 42,734,654 | | | $ | 52,414,603 | | | $ | 53,698,707 | | | $ | 29,831,966 | |
Core Bond Fund | | | 131,930,366 | | | | 142,074,417 | | | | 164,794,299 | | | | 68,348,283 | |
Global Real Estate Securities Fund | | | 18,993,095 | | | | 9,016,052 | | | | 15,158,842 | | | | 12,570,389 | |
| | | | | | | | | | | | | | | | |
| | | Outstanding Contract Amounts Sold | |
| Quarter Ended | | March 31, 2011 | | | June 30, 2011 | | | September 30, 2011 | | | December 31, 2011 | |
Non-U.S. Fund | | $ | 42,463,132 | | | $ | 52,924,412 | | | $ | 54,633,710 | | | $ | 30,210,708 | |
Core Bond Fund | | | 105,332,308 | | | | 67,595,010 | | | | 87,765,144 | | | | 72,968,251 | |
Global Real Estate Securities Fund | | | 34,858,474 | | | | 2,467,411 | | | | 31,699,603 | | | | 12,740,157 | |
| | |
| Notes to Financial Statements | | 105 |
Russell Investment Funds
Notes to Financial Statements, continued — December 31, 2011
Options
The Funds may purchase and sell (write) call and put options on securities and securities indices, provided such options are traded on a national securities exchange or in an over-the-counter market. The Funds may also purchase and sell call and put options on foreign currencies. The domestic equity Funds may utilize options to expose cash reserves to markets.
When a Fund writes a covered call or a put option, an amount equal to the premium received by the Fund is included in the Fund’s Statement of Assets and Liabilities as an asset and as an equivalent liability. The amount of the liability is subsequently marked-to-market to reflect the current market value of the option written. The Fund receives a premium on the sale of a call option but gives up the opportunity to profit from any increase in stock value above the exercise price of the option, and when the Fund writes a put option it is exposed to a decline in the price of the underlying security.
Whether an option which the Fund has written expires on its stipulated expiration date or the Fund enters into a closing purchase transaction, the Fund realizes a gain (or loss, if the cost of a closing purchase transaction exceeds the premium received when the option was sold) without regard to any unrealized gain or loss on the underlying security, and the liability related to such option is extinguished. If a call option which the Fund has written is exercised, the Fund realizes a capital gain or loss from the sale of the underlying security, and the proceeds from such sale are increased by the premium originally received. When a put option which a Fund has written is exercised, the amount of the premium originally received will reduce the cost of the security which a Fund purchases upon exercise of the option. Realized gains (losses) on purchased options are included in net realized gain (loss) from investments on the Statements of Operations.
The Funds’ use of written options involves, to varying degrees, elements of market risk in excess of the amount recognized in the Statements of Assets and Liabilities. The face or contract amounts of these instruments reflect the extent of the Funds’ exposure to market risk. The risks may be caused by an imperfect correlation between movements in the price of the instrument and the price of the underlying securities and interest rates.
A Fund may enter into a swaption (swap option). In a swaption, the buyer gains the right but not the obligation to enter into a specified swap agreement with the issuer on a specified future date. The writer of the contract receives the premium and bears the risk of unfavorable changes in the preset rate on the underlying interest rate swap. Unrealized gains/losses on swaptions are reflected in investment assets and investment liabilities in the Fund’s Statement of Assets and Liabilities.
For the period ended December 31, 2011, the Core Bond Fund purchased/sold options primarily for return enhancement and hedging.
The Core Bond Fund’s options contracts outstanding values fluctuate throughout the operating year as required to meet strategic requirements. The following table illustrates the quarterly volume of options contracts. For the purpose of this disclosure, volume is measured by contracts outstanding at period end.
| | | | | | | | | | | | | | | | |
| | | Number of Option Contracts Outstanding | |
| Quarter Ended | | March 31, 2011 | | | June 30, 2011 | | | September 30, 2011 | | | December 31, 2011 | |
Core Bond Fund | | | 144 | | | | 127 | | | | 66 | | | | 50 | |
Futures Contracts
The Funds may invest in futures contracts (i.e., interest rate, foreign currency and index futures contracts) to a limited extent. The face or contract amounts of these instruments reflect the extent of the Funds’ exposure to off balance-sheet risk. The primary risks associated with the use of futures contracts are an imperfect correlation between the change in market value of the securities held by the Fund and the prices of futures contracts and the possibility of an illiquid market. Upon entering into a futures contract, the Funds are required to deposit with a broker an amount, termed the initial margin, which typically represents 5% of the purchase price indicated in the futures contract. Payments to and from the broker, known as variation margin, are typically required to be made on a daily basis as the price of the futures contract fluctuates. Changes in initial settlement value are accounted for as unrealized appreciation (depreciation) until the contracts are terminated, at which time realized gains and losses are recognized.
| | | | |
| | 106 | | | Notes to Financial Statements |
Russell Investment Funds
Notes to Financial Statements, continued — December 31, 2011
For the period ended December 31, 2011, the following Funds entered into future contracts primarily for the strategies listed below:
| | |
Funds | | Strategies |
| Multi-Style Equity Fund | | Exposing cash reserves to markets |
| Aggressive Equity Fund | | Exposing cash reserves to markets |
| Non-U.S. Fund | | Exposing cash reserves to markets |
| Core Bond Fund | | Return enhancement, hedging and exposing cash reserves to markets |
| Global Real Estate Securities Fund | | Exposing cash reserves to markets |
The Funds’ futures contracts outstanding values fluctuate throughout the operating year as required to meet strategic requirements. The following table illustrates the quarterly volume of futures contracts. For the purpose of this disclosure, volume is measured by contracts outstanding at period end.
| | | | | | | | | | | | | | | | | | | | |
| | | Number of Futures Contracts Outstanding | |
Quarter Ended | | Multi-Style
Equity Fund | | | Aggressive
Equity Fund | | | Non-U.S. Fund | | | Core Bond Fund | | | Global Real Estate
Securities Fund | |
March 31, 2011 | | | 146 | | | | 97 | | | | 395 | | | | 1,528 | | | | — | |
June 30, 2011 | | | 221 | | | | 70 | | | | 391 | | | | 2,056 | | | | — | |
September 30, 2011 | | | 339 | | | | 96 | | | | 444 | | | | 1,719 | | | | 284 | |
December 31, 2011 | | | 154 | | | | 69 | | | | 406 | | | | 836 | | | | 519 | |
As of December 31, 2011, the Funds had cash collateral balances in connection with futures contracts purchased (sold) as follows:
| | | | |
| | Cash Collateral
for Futures | |
Multi-Style Equity Fund | | $ | 1,750,000 | |
Aggressive Equity Fund | | | 800,000 | |
Non-U.S. Fund | | | 2,700,000 | |
Core Bond Fund | | | 324,000 | |
Global Real Estate Securities Fund | | | 1,570,000 | |
Swap Agreements
The Funds may enter into swap agreements, on either an asset-based or liability-based basis, depending on whether they are hedging their assets or their liabilities, and will usually enter into swaps on a net basis, i.e., the two payment streams are netted out, with the Funds receiving or paying, as the case may be, only the net amount of the two payments. When a Fund engages in a swap, it exchanges its obligations to pay or rights to receive payments for the obligations or rights to receive payments of another party (i.e., an exchange of floating rate payments for fixed rate payments).
Certain Funds may enter into several different types of agreements including interest rate, credit default, index (total return) and currency swaps. The Funds may enter into index swap agreements to expose cash reserves to markets or to effect investment transactions consistent with those Funds’ investment objectives and strategies. Interest rate swaps are a counterparty agreement, can be customized to meet each party’s needs, and involve the exchange of a fixed payment per period for a payment that is not fixed. Currency swaps are an agreement where two parties exchange specified amounts of different currencies followed by each paying the other a series of interest payments based on the principal cash flow. At maturity the principal amounts are returned. Credit default swaps are a counterparty agreement which allows the transfer of third party credit risk (the possibility that an issuer will default on their obligation by failing to pay principal or interest in a timely manner) from one party to another. The lender faces the credit risk from a third party and the counterparty in the swap agrees to insure this risk in exchange for regular periodic payments.
The Funds expect to enter into these transactions primarily to preserve a return or spread on a particular investment or portion of their portfolios or to protect against any increase in the price of securities they anticipate purchasing at a later date or for return enhancement. The net amount of the excess, if any, of the Funds’ obligations over their entitlements with respect to each swap will be accrued on a daily basis and an amount of cash or liquid assets having an aggregate NAV at least equal to the accrued excess will be segregated. To the extent that the Funds enter into swaps on other than a net basis, the amount earmarked on the Funds’ records will be the full amount of the Funds’ obligations, if any, with respect to such interest rate swaps, accrued on a daily basis. If there is a default by the other party to such a transaction, the Funds will have contractual remedies pursuant to the agreement related to the transaction.
| | |
| Notes to Financial Statements | | 107 |
Russell Investment Funds
Notes to Financial Statements, continued — December 31, 2011
A Fund may not receive the expected amount under a swap agreement if the other party to the agreement defaults or becomes bankrupt. The market for swap agreements is largely unregulated. The Funds may enter into swap agreements with counterparties that meet RIMCo’s credit quality limitations. The Funds will not enter into any swap unless the counterparty has a minimum senior unsecured credit rating or long-term counterparty credit rating, including reassignments, of A- or better as defined by Standard & Poor’s or an equivalent rating from any nationally recognized statistical rating organization (using highest of split ratings) at the time of entering into such transaction.
Swap agreements generally are entered into by “eligible contract participants” and in compliance with certain other criteria necessary to render them excluded from regulation under the Commodity Exchange Act (“CEA”) and, therefore not subject to regulation as futures or commodity option transactions under the CEA.
As of December 31, 2011, the Core Bond Fund had cash collateral balances in connection with swap contracts purchased (sold) as follows:
| | | | | | | | |
| | | Cash Collateral
for Swaps | | | Due to Broker | |
Core Bond Fund | | $ | 429,133 | | | $ | 1,902,962 | |
Credit Default Swaps
The Core Bond Fund may enter into credit default swaps. A credit default swap can refer to corporate issues, asset-backed securities or an index of assets, each known as the reference entity or underlying asset. The Fund may act as either the buyer or the seller of a credit default swap involving one party making a stream of payments to another party in exchange for the right to receive a specified return in the event of a default or other credit event. Depending upon the terms of the contract, the credit default swap may be closed via physical settlement. However, due to the possible or potential instability in the market, there is a risk that the Fund may be unable to deliver the underlying debt security to the other party to the agreement. Additionally, the Fund may not receive the expected amount under the swap agreement if the other party to the agreement defaults or becomes bankrupt. In an unhedged credit default swap, the Fund enters into a credit default swap without owning the underlying asset or debt issued by the reference entity. Credit default swaps allow the Fund to acquire or reduce credit exposure to a particular issuer, asset or basket of assets.
As the seller of protection in a credit default swap, the Fund would be required to pay the par or other agreed-upon value (or otherwise perform according to the swap contract) of a reference debt obligation to the counterparty in the event of a default (or other specified credit event); the counterparty would be required to surrender the reference debt obligation. In return, the Fund would receive from the counterparty a periodic stream of payments over the term of the contract provided that no credit event has occurred. If no credit event occurs, the Fund would keep the stream of payments and would have no payment obligations. As a seller of protection, the Fund would effectively add leverage to its portfolio because, in addition to its total net assets, that Fund would be subject to investment exposure on the notional amount of the swap.
The Fund may also purchase protection via credit default swap contracts in order to offset the risk of default of debt securities held in its portfolio, in which case the Fund would function as the counterparty referenced in the preceding paragraph.
If a credit event occurs on a corporate issue and cash settlement is not elected, a variety of other deliverable obligations may be delivered in lieu of the specific referenced obligation. The ability to deliver other obligations may result in a cheapest-to-deliver option (the buyer of protection’s right to choose the deliverable obligation with the lowest value following a credit event). The Fund may use credit default swaps on corporate issues to provide a measure of protection against defaults of the issuers (i.e., to reduce risk where the Fund owns or has exposure to the referenced obligation) or to take an active long or short position with respect to the likelihood (as measured by the credit default swap’s spread) of a particular issuer’s default.
Unlike credit default swaps on corporate issues, deliverable obligations for credit default swaps on asset-backed securities in most instances are limited to the specific referenced obligation as performance for asset-backed securities can vary across deals. Prepayments, principal paydowns, and other write-down or loss events on the underlying mortgage loans will reduce the outstanding principal balance of the referenced obligation. These reductions may be temporary or permanent as defined under the terms of the swap agreement and the notional amount for the swap agreement generally will be adjusted by corresponding amounts. The Fund may use credit default swaps on asset-backed securities to provide a measure of protection against defaults (or other defined credit events) of the referenced obligation or to take an active long or short position with respect to the likelihood of a particular referenced obligation’s default (or other defined credit events).
| | | | |
| | 108 | | | Notes to Financial Statements |
Russell Investment Funds
Notes to Financial Statements, continued — December 31, 2011
Credit default swap agreements on credit indices involve one party making a stream of payments to another party in exchange for the right to receive a specified return in the event of a write down, principal shortfall, interest shortfall or default of all or part of the referenced entities comprising the credit index. A credit index is a basket of credit instruments or exposures designed to be representative of some part of the credit market as a whole. These indices are made up of reference credits that are judged by a poll of dealers to be the most liquid entities in the credit default swap market based on the sector of the index. Components of the indices may include, but are not limited to, investment grade securities, high yield securities, asset backed securities, emerging markets, and/or various credit ratings within each sector. Credit indices are traded using credit default swaps with standardized terms including a fixed spread and standard maturity dates. An index credit default swap references all the names in the index, and if there is a default, the credit event is settled based on that name’s weight in the index. The composition of the indices changes periodically, usually every six months, and for most indices, each name has an equal weight in the index. Traders may use credit default swaps on indices to speculate on changes in credit quality.
Implied credit spreads, represented in absolute terms, utilized in determining the market value of credit default swap agreements on corporate issues as of period end are disclosed in the Schedule of Investments and generally serve as an indicator of the current status of the payment/performance risk and represent the likelihood or risk of default (or other defined credit event) for the credit derivative. The implied credit spread of a particular referenced entity reflects the cost of entering into a credit default swap and may include upfront payments required to be made to enter into the agreement. For credit default swap agreements on asset-backed securities and credit indices, the quoted market prices and resulting values serve as the indicator of the current status of the payment/performance risk. Wider credit spreads and increasing market values, in absolute terms when compared to the notional amount of the swap, generally represent a deterioration of the referenced entity’s credit soundness and a greater likelihood or risk of default or other credit event occurring as defined under the terms of the agreement. The maximum potential amount of future payments (undiscounted) that the Fund as a seller of protection could be required to make under a credit default swap agreement would be an amount equal to the notional amount of the agreement. Notional amounts of all credit default swap agreements outstanding as of December 31, 2011 for which the Fund is the seller of protection are disclosed in the Schedules of Investments. These potential amounts would be partially offset by any recovery values of the respective referenced obligations, upfront payments received upon entering into the agreement, or net amounts received from the settlement of buy protection credit default swap agreements entered into by the Fund for the same referenced entity or entities.
Credit default swaps could result in losses if the Fund does not correctly evaluate the creditworthiness of the company or companies on which the credit default swap is based. Credit default swap agreements may involve greater risks than if the Fund had invested in the reference obligation directly since, in addition to risks relating to the reference obligation, credit default swaps are subject to illiquidity and counterparty risk. The Fund will generally incur a greater degree of risk when it sells a credit default swap than when it purchases a credit default swap. As a buyer of a credit default swap, the Fund may lose its investment and recover nothing should a credit event fail to occur and the swap is held to its termination date. As seller of a credit default swap, if a credit event were to occur, the value of any deliverable obligation received by the Fund, coupled with the upfront or periodic payments previously received, may be less than what it pays to the buyer, resulting in a loss of value to the Fund.
If the creditworthiness of the Fund’s swap counterparty declines, the risk that the counterparty may not perform could increase, potentially resulting in a loss to the Fund. To limit the counterparty risk involved in swap agreements, the Fund will only enter into swap agreements with counterparties that meet certain standards of creditworthiness. Although there can be no assurance that the Fund will be able to do so, the Fund may be able to reduce or eliminate its exposure under a swap agreement either by assignment or other disposition, or by entering into an offsetting swap agreement with the same party or another creditworthy party. The Fund may have limited ability to eliminate its exposure under a credit default swap if the credit of the reference entity or underlying asset has declined.
For the period ended December 31, 2011, the Core Bond Fund entered into credit default swaps primarily for return enhancement and hedging.
The Core Bond Fund’s credit default swap contract notional amounts fluctuate throughout the operating year as required to meet the strategic requirements. The following table illustrates the quarterly volume of credit default swap contracts. For the purpose of this disclosure, the volume is measured by the notional amounts outstanding.
| | | | | | | | | | | | | | | | |
| | | Credit Default Swap Notional Amounts Outstanding | |
| Quarter Ended | | March 31, 2011 | | | June 30, 2011 | | | September 30, 2011 | | | December 31, 2011 | |
Core Bond Fund | | $ | 19,485,298 | | | $ | 38,565,298 | | | $ | 44,410,298 | | | $ | 107,619,798 | |
| | |
| Notes to Financial Statements | | 109 |
Russell Investment Funds
Notes to Financial Statements, continued — December 31, 2011
Interest Rate Swaps
The use of interest rate swaps is a highly specialized activity which involves investment techniques and risks different from those associated with ordinary portfolio securities transactions. If a money manager using this technique is incorrect in its forecast of market values, interest rates and other applicable factors, the investment performance of a Fund might diminish compared to what it would have been if this investment technique were not used.
Interest rate swaps do not involve the delivery of securities or other underlying assets or principal. Accordingly, the risk of loss with respect to interest rate swaps is limited to the net amount of interest payments that the Funds are contractually obligated to make. If the other party to an interest rate swap defaults, the Funds’ risk of loss consists of the net amount of interest payments that the Funds are contractually entitled to receive. Since interest rate swaps are individually negotiated, the Funds expect to achieve an acceptable degree of correlation between their rights to receive interest on their portfolio securities and their rights and obligations to receive and pay interest pursuant to interest rate swaps.
For the period ended December 31, 2011, the Core Bond Fund entered into interest rate swaps primarily for return enhancement and hedging.
The Core Bond Fund’s interest rate swap contract notional amounts fluctuate throughout the operating year as required to meet the strategic requirements. The following table illustrates the quarterly volume of interest rate swap contracts. For the purpose of this disclosure, the volume is measured by the notional amounts outstanding.
| | | | | | | | | | | | | | | | |
| | | Interest Rate Swap Notional Amounts Outstanding | |
| Quarter Ended | | March 31, 2011 | | | June 30, 2011 | | | September 30, 2011 | | | December 31, 2011 | |
Core Bond Fund | | $ | 5,617,134,000 | | | $ | 2,861,724,000 | | | $ | 147,460,000 | | | $ | 90,495,000 | |
Index Swaps
Certain Funds may enter into index swap agreements to expose cash reserves to markets or to effect investment transactions consistent with these Funds’ investment objectives and strategies. Swap agreements are two party contracts entered into primarily by institutional investors for periods ranging from a few weeks to more than one year. In a standard swap transaction, the two parties agree to exchange the returns (or differentials in rates of return) earned or realized on particular investments or instruments. The returns to be exchanged between the parties are calculated with respect to a “notional amount” (i.e. a specified dollar amount that is hypothetically invested in a “basket” of securities representing a particular index).
For the period ended December 31, 2011, none of the Funds entered into index swaps.
ISDA Master Agreements
The Funds are parties to International Swaps and Derivatives Association, Inc. Master Agreements (“ISDA Master Agreements”) with counterparties that govern transactions in over-the-counter derivative and foreign exchange contracts entered into by the Funds and those counterparties. The ISDA Master Agreements contain provisions for general obligations, representations, agreements, collateral and events of default or termination. Events of termination include conditions that may entitle counterparties to elect to terminate early and cause settlement of all outstanding transactions under the applicable ISDA Master Agreement. Any election to terminate early could be material to the financial statements.
Loan Agreements
The Core Bond Fund may invest in direct debt instruments which are interests in amounts owed by corporate, governmental, or other borrowers to lenders or lending syndicates. The Fund’s investments in loans may be in the form of participations in loans or assignments of all or a portion of loans from third parties. A loan is often administered by a bank or other financial institution (the “agent”) that acts as agent for all holders. The agent administers the terms of the loan, as specified in the loan agreement. When investing in a loan participation, the Fund has the right to receive payments of principal, interest and any fees to which it is entitled only from the agent selling the loan agreement and only upon receipt by the agent of payments from the borrower. The Fund generally has no right to enforce compliance with the terms of the loan agreement with the borrower. As a result, the Fund may be subject to the credit risk of both the borrower and the agent that is selling the loan agreement. When the Fund purchases assignments from agents it acquires direct rights against the borrower on the loan. At December 31, 2011, the Core Bond Fund had no unfunded loan commitments.
| | | | |
| | 110 | | | Notes to Financial Statements |
Russell Investment Funds
Notes to Financial Statements, continued — December 31, 2011
Investments in Emerging Markets
Emerging Markets Securities
Investing in emerging markets securities can pose some risks different from and greater than, risks of investing in U.S. or developed markets securities. These risks include: a risk of loss due to political instability; exposure to economic structures that are generally less diverse and mature, and to political systems which may have less stability, than those of more developed countries; smaller market capitalization of securities markets, which may suffer periods of relative illiquidity; significant price volatility; restrictions on foreign investment; and possible repatriation of investment income and capital. In addition, foreign investors may be required to register the proceeds of sales and future economic or political crises could lead to price controls, forced mergers, expropriation or confiscatory taxation, seizure, nationalization, or creation of government monopolies. The currencies of emerging market countries may experience significant declines against the U.S. dollar, and devaluation may occur subsequent to investments in these currencies by the Funds. Emerging market securities may be subject to currency transfer restrictions and may experience delays and disruptions in securities settlement procedures for a Fund’s portfolio securities. Inflation and rapid fluctuations in inflation rates have had, and may continue to have, negative effects on the economies and securities markets of certain emerging market countries.
Emerging Markets Debt
A Fund’s emerging markets debt securities may include obligations of governments and corporations. As with any fixed income securities, emerging markets debt securities are subject to the risk of being downgraded in credit rating and to the risk of default. In the event of a default on any investments in foreign debt obligations, it may be more difficult for a Fund to obtain or to enforce a judgment against the issuers of such securities. With respect to debt issued by emerging market governments, such issuers may be unwilling to pay interest and repay principal when due, either due to an inability to pay or submission to political pressure not to pay, and as a result may default, declare temporary suspensions of interest payments or require that the conditions for payment be renegotiated.
Repurchase Agreements
The Core Bond Fund may enter into repurchase agreements. A repurchase agreement is an agreement under which the Fund acquires a fixed income security from a commercial bank, broker or dealer and simultaneously agrees to resell such security to the seller at an agreed upon price and date (normally within a few days or weeks). The resale price reflects an agreed upon interest rate effective for the period the security is held by the Fund and is unrelated to the interest rate on the security. The securities acquired by the Fund constitute collateral for the repurchase obligation. In these transactions, the securities acquired by the Fund (including accrued interest earned thereon) must have a total value in excess of the value of the repurchase agreement and must be held by the custodian bank until repurchased. The Fund will not invest more than 15% of its net assets (taken at current market value) in repurchase agreements maturing in more than seven days.
Mortgage-Related and Other Asset-Backed Securities
The Core Bond Fund may invest in mortgage or other asset-backed securities (“ABS”). These securities may include mortgage instruments issued by U.S. government agencies (“agency mortgages”) or those issued by private entities (“non-agency mortgages”). Specific types of instruments may include mortgage pass-through securities, collateralized mortgage obligations (“CMOs”), commercial mortgage-backed securities, mortgage dollar rolls, CMO residuals, stripped mortgage-backed securities and other securities that directly or indirectly represent a participation in, or are secured by a payable from, mortgage loans on real property. The value of the Fund’s mortgage-backed securities (“MBS”) may be affected by, among other things, changes or perceived changes in interest rates, factors concerning the interests in and structure of the issuer or the originator of the mortgage, or the quality of the underlying assets. The quality and value of the underlying assets may decline, or default This has become an increasing risk for collateral related to non-agency mortgages (e.g., sub-prime, Alternative A - paper (“Alt - A loans”)) and non-conforming mortgage loans, especially in a declining residential real estate market. In addition, regulatory or tax changes may adversely affect the mortgage securities markets as a whole.
MBS often have stated maturities of up to thirty years when they are issued, depending upon the length of the mortgages underlying the securities. In practice however, unscheduled or early payments of principal and interest on the underlying mortgages may make the securities’ effective maturity shorter than this, and the prevailing interest rates may be higher or lower than the current yield of the Fund’s portfolio at the time the Fund receives the payments for reinvestment.
Rising or high interest rates may result in slower than expected principal payments which may tend to extend the duration of MBS, making them more volatile and more sensitive to changes in interest rates. This is known as extension risk.
| | |
| Notes to Financial Statements | | 111 |
Russell Investment Funds
Notes to Financial Statements, continued — December 31, 2011
MBS may have less potential for capital appreciation than comparable fixed income securities due to the likelihood of increased prepayments of mortgages resulting from foreclosures or declining interest rates. These foreclosed or refinanced mortgages are paid off at face value (par) or less, causing a loss, particularly for any investor who may have purchased the security at a premium or a price above par. In such an environment, this risk limits the potential price appreciation of these securities.
Through its investments in MBS, including those that are issued by private issuers, the Fund has exposure to agency mortgages, private non-agency mortgages (including those secured by subprime and Alt-A loans) and non-conforming loans as well as to the mortgage and credit markets generally. Private issuers include commercial banks, savings associations, mortgage companies, investment banking firms, finance companies and special purpose finance entities (called special purpose vehicles or “SPVs”) and other entities that acquire and package mortgage loans for resale as MBS. These privately issued non-agency MBS may offer higher yields than those issued by government agencies, but also may be subject to greater price changes than governmental issues. Subprime loans refer to loans made to borrowers with weakened credit histories or with a lower capacity to make timely payments on their loans. Alt-A loans refers to loans extended to borrowers who have incomplete documentation of income, assets, or other variables that are important to the credit underwriting processes. Non-conforming mortgages are loans that do not meet the standards that allow purchase by government-sponsored enterprises. MBS with exposure to subprime loans, Alt-A loans or non-conforming loans have had in many cases higher default rates than those loans that meet government underwriting requirements. The risk of non-payment is greater for MBS that are backed by mortgage pools that contain subprime, Alt-A and non-conforming loans, but a level of risk exists for all loans.
Unlike agency MBS issued or guaranteed by the U.S. government or a government-sponsored entity (e.g., Fannie Mae (the Federal National Mortgage Association) and Freddie Mac (the Federal Home Loan Mortgage Corporation)), MBS issued by private issuers do not have a government or government-sponsored entity guarantee, but may have credit enhancements provided by external entities such as banks or financial institutions or achieved through the structuring of the transaction itself. Examples of such credit support arising out of the structure of the transaction include the issue of senior and subordinated securities (e.g., the issuance of securities by an SPV in multiple classes or “tranches,” with one or more classes being senior to other subordinated classes as to the payment of principal and interest, with the result that defaults on the underlying mortgage loans are borne first by the holders of the subordinated class); creation of “reserve funds” (in which case cash or investments, sometimes funded from a portion of the payments on the underlying mortgage loans, are held in reserve against future losses); and “overcollateralization” (in which case the scheduled payments on, or the principal amount of, the underlying mortgage loans exceeds that required to make payment on the securities and pay any servicing or other fees). However, there can be no guarantee that credit enhancements, if any, will be sufficient to prevent losses in the event of defaults on the underlying mortgage loans. In addition, MBS that are issued by private issuers are not subject to the underwriting requirements for the underlying mortgages that are applicable to those MBS that have a government or government-sponsored entity guarantee. As a result, the mortgage loans underlying private MBS may, and frequently do, have less favorable collateral, credit risk or other underwriting characteristics than government or government-sponsored MBS and have wider variances in a number of terms including interest rate, term, size, purpose and borrower characteristics. Privately issued pools more frequently include second mortgages, high loan-to-value mortgages and manufactured housing loans. The coupon rates and maturities of the underlying mortgage loans in a private-label MBS pool may vary to a greater extent than those included in a government guaranteed pool, and the pool may include subprime mortgage loans.
Privately issued MBS are not traded on an exchange and there may be a limited market for the securities, especially when there is a perceived weakness in the mortgage and real estate market sectors. Without an active trading market, MBS held in the Fund’s portfolio may be particularly difficult to value because of the complexities involved in assessing the value of the underlying mortgage loans.
ABS may include MBS, loans, receivables or other assets. The value of the Fund’s ABS may be affected by, among other things, actual or perceived changes in interest rates, factors concerning the interests in and structure of the issuer or the originator of the receivables, the market’s assessment of the quality of underlying assets or actual or perceived changes in the credit worthiness of the individual borrowers, the originator, the servicing agent or the financial institution providing the credit support.
Payment of principal and interest may be largely dependent upon the cash flows generated by the assets backing the securities. Rising or high interest rates tend to extend the duration of ABS, making them more volatile and more sensitive to changes in interest rates. The underlying assets are sometimes subject to prepayments which can shorten the security’s weighted average life and may lower its return. Defaults on loans underlying ABS have become an increasing risk for ABS that are secured by home equity loans related to sub-prime, Alt-A or non-conforming mortgage loans, especially in a declining residential real estate market.
ABS (other than MBS) present certain risks that are not presented by MBS. Primarily, these securities may not have the benefit of any security interest in the related assets. Credit card receivables are generally unsecured and the debtors are entitled to the
| | | | |
| | 112 | | | Notes to Financial Statements |
Russell Investment Funds
Notes to Financial Statements, continued — December 31, 2011
protection of a number of state and federal consumer credit laws, many of which give such debtors the right to set off certain amounts owed on the credit cards, thereby reducing the balance due. There is the possibility that recoveries on repossessed collateral may not, in some cases, be available to support payments on these securities. ABS are often backed by a pool of assets representing the obligations of a number of different parties. To lessen the effect of failures by obligors on underlying assets to make payments, the securities may contain elements of credit support which fall into two categories: (i) liquidity protection, and (ii) protection against losses resulting from ultimate default by an obligor on the underlying assets. Liquidity protection refers to the provision of advances, generally by the entity administering the pool of assets, to ensure that the receipt of payments on the underlying pool occurs in a timely fashion. Protection against losses results from payment of the insurance obligations on at least a portion of the assets in the pool. This protection may be provided through guarantees, policies or letters of credit obtained by the issuer or sponsor from third parties, through various means of structuring the transaction or through a combination of such approaches. The Fund will not pay any additional or separate fees for credit support. The degree of credit support provided for each issue is generally based on historical information respecting the level of credit risk associated with the underlying assets. Delinquency or loss in excess of that anticipated or failure of the credit support could adversely affect the return on an investment in such a security. The availability of ABS may be affected by legislative or regulatory developments. It is possible that such developments may require the Fund to dispose of any then existing holdings of such securities.
Forward Commitments
The Core Bond Fund may contract to purchase securities for a fixed price at a future date beyond customary settlement time consistent with the Fund’s investment strategies. The price of the underlying securities and the date when the securities will be delivered and paid for are fixed at the time the transaction is negotiated. The Funds may dispose of a forward commitment transaction prior to settlement if it is appropriate to do so and may realize short-term gains (or losses) upon such sale. When effecting such transactions, cash or liquid high-grade debt obligations of the Funds in a dollar amount sufficient to make payment for the portfolio securities to be purchased will be earmarked on the Fund’s records at the trade date and until the transaction is settled. A forward commitment transaction involves a risk of loss if the value of the security to be purchased declines prior to the settlement date or the other party to the transaction fails to complete the transaction.
A to be announced (“TBA”) security is a forward mortgage-backed securities trade. The securities are purchased and sold on a forward commitment basis with an approximate principal amount and maturity date. The actual principal amount and maturity date will be determined upon settlement when the specific mortgage pools are assigned. As of December 31, 2011, the Core Bond Fund had no cash collateral balances in connection with TBAs.
Inflation-Indexed Bonds
The Core Bond Fund may invest in inflation-indexed securities, which are typically bonds or notes designed to provide a return higher than the rate of inflation (based on a designated index) if held to maturity. A common type of inflation-indexed security is a U.S. Treasury Inflation-Protected Security, or TIPS. The principal of a TIPS increases with inflation and decreases with deflation, as measured by the Consumer Price Index. When a TIPS matures, the adjusted principal or original principal is paid, whichever is greater. TIPS pay interest twice a year, at a fixed rate. The rate is applied to the adjusted principal, Therefore, like the principal, interest payments rise with inflation and fall with deflation.
Guarantees
In the normal course of business, the Funds enter into contracts that contain a variety of representations which provide general indemnifications. The Funds’ maximum exposure under these arrangements is unknown as this would involve future claims that may be made against the Funds that have not yet occurred. However, the Funds expect the risk of loss to be remote.
Market, Credit and Counterparty Risk
In the normal course of business, the Funds trade financial instruments and enter into financial transactions where risk of potential loss exists due to changes in the market (market risk) or failure of the other party to a transaction to perform (credit risk). Similar to credit risk, the Funds may be exposed to counterparty risk or risk that an institution or other entity with which the Funds have unsettled or open transactions will default. The potential loss could exceed the value of the relevant assets recorded in the financial statements (the “Assets”). The Assets, which potentially expose the Funds to credit risk, consist principally of cash due from counterparties and investments. The extent of the Funds’ exposure to credit and counterparty risks with respect to the Assets approximates their carrying value as recorded in the Funds’ Statements of Assets and Liabilities.
| | |
| Notes to Financial Statements | | 113 |
Russell Investment Funds
Notes to Financial Statements, continued — December 31, 2011
On September 15, 2008, Lehman Brothers Holdings Inc. filed for protection under Chapter 11 of the United States Bankruptcy Code. The Core Bond Fund and Non-U.S. Fund had direct holdings, swap agreements, and securities and derivatives transactions outstanding with Lehman Brothers entities as issuers or counterparties at the time the relevant Lehman Brothers entities filed for protection or were placed in administration. The direct holdings associated with Lehman Brothers have been written down to their estimated recoverable values and incorporated as components of other receivables and liabilities on the Statements of Assets and Liabilities and net changes in realized gain (loss) or unrealized appreciation (depreciation) on the Statement of Operations. The Funds have also utilized certain netting arrangements to offset payables and receivables of Lehman Brothers securities.
On November 4, 2011, creditors of Lehman Brothers Holdings Inc. and its affiliated chapter 11 debtors (collectively, “Lehman Brothers”) voted to accept the Third Amended Joint Chapter 11 Plan of Lehman Brothers dated August 31, 2011 (the “Plan”). The Bankruptcy Court confirmed the Plan on December 6, 2011. Creditors of Lehman Brothers expect to receive preliminary distributions in the first quarter of 2012. Pursuant to the Plan, there will be an initial distribution of “Available Cash” with semiannual distributions on each March 30th and September 30th thereafter. Reserved amounts that become available (through claims being disallowed or reduced, litigation being resolved, or distributions not being collected) will be included as Available Cash for the subsequent semi-annual distributions. Distributions will be made only to claimants holding “Allowed Claims” as of the relevant distribution date. The date for final distributions to creditors of Lehman Brothers is unknown.
| 3. | | Investment Transactions |
Securities
During the period ended December 31, 2011, purchases and sales of investment securities (excluding U.S. Government and Agency obligations, short-term investments, options, futures and repurchase agreements) were as follows:
| | | | | | | | |
| | | Purchases | | | Sales | |
Multi-Style Equity Fund | | $ | 505,831,206 | | | $ | 524,454,703 | |
Aggressive Equity Fund | | | 191,375,052 | | | | 195,488,624 | |
Non-U.S. Fund | | | 180,699,696 | | | | 166,574,605 | |
Core Bond Fund | | | 158,023,085 | | | | 112,348,674 | |
Global Real Estate Securities Fund | | | 298,735,813 | | | | 278,618,162 | |
Purchases and sales of U.S. Government and Agency obligations (excluding short-term investments, options, futures and repurchase agreements) were as follows:
| | | | | | | | |
| | | Purchases | | | Sales | |
Core Bond Fund | | $ | 911,123,375 | | | $ | 845,254,381 | |
Written Options Contracts
Transactions in written options contracts for the period ended December 31, 2011 were as follows:
| | | | | | | | |
| | | Core Bond Fund | |
| | | Number of
Contracts | | | Premiums
Received | |
Outstanding December 31, 2010 | | | 125 | | | $ | 873,046 | |
| | | | | | | | |
Opened | | | 181 | | | | 2,846,085 | |
Closed | | | (121 | ) | | | (2,260,669 | ) |
Expired | | | (136 | ) | | | (706,352 | ) |
| | | | | | | | |
Outstanding December 31, 2011 | | | 49 | | | $ | 752,110 | |
| | | | | | | | |
Securities Lending
The Investment Company has a securities lending program whereby each Fund can loan securities with a value up to 33 1/3% of each Fund’s total assets. The Fund receives cash (U.S. currency), U.S. Government or U.S. Government Agency obligations as collateral against the loaned securities. To the extent that a loan is collateralized by cash, such collateral is invested by the securities lending agent, State Street Bank and Trust Company (“State Street”), in short-term instruments, pooled collateral vehicles that invest in short term instruments, money market mutual funds and other short-term investments that meet certain quality and diversification requirements. The collateral received is recorded on a lending Fund’s Statement of Assets and Liabilities along with the related obligation to return the collateral.
| | | | |
| | 114 | | | Notes to Financial Statements |
Russell Investment Funds
Notes to Financial Statements, continued — December 31, 2011
Income generated from the investment of cash collateral, less negotiated rebate fees paid to participating brokers and transaction costs, is divided between the Fund and State Street and is recorded as income for the Fund. To the extent that a loan is secured by non-cash collateral, brokers pay the Fund negotiated lenders’ fees, which are divided between the Fund and State Street and are recorded as securities lending income for the Fund. All collateral received will be in an amount at least equal to 102% (for loans of U.S. securities) or 105% (for loans of non-U.S. securities) of the market value of the loaned securities at the inception of each loan. The market value of the loaned securities is determined at the close of business of the Fund and any additional required collateral is delivered to the Fund the next day. Should the borrower of the securities fail financially, there is a risk of delay in recovery of the securities or loss of rights in the collateral. Consequently, loans are made only to borrowers which are deemed to be creditworthy by State Street.
Each Fund that participates in the securities lending program has most of the cash collateral invested in the Russell U.S. Cash Collateral Fund, an unregistered fund advised by RIMCo. Prior to December 3, 2010, the Funds that participated in securities lending had a portion of their cash collateral invested in the State Street Securities Lending Quality Trust Fund (“SLQT”), a securities lending cash collateral vehicle managed by State Street Global Advisers. On December 3, 2010, the Funds redeemed in-kind out of SLQT realizing certain losses as a result of such redemption, and proceeds of the redemption were invested in the RIF Liquidating Trust, an unregistered fund managed by State Street.
As of December 31, 2011, the non-cash collateral pledged for the securities on loan in the following funds was as follows:
| | | | | | | | |
| | | Non-Cash
Collateral Value | | | Non-Cash Collateral Holding | |
| | | | | | | | |
Multi-Style Equity Fund | | $ | 758,511 | | | | Pool of U.S. Government Securities | |
Aggressive Equity Fund | | | 1,227,458 | | | | Pool of U.S. Government Securities | |
Non-U.S. Fund | | | 596,843 | | | | Pool of U.S. Government Securities | |
Custodian
The Funds have entered into arrangements with their custodian whereby custody credits realized as a result of uninvested cash balances are used to reduce a portion of the Funds’ expenses. During the period ended December 31, 2011, the Funds’ custodian fees were reduced by the following amounts under these arrangements
| | | | |
| | | Amount
Paid | |
Multi-Style Equity Fund | | $ | 8 | |
Aggressive Equity Fund | | | 1 | |
Non-U.S. Fund | | | 4 | |
Core Bond Fund | | | 264 | |
Global Real Estate Securities Fund | | | 2 | |
Brokerage Commissions
The Funds effect certain transactions through Recapture Services, a division of BNY ConvergeEX Execution Solutions LLC (“BNY”) and its global network of correspondent brokers. BNY is a registered broker and is not an affiliate of the Funds or RIMCo. Trades placed through BNY and its correspondents are used (i) to obtain brokerage and research services for RIMCo to assist RIMCo in its investment decision-making process in its capacity as advisor to the Funds or (ii) to generate commission rebates to the Funds on whose behalf the trades were made. For purposes of trading to obtain brokerage and research services for RIMCo or to generate commission rebates to the Funds, the Funds’ money managers are requested to and RIMCo may, with respect to transactions it places, effect transactions with or through BNY and its correspondents or other brokers only to the extent that the money managers or RIMCo believe that the Funds will receive best execution. In addition, RIMCo recommends targets for the amount of trading that money managers allocate through BNY based upon asset class, investment style and other factors. Brokerage and research services provided to RIMCo by BNY or other brokers include, but are not limited to (1) advice either directly or indirectly through publications or writings as to the advisability of investing in, purchasing or selling securities and the availability of securities or of purchasers or sellers of securities; (2) analysis and reports concerning issuers, industries, securities, economic factors and trends, portfolio strategy and the performance of accounts; and/or (3) services that are required in connection therewith. Research services will generally be obtained from unaffiliated third parties at market rates, which may be included in commission costs. Research provided to RIMCo may benefit the particular Funds generating the trading activity and may also benefit other Funds within RIF and other funds and clients managed or advised by RIMCo or its affiliates. Similarly, the Funds may benefit from research provided with respect to trading by those other funds and clients. In some cases, research may also be provided by other non-affiliated brokers.
| | |
| Notes to Financial Statements | | 115 |
Russell Investment Funds
Notes to Financial Statements, continued — December 31, 2011
BNY may also rebate to the Funds a portion of commissions earned on certain trading by the Funds through BNY and their correspondents in the form of commission recapture. Commission recapture is paid solely to those Funds generating the applicable trades. Commission recapture is generated on the instructions of the Soft Money Commission once RIMCo’s research budget has been met, as determined annually in the Soft Money Commission budgeting process.
Additionally, the Funds paid brokerage commissions to non-affiliated brokers who provided brokerage and research services to the adviser.
| 4. | | Related Party Transactions, Fees and Expenses |
Adviser and Administrator
RIMCo is the Funds’ adviser and RFSC, a wholly-owned subsidiary of RIMCo, is the Funds’ administrator. RIMCo is a wholly-owned subsidiary of Frank Russell Company (a subsidiary of The Northwestern Mutual Life Insurance Company). Frank Russell Company provides ongoing money manager research and trade placement services to RIF and RIMCo.
The Funds are permitted to invest their cash reserves (i.e., cash awaiting investment or cash held to meet redemption requests or to pay expenses) in the Russell U.S. Cash Management Fund, an unregistered Fund advised by RIMCo. As of December 31, 2011, the Funds have invested $96,547,566 in the Russell U.S. Cash Management Fund. In addition, a portion of the collateral received from the Investment Company’s securities lending program in the amount of $64,766,711 is invested in the Russell U.S. Cash Collateral Fund, an unregistered fund advised by RIMCo.
The advisory and administrative fees specified in the table below are based upon the average daily net assets of each Fund and are payable monthly.
| | | | | | | | |
| | | Annual Rate | |
| Funds | | Adviser | | | Administrator | |
Multi-Style Equity Fund | | | 0.73 | % | | | .05 | % |
Aggressive Equity Fund | | | 0.90 | | | | .05 | |
Non-U.S. Fund | | | 0.90 | | | | .05 | |
Core Bond Fund | | | 0.55 | | | | .05 | |
Global Real Estate Securities Fund | | | 0.80 | | | | .05 | |
The following shows the respective totals for advisory and administrative fees for the period ended December 31, 2011.
| | | | | | | | |
| | | Advisory | | | Administrative | |
Multi-Style Equity Fund | | $ | 2,873,735 | | | $ | 196,831 | |
Aggressive Equity Fund | | | 1,696,409 | | | | 94,245 | |
Non-U.S. Fund | | | 3,252,336 | | | | 180,685 | |
Core Bond Fund | | | 2,804,598 | | | | 254,964 | |
Global Real Estate Securities Fund | | | 3,955,132 | | | | 247,196 | |
RIMCo agreed to certain waivers of its advisory fees as follows:
For the Aggressive Equity Fund, RIMCo has contractually agreed, until April 30, 2012, to waive 0.06% of its 0.90% advisory fee. The waiver may not be terminated during the relevant period except with Board approval. The total amount of the waiver for the period ended December 31, 2011 was $113,094. There were no reimbursements during the period.
For the Non-U.S. Fund, RIMCo has contractually agreed, until April 30, 2012, to waive 0.06% of its 0.90% advisory fee. The waiver may not be terminated during the relevant period except with Board approval. The total amount of the waiver for the period ended December 31, 2011 was $216,822. There were no reimbursements during the period.
For the Core Bond Fund, RIMCo has contractually agreed, until April 30, 2012, to waive 0.07% of its 0.55% advisory fee. The waiver may not be terminated during the relevant period except with Board approval. The total amount of the waiver for the period ended December 31, 2011 was $356,949. There were no reimbursements during the period.
Transfer and Dividend Disbursing Agent
RFSC serves as transfer agent and provides dividend disbursing services to the Funds. For this service, RFSC is paid a fee based upon the average daily net assets of the Funds for transfer agency and dividend disbursing services. RFSC retains a portion of this
| | | | |
| | 116 | | | Notes to Financial Statements |
Russell Investment Funds
Notes to Financial Statements, continued — December 31, 2011
fee for services provided to the Funds and pays the balance to unaffiliated agents who assist in providing these services. Transfer agency fees paid by the Funds presented herein for the period ended December 31, 2011 were as follows:
| | | | |
| | | Amount | |
| | | | |
Multi-Style Equity Fund | | $ | 17,321 | |
Aggressive Equity Fund | | | 8,293 | |
Non-U.S. Fund | | | 15,900 | |
Core Bond Fund | | | 22,437 | |
Global Real Estate Securities Fund | | | 21,753 | |
Contributions from Adviser
Fund reimbursements presented in the Statements of Changes in Net Assets include payments by RIMCo to certain Funds made during the period ended December 31, 2011 to compensate for fund share transactions relating to the valuation of a portfolio holding, the SLQT, in which the Funds invested cash collateral received in securities lending transactions. Other reimbursements included in the Statements of Operations relate to amounts for advisory fees paid indirectly by certain Funds to RIMCo that were invested in the U.S. Cash Management Fund for the period from September 1, 2010 to September 16, 2011.
Distributor
Russell Financial Services, Inc. (the “Distributor”), a wholly-owned subsidiary of RIMCo, serves as distributor for RIF, pursuant to the Distribution Agreement with the Investment Company. The Distributor receives no compensation from the Investment Company for its services.
Accrued Fees Payable to Affiliates
Accrued fees payable to affiliates for the period ended December 31, 2011 were as follows:
| | | | | | | | | | | | | | | | | | | | |
| | | | | |
| | | Multi-Style
Equity Fund | | | Aggressive
Equity Fund | | | Non-U.S. Fund | | | Core Bond Fund | | | Global Real
Estate Securities
Fund | |
| | | | | | | | | | | | | | | | | | | | |
Advisory fees | | $ | 230,643 | | | $ | 125,859 | | | $ | 234,775 | | | $ | 219,673 | | | $ | 315,881 | |
Administration fees | | | 15,797 | | | | 7,492 | | | | 13,973 | | | | 22,883 | | | | 19,743 | |
Transfer agent fees | | | 1,392 | | | | 660 | | | | 1,227 | | | | 2,000 | | | | 1,731 | |
Trustee fees | | | 707 | | | | 325 | | | | 689 | | | | 779 | | | | 915 | |
| | | | | | | | | | | | | | | | | | | | |
| | $ | 248,539 | | | $ | 134,336 | | | $ | 250,664 | | | $ | 245,335 | | | $ | 338,270 | |
| | | | | | | | | | | | | | | | | | | | |
Affiliated Brokerage Commissions
The Funds effect certain transactions through Russell Implementation Services Inc. (“RIS”) and its global network of unaffiliated correspondent brokers. RIS is a registered broker and investment adviser and an affiliate of RIMCo. Trades placed through RIS and its correspondents are made (i) to manage trading associated with changes in managers, rebalancing across existing managers, cash flows and other portfolio transitions or (ii) to execute portfolio securities transactions for each Fund’s assets that RIMCo determines not to allocate to money managers and for each Fund’s cash reserves.
Amounts retained by RIS for the period ended December 31, 2011(unaudited) were as follows:
| | | | | | | | |
| Fund Name | | Amount | | | Percent of
Fund’s
Commission | |
| Multi-Style Equity Fund | | $ | 68,015 | | | | 11.7 | |
| Aggressive Equity Fund | | | 2,470 | | | | 0.7 | |
| Non-U.S. Fund | | | 13,688 | | | | 3.4 | |
Board of Trustees
The Russell Fund Complex consists of Russell Investment Company, which has 36 funds, and RIF, which has 10 funds. Each of the Trustees is a Trustee of both RIC and RIF. During the period, the Russell Fund Complex paid each of its independent Trustees a retainer of $75,000 per year, $6,500 for each regularly scheduled meeting attended in person (effective January 1, 2012, $7,000), $2,500 (effective January 1, 2012, $3,500) for each special meeting and the Annual 38a-1 meeting attended in
| | |
| Notes to Financial Statements | | 117 |
Russell Investment Funds
Notes to Financial Statements, continued — December 31, 2011
person, and for each Audit Committee meeting, Nominating and Governance Committee meeting, Investment Committee meeting or any other committee meeting established and approved by the Board that is attended in person. Each Trustee receives a $1,000 fee for attending the regularly scheduled and special meetings by phone instead of receiving the full fee had the member attended in person (except for telephonic meetings called pursuant to the Funds’ valuation and pricing procedures) and a $500 fee for attending committee meeting by phone instead of receiving the full fee had the member attended in person. Trustees’ out-of-pocket expenses are also paid by the Russell Fund Complex. The Audit Committee Chair and Investment Committee Chair are each paid a fee of $15,000 per year and the Nominating and Governance Committee Chair is paid a fee of $6,000 per year. The chairman of the Board receives additional annual compensation of $75,000 per year.
At December 31, 2011, the following Funds had net tax basis capital loss carryforwards which may be applied against any net realized taxable gains in each succeeding year or until their respective expiration dates, whichever occurs first. Under the Regulated Investment Company Modernization Act of 2010, the Funds will be permitted to carry forward capital losses incurred in taxable years beginning after December 22, 2010 for an unlimited period. However, any losses incurred during those future taxable years will be required to be utilized prior to the losses incurred in pre-enactment taxable years. As a result of this ordering rule, pre-enactment capital loss carryforwards may be more likely to expire unused. Additionally, post-enactment capital losses that are carried forward will retain their character as either short-term or long-term capital losses rather than being considered all short-term as under previous law. For the fiscal year ending December 31, 2011, the Funds had no short-term or long-term capital losses which may be carried forward indefinitely. Available capital loss carryforwards and expiration dates are as follows:
| | | | | | | | | | | | |
| Funds | | 12/31/2016 | | | 12/31/2017 | | | Totals | |
| | | | | | | | | | | | |
Multi-Style Equity | | $ | — | | | $ | 50,196,208 | | | $ | 50,196,208 | |
Aggressive Equity | | | — | | | | 33,997,250 | | | | 33,997,250 | |
Non-U.S. | | | 40,217,249 | | | | 51,040,031 | | | | 91,257,280 | |
Global Real Estate Securities | | | — | | | | 24,647,989 | | | | 24,647,989 | |
At December 31, 2011, the cost of investments and net unrealized appreciation (depreciation), undistributed ordinary income and undistributed long-term capital gains for income tax purposes were as follows:
| | | | | | | | | | | | | | | | | | | | |
| | Multi-Style
Equity Fund | | | Aggressive
Equity Fund | | | Non-U.S. Fund | | | Core Bond Fund | | | Global Real Estate
Securities Fund | |
| | | | | | | | | | | | | | | | | | | | |
Cost of Investments | | $ | 353,032,046 | | | $ | 171,445,833 | | | $ | 359,051,194 | | | $ | 583,471,369 | | | $ | 429,095,462 | |
| | | | | | | | | | | | | | | | | | | | |
Unrealized Appreciation | | $ | 32,760,764 | | | $ | 18,809,115 | | | $ | 31,571,578 | | | $ | 33,537,812 | | | $ | 151,333,423 | |
Unrealized Depreciation | | | (11,097,444 | ) | | | (7,347,173 | ) | | | (38,177,005 | ) | | | (30,451,327 | ) | | | (84,848,277 | ) |
| | | | | | | | | | | | | | | | | | | | |
Net Unrealized Appreciation (Depreciation) | | $ | 21,663,320 | | | $ | 11,461,941 | | | $ | (6,605,427 | ) | | $ | 3,086,485 | | | $ | 66,485,146 | |
| | | | | | | | | | | | | | | | | | | | |
Undistributed Ordinary Income | | $ | 1,098,318 | | | $ | — | | | $ | 3,706,713 | | | $ | 2,333,723 | | | $ | 2,178,634 | |
Undistributed Long-Term Capital Gains
(Capital Loss Carryforward) | | $ | (50,196,208 | ) | | $ | (33,997,250 | ) | | $ | (91,257,280 | ) | | $ | 1,629,917 | | | $ | (24,647,989 | ) |
Tax Composition of Distributions | | | | | | | | | | | | | | | | | | | | |
Ordinary Income | | $ | 3,846,522 | | | $ | 879,375 | | | $ | 6,022,481 | | | $ | 18,297,548 | | | $ | 11,195,328 | |
Tax-Exempt Income | | $ | — | | | $ | — | | | $ | — | | | $ | — | | | $ | — | |
Long-Term Capital Gains | | $ | — | | | $ | — | | | $ | — | | | $ | 7,302,197 | | | $ | — | |
Distributions in Excess | | $ | — | | | $ | 63,347 | | | $ | — | | | $ | — | | | $ | — | |
Tax Return of Capital | | $ | — | | | $ | — | | | $ | — | | | $ | — | | | $ | — | |
| 6. | | Fund Share Transactions (amounts in thousands) |
Share transactions for the periods ended December 31, 2011 and December 31, 2010 were as follows:
| | | | | | | | | | | | | | | | |
| | | 2011 | | | 2010 | |
| Multi-Style Equity Fund | | Shares | | | Dollars | | | Shares | | | Dollars | |
| | | | | | | | | | | | | | | | |
Proceeds from shares sold | | | 2,272 | | | $ | 31,347 | | | | 1,894 | | | $ | 22,754 | |
Proceeds from reinvestment of distributions | | | 284 | | | | 3,847 | | | | 287 | | | | 3,360 | |
Payments for shares redeemed | | | (3,854 | ) | | | (52,698 | ) | | | (4,706 | ) | | | (56,133 | ) |
| | | | | | | | | | | | | | | | |
Total increase (decrease) | | | (1,298 | ) | | $ | (17,504 | ) | | | (2,525 | ) | | $ | (30,019 | ) |
| | | | | | | | | | | | | | | | |
| | | | |
| | 118 | | | Notes to Financial Statements |
Russell Investment Funds
Notes to Financial Statements, continued — December 31, 2011
| | | | | | | | | | | | | | | | |
| | | 2011 | | | 2010 | |
| Aggressive Equity Fund | | Shares | | | Dollars | | | Shares | | | Dollars | |
| | | | | | | | | | | | | | | | |
Proceeds from shares sold | | | 1,277 | | | $ | 15,071 | | | | 1,360 | | | $ | 13,976 | |
Proceeds from reinvestment of distributions | | | 82 | | | | 942 | | | | 76 | | | | 778 | |
Payments for shares redeemed | | | (1,872 | ) | | | (22,488 | ) | | | (1,882 | ) | | | (19,240 | ) |
| | | | | | | | | | | | | | | | |
Total increase (decrease) | | | (513 | ) | | $ | (6,475 | ) | | | (446 | ) | | $ | (4,486 | ) |
| | | | | | | | | | | | | | | | |
| | | | | | | | | | | | | | | | |
| | | | | | | | | | | | | | | | |
| | | 2011 | | | 2010 | |
| Non-U.S. Fund | | Shares | | | Dollars | | | Shares | | | Dollars | |
| | | | | | | | | | | | | | | | |
Proceeds from shares sold | | | 4,119 | | | $ | 39,765 | | | | 3,705 | | | $ | 33,734 | |
Proceeds from reinvestment of distributions | | | 603 | | | | 6,023 | | | | 331 | | | | 2,908 | |
Payments for shares redeemed | | | (2,983 | ) | | | (29,666 | ) | | | (2,938 | ) | | | (26,583 | ) |
| | | | | | | | | | | | | | | | |
Total increase (decrease) | | | 1,739 | | | $ | 16,122 | | | | 1,098 | | | $ | 10,059 | |
| | | | | | | | | | | | | | | | |
| | | | | | | | | | | | | | | | |
| | | 2011 | | | 2010 | |
| Core Bond Fund | | Shares | | | Dollars | | | Shares | | | Dollars | |
| | | | | | | | | | | | | | | | |
Proceeds from shares sold | | | 9,039 | | | $ | 95,798 | | | | 8,107 | | | $ | 86,343 | |
Proceeds from reinvestment of distributions | | | 2,442 | | | | 25,606 | | | | 2,784 | | | | 29,227 | |
Payments for shares redeemed | | | (4,286 | ) | | | (45,526 | ) | | | (5,254 | ) | | | (56,066 | ) |
| | | | | | | | | | | | | | | | |
Total increase (decrease) | | | 7,195 | | | $ | 75,878 | | | | 5,637 | | | $ | 59,504 | |
| | | | | | | | | | | | | | | | |
| | | | | | | | | | | | | | | | |
| | | 2011 | | | 2010 | |
| Global Real Estate Securities Fund | | Shares | | | Dollars | | | Shares | | | Dollars | |
| | | | | | | | | | | | | | | | |
Proceeds from shares sold | | | 2,665 | | | $ | 35,655 | | | | 2,018 | | | $ | 25,770 | |
Proceeds from reinvestment of distributions | | | 818 | | | | 11,195 | | | | 783 | | | | 9,961 | |
Payments for shares redeemed | | | (1,717 | ) | | | (23,548 | ) | | | (2,807 | ) | | | (34,966 | ) |
| | | | | | | | | | | | | | | | |
Total increase (decrease) | | | 1,766 | | | $ | 23,302 | | | | (6 | ) | | $ | 765 | |
| | | | | | | | | | | | | | | | |
| 7. | | Interfund Lending Program |
The Funds have been granted permission from the Securities and Exchange Commission to participate in a joint lending and borrowing facility (the “Credit Facility”). Funds may borrow money from each other for temporary purposes. All such borrowing and lending will be subject to a participating Fund’s fundamental investment limitations. Typically, Funds will borrow from the RIC funds. A RIC lending fund will lend through the program only when the returns are higher than those available from an investment in repurchase agreements or short-term reserves and the portfolio manager determines it is in the best interest of the RIC lending fund. The Funds will borrow through the program only when the costs are equal to or lower than the cost of bank loans. Interfund loans and borrowings normally extend overnight, but can have a maximum duration of seven days. Loans may be called on one business day’s notice. A participating Fund may have to borrow from a bank at a higher interest rate if an interfund loan is called or not renewed. Any delay in repayment to the RIC lending fund could result in a lost investment opportunity or additional borrowing costs. For the period ended December 31, 2011, the Funds did not borrow or loan through the interfund lending program.
As of December 31, 2011, the following table includes shareholders of record with greater than 10% of the total outstanding shares of each respective Fund. The Northwestern Mutual Life Insurance Company accounts were the largest shareholder in each Fund.
| | | | | | | | |
| | | # of
Shareholders | | | % | |
Multi-Style Equity Fund | | | 2 | | | | 80.8 | |
Aggressive Equity Fund | | | 2 | | | | 80.2 | |
Non-U.S. Fund | | | 2 | | | | 74.2 | |
Core Bond Fund | | | 3 | | | | 84.7 | |
Global Real Estate Securities Fund | | | 2 | | | | 91.9 | |
| | |
| Notes to Financial Statements | | 119 |
Russell Investment Funds
Notes to Financial Statements, continued — December 31, 2011
Restricted securities are subject to contractual limitations on resale, are often issued in private placement transactions, and are not registered under the Securities Act of 1933, as amended (the “Act”). The most common types of restricted securities are those sold under Rule 144A of the Act and commercial paper sold under Section 4(2) of the Act.
A Fund may invest a portion of its net assets not to exceed 15% in securities that are illiquid. This limitation is applied at the time of purchase. Illiquid securities are securities that may not be readily marketable, and that cannot be sold within seven days in the ordinary course of business at the approximate amount at which the Fund has valued the securities. Restricted securities are generally considered to be illiquid.
The following table lists restricted securities held by a Fund that are illiquid. The following table does not include (1) securities deemed liquid by RIMCo or a money manager pursuant to Board approved policies and procedures or (2) illiquid securities that are not restricted securities as designated on a Fund’s Schedule of Investments.
| | | | | | | | | | | | | | | | | | | | |
Fund - % of Net Assets
Securities | | Acquisition
Date | | | Principal
Amount ($)
or Shares | | | Cost per
Unit
$ | | | Cost
(000)
$ | | | Market Value
(000)
$ | |
| | | | | | | | | | | | | | | | | | | | |
Aggressive Equity Fund - 0.2% | | | | | | | | | | | | | | | | | | | | |
Cohu, Inc. | | | 03/02/07 | | | | 25,540 | | | | 12.55 | | | | 320 | | | | 290 | |
| | | | | | | | | | | | | | | | | | | | |
| | | | | | | | | | | | | | | | | | | 290 | |
| | | | | | | | | | | | | | | | | | | | |
Non-U.S. Fund - 0.2% | | | | | | | | | | | | | | | | | | | | |
Rolls-Royce Holdings PLC | | | 03/18/10 | | | | 61,640 | | | | 8.95 | | | | 552 | | | | 715 | |
| | | | | | | | | | | | | | | | | | | | |
| | | | | | | | | | | | | | | | | | | 715 | |
| | | | | | | | | | | | | | | | | | | | |
Core Bond Fund - 0.6% | | | | | | | | | | | | | | | | | | | | |
Adams Aircraft Industries, Inc. Term | | | 05/22/07 | | | | 49 | | | | 114.22 | | | | 56 | | | | — | |
ARES CLO, Ltd. | | | 01/15/09 | | | | 248,363 | | | | 79.08 | | | | 197 | | | | 241 | |
Australia & New Zealand Banking Group, Ltd. | | | 06/15/11 | | | | 300,000 | | | | 99.83 | | | | 300 | | | | 300 | |
Chatham Light CLO, Ltd. | | | 11/25/09 | | | | 453,885 | | | | 91.88 | | | | 417 | | | | 437 | |
CIT Mortgage Loan Trust | | | 10/05/07 | | | | 38,017 | | | | 100.00 | | | | 38 | | | | 37 | |
CIT Mortgage Loan Trust | | | 10/05/07 | | | | 130,000 | | | | 100.00 | | | | 130 | | | | 97 | |
CIT Mortgage Loan Trust | | | 10/05/07 | | | | 180,000 | | | | 100.00 | | | | 180 | | | | 72 | |
DG Funding Trust | | | 11/04/03 | | | | 49 | | | | 10,537.12 | | | | 516 | | | | 368 | |
Escrow GM Corp | | | 04/21/11 | | | | 80,000 | | | | — | | | | — | | | | 30 | |
UBS AG | | | 11/05/07 | | | | 270,000 | | | | 55.27 | | | | 149 | | | | 79 | |
Washington Mutual Mortgage Pass Through Certificates | | | 04/01/05 | | | | 183,195 | | | | 100.00 | | | | 183 | | | | 7 | |
Weatherford International, Ltd. | | | 04/21/11 | | | | 250,000 | | | | 127.70 | | | | 319 | | | | 323 | |
Westchester CLO, Ltd. | | | 01/04/11 | | | | 1,281,544 | | | | 89.57 | | | | 1,148 | | | | 1,143 | |
| | | | | | | | | | | | | | | | | | | | |
| | | | | | | | | | | | | | | | | | | 3,134 | |
| | | | | | | | | | | | | | | | | | | | |
Global Real Estate Securities Fund—0.0% | | | | | | | | | | | | | | | | | | | | |
BGP Holdings PLC | | | 08/06/09 | | | | 926,311 | | | | — | | | | — | | | | — | |
| | | | | | | | | | | | | | | | | | | | |
| | | | | | | | | | | | | | | | | | | — | |
| | | | | | | | | | | | | | | | | | | | |
Illiquid securities and restricted securities may be priced by the Funds using fair value procedures approved by the Board.
Management has evaluated the events and/or transactions that have occurred through the date the financial statements were issued and noted no items requiring adjustments of the financial statements or additional disclosures.
| | | | |
| | 120 | | | Notes to Financial Statements |
Report of Independent Registered Public Accounting Firm
To the Board of Trustees and Shareholders
of Russell Investment Funds
In our opinion, the accompanying statements of assets and liabilities, including the schedules of investments, and the related statements of operations and of changes in net assets and the financial highlights present fairly, in all material respects, the financial position of Multi-Style Equity Fund, Aggressive Equity Fund, Non-U.S. Fund, Core Bond Fund, and Global Real Estate Securities Fund (five of the portfolios constituting the Russell Investment Funds, hereafter referred to as the “Funds”) at December 31, 2011, the results of each of their operations for the year then ended, the changes in each of their net assets for each of the two years in the period then ended and the financial highlights for each of the five years in the period then ended, in conformity with accounting principles generally accepted in the United States of America. These financial statements and financial highlights (hereafter referred to as “financial statements”) are the responsibility of the Funds’ management; our responsibility is to express an opinion on these financial statements based on our audits. We conducted our audits of these financial statements in accordance with the standards of the Public Company Accounting Oversight Board (United States). Those standards require that we plan and perform the audits to obtain reasonable assurance about whether the financial statements are free of material misstatement. An audit includes examining, on a test basis, evidence supporting the amounts and disclosures in the financial statements, assessing the accounting principles used and significant estimates made by management, and evaluating the overall financial statement presentation. We believe that our audits, which included confirmation of securities at December 31, 2011 by correspondence with the custodian, brokers, and transfer agent, and the application of alternative auditing procedures where securities purchased confirmations had not been received, provide a reasonable basis for our opinion.

PricewaterhouseCoopers LLP
Seattle, Washington
February 15, 2012
| | |
| Report of Independent Registered Public Accounting Firm | | 121 |
Russell Investment Funds
Tax Information — December 31, 2011 (Unaudited)
For the tax year ended December 31, 2011, the Funds hereby designate 100% or the maximum amount allowable, of its net taxable income as qualified dividends taxed at individual net capital gain rates.
The Form 1099 you receive in January 2012 will show the tax status of all distributions paid to your account in calendar year 2011.
The Funds designate dividends distributed during the fiscal year as qualifying for the dividends received deduction for corporate shareholders as follows:
| | | | |
Multi-Style Equity Fund | | | 100.0 | % |
Aggressive Equity Fund | | | 100.0 | % |
Non-U.S. Fund | | | 4.0 | % |
Core Bond Fund | | | 0.0 | % |
Global Real Estate Securities Fund | | | 0.0 | % |
Pursuant to Section 852 of the Internal Revenue Code, the Funds designate the following amounts as long-term capital gain dividends for their taxable year ended December 31, 2011:
| | | | |
| | | Long-Term Capital
Gains | |
| | | | |
Core Bond | | $ | 7,302,197 | |
Please consult a tax adviser for any questions about federal or state income tax laws.
The Non-U.S Fund paid foreign taxes of $871,448 and recognized $9,564,310 of foreign source income during the taxable year ended December 31, 2011. Pursuant to Section 853 of the Internal Revenue Code, the Fund designates $0.0231 per share of foreign taxes paid and $0.2539 of gross income per share earned from foreign sources in the taxable year ended December 31, 2011.
Russell Investment Funds
Basis for Approval of Investment Advisory Contracts — (Unaudited)
Approval of Investment Advisory Agreement
The Board of Trustees, including all of the Independent Trustees, last considered and approved the continuation of the advisory agreement with RIMCo (the “RIMCo Agreement”) and the portfolio management contract with each Money Manager of the Funds (collectively, the “portfolio management contracts”) in which the Funds invest (the “Underlying Funds”) at a meeting held in person on April 19, 2011 (the “Agreement Evaluation Meeting”). During the course of a year, the Trustees receive a wide variety of materials regarding the investment performance of the Funds, sales and redemptions of the Funds’ and Underlying Funds’ shares, management of the Funds and the Underlying Funds by RIMCo and compliance with applicable regulatory requirements. In preparation for the annual review, the Independent Trustees, with the advice and assistance of their independent counsel, also requested and the Board considered (1) information and reports prepared by RIMCo relating to the services provided by RIMCo (and its affiliates) to the Funds and the Underlying Funds; and (2) information (the “Third-Party Information”) received from an independent, nationally recognized provider of investment company information comparing the performance of each of the Funds and the Underlying Funds and their respective operating expenses over various periods of time with other peer funds not managed by RIMCo, believed by the provider to be generally comparable in investment objectives to the Funds and the Underlying Funds. In the case of each Fund, its other peer funds are collectively hereinafter referred to as the Fund’s “Comparable Funds,” and, with the Fund, such Comparable Funds are collectively hereinafter referred to as the Fund’s “Performance Universe” in the case of performance comparisons and the Fund’s “Expense Universe” in the case of operating expense comparisons. In the case of certain Funds, the Third-Party Information reflected changes in the Comparable Funds requested by RIMCo, which changes were noted in the Third-Party Information. The foregoing information requested by the Trustees or provided by RIMCo is collectively called the “Agreement Evaluation Information.” The Trustees’ evaluations also reflected the knowledge and familiarity gained as Board members of the Funds and other funds in the same complex with respect to services provided by RIMCo, RIMCo’s affiliates and each Money Manager. The Trustees received a memorandum from counsel to the Funds and Underlying Funds discussing the legal standards for their consideration of the continuations of the RIMCo Agreement and the portfolio management contracts, and the Independent Trustees separately received a memorandum regarding their responsibilities from their independent counsel.
On April 11, 2011, the Independent Trustees in preparation for the Agreement Evaluation Meeting met by conference telephone call to review Agreement Evaluation Information received to that date in a private session with their independent counsel at which no representatives of RIMCo or the Funds’ management were present and, on the basis of that review, requested additional Agreement Evaluation Information. At the Agreement Evaluation Meeting, the Board, including the Independent Trustees, reviewed the proposed continuance of the RIMCo Agreement and the portfolio management contracts with management, counsel to the Funds and Underlying Funds and independent counsel to the Independent Trustees. Presentations made by RIMCo to the Board as part of this review encompassed the Funds and all other RIMCo-managed funds for which the Board has supervisory responsibility. Following this review, but prior to voting, the Independent Trustees again met in executive session with their independent counsel to consider additional Agreement Evaluation Information received from RIMCo and management at the Agreement Evaluation Meeting. The discussion below reflects all of these reviews.
In evaluating the portfolio management contracts, the Board considered RIMCo’s advice that the Underlying Funds, in employing a manager-of-managers method of investment, operate in a manner that is distinctly different from most other investment companies. In the case of most other investment companies, an advisory fee is paid by the investment company to its adviser which, in turn, employs and compensates individual portfolio managers to make specific securities selections consistent with the adviser’s style and investment philosophy. RIMCo has engaged multiple unaffiliated Money Managers for all Underlying Funds.
The Board considered that RIMCo (rather than any Money Manager) is responsible under the RIMCo Agreement for allocating assets of each Fund among its Underlying Funds and for determining, implementing and maintaining the investment program for each Underlying Fund. The assets of each Fund are invested in different combinations of the Underlying Funds pursuant to target asset allocations set by RIMCo. RIMCo may modify the target asset allocation for any Fund and/or the Underlying Funds in which the Funds invest. Assets of each Underlying Fund generally have been allocated among the multiple Money Managers selected by RIMCo, subject to Board approval, for that Underlying Fund. RIMCo manages directly a portion of one Underlying Fund’s assets employing a “select holdings strategy,” as described below. RIMCo also may manage directly any portion of each Underlying Fund’s assets that RIMCo determines not to allocate to the Money Managers and portions of an Underlying Fund during transitions between Money Managers. In all cases, assets are managed directly by RIMCo pursuant to authority provided by the RIMCo Agreement.
RIMCo is responsible for selecting, subject to Board approval, Money Managers for each Underlying Fund and for actively managing allocations and reallocations of its assets among the Money Managers. The Board has been advised that RIMCo’s goal is to construct and manage diversified portfolios in a risk-aware manner. Each Money Manager for an Underlying Fund in effect performs the function of an individual portfolio manager who is responsible for selecting portfolio securities for the portion of the Underlying Fund assigned to it by RIMCo (each, a “segment”) in accordance with the Underlying Fund’s applicable investment objective, policies and restrictions, any constraints placed by RIMCo upon their selection of portfolio securities and the Money Manager’s specified role in
| | |
| Basis for Approval of Investment Advisory Contracts | | 123 |
Russell Investment Funds
Basis for Approval of Investment Advisory Contracts, continued — (Unaudited)
an Underlying Fund. RIMCo is responsible for communicating performance expectations to each Money Manager; supervising compliance by each Money Manager with each Underlying Fund’s investment objective and policies; authorizing Money Managers to engage in certain investment strategies for an Underlying Fund; and recommending annually to the Board whether portfolio management contracts should be renewed, modified or terminated. In addition to its annual recommendation as to the renewal, modification or termination of portfolio management contracts, RIMCo is responsible for recommending to the Board additions of new Money Managers or replacements of existing Money Managers at any time when, based on RIMCo’s research and ongoing review and analysis, such actions are appropriate. RIMCo may impose specific investment constraints from time to time for each Money Manager intended to capitalize on the strengths of that Money Manager or to coordinate the investment activities of Money Managers for an Underlying Fund in a complementary manner. Therefore, the performance of individual Money Managers for an Underlying Fund may reflect the roles assigned to them by RIMCo in the Underlying Fund’s investment activities and any constraints placed by RIMCo upon their selection of portfolio securities. In light of the foregoing, the overall performance of each Underlying Fund over appropriate periods reflects, in great part, the performance of RIMCo in designing the Underlying Fund’s investment program, structuring an Underlying Fund, selecting an effective Money Manager with a particular investment style or sub-style for a segment that is complementary to the styles of the Money Managers of other Underlying Fund segments, and allocating assets among the Money Managers in a manner designed to achieve the objectives of the Underlying Fund.
The Board considered that the prospectuses for the Funds and the Underlying Funds and other public disclosures emphasize to investors RIMCo’s role as the principal investment manager for each Underlying Fund, rather than the investment selection role of the Underlying Funds’ Money Managers, and describe the manner in which the Funds or Underlying Funds operate so that investors may take that information into account when deciding to purchase shares of any such Fund. The Board further considered that Fund investors in pursuing their investment goals and objectives likely purchased their shares on the basis of this information and RIMCo’s reputation for and performance record in managing the Underlying Funds’ manager-of-managers structure.
The Board also considered the demands and complexity of managing the Underlying Funds pursuant to the manager-of-managers structure, the special expertise of RIMCo with respect to the manager-of-managers structure of the Underlying Funds and the likelihood that, at the current expense ratio of each Underlying Fund, there would be no acceptable alternative investment managers to replace RIMCo on comparable terms given the need to continue the manager-of-managers strategy of such Underlying Fund selected by shareholders in purchasing their shares of a Fund or Underlying Fund.
In addition to these general factors relating to the manager-of-managers structure of the Underlying Funds, the Trustees considered, with respect to each Fund and Underlying Fund, various specific factors in evaluating renewal of the RIMCo Agreement, including the following:
| 1. | The nature, scope and overall quality of the investment management and other services provided, and expected to be provided, to the Fund or the Underlying Fund by RIMCo; |
| 2. | The advisory fee paid by the Fund or the Underlying Fund to RIMCo (the “Advisory Fee”) and the fact that it encompasses all investment advisory fees paid by the Fund or Underlying Fund, including the fees for any Money Managers of such Underlying Fund; |
| 3. | Information provided by RIMCo as to other fees and benefits received by RIMCo or its affiliates from the Fund or Underlying Fund, including any administrative, transfer agent or cash management fees and fees received for management of securities lending cash collateral, soft dollar arrangements and commissions in connection with portfolio securities transactions; |
| 4. | Information provided by RIMCo as to expenses incurred by the Fund or the Underlying Fund; and |
| 5. | Information provided by RIMCo as to the profits that RIMCo derives from its mutual fund operations generally and from the Fund or Underlying Fund. |
In evaluating the nature, scope and overall quality of the investment management and other services provided and which are expected to be provided to the Funds, including Fund portfolio management services, the Board inquired as to the continuing impact on the Funds’ operations of significant changes in RIMCo’s senior management and other personnel providing services to the Funds during 2009 and 2010 and to the date of the Agreement Evaluation Meeting and the relocation of the Russell organization’s headquarters. At the Agreement Evaluation Meeting, senior representatives of RIMCo discussed these changes with the Board and assured the Board that such changes have not resulted in any diminution in the nature, scope or quality of the services provided to the Funds or the Underlying Funds. The Board also discussed the impact of such changes on the compliance programs of the Funds, the Underlying Funds and RIMCo with the Funds’ Chief Compliance Officer (the “CCO”) and received assurances from the CCO that such changes have not resulted in any diminution in the scope and quality of the compliance programs of the Funds or the Underlying Funds.
| | | | |
| | 124 | | | Basis for Approval of Investment Advisory Contracts |
Russell Investment Funds
Basis for Approval of Investment Advisory Contracts, continued — (Unaudited)
As noted above, RIMCo, pursuant to the terms of the RIMCo Agreement, directly manages a portion — up to 10% — of the assets of the RIF Multi-Style Equity Fund (the “Participating Underlying Fund”) utilizing a select holdings strategy, the actual allocation being determined by the Participating Underlying Fund’s RIMCo portfolio manager. The select holdings strategy utilized by RIMCo in managing such assets for the Participating Underlying Fund is designed to increase the Participating Underlying Fund’s exposure to stocks that are viewed as attractive by multiple Money Managers of the Participating Underlying Fund. The Board considered that the select holdings strategy initially was utilized for two other mutual funds under the management of RIMCo but did not achieve the objectives anticipated by RIMCo in respect of such funds and therefore was discontinued. Against this background, the Board reviewed the results of the select holdings strategy in respect of the Participating Underlying Fund during the past year. The Trustees considered that RIMCo is not required to pay investment advisory fees to a Money Manager with respect to assets for which the select holdings strategy is utilized and that the profits derived by RIMCo generally and from the Participating Underlying Fund consequently may increase incrementally. The Board, however, also considered RIMCo’s advice that it pays certain Money Managers additional fees for providing information and other services in connection with the select holdings strategy and incurs additional costs in carrying out the select holdings strategy, the limited amount of assets that are managed directly by RIMCo pursuant to the select holdings strategy, and the fact that the aggregate investment advisory fees paid by the Participating Underlying Fund are not increased as a result of the select holdings strategy.
In evaluating the reasonableness of the Funds’ and Underlying Funds’ Advisory Fees in light of Fund and Underlying Fund performance, the Board considered that, in the Agreement Evaluation Information and at past meetings, RIMCo noted differences between the investment strategies of certain Underlying Funds and their respective Comparable Funds in pursuing their investment objectives, including fund strategies which seek to achieve a lower tracking error (i.e., the difference, whether positive or negative, between the return of a fund and its benchmark) and resulting lower return volatility than their Comparable Funds. According to RIMCo, these strategies may be expected to result, and for certain Underlying Funds during the periods covered by the Third-Party Information did result, in lower performance of the Underlying Funds than that of some of their Comparable Funds. According to RIMCo, the strategies pursued by the Underlying Funds, among other things, are intended to result in less volatile, more moderate returns relative to each Underlying Fund’s performance benchmark rather than more volatile, more extreme returns that its Comparable Funds may experience over time, although Fund results in 2008 and early 2009 generally did not reflect uniform success in achieving lesser volatility.
In discussing the Advisory Fees for the Underlying Funds generally, RIMCo noted, among other things, that its Advisory Fees for Underlying Funds encompass services that may not be provided by investment advisers to the Underlying Funds’ Comparable Funds, such as cash equitization and management of portfolio transition costs when Money Managers are added, terminated or replaced. RIMCo also observed that its “margins” in providing investment advisory services to the Underlying Funds tend to be lower than competitors’ margins because of the demands and complexities of managing the Underlying Funds’ manager-of-managers structure, including RIMCo’s payment of a significant portion of the Underlying Funds’ Advisory Fees to their Money Managers.
The Board noted RIMCo’s advice that the services provided to the Funds and the Underlying Funds pursuant to the RIMCo Agreement do not encompass cash management services and considered RIMCo’s belief that its Advisory Fees nevertheless are reasonable. The Board also noted that the uninvested cash of the Underlying Funds is “swept” into a pooled investment vehicle maintained by RIMCo and that RIMCo receives a separate investment advisory fee from that investment vehicle to manage its investment portfolio. The Board considered and relied upon views expressed by RIMCo and counsel to the Funds and the Underlying Funds at the Agreement Evaluation Meeting and prior meetings regarding the appropriateness and permissibility of the separate advisory fees received by RIMCo from the investment vehicle and further considered that such fees, while being accrued on the books of the investment vehicle, are not being distributed to RIMCo pending resolution of certain issues raised by regulators.
The Board considered for each Fund and Underlying Fund whether economies of scale have been realized and whether the Advisory Fees for such Fund or Underlying Fund appropriately reflect or should be revised to reflect any such economies. The Board determined that, after giving effect to any applicable fee or expense caps, waivers or reimbursements, the Advisory Fee for each Fund or Underlying Fund appropriately reflected any economies of scale realized by that Fund, based upon such factors as the variability of Money Manager investment advisory fees and other factors associated with the manager-of-managers structure employed by the Underlying Funds.
The Board considered, as a general matter, that fees payable to RIMCo by institutional clients with investment objectives similar to those of the Funds and other funds under the Board’s supervision, including the Underlying Funds, are lower, and, in some cases, may be substantially lower, than the rates paid by the funds supervised by the Board, including the Funds. The Trustees considered the differences in the nature and scope of services RIMCo provides to institutional clients and the funds under its supervision, including the Underlying Funds. RIMCo explained, among other things, that institutional clients have fewer administrative needs than the Funds. RIMCo also noted that since the Funds must constantly issue and redeem their shares, they are more difficult to manage than institutional accounts, where assets are relatively stable. In addition, RIMCo noted that the Funds are subject to
| | |
| Basis for Approval of Investment Advisory Contracts | | 125 |
Russell Investment Funds
Basis for Approval of Investment Advisory Contracts, continued — (Unaudited)
heightened regulatory requirements relative to institutional clients. The Board noted that RIMCo provides office space and facilities to the Funds and Underlying Funds and all of the Funds’ and Underlying Funds’ officers. Accordingly, the Trustees concluded that the services provided to the Funds and Underlying Funds are sufficiently different from the services provided to the other clients that comparisons are not probative and should not be given significant weight.
With respect to the Funds’ Advisory Fees, the Third-Party Information showed that the Advisory fee for each Fund, on a contractual basis, was ranked in the fourth quintile of its Expense Universe but was ranked in the first quintile of its Expense Universe an actual basis (i.e., giving effect to any voluntary fee waivers implemented by RIMCo and the advisers to such Fund’s Comparable Funds). The comparisons were based upon the latest fiscal years for the Expense Universe funds. In assessing the Funds’ Advisory Fees, the Board focused on actual Advisory Fees.
With respect to the Funds’ total expenses, the Third-Party Information showed that, with the exception of the Equity Growth Strategy Fund, each of the Funds had total expenses which were ranked at least in the third quintile of its Expense Universe. In these rankings, the first quintile represents funds with the lowest total expenses among the Expense Universe Funds and the fifth quintile represents funds with the highest total expenses among the Expense Universe Funds. The Board considered RIMCo’ advice with respect to the Equity Growth Strategy Fund that its total expenses were within 5 basis points of the third quintile of its Expense Universe.
On the basis of the Agreement Evaluation Information, and other information previously received by the Board from RIMCo during the course of the current year or prior years, or presented at or in connection with the Agreement Evaluation Meeting by RIMCo, the Board, in respect of each Fund and Underlying Fund, found, after giving effect to any applicable waivers and/or reimbursements and considering differences in the composition and investment strategies of their respective Comparable Funds (1) the Advisory Fee charged by RIMCo was reasonable in light of the nature, scope and overall quality of the investment management and other services provided, and expected to be provided, to the Funds or Underlying Funds; (2) the relative expense ratio of each Fund and Underlying Fund was comparable to those of its Comparable Funds; (3) RIMCo’s methodology of allocating expenses of operating funds in the complex was reasonable; (4) other benefits and fees received by RIMCo or its affiliates from the Funds or Underlying Funds were not excessive; and (5) RIMCo’s profitability with respect to the Funds and each Underlying Fund was not excessive in light of the nature, scope and overall quality of the investment management and other services provided by RIMCo.
In evaluating the performance of the Funds and Underlying Funds generally relative to their Comparable Funds, the Board, in addition to factors discussed above, also considered RIMCo’s advice that many of the Underlying Funds’ Comparable Funds do not “equitize” their cash (i.e., cash awaiting investment or disbursement to satisfy redemptions or other fund obligations) and may hold large cash positions uninvested in their investment portfolios. By contrast, the Underlying Funds generally follow a strategy of equitizing their cash and fully investing their assets in pursuit of their investment objectives (the Underlying Funds’ strategy of equitizing cash and fully investing their assets is hereinafter referred to as their “full investment strategy”). RIMCo noted that the Underlying Funds’ full investment strategy generally will detract from their relative performance, and therefore the relative performance of the Funds, in a declining market, such as 2008, but may enhance relative performance in a rising market, such as 2009 and 2010.
The Board concluded that, under the circumstances, the performance of each of the Funds was consistent with continuation of the RIMCo Agreement. In evaluating performance, the Board considered each Fund’s and Underlying Fund’s absolute performance and performance relative to appropriate benchmarks and indices in addition to such Fund’s performance relative to its Comparable Funds. In assessing the Funds’ performance relative to their Comparable Funds or benchmarks or in absolute terms, the Board also considered RIMCo’s stated investment strategy of managing the Underlying Funds in a risk-aware manner and the extraordinary capital market conditions during 2008 and early 2009.
After considering the foregoing and other relevant factors and, the Board concluded that continuation of the RIMCo Agreement on its current terms and conditions would be in the best interests of each Fund and its respective shareholders and voted to approve the continuation of the RIMCo Agreement.
At the Agreement Evaluation Meeting, with respect to the evaluation of the terms of portfolio management contracts with Money Managers for the Underlying Funds, the Board received and considered information from RIMCo reporting, among other things, for each Money Manager, the Money Manager’s performance over various periods; RIMCo’s assessment of the performance of each Money Manager; any significant business relationships between the Money Manager and RIMCo or Russell Financial Services, Inc., the Funds’ and Underlying Funds’ underwriter; and RIMCo’s recommendation to retain the Money Manager at the current fee rate, to retain the Money Manager at a reduced fee rate or to terminate the Money Manager. The Board received reports during the course of the year from the CCO regarding each Money Manager’s compliance program. RIMCo recommended that each Money Manager be retained at its current fee rate. RIMCo has advised the Board that it does not regard Money Manager profitability as relevant to its
| | | | |
| | 126 | | | Basis for Approval of Investment Advisory Contracts |
Russell Investment Funds
Basis for Approval of Investment Advisory Contracts, continued — (Unaudited)
evaluation of the portfolio management contracts with Money Managers because the willingness of Money Managers to serve in such capacity depends upon arm’s-length negotiations with RIMCo; RIMCo is aware of the fees charged by Money Managers to other clients; and RIMCo believes that the fees agreed upon with Money Managers are reasonable in light of the anticipated quality of investment advisory services to be rendered. The Board accepted RIMCo’s explanation in light of the Board’s findings as to the reasonableness of the Advisory Fee paid by each Fund and Underlying Fund and the fact that each Money Manager’s fee is paid by RIMCo.
Based substantially upon RIMCo’s recommendations, together with the Agreement Evaluation Information and other information received from RIMCo in support of its recommendations at the Agreement Evaluation Meeting, the Board concluded that the fees paid to the Money Managers of each Underlying Fund are reasonable in light of the quality of the investment advisory services provided and that continuation of the portfolio management contract with each Money Manager of each Underlying Fund would be in the best interests of such Underlying Fund and its shareholders.
In their deliberations, the Trustees did not identify any particular information as to the RIMCo Agreement or, other than RIMCo’s recommendation, the portfolio management contract with any Money Manager for an Underlying Fund that was all-important or controlling and each Trustee attributed different weights to the various factors considered. The Trustees evaluated all information available to them on a Fund-by-Fund basis and their determinations were made in respect of each Fund and Underlying Fund.
Subsequently, the Board of Trustees received a proposal from RIMCo at a meeting held on December 6, 2011, to effect a money manager change for the RIF Multi-Style Equity Fund. In the case of the proposed change, the Trustees approved the terms of the proposed portfolio management contract based substantially upon RIMCo’s recommendation to hire the Money Manager at the proposed fee rate; any significant business relationships between the Money Manager and RIMCo or Russell Financial Services, Inc., the Fund’s underwriter; RIMCo’s explanation as to the lack of relevance of profitability to the evaluation of portfolio management contracts with money managers because the willingness of Money Managers to serve in such capacity depends upon arm’s-length negotiations with RIMCo; RIMCo’s awareness of the fees charged by the Money Manager to other clients; and RIMCo’s belief that the proposed investment advisory fees would be reasonable in light of the anticipated quality of investment advisory services to be rendered. The Trustees also considered their findings at their April 19, 2011 meeting as to the reasonableness of the aggregate investment advisory fees paid by the Fund, and the fact that the aggregate investment advisory fees paid by the Fund would not increase as a result of the implementation of the proposed money manager change because the money managers’ investment advisory fee is paid by RIMCo.
| | |
| Basis for Approval of Investment Advisory Contracts | | 127 |
Russell Investment Funds
Shareholder Request for Additional Information — December 31, 2011 (Unaudited)
A complete unaudited schedule of investments is made available generally no later than 60 days after the end of the first and third quarters of each year. These reports are available (i) free of charge, upon request, by calling the Funds at (800) 787-7354, (ii) on the Securities and Exchange Commission’s website at www.sec.gov, and (iii) at the Securities and Exchange Commission’s public reference room.
The Board has delegated to RIMCo, as RIF’s investment adviser, the primary responsibility for monitoring, evaluating and voting proxies solicited by or with respect to issuers of securities in which assets of the Funds may be invested. RIMCo has established a proxy voting committee and has adopted written proxy voting policies and procedures (“P&P”) and proxy voting guidelines (“Guidelines”). The Funds maintain a Portfolio Holdings Disclosure Policy that governs the timing and circumstances of disclosure to shareholders and third parties of information regarding the portfolio investments held by the Funds. A description of the P&P, Guidelines, Portfolio Holdings Disclosure Policy and additional information about Fund Trustees are contained in the Funds’ Statement of Additional Information (“SAI”). The SAI and information regarding how the Funds voted proxies relating to portfolio securities during the most recent 12 month period ended December 31, 2011 are available (i) free of charge, upon request, by calling the Funds at (800) 787-7354, and (ii) on the Securities and Exchange Commission’s website at www.sec.gov.
If possible, depending on contract owner registration and address information, and unless you have otherwise opted out, only one copy of the RIF prospectus and each annual and semi-annual report will be sent to contract owners at the same address. If you would like to receive a separate copy of these documents, please contact your Insurance Company. If you currently receive multiple copies of the prospectus, annual report and semi-annual report and would like to request to receive a single copy of these documents in the future, please call your insurance company.
Some insurance companies may offer electronic delivery of the Funds’ prospectus and annual and semi-annual reports. Please contact your insurance company for further details.
| | | | |
| | 128 | | | Shareholder Request for Additional Information |
Russell Investment Funds
Disclosure of Information about Fund Trustees and Officers — December 31, 2011 (Unaudited)
The following tables provide information for each officer and trustee of the Russell Fund Complex. The Russell Fund Complex consists of Russell Investment Company (“RIC”), which has 36 funds, and Russell Investment Funds (“RIF”), which has 10 funds. Each of the trustees is a trustee of both RIC and RIF. The first table provides information for the interested trustee. The second table provides information for the independent trustees. The third table provides information for the trustees emeritus. The fourth table provides information for the officers. Furthermore, each Trustee possesses the following specific attributes: Mr. Alston has business, financial and investment experience as a senior executive of an international real estate firm and is trained as a lawyer; Ms. Blake has had experience as a certified public accountant and has had experience as a member of boards of directors/trustees of other investment companies; Mr. Connealy has had experience with other investment companies and their investment advisers first as a partner in the investment management practice of PricewaterhouseCoopers LLP and, subsequently, as the senior financial executive of two other investment organizations sponsoring and managing investment companies, and has been determined by the Board to be an “audit committee financial expert,” as explained below; Mr. Fine has had financial, business and investment experience as a senior executive of a non-profit organization and previously, as a senior executive of a large regional financial services organization with management responsibility for such activities as investments, asset management and securities brokerage; Mr. Tennison has had business, financial and investment experience as a senior executive of a corporation with international activities and was trained as an accountant; Mr. Thompson has had experience in business, governance, investment and financial reporting matters as a senior executive of an organization sponsoring and managing other investment companies, and, subsequently, has served as a board member of other investment companies; and Ms. Weston has had experience as a tax and corporate lawyer, has served as general counsel of several corporations and has served as a director of another investment company. Ms. Cavanaugh, the only interested trustee, has had experience with other financial services companies, including companies engaged in the sponsorship, management and distribution of investment companies. As a senior officer of the Funds, the Adviser and various affiliates of the Adviser providing services to the Funds, Ms. Cavanaugh is in a position to provide the Board with such parties’ perspectives on the management, operations and distribution of the Funds.
| | | | | | | | | | | | |
Name,
Age,
Address | | Position(s) Held
with Fund and
Length of
Time Served | | Term
of
Office* | | Principal Occupation(s)
During the
Past 5 Years | | No. of
Portfolios
in Russell
Fund
Complex
Overseen
by Trustee | | | Other
Directorships Held
by Trustee
During the
Past 5 Years |
INTERESTED TRUSTEES | | |
# Sandra Cavanaugh,
Born May 10, 1954 1301 Second Avenue, 18th Floor Seattle, WA 98101 | | President and Chief Executive Officer since 2010 Trustee since 2010 | | Appointed until successor is duly elected and qualified Until successor is chosen and qualified by Trustees | | • President and CEO RIC and RIF • Chairman of the Board, President and CEO, Russell Financial Services, Inc. • Chairman of the Board, President and CEO, Russell Fund Services Company (“RFSC”) • Chairman of the Board and President, Russell Insurance Agency, Inc. (insurance agency (“RIA”)) • May 2009 to December 2009, Executive Vice President, Retail Channel, SunTrust Bank • 2007 to January 2009, Senior Vice President, National Sales — Retail Distribution, JPMorgan Chase/ Washington Mutual, Inc. • 1997 to 2007, President — WM Funds Distributor & Shareholder Services/WM Financial Services | | | 46 | | | None |
| # | Ms. Cavanaugh is also an officer and/or director of one or more affiliates of RIC and RIF and is therefore an Interested Trustee. |
| * | Each Trustee is subject to mandatory retirement at age 72. |
| | |
| Disclosure of Information about Fund Trustees and Officers | | 129 |
Russell Investment Funds
Disclosure of Information about Fund Trustees and Officers — December 31, 2011 (Unaudited)
| | | | | | | | | | | | |
Name,
Age,
Address | | Position(s) Held
with Fund and
Length of
Time Served | | Term
of
Office* | | Principal Occupation(s)
During the
Past 5 Years | | No. of
Portfolios
in Russell
Fund
Complex
Overseen
by Trustee | | | Other
Directorships Held
by Trustee
During the
Past 5 Years |
INDEPENDENT TRUSTEES | | |
Thaddas L. Alston,
Born April 7, 1945 1301 Second Avenue, 18th Floor Seattle, WA 98101 | | Trustee since 2006 Chairman of the Investment Committee since 2010 | | Appointed until successor is duly elected and qualified Appointed until successor is duly elected and qualified | | • Senior Vice President, Larco Investments, Ltd. (real estate firm) | | | 46 | | | None |
| | | | | | | | | | | | | |
Kristianne Blake,
Born January 22, 1954 1301 Second Avenue, 18th Floor Seattle, WA 98101 | | Trustee since 2000 Chairman since 2005 | | Appointed until successor is duly elected and qualified Annual | | • Director and Chairman of the Audit Committee, Avista Corp. • Trustee and Chairman of the Operations Committee, Principal Investors Funds and Principal Variable Contracts Funds • Regent, University of Washington • President, Kristianne Gates Blake, P.S. (accounting services) • February 2002 to June 2005, Chairman of the Audit Committee, RIC and RIF • Trustee and Chairman of the Operations and Distribution Committee, WM Group of Funds, 1999–2006 | | | 46 | | | • Director, Avista Corp (electric utilities); • Trustee, Principal Investors Funds (investment company); • Trustee, Principal Variable Contracts Funds (investment company) • Trustee, WM Group of Funds until 2006 (investment company) |
| | | | | | | | | | | | | |
Daniel P. Connealy,
Born June 6, 1946 1301 Second Avenue, 18th Floor Seattle, WA 98101 | | Trustee since 2003 Chairman of Audit Committee since 2005 | | Appointed until successor is duly elected and qualified Appointed until successor is duly elected and qualified | | • June 2004 to present, Senior Vice President and Chief Financial Officer, Waddell & Reed Financial, Inc. | | | 46 | | | • Director, Gold Banc Corporation until 2006 |
| | | | | | | | | | | | | |
Jonathan Fine,
Born July 8, 1954 1301 Second Avenue, 18th Floor Seattle, WA 98101 | | Trustee since 2004 | | Appointed until successor is duly elected and qualified | | • President and Chief Executive Officer, United Way of King County, WA | | | 46 | | | None |
| * | Each Trustee is subject to mandatory retirement at age 72. |
| | | | |
| | 130 | | | Disclosure of Information about Fund Trustees and Officers |
Russell Investment Funds
Disclosure of Information about Fund Trustees and Officers — December 31, 2011 (Unaudited)
| | | | | | | | | | | | |
Name,
Age,
Address | | Position(s) Held
with Fund and
Length of
Time Served | | Term
of
Office* | | Principal Occupation(s)
During the
Past 5 Years | | No. of
Portfolios
in Russell
Fund
Complex
Overseen
by Trustee | | | Other
Directorships Held
by Trustee
During the
Past 5 Years |
INDEPENDENT TRUSTEES (continued) |
Raymond P. Tennison, Jr., Born December 21, 1955 1301 Second Avenue, 18th Floor Seattle, WA 98101 | | Trustee since 2000 Chairman of the Nominating and Governance Committee since 2007 | | Appointed until successor is duly elected and qualified. Appointed until successor is duly elected and qualified | | • Vice Chairman of the Board, Simpson Investment Company • Until November 2010, President, Simpson Investment Company and several additional subsidiary companies, including Simpson Timber Company, Simpson Paper Company and Simpson Tacoma Kraft Company | | | 46 | | | None |
| | | | | | | | | | | | | |
Jack R. Thompson,
Born March 21, 1949 1301 Second Avenue, 18th Floor Seattle, WA 98101 | | Trustee since 2005 | | Appointed until successor is duly elected and qualified | | • September 2003 to September 2009, Independent Board Chair and Chairman of the Audit Committee, Sparx Asia Funds • September 2007 to September 2010 Director, Board Chairman and Chairman of the Audit Committee, LifeVantage Corporation (health products company) | | | 46 | | | • Director, Board Chairman and Chairman of the Audit Committee, LifeVantage Corporation until September 2010 (health products company) • Director, Sparx Asia Funds until 2009 (investment company) |
| | | | | | | | | | | | | |
Julie W. Weston,
Born October 2, 1943 1301 Second Avenue, 18th Floor Seattle, WA 98101 | | Trustee since 2002 | | Appointed until successor is duly elected and qualified | | • Retired • Chairperson of the Investment Committee until December 2009 | | | 46 | | | None |
| * | Each Trustee is subject to mandatory retirement at age 72. |
| | |
| Disclosure of Information about Fund Trustees and Officers | | 131 |
Russell Investment Funds
Disclosure of Information about Fund Trustees and Officers — December 31, 2011
(Unaudited)
| | | | | | | | | | | | |
Name,
Age,
Address | | Position(s) Held
with Fund and
Length of
Time Served | | Term
of
Office | | Principal Occupation(s)
During the
Past 5 Years | | No. of
Portfolios
in Russell
Fund
Complex
Overseen
by Trustee | | | Other
Directorships Held
by Trustee
During the
Past 5 Years |
TRUSTEES EMERITUS | | |
**George F. Russell, Jr., Born July 3, 1932 1301 Second Avenue, 18th Floor Seattle, WA 98101 | | Trustee Emeritus and Chairman Emeritus since 1999 | | Until resignation or removal | | • Director Emeritus, Frank Russell Company (investment consultant to institutional investors (“FRC”)); and RIMCo • Chairman Emeritus, RIC and RIF; Russell Implementation Services Inc. (broker-dealer and investment adviser (“RIS”)); Russell 20-20 Association (non-profit corporation); and Russell Trust Company (non-depository trust company (“RTC”)) • Chairman, Sunshine Management Services, LLC (investment adviser) | | | 46 | | | None |
| | | | | | | | | | | | | |
Paul E. Anderson,
Born October 15, 1931 1301 Second Avenue, 18th Floor Seattle, WA 98101 | | Trustee Emeritus since 2007 | | Five year term | | • President, Anderson Management Group LLC (private investments consulting) • February 2002 to June 2005, Lead Trustee, RIC and RIF • Trustee of RIC and RIF until 2006 • Chairman of the Nominating and Governance Committee 2006 | | | 46 | | | None |
| ** | Mr. Russell is also a director emeritus of one or more affiliates of RIC and RIF. |
| | | | |
| | 132 | | | Disclosure of Information about Fund Trustees and Officers |
Russell Investment Funds
Disclosure of Information about Fund Trustees and Officers — December 31, 2011
(Unaudited)
| | | | | | |
Name,
Age,
Address | | Position(s) Held
with Fund and
Length of
Time Served | | Term
of
Office | | Principal Occupation(s)
During the
Past 5 Years |
OFFICERS | | |
Cheryl Wichers, Born December 16, 1966 1301 Second Avenue, 18th Floor Seattle, WA 98101 | | Chief Compliance Officer since 2005 | | Until removed by Independent Trustees | | • Chief Compliance Officer, RIC • Chief Compliance Officer, RIF • Chief Compliance Officer, RIMCo • Chief Compliance Officer, RFSC • Chief Compliance Officer, Russell Exchange Traded Funds Trust • April 2002-May 2005, Manager, Global Regulatory Policy |
| | | | | | | |
Sandra Cavanaugh,
Born May 10, 1954 1301 Second Avenue, 18th Floor Seattle, WA 98101 | | President and Chief Executive Officer since 2010 | | Until successor is chosen and qualified by Trustees | | • President and CEO, RIC and RIF • Chairman of the Board, President and CEO, Russell Financial Services, Inc. • Chairman of the Board, President and CEO, RFSC • Chairman of the Board and President, Russell Insurance Agency, Inc. (insurance agency (“RIA”)) • May 2009 to December 2009, Executive Vice President, Retail Channel, SunTrust Bank • 2007 to January 2009, Senior Vice President, National Sales — Retail Distribution, JPMorgan Chase/Washington Mutual, Inc. • 1997 to 2007, President — WM Funds Distributor & Shareholder Services/WM Financial Services |
| | | | | | | |
Mark E. Swanson, Born November 26, 1963 1301 Second Avenue, 18th Floor Seattle, WA 98101 | | Treasurer and Chief Accounting Officer since 1998 | | Until successor is chosen and qualified by Trustees | | • Treasurer, Chief Accounting Officer and CFO, RIC, RIF and Russell Exchange Traded Funds Trust • Director, Funds Administration, RIMCo, RFSC, RTC and Russell Financial Services, Inc. • Treasurer and Principal Accounting Officer, SSgA Funds |
| | | | | | | |
Peter Gunning, Born February 22, 1967 1301 Second Avenue, 18th Floor Seattle, WA 98101 | | Chief Investment Officer since 2008 | | Until removed by Trustees | | • Chief Investment Officer, RIC and RIF • Director, FRC • Chairman of the Board, President and CEO, RIMCo • 1996 to 2008 Chief Investment Officer, Russell, Asia Pacific |
| | | | | | | |
Mary Beth Rhoden,
Born April 25, 1969 1301 Second Avenue, 18th Floor Seattle, WA 98101 | | Secretary since 2010 | | Until successor is chosen and qualified by Trustees | | • 1999 to 2010 Assistant Secretary, RIC and RIF • Associate General Counsel, FRC • Secretary, RIMCo, RFSC and Russell Financial Services, Inc. • Secretary and Chief Legal Officer, RIC, RIF and Russell Exchange Traded Funds Trust |
| | |
| Disclosure of Information about Fund Trustees and Officers | | 133 |
Russell Investment Funds
1301 Second Avenue, Seattle, Washington 98101
(800) 787-7354
Interested Trustee
Sandra Cavanaugh
Independent Trustees
Thaddas L. Alston
Kristianne Blake
Daniel P. Connealy
Jonathan Fine
Raymond P. Tennison, Jr.
Jack R. Thompson
Julie W. Weston
Trustees Emeritus
George F. Russell, Jr.
Paul E. Anderson
Officers
Sandra Cavanaugh, President and Chief Executive Officer
Cheryl Wichers, Chief Compliance Officer
Peter Gunning, Chief Investment Officer
Mark E. Swanson, Treasurer and Chief Accounting Officer
Mary Beth Rhoden, Secretary
Adviser
Russell Investment Management Company
1301 Second Avenue
Seattle, WA 98101
Administrator and Transfer and Dividend Disbursing Agent
Russell Fund Services Company
1301 Second Avenue
Seattle, WA 98101
Custodian
State Street Bank and Trust Company
Josiah Quincy Building
200 Newport Avenue
North Quincy, MA 02171
Office of Shareholder Inquiries
1301 Second Avenue
Seattle, WA 98101
(800) 787-7354
Legal Counsel
Dechert LLP
200 Clarendon Street, 27th Floor
Boston, MA 02116-5021
Distributor
Russell Financial Services, Inc.
1301 Second Avenue
Seattle, WA 98101
Independent Registered Public Accounting Firm
PricewaterhouseCoopers LLP
1420 5th Avenue
Suite 1900 Seattle, WA 98101
Money Managers as of December 31, 2011
Multi-Style Equity Fund
BlackRock Capital Management, Inc., Wilmington, DE
Columbus Circle Investors, Stamford, CT
DePrince, Race & Zollo, Inc., Winter Park, FL
Institutional Capital LLC, Chicago, IL
Jacobs Levy Equity Management Inc., Florham Park, NJ
Suffolk Capital Management LLC, New York, NY
Sustainable Growth Advisers, LP, Stamford, CT
Aggressive Equity Fund
ClariVest Asset Management LLC, San Diego, CA
DePrince, Race & Zollo, Inc., Winter Park, FL
Jacobs Levy Equity Management Inc., Florham Park, NJ
Ranger Investment Management, L.P., Dallas, TX
Signia Capital Management, LLC, Spokane, WA
Tygh Capital Management, Inc., Portland, OR
Non-U.S. Fund
Barrow, Hanley, Mewhinney & Strauss, LLC, Dallas, TX
Marsico Capital Management, LLC, Denver, CO
MFS Institutional Advisors Inc., Boston, MA
Pzena Investment Management LLC, New York, NY
Core Bond Fund
Goldman Sachs Asset Management, L.P., New York, NY
Metropolitan West Asset Management LLC, Los Angeles, CA
Pacific Investment Management Company LLC, Newport Beach, CA
Global Real Estate Securities Fund
AEW Capital Management, LP, Boston, MA
Cohen & Steers Capital Management, Inc., New York, NY
INVESCO Advisers, Inc. which acts as a money manager to the Fund through its INVESCO Real Estate Division, Dallas, TX
This report is prepared from the books and records of the Funds and is submitted for the general information of shareholders and is not authorized for distribution to prospective investors unless accompanied or preceded by an effective Prospectus. Nothing herein contained is to be considered an offer of sale or a solicitation of an offer to buy shares of Russell Investment Funds. Such offering is made only by Prospectus, which includes details as to offering price and other material information.
| | | | |
| | 134 | | | Manager, Money Managers and Service Providers |
| | | | |
Russell Investment Funds | | 1301 Second Avenue | | 800-787-7354 |
| | Seattle, Washington 98101 | | Fax: 206-505-3495 |
| | | | www.russell.com |


36-08-023

2011 ANNUAL REPORT
Russell
Investment Funds
LifePoints® Funds Variable Target Portfolio Series
DECEMBER 31, 2011
FUND
Conservative Strategy Fund
Moderate Strategy Fund
Balanced Strategy Fund
Growth Strategy Fund
Equity Growth Strategy Fund

Russell Investment Funds
Russell Investment Funds is a series investment company with ten different investment portfolios referred to as Funds. These financial statements report on five of these Funds.
Russell Investment Funds
LifePoints® Funds
Variable Target Portfolio Series
Annual Report
December 31, 2011
Table of Contents
Russell Investment Funds - LifePoints® Funds Variable Target Portfolio Series.
Copyright © Russell Investments 2012. All rights reserved.
Russell Investments is a Washington, USA corporation, which operates through subsidiaries worldwide and is a subsidiary of The Northwestern Mutual Life Insurance Company.
Fund objectives, risks, charges and expenses should be carefully considered before investing. A prospectus containing this and other important information must precede or accompany this material. Please read the prospectus carefully before investing.
Securities distributed through Russell Financial Services, Inc., member FINRA and part of Russell Investments.
Indices and benchmarks are unmanaged and cannot be invested in directly. Returns represent past performance, are not a guarantee of future performance, and are not indicative of any specific investment. Index return information is provided by vendors and although deemed reliable, is not guaranteed by Russell Investments or its affiliates.
Russell Investments is the owner of the trademarks, service marks, and copyrights related to its respective indexes.
Performance quoted represents past performance and does not guarantee future results. The investment return and principal value of an investment will fluctuate so that shares, when redeemed, may be worth more or less than their original cost. Current performance may be lower or higher than the performance data quoted.
To Our Shareholders
I am pleased to present you with Russell Investment Funds’ 2011 Annual Report for the fiscal year ending December 31, 2011. Inside you’ll find portfolio management discussions and fund performance information.
Although 2011 proved to be a challenging year for world markets, all of us at Russell remain focused on our primary mission — improving financial security for people.
For over 75 years, we’ve helped clients invest in all kinds of markets throughout the market cycle. During good times and uncertain times, we are guided by the same disciplined, long-term investment approach. We conduct our own objective research of worldwide capital markets and independent money managers, which allows us to build portfolios with a global perspective.
In 2011, we witnessed non-stop assaults on the world economy: an earthquake, tsunami and nuclear disaster in Japan; ongoing conflicts in the Middle East; a financial crisis in Europe centered in Greece, Italy and Spain; the downgrade of U.S. debt in the summer; and continued market volatility throughout the fall.
As of December 31, 2011, the broad global equity market, represented by the Russell Global Index, was down 7.67% year-to-date. Market volatility made the journey even more unsettling for many investors. To help you cope with such uncertain times, we suggest you work closely with your financial advisor.
Your advisor can help you focus on your investment goals and the plan to help you reach them. We also believe it’s important to talk with your advisor about the mix of investments in your portfolio to make sure you are comfortable with them and your investment time horizon.
Volatile markets — like those we endured in 2011 — are often driven by emotions in the short-term. Longer-term, we believe underlying fundamentals drive the market. This belief, along with a thoughtful plan and globally diversified portfolio, can help you look past the day-to-day market gyrations and help you reach your long-term goals.
From all of us at Russell Investments, thank you for the trust you have placed in our firm.
Best regards,

Sandra Cavanaugh
CEO, Americas Private Client Services
Russell Investment Management Company
Russell Investment Funds
Market Summary as of December 31, 2011 (Unaudited)
U.S. Equity Markets
The fiscal year ended December 31, 2011 was a relatively tumultuous period for the U.S. equity market. Despite macroeconomic uncertainty and high levels of volatility, the Russell 1000® Index rose 1.50%, while the Russell 2000® Index lost 4.18% over the year.
The U.S. equity market started off strongly in 2011. Investor confidence was buoyed by the Federal Reserve’s second round of quantitative easing (“QE2”), which demonstrated the Federal Reserve’s willingness to take action to stimulate the U.S. economy. This, in combination with positive corporate earnings numbers, drove up both equity and real asset markets. The energy sector was the largest beneficiary of this expansion through early 2011, as rising crude oil prices contributed to rising share prices of oil producers and distributors. The strong performance of energy and other cyclically-oriented sectors resulted in factors such as high beta (a stock’s sensitivity to market movement) and high earnings variability being rewarded during the first quarter.
The strength of the U.S. equity market rally was underlined by four months of consecutive positive returns for U.S. large capitalization stocks, as the Russell 1000® Index rose 9.44% between January 1, 2011 and April 30, 2011. U.S. small capitalization stocks were even larger beneficiaries of investors’ elevated appetite for risk, with the Russell 2000® Index appreciating 10.79% over the same period.
Though there was some economic optimism that underlined relatively strong equity returns during the first four months of 2011, the period was also marked by high volatility and macroeconomic concerns. In January, oil prices began to rise due to unrest across the Arab world. Beginning with the ousting of Tunisia’s president on January 14th, 2011, a number of Arab nations ruled by authoritarian regimes experienced popular uprisings in what became known as the “Arab Spring.” The initial upheaval in Tunisia and Egypt quickly led to the overthrow of both governments. However, unrest in Libya and growing concern about unrest in Saudi Arabia caused many investors to fear a potential oil supply disruption. While Saudi Arabia managed to avert a serious crisis, Libya disintegrated into civil war and this turmoil helped drive crude oil prices above $100 per barrel, a psychologically important number for investors.
With the market struggling to digest the potential impact of the “Arab Spring,” on March 11th, 2011, a large earthquake and tsunami ravaged a significant portion of Japan, the world’s third largest economy. The natural disaster devastated key parts of Japan’s industrial heartland, including the country’s automotive industry, and caused a nuclear crisis at the Fukushima nuclear plant. The Fukushima crisis fomented global criticism of nuclear power and provided a further tailwind to rising oil prices.
In the month following Japan’s disaster and bolstered by the ongoing war in Libya, West Texas Intermediate crude oil prices, which are a key input to U.S. gasoline prices, peaked at over $110 dollars a barrel. These were price levels not seen since the oil price rally of 2007. The negative economic impacts of such elevated prices on inflation and the consumer caused many investors and governments to become more concerned about the detrimental effect these prices would have on the fragile global economic recovery. In June 2011, the International Energy Agency released 60 million barrels of oil into the market in an effort to push oil prices down. This contributed to a decrease in oil prices over the following months. After leading markets during early 2011, energy stocks struggled throughout the second and third quarters of 2011 in response to lower oil prices and global economic concerns and were among the worst performing stocks in the Russell 1000® and Russell 2000® Indexes.
While economic concerns remained, the positive impact of lower oil prices on consumer spending and the diminishing risks of inflation provided investors with some hope that the global economic recovery could continue. However, the optimism quickly dissipated in June with the re-emergence of the European debt crisis, as Greece, Italian and Spanish bond yields rose rapidly. With fears that the sovereign debt contagion had spread to Italy and Spain, investors questioned the viability of both the Eurozone and the European Union.
Sovereign debt issues became the key market theme for the next several months. While Europe continued to be mired in uncertainty, the U.S. became the focal point of investor concern in late July and early August, as political contention
Russell Investment Funds
over the budget deficit threatened to result in a U.S. government debt default. While this outcome was eventually avoided, the uncertainty resulted in Standards & Poor’s downgrade of U.S. sovereign debt from its prestigious AAA credit rating. This downgrade, along with weakening U.S. economic data such as disappointing housing data and increasing unemployment, was a catalyst for a U.S. equity market sell-off, which was further exacerbated by the political gridlock in Europe on a solution to the ongoing sovereign debt crisis. Consequentially, the Russell 1000® Index and the Russell 2000® Index both experienced one of the largest quarterly declines in their history, falling 14.68% and 21.87% in the third quarter, respectively.
The market’s focus on macroeconomic news, especially coming out of Europe, drove correlations among stocks higher and was a large determinant of overall market performance. The fear and macro-driven market environment during the second and third quarters of 2011 saw higher risk stocks penalized. Consequently, stocks perceived to be sensitive to economic growth, including those with higher betas and more cyclical earnings patterns, struggled. Investors sought stocks in categories that are traditionally viewed as “safe” investments, such as consumer staples and utilities. As a result, stocks with low volatility and high dividend yields performed best, as investors looked to reduce their sensitivity to a potentially weakening economic environment.
While the sell off pushed the market into bear market territory, October saw the U.S. equity market rebound as fears about another global economic meltdown eased. Many market commentators viewed the magnitude of the rebound as the result of the deeply depressed valuations witnessed in September. The dividend yield on the Russell 1000® Index and the S&P 500® Index both surpassed the yield on 10-Year Treasury notes. Investors began to show more willingness to take the risk of owning high growth stocks and stocks with very low price-to-earnings and price-to-book ratios as a result of the sell off. With economic data showing positive but slow economic growth and European governments making progress on the sovereign debt crisis, market fears declined through October.
The month of October was particularly strong for U.S. equities. The Russell 1000® Index finished up 11.21%, just 61 basis points shy of the overall fourth quarter return and the Russell 1000® Index’s highest one-month return since December of 1991. The Russell 2000® Index rose 11.21%. Following October, the U.S. equity market began to exhibit some of the same trends from earlier in 2011. As a whole, the fourth quarter was different from a factor and characteristics perspective than the rest of 2011, though much of the difference was due to the month of October. November was slightly more turbulent, with the market ending close to even for the month. After the optimism of October, investors became increasingly worried about the implications of the ongoing European debt crisis. These fears were evidenced by the rapid increase in Italian bond yields, which rose above the psychologically important 7% threshold, and by a weak German bond auction during November. The failure to stem the continuing European debt crisis caused equity markets to fall throughout much of November. However, in response to news of a coordinated monetary easing from the European Central Bank and the central banks of the U.S., Canada, Switzerland, Japan, and the U.K., equity markets rallied in the last week of November. December was the least volatile month of the quarter, partially due to low trading volumes. The market was also supported by declining U.S. unemployment figures (9.1% for September, 9.0% for October, 8.6% for November as measured by U.S. Bureau of Labor Statistics), declining year-over-year inflation figures (3.9% for September, 3.6% for October, 3.4% for November as measured by U.S. Bureau of Labor Statistics) and positive U.S. housing market news, including an increase in housing starts. However it was low beta stocks that led the market’s positive move during December.
The overall style environment during the year favored growth managers. The Russell 1000® Growth Index returned 2.64% and the Russell 1000® Value Index returned 0.39%. As the market struggled during the second and third quarters of 2011, growth managers were better able to limit losses. Quality elements of many growth companies, including high profitability and low amounts of debt, were beneficial to growth stock performance. However, many growth managers struggled to match their benchmarks as their higher beta positioning was out of favor during the market’s most risk averse portions of the year. Some more cyclical exposures that are commonly held among value managers, including high earnings variability, leverage and low valuations, all provided headwinds to performance during the fiscal year. Market leadership was narrow overall, with the Russell 1000® Index utilities sector outperforming the Russell 1000® Index by approximately 1100 basis points during the year. Although the Top 50 capitalization tier of the Russell 1000® Index generated a positive return for the year, the remaining 950 stocks, in aggregate, produced negative returns.
Non-U.S. Developed Equity Markets
For the fiscal year ended December 31, 2011, the non-U.S. equity market as measured by the Russell Developed ex-U.S. Large Cap® Index (the “Index”) was down 12.35%. The period was marked by volatile swings in stock prices and a series of unfavorable global developments. With the depressed U.S. housing market continuing to negatively affect the
Russell Investment Funds
global economy and an increasingly difficult credit crisis gripping Europe, Japan’s earthquake and tsunami dealt a serious blow to Japan’s already struggling economy and added to the difficult global market environment. Japan’s earthquake severely damaged its Fukushima nuclear power facility, and the economic ripple effects of the nuclear disaster were evident in major changes to national energy policies and global supply chains, most notably in the global auto and technology industries. With the added threats of mounting inflationary pressures in emerging markets due to rising commodity prices, including food and energy, and civil unrest in the Middle East, investors grew increasingly risk averse as 2011 progressed.
Amidst the uncertainty in the global economy, corporate earnings proved resilient through the period as expectations for sharp deterioration in earnings were not realized. The European Union’s decision to write down Greece’s debt and recapitalize many European banks was welcomed by investors. While markets rallied in October on the European Union’s assurances that it would reach a successful resolution of the sovereign debt crisis, the lack of tangible details eroded much of the confidence provided by this plan.
After weakening sharply in the first half of 2011, the U.S. dollar rapidly recovered versus other major currencies as investor outlook dimmed with worsening global economic conditions. The net impact over the full year was a slight degradation of international equity market performance for U.S. dollar investors. The Index fell 11.9% in local currencies. The U.S. Federal Reserve’s first and second rounds of quantitative easing (a form of monetary policy used to increase the money supply through the Federal Reserve’s purchase of government securities or other securities from the market), combined with indications that there could be more rounds of such activity to come, kept the dollar down for much of the period, even as the global market’s flight to quality continued to support U.S. debt issuance at historically low yields.
In a world increasingly concerned with flagging economic growth, investors gravitated to areas of the market most likely able to sustain growth in a weak global economy. This favored stable growth sectors such as consumer staples and health care and growth oriented investment strategies in general. The Russell Developed ex-U.S. Large Cap Growth® Index ended the 12-month period down 9.60%. In contrast, the Russell Developed ex-U.S. Large Cap Value® Index was down more than 14.5%, with its heavy exposure to financial stocks a major factor in its underperformance.
Regionally, the United Kingdom (U.K.) offered some downside protection to market declines. The U.K. is home to many of the world’s largest consumer staples, health care and energy companies. Unilever, British American Tobacco, GlaxoSmithKline, British Petroleum and Shell are the types of stable earning companies investors favored during the period. Stocks in the Russell Europe ex-U.K. Index fell a less dramatic 4.8%.
Japan’s geographic and economic distance from Europe should have proved an advantage as Japanese share prices started the period at already depressed levels. However, the March earthquake and ensuing nuclear disaster eroded Japan’s position as a relative safe haven. Japanese shares ended the period down 12.6% in U.S. dollars as measured by the Russell Asia ex-Japan Index. A strengthening yen continued to challenge Japanese export companies, but benefited foreign investors. The Japanese market was down over 17% in Yen terms as measured by the Russell Asia ex-Japan Index.
Given its link to global economics, Asia/Pacific ex-Japan as a region performed in line with the broad non-US equity markets, falling slightly more than 12% as measured by the Index. The outlook of potentially weakening future demand had an erosive impact on commodity producing countries, specifically Australia. Within the region, Hong Kong fell sharply, down 18.5%, on fears that China’s anti-inflationary measures would cause an economic slowdown.
Europe ex-U.K. was the worst performing region within the developed markets, declining 15.2% for the period. Europe’s greatest detriment remained the increasing risk of a sovereign debt default in Greece, Ireland, Italy, Portugal, and Spain. A default represents a serious threat to the survival of the European Union, as the economically healthier nations would be forced to bail out their more fiscally stressed members. While the stock markets of the distressed European nations fell collectively, led by the nearly 57% drop in the value of Greek shares, the stock markets of more fiscally sound Germany and France also reflected the strains, and ended the period down 18.1% and 16.7%, respectively, as measured by the Index.
The woes of Asia/Pacific ex-Japan and Europe ex-U.K. were reflected in sector performance. Classically defensive sectors, such as consumer staples, health care and telecommunications, led the non-U.S. equity market, with health care faring best at a 6.1% gain for the period as measured by the Index. While areas most dependent on economic expansion, such as financials, consumer discretionary and technology, experienced short-lived rallies during the year, the faltering global recovery took its toll, with these sectors slumping 14-20% as measured by the Russell Large Cap
Russell Investment Funds
Developed ex-U.S. Financial, Consumer Discretionary and Technology Indexes. An outlier were energy stocks, which only fell 3.7% as measured by the Russell Large Cap Developed ex-U.S. Energy Index, as unrest within a number of energy producing nations kept global oil prices at elevated levels.
Mining/materials stocks were the worst performers in the period, down 22.9% as measured by the Russell Large Cap Developed ex-U.S. Materials Index on the outlook for slower growth in the developed economies and in China, which is a major buyer of iron ore and copper. Beyond this, the stresses facing the global financial sector, including persistent weakness in the U.S. housing/mortgage market, exposure to distressed sovereign debts and the additional threats of high unemployment and anemic capital markets, contributed to the financial sector falling 19.9% as measured by the Russell Large Cap Developed ex-U.S. Financials Index. European bank stocks slid on fears that degradation in the value of holdings in “risk free” sovereign debt securities such as Greece and other highly indebted nations might result in a bank collapse. Technology stocks also lagged, falling 20% during the year as measured by the Russell Large Cap Developed ex-U.S. Technology Index, given slower demand for European tech hardware used in manufacturing and renewed corporate reduction in capital expenditures and use of consulting services.
Emerging Markets
The Russell Emerging Markets Index (the “Index”) was down 19.40% over the fiscal year ended December 31, 2011. The period was characterized by high levels of volatility and macro-economic events that impacted the market, such as Middle East conflict in early 2011 and the European sovereign debt crisis in the second half of the year. Inflationary pressures remained strong during the most of the fiscal year. However, emerging markets central banks raised interest rates to contain inflation and emerging markets’ currencies appreciated in value relative to the U.S. dollar until the summer of 2011, when, driven by market fears, investors redeemed capital out of emerging markets, causing a market decline. After late summer 2011, as concerns regarding inflation decreased, emerging markets eased their anti-inflationary monetary policies, providing some relief to their capital markets. However, inflationary concerns were replaced with concerns regarding slowdown of global demand and the negative effect on economic growth.
In early 2011, investors lost some of their appetite for emerging market stocks, as pro-democracy movements swept through oil-producing regions in North Africa and the Middle East. This pushed up the price of crude oil, prompted worries about global economic growth, and served as a reminder of the political risks that can accompany investments in emerging markets. Investors’ risk appetite was further diminished by an earthquake, tsunami and nuclear disaster in Japan, which disrupted global manufacturing supply chains. The Index held up relatively well in the first quarter of 2011 given the magnitude of these events, returning 1.41% over that period.
During the second quarter of 2011, rising prices, particularly of food and energy, became a concern for policymakers in the developing world. Central banks in emerging markets weighed the need to control inflation against the possibility of encouraging destabilizing capital inflows from developed markets, where interest rates remained at or close to historic lows. Despite these concerns, policymakers across the developing world opted to increase interest rates. While this strengthened the currencies of some countries, equity markets suffered as a result of the increases and the Index declined 0.85% during the quarter.
The third quarter of 2011 was characterized by a deepening sovereign debt crisis in Europe, caused by the excessive debt of Greece and other European countries. By September, the International Monetary Fund (“IMF”) warned that the global economy had entered a “dangerous new phase.” IMF estimates showed that the chance of a serious slowdown in the global economy had doubled since earlier in the year. In a reminder that slowdown in the developed world carried risks for emerging markets, the IMF also warned that the developing world faced the risk of sharp reversals or even a sudden stop in economic growth. The overall effect of this economic uncertainty was a sharp rise in risk aversion during the third quarter of 2011, which caused investors to flee from emerging market equities in favor of safe-haven investments such as U.S., German and United Kingdom government bonds. The Index declined 22.38% during the third quarter.
The fourth quarter started off positively, as a resolution to the European debt crisis seemed possible. The Index recovered 12.59% in October. However, this optimism quickly unraveled as continental European governments reacted negatively to the U.K. Prime Minister’s decision to seek an exemption to pending regulations that might have a deleterious impact to London’s financial center. Purchasing Managers Index data showed contractionary signals, both in developed and emerging markets nations, while earnings revisions continued to fall. The remainder of the quarter was a difficult and volatile period for emerging markets. Stocks across the developing world tumbled on slowing global economic activity and continued uncertainty about European sovereign debt crisis. Emerging markets’ returns were further impacted by currency volatility. As European banks sought to shore up their balance sheets, they sharply
Russell Investment Funds
curtailed loans to emerging markets and the resulting capital flight caused the value of many emerging markets currencies to fall. Emerging markets were mixed at the individual country level, but overall ended the period 3.27% higher as measured by the Index.
As energy companies comprise a large percentage of the Russian market, a double-digit rise in the price of crude oil contributed to Russia’s strong performance through November. In December, however, Russian equities fell due to political protests over the outcome of recent elections and the Russian market finished the year lower, declining 20.72% over the year as measured by the Index. The Czech Republic was the best performing emerging market in the European region during the year, declining 9.19% as measured by the Index, while Hungary and Turkey were among the worst performers. The Hungarian market fell by 34.07% as measured by the Index as its sovereign-debt crisis deepened. The problem was intensified when Hungary’s currency, the forint, fell to a record low against the Swiss franc, which is the currency in which most Hungarian mortgages are denominated. The Turkish stock market fell by 35.40% as measured by the Index as investors grew concerned that Turkey’s central bank was failing to address the country’s widening current-account deficit. Turkey’s foreign trade deficit, the key driver of the country’s increasing current account gap, grew significantly over the period, fueling market concerns that Turkish policy makers have failed to manage the fast-growing economy. Egypt was the worst performing country in the Europe, Middle East and Africa region. The Egyptian market fell 45.31% as measured by the Index as protests against military rulers continued.
In Latin America, Mexico was one of the best performing emerging markets in 2011. The Mexican market experienced a 13.23% loss as measured by the Index. High oil prices (which caused higher transportation costs) made Mexico’s proximity to the United States more valuable, while a fall in the peso made the country’s exports more competitive. Other Latin American markets followed the global trend downward due to the lower price of some mined commodities such as copper, since mined commodities represent a significant portion of the exports of some Latin American economies. The Chilean market, an important copper exporter, was the worst performing country in Latin America, falling 22.69% as measured by the Index. The one-year period also saw a dramatic change in Brazil’s monetary policy. Initially, the Brazilian interest rate was raised in an effort to control inflation. By August, however, Brazilian policymakers were lowering interest rates in order to shield the country’s economy from an expected global slowdown. By the end of October, Brazilian industrial output had contracted for two consecutive quarters, prompting recession worries. The central bank responded quickly and cut interest rates again in November and December, triggering a positive market response. Brazilian equities advanced 8.86% in third quarter and finished the year down 20.09% as measured by the Index.
In Asia, there was significant difference in country-by-country performance. Indonesia was the standout performer, gaining 3.94% as measured by the Index. Indonesia’s strong performance stood in contrast to weakening in two of Asia’s larger markets, as India and China were down 37.56% and 20.91%, respectively, as measured by the Index. The Reserve Bank of India undertook the fastest interest rate increase in its history and seven interest rate hikes in 2011 took India’s interest rate to 8.5% by the end of the period. In China, inflation hit a 37-month-high in July, even as the central bank raised interest rates. Chinese policymakers increased the required reserve ratio for banks on multiple occasions in the first half of the year, prompting renewed fears of a ‘hard landing’ in the Chinese economy. However, in the fourth quarter of 2011, Chinese policymakers took steps to loosen monetary policy and protect growth by reducing the reserve requirement ratio. Small Southeast Asian countries also performed strongly. Philippines and Malaysia gained 2.05% and 0.04%, respectively, as measured by the Index.
Throughout the year, political, economic, and corporate uncertainty caused defensive industries to be in favor across the globe. Specifically, consumer staples and utilities were the best performing sectors in 2011, falling 0.92% and 8.54%, respectively, as measured by the Index. While the materials and processing sector performed poorly on broad moderation in global demand for commodities, it was paradoxically gold mining that did the worst, largely as a result of relative optimism for equities (which increasingly appeared undervalued). Large capitalization stocks did significantly better than small capitalization stocks over the period.
U.S. Global Fixed Income Markets
The fiscal year ended December 31, 2011 started off strong for fixed income markets, with the continuation of the global credit rally. Fixed income sectors that carry credit risk (i.e., credit sectors) generally outperformed similar duration U.S. Treasury securities. However, investors became increasingly pessimistic starting in May, when negative economic data caused investors to revise growth forecasts downward. The less optimistic growth outlook started a flight-to-quality trend, which led to substantially positive performance for U.S. Treasuries, while nearly all other fixed income sectors suffered. This dynamic generally persisted until the fourth quarter, when the market environment for credit sectors was more favorable given positive economic data releases. However, overarching concerns over the European sovereign debt
Russell Investment Funds
crisis continued to linger and contributed to a flight-to-quality in November despite a positive environment for credit sectors in the other months of the quarter. For the fiscal year ended December 31, 2011, the Barclays Capital U.S. Aggregate Bond Index and the BofAML Global High Yield Index (USD hedged) returned 7.84% and 3.18%, respectively. However, reflective of the generally poor environment for credit risk in 2011, these Indexes lost 1.14% and 4.22%, respectively, relative to similar duration U.S. Treasury securities. The difference in yields between longer maturity (e.g., 10-year note) and shorter maturity (e.g., 2-year note) U.S. Treasury securities decreased materially this year, which is known as “yield curve flattening.” The yield difference decreased the most in August when yields of longer maturity Treasury securities declined significantly during the flight-to-quality. Yields of shorter maturity Treasuries had a smaller magnitude of decline as yields on short maturity Treasuries were already at very low levels due to the U.S. Federal Reserve’s (the “Fed”) quantitative easing efforts to keep short-term interest rates low in order to stimulate economic growth. Thus, longer maturity Treasuries outperformed shorter maturity Treasuries in 2011.
Credit sectors performed well relative to similar duration U.S. Treasury securities during the first four months of the year, as the economy showed signs that it was stabilizing, which lead to economic growth forecasts that generally supported the performance of riskier assets. With Treasury prices falling and a continued market demand for riskier credit sector securities, credit sectors generally outperformed similar duration Treasuries through May 2011. During this same period, investors also faced a series geopolitical events occurring abroad that dampened investor optimism. In January, the markets focused on Egypt as an uprising of civil resistance resulted in protests, labor strikes and demonstrations in an effort to overthrow the Egyptian president. In February, while the Egyptian protests continued, the markets simultaneously focused their attention on the violent civil war in Libya. With Libya being a large producer of the world’s oil supply, investors had concerns over the Libyan civil war’s impact on oil prices, which rose 10% from the end of February through April as measured by the price change in West Texas Intermediate Crude Oil futures contracts.
The non-agency mortgage sector performance was generally strong during the first four months of the year. In April, the Fed began selling sub-prime securities that were acquired from American International Group (“AIG”) in 2008 and held in a trust called Maiden Lane II. The initial sales were received well by investors, who welcomed the additional supply in the marketplace as the non-agency mortgage market had been shrinking with little to no new issuance since the start of the financial crisis. However, the Fed announced an indefinite halt to the Maiden Lane II sales in June after watching the market prices for sub-prime mortgages drop materially since the initial sales due to a drawn out sales process. The sale of the Maiden Lane II assets involved frequent periodic sales that gave little time for investors to analyze and value the securities being sold, which dampened investors demand. The overall impact of the Fed’s sales was mixed as it demonstrated that there was pent-up demand for non-agency mortgages but also revealed the limits of the incremental demand and ultimately left non-agency mortgage prices lower. Generally, performance of non-agency mortgages was negative for the year.
The last eight months of the year were much more unfavorable than the first four. While credit sectors were able to push through many headwinds in the first part of the year, they began to underperform similar duration Treasury securities in May as investors started to lose optimism given the growing concerns over the European debt crisis, slowing U.S. economic growth, stagnant job market and negative housing market news. A renewed focus on these concerns sparked a flight-to-quality whereby investors sought the safety and liquidity of Treasuries over riskier credit sectors. Consequently, despite the formal end of the Fed’s quantitative easing in June, Treasury securities remained in demand and Treasury yields across all parts of the yield curve continued to decline.
Given the flight-to-quality and concerns over the negative impact of the European debt crisis on financial companies, financial-related corporate bonds performed poorly compared to non-financial corporate bonds. Generally, investors perceived non-financial corporate bond sub-sectors, such as industrials and utilities, to be less tied to the European debt crisis. Broadly, corporate bonds continued to exhibit low default rates and strong fundamentals, as many corporate bond issuers were able to refinance their debt after the peak of the financial crisis in 2008, putting them in a better financial position to repay their corporate debt going forward. As a relative comparison, global high yield corporate bonds generally underperformed emerging market debt in 2011 as emerging market debt securities tend to be longer in maturity and more interest rate sensitive than global high yield bonds. However, from a credit perspective, emerging market debt underperformed similar duration U.S. Treasury securities more than global high yield corporate bonds did.
In July, concerns regarding a possible default and/or downgrade of U.S. government debt increased due to political gridlock and the possibility that the U.S. debt ceiling would not be raised in time to prevent a default. Ultimately, the debt ceiling was raised. However, Standard and Poor’s downgraded the U.S. debt rating to AA+ from the highest rating of AAA. Generally, a rating agency downgrade signals increased credit risk, which typically leads to higher yields to compensate investors for the additional risk. However, with serious concerns about the European debt crisis, U.S.
Russell Investment Funds
Treasury securities reinforced their status as the world’s safe haven asset and saw their yields decline following the ratings downgrade. The dramatic flight-to-quality in early August caused Treasury yields to drop to historically low levels while credit sector yields lagged considerably or even rose in some instances.
With investors on edge and fearing the possibility of a recession, the Fed explicitly stated its intent to keep short-term interest rates low until at least mid-2013. Additionally, in September, the Fed formally announced a stimulus program to sell $400 billion in Treasury securities with maturities less than 3 years while purchasing the same amount in Treasury securities with maturities longer than 6 years. This was designed to lower longer term interest rates without the Fed having to take on additional debt. While the structure of the program was largely anticipated, investors underestimated its size. Thus, after the announcement, long term Treasury bonds saw a downward correction in yield to reflect the amount of the Fed’s buying. In addition, investors were surprised by the Fed’s simultaneous announcement of its intent to reinvest principal payments from its agency debt and agency mortgage-backed securities holdings back into agency mortgages-backed securities. This reinvestment plan was designed to keep mortgage rates low by creating demand for mortgage securities, thereby encouraging lenders to issue more mortgages to borrowers. This led to more divergent performance within agency mortgages depending on coupon and maturity date. The year ended on a higher note with a generally positive environment for credit sectors in the fourth quarter due to better than expected economic data and positive developments around the European debt crisis. For example, non-farm payrolls bested consensus estimates at the end of September. In addition, labor markets showed signs of improvement as the unemployment rate decreased from September to December. As seen by November’s flight-to-quality, in which the BofAML Global High Yield Index (USD hedged) lost 3.11% relative to similar duration Treasuries, investors still remained cautious throughout the quarter given the lack of a long term solution for the European debt crisis. However, some positive developments around the European debt crisis occurred near the end of November, including the expansion of the purview of the European Financial Stability Facility. In addition, a group of central banks (European Union, United States, Canada, Japan, England, and Switzerland) agreed to provide cheaper access to the U.S. dollar currency to commercial banks in each central bank’s respective jurisdiction. This coordinated effort by the central banks to improve financial market liquidity was a positive development for credit sectors.
(This page intentionally left blank)
Russell Investment Funds
Conservative Strategy Fund
Portfolio Management Discussion and Analysis — December 31, 2011 (Unaudited)
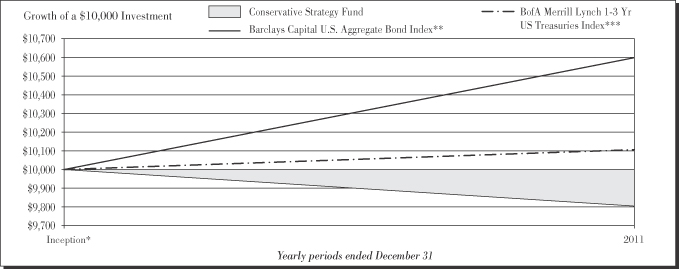
| | | | | | |
|
| Conservative Strategy Fund | |
| | | | | Total
Return | |
Inception* | | | | | (1.96 | )% |
|
| Barclays Capital U.S. Aggregate Bond Index ** | |
| | | | | Total
Return | |
Inception* | | | | | 5.99 | % |
|
| BofA Merrill Lynch 1-3 Yr US Treasuries Index *** | |
| | | | | Total
Return | |
Inception* | | | | | 1.06 | % |
| | | | |
| | 12 | | | Conservative Strategy Fund |
Russell Investment Funds
Conservative Strategy Fund
Portfolio Management Discussion and Analysis — December 31, 2011 (Unaudited)
The Fund is a fund of funds that invests in other Russell Investment Funds and Russell Investment Company mutual funds (the “Underlying Funds”). The Underlying Funds allocate most of their assets among multiple money managers. Russell Investment Management Company (“RIMCo”), as the Underlying Funds’ advisor, may change the allocation of the Underlying Funds’ assets among money managers at any time. An exemptive order from the Securities and Exchange Commission (“SEC”) permits RIMCo to engage or terminate a money manager in an Underlying Fund at any time, subject to approval by the Underlying Fund’s Board without a shareholder vote.
What is the Fund’s investment objective?
The Conservative Strategy Fund (the “Fund”) seeks to provide high current income and low long-term capital appreciation.
How did the Fund perform relative to its benchmark for the fiscal year ended December 31, 2011?
For the period May 2, 2011 (inception of the Fund) through December 31, 2011, the Fund lost 1.96%. This is compared to the Fund’s benchmark, the Barclays Capital U.S. Aggregate Bond Index, which gained 5.99% during the same period.
For the period May 2, 2011 (inception of the Fund) through December 31, 2011, the Lipper® Mixed Asset Target Allocation Conservative Funds Average, a group of funds that Lipper considers to have investment strategies similar to those of the Fund, lost 2.46%. This result serves as a peer comparison and is expressed net of operating expenses.
The Fund’s performance includes operating expenses, whereas the Index returns are unmanaged and do not include expenses of any kind. The Fund’s underperformance relative to the Barclays Capital U.S. Aggregate Bond Index was due to the Fund’s exposure to both active fixed income management, which underperformed the Fund’s Index due to riskier out-of-benchmark positions, and to equity investments, particularly global investment mandates, which in the aggregate underperformed core fixed income.
How did the market conditions described in the Market Summary report affect the Fund’s performance?
The Fund is a fund of funds and its performance is based on RIMCo’s strategic asset allocations and the performance of the Underlying Funds in which the Fund invests.
As the fiscal year began with hopes for a continued economic recovery from the 2008 financial crisis, the Underlying Fund’s money managers took pro-recovery bets early in the fiscal year. This was evident in both equity managers that picked high-risk stocks relative to the benchmark in sectors such as financials and consumer discretionary as well as fixed income managers that chose riskier out of benchmark positions. However, as the year progressed, the market grew concerned with economic and political events within the United States, Europe and emerging markets. Money managers turned their focus on prudently reducing risk while also attempting to maintain exposure to
factors that drive excess returns. This strategy allowed for strong returns beginning in October, as markets rallied through the end of the year.
All of the Underlying Funds (which are designed to represent individual asset classes) underperformed the Fund’s Index for the fiscal year. In the fixed income Underlying Funds, the RIF Core Bond, Russell Short Duration Bond and Russell Investment Grade Bond Funds underperformed the Fund’s Index due to their preference for out-of-benchmark allocations to non-Treasury fixed income securities, such as investment grade financials, high yield corporate bonds and non-agency mortgage-backed securities. These positions suffered due to the European sovereign debt crisis, as well as the Federal Reserve selling its Maiden Lane II non-agency mortgage portfolio in April 2011, which decreased prices for these securities. Despite positive developments for credit sectors in the fourth quarter, fourth quarter performance was not strong enough to offset previous losses. The Russell Global Opportunistic Credit Fund underperformed the Fund’s benchmark due to exposure to emerging market debt, which suffered due to macro-economic risk aversion. The Russell Global Equity and RIF Non-U.S. Funds underperformed the Fund’s benchmark due to macro-economic risk aversion that resulted in a flight from international countries with riskier markets to traditionally safe equities. In the U.S. equity Underlying Funds, the Russell U.S. Core Equity and RIF Multi-Style Equity Funds underperformed the Fund’s Index due to the second and third quarter sell off, which pushed the market into bear market territory. The market’s focus on macroeconomic news, especially coming out of Europe, drove correlations among stocks higher. Combined with the U.S. sovereign debt downgrade, increasing unemployment, and disappointing housing data in these two quarters, the U.S. equity market experienced strong quarterly declines. The fourth quarter saw a strong rebound as global recession fears subsided, and due to pro-recovery positions, the funds were able to make up some of the prior losses. Macro-economic fears caused a large real-estate pull back with limited consideration of net asset value differences across companies, sectors, countries and regions. This led to the Russell Global Real Estate Securities Fund underperforming the Fund’s benchmark. Similar macro-economic fears led to lower aggregate demand for real assets, which detracted from the performance of the Russell Global Infrastructure Fund and the Russell Commodity Strategies Fund. The Russell Global Infrastructure Fund lagged the Fund’s Index due to positions in Europe and emerging markets experiencing lower demand.
How did the investment strategies and techniques employed by the Fund and its money managers of the Underlying Funds affect the Fund’s performance?
The Fund’s allocation to the fixed income Underlying Funds during the fiscal year was 38% invested in the RIF Core Bond Fund, 20% invested in the Russell Investment Grade Bond Fund, 18% invested in the Russell Short Duration Bond Fund, and 2% invested in the Russell Global Opportunistic Credit Fund. In aggregate, the fixed income asset class
| | |
| Conservative Strategy Fund | | 13 |
Russell Investment Funds
Conservative Strategy Fund
Portfolio Management Discussion and Analysis — December 31, 2011 (Unaudited)
underperformed the Barclays Capital U.S. Aggregate Bond Index. This was primarily due to these Underlying Funds holding riskier out-of -benchmark debt, which underperformed due to the macroeconomic pullback and European sovereign debt crisis. The RIF Core Bond and Russell Investment Grade Bond Funds suffered due to overweight positions to investment grade financials, high yield corporate bonds and non-agency mortgages. The Russell Short Duration Bond Fund underperformed due to exposure to non-agency residential mortgage-backed securities, currency strategies, and an overweight to investment grade financials. The Russell Global Opportunistic Credit Fund underperformed due to emerging market debt exposure, as these markets suffered from investors’ risk off sentiment.
The international equity Underlying Funds experienced high levels of volatility and all three funds underperformed the Barclays Capital U.S. Aggregate Bond Index. The Fund’s allocation to the RIF Non-U.S. Fund was 5% and the Russell Global Equity Fund was 5%. These funds’ investment strategies do not emphasize downside protection, risk aversion or defensiveness and their performance was negatively affected by macro-economic events, the weak performance of emerging markets and the resulting flight to safety. The RIF Non-U.S. Fund was not sufficiently defensive for a market environment marked by fear and skepticism, and its emphasis on companies with higher rates of earnings growth proved disadvantageous as general skepticism towards growth prospects weighed on share prices. The Russell Global Equity Fund suffered due to stock selection within the energy, consumer discretionary and financials sectors.
The U.S. equity Underlying Funds were positioned aggressively. Though the U.S. equity market in the first and fourth quarters of the year exhibited traits representative of economic recovery, the general volatility over the fiscal year and generally fearful market environment caused strong underperformance in aggressive equity strategies. The Fund’s allocation to the RIF Multi-Style Equity Fund was 3% and the Russell U.S. Quantitative Equity Fund was 3%. Both funds underperformed the Fund’s Index. The RIF Multi-Style Equity Fund benefited from its pro-recovery positioning in early 2011, though despite the fund’s more defensive tactical positioning during the worst period of 2011, a remaining exposure to stocks with higher
betas and stocks with more cyclical earnings patterns detracted from its performance in the second and third quarter as global recession fears grew. A partial recovery in the fourth quarter benefited the fund, but this was not enough to offset prior losses. The Russell U.S. Quantitative Equity Fund had a neutral exposure to risk and overweight exposure to quality, as the rotation by investors away from risk was accompanied by a rotation towards quality based factors (e.g., return on equity, return on assets and earnings stability). However, while this rotation allowed the fund to make up losses incurred in the second and third quarters, it underperformed the Fund’s benchmark for the fiscal year.
The Fund’s allocation to real asset Underlying Funds during the fiscal year was 2% invested in the Russell Commodity Strategies Fund, 2% invested in the Russell Global Real Estate Securities Fund and 2% invested in the Russell Global Infrastructure Fund. All three funds underperformed the Fund’s benchmark, with the Russell Global Real Estate Securities Fund posting absolute negative returns and the other two posting absolute positive returns. Stock selection within the U.S., Hong Kong and Japan significantly detracted from the Russell Global Real Estate Securities Fund’s performance, as well as exposures to more cyclically-exposed sectors.
Describe any changes to the Fund’s structure or allocation to the Underlying Funds.
The Fund had no structure or allocation changes to the Underlying Funds during the fiscal year.
The views expressed in this report reflect those of the portfolio managers only through the end of the fiscal year covered by the report. These views do not necessarily represent the views of RIMCo, or any other person in RIMCo or any other affiliated organization. These views are subject to change at any time based upon market conditions or other events, and RIMCo disclaims any responsibility to update the views contained herein. These views should not be relied on as investment advice and, because investment decisions for a Russell Investment Fund (“RIF”) or Russell Investment Company (“RIC”) Fund are based on numerous factors, should not be relied on as an indication of investment decisions of any RIF or RIC Fund.
| * | | The Fund first issued shares on May 2, 2011. |
| ** | | The Barclays Capital U.S. Aggregate Bond Index is an index, with income reinvested, generally representative of intermediate-term government bonds, investment-grade corporate debt securities and mortgage-backed securities. |
| *** | | BofA Merrill Lynch 1-3 Yr US Treasuries Index is an index composed of approximately 160 issues in the form of publicly placed, coupon-bearing US Treasury debt. Issues must carry a term to maturity of at least one year and par amounts outstanding must be no less than $10 million at the start and at the close of the performance measurement periods. |
The performance shown in this section does not reflect any Insurance Company Separate Account or Policy Charges. Performance is historical and assumes reinvestment of all dividends and capital gains. Investment return and principal value will fluctuate so that an investor’s shares, when redeemed, may be worth more or less than when purchased. Past performance is not indicative of future results.
| | | | |
| | 14 | | | Conservative Strategy Fund |
Russell Investment Funds
Conservative Strategy Fund
Shareholder Expense Example — December 31, 2011 (Unaudited)
Fund Expenses
The following disclosure provides important information regarding each Fund’s Expense Example, which appears on each Fund’s individual page in this Annual Report. Please refer to this information when reviewing the Expense Example for a Fund.
Example
As a shareholder of the Fund, you incur two types of costs: (1) transaction costs, and (2) ongoing costs, including advisory fees and other Fund expenses. The Example is intended to help you understand your ongoing costs (in dollars) of investing in the Fund and to compare these costs with the ongoing costs of investing in other mutual funds. The Example is based on an investment of $1,000 invested at the beginning of the period and held for the entire period indicated, which for this Fund is from July 1, 2011 to December 31, 2011.
Actual Expenses
The information in the table under the heading “Actual Performance” provides information about actual account values and actual expenses. You may use the information in this column, together with the amount you invested, to estimate the expenses that you paid over the period. Simply divide your account value by $1,000 (for example, an $8,600 account value divided by $1,000 = 8.6), then multiply the result by the number in the first column in the row entitled “Expenses Paid During Period” to estimate the expenses you paid on your account during this period.
Hypothetical Example for Comparison Purposes
The information in the table under the heading “Hypothetical Performance (5% return before expenses)” provides information about hypothetical account values and hypothetical expenses based on the Fund’s actual expense ratio and an assumed rate of return of 5% per year before expenses, which is not the Fund’s actual return. The hypothetical account values and expenses may not be used to estimate the actual ending account balance or expenses you paid for the period. You may use this information to compare the ongoing costs of investing in the Fund and other funds. To do so, compare this 5% hypothetical example with the 5% hypothetical examples that appear in the shareholder reports of other funds.
Please note that the expenses shown in the table are meant to highlight your ongoing costs only and do not reflect any transactional costs. Therefore, the information under the heading “Hypothetical Performance (5% return before expenses)” is useful in comparing ongoing costs only, and will not help you determine the relative total costs of owning different funds. In addition, if these transactional costs were included, your costs would have been higher. The fee and expenses shown in this section do not reflect any Insurance Company Separate Account or Policy Charges.
| | | | | | | | |
| | | Actual
Performance | | | Hypothetical
Performance
(5% return
before expenses) | |
| | | | | | | | |
Beginning Account Value
| | | | | | | | |
July 1, 2011 | | $ | 1,000.00 | | | $ | 1,000.00 | |
Ending Account Value
| | | | | | | | |
December 31, 2011 | | $ | 986.40 | | | $ | 1,024.70 | |
Expenses Paid During Period* | | $ | 0.50 | | | $ | 0.51 | |
| * | Expenses are equal to the Fund’s annualized expense ratio of 0.10% (representing the six month period annualized), multiplied by the average account value over the period, multiplied by 184/365 (to reflect the one-half year period). May reflect amounts waived, reimbursed and/or other credits. Without any waivers, reimbursements and/or other credits, expenses would have been higher. |
| | |
| Conservative Strategy Fund | | 15 |
Russell Investment Funds
Conservative Strategy Fund
Schedule of Investments — December 31, 2011
Amounts in thousands (except share amounts)
| | | | | | | | |
| | | Shares | | | Market
Value
$ | |
| | | | | | | | |
| Investments - 102.4% | | | | | | | | |
Russell Investment Company (“RIC”) and other Russell Investment Funds (“RIF”) Series Mutual Funds | | | | | | | | |
| | |
| Domestic Equities - 6.1% | | | | | | | | |
RIC Russell U.S. Quantitative Equity Fund Class Y | | | 1,010 | | | | 30 | |
RIF Multi-Style Equity Fund | | | 2,244 | | | | 30 | |
| | | | | | | | |
| | | | | | | 60 | |
| | | | | | | | |
| | |
| Fixed Income - 80.2% | | | | | | | | |
RIC Russell Global Opportunistic Credit Fund Class Y | | | 2,070 | | | | 20 | |
RIC Russell Investment Grade Bond Fund Class Y | | | 9,064 | | | | 200 | |
RIC Russell Short Duration Bond Fund Class Y | | | 9,393 | | | | 180 | |
RIF Core Bond Fund | | | 36,359 | | | | 381 | |
| | | | | | | | |
| | | | | | | 781 | |
| | | | | | | | |
| | |
| International Equities - 10.0% | | | | | | | | |
RIC Russell Global Equity Fund Class Y | | | 6,076 | | | | 49 | |
RIF Non-U.S. Fund | | | 5,526 | | | | 48 | |
| | | | | | | | |
| | | | | | | 97 | |
| | | | | | | | |
| | |
| Real Assets - 6.1% | | | | | | | | |
RIC Russell Commodity Strategies Fund Class Y | | | 2,025 | | | | 19 | |
RIC Russell Global Infrastructure Fund Class Y | | | 1,985 | | | | 20 | |
RIF Global Real Estate Securities Fund | | | 1,573 | | | | 20 | |
| | | | | | | | |
| | | | | | | 59 | |
| | | | | | | | |
| | |
Total Investments - 102.4%
(identified cost $1,011) | | | | | | | 997 | |
| | |
Other Assets and Liabilities,
Net - (2.4%) | | | | | | | (23 | ) |
| | | | | | | | |
| | |
| Net Assets - 100.0% | | | | | | | 974 | |
| | | | | | | | |
See accompanying notes which are an integral part of the financial statements.
| | | | |
| | 16 | | | Conservative Strategy Fund |
Russell Investment Funds
Conservative Strategy Fund
Presentation of Portfolio Holdings — December 31, 2011 (Unaudited)
| | | | |
| Categories | | % of Net
Assets | |
| | | | |
| | | | |
Domestic Equities | | | 6.1 | |
Fixed Income | | | 80.2 | |
International Equities | | | 10.0 | |
Real Assets | | | 6.1 | |
| | | | |
| |
Total Investments | | | 102.4 | |
Other Assets and Liabilities, Net | | | (2.4 | ) |
| | | | |
| |
| | | 100.0 | |
| | | | |
See accompanying notes which are an integral part of the financial statements.
| | |
| Conservative Strategy Fund | | 17 |
Russell Investment Funds
Moderate Strategy Fund
Portfolio Management Discussion and Analysis — December 31, 2011 (Unaudited)
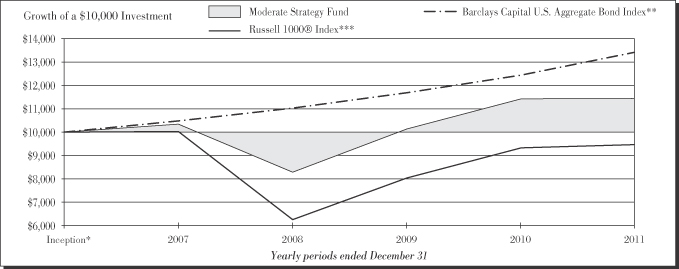
| | | | | | |
|
| Moderate Strategy Fund | |
| | | | | Total
Return | |
1 Year | | | | | 0.12 | % |
Inception* | | | | | 2.92 | %§ |
|
| Barclays Capital U.S. Aggregate Bond Index ** | |
| | | | | Total
Return | |
1 Year | | | | | 7.84 | % |
Inception* | | | | | 6.51 | %§ |
|
| Russell 1000® Index *** | |
| | | | | Total
Return | |
1 Year | | | | | 1.50 | % |
Inception* | | | | | (1.15 | )%§ |
| | | | |
| | 18 | | | Moderate Strategy Fund |
Russell Investment Funds
Moderate Strategy Fund
Portfolio Management Discussion and Analysis — December 31, 2011 (Unaudited)
The Fund is a fund of funds that invests in other Russell Investment Funds and Russell Investment Company mutual funds (the “Underlying Funds”). The Underlying Funds allocate most of their assets among multiple money managers. Russell Investment Management Company (“RIMCo”), as the Underlying Funds’ advisor, may change the allocation of the Underlying Funds’ assets among money managers at any time. An exemptive order from the Securities and Exchange Commission (“SEC”) permits RIMCo to engage or terminate a money manager in an Underlying Fund at any time, subject to approval by the Underlying Fund’s Board, without a shareholder vote.
What is the Fund’s investment objective?
The Moderate Strategy Fund (the “Fund”) seeks to provide high current income and moderate long-term capital appreciation.
How did the Fund perform relative to its benchmark for the fiscal year ended December 31, 2011?
For the fiscal year ended December 31, 2011, the Fund gained 0.12%. This is compared to the Fund’s benchmark, the Barclays Capital U.S. Aggregate Bond Index, which gained 7.84% during the same period.
For the fiscal year ended December 31, 2011, the Lipper® Mixed Asset Target Allocation Moderate Funds Average, a group of funds that Lipper considers to have investment strategies similar to those of the Fund, gained 0.32%. This result serves as a peer comparison and is expressed net of operating expenses.
The Fund’s performance includes operating expenses, whereas the Index returns are unmanaged and do not include expenses of any kind. The Fund’s underperformance relative to the Barclays Capital U.S. Aggregate Bond Index was due to the Fund’s exposure to both active fixed income management, which underperformed the Fund’s Index due to riskier out-of-benchmark positions, and to equity investments, particularly global investment mandates, which in the aggregate underperformed core fixed income.
How did the market conditions described in the Market Summary report affect the Fund’s performance?
The Fund is a fund of funds and its performance is based on RIMCo’s strategic asset allocations and the performance of the Underlying Funds in which the Fund invests.
As the fiscal year began with hopes for a continued economic recovery from the 2008 financial crisis, the Underlying Fund’s money managers took pro-recovery bets early in the fiscal year. This was evident in both equity managers that picked high-risk stocks relative to the benchmark in sectors such as financials and consumer discretionary as well as fixed income managers that chose riskier out of benchmark positions. However, as the year progressed, the market grew concerned with economic and political events within the United States, Europe and emerging markets. Money managers turned their focus on prudently reducing risk while also attempting to maintain exposure to
factors that drive excess returns. This strategy allowed for strong returns beginning in October, as markets rallied through the end of the year.
All of the Underlying Funds (which are designed to represent individual asset classes) underperformed the Fund’s Index for the fiscal year. In the fixed income Underlying Funds, the RIF Core Bond, Russell Investment Grade, and Russell Global Opportunistic Credit Funds underperformed the Fund’s Index due to their preference for out-of-benchmark allocations to non-Treasury fixed income securities, such as investment grade financials, high yield corporate bonds and non-agency mortgage-backed securities. These positions suffered due to the European sovereign debt crisis, as well as the Federal Reserve selling its Maiden Lane II non-agency mortgage portfolio in April 2011, which decreased prices for these securities. Despite positive developments for credit sectors in the fourth quarter, fourth quarter performance was not strong enough to offset previous losses. The Russell Global Opportunistic Credit Fund underperformed the Fund’s benchmark due to exposure to emerging market debt, which suffered due to macro-economic risk aversion. The Russell Global Equity, Russell Emerging Markets and RIF Non-U.S. Funds underperformed the Fund’s benchmark due to macro-economic risk aversion that resulted in a flight from international countries with riskier markets to traditionally safe equities. In the U.S. equity Underlying Funds, the Russell U.S. Core Equity Fund, RIF Multi-Style Equity Fund and RIF Aggressive Equity Fund underperformed the Fund’s Index due to the second and third quarter sell off, which pushed the market into bear market territory. The market’s focus on macroeconomic news, especially coming out of Europe, drove correlations among stocks higher. Combined with the U.S. sovereign debt downgrade, increasing unemployment, and disappointing housing data in these two quarters, the U.S. equity market experienced strong quarterly declines. The fourth quarter saw a rebound as global recession fears subsided, and due to pro-recovery positions, the funds were able to make up some of the prior losses. Macro-economic fears caused a large real-estate pull back with limited consideration of net asset value differences across companies, sectors, countries and regions. This led to the Russell Global Real Estate Securities Fund underperforming the Fund’s benchmark. Similar macro-economic fears led to lower aggregate demand for real assets, which detracted from the performance of the Russell Global Infrastructure Fund and the Russell Commodity Strategies Fund. The Russell Global Infrastructure Fund lagged the Fund’s Index due to positions in Europe and emerging markets experiencing lower demand.
How did the investment strategies and techniques employed by the Fund and the money managers of the Underlying Funds affect the Fund’s performance?
The Fund’s allocation to the fixed income Underlying Funds during the fiscal year was 36% invested in the RIF Core Bond Fund, 20% invested in the Russell Investment Grade Bond Fund, and 2% invested in the Russell Global Opportunistic Credit Fund. The fixed income asset class underperformed the
| | |
| Moderate Strategy Fund | | 19 |
Russell Investment Funds
Moderate Strategy Fund
Portfolio Management Discussion and Analysis — December 31, 2011 (Unaudited)
Fund’s Index. This was primarily due to the Underlying Funds holding riskier out-of -benchmark debt, which underperformed due to the macroeconomic pullback and European sovereign debt crisis. The RIF Core Bond and Russell Investment Grade Bond Funds suffered due to overweight positions to investment grade financials, high yield corporate bonds and non-agency mortgages. The Russell Global Opportunistic Credit Fund underperformed due to emerging market debt exposure, as these markets suffered from investors’ risk off sentiment.
The international equity Underlying Funds experienced high levels of volatility and all three funds underperformed the Fund’s Index. The Fund’s allocation to the RIF Non-U.S. Fund was 9%, the Russell Global Equity Fund was 8% and the Russell Emerging Markets Fund was 3% during the period. These funds’ investment strategies do not emphasize downside protection, risk aversion or defensiveness and their performance was negatively affected by macro-economic events, the weak performance of emerging markets and the resulting flight to safety. The RIF Non-U.S. Fund was not sufficiently defensive for a market environment marked by fear and skepticism, and its emphasis on companies with higher rates of earnings growth proved disadvantageous as general skepticism towards growth prospects weighed on share prices. The Russell Global Equity Fund suffered due to stock selection within the energy, consumer discretionary and financials sectors.
The U.S. equity Underlying Funds were positioned aggressively. Though the U.S. equity market in the first and fourth quarters of the year exhibited traits representative of economic recovery, the general volatility over the fiscal year and generally fearful market environment caused strong underperformance in aggressive equity strategies. The Fund’s allocation to the Russell U.S. Quantitative Equity Fund was 6%, the RIF Multi-Style Equity Fund was 5%, and the RIF Aggressive Equity Fund was 2% during the period. All three funds underperformed the Fund’s Index. The Russell U.S. Quantitative Equity Fund had a neutral exposure to risk and overweight exposure to quality, as the rotation by investors away from risk was accompanied by a rotation towards quality based factors (e.g., return on equity, return on assets and earnings stability). However, while this rotation allowed the fund to make up losses incurred in the second and third quarters, it underperformed the Fund’s benchmark for the fiscal year. The RIF Multi-Style Equity Fund benefited from its pro-recovery
positioning in early 2011, though despite the fund’s more defensive tactical positioning during the worst period of 2011, a remaining exposure to stocks with higher betas and stocks with more cyclical earnings patterns detracted from its performance in the second and third quarter as global recession fears grew. A partial recovery in the fourth quarter benefited the fund, but this was not enough to offset prior losses. The RIF Aggressive Equity Fund benefited from its exposure to sectors such as producer durables and technology during early 2011, but as macroeconomic uncertainty increased in the second and third quarters of 2011, its lack of exposure to consumer staples and utilities was detrimental, as was stock selection in the financials sector.
The Fund’s allocation to real asset Underlying Funds during the fiscal year was 3% invested in the Russell Commodity Strategies Fund, 3% invested in the Russell Global Real Estate Securities Fund and 3% invested in the Russell Global Infrastructure Fund. All three funds underperformed the Fund’s benchmark, with the Russell Global Real Estate Securities Fund posting absolute negative returns and the other two posting absolute positive returns. Stock selection within the U.S., Hong Kong and Japan significantly detracted from the Russell Global Real Estate Securities Fund’s performance, as well as exposures to more cyclically-exposed sectors.
Describe any changes to the Fund’s structure or allocation to the Underlying Funds.
The Fund had no structure or allocation changes to the Underlying Funds during the fiscal year.
The views expressed in this report reflect those of the portfolio managers only through the end of the fiscal year covered by the report. These views do not necessarily represent the views of RIMCo, or any other person in RIMCo or any other affiliated organization. These views are subject to change at any time based upon market conditions or other events, and RIMCo disclaims any responsibility to update the views contained herein. These views should not be relied on as investment advice and, because investment decisions for a Russell Investment Fund (“RIF”) or Russell Investment Company (“RIC”) Fund are based on numerous factors, should not be relied on as an indication of investment decisions of any RIF or RIC Fund.
| * | | The Fund first issued shares on April 30, 2007. |
| ** | | The Barclays Capital U.S. Aggregate Bond Index is an index, with income reinvested, generally representative of intermediate-term government bonds, investment-grade corporate debt securities and mortgage-backed securities. |
| *** | | Russell 1000® Index includes the 1,000 largest companies in the Russell 3000® Index. The Russell 1000® Index represents the universe of stocks from which most active money managers typically select. The Russell 1000® Index return reflects adjustments from income dividends and capital gain distributions reinvested as of the ex-dividend dates. |
The performance shown in this section does not reflect any Insurance Company Separate Account or Policy Charges. Performance is historical and assumes reinvestment of all dividends and capital gains. Investment return and principal value will fluctuate so that an investor’s shares, when redeemed, may be worth more or less than when purchased. Past performance is not indicative of future results.
| | | | |
| | 20 | | | Moderate Strategy Fund |
Russell Investment Funds
Moderate Strategy Fund
Shareholder Expense Example — December 31, 2011 (Unaudited)
Fund Expenses
The following disclosure provides important information regarding each Fund’s Expense Example, which appears on each Fund’s individual page in this Annual Report. Please refer to this information when reviewing the Expense Example for a Fund.
Example
As a shareholder of the Fund, you incur two types of costs: (1) transaction costs, and (2) ongoing costs, including advisory fees and other Fund expenses. The Example is intended to help you understand your ongoing costs (in dollars) of investing in the Fund and to compare these costs with the ongoing costs of investing in other mutual funds. The Example is based on an investment of $1,000 invested at the beginning of the period and held for the entire period indicated, which for this Fund is from July 1, 2011 to December 31, 2011.
Actual Expenses
The information in the table under the heading “Actual Performance” provides information about actual account values and actual expenses. You may use the information in this column, together with the amount you invested, to estimate the expenses that you paid over the period. Simply divide your account value by $1,000 (for example, an $8,600 account value divided by $1,000 = 8.6), then multiply the result by the number in the first column in the row entitled “Expenses Paid During Period” to estimate the expenses you paid on your account during this period.
Hypothetical Example for Comparison Purposes
The information in the table under the heading “Hypothetical Performance (5% return before expenses)” provides information about hypothetical account values and hypothetical expenses based on the Fund’s actual expense ratio and an assumed rate of return of 5% per year before expenses, which is not the Fund’s actual return. The hypothetical account values and expenses may not be used to estimate the actual ending account balance or expenses you paid for the period. You may use this information to compare the ongoing costs of investing in the Fund and other funds. To do so, compare this 5% hypothetical example with the 5% hypothetical examples that appear in the shareholder reports of other funds.
Please note that the expenses shown in the table are meant to highlight your ongoing costs only and do not reflect any transactional costs. Therefore, the information under the heading “Hypothetical Performance (5% return before expenses)” is useful in comparing ongoing costs only, and will not help you determine the relative total costs of owning different funds. In addition, if these transactional costs were included, your costs would have been higher. The fee and expenses shown in this section do not reflect any Insurance Company Separate Account or Policy Charges.
| | | | | | | | |
| | | Actual
Performance | | | Hypothetical
Performance
(5% return
before expenses) | |
| | | | | | | | |
Beginning Account Value
| | | | | | | | |
July 1, 2011 | | $ | 1,000.00 | | | $ | 1,000.00 | |
Ending Account Value
| | | | | | | | |
December 31, 2011 | | $ | 963.30 | | | $ | 1,024.70 | |
Expenses Paid During Period* | | $ | 0.49 | | | $ | 0.51 | |
| * | Expenses are equal to the Fund’s annualized expense ratio of 0.10% (representing the six month period annualized), multiplied by the average account value over the period, multiplied by 184/365 (to reflect the one-half year period). May reflect amounts waived, reimbursed and/or other credits. Without any waivers, reimbursements and/or other credits, expenses would have been higher. |
| | |
| Moderate Strategy Fund | | 21 |
Russell Investment Funds
Moderate Strategy Fund
Schedule of Investments — December 31, 2011
Amounts in thousands (except share amounts)
| | | | | | | | |
| | | Shares | | | Market
Value $ | |
| | | | | | | | |
| | | | | | | | |
| Investments - 100.0% | | | | | | | | |
Russell Investment Company (“RIC”) and other Russell Investment Funds (“RIF”) Series Mutual Funds | | | | | | | | |
| | |
| Domestic Equities - 13.1% | | | | | | | | |
RIC Russell U.S. Quantitative Equity Fund Class Y | | | 153,027 | | | | 4,533 | |
RIF Aggressive Equity Fund | | | 132,580 | | | | 1,506 | |
RIF Multi-Style Equity Fund | | | 284,881 | | | | 3,772 | |
| | | | | | | | |
| | | | | | | 9,811 | |
| | | | | | | | |
| | |
| Fixed Income - 57.9% | | | | | | | | |
RIC Russell Global Opportunistic Credit Fund Class Y | | | 154,999 | | | | 1,499 | |
RIC Russell Investment Grade Bond Fund Class Y | | | 678,164 | | | | 15,001 | |
RIF Core Bond Fund | | | 2,575,502 | | | | 26,965 | |
| | | | | | | | |
| | | | | | | 43,465 | |
| | | | | | | | |
| | |
| International Equities - 20.0% | | | | | | | | |
RIC Russell Emerging Markets Fund Class Y | | | 138,611 | | | | 2,236 | |
RIC Russell Global Equity Fund Class Y | | | 752,205 | | | | 6,017 | |
RIF Non-U.S. Fund | | | 774,516 | | | | 6,777 | |
| | | | | | | | |
| | | | | | | 15,030 | |
| | | | | | | | |
| | |
| Real Assets - 9.0% | | | | | | | | |
RIC Russell Commodity Strategies Fund Class Y | | | 233,358 | | | | 2,226 | |
RIC Russell Global Infrastructure Fund Class Y | | | 225,826 | | | | 2,274 | |
RIF Global Real Estate Securities Fund | | | 179,023 | | | | 2,265 | |
| | | | | | | | |
| | | | | | | 6,765 | |
| | | | | | | | |
| | |
Total Investments - 100.0%
(identified cost $71,993) | | | | | | | 75,071 | |
| | |
Other Assets and Liabilities,
Net - (0.0%) | | | | | | | (15 | ) |
| | | | | | | | |
| | |
| Net Assets - 100.0% | | | | | | | 75,056 | |
| | | | | | | | |
See accompanying notes which are an integral part of the financial statements.
| | | | |
| | 22 | | | Moderate Strategy Fund |
Russell Investment Funds
Moderate Strategy Fund
Presentation of Portfolio Holdings — December 31, 2011 (Unaudited)
| | | | |
| Categories | | % of Net
Assets | |
| | | | |
| | | | |
Domestic Equities | | | 13.1 | |
Fixed Income | | | 57.9 | |
International Equities | | | 20.0 | |
Real Assets | | | 9.0 | |
| | | | |
| |
Total Investments | | | 100.0 | |
Other Assets and Liabilities, Net | | | (— | )* |
| | | | |
| |
| | | 100.0 | |
| | | | |
| * | Less than .05% of net assets. |
See accompanying notes which are an integral part of the financial statements.
| | |
| Moderate Strategy Fund | | 23 |
Russell Investment Funds
Balanced Strategy Fund
Portfolio Management Discussion and Analysis — December 31, 2011 (Unaudited)
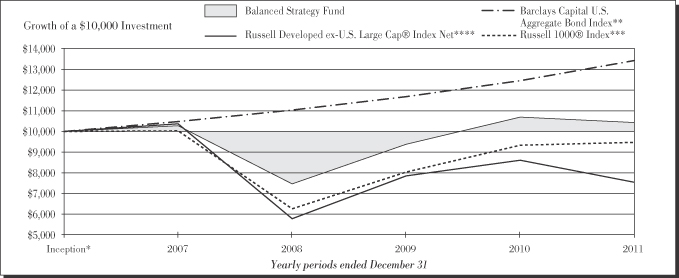
| | | | | | |
|
| Balanced Strategy Fund | |
| | | | | Total
Return | |
1 Year | | | | | (2.40 | )% |
Inception* | | | | | 0.92 | %§ |
|
| Barclays Capital U.S. Aggregate Bond Index ** | |
| | | | | Total
Return | |
1 Year | | | | | 7.84 | % |
Inception* | | | | | 6.51 | %§ |
|
| Russell 1000® Index *** | |
| | | | | Total
Return | |
1 Year | | | | | 1.50 | % |
Inception* | | | | | (1.15 | )%§ |
|
| Russell Developed ex-U.S. Large Cap® Index Net **** | |
| | | | | Total
Return | |
1 Year | | | | | (12.35 | )% |
Inception* | | | | | (5.85 | )%§ |
| | | | |
| | 24 | | | Balanced Strategy Fund |
Russell Investment Funds
Balanced Strategy Fund
Portfolio Management Discussion and Analysis — December 31, 2011 (Unaudited)
The Fund is a fund of funds that invests in other Russell Investment Funds and Russell Investment Company mutual funds (the “Underlying Funds”). The Underlying Funds allocate most of their assets among multiple money managers. Russell Investment Management Company (“RIMCo”), as the Underlying Funds’ advisor, may change the allocation of the Underlying Funds’ assets among money managers at any time. An exemptive order from the Securities and Exchange Commission (“SEC”) permits RIMCo to engage or terminate a money manager in an Underlying Fund at any time, subject to approval by the Underlying Fund’s Board, without a shareholder vote.
What is the Fund’s investment objective?
The Balanced Strategy Fund (the “Fund”) seeks to provide above average capital appreciation and a moderate level of current income.
How did the Fund perform relative to its benchmark for the fiscal year ended December 31, 2011?
For the fiscal year ended December 31, 2011, the Fund lost 2.40%. This is compared to the Fund’s benchmark, the Barclays Capital U.S. Aggregate Bond Index, which gained 7.84% during the same period.
For the fiscal year ended December 31, 2011, the Lipper® Mixed Asset Target Allocation Moderate Funds Average, a group of funds that Lipper considers to have investment strategies similar to those of the Fund, gained 0.32%. This result serves as a peer comparison and is expressed net of operating expenses.
The Fund’s performance includes operating expenses, whereas the Index returns are unmanaged and do not include expenses of any kind. The Fund’s underperformance relative to the Barclays Capital U.S. Aggregate Bond Index was due to the Fund’s exposure to both active fixed income management, which underperformed the Fund’s Index due to riskier out-of-benchmark positions, and to equity investments, particularly global investment mandates, which in the aggregate underperformed core fixed income.
How did the market conditions described in the Market Summary report affect the Fund’s performance?
The Fund is a fund of funds and its performance is based on RIMCo’s strategic asset allocations and the performance of the Underlying Funds in which the Fund invests.
As the fiscal year began with hopes for a continued economic recovery from the 2008 financial crisis, the Underlying Fund’s money managers took pro-recovery bets early in the fiscal year. This was evident in both equity managers that picked high-risk stocks relative to the benchmark in sectors such as financials and consumer discretionary as well as fixed income managers that chose riskier out of benchmark positions. However, as the year progressed, the market grew concerned with economic and political events within the United States, Europe and emerging markets. Money managers turned their focus on prudently reducing risk while also attempting to maintain exposure to
factors that drive excess returns. This strategy allowed for strong returns beginning in October, as markets rallied through the end of the year.
All of the Underlying Funds (which are designed to represent individual asset classes) underperformed the Fund’s Index for the fiscal year. In the fixed income Underlying Funds, the RIF Core Bond Fund underperformed the Fund’s Index due to its preference for out-of-benchmark allocations to non-Treasury fixed income securities, such as investment grade financials, high yield corporate bonds and non-agency mortgage-backed securities. These positions suffered due to the European sovereign debt crisis, as well as the Federal Reserve selling its Maiden Lane II non-agency mortgage portfolio in April 2011, which decreased prices for these securities. Despite positive developments for credit sectors in the fourth quarter, fourth quarter performance was not strong enough to offset previous losses. The Russell Global Opportunistic Credit Fund underperformed the Fund’s benchmark due to exposure to emerging market debt, which suffered due to macro-economic risk aversion. The Russell Global Equity, Russell Emerging Markets and RIF Non-U.S. Funds underperformed the Fund’s benchmark due to macro-economic risk aversion that resulted in a flight from international countries with riskier markets to traditionally safe equities. In the U.S. equity Underlying Funds, the Russell U.S. Core Equity, RIF Multi-Style Equity and RIF Aggressive Equity Funds underperformed the Fund’s Index due to the second and third quarter sell off, which pushed the market into bear market territory. The market’s focus on macroeconomic news, especially coming out of Europe, drove correlations among stocks higher. Combined with the U.S. sovereign debt downgrade, increasing unemployment, and disappointing housing data in these two quarters, the U.S. equity market experienced strong quarterly declines. The fourth quarter saw a strong rebound as global recession fears subsided, and due to pro-recovery positions, the funds were able to make up some of the prior losses. Macro-economic fears caused a large real-estate pull back with limited consideration of net asset value differences across companies, sectors, countries and regions. This led to the Russell Global Real Estate Securities Fund underperforming the Fund’s benchmark. Similar macro-economic fears led to lower aggregate demand for real assets, which detracted from the performance of the Russell Global Infrastructure Fund and the Russell Commodity Strategies Fund. The Russell Global Infrastructure Fund lagged the Fund’s Index due to positions in Europe and emerging markets experiencing lower demand.
How did the investment strategies and techniques employed by the Fund and the money managers of the Underlying Funds affect the Fund’s performance?
The Fund’s allocation to the fixed income Underlying Funds during the fiscal year was 35% invested in the RIF Core Bond Fund and 3% invested in the Russell Global Opportunistic Credit Fund. The fixed income asset class underperformed the Fund’s Index. This was primarily due to the Underlying Funds holding riskier out-of -benchmark debt, which underperformed
| | |
| Balanced Strategy Fund | | 25 |
Russell Investment Funds
Balanced Strategy Fund
Portfolio Management Discussion and Analysis — December 31, 2011 (Unaudited)
due to the macroeconomic pullback and European sovereign debt crisis. The RIF Core Bond Fund suffered due to overweight positions to investment grade financials, high yield corporate bonds and non-agency mortgages. The Russell Global Opportunistic Credit Fund underperformed due to emerging market debt exposure, as these markets suffered from investors’ risk off sentiment.
The international equity Underlying Funds experienced high levels of volatility and all three funds underperformed the Fund’s Index. The Fund’s allocation to the RIF Non-U.S. Fund was 15%, the Russell Global Equity Fund was 10% and the Russell Emerging Markets Fund was 4% during the period. These funds’ investment strategies do not emphasize downside protection, risk aversion or defensiveness and their performance was negatively affected by macro-economic events, the weak performance of emerging markets and the resulting flight to safety. The RIF Non-U.S. Fund was not sufficiently defensive for a market environment marked by fear and skepticism, and its emphasis on companies with higher rates of earnings growth proved disadvantageous as general skepticism towards growth prospects weighed on share prices. The Russell Global Equity Fund suffered from stock selection within the energy, consumer discretionary and financials sectors.
The U.S. equity Underlying Funds were positioned aggressively. Though the U.S. equity market in the first and fourth quarters of the year exhibited traits representative of economic recovery, the general volatility over the fiscal year and generally fearful market environment caused strong underperformance in aggressive equity strategies. The Fund’s allocation to the RIF Multi-Style Equity Fund was 10%, the Russell U.S. Quantitative Equity Fund was 9% and the RIF Aggressive Equity Fund was 4% during the period. All three funds underperformed the Fund’s Index. The RIF Multi-Style Equity Fund benefited from its pro-recovery positioning in early 2011, though despite the fund’s more defensive tactical positioning during the worst period of 2011, a remaining exposure to stocks with higher betas and stocks with more cyclical earnings patterns detracted from its performance in the second and third quarter as global recession fears grew. A partial recovery in the fourth quarter benefited the fund, but this was not enough to offset prior losses. The Russell U.S. Quantitative Equity Fund had a neutral
exposure to risk and overweight exposure to quality, as the rotation by investors away from risk was accompanied by a rotation towards quality based factors (e.g., return on equity, return on assets and earnings stability). However, while this rotation allowed the fund to make up losses incurred in the second and third quarters, it underperformed the Fund’s benchmark for the fiscal year. The RIF Aggressive Equity Fund benefited from its exposure to sectors such as producer durables and technology during early 2011, but as macroeconomic uncertainty increased in the second and third quarters of 2011, its lack of exposure to consumer staples and utilities was detrimental, as was stock selection in the financials sector.
The Fund’s allocation to real asset Underlying Funds during the fiscal year was 4% invested in the Russell Commodity Strategies Fund, 3% invested in the Russell Global Real Estate Securities Fund and 3% invested in the Russell Global Infrastructure Fund. All three funds underperformed the Fund’s benchmark, with the Russell Global Real Estate Securities Fund posting absolute negative returns and the other two posting absolute positive returns. Stock selection within the U.S., Hong Kong and Japan significantly detracted from the Russell Global Real Estate Securities Fund’s performance, as well as exposures to more cyclically-exposed sectors.
Describe any changes to the Fund’s structure or allocation to the Underlying Funds.
The Fund had no structure or allocation changes to the Underlying Funds during the fiscal year.
The views expressed in this report reflect those of the portfolio managers only through the end of the fiscal year covered by the report. These views do not necessarily represent the views of RIMCo, or any other person in RIMCo or any other affiliated organization. These views are subject to change at any time based upon market conditions or other events, and RIMCo disclaims any responsibility to update the views contained herein. These views should not be relied on as investment advice and, because investment decisions for a Russell Investment Fund (“RIF”) or Russell Investment Company (“RIC”) Fund are based on numerous factors, should not be relied on as an indication of investment decisions of any RIF or RIC Fund.
| * | | The Fund first issued shares on April 30, 2007. |
| ** | | The Barclays Capital U.S. Aggregate Bond Index is an index, with income reinvested, generally representative of intermediate-term government bonds, investment-grade corporate debt securities and mortgage-backed securities. |
| *** | | Russell 1000® Index includes the 1,000 largest companies in the Russell 3000® Index. The Russell 1000® Index represents the universe of stocks from which most active money managers typically select. The Russell 1000® Index return reflects adjustments from income dividends and capital gain distributions reinvested as of the ex-dividend dates. |
| **** | | Russell Developed ex-U.S. Large Cap® Index (net of tax on dividends from foreign holdings) is an index which offers investors access to the large-cap segment of the global equity market, excluding companies assigned to the United States. It is constructed to provide a comprehensive and unbiased barometer for the large-cap segment and is completely reconstituted annually to accurately reflect the changes in the market over time. |
The performance shown in this section does not reflect any Insurance Company Separate Account or Policy Charges. Performance is historical and assumes reinvestment of all dividends and capital gains. Investment return and principal value will fluctuate so that an investor’s shares, when redeemed, may be worth more or less than when purchased. Past performance is not indicative of future results.
| | | | |
| | 26 | | | Balanced Strategy Fund |
Russell Investment Funds
Balanced Strategy Fund
Shareholder Expense Example — December 31, 2011 (Unaudited)
Fund Expenses
The following disclosure provides important information regarding each Fund’s Expense Example, which appears on each Fund’s individual page in this Annual Report. Please refer to this information when reviewing the Expense Example for a Fund.
Example
As a shareholder of the Fund, you incur two types of costs: (1) transaction costs, and (2) ongoing costs, including advisory fees and other Fund expenses. The Example is intended to help you understand your ongoing costs (in dollars) of investing in the Fund and to compare these costs with the ongoing costs of investing in other mutual funds. The Example is based on an investment of $1,000 invested at the beginning of the period and held for the entire period indicated, which for this Fund is from July 1, 2011 to December 31, 2011.
Actual Expenses
The information in the table under the heading “Actual Performance” provides information about actual account values and actual expenses. You may use the information in this column, together with the amount you invested, to estimate the expenses that you paid over the period. Simply divide your account value by $1,000 (for example, an $8,600 account value divided by $1,000 = 8.6), then multiply the result by the number in the first column in the row entitled “Expenses Paid During Period” to estimate the expenses you paid on your account during this period.
Hypothetical Example for Comparison Purposes
The information in the table under the heading “Hypothetical Performance (5% return before expenses)” provides information about hypothetical account values and hypothetical expenses based on the Fund’s actual expense ratio and an assumed rate of return of 5% per year before expenses, which is not the Fund’s actual return. The hypothetical account values and expenses may not be used to estimate the actual ending account balance or expenses you paid for the period. You may use this information to compare the ongoing costs of investing in the Fund and other funds. To do so, compare this 5% hypothetical example with the 5% hypothetical examples that appear in the shareholder reports of other funds.
Please note that the expenses shown in the table are meant to highlight your ongoing costs only and do not reflect any transactional costs. Therefore, the information under the heading “Hypothetical Performance (5% return before expenses)” is useful in comparing ongoing costs only, and will not help you determine the relative total costs of owning different funds. In addition, if these transactional costs were included, your costs would have been higher. The fee and expenses shown in this section do not reflect any Insurance Company Separate Account or Policy Charges.
| | | | | | | | |
| | | Actual
Performance | | | Hypothetical
Performance
(5% return
before expenses) | |
| | | | | | | | |
Beginning Account Value
| | | | | | | | |
July 1, 2011 | | $ | 1,000.00 | | | $ | 1,000.00 | |
Ending Account Value
| | | | | | | | |
December 31, 2011 | | $ | 934.70 | | | $ | 1,024.70 | |
Expenses Paid During Period* | | $ | 0.49 | | | $ | 0.51 | |
| * | Expenses are equal to the Fund’s annualized expense ratio of 0.10% (representing the six month period annualized), multiplied by the average account value over the period, multiplied by 184/365 (to reflect the one-half year period). May reflect amounts waived, reimbursed and/or other credits. Without any waivers, reimbursements and/or other credits, expenses would have been higher. |
| | |
| Balanced Strategy Fund | | 27 |
Russell Investment Funds
Balanced Strategy Fund
Schedule of Investments — December 31, 2011
Amounts in thousands (except share amounts)
| | | | | | | | |
| | | Shares | | | Market
Value
$ | |
| | | | | | | | |
| | | | | | | | |
| Investments - 100.0% | | | | | | | | |
Russell Investment Company (“RIC”) and other Russell Investment Funds (“RIF”) Series Mutual Funds | | | | | | | | |
| | |
| Domestic Equities - 23.2% | | | | | | | | |
RIC Russell U.S. Quantitative Equity Fund Class Y | | | 612,637 | | | | 18,146 | |
RIF Aggressive Equity Fund | | | 710,433 | | | | 8,071 | |
RIF Multi-Style Equity Fund | | | 1,547,232 | | | | 20,485 | |
| | | | | | | | |
| | | | | | | 46,702 | |
| | | | | | | | |
| | |
| Fixed Income - 38.0% | | | | | | | | |
RIC Russell Global Opportunistic Credit Fund Class Y | | | 624,421 | | | | 6,038 | |
RIF Core Bond Fund | | | 6,727,210 | | | | 70,434 | |
| | | | | | | | |
| | | | | | | 76,472 | |
| | | | | | | | |
| | |
| International Equities - 28.8% | | | | | | | | |
RIC Russell Emerging Markets Fund Class Y | | | 491,829 | | | | 7,934 | |
RIC Russell Global Equity Fund Class Y | | | 2,498,763 | | | | 19,990 | |
RIF Non-U.S. Fund | | | 3,424,701 | | | | 29,966 | |
| | | | | | | | |
| | | | | | | 57,890 | |
| | | | | | | | |
| | |
| Real Assets - 10.0% | | | | | | | | |
RIC Russell Commodity Strategies Fund Class Y | | | 831,459 | | | | 7,932 | |
RIC Russell Global Infrastructure Fund Class Y | | | 602,622 | | | | 6,068 | |
RIF Global Real Estate Securities Fund | | | 477,779 | | | | 6,044 | |
| | | | | | | | |
| | | | | | | 20,044 | |
| | | | | | | | |
| | |
Total Investments - 100.0%
(identified cost $197,030) | | | | | | | 201,108 | |
| | |
Other Assets and Liabilities,
Net - (0.0%) | | | | | | | (39 | ) |
| | | | | | | | |
| | |
| Net Assets - 100.0% | | | | | | | 201,069 | |
| | | | | | | | |
See accompanying notes which are an integral part of the financial statements.
| | | | |
| | 28 | | | Balanced Strategy Fund |
Russell Investment Funds
Balanced Strategy Fund
Presentation of Portfolio Holdings — December 31, 2011 (Unaudited)
| | | | |
| Categories | | % of Net
Assets | |
| | | | |
| | | | |
Domestic Equities | | | 23.2 | |
Fixed Income | | | 38.0 | |
International Equities | | | 28.8 | |
Real Assets | | | 10.0 | |
| | | | |
| |
Total Investments | | | 100.0 | |
Other Assets and Liabilities, Net | | | (— | )* |
| | | | |
| |
| | | 100.0 | |
| | | | |
| * | Less than .05% of net assets. |
See accompanying notes which are an integral part of the financial statements.
| | |
| Balanced Strategy Fund | | 29 |
Russell Investment Funds
Growth Strategy Fund
Portfolio Management Discussion — December 31, 2011 (Unaudited)
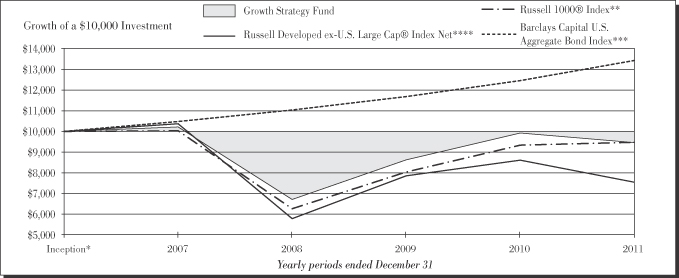
| | | | | | |
|
| Growth Strategy Fund | |
| | | | | Total
Return | |
1 Year | | | | | (4.73 | )% |
Inception* | | | | | (1.19 | )%§ |
| | | | | | |
|
| Russell 1000® Index ** | |
| | | | | Total
Return | |
1 Year | | | | | 1.50 | % |
Inception* | | | | | (1.15 | )%§ |
| | | | | | |
|
| Barclays Capital U.S. Aggregate Bond Index *** | |
| | | | | Total
Return | |
1 Year | | | | | 7.84 | % |
Inception* | | | | | 6.51 | %§ |
| | | | | | |
|
| Russell Developed ex-U.S. Large Cap® Index Net **** | |
| | | | | Total
Return | |
1 Year | | | | | (12.35 | )% |
Inception* | | | | | (5.85 | )%§ |
Russell Investment Funds
Growth Strategy Fund
Portfolio Management Discussion — December 31, 2011 (Unaudited)
The Fund is a fund of funds that invests in other Russell Investment Funds and Russell Investment Company mutual funds (the “Underlying Funds”). The Underlying Funds allocate most of their assets among multiple money managers. Russell Investment Management Company (“RIMCo”), as the Underlying Funds’ advisor, may change the allocation of the Underlying Funds’ assets among money managers at any time. An exemptive order from the Securities and Exchange Commission (“SEC”) permits RIMCo to engage or terminate a money manager in an Underlying Fund at any time, subject to approval by the Underlying Fund’s Board, without a shareholder vote.
What is the Fund’s investment objective?
The Growth Strategy Fund (the “Fund”) seeks to provide above average capital appreciation and a moderate level of current income.
How did the Fund perform relative to its benchmark for the fiscal year ended December 31, 2011?
For the fiscal year ended December 31, 2011, the Fund lost 4.73%. This is compared to the Fund’s benchmark, the Russell 1000® Index, which gained 1.50% during the same period.
For the fiscal year ended December 31, 2011, the Lipper® Mixed Asset Target Allocation Growth Funds Average, a group of funds that Lipper considers to have investment strategies similar to those of the Fund, lost 1.65%. This result serves as a peer comparison and is expressed net of operating expenses.
The Fund’s performance includes operating expenses, whereas the Index returns are unmanaged and do not include expenses of any kind. The Fund’s underperformance relative to the Russell 1000® Index was due in part to the Fund’s relative exposure to active fixed income management and global investment mandates, which in the aggregate underperformed U.S. core equities.
How did the market conditions described in the Market Summary report affect the Fund’s performance?
The Fund is a fund of funds and its performance is based on RIMCo’s strategic asset allocations and the performance of the Underlying Funds in which the Fund invests.
As the fiscal year began with hopes for a continued economic recovery from the 2008 financial crisis, the Underlying Fund’s money managers took pro-recovery bets early in the fiscal year. This was evident in both equity managers that picked high-risk stocks relative to the benchmark in sectors such as financials and consumer discretionary as well as fixed income managers that chose riskier fixed income positions. However, as the year progressed, the market grew concerned with economic and political events within the United States, Europe and emerging markets. Money managers turned their focus on prudently reducing risk while also attempting to maintain exposure to factors that drive excess returns. This strategy allowed for strong returns beginning in October, as markets rallied through the end of the year.
Two of the Underlying Funds (which are designed to represent individual asset classes) outperformed the Russell 1000® Index for the fiscal year. In the fixed income Underlying Funds, the RIF Core Bond and Russell Global Opportunistic Credit Funds outperformed and underperformed the Russell 1000® Index, respectively. The RIF Core Bond invests in fixed income securities such as investment grade financials, high yield corporate bonds and non-agency mortgage-backed securities. These positions suffered due to the European sovereign debt crisis, as well as the Federal Reserve selling its Maiden Lane II non-agency mortgage portfolio in April 2011. However, positive developments for less-risky credit sectors in the fourth quarter helped the RIF Core Bond Fund outperform the benchmark. The Russell Global Opportunistic Credit Fund underperformed the Russell 1000® Index. This fund’s underperformance was due in part to its exposure to short duration bonds and emerging market currencies and an underweight to liquid high-yield issuers. The Russell Global Equity, Russell Emerging Markets and RIF Non-U.S. Funds underperformed the Fund’s benchmark due to macro-economic risk aversion that resulted in a flight from international countries with riskier markets to traditionally safe equities. In the U.S. equity Underlying Funds, the Russell U.S. Core Equity, RIF Multi-Style Equity and RIF Aggressive Equity Funds underperformed the Russell 1000® Index. These funds benefited from pro-recovery positions beginning in October 2011, which offset losses from earlier in the year, but underperformed the benchmark over the fiscal year due to exposure to stocks with higher betas. However, the Russell U.S. Quantitative Equity Fund outperformed the Russell 1000® Index due largely to gains in the fourth quarter, as the fund benefited from its ability to take advantage of the lowered factor correlations. Macro-economic fears caused a large real-estate pull back with limited consideration of net asset value differences across companies, sectors, countries and regions. This led to the Russell Global Real Estate Securities Fund underperforming the Fund’s benchmark. Similar macro-economic fears led to lower aggregate demand for real assets, which detracted from the performance of the Russell Global Infrastructure Fund and the Russell Commodity Strategies Fund. The Russell Global Infrastructure Fund lagged the Fund’s Index due to positions in Europe and emerging markets experiencing lower demand.
How did the investment strategies and techniques employed by the Fund and the money managers of the Underlying Funds affect the Fund’s performance?
The international equity Underlying Funds experienced high levels of volatility and all three funds underperformed the Fund’s Index. The Fund’s allocation to the RIF Non-U.S. Fund was 19%, the Russell Global Equity Fund was 14% and the Russell Emerging Markets Fund was 5% during the period. These funds’ investment strategies do not emphasize downside protection, risk aversion or defensiveness and their performance was negatively affected by macro-economic events, the weak performance of emerging markets and the resulting flight to safety. The RIF Non-U.S. Fund was not sufficiently defensive for a market environment marked by fear and skepticism, and
Russell Investment Funds
Growth Strategy Fund
Portfolio Management Discussion — December 31, 2011 (Unaudited)
its emphasis on companies with higher rates of earnings growth proved disadvantageous as general skepticism towards growth prospects weighed on share prices. The Russell Global Equity Fund suffered from stock selection within the energy, consumer discretionary and financials sectors.
The U.S. equity Underlying Funds were generally positioned aggressively. Though the U.S. equity market in the first and fourth quarters of the year exhibited traits representative of economic recovery, the general volatility over the fiscal year and generally fearful market environment caused strong underperformance in aggressive equity strategies with only the Russell U.S. Quantitative Equity Fund outperforming the Fund’s benchmark. The Fund’s allocation to the RIF Multi-Style Equity Fund was 12%, the Russell U.S. Quantitative Equity Fund was 11% and the RIF Aggressive Equity Fund was 6% during the period. The RIF Multi-Style Equity Fund benefited from its pro-recovery positioning in early 2011, though despite the fund’s more defensive tactical positioning during the worst period of 2011, a remaining exposure to stocks with higher betas and stocks with more cyclical earnings patterns detracted from its performance in the second and third quarter as global recession fears grew. A partial recovery in the fourth quarter benefited the fund, but this was not enough to offset prior losses. The Russell U.S. Quantitative Equity Fund had a neutral exposure to risk and overweight exposure to quality, as the rotation by investors away from risk was accompanied by a rotation towards quality based factors (e.g., return on equity, return on assets and earnings stability). This rotation allowed the fund to make up losses incurred in the second and third quarters and helped it to outperform the Fund’s benchmark for the fiscal year. The RIF Aggressive Equity Fund benefited from its exposure to sectors such as producer durables and technology during early 2011, but as macroeconomic uncertainty increased in the second and third quarters of 2011, its lack of exposure to consumer staples and utilities was detrimental, as was stock selection in the financials sector.
The Fund’s allocation to the fixed income Underlying Funds during the fiscal year was 15% invested in the RIF Core
Bond Fund and 4% invested in the Russell Global Opportunistic Credit Fund. These two funds outperformed and underperformed the Fund’s benchmark, respectively. The Russell Global Opportunistic Credit Fund held riskier fixed income securities, which underperformed due to the macroeconomic pullback and European sovereign debt crisis. The RIF Core Bond Fund had stronger performance due to its more conservative positioning.
The Fund’s allocation to real asset Underlying Funds during the fiscal year was 6% invested in the Russell Commodity Strategies Fund, 4% invested in the Russell Global Real Estate Securities Fund and 4% invested in the Russell Global Infrastructure Fund. All three funds underperformed the Fund’s benchmark, with the Russell Global Real Estate Securities Fund posting absolute negative returns and the other two posting absolute positive returns. Stock selection within the U.S., Hong Kong and Japan significantly detracted from the Russell Global Real Estate Securities Fund’s performance, as well as exposures to more cyclically-exposed sectors.
Describe any changes to the Fund’s structure or allocation to the Underlying Funds.
The Fund had no structure or allocation changes to the Underlying Funds during the fiscal year.
The views expressed in this report reflect those of the portfolio managers only through the end of the fiscal year covered by the report. These views do not necessarily represent the views of RIMCo, or any other person in RIMCo or any other affiliated organization. These views are subject to change at any time based upon market conditions or other events, and RIMCo disclaims any responsibility to update the views contained herein. These views should not be relied on as investment advice and, because investment decisions for a Russell Investment Fund (“RIF”) or Russell Investment Company (“RIC”) Fund are based on numerous factors, should not be relied on as an indication of investment decisions of any RIF or RIC Fund.
| * | | The Fund first issued shares on April 30, 2007. |
| ** | | Russell 1000® Index includes the 1,000 largest companies in the Russell 3000® Index. The Russell 1000® Index represents the universe of stocks from which most active money managers typically select. The Russell 1000® Index return reflects adjustments from income dividends and capital gain distributions reinvested as of the ex-dividend dates. |
| *** | | The Barclays Capital U.S. Aggregate Bond Index is an index, with income reinvested, generally representative of intermediate-term government bonds, investment-grade corporate debt securities and mortgage-backed securities. |
| **** | | Russell Developed ex-U.S. Large Cap® Index (net of tax on dividends from foreign holdings) is an index which offers investors access to the large-cap segment of the global equity market, excluding companies assigned to the United States. It is constructed to provide a comprehensive and unbiased barometer for the large-cap segment and is completely reconstituted annually to accurately reflect the changes in the market over time. |
The performance shown in this section does not reflect any Insurance Company Separate Account or Policy Charges. Performance is historical and assumes reinvestment of all dividends and capital gains. Investment return and principal value will fluctuate so that an investor’s shares, when redeemed, may be worth more or less than when purchased. Past performance is not indicative of future results.
Russell Investment Funds
Growth Strategy Fund
Shareholder Expense Example — December 31, 2011 (Unaudited)
Fund Expenses
The following disclosure provides important information regarding each Fund’s Expense Example, which appears on each Fund’s individual page in this Annual Report. Please refer to this information when reviewing the Expense Example for a Fund.
Example
As a shareholder of the Fund, you incur two types of costs: (1) transaction costs, and (2) ongoing costs, including advisory fees and other Fund expenses. The Example is intended to help you understand your ongoing costs (in dollars) of investing in the Fund and to compare these costs with the ongoing costs of investing in other mutual funds. The Example is based on an investment of $1,000 invested at the beginning of the period and held for the entire period indicated, which for this Fund is from July 1, 2011 to December 31, 2011.
Actual Expenses
The information in the table under the heading “Actual Performance” provides information about actual account values and actual expenses. You may use the information in this column, together with the amount you invested, to estimate the expenses that you paid over the period. Simply divide your account value by $1,000 (for example, an $8,600 account value divided by $1,000 = 8.6), then multiply the result by the number in the first column in the row entitled “Expenses Paid During Period” to estimate the expenses you paid on your account during this period.
Hypothetical Example for Comparison Purposes
The information in the table under the heading “Hypothetical Performance (5% return before expenses)” provides information about hypothetical account values and hypothetical expenses based on the Fund’s actual expense ratio and an assumed rate of return of 5% per year before expenses, which is not the Fund’s actual return. The hypothetical account values and expenses may not be used to estimate the actual ending account balance or expenses you paid for the period. You may use this information to compare the ongoing costs of investing in the Fund and other funds. To do so, compare this 5% hypothetical example with the 5% hypothetical examples that appear in the shareholder reports of other funds.
Please note that the expenses shown in the table are meant to highlight your ongoing costs only and do not reflect any transactional costs. Therefore, the information under the heading “Hypothetical Performance (5% return before expenses)” is useful in comparing ongoing costs only, and will not help you determine the relative total costs of owning different funds. In addition, if these transactional costs were included, your costs would have been higher. The fee and expenses shown in this section do not reflect any Insurance Company Separate Account or Policy Charges.
| | | | | | | | |
| | | Actual
Performance | | | Hypothetical
Performance
(5% return
before expenses) | |
| | | | | | | | |
Beginning Account Value
| | | | | | | | |
July 1, 2011 | | $ | 1,000.00 | | | $ | 1,000.00 | |
Ending Account Value
| | | | | | | | |
December 31, 2011 | | $ | 908.40 | | | $ | 1,024.70 | |
Expenses Paid During Period* | | $ | 0.48 | | | $ | 0.51 | |
| * | Expenses are equal to the Fund’s annualized expense ratio of 0.10% (representing the six month period annualized), multiplied by the average account value over the period, multiplied by 184/365 (to reflect the one-half year period). May reflect amounts waived, reimbursed and/or other credits. Without any waivers, reimbursements and/or other credits, expenses would have been higher. |
Russell Investment Funds
Growth Strategy Fund
Schedule of Investments — December 31, 2011
Amounts in thousands (except share amounts)
| | | | | | | | |
| | | Shares | | | Market
Value
$ | |
| | | | | | | | |
| Investments - 100.0% | | | | | | | | |
Russell Investment Company (“RIC”) and other Russell Investment Funds (“RIF”) Series Mutual Funds | | | | | | | | |
| | |
| Domestic Equities - 29.0% | | | | | | | | |
RIC Russell U.S. Quantitative Equity Fund Class Y | | | 413,464 | | | | 12,247 | |
RIF Aggressive Equity Fund | | | 586,952 | | | | 6,668 | |
RIF Multi-Style Equity Fund | | | 1,009,642 | | | | 13,367 | |
| | | | | | | | |
| | | | | | | 32,282 | |
| | | | | | | | |
| | |
| Fixed Income - 19.0% | | | | | | | | |
RIC Russell Global Opportunistic Credit Fund Class Y | | | 461,791 | | | | 4,466 | |
RIF Core Bond Fund | | | 1,598,273 | | | | 16,734 | |
| | | | | | | | |
| | | | | | | 21,200 | |
| | | | | | | | |
| | |
| International Equities - 38.0% | | | | | | | | |
RIC Russell Emerging Markets Fund Class Y | | | 344,983 | | | | 5,565 | |
RIC Russell Global Equity Fund Class Y | | | 1,950,624 | | | | 15,605 | |
RIF Non-U.S. Fund | | | 2,427,114 | | | | 21,237 | |
| | | | | | | | |
| | | | | | | 42,407 | |
| | | | | | | | |
| | |
| Real Assets - 14.0% | | | | | | | | |
RIC Russell Commodity Strategies Fund Class Y | | | 700,695 | | | | 6,685 | |
RIC Russell Global Infrastructure Fund Class Y | | | 444,484 | | | | 4,476 | |
RIF Global Real Estate Securities Fund | | | 352,210 | | | | 4,455 | |
| | | | | | | | |
| | | | | | | 15,616 | |
| | | | | | | | |
| | |
Total Investments - 100.0%
(identified cost $111,118) | | | | | | | 111,505 | |
| | |
Other Assets and Liabilities,
Net - (0.0%) | | | | | | | (26 | ) |
| | | | | | | | |
| | |
| Net Assets - 100.0% | | | | | | | 111,479 | |
| | | | | | | | |
See accompanying notes which are an integral part of the financial statements.
Russell Investment Funds
Growth Strategy Fund
Presentation of Portfolio Holdings — December 31, 2011 (Unaudited)
| | | | |
| Categories | | % of Net
Assets | |
| | | | |
| | | | |
Domestic Equities | | | 29.0 | |
Fixed Income | | | 19.0 | |
International Equities | | | 38.0 | |
Real Assets | | | 14.0 | |
| | | | |
| |
Total Investments | | | 100.0 | |
Other Assets and Liabilities, Net | | | (— | )* |
| | | | |
| |
| | | 100.0 | |
| | | | |
| * | Less than .05% of net assets. |
See accompanying notes which are an integral part of the financial statements.
Russell Investment Funds
Equity Growth Strategy Fund
Portfolio Management Discussion and Analysis — December 31, 2011 (Unaudited)
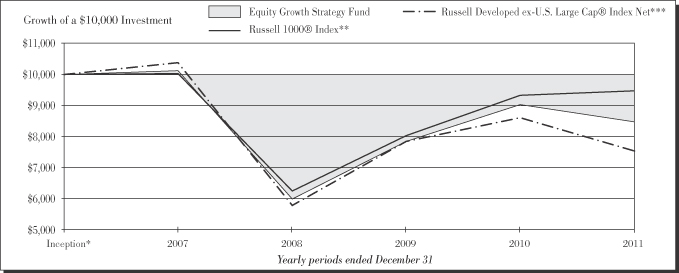
| | | | | | |
|
| Equity Growth Strategy Fund | |
| | | | | Total
Return | |
1 Year | | | | | (6.22 | )% |
Inception* | | | | | (3.49 | )%§ |
|
| Russell 1000® Index ** | |
| | | | | Total
Return | |
1 Year | | | | | 1.50 | % |
Inception* | | | | | (1.15 | )%§ |
|
| Russell Developed ex-U.S. Large Cap® Index Net *** | |
| | | | | Total
Return | |
1 Year | | | | | (12.35 | )% |
Inception* | | | | | (5.85 | )%§ |
| | | | |
| | 36 | | | Equity Growth Strategy Fund |
Russell Investment Funds
Equity Growth Strategy Fund
Portfolio Management Discussion and Analysis — December 31, 2011 (Unaudited)
The Fund is a fund of funds that invests in other Russell Investment Funds and Russell Investment Company mutual funds (the “Underlying Funds”). The Underlying Funds allocate most of their assets among multiple money managers. Russell Investment Management Company (“RIMCo”), as the Underlying Funds’ advisor, may change the allocation of the Underlying Funds’ assets among money managers at any time. An exemptive order from the Securities and Exchange Commission (“SEC”) permits RIMCo to engage or terminate a money manager in an Underlying Fund at any time, subject to approval by the Underlying Fund’s Board, without a shareholder vote.
What is the Fund’s investment objective?
The Equity Growth Strategy Fund (the “Fund”) seeks to provide high long-term capital appreciation.
How did the Fund perform relative to its benchmark for the fiscal year ended December 31, 2011?
For the fiscal year ended December 31, 2011, the Fund lost 6.22%. This is compared to the Fund’s benchmark, the Russell 1000® Index, which gained 1.50% during the same period.
For the fiscal year ended December 31, 2011, the Lipper® Global Core Funds Average, a group of funds that Lipper considers to have investment strategies similar to those of the Fund, lost 8.25 %. This result serves as a peer comparison and is expressed net of operating expenses.
The Fund’s performance includes operating expenses, whereas the Index returns are unmanaged and do not include expenses of any kind. The Fund’s underperformance relative to the Russell 1000® Index was due in part to the Fund’s relative exposure to active fixed income management and global investment mandates, which in the aggregate underperformed U.S. core equities.
How did the market conditions described in the Market Summary report affect the Fund’s performance?
The Fund is a fund of funds and its performance is based on RIMCo’s strategic asset allocations and the performance of the Underlying Funds in which the Fund invests.
As the fiscal year began with hopes for a continued economic recovery from the 2008 financial crisis, the Underlying Fund’s money managers took pro-recovery bets early in the fiscal year. This was evident in both equity managers that picked high-risk stocks relative to the benchmark in sectors such as financials and consumer discretionary as well as fixed income managers that chose riskier fixed income positions. However, as the year progressed, the market grew concerned with economic and political events within the United States, Europe and emerging markets. Money managers turned their focus on prudently reducing risk while also attempting to maintain exposure to factors that drive excess returns. This strategy allowed for strong returns beginning in October, as markets rallied through the end of the year.
One of the Underlying Funds (which are designed to represent individual asset classes) outperformed the Russell 1000® Index for the fiscal year. In the fixed income Underlying Funds, the Russell Global Opportunistic Credit Fund underperformed the Russell 1000® Index. This fund’s underperformance was due in part to its exposure to short duration bonds and emerging market currencies and an underweight to liquid high-yield issuers. The Russell Global Equity, Russell Emerging Markets and RIF Non-U.S. Funds underperformed the Fund’s benchmark due to macro-economic risk aversion that resulted in a flight from international countries with riskier markets to traditionally safe equities. In the U.S. equity Underlying Funds, the Russell U.S. Core Equity, RIF Multi-Style Equity and RIF Aggressive Equity Funds underperformed the Russell 1000® Index. These funds benefited from pro-recovery positions beginning in October 2011, which offset losses from earlier in the year, but underperformed the benchmark over the fiscal year due to exposure to stocks with higher betas. However, the Russell U.S. Quantitative Equity Fund outperformed the Russell 1000® Index due largely to gains in the fourth quarter, as the fund benefited from its ability to take advantage of the lowered factor correlations. Macro-economic fears caused a large real-estate pull back with limited consideration of net asset value differences across companies, sectors, countries and regions. This led to the Russell Global Real Estate Securities Fund underperforming the Fund’s benchmark. Similar macro-economic fears led to lower aggregate demand for real assets, which detracted from the performance of the Russell Global Infrastructure Fund and the Russell Commodity Strategies Fund. The Russell Global Infrastructure Fund lagged the Fund’s Index due to positions in Europe and emerging markets experiencing lower demand.
How did the investment strategies and techniques employed by the Fund and the money managers of the Underlying Funds affect the Fund’s performance?
The international equity Underlying Funds experienced high levels of volatility and all three funds underperformed the Fund’s Index. The Fund’s allocation to the RIF Non-U.S. Fund was 23%, the Russell Global Equity Fund was 14% and the Russell Emerging Markets Fund was 7% during the period. These funds’ investment strategies do not emphasize downside protection, risk aversion or defensiveness and their performance was negatively affected by macro-economic events, the weak performance of emerging markets and the resulting flight to safety. The RIF Non-U.S. Fund was not sufficiently defensive for a market environment marked by fear and skepticism, and its emphasis on companies with higher rates of earnings growth proved disadvantageous as general skepticism towards growth prospects weighed on share prices. The Russell Global Equity Fund suffered from stock selection within the energy, consumer discretionary and financials sectors.
The U.S. equity Underlying Funds were generally positioned aggressively. Though the U.S. equity market in the first and fourth quarters of the year exhibited traits representative of economic recovery, the general volatility over the fiscal year
| | |
| Equity Growth Strategy Fund | | 37 |
Russell Investment Funds
Equity Growth Strategy Fund
Portfolio Management Discussion and Analysis — December 31, 2011 (Unaudited)
and generally fearful market environment caused strong underperformance in aggressive equity strategies with only the Russell U.S. Quantitative Equity Fund outperforming the Fund’s benchmark. The Fund’s allocation to the RIF Multi-Style Equity Fund was 15%, the Russell U.S. Quantitative Equity Fund was 14% and the RIF Aggressive Equity Fund was 7% during the period. The RIF Multi-Style Equity Fund benefited from its pro-recovery positioning in early 2011, though despite the fund’s more defensive tactical positioning during the worst period of 2011, a remaining exposure to stocks with higher betas and stocks with more cyclical earnings patterns detracted from its performance in the second and third quarter as global recession fears grew. A partial recovery in the fourth quarter benefited the fund, but this was not enough to offset prior losses. The Russell U.S. Quantitative Equity Fund had a neutral exposure to risk and overweight exposure to quality, as the rotation by investors away from risk was accompanied by a rotation towards quality based factors (e.g., return on equity, return on assets and earnings stability). This rotation allowed the fund to make up losses incurred in the second and third quarters and helped it to outperform the Fund’s benchmark for the fiscal year. The RIF Aggressive Equity Fund benefited from its exposure to sectors such as producer durables and technology during early 2011, but as macroeconomic uncertainty increased in the second and third quarters of 2011, its lack of exposure to consumer staples and utilities was detrimental, as was stock selection in the financials sector.
The Fund’s allocation to the fixed income Underlying Funds during the fiscal year was 5% invested in the Russell Global Opportunistic Credit Fund. This fund underperformed the Fund’s benchmark. The Russell Global Opportunistic Credit Fund held riskier fixed income securities, which underperformed due to the macroeconomic pullback and European sovereign debt crisis.
The Fund’s allocation to real asset Underlying Funds during the fiscal year was 6% invested in the Russell Commodity Strategies Fund, 5% invested in the Russell Global Real Estate Securities Fund and 4% invested in the Russell Global Infrastructure Fund. All three funds underperformed the Fund’s benchmark, with the Russell Global Real Estate Securities Fund posting absolute negative returns and the other two posting absolute positive returns. Stock selection within the U.S., Hong Kong and Japan significantly detracted from the Russell Global Real Estate Securities Fund’s performance, as well as exposures to more cyclically-exposed sectors.
Describe any changes to the Fund’s structure or allocation to the Underlying Funds.
The Fund had no structure or allocation changes to the Underlying Funds during the fiscal year.
The views expressed in this report reflect those of the portfolio managers only through the end of the fiscal year covered by the report. These views do not necessarily represent the views of RIMCo, or any other person in RIMCo or any other affiliated organization. These views are subject to change at any time based upon market conditions or other events, and RIMCo disclaims any responsibility to update the views contained herein. These views should not be relied on as investment advice and, because investment decisions for a Russell Investment Fund (“RIF”) or Russell Investment Company (“RIC”) Fund are based on numerous factors, should not be relied on as an indication of investment decisions of any RIF or RIC Fund.
| * | | The Fund first issued shares on April 30, 2007. |
| ** | | Russell 1000® Index includes the 1,000 largest companies in the Russell 3000® Index. The Russell 1000® Index represents the universe of stocks from which most active money managers typically select. The Russell 1000® Index return reflects adjustments from income dividends and capital gain distributions reinvested as of the ex-dividend dates. |
| *** | | Russell Developed ex-U.S. Large Cap® Index (net of tax on dividends from foreign holdings) is an index which offers investors access to the large-cap segment of the global equity market, excluding companies assigned to the United States. It is constructed to provide a comprehensive and unbiased barometer for the large-cap segment and is completely reconstituted annually to accurately reflect the changes in the market over time. |
The performance shown in this section does not reflect any Insurance Company Separate Account or Policy Charges. Performance is historical and assumes reinvestment of all dividends and capital gains. Investment return and principal value will fluctuate so that an investor’s shares, when redeemed, may be worth more or less than when purchased. Past performance is not indicative of future results.
| | | | |
| | 38 | | | Equity Growth Strategy Fund |
Russell Investment Funds
Equity Growth Strategy Fund
Shareholder Expense Example — December 31, 2011 (Unaudited)
Fund Expenses
The following disclosure provides important information regarding each Fund’s Expense Example, which appears on each Fund’s individual page in this Annual Report. Please refer to this information when reviewing the Expense Example for a Fund.
Example
As a shareholder of the Fund, you incur two types of costs: (1) transaction costs, and (2) ongoing costs, including advisory fees and other Fund expenses. The Example is intended to help you understand your ongoing costs (in dollars) of investing in the Fund and to compare these costs with the ongoing costs of investing in other mutual funds. The Example is based on an investment of $1,000 invested at the beginning of the period and held for the entire period indicated, which for this Fund is from July 1, 2011 to December 31, 2011.
Actual Expenses
The information in the table under the heading “Actual Performance” provides information about actual account values and actual expenses. You may use the information in this column, together with the amount you invested, to estimate the expenses that you paid over the period. Simply divide your account value by $1,000 (for example, an $8,600 account value divided by $1,000 = 8.6), then multiply the result by the number in the first column in the row entitled “Expenses Paid During Period” to estimate the expenses you paid on your account during this period.
Hypothetical Example for Comparison Purposes
The information in the table under the heading “Hypothetical Performance (5% return before expenses)” provides information about hypothetical account values and hypothetical expenses based on the Fund’s actual expense ratio and an assumed rate of return of 5% per year before expenses, which is not the Fund’s actual return. The hypothetical account values and expenses may not be used to estimate the actual ending account balance or expenses you paid for the period. You may use this information to compare the ongoing costs of investing in the Fund and other funds. To do so, compare this 5% hypothetical example with the 5% hypothetical examples that appear in the shareholder reports of other funds.
Please note that the expenses shown in the table are meant to highlight your ongoing costs only and do not reflect any transactional costs. Therefore, the information under the heading “Hypothetical Performance (5% return before expenses)” is useful in comparing ongoing costs only, and will not help you determine the relative total costs of owning different funds. In addition, if these transactional costs were included, your costs would have been higher. The fee and expenses shown in this section do not reflect any Insurance Company Separate Account or Policy Charges.
| | | | | | | | |
| | | Actual
Performance | | | Hypothetical
Performance
(5% return
before expenses) | |
| | | | | | | | |
Beginning Account Value
| | | | | | | | |
July 1, 2011 | | $ | 1,000.00 | | | $ | 1,000.00 | |
Ending Account Value
| | | | | | | | |
December 31, 2011 | | $ | 891.20 | | | $ | 1,024.70 | |
Expenses Paid During Period* | | $ | 0 .48 | | | $ | 0.51 | |
| * | Expenses are equal to the Fund’s annualized expense ratio of 0.10% (representing the six month period annualized), multiplied by the average account value over the period, multiplied by 184/365 (to reflect the one-half year period). May reflect amounts waived, reimbursed and/or other credits. Without any waivers, reimbursements and/or other credits, expenses would have been higher. |
| | |
| Equity Growth Strategy Fund | | 39 |
Russell Investment Funds
Equity Growth Strategy Fund
Schedule of Investments — December 31, 2011
Amounts in thousands (except share amounts)
| | | | | | | | |
| | | Shares | | | Market
Value
$ | |
| | | | | | | | |
| Investments - 100.0% | | | | | | | | |
Russell Investment Company (“RIC”) and other Russell Investment Funds (“RIF”) Series Mutual Funds | | | | | | | | |
| | |
| Domestic Equities - 36.0% | | | | | | | | |
RIC Russell U.S. Quantitative Equity Fund Class Y | | | 146,276 | | | | 4,333 | |
RIF Aggressive Equity Fund | | | 190,165 | | | | 2,160 | |
RIF Multi-Style Equity Fund | | | 349,588 | | | | 4,629 | |
| | | | | | | | |
| | | | | | | 11,122 | |
| | | | | | | | |
| | |
| Fixed Income - 5.0% | | | | | | | | |
RIC Russell Global Opportunistic Credit Fund Class Y | | | 159,228 | | | | 1,540 | |
| | | | | | | | |
| | |
| International Equities - 44.0% | | | | | | | | |
RIC Russell Emerging Markets Fund Class Y | | | 133,146 | | | | 2,147 | |
RIC Russell Global Equity Fund Class Y | | | 539,718 | | | | 4,318 | |
RIF Non-U.S. Fund | | | 810,863 | | | | 7,095 | |
| | | | | | | | |
| | | | | | | 13,560 | |
| | | | | | | | |
| | |
| Real Assets - 15.0% | | | | | | | | |
RIC Russell Commodity Strategies Fund Class Y | | | 193,189 | | | | 1,843 | |
RIC Russell Global Infrastructure Fund Class Y | | | 123,393 | | | | 1,242 | |
RIF Global Real Estate Securities Fund | | | 122,344 | | | | 1,548 | |
| | | | | | | | |
| | | | | | | 4,633 | |
| | | | | | | | |
| | |
Total Investments - 100.0%
(identified cost $29,245) | | | | | | | 30,855 | |
| | |
Other Assets and Liabilities, Net - (0.0%) | | | | | | | (10 | ) |
| | | | | | | | |
| | |
| Net Assets - 100.0% | | | | | | | 30,845 | |
| | | | | | | | |
See accompanying notes which are an integral part of the financial statements.
| | | | |
| | 40 | | | Equity Growth Strategy Fund |
Russell Investment Funds
Equity Growth Strategy Fund
Presentation of Portfolio Holdings — December 31, 2011 (Unaudited)
| | | | |
| Categories | | % of Net
Assets | |
| | | | |
| | | | |
Domestic Equities | | | 36.0 | |
Fixed Income | | | 5.0 | |
International Equities | | | 44.0 | |
Real Assets | | | 15.0 | |
| | | | |
| |
Total Investments | | | 100.0 | |
Other Assets and Liabilities, Net | | | (— | )* |
| | | | |
| |
| | | 100.0 | |
| | | | |
| * | Less than .05% of net assets. |
See accompanying notes which are an integral part of the financial statements.
| | |
| Equity Growth Strategy Fund | | 41 |
Russell Investment Funds
LifePoints® Funds Variable Target Portfolio Series
Statements of Assets and Liabilities — December 31, 2011
| | | | | | | | |
| Amounts in thousands | | Conservative Strategy
Fund | | | Moderate Strategy
Fund | |
| | | | | | | | |
Assets | | | | | | | | |
Investments, at identified cost | | $ | 1,011 | | | $ | 71,993 | |
Investments, at market | | | 997 | | | | 75,071 | |
Receivables: | | | | | | | | |
Investments sold | | | — | | | | 4 | |
Fund shares sold | | | — | | | | 2 | |
From affiliates | | | — | | | | — | |
| | | | | | | | |
Total assets | | | 997 | | | | 75,077 | |
| | | | | | | | |
| | |
Liabilities | | | | | | | | |
Payables: | | | | | | | | |
Investments purchased | | | — | | | | — | |
Fund shares redeemed | | | — | | | | 6 | |
Accrued fees to affiliates | | | 9 | | | | 7 | |
Other accrued expenses | | | 14 | | | | 8 | |
Income distribution | | | — | | | | — | |
| | | | | | | | |
Total liabilities | | | 23 | | | | 21 | |
| | | | | | | | |
| | | | | | | | |
Net Assets | | $ | 974 | | | $ | 75,056 | |
| | | | | | | | |
Net Assets Consist of: | | | | | | | | |
Undistributed (overdistributed) net investment income | | $ | — | | | $ | 100 | |
Accumulated net realized gain (loss) | | | 5 | | | | (2,848 | ) |
Unrealized appreciation (depreciation) on investments | | | (14 | ) | | | 3,078 | |
Shares of beneficial interest | | | 1 | | | | 80 | |
Additional paid-in capital | | | 982 | | | | 74,646 | |
| | | | | | | | |
Net Assets | | $ | 974 | | | $ | 75,056 | |
| | | | | | | | |
Net Asset Value, offering and redemption price per share: | | | | | | | | |
Net asset value per share:(a) | | $ | 9 .59 | | | $ | 9 .41 | |
Net assets | | $ | 973,796 | | | $ | 75,056,476 | |
Shares outstanding ($.01 par value) | | | 101,578 | | | | 7,972,899 | |
| (a) | Net asset value per share equals net assets divided by shares of beneficial interest outstanding. |
See accompanying notes which are an integral part of the financial statements.
| | | | |
| | 42 | | | Statements of Assets and Liabilities |
| | | | | | | | | | |
Balanced Strategy
Fund | | | Growth Strategy
Fund | | | Equity Growth
Strategy Fund | |
| | | | | | | | | | |
| $ | 197,030 | | | $ | 111,118 | | | $ | 29,245 | |
| | 201,108 | | | | 111,505 | | | | 30,855 | |
| | | | | | | | | | |
| | — | | | | — | | | | — | |
| | 263 | | | | 105 | | | | 31 | |
| | — | | | | — | | | | 2 | |
| | | | | | | | | | |
| | 201,371 | | | | 111,610 | | | | 30,888 | |
| | | | | | | | | | |
| | |
| | | | | | | | | | |
| | | | | | | | | | |
| | 263 | | | | 106 | | | | 32 | |
| | — | | | | — | | | | — | |
| | 27 | | | | 13 | | | | 1 | |
| | 12 | | | | 11 | | | | 10 | |
| | — | | | | 1 | | | | — | |
| | | | | | | | | | |
| | 302 | | | | 131 | | | | 43 | |
| | | | | | | | | | |
| | | | | | | | | | |
| $ | 201,069 | | | $ | 111,479 | | | $ | 30,845 | |
| | | | | | | | | | |
| | | | | | | | | | |
| $ | 172 | | | $ | 64 | | | $ | 41 | |
| | (7,784 | ) | | | (6,261 | ) | | | (5,515 | ) |
| | 4,078 | | | | 387 | | | | 1,610 | |
| | 232 | | | | 139 | | | | 43 | |
| | 204,371 | | | | 117,150 | | | | 34,666 | |
| | | | | | | | | | |
| $ | 201,069 | | | $ | 111,479 | | | $ | 30,845 | |
| | | | | | | | | | |
| | | | | | | | | | |
| $ | 8 .66 | | | $ | 8 .01 | | | $ | 7 .22 | |
| $ | 201,069,015 | | | $ | 111,479,467 | | | $ | 30,845,373 | |
| | 23,217,252 | | | | 13,919,245 | | | | 4,272,838 | |
See accompanying notes which are an integral part of the financial statements.
| | |
| Statements of Assets and Liabilities | | 43 |
Russell Investment Funds
LifePoints® Funds Variable Target Portfolio Series
Statements of Operations — For the Period Ended December 31, 2011
| | | | | | | | |
| Amounts in thousands | | Conservative Strategy
Fund* | | | Moderate Strategy
Fund | |
| | | | | | | | |
Investment Income | | | | | | | | |
Income distribution from Underlying Funds | | $ | 11 | | | $ | 1,911 | |
| | | | | | | | |
| | |
Expenses | | | | | | | | |
Advisory fees | | | — | ** | | | 132 | |
Administrative fees | | | — | ** | | | 33 | |
Custodian fees | | | 10 | | | | 23 | |
Transfer agent fees | | | — | ** | | | 3 | |
Professional fees | | | 22 | | | | 31 | |
Trustees’ fees | | | — | ** | | | 1 | |
Printing fees | | | 3 | | | | 11 | |
Miscellaneous | | | 7 | | | | 13 | |
| | | | | | | | |
Expenses before reductions | | | 42 | | | | 247 | |
Expense reductions | | | (42 | ) | | | (180 | ) |
| | | | | | | | |
Net expenses | | | — | ** | | | 67 | |
| | | | | | | | |
Net investment income (loss) | | | 11 | | | | 1,844 | |
| | | | | | | | |
| | |
Net Realized and Unrealized Gain (Loss) | | | | | | | | |
Net realized gain (loss) on: | | | | | | | | |
Investments | | | — | | | | (308 | ) |
Capital gain distributions from Underlying Funds | | | 5 | | | | 504 | |
| | | | | | | | |
Net realized gain (loss) | | | 5 | | | | 196 | |
Net change in unrealized appreciation (depreciation) on investments | | | (14 | ) | | | (2,125 | ) |
| | | | | | | | |
Net realized and unrealized gain (loss) | | | (9 | ) | | | (1,929 | ) |
| | | | | | | | |
Net Increase (Decrease) in Net Assets from Operations | | $ | 2 | | | $ | (85 | ) |
| | | | | | | | |
| * | For the period May 3, 2011 (commencement of operations) to December 31, 2011. |
See accompanying notes which are an integral part of the financial statements.
| | | | |
| | 44 | | | Statements of Operations |
| | | | | | | | | | |
Balanced Strategy
Fund | | | Growth Strategy
Fund | | | Equity Growth
Strategy Fund | |
| | | | | | | | | | |
| | | | | | | | | | |
| $ | 4,592 | | | $ | 2,219 | | | $ | 544 | |
| | | | | | | | | | |
| | |
| | | | | | | | | | |
| | 373 | | | | 209 | | | | 60 | |
| | 93 | | | | 52 | | | | 15 | |
| | 22 | | | | 23 | | | | 23 | |
| | 8 | | | | 5 | | | | 1 | |
| | 38 | | | | 32 | | | | 28 | |
| | 4 | | | | 2 | | | | 1 | |
| | 30 | | | | 19 | | | | 7 | |
| | 16 | | | | 14 | | | | 12 | |
| | | | | | | | | | |
| | 584 | | | | 356 | | | | 147 | |
| | (402 | ) | | | (251 | ) | | | (117 | ) |
| | | | | | | | | | |
| | 182 | | | | 105 | | | | 30 | |
| | | | | | | | | | |
| | 4,410 | | | | 2,114 | | | | 514 | |
| | | | | | | | | | |
| | |
| | | | | | | | | | |
| | | | | | | | | | |
| | (401 | ) | | | (414 | ) | | | (179 | ) |
| | 1,262 | | | | 452 | | | | 88 | |
| | | | | | | | | | |
| | 861 | | | | 38 | | | | (91 | ) |
| | (10,967 | ) | | | (7,848 | ) | | | (2,499 | ) |
| | | | | | | | | | |
| | (10,106 | ) | | | (7,810 | ) | | | (2,590 | ) |
| | | | | | | | | | |
| $ | (5,696 | ) | | $ | (5,696 | ) | | $ | (2,076 | ) |
| | | | | | | | | | |
See accompanying notes which are an integral part of the financial statements.
| | |
| Statements of Operations | | 45 |
Russell Investment Funds
LifePoints® Funds Variable Target Portfolio Series
Statements of Changes in Net Assets — For the Periods Ended December 31,
| | | | | | | | | | | | |
| | | Conservative Strategy
Fund | | | Moderate Strategy
Fund | |
| Amounts in thousands | | 2011* | | | 2011 | | | 2010 | |
| | | | | | | | | | | | |
Increase (Decrease) in Net Assets | | | | | | | | | | | | |
| | | |
Operations | | | | | | | | | | | | |
Net investment income (loss) | | $ | 11 | | | $ | 1,844 | | | $ | 1,990 | |
Net realized gain (loss) | | | 5 | | | | 196 | | | | (343 | ) |
Net change in unrealized appreciation (depreciation) | | | (14 | ) | | | (2,125 | ) | | | 3,733 | |
| | | | | | | | | | | | |
Net increase (decrease) in net assets from operations | | | 2 | | | | (85 | ) | | | 5,380 | |
| | | | | | | | | | | | |
| | | |
Distributions | | | | | | | | | | | | |
From net investment income | | | (11 | ) | | | (1,745 | ) | | | (2,054 | ) |
From return of capital | | | — | | | | — | | | | (74 | ) |
| | | | | | | | | | | | |
Net decrease in net assets from distributions | | | (11 | ) | | | (1,745 | ) | | | (2,128 | ) |
| | | | | | | | | | | | |
| | | |
Share Transactions | | | | | | | | | | | | |
Net increase (decrease) in net assets from share transactions | | | 983 | | | | 22,313 | | | | 15,650 | |
| | | | | | | | | | | | |
Total Net Increase (Decrease) in Net Assets | | | 974 | | | | 20,483 | | | | 18,902 | |
| | | |
Net Assets | | | | | | | | | | | | |
Beginning of period | | | — | | | | 54,573 | | | | 35,671 | |
| | | | | | | | | | | | |
End of period | | $ | 974 | | | $ | 75,056 | | | $ | 54,573 | |
| | | | | | | | | | | | |
Undistributed (overdistributed) net investment income included in net assets | | $ | — | | | $ | 100 | | | $ | — | |
| * | For the period May 3, 2011 (commencement of operations) to December 31, 2011. |
See accompanying notes which are an integral part of the financial statements.
| | | | |
| | 46 | | | Statements of Changes in Net Assets |
| | | | | | | | | | | | | | | | | | | | | | |
Balanced Strategy
Fund | | | Growth Strategy
Fund | | | Equity Growth Strategy
Fund | |
| 2011 | | | 2010 | | | 2011 | | | 2010 | | | 2011 | | | 2010 | |
| | | | | | | | | | | | | | | | | | | | | | |
| | | | | | | | | | | | | | | | | | | | | | |
| | | | | |
| | | | | | | | | | | | | | | | | | | | | | |
| $ | 4,410 | | | $ | 4,694 | | | $ | 2,114 | | | $ | 2,079 | | | $ | 514 | | | $ | 439 | |
| | 861 | | | | (3,974 | ) | | | 38 | | | | (4,197 | ) | | | (91 | ) | | | (1,885 | ) |
| | (10,967 | ) | | | 16,989 | | | | (7,848 | ) | | | 13,165 | | | | (2,499 | ) | | | 4,841 | |
| | | | | | | | | | | | | | | | | | | | | | |
| | (5,696 | ) | | | 17,709 | | | | (5,696 | ) | | | 11,047 | | | | (2,076 | ) | | | 3,395 | |
| | | | | | | | | | | | | | | | | | | | | | |
| | | | | |
| | | | | | | | | | | | | | | | | | | | | | |
| | (4,238 | ) | | | (4,867 | ) | | | (2,051 | ) | | | (2,140 | ) | | | (473 | ) | | | (480 | ) |
| | — | | | | (284 | ) | | | — | | | | (131 | ) | | | — | | | | (198 | ) |
| | | | | | | | | | | | | | | | | | | | | | |
| | (4,238 | ) | | | (5,151 | ) | | | (2,051 | ) | | | (2,271 | ) | | | (473 | ) | | | (678 | ) |
| | | | | | | | | | | | | | | | | | | | | | |
| | | | | |
| | | | | | | | | | | | | | | | | | | | | | |
| | 53,881 | | | | 39,379 | | | | 28,634 | | | | 20,310 | | | | 6,578 | | | | 4,042 | |
| | | | | | | | | | | | | | | | | | | | | | |
| | 43,947 | | | | 51,937 | | | | 20,887 | | | | 29,086 | | | | 4,029 | | | | 6,759 | |
| | | | | |
| | | | | | | | | | | | | | | | | | | | | | |
| | 157,122 | | | | 105,185 | | | | 90,592 | | | | 61,506 | | | | 26,816 | | | | 20,057 | |
| | | | | | | | | | | | | | | | | | | | | | |
| $ | 201,069 | | | $ | 157,122 | | | $ | 111,479 | | | $ | 90,592 | | | $ | 30,845 | | | $ | 26,816 | |
| | | | | | | | | | | | | | | | | | | | | | |
| $ | 172 | | | $ | — | | | $ | 64 | | | $ | — | | | $ | 41 | | | $ | — | |
See accompanying notes which are an integral part of the financial statements.
| | |
| Statements of Changes in Net Assets | | 47 |
Russell Investment Funds
LifePoints® Funds Variable Target Portfolio Series
Financial Highlights — For the Periods Ended
For a Share Outstanding Throughout the Period.
| | | | | | | | | | | | | | | | | | | | | | | | | | | | |
| | |
$
Net Asset Value,
Beginning of
Period | | | $
Net
Investment
Income (Loss)(a)(b) | | | $
Net Realized
and Unrealized
Gain (Loss) | | | $
Total from
Investment
Operations | | | $
Distributions
from Net
Investment Income | | | $
Distributions
from Net
Realized Gain | | | $
Return of
Capital | |
Conservative Strategy Fund | | | | | |
December 31, 2011(1) | | | 10.00 | | | | .29 | | | | (.49 | ) | | | (.20 | ) | | | (.21 | ) | | | — | (g) | | | — | |
Moderate Strategy Fund | | | | | |
December 31, 2011 | | | 9.64 | | | | .27 | | | | (.26 | ) | | | .01 | | | | (.24 | ) | | | — | | | | — | |
December 31, 2010 | | | 8.95 | | | | .42 | | | | .69 | | | | 1.11 | | | | (.41 | ) | | | — | | | | (.01 | ) |
December 31, 2009 | | | 7.67 | | | | .36 | | | | 1.34 | | | | 1.70 | | | | (.37 | ) | | | (.05 | ) | | | — | |
December 31, 2008 | | | 9.99 | | | | .33 | | | | (2.32 | ) | | | (1.99 | ) | | | (.23 | ) | | | (.10 | ) | | | — | |
December 31, 2007(2) | | | 10.00 | | | | .46 | | | | (.11 | ) | | | .35 | | | | (.36 | ) | | | — | (g) | | | — | |
Balanced Strategy Fund | | | | | |
December 31, 2011 | | | 9.07 | | | | .21 | | | | (.42 | ) | | | (.21 | ) | | | (.20 | ) | | | — | | | | — | |
December 31, 2010 | | | 8.25 | | | | .31 | | | | .84 | | | | 1.15 | | | | (.31 | ) | | | — | | | | (.02 | ) |
December 31, 2009 | | | 6.80 | | | | .26 | | | | 1.47 | | | | 1.73 | | | | (.24 | ) | | | (.04 | ) | | | — | |
December 31, 2008 | | | 9.93 | | | | .23 | | | | (2.88 | ) | | | (2.65 | ) | | | (.21 | ) | | | (.27 | ) | | | — | |
December 31, 2007(2) | | | 10.00 | | | | .47 | | | | (.20 | ) | | | .27 | | | | (.34 | ) | | | — | (g) | | | — | |
Growth Strategy Fund | | | | | | | | | | | | | | | | | | | | | | | | | |
December 31, 2011 | | | 8.57 | | | | .17 | | | | (.57 | ) | | | (.40 | ) | | | (.16 | ) | | | — | | | | — | |
December 31, 2010 | | | 7.66 | | | | .23 | | | | .91 | | | | 1.14 | | | | (.22 | ) | | | — | | | | (.01 | ) |
December 31, 2009 | | | 6.11 | | | | .19 | | | | 1.56 | | | | 1.75 | | | | (.17 | ) | | | (.03 | ) | | | — | |
December 31, 2008 | | | 9.90 | | | | .15 | | | | (3.46 | ) | | | (3.31 | ) | | | (.14 | ) | | | (.34 | ) | | | — | |
December 31, 2007(2) | | | 10.00 | | | | .45 | | | | (.24 | ) | | | .21 | | | | (.31 | ) | | | — | | | | — | |
Equity Growth Strategy Fund | | | | | | | | | | | | | | | | | | | | | | | | | |
December 31, 2011 | | | 7.82 | | | | .13 | | | | (.61 | ) | | | (.48 | ) | | | (.12 | ) | | | — | | | | — | |
December 31, 2010 | | | 6.98 | | | | .14 | | | | .91 | | | | 1.05 | | | | (.15 | ) | | | — | | | | (.06 | ) |
December 31, 2009 | | | 5.42 | | | | .12 | | | | 1.56 | | | | 1.68 | | | | (.09 | ) | | | (.03 | ) | | | — | |
December 31, 2008 | | | 9.83 | | | | .07 | | | | (3.92 | ) | | | (3.85 | ) | | | (.05 | ) | | | (.51 | ) | | | — | |
December 31, 2007(2) | | | 10.00 | | | | .50 | | | | (.38 | ) | | | .12 | | | | (.29 | ) | | | — | | | | — | |
See accompanying notes which are an integral part of the financial statements.
| | | | | | | | | | | | | | | | | | | | | | | | | | | | | | |
$
Total
Distributions | | | $
Net Asset Value,
End of
Period | | | %
Total
Return(c)(h) | | | $
Net Assets,
End of Period
(000) | | | %
Ratio of Expenses
to Average
Net Assets,
Gross(d)(e) | | | %
Ratio of Expenses
to Average
Net Assets,
Net(d)(e)(f) | | | %
Ratio of Net
Investment Income
to Average
Net Assets(c)(f) | | | %
Portfolio
Turnover Rate(c) | |
| | | | | | | | | | | | | | | | | | | | | | | | | | | | | | |
| | (.21 | ) | | | 9.59 | | | | (1.96 | ) | | | 974 | | | | 18.39 | | | | .10 | | | | 3.10 | | | | 5 | |
| | | | | | | | | | | | | | | | | | | | | | | | | | | | | | |
| | (.24 | ) | | | 9.41 | | | | .12 | | | | 75,056 | | | | .38 | | | | .10 | | | | 2.80 | | | | 10 | |
| | (.42 | ) | | | 9.64 | | | | 12.62 | | | | 54,573 | | | | .44 | | | | .10 | | | | 4.56 | | | | 45 | |
| | (.42 | ) | | | 8.95 | | | | 23.09 | | | | 35,671 | | | | .48 | | | | .10 | | | | 4.40 | | | | 21 | |
| | (.33 | ) | | | 7.67 | | | | (20.39 | ) | | | 19,308 | | | | .53 | | | | .11 | | | | 3.77 | | | | 39 | |
| | (.36 | ) | | | 9.99 | | | | 3.54 | | | | 8,654 | | | | 2.01 | | | | .11 | | | | 5.37 | | | | 24 | |
| | | | | | | | | | | | | | | | | | | | | | | | | | | | | | |
| | (.20 | ) | | | 8.66 | | | | (2.40 | ) | | | 201,069 | | | | .31 | | | | .10 | | | | 2.36 | | | | 8 | |
| | (.33 | ) | | | 9.07 | | | | 14.06 | | | | 157,122 | | | | .36 | | | | .10 | | | | 3.67 | | | | 23 | |
| | (.28 | ) | | | 8.25 | | | | 26.23 | | | | 105,185 | | | | .35 | | | | .09 | | | | 3.62 | | | | 8 | |
| | (.48 | ) | | | 6.80 | | | | (27.70 | ) | | | 60,158 | | | | .35 | | | | .08 | | | | 2.75 | | | | 16 | |
| | (.34 | ) | | | 9.93 | | | | 2.73 | | | | 35,697 | | | | .74 | | | | .08 | | | | 5.37 | | | | 11 | |
| | | | | | | | | | | | | | | | | | | | | | | | | | | | | | |
| | (.16 | ) | | | 8.01 | | | | (4.73 | ) | | | 111,479 | | | | .34 | | | | .10 | | | | 2.02 | | | | 10 | |
| | (.23 | ) | | | 8.57 | | | | 15.06 | | | | 90,592 | | | | .39 | | | | .10 | | | | 2.88 | | | | 29 | |
| | (.20 | ) | | | 7.66 | | | | 29.43 | | | | 61,506 | | | | .40 | | | | .09 | | | | 2.80 | | | | 6 | |
| | (.48 | ) | | | 6.11 | | | | (34.73 | ) | | | 34,742 | | | | .40 | | | | .04 | | | | 1.85 | | | | 10 | |
| | (.31 | ) | | | 9.90 | | | | 2.13 | | | | 27,390 | | | | .84 | | | | .04 | | | | 5.05 | | | | 3 | |
| | | | | | | | | | | | | | | | | | | | | | | | | | | | | | |
| | (.12 | ) | | | 7.22 | | | | (6.22 | ) | | | 30,845 | | | | .49 | | | | .10 | | | | 1.72 | | | | 15 | |
| | (.21 | ) | | | 7.82 | | | | 15.09 | | | | 26,816 | | | | .53 | | | | .10 | | | | 1.89 | | | | 42 | |
| | (.12 | ) | | | 6.98 | | | | 31.79 | | | | 20,057 | | | | .59 | | | | .08 | | | | 2.02 | | | | 21 | |
| | (.56 | ) | | | 5.42 | | | | (41.18 | ) | | | 12,613 | | | | .58 | | | | .04 | | | | .87 | | | | 24 | |
| | (.29 | ) | | | 9.83 | | | | 1.25 | | | | 13,006 | | | | 1.36 | | | | .04 | | | | 5.59 | | | | 6 | |
See accompanying notes which are an integral part of the financial statements.
Russell Investment Funds
LifePoints® Funds Variable Target Portfolio Series
Notes to Financial Highlights – December 31, 2011
| (1) | For the period May 3, 2011 (commencement of operations) to December 31, 2011. |
| (2) | For the period May 1, 2007 (commencement of operations) to December 31, 2007. |
| (a) | Average daily shares outstanding were used for this calculation. |
| (b) | Recognition of net investment income by the Fund is affected by the timing of the declaration of dividends by the Underlying Funds in which the Fund invests. |
| (c) | Periods less than one year are not annualized. |
| (d) | The ratios for periods less than one year are annualized. |
| (e) | The calculation includes only those expenses charged directly to the Fund and does not include expenses charged to the Underlying Funds in which the Fund invests. |
| (f) | May reflect amounts waived and reimbursed by Russell Investment Management Company (“RIMCo”) and Russell Fund Services Company (“RFSC”). |
| (g) | Less than $.01 per share. |
| (h) | The total return does not reflect any Insurance Company Separate Account or Policy Charges. |
See accompanying notes which are an integral part of the financial statements.
| | | | |
| | 50 | | | Notes to Financial Highlights |
Russell Investment Funds
LifePoints® Funds Variable Target Portfolio Series
Notes to Financial Statements — December 31, 2011
Russell Investment Funds (the “Investment Company” or “RIF”) is a series investment company with 10 different investment portfolios referred to as Funds. These financial statements report on five of these Funds (each a “Fund” and collectively the “Funds”). The Investment Company provides the investment base for one or more variable insurance products issued by one or more insurance companies. These Funds are offered at net asset value to qualified insurance company separate accounts offering variable insurance products. The Investment Company is registered under the Investment Company Act of 1940, as amended, as an open-end management investment company. It is organized and operated as a Massachusetts business trust under an Amended and Restated Master Trust Agreement dated October 1, 2008 (“Master Trust Agreement”) as amended. The Investment Company’s Master Trust Agreement permits the Board of Trustees (the “Board”) to issue an unlimited number of shares of beneficial interest.
The Funds seek to achieve their objective by investing in a combination of Russell Investment Company (“RIC”) Funds and other of the Investment Company’s Funds (together, the “Underlying Funds”) as set forth in the table below. Russell Investment Management Company (“RIMCo”) the Funds’ investment adviser, may modify the target asset allocation for any Fund and/or the Underlying Funds in which the Funds invest from time to time based on capital markets research or on factors such as RIMCo’s outlook for the economy, financial markets generally and/or relative market valuation of the asset classes represented by each Underlying Fund. Modifications in the allocations to the Underlying Funds are typically based on strategic, long-term allocation decisions. A Fund’s actual allocation may vary from the target strategic asset allocation at any point in time (1) due to market movements, (2) by up to +/- 3% at the equities, fixed income or real asset category level based on RIMCo’s assessment of relative market valuation of the asset classes represented by each Underlying Fund, (3) due to the implementation over a period of time of a change to the target strategic asset allocation including the addition of a new Underlying Fund. There may be no changes in the asset allocation or to the Underlying Funds in a given year or such changes may be made one or more times in a year. In the future, the Funds may also invest in other Underlying Funds that pursue investment strategies not pursued by the current Underlying Funds or represent asset classes which are not currently represented by the Underlying Funds.
| | | | | | | | | | | | | | | | | | | | |
| | | Asset Allocation Targets as of May 1, 2011* | |
| Underlying Funds | | Conservative
Strategy Fund | | | Moderate
Strategy Fund | | | Balanced
Strategy Fund | | | Growth
Strategy Fund | | | Equity Growth
Strategy Fund | |
Domestic Equity Funds | | | | | | | | | | | | | | | | | | | | |
RIF Aggressive Equity Fund | | | 0 | % | | | 0-7 | % | | | 0-9 | % | | | 1-11 | % | | | 2-12 | % |
RIF Multi-Style Equity Fund | | | 0-8 | | | | 0-10 | | | | 5-15 | | | | 7-17 | | | | 10-20 | |
RIC Russell U.S. Quantitative Equity Fund Class Y | | | 0-8 | | | | 1-11 | | | | 4-14 | | | | 6-16 | | | | 9-19 | |
Fixed Income Funds | | | | | | | | | | | | | | | | | | | | |
RIF Core Bond Fund | | | 33-43 | | | | 31-41 | | | | 30-40 | | | | 10-20 | | | | 0 | |
RIC Russell Global Opportunistic Credit Fund Class Y | | | 0-7 | | | | 0-7 | | | | 0-8 | | | | 0-9 | | | | 0-10 | |
RIC Russell Investment Grade Bond Fund Class Y | | | 15-25 | | | | 15-25 | | | | 0 | | | | 0 | | | | 0 | |
RIC Russell Short Duration Bond Fund Class Y | | | 13-23 | | | | 0 | | | | 0 | | | | 0 | | | | 0 | |
International Equity Funds | | | | | | | | | | | | | | | | | | | | |
RIF Non-U.S. Fund | | | 0-10 | | | | 4-14 | | | | 10-20 | | | | 14-24 | | | | 18-28 | |
RIC Russell Emerging Markets Fund Class Y | | | 0 | | | | 0-8 | | | | 0-9 | | | | 0-10 | | | | 2-12 | |
RIC Russell Global Equity Fund Class Y | | | 0-10 | | | | 3-13 | | | | 5-15 | | | | 9-19 | | | | 9-19 | |
Real Asset Funds | | | | | | | | | | | | | | | | | | | | |
RIF Global Real Estate Securities Fund | | | 0-7 | | | | 0-8 | | | | 0-8 | | | | 0-9 | | | | 0-10 | |
RIC Russell Commodity Strategies Fund Class Y | | | 0-7 | | | | 0-8 | | | | 0-9 | | | | 1-11 | | | | 1-11 | |
RIC Russell Global Infrastructure Fund Class Y | | | 0-7 | | | | 0-8 | | | | 0-8 | | | | 0-9 | | | | 0-9 | |
| | * | Prospectus dated May 1, 2011, as supplemented through December 20, 2011. |
| 2. | | Significant Accounting Policies |
The Funds’ financial statements are prepared in accordance with U.S. generally accepted accounting principles (“U.S. GAAP”) which require the use of management estimates and assumptions at the date of the financial statements. Actual results could differ from those estimates. The following is a summary of the significant accounting policies consistently followed by each Fund in the preparation of its financial statements.
Security Valuation
The Funds value their portfolio securities, the shares of the Underlying Funds, at the current net asset value per share of each Underlying Fund.
| | |
| Notes to Financial Statements | | 51 |
Russell Investment Funds
LifePoints® Funds Variable Target Portfolio Series
Notes to Financial Statements, continued — December 31, 2011
Fair value of securities is defined as the price that the Funds would receive upon selling an investment in a timely transaction to an independent buyer in the principal or most advantageous market of the investment. To increase consistency and comparability in fair value measurement, the fair value hierarchy was established to maximize the use of observable market data and minimize the use of unobservable inputs and to establish classification of fair value measurements for disclosure purposes. Inputs refer broadly to the assumptions that market participants would use in pricing the asset, including assumptions about risk, (e.g., the risk inherent in a particular valuation technique, such as a pricing model or the risks inherent in the inputs to a particular valuation technique). Inputs may be observable or unobservable. Observable inputs are inputs that reflect the assumptions market participants would use in pricing the asset or liability developed based on market data obtained from sources independent of the reporting entity. Unobservable inputs are inputs that reflect the reporting entity’s own assumptions about the assumptions market participants would use in pricing the asset or liability developed based on the best information available in the circumstances.
The fair value hierarchy of inputs is summarized in the three broad levels listed below.
Level 1 — quoted prices (unadjusted) in active markets for identical investments.
Level 2 — other significant observable inputs including quoted market prices in non-active markets or prices derived from market data.
Level 3 — significant unobservable inputs including the Fund’s own assumptions in determining the fair value of investments.
The levels associated with valuing the Funds’ investments for the period ended December 31, 2011 were Level 1 for all Funds.
Investment Transactions
Investment transactions are reflected as of the trade date for financial reporting purposes. This may cause the net asset value stated in the financial statements to be different from the net asset value at which shareholders may transact. Realized gains and losses from securities transactions, if any, are recorded on the basis of specific identified cost.
Investment Income
Distributions of income and capital gains from the Underlying Funds are recorded on the ex-dividend date.
Federal Income Taxes
Since the Investment Company is a Massachusetts business trust, each Fund is a separate corporate taxpayer and determines its net investment income and capital gains (or losses) and the amounts to be distributed to each Fund’s shareholders without regard to the income and capital gains (or losses) of the other Funds.
Each Fund qualifies as a regulated investment company and distributes all of its taxable income and capital gains. Therefore, no federal income tax provision was required for the Funds.
Each Fund files a U. S. tax return. At December 31, 2011, the Funds have recorded no liabilities for net unrecognized tax benefits relating to uncertain income tax positions they have taken or expect to take in future tax returns. While the statute of limitations remains open to examine the Funds’ U.S. tax returns filed for the fiscal years ending December 31, 2008 through December 31, 2010, no examinations are in progress or anticipated at this time. The Funds are not aware of any tax positions for which it is reasonably possible that the total amounts of unrecognized tax benefits will significantly change in the next twelve months.
The Funds comply with the authoritative guidance for uncertainty in income taxes which requires management to determine whether a tax position of the Funds is more likely than not to be sustained upon examination, including resolution of any related appeals or litigation processes, based on the technical merits of the position. For tax positions meeting the more likely than not threshold, the tax amount recognized in the financial statements is reduced by the largest benefit that has a greater than 50% likelihood of being realized upon ultimate settlement with the relevant taxing authority. Management determined that no accruals need to be made in the financial statements due to uncertain tax positions. Management continually reviews and adjusts its liability for income taxes based on analyses of tax laws and regulations, as well as their interpretations, and other relevant factors.
Dividends and Distributions to Shareholders
Income dividends, capital gain distributions and return of capital, if any, are recorded on the ex-dividend date. Income dividends are generally declared and paid quarterly. Capital gain distributions are generally declared and paid annually. An additional distribution may be paid by the Funds to avoid imposition of federal income and excise tax on any remaining undistributed capital gains and net investment income.
| | | | |
| | 52 | | | Notes to Financial Statements |
Russell Investment Funds
LifePoints® Funds Variable Target Portfolio Series
Notes to Financial Statements, continued — December 31, 2011
The timing and characterization of certain income and capital gain distributions are determined in accordance with federal tax regulations which may differ from U.S. GAAP. As a result, net investment income and net realized gain (or loss) from investment transactions for a reporting period may differ significantly from distributions during such period. The differences between tax regulations and U.S. GAAP relate primarily to investments in the Underlying Funds sold at a loss, wash sale deferrals and capital loss carryforwards. Accordingly, the Funds may periodically make reclassifications among certain of their capital accounts without impacting their net asset values.
Expenses
Expenses included in the accompanying financial statements reflect the expenses of each Fund and do not include those expenses incurred by the Underlying Funds. Because the Underlying Funds have varied expense and fee levels and the Funds may own different proportions of the Underlying Funds at different times, the amount of the fees and expenses incurred indirectly by the Funds will vary.
Guarantees
In the normal course of business, the Funds enter into contracts that contain a variety of representations which provide general indemnifications. The Funds’ maximum exposure under these arrangements is unknown as this would involve future claims that may be made against the Funds that have not yet occurred. However, the Funds expect the risk of loss to be remote.
Market, Credit and Counterparty Risk
In the normal course of business, the Underlying Funds trade financial instruments and enter into financial transactions where risk of potential loss exists due to changes in the market (market risk) or failure of the other party to a transaction to perform (credit risk). Similar to credit risk, the Underlying Funds may be exposed to counterparty risk or risk that an institution or other entity with which the Underlying Funds have unsettled or open transactions will default. The potential loss could exceed the value of the relevant assets recorded in the Underlying Funds’ financial statements (the “Assets”). The Assets, which potentially expose the Underlying Funds to credit risk, consist principally of cash due from counterparties and investments. The extent of the Underlying Funds’ exposure to credit and counterparty risks with respect to the Assets approximates their carrying value as recorded in the Underlying Funds’ Statements of Assets and Liabilities.
| 3. | | Investment Transactions |
Securities
During the period ended December 31, 2011, purchases and sales of the Underlying Funds (excluding short-term investments) were as follows:
| | | | | | | | |
| | | Purchases | | | Sales | |
| | | | | | | | |
Conservative Strategy Fund | | $ | 1,034,556 | | | $ | 23,423 | |
Moderate Strategy Fund | | | 29,811,754 | | | | 6,889,353 | |
Balanced Strategy Fund | | | 70,048,238 | | | | 14,706,572 | |
Growth Strategy Fund | | | 39,523,629 | | | | 10,360,955 | |
Equity Growth Strategy Fund | | | 11,311,548 | | | | 4,603,537 | |
| 4. | | Related Party Transactions, Fees and Expenses |
Adviser and Administrator
RIMCo advises the Funds and Russell Fund Services Company (“RFSC”) is the Funds’ administrator. RFSC is a wholly-owned subsidiary of RIMCo. RIMCo is a wholly-owned subsidiary of Frank Russell Company (a subsidiary of The Northwestern Mutual Life Insurance Company). Frank Russell Company provides ongoing money manager research and trade placement services to RIF and RIMCo.
The advisory fee of 0.20% and administrative fee of 0.05% are based upon the average daily net assets of the Funds and are payable monthly. The following shows the total amount of each of these fees paid by the Funds for the period ended December 31, 2011.
| | | | | | | | |
| | | Advisory | | | Administrative | |
| | | | | | | | |
Conservative Strategy Fund | | $ | 460 | | | $ | 115 | |
Moderate Strategy Fund | | | 131,825 | | | | 32,956 | |
Balanced Strategy Fund | | | 373,168 | | | | 93,292 | |
Growth Strategy Fund | | | 208,887 | | | | 52,222 | |
Equity Growth Strategy Fund | | | 59,808 | | | | 14,952 | |
| | |
| Notes to Financial Statements | | 53 |
Russell Investment Funds
LifePoints® Funds Variable Target Portfolio Series
Notes to Financial Statements, continued — December 31, 2011
RIMCo has contractually agreed, until April 30, 2012, to waive up to the full amount of its 0.20% advisory fee and then reimburse each Fund for other direct Fund-level expenses to the extent that direct Fund-level expenses exceed 0.10% of the average daily net assets of the Fund on an annual basis. Direct Fund-level expenses do not include extraordinary expenses or the expenses of other investment companies in which the Funds invest, including the Underlying Funds, which are borne indirectly by the Funds. These waivers and reimbursements may not be terminated during the relevant period except with Board approval.
As of December 31, 2011, RIMCo waived/reimbursed the following expenses:
| | | | | | | | | | | | |
| | | Waiver | | | Reimbursement | | | Total | |
| | | | | | | | | | | | |
Conservative Strategy Fund | | $ | 460 | | | $ | 41,553 | | | $ | 42,013 | |
Moderate Strategy Fund | | | 131,825 | | | | 48,515 | | | | 180,340 | |
Balanced Strategy Fund | | | 373,168 | | | | 28,566 | | | | 401,734 | |
Growth Strategy Fund | | | 208,887 | | | | 41,858 | | | | 250,745 | |
Equity Growth Strategy Fund | | | 59,808 | | | | 57,664 | | | | 117,472 | |
RIMCo and RFSC do not have the ability to recover amounts waived or reimbursed from previous periods.
Transfer and Dividend Disbursing Agent
RFSC serves as Transfer and Dividend Disbursing Agent for the Investment Company. For this service, RFSC is paid a fee based upon the average daily net assets of the Funds for transfer agency and dividend disbursing services. RFSC retains a portion of this fee for its services provided to the Funds and pays the balance to unaffiliated agents who assist in providing these services. Total fees paid for the Funds presented herein for the period ended December 31, 2011 were as follows:
| | | | |
| | | Amount | |
| | | | |
Conservative Strategy Fund | | $ | 10 | |
Moderate Strategy Fund | | | 2,900 | |
Balanced Strategy Fund | | | 8,210 | |
Growth Strategy Fund | | | 4,596 | |
Equity Growth Strategy Fund | | | 1,316 | |
Distributor
Russell Financial Services, Inc. (the “Distributor”), a wholly-owned subsidiary of RIMCo, is the distributor for the Investment Company pursuant to a Distribution Agreement with the Investment Company. The Distributor receives no compensation from the Investment Company for its services.
Accrued Fees Payable to Affiliates
Accrued fees payable to affiliates for the period ended December 31, 2011 were as follows:
| | | | | | | | | | | | | | | | | | | | |
| | | Conservative Strategy
Fund | | | Moderate Strategy
Fund | | | Balanced Strategy
Fund | | | Growth Strategy
Fund | | | Equity Growth
Strategy Fund | |
| | | | | | | | | | | | | | | | | | | | |
Advisory fees | | $ | 8,509 | | | $ | 3,210 | | | $ | 26,399 | | | $ | 10,019 | | | $ | — | |
Administration fees | | | 42 | | | | 3,159 | | | | 130 | | | | 2,378 | | | | 1,301 | |
Transfer agent fees | | | 3 | | | | 280 | | | | 754 | | | | 418 | | | | 117 | |
Trustee fees | | | 73 | | | | 66 | | | | 203 | | | | 118 | | | | 36 | |
| | | | | | | | | | | | | | | | | | | | |
| | $ | 8,627 | | | $ | 6,715 | | | $ | 27,486 | | | $ | 12,933 | | | $ | 1,454 | |
| | | | | | | | | | | | | | | | | | | | |
Board of Trustees
The Russell Fund Complex consists of Russell Investment Company, which has 36 funds, and RIF, which has 10 funds. Each of the Trustees is a Trustee of both RIC and RIF. During the period, the Russell Fund Complex paid each of its independent Trustees a retainer of $75,000 per year, $6,500 for each regularly scheduled meeting attended in person (effective January 1, 2012, $7,000), $2,500 (effective January 1, 2012, $3,500) for each special meeting and the Annual 38a-1 meeting attended in person, and for each Audit Committee meeting, Nominating and Governance Committee meeting, Investment Committee meeting or any other committee meeting established and approved by the Board that is attended in person. Each Trustee receives a $1,000 fee for attending regularly scheduled and special meetings by phone instead of receiving the full fee had the member attended in person (except for telephonic meetings called pursuant to the Funds’ valuation and pricing procedures) and a $500 fee for attending the committee meeting by phone instead of receiving the full fee had the member attended in person. Trustees’ out-of-pocket expenses are also paid by the Russell Fund Complex. The Audit Committee Chair and Investment Committee Chair are each paid a fee of $15,000 per year and the Nominating and Governance Committee Chair is paid a fee of $6,000 per year. The chairman of the Board receives additional annual compensation of $75,000.
| | | | |
| | 54 | | | Notes to Financial Statements |
Russell Investment Funds
LifePoints® Funds Variable Target Portfolio Series
Notes to Financial Statements, continued — December 31, 2011
Transactions with Affiliated Companies
An affiliated company is a company in which a Fund has ownership of at least 5% of the voting securities or which the Fund controls, is controlled by or is under common control. Transactions during the period ended December 31, 2011, with Underlying Funds which are, or were, an affiliated company are as follows:
| | | | | | | | | | | | | | | | | | | | | | | | |
| | | Market Value | | | Purchases Cost | | | Sales Cost | | | Realized
Gain (Loss) | | | Income
Distributions | | | Capital Gains
Distributions | |
| | | | | | | | | | | | | | | | | | | | | | | | |
Conservative Strategy Fund | | | | | | | | | | | | | | | | | | | | | | | | |
RIF Multi-Style Equity Fund | | $ | 30 | | | $ | 30 | | | $ | — | | | $ | — | | | $ | — | | | $ | — | |
RIC Russell U.S. Quantitative Equity Fund | | | 30 | | | | 30 | | | | — | | | | — | | | | — | | | | — | |
RIF Core Bond Fund | | | 381 | | | | 395 | | | | 11 | | | | — | | | | 4 | | | | 4 | |
RIC Russell Global Opportunistic Credit Fund | | | 20 | | | | 21 | | | | — | | | | — | | | | 1 | | | | — | |
RIC Russell Investment Grade Bond Fund | | | 200 | | | | 207 | | | | 6 | | | | — | | | | 3 | | | | 1 | |
RIC Russell Short Duration Bond Fund | | | 180 | | | | 184 | | | | 5 | | | | — | | | | 1 | | | | — | |
RIF Non-U.S. Fund | | | 48 | | | | 53 | | | | 1 | | | | — | | | | — | | | | — | |
RIC Russell Global Equity Fund | | | 49 | | | | 52 | | | | — | | | | — | | | | 1 | | | | — | |
RIF Global Real Estate Securities Fund | | | 20 | | | | 21 | | | | — | | | | — | | | | — | | | | — | |
RIC Russell Commodity Strategies Fund | | | 19 | | | | 22 | | | | — | | | | — | | | | 1 | | | | — | |
RIC Russell Global Infrastructure Fund | | | 20 | | | | 20 | | | | — | | | | — | | | | — | | | | — | |
| | | | | | | | | | | | | | | | | | | | | | | | |
| | $ | 997 | | | $ | 1,035 | | | $ | 23 | | | $ | — | | | $ | 11 | | | $ | 5 | |
| | | | | | | | | | | | | | | | | | | | | | | | |
Moderate Strategy Fund | | | | | | | | | | | | | | | | | | | | | | | | |
RIF Aggressive Equity Fund | | $ | 1,506 | | | $ | 645 | | | $ | 189 | | | $ | (10 | ) | | $ | 7 | | | $ | — | |
RIF Multi-Style Equity Fund | | | 3,772 | | | | 2,136 | | | | 1,008 | | | | (54 | ) | | | 34 | | | | — | |
RIC Russell U.S. Quantitative Equity Fund | | | 4,533 | | | | 1,523 | | | | 411 | | | | (12 | ) | | | 49 | | | | — | |
RIF Core Bond Fund | | | 26,965 | | | | 9,758 | | | | 2,340 | | | | (56 | ) | | | 856 | | | | 355 | |
RIC Russell Global Opportunistic Credit Fund | | | 1,499 | | | | 529 | | | | 75 | | | | — | | | | 95 | | | | — | |
RIC Russell Investment Grade Bond Fund | | | 15,001 | | | | 4,731 | | | | 947 | | | | (34 | ) | | | 471 | | | | 57 | |
RIF Non-U.S. Fund | | | 6,777 | | | | 3,428 | | | | 735 | | | | (62 | ) | | | 96 | | | | — | |
RIC Russell Emerging Markets Fund | | | 2,236 | | | | 1,346 | | | | 295 | | | | (22 | ) | | | 39 | | | | 91 | |
RIC Russell Global Equity Fund | | | 6,017 | | | | 2,680 | | | | 508 | | | | (31 | ) | | | 66 | | | | — | |
RIF Global Real Estate Securities Fund | | | 2,265 | | | | 1,015 | | | | 245 | | | | (16 | ) | | | 44 | | | | — | |
RIC Russell Commodity Strategies Fund | | | 2,226 | | | | 1,145 | | | | 244 | | | | (1 | ) | | | 97 | | | | — | |
RIC Russell Global Infrastructure Fund | | | 2,274 | | | | 876 | | | | 200 | | | | (10 | ) | | | 57 | | | | 1 | |
| | | | | | | | | | | | | | | | | | | | | | | | |
| | $ | 75,071 | | | $ | 29,812 | | | $ | 7,197 | | | $ | (308 | ) | | $ | 1,911 | | | $ | 504 | |
| | | | | | | | | | | | | | | | | | | | | | | | |
Balanced Strategy Fund | | | | | | | | | | | | | | | | | | | | | | | | |
RIF Aggressive Equity Fund | | $ | 8,071 | | | $ | 2,371 | | | $ | 261 | | | $ | (17 | ) | | $ | 39 | | | $ | — | |
RIF Multi-Style Equity Fund | | | 20,485 | | | | 8,416 | | | | 2,964 | | | | (146 | ) | | | 191 | | | | — | |
RIC Russell U.S. Quantitative Equity Fund | | | 18,146 | | | | 3,936 | | | | 341 | | | | (9 | ) | | | 202 | | | | — | |
RIF Core Bond Fund | | | 70,434 | | | | 25,395 | | | | 9,723 | | | | (139 | ) | | | 2,352 | | | | 938 | |
RIC Russell Global Opportunistic Credit Fund | | | 6,038 | | | | 1,933 | | | | 408 | | | | (1 | ) | | | 383 | | | | — | |
RIF Non-U.S. Fund | | | 29,966 | | | | 11,146 | | | | 407 | | | | (54 | ) | | | 444 | | | | — | |
RIC Russell Emerging Markets Fund | | | 7,934 | | | | 3,629 | | | | 174 | | | | (6 | ) | | | 138 | | | | 322 | |
RIC Russell Global Equity Fund | | | 19,990 | | | | 6,528 | | | | 184 | | | | (6 | ) | | | 218 | | | | — | |
RIF Global Real Estate Securities Fund | | | 6,044 | | | | 1,896 | | | | 74 | | | | (3 | ) | | | 124 | | | | — | |
RIC Russell Commodity Strategies Fund | | | 7,932 | | | | 3,158 | | | | 464 | | | | (16 | ) | | | 342 | | | | — | |
RIC Russell Global Infrastructure Fund | | | 6,068 | | | | 1,640 | | | | 108 | | | | (4 | ) | | | 159 | | | | 2 | |
| | | | | | | | | | | | | | | | | | | | | | | | |
| | $ | 201,108 | | | $ | 70,048 | | | $ | 15,108 | | | $ | (401 | ) | | $ | 4,592 | | | $ | 1,262 | |
| | | | | | | | | | | | | | | | | | | | | | | | |
Growth Strategy Fund | | | | | | | | | | | | | | | | | | | | | | | | |
RIF Aggressive Equity Fund | | $ | 6,668 | | | $ | 2,033 | | | $ | 550 | | | $ | (47 | ) | | $ | 32 | | | $ | — | |
RIF Multi-Style Equity Fund | | | 13,367 | | | | 5,723 | | | | 2,803 | | | | (135 | ) | | | 129 | | | | — | |
RIC Russell U.S. Quantitative Equity Fund | | | 12,247 | | | | 2,467 | | | | 488 | | | | (15 | ) | | | 137 | | | | — | |
RIF Core Bond Fund | | | 16,734 | | | | 7,497 | | | | 4,305 | | | | (30 | ) | | | 551 | | | | 224 | |
RIC Russell Global Opportunistic Credit Fund | | | 4,466 | | | | 1,386 | | | | 399 | | | | (2 | ) | | | 283 | | | | — | |
RIF Non-U.S. Fund | | | 21,237 | | | | 7,840 | | | | 825 | | | | (134 | ) | | | 321 | | | | — | |
RIC Russell Emerging Markets Fund | | | 5,565 | | | | 2,476 | | | | 170 | | | | (8 | ) | | | 97 | | | | 226 | |
RIC Russell Global Equity Fund | | | 15,605 | | | | 4,836 | | | | 320 | | | | (29 | ) | | | 171 | | | | — | |
RIF Global Real Estate Securities Fund | | | 4,455 | | | | 1,301 | | | | 112 | | | | (2 | ) | | | 93 | | | | — | |
RIC Russell Commodity Strategies Fund | | | 6,685 | | | | 2,861 | | | | 683 | | | | (9 | ) | | | 288 | | | | — | |
RIC Russell Global Infrastructure Fund | | | 4,476 | | | | 1,104 | | | | 120 | | | | (3 | ) | | | 117 | | | | 2 | |
| | | | | | | | | | | | | | | | | | | | | | | | |
| | $ | 111,505 | | | $ | 39,524 | | | $ | 10,775 | | | $ | (414 | ) | | $ | 2,219 | | | $ | 452 | |
| | | | | | | | | | | | | | | | | | | | | | | | |
| | |
| Notes to Financial Statements | | 55 |
Russell Investment Funds
LifePoints® Funds Variable Target Portfolio Series
Notes to Financial Statements, continued — December 31, 2011
| | | | | | | | | | | | | | | | | | | | | | | | |
| | | Market Value | | | Purchases Cost | | | Sales Cost | | | Realized
Gain (Loss) | | | Income
Distributions | | | Capital Gains
Distributions | |
| | | | | | | | | | | | | | | | | | | | | | | | |
Equity Growth Strategy Fund | | | | | | | | | | | | | | | | | | | | | | | | |
RIF Aggressive Equity Fund | | $ | 2,160 | | | $ | 734 | | | $ | 364 | | | $ | (25 | ) | | $ | 11 | | | $ | — | |
RIF Multi-Style Equity Fund | | | 4,629 | | | | 1,252 | | | | 520 | | | | (27 | ) | | | 43 | | | | — | |
RIC Russell U.S. Quantitative Equity Fund | | | 4,333 | | | | 1,046 | | | | 591 | | | | (24 | ) | | | 49 | | | | — | |
RIC Russell Global Opportunistic Credit Fund | | | 1,540 | | | | 770 | | | | 528 | | | | — | | | | 97 | | | | — | |
RIF Non-U.S. Fund | | | 7,095 | | | | 2,843 | | | | 893 | | | | (50 | ) | | | 113 | | | | — | |
RIC Russell Emerging Markets Fund | | | 2,147 | | | | 1,164 | | | | 413 | | | | (18 | ) | | | 37 | | | | 87 | |
RIC Russell Global Equity Fund | | | 4,318 | | | | 1,416 | | | | 407 | | | | (16 | ) | | | 47 | | | | — | |
RIF Global Real Estate Securities Fund | | | 1,548 | | | | 583 | | | | 255 | | | | (9 | ) | | | 34 | | | | — | |
RIC Russell Commodity Strategies Fund | | | 1,843 | | | | 1,100 | | | | 609 | | | | (3 | ) | | | 80 | | | | — | |
RIC Russell Global Infrastructure Fund | | | 1,242 | | | | 404 | | | | 203 | | | | (7 | ) | | | 33 | | | | 1 | |
| | | | | | | | | | | | | | | | | | | | | | | | |
| | $ | 30,855 | | | $ | 11,312 | | | $ | 4,783 | | | $ | (179 | ) | | $ | 544 | | | $ | 88 | |
| | | | | | | | | | | | | | | | | | | | | | | | |
At December 31, 2011, the following Funds had net tax basis capital loss carryforwards which may be applied against any net realized taxable gains in each succeeding year or until their respective expiration dates, whichever occurs first. Under the Regulated Investment Company Modernization Act of 2010, the Funds will be permitted to carry forward capital losses incurred in taxable years beginning after December 22, 2010 for an unlimited period. However, any losses incurred during those future taxable years will be required to be utilized prior to the losses incurred in pre-enactment taxable years. As a result of this ordering rule, pre-enactment capital loss carryforwards may be more likely to expire unused. Additionally, post-enactment capital losses that are carried forward will retain their character as either short-term or long-term capital losses rather than being considered all short-term as under previous law. For the fiscal year ending December 31, 2011, the Funds had no short-term or long-term capital losses which may be carried forward indefinitely. Available capital loss carryforwards and expiration dates are as follows:
| | | | | | | | | | | | |
| Funds | | 12/31/2017 | | | 12/31/2018 | | | Totals | |
| | | | | | | | | | | | |
Balanced Strategy Fund | | $ | — | | | $ | 442,086 | | | $ | 442,086 | |
Growth Strategy Fund | | | — | | | | 1,435,649 | | | | 1,435,649 | |
Equity Growth Strategy Fund | | | 215,835 | | | | 720,380 | | | | 936,215 | |
At December 31, 2011, the cost of investments and net unrealized appreciation (depreciation), undistributed ordinary income and undistributed long-term capital gains for income tax purposes were as follows:
| | | | | | | | | | | | | | | | | | | | |
| | | Conservative
Strategy Fund | | | Moderate Strategy
Fund | | | Balanced Strategy
Fund | | | Growth Strategy
Fund | | | Equity Growth
Strategy Fund | |
| | | | | | | | | | | | | | | | | | | | |
Cost of Investments | | $ | 1,011,159 | | | $ | 75,256,410 | | | $ | 204,335,779 | | | $ | 115,871,951 | | | $ | 33,815,960 | |
| | | | | | | | | | | | | | | | | | | | |
Unrealized Appreciation | | $ | 174 | | | $ | (206,474 | ) | | $ | (7,316,690 | ) | | $ | (55,959,381 | ) | | $ | (4,448,067 | ) |
Unrealized Depreciation | | | (14,660 | ) | | | 21,370 | | | | 4,088,999 | | | | 51,591,971 | | | | 1,487,041 | |
| | | | | | | | | | | | | | | | | | | | |
Net Unrealized Appreciation (Depreciation) | | $ | (14,486 | ) | | $ | (185,104 | ) | | $ | (3,227,691 | ) | | $ | (4,367,410 | ) | | $ | (2,961,026 | ) |
| | | | | | | | | | | | | | | | | | | | |
Undistributed Ordinary Income | | $ | 6 | | | $ | 99,565 | | | $ | 171,504 | | | $ | 63,623 | | | $ | 41,014 | |
Undistributed Long-Term Capital Gains (Capital Loss Carryforward) | | $ | 4,974 | | | $ | 420,475 | | | | (442,086 | ) | | $ | (1,435,649 | ) | | $ | (936,215 | ) |
Tax Composition of Distributions | | | | | | | | | | | | | | | | | | | | |
Ordinary Income | | $ | 10,755 | | | $ | 1,743,909 | | | $ | 4,237,869 | | | $ | 2,051,021 | | | $ | 473,249 | |
Tax-Exempt Income | | $ | — | | | $ | — | | | $ | — | | | $ | — | | | $ | — | |
Long-Term Capital Gains | | $ | — | | | $ | — | | | $ | — | | | $ | — | | | $ | — | |
Distributions in Excess | | $ | — | | | $ | — | | | $ | — | | | $ | — | | | $ | — | |
Tax Return of Capital | | $ | — | | | $ | — | | | $ | — | | | $ | — | | | $ | — | |
As permitted by tax regulations, the Funds intend to defer a net realized capital loss incurred from November 1, 2011 to December 31, 2011, and treat it as arising in the fiscal year 2012. As of December 31, 2011, the Funds had realized capital losses as follows:
| | | | |
| Fund | | | |
| | | | |
Moderate Strategy Fund | | $ | 4,281 | |
Balanced Strategy Fund | | | 36,024 | |
Growth Strategy Fund | | | 70,848 | |
Equity Growth Strategy Fund | | | 7,559 | |
| | | | |
| | 56 | | | Notes to Financial Statements |
Russell Investment Funds
LifePoints® Funds Variable Target Portfolio Series
Notes to Financial Statements, continued — December 31, 2011
| 6. | | Fund Share Transactions (amounts in thousands) |
Share transactions for the periods ended December 31, 2011 and December 31, 2010 were as follows:
| | | | | | | | | | | | | | | | |
| | | 2011 | | | | | | | |
| Conservative Strategy Fund(1) | | Shares | | | Dollars | | | | | | | |
| | | | | | | | | | | | | | | | |
Proceeds from shares sold | | | 101 | | | $ | 973 | | | | | | | | | |
Proceeds from reinvestment of distributions | | | 1 | | | | 10 | | | | | | | | | |
Payments for shares redeemed | | | — | | | | — | | | | | | | | | |
| | | | | | | | | | | | | | | | |
Total increase (decrease) | | | 102 | | | $ | 983 | | | | | | | | | |
| | | | | | | | | | | | | | | | |
| | |
| | | 2011 | | | 2010 | |
| Moderate Strategy Fund | | Shares | | | Dollars | | | Shares | | | Dollars | |
Proceeds from shares sold | | | 2,646 | | | $ | 25,578 | | | | 2,236 | | | $ | 20,764 | |
Proceeds from reinvestment of distributions | | | 183 | | | | 1,744 | | | | 226 | | | | 2,128 | |
Payments for shares redeemed | | | (518 | ) | | | (5,009 | ) | | | (784 | ) | | | (7,242 | ) |
| | | | | | | | | | | | | | | | |
Total increase (decrease) | | | 2,311 | | | $ | 22,313 | | | | 1,678 | | | $ | 15,650 | |
| | | | | | | | | | | | | | | | |
| | |
| | | 2011 | | | 2010 | |
| Balanced Strategy Fund | | Dollars | | | Shares | | | Shares | | | Dollars | |
Proceeds from shares sold | | | 6,359 | | | $ | 58,019 | | | | 4,844 | | | $ | 41,538 | |
Proceeds from reinvestment of distributions | | | 477 | | | | 4,238 | | | | 586 | | | | 5,151 | |
Payments for shares redeemed | | | (941 | ) | | | (8,376 | ) | | | (861 | ) | | | (7,310 | ) |
| | | | | | | | | | | | | | | | |
Total increase (decrease) | | | 5,895 | | | $ | 53,881 | | | | 4,569 | | | $ | 39,379 | |
| | | | | | | | | | | | | | | | |
| | |
| | | 2011 | | | 2010 | |
| Growth Strategy Fund | | Shares | | | Dollars | | | Shares | | | Dollars | |
Proceeds from shares sold | | | 3,807 | | | $ | 32,607 | | | | 2,715 | | | $ | 21,639 | |
Proceeds from reinvestment of distributions | | | 249 | | | | 2,050 | | | | 274 | | | | 2,271 | |
Payments for shares redeemed | | | (702 | ) | | | (6,023 | ) | | | (454 | ) | | | (3,600 | ) |
| | | | | | | | | | | | | | | | |
Total increase (decrease) | | | 3,354 | | | $ | 28,634 | | | | 2,535 | | | $ | 20,310 | |
| | | | | | | | | | | | | | | | |
| | |
| | | 2011 | | | 2010 | |
| Equity Growth Strategy Fund | | Shares | | | Dollars | | | Shares | | | Dollars | |
Proceeds from shares sold | | | 1,436 | | | $ | 11,225 | | | | 1,155 | | | $ | 8,348 | |
Proceeds from reinvestment of distributions | | | 64 | | | | 473 | | | | 89 | | | | 678 | |
Payments for shares redeemed | | | (655 | ) | | | (5,120 | ) | | | (689 | ) | | | (4,984 | ) |
| | | | | | | | | | | | | | | | |
Total increase (decrease) | | | 845 | | | $ | 6,578 | | | | 555 | | | $ | 4,042 | |
| | | | | | | | | | | | | | | | |
| (1) | For the period May 2, 2011 (date of first issue) to December 31, 2011. |
| 7. | | Interfund Lending Program |
The Funds have been granted permission from the Securities and Exchange Commission to participate in a joint lending and borrowing facility (the “Credit Facility”). Funds may borrow money from each other for temporary purposes. All such borrowing and lending will be subject to a participating Fund’s fundamental investment limitations. Typically, Funds will borrow from the RIC funds. A RIC lending fund will lend through the program only when the returns are higher than those available from an investment in repurchase agreements or short-term reserves and the portfolio manager determines it is in the best interest of the RIC lending fund. The Funds will borrow through the program only when the costs are equal to or lower than the cost of bank loans. Interfund loans and borrowings normally extend overnight, but can have a maximum duration of seven days. Loans may be called on one business day’s notice. A participating Fund may have to borrow from a bank at a higher interest rate if an interfund loan is called or not renewed. Any delay in repayment to the RIC lending fund could result in a lost investment opportunity or additional borrowing costs. For the period ended December 31, 2011, the Funds did not borrow or loan through the interfund lending program.
| | |
| Notes to Financial Statements | | 57 |
Russell Investment Funds
LifePoints® Funds Variable Target Portfolio Series
Notes to Financial Statements, continued — December 31, 2011
As of December 31, 2011, the following table includes shareholders of record with greater than 10% of the total outstanding shares of each respective Fund.
| | | | | | | | |
| | | # of Shareholders | | | % | |
| | | | | | | | |
Conservative Strategy Fund | | | 2 | | | | 100.0 | |
Moderate Strategy Fund | | | 1 | | | | 97 .3 | |
Balanced Strategy Fund | | | 1 | | | | 95 .7 | |
Growth Strategy Fund | | | 1 | | | | 94 .5 | |
Equity Growth Strategy Fund | | | 1 | | | | 93 .0 | |
Management has evaluated the events and/or transactions that have occurred through the date the financial statements were issued and noted no items requiring adjustments to the financial statements or additional disclosures.
| | | | |
| | 58 | | | Notes to Financial Statements |
Report of Independent Registered Public Accounting Firm
To the Board of Trustees and Shareholders
of Russell Investment Funds
In our opinion, the accompanying statements of assets and liabilities, including the schedules of investments, and the related statements of operations and of changes in net assets and the financial highlights present fairly, in all material respects, the financial position of Conservative Strategy Fund, Moderate Strategy Fund, Balanced Strategy Fund, Growth Strategy Fund, and Equity Growth Strategy Fund (five of the portfolios constituting the Russell Investment Funds, hereafter referred to as the “Funds”) at December 31, 2011, and the results of each of their operations, the changes in each of their net assets for the periods then ended and the financial highlights for each of the periods indicated, in conformity with accounting principles generally accepted in the United States of America. These financial statements and financial highlights (hereafter referred to as “financial statements”) are the responsibility of the Funds’ management; our responsibility is to express an opinion on these financial statements based on our audits. We conducted our audits of these financial statements in accordance with the standards of the Public Company Accounting Oversight Board (United States). Those standards require that we plan and perform the audits to obtain reasonable assurance about whether the financial statements are free of material misstatement. An audit includes examining, on a test basis, evidence supporting the amounts and disclosures in the financial statements, assessing the accounting principles used and significant estimates made by management, and evaluating the overall financial statement presentation. We believe that our audits, which included confirmation of securities at December 31, 2011 by correspondence with the transfer agent, provide a reasonable basis for our opinion.

PricewaterhouseCoopers LLP
Seattle, Washington
February 15, 2012
| | |
| Report of Independent Registered Public Accounting Firm | | 59 |
Russell Investment Funds
LifePoints® Funds Variable Target Portfolio Series
Tax Information — December 31, 2011 (Unaudited)
For the tax year ended December 31, 2011, the Funds hereby designate 100% or the maximum amount allowable, of its net taxable income as qualified dividends taxed at individual net capital gain rates.
The Form 1099 you receive in January 2012 will show the tax status of all distributions paid to your account in calendar year 2011.
The Funds designate dividends distributed during the fiscal year as qualifying for the dividends received deduction for corporate shareholders as follows:
| | | | |
Conservative Strategy Fund | | | 5.1 | % |
Moderate Strategy Fund | | | 8.5 | % |
Balanced Strategy Fund | | | 14.7 | % |
Growth Strategy Fund | | | 21.7 | % |
Equity Growth Strategy Fund | | | 30.7 | % |
Please consult a tax adviser for any questions about federal or state income tax laws.
Russell Investment Funds
LifePoints® Funds Variable Target Portfolio Series
Basis for Approval of Investment Advisory Contracts — (Unaudited)
Approval of Investment Advisory Agreement
The Board of Trustees, including all of the Independent Trustees, last considered and approved the continuation of the advisory agreement with RIMCo (the “RIMCo Agreement”) and the portfolio management contract with each Money Manager of the Funds (collectively, the “portfolio management contracts”) in which the Funds invest (the “Underlying Funds”) at a meeting held in person on April 19, 2011 (the “Agreement Evaluation Meeting”). During the course of a year, the Trustees receive a wide variety of materials regarding the investment performance of the Funds, sales and redemptions of the Funds’ and Underlying Funds’ shares, management of the Funds and the Underlying Funds by RIMCo and compliance with applicable regulatory requirements. In preparation for the annual review, the Independent Trustees, with the advice and assistance of their independent counsel, also requested and the Board considered (1) information and reports prepared by RIMCo relating to the services provided by RIMCo (and its affiliates) to the Funds and the Underlying Funds; and (2) information (the “Third-Party Information”) received from an independent, nationally recognized provider of investment company information comparing the performance of each of the Funds and the Underlying Funds and their respective operating expenses over various periods of time with other peer funds not managed by RIMCo, believed by the provider to be generally comparable in investment objectives to the Funds and the Underlying Funds. In the case of each Fund, its other peer funds are collectively hereinafter referred to as the Fund’s “Comparable Funds,” and, with the Fund, such Comparable Funds are collectively hereinafter referred to as the Fund’s “Performance Universe” in the case of performance comparisons and the Fund’s “Expense Universe” in the case of operating expense comparisons. In the case of certain Funds, the Third-Party Information reflected changes in the Comparable Funds requested by RIMCo, which changes were noted in the Third-Party Information. The foregoing information requested by the Trustees or provided by RIMCo is collectively called the “Agreement Evaluation Information.” The Trustees’ evaluations also reflected the knowledge and familiarity gained as Board members of the Funds and other funds in the same complex with respect to services provided by RIMCo, RIMCo’s affiliates and each Money Manager. The Trustees received a memorandum from counsel to the Funds and Underlying Funds discussing the legal standards for their consideration of the continuations of the RIMCo Agreement and the portfolio management contracts, and the Independent Trustees separately received a memorandum regarding their responsibilities from their independent counsel.
On April 11, 2011, the Independent Trustees in preparation for the Agreement Evaluation Meeting met by conference telephone call to review Agreement Evaluation Information received to that date in a private session with their independent counsel at which no representatives of RIMCo or the Funds’ management were present and, on the basis of that review, requested additional Agreement Evaluation Information. At the Agreement Evaluation Meeting, the Board, including the Independent Trustees, reviewed the proposed continuance of the RIMCo Agreement and the portfolio management contracts with management, counsel to the Funds and Underlying Funds and independent counsel to the Independent Trustees. Presentations made by RIMCo to the Board as part of this review encompassed the Funds and all other RIMCo-managed funds for which the Board has supervisory responsibility. Following this review, but prior to voting, the Independent Trustees again met in executive session with their independent counsel to consider additional Agreement Evaluation Information received from RIMCo and management at the Agreement Evaluation Meeting. The discussion below reflects all of these reviews.
In evaluating the portfolio management contracts, the Board considered RIMCo’s advice that the Underlying Funds, in employing a manager-of-managers method of investment, operate in a manner that is distinctly different from most other investment companies. In the case of most other investment companies, an advisory fee is paid by the investment company to its adviser which, in turn, employs and compensates individual portfolio managers to make specific securities selections consistent with the adviser’s style and investment philosophy. RIMCo has engaged multiple unaffiliated Money Managers for all Underlying Funds.
The Board considered that RIMCo (rather than any Money Manager) is responsible under the RIMCo Agreement for allocating assets of each Fund among its Underlying Funds and for determining, implementing and maintaining the investment program for each Underlying Fund. The assets of each Fund are invested in different combinations of the Underlying Funds pursuant to target asset allocations set by RIMCo. RIMCo may modify the target asset allocation for any Fund and/or the Underlying Funds in which the Funds invest. Assets of each Underlying Fund generally have been allocated among the multiple Money Managers selected by RIMCo, subject to Board approval, for that Underlying Fund. RIMCo manages directly a portion of one Underlying Fund’s assets employing a “select holdings strategy,” as described below. RIMCo also may manage directly any portion of each Underlying Fund’s assets that RIMCo determines not to allocate to the Money Managers and portions of an Underlying Fund during transitions between Money Managers. In all cases, assets are managed directly by RIMCo pursuant to authority provided by the RIMCo Agreement.
RIMCo is responsible for selecting, subject to Board approval, Money Managers for each Underlying Fund and for actively managing allocations and reallocations of its assets among the Money Managers. The Board has been advised that RIMCo’s goal is to construct and manage diversified portfolios in a risk-aware manner. Each Money Manager for an Underlying Fund in effect performs the function of an individual portfolio manager who is responsible for selecting portfolio securities for the portion of the Underlying Fund assigned to it by RIMCo (each, a “segment”) in accordance with the Underlying Fund’s applicable investment objective, policies and restrictions, any constraints placed by RIMCo upon their selection of portfolio securities and the Money Manager’s specified role in
| | |
| Basis for Approval of Investment Advisory Contracts | | 61 |
Russell Investment Funds
LifePoints® Funds Variable Target Portfolio Series
Basis for Approval of Investment Advisory Contracts, continued — (Unaudited)
an Underlying Fund. RIMCo is responsible for communicating performance expectations to each Money Manager; supervising compliance by each Money Manager with each Underlying Fund’s investment objective and policies; authorizing Money Managers to engage in certain investment strategies for an Underlying Fund; and recommending annually to the Board whether portfolio management contracts should be renewed, modified or terminated. In addition to its annual recommendation as to the renewal, modification or termination of portfolio management contracts, RIMCo is responsible for recommending to the Board additions of new Money Managers or replacements of existing Money Managers at any time when, based on RIMCo’s research and ongoing review and analysis, such actions are appropriate. RIMCo may impose specific investment constraints from time to time for each Money Manager intended to capitalize on the strengths of that Money Manager or to coordinate the investment activities of Money Managers for an Underlying Fund in a complementary manner. Therefore, the performance of individual Money Managers for an Underlying Fund may reflect the roles assigned to them by RIMCo in the Underlying Fund’s investment activities and any constraints placed by RIMCo upon their selection of portfolio securities. In light of the foregoing, the overall performance of each Underlying Fund over appropriate periods reflects, in great part, the performance of RIMCo in designing the Underlying Fund’s investment program, structuring an Underlying Fund, selecting an effective Money Manager with a particular investment style or sub-style for a segment that is complementary to the styles of the Money Managers of other Underlying Fund segments, and allocating assets among the Money Managers in a manner designed to achieve the objectives of the Underlying Fund.
The Board considered that the prospectuses for the Funds and the Underlying Funds and other public disclosures emphasize to investors RIMCo’s role as the principal investment manager for each Underlying Fund, rather than the investment selection role of the Underlying Funds’ Money Managers, and describe the manner in which the Funds or Underlying Funds operate so that investors may take that information into account when deciding to purchase shares of any such Fund. The Board further considered that Fund investors in pursuing their investment goals and objectives likely purchased their shares on the basis of this information and RIMCo’s reputation for and performance record in managing the Underlying Funds’ manager-of-managers structure.
The Board also considered the demands and complexity of managing the Underlying Funds pursuant to the manager-of-managers structure, the special expertise of RIMCo with respect to the manager-of-managers structure of the Underlying Funds and the likelihood that, at the current expense ratio of each Underlying Fund, there would be no acceptable alternative investment managers to replace RIMCo on comparable terms given the need to continue the manager-of-managers strategy of such Underlying Fund selected by shareholders in purchasing their shares of a Fund or Underlying Fund.
In addition to these general factors relating to the manager-of-managers structure of the Underlying Funds, the Trustees considered, with respect to each Fund and Underlying Fund, various specific factors in evaluating renewal of the RIMCo Agreement, including the following:
| | 1. | The nature, scope and overall quality of the investment management and other services provided, and expected to be provided, to the Fund or the Underlying Fund by RIMCo; |
| | 2. | The advisory fee paid by the Fund or the Underlying Fund to RIMCo (the “Advisory Fee”) and the fact that it encompasses all investment advisory fees paid by the Fund or Underlying Fund, including the fees for any Money Managers of such Underlying Fund; |
| | 3. | Information provided by RIMCo as to other fees and benefits received by RIMCo or its affiliates from the Fund or Underlying Fund, including any administrative, transfer agent or cash management fees and fees received for management of securities lending cash collateral, soft dollar arrangements and commissions in connection with portfolio securities transactions; |
| | 4. | Information provided by RIMCo as to expenses incurred by the Fund or the Underlying Fund; and |
| | 5. | Information provided by RIMCo as to the profits that RIMCo derives from its mutual fund operations generally and from the Fund or Underlying Fund. |
In evaluating the nature, scope and overall quality of the investment management and other services provided and which are expected to be provided to the Funds, including Fund portfolio management services, the Board inquired as to the continuing impact on the Funds’ operations of significant changes in RIMCo’s senior management and other personnel providing services to the Funds during 2009 and 2010 and to the date of the Agreement Evaluation Meeting and the relocation of the Russell organization’s headquarters. At the Agreement Evaluation Meeting, senior representatives of RIMCo discussed these changes with the Board and assured the Board that such changes have not resulted in any diminution in the nature, scope or quality of the services provided to the Funds or the Underlying Funds. The Board also discussed the impact of such changes on the compliance programs of the Funds, the Underlying Funds and RIMCo with the Funds’ Chief Compliance Officer (the “CCO”) and received assurances from the CCO that such changes have not resulted in any diminution in the scope and quality of the compliance programs of the Funds or the Underlying Funds.
| | | | |
| | 62 | | | Basis for Approval of Investment Advisory Contracts |
Russell Investment Funds
LifePoints® Funds Variable Target Portfolio Series
Basis for Approval of Investment Advisory Contracts, continued — (Unaudited)
As noted above, RIMCo, pursuant to the terms of the RIMCo Agreement, directly manages a portion — up to 10% — of the assets of the RIF Multi-Style Equity Fund (the “Participating Underlying Fund”) utilizing a select holdings strategy, the actual allocation being determined by the Participating Underlying Fund’s RIMCo portfolio manager. The select holdings strategy utilized by RIMCo in managing such assets for the Participating Underlying Fund is designed to increase the Participating Underlying Fund’s exposure to stocks that are viewed as attractive by multiple Money Managers of the Participating Underlying Fund. The Board considered that the select holdings strategy initially was utilized for two other mutual funds under the management of RIMCo but did not achieve the objectives anticipated by RIMCo in respect of such funds and therefore was discontinued. Against this background, the Board reviewed the results of the select holdings strategy in respect of the Participating Underlying Fund during the past year. The Trustees considered that RIMCo is not required to pay investment advisory fees to a Money Manager with respect to assets for which the select holdings strategy is utilized and that the profits derived by RIMCo generally and from the Participating Underlying Fund consequently may increase incrementally. The Board, however, also considered RIMCo’s advice that it pays certain Money Managers additional fees for providing information and other services in connection with the select holdings strategy and incurs additional costs in carrying out the select holdings strategy, the limited amount of assets that are managed directly by RIMCo pursuant to the select holdings strategy, and the fact that the aggregate investment advisory fees paid by the Participating Underlying Fund are not increased as a result of the select holdings strategy.
In evaluating the reasonableness of the Funds’ and Underlying Funds’ Advisory Fees in light of Fund and Underlying Fund performance, the Board considered that, in the Agreement Evaluation Information and at past meetings, RIMCo noted differences between the investment strategies of certain Underlying Funds and their respective Comparable Funds in pursuing their investment objectives, including fund strategies which seek to achieve a lower tracking error (i.e., the difference, whether positive or negative, between the return of a fund and its benchmark) and resulting lower return volatility than their Comparable Funds. According to RIMCo, these strategies may be expected to result, and for certain Underlying Funds during the periods covered by the Third-Party Information did result, in lower performance of the Underlying Funds than that of some of their Comparable Funds. According to RIMCo, the strategies pursued by the Underlying Funds, among other things, are intended to result in less volatile, more moderate returns relative to each Underlying Fund’s performance benchmark rather than more volatile, more extreme returns that its Comparable Funds may experience over time, although Fund results in 2008 and early 2009 generally did not reflect uniform success in achieving lesser volatility.
In discussing the Advisory Fees for the Underlying Funds generally, RIMCo noted, among other things, that its Advisory Fees for Underlying Funds encompass services that may not be provided by investment advisers to the Underlying Funds’ Comparable Funds, such as cash equitization and management of portfolio transition costs when Money Managers are added, terminated or replaced. RIMCo also observed that its “margins” in providing investment advisory services to the Underlying Funds tend to be lower than competitors’ margins because of the demands and complexities of managing the Underlying Funds’ manager-of-managers structure, including RIMCo’s payment of a significant portion of the Underlying Funds’ Advisory Fees to their Money Managers.
The Board noted RIMCo’s advice that the services provided to the Funds and the Underlying Funds pursuant to the RIMCo Agreement do not encompass cash management services and considered RIMCo’s belief that its Advisory Fees nevertheless are reasonable. The Board also noted that the uninvested cash of the Underlying Funds is “swept” into a pooled investment vehicle maintained by RIMCo and that RIMCo receives a separate investment advisory fee from that investment vehicle to manage its investment portfolio. The Board considered and relied upon views expressed by RIMCo and counsel to the Funds and the Underlying Funds at the Agreement Evaluation Meeting and prior meetings regarding the appropriateness and permissibility of the separate advisory fees received by RIMCo from the investment vehicle and further considered that such fees, while being accrued on the books of the investment vehicle, are not being distributed to RIMCo pending resolution of certain issues raised by regulators.
The Board considered for each Fund and Underlying Fund whether economies of scale have been realized and whether the Advisory Fees for such Fund or Underlying Fund appropriately reflect or should be revised to reflect any such economies. The Board determined that, after giving effect to any applicable fee or expense caps, waivers or reimbursements, the Advisory Fee for each Fund or Underlying Fund appropriately reflected any economies of scale realized by that Fund, based upon such factors as the variability of Money Manager investment advisory fees and other factors associated with the manager-of-managers structure employed by the Underlying Funds.
The Board considered, as a general matter, that fees payable to RIMCo by institutional clients with investment objectives similar to those of the Funds and other funds under the Board’s supervision, including the Underlying Funds, are lower, and, in some cases, may be substantially lower, than the rates paid by the funds supervised by the Board, including the Funds. The Trustees considered the differences in the nature and scope of services RIMCo provides to institutional clients and the funds under its supervision, including the Underlying Funds. RIMCo explained, among other things, that institutional clients have fewer administrative needs than the Funds. RIMCo also noted that since the Funds must constantly issue and redeem their shares, they are more difficult to manage than institutional accounts, where assets are relatively stable. In addition, RIMCo noted that the Funds are subject to
| | |
| Basis for Approval of Investment Advisory Contracts | | 63 |
Russell Investment Funds
LifePoints® Funds Variable Target Portfolio Series
Basis for Approval of Investment Advisory Contracts, continued — (Unaudited)
heightened regulatory requirements relative to institutional clients. The Board noted that RIMCo provides office space and facilities to the Funds and Underlying Funds and all of the Funds’ and Underlying Funds’ officers. Accordingly, the Trustees concluded that the services provided to the Funds and Underlying Funds are sufficiently different from the services provided to the other clients that comparisons are not probative and should not be given significant weight.
With respect to the Funds’ Advisory Fees, the Third-Party Information showed that the Advisory fee for each Fund, on a contractual basis, was ranked in the fourth quintile of its Expense Universe but was ranked in the first quintile of its Expense Universe an actual basis (i.e., giving effect to any voluntary fee waivers implemented by RIMCo and the advisers to such Fund’s Comparable Funds). The comparisons were based upon the latest fiscal years for the Expense Universe funds. In assessing the Funds’ Advisory Fees, the Board focused on actual Advisory Fees.
With respect to the Funds’ total expenses, the Third-Party Information showed that, with the exception of the Equity Growth Strategy Fund, each of the Funds had total expenses which were ranked at least in the third quintile of its Expense Universe. In these rankings, the first quintile represents funds with the lowest total expenses among the Expense Universe Funds and the fifth quintile represents funds with the highest total expenses among the Expense Universe Funds. The Board considered RIMCo’ advice with respect to the Equity Growth Strategy Fund that its total expenses were within 5 basis points of the third quintile of its Expense Universe.
On the basis of the Agreement Evaluation Information, and other information previously received by the Board from RIMCo during the course of the current year or prior years, or presented at or in connection with the Agreement Evaluation Meeting by RIMCo, the Board, in respect of each Fund and Underlying Fund, found, after giving effect to any applicable waivers and/or reimbursements and considering differences in the composition and investment strategies of their respective Comparable Funds (1) the Advisory Fee charged by RIMCo was reasonable in light of the nature, scope and overall quality of the investment management and other services provided, and expected to be provided, to the Funds or Underlying Funds; (2) the relative expense ratio of each Fund and Underlying Fund was comparable to those of its Comparable Funds; (3) RIMCo’s methodology of allocating expenses of operating funds in the complex was reasonable; (4) other benefits and fees received by RIMCo or its affiliates from the Funds or Underlying Funds were not excessive; and (5) RIMCo’s profitability with respect to the Funds and each Underlying Fund was not excessive in light of the nature, scope and overall quality of the investment management and other services provided by RIMCo.
In evaluating the performance of the Funds and Underlying Funds generally relative to their Comparable Funds, the Board, in addition to factors discussed above, also considered RIMCo’s advice that many of the Underlying Funds’ Comparable Funds do not “equitize” their cash (i.e., cash awaiting investment or disbursement to satisfy redemptions or other fund obligations) and may hold large cash positions uninvested in their investment portfolios. By contrast, the Underlying Funds generally follow a strategy of equitizing their cash and fully investing their assets in pursuit of their investment objectives (the Underlying Funds’ strategy of equitizing cash and fully investing their assets is hereinafter referred to as their “full investment strategy”). RIMCo noted that the Underlying Funds’ full investment strategy generally will detract from their relative performance, and therefore the relative performance of the Funds, in a declining market, such as 2008, but may enhance relative performance in a rising market, such as 2009 and 2010.
The Board concluded that, under the circumstances, the performance of each of the Funds was consistent with continuation of the RIMCo Agreement. In evaluating performance, the Board considered each Fund’s and Underlying Fund’s absolute performance and performance relative to appropriate benchmarks and indices in addition to such Fund’s performance relative to its Comparable Funds. In assessing the Funds’ performance relative to their Comparable Funds or benchmarks or in absolute terms, the Board also considered RIMCo’s stated investment strategy of managing the Underlying Funds in a risk-aware manner and the extraordinary capital market conditions during 2008 and early 2009.
After considering the foregoing and other relevant factors and, the Board concluded that continuation of the RIMCo Agreement on its current terms and conditions would be in the best interests of each Fund and its respective shareholders and voted to approve the continuation of the RIMCo Agreement.
At the Agreement Evaluation Meeting, with respect to the evaluation of the terms of portfolio management contracts with Money Managers for the Underlying Funds, the Board received and considered information from RIMCo reporting, among other things, for each Money Manager, the Money Manager’s performance over various periods; RIMCo’s assessment of the performance of each Money Manager; any significant business relationships between the Money Manager and RIMCo or Russell Financial Services, Inc., the Funds’ and Underlying Funds’ underwriter; and RIMCo’s recommendation to retain the Money Manager at the current fee rate, to retain the Money Manager at a reduced fee rate or to terminate the Money Manager. The Board received reports during the course of the year from the CCO regarding each Money Manager’s compliance program. RIMCo recommended that each Money Manager be retained at its current fee rate. RIMCo has advised the Board that it does not regard Money Manager profitability as relevant to its
| | | | |
| | 64 | | | Basis for Approval of Investment Advisory Contracts |
Russell Investment Funds
LifePoints® Funds Variable Target Portfolio Series
Basis for Approval of Investment Advisory Contracts, continued — (Unaudited)
evaluation of the portfolio management contracts with Money Managers because the willingness of Money Managers to serve in such capacity depends upon arm’s-length negotiations with RIMCo; RIMCo is aware of the fees charged by Money Managers to other clients; and RIMCo believes that the fees agreed upon with Money Managers are reasonable in light of the anticipated quality of investment advisory services to be rendered. The Board accepted RIMCo’s explanation in light of the Board’s findings as to the reasonableness of the Advisory Fee paid by each Fund and Underlying Fund and the fact that each Money Manager’s fee is paid by RIMCo.
Based substantially upon RIMCo’s recommendations, together with the Agreement Evaluation Information and other information received from RIMCo in support of its recommendations at the Agreement Evaluation Meeting, the Board concluded that the fees paid to the Money Managers of each Underlying Fund are reasonable in light of the quality of the investment advisory services provided and that continuation of the portfolio management contract with each Money Manager of each Underlying Fund would be in the best interests of such Underlying Fund and its shareholders.
In their deliberations, the Trustees did not identify any particular information as to the RIMCo Agreement or, other than RIMCo’s recommendation, the portfolio management contract with any Money Manager for an Underlying Fund that was all-important or controlling and each Trustee attributed different weights to the various factors considered. The Trustees evaluated all information available to them on a Fund-by-Fund basis and their determinations were made in respect of each Fund and Underlying Fund.
Subsequently, the Board of Trustees received the following proposals from RIMCo: (1) at a meeting held on May 24, 2011, to effect a money manager change for the RIC Russell Commodity Strategies Fund; and (2) at a meeting held on December 6, 2011 to effect a money manager change for the RIC Russell Investment Grade Bond Fund and RIF Multi-Style Equity Fund. In the case of each such proposed change, the Trustees approved the terms of the proposed portfolio management contract based substantially upon RIMCo’s recommendation to hire the Money Manager at the proposed fee rate; any significant business relationships between the Money Manager and RIMCo or Russell Financial Services, Inc., the Underlying Fund’s underwriter; RIMCo’s explanation as to the lack of relevance of profitability to the evaluation of portfolio management contracts with money managers because the willingness of Money Managers to serve in such capacity depends upon arm’s-length negotiations with RIMCo; RIMCo’s awareness of the fees charged by the Money Manager to other clients; and RIMCo’s belief that the proposed investment advisory fees would be reasonable in light of the anticipated quality of investment advisory services to be rendered. The Trustees also considered their findings at their April 19, 2011 meeting as to the reasonableness of the aggregate investment advisory fees paid by the Underlying Fund, and the fact that the aggregate investment advisory fees paid by the Underlying Fund would not increase as a result of the implementation of the proposed money manager change because the money managers’ investment advisory fee is paid by RIMCo.
| | |
| Basis for Approval of Investment Advisory Contracts | | 65 |
Russell Investment Funds
LifePoints® Funds Variable Target Portfolio Series
Shareholder Requests for Additional Information — December 31, 2011 (Unaudited)
A complete unaudited schedule of investments is made available generally no later than 60 days after the end of the first and third quarters of each year. These reports are available (i) free of charge, upon request, by calling the Funds at (800) 787-7354, (ii) on the Securities and Exchange Commission’s website at www.sec.gov, and (iii) at the Securities and Exchange Commission’s public reference room.
The Board has delegated to RIMCo, as RIF’s investment adviser, the primary responsibility for monitoring, evaluating and voting proxies solicited by or with respect to issuers of securities in which assets of the Underlying Funds may be invested. RIMCo has established a proxy voting committee and has adopted written proxy voting policies and procedures (“P&P”) and proxy voting guidelines (“Guidelines”). The Funds maintain a Portfolio Holdings Disclosure Policy that governs the timing and circumstances of disclosure to shareholders and third parties of information regarding the portfolio investments held by the Funds. A description of the P&P, Guidelines, Portfolio Holdings Disclosure Policy and additional information about Fund Trustees are contained in the Funds’ Statement of Additional Information (“SAI”). The SAI and information regarding how the Underlying Funds voted proxies relating to portfolio securities during the most recent 12-month period ended December 31, 2011 are available (i) free of charge, upon request, by calling the Funds at (800) 787-7354, and (ii) on the Securities and Exchange Commission’s website at www.sec.gov.
If possible, depending on contract owner registration and address information, and unless you have otherwise opted out, only one copy of the RIF prospectus and each annual and semi-annual report will be sent to contract owners at the same address. If you would like to receive a separate copy of these documents, please contact your Insurance Company. If you currently receive multiple copies of the prospectus, annual report and semi-annual report and would like to request to receive a single copy of these documents in the future, please call your Insurance Company.
Some Insurance Companies may offer electronic delivery of the Funds’ prospectuses and annual and semi-annual reports. Please contact your Insurance Company for further details.
| | | | |
| | 66 | | | Shareholder Requests for Additional Information |
Russell Investment Funds
LifePoints® Funds Variable Target Portfolio Series
Disclosure of Information about Fund Trustees and Officers — December 31, 2011 (Unaudited)
The following tables provide information for each officer and trustee of the Russell Fund Complex. The Russell Fund Complex consists of Russell Investment Company (“RIC”), which has 36 funds, and Russell Investment Funds (“RIF”), which has 10 funds. Each of the trustees is a trustee of both RIC and RIF. The first table provides information for the interested trustee. The second table provides information for the independent trustees. The third table provides information for the trustees emeritus. The fourth table provides information for the officers. Furthermore, each Trustee possesses the following specific attributes: Mr. Alston has business, financial and investment experience as a senior executive of an international real estate firm and is trained as a lawyer; Ms. Blake has had experience as a certified public accountant and has had experience as a member of boards of directors/trustees of other investment companies; Mr. Connealy has had experience with other investment companies and their investment advisers first as a partner in the investment management practice of PricewaterhouseCoopers LLP and, subsequently, as the senior financial executive of two other investment organizations sponsoring and managing investment companies, and has been determined by the Board to be an “audit committee financial expert,” as explained below; Mr. Fine has had financial, business and investment experience as a senior executive of a non-profit organization and previously, as a senior executive of a large regional financial services organization with management responsibility for such activities as investments, asset management and securities brokerage; Mr. Tennison has had business, financial and investment experience as a senior executive of a corporation with international activities and was trained as an accountant; Mr. Thompson has had experience in business, governance, investment and financial reporting matters as a senior executive of an organization sponsoring and managing other investment companies, and, subsequently, has served as a board member of other investment companies; and Ms. Weston has had experience as a tax and corporate lawyer, has served as general counsel of several corporations and has served as a director of another investment company. Ms. Cavanaugh, the only interested trustee, has had experience with other financial services companies, including companies engaged in the sponsorship, management and distribution of investment companies. As a senior officer of the Funds, the Adviser and various affiliates of the Adviser providing services to the Funds, Ms. Cavanaugh is in a position to provide the Board with such parties’ perspectives on the management, operations and distribution of the Funds.
| | | | | | | | | | | | |
Name,
Age,
Address | | Position(s) Held
with Fund and
Length of
Time Served | | Term
of
Office* | | Principal Occupation(s)
During the
Past 5 Years | | No. of
Portfolios
in Russell
Fund
Complex
Overseen
by Trustee | | | Other
Directorships Held
by Trustee
During the
Past 5 Years |
INTERESTED TRUSTEES | | | | | | |
# Sandra Cavanaugh,
Born May 10, 1954 1301 Second Avenue, 18th Floor Seattle, WA 98101 | | President and Chief Executive Officer since 2010 Trustee since 2010 | | Appointed until successor is duly elected and qualified Until successor is chosen and qualified by Trustees | | • President and CEO RIC and RIF • Chairman of the Board, President and CEO, Russell Financial Services, Inc. • Chairman of the Board, President and CEO, Russell Fund Services Company (“RFSC”) • Chairman of the Board and President, Russell Insurance Agency, Inc. (insurance agency (“RIA”)) • May 2009 to December 2009, Executive Vice President, Retail Channel, SunTrust Bank • 2007 to January 2009, Senior Vice President, National Sales — Retail Distribution, JPMorgan Chase/ Washington Mutual, Inc. • 1997 to 2007, President — WM Funds Distributor & Shareholder Services/WM Financial Services | | | 46 | | | None |
| # | Ms. Cavanaugh is also an officer and/or director of one or more affiliates of RIC and RIF and is therefore an Interested Trustee. |
| * | Each Trustee is subject to mandatory retirement at age 72. |
| | |
| Disclosure of Information about Fund Trustees and Officers | | 67 |
Russell Investment Funds
LifePoints® Funds Variable Target Portfolio Series
Disclosure of Information about Fund Trustees and Officers, continued — December 31, 2011 (Unaudited)
| | | | | | | | | | | | |
Name,
Age,
Address | | Position(s) Held
with Fund and
Length of
Time Served | | Term
of
Office* | | Principal Occupation(s)
During the
Past 5 Years | | No. of
Portfolios
in Russell
Fund
Complex
Overseen
by Trustee | | | Other
Directorships Held
by Trustee
During the
Past 5 Years |
INDEPENDENT TRUSTEES |
Thaddas L. Alston,
Born April 7, 1945 1301 Second Avenue, 18th Floor Seattle, WA 98101 | | Trustee since 2006 Chairman of the Investment Committee since 2010 | | Appointed until successor is duly elected and qualified Appointed until successor is duly elected and qualified | | • Senior Vice President, Larco Investments, Ltd. (real estate firm) | | | 46 | | | None |
| | | | | | | | | | | | | |
Kristianne Blake,
Born January 22, 1954 1301 Second Avenue, 18th Floor Seattle, WA 98101 | | Trustee since 2000 Chairman since 2005 | | Appointed until successor is duly elected and qualified Annual | | • Director and Chairman of the Audit Committee, Avista Corp. • Trustee and Chairman of the Operations Committee, Principal Investors Funds and Principal Variable Contracts Funds • Regent, University of Washington • President, Kristianne Gates Blake, P.S. (accounting services) • February 2002 to June 2005, Chairman of the Audit Committee, RIC and RIF • Trustee and Chairman of the Operations and Distribution Committee, WM Group of Funds, 1999–2006 | | | 46 | | | • Director, Avista Corp (electric utilities); • Trustee, Principal Investors Funds (investment company); • Trustee, Principal Variable Contracts Funds (investment company) • Trustee, WM Group of Funds until 2006 (investment company) |
| | | | | | | | | | | | | |
Daniel P. Connealy,
Born June 6, 1946 1301 Second Avenue, 18th Floor Seattle, WA 98101 | | Trustee since 2003 Chairman of Audit Committee since 2005 | | Appointed until successor is duly elected and qualified Appointed until successor is duly elected and qualified | | • June 2004 to present, Senior Vice President and Chief Financial Officer, Waddell & Reed Financial, Inc. | | | 46 | | | • Director, Gold Banc Corporation until 2006 |
| | | | | | | | | | | | | |
Jonathan Fine,
Born July 8, 1954 1301 Second Avenue, 18th Floor Seattle, WA 98101 | | Trustee since 2004 | | Appointed until successor is duly elected and qualified | | • President and Chief Executive Officer, United Way of King County, WA | | | 46 | | | None |
| * | Each Trustee is subject to mandatory retirement at age 72. |
| | | | |
| | 68 | | | Disclosure of Information about Fund Trustees and Officers |
Russell Investment Funds
LifePoints® Funds Variable Target Portfolio Series
Disclosure of Information about Fund Trustees and Officers, continued — December 31, 2011 (Unaudited)
| | | | | | | | | | | | |
Name,
Age,
Address | | Position(s) Held
with Fund and
Length of
Time Served | | Term
of
Office* | | Principal Occupation(s)
During the
Past 5 Years | | No. of
Portfolios
in Russell
Fund
Complex
Overseen
by Trustee | | | Other
Directorships Held
by Trustee
During the
Past 5 Years |
INDEPENDENT TRUSTEES (continued) |
Raymond P. Tennison, Jr.,
Born December 21, 1955 1301 Second Avenue, 18th Floor Seattle, WA 98101 | | Trustee since 2000 Chairman of the Nominating and Governance Committee since 2007 | | Appointed until successor is duly elected and qualified. Appointed until successor is duly elected and qualified | | •Vice Chairman of the Board, Simpson Investment Company •Until November 2010, President, Simpson Investment Company and several additional subsidiary companies, including Simpson Timber Company, Simpson Paper Company and Simpson Tacoma Kraft Company | | | 46 | | | None |
| | | | | | | | | | | | | |
Jack R. Thompson,
Born March 21, 1949 1301 Second Avenue, 18th Floor Seattle, WA 98101 | | Trustee since 2005 | | Appointed until successor is duly elected and qualified | | •September 2003 to September 2009, Independent Board Chair and Chairman of the Audit Committee, Sparx Asia Funds •September 2007 to September 2010 Director, Board Chairman and Chairman of the Audit Committee, LifeVantage Corporation (health products company) | | | 46 | | | •Director, Board Chairman and Chairman of the Audit Committee, LifeVantage Corporation until September 2010 (health products company) •Director, Sparx Asia Funds until 2009 (investment company) |
| | | | | | | | | | | | | |
Julie W. Weston,
Born October 2, 1943 1301 Second Avenue, 18th Floor Seattle, WA 98101 | | Trustee since 2002 | | Appointed until successor is duly elected and qualified | | •Retired •Chairperson of the Investment Committee until December 2009 | | | 46 | | | None |
| * | Each Trustee is subject to mandatory retirement at age 72. |
| | |
| Disclosure of Information about Fund Trustees and Officers | | 69 |
Russell Investment Funds
LifePoints® Funds Variable Target Portfolio Series
Disclosure of Information about Fund Trustees and Officers, continued — December 31, 2011 (Unaudited)
| | | | | | | | | | | | |
Name,
Age,
Address | | Position(s) Held
with Fund and
Length of
Time Served | | Term
of
Office | | Principal Occupation(s)
During the
Past 5 Years | | No. of
Portfolios
in Russell
Fund
Complex
Overseen
by Trustee | | | Other
Directorships Held
by Trustee
During the
Past 5 Years |
TRUSTEES EMERITUS |
** George F. Russell, Jr.,
Born July 3, 1932 1301 Second Avenue, 18th Floor Seattle, WA 98101 | | Trustee Emeritus and Chairman Emeritus since 1999 | | Until resignation or removal | | • Director Emeritus, Frank Russell Company (investment consultant to institutional investors (“FRC”)); and RIMCo • Chairman Emeritus, RIC and RIF; Russell Implementation Services Inc. (broker-dealer and investment adviser (“RIS”)); Russell 20-20 Association (non-profit corporation); and Russell Trust Company (non-depository trust company (“RTC”)) • Chairman, Sunshine Management Services, LLC (investment adviser) | | | 46 | | | None |
| | | | | | | | | | | | | |
Paul E. Anderson,
Born October 15, 1931 1301 Second Avenue, 18th Floor Seattle, WA 98101 | | Trustee Emeritus since 2007 | | Five year term | | • President, Anderson Management Group LLC (private investments consulting) • February 2002 to June 2005, Lead Trustee, RIC and RIF • Trustee of RIC and RIF until 2006 • Chairman of the Nominating and Governance Committee 2006 | | | 46 | | | None |
| ** | Mr. Russell is also a director emeritus of one or more affiliates of RIC and RIF. |
| | | | |
| | 70 | | | Disclosure of Information about Fund Trustees and Officers |
Russell Investment Funds
LifePoints® Funds Variable Target Portfolio Series
Disclosure of Information about Fund Trustees and Officers, continued — December 31, 2011 (Unaudited)
| | | | | | |
Name,
Age,
Address | | Position(s) Held
with Fund and
Length of
Time Served | | Term
of
Office | | Principal Occupation(s)
During the
Past 5 Years |
OFFICERS |
Cheryl Wichers,
Born December 16, 1966 1301 Second Avenue, 18th Floor Seattle, WA 98101 | | Chief Compliance Officer since 2005 | | Until removed by Independent Trustees | | •Chief Compliance Officer, RIC •Chief Compliance Officer, RIF •Chief Compliance Officer, RIMCo •Chief Compliance Officer, RFSC •Chief Compliance Officer, Russell Exchange Traded Funds Trust •April 2002-May 2005, Manager, Global Regulatory Policy |
| | | | | | | |
Sandra Cavanaugh,
Born May 10, 1954 1301 Second Avenue, 18th Floor Seattle, WA 98101 | | President and Chief Executive Officer since 2010 | | Until successor is chosen and qualified by Trustees | | •President and CEO, RIC and RIF •Chairman of the Board, President and CEO, Russell Financial Services, Inc. •Chairman of the Board, President and CEO, RFSC •Chairman of the Board and President, Russell Insurance Agency, Inc. (insurance agency (“RIA”)) •May 2009 to December 2009, Executive Vice President, Retail Channel, SunTrust Bank •2007 to January 2009, Senior Vice President, National Sales — Retail Distribution, JPMorgan Chase/Washington Mutual, Inc. •1997 to 2007, President — WM Funds Distributor & Shareholder Services/WM Financial Services |
| | | | | | | |
Mark E. Swanson,
Born November 26, 1963 1301 Second Avenue, 18th Floor Seattle, WA 98101 | | Treasurer and Chief Accounting Officer since 1998 | | Until successor is chosen and qualified by Trustees | | •Treasurer, Chief Accounting Officer and CFO, RIC, RIF and Russell Exchange Traded Funds Trust •Director, Funds Administration, RIMCo, RFSC, RTC and Russell Financial Services, Inc. •Treasurer and Principal Accounting Officer, SSgA Funds |
| | | | | | | |
Peter Gunning,
Born February 22, 1967 1301 Second Avenue, 18th Floor Seattle, WA 98101 | | Chief Investment Officer since 2008 | | Until removed by Trustees | | •Chief Investment Officer, RIC and RIF •Director, FRC •Chairman of the Board, President and CEO, RIMCo •1996 to 2008 Chief Investment Officer, Russell, Asia Pacific |
| | | | | | | |
Mary Beth Rhoden,
Born April 25, 1969 1301 Second Avenue, 18th Floor Seattle, WA 98101 | | Secretary since 2010 | | Until successor is chosen and qualified by Trustees | | •1999 to 2010 Assistant Secretary, RIC and RIF •Associate General Counsel, FRC •Secretary, RIMCo, RFSC and Russell Financial Services, Inc. •Secretary and Chief Legal Officer, RIC, RIF and Russell Exchange Traded Funds Trust |
| | |
| Disclosure of Information about Fund Trustees and Officers | | 71 |
Russell Investment Funds
LifePoints® Funds Variable Target Portfolio Series
1301 Second Avenue, Seattle, Washington 98101
(800) 787-7354
Interested Trustee
Sandra Cavanaugh
Independent Trustees
Thaddas L. Alston
Kristianne Blake
Daniel P. Connealy
Jonathan Fine
Raymond P. Tennison, Jr.
Jack R. Thompson
Julie W. Weston
Trustees Emeritus
George F. Russell, Jr.
Paul E. Anderson
Officers
Sandra Cavanaugh, President and Chief Executive Officer
Cheryl Wichers, Chief Compliance Officer
Peter Gunning, Chief Investment Officer
Mark E. Swanson, Treasurer and Chief Accounting Officer
Mary Beth Rhoden, Secretary
Adviser
Russell Investment Management Company
1301 Second Avenue
Seattle, WA 98101
Administrator and Transfer and Dividend Disbursing Agent
Russell Fund Services Company
1301 Second Avenue
Seattle, WA 98101
Custodian
State Street Bank and Trust Company
Josiah Quincy Building
200 Newport Avenue
North Quincy, MA 02171
Office of Shareholder Inquiries
1301 Second Avenue
Seattle, WA 98101
(800) 787-7354
Legal Counsel
Dechert LLP
200 Clarendon Street, 27th Floor
Boston, MA 02116-5021
Distributor
Russell Financial Services, Inc.
1301 Second Avenue
Seattle, WA 98101
Independent Registered Public Accounting Firm
PricewaterhouseCoopers LLP
1420 5th Avenue
Suite 1900
Seattle, WA 98101
Money Managers of Underlying Funds as of December 31, 2011
RIC Russell U.S. Quantitative Equity Fund
Aronson+Johnson+Ortiz, LP, Philadelphia, PA
INTECH Investment Management LLC, West Palm Beach, FL
Jacobs Levy Equity Management Inc., Florham Park, NJ
Numeric Investors LLC, Boston, MA
PanAgora Asset Management Inc., Boston, MA
RIF Aggressive Equity Fund
ClariVest Asset Management LLC, San Diego, CA
DePrince, Race & Zollo, Inc., Winter Park, FL
Jacobs Levy Equity Management Inc., Florham Park, NJ
Ranger Investment Management, L.P., Dallas, TX
Signia Capital Management, LLC, Spokane, WA
Tygh Capital Management, Inc., Portland, OR
RIF Multi-Style Equity Fund
BlackRock Capital Management, Inc., Wilmington, DE
Columbus Circle Investors, Stamford, CT
DePrince, Race & Zollo, Inc., Winter Park, FL
Institutional Capital LLC, Chicago, IL
Jacobs Levy Equity Management Inc., Florham Park, NJ
Suffolk Capital Management LLC, New York, NY
Sustainable Growth Advisers, LP, Stamford, CT.
RIC Russell Global Opportunistic Credit Fund
DDJ Capital Management LLC, Waltham, MA
Oaktree Capital Management, L.P., Los Angeles, CA
Stone Harbor Investment Partners LP, New York, NY
RIC Russell Investment Grade Bond Fund
Logan Circle Partners, L.P., Philadelphia, PA
Metropolitan West Asset Management LLC, Los Angeles, CA
Neuberger Berman Fixed Income LLC, Chicago, IL
Pacific Investment Management Company LLC, Newport Beach, CA
Western Asset Management Company, Pasadena, CA
Western Asset Management Company Limited, London, England
RIC Russell Short Duration Bond Fund
Logan Circle Partners, L.P., Philadelphia, PA
Pacific Investment Management Company LLC, Newport Beach, CA
RIF Core Bond Fund
Goldman Sachs Asset Management, L.P., New York, NY
Metropolitan West Asset Management LLC, Los Angeles, CA
Pacific Investment Management Company LLC, Newport Beach, CA
RIC Russell Emerging Markets Fund
AllianceBernstein L.P., New York, NY
Arrowstreet Capital, Limited Partnership, Boston, MA
Delaware Management Company, a Series of Delaware
Management Business Trust, Philadelphia, PA
Genesis Asset Managers, LLP, Guernsey, Channel Islands
Harding Loevner LP, Somerville, NJ
UBS Global Asset Management (Americas) Inc., New York, NY
Victoria 1522 Investments, LP, San Francisco, CA
| | | | |
| | 72 | | | Adviser, Money Managers and Service Providers |
Russell Investment Funds
LifePoints® Funds Variable Target Portfolio Series
1301 Second Avenue, Seattle, Washington 98101
(800) 787-7354
RIC Russell Global Equity Fund
GLG Inc., New York, NY
Harris Associates L.P., Chicago, IL
MFS Institutional Advisors Inc., Boston, MA
Sanders Capital, LLC, New York, NY
Tradewinds Global Investors, LLC, Los Angeles, CA
T. Rowe Price Associates, Inc., Baltimore, MD
RIF Non-U.S. Fund
Barrow, Hanley, Mewhinney & Strauss, LLC, Dallas, TX
Marsico Capital Management, LLC, Denver, CO
MFS Institutional Advisors Inc., Boston, MA
Pzena Investment Management LLC, New York, NY
RIC Russell Commodity Strategies Fund
Credit Suisse Asset Management, LLC, New York, NY
Goldman Sachs Asset Management, L.P., New York, NY
Jefferies Asset Management, LLC, Stamford, CT
* Investments in the Fund are not deposits with or other liabilities of Macquarie Bank Limited ABN 46 008 583 542 (“MBL”) nor any Macquarie Group company and are subject to investment risk, including loss of income and principal invested and possible delays in payment of redemption proceeds. Neither MBL nor any other member company of the Macquarie Group guarantees the performance of the Fund or the repayment of principal from the Fund or any particular rate of return.
RIC Russell Global Infrastructure Fund
Cohen & Steers Capital Management, Inc., New York, NY
Macquarie Capital Investment LLC, New York, NY*
Nuveen Asset Management, LLC Chicago, IL
RIF Global Real Estate Securities Fund
AEW Capital Management LP, Boston, MA
Cohen & Steers Capital Management, Inc., New York, NY INVESCO Advisers, Inc. which acts as a money manager to the Fund through its INVESCO Real Estate Division, Atlanta, GA
This report is prepared from the books and records of the Funds and is submitted for the general information of shareholders and is not authorized for distribution to prospective investors unless accompanied or preceded by an effective Prospectus. Nothing herein contained is to be considered an offer of sale or a solicitation of an offer to buy shares of Russell Investment Funds. Such offering is made only by Prospectus, which includes details as to offering price and other material information.
| | |
| Adviser, Money Managers and Service Providers | | 73 |
| | | | |
| Russell Investment Funds | | 1301 Second Avenue | | 800-787-7354 |
| | Seattle, Washington 98101 | | Fax: 206-505-3495 |
| | | | www.russell.com |


36-08-195
Item 2. Code of Ethics. [Annual Report Only]
| (a) | As of the end of the period covered by the report, the registrant has adopted a code of ethics that applies to the registrant’s principal executive officer and principal financial officer (“Code”). |
| (b) | That Code comprises written standards that are reasonably designed to deter wrongdoing and to promote: |
| | 1) | honest and ethical conduct, including the ethical handling of actual or apparent conflicts of interest between personal and professional relationships; |
| | 2) | full, fair, accurate, timely and understandable disclosure in reports and documents that a registrant files with, or submits to, the Securities and Exchange Commission (“SEC”) and in other public communications made by each Mutual Fund; |
| | 3) | compliance with applicable laws and governmental rules and regulations; |
| | 4) | the prompt internal reporting to an appropriate person or persons identified in the Code of violations of the Code; and |
| | 5) | accountability for adherence to the Code. |
| (c) | The Code was restated as of December 6, 2004; the restatement did not involve any material change. |
| (d) | As of the end of the period covered by the report, there have been no waivers granted from a provision of the Code that applies to the registrant’s principal executive officer and principal financial officer. |
| (f) | The registrant has filed with the SEC, pursuant to Item 12(a)(1), a copy of the Code that applies to the registrant’s principal executive officer, principal financial officer, principal accounting officer or controller, or persons performing similar functions, as an exhibit to its annual report on this Form N-CSR. |
Item 3. Audit Committee Financial Expert. [Annual Report Only]
Registrant’s board of trustees has determined at a meeting held on February 23, 2005, that the Registrant has at least one audit committee financial expert serving on its audit committee. Daniel P. Connealy was determined to be the Audit Committee Financial Expert and is also determined to be “independent” for purposes of Item 3, paragraph (a)(2)(i) and (ii) of Form N-CSR.
Item 4. Principal Accountant Fees and Services. [Annual Report Only]
Audit Fees
(a) The aggregate fees billed for each of the last two fiscal years for professional services rendered by the principal accountant for the audit of the registrant’s annual financial statements
or services that are normally provided by the accountant in connection with statutory and regulatory filings or engagements for those fiscal years were as follows:
| | | | |
2010 | | $ | 181,560 | |
2011 | | $ | 195,910 | |
Audit-Related Fees
(b) The aggregate fees billed in each of the last two fiscal years for assurance and related services by the principal accountant that are reasonably related to the performance of the audit of the registrant’s financial statements and are not reported under paragraph (a) of this Item and the nature of the services comprising those fees were as follows:
| | | | | | |
| | | Fees | | | Nature of Services |
2010 | | $ | 64,963 | | | Performance of agreed-upon procedures with respect to 06/30/10 semi-annual reports |
2011 | | $ | 72,760 | | | Performance of agreed-upon procedures with respect to 06/30/11 semi-annual reports |
Tax Fees
(c) The aggregate fees billed in each of the last two fiscal years for professional services rendered by the principal accountant for tax compliance, tax advice, and tax planning and the nature of the services comprising the fees were as follows:
| | | | | | |
| | | Fees | | | Nature of Services |
2010 | | $ | 68,431 | | | Tax services |
2011 | | $ | 76,530 | | | Tax services |
All Other Fees
(d) The aggregate fees billed in each of the last two fiscal years for products and services provided by the principal accountant, other than the services reported in paragraphs (a) through (c) of this Item and the nature of the services comprising those fees were as follows:
| | | | | | |
| | | Fees | | | Nature of Services |
2010 | | $ | 0 | | | Overhead/travel |
2011 | | $ | 2,500 | | | Tax Service Fees rendered to Private Limited on International Funds |
(e) (1) Registrant’s audit committee has adopted the following pre-approval policies and procedures for certain services provided by Registrant’s accountants:
Russell Investment Company
Russell Investment Funds
Audit and Non-Audit Services Pre-Approval Policy
Effective Date: May 19, 2003
As amended through November 14, 2005
This Policy has been adopted by the Audit Committee (the “RIC Audit Committee”) of the Board of Trustees of Russell Investment Company (“RIC”) and the Audit Committee (the “RIF Audit Committee”) of the Russell Investment Funds (“RIF”) to apply to any and all engagements of the independent auditor to RIC and RIF, respectively, for audit, non-audit, tax or other services. In the case of RIC, the term “Audit Committee” as used in this policy shall refer to the RIC Audit Committee and the term “Fund” shall refer to RIC. In the case of RIF, the term “Audit Committee” as used in this Policy shall refer to the RIF Audit Committee and the term “Fund” shall refer to RIF. The term “Investment Adviser” shall refer to Russell Investment Management Company. This Policy does not delegate to management the responsibilities set forth herein for the pre-approval of services performed by the Funds’ independent auditor.
| II. | Statement of Principles. |
Under the Sarbanes-Oxley Act of 2002 (the “Act”), the Audit Committee of the Fund’s Board of Trustees (the “Audit Committee”) is charged with responsibility for the appointment, compensation and oversight of the work of the independent auditor for the Fund. As part of these responsibilities, the Audit Committee is required to pre-approve the audit services and permissible non-audit services (“non-audit services”) performed by the independent auditor for the Fund to assure that the independence of the auditor is not in any way compromised or impaired. In determining whether an auditor is independent, there are three guiding principles under the Act that must be considered. In general, the independence of the auditor to the Fund would be deemed impaired if the auditor provides a service whereby it:
| | • | | Functions in the role of management of the Fund, the adviser of the Fund or any other affiliate* of the Fund; |
| | • | | Is in the position of auditing its own work; or |
| | • | | Serves in an advocacy role for the Fund, the adviser of the Fund or any other affiliate of the Fund. |
Accordingly, it is the policy of the Fund that the independent auditor for the Fund must not be engaged to perform any service that contravenes any of the three guidelines set forth above, or which in any way could be deemed to impair or compromise the independence of the auditor for
| * | For purposes of this Policy, an affiliate of the Funds is defined as the Funds’ investment adviser (but not a sub-adviser whose role is primarily portfolio management and whose activities are overseen by the principal investment adviser), and any entity controlling, controlled by, or under common control with the investment adviser that provides ongoing services to the Fund. |
the Fund. This Policy is designed to accomplish those requirements and will henceforth be applied to all engagements by the Fund of its independent auditor, whether for audit, audit-related, tax, or other non-audit services.
Rules adopted by the United States Securities and Exchange Commission (the “SEC”) establish two distinct approaches to the pre-approval of services by the Audit Committee. The proposed services either may receive general pre-approval through adoption by the Audit Committee of a list of authorized services for the Fund, together with a budget of expected costs for those services (“general pre-approval”), or specific pre-approval by the Audit Committee of all services provided to the Fund on a case-by-case basis (“specific pre-approval”). The Audit Committee believes that the combination of these two approaches reflected in this Policy will result in an effective and efficient procedure for the pre-approval of permissible services performed by the Fund’s independent audit. The appendices to this Policy list the audit, audit-related, tax and other services that have the general pre-approval of the Audit Committee. As set forth in this Policy, unless a particular service has received general pre-approval, those services will require specific pre-approval by the Audit Committee before any such services can be provided by the independent auditor. Any proposed service to the Fund that exceeds the pre-approved budget for those services will also require specific pre-approval by the appropriate Audit Committee.
In assessing whether a particular audit or non-audit service should be approved, the Audit Committee will take into account the ratio between the total amounts paid for audit, audit-related, tax and other services, based on historical patterns at the Fund, with a view toward assuring that the level of fees paid for non-audit services as they relate to the fees paid for audit services does not compromise or impair the independence of the auditor. The Audit Committee will review the list of general pre-approved services, including the pre-approved budget for those services, at least annually and more frequently if deemed appropriate by the Audit Committee, and may implement changes thereto from time to time.
As provided in the Act and in the SEC’s rules, the Audit Committee from time to time may delegate either general or specific pre-approval authority to one or more of its members. Any member to whom such authority is delegated must report, for informational purposes only, any pre-approval decisions to the Audit Committee at its next scheduled meeting.
The annual audit services engagement terms and fees for the independent auditor for the Fund require specific pre-approval of the Audit Committee. Audit services include the annual financial statement audit and other procedures required to be performed by the independent auditor in order to be able to form an opinion on the financial statements for the Fund for that year. These other procedures include reviews of information systems, procedural reviews and testing performed in order to understand and rely on the Fund’s systems of internal control, and consultations relating to the audit. Audit services also include the attestation engagement for the independent auditor’s report on the report from management on financial reporting internal controls. The Audit Committee will review the audit services engagement as necessary or appropriate in the sole judgment of the Audit Committee.
In addition to the pre-approval by the Audit Committee of the annual engagement of the independent auditor to perform audit services, the Audit Committee may grant general pre-approval to other audit services, which are those services that only the independent auditor reasonably can provide. These may include statutory audits and services associated with the Fund’s SEC registration statement on Form N-1A, periodic reports and documents filed with the SEC or other documents issued in connection with the Fund’s securities offerings.
The Audit Committee has pre-approved the audit services set forth in Schedule A of the Audit and Non-Audit Pre-Approved Services. All other audit services not listed in Schedule A of the Audit and Non-Audit Pre-Approved Services must be specifically pre-approved by the Audit Committee.
| V. | Audit-Related Services. |
Audit-related services are assurance and related services that are reasonably related to the performance of the audit or review of the financial statements for the Fund, or the separate financial statements for a series of the Fund that are traditionally performed by the independent auditor. Because the Audit Committee believes that the provision of audit-related services does not compromise or impair the independence of the auditor and is consistent with the SEC’s rules on auditor independence, the Audit Committee may grant pre-approval to audit related services. “Audit related services” include, among others, accounting consultations related to accounting, financial reporting or disclosure matters not classified as “audit services;” assistance with understanding and implementing new accounting and financial report or disclosure matters not classified as “audit services;” assistance with understanding and implementing new accounting and financial reporting guidance from rulemaking authorities; agreed upon or expanded audit procedures related to accounting and/or billing records required to respond to or comply with financial, accounting or regulatory reporting matters; and assistance with internal reporting requirements under Form N-SAR and Form N-CSR.
The Audit Committee has pre-approved the audit-related services set forth in Schedule B of the Audit and Non-Audit Pre-Approved Services. All other audit-related services not listed in Schedule B of the Audit and Non-Audit Pre-Approved Services must be specifically pre-approved by the Audit Committee.
The Audit Committee believes that the independent auditor can provide tax services to the Fund, such as tax compliance, tax planning and tax advice, without impairing the auditor’s independence and the SEC has stated that the independent auditor may provide such services. Consequently, the Audit Committee believes that it may grant general pre-approval to those tax services that have historically been provided by the auditor, that the Audit Committee has reviewed and believes would not impair the independence of the auditor, and that are consistent with the SEC’s rules on auditor independence. However, the Audit Committee will not permit
the retention of the independent auditor to provide tax advice in connection with any transaction recommended by the independent auditor, the sole business purpose of which may be tax avoidance and the tax treatment of which may not be supported by the United States Internal Revenue Code and related regulations or the applicable tax statutes and regulations that apply to the Funds investments outside the United States. The Audit Committees will consult with the Treasurer of the Fund or outside counsel to determine that the Fund’s tax planning and reporting positions are consistent with this policy. The Audit Committee has pre-approved the tax services set forth in Schedule C of the Audit and Non-Audit Pre-Approved Services. All other tax services not listed in Schedule C of the Audit and Non-Audit Pre-Approved Services must be specifically pre-approved by the Audit Committee.
The Audit Committee believes, based on the SEC’s rules prohibiting the independent auditor from providing specific non-audit services, that other types of non-audit services are permitted. Accordingly, the Audit Committee believes that it may grant general pre-approval to those permissible non-audit services classified as “all other” services that the Audit Committee believes are routine and recurring services, would not impair or compromise the independence of the auditor and are consistent with the SEC’s rules on auditor independence.
The Audit Committee has pre-approved the permissible “all other services” set forth in Schedule D of the Audit and Non-Audit Pre-Approved Services. Permissible “all other services” not listed in Schedule D of the Audit and Non-Audit Pre-Approved Services must be specifically pre-approved by the Audit Committee.
A list of the SEC’s prohibited non-audit services is attached to this Policy as Schedule E of the Audit and Non-Audit Pre-Approved Services. The SEC’s rules and relevant official interpretations and guidance should be consulted to determine the scope of these prohibited services and the applicability of any exceptions to certain of the prohibitions. Under no circumstance may an executive, manager or associate of the Fund, or the Investment Adviser, authorize the independent auditor for the Fund to provide prohibited non-audit services.
| VIII. | Pre-Approval Fee Levels or Budgeted Amounts. |
Pre-Approval fee levels or budgeted amounts for all services to be provided by the independent auditor will be established annually by the Audit Committee and shall be subject to periodic subsequent review during the year if deemed appropriate by the Audit Committee. (Separate amounts may be specified for the Fund and for other affiliates in the investment company complex subject to pre-approval). Any proposed services exceeding these levels or amounts will require specific pre-approval by the Audit Committee. The Audit Committee will be mindful of the overall relationship of fees for audit and non-audit services in determining whether to pre-approve any such services. For each fiscal year, the Audit Committee may determine the appropriateness of the ratio between the total amount of fees for Audit, Audit-related, and Tax services for the Fund (including any Audit-related or Tax services fees for affiliates subject to pre-approval), and the total amount of fees for certain permissible non-audit services classified as “all other services” for the Fund (including any such services for affiliates subject to pre-approval by the Audit Committee).
All requests or applications for services to be provided by the independent auditor that do not require specific pre-approval by the Audit Committee will be submitted to the “RIC/RIF Clearance Committee” (the “Clearance Committee”) (which shall be comprised of not less than three members, including the Treasurer of the Fund who shall serve as its Chairperson) and must include a detailed description of the services to be rendered and the estimated costs of those services. The Clearance Committee will determine whether such services are included within the list of services that have received general pre-approval by the Audit Committee. The Audit Committee will be informed not less frequently than quarterly by the Chairperson of the Clearance Committee of any such services rendered by the independent auditor for the Fund and the fees paid to the independent auditors for such services.
Requests or applications to provide services that require specific pre-approval by the Audit Committee will be submitted to the Audit Committee by both the independent auditor and the Clearance Committee and must include a joint certification by the engagement partner of the independent auditor and the Chairperson of the Clearing Committee that, in their view, the request or application is consistent with the SEC’s rules governing auditor independence.
The Internal Audit Department of Frank Russell Company, the parent company of RFSC, and the officers of RIC and RIF will report to the Chairman of the Audit Committee any breach of this Policy that comes to the attention of the Internal Audit Department of Frank Russell Company or an officer of RIC or RIF.
| X. | Additional Requirements. |
The Audit Committee has determined to take additional measures on an annual basis to meet its responsibility to oversee the work performed by the independent auditor and to assure the internal auditor’s continuing independence from the Fund and its affiliates, including Frank Russell Company. Such efforts will include, but not be limited to, reviewing a written annual statement from the independent auditor delineating all relationships between the independent auditor and RIC, RIF, and Russell and its subsidiaries and affiliates, consistent with Independence Standards Board Standard No. 1, and discussing with the independent auditor its methods and procedures for ensuring its independence.
(e) (2) The percentage of services described in each of paragraphs (b) through (d) of this Item that were approved by the audit committee pursuant to paragraph (c)(7)(i)(C) of Rule 2-01 of Regulation S-X is as follows:
| | |
| Audit Fees | | 0% |
| Audit-Related Fees | | 0% |
| Tax Fees | | 0% |
| All Other Fees | | 0% |
(f) For services, 50 percent or more of which were pre-approved, the percentage of hours expended on the principal accountant’s engagement to audit the registrant’s financial statements for the most recent fiscal year that were attributed to work performed by persons other than the principal accountant’s full-time, permanent employees was 0%.
(g) The aggregate non-audit fees billed by registrant’s accountant for services rendered to the registrant, and rendered to the registrant’s investment adviser (not including any sub-adviser whose role is primarily portfolio management and is subcontracted with or overseen by another investment adviser), and any entity controlling, controlled by, or under common control with the adviser that provides ongoing services to the registrant for each of the last two fiscal years of the registrant were as follows:
(h) The registrant’s audit committee of the board of trustees has considered whether the provision of nonaudit services that were rendered to the registrant’s investment adviser (not including any subadviser whose role is primarily portfolio management and is subcontracted with or overseen by another investment adviser), and any entity controlling, controlled by, or under common control with the investment adviser that provides ongoing services to the registrant that were not pre-approved pursuant to paragraph (c)(7)(ii) of Rule 2-01 of Regulation S-X is compatible with maintaining the principal accountant’s independence.
Item 5. Audit Committee of Listed Registrants. [Not Applicable]
Item 6. [Schedules of Investments are included as part of the Report to Shareholders filed under Item 1 of this form]
Items 7-9. [Not Applicable]
Item 10. Submission of Matters to a Vote of Security Holders
There have been no changes to the procedures by which shareholders may recommend nominees to the Registrant’s Board of Trustees that would require disclosure herein.
Item 11. Controls and Procedures
(a) Registrant’s principal executive officer and principal financial officer have concluded that Registrant’s disclosure controls and procedures (as defined in Rule 30a-2(c) under the Investment Company Act of 1940 (the “Act”)) are effective, based on their evaluation of these controls and procedures as of a date within 90 days of the date this report is filed with the Securities and Exchange Commission.
(b) There were no significant changes in Registrant’s internal control over financial reporting that occurred during the period covered by this report that has materially affected or is likely to materially affect Registrant’s internal control over financial reporting.
Item 12. Exhibit List
(a) Registrant’s code of ethics described in Item 2.
(b) Certification for principal executive officer of Registrant as required by Rule 30a-2(a) under the Act and certification for principal financial officer of Registrant as required by Rule 30a-2(a) under the Act.
SIGNATURES
Pursuant to the requirements of the Securities Exchange Act of 1934 and the Investment Company Act of 1940, the Registrant has duly caused this report to be signed on its behalf by the undersigned, thereunto duly authorized.
| | |
Russell Investment Funds |
| By: | | /s/ Sandra Cavanaugh |
| | Sandra Cavanaugh |
| | Principal Executive Officer and Chief Executive Officer |
| |
| Date: | | February 27, 2012 |
Pursuant to the requirements of the Securities Exchange Act of 1934 and the Investment Company Act of 1940, this report has been signed below by the following persons on behalf of the Registrant and in the capacities and on the dates indicated.
| | |
| By: | | /s/ Sandra Cavanaugh |
| | Sandra Cavanaugh |
| | Principal Executive Officer and Chief Executive Officer |
| Date: | | February 27, 2012 |
| By: | | /s/ Mark E. Swanson |
| | Mark E. Swanson |
| | Principal Financial Officer, Principal Accounting Officer and Treasurer |
| Date: | | February 27, 2012 |